*Corresponding Author Address: B.Basanta Kumar Reddy, Srinivasarao College of Pharmacy, P.M.Palem, Visakhapatnam -530041, AP, India. Email: [email protected] World Journal of Pharmaceutical Sciences ISSN (Print): 2321-3310; ISSN (Online): 2321-3086 Published by Atom and Cell Publishers © All Rights Reserved Available online at: http://www.wjpsonline.org/ Original Article Studies on controlled release formulations of a macrolide antibiotic drug: Influence of HPMC of different grades as matrix former B. Basanta Kumar Reddy 1 , Dr. K.E.V. Nagoji 2 , Dr. Chakrapani Patnaik 3 1 Srinivasarao College of Pharmacy, P.M. Palem, Visakhapatnam-530041, Andhra Pradesh, India. 2 Sri Venkateswara College of Pharmacy, Etcherla, Srikakulam-532410, Andhra Pradesh, India. 3 Post Graduate Department of Chemistry, Khallikote University, Berhampur-760 001, Odisha, India. Received: 31-08-2015 / Revised: 18-09-2015 / Accepted: 28-09-2015 ABSTRACT In the present study, several combinations of different grades of hydroxy propyl methyl cellulose (HPMC) such as HPMC-K4M, HPMC-K15M, HPMC-K100M as hydrophilic polymers and hydrophobic polymer like ethyl cellulose(EC) are used to prepare the matrix tablets that resulted in desired and controlled drug release profile. Hydrophobic polymers provide several advantages including good stability at varying pH ranges and effectively retard the release of water soluble drug(s) along with hydrophilic polymers. Erythromycin ethylsuccinate is a model drug and having short half-life of 1.5 hours. Tablets containing 100 mg of drug were formulated by wet granulation. Pre-compression and post-compression parameters were evaluated for all the formulations, which are in the acceptable range. The dissolution data were fitted into zero-order, first-order, Higuchi and Korsemeyer–Peppas models to identify the pharmacokinetics and drug release mechanism. The optimized formulation (F5) prepared with EC: HPMC-K4M in the ratio 10 mg: 5 mg show 99.02% drug release in 24 hours, which is comparable with marketed sample. Kinetic results reveal that all formulations followed zero order. Hence, it can be concluded that the use of low viscous hydrophilic polymer can extend the release of drug up to 24 hours. Key Words: Controlled release, HPMC, Ethyl cellulose, Matrix tablets, Release Kinetics. INTRODUCTION Erythromycin is produced by a strain of Saccharopolyspora erythraea and belongs to the macrolide group of antibiotics, mainly used in the treatment of infections caused by Gram-positive and some Gram-negative organisms. It is basic in nature and unstable in acidic media such as in gastric juice. It is therefore necessary to use structurally modified erythromycin derivatives or acid-resistant dosage forms in order to prevent gastric inactivation of the drug. Erythromycin ethyl succinate is an ester of erythromycin which is reported to be acid-stable due to its insolubility in acidic media and suitable for oral administration. Erythromycin ethyl succinate is known chemically as erythromycin-2'-(ethyl succinate); the molecular formula being C43H75NO16 and the molecular weight is 862.06. The structural formula is in Figure 1. Due to its short biological half-life period of 1.5 hours and dosing frequency more than one per day; it becomes an ideal candidate for studies on its desirable or controlled drug release, patient compliance and cost–effectiveness. In the present study, an attempt has been made to develop matrix tablet system with different grades and proportions of hydroxy propyl methyl cellulose (HPMC K4M, HPMC K15M and HPMC K100M), along with ethyl cellulose, in which HPMC as hydrophilic polymers and ethyl cellulose as hydrophobic polymer. Due to hydrophilic nature, HPMC polymers on contact with aqueous fluids get hydrated to form a viscous gel layer through which drug will be released by diffusion and/or by erosion of the matrix [1]. The drug release for extended duration; particularly for highly water soluble drug hydrophobic matrix system is suitable, along with a hydrophilic matrix because of the rapid diffusion of the dissolved drug though the hydrophilic network, for developing sustained release dosage forms. Therefore, the main objective of the study is that, the rate of diffusion of drug molecules influence by various viscosity grades of HPMC.

Welcome message from author
This document is posted to help you gain knowledge. Please leave a comment to let me know what you think about it! Share it to your friends and learn new things together.
Transcript

*Corresponding Author Address: B.Basanta Kumar Reddy, Srinivasarao College of Pharmacy, P.M.Palem, Visakhapatnam -530041, AP,
India. Email: [email protected]
World Journal of Pharmaceutical Sciences ISSN (Print): 2321-3310; ISSN (Online): 2321-3086
Published by Atom and Cell Publishers © All Rights Reserved
Available online at: http://www.wjpsonline.org/
Original Article
Studies on controlled release formulations of a macrolide antibiotic drug: Influence of
HPMC of different grades as matrix former
B. Basanta Kumar Reddy1, Dr. K.E.V. Nagoji2, Dr. Chakrapani Patnaik3
1Srinivasarao College of Pharmacy, P.M. Palem, Visakhapatnam-530041, Andhra Pradesh, India. 2Sri Venkateswara College of Pharmacy, Etcherla, Srikakulam-532410, Andhra Pradesh, India. 3Post Graduate Department of Chemistry, Khallikote University, Berhampur-760 001, Odisha, India.
Received: 31-08-2015 / Revised: 18-09-2015 / Accepted: 28-09-2015
ABSTRACT
In the present study, several combinations of different grades of hydroxy propyl methyl cellulose (HPMC) such
as HPMC-K4M, HPMC-K15M, HPMC-K100M as hydrophilic polymers and hydrophobic polymer like ethyl
cellulose(EC) are used to prepare the matrix tablets that resulted in desired and controlled drug release profile.
Hydrophobic polymers provide several advantages including good stability at varying pH ranges and effectively
retard the release of water soluble drug(s) along with hydrophilic polymers. Erythromycin ethylsuccinate is a
model drug and having short half-life of 1.5 hours. Tablets containing 100 mg of drug were formulated by wet
granulation. Pre-compression and post-compression parameters were evaluated for all the formulations, which
are in the acceptable range. The dissolution data were fitted into zero-order, first-order, Higuchi and
Korsemeyer–Peppas models to identify the pharmacokinetics and drug release mechanism. The optimized
formulation (F5) prepared with EC: HPMC-K4M in the ratio 10 mg: 5 mg show 99.02% drug release in 24
hours, which is comparable with marketed sample. Kinetic results reveal that all formulations followed zero
order. Hence, it can be concluded that the use of low viscous hydrophilic polymer can extend the release of drug
up to 24 hours.
Key Words: Controlled release, HPMC, Ethyl cellulose, Matrix tablets, Release Kinetics.
INTRODUCTION
Erythromycin is produced by a strain
of Saccharopolyspora erythraea and belongs to the
macrolide group of antibiotics, mainly used in the
treatment of infections caused by Gram-positive
and some Gram-negative organisms. It is basic in
nature and unstable in acidic media such as in
gastric juice. It is therefore necessary to use
structurally modified erythromycin derivatives or
acid-resistant dosage forms in order to prevent
gastric inactivation of the drug. Erythromycin ethyl
succinate is an ester of erythromycin which is
reported to be acid-stable due to its insolubility in
acidic media and suitable for oral administration.
Erythromycin ethyl succinate is known chemically
as erythromycin-2'-(ethyl succinate); the molecular
formula being C43H75NO16 and the molecular
weight is 862.06. The structural formula is in
Figure 1. Due to its short biological half-life period
of 1.5 hours and dosing frequency more than one
per day; it becomes an ideal candidate for studies
on its desirable or controlled drug release, patient
compliance and cost–effectiveness.
In the present study, an attempt has been made to
develop matrix tablet system with different grades
and proportions of hydroxy propyl methyl cellulose
(HPMC K4M, HPMC K15M and HPMC K100M),
along with ethyl cellulose, in which HPMC as
hydrophilic polymers and ethyl cellulose as
hydrophobic polymer. Due to hydrophilic nature,
HPMC polymers on contact with aqueous fluids get
hydrated to form a viscous gel layer through which
drug will be released by diffusion and/or by erosion
of the matrix [1]. The drug release for extended
duration; particularly for highly water soluble drug
hydrophobic matrix system is suitable, along with a
hydrophilic matrix because of the rapid diffusion of
the dissolved drug though the hydrophilic network,
for developing sustained release dosage forms.
Therefore, the main objective of the study is that,
the rate of diffusion of drug molecules influence by
various viscosity grades of HPMC.

Reddy et al., World J Pharm Sci 2015; 3(10): 2058-2068
2059
MATERIALS AND METHODS
Materials: The chemicals used in the experiment
were Erythromycin ethyl succinate, HPMC K4,
HPMC K15, HPMC K100, Ethyl cellulose, Dibasic
calcium phosphate, Magnesium stearate and Talc.
All other ingredients used are of analytical grade.
Methods
Drug Excipients' Compatibility Studies
FT-IR Characterization Studies (physical
compatibility studies): Infrared spectrum is taken
for the drug (Figure-2) and drug-polymer mixtures
(Figure-3). FT-IR studies are carried by KBr disk
method using computer mediated Fourier
Transformed Infrared Spectroscopy (FTIR)
(Shimadzu Model). The characteristic FTIR bands
of Erythromycin ethylsuccinate at 2973.37 cm-1
(alcohol stretch) and 3460.41 cm-1 (amine stretch)
were observed.
Differential Scanning Calorimetry (DSC)
(chemical compatibility studies): The chemical
interaction between the drug and excipients have
been studied using DSC apparatus, over a
temperature range which will encompass any
thermal changes due to both the drug and excipient.
Basically, the thermal properties of a physical
mixture are the sum of the thermal properties of
individual components. This thermogram can be
compared with those of the drug and the excipient
alone (Figure 4 & Figure 5). Comparison of the
DSC data shows changes in melting point, peak
shape, area and/or the appearance of a transition.
Preparation of erythromycin ethyl succinate
granules: Accurately weighed quantities of drug
and excipients (except lubricant and glidant)
blended properly and then passed through the 80#
sieve. The wet damp mass is formed by slowly
adding granulating liquid (as distilled water). The
cohesive material was sieved through 22# and 44#
mesh into granules of uniform size. The wet
granules are dried at 50ºC for 2 hrs in a hot air oven
(Universal Hot Air Oven) and then talc and
magnesium stearate are added to lubricate [2-3].
Evaluation of granules:- The flow properties of
granules were characterized in terms of angle of
repose, Carr's index and Hausner’s ratio. The bulk
density and tapped density were determined using
Bulk Density tester (Teknik Bulk Density Tester).
The data summarized in Table 3.
Bulk Density: Bulk density is determined by
Teknik Bulk Density Apparatus, by placing pre-
sieved drug excipients blend in to a 100 ml
graduated cylinder and measuring the volume and
weight as it is, thus it is calculated using formula
[4-5];
where, M =Weight of powder taken; Vb =Bulk
volume
Tapped Density: Tapped density is determined by
Teknik Bulk Density Apparatus, blend was filled in
100 ml graduated cylinder of tap density tester
which operates for fixed number of taps until the
powder bed volume reaches a minimum, thus is
calculated using formula [5-6];
where, M =Weight of powder taken; Vt =tapped
volume.
Angle of Repose: Angle of repose 'θ' is determined
by using funnel method. Certain amount of tablet
blend is poured from funnel that can be raised
vertically until a maximum cone height 'h' is
obtained. Diameter heap D, was measured. The
angle of repose is calculated by formula (Table 1);
Carr's Index: This is measured for the property of
a powder to be compressed into a tablet; as such
they are measured for relative importance of
interparticulate interactions. Carr's index is
calculated by following equation (Table 2) [5,7];
where, ρt =tapped density; ρb =bulk density;
Hausner Ratio: Values less than 1.25 indicate
good flow, whereas greater than 1.25 indicates poor
flow. Hausner ratio is calculated by following
equation [5];
where, ρt =tapped density and ρb =bulk density
Formulation of Tablets: The prepared granules of
erythromycin ethyl succinate were compressed in
10 mm punches, Single tablet compression
machine (Shakti). The formulae for batches F1 to
F12 are shown in Table 4.
Evaluation of Tablet: The prepared matrix tablets
were evaluated for thickness, hardness, friability,
weight variation and drug content. The results are
shown in Table 6.

Reddy et al., World J Pharm Sci 2015; 3(10): 2058-2068
2060
Weight Variation: Twenty tablets are randomly
selected from each batch and then individually
weighed; calculated the average weight of twenty
tablets. The requirements are met if the weights of
not more than 2 of the tablets differ from the
average weight by more than the percentage listed
in the accompanying Table-5 [8-9].
Thickness: The thickness of the tablet is measured
by using vernier calipers. Twenty tablets from each
batch are randomly selected and thicknesses are
measured. The mean and standard deviation (S.D)
are calculated for precise readings [10].
Hardness: Hardness is measured using Monsanto
hardness tester. For each batch five tablets are
tested and calculated the mean and standard
deviation for precision [11].
Friability: Twenty tablets are weighed and placed
in the Roche Friabilator which is rotated at 25rpm
for 4 minutes and then the tablets are removed;
accurately weighed after dusting out any loose
particles adhering the tablets. The percentage
friability was calculated by [12]:
where, w= weight of the tablet
Drug Content Uniformity: Twenty tablets of
each type of formulation are weighed and
crushed in mortar and powder equivalent to 100
mg of Erythromycin ethyl succinate is weighed
and dissolved in 100 mL of 0.1N HCl. From the
stock solution 1 mL sample is withdrawn and
diluted to 10 mL with 0.1N HCl and then
subsequent dilutions are prepared with 0.1N HCl.
The absorbance is measured at wavelength 215nm
using a Systronics Double Beam UV-Visible
Spectrophotometer 2203.
In-Vitro Dissolution Study: The study is carried
out using 0.1N HCl for initial 2 hours and then up
to 24 hours with phosphate buffer 7.4 using the
USP apparatus types II (paddle type) (Lab India
Dissolution Test Apparatus DS 8000). The
dissolution medium 900 mL maintained at
temperature 37 ± 0.5 ºC, at a speed of 100 rpm. A 5
mL of aliquot was withdrawn from the dissolution
apparatus at certain time intervals for 24 hours and
immediately the samples were replaced with fresh
dissolution medium. After filtration, the collected
sample was diluted with suitable concentration
with the corresponding dissolution medium. The
absorbance was measured at 215 nm using a
Systronic Double Beam Spectrophotometer 2203.
The amount of the drug released was determined
from the standard calibration curve of pure drug
[13].
Kinetic Modeling of in-vitro Drug Release
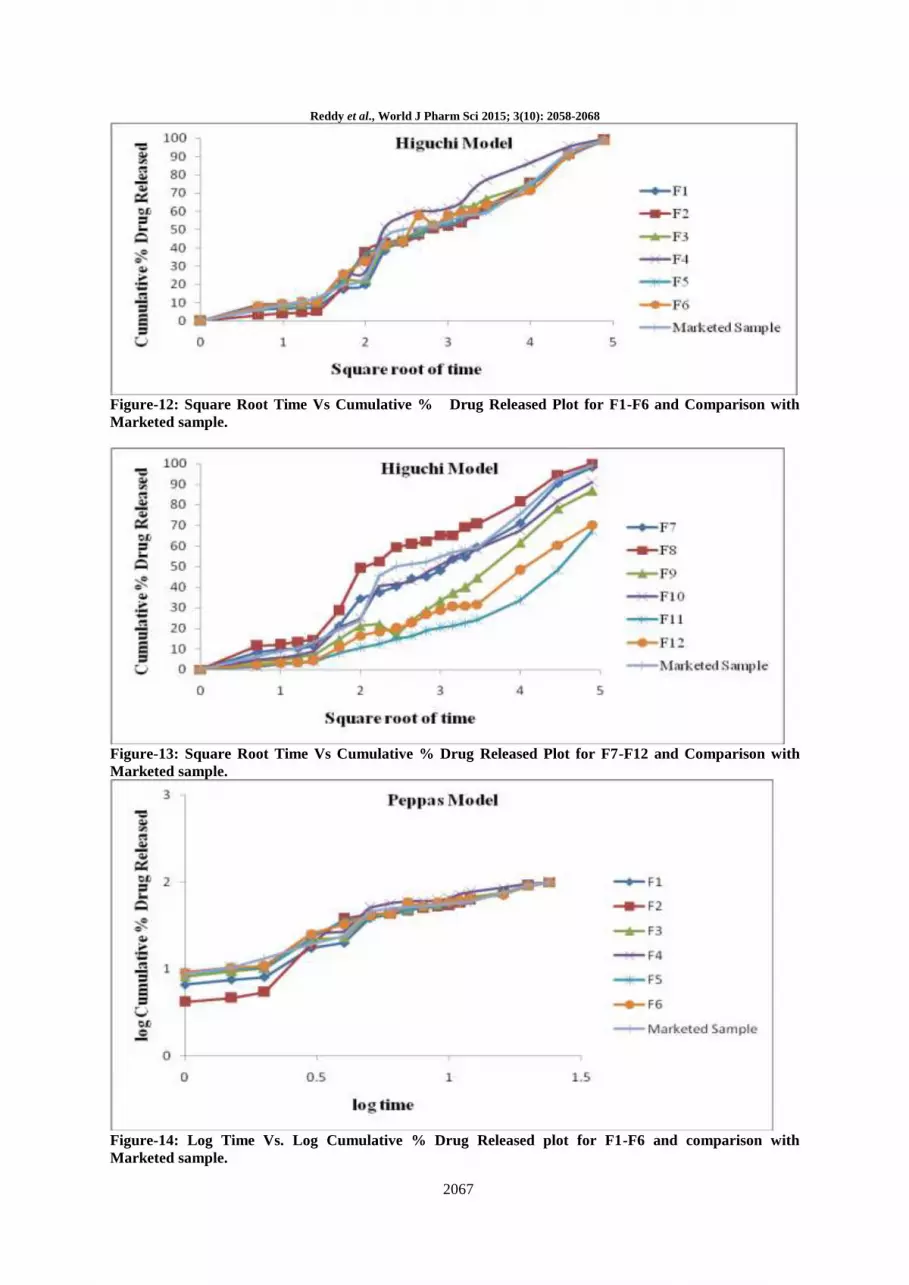
(Figure-6 to Figure-15): To study the release
kinetics, the data obtained from in-vitro drug
released studies of optimized formulation F5 was
plotted in various kinetic models:
1. Zero order rate kinetics: Cumulative percentage
of drug released vs. time
2. First order rate kinetics: Log cumulative
percentage of drug remaining vs. time
3. Higuchi model: Cumulative percentage of drug
released vs. square root of time
4. Korsmeyer Peppas model: Log cumulative
percentage of drug released vs. log time
RESULTS
The FTIR spectral data of pure drug and drug-
polymer mixture is interpreted in detail and the
overlaid spectrum showed similar peaks. From
FTIR characterization study, it is observed that
there was no interaction between drug and
excipients. Based on the physical compatibility
result, the excipients were chosen for the
formulation development. In DSC studies, drug
peak showed at 115.18ºC in drug-polymer mixture
whereas the pure drug showed an endothermic peak
at 120.90°C.
The DSC thermograms of pure drug and drug-
polymer mixture revealed that there were no
polymer interactions or phase transformations
occurred and the drug and excipients are
chemically compatible with each other. The bulk
density of granules was found to be between 0.365
and 0.394 gm/cc which indicates good packing
capacity of granules. Carr’s index was found to be
between 12.23 and 14.53, showing good flow
characteristics. Hausner’s ratio ranged from 1.114
to 1.98 which indicates good flow ability. The
angle of repose of all the formulations was within
the range of 23°24′ to 25°63′, i.e. the granules of
erythromycin ethyl succinate have good flow
properties. The thickness ranged from 4.23 ± 0.03
mm to 4.45 ± 0.02 mm, and the hardness ranged
from 5.22 ± 0.01 kg/cm2 to 5.82 ± 0.01 kg/cm2.
The friability ranged from 0.32 ± 0.02 to 0.82 ±
0.02. The values of percentage weight variation
ranged from 1.31 to 2.45. Drug content ranged
from 91% to 96% indicating good content
uniformity among the prepared formulations.
Coefficient correlation values were found to be in
the range 0.9242 to 0.9948, 0.7903 to 0.9829,
0.9379 to 0.9916 and 0.9588 to 0.9947 for zero-
order, first-order, Huguchi model and Peppas

Reddy et al., World J Pharm Sci 2015; 3(10): 2058-2068
2061
model respectively. The slopes were found in the
range from 0.6670 to 1.0231 (in Table-7).
DISCUSSION
In the present work, matrix tablets of erythromycin
ethyl succinate have been formulated by using
ethyl cellulose and HPMC grade polymers in 2:1,
2:2, 1:1, and 1:2 proportions, to study the release of
drug up to desired time in each formulation. From
FTIR characterization and DSC studies, it is
observed that there was no interaction between
drug and excipients in the formulations. The matrix
tablets so prepared by wet granulation method
evaluated for their hardness and friability. More
than 5.55±0.01 Kg/cm2 hardness and below 1%
friability indicated good physical strength of
tablets.
Among all formulations, the optimized F5
formulation has 96% drug content indicated
uniform distribution of drug and sustained good
therapeutic activity. Kinetic results revealed that all
formulations followed zero order kinetics, as zero
order regression value (R2) is more than first order
value ie., 0.9699 > 0.9185. The calculated “n”
values from power law equation for drug release
profile of F5 is 0.7507 with a correlation
coefficient 0.9712, suggesting that drug release
mechanism from matrix tablets followed
anomalous (non-fickian) diffusion mechanism [14].
CONCLUSION
The market for drug delivery system has come a
long way and will continue to grow at an
impressive rate. Today’s drug delivery
technologies enable the incorporation of drug
molecules into a new delivery system, thus
providing numerous therapeutic and commercial
advantages. Matrix tablet drug delivery systems
provide several advantages including greater
flexibility and adaptability. The hydrophilic matrix
of HPMC all grades alone could not control the
drug release effectively for 24 hrs. It is evident
from the results that the matrix tablets prepared
from HPMC (low viscous polymer grade like
HPMC K4M) along with ethyl cellulose a better
system for once-daily controlled release matrix
tablet of erythromycin ethylsuccinate. Formulation
F5 exhibited satisfactory drug release in the initial
hours and the total release pattern was very close to
the theoretical release profile. So, F5 was the most
successful, cost-effective and optimized
formulation.
ACKNOWLEDGEMENT
The authors are grateful to Mr. Pradeep Kumar
Jena from Hetero Pharma, Hyderabad, and Mr.
Asish Arora from Ranbaxy Ltd., for their support
and co-operation.
Table-1: Angle of repose as an indication of powder flow [5].
Table-2: Carr's index as an indicator of flow properties [5].
Table-3: Pre-compression Evaluation Tests.
Formulation Bulk Density
(g/cc)
Tapped Density
(g/cc)
Angle of Repose
( º )
Carr's Index
(%)
Hausner’s
Ratio
F1 0.384 0.441 25.41 12.92 1.148
F2 0.379 0.434 23.24 12.67 1.145
F3 0.394 0.461 24.32 14.53 1.170
F4 0.370 0.422 25.63 12.32 1.140
F5 0.369 0.428 24.21 12.18 1.149
F6 0.365 0.437 24.74 14.47 1.197
Angle of repose (degrees) Type of flow
<20 Excellent
20-30 Good
30-34 Passable
>40 Very poor
Carr's Index (%) Type of flow
5-15 Excellent
12-16 Good
18-21 Fair to passable
23-35 Poor
33-38 Very poor
>40 Extremely poor

Reddy et al., World J Pharm Sci 2015; 3(10): 2058-2068
2062
F7 0.372 0.428 25.62 13.08 1.150
F8 0.384 0.428 24.37 12.28 1.114
F9 0.370 0.422 23.38 12.32 1.140
F10 0.375 0.411 24.34 12.32 1.135
F11 0.380 0.421 25.12 12.23 1.142
F12 0.371 0.432 25.10 13.26 1.198
Table-4: Formulation of Erythromycin ethyl succinate Controlled Release Matrix Tablet.
Ingredients
(mg/tablet) F1 F2 F3 F4 F5 F6 F7 F8 F9 F10 F11 F12
Erythromycin
ethylsuccinate 100 100 100 100 100 100 100 100 100 100 100 100
Ethyl cellulose 10 10 5 5 10 10 5 5 10 10 5 5
HPMC K4M - - - - 5 10 5 10 - - - -
HPMC K15M 5 10 5 10 - - - - - - - -
HPMC K100M - - - - - - - - 5 10 5 10
Dibasic Calcium
Phosphate 173 168 178 173 173 168 178 173 173 168 178 173
Talc 6 6 6 6 6 6 6 6 6 6 6 6
Magnesium
stearate 6 6 6 6 6 6 6 6 6 6 6 6
Distilled water (in
mL) q.s q.s q.s q.s q.s q.s q.s q.s q.s q.s q.s q.s
Total weight of
the tablet 300 300 300 300 300 300 300 300 300 300 300 300
q.s=Quantity sufficient
Table-5: Weight variation tolerances for uncoated tablets [9].
Average weight of tablets(mg) Maximum percent deviation (%)
130 or less 10
130-324 7.5
>324 5
Table-6: Post-compression Evaluation Data of Erythromycin ethyl succinate Matrix Tablets Prepared by
Wet Granulation Method.
S.D=standard deviation, * Values are expressed as mean ± SD; n=3
Formulations Hardness
(kg/cm2)± S.D*
Weight variation
(%) Friability
(%) ± S.D*
Thickness
(mm) S.D*
Drug content
(%) ± S.D*
F1 5.22±0.01 1.93 0.32±0.02 4.23±0.03 92
F2 5.72±0.36 1.22 0.76±0.04 4.36±0.02 91
F3 5.82±0.01 1.71 0.82±0.02 4.35±0.01 92
F4 5.53±0.36 2.45 0.66±0.06 4.43±0.04 94
F5 5.55±0.35 1.31 0.42±0.03 4.35±0.03 96
F6 5.76±0.36 1.83 0.49±0.05 4.45±0.02 93
F7 5.68±0.33 2.15 0.66±0.01 4.35±0.01 91
F8 5.65±0.32 1.98 0.45±0.01 4.32±0.03 95
F9 5.52±0.36 1.76 0.59±0.05 4.29±0.05 94
F10 5.78±0.33 1.36 0.57±0.04 4.35±0.03 93
F11 5.54±0.32 1.46 0.45±0.03 4.32±0.01 92
F12 5.53±0.36 1.62 0.59±0.02 4.29±0.02 96

Reddy et al., World J Pharm Sci 2015; 3(10): 2058-2068
2063
Table- 7: Correlation Coefficient (R2) Values in the Analysis of Release Data of the Pure Drug Matrix
Tablets.
Formulation
R2 Values
Zero order First order Higuchi Peppas 'n' (slope)
F1 0.9728 0.9122 0.9889 0.9733 0.8637
F2 0.9615 0.9177 0.9869 0.9588 1.0231
F3 0.9667 0.9239 0.9907 0.9742 0.7878
F4 0.9354 0.9083 0.9784 0.9630 0.7832
F5 0.9699 0.9185 0.9905 0.9712 0.7507
F6 0.9583 0.9165 0.9879 0.9743 0.7539
F7 0.9809 0.9214 0.9894 0.9801 0.7196
F8 0.9242 0.7903 0.9757 0.9602 0.6670
F9 0.9941 0.9611 0.9643 0.9833 0.8747
F10 0.9638 0.9829 0.9916 0.9782 0.8768
F11 0.9851 0.9449 0.9379 0.9947 0.9942
F12 0.9948 0.9826 0.9757 0.9864 0.9764
Figure-1: Erythromycin ethyl succinate.
500750100012501500175020002500300035004000
1/cm
45
52.5
60
67.5
75
82.5
%T
3445
.94
2973
.37
2359
.98
1735
.03
1698
.38
1457
.27
1374
.33
1254
.74
1168
.90
1053
.17
995.
30
894.
04
669.
32
B5 Figure-2: FTIR spectra of pure drug.

Reddy et al., World J Pharm Sci 2015; 3(10): 2058-2068
2064
500750100012501500175020002500300035004000
1/cm
30
37.5
45
52.5
60
67.5
75
%T
3460
.41
2973
.37
1868
.12
1735
.99
1457
.27
1375
.29
1167
.94 10
53.1
7
892.
11 669.
32
578.
66
B7 Figure-3: FTIR spectra of drug-polymer mixtures.
Figure-4: DSC Thermogram of pure drug.
Figure-5: DSC Thermogram of pure drug with polymers

Reddy et al., World J Pharm Sci 2015; 3(10): 2058-2068
2065
Figure-6: Dissolution profile for F1-F6 and comparison with marketed sample.
Figure-7: Dissolution profile for F7-F12 and comparison with marketed sample.
Figure-8: Dissolution profile for optimized Plot for F1-F6 and Comparison with marketed sample

Reddy et al., World J Pharm Sci 2015; 3(10): 2058-2068
2066
Figure-9: Time Vs log Cumulative % Drug Remained formulation F5 and comparison with marketed
sample
Figure-10: Time Vs log Cumulative % Drug remained Plot for F7-F12 and Comparison with Marketed
sample.
Figure-11: Time Vs log Cumulative % Drug remained Plot for optimized formulation F5 and
Comparison with marketed sample.
Reddy et al., World J Pharm Sci 2015; 3(10): 2058-2068
2067
Figure-12: Square Root Time Vs Cumulative % Drug Released Plot for F1-F6 and Comparison with
Marketed sample.
Figure-13: Square Root Time Vs Cumulative % Drug Released Plot for F7-F12 and Comparison with
Marketed sample.
Figure-14: Log Time Vs. Log Cumulative % Drug Released plot for F1-F6 and comparison with
Marketed sample.

Reddy et al., World J Pharm Sci 2015; 3(10): 2058-2068
2068
Figure-15: Log Time Vs. Log Cumulative % Drug Released plot for F7-F12 and comparison with
Marketed sample
REFERENCES
1. Rahman Md.M et al. Evaluation of Various Grades of Hydroxypropylmethylcellulose Matrix Systems
as Oral Sustained Release Drug Delivery systems. J Pharm Sci & Res 2011; 3: 930-938.
2. Rezal MD et al. Comparative evaluation of polymers as matrix for controlled release drug delivery. J
Pharm Pharmaceut Sci 2003; 6: 274-291.
3. Andreopopulas AG, Tarantilli PA. Xanthan gum as a carrier for controlled release of drug. J Biomater
Appl 2001; 16: 35-38.
4. Basak SC et al. Controlled release HPMC matrix tablet of propranolol HCl. Ind J Pharm Sci 2004; 66:
827-833.
5. Aulton, ME. Pharmaceutics: The Science of Dosage form Design, Second ed.; Churchill, Livingstone;
2002; pp. 133-134.
6. Shabaraya AR, Narayanacharyulu R. Design and evaluation of chitason matrix of metoprolol tartrate
for sustained release. J Pharm Pharmaceut Sci 2008; 8: 231-236.
7. Shirwaikar AA et al. Formulation and evaluation of sustained release tablets using an insoluble rosin
matrix system. Ind J Pharm Sci 2005; 67: 80-83.
8. Krishanaiah YS et al. Development of colon target oral guar gum matrix tablet of Albendazole for the
treatment of Helminthiasis. Ind J Pharm Sci 2003; 65: 378-385.
9. Lachman L, Lieberman HA. The Theory and Practice of Industrial Pharmacy, Special Indian ed.;
India, 2009; pp. 300.
10. The British Pharmacopoeia. Department of health/by stationary office on behalf of the medicine and
health care product regulatory agency, 5th ed.; Crown copy right, 2005; pp. 1303-1304, 2588-2589,
A133.
11. The United State of Pharmacopoeia 24/ NF19. The official compendia of standard United States
Pharmacopoeial convection Inc., Asian ed.; Rockville, 1995; pp. 1015,1016, 1791.
12. Chaudhari PD. Formulation and Evaluation of fast dissolving tablet of famotidine. Ind Dru 2005; 42:
641-649.
13. Raparla DV, Murthy TE. Formulation and evaluation of oral controlled release Glimepiride matrix
tablets. Adv Phamaco Toxico 2007; 8: 59-62.
14. Gautam S, Mahaveer S. Review: In-Vitro drug release characterization models. Int J of Pharmaceut Stu
and Res 2011; 2: 77-84.
Related Documents