Studies on central carbon metabolism and respiration of Gluconobacter oxydans 621H Inaugural-Dissertation zur Erlangung des Doktorgrades der Mathematisch-Naturwissenschaftlichen Fakultät der Heinrich-Heine-Universität Düsseldorf vorgelegt von Tanja Hanke aus Solingen Düsseldorf, Dezember 2009

Welcome message from author
This document is posted to help you gain knowledge. Please leave a comment to let me know what you think about it! Share it to your friends and learn new things together.
Transcript
Studies on central carbon metabolism and respiration of Gluconobacter oxydans 621H
Inaugural-Dissertation
zur Erlangung des Doktorgrades der Mathematisch-Naturwissenschaftlichen Fakultät
der Heinrich-Heine-Universität Düsseldorf
vorgelegt von
Tanja Hanke aus Solingen
Düsseldorf, Dezember 2009
Aus dem Institut für Biotechnologie 1
des Forschungszentrums Jülich GmbH
Gedruckt mit der Genehmigung der
Mathematisch-Naturwissenschaftlichen Fakultät der
Heinrich-Heine-Universität Düsseldorf
Referent: Prof. Dr. H. Sahm
Koreferent: Prof. Dr. M. Bott
Tag der mündlichen Prüfung: 22.01.2010
Publications
Hanke T, Noack S, Nöh K, Bringer S, Oldiges M, Sahm H, Bott M, Wiechert W (2010)
Characterisation of glucose catabolism in Gluconobacter oxydans 621H by 13C-
labeling and metabolic flux analysis. Submitted to FEMS Microbiology Letters
Hanke T, Bringer S, Polen T, Sahm H, Bott M (2010) Genome-wide microarray
analyses of Gluconobacter oxydans: Response to oxygen depletion, growth phases
and acidic growth conditions. Manuscript for submission to J Bacteriol
Hanke T, Bringer S, Sahm H Bott M (2010) The cytochrome bc1 complex in
Gluconobacter oxydans 621H: Functional analysis by fermentation studies and whole
cell kinetics with a marker-free deletion mutant. Manuscript for submission to J
Bacteriol

Abstract
Gluconobacter oxydans shows a number of exceptional characteristics, like the
biphasic growth on glucose and the incomplete oxidation of glucose to gluconate
(phase I, exponential growth,) and ketogluconates (phase II, linear growth), leading
to an acidification of the medium down to pH values less than 4. Furthermore, growth
and metabolism of G. oxydans is strongly dependent on the availability of oxygen. In
the respiratory chain, two terminal end acceptors are present. The ubiquinol bd
oxidase, preferably used under acidic pH, is less efficient in contribution to the proton
motive force than the bo3 oxidase.
An open question was the function of a cytochrome bc1 complex as well as
soluble cytochrome c552, in the absence of a cytochrome c oxidase. For elucidation of
the function of these respiratory chain components, a deletion mutant lacking the
genes encoding the cytochrome bc1 complex was constructed and characterised.
When cultivated on mannitol at pH 4 the deletion mutant showed retarded growth
and substrate consumption. Therefore, the cytochrome bc1 complex is involved in
energy supply of the cells under acidic pH when the more inefficient ubiquinol bd
oxidase is upregulated. Interestingly, under oxygen limitation the deletion mutant
released heme into the culture medium in the late stationary phase. Since hemes b
and c are the prosthetic groups of the cytochrome bc1 complex heme excretion of the
mutant is a consequence of absence of the corresponding apoenzymes, which is
formed under oxygen limitation. The membrane-bound and respiratory chain-linked
alcohol dehydrogenase (ADH) was reported to be a component of the respiratory
chain and not merely an oxidoreductase. A connection to the cytochrome bc1
complex was investigated in this work. The oxidation velocity of the ADH of the
mutant was significantly lower than that of the wild type was. Furthermore, the
cytochrome bc1 complex was shown to be involved in the energy-dependent
activation of the ADH in cells grown at pH 4, but a direct interaction between the
cytochrome bc1 complex and the ADH was not demonstrated yet.
In order to throw light on the regulation of the respiratory chain in conjunction with
the overall metabolism, genome-wide DNA microarray analyses were carried out with
G. oxydans 621H. Three conditions were investigated: I) oxygen limitation vs. oxygen
excess, II) cultivation at decreased pH of 4 vs. cultivation at standard pH of 6 and III)
growth phase II vs. growth phase I during growth on glucose pH 6, since the
cytochrome bc1 complex deletion mutant showed growth retardation in growth phase
II. Transcriptional analyses of oxygen-limited cells displayed an upregulation of genes
encoding the cytochrome bc1 complex and both terminal oxidases. In cells grown at

pH 4, an enhanced transcription of the genes encoding the more inefficient ubiquinol
bd oxidase occurred. Since no direct connection between the glucose metabolism
and the cytochrome bc1 complex was evident, glucose metabolism was further
characterised in the wild type. 13C-Metabolome analysis and metabolic flux analysis
(MFA) were applied to solve the question of the quantity and oxidation state of the
substrate entering the cell for catabolism. MFA of phase I glucose cultures showed
that 97% of the initial glucose was oxidised in the periplasm by the highly active and
respiratory chain-linked glucose dehydrogenase, whereas only 3% of glucose
proceeded into the cytoplasm. According to the model, intracellular glucose was
predominantly oxidised to gluconate, subsequently phosphorylated by gluconate
kinase and further metabolised via the pentose phosphate pathway. In addition,
genome-wide transcriptional analysis of G. oxydans approved the reported
assumption of a highly active pentose phosphate pathway, which is enhanced in
growth phase II. In contrast, the Entner-Doudoroff pathway was almost inactive in
growth phase I.

Zusammenfassung
Zu den Besonderheiten von G. oxydans gehören das biphasische Wachstum mit
Glukose und die unvollständige Oxidation von Glukose zu Glukonat (Phase I,
exponentielles Wachstum) und Ketoglukonat (Phase II, lineares Wachstum), die zu
einer Ansäuerung des Mediums mit pH Werten kleiner als 4 führt. Wachstum und
Metabolismus von G. oxydans sind stark von der Sauerstoffverfügbarkeit abhängig.
Die Atmungskette des Bakteriums enthält zwei terminale Oxidasen: die Ubichinon bd
Oxidase wird bevorzugt bei sauren pH Werten genutzt und ist weniger effizient in
ihrem Beitrag zur Generierung der protonenmotorischen Kraft als die Ubichinon bo3
Oxidase.
Da die Cytochrom c Oxidase fehlt, ist die Funktion des Cytochrom bc1 Komplexes
und des löslichen Cytochrom c552 nicht geklärt. Zur Aufklärung der Funktion dieser
Atmungskettenkomponenten wurde eine Deletionsmutante des Cytochrom bc1
Komplexes konstruiert und charakterisiert. Bei Kultivierung mit Mannitol bei pH 4
zeigte diese Mutante eine Verzögerung im Wachstum und im Substratverbrauch.
Offensichtlich ist der Cytochrom bc1 Komplex an der Energieversorgung von pH 4
kultivierten Zellen beteiligt, in denen die ineffizientere Ubichinon bd Oxidase verstärkt
genutzt wird. Unter Sauerstoffmangel gab die Mutante in der stationären Phase Häm
in das Medium ab. Da Häm b und Häm c die prosthetischen Gruppen des Cytochrom
bc1 Komplexes sind, ist die Exkretion des Häms die Konsequenz der Abwesenheit
des Apoenzyms, das der Wildtyp unter Sauerstoffmangelbedingung produziert. Eine
japanische Arbeitsgruppe beschrieb die membrangebundene Alkohol
Dehydrogenase (ADH) als Bestandteil der Atmungskette. Daher wurde in der
vorliegenden Arbeit eine Verbindung mit dem Cytochrom bc1 Komplex untersucht.
Die Oxidationskapazität der ADH war in der Mutante gegenüber dem Wildtyp
signifikant verringert und der Cytochrom bc1 Komplex war an der energieabhängigen
Aktivierung der ADH in pH 4 kultivierten Zellen beteiligt.
Um die Regulation der Atmungskette und des Metabolismus gleichzeitig zu
untersuchen, wurden genomweite Transkriptionsanalysen mit G. oxydans 621H
durchgeführt. Drei Bedingungen wurden gewählt: I) Sauerstofflimitierung vs.
Sauerstoffüberschuss, II) Kultivierung bei pH 4 vs. Kultivierung bei pH 6 und III)
Wachstumsphase II vs. Wachstumsphase I bei Kultivierung mit Glukose pH 6, da die
Cytochrom bc1 Deletionsmutante verzögertes Wachstum in Phase II zeigte. Die
Gene, kodierend für den Cytochrom bc1 Komplex und die beiden Endoxidasen,
wurden in sauerstofflimitierten Zellen verstärkt transkribiert. Bei pH 4 kultivierten
Zellen zeigte sich eine verstärkte Transkription der Gene kodierend für die
ineffizientere Ubichinon bd Oxidase. Weil kein direkter Zusammenhang zwischen
dem Glukosemetabolismus und dem Cytochrom bc1 Komplex ersichtlich war, wurde
der Glukosemetabolismus des Wildtyps näher untersucht. Um zu klären, wie viel und
welche Oxidationsstufe des Substrates in die Zellen aufgenommen wird, wurden eine 13C-Metabolomanalyse und eine metabolische Flussanalyse (MFA) durchgeführt. Die
MFA der ersten Wachstumsphase zeigte dass 97% der ursprünglichen Glukose im
Periplasma oxidiert wurden und 3% der Glukose in das Cytoplasma aufgenommen
wurden. Dem Modell entsprechend wurde die Glukose intrazellulär erst durch die
cytoplasmatische Glukose Dehydrogenase zu Glukonat oxidiert, bevor dieses durch
die Glukonat Kinase phosporyliert und in den Pentosephosphatweg eingeschleust
wurde. Die Transkriptomanalyse bestätigte die Verstärkung der Aktivität des
Pentosephosphatweg in Phase II. Hingegen war der Entner-Doudoroff Weg in
Phase I fast inaktiv.
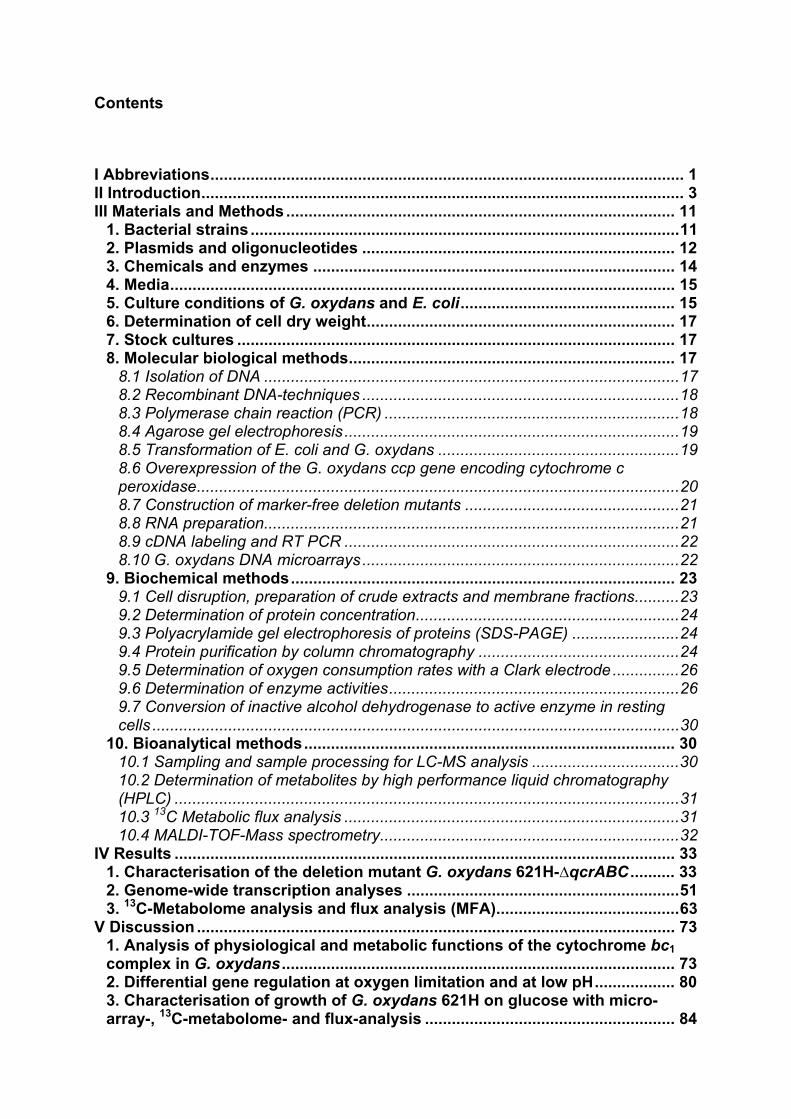
Contents
I Abbreviations .......................................................................................................... 1 II Introduction ............................................................................................................ 3 III Materials and Methods ....................................................................................... 11
1. Bacterial strains ................................................................................................ 11 2. Plasmids and oligonucleotides ...................................................................... 12 3. Chemicals and enzymes ................................................................................. 14 4. Media ................................................................................................................. 15 5. Culture conditions of G. oxydans and E. coli ................................................ 15 6. Determination of cell dry weight ..................................................................... 17 7. Stock cultures .................................................................................................. 17 8. Molecular biological methods ......................................................................... 17
8.1 Isolation of DNA ............................................................................................. 17 8.2 Recombinant DNA-techniques ....................................................................... 18 8.3 Polymerase chain reaction (PCR) .................................................................. 18 8.4 Agarose gel electrophoresis ........................................................................... 19 8.5 Transformation of E. coli and G. oxydans ...................................................... 19 8.6 Overexpression of the G. oxydans ccp gene encoding cytochrome c peroxidase ............................................................................................................ 20 8.7 Construction of marker-free deletion mutants ................................................ 21 8.8 RNA preparation............................................................................................. 21 8.9 cDNA labeling and RT PCR ........................................................................... 22 8.10 G. oxydans DNA microarrays ....................................................................... 22
9. Biochemical methods ...................................................................................... 23 9.1 Cell disruption, preparation of crude extracts and membrane fractions .......... 23 9.2 Determination of protein concentration ........................................................... 24 9.3 Polyacrylamide gel electrophoresis of proteins (SDS-PAGE) ........................ 24 9.4 Protein purification by column chromatography ............................................. 24 9.5 Determination of oxygen consumption rates with a Clark electrode ............... 26 9.6 Determination of enzyme activities ................................................................. 26 9.7 Conversion of inactive alcohol dehydrogenase to active enzyme in resting cells ...................................................................................................................... 30
10. Bioanalytical methods ................................................................................... 30 10.1 Sampling and sample processing for LC-MS analysis ................................. 30 10.2 Determination of metabolites by high performance liquid chromatography (HPLC) ................................................................................................................. 31 10.3 13C Metabolic flux analysis ........................................................................... 31 10.4 MALDI-TOF-Mass spectrometry ................................................................... 32
IV Results ................................................................................................................ 33 1. Characterisation of the deletion mutant G. oxydans 621H-∆qcrABC .......... 33 2. Genome-wide transcription analyses ............................................................. 51 3. 13C-Metabolome analysis and flux analysis (MFA) ......................................... 63
V Discussion ........................................................................................................... 73 1. Analysis of physiological and metabolic functions of the cytochrome bc1 complex in G. oxydans ........................................................................................ 73 2. Differential gene regulation at oxygen limitation and at low pH .................. 80 3. Characterisation of growth of G. oxydans 621H on glucose with micro- array-, 13C-metabolome- and flux-analysis ........................................................ 84
VI References .......................................................................................................... 89 VII Appendix .......................................................................................................... 101

I Abbrevations
1
I Abbreviations
λ Wavelenght (nm) °C Degree Celsius ε molar extinction coefficient Ω Ohm 2-KGA 2-Keto-gluconate 5-KGA 5-Keto-gluconate A Ampère ADH Alcohol dehydrogenase ATP Adenosine triphosphate BCA Bicinchonine acid bp Base pairs C Carbon CCCP Carbonylcyanide-m-chlorophenylhydrazone CDW Cell dry weight Cef Cefoxitin CTR Carbon dioxide transfer rate Da Dalton DCPIP 2,6-Dichlor-indophenol DDM n-Dodecylmaltoside DNA Desoxyribonucleic acid dNTP Desoxyribonukleotidtriphosphate DO Dissolved oxygen DTT Dithiothreitol EDP Entner-Doudoroff Pathway EDTA Ethylendiamine tetraacetate EMP Embden-Meyerhof pathway EP Electroporation FA Formaldehyde FAD Flavin adenine dinucleotide g Gravitational acceleration (9,81 m/s2) G6P-DH Glucose 6-phosphate dehydrogenase GK Glucose kinase Gntk Gluconate kinase H2O2 Hydrogen peroxide H2SO4 Sulfuric acid HClO4 Perchloric acid HEPES 2-(4-(2-Hydroxyethyl)-1-piperazinyl)-ethanesulfonic acid HPLC High Performance Liquid Chromatography IPTG Isopropyl-β-D-thiogalactoside Kan Kanamycine kb kilo base pairs kDa Kilo Dalton KPi Potassium phosphate buffer LC Liquid Chromatography M Molar; Mol per liter MgCl2 Magnesium chloride mGDH Membrane-bound glucose dehydrogenase MOPS Morpholinopropane sulfonic acid
I Abbrevations
2
MS Mass spectroscopy NAD+ Nicotinamide-adenine-dinucleotide NADP+ Nicotinamide-adenine-dinucleotide phosphate ODx nm Optical density at a wavelength of x nm ox oxidised PAGE Polyacrylamide gel electrophoresis PCR Polymerase chain reaction PMS Phenazine methane sulfate PPP Pentose phosphate pathway PQQ Pyrroloquinoline quinone RC Respiratory chain red reduced RNA Ribonucleic acid RNase Ribonuclease rpm Rounds per minute RT Room temperature RT-PCR Reverse transcription PCR SDS Sodium dodecylsulfate Stl/h Standard liter per hour TAE Tris/Acetate/EDTA TCA Citric acid cycle TNI Tris sodiumcloride imidazole buffer Tris Tri-(hydroxymethyl)-aminomethane U Unit UV Ultraviolet V Volt v/v Volume per volume w/v Weight per volume
II Introduction
3
II Introduction
Acetic acid bacteria are Gram negative bacteria existing in natural sweet habitats
like fruits, flowers and sweet or alcoholic drinks (Swings 1992, Gupta et al. 2001,
Battey and Schaffner 2001). The family of Acetobacteriaceae splits into 10 genera,
among those are Acetobacter, Gluconobacter, Gluconacetobacter and Acidomonas
(Yamada and Yukphan 2008). Gluconobacter and Acetobacter are similar to each
other, but a distinction is possible by 16S-rRNA analysis (Sievers et al. 1995).
Furthermore, Acetobacter is capable of oxidising lactate and acetic acid completely
to CO2, in contrast to Gluconobacter. The genus Gluconobacter consists of four
species named G. asaii, G. cerinus, G. frateurii and G. oxydans (Sievers et al. 1995,
Tanaka et al. 1999). G. oxydans is strictly aerobic and forms flagella when cells are
oxygen-limited (De Ley and Swings 1981, De Ley et al. 1984, Gupta et al. 2001).
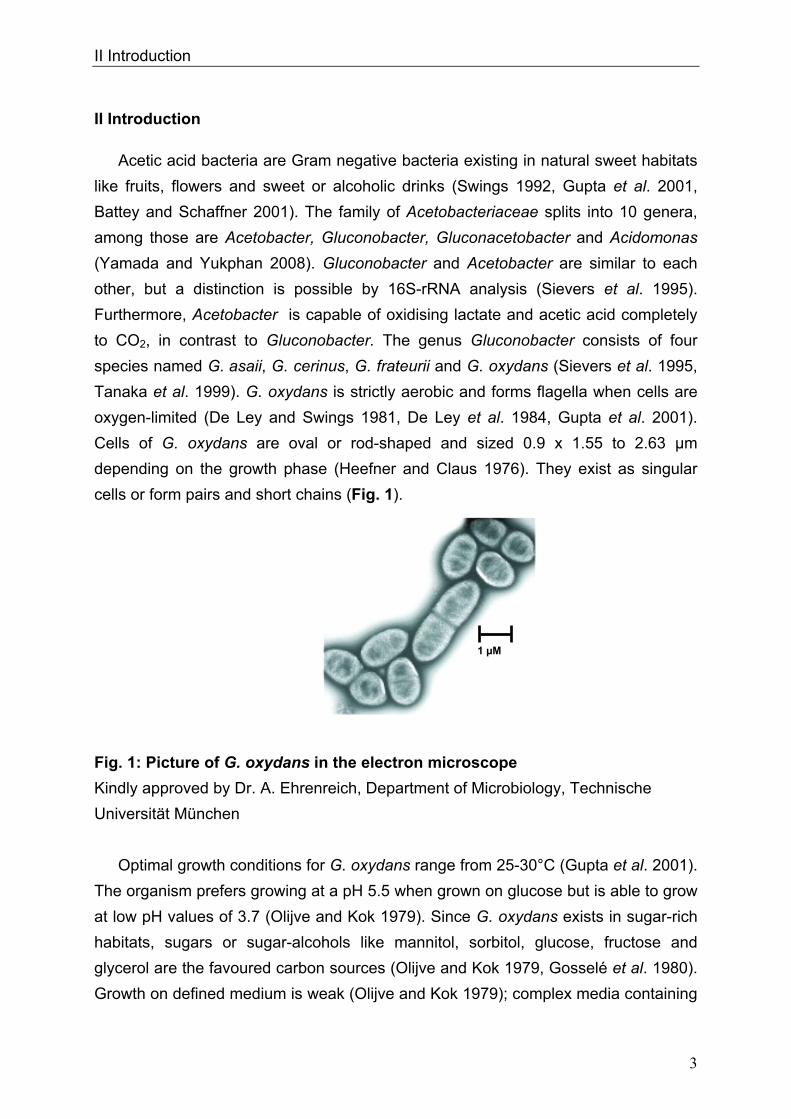
Cells of G. oxydans are oval or rod-shaped and sized 0.9 x 1.55 to 2.63 μm
depending on the growth phase (Heefner and Claus 1976). They exist as singular
cells or form pairs and short chains (Fig. 1).
Fig. 1: Picture of G. oxydans in the electron microscope
Kindly approved by Dr. A. Ehrenreich, Department of Microbiology, Technische
Universität München
Optimal growth conditions for G. oxydans range from 25-30°C (Gupta et al. 2001).
The organism prefers growing at a pH 5.5 when grown on glucose but is able to grow
at low pH values of 3.7 (Olijve and Kok 1979). Since G. oxydans exists in sugar-rich
habitats, sugars or sugar-alcohols like mannitol, sorbitol, glucose, fructose and
glycerol are the favoured carbon sources (Olijve and Kok 1979, Gosselé et al. 1980).
Growth on defined medium is weak (Olijve and Kok 1979); complex media containing
1 µM
II Introduction
4
yeast extract permit growth of the organism to higher dell densities (Raspor and
Goranovič 2008).
In 2005 the genome sequence of G. oxydans 621H was published by Prust et al.,
offering new insights into the metabolic pathways. The genome size is 2.9 Mbp
including 5 plasmids and 2664 putative protein-coding ORFs of which 1877 ORFs
were functionally characterised. The GC-content of the genomic DNA of 61% is
relatively high in comparison to other bacteria (De Ley et al. 1984, Shimizu et al.
1999, Prust et al. 2005). The genome annotation affirmed that G. oxydans lacks
genes of the citric acid cycle (TCA) and of the Embden-Meyerhof pathway (EMP)
(Greenfield et al. 1972, Fritsche 1999, Prust et al. 2005). The genes encoding for
succinate dehydrogenase, succinyl-CoA-synthetase and 6-phosphofructokinase are
not present. Since both, Embden-Meyerhof-Parnas pathway and the citrate cycle are
interrupted, these pathways serve for the formation of precursors only. The pentose
phosphate pathway (PPP) and the Entner-Doudoroff pathway (EDP) are both
completely present in G. oxydans (Deppenmeier et al. 2002, Kersters et al. 1968).
G. oxydans is used since 1930 industrially due to its many membrane-bound and
respiratory chain linked dehydrogenases, which enable the organism to oxidise
various substrates, like sugars or polyols, in one or more steps (Kulhanek 1989).
These reactions take place in the periplasm and the oxidation intermediates
accumulate in the culture medium. Only a small fraction of the substrate enters the
cells and serves for growth and biomass production (Weenk et al. 1984).
Concomitant with the high oxidation capacity are the low growth yields of G. oxydans
allowing a conversion of more than 90% of the substrates into industrially relevant
products. The organism is utilised for the production of acetic acid, miglitol
(antidiabetic drug) and for dihydroxyacetone serving as a tanning agent (Campbell et
al. 2000, Schedel 2000, Claret et al. 1994). G. oxydans has industrial relevance due
to its capacity to oxidise glucose to gluconate that serves as a solvent of dirt in the
textile industry (Meiberg et al. 1983, Pronk et al. 1989). The most prominent product
manufactured with G. oxydans is vitamin C via a sequence of three oxidations
starting from sorbitol (Bemus et al. 2006, Hancock 2009). Finally, genetically
engineered strains of the organism produce up to 300 mM 5-ketogluconic acid from
glucose. This prochiral ketoacid is a precursor of enantiopure L-(+)-tartaric acid
(Klasen et al. 1992, Elfari et al. 2005, Merfort et al. 2006).

II Introduction
5
The respiratory chain of G. oxydans
The name G. oxydans stresses the fact, that this organism strictly depends on
oxygen and has a high capacity to oxidise substrates. It possesses many membrane-
bound oxidoreductases, which are part of the respiratory chain. The membrane-
bound dehydrogenases (oxidoreductases) of G. oxydans pass electrons to the
respiratory chain (Prust et al. 2005). PQQ, heme c or FAD serve as prosthetic groups
(Shinagawa et al. 1990, Matsushita et al. 2003, Toyama et al. 2007, Toyama et al.
2004). The electrons derived from the enzyme catalysed oxidations are transferred to
ubiquinone (Fig. 2).
Fig. 2 Components of the respiratory chain in G. oxydans Pmf: proton motive force; PQQ: Pyrroloquinoline quinone; FAD: Flavine adenine dinucleotide
G. oxydans possesses the monomeric, non-proton pumping NADH
dehydrogenase II (NADH: ubiquinone oxidoreductase, ndh) (Prust et al. 2005)
(Fig. 2). The respiratory chain of G. oxydans is branched; electrons can be
transferred either to an ubiquinol bo3 oxidase or to a copper containing ubiquinol bd
oxidase (Matsushita et al. 1987, Matsushita et al. 1994). The ubiquinol bo3 oxidase is
more efficient in generating a proton motive force than the ubiquinol bd oxidase
because it pumps two protons per electron pair into the periplasm (Verkhovskaya et
al. 1997). In contrast, the ubiquinol bd oxidase is a non-proton pumping oxidase
(Millers et al. 1985). The ubiquinol bo3 oxidase is very similar to cytochrome c
oxidases. Three of four subunits are nearly identical; the fourth is highly homologous
to the analogous subunit of the cytochrome c oxidase (Abramson et al. 2000). These
oxidases have distinct cytochrome c or ubiquinol binding sites, but the overall
GlucosemGDH
PQQ
Ubiquinone-pool
NADHNADH-DH II
FAD
pmf
ADP + Pi
ATPATP -synthase
Ubiquinol bo3-oxidase
Ubiquinol bd- oxidase
½ O2
H2O
½ O2
H2O
Cytochrome bc1 complex
Cyto-
chrome c552
pmf
Cytochrome cperoxidase
H2O2 2 H2O
GlucosemGDH
PQQ
Ubiquinone-pool
NADHNADH-DH II
FAD
GlucosemGDH
PQQGlucosemGDH
PQQGlucosemGDH
PQQ
Ubiquinone-poolUbiquinone-pool
NADHNADH-DH II
FADNADH
NADH-DH II
FADNADH
NADH-DH II
FADNADH
NADH-DH II
FAD
pmf
ADP + Pi
ATPATP -synthase
pmf
ADP + Pi
ATPATP -synthase
ADP + Pi
ATPATP -synthase
Ubiquinol bo3-oxidase
Ubiquinol bd- oxidase
½ O2
H2O
½ O2
H2O
Ubiquinol bo3-oxidase
Ubiquinol bd- oxidase
½ O2
H2O
½ O2
H2O
½ O2
H2O
½ O2
H2O
Cytochrome bc1 complex
Cyto-
chrome c552
pmf
Cytochrome cperoxidase
H2O2 2 H2O
Cytochrome cperoxidase
H2O2 2 H2O
Cytochrome cperoxidase
H2O2 2 H2O
Cytochrome cperoxidase
H2O2 2 H2OH2O2 2 H2OUnknown end acceptor
II Introduction
6
mechanism is very similar (Abramson et al. 2000). The ubiquinol bd oxidase and the
ubiquinol bo3 oxidase are both present in E. coli (Anraku and Gennis 1987), and
regulated by oxygen availability. If cells become oxygen-limited, the concentration of
the ubiquinol bd oxidase rises (Tseng et al. 1995). In G. oxydans, the upregulation of
the ubiquinol bd oxidase has been shown indirectly when the pH of the medium
dropped from 6 to 4 (Matsushita et al. 1989).
Surprisingly, G. oxydans also possesses the genes encoding for a cytochrome
bc1 complex, as well as for cytochrome c552, which was disclosed by genome
sequencing in 2005 (Prust et al. 2005). The complex consists of three subunits: the
cytochrome c subunit with one cytochrome c as prosthetic group, a cytochrome b
subunit with two cytochrome b and an iron-sufur subunit with one [Fe-S]-cluster. The
genes for a cytochrome c oxidase are missing (Prust et al. 2005) and therefore the
function of the cytochrome bc1 complex is not clear. The fate of the electrons is in
question as well as the conditions, under which electrons might be channelled
through the cytochrome bc1 complex. The complex might sustain the proton motive
force when the concentration of the unproductive, non-proton translocating bd type
oxidase is increased.
Genome annotation revealed the occurrence of a cytochrome c peroxidase
localised in the periplasm (Prust et al. 2005). This enzyme is reduced via soluble
cytochrome c552 and transfers electrons to H2O2 (Atack and Kelly 2007). Another
suggestion for the function of the cytochrome bc1 complex in G. oxydans was
therefore involvement in detoxification of the cells under conditions, where reactive
oxygen species like H2O2 are formed. G. oxydans possesses the gene encoding for
the periplasmatic cytochrome c peroxidase, which transfers electrons from
cytochrome c552 to H2O2 and reduces it to water. However, in other bacteria like
Pseudomonas denitrificans, this enzyme is not the only end acceptor of electrons
from the cytochrome bc1 complex via reduced cytochrome c (Nicholls and Ferguson
2002); thus the nature of the end acceptor of electrons from the cytochrome bc1
pathway is still in question. The anaerobic bacterium Zymomonas mobilis occurs in
the same habitats like G. oxydans and its respiratory chain is very similar to that of
G. oxydans (Kalnenieks 2006). In this organism, the occurrence of a cytochrome bc1
complex is more peculiar (Sootsuwan et al. 2008, Kouvelis et al. 2009). It is hardly
acceptable, that two organisms possess the cytochrome bc1 complex pathway
exclusive of an end acceptor and the search for the terminal acceptor became more
crucial.
The membrane-bound alcohol dehydrogenase (ADH) is an enzyme of great
interest in Gluconobacter research (Adachi et al. 1978, Jongejan et al. 2000) since it
II Introduction
7
functions not only as an oxidoreductase like the other membrane-bound
dehydrogenase. It was reported to have integral functions in the respiratory chain
(Adachi et al. 1978, Jongejan et al. 2000). It belongs to the ADH type III family and
consists of three subunits (Matsushita et al. 2008). Three cytochrome c are located
within the cytochrome c subunit, PQQ and one cytochrome c are bound within the
large subunit. The function of the 15 kDa subunit is not clear yet. Matsushita et al.
2008 reported a bound ubiquinol in the enzyme. Besides its normal catalytic function,
ADH plays a more general role in the respiratory chain. On the one hand, it can
transfer electrons from ethanol to the ubiquinol pool; on the other hand, it can receive
electrons from a soluble ubiquinol to an ubiquinone bound to the enzyme (Matsushita
et al. 2008). These electrons can be received from the membrane-bound glucose
dehydrogenase mGDH, which does not exhibit ferricyanide reductase activity when
the ADH is not present or when the cytochrome c subunit of the ADH is missing
(Shinagawa et al. 1990). Thus, the electron transfer from GDH to ferricyanide is
mediated by ubiquinone and ADH (Shinagawa et al. 1990), but the authors did not
mention a possible reason for such an electron transport. There are indications in the
literature, that the ADH is interconnected with the ubiquinol bd oxidase, which is
synonymously named “cyanide-insensitive” oxidase. This connection has only been
shown indirectly and the mechanism is not known yet. It was reported that the
cyanide-sensitivity of the cells increased, when the cytochrome c subunit of the ADH
was missing (Matsushita et al. 1989). The authors concluded that the second subunit
cytochrome c of the alcohol dehydrogenase might be involved in the cyanide-
insensitive respiratory chain bypass (cytochrome bd) (Matsushita et al. 1991).
Furthermore, is was reported that a decreased ADH activity in pH 4 grown cells was
restored after incubation of the cells at pH 6 if the cells were actively generating a
membrane potential (Matsushita et al. 1995). In the present work, we put forward a
possible involvement of the cytochrome bc1 complex in the activation of the ADH,
since the cytochrome bc1 complex actively generates a proton motive force. Further
indications for presence of super-complex structures were provided by Soemphol et
al. 2008 who investigated the interaction of the two membrane bound sorbitol
dehydrogenases (GLDHs) of Gluconobacter frateurii with the two terminal oxidases.
In a mutant strain defective in PQQ-GLDH, oxidase activity with sorbitol was more
resistant to cyanide than in either the wild-type strain or the mutant strain defective in
FAD-SLDH. These results suggested that PQQ-GLDH connects efficiently to the
cytochrome bo3 terminal oxidase whereas FAD-SLDH linked preferably to the
cyanide-insensitive terminal oxidase (cytochrome bd).

II Introduction
8
Glucose metabolism in G. oxydans
Beside a branched, complex respiratory chain, the glucose metabolism of
G. oxydans is not simple, either. G. oxydans possesses three pathways for the
catabolism of glucose. The predominant one is the periplasmatic oxidation by mGDH
and membrane-bound gluconate dehydrogenases (Levering et al. 1988, Pronk et al.
1989) (Fig. 3).
Fig. 3 Pathways of glucose and gluconate oxidation in G. oxydans pentose phosphate pathway (orange); Entner-Doudoroff pathway (dark blue); reactions of gluconeogensis in green; oxidative reactions of glucose or gluconate in light blue, intermediates in yellow; DH: dehydrogenase; p: periplasmatic; ex: extern; Upt: uptake; Glc: Glucose; Glcn: Gluconate; KGA: ketogluconates; mGDH: membrane-bound glucose DH; cGDH: cytosolic glucose DH; g2DH: gluconate 2-DH; g5DH: gluconate 5-DH; KDGP: 2-keto-3-deoxy-6-phospho-gluconate; P: phosphate; GAP: glyceraldehyde 3-phosphate; GLac: gluconolacton; hk: hexokinase; gntk: gluconokinase; pg: gluconolactonase; gno: gluconate-5-dehydrogenase; edd: 6-phosphogluconate dehydratase; eda: 2-Keto-3-deoxygluconate 6-phosphate aldolase; zwf: glucose 6-phosphate dehydrogenase; gnd: 6-phosphogluconate dehydrogenase; rpe: ribulose 5-phosphate epimerase; tka: transketolase; tal: phosphate isomerase; pgi: glucose 6-phosphate isomerase; fdp: fructose bisphosphatase; fba: fructose-1,6-diphosphate aldolase; tpi: triosephosphate isomerase; gap: glyceraldehyde 3-phosphate dehydrogenase; pgk: phosphoglycerate kinase; pyk: pyruvate kinase
II Introduction
9
Intermediates and products of these reactions accumulate in the medium. In parallel,
glucose is taken up into the cytoplasm by an unknown transport system (Pronk et al.
1989, Olijve 1979). Here, glucose can either be oxidised to gluconate by a soluble
NAD(P)-linked glucose dehydrogenase or be phosphorylated to glucose 6-phosphate
by glucose kinase. As G. oxydans lacks phosphofructokinase, glucose 6-phosphate
cannot be metabolised via glycolysis, but only via the pentose phosphate pathway
(PPP) or the Entner-Doudoroff pathway (EDP) (Deppenmeier and Ehrenreich 2008,
Deppenmeier et al. 2002, Kersters and De Ley 1968). Intracellular gluconate can
either be oxidised to 5-ketogluconate by an NAD(P)-linked gluconate 5-
dehydrogenase (Merfort 2006) or phosphorylated by gluconate kinase to 6-
phosphogluconate, which is then metabolised via PPP or EDP (Fig. 3) (Pronk et al.
1989). Pyruvate formed in EDP and in the late reactions of glycolysis can be oxidized
to acetyl-CoA by the pyruvate dehydrogenase complex (Prust et al. 2005). Growth of
G. oxydans on glucose divides into two metabolic phases (Olijve and Kok 1979a,
Levering et al. 1988). In the first phase, cells oxidise glucose rapidly to gluconate by
the membrane-bound glucose dehydrogenase (mGDH); gluconate mainly
accumulates in the medium. In the second growth phase, gluconate present in the
medium is further oxidized to 5-keto and 2-ketogluconates by the membrane-bound
sorbitol dehydrogenase and gluconate 2-dehydrogenase, respectively (Weenk et al.
1984, Hölscher et al. 2009). Since this periplasmatic oxidation is the prevailing route
of glucose catabolism, only a small fraction of the carbon source is utilised for cell
growth. In growth phase I cells grow exponentially whereas growth in phase II is slow
and linear (Olijve and Kok 1979).
Aims of the work
The presence of genes encoding the cytochrome bc1 complex was one of the
surprising results when the genome of G. oxydans was sequenced in 2005. The
absence of an electron end acceptor, like the cytochrome c oxidase, initiated the
search for the function of the complex. One aim of the present work was elucidation
of the role of the cytochrome bc1 complex in the respiratory chain of G. oxydans. One
strategy to attain this goal was construction of a marker-free deletion mutant lacking
the cytochrome bc1 complex. Based on the literature on the respiratory chain of
G. oxydans, clarification of the function of the complex with the help of a deletion
mutant appeared most promising by variation of the parameters oxygen supply and
pH-value of the growth medium. Furthermore, performance of short time oxidation
kinetics with intact cell and different substrates were planned, in order to check an

II Introduction
10
influence of the cytochrome bc1 complex on primary oxidative steps of the
membrane. Since there were several indications in the literature of formation of super
complexes among components of the respiratory chain, co-purification experiments
were envisaged. Presence of a gene in the G. oxydans genome encoding a
periplasmatic cytochrome c peroxidase was a perspective to identify an alternative
terminal electron acceptor of the cytochrome bc1 complex pathway. This enzyme was
to be characterised, although in most other bacteria, it is not the sole acceptor of
electrons from cytochrome c, but occurs in combination with a cytochrome c oxidase.
To evaluate the results obtained from phenotypical characterisation of the deletion
mutant and to relate them to possible impacts on the central carbon metabolism,
genome-wide microarray analyses under three conditions were scheduled: I) oxygen
limitation vs. oxygen excess, II) pH 4 grown cells vs. pH 6 grown cells and III) cells of
growth phase II vs. cells of growth phase I during cultivation on glucose. The
concentration of the ubiquinol bd oxidase was reported to enhance under oxygen
limitation and acidic pH, therefore these conditions were likely to provoke regulation
of genes encoding the respiratory chain components.
The membrane-bound glucose dehydrogenase is a highly active enzyme feeding
electrons into the respiratory chain and releasing gluconate into the culture medium.
Upon glucose exhaustion, G. oxydans enters a second phase of growth on
gluconate. An unexplained phenomenon is the strongly decreased cell growth in
phase II, although most of the gluconate is oxidised by the membrane-bound
gluconate-2-dehydrogenase. Thus, the energy supply of the cells should be similar to
that of growth phase I. In order to obtain data on the changes in catabolism occurring
in growth phase II, genome-wide transcription analysis, enzyme activity
measurements and a first 13C-metabolome analysis with G. oxydans were planned.
At the same time, metabolic flux analysis would allow an identification of the principal
pathway of glucose catabolism. Genome sequencing and annotation in 2005
demonstrated the presence of all genes encoding the enzymes of the pentose
phosphate pathway and the Entner-Doudoroff pathway in G. oxydans. In this work
resolution of the relative contributions of the two pathways to overall catabolism by
metabolic flux analysis was pursued.
III Materials and Methods
11
III Materials and Methods
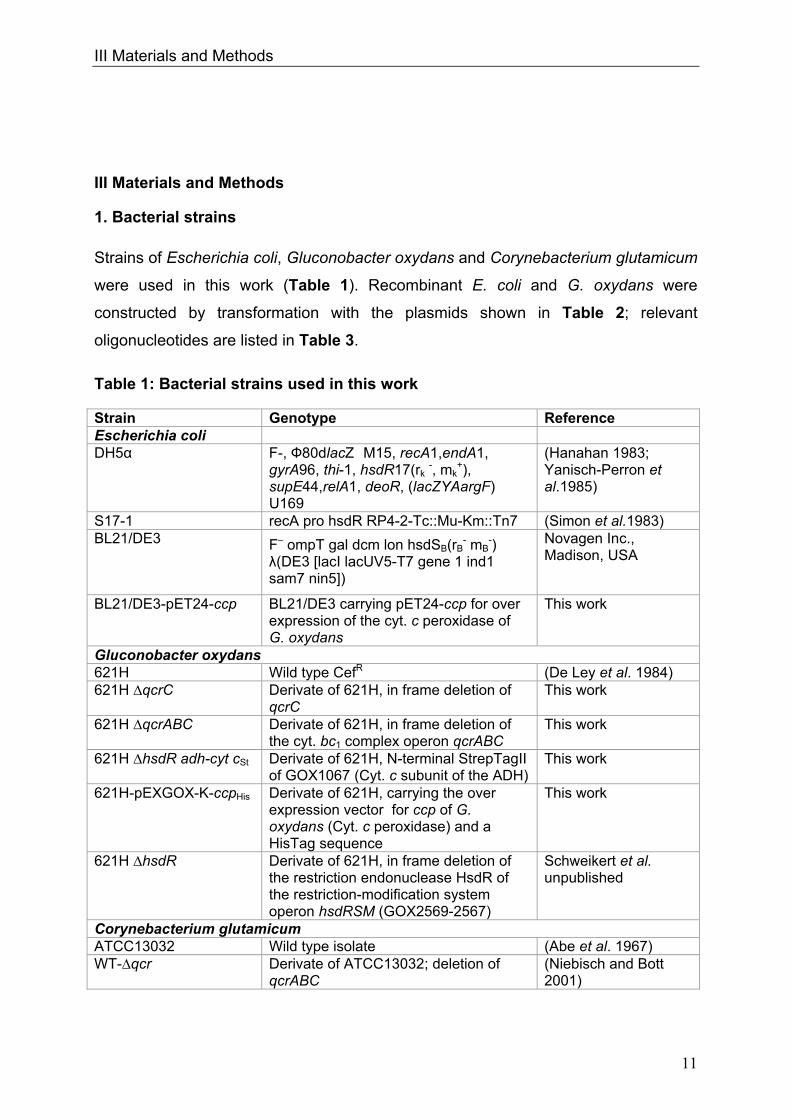
1. Bacterial strains Strains of Escherichia coli, Gluconobacter oxydans and Corynebacterium glutamicum
were used in this work (Table 1). Recombinant E. coli and G. oxydans were
constructed by transformation with the plasmids shown in Table 2; relevant
oligonucleotides are listed in Table 3.
Table 1: Bacterial strains used in this work
Strain Genotype Reference Escherichia coli DH5α F-, Ф80dlacZ M15, recA1,endA1,
gyrA96, thi-1, hsdR17(rk -, mk
+), supE44,relA1, deoR, (lacZYAargF) U169
(Hanahan 1983; Yanisch-Perron et al.1985)
S17-1 recA pro hsdR RP4-2-Tc::Mu-Km::Tn7 (Simon et al.1983) BL21/DE3 F– ompT gal dcm lon hsdSB(rB
- mB-)
λ(DE3 [lacI lacUV5-T7 gene 1 ind1 sam7 nin5])
Novagen Inc., Madison, USA
BL21/DE3-pET24-ccp BL21/DE3 carrying pET24-ccp for over expression of the cyt. c peroxidase of G. oxydans
This work
Gluconobacter oxydans 621H Wild type CefR (De Ley et al. 1984) 621H ∆qcrC Derivate of 621H, in frame deletion of
qcrC This work
621H ∆qcrABC Derivate of 621H, in frame deletion of the cyt. bc1 complex operon qcrABC
This work
621H ∆hsdR adh-cyt cSt Derivate of 621H, N-terminal StrepTagII of GOX1067 (Cyt. c subunit of the ADH)
This work
621H-pEXGOX-K-ccpHis Derivate of 621H, carrying the over expression vector for ccp of G. oxydans (Cyt. c peroxidase) and a HisTag sequence
This work
621H ∆hsdR Derivate of 621H, in frame deletion of the restriction endonuclease HsdR of the restriction-modification system operon hsdRSM (GOX2569-2567)
Schweikert et al. unpublished
Corynebacterium glutamicum ATCC13032 Wild type isolate (Abe et al. 1967) WT-∆qcr Derivate of ATCC13032; deletion of
qcrABC (Niebisch and Bott 2001)
III Materials and Methods
12
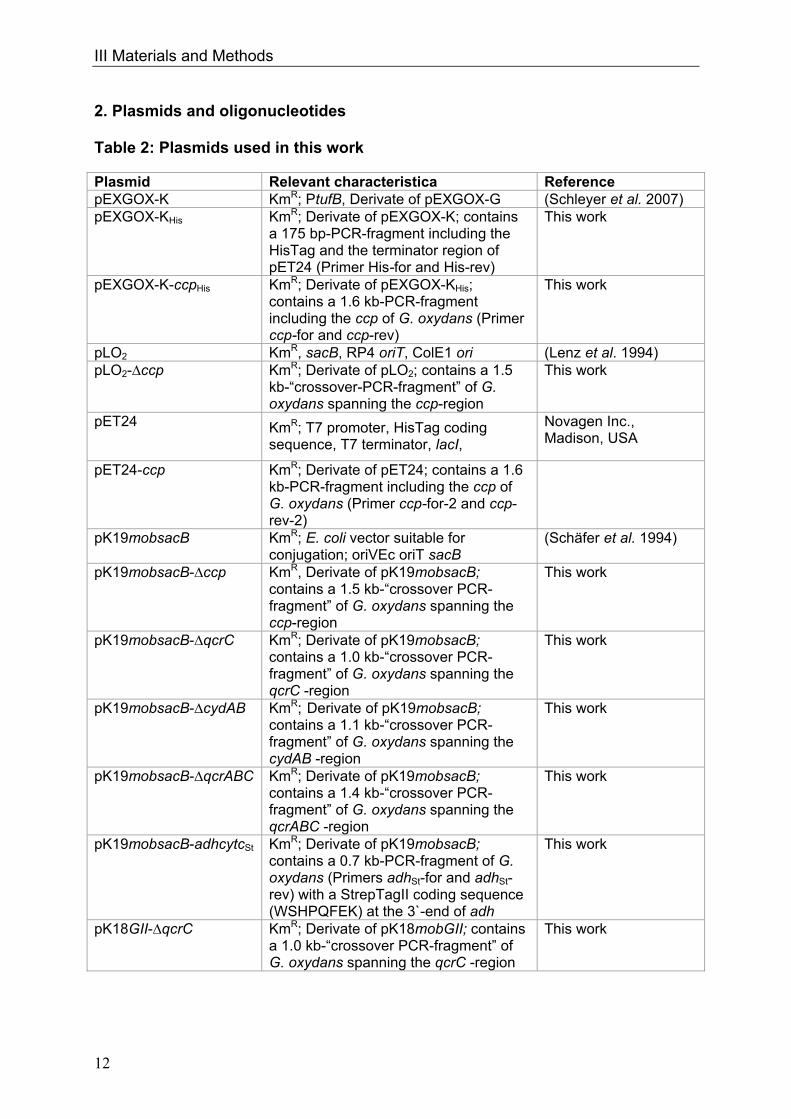
2. Plasmids and oligonucleotides Table 2: Plasmids used in this work
Plasmid Relevant characteristica Reference pEXGOX-K KmR; PtufB, Derivate of pEXGOX-G (Schleyer et al. 2007) pEXGOX-KHis KmR; Derivate of pEXGOX-K; contains
a 175 bp-PCR-fragment including the HisTag and the terminator region of pET24 (Primer His-for and His-rev)
This work
pEXGOX-K-ccpHis KmR; Derivate of pEXGOX-KHis; contains a 1.6 kb-PCR-fragment including the ccp of G. oxydans (Primer ccp-for and ccp-rev)
This work
pLO2 KmR, sacB, RP4 oriT, ColE1 ori (Lenz et al. 1994) pLO2-∆ccp KmR; Derivate of pLO2; contains a 1.5
kb-“crossover-PCR-fragment” of G. oxydans spanning the ccp-region
This work
pET24 KmR; T7 promoter, HisTag coding sequence, T7 terminator, lacI,
Novagen Inc., Madison, USA
pET24-ccp KmR; Derivate of pET24; contains a 1.6 kb-PCR-fragment including the ccp of G. oxydans (Primer ccp-for-2 and ccp-rev-2)
pK19mobsacB KmR; E. coli vector suitable for conjugation; oriVEc oriT sacB
(Schäfer et al. 1994)
pK19mobsacB-∆ccp KmR, Derivate of pK19mobsacB; contains a 1.5 kb-“crossover PCR-fragment” of G. oxydans spanning the ccp-region
This work
pK19mobsacB-∆qcrC KmR; Derivate of pK19mobsacB; contains a 1.0 kb-“crossover PCR-fragment” of G. oxydans spanning the qcrC -region
This work
pK19mobsacB-∆cydAB KmR; Derivate of pK19mobsacB; contains a 1.1 kb-“crossover PCR-fragment” of G. oxydans spanning the cydAB -region
This work
pK19mobsacB-∆qcrABC KmR; Derivate of pK19mobsacB; contains a 1.4 kb-“crossover PCR-fragment” of G. oxydans spanning the qcrABC -region
This work
pK19mobsacB-adhcytcSt KmR; Derivate of pK19mobsacB; contains a 0.7 kb-PCR-fragment of G. oxydans (Primers adhSt-for and adhSt-rev) with a StrepTagII coding sequence (WSHPQFEK) at the 3`-end of adh
This work
pK18GII-∆qcrC KmR; Derivate of pK18mobGII; contains a 1.0 kb-“crossover PCR-fragment” of G. oxydans spanning the qcrC -region
This work

III Materials and Methods
13
Table 3: Oligonucleotides used in this work. Oligonucleotides were obtained by Eurofins MWG Operon (Ebersberg, Germany). The sequences are given in 5' 3'- direction. The relevant features of the oligonucleotides are underlined (Restriction sites), bold (Sequences for StrepTag-II) and italic (homologous sequences for crossover PCR; us: upstream, ds: downstream
PCR primer Sequence Enzyme His-for TATATAGTCGACCGGATATAGTTCCTCCTTTCAG SalI His-rev TATATAATTTAAATCACTCGAGCACCACC SwaI ccp-for GTGGTGCGTTCCAGCA ccp-rev GTTCGAGGAACCAGAACC ccp-for-2 TATATACATATGGTGCGTTCCAGCACGATTAC NdeI ccp-rev-2 TATATACTCGAGGTTCGAGGAACCAGAACCCGACACA XhoI adhSt-for TATATA TCTAGA CACCGAGCCTGCGCAG XbaI adhSt-rev TATATAGTCGACTCACTTCTCGAACTGTGGGTGGGAC
CATTGTGCGTCGTCCACGCC SalI
PCR primers used for deletion
∆ccp-us-for TATATAGTCGACCATGAGCATGTGTTCCATCTGACCAAG
SalI
∆ccp-us-rev CCCATCCACTAAACTTAAACACGTGCTGGAACGCACCACTTTT
∆ccp-ds-for TGTTTAAGTTTAGTGGATGGGCAGGCTCCTGTGTCGGGTTCTG
∆ccp-ds-rev TATATATCTAGACAATACACCCCCCATACACGACAGGC
XbaI
∆qcrC-us-for TATATAGCATGCCCAGACCCTGCCGTTCCACC SphI ∆qcrC-us-rev CCCATCCACTAAACTTAAACACCGGGTCCAGCGCGTC
AT
∆qcrC-ds-for TGTTTAAGTTTAGTGGATGGGCTGCTGCAACGCCGCATC
∆qcrC-ds-rev TATATAGGATCCCGTGTGGTCGCTGCTTCTTTGC BamHI ∆qcrC-us-for-2 TATATAGTCGACCCAGACCCTGCCGTTCCACC SalI ∆qcrC-ds-rev-2 TATATATCTAGACGTGTGGTCGCTGCTTCTTTGC XbaI ∆qcrABC-us-for TATATAGTCGACGATCACATGAGCCGTCTGAAGGGCG
G SalI
∆qcrABC-us-rev CCCATCCACTAAACTTAAACACTGGGTCATGCGGAACCTCTGCCG
∆qcrABC-ds-for AGTTTAGTGGATGGGCGCCGCTGACCGAGCTGAACTACATC
∆qcrABC-ds-rev TATATATCTAGAGACAGCCGTCAGCCGCATCGTTTC XbaI ∆cydAB-us-for TATATAGTCGACGACAGGCGCCCTCG SalI ∆cydAB-us-rev CCCATCCACTAAACTTAAACACATGTCGATTGCCTTCT
GGG
∆cydAB-ds-for TGTTTAAGTTTAGTGGATGGGTGAGAACAGGGAGGCC ∆cydAB-ds-rev TATATATCTAGAGCACATCCCCGCAGAAC XbaI
Deletion control primer and sequencing primer
c∆qcrC-for CCCTGCATGTCGCGGCG c∆qcrC-rev CCCGCGTTCAAAAGAACGGG c∆qcrABC-for GAATGAACGCAGCTAGTCAG c∆qcrABC-rev CTGCACGGCCAGGTG c∆cydAB-for GTGGTTTCAGCACTTCTC c∆cydAB-rev CGACGTTTGCGCGG
III Materials and Methods
14
c∆ccp-for GCTGAACTCGGCGCGTTTC c∆ccp-rev CAGACATTCCGTGATGAAATGGC Univ (fragments in pK18mob and derivatives)
CGCCAGGGTTTTCCCAGTCACGACG
rspI (fragments in pK18mob and derivatives)
GGAAACAGCTATGACCATG
cDNA synthesis primer for RT-PCR
cDNA0278 CTCCGCCATGCCAGCGTC cDNA1914 GCGGGACATCATGTTGATGG cDNA1675 CCAGATCAGGTTTGACCGGCG cDNA0564 CATGAGCCGTCTGAAGGG
Primer for Light cycler
LC0278-for CCCCGCTGCTGTTCTTCTCCTTCC LC0278-rev GAAGCCCGCAGGCGACATGAAC LC1914-for ACCCAGGCTCCTACCACCACG LC1914-rev CGATGATGACGATCACCGATGCC LC1675-for GACCGGTTTCAGCCTCAAATCCGG LC1675-rev CCTGCGTGGTCTGAAGCGTGGTG LC0564-for GGGGACTTTTCCTCCGCTTG LC0564-rev GCGGAATGAGGGCATGAATC
Primer for amplification of “standard” genes, used for quantification in the light cycler
Q0278-for GTGGCTGGCGTTGCCGG Q0278-rev GCACATGGGCCTCGC Q1914-for AGTAAGAGGGGCGCATAAGACTT Q1914-rev CTTTCGAAACCTGAGGGTAGG Q1675-for CGTTTCGCACTTGATATGAGGAAAAATC Q1675-rev CCTCTTTGACGGGCTTCTGAAAAG Q0564-for GTACCGGGGAAAATGC Q0564-rev CAAAATATGTCCGTTTTC
3. Chemicals and enzymes
Chemicals were obtained from Sigma-Aldrich Chemie GmbH (Taufkirchen,
Germany), Merck KGaA (Darmstadt, Germany), Fluka (Neu-Ulm, Germany) or Roth
GmbH + Co.KG (Karlsruhe, Germany). Biochemicals and enzymes (including related
buffers) were from Roche Diagnostics GmbH (Mannheim, Germany), New England
Biolabs (Frankfurt, Germany) and Invitrogen (Karlsruhe, Germany). 1-13C-D-glucose
and U-13C-glucose were obtained from Deutero GmbH (Kastellaun, Germany).
Auxiliary enzymes for activity assays (glucose 6-phosphate dehydrogenase and 6-
phosphogluconate dehydrogenase from yeast) were purchased from Sigma-Aldrich
(Taufkirchen, Germany) and Merck (Darmstadt, Germany). Media components

III Materials and Methods
15
”Bacto-Peptone“, “Bacto Yeast extract” and ”Bacto-Agar“ were obtained from Becton
Dickinson GmbH (Heidelberg, Germany).
4. Media E. coli was cultivated in Luria-Bertani (LB) medium (Sambrook and Russel 2000).
For anaerobic cultures, the following medium was used (Pope and Cole 1982):
Medium for anaerobic growth Ad 1 l aqua bidest Trace element solution 50 ml LB medium 0.4 g FeCl2 1 ml trace element solution 8.2 g MgCl2 5.5 g KH2PO4 1.0 g MnCl2 10.5 g K2HPO4 0.1 g CaCl2 1.0 g (NH4)SO4 2 ml conc. HCl 0.5 g Sodiumcitrate Ad 100 ml aqua bidest 0.1 g MgSO4 200 mg Ammonium molybdate 7.0 g Fumaric acid 2.0 g Glucose 4.0 g Glycerol 350 mg Nitrate 350 mg Nitrite
G. oxydans was cultivated in a medium which contained 5 g l-1 yeast extract,
2.5 g l-1 MgSO4 x 7 H2O, 0.5 g l-1 glycerol and 80 g l-1 glucose or mannitol as a
carbon source (Bremus 2006). For growth of G. oxydans before electroporation, EP
medium was used (Bremus 2006) (15 g l-1 yeast extract, 2.5 g l-1 MgSO4 x 7 H2O,
0.5 g l-1 glycerol and 80 g l-1 mannitol).
Media for bacterial growth were sterilised for 20 min at 121°C. Antibiotics were
added after cooling down to 50°C. Cultures of G. oxydans and E. coli were
supplemented with 50 ng μl-1 cefoxitin or kanamycin as antibiotica. 15 g l-1 agar was
added for preparation of solid plates.
5. Culture conditions of G. oxydans and E. coli
For cultivation of E. coli, LB-medium was inoculated with single colonies and cells
were cultivated at 37°C over night. The main cultures of 50-500 ml LB-medium were
inoculated at an OD600 of 0.1-0.3 in 0.3-2.0 l flasks and cultured at 120 rpm and
37°C. For anaerobically growth of E. coli, the over night culture was inoculated at a
ratio of 1:100 in a 500 ml flask containing 500 ml of the medium for anaerobic growth
and cultivated for 8 h at 90 rpm and 37°C. 50 ml of the culture were inoculated in 2 l
flasks containing 2 l of the medium for anaerobic growth and cultured at 30 rpm and
37°C for 12 h. Induction with IPTG (0.5 mM final concentration) occurred after 9 h.
III Materials and Methods
16
G. oxydans was grown in 0.3-5.0 l flasks filled with 0.05-1.0 l medium. Precultures
were inoculated with single colonies and grown over night at 180 rpm and 30°C. Main
cultures were inoculated at an OD600 of 0.1-0.3 and grown as described. Growth of
bacteria in liquid cultures was determined by measuring the optical density at 600 nm
in an “Ultrospec 300 pro photometer” (Amersham Bioscience, Freiburg, Germany).
Cell densities above absorption of 0.3 were diluted to assure linearity.
G. oxydans was cultivated in the “FedBatch-Pro” fermentation system (DASGIP
AG, Jülich, Germany) for controlled growth conditions (control of pH and oxygen
availability) in four parallel 250 ml bioreactors (Fig. 4). Each reactor was equipped
with electrodes for measuring the pH value and the concentration of dissolved
oxygen (DO) in the medium. Automatic titration with 2 M NaOH maintained the pH.
The oxygen electrodes were calibrated by gassing with air (100% DO) and N2 (0%
DO). The cultures were gassed with a fixed concentration of O2 (2% O2) to obtain
oxygen limitation if desired. At the beginning of growth, the concentration of oxygen
was not limiting. When the cell density increased, oxygen consumption of the culture
increased. The gassing with 2% O2 did not allow an increase in oxygen concentration
in the medium resulting in oxygen depletion during cell growth. Another approach
was to keep the DO of the medium statically at e.g. 15% during growth. The software
of the fermentation system was able to calculate the right gas mixture of O2, N2 and
air in different ratios in order to maintain the 15% DO at any time of cell growth.
Higher oxygen consumption caused by higher cell densities were balanced with
higher percentage of air or O2 in the mixture. Consequently, the cells were never
oxygen-limited, independent of cell growth. Gassing rates as well as concentrations
of gases, which were gassed into the cultures, were recorded as well as leaving gas
concentrations. Thus, the O2 consumption and CO2 production of growing cells were
calculated. The software of the DasGip fermentation system performed calculation of
oxygen transfer rates and carbon dioxide transfer rates. Gassing rate was constant
with 12 standard l min-1 and the magnetic stirrer was set at 900 rpm. The pH was kept
at 4 or 6 and the cells were cultured at 30°C.

III Materials and Methods
17
Fig. 4 “Fedbatch-Pro“-fermentation system a) Complete system of the „Fedbatch-Pro“-fermentation system; b) detailed picture of the four reaction bioreactors
6. Determination of cell dry weight
The cell dry weight of G. oxydans 621H was determined by applying membrane
filtration (Bratbak and Dundas 1984). A cellulose filter with a pore diameter of 0.45
μm (Millipore, Schwalbach, Germany) was dried for 24 h at 110°C, cooled down in an
exsiccator and weighted. 10 ml samples of growing G. oxydans was harvested at
different time points, filtrated and washed with 100 ml of distilled water. Samples
were weighted again after drying for 24 h at 110°C and cooling down in an
exsiccator. From the net weight the following correlation was calculated for
G. oxydans: Biomass cell dry weight (CDW) [g l-1] = 0.23 x OD600 nm.
7. Stock cultures
Strains of G. oxydans and E. coli were stored as glycerol stocks. Strains were
grown until exponential growth phase and 1 ml of the culture was mixed with 1 ml
stock solution (67% glycerol (w/v), 13 mM MgCl2) and stored at -70°C (Sambrook
and Russel 2000).
8. Molecular biological methods
8.1 Isolation of DNA
DNA fragments from agarose gels were isolated with the QIAquick Gel Extraction
Kit (Qiagen, Hilden, Germany) following the manufacturer’s instructions. PCR
products and fragments of restriction reactions were purified with the PCR
Purification Kit (Qiagen, Hilden, Germany). Genomic DNA of E. coli or G. oxydans
was isolated with the DNeasy Tissue Kit “DNA purification from bacteria” (Qiagen,
Hilden, Germany) according to the manufacturer’s instructions. Genomic DNA was
stored at 4°C. Plasmid DNA of E. coli for cloning, sequencing and transformation was
isolated after alkaline lysis of the cells following the protocol of the QIAprep Spin
a) b)

III Materials and Methods
18
Miniprep Kit (Qiagen, Hilden, Germany). Plasmid DNA was isolated from G. oxydans
in the same way by adapting the protocol to higher culture volumes (20 ml instead of
2 ml) and addition of 15 mg ml-1 lysozyme to buffer P2. Plasmids were eluted from
the column with 20 μl H2O or elution buffer (Tris pH 8) and stored at -20°C.
Concentration of nucleic acids was determined at 260 nm (Sambrook et al. 1989)
(NanoDrop ND-1000 UV-Vis Spektralphotometers, Peqlab, Erlangen, Germany). The
quality of the DNA was controlled using the OD260/OD280 ratio. Protein-free samples
show a ratio between 1.8 and 2.2 (Gallagher and Desjardins 2007). Samples were
send to Agowa (Berlin, Germany) for sequencing.
8.2 Recombinant DNA-techniques
For DNA restriction, 2-10 μg DNA was digested in 50 μl total volume with 5 U
enzyme and 5 μl of the required buffer (recommendations of manufacturer). If two or
more restriction enzymes were used, it was necessary to use the same restriction
buffer. Restriction was finished after 1-2 h. The restricted DNA-fragments were used
for analytical applications or in order to ligate them into a desired vector. Before
ligation, the restricted plasmid was dephosphorylated in order to keep down vector
self-ligation. An alkaline dephosphatase was used following the manufacturer’s
instructions (Roche, Mannheim, Germany). The DNA-fragment was mixed with the
dephosphorylated vector for ligation (Rapid DNA ligation kit, Roche, Mannheim,
Germany). For blunt end ligations, 10-fold excess of the insert was used. For sticky
end ligation, a 3-fold excess was sufficient. 50 ng of vector was applied and the
required concentration of DNA-insert was calculated using the following formula
(Instructions of ROCHE):
vectortheofsize
fragmenttheofsizevectorng50 x factor of excess = ng DNA-fragment
8.3 Polymerase chain reaction (PCR)
The polymerase chain reaction was performed to amplify genomic DNA for
cloning or for controlling deletion mutants (Mullis and Faloona 1987, Rabinow et al.
1996). Isolated genomic DNA and plasmids served as PCR templates. Colony PCR
was used for screening for correct deletion clones. Amplification of DNA in colony
PCR occurred with DNA of broken cells without an isolation of the genomic DNA as
described previously. Therefore, a small amount of cells was heated in 100 μl water
at 95°C for 5 min for cell disruption before adding 3 μl of this cells suspension in the
PCR reaction. PCR was performed using the T3 thermocycler (Biometra, Göttingen.
III Materials and Methods
19
Germany). For preparative applications, a high fidelity polymerase (Phusion,
Finnzymes, MA, USA) was used according to the manufacturer’s instructions.
Denaturation of the DNA was achieved at 98°C. For non-preparative applications, the
“Taq” polymerase was used (Qiagen, Hilden, Germany) which has its denaturation
temperature at 95°C. The annealing temperature was dependent on the length and
the GC-content of the primers used. In most cases, the primers had an annealing
temperature of 60°C. The melting temperature was calculated according to the
following formula:
TM (Melting temperature) = 4 x (G+C) + 2 x (A+T) (Ashen et al. 2001).
Elongation occurred at 72°C and reactions were performed for 35 cycles.
8.4 Agarose gel electrophoresis
For analytical and preparative gel electrophoresis of DNA, horizontal
electrophoresis chambers were used with 1% (w/v) agarose gels (GibcoBRL Ultra
Pure Agarose, Invitrogen, Karlsruhe, Germany) in 1x TAE buffer. Separation of DNA
fragments occurred at 80 V and gels were stained with ethidium-bromide solution
(1 μg ml-1) for at least 10 min. Washing was performed in water for 10 min. DNA-
fragments were analysed using UV-light (Image Master VDS System, Amersham
Biosciences). The size of the fragments was determined by comparison to an
appropriate DNA-standard.
The quality of RNA was inspected with formaldehyde-containing agarose gels
(Sambrook and Russell 2001). 10x FA buffer (200 mM MOPS, 50 mM sodium
acetate, 10 mM EDTA ad 1 l with aqua bidest, pH 7.0) was used in the FA-running
buffer (100 ml 10x FA buffer, 20 ml 37%, formaldehyde 880 ml RNase-free water).
The gel for separation of RNA contained 1.2 g agarose, 10 ml 10x FA buffer, 1.8 ml
37% formaldehyde, ad 100 ml RNase-free H2O. RNA samples (0.5 μg) were mixed
with RNA-loading dye (60 μl of saturated bromphenolblue, 80 μl 0.5 M EDTA pH 8.0,
720 μl 37% formaldehyde, 2 ml 100% glycerol, 4 ml 10x FA buffer, 3 ml formamide).
After heating for 10 min at 65°C and incubation for 5 min on ice the RNA was loaded
onto the gel. Electrophoresis was performed at 80 V. The quality of the RNA was
analysed on the basis of the 16s and 23 s RNA, which should migrate as clear
defined bands in the gel.
8.5 Transformation of E. coli and G. oxydans
Heat-shock competent cells of E. coli were generated following the RbCl-method
(Cohen et al. 1972) and 60 ng plasmid DNA were added to the cells (Hanahan et al.
1983). Afterwards, cells were incubated on ice for 30 min. Then, cells were heated to

III Materials and Methods
20
42°C for 2 min, cooled down on ice for 2 min and 1 ml LB-medium was added.
Finally, cells were incubated at 37°C for at least 1 h before they were plated on
selective solid plates.
For the electroporation of the wild type strain G. oxydans 621H competent cells
were prepared by the method of Mostafa et al. 2002. Only replicative plasmids were
transformed by electroporation (Trevors and Stradoub 1990, Choi et al. 2006). Cells
were grown in 100 ml EP medium to an OD600 of about 0.8, washed twice with 1 mM
HEPES-buffer and resuspended in 400 μl 1 mM HEPES. 50 ng of plasmid DNA was
added to 100 μl of cells. Electroporation of the cells was carried out with the Gene
Pulser Xcell (BioRad, Munich, Germany) in electroporation cuvettes with 1 mm
electrode distance. After the pulse (2.0 kV, 25 μF, 200 Ω), cells were directly
resuspended in 1 ml electroporation medium and transferred to 15 ml falcon tubes.
After 16 h incubation at 30°C at 100 rpm, cells were cultivated on selective solid
plates and incubated at 30°C for 2-3 days.
Non-replicative plasmids had to be transferred into G. oxydans by biparental
mating using E. coli S17-1 (Simon et al. 1983) containing the target vector as the
donor since with electroporation no colonies were obtained. 50 ml cultures of E. coli
and G. oxydans were grown to OD600 of about 0.6 (E. coli in LB-medium with 50 μg
ml-1 kanamycin; G. oxydans in mannitol medium with 50 μg ml-1 cefoxitin) and
washed twice in non-selective medium. Cells were resuspended in mannitol medium
without kanamycin or cefoxitin and mixed in a 1:1 ratio. The cells were plated on non-
selective solid agar and incubated over night at 30°C. The cells were scraped from
the plates and cultivated on selective mannitol medium agar containing cefoxitin and
kanamycin (50 μg ml-1 each). Only plasmid-containing cells of G. oxydans were able
to survive since E. coli is cefoxitine sensitive. Plates were incubated at 30°C for 2-3
days until recombinant cells formed colonies.
8.6 Overexpression of the G. oxydans ccp gene encoding cytochrome c
peroxidase
Cells of E. coli BL21 (DE3) carrying the recombinant vector pET24-ccp were
inoculated in 50 ml LB medium with 50 μl ml-1 kanamycin and grown over night at
37°C. Up to 500 ml culture volumes were inoculated at an OD600 of 0.1 in LB
medium, containing 50 μl ml-1 kanamycin. Cells were grown to an OD600 of 0.8 at
37°C and then expression of the target gene was induced by adding IPTG (0.5 mM
final concentration). Cultures were incubated at room temperature for 4 h at 120 rpm.
Cells were harvested by centrifugation at 5,300 g for 10 min at 4°C. To control the
III Materials and Methods
21
overexpression of the cytochrome c peroxidase, 50 μl samples were taken before
induction and every hour until cell harvest and analysed with SDS-PAGE.
8.7 Construction of marker-free deletion mutants
The non-replicative vector pK19mobsacB (Schäfer et al. 1994) was used to
generate a vector for marker-free deletion. For in-frame deletions, around 600 bp
flanking regions of the target gene or operon were amplified. The fragments were
fused together by “crossover PCR” and this insert was cloned into pK19mobsacB.
The E. coli strains bearing the deletion vector pK19mobsacB grew very weakly, so
that the suicide vectors pLO2 (bearing sacB for counter selection) and pK18mobGII
(Katzen et al. 1999) (bearing the gusA gene for counter selection) were used as
possible improvements of the method. However, the respective transformed S17-1
cells did not grow better than pK19mobsacB bearing cells and were not used further.
The deletion vectors were transformed into G. oxydans 621H by biparental mating
resulting in kanamycin-resistant, sucrose-sensitive colonies. Five colonies were
selected and cultivated in 100 ml non-selective medium at 30°C over night. 100 μl of
non diluted cells were directly cultivated on selective and non selective mannitol
medium agar plates containing 10% sucrose and grown for 2-3 days at 30°C.
Kanamycin-sensitive, sucrose-resistant colonies were picked and analyzed via
colony PCR. G. oxydans DSM2343-∆qcrABC, for example, was identified using 5´
GAATGAACGCAGCTAGTCAG and 5´ CTGCACGGCCAGGTG, resulting in a
3976 bp PCR fragment in wild type cells, but 1456 bp PCR fragment in the desired
deletion strain, were the sequence encoding the cytochrome bc1 complex was
missing.
8.8 RNA preparation
For total RNA preparation the RNeasy kit (QIAGEN, Hilden, Germany) was used
according to the manufacture’s instructions. Cells were disrupted with a Mini-
BeadBeater (Silamat S5, ivoclar, Ellwangen, Germany) by four intervals of 15 s each.
DNA digestion was performed directly on the column were the DNA was bound for its
isolation by adding 30 Kuniz U DNase, RNase-free (QIAGEN, Hilden, Germany) for
20 min (manufacturer’s instructions). RNA concentration and quality was checked
photometrically and on formaldehyde-containing gels according to standard
procedures (Sambrook et al. 1989).
III Materials and Methods
22
8.9 cDNA labeling and RT PCR
cDNA synthesis for microarray analysis was performed according to Polen et al.
2007. 25 μg RNA were used for random hexamer-primed synthesis of fluorescence-
labeled cDNA with the fluorescent nucleotide analogues Cy3-dUTP and Cy5-dUTP
(GE Healthcare, Freiburg, Germany). The mixture contained 3 μl 1 mM Cy3-dUTP or
Cy5-dUTP, 3 μl 0.1 M DTT, 6 μl 5x first strand buffer (Invitrogen, Karlsruhe,
Germany), 0.6 μl dNTP-mix (dATP: 25 mM, dCTP: 25 mM, dGTP: 25 mM and dTTP:
10 mM) and 2 μl Superscript II polymerase (Invitrogen, Karlsruhe, Germany).
For quantitative real time PCR experiments, 500 ng RNA were transcribed into
cDNA using specific primers for the genes under investigation according to
manufacturer’s instructions (Omniscript RT, Qiagen, Hilden, Germany). The products
were quantified via real-time PCR using a LightCycler instrument 1.0 (Roche, Basel,
Switzerland) with SYBR Green I as the fluorescence dye following the instructions of
the supplier (QuantiTect SYBR Green PCR, Qiagen, Hilden, Germany). To quantify
the amount of cDNA, a calibration curve was generated from eight known
concentrations of the genes of interest processed in parallel via real-time PCR. For
each concentration of cDNA, the “no amplification control” (NAC) was subtracted;
these controls contained water instead of RTase.
8.10 G. oxydans DNA microarrays
For genome-wide transcription analyses G. oxydans DNA microarrays were
obtained from Eurofins MWG Operon, Ebersberg, Germany. The array design
comprises 3864 sequence-specific oligonucleotide probes (70mer). 2731
oligonucleotides represent all annotated protein coding genes from G. oxydans 621H
genome (NC_006677) and plasmids (NC_006672, NC_006673, NC_006674,
NC_006675, NC_006676), as well as 67 genes for structural RNAs. 939 selected
oligonucleotides represent intergenic regions >100 bp (2 probes for IGRs >500 bp).
127 further oligonucleotide probes (from B. subtilis 168, Alien spike controls, lacI,
lacZ, tetA, cat, aph) were included as negative and positive controls to check for
quality and specificity. Oligo probes for genes GOX0265, GOX0854, GOX1675,
GOX2188 and GOX2290 with 100%, 90%, 80%, 70%, 60% and 50% sequence
specificity served as specificity controls of hybridisation. The oligonucleotide set was
spotted in duplicate on glass slides resulting in two identical sub-arrays of 2 x 2 cm,
each having spot sizes of 80 to 100 μm and about 225 μm spot distance (MI
Microarrays Inc., Huntsville, AL, USA).
Preparation of the oligonucleotide-slides for hybridization was performed in 50 ml
Falcon tubes. All reagents were obtained from the OpArray system from Eurofins

III Materials and Methods
23
MWG Operon. Slides were incubated at 42°C in Pre-Hybridisation solution for 1 h for
blocking of potential unspecific binding sites, then transferred into Wash 1 (1.25 ml
Wash B and 48.75 ml H2O) and incubated for 5 min at 37°C. The slides were washed
with H2O and dried in a centrifuge at 1600 rpm for 5 min. Hybridization of the mRNA
to the oligos on the slides was carried out for 16-18 h at 42°C using a “MAUI”
hybridization system (BioMicro Systems, Salt Lake City, USA). For the post-
hybridization, slides were washed with decreasing salt concentrations at 37°C in
Wash 2 (5 ml Wash A, 2.5 ml Wash B and 42.5 ml H2O) and Wash 3 (5 ml Wash A
and 45 ml H2O) for 10 minutes each. This procedure removed unspecifically-bound
mRNA from the slides. The slides were rotated in Wash 4 solution (1 ml Wash A and
49 ml H2O) for 5 min at room temperature and then dried by centrifugation.
The fluorescence of the hybridized DNA arrays was determined at 532 nm (Cy3-
dUTP) and 635 nm (Cy5-dUTP) at a 10-μm resolution with a GenePix 4000B laser
scanner (Axon Instruments, USA). Quantitative image analysis was carried out using
GenePix image analysis software and results were saved as GPR-file (GenePix Pro
6.0, Axon Instruments, CA, USA). For data normalization, GPR-files were processed
using the BioConductor/R-packages limma (Dudoit and Yang 2003) and marray
(Smyth 2005) (http://www.bioconductor.org). For further analysis, the processed and
loess-normalized data, as well as detailed experimental information according to
MIAME (Brazma et al. 2001) were stored in the in-house microarray database (Polen
and Wendisch 2004).
Each microarray experiment was repeated at least three times in biological
independent experiments. To search for differentially expressed genes, following
criteria had to be fulfilled (i) Signal over background ratios exceeding a factor of 5 for
the red or green signal for reliable signal detection, (ii) Reliable detection was
confirmed in at least two out of three hybridizations, (iii) Average relative mRNA level
changes were at least 1.8 fold, (iv) Significance was assured by a statistical test, the
calculated p-value had to be < 0.05 to assure that the results were significant.
9. Biochemical methods
9.1 Cell disruption, preparation of crude extracts and membrane fractions
For disruption of cells in a French press, cells of G. oxydans or E. coli were
resuspended in 20 ml disruption buffer, which was the reaction buffer for enzyme
assays including one tablet of protease inhibitor (Complete, EDTA-free, Roche,
Mannheim, Germany) and disrupted by passing three time through the French Press
(1,600 Psi, sim aminco, Spectronic instruments, Rochester). For small cell volumes
III Materials and Methods
24
(3 ml), cells were broken by 3 min of ultrasonification (UP 200s sonifier, Dr.
Hielscher, Stuttgart, Germany, cycle 0.5, amplitude 70) in an ice bath.
In order to obtain cell crude extracts, cell debris of disrupted cells was removed by
centrifugation at 5,500 g for 20 min at 4°C. This supernatant was used as crude
extract. For preparation of membranes, the supernatant was centrifuged for 60 min at
180,000 g at 4°C. The membrane-bound enzymes in the resulting pellet were
solubilised with 10% DDM (n-dodecylmaltoside) so that 2 g DDM per 1 g protein was
added. To enhance solubilisation, the suspension was stirred for 1 h at 4°C. After
that, the solution was centrifuged again for 60 min at 180,000 g at 4°C in order to
separate the membranes in solution and the non-solubilised membranes from each
other. That supernatant was used as membrane fraction.
9.2 Determination of protein concentration
Concentrations of proteins were determined with the BCA (bicinchoninic acid)
assay (Smith et al. 1985). It is based on the Biuret-reaction, where Cu2+-ions react
with proteins to Cu+. Cu+ forms violet complexes with the BCA. 25 μl protein-sample
were added to 200 μl BCA solution and incubated at 37°C for 30 min. Protein
concentrations were determined at 562 nm since the violet complex has its
absorption maximum at this wave length. (Molecular device spectramax plus, GMI,
Minnesota, USA) using bovine serum albumine as a standard.
9.3 Polyacrylamide gel electrophoresis of proteins (SDS-PAGE)
The SDS-PAGE (Laemmli et al. 1970) was used for separation of soluble or
solubilised membrane proteins according to their molecular mass and performed in
vertical chambers (BioRad laboratories, Munich). The proteins were separated in a
collection gel containing 4% acryl amide and a separation gel (containing 12% acryl
amide) after they were mixed with 2-fold loading dye (350 mM Tris, 10% (w/v) SDS,
6% -mercaptoethanol, 30% (v/v) glycerol, 0.001% bromphenol blue, pH 6.8) and
denatured for 5 min at 95°C. Separation occurred at a maximum voltage of 200 V.
Protein staining was performed with Coomassie Blue. Gels were washed with aqua
bidest, stained for 20 min (0.6 g Serva blue G250, 0.6 g Serva blue R250, 454 ml
methanol and 92 ml 96% acetic acid ad 1 l aqua bidest) and washed again with aqua
bidest. For destaining, the gel was incubated for 2 h in destaining solution (454 ml
methanol and 92 ml 96% acetic acid ad 1 l aqua bidest).
9.4 Protein purification by column chromatography
Gel filtration was used to separate proteins from a reddish colored pigment, both
present in the supernatant of G. oxydans 621H-∆qcrABC after about 40 h of
III Materials and Methods
25
cultivation under oxygen limitation. 70 ml of the supernatant was passed through a
HIPrep 26/10 desalting column (GE Healthcare, Freiburg, Germany) connected to an
Äkta explorer system (Amersham Bioscience, Freiburg, Germany). Proteins were
eluted with 50 mM KPi buffer pH 8.0 at 4°C and a flow rate of 5 ml min-1. Detecting
wavelength were set at 280 nm and protein elution could be followed. The reddish
pigment accumulated in the first fourth of the column and had to be eluted with 20%
ethanol. Since it was assumed that the red pigment was heme, 410 nm and 552 nm
were used as detecting wavelength. In a second approach, the reddish pigment was
eluted with 20% methanol.
Affinity chromatography with StrepTactin-Sepharose (Skerra and Schmidt 2000)
was used to purify the cytochrome c subunit of the alcohol dehydrogenase with a
cromosomally introduced StrepTag II (Sequence: WSHPQFEK). The solubilised
membrane fraction of a 3 l G. oxydans adh-cyt cSt culture was used for the
purification. 60 μl of avidine solution (5 mg ml-1 of hen protein, Sigma, Taufkirchen,
Germany) was added for avoiding unspecific binding of natural biotinylated proteins
to the column material. The solubilised membrane-suspension was loaded into a
column with 2 ml volume (1 ml bed-volume) StrepTactin-Sepharose (IBA, Göttingen,
Germany), which was equilibrated with 20 ml buffer (100 mM Tris/HCl pH 7.5 and
0.1% DDM). The tagged cytochrome c subunit of the ADH bound to the column
material due to specific interaction between the StrepTagII and the StrepTactin
Sepharose. After washing with 15 ml buffer (100 mM Tris/HCl pH 7.5, 100 mM NaCl,
2 mM MgSO4 and 0.1% DDM) for removing unspecific proteins from the column
material, the three subunits of the alcohol dehydrogenase were eluted by adding 1 ml
elution buffer (washing buffer + 15 mM desthiobiotine, Sigma, Taufkirchen, Germany)
for eight times.
Protein purification of polyhistidin tagged cytochrome c peroxidase of G. oxydans
was performed with 2 ml Ni2+-NTA-agarose (1 ml bed-volume) in 15 ml polypropylene
columns (Qiagen, Taufkirchen, Germany), after equilibration with 20 ml TNI5 buffer
(Tris sodiumchloride with 5 mM imidazole). Unspecifically bound proteins were eluted
by washing with 20 ml TNI20 (Tris sodiumchloride with 20 mM imidazole). Specific
protein was eluted by increasing the concentration of imidazole. Therefore, 6 ml of
TNI50, TNI70, TNI100, TNI200 and TNI400 were loaded to the column after each
other. Specific-bound proteins eluted at TNI 100. The column was regenerated by
washing with 20 ml “Strip” buffer (EDTA for removal of Ni2+ ions) and equilibrating
with 5 ml 100 mM NiSO4 for new chromatographies.
III Materials and Methods
26
9.5 Determination of oxygen consumption rates with a Clark electrode
Oxygen consumption rates of exponential grown, intact cells of G. oxydans were
measured in a 2 ml chamber with an oxygen electrode of the Clark type (Hansatech
Instruments Ltd., Norfolk, GB). The chamber was used according to the
manufacturer’s instructions and the temperature of the measuring cell was set to
30°C. For quantification of oxygen concentrations in the reaction chamber, the
chamber was filled with 50 mM KPi pH 6 or 4 and electrode was calibrated by
gassing the buffer with air until a constant rate was measured. The baseline at zero
was set by adding DTT, which consumed oxygen rapidly. Then, oxygen consumption
measurements were were performed in 50 mM KPi-buffer pH 6 or 4, cell density was
set to OD600 0.5. The reaction started after addition of the substrate (end
concentration of 25.5 mM glucose, 21.25 mM ethanol or 25.5 mM sorbitol). The
linearity of the oxygen consumption was tested by doubling or reducing the cell
density. The measurements were repeated in three biological independent
approaches. 10 μl of 10 mM CCCP was added as uncoupler, which decreased the
membrane potential. With this uncoupler addition, an energy dependency of the
specific dehydrogenase activity was tested.
9.6 Determination of enzyme activities
Enzyme activities were determined using an “Ultrospec 4300 pro” photometer
(Amersham Bioscience, Freiburg, Germany). Substrate-dependent changes of redox
states of cofactors and artificial electron acceptors were determined at 30°C at the
specific wavelength. Measurements were performed in 1.5 ml cuvettes (see below for
concentrations of substrates) after pre-warming for 2 min at 30°C and starting with
the enzyme. Extinction changes were followed for 2 min. For calculation of the
specific enzyme activities [U/mg protein], following formula was used:
A [U mg-1 Protein] = [(E t-1 x V) / (v x d x ε)] / (mg protein ml-1)
(E, Change of extinction; t, time [min]; V, total volume [μl]; v, volume of the probe [μl];
d, thickness of the cell [cm]; ε, molar extinction coefficient).
One unit of enzyme activity (U) was defined as the amount of enzyme catalysing
the conversion of 1 μmol substrate per min at 30°C. Enzyme activities were
determined for at least three biological independent replicates of 50 ml cultures and
different dilutions of the samples were used to ensure linearity.
III Materials and Methods
27
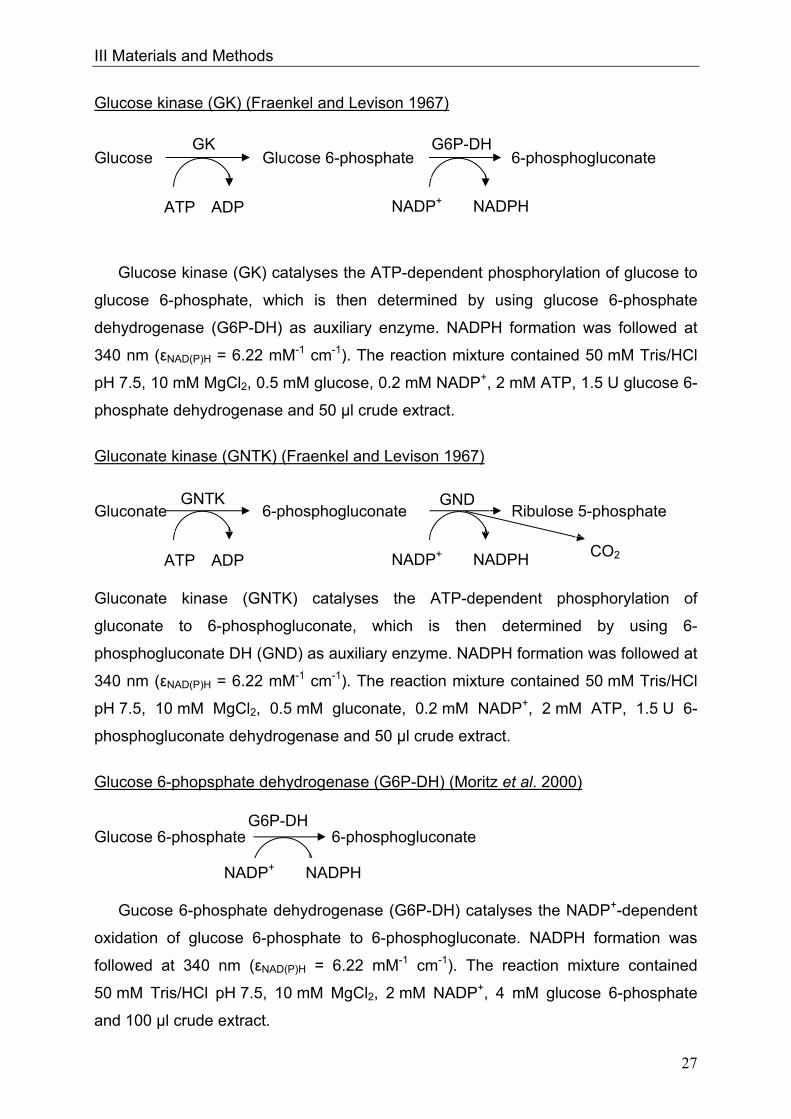
Glucose kinase (GK) (Fraenkel and Levison 1967)
Glucose Glucose 6-phosphate 6-phosphogluconate
Glucose kinase (GK) catalyses the ATP-dependent phosphorylation of glucose to
glucose 6-phosphate, which is then determined by using glucose 6-phosphate
dehydrogenase (G6P-DH) as auxiliary enzyme. NADPH formation was followed at
340 nm (εNAD(P)H = 6.22 mM-1 cm-1). The reaction mixture contained 50 mM Tris/HCl
pH 7.5, 10 mM MgCl2, 0.5 mM glucose, 0.2 mM NADP+, 2 mM ATP, 1.5 U glucose 6-
phosphate dehydrogenase and 50 μl crude extract.
Gluconate kinase (GNTK) (Fraenkel and Levison 1967)
Gluconate 6-phosphogluconate Ribulose 5-phosphate
Gluconate kinase (GNTK) catalyses the ATP-dependent phosphorylation of
gluconate to 6-phosphogluconate, which is then determined by using 6-
phosphogluconate DH (GND) as auxiliary enzyme. NADPH formation was followed at
340 nm (εNAD(P)H = 6.22 mM-1 cm-1). The reaction mixture contained 50 mM Tris/HCl
pH 7.5, 10 mM MgCl2, 0.5 mM gluconate, 0.2 mM NADP+, 2 mM ATP, 1.5 U 6-
phosphogluconate dehydrogenase and 50 μl crude extract.
Glucose 6-phopsphate dehydrogenase (G6P-DH) (Moritz et al. 2000)
Glucose 6-phosphate 6-phosphogluconate
Gucose 6-phosphate dehydrogenase (G6P-DH) catalyses the NADP+-dependent
oxidation of glucose 6-phosphate to 6-phosphogluconate. NADPH formation was
followed at 340 nm (εNAD(P)H = 6.22 mM-1 cm-1). The reaction mixture contained
50 mM Tris/HCl pH 7.5, 10 mM MgCl2, 2 mM NADP+, 4 mM glucose 6-phosphate
and 100 μl crude extract.
ATP ADP NADP+ NADPH
G6P-DH GK
ATP ADP NADP+ NADPH
GND GNTK
CO2
G6P-DH
NADP+ NADPH
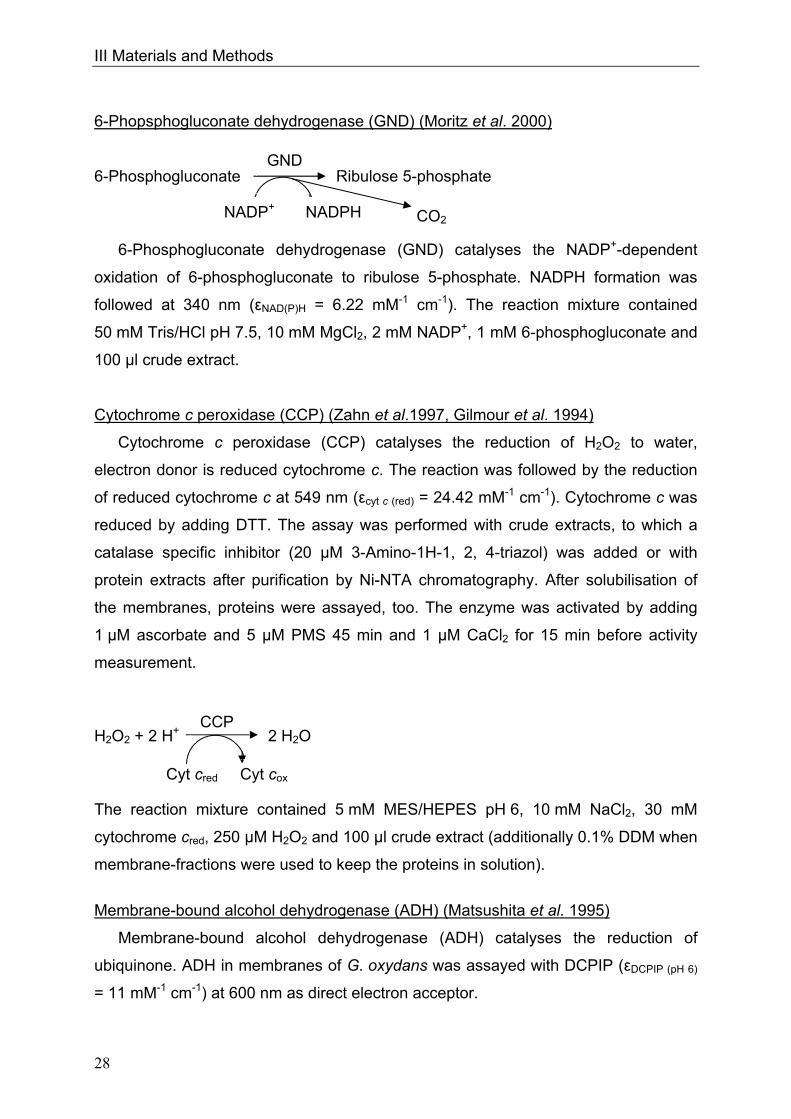
III Materials and Methods
28
6-Phopsphogluconate dehydrogenase (GND) (Moritz et al. 2000)
6-Phosphogluconate Ribulose 5-phosphate
6-Phosphogluconate dehydrogenase (GND) catalyses the NADP+-dependent
oxidation of 6-phosphogluconate to ribulose 5-phosphate. NADPH formation was
followed at 340 nm (εNAD(P)H = 6.22 mM-1 cm-1). The reaction mixture contained
50 mM Tris/HCl pH 7.5, 10 mM MgCl2, 2 mM NADP+, 1 mM 6-phosphogluconate and
100 μl crude extract.
Cytochrome c peroxidase (CCP) (Zahn et al.1997, Gilmour et al. 1994)
Cytochrome c peroxidase (CCP) catalyses the reduction of H2O2 to water,
electron donor is reduced cytochrome c. The reaction was followed by the reduction
of reduced cytochrome c at 549 nm (εcyt c (red) = 24.42 mM-1 cm-1). Cytochrome c was
reduced by adding DTT. The assay was performed with crude extracts, to which a
catalase specific inhibitor (20 μM 3-Amino-1H-1, 2, 4-triazol) was added or with
protein extracts after purification by Ni-NTA chromatography. After solubilisation of
the membranes, proteins were assayed, too. The enzyme was activated by adding
1 μM ascorbate and 5 μM PMS 45 min and 1 μM CaCl2 for 15 min before activity
measurement.
H2O2 + 2 H+ 2 H2O
The reaction mixture contained 5 mM MES/HEPES pH 6, 10 mM NaCl2, 30 mM
cytochrome cred, 250 μM H2O2 and 100 μl crude extract (additionally 0.1% DDM when
membrane-fractions were used to keep the proteins in solution).
Membrane-bound alcohol dehydrogenase (ADH) (Matsushita et al. 1995)
Membrane-bound alcohol dehydrogenase (ADH) catalyses the reduction of
ubiquinone. ADH in membranes of G. oxydans was assayed with DCPIP (εDCPIP (pH 6)
= 11 mM-1 cm-1) at 600 nm as direct electron acceptor.
NADP+ NADPH
GND
CO2
Cyt cred Cyt cox
CCP
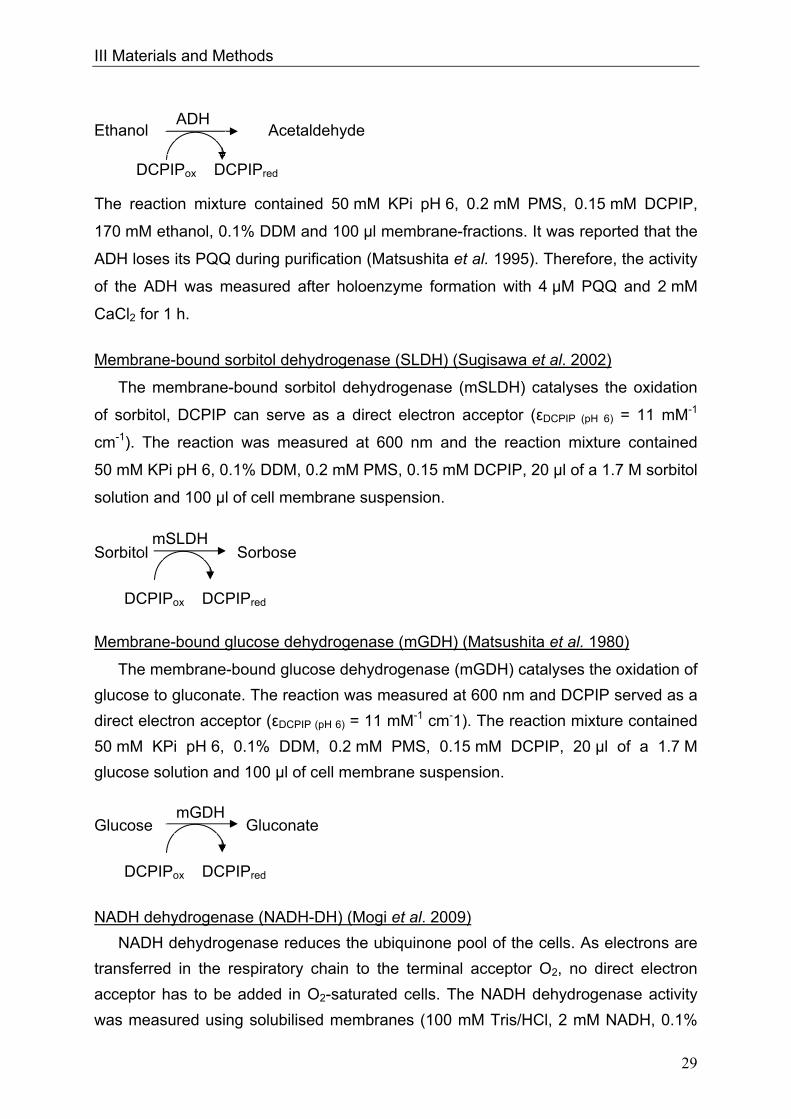
III Materials and Methods
29
Ethanol Acetaldehyde
The reaction mixture contained 50 mM KPi pH 6, 0.2 mM PMS, 0.15 mM DCPIP,
170 mM ethanol, 0.1% DDM and 100 μl membrane-fractions. It was reported that the
ADH loses its PQQ during purification (Matsushita et al. 1995). Therefore, the activity
of the ADH was measured after holoenzyme formation with 4 μM PQQ and 2 mM
CaCl2 for 1 h.
Membrane-bound sorbitol dehydrogenase (SLDH) (Sugisawa et al. 2002)
The membrane-bound sorbitol dehydrogenase (mSLDH) catalyses the oxidation
of sorbitol, DCPIP can serve as a direct electron acceptor (εDCPIP (pH 6) = 11 mM-1
cm-1). The reaction was measured at 600 nm and the reaction mixture contained
50 mM KPi pH 6, 0.1% DDM, 0.2 mM PMS, 0.15 mM DCPIP, 20 μl of a 1.7 M sorbitol
solution and 100 μl of cell membrane suspension.
Sorbitol Sorbose
Membrane-bound glucose dehydrogenase (mGDH) (Matsushita et al. 1980)
The membrane-bound glucose dehydrogenase (mGDH) catalyses the oxidation of
glucose to gluconate. The reaction was measured at 600 nm and DCPIP served as a
direct electron acceptor (εDCPIP (pH 6) = 11 mM-1 cm-1). The reaction mixture contained
50 mM KPi pH 6, 0.1% DDM, 0.2 mM PMS, 0.15 mM DCPIP, 20 μl of a 1.7 M
glucose solution and 100 μl of cell membrane suspension.
Glucose Gluconate
NADH dehydrogenase (NADH-DH) (Mogi et al. 2009)
NADH dehydrogenase reduces the ubiquinone pool of the cells. As electrons are
transferred in the respiratory chain to the terminal acceptor O2, no direct electron
acceptor has to be added in O2-saturated cells. The NADH dehydrogenase activity
was measured using solubilised membranes (100 mM Tris/HCl, 2 mM NADH, 0.1%
DCPIPox DCPIPred
ADH
DCPIPox DCPIPred
mSLDH
DCPIPox DCPIPred
mGDH

III Materials and Methods
30
DDM, 100 μl cell membrane suspension, pH 7.4) by following the decrease of NADH
extinction (εNAD(P)H = 6,22 mM-1 cm-1) at 340 nm.
NADH + H+ + O2 + H+ NAD+ + H2O
9.7 Conversion of inactive alcohol dehydrogenase to active enzyme in resting
cells
The conversion of inactive alcohol dehydrogenase (ADH) into an active enzyme
was performed as described previously (Matsushita et al. 1995). The ADH activity is
decreased in pH 4 grown cells as was reported by Matsushita et al. 1995, but can be
activated by incubation of resting cells in buffer at pH 6. For this, cells were cultivated
over night in mannitol medium. Main cultures were cultivated at pH 6 (control) or at
pH 4 with a start OD600 of 0.3, grown for 3-4 h at 30°C. Cells were harvested and
washed three times in 50 mM KPi. One culture (pH 4) and the control culture (pH 6)
were immediately disrupted using a French press and centrifuged at 18,000 g for 1 h.
After solubilisation of the ADH and holoenzyme formation by addition of 4 μM PQQ
and 2 mM CaCl2 for 0.5 h, ADH activity was measured photometrically. Two other
cultures were grown at pH 4 and washed as described. Then they were incubated
with 1% sorbitol in 50 mM KPi pH 6 for 4.5 h, to one of which 50 μM CCCP was
added. After that the activity of the ADH was measured as described.
10. Bioanalytical methods
10.1 Sampling and sample processing for LC-MS analysis
For LC-MS analysis, cells corresponding to at least 25 mg CDW were harvested
and mixed immediately with a 3-fold volume 60% methanol at -80°C in order to stop
metabolism (Bartek et al. 2008). For removal of the 60% methanol, the mixtures were
centrifuged at 10,000 g and -20°C for 5 min and each cell pellet was resuspended in
1 ml pure methanol (-70°C). After mixing thoroughly, 2 ml chloroform (-20°C) for cell
disruption were added. The suspension was shaken at -20°C for two hours and then
centrifuged at 10,000 g at -20°C for 10 min. The upper methanol phase contained the
metabolites and was filtrated through a 0.2 μm filter (Millipore, MA, USA). It was
frozen at -80°C for subsequent LC-MS analysis. Cell extraction samples were
analyzed with an Agilent 1100 HPLC system (Agilent Technologies, Waldbronn,
Germany) coupled to an API 4000 mass spectrometer (Applied Biosystems,
Concord, Canada) equipped with a TurboIon spray source.

III Materials and Methods
31
10.2 Determination of metabolites by high performance liquid chromatography
(HPLC)
For the determination of metabolites via high performance liquid chromatography
(HPLC), 1 ml cell culture was centrifuged at 13,000 g for 2 min and the supernatant
was filtrated through a 0.22 μm filter (Millipore, MA, USA) prior to HPLC analysis.
Gluconate, 5-keto-gluconate (5-KGA) and 2-keto-gluconate (2-KGA) were analysed
by HPLC as described previously (Herrmann et al. 2004). The substances were
separated using a Shodex DE 613 150 x 0.6 column (Phenomenex, Aschaffenburg,
Germany) using 2 mM HClO4 as eluant at a flow rate of 0.5 ml min-1. Glucose,
fructose and mannitol were analysed by an Aminex HPX-87C, 300 mm column (Bio-
rad Laboratories, Munich, Germany) using water as eluant at a flow rate of 0.6 ml
min-1. Determination of amino acids was performed after derivatisation with o-
phthaldialdehyd (OPA) (Lindroth and Mopper 1979) in reversed phase HPLC using a
ODS Hypersil 120 x 4 mm column (CS Chromatographie Service GmbH,
Langerwehe, Germany). 1 μl of the sample was mixed with 20 μl
OPA/2-mercaptoethanol reagent (Pierce Europe BV, Oud-Beijerland, Netherlands)
and incubated for 1 min at room temperature. Substances were eluted according to
their hydropathy using a flow rate of 0.35 ml min-1 within the first minute and of 0.6 ml
min-1 in the following 15 min at 40°C with a gradient of 0.1 M sodium acetate (pH 7.2)
as polar phase and methanol as unpolar phase. Fluorescence of amino acid-isoindol-
derivates was detected at 450 nm after excitation at 230 nm. Amino acids were
identified due to their specific retention times.
10.3 13C Metabolic flux analysis
Metabolic flux analysis with 13C-tracer experiments serve for the quantification of
in vivo not directly observable metabolic flux rates (Nöh et al. 2006). This objective is
addressed by a model-based evaluation with the aid of computational routines. In a 13C-labeling experiment specifically labeled substrate (4.0% naturally labeled
glucose, 7.7% 1-13C-glucose, and 88.3% U-13C) was fed to the cells while metabolic
stationarity (intra- and extra cellular rates must be in equilibrium, and have to
correlate to the growth phase of the cells) within the cells was maintained. The
metabolites' emerging specific mass isotope isomer (isotopomer) patterns are
measured using mass spectrometry (LC-MS, Luo et al. 2007; GC-MS, Fischer et al.
2004). For more details about 13C-MFA it is referred to recent review papers
(Wiechert 2001, Zamboni et al. 2009). Based on the genome information of
G. oxydans a metabolic network model of central metabolism was formulated. The
III Materials and Methods
32
software toolbox 13CFLUX (http://www.13cflux.net) was used for all modeling and
evaluation steps (Wiechert et al. 2001).
10.4 MALDI-TOF-Mass spectrometry
MALDI-TOF-Mass spectroscopy was used for identification of proteins (over
production of the cytochrome c peroxidase and co-purification experiments with the
StrepII-tagged cytochrome c subunit of the alcohol dehydrogenase). For peptide
mass fingerprinting, protein spots of interest were excised from destained colloidal
Coomassie-stained gels and subjected to ingel digestion with trypsin essentially as
described previously (Schaffer et al. 2001). Briefly, gel pieces were washed three
times with 350 μl 0.1 M ammoniumbicarbonate in 30% (v/v) acetonitril for 10 min at
RT to remove the SDS and the Commassie-blue. 4 μl 3 mM Tris/Cl-buffer (pH 8.8)
with 10 ng μl-1 trypsine (Promega, Mannheim, Germany) for ingel digesting of the
proteins were added to the completely dried probes. After 30 min at RT, additional
6 μl 3 mM Tris/HCl (pH 8.8) was added for increasing the reaction volume in order to
avoid dehydration over night at RT. The next day, 10 μl H2O were added to solve
water-soluble peptides from the gel. 15 min later, 10 μl 0.2% (v/v) trifluoracetic acid in
30% (v/v) acetonitril were added to solve the remaining peptides from the gel piece.
After incubation at RT for 10 minutes, all proteins were eluted from the gel. 0.5 μl
sample was mixed with 0.5 μl 0.1% (v/v) trifluoracetic acid (for better integration of
the peptides into the matrix) on a PAC (Prespotted-Anchor-Chip)-target-plate (Bruker
Daltonics, Eppendorf, Hamburg, Germany). This plate contained already spots with
matrix material (saturated α-cyano-4-hydroxy-trans-cinnamic acid) and a standard
(Mass spectrum from 1046-3657 Da). Probes were analysed with an Ultraflex
MALDI-TOF/TOF37 Mass spectrometer III (Bruker Daltonics, Bremen, Germany) with
a positive reflector modus and an acceleration potential of 26.3 kV. Probes were
significant if the MOWSE-score (molecular weight search, Pappin et al. 1993) was ≥
50.
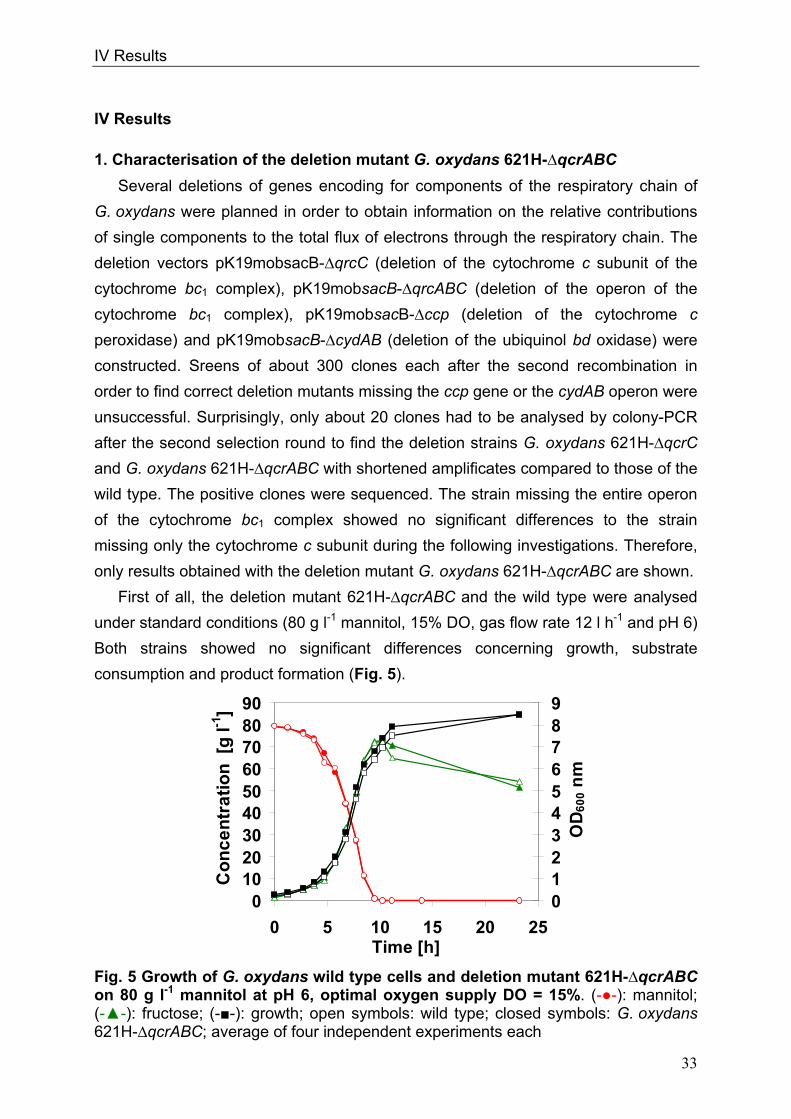
IV Results
33
0102030405060708090
0 5 10 15 20 25Time [h]
Co
nc
en
tra
tio
n [
g l-1
]
0123456789
OD
60
0 n
m
IV Results 1. Characterisation of the deletion mutant G. oxydans 621H-∆qcrABC
Several deletions of genes encoding for components of the respiratory chain of
G. oxydans were planned in order to obtain information on the relative contributions
of single components to the total flux of electrons through the respiratory chain. The
deletion vectors pK19mobsacB-∆qrcC (deletion of the cytochrome c subunit of the
cytochrome bc1 complex), pK19mobsacB-∆qrcABC (deletion of the operon of the
cytochrome bc1 complex), pK19mobsacB-∆ccp (deletion of the cytochrome c
peroxidase) and pK19mobsacB-∆cydAB (deletion of the ubiquinol bd oxidase) were
constructed. Sreens of about 300 clones each after the second recombination in
order to find correct deletion mutants missing the ccp gene or the cydAB operon were
unsuccessful. Surprisingly, only about 20 clones had to be analysed by colony-PCR
after the second selection round to find the deletion strains G. oxydans 621H-∆qcrC
and G. oxydans 621H-∆qcrABC with shortened amplificates compared to those of the
wild type. The positive clones were sequenced. The strain missing the entire operon
of the cytochrome bc1 complex showed no significant differences to the strain
missing only the cytochrome c subunit during the following investigations. Therefore,
only results obtained with the deletion mutant G. oxydans 621H-∆qcrABC are shown.
First of all, the deletion mutant 621H-∆qcrABC and the wild type were analysed
under standard conditions (80 g l-1 mannitol, 15% DO, gas flow rate 12 l h-1 and pH 6)
Both strains showed no significant differences concerning growth, substrate
consumption and product formation (Fig. 5).
Fig. 5 Growth of G. oxydans wild type cells and deletion mutant 621H-∆qcrABC on 80 g l-1 mannitol at pH 6, optimal oxygen supply DO = 15%. (--): mannitol; (--): fructose; (--): growth; open symbols: wild type; closed symbols: G. oxydans 621H-∆qcrABC; average of four independent experiments each

IV Results
34
Mannitol was consumed in the first 10 h, about 75 g l-1 fructose accumulated in the
medium and cells reached an OD600 of about 8. Cells did not grow during the next
hours, but consumed fructose at low but measurable quantities (5-10 g l-1
10 h-1). Increasing the DO from 15% to 45% did not result in increased growth or
faster oxidation rates. Significant differences between both strains appeared during
cultivation at pH 4 (Fig. 6).
Fig. 6 Growth of G. oxydans wild type cells and deletion mutant 621H-∆qcrABC on 80 g l-1 mannitol at pH 4, optimal oxygen supply DO = 15%. (--): mannitol; (--): fructose; (--): growth; open symbols: G. oxydans 621H wild type; closed symbols: G. oxydans 621H-∆qcrABC; average of four independent experiments each
The wild type showed similar growth, substrate consumption and product formation
like at pH 6, whereas the deletion mutant showed a delay in substrate consumption
and product formation. Growth was slower than that of the wild type (μ = 0.27
compared to μ = 0.41) and resulted in slightly fewer biomass formation. Likewise, the
oxygen consumption rates and the carbon dioxide production rates of the deletion
mutant were retarded compared to the wild type (Fig. 7). These results indicate that
at pH 4 the cytochrome bc1 complex is used and contributes to the cell’s energy
generation.
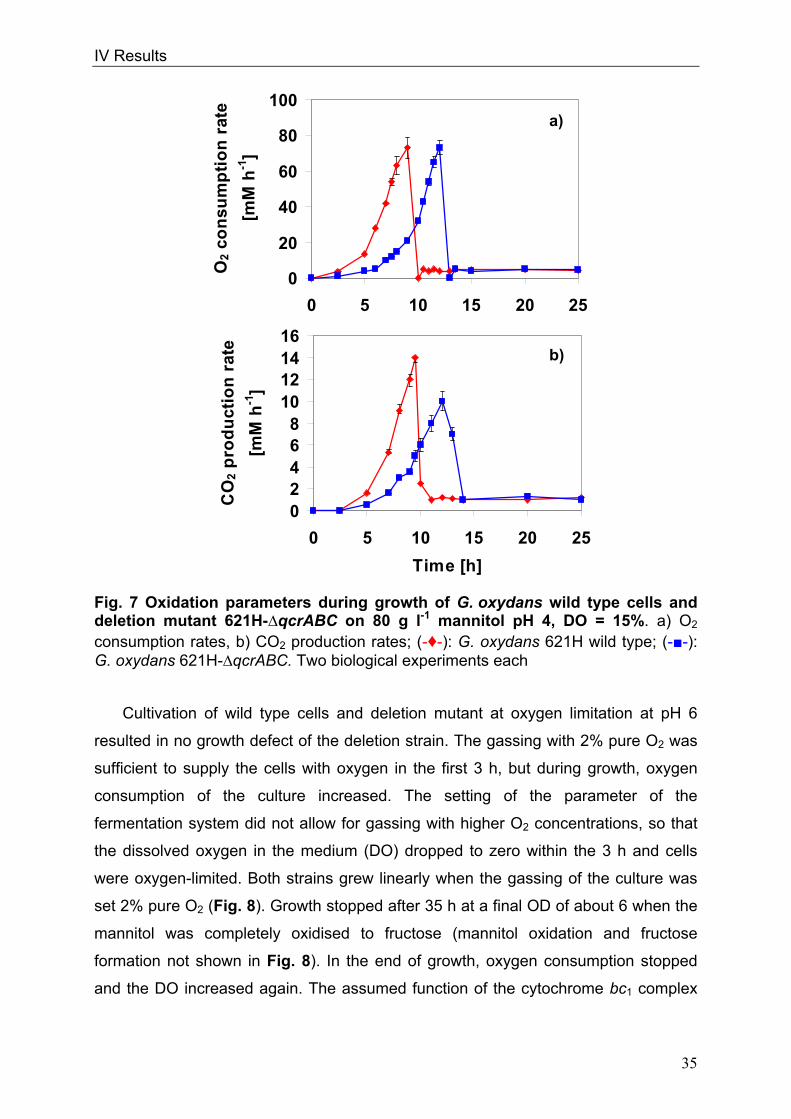
IV Results
35
Fig. 7 Oxidation parameters during growth of G. oxydans wild type cells and deletion mutant 621H-∆qcrABC on 80 g l-1 mannitol pH 4, DO = 15%. a) O2 consumption rates, b) CO2 production rates; (-♦-): G. oxydans 621H wild type; (--): G. oxydans 621H-∆qcrABC. Two biological experiments each
Cultivation of wild type cells and deletion mutant at oxygen limitation at pH 6
resulted in no growth defect of the deletion strain. The gassing with 2% pure O2 was
sufficient to supply the cells with oxygen in the first 3 h, but during growth, oxygen
consumption of the culture increased. The setting of the parameter of the
fermentation system did not allow for gassing with higher O2 concentrations, so that
the dissolved oxygen in the medium (DO) dropped to zero within the 3 h and cells
were oxygen-limited. Both strains grew linearly when the gassing of the culture was
set 2% pure O2 (Fig. 8). Growth stopped after 35 h at a final OD of about 6 when the
mannitol was completely oxidised to fructose (mannitol oxidation and fructose
formation not shown in Fig. 8). In the end of growth, oxygen consumption stopped
and the DO increased again. The assumed function of the cytochrome bc1 complex
0
20
40
60
80
100
0 5 10 15 20 25
O2
con
sum
pti
on
rat
e
[mM
h-1
]
02468
10121416
0 5 10 15 20 25
Time [h]
CO
2 p
rod
uct
ion
rat
e
[mM
h-1
]
a)
b)
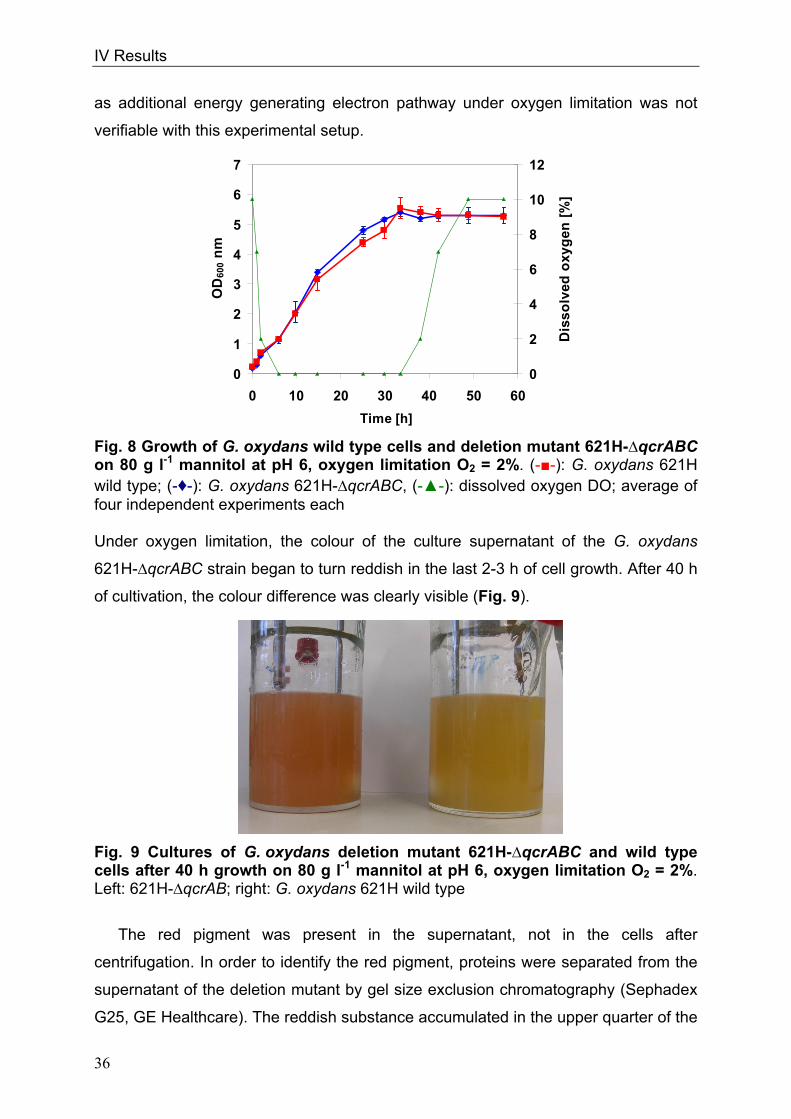
IV Results
36
0
1
2
3
4
5
6
7
0 10 20 30 40 50 60
Time [h]
OD
600
nm
0
2
4
6
8
10
12
Dis
so
lved
oxy
ge
n [
%]
as additional energy generating electron pathway under oxygen limitation was not
verifiable with this experimental setup.
Fig. 8 Growth of G. oxydans wild type cells and deletion mutant 621H-∆qcrABC on 80 g l-1 mannitol at pH 6, oxygen limitation O2 = 2%. (--): G. oxydans 621H wild type; (-♦-): G. oxydans 621H-∆qcrABC, (--): dissolved oxygen DO; average of four independent experiments each Under oxygen limitation, the colour of the culture supernatant of the G. oxydans
621H-∆qcrABC strain began to turn reddish in the last 2-3 h of cell growth. After 40 h
of cultivation, the colour difference was clearly visible (Fig. 9).
Fig. 9 Cultures of G. oxydans deletion mutant 621H-∆qcrABC and wild type cells after 40 h growth on 80 g l-1 mannitol at pH 6, oxygen limitation O2 = 2%. Left: 621H-∆qcrAB; right: G. oxydans 621H wild type
The red pigment was present in the supernatant, not in the cells after
centrifugation. In order to identify the red pigment, proteins were separated from the
supernatant of the deletion mutant by gel size exclusion chromatography (Sephadex
G25, GE Healthcare). The reddish substance accumulated in the upper quarter of the
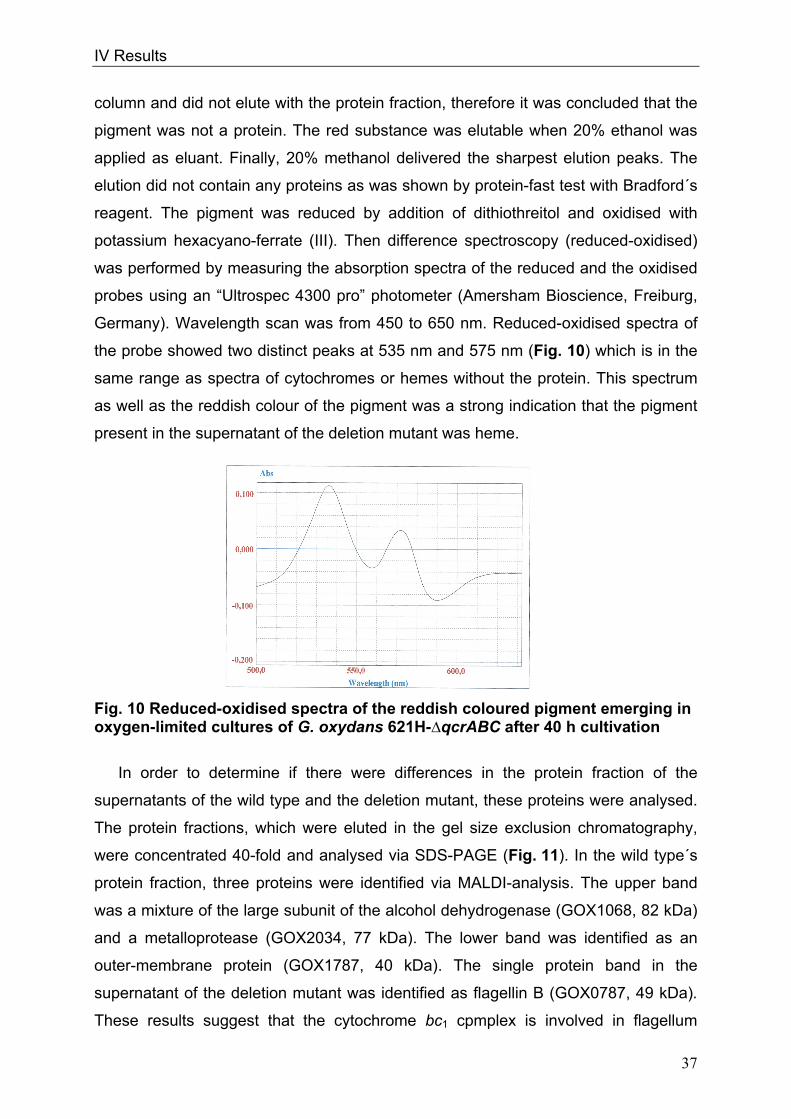
IV Results
37
column and did not elute with the protein fraction, therefore it was concluded that the
pigment was not a protein. The red substance was elutable when 20% ethanol was
applied as eluant. Finally, 20% methanol delivered the sharpest elution peaks. The
elution did not contain any proteins as was shown by protein-fast test with Bradford´s
reagent. The pigment was reduced by addition of dithiothreitol and oxidised with
potassium hexacyano-ferrate (III). Then difference spectroscopy (reduced-oxidised)
was performed by measuring the absorption spectra of the reduced and the oxidised
probes using an “Ultrospec 4300 pro” photometer (Amersham Bioscience, Freiburg,
Germany). Wavelength scan was from 450 to 650 nm. Reduced-oxidised spectra of
the probe showed two distinct peaks at 535 nm and 575 nm (Fig. 10) which is in the
same range as spectra of cytochromes or hemes without the protein. This spectrum
as well as the reddish colour of the pigment was a strong indication that the pigment
present in the supernatant of the deletion mutant was heme.
Fig. 10 Reduced-oxidised spectra of the reddish coloured pigment emerging in oxygen-limited cultures of G. oxydans 621H-∆qcrABC after 40 h cultivation
In order to determine if there were differences in the protein fraction of the
supernatants of the wild type and the deletion mutant, these proteins were analysed.
The protein fractions, which were eluted in the gel size exclusion chromatography,
were concentrated 40-fold and analysed via SDS-PAGE (Fig. 11). In the wild type´s
protein fraction, three proteins were identified via MALDI-analysis. The upper band
was a mixture of the large subunit of the alcohol dehydrogenase (GOX1068, 82 kDa)
and a metalloprotease (GOX2034, 77 kDa). The lower band was identified as an
outer-membrane protein (GOX1787, 40 kDa). The single protein band in the
supernatant of the deletion mutant was identified as flagellin B (GOX0787, 49 kDa).
These results suggest that the cytochrome bc1 cpmplex is involved in flagellum
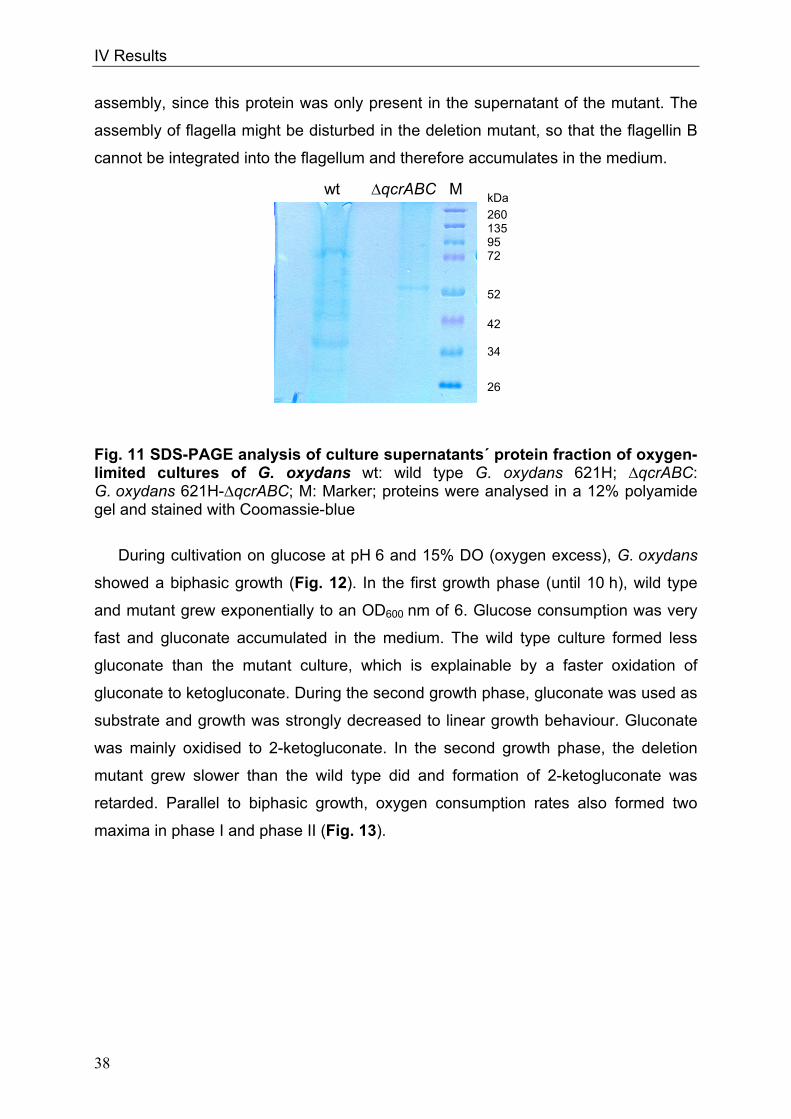
IV Results
38
assembly, since this protein was only present in the supernatant of the mutant. The
assembly of flagella might be disturbed in the deletion mutant, so that the flagellin B
cannot be integrated into the flagellum and therefore accumulates in the medium.
Fig. 11 SDS-PAGE analysis of culture supernatants´ protein fraction of oxygen-limited cultures of G. oxydans wt: wild type G. oxydans 621H; ∆qcrABC: G. oxydans 621H-∆qcrABC; M: Marker; proteins were analysed in a 12% polyamide gel and stained with Coomassie-blue
During cultivation on glucose at pH 6 and 15% DO (oxygen excess), G. oxydans
showed a biphasic growth (Fig. 12). In the first growth phase (until 10 h), wild type
and mutant grew exponentially to an OD600 nm of 6. Glucose consumption was very
fast and gluconate accumulated in the medium. The wild type culture formed less
gluconate than the mutant culture, which is explainable by a faster oxidation of
gluconate to ketogluconate. During the second growth phase, gluconate was used as
substrate and growth was strongly decreased to linear growth behaviour. Gluconate
was mainly oxidised to 2-ketogluconate. In the second growth phase, the deletion
mutant grew slower than the wild type did and formation of 2-ketogluconate was
retarded. Parallel to biphasic growth, oxygen consumption rates also formed two
maxima in phase I and phase II (Fig. 13).
wt ∆qcrABC M
260 135 95 72
52
42 34
26
kDa

IV Results
39
Fig. 12 Growth of G. oxydans wild type cells and deletion mutant 621H-∆qcrABC on 80 g l-1 glucose pH 6, oxygen supply DO = 15%. a): G. oxydans wild type; b): G. oxydans 621H-∆qcrABC; (--): glucose; (--): gluconate; (-♦-): 2-ketogluconate; (--): growth; average of four independent experiments each During the first oxidation phase of the wild type, when glucose was oxidised to
gluconate, the cells rapidly consumed oxygen at a maximum oxidation rate of about
70 mM h-1 (46.7 mmol h-1 g-1 CDW). When cells entered the second growth phase,
oxygen consumption rates decreased (11.4 mmol h-1 g-1 CDW) and O2 was
consumed over a longer period compared to the first oxidation phase. This indicated
that oxidation of gluconate to ketogluconate occurred more slowly than the oxidation
of glucose to gluconate, partially due to a lower activity of membrane-bound
gluconate-2-dehydrogenase compared to membrane-bound glucose dehydrogenase.
In both, the first and second oxidation phases 220 mM (146.7 mmol g-1 CDW and
a)
b)
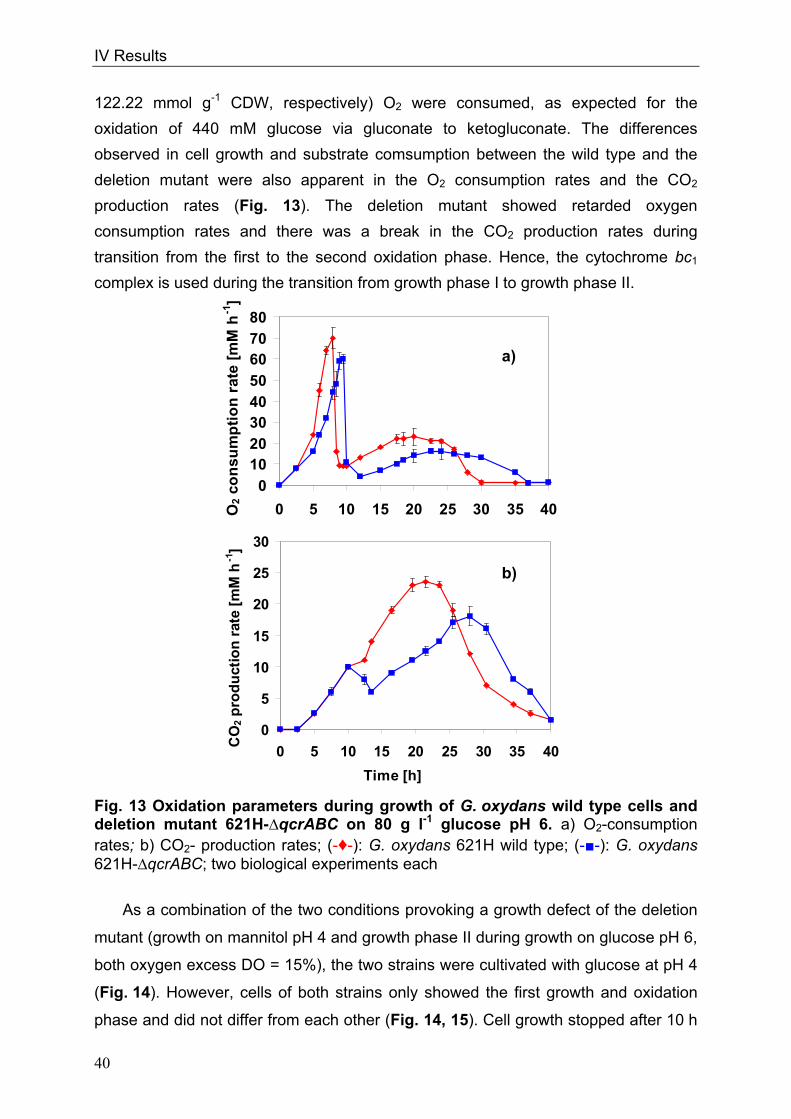
IV Results
40
122.22 mmol g-1 CDW, respectively) O2 were consumed, as expected for the
oxidation of 440 mM glucose via gluconate to ketogluconate. The differences
observed in cell growth and substrate comsumption between the wild type and the
deletion mutant were also apparent in the O2 consumption rates and the CO2
production rates (Fig. 13). The deletion mutant showed retarded oxygen
consumption rates and there was a break in the CO2 production rates during
transition from the first to the second oxidation phase. Hence, the cytochrome bc1
complex is used during the transition from growth phase I to growth phase II.
Fig. 13 Oxidation parameters during growth of G. oxydans wild type cells and deletion mutant 621H-∆qcrABC on 80 g l-1 glucose pH 6. a) O2-consumption rates; b) CO2- production rates; (-♦-): G. oxydans 621H wild type; (--): G. oxydans 621H-∆qcrABC; two biological experiments each
As a combination of the two conditions provoking a growth defect of the deletion
mutant (growth on mannitol pH 4 and growth phase II during growth on glucose pH 6,
both oxygen excess DO = 15%), the two strains were cultivated with glucose at pH 4
(Fig. 14). However, cells of both strains only showed the first growth and oxidation
phase and did not differ from each other (Fig. 14, 15). Cell growth stopped after 10 h
0
1020
3040
50
6070
80
0 5 10 15 20 25 30 35 40O2
con
sum
pti
on
rat
e [m
M h
-1]
0
5
10
15
20
25
30
0 5 10 15 20 25 30 35 40
Time [h]
CO
2 p
rod
uct
ion
rat
e [m
M h
-1]
a)
b)
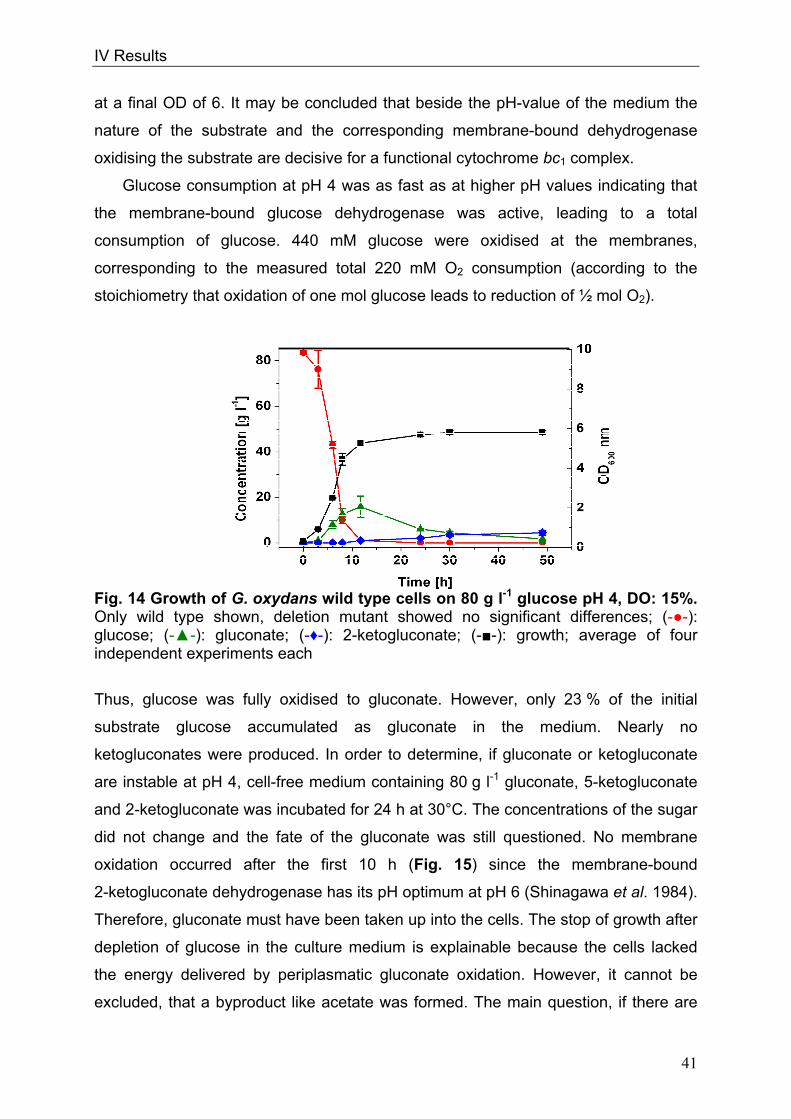
IV Results
41
at a final OD of 6. It may be concluded that beside the pH-value of the medium the
nature of the substrate and the corresponding membrane-bound dehydrogenase
oxidising the substrate are decisive for a functional cytochrome bc1 complex.
Glucose consumption at pH 4 was as fast as at higher pH values indicating that
the membrane-bound glucose dehydrogenase was active, leading to a total
consumption of glucose. 440 mM glucose were oxidised at the membranes,
corresponding to the measured total 220 mM O2 consumption (according to the
stoichiometry that oxidation of one mol glucose leads to reduction of ½ mol O2).
Fig. 14 Growth of G. oxydans wild type cells on 80 g l-1 glucose pH 4, DO: 15%. Only wild type shown, deletion mutant showed no significant differences; (--): glucose; (--): gluconate; (-♦-): 2-ketogluconate; (--): growth; average of four independent experiments each
Thus, glucose was fully oxidised to gluconate. However, only 23 % of the initial
substrate glucose accumulated as gluconate in the medium. Nearly no
ketogluconates were produced. In order to determine, if gluconate or ketogluconate
are instable at pH 4, cell-free medium containing 80 g l-1 gluconate, 5-ketogluconate
and 2-ketogluconate was incubated for 24 h at 30°C. The concentrations of the sugar
did not change and the fate of the gluconate was still questioned. No membrane
oxidation occurred after the first 10 h (Fig. 15) since the membrane-bound
2-ketogluconate dehydrogenase has its pH optimum at pH 6 (Shinagawa et al. 1984).
Therefore, gluconate must have been taken up into the cells. The stop of growth after
depletion of glucose in the culture medium is explainable because the cells lacked
the energy delivered by periplasmatic gluconate oxidation. However, it cannot be
excluded, that a byproduct like acetate was formed. The main question, if there are
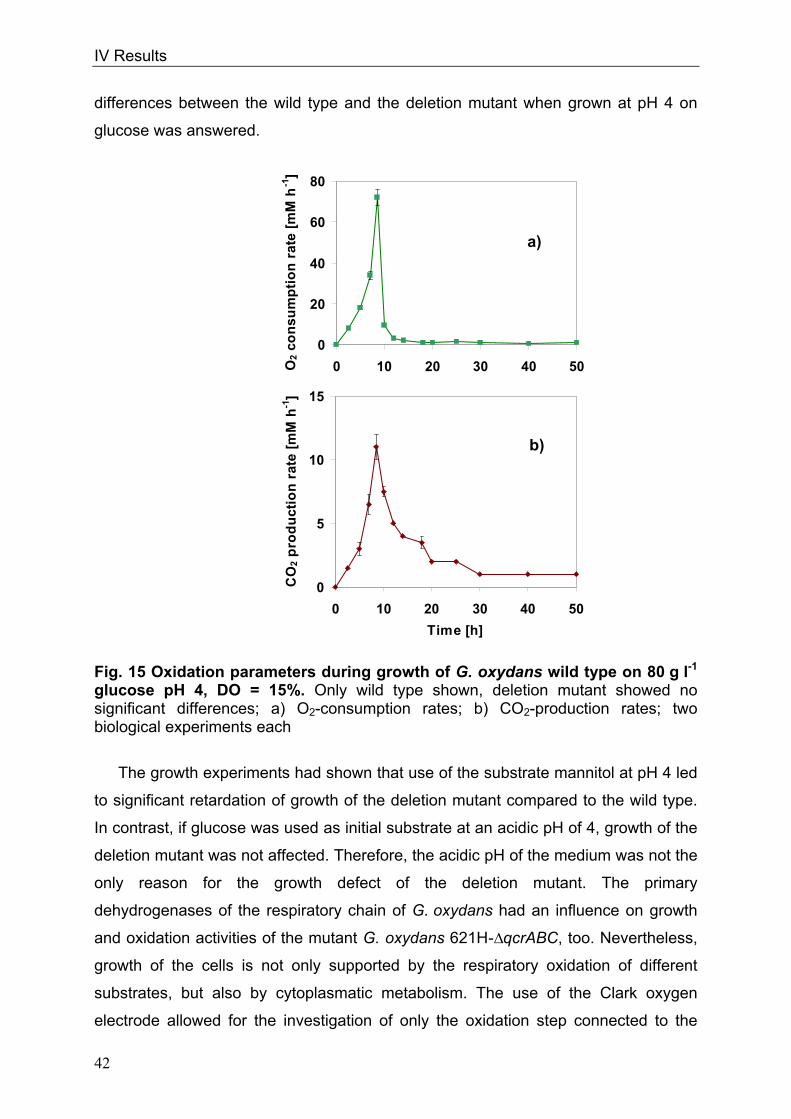
IV Results
42
differences between the wild type and the deletion mutant when grown at pH 4 on
glucose was answered.
Fig. 15 Oxidation parameters during growth of G. oxydans wild type on 80 g l-1 glucose pH 4, DO = 15%. Only wild type shown, deletion mutant showed no significant differences; a) O2-consumption rates; b) CO2-production rates; two biological experiments each
The growth experiments had shown that use of the substrate mannitol at pH 4 led
to significant retardation of growth of the deletion mutant compared to the wild type.
In contrast, if glucose was used as initial substrate at an acidic pH of 4, growth of the
deletion mutant was not affected. Therefore, the acidic pH of the medium was not the
only reason for the growth defect of the deletion mutant. The primary
dehydrogenases of the respiratory chain of G. oxydans had an influence on growth
and oxidation activities of the mutant G. oxydans 621H-∆qcrABC, too. Nevertheless,
growth of the cells is not only supported by the respiratory oxidation of different
substrates, but also by cytoplasmatic metabolism. The use of the Clark oxygen
electrode allowed for the investigation of only the oxidation step connected to the
0
20
40
60
80
0 10 20 30 40 50O2
con
sum
pti
on
rat
e [m
M h
-1]
0
5
10
15
0 10 20 30 40 50
Time [h]
CO
2 p
rod
uct
ion
rat
e [m
M h
-1]
a)
b)
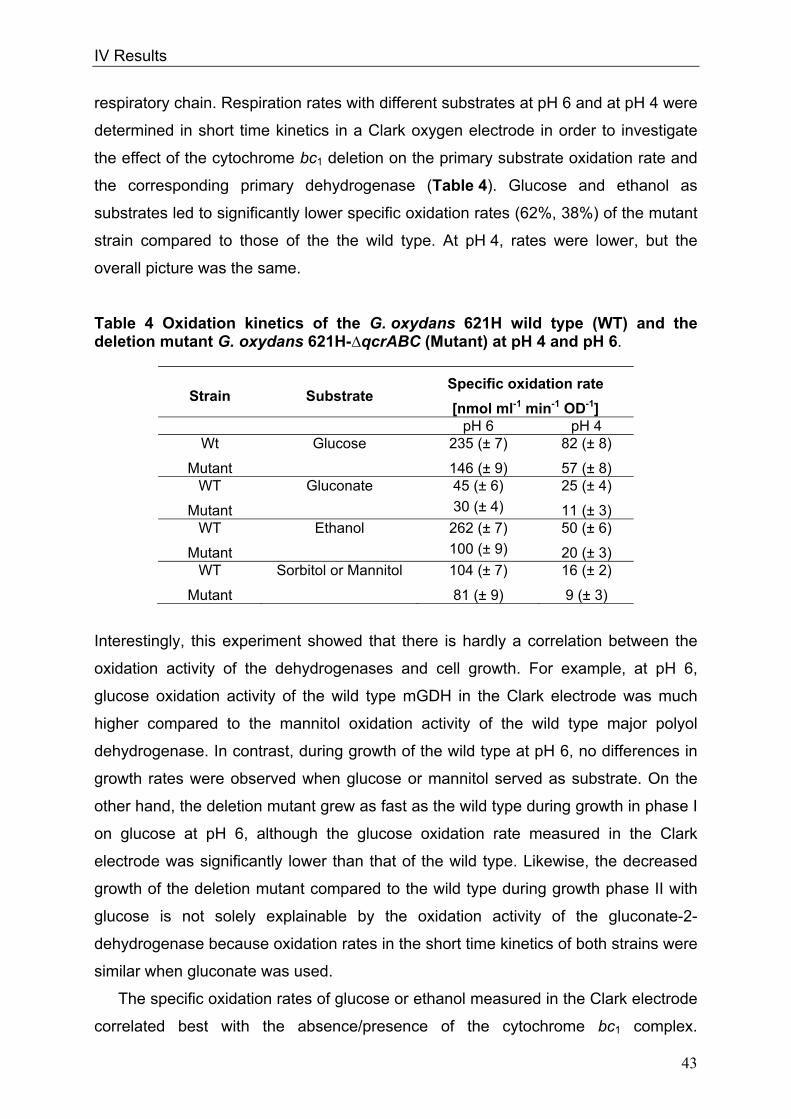
IV Results
43
respiratory chain. Respiration rates with different substrates at pH 6 and at pH 4 were
determined in short time kinetics in a Clark oxygen electrode in order to investigate
the effect of the cytochrome bc1 deletion on the primary substrate oxidation rate and
the corresponding primary dehydrogenase (Table 4). Glucose and ethanol as
substrates led to significantly lower specific oxidation rates (62%, 38%) of the mutant
strain compared to those of the the wild type. At pH 4, rates were lower, but the
overall picture was the same.
Table 4 Oxidation kinetics of the G. oxydans 621H wild type (WT) and the deletion mutant G. oxydans 621H-∆qcrABC (Mutant) at pH 4 and pH 6.
Strain Substrate Specific oxidation rate
[nmol ml-1 min-1 OD-1] pH 6 pH 4
Wt Glucose 235 (± 7) 82 (± 8)
Mutant 146 (± 9) 57 (± 8) WT Gluconate 45 (± 6) 25 (± 4)
Mutant 30 (± 4) 11 (± 3) WT Ethanol 262 (± 7) 50 (± 6)
Mutant 100 (± 9) 20 (± 3) WT Sorbitol or Mannitol 104 (± 7) 16 (± 2)
Mutant 81 (± 9) 9 (± 3)
Interestingly, this experiment showed that there is hardly a correlation between the
oxidation activity of the dehydrogenases and cell growth. For example, at pH 6,
glucose oxidation activity of the wild type mGDH in the Clark electrode was much
higher compared to the mannitol oxidation activity of the wild type major polyol
dehydrogenase. In contrast, during growth of the wild type at pH 6, no differences in
growth rates were observed when glucose or mannitol served as substrate. On the
other hand, the deletion mutant grew as fast as the wild type during growth in phase I
on glucose at pH 6, although the glucose oxidation rate measured in the Clark
electrode was significantly lower than that of the wild type. Likewise, the decreased
growth of the deletion mutant compared to the wild type during growth phase II with
glucose is not solely explainable by the oxidation activity of the gluconate-2-
dehydrogenase because oxidation rates in the short time kinetics of both strains were
similar when gluconate was used.
The specific oxidation rates of glucose or ethanol measured in the Clark electrode
correlated best with the absence/presence of the cytochrome bc1 complex.
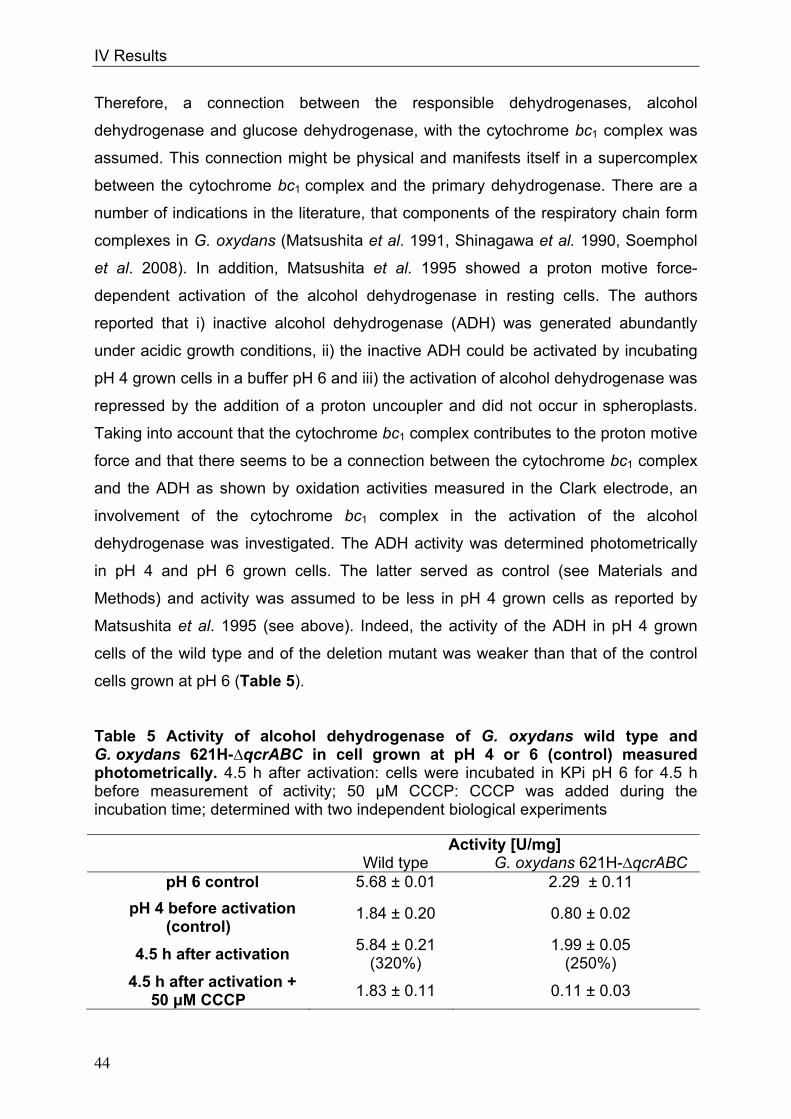
IV Results
44
Therefore, a connection between the responsible dehydrogenases, alcohol
dehydrogenase and glucose dehydrogenase, with the cytochrome bc1 complex was
assumed. This connection might be physical and manifests itself in a supercomplex
between the cytochrome bc1 complex and the primary dehydrogenase. There are a
number of indications in the literature, that components of the respiratory chain form
complexes in G. oxydans (Matsushita et al. 1991, Shinagawa et al. 1990, Soemphol
et al. 2008). In addition, Matsushita et al. 1995 showed a proton motive force-
dependent activation of the alcohol dehydrogenase in resting cells. The authors
reported that i) inactive alcohol dehydrogenase (ADH) was generated abundantly
under acidic growth conditions, ii) the inactive ADH could be activated by incubating
pH 4 grown cells in a buffer pH 6 and iii) the activation of alcohol dehydrogenase was
repressed by the addition of a proton uncoupler and did not occur in spheroplasts.
Taking into account that the cytochrome bc1 complex contributes to the proton motive
force and that there seems to be a connection between the cytochrome bc1 complex
and the ADH as shown by oxidation activities measured in the Clark electrode, an
involvement of the cytochrome bc1 complex in the activation of the alcohol
dehydrogenase was investigated. The ADH activity was determined photometrically
in pH 4 and pH 6 grown cells. The latter served as control (see Materials and
Methods) and activity was assumed to be less in pH 4 grown cells as reported by
Matsushita et al. 1995 (see above). Indeed, the activity of the ADH in pH 4 grown
cells of the wild type and of the deletion mutant was weaker than that of the control
cells grown at pH 6 (Table 5).
Table 5 Activity of alcohol dehydrogenase of G. oxydans wild type and G. oxydans 621H-∆qcrABC in cell grown at pH 4 or 6 (control) measured photometrically. 4.5 h after activation: cells were incubated in KPi pH 6 for 4.5 h before measurement of activity; 50 μM CCCP: CCCP was added during the incubation time; determined with two independent biological experiments
Activity [U/mg] Wild type G. oxydans 621H-∆qcrABC
pH 6 control 5.68 ± 0.01 2.29 ± 0.11
pH 4 before activation (control)
1.84 ± 0.20 0.80 ± 0.02
4.5 h after activation 5.84 ± 0.21
(320%) 1.99 ± 0.05
(250%) 4.5 h after activation +
50 μM CCCP 1.83 ± 0.11 0.11 ± 0.03
IV Results
45
The ADH activity in both strains was restored after incubating the cells for 4.5 h in
KPi buffer, pH 6. In the deletion mutant, the activity was restored to 250% instead of
320% in the wild type referred to the activity at pH 4. Therefore, the cytochrome bc1
complex presumably plays a role in the activation.
The probability of supercomplex formation between components of the respiratory
chain was described previously (Matsushita et al. 1991, Shinagawa et al. 1990,
Soemphol et al. 2008). The experimental data of Clark electrode experiments
together with the activation test of the ADH supported this view, at least between the
cytochrome bc1 complex and the ADH. Therefore, co-purification experiments were
performed. A strain was constructed with genomically integrated StrepTagII at the C-
terminus of the cytochrome c subunit of the ADH (G. oxydans 621H ∆hsdR adh-cyt
cSt). The vector pK19mobsacB-adhcytcSt was integrated into the genome by
homologous recombination. G. oxydans 621H ∆hsdR (Schweikert et al. in
preparation) was used as parental strain, because this strain was transformable by
electroporation, due to a deleted endonuclease HsdR.
The tagged cytochrome c subunit of the ADH interacts with the column material
during the purification (see Materials and Methods), and is eluted specifically with
elution buffer after washing the column for removal of unspecifically bound proteins.
Proteins interacting with the tagged cytochrome c subunit of the ADH, like the two
other subunits of the ADH or other components of the respiratory chain, which might
form supercomplexes with the ADH, should bind on the column, too. Therefore,
interaction partners in supercomplexes can be “fished” by binding one partner to the
column with a StrepTagII. Each protein interacting with the ADH should be eluted
with the tagged ADH subunit. The large subunit of the alcohol dehydrogenase was
purified in addition with the tagged cytochrome c subunit of the ADH, as well as the
15 kDA subunit (Fig. 16, left). Eluates containing the ADH were reddishly coloured
(Fig. 16, right) indicating a high content of the red pigment cytochrome c (Matsushita
et al. 2008). Bands of the SDS-PAGE were cut out and analysed with MALDI-TOF to
assure the correct identification of the protein. The band at 72 kDa was a mixture of
the large subunit of the ADH and the tagged cytochrome c subunit of the ADH. This
indicated, that the interaction between these subunits was so strong, that they could
not fully be separated in a denaturating SDS-gel. The band at 48 kDa consisted of
only the tagged subunit. No other components of the respiratory chain were co-
purified with the three subunits of the alcohol dehydrogenase. Hence, the co-
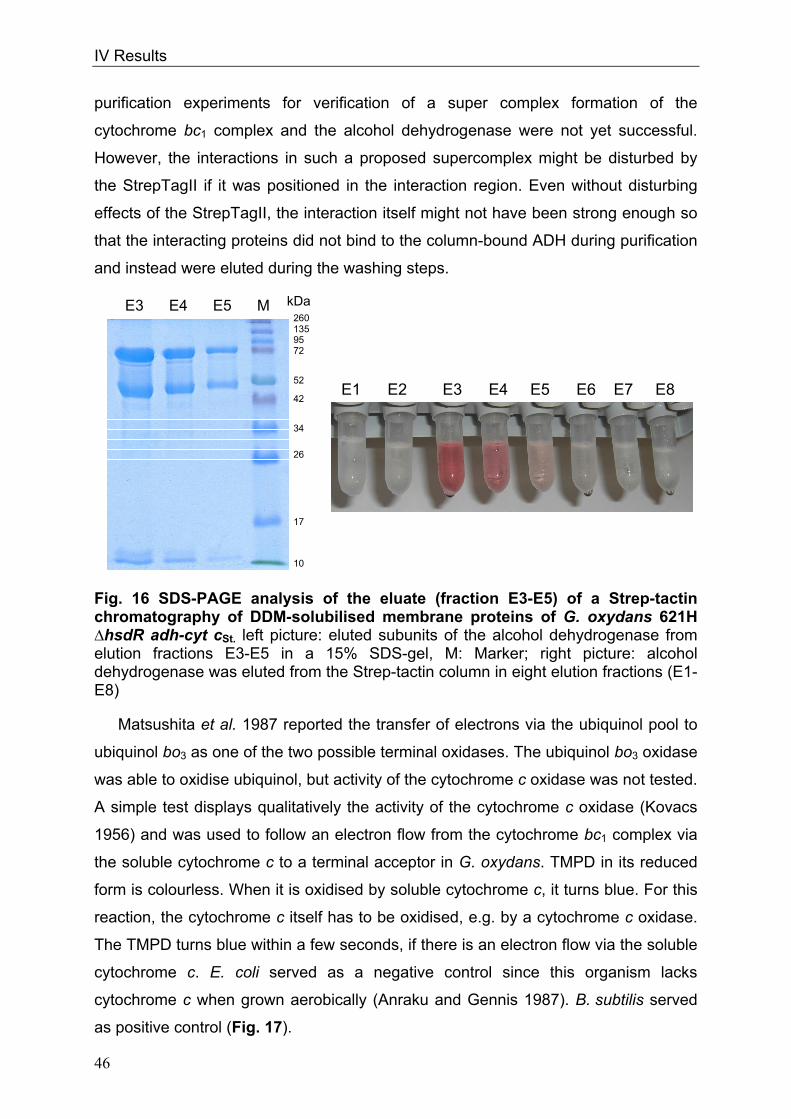
IV Results
46
kDa
purification experiments for verification of a super complex formation of the
cytochrome bc1 complex and the alcohol dehydrogenase were not yet successful.
However, the interactions in such a proposed supercomplex might be disturbed by
the StrepTagII if it was positioned in the interaction region. Even without disturbing
effects of the StrepTagII, the interaction itself might not have been strong enough so
that the interacting proteins did not bind to the column-bound ADH during purification
and instead were eluted during the washing steps.
Fig. 16 SDS-PAGE analysis of the eluate (fraction E3-E5) of a Strep-tactin chromatography of DDM-solubilised membrane proteins of G. oxydans 621H ∆hsdR adh-cyt cSt. left picture: eluted subunits of the alcohol dehydrogenase from elution fractions E3-E5 in a 15% SDS-gel, M: Marker; right picture: alcohol dehydrogenase was eluted from the Strep-tactin column in eight elution fractions (E1-E8)
Matsushita et al. 1987 reported the transfer of electrons via the ubiquinol pool to
ubiquinol bo3 as one of the two possible terminal oxidases. The ubiquinol bo3 oxidase
was able to oxidise ubiquinol, but activity of the cytochrome c oxidase was not tested.
A simple test displays qualitatively the activity of the cytochrome c oxidase (Kovacs
1956) and was used to follow an electron flow from the cytochrome bc1 complex via
the soluble cytochrome c to a terminal acceptor in G. oxydans. TMPD in its reduced
form is colourless. When it is oxidised by soluble cytochrome c, it turns blue. For this
reaction, the cytochrome c itself has to be oxidised, e.g. by a cytochrome c oxidase.
The TMPD turns blue within a few seconds, if there is an electron flow via the soluble
cytochrome c. E. coli served as a negative control since this organism lacks
cytochrome c when grown aerobically (Anraku and Gennis 1987). B. subtilis served
as positive control (Fig. 17).
E1 E2 E3 E4 E5 E6 E7 E8
260 135 95 72
52
42
34
26
17
10
E3 E4 E5 M kDa
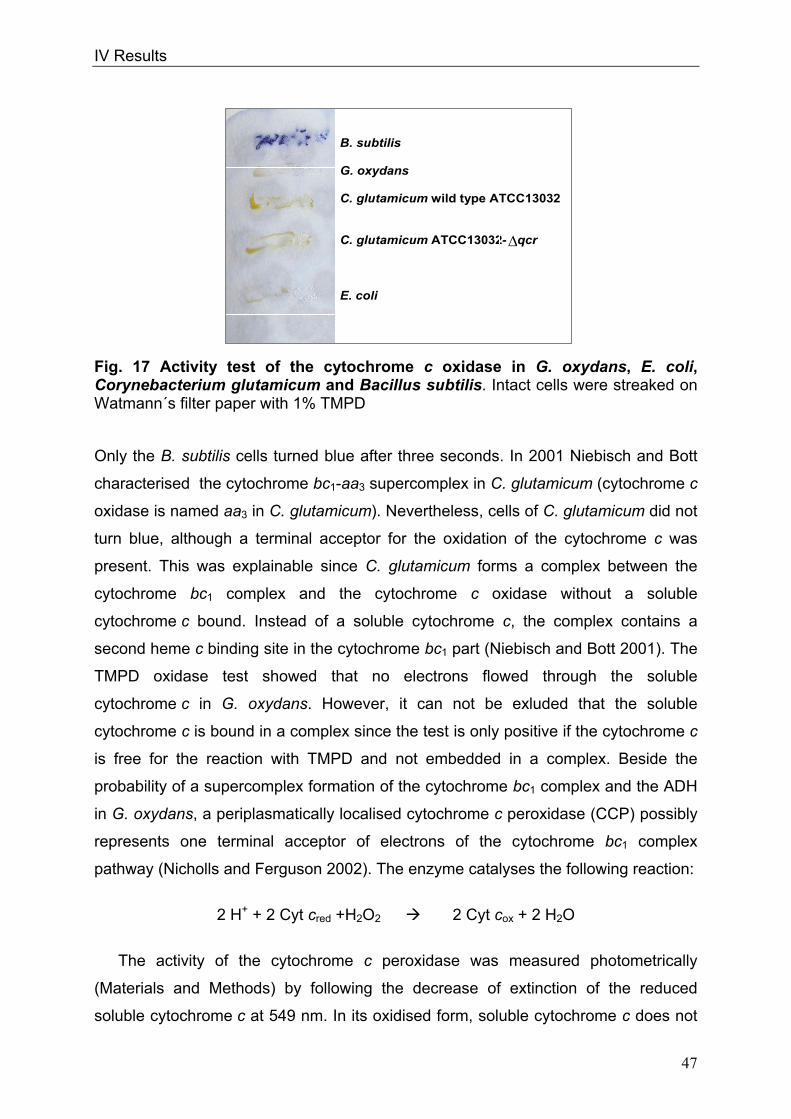
IV Results
47
Fig. 17 Activity test of the cytochrome c oxidase in G. oxydans, E. coli, Corynebacterium glutamicum and Bacillus subtilis. Intact cells were streaked on Watmann´s filter paper with 1% TMPD
Only the B. subtilis cells turned blue after three seconds. In 2001 Niebisch and Bott
characterised the cytochrome bc1-aa3 supercomplex in C. glutamicum (cytochrome c
oxidase is named aa3 in C. glutamicum). Nevertheless, cells of C. glutamicum did not
turn blue, although a terminal acceptor for the oxidation of the cytochrome c was
present. This was explainable since C. glutamicum forms a complex between the
cytochrome bc1 complex and the cytochrome c oxidase without a soluble
cytochrome c bound. Instead of a soluble cytochrome c, the complex contains a
second heme c binding site in the cytochrome bc1 part (Niebisch and Bott 2001). The
TMPD oxidase test showed that no electrons flowed through the soluble
cytochrome c in G. oxydans. However, it can not be exluded that the soluble
cytochrome c is bound in a complex since the test is only positive if the cytochrome c
is free for the reaction with TMPD and not embedded in a complex. Beside the
probability of a supercomplex formation of the cytochrome bc1 complex and the ADH
in G. oxydans, a periplasmatically localised cytochrome c peroxidase (CCP) possibly
represents one terminal acceptor of electrons of the cytochrome bc1 complex
pathway (Nicholls and Ferguson 2002). The enzyme catalyses the following reaction:
2 H+ + 2 Cyt cred +H2O2 2 Cyt cox + 2 H2O
The activity of the cytochrome c peroxidase was measured photometrically
(Materials and Methods) by following the decrease of extinction of the reduced
soluble cytochrome c at 549 nm. In its oxidised form, soluble cytochrome c does not
B. subtilis G. oxydans C. glutamicum wild type ATCC13032 C. glutamicum ATCC13032- qcr E. coli
∆

IV Results
48
absorb light at 549 nm. However, activity of the cytochrome c peroxidase was not
detectable in cell-free extracts. Catalase was assumed to exhaust the hydrogen
peroxide immediately, so that no reaction of the cytochrome c peroxidase was
measurable. Addition of 20 μM of a catalase-specific inhibitor (3-Amino-1H-1, 2, 4-
triazol) (Manilov et al. 1996) to the reaction mixture did not result in a measurable
activity of the cytochrome c peroxidase so that the inhibitor was not active. In order to
measure the activity of the cytochrome c peroxidase without disturbing influences of
the catalase, the gene encoding the cytochrome c peroxidase was overexpressed in
E. coli for purification. The gene was cloned into an overexpression vector providing
a C-terminal His-tag (pET24). The cytochrome c peroxidase contains cytochrome c,
which is not synthesised in aerobically grown E. coli (Atack and Kelly 2007, Anraku
and Gennis 1987). To obtain an active enzyme by heterologous expression, the
E. coli strain bearing the plasmid was cultivated anaerobically. However, anaerobic
overproduction of the enzyme in E. coli was not detected after induction with IPTG,
although sequencing verified the correctness of the vector. Therefore, overproduction
of cytochrome c peroxidase was also tested in aerobically grown E. coli cells. These
cells overproduced the apoenzyme of the cytochrome c peroxidase as proven by
SDS-PAGE (Fig. 18) and MALDI-analysis; the enzyme was purified from the
membrane fraction of the cells.
Fig. 18 SDS-PAGE analysis of cells of E. coli pET24-ccp and eluates of a Ni-NTA-chromatography of E. coli pET24-ccp. Proteins were analysed in a 12% polyamide gel and stained with Coomassie-blue, a) Proof for an overproduction of the cytochrome c peroxidase; t0: cells before induction with 0.5 mM IPTG; t1 and t4: 1 h or 4 h after induction with IPTG resulting in overproduced cytochrome c peroxidase; b) steps for purification of the cytochrome c peroxidase; t4: overproduced cytochrome c peroxidase after induction with IPTG; s1: supernatant after cell disruption; p1: pellet after cell disruption; s2: supernatant after ultracentrifugation; p2: pellet after ultracentrifugation; c) TNI100: proteins eluted from the Ni-NTA-column with TNI100; M: Marker (Precision plus, Bio-Rad, Munich, Germany)
t0 t1 t4 M
250 150
100
75
50
TNI100 M t4 s1 p1 s2 p2 M
a) b) c)
kDa

IV Results
49
As expected, the apo-CCP was not active because no cytochrome c was available
in aerobically grown E. coli cells (Thöny-Meyer et al. 1995). In addition, functional
expression of the CCP has a number of premises, concerning transport into the
periplasm and protein assembly (apo-CCP and the cytochrome c as prothetic group)
in the periplasm (Ferguson et al. 2008). It can not be excluded that those cellular
processes exerted adverse effects on functional expression in anaerobically
cultivated E. coli.
In an alternative approach homologous overproduction of the enzyme in
G. oxydans was performed. For the homologous overproduction of the cytochrome c
peroxidase in G. oxydans, the HisTag-terminator sequence of the pET24 vector and
the gene encoding for the cytochrome c peroxidase were cloned into the vector
pEXGOX-K. A 3 l culture of G. oxydans containing the overproduction vector
pEXGOX-K-ccpHis was used for the homologous overproduction of the cytochrome c
peroxidase. SDS-gel analysis demonstrated no significant overproduction of the
enzyme although the vector was sequenced and found to be correct.
The cytochrome c peroxidase still represented a possible in vivo terminal acceptor
of the cytochrome bc1 complex pathway. To test the condition, when the cytochrome
c peroxidase is preferably used, transcription of the ccp-gene was investigated under
different conditions of oxygen availability. H2O2 is formed when electrons are
transferred to molecular oxygen; especially in highly active respiratory chains
superoxide ions are formed which then are converted by superoxide dismutase into a
molecule of hydrogen peroxide and one of oxygen (Fridovich 1978, 1995, Imlay and
Fridovich 1991). Parallel to H2O2 formation, the transcription of the ccp gene was
supposed to increase, when electrons entered the respiratory chain rapidly, which is
the case when oxygen availability is high (Costa and Morradas-Ferreira 2001).
Different conditions of oxygen availability were tested. Cells were cultivated under
oxygen-limited conditions from the beginning of growth, or oxygen limitation was set
in the middle of the exponential growth phase. The different oxygen availability
conditions resulted in different growth behaviour of the cells (Fig. 19). Keeping the
DO at 45% or 30% resulted in exponential cell growth; limiting the oxygen availability
due to constant gassing with 2% O2 resulted in decreased linear growth. This was
true for a limitation from the beginning of growth and for a limitation set in the middle
of the exponential growth phase. Oxygen excess conditions were established by
provision of DO 30% and cells were harvested in the middle of the exponential
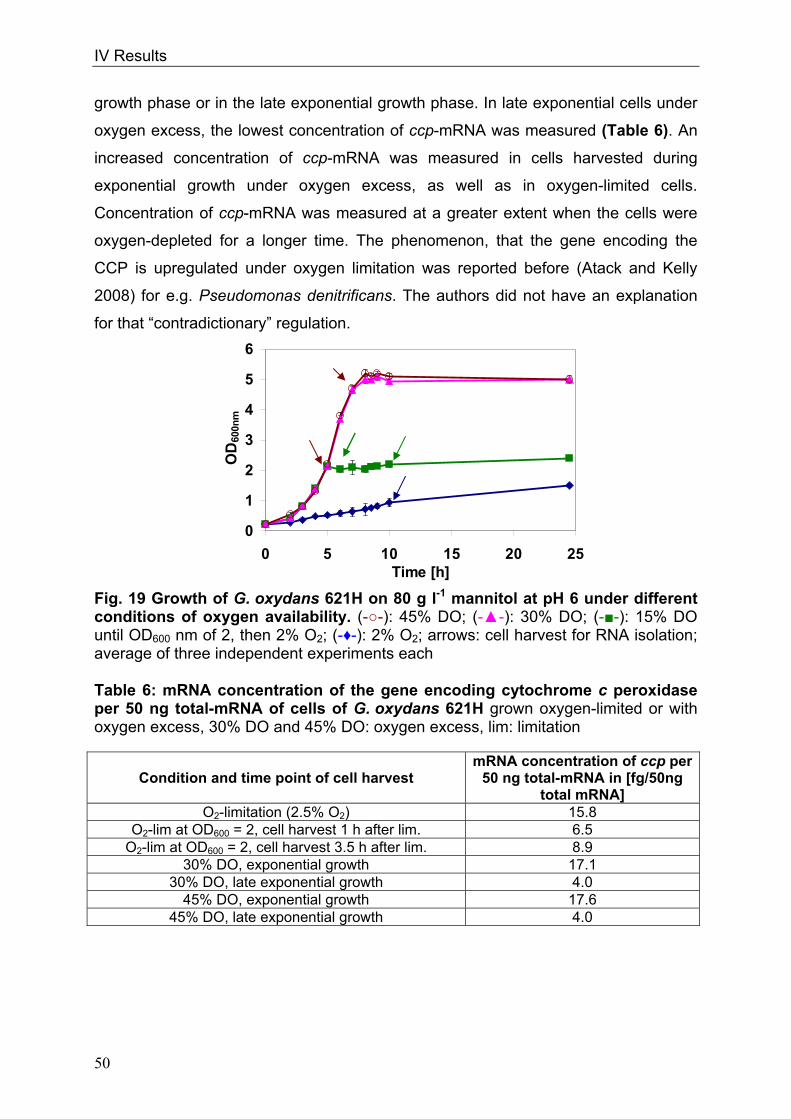
IV Results
50
growth phase or in the late exponential growth phase. In late exponential cells under
oxygen excess, the lowest concentration of ccp-mRNA was measured (Table 6). An
increased concentration of ccp-mRNA was measured in cells harvested during
exponential growth under oxygen excess, as well as in oxygen-limited cells.
Concentration of ccp-mRNA was measured at a greater extent when the cells were
oxygen-depleted for a longer time. The phenomenon, that the gene encoding the
CCP is upregulated under oxygen limitation was reported before (Atack and Kelly
2008) for e.g. Pseudomonas denitrificans. The authors did not have an explanation
for that “contradictionary” regulation.
Fig. 19 Growth of G. oxydans 621H on 80 g l-1 mannitol at pH 6 under different conditions of oxygen availability. (--): 45% DO; (--): 30% DO; (--): 15% DO until OD600 nm of 2, then 2% O2; (-♦-): 2% O2; arrows: cell harvest for RNA isolation; average of three independent experiments each Table 6: mRNA concentration of the gene encoding cytochrome c peroxidase per 50 ng total-mRNA of cells of G. oxydans 621H grown oxygen-limited or with oxygen excess, 30% DO and 45% DO: oxygen excess, lim: limitation
Condition and time point of cell harvest mRNA concentration of ccp per
50 ng total-mRNA in [fg/50ng total mRNA]
O2-limitation (2.5% O2) 15.8 O2-lim at OD600 = 2, cell harvest 1 h after lim. 6.5
O2-lim at OD600 = 2, cell harvest 3.5 h after lim. 8.9 30% DO, exponential growth 17.1
30% DO, late exponential growth 4.0 45% DO, exponential growth 17.6
45% DO, late exponential growth 4.0
0
1
2
3
4
5
6
0 5 10 15 20 25Time [h]
OD
600n
m
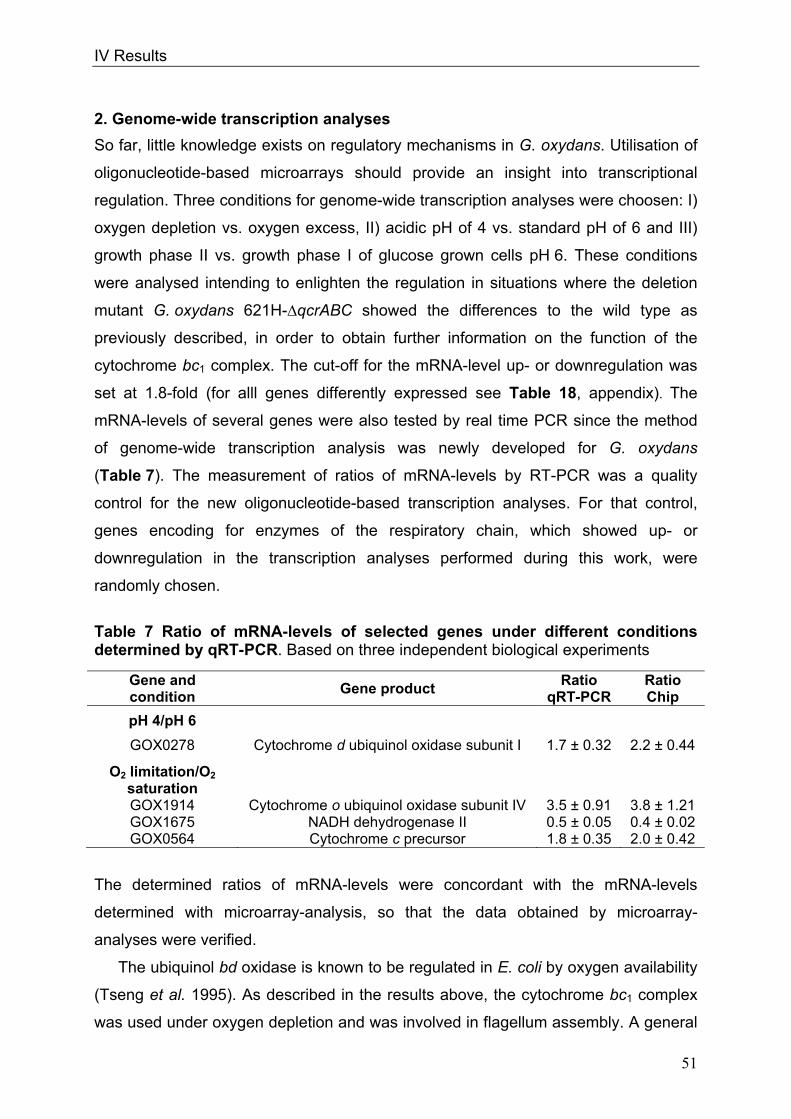
IV Results
51
2. Genome-wide transcription analyses
So far, little knowledge exists on regulatory mechanisms in G. oxydans. Utilisation of
oligonucleotide-based microarrays should provide an insight into transcriptional
regulation. Three conditions for genome-wide transcription analyses were choosen: I)
oxygen depletion vs. oxygen excess, II) acidic pH of 4 vs. standard pH of 6 and III)
growth phase II vs. growth phase I of glucose grown cells pH 6. These conditions
were analysed intending to enlighten the regulation in situations where the deletion
mutant G. oxydans 621H-∆qcrABC showed the differences to the wild type as
previously described, in order to obtain further information on the function of the
cytochrome bc1 complex. The cut-off for the mRNA-level up- or downregulation was
set at 1.8-fold (for alll genes differently expressed see Table 18, appendix). The
mRNA-levels of several genes were also tested by real time PCR since the method
of genome-wide transcription analysis was newly developed for G. oxydans
(Table 7). The measurement of ratios of mRNA-levels by RT-PCR was a quality
control for the new oligonucleotide-based transcription analyses. For that control,
genes encoding for enzymes of the respiratory chain, which showed up- or
downregulation in the transcription analyses performed during this work, were
randomly chosen.
Table 7 Ratio of mRNA-levels of selected genes under different conditions determined by qRT-PCR. Based on three independent biological experiments
The determined ratios of mRNA-levels were concordant with the mRNA-levels
determined with microarray-analysis, so that the data obtained by microarray-
analyses were verified.
The ubiquinol bd oxidase is known to be regulated in E. coli by oxygen availability
(Tseng et al. 1995). As described in the results above, the cytochrome bc1 complex
was used under oxygen depletion and was involved in flagellum assembly. A general
Gene and condition
Gene product Ratio
qRT-PCR Ratio Chip
pH 4/pH 6
GOX0278 Cytochrome d ubiquinol oxidase subunit I 1.7 ± 0.32 2.2 ± 0.44
O2 limitation/O2 saturation
GOX1914 Cytochrome o ubiquinol oxidase subunit IV 3.5 ± 0.91 3.8 ± 1.21 GOX1675 NADH dehydrogenase II 0.5 ± 0.05 0.4 ± 0.02 GOX0564 Cytochrome c precursor 1.8 ± 0.35 2.0 ± 0.42

IV Results
52
regulation of respiratory chain components like the ubiquinol bd oxidase and the
cytochrome bc1 complex as well as membrane-associated components like flagella
was therefore supposed in G. oxydans under oxygen limitation.
Cells for mRNA-isolation were grown under O2-excess (DO = 15%) until an OD600
of 3.5, then the oxygen limitation was set. Establishment of oxygen limitation was
achieved by gassing the bioreactor with 2% O2. Cells were harvested a few minutes
before and 4 h after the start of oxygen limitation for extraction of mRNA (Fig. 20).
Microarray analysis showed downregulation of the mRNA-levels of 351 genes and
upregulation of the mRNA-levels of 291 genes. A selection of the regulated genes
was summarised in functional groups as defined by Prust et al. 2005 (Table 8). Some
of these genes exhibited regulation due to the different growth phases of the two time
points of harvesting (e.g., 52 genes involved in protein biosynthesis were
downregulated). To ascertain condition-specific regulations, a comparison of the two
data sets obtained by the conditions oxygen limitation vs. oxygen excess and
gluconate-grown cells vs. glucose-grown cells (see next chapter, cell harvest in
different growth phases, as well) was made.
Fig. 20 Growth of G. oxydans 621H on 80 g l-1 mannitol under oxygen excess (DO = 15%) and under oxygen limitation (2% O2). Cells were grown oxygen saturated (DO = 15%) until an OD600 of 3, then O2-limitation was set with 2% O2, arrows: time point of cell harvest for RNA isolation
Oxygen limitation elicited mainly downregulation of genes involved in the pentose
phosphate pathway and in amino acid metabolism. Twenty-eight genes involved in
chemotaxis or flagella synthesis were upregulated and 45 genes involved in electron
transport and in the assembly of ATP synthase showed a differential regulation.
0
2
4
6
8
10
0 10 20 30Time [h]
OD
60
0 n
m
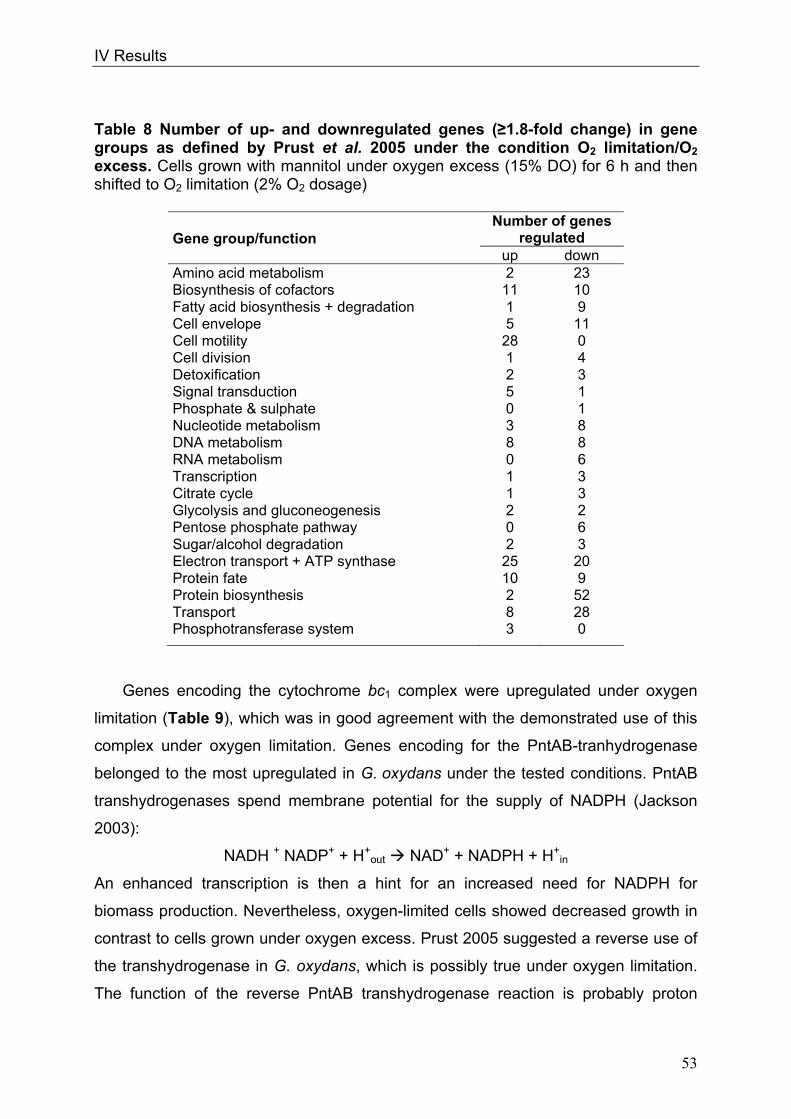
IV Results
53
Table 8 Number of up- and downregulated genes (≥1.8-fold change) in gene groups as defined by Prust et al. 2005 under the condition O2 limitation/O2 excess. Cells grown with mannitol under oxygen excess (15% DO) for 6 h and then shifted to O2 limitation (2% O2 dosage)
Gene group/function
Number of genes regulated
up down Amino acid metabolism 2 23 Biosynthesis of cofactors 11 10 Fatty acid biosynthesis + degradation 1 9 Cell envelope 5 11 Cell motility 28 0 Cell division 1 4 Detoxification 2 3 Signal transduction 5 1 Phosphate & sulphate 0 1 Nucleotide metabolism 3 8 DNA metabolism 8 8 RNA metabolism 0 6 Transcription 1 3 Citrate cycle 1 3 Glycolysis and gluconeogenesis 2 2 Pentose phosphate pathway 0 6 Sugar/alcohol degradation 2 3 Electron transport + ATP synthase 25 20 Protein fate 10 9 Protein biosynthesis 2 52 Transport 8 28 Phosphotransferase system 3 0
Genes encoding the cytochrome bc1 complex were upregulated under oxygen
limitation (Table 9), which was in good agreement with the demonstrated use of this
complex under oxygen limitation. Genes encoding for the PntAB-tranhydrogenase
belonged to the most upregulated in G. oxydans under the tested conditions. PntAB
transhydrogenases spend membrane potential for the supply of NADPH (Jackson
2003):
NADH + NADP+ + H+out NAD+ + NADPH + H+
in
An enhanced transcription is then a hint for an increased need for NADPH for
biomass production. Nevertheless, oxygen-limited cells showed decreased growth in
contrast to cells grown under oxygen excess. Prust 2005 suggested a reverse use of
the transhydrogenase in G. oxydans, which is possibly true under oxygen limitation.
The function of the reverse PntAB transhydrogenase reaction is probably proton
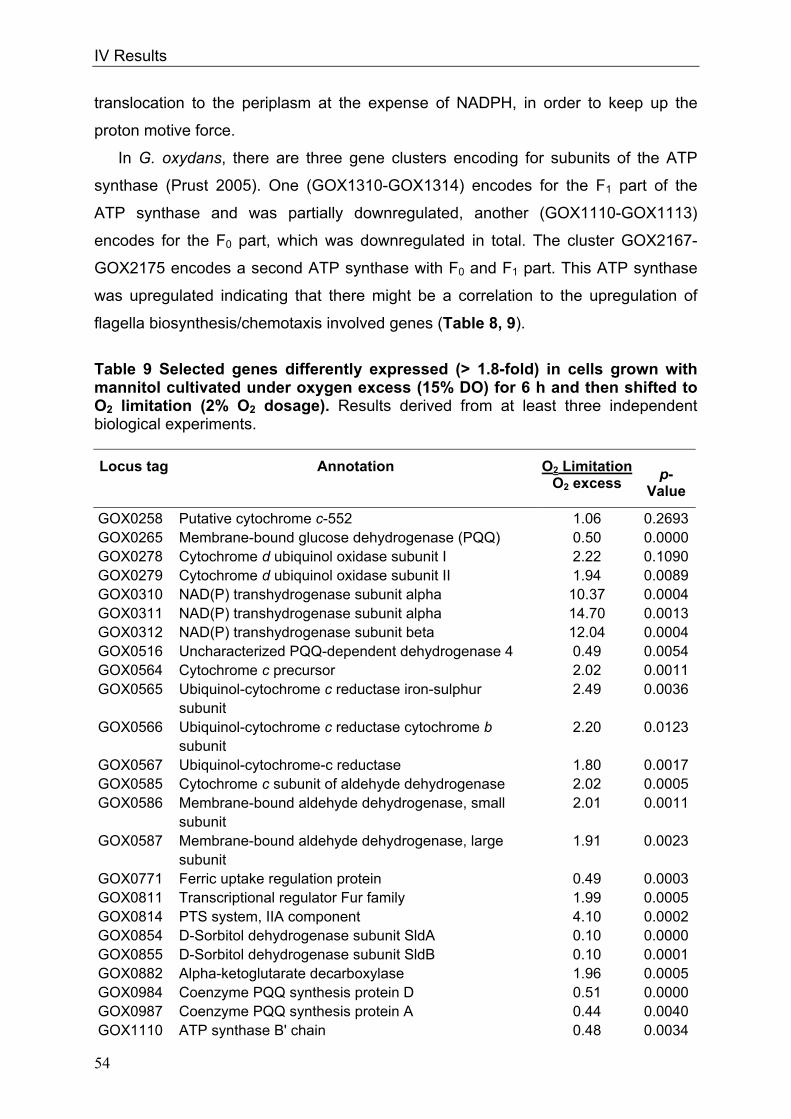
IV Results
54
translocation to the periplasm at the expense of NADPH, in order to keep up the
proton motive force.
In G. oxydans, there are three gene clusters encoding for subunits of the ATP
synthase (Prust 2005). One (GOX1310-GOX1314) encodes for the F1 part of the
ATP synthase and was partially downregulated, another (GOX1110-GOX1113)
encodes for the F0 part, which was downregulated in total. The cluster GOX2167-
GOX2175 encodes a second ATP synthase with F0 and F1 part. This ATP synthase
was upregulated indicating that there might be a correlation to the upregulation of
flagella biosynthesis/chemotaxis involved genes (Table 8, 9).
Table 9 Selected genes differently expressed (> 1.8-fold) in cells grown with mannitol cultivated under oxygen excess (15% DO) for 6 h and then shifted to O2 limitation (2% O2 dosage). Results derived from at least three independent biological experiments.
Locus tag
Annotation
O2 Limitation O2 excess
p-Value
GOX0258 Putative cytochrome c-552 1.06 0.2693GOX0265 Membrane-bound glucose dehydrogenase (PQQ) 0.50 0.0000GOX0278 Cytochrome d ubiquinol oxidase subunit I 2.22 0.1090GOX0279 Cytochrome d ubiquinol oxidase subunit II 1.94 0.0089GOX0310 NAD(P) transhydrogenase subunit alpha 10.37 0.0004GOX0311 NAD(P) transhydrogenase subunit alpha 14.70 0.0013GOX0312 NAD(P) transhydrogenase subunit beta 12.04 0.0004GOX0516 Uncharacterized PQQ-dependent dehydrogenase 4 0.49 0.0054GOX0564 Cytochrome c precursor 2.02 0.0011GOX0565 Ubiquinol-cytochrome c reductase iron-sulphur 2.49 0.0036 subunit GOX0566 Ubiquinol-cytochrome c reductase cytochrome b 2.20 0.0123 subunit GOX0567 Ubiquinol-cytochrome-c reductase 1.80 0.0017GOX0585 Cytochrome c subunit of aldehyde dehydrogenase 2.02 0.0005GOX0586 Membrane-bound aldehyde dehydrogenase, small 2.01 0.0011 subunit GOX0587 Membrane-bound aldehyde dehydrogenase, large 1.91 0.0023 subunit GOX0771 Ferric uptake regulation protein 0.49 0.0003GOX0811 Transcriptional regulator Fur family 1.99 0.0005GOX0814 PTS system, IIA component 4.10 0.0002GOX0854 D-Sorbitol dehydrogenase subunit SldA 0.10 0.0000GOX0855 D-Sorbitol dehydrogenase subunit SldB 0.10 0.0001GOX0882 Alpha-ketoglutarate decarboxylase 1.96 0.0005GOX0984 Coenzyme PQQ synthesis protein D 0.51 0.0000GOX0987 Coenzyme PQQ synthesis protein A 0.44 0.0040GOX1110 ATP synthase B' chain 0.48 0.0034
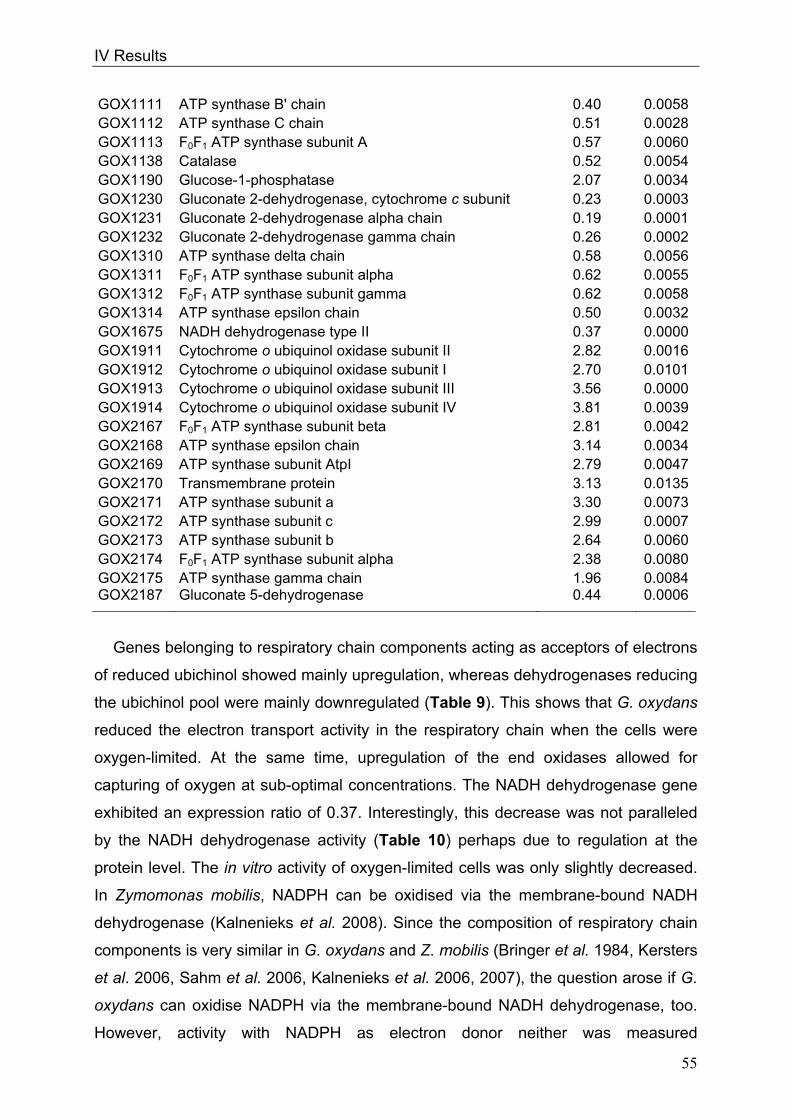
IV Results
55
GOX1111 ATP synthase B' chain 0.40 0.0058GOX1112 ATP synthase C chain 0.51 0.0028GOX1113 F0F1 ATP synthase subunit A 0.57 0.0060GOX1138 Catalase 0.52 0.0054GOX1190 Glucose-1-phosphatase 2.07 0.0034GOX1230 Gluconate 2-dehydrogenase, cytochrome c subunit 0.23 0.0003GOX1231 Gluconate 2-dehydrogenase alpha chain 0.19 0.0001GOX1232 Gluconate 2-dehydrogenase gamma chain 0.26 0.0002GOX1310 ATP synthase delta chain 0.58 0.0056GOX1311 F0F1 ATP synthase subunit alpha 0.62 0.0055GOX1312 F0F1 ATP synthase subunit gamma 0.62 0.0058GOX1314 ATP synthase epsilon chain 0.50 0.0032GOX1675 NADH dehydrogenase type II 0.37 0.0000GOX1911 Cytochrome o ubiquinol oxidase subunit II 2.82 0.0016GOX1912 Cytochrome o ubiquinol oxidase subunit I 2.70 0.0101GOX1913 Cytochrome o ubiquinol oxidase subunit III 3.56 0.0000GOX1914 Cytochrome o ubiquinol oxidase subunit IV 3.81 0.0039GOX2167 F0F1 ATP synthase subunit beta 2.81 0.0042GOX2168 ATP synthase epsilon chain 3.14 0.0034GOX2169 ATP synthase subunit AtpI 2.79 0.0047GOX2170 Transmembrane protein 3.13 0.0135GOX2171 ATP synthase subunit a 3.30 0.0073GOX2172 ATP synthase subunit c 2.99 0.0007GOX2173 ATP synthase subunit b 2.64 0.0060GOX2174 F0F1 ATP synthase subunit alpha 2.38 0.0080GOX2175 ATP synthase gamma chain 1.96 0.0084GOX2187 Gluconate 5-dehydrogenase 0.44 0.0006
Genes belonging to respiratory chain components acting as acceptors of electrons
of reduced ubichinol showed mainly upregulation, whereas dehydrogenases reducing
the ubichinol pool were mainly downregulated (Table 9). This shows that G. oxydans
reduced the electron transport activity in the respiratory chain when the cells were
oxygen-limited. At the same time, upregulation of the end oxidases allowed for
capturing of oxygen at sub-optimal concentrations. The NADH dehydrogenase gene
exhibited an expression ratio of 0.37. Interestingly, this decrease was not paralleled
by the NADH dehydrogenase activity (Table 10) perhaps due to regulation at the
protein level. The in vitro activity of oxygen-limited cells was only slightly decreased.
In Zymomonas mobilis, NADPH can be oxidised via the membrane-bound NADH
dehydrogenase (Kalnenieks et al. 2008). Since the composition of respiratory chain
components is very similar in G. oxydans and Z. mobilis (Bringer et al. 1984, Kersters
et al. 2006, Sahm et al. 2006, Kalnenieks et al. 2006, 2007), the question arose if G.
oxydans can oxidise NADPH via the membrane-bound NADH dehydrogenase, too.
However, activity with NADPH as electron donor neither was measured

IV Results
56
photometrically nor potentiometrically in G. oxydans so that NADPH cannot be used
for the energy supply of the cells but serves for anabolic reactions only.
The gene encoding the ferric uptake regulator (Fur) was upregulated. In E. coli,
Fur mediates the regulation of iron acquisition and storage systems, respiration, the
TCA cycle, glycolysis, methionine biosynthesis, phage-DNA packaging, purine
metabolism, and redox-stress resistance (McHugh et al. 2003) by binding of Fe2+ and
subsequent repression of the target genes.
Table 10 Stoichiometry of the intracellular NADH-dependent oxygen reduction. Measurements were performed with isolated cell membranes of cells grown under oxygen excess or under oxygen limitation, photometrically for NADH oxidation and in a Clark electrode chamber for O2 reduction.
Genes involved in the pentose phosphate pathway had decreased mRNA-levels
under oxygen limitation, as well as the genes encoding for the cytoplasmatic glucose
dehydrogenase, indicating a decreased sugar metabolism under oxygen limitation.
The catalase gene showed a strong downregulation, which in turn is an indication for
decreased H2O2 concentrations under oxygen limitation compared to oxygen excess
(Yoshpe-Purer and Henis 1976). Interestingly, the mRNA level of the EIIA component
of the PTS system increased under oxygen limitation although the PTS system is
supposed to be not functional in G. oxydans (Prust et al. 2005). Upregulation
indicates that there are regulatory functions like catabolite repression left in EIIA.
Matsushita et al. 1989 reported an increased use of the more inefficient ubiquinol
bd oxidase in cells grown under acidic conditions. However, this was shown indirectly
only. In this work, the idea was put forward that the cytochrome bc1 complex is
necessary when the ubiquinol bd oxidase is preferably used in order to maintain
proton motive force. Therefore, it was required to unambiguously show the increase
of the ubiquinol bd oxidase at the transcriptional level to verify the indirect results of
Matsushita et al. 1989. For comparison of the levels of mRNA of cells grown at pH 4
to those of cells grown at pH 6, both cultures were harvested at OD600 of 2.5 in the
same growth phase (Fig. 21). Ninety-five genes showed altered mRNA-levels, 41 of
these genes encoding for transposases or hypothetical proteins. Table 11 shows a
Sample NADH oxidation
(nmol mg-1 protein) Oxygen consumption
(nmol mg-1 protein)
Oxygen excess 1851 ± 105 832 ± 40 Oxygen limitation 1706 ± 98 788 ± 37
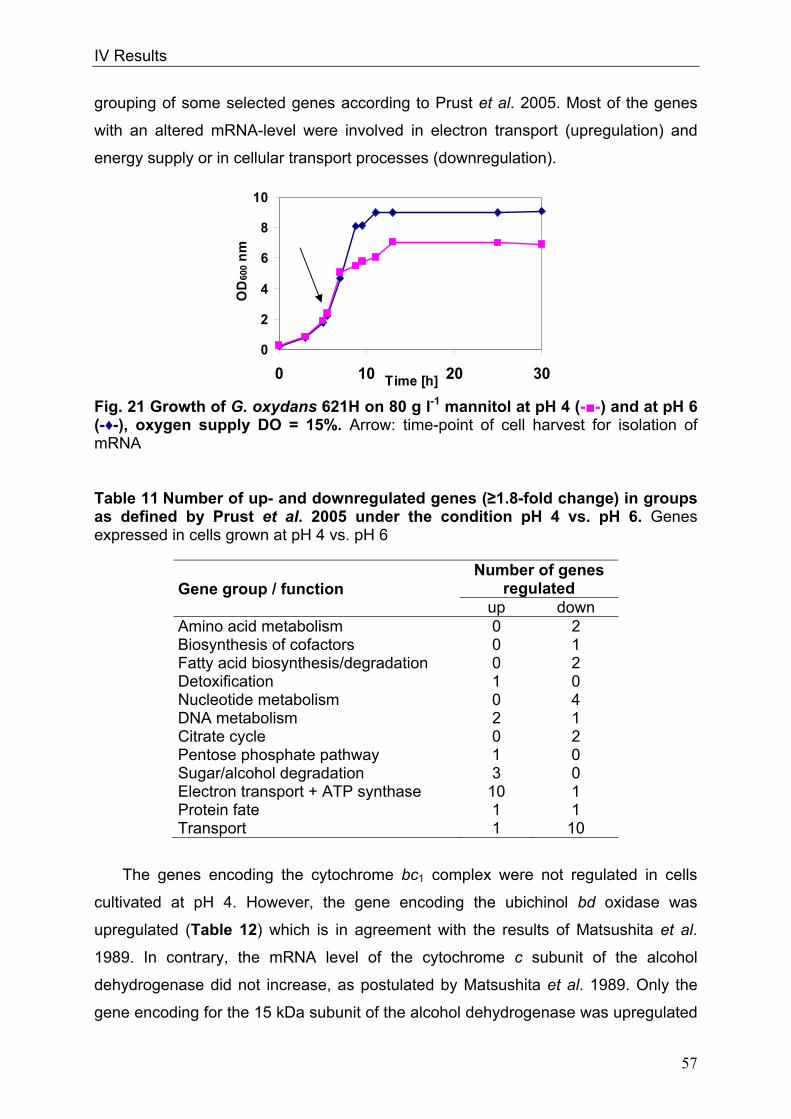
IV Results
57
grouping of some selected genes according to Prust et al. 2005. Most of the genes
with an altered mRNA-level were involved in electron transport (upregulation) and
energy supply or in cellular transport processes (downregulation).
Fig. 21 Growth of G. oxydans 621H on 80 g l-1 mannitol at pH 4 (--) and at pH 6 (-♦-), oxygen supply DO = 15%. Arrow: time-point of cell harvest for isolation of mRNA Table 11 Number of up- and downregulated genes (≥1.8-fold change) in groups as defined by Prust et al. 2005 under the condition pH 4 vs. pH 6. Genes expressed in cells grown at pH 4 vs. pH 6
Gene group / function
Number of genes regulated
up down Amino acid metabolism 0 2 Biosynthesis of cofactors 0 1 Fatty acid biosynthesis/degradation 0 2 Detoxification 1 0 Nucleotide metabolism 0 4 DNA metabolism 2 1 Citrate cycle 0 2 Pentose phosphate pathway 1 0 Sugar/alcohol degradation 3 0 Electron transport + ATP synthase 10 1 Protein fate 1 1 Transport 1 10
The genes encoding the cytochrome bc1 complex were not regulated in cells
cultivated at pH 4. However, the gene encoding the ubichinol bd oxidase was
upregulated (Table 12) which is in agreement with the results of Matsushita et al.
1989. In contrary, the mRNA level of the cytochrome c subunit of the alcohol
dehydrogenase did not increase, as postulated by Matsushita et al. 1989. Only the
gene encoding for the 15 kDa subunit of the alcohol dehydrogenase was upregulated
0
2
4
6
8
10
0 10 20 30Time [h]
OD
600
nm
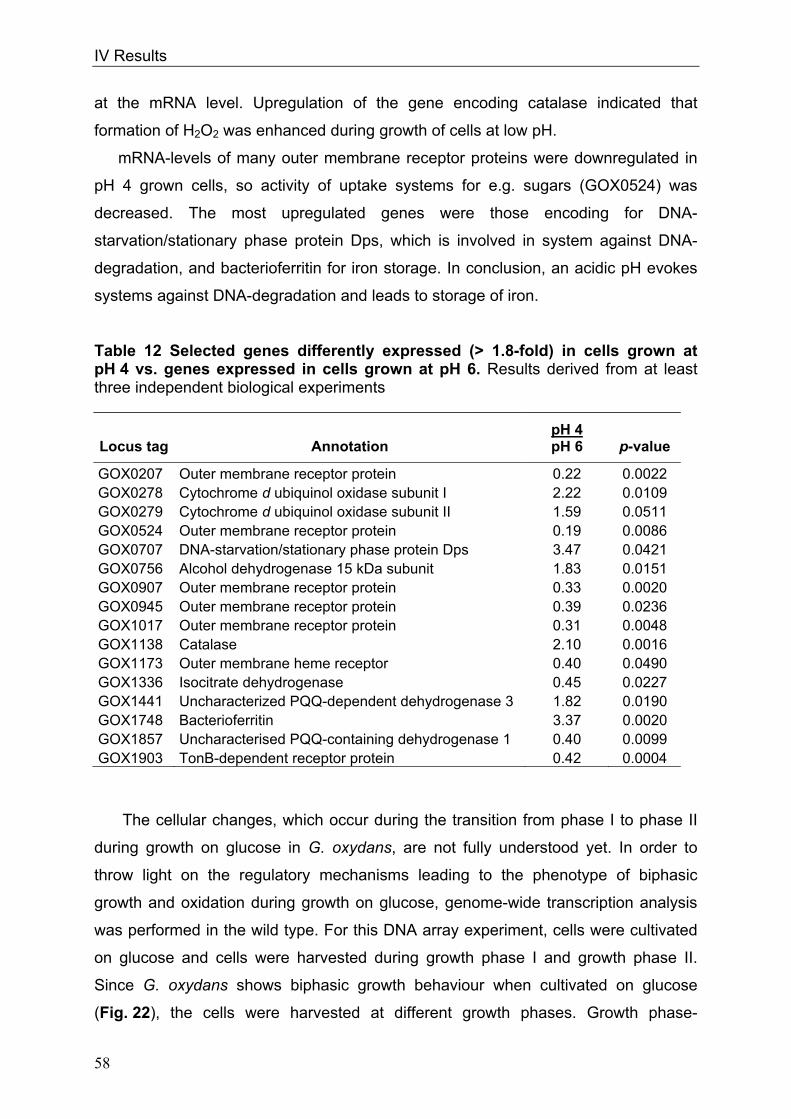
IV Results
58
at the mRNA level. Upregulation of the gene encoding catalase indicated that
formation of H2O2 was enhanced during growth of cells at low pH.
mRNA-levels of many outer membrane receptor proteins were downregulated in
pH 4 grown cells, so activity of uptake systems for e.g. sugars (GOX0524) was
decreased. The most upregulated genes were those encoding for DNA-
starvation/stationary phase protein Dps, which is involved in system against DNA-
degradation, and bacterioferritin for iron storage. In conclusion, an acidic pH evokes
systems against DNA-degradation and leads to storage of iron.
Table 12 Selected genes differently expressed (> 1.8-fold) in cells grown at pH 4 vs. genes expressed in cells grown at pH 6. Results derived from at least three independent biological experiments
Locus tag Annotation pH 4 pH 6 p-value
GOX0207 Outer membrane receptor protein 0.22 0.0022 GOX0278 Cytochrome d ubiquinol oxidase subunit I 2.22 0.0109 GOX0279 Cytochrome d ubiquinol oxidase subunit II 1.59 0.0511 GOX0524 Outer membrane receptor protein 0.19 0.0086 GOX0707 DNA-starvation/stationary phase protein Dps 3.47 0.0421 GOX0756 Alcohol dehydrogenase 15 kDa subunit 1.83 0.0151 GOX0907 Outer membrane receptor protein 0.33 0.0020 GOX0945 Outer membrane receptor protein 0.39 0.0236 GOX1017 Outer membrane receptor protein 0.31 0.0048 GOX1138 Catalase 2.10 0.0016 GOX1173 Outer membrane heme receptor 0.40 0.0490 GOX1336 Isocitrate dehydrogenase 0.45 0.0227 GOX1441 Uncharacterized PQQ-dependent dehydrogenase 3 1.82 0.0190 GOX1748 Bacterioferritin 3.37 0.0020 GOX1857 Uncharacterised PQQ-containing dehydrogenase 1 0.40 0.0099 GOX1903 TonB-dependent receptor protein 0.42 0.0004
The cellular changes, which occur during the transition from phase I to phase II
during growth on glucose in G. oxydans, are not fully understood yet. In order to
throw light on the regulatory mechanisms leading to the phenotype of biphasic
growth and oxidation during growth on glucose, genome-wide transcription analysis
was performed in the wild type. For this DNA array experiment, cells were cultivated
on glucose and cells were harvested during growth phase I and growth phase II.
Since G. oxydans shows biphasic growth behaviour when cultivated on glucose
(Fig. 22), the cells were harvested at different growth phases. Growth phase-

IV Results
59
0
2
4
6
8
10
0 10 20 30Time [h]
OD
600
nm
dependent changes in mRNA-levels increased the response to the regulation, which
occurred during transition from phase I to phase II, explaining the strong response of
downregulation of 332 genes whereas 276 genes showed upregulated mRNA levels.
Table 13 shows a functional grouping of some selected genes according to Prust et
al. 2005. Many of these genes with altered mRNA-levels are involved in electron
transport and energy supply, cellular transport processes or amino acid metabolism.
Nearly all genes involved in gluconeogenesis, pentose phosphate pathway and
Entner-Doudoroff pathway were upregulated (Table 13, 14), indicating for an
enhanced sugar metabolism in phase II. The cytochrome bc1 complex genes were
not regulated, although the deletion mutant devoid of the complex showed retardet
growth in growth phase II.
Fig. 22 Growth of G. oxydans 621H on 80 g l-1 glucose at pH 6 and oxygen supply DO = 15%. Arrows: time-point of cell harvest for isolation of mRNA
Table 13 Number of up- and downregulated genes (≥1.8-fold change) in gene groups as defined by Prust et al. 2005 under the condition growth phase II/growth phase I during growth on glucose. Cells grown with glucose, growth phase II (carbon source gluconate) compared to growth phase I (carbon source glucose)
Gene group / function
Number of genes regulated
up down Amino acid metabolism 7 24 Biosynthesis of cofactors 4 6 Fatty acid biosynthesis/degradation 1 12 Cell envelope 3 13 Cell motility 5 0 Cell division 3 7 Detoxification 3 1 Signal transduction 3 3 Phosphate & sulphate 0 3 Nucleotide metabolism 1 9
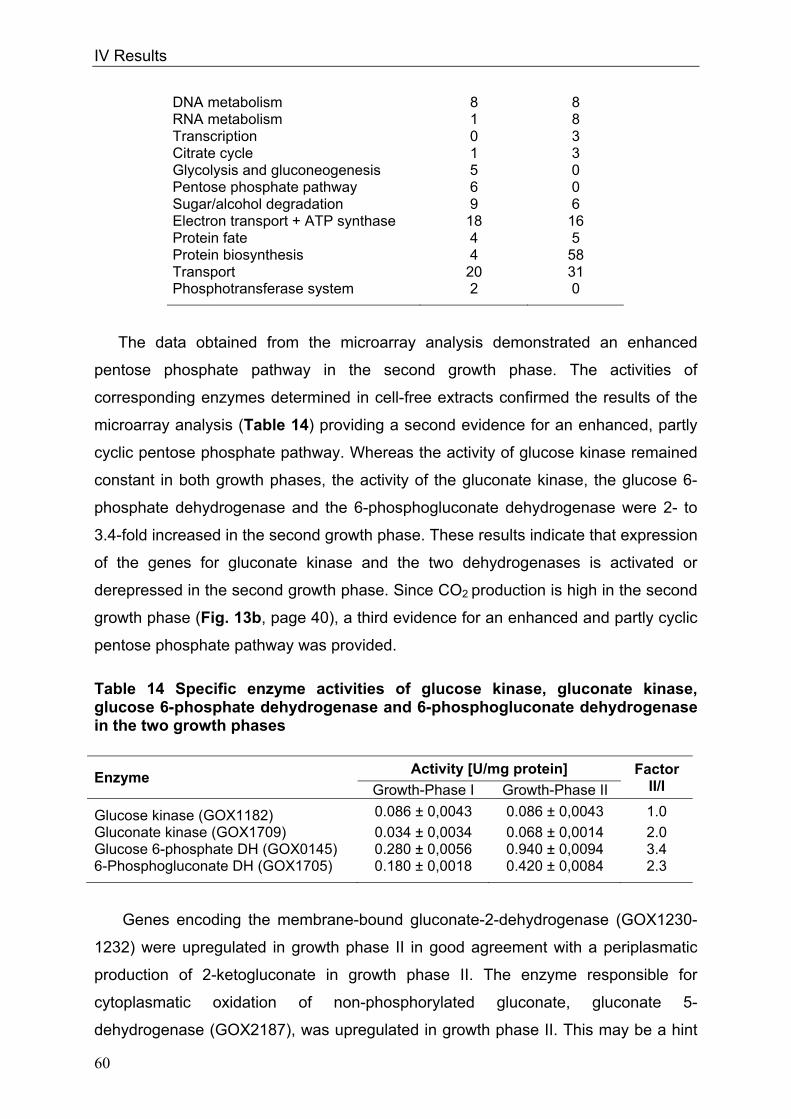
IV Results
60
DNA metabolism 8 8 RNA metabolism 1 8 Transcription 0 3 Citrate cycle 1 3 Glycolysis and gluconeogenesis 5 0 Pentose phosphate pathway 6 0 Sugar/alcohol degradation 9 6 Electron transport + ATP synthase 18 16 Protein fate 4 5 Protein biosynthesis 4 58 Transport 20 31 Phosphotransferase system 2 0
The data obtained from the microarray analysis demonstrated an enhanced
pentose phosphate pathway in the second growth phase. The activities of
corresponding enzymes determined in cell-free extracts confirmed the results of the
microarray analysis (Table 14) providing a second evidence for an enhanced, partly
cyclic pentose phosphate pathway. Whereas the activity of glucose kinase remained
constant in both growth phases, the activity of the gluconate kinase, the glucose 6-
phosphate dehydrogenase and the 6-phosphogluconate dehydrogenase were 2- to
3.4-fold increased in the second growth phase. These results indicate that expression
of the genes for gluconate kinase and the two dehydrogenases is activated or
derepressed in the second growth phase. Since CO2 production is high in the second
growth phase (Fig. 13b, page 40), a third evidence for an enhanced and partly cyclic
pentose phosphate pathway was provided.
Table 14 Specific enzyme activities of glucose kinase, gluconate kinase, glucose 6-phosphate dehydrogenase and 6-phosphogluconate dehydrogenase in the two growth phases
Genes encoding the membrane-bound gluconate-2-dehydrogenase (GOX1230-
1232) were upregulated in growth phase II in good agreement with a periplasmatic
production of 2-ketogluconate in growth phase II. The enzyme responsible for
cytoplasmatic oxidation of non-phosphorylated gluconate, gluconate 5-
dehydrogenase (GOX2187), was upregulated in growth phase II. This may be a hint
Enzyme Activity [U/mg protein] Factor
II/I Growth-Phase I Growth-Phase II
Glucose kinase (GOX1182) 0.086 ± 0,0043 0.086 ± 0,0043 1.0
Gluconate kinase (GOX1709) 0.034 ± 0,0034 0.068 ± 0,0014 2.0 Glucose 6-phosphate DH (GOX0145) 0.280 ± 0,0056 0.940 ± 0,0094 3.4 6-Phosphogluconate DH (GOX1705) 0.180 ± 0,0018 0.420 ± 0,0084 2.3

IV Results
61
that gluconate was taken up in phase II leading to an enhanced cytoplasmatic
oxidation of the substrate (Table 15). Interestingly, the two dehydrogenases for
sorbitol oxidation were contrarily regulated in the two growth phases on glucose. The
PQQ-containing major polyol dehydrogenase was upregulated whereas the FAD-
dependent enzyme, which is not functional in G. oxydans due to a frame shift (Prust
et al. 2005), was downregulated. The upregulation of the major polyol
dehydrogenase in growth phase II is in good agreement with an enhanced production
of 5-ketogluconate in phase II since the major polyol dehydrogenase is the
responsible enzyme for periplasmatic 5-ketogluconate production (Weenk et al.
1984).
In growth phase II genes encoding for the two ATP synthases, the
transhydrogenase and the ubiquinol bd oxidase showed the same regulation pattern
as in oxygen-limited cells leading to the assumption, that the transcription of these
genes was subject to a common underlying condition in the two DNA microarray
experiments. In both experimental setups, oxygen limitation and glucose metabolism,
growth phase differences existed between the cells which were harvested for the
corresponding mRNA-isolations. The identical regulation pattern of genes under the
two conditions, indicated that their regulation was partly due to growth decrease
causing stress (Wagner et al. 2009). The induction of genes encoding RNA
polymerase factor sigma-32, a small heat shock protein (sHsp), and the chaperone
DnaK was surprising in gluconate grown G. oxydans. As it is known that there are
several unfavourable growth conditions that provoke heat shock response, e.g. heat,
cold, salt, drought, osmotic and oxidative stresses (Jiang et al. 2009, Parsell et al.
1989; van Bogelen et al. 1996), the upregulation of genes encoding RNA polymerase
factor sigma-32, sHsp, and DnaK is maybe an indication for a stress situation in
growth phase II. In G. oxydans the gene encoding superoxide dismutase was
upregulated 3.5-fold in gluconate grown cells, indicating oxidative stress under this
condition. A direct explanation, why cells in growth phase II should be affected by
oxygen stress is not clear. Nevertheless, the data described here indicate a stress
situation, which is probably oxidative stress. Furthermore, the strong sigma-32
dependent induction of a small heat shock protein (sHSP) and of the chaperone
DnaK (Hsp70) in G. oxydans was a consequence of the increased sigma-32 protein
level. In E. coli, the sigma-32 regulon is essential for growth and cell division and
highly responsive to growth phases (Wagner et al. 2009). Thus, the change from an
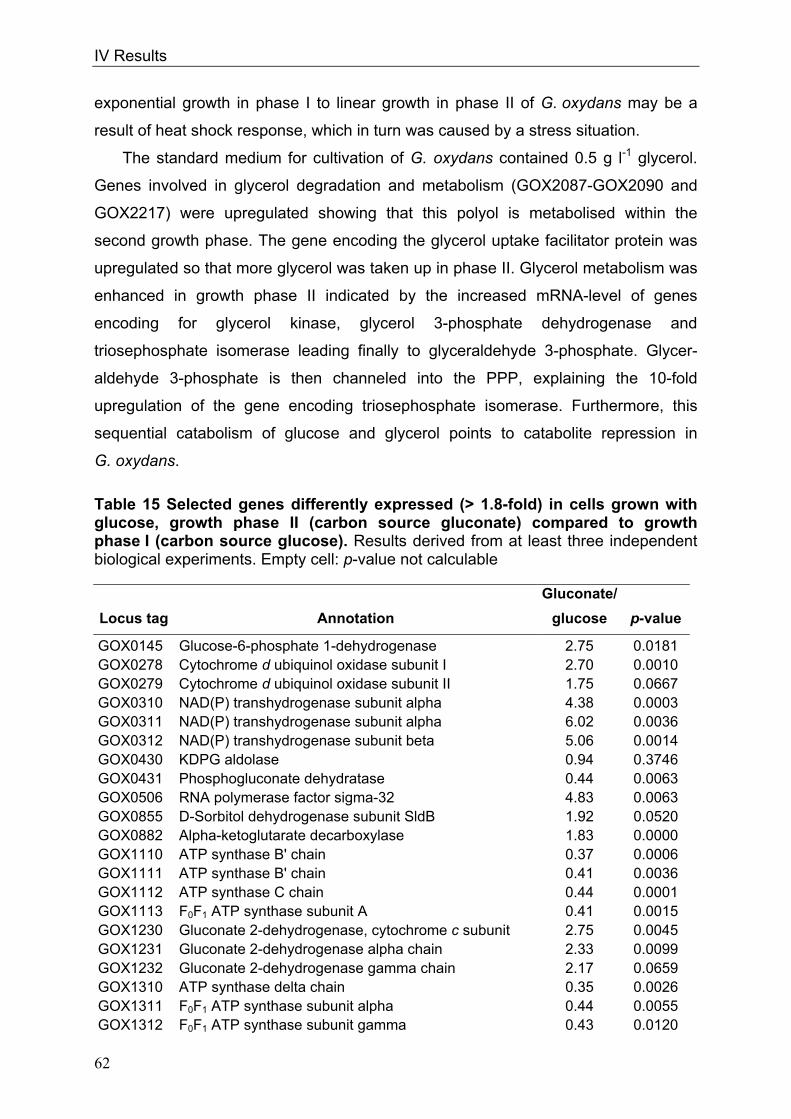
IV Results
62
exponential growth in phase I to linear growth in phase II of G. oxydans may be a
result of heat shock response, which in turn was caused by a stress situation.
The standard medium for cultivation of G. oxydans contained 0.5 g l-1 glycerol.
Genes involved in glycerol degradation and metabolism (GOX2087-GOX2090 and
GOX2217) were upregulated showing that this polyol is metabolised within the
second growth phase. The gene encoding the glycerol uptake facilitator protein was
upregulated so that more glycerol was taken up in phase II. Glycerol metabolism was
enhanced in growth phase II indicated by the increased mRNA-level of genes
encoding for glycerol kinase, glycerol 3-phosphate dehydrogenase and
triosephosphate isomerase leading finally to glyceraldehyde 3-phosphate. Glycer-
aldehyde 3-phosphate is then channeled into the PPP, explaining the 10-fold
upregulation of the gene encoding triosephosphate isomerase. Furthermore, this
sequential catabolism of glucose and glycerol points to catabolite repression in
G. oxydans.
Table 15 Selected genes differently expressed (> 1.8-fold) in cells grown with glucose, growth phase II (carbon source gluconate) compared to growth phase I (carbon source glucose). Results derived from at least three independent biological experiments. Empty cell: p-value not calculable
Locus tag Annotation
Gluconate/
glucose p-value
GOX0145 Glucose-6-phosphate 1-dehydrogenase 2.75 0.0181 GOX0278 Cytochrome d ubiquinol oxidase subunit I 2.70 0.0010 GOX0279 Cytochrome d ubiquinol oxidase subunit II 1.75 0.0667 GOX0310 NAD(P) transhydrogenase subunit alpha 4.38 0.0003 GOX0311 NAD(P) transhydrogenase subunit alpha 6.02 0.0036 GOX0312 NAD(P) transhydrogenase subunit beta 5.06 0.0014 GOX0430 KDPG aldolase 0.94 0.3746 GOX0431 Phosphogluconate dehydratase 0.44 0.0063 GOX0506 RNA polymerase factor sigma-32 4.83 0.0063 GOX0855 D-Sorbitol dehydrogenase subunit SldB 1.92 0.0520 GOX0882 Alpha-ketoglutarate decarboxylase 1.83 0.0000 GOX1110 ATP synthase B' chain 0.37 0.0006 GOX1111 ATP synthase B' chain 0.41 0.0036 GOX1112 ATP synthase C chain 0.44 0.0001 GOX1113 F0F1 ATP synthase subunit A 0.41 0.0015 GOX1230 Gluconate 2-dehydrogenase, cytochrome c subunit 2.75 0.0045 GOX1231 Gluconate 2-dehydrogenase alpha chain 2.33 0.0099 GOX1232 Gluconate 2-dehydrogenase gamma chain 2.17 0.0659 GOX1310 ATP synthase delta chain 0.35 0.0026 GOX1311 F0F1 ATP synthase subunit alpha 0.44 0.0055 GOX1312 F0F1 ATP synthase subunit gamma 0.43 0.0120
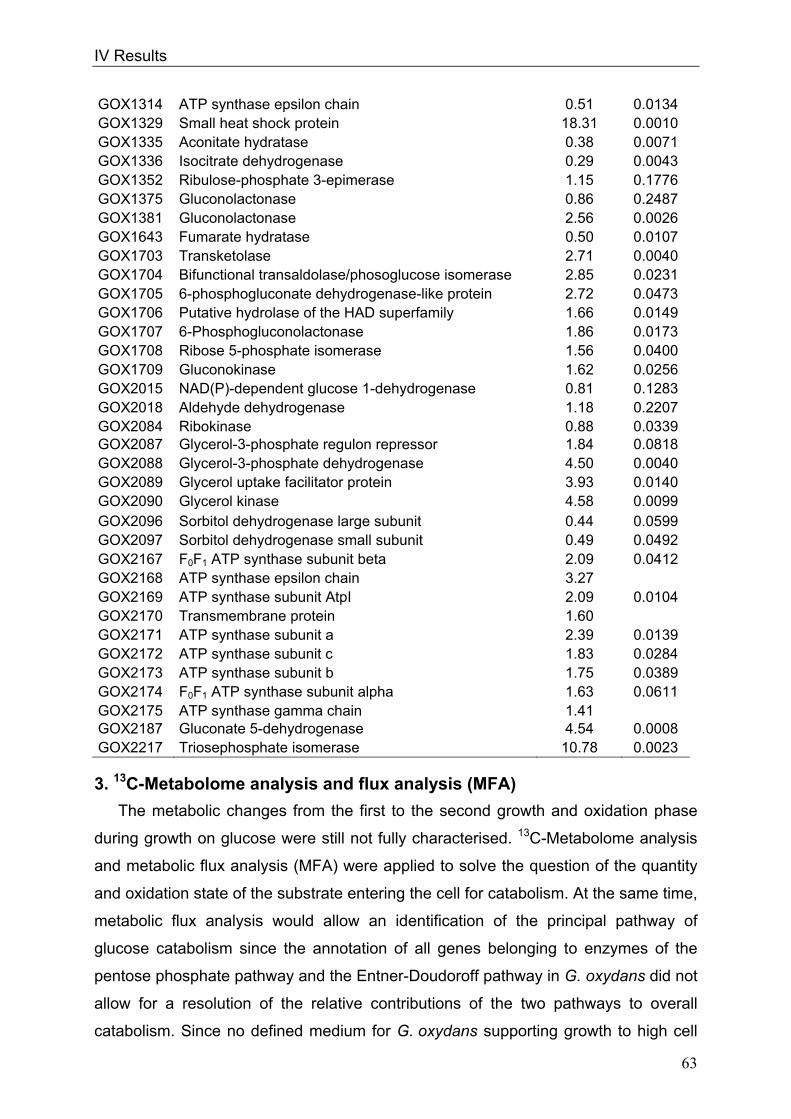
IV Results
63
GOX1314 ATP synthase epsilon chain 0.51 0.0134 GOX1329 Small heat shock protein 18.31 0.0010 GOX1335 Aconitate hydratase 0.38 0.0071 GOX1336 Isocitrate dehydrogenase 0.29 0.0043 GOX1352 Ribulose-phosphate 3-epimerase 1.15 0.1776 GOX1375 Gluconolactonase 0.86 0.2487 GOX1381 Gluconolactonase 2.56 0.0026 GOX1643 Fumarate hydratase 0.50 0.0107 GOX1703 Transketolase 2.71 0.0040 GOX1704 Bifunctional transaldolase/phosoglucose isomerase 2.85 0.0231 GOX1705 6-phosphogluconate dehydrogenase-like protein 2.72 0.0473 GOX1706 Putative hydrolase of the HAD superfamily 1.66 0.0149 GOX1707 6-Phosphogluconolactonase 1.86 0.0173 GOX1708 Ribose 5-phosphate isomerase 1.56 0.0400 GOX1709 Gluconokinase 1.62 0.0256 GOX2015 NAD(P)-dependent glucose 1-dehydrogenase 0.81 0.1283 GOX2018 Aldehyde dehydrogenase 1.18 0.2207 GOX2084 Ribokinase 0.88 0.0339 GOX2087 Glycerol-3-phosphate regulon repressor 1.84 0.0818 GOX2088 Glycerol-3-phosphate dehydrogenase 4.50 0.0040 GOX2089 Glycerol uptake facilitator protein 3.93 0.0140 GOX2090 Glycerol kinase 4.58 0.0099 GOX2096 Sorbitol dehydrogenase large subunit 0.44 0.0599 GOX2097 Sorbitol dehydrogenase small subunit 0.49 0.0492 GOX2167 F0F1 ATP synthase subunit beta 2.09 0.0412 GOX2168 ATP synthase epsilon chain 3.27 GOX2169 ATP synthase subunit AtpI 2.09 0.0104 GOX2170 Transmembrane protein 1.60 GOX2171 ATP synthase subunit a 2.39 0.0139 GOX2172 ATP synthase subunit c 1.83 0.0284 GOX2173 ATP synthase subunit b 1.75 0.0389 GOX2174 F0F1 ATP synthase subunit alpha 1.63 0.0611 GOX2175 ATP synthase gamma chain 1.41 GOX2187 Gluconate 5-dehydrogenase 4.54 0.0008 GOX2217 Triosephosphate isomerase 10.78 0.0023
3. 13C-Metabolome analysis and flux analysis (MFA)
The metabolic changes from the first to the second growth and oxidation phase
during growth on glucose were still not fully characterised. 13C-Metabolome analysis
and metabolic flux analysis (MFA) were applied to solve the question of the quantity
and oxidation state of the substrate entering the cell for catabolism. At the same time,
metabolic flux analysis would allow an identification of the principal pathway of
glucose catabolism since the annotation of all genes belonging to enzymes of the
pentose phosphate pathway and the Entner-Doudoroff pathway in G. oxydans did not
allow for a resolution of the relative contributions of the two pathways to overall
catabolism. Since no defined medium for G. oxydans supporting growth to high cell

IV Results
64
density was available, we used a complex medium for allocation of cell mass. Then,
establishment of the 13C-metabolome was by analysis of the metabolic intermediates
rather than by amino acids analysis (Wiechert 2001, Zamboni et al. 2009).
Cells were harvested during the first and the second growth phase on labeled
glucose (4.0% “natural” glucose, 7.7% 1-13C-glucose, and 88.3% U-13C) (for
reference of cell growth on glucose pH 6, see Fig. 12a, page 39). Two independent
cultures grown with 13C-labeled glucose showed identical growth behavior and
substrate oxidation rates as the reference culture cultivated with natural glucose.
Biomass production in the second growth phase was only one fourth (0.38 g l-1 CDW)
of that of the first growth phase (1.5 g l-1 CDW), although the concentration of
accumulated gluconate (which then was used for energy supply and biomass
formation in the second growth phase) was more than two thirds of the initial 80 g l-1
glucose concentration. Therefore, in phase II a theoretical biomass formation of two
thirds of the biomass formation in phase I was possible. This was not the case,
allowing the conclusion that oxidation of glucose is more efficient with respect to
biomass production.
A reference culture with natural glucose showed the de facto CO2 production,
since short cell infrared detectors as used in the DasGip fermentation system
quantify 13CO2 not correctly (Fig. 23) (Hirano et al. 1979). In contrast to the identical
total oxygen consumption in phases I and II, the total CO2 production in phase II was
5.7-fold higher than in phase I. The increased CO2 production in the second growth
phase was not proportional to cell growth (which decreased in growth phase II when
CO2 production increased), indicating that metabolic activities were varying over time,
i.e. the cells were in a state of metabolic non-stationarity (Fig. 23). Since metabolic
stationarity is a prerequisite for metabolic flux analysis (Wiechert and Nöh 2005), the
sample taken in the second growth was included in the LC-MS analysis, but excluded
from flux analysis.
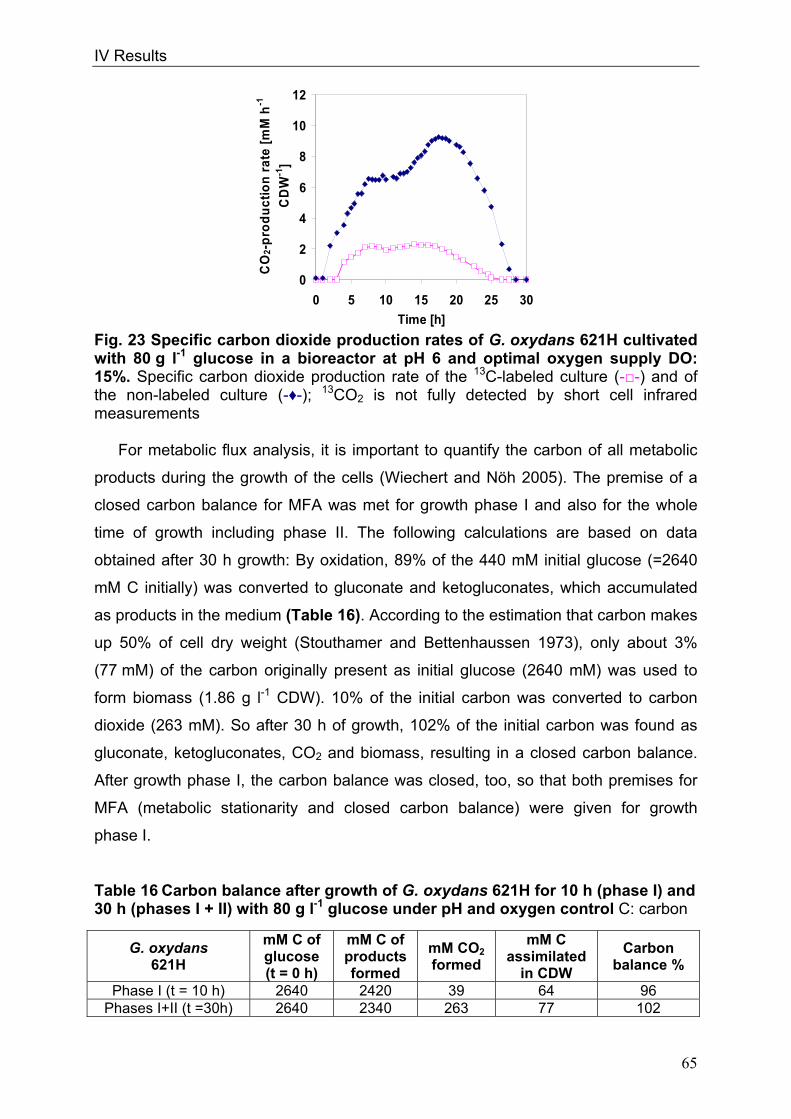
IV Results
65
0
2
4
6
8
10
12
0 5 10 15 20 25 30
Time [h]
CO
2-p
rod
uc
tio
n r
ate
[m
M h
-1
CD
W-1
]
Fig. 23 Specific carbon dioxide production rates of G. oxydans 621H cultivated with 80 g l-1 glucose in a bioreactor at pH 6 and optimal oxygen supply DO: 15%. Specific carbon dioxide production rate of the 13C-labeled culture (--) and of the non-labeled culture (-♦-); 13CO2 is not fully detected by short cell infrared measurements
For metabolic flux analysis, it is important to quantify the carbon of all metabolic
products during the growth of the cells (Wiechert and Nöh 2005). The premise of a
closed carbon balance for MFA was met for growth phase I and also for the whole
time of growth including phase II. The following calculations are based on data
obtained after 30 h growth: By oxidation, 89% of the 440 mM initial glucose (=2640
mM C initially) was converted to gluconate and ketogluconates, which accumulated
as products in the medium (Table 16). According to the estimation that carbon makes
up 50% of cell dry weight (Stouthamer and Bettenhaussen 1973), only about 3%
(77 mM) of the carbon originally present as initial glucose (2640 mM) was used to
form biomass (1.86 g l-1 CDW). 10% of the initial carbon was converted to carbon
dioxide (263 mM). So after 30 h of growth, 102% of the initial carbon was found as
gluconate, ketogluconates, CO2 and biomass, resulting in a closed carbon balance.
After growth phase I, the carbon balance was closed, too, so that both premises for
MFA (metabolic stationarity and closed carbon balance) were given for growth
phase I.
Table 16 Carbon balance after growth of G. oxydans 621H for 10 h (phase I) and 30 h (phases I + II) with 80 g l-1 glucose under pH and oxygen control C: carbon
G. oxydans 621H
mM C of glucose (t = 0 h)
mM C of products
formed
mM CO2
formed
mM C assimilated
in CDW
Carbon balance %
Phase I (t = 10 h) 2640 2420 39 64 96 Phases I+II (t =30h) 2640 2340 263 77 102
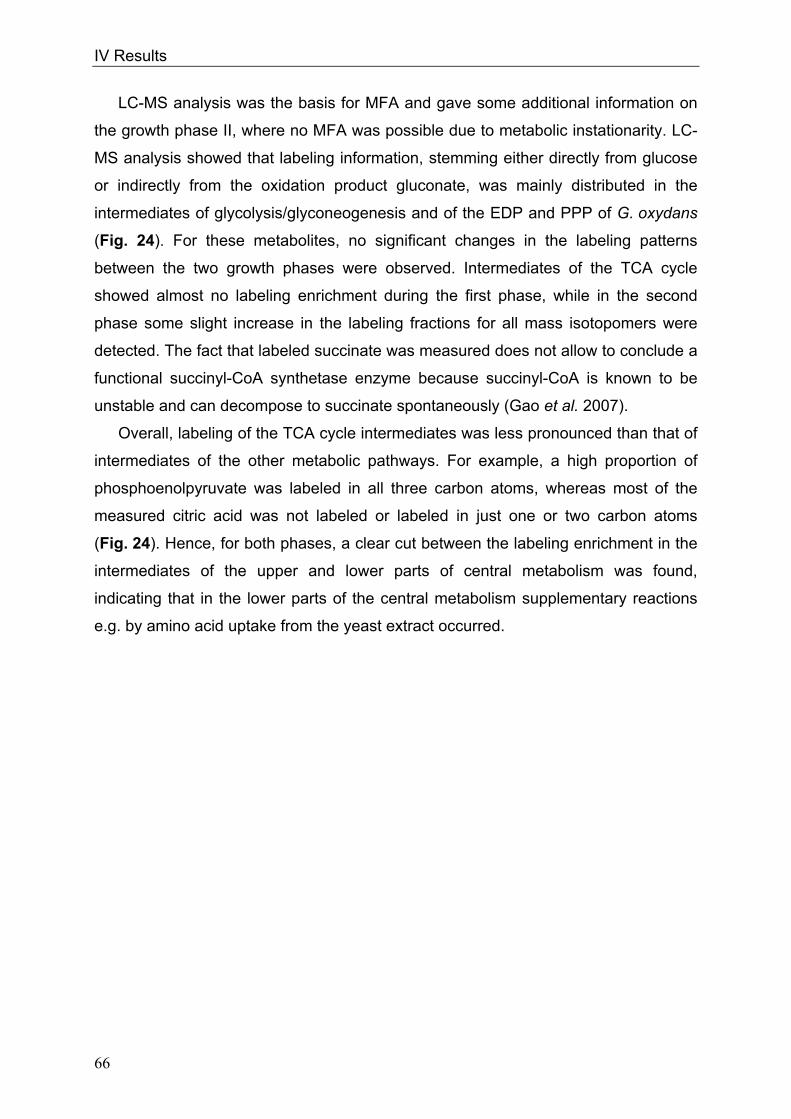
IV Results
66
LC-MS analysis was the basis for MFA and gave some additional information on
the growth phase II, where no MFA was possible due to metabolic instationarity. LC-
MS analysis showed that labeling information, stemming either directly from glucose
or indirectly from the oxidation product gluconate, was mainly distributed in the
intermediates of glycolysis/glyconeogenesis and of the EDP and PPP of G. oxydans
(Fig. 24). For these metabolites, no significant changes in the labeling patterns
between the two growth phases were observed. Intermediates of the TCA cycle
showed almost no labeling enrichment during the first phase, while in the second
phase some slight increase in the labeling fractions for all mass isotopomers were
detected. The fact that labeled succinate was measured does not allow to conclude a
functional succinyl-CoA synthetase enzyme because succinyl-CoA is known to be
unstable and can decompose to succinate spontaneously (Gao et al. 2007).
Overall, labeling of the TCA cycle intermediates was less pronounced than that of
intermediates of the other metabolic pathways. For example, a high proportion of
phosphoenolpyruvate was labeled in all three carbon atoms, whereas most of the
measured citric acid was not labeled or labeled in just one or two carbon atoms
(Fig. 24). Hence, for both phases, a clear cut between the labeling enrichment in the
intermediates of the upper and lower parts of central metabolism was found,
indicating that in the lower parts of the central metabolism supplementary reactions
e.g. by amino acid uptake from the yeast extract occurred.
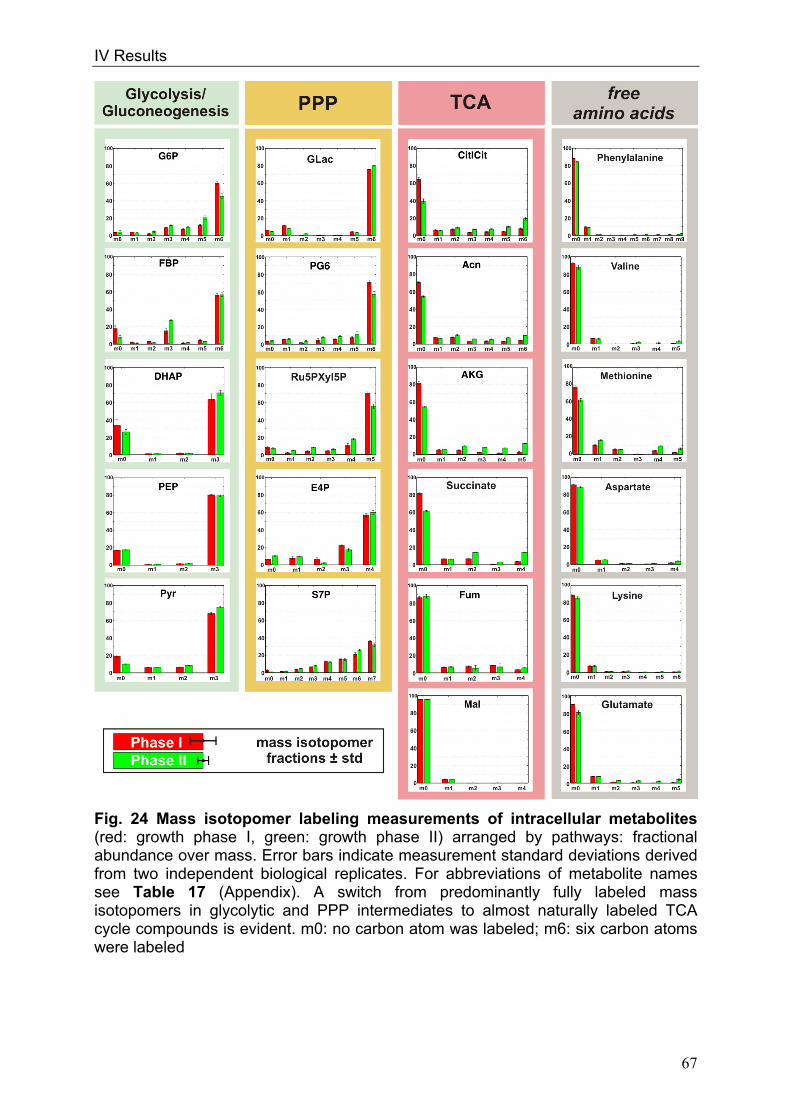
IV Results
67
Fig. 24 Mass isotopomer labeling measurements of intracellular metabolites (red: growth phase I, green: growth phase II) arranged by pathways: fractional abundance over mass. Error bars indicate measurement standard deviations derived from two independent biological replicates. For abbreviations of metabolite names see Table 17 (Appendix). A switch from predominantly fully labeled mass isotopomers in glycolytic and PPP intermediates to almost naturally labeled TCA cycle compounds is evident. m0: no carbon atom was labeled; m6: six carbon atoms were labeled
IV Results
68
Furthermore, more CO2 was measured during the growth on glucose than would
be formed by total oxidation of the glucose and/or gluconate which entered the cells.
The carbon balance of initial substrate concentration and the concentration of the
products gluconate and ketogluconate measured by HPLC-analysis, resulted in a
difference of 3 g l-1 (16.5 mM) of C-6 carbohydrates or 100 mM CO2 (total oxidation
of one C-6 carbohydrate leads to maximal 6 CO2) after 30 h of growth, stemming
from intracellular sugar oxidation under the assumption that the PPP was partly
cyclic. The analysed amount of total carbon dioxide was 263 mM after 30 h so that
160 mM surplus carbon dioxide was produced. Following the calculation, that nearly
half of the CO2 produced was not originating from central sugar metabolism
supported the result described above, that amino acids were taken up in side
reactions. A carbon balance only refers to balancing the initial glucose entering the
cells and the products formed during growth (addition of accumulating gluconate and
ketogluconate, substrate integration for biomass production and CO2). For this
reason, the additional 160 mM CO2 not stemming from the initial carbon source had
to be substracted in the carbon balance. Nevertheless, the carbon balance was not
much affected by substracting the surplus 160 mM CO2. It was still closed with 97%
after 30 h cell growth. However, the results clarified, that the high CO2 production in
growth phase II is not only due to a cyclic PPP as was assumed in the past.
Nearly all measurable amino acids were unlabeled, supporting the assumption of
uptake of amino acids from the medium, as well as the measured surplus CO2.
Indeed, qualitative determination of amino acids within the two growth phases
showed, that Asp, Gly, Thr, Val, Phe, Ile and Ieu were mainly consumed during the
transition from growth phase I into phase II (8 h to 14.5 h). In total, Glu, Asn, Ser and
Ala were also used during the whole growth time. Exhaustion of amino acids could be
one reason for the decreased growth in the second growth phase. However, increase
of the concentration of yeast extract from 5 g l-1 to 15 g l-1 did not result in increased
growth during the second growth phase so that a limitation of amino acids was
excluded as an explanation for the decreased cell growth in phase II. On the
contrary, the time point of transition from the first to the second growth phase did not
change and cell growth was not enhanced in growth phase II, showing that the
growth in phase II is mainly dependent from the sugar concentration. The point of
time of total glucose oxidation determines the point of time of the beginning of
decreased growth.
IV Results
69
Based on the 13C metabolome analysis, a flux analysis was only possible for the
first growth phase (Fig. 25). Intracellular fluxes were estimated using the extracellular
flux measurements, like accumulation rates of gluconate and ketogluconates in the
medium, and the 13C metabolite labeling data of sample point I in growth phase I.
Repeated flux estimation with randomly chosen initial values for all independent
fluxes showed good and reproducible agreement of measurements and model
predictions for all reactions of the EMP, PPP and EDP. The model showed that
almost all glucose (96.87%) was directly oxidised by the membrane-bound glucose
dehydrogenase to gluconate, which to some extent was further oxidised to
ketogluconates by the major polyol dehydrogenase (g5dh) and gluconate-2-DH
(g2dh) (together 13.81%). 83.04% of the gluconate accumulated in the medium
instead of being further oxidised in growth phase I. Based on the model, a small
amount (3.13%) of glucose was taken up by the cells. These 3.13% were converted
to gluconate by the cytoplasmic glucose dehydrogenase (gdh3) and
gluconolactonase (gdh4). Additionally, PPP was calculated in the model to be cyclic,
so that glucose 6-phosphate was formed without a net flux from glucose to glucose 6-
phosphate. In contrast, the model showed a flux from glucose 6-phosphate to
glucose (1.23%), which was added to the flux from glucose to gluconate resulting in a
total net flux of 4.36% from glucose to gluconate. The intracellular gluconate was
phosphorylated by gluconate kinase (glcnk) so that the model calculated a net flux of
3.36% for that reaction. A part of the gluconate was further oxidised cytoplasmatically
by the gluconate 5-dehydrogenase, so that a net flux of 1.02% was calculated. The
5-ketogluconate was then contributing to the ketogluconate in the medium due to an
export of 5-ketogluconate from the cytoplasm to the medium via the periplasm
(1.02%).
The cytoplasmatic glucose 6-phosphate was channeled into the PPP and the
lower part of the glycolysis as was demonstrated by the model. Due to the calculated
cyclic operation of the PPP, a net flux of 1.29% from glucose 6-phosphate to 6-
phosphogluconate was added to the flux of 3.36% coming from the phosphorylation
reaction of gluconate to 6-phosphogluconate and so a net flux of 4.38% from 6-
phosphogluconate to ribulose 5-phosphate was calculated. A small net flux of 0.28%
from 6-phosphogluconate to 2-keto-3-deoxygluconate 6-phosphate (KDPG) showed,
that the Entner-Doudoroff pathway was nearly inactive during growth phase I.
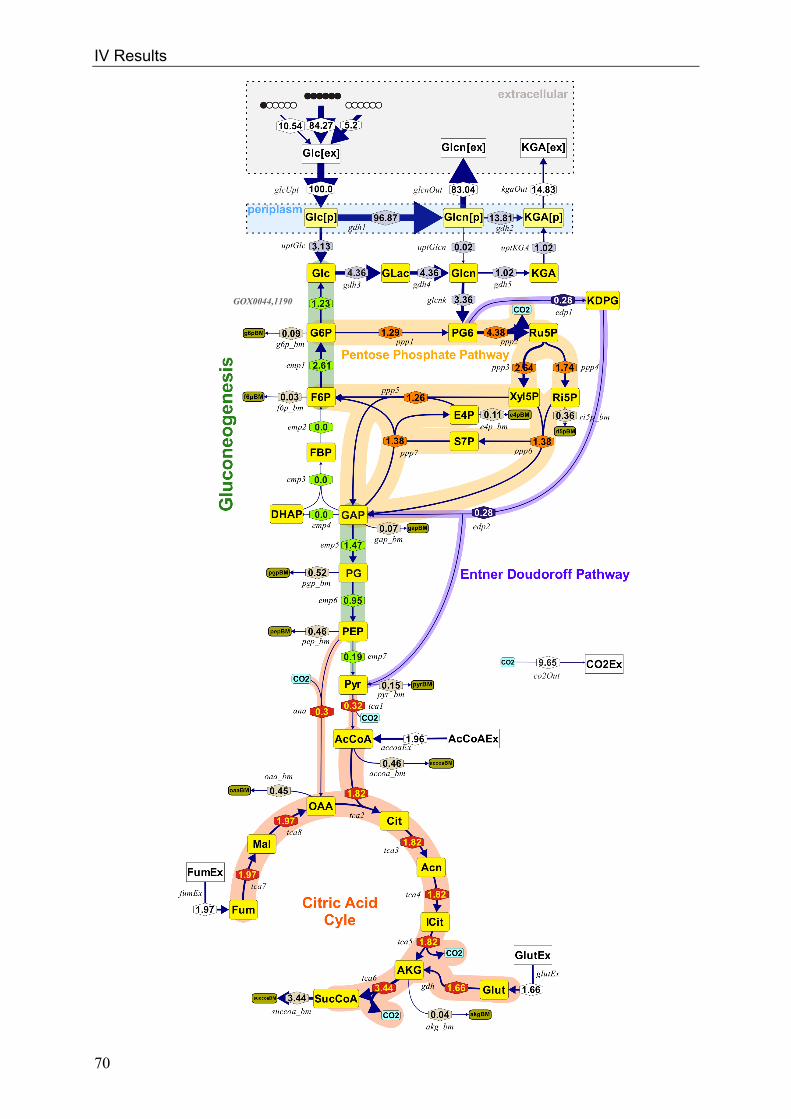
IV Results
70
GOX0044,1190

IV Results
71
Fig. 25 In vivo flux distribution of G. oxydans 621H during growth with glucose (growth phase I). Main metabolic pathways that were in the focus of the 13C-MFA study proceed in two compartments, periplasm and cytosol. All mass balanced metabolites are represented by rectangles (yellow: central metabolism, white: carbon sources, dark yellow: carbon sinks). Fluxes into biomass synthesis are in stone. Flux values (hexagons) are related to 100% glucose uptake (glcUpt) where a mixture of naturally labeled, 1-13C and U-13C labeled glucose is exposed. The width of each flux edge is scaled proportional to its underlying value; flux arrows are pointing in net flux direction. For abbreviations of flux and metabolite names used in the model see Table 17 (Appendix) (GOX0044: Phosphomannomutase; GOX1190: Glucose-1-phosphatase). The picture was generated with Omix - an editor for biochemical network visualization [http://www.13cflux.net/omix]. PG: 1,3 bisphosphoglycerate, 3-phospoglycerate and 2-phosphoglycertae are lumped.
From the ribulose 5-phosphate, a net flux of 2.64% to xylulose 5-phosphate was
calculated, whereas only 1.74% were converted to ribose 5-phosphate. That
indicates that the ribulose 5-phosphate epimerase is more active than the ribulose 5-
phosphate isomerase.The operations of the PPP and the EDP resulted in formation
of fructose 6-phosphate, gyceraldehyde 3-phosphate and pyruvate. High fluxes for
transaldolase (ppp7, 1.38%) and transketolase (ppp5, 1.26%) in the direction of
fructose 6-phosphate formation and a high flux for glucose 6-phosphate isomerase
(emp1, 2.61%) explain the formation of glucose 6-phosphate (Fig. 25) and show the
cyclic operation of the PPP. According to the model, no flux was calculated for
triosephosphate isomerase, fructose bisphosphatase and fructose-1.6-diphosphate
aldolase. The model-predicted formation of unphosphorylated glucose from glucose
6-phosphate can be catalysed by phosphomannomutase (GOX0044) and glucose 1-
phosphatase (GOX1190).
The model calculated a net flux of 1.47% from glyceraldehyde 3-phosphate to
phosphoglycerate. Due to net fluxes into biomass, further fluxes to phosphoenol
pyruvate (PEP) and subsequent pyruvate decreased. Since a net flux from KDGP of
0.28% to pyruvate via the 2-keto-3-deoxygluconate 6-phosphate aldolase (edp2) was
added to the 0.19% carbon flux, which were channelled to pyruvate via the pyruvate
kinase, a net flux of 0.32% from pyruvate to acetyl-CoA was possible. For the
anaplerotic reaction from PEP to oxaloacetate, a net flux of 0.3% was estimated.
Although less labeling information was present in intermediates of the citric acid cycle
(TCA), a calculation of net fluxes in this part of the metabolism was possible
assuming additional fluxes of acetyl-CoA, fumerate and glutamate predicted by the
model. Those model based additional fluxes were in the range of about 2% each.
Therefore, the model supported the idea of additional uptake reactions based on e.g.
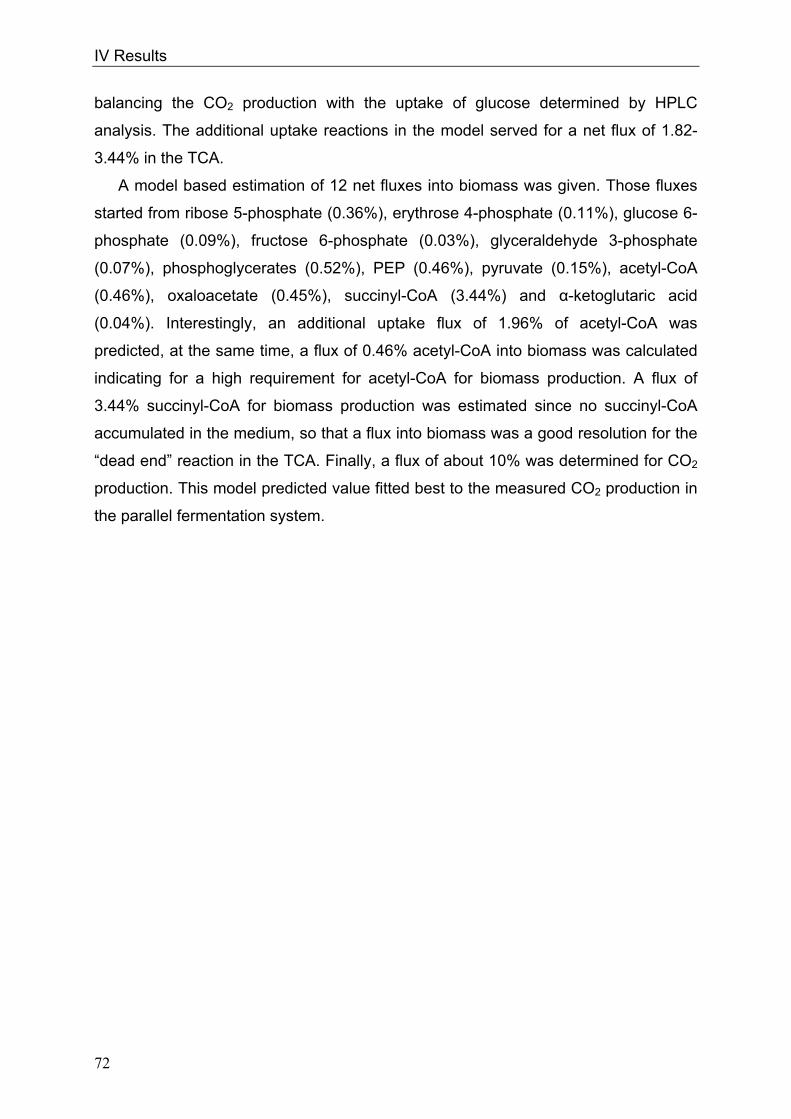
IV Results
72
balancing the CO2 production with the uptake of glucose determined by HPLC
analysis. The additional uptake reactions in the model served for a net flux of 1.82-
3.44% in the TCA.
A model based estimation of 12 net fluxes into biomass was given. Those fluxes
started from ribose 5-phosphate (0.36%), erythrose 4-phosphate (0.11%), glucose 6-
phosphate (0.09%), fructose 6-phosphate (0.03%), glyceraldehyde 3-phosphate
(0.07%), phosphoglycerates (0.52%), PEP (0.46%), pyruvate (0.15%), acetyl-CoA
(0.46%), oxaloacetate (0.45%), succinyl-CoA (3.44%) and α-ketoglutaric acid
(0.04%). Interestingly, an additional uptake flux of 1.96% of acetyl-CoA was
predicted, at the same time, a flux of 0.46% acetyl-CoA into biomass was calculated
indicating for a high requirement for acetyl-CoA for biomass production. A flux of
3.44% succinyl-CoA for biomass production was estimated since no succinyl-CoA
accumulated in the medium, so that a flux into biomass was a good resolution for the
“dead end” reaction in the TCA. Finally, a flux of about 10% was determined for CO2
production. This model predicted value fitted best to the measured CO2 production in
the parallel fermentation system.
V Discussion
73
V Discussion
1. Analysis of physiological and metabolic functions of the cytochrome bc1 complex in G. oxydans
G. oxydans with its numerous membrane-bound dehydrogenases offers various
promising perspectives for industrial use of the organism (Campbell et al. 2000,
Schedel 2000, Claret et al. 1994). Many of these dehydrogenases have been studied
in the last decades (Matsushita et al 1989, 1991), and in 2005 genome sequencing
disclosed new dehydrogenases for prospective industrial use (Deppenmeier and
Ehrenreich 2009). To almost the same extent both of the two terminal oxidases,
ubiquinol bd and bo3 have been the targets of intensive investigations for
understanding their contribution to the energy supply of G. oxydans (Matsushita et al.
1989). Before genome sequencing the existence of a third pathway for electron
transport via the cytochrome bc1 complex remained undetected in G. oxydans.
However, in the present work deletion of the genes encoding the cytochrome bc1
complex was successful giving the opportunity to attain insight into its role for e.g. the
energy supply of the cells via phenotyping of the mutant.
With mannitol as carbon source and under optimal growth conditions in a
bioreactor system, the deletion mutant showed the same growth rate, substrate
consumption, product formation and oxidation pattern like the wild type. Hence, the
conditions, under which the cytochrome bc1 complex is necessary in G. oxydans, had
to be elucidated. A possible function of the complex is protection against oxidative
stress, due to the presence of a periplasmatic cytochrome c peroxidase (CCP). This
enzyme accepts electrons from reduced cytochrome c for reduction of H2O2 to water
(Atack and Kelly 2007). H2O2 evolves when electrons are transferred to molecular
oxygen under formation of superoxide ions, which then are converted by superoxide
dismutase into hydrogen peroxide and oxygen (Fridovich 1978, 1995, Imlay and
Fridovich 1991). Formation of superoxide ions is a normal side-reaction of the
respiratory chain and occurs especially during cultivation under oxygen excess
(Atack and Kelly 2007). The highly active oxidoreductases in the respiratory chain of
G. oxydans most likely contribute indirectly to the production of H2O2 since they are
responsible for the high flow of electrons through the respiratory chain. Under
conditions of oxygen excess, the electrons are passed rapidly to the terminal
acceptors and to oxygen. The side reaction leading to H2O2 is enhanced

V Discussion
74
simultaneously. This side reaction was found to proceed at the NADH
dehydrogenase II (Messner and Imlay 1999). A second way for the production of
H2O2 in G. oxydans is the old yellow enzyme (Adachi et al. 1979) which reduces O2
to H2O2 under the oxidation of NADPH to NADP+.
Bacterial cytochrome c peroxidases (CCP) contain two covalently bound c-heme
types (Atack and Kelly 2007). The authors referred the CCP of G. oxydans to include
three heme-binding sites. The function of the third heme was not clarified. RT-PCR
during this work showed that transcription of the ccp-gene is enhanced in oxygen-
limited, slowly growing cells, as well as in cells cultivated under oxygen excess. Atack
and Kelly 2007 also referred an upregulation of the ccp-gene in oxygen-depleted
cells. The authors call this regulation contradictionary, since CCP is involved in
detoxification of H2O2, which is more likely present at high concentrations under
oxygen excess. The authors suggested a general upregulation of enzymes
transferring electrons to alternative electron end acceptors, such as e.g. H2O2,
fumarate or nitrate, under oxygen limitation. Since electrons are transferred not to
molecular oxygen but to the alternative terminal acceptor H2O2 by the cytochrome c
peroxidase, the upregulation of the gene encoding CCP under oxygen limitation
makes sense. Assuming, that the cytochrome bc1 complex is co-regulated with the
CCP, since it reduces its electron acceptor, the deletion mutant devoid of the
cytochrome bc1 complex was investigated under oxygen limitation.
A second motivation for the investigation of the deletion mutant under oxygen
limitation was given by the fact, that the non-proton pumping bd oxidase in oxygen-
depleted E. coli is upregulated (Tseng et al. 1995). Since the same regulation takes
place in G. oxydans, the cytochrome bc1 complex might be involved in energy supply
of the cells under conditions, when the concentration of the non-proton translocating
bd type oxidase enhances. In G. oxydans, the ubiquinol bd oxidase was also
upregulated under the condition of decreased pH-value during cultivation (Matsushita
et al. 1989). In accordance, the mRNA-level of the ubiquinol bd oxidase enhanced
under these two conditions as confirmed by microarray-analyses, whereas the
trasncritption of genes encoding the cytochrome bc1 complex was only enhanced
under oxygen limitation. However, the deletion mutant, compared to the wild type,
exhibited no differing phenotype when grown under oxygen depletion but it showed
retarded growth and oxidation parameters at pH 4. The cytochrome bc1 complex
seems to be of importance under acidic growth conditions, possibly in order to
V Discussion
75
maintain the energy supply of the cells, which is decreased by an enhanced electron
flow over the non-proton translocating ubiquinol bd oxidase (Matsushita et al. 1989).
The deletion mutant only showed a phenotype in one (decreased pH) of the two
conditions with increased ubiquinol bd oxidase. Under the condition of oxygen
limitation the function of the cytochrome bc1 complex may not manifest itself in
growth differences.
The deletion mutant produced a reddish pigment under oxygen limitation.
Difference spectra (reduced-oxidised) of the pigment showed two peaks in the range
of the cytochrome c α-absorption peak at 550 nm (Nicholls and Ferguson 2002). The
pigment was not associated with protein since it did not elute with the protein fraction
in gel chromatography and the Bradford test was negative. The heme group itself
may have absorption at longer wavelengths because the protein surroundings in
cytochromes influence the absorption of the prosthetic group heme (Mauk et al.
2009). Cytochrome c possesses a covalently bound heme group, whereas in
cytochrome b the heme is not covalently bound (Nicholls and Ferguson 2002). The
cytochromes b of the cytochrome bc1 complex have their α-absorption peaks at 560
and 566 nm. Therefore, the reddish pigment probably is the heme of the cytochromes
b or c of the cytochrome bc1 complex. The fact that hemes are hydrophobic and
therefore difficult to dissolve (Lebrun et al. 1998) was reflected by the difficult removal
of the pigment from the column. The presence of heme in the culture supernatant is
an indication that the cytochrome bc1 complex is functional under oxygen limitation.
In the deletion mutant, the heme cannot bind to its apoenzyme and accumulates in
the medium.
Interestingly, flagellin B was identified in the protein fraction of the culture
supernatant of the oxygen-limited deletion mutant. In accordance, microarray
analyses showed upregulation of many chemotaxis- and flagellum-specific genes in
oxygen-limited cells, as well as of the gene encoding flagellin B. The assembly of
flagella might be disturbed in the deletion mutant devoid of the cytochrome bc1
complex since proton motive force drives the flagellum assembly (Minamo et al.
2008).
Short time kinetics were performed to analyse the oxidation capacity of selected
oxidoreductases in the wild type and the deletion mutant devoid of the cytochrome
bc1 complex. The oxidation activities of the cell suspensions revealed unexpectedly
lower enzyme activities in the deletion mutant compared to the wild type, when
V Discussion
76
glucose or ethanol were used as substrates. In contrast, during growth on glucose in
phase I, when glucose was oxidised to gluconate, no growth differences were
observed between the two strains. During growth, different factors influence biomass
formation and oxidation activities, whereas the short time assays reflect the activity of
only a single enzyme connected to the respiratory chain. Strongest growth effects of
the deletion mutant were observed during growth on mannitol at pH 4 and gluconate
at pH 6. Mannitol oxidation at the membranes of G. oxydans is catalysed by the
major polyol dehydrogenase SLDH (Sugisawa and Hoshino 2002, Matsushita et al.
2003), whereas the oxidation of gluconate at pH 6 is catalysed by the membrane-
bound gluconate-2-dehydrogenase (Shinagawa et al. 1984). The oxidation activity of
the SLDH of the deletion mutant with mannitol as substrate showed a decrease of
44% at pH 4 and of 22% at pH 6, compared to the corresponding wild type activities.
Here, the short time kinetics and the growth behaviour correlated since at pH 6 little
differences in oxidation capacity and growth behaviour of the two strains was
observed.
Two additional observations were made by comparing growth of the deletion
mutant and the wild type as well as their oxidation capacities in the Clark electrode. I)
when gluconate was used as substrate for oxidation at pH 6 via the gluconate-2-
dehydrogenase, activity measurements with the Clark electrode showed a decrease
of 34% of the mutant’s activity compared to that of the wild type. Growth was also
decreased compared to the wild type. II) At pH 6 with glucose and glucose
dehydrogenase as corresponding enzyme, the mutant showed a decrease of 39% of
oxidative activity but this strong decrease was not paralleled by differences in growth
parameters of the deletion mutant and the wild type. Therefore, a decrease in the
oxidation capacity of the deletion mutant did not necessarily result in a growth defect
of the mutant. In conclusion, the decreased growth of gluconate grown mutant cells
cannot only be attributed to a decreased activity of the gluconate-2-dehydrogenase.
The fact, that in the mutant the oxidation rates of ADH and mGDH showed the
highest decrease in the deletion mutant pointed to an interaction between the
cytochrome bc1 complex and the ADH. The argumentation that interactions between
components of the respiratory chain of G. oxydans must exist has also been
discussed in the literature. Soemphol et al. 2008 reported an interaction between the
ubiquinol bd oxidase with the FAD-dependent sorbitol dehydrogenase and a
connection of the ubiquinol bo3 oxidase with the PQQ-dependent sorbitol
V Discussion
77
dehydrogenase in G. frateurii. Matsushita et al. 1991 suggested that the cytochrome
c subunit II of the ADH was an integral part of the respiratory chain of G. oxydans by
not only accepting electrons originating from alcohol oxidation by its subunit I but also
accepting and conducting electrons from and to other respiratory chain components
as e.g. the glucose dehydrogenase and the ubiquinol bd oxidase (Matsushita et al.
1991, Shinagawa et al. 1990, Soemphol et al. 2008, Matsushita et al. 2004). The
mGDH only exhibited ferricyanide reductase activity, when the cytochrome c subunit
of the ADH was present (Matsushita et al. 2004, Shinagawa et al. 1990). Matsushita
et al. 1989 reported that the ADH was interconnected with the ubiquinol bd oxidase.
This connection was shown indirectly and the mechanism was not elucidated. Again,
the cytochrome c subunit was important for the electron transfer between the ADH
and the interaction partner (Matsushita et al. 1991, 2004). In addition, Matsushita et
al. 1995 showed a proton motive force dependent activation of the ADH in resting
cells. Combining these results, an involvement of the cytochrome bc1 complex in the
activation of the ADH was investigated. The decreased oxidation capacity of the ADH
in the deletion mutant could be a hint for an interaction between the ADH and the
cytochrome bc1 complex, which contributes to the proton motive force. Indeed, the
the cytochrome bc1 complex plays a role in the activation, since results from the
present work showed that the ADH of the deletion mutant was activated to a
significantly lower extent, compared to the wild type situation. Matsushita et al. 1995
reported an activation of 310% for the wild type, in good agreement with the results
described in this work (320%). However, for a more detailed picture of the function of
the cytochrome bc1 complex biochemical investigations are required. Therefore, first
efforts have been made by co-purification experiments. The cytochrome c subunit of
the ADH was tagged successfully resulting in a co-purified large subunit and the
15 kDa subunit of the enzyme. The protein eluates had a red colour displaying the
high content of cytochrome c in the enzyme (Matsushita et al. 2008 reported four
hemes c bound in subunit II). A supercomplex formation between the cytochrome bc1
complex and the ADH, i.e. a co-purification of components of the cytochrome bc1
complex, was not detectable. However, this result does not exclude a physical
connection of the two complexes since the StrepTag II may have disturbed the
interaction (Kim 2003).
The cytochrome c oxidase test with the chromogenic electron donor TMPD was
performed in G. oxydans to trace a flux of electrons through the cytochrome bc1
V Discussion
78
complex via soluble cytochrome c to a terminal acceptor. With cells of G. oxydans
and of C. glutamicum TMPD did not change the colour. This can be interpreted that
no electron flow from the cytochrome bc1 complex via the soluble cytochrome c to a
terminal oxidase occurred. However, this is not true in the case of C. glutamicum
since the cytochrome bc1 complex is functional in C. glutamicum and connected to
the cytochrome c oxidase (Niebisch and Bott 2001). Interestingly, in C. glutamicum
no soluble cytochrome c552 is present. However, a second heme-binding motive
CXXCH beside the standard heme-binding motive is present in the cytochrome c
subunit of the cytochrome bc1 complex in C. glutamicum. This additional prosthetic
group substitutes the soluble cytochrome c and is involved in the transfer of electrons
to the cytochrome c oxidase, which forms a supercomplex with the cytochrome bc1
complex. Thus, the TMPD test result with G. oxydans is ambiguous: either no flux
through the cytochrome bc1 complex to a terminal oxidase, or existence of complex-
bound cytochrome c552.
To summarise, the decreased oxidation velocities of the deletion mutant point to
an interaction between the ADH and the cytochrome bc1 complex. Although the
cytochrome bc1 complex is involved in the activation of the ADH in pH 4 grown cells,
a direct interaction was not demonstrated, but cannot be excluded. However, the
decreased oxidation capacities of the deletion mutant can be interpreted in a second
way. For evaluation of the results from short time kinetics, it was hypothesised in this
work that the electrons underlie a reverse electron flow through the cytochrome bc1
complex. Following this assumption, transfer of electrons via the cytochrome bc1
complex would not be to an end acceptor, but to the ubiquinol pool in the membrane.
In a standard situation with “normal” electron flow the electrons are passed through
the cytochrome bc1 complex as depicted in Fig. 26. Per ubiquinol oxidised, one
electron is channelled to the soluble cytochrome c via the enzyme-bound [Fe-S]-
cluster and the cytochrome c of the complex (Trumpower 1990a, b). The reduction of
the [Fe-S]-cluster delivers the energy for the energetically non-favoured electron
transfer from ubiquinol to the first cytochrome b of the complex, which has a lower
redox-potential than that of ubiquinol. From the first cytochrome b, electrons flow to a
second cytochrome b, which has a higher redox potential. Therefore, it is called
cytochrome bH and this electron flow is energetically favoured. Via the high potential
cytochrome b, the electron is channelled back to the ubiquinol pool which has again
a more positive redox-potential. This one electron transfer to the ubiquinone leads to
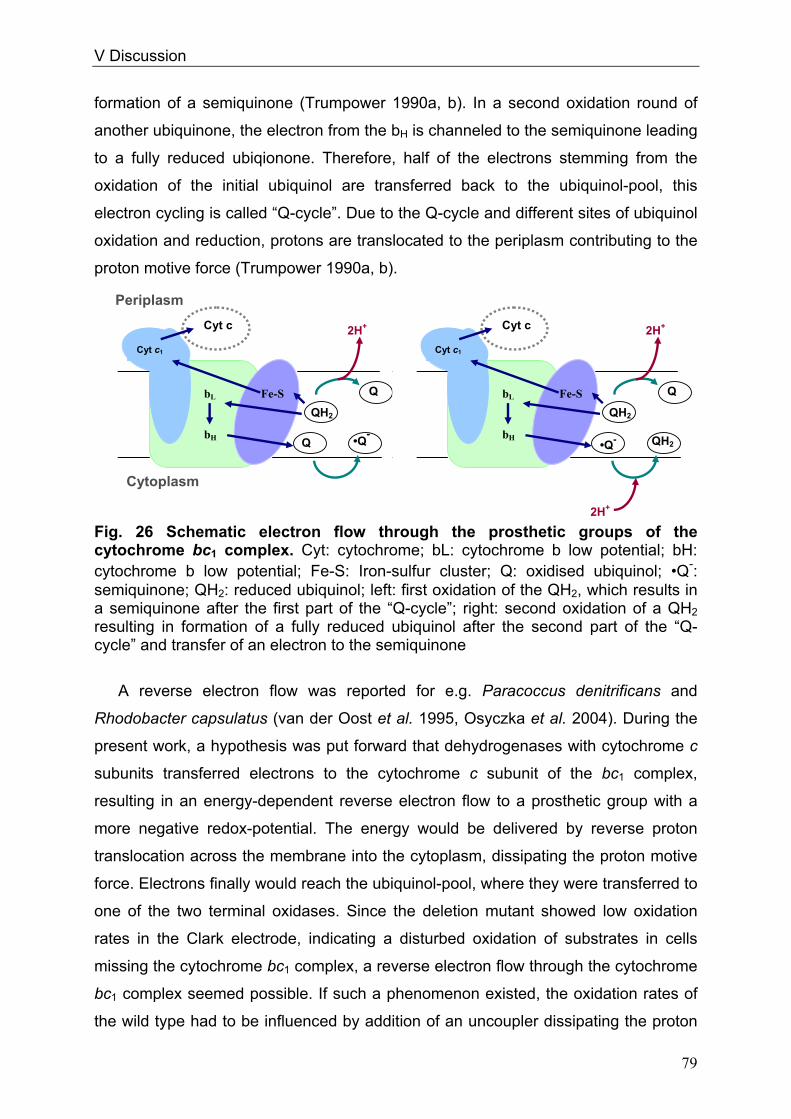
V Discussion
79
Periplasm
Cytoplasm
2H+
QH2
Q
Q
•Q-
Cyt c1
bL bH
Fe-S
2H+ Cyt c
QH2
•Q-
Q
QH2
Cyt c1
bL bH
Fe-S
2H+ Cyt c
formation of a semiquinone (Trumpower 1990a, b). In a second oxidation round of
another ubiquinone, the electron from the bH is channeled to the semiquinone leading
to a fully reduced ubiqionone. Therefore, half of the electrons stemming from the
oxidation of the initial ubiquinol are transferred back to the ubiquinol-pool, this
electron cycling is called “Q-cycle”. Due to the Q-cycle and different sites of ubiquinol
oxidation and reduction, protons are translocated to the periplasm contributing to the
proton motive force (Trumpower 1990a, b).
Fig. 26 Schematic electron flow through the prosthetic groups of the cytochrome bc1 complex. Cyt: cytochrome; bL: cytochrome b low potential; bH: cytochrome b low potential; Fe-S: Iron-sulfur cluster; Q: oxidised ubiquinol; •Q-: semiquinone; QH2: reduced ubiquinol; left: first oxidation of the QH2, which results in a semiquinone after the first part of the “Q-cycle”; right: second oxidation of a QH2 resulting in formation of a fully reduced ubiquinol after the second part of the “Q-cycle” and transfer of an electron to the semiquinone
A reverse electron flow was reported for e.g. Paracoccus denitrificans and
Rhodobacter capsulatus (van der Oost et al. 1995, Osyczka et al. 2004). During the
present work, a hypothesis was put forward that dehydrogenases with cytochrome c
subunits transferred electrons to the cytochrome c subunit of the bc1 complex,
resulting in an energy-dependent reverse electron flow to a prosthetic group with a
more negative redox-potential. The energy would be delivered by reverse proton
translocation across the membrane into the cytoplasm, dissipating the proton motive
force. Electrons finally would reach the ubiquinol-pool, where they were transferred to
one of the two terminal oxidases. Since the deletion mutant showed low oxidation
rates in the Clark electrode, indicating a disturbed oxidation of substrates in cells
missing the cytochrome bc1 complex, a reverse electron flow through the cytochrome
bc1 complex seemed possible. If such a phenomenon existed, the oxidation rates of
the wild type had to be influenced by addition of an uncoupler dissipating the proton
V Discussion
80
gradient needed for the reverse electron flow. This was only the case with sorbitol as
substrate. Thus, a reverse electron flow cannot be ruled out completely. A clear
advantage of this reverse electron flow for the organism was not obvious. It would
dissipate energy for the ability of oxidation of some additional substrates, which
perhaps could not be oxidised otherwise.
2. Differential gene regulation at oxygen limitation and at low pH
In order to throw light on the regulation of the respiratory chain in conjunction with
the overall metabolism, genome-wide DNA microarray analyses were carried out with
G. oxydans 621H. An increasing content of the highly oxygen-affine ubiquinol bd
oxidase was shown in oxygen-limited E. coli cells (Gennis and Stewart 1996).
Therefore, a regulation of components of the respiratory chain under oxygen
limitation seemed likely. Oxygen limitation of the cells affected the expression of
nearly all components of the respiratory chain of G. oxydans resulting in an enhanced
transcription or a decreased mRNA-level. In G. oxydans, the low oxygen-affine
ubiquinol bo3 oxidase genes were upregulated as well as two genes encoding the
cytochrome bc1 complex under oxygen limitation. In contrast, expression of genes
encoding for ubiquinol reducing components of the respiratory chain was decreased.
In accordance, transcription of PQQ-biosynthesis genes was decreased as well.
In the case of NADH dehydrogenase, the decline in transcription did not manifest
itself in the in vitro measurable enzyme activity that remained stable, possibly due to
posttranscriptional regulation. In this work it was shown that the NADH
dehydrogenase of G. oxydans does not accept NADPH as electron donor, as it is the
case for the NAD(P)H dehydrogenase in Z. mobilis (Kalnenieks et al. 2007). This
organism possesses a similar respiratory chain as G. oxydans and occurs naturally in
the same or in comparable habitats (Bringer et al. 1984, Kersters et al. 2006, Sahm
et al. 2006, Kalnenieks et al. 2007); therefore, characteristics of enzymes of
Z. mobilis were assumed to be similar to those of G. oxydans. In the case of the
NADH dehydrogenase, this was certainly not true. However, in G. oxydans there is
hardly any need to oxidise NADPH at the membranes, although there are three main
reactions/reaction pathways for formation of NADPH: I) The membrane-bound
nicotinamide nucleotide transhydrogenase (PntAB), II) the PPP dehydrogenases
contributing to the balance between NADH and NADPH via their dual cofactor
specificities and III) the cytoplasmatic NADP-dependent dehydrogenases which
V Discussion
81
oxidise glucose to gluconate and gluconate to 5-ketogluconate (Prust 2005, Merfort
et al. 2006).
Genes pntAB encoding the membrane-bound nicotinamide nucleotide
transhydrogenase were the most strongly upregulated genes in oxygen-limited cells
of G. oxydans. As the NAD(P)H transhydrogenase couples hydride transfer between
NADH + H+ and NADP+ to proton translocation across a membrane at the expense of
the membrane potential ∆p, in G. oxydans the enzyme might have two functions. The
hydride transfer from NADH to NADP+ results in an increased formation of NADPH
used for biomass production. In E. coli, PntAB contributes to the balancing between
the NADH and NADPH pools (Sauer et al. 2004). In B. subtilis, Agrobacterium
tumefaciens, Rhodobacter sphaeroides, Sinohizobium meliloti and Zymomonas
mobilis, but not in E. coli, the PPP dehydrogenases contribute to the balance
between NADH and NADPH via their dual cofactor specificities (Fuhrer and Sauer
2009). This is also the case in G. oxydans. The NADPH required for biomass
synthesis is provided by glucose 6-phosphate dehydrogenase and 6-
phosphogluconate dehydrogenase, which accept both, NAD+ and NADP+ as electron
acceptors (Adachi et al. 1982; Tonouchi et al. 2003). Thus, there is no direct need for
formation of NADPH by the PntAB transhydrogenase in G. oxydans. Prust et al. 2005
suggested a second function of the PntAB transhydrogenase. Possibly, the
transhydrogenase translocates cytoplasmic protons across the membrane, thereby
contributing to the generation of ∆p at the expense of NADPH. Thus, under oxygen-
limited growth conditions the proton translocating pyridine nucleotide
transhydrogenase possibly substituted the respiratory activity, which was probably
decreased due to downregulated primary oxidoreductases. However, it was shown
that over production of enzymes using NADP+ as cofactors, like the cytoplasmatic
gluconate 5-dehydrogenase, resulted in a decreased growth due to accumulating
NADPH (Klasen 1994). If the PntAB transhydrogenase is able to operate in the
opposite function contributing to the proton motive force at an expense of NADPH,
the accumulation of NADPH was not reasonable. Furthermore, the mRNA-levels of
the two dehydrogenases of the PPP were strongly decreased under oxygen limitation
in G. oxydans. Therefore, it is unlikely that enough NADPH was disposable for driving
the reverse reaction of the PntAB transhydrogenase in the direction of proton
translocation to the periplasm under expense of NADPH. The de facto function of the

V Discussion
82
PntAB transhydrogenase in oxygen-limited cells of G. oxydans should be
investigated in future.
In G. oxydans, two distinct ATP synthases exist (Prust 2005). One is encoded in a
single operon, the other in two different operons. Expression of the latter operons
was decreased, whereas expression of the first was increased in oxygen-limited
cells. Both ATP synthases most probably are active in G. oxydans, although one
subunit of each of the ATP synthases was not correctly identified (Prust 2005). In
gluconate-grown cells, the same regulation pattern of the two ATP synthases
occurred leading to the assumption that growth phase effects could be responsible
for the differently expressed ATP synthases. In both conditions, gene transcription for
chemotaxis/flagellum assembly was enhanced. A correlation between chemotaxis
and the upregulated ATP synthase is likely. In Salmonella enterica, Minamino et al.
2008b reviewed that the export of flagella proteins is driven by proton motive force.
The ATPase FliI, which forms a monohexamer, similar to the basal body in F0/F1 ATP
synthases, is more involved in releasing the proteins from the initial complex of FliH-
FliI, which coordinates the protein to the export gate formed by flnAB. The
upregulated ATP synthase in G. oxydans might contribute to the proton motive force
by proton translocation into the periplasm operating in reverse direction. This would
result in an enhanced energy supply for the energy-dependent chemotaxis/flagellum
assembly (Minamino et al. 2008a, b).
The downregulation of the catalase encoding gene in oxygen-limited cells is
consistent with the reduced formation of reactive oxygen species under the condition
of low oxygen availability where less H2O2 is produced (Atack and Kelly 2007).
Nevertheless, the gene encoding cytochrome c peroxidase was upregulated in those
cells indicating another function beside detoxification of the cells. As discussed
before, the enzyme possibly serves as terminal electron acceptor from the
cytochrome bc1 complex via the soluble cytochrome c.
ArcAB and FNR are known to be regulators induced by anaerobiosis in facultative
anaerobes (Patschkowski et al. 2000) whose regulatory activities result in increased
transcription of the genes encoding ubiquinol bd oxidase and decreased transcription
of the genes encoding for NADH dehydrogenase II, isocitrate dehydrogenase and
ubiquinol bo3 oxidase. This regulation, with the exception of the gene encoding
ubiquinol bo3 oxidase, was observed in G. oxydans, too. However, no ArcAB or FNR
homologues were annotated in G. oxydans up to now. FNR is closely related to the
V Discussion
83
catabolite repressor protein (CRP) (Spiro 1994); GOX0974 was annotated as CRP.
However, using the BLAST program, GOX0974 shows more similarity to E. coli FNR
(29 %) than to E. coli CRP (21 %). The FNR-binding motive TTGAT-4N-GTCAA
(Mouncey and Kaplan 1998) is not fully present (TTGAT can be found), but there are
the typical 4-5 cysteine residues in the coding region for binding of the [4Fe-4S]2+
cluster. In its dimeric form with two [4Fe-4S]2+-clusters, FNR can bind to the DNA. In
the presence of oxygen, the clusters are converted to [2Fe-2S]2+-clusters (Green et
al. 2009). The regulator looses its dimeric structure and cannot bind to DNA. The
function of FNR as an activator (e.g. of the nitrate reductase gene in E. coli) or as an
repressor (e.g. of the ndh gene in E. coli) depends on the position of the binding motif
in the promoter region (Guest et al. 1996) The fnr gene of E. coli is autoregulated
(Spiro and Guest 1987). In G. oxydans a 0.7-fold downregulation of GOX0974 in
oxygen-depleted cells was observed.
Thus, by profiling the transcriptome of oxygen-limited cells compared to cells
cultivated under oxygen excess, a strong regulation of the PntAB was disclosed
which lead to the notion of a reverse function of the transhydrogenase for maintaining
the proton motive force under oxygen depletion. The respiratory activity was
decreased shown by downregulation of primary oxidoreductases. Due to oxygen
depletion, transcription of genes encoding terminal oxidases and genes involved in
flagella assembly/chemotaxis was enhanced for capturing oxygen.
The regulatory response to acidic pH was less pronounced than that to oxygen
limitation. There was no evidence from transcriptional analysis for an upregulation of
the cytochrome c subunit of the ADH, as reported by Matsushita et al. 1989. Instead,
transcription of the 15 kDa subunit of this enzyme was amplified. The 15 kDa subunit
is probably a linker to the membrane and not involved in electron transport
(Matsushita et al. 2008). The data resulting from our microarray analysis confirmed
presence of amplified ubiquinol bd oxidase transcripts in cells cultivated at pH 4. The
regulation of membrane-bound oxidases in the respiratory chain of G. oxydans differs
from that of E. coli, where e.g. the gene encoding the bd oxidase is upregulated at
pH 8.7 (Maurer et al. 2005).
V Discussion
84
3. Characterisation of growth of G. oxydans 621H on glucose with microarray-, 13C-metabolome- and flux-analysis
Genome-wide transcription analysis and 13C-metabolome analysis in cells of the
two growth phases when cultivated with glucose focused on metabolic changes
under these growth conditions. Since EMP and TCA cycle are incomplete (Prust et
al. 2005), it was assumed that changes occurred in the relative activities of the PPP
or the EDP. In this work, the quantitative carbon flux distribution in the central
metabolism of G. oxydans was analysed by applying 13C-glucose feeding (Wiechert
and Nöh 2005, Wiechert 2001, Zamboni et al. 2009). Parallel cultivation under
controlled conditions allowed for collection of reproducible LC-MS data (biological
and technical replicates) suitable for 13C-MFA.
G. oxydans grew exponentially in phase I and formed 80% of the biomass found
at the end of the cultivation. During this phase, 440 mM glucose was oxidised at a
high rate (70 mM h-1) to gluconate via the membrane-bound glucose dehydrogenase
(mGDH) and the transferred electrons were used to reduce 220 mM O2 to water. This
stoichiometry indicated that only negligible amounts of glucose were oxidised in the
cell with concomitant formation of NADH that was subsequently oxidised by NADH
dehydrogenase. Consistently, the flux model calculated that 97% of the glucose was
oxidised in the periplasm by mGDH and only 3% entered the cytoplasm.
Furthermore, the model predicted that cytoplasmic glucose was oxidised by the
soluble GDH, rather than being phosphorylated by glucose kinase. In this work, an
activity of 0.086 U mg-1 cell-free protein of glucose kinase was determined, agreeing
well with the glucose kinase activity of 0.060 U mg-1 cell-free protein reported by
Pronk et al. 1989. Activity measurements by the same authors of the cytoplasmatic
glucose dehydrogenase (cGDH) and the mGDH resulted in 0.15 and 4 U mg-1 cell-
free protein, i.e. cytoplasmic glucose dehydrogenation was 3.8% of the periplasmatic
activity. This result of in vitro determinations of enzyme activities is in agreement with
our model prediction of the in vivo situation of carbon flux.
The attested cytoplasmatic oxidation of unphosphorylated sugars is unusual,
because in other bacteria sugars either are taken up by phosphoenolpyruvate-
dependent phosphotransferase systems (PTS), or are immediately phosphorylated
by a cytoplasmic sugar kinase. The PTS system is incomplete in G. oxydans
because EIIB and EIIC are missing (Prust et al. 2005). The uptake mechanism for
glucose is unclear yet. Most commonly, glycerol in bacteria is taken up by a facilitator
protein (Stroud et al. 2003, Hénin et al. 2008). Since in G. oxydans only one gene
V Discussion
85
encoding for a facilitator was identified this permease most probably transports
glycerol (Prust 2005). Genes encoding enzymes for glycerol uptake and degradation
in G. oxydans are organised in an operon (GOX2087-GOX2090). Interestingly,
glycerol, present at a low concentration of 0.5 g l-1 in the media is metabolised in the
second growth phase of glucose-cultivated cells as indicated by the enhanced
mRNA-levels of the glycerol operon in growth phase II. Glycerol 3-phosphate is then
presumably channeled into the PPP, explaining the 10-fold upregulation of the gene
encoding triosephosphate isomerase. This mode of glycerol catabolism strongly
indicates that catabolite repression takes place in G. oxydans. Expression of the EIIA
component of the PTS was enhanced in growth phase II, indicating, that the
rudimentary PTS might still have a function in G. oxydans, e.g. of catabolite
repression, since non-PTS sugars like glycerol have an influence to the
phosphorylation state of EIIA (Eppler et al. 2002). The increased level of EIIA is
maybe involved in an increased block of glycerol metabolism, if it is mostly
dephosporylated. Elevated mRNA-levels of the glycerol metabolism operon can
perhaps abolish the effect of increased EIIA. The EIIA component of the PTS system
and catabolite repression in G. oxydans require more detailed investigation.
Only a low growth rate and low biomass production were observed in the second
growth phase, which probably was due to energy limitation of the cells, although
370 mM ketogluconates were formed from gluconate by membrane oxidation. For the
reduction of 1 mM O2, 2 mM gluconate had to be oxidised. Therefore, 185 mM O2
must have been consumed by gluconate oxidation. De facto, 220 mM O2 was
reduced within this phase. Thus, the remaining 35 mM O2 were reduced by electrons
transferred to the respiratory chain via NADH oxidation. Under the conditions applied
in this work, the main energy supply of the cells originated from substrate oxidation in
the periplasm. However, in the second oxidation phase the oxidative activities of the
ketogluconate-forming gluconate-2- and gluconate-5-dehydrogenases were 70–80%
lower than the activity of the mGHD in the first oxidation phase, as determined in a
Clark oxygen electrode. This might be the main reason for the energy limitation of the
cells in growth phase II. Increasing the concentration of yeast extract from 5 g l-1 to
15 g l-1 did not affect the oxidation phases or the time point of transition from the first
to the second one. The growth rate during the second oxidation phase was not
increased, either. Therefore, nutrient limitation of e.g. amino acids can be excluded
as reason for the decreased growth.
V Discussion
86
The genes responsible for chromosome partitioning GOX1062 and GOX1063
were downregulated in growth phase II, as well as many ribosomal proteins,
indicating that diminished chromosome partitioning is probably another cause for the
decreased growth rate in the growth phase II. Decreased mRNA-levels of the genes
encoding for cell division proteins underline this assumption. Of course, it cannot be
excluded that the decreased growth rate caused the downregulation of those genes.
The induction of genes encoding RNA polymerase factor sigma-32, a small heat
shock protein (sHsp), and DnaK was surprising in gluconate-grown cells (as well as
in oxygen-limited cells). It is well known that heat shock response is provoken by
several unfavourable growth conditions like heat, cold, salt, and drought, osmotic and
oxidative stresses (Jiang et al. 2009, Parsell et al. 1989; van Bogelen et al. 1986), so
that the heat shock response is not an answer to heat only. In G. oxydans the gene
encoding superoxide dismutase was upregulated 3.5-fold in gluconate grown cells,
indicating for increased concentrations of superoxide anion (Storz and Zheng 2000).
This is possibly a hint, that oxidative stress occurred during the change from growth
phase I into growth phase II of glucose-grown cells. The oxidative stress response is
mediated by the regulators OxyR and SoxR, which sense H2O2 and superoxide
anions (Storz and Zheng 2000). The responses of these regulators overlap with e.g.
FNR (regulator of fumarate and nitrate reduction) or the sigma-38 regulon (the
starvation/stationary phase sigma factor) (Storz and Zheng 2000). Due to this overlap
of stress responses, it is not imperative that increased transcription of e.g. the
superoxide dismutase was triggered by increased concentrations of superoxide
anion.
The strong sigma-32 dependent induction of a small heat shock protein (sHSP)
and of the chaperone DnaK (Hsp70) in G. oxydans was a consequence of the
increased sigma-32 protein level. In E. coli, the sigma-32 regulon is essential for
growth and cell division and highly responsive to growth phases (Wagner et al.
2009). Thus, the change from an exponential growth in phase I to linear growth in
phase II of G. oxydans may be a result of heat shock response/oxidative stress
response. However, it cannot be excluded that these findings are rather the
consequence of the decreased growth rate than the reason for it. Due to the
overlapping responses of heat hock, oxidative stress and stationary growth phase, it
is difficult to find the initial factor, which induced the remaining regulatory answers.
V Discussion
87
The mRNA level of gluconate kinase was increased 1.6-fold in the second
growth phase. Hence, gluconate is taken up into the cytoplasm and then
phosphorylated by the substrate-induced gluconate kinase. In the second growth
phase, the gluconate was oxidised to 2-ketogluconate as the main product via
membrane-oxidation, which was mainly due to the constant pH value of 6 applied in
the cultivations. At pH 6, the membrane-bound gluconate-2-dehydrogenase
(gluconate-2-DH) has its pH optimum (Shinagawa et al. 1984). The expression levels
of the genes encoding subunits of gluconate-2-DH were increased 2.1-2.7-fold.
Formation of 5-ketogluconate production was low, owing to the fact that 5-
ketogluconate formation from gluconate is optimally catalysed at pH 5 by the major
polyol dehydrogenase encoded by the sldAB genes (Miyazaki et al. 2002; Gätgens et
al. 2007). The preferred substrates of this enzyme are the polyols arabitol, sorbitol,
and mannitol, however gluconate is oxidised to 5-ketogluconate at 4-40% the rate of
arabitol oxidation (Sugisawa and Hoshino 2002, Matsushita et al. 2003, Elfari et al.
2005, Merfort et al. 2006 a, b).
During the second growth phase, when the periplasmatic oxidation of glucose to
gluconate was almost completed, high amounts of carbon dioxide were produced.
This was also reported by Olijve and Kok 1979. Balancing of the concentrations of
substrate entering the cytoplasm (about 3%, calculated by product concentrations
after growth subtracted from initial substrate concentration) with the carbon dioxide
produced claimed an activated, partly cyclic PPP producing more than one mol
carbon dioxide per mol gluconate. Complete glucose oxidation to carbon dioxide via
a cyclic PPP theoretically can lead to the evolution of 6 CO2 per mol of glucose.
Prerequisites for a cyclic flow of carbon through this pathway are the absence of 6-
phosphofructokinase and presence of fructose-1,6-bisphosphatase, both premises
being met by the organism (Prust 2005). By genome-wide transcription profiling of
G. oxydans cells from growth phases I and II activation of the PPP indeed was
shown: 15 genes encoding for enzymes of the PPP or EMP/gluconeogenesis were
upregulated in growth phase II. Increased activity of selected PPP enzymes was also
detected at the protein level due to enzyme activity measurements. In the cultivations
described here, 10% of the glucose metabolised was converted to CO2, in agreement
with results from 14C-labeling experiments by Shinjoh et al. 1990, who reported that
7.1% of glucose were converted to CO2. Furthermore, surplus CO2 was not
V Discussion
88
explainable only with a complete cyclic PPP since more CO2 was produced than the
complete oxidation of the 3% substrate entering the cells would allow. 13C-Metabolome analysis showed a clear cut between the upper and the lower
parts of glucose metabolism. Only low labeling information was found in the
intermediates of the TCA cycle. In addition, the labeling patterns of the TCA cycle
intermediates fitted to the metabolic model only when additional uptake reactions for
unlabeled compounds of the yeast extract were included, at least some amino acids
of the oxaloacetate family (lysine and aspartate). Exogenous acetyl-CoA entered the
TCA cycle, presumably also derived from degradation of exogenous amino acids,
e.g. leucine and lysine. Succinyl-CoA, the end product of the incomplete TCA cycle,
is directed into biosyntheses. In G. oxydans heme synthesis starts with the formation
of 5-aminolevulinic acid from succinyl-CoA and glycine, catalyzed by 5-aminolevulinic
acid synthase (GOX1636) (Prust 2005). Furthermore, succinyl-CoA is required for
lysine synthesis. Since G. oxydans does not secrete succinate it can be concluded
that succinyl-CoA does not accumulate in the cells but is used in the synthesis of
cellular components.
Thus, the 13C-metabolome analysis carried out in the present work has shown
that in G. oxydans the intracellular carbon flux from glucose is directed into the PPP.
In growth phase I only glucose is taken up by the cells, oxidised to gluconate before
being phosphorylated to 6-phosphogluconate. Transition of cells from growth with
glucose in phase I to growth with gluconate in phase II is accompanied by an
increase of activity of gluconate kinase and the two PPP dehydrogenases, and
decreased growth and oxygen consumption rates. Significant fluxes for the TCA
cycle were estimated contributing more than half of the overall CO2 produced.
VI References
89
VI References
Abe S, Takayama K, Kinoshita S (1967) Taxonomical studies an glutamic acid
producing bacteria. J Gen Appl Microbiol 13: 279-301
Abramson J, Riistama S, Larsson G, Jasaitis A, Svensson M, Laakkonen L,
Puustinen A, Iwata S, Wikström M (2000) The structure of the ubiquinol oxidase
from Escherichia coli and its ubiquinone binding site. Nat Struct Biol 7: 910-917
nature structural biology 7:910-917
Adachi O, Tayama K, Shinagawa E, Matsushita K, Ameyama M (1978) Purification
and characterization of particulate alcohol dehydrogenase from Gluconobacter
suboxydans. Agric Biol Chem 42: 2045-2056
Adachi O, Matsushita K, Shinagawa E, Ameyama M (1979) Occurrence of old yellow
enzyme in Gluconobacter oxydans, and the cyclic regeneration of NADP. J
Biochem 86: 699-709
Ameyama M, Shinagawa E, Matsushita K, and Osao Adachi O (1981) D-Glucose
dehydrogenase of Gluconobacter suboxydans: solubilization, purification and
characterization. Agric Biol Chem 45: 851-861
Anraku Y, Gennis RB (1987) The aerobic respiratory chain of Eschericehia coli.
Trends Biochem Sci 12: 262-266
Attack JM and Kelly DJ (2007) Structure, mechanism and physiological roles of
bacterial cytochrome c peroxidases. Adv Microb Physiol 52: 73-106
Bartek T, Makus P, Klein B, Lang S, Oldiges M (2008) Influence of L-isoleucine and
pantothenate auxotrophy for L-valine formation in Corynebacterium glutamicum
resisted by metabolome analysis. Bioprocess Biosyst Eng 31: 217-225
Battey AS, Schaffner DW (2001) Modelling bacterial spoilage in cold-filled ready to
drink beverages by Acinetobacter calcoaceticus and Gluconobacter oxydans. J
Appl Microbiol 91: 237-47
Bekker M, de Vries S, Ter Beek A, Hellingwerf KJ, Teixeira de Mattos MJ (2009)
Respiration of Escherichia coli can be fully uncoupled via the nonelectrogenic
terminal cytochrome bd-II oxidase. J Bacteriol 191: 5510-5517
Bott M (2001) A high-resolution reference map for cytoplasmic and membrane
associated proteins of Corynebacterium glutamicum. Electrophoresis 22: 4404-
4422
Bratbak G, Dundas I (1984) Bacterial dry matter content and biomass estimations.
Appl Environ Microbiol 48: 755-757
Brazma A, Hingamp P, Quackenbush J, Sherlock G, Spellman P, Stoeckert C, Aach
J, Ansorge W, Ball CA, Causton HC, Gaasterland T, Glenisson P, Holstege FC,
Kim IF, Markowitz V, Matese JC, Parkinson H, Robinson A, Sarkans U, Schulze-
Kremer S, Stewart J, Taylor R, Vilo J, Vingron M (2003) Minimum information
VI References
90
about a microarray experiment (MIAME)-toward standards for microarray data.
Nucleic Acids Res 31: 68-71
Bremus C (2006) Bildung der Vitamin C-Vorstufe 2-Keto-L-Gulonsäure mit
Gluconobacter oxydans. Dissertation at the Heinrich-Heine Universität Düsseldorf
Bringer S, Finn RK, Sahm H (1984) Effect of oxygen on the metabolism of
Zymomonas mobilis. Arch Microbiol 139: 376-381
Campbell LK, Baker DE, Campbell RK (2000) Miglitol: assessment of its role in the
treatment of patients with diabetes mellitus. Ann Pharmacother 34: 1291-1301
Choi KH, Kumar A, Schweizer HP (2006) A 10 min method for preparation of highly
electrocompetent Pseudomonas aeruginosa cells: Application for DNA fragment
transfer between chromosomes and plasmid transformation. J Microbiol Meth 64:
391-397
Claret C, Salmon JM, Romieu C, Bories A (1994) Physiology of Gluconobacter
oxydans during dihydroxyacetone production from glycerol. Appl Microbiol
Biotechnol 41: 359-65
Cohen SN, Chang ACY, Hsu L (1972) Nonchromosomal antibiotic resistance in
bacteria: Genetic transformation of Escherichia coli by R-factor DNA. Proc NatI
Acad Sci 69: 2110-4
Costa V, Moradas-Ferreira P (2001) Oxidative stress and signal transduction in
Saccharomyces cerevisiae: insights into ageing, apoptosis and diseases. Mol
Aspects of Medicine 22: 217-246
De Ley J, Swings J (1981) The genera Gluconobacter and Acetobacter. In: The
Prokaryotes. A handbook on habitats, isolation, and identification of bacteria.
Hrsg.: Starr MP, Stolp H, Tröper, HG, Balows A, Schlegel, H. G.Springer Verlag,
Berlin:771-778
De Ley J, Gillis M, Swings J (1984) Genus Gluconobacter. In: Bergey`s Manual of
Systematic Bacteriology, vol 1. Krieg, NR, Holt, JG, eds. Williams and Wilkins,
Baltimore: 267-278
Deppenmeier U, Hoffmeister M, Prust C (2002) Biochemistry and biotechnological
applications of Gluconobacter strains. Appl Microbiol Biotechnol 60: 233-42
Deppenmeier U, Ehrenreich A (2008) Physiology of acetic acid bacteria in light of the
genome sequence of Gluconobacter oxydans. J Mol Microb Biotechnol 16: 69-80
Deppenmeier U, Ehrenreich A (2009) Physiology of acetic acid bacteria in light of the
genome sequence of Gluconobacter oxydans. J Mol Microbiol Biotechnol 16: 69-
80
Dudoit S and Yang YJH (2003) Bioconductor R Packages for Exploratory Analysis
and Normalization of cDNA Microarray Data. In: The analysis of gene expression
data, Springer-Verlag London
VI References
91
Elfari M, Ha SW, Bremus C, Merfort M, Khodaverdi V, Herrmann U, Sahm H, Görisch
H (2005) A Gluconobacter oxydans mutant converting glucose almost
quantitatively to 5-keto-D-gluconic acid. Appl Microbiol Biotechnol 66: 668-74
Eppler T, Postma P, Schütz A, Völker U, Boos W (2002) Glycerol-3-phosphate-
induced catabolite repression in Escherichia coli. J Bacteriol 184: 3044-3052
Ferguson SJ, Stevens JM, Allen JWA, Robertson IB (2008) Cytochrome c assembly:
A tale of ever increasing variation and mystery? Biochim Biophys Acta 1777: 980-
984
Fischer E, Zamboni N and Sauer U (2004) High-throughput metabolic flux analysis
based on gas chromatography-mass spectrometry derived 13C constraints. Anal
Biochem 325: 308-16
Fraenkel DG and Levisohn SR (1967). Glucose and gluconate metabolism in
Escherichia coli mutant lacking phosphoglucose isomerase. J Bacteriol 93: 1571-
1578
Fridovich I (1978) The biology of oxygen radicals. Science 201: 875–880
Fridovich I (1995) Superoxide radical and superoxide dismutases. Annu Rev Biochem
64: 97-112
Fritsche W (1999) Mikrobiologie. Spektrum, Akademischer Verlag, Heidelberg- Berlin.
Fuhrer T and Sauer U (2009) Different biochemical mechanisms ensure network-wide
balancing of reducing equivalents in microbial metabolism. J Bacteriol 191: 2112-
2121
Gallagher PR, Desjardins PR (2007) Quantitation of DNA and RNA with absorption
and fluorescence spectroscopy. Curr Protoc Hum Genet Appendix 3D
Gao L, Chiou W, Tang H, Chenga X, Campb HS, Burns DJ (2007) Simultaneous
quantification of malonyl-CoA and several other short-chain acyl-CoAs in animal
tissues by ion-pairing reversed-phase HPLC/MS. Journal of Chromatogr. 853:
303-313
Gätgens C, Degner U, Bringer-Meyer S, Herrmann U (2007) Biotransformation of
glycerol to dihydroxyacetone by recombinant Gluconobacter oxydans DSM2343.
Appl Microbiol Biotechnol 76: 553-559
Gennis RB, Stewart V (1996) Respiration. In: Neidhardt F C, et al., editors.
Escherichia coli and Salmonella: cellular and molecular biology. 2nd ed. Vol. 1.
Washington, D.C. ASM Press: 217-261
Gilmour R, Goodhew CF, Pettigrew GW, Prazeres S, Moura JJG, Moura I (1994) The
kinetics of the oxidation of cytochrome c by Paracoccus cytochrome c peroxidase.
Biochem J 300: 907-914
Goodhew CF, Wilson lBH, Hunter DJB, Pettigrew GW (1990) The cellular location
and specificity of bacterial cytochrome c peroxidases. Biochem J 271: 707-712
Gosselé F, Swings J, De Ley J (1980) Growth factor equirements of Gluconobacter.
Zbl Bakt 4: 348-50

VI References
92
Green J, Crack JC, Thomson AJ, LeBrun NE (2009) Bacterial sensors of oxygen.
Curr Op Microbiol 12: 145-151
Greenfield S, Claus GW (1972) Nonfunctional tricarboxylic acid cycle and the
mechanism of glutamate biosynthesis in Acetobacter suboxydans. J Bacteriol
112: 1295-1301
Guest JR, Green J, Irvine AS, Spiro S (1996) The FNR modulon and FNR-regulated
gene expression. Regulation of gene expression in Escherichia coli, R.G. Landes
Company, Austin, Texas 313-342
Gupta A, Singh VK, Qazi GN, Kuma, A (2001) Gluconobacter oxydans: Its
biotechnological applications. J Mol Microbiol Biotechnol 3: 445-56
Hanahan D (1983) Studies on Transformation of E. coli with Plasmids. J Mol Biol.
166: 557-580
Hancock RD (2009) Recent Patents on Vitamin C: Opportunities for Crop
Improvement and Single-Step Biological Manufacture. Recent Patents on Food,
Nutrition & Agriculture 1: 39-49
Heefner DL, Claus GW (1976) Change in quantity of lipids and cell size during
intracytoplasmic membrane formation in Gluconobacter oxydans. J Bacteriol 125:
1163-1171
Hénin J, Tajkhorshid E, Schulten K, Chipot C (2008) Diffusion of glycerol through
Escherichia coli aquaglyceroporin GlpF. Biophys J 94: 832-839
Hirano S, Kanamatsu T, Takagi Y, Abei T (1997) A simple infrared spectroscopic
method for the measurement of expired 13C02. Analyt Biochem 96: 64-69
Hölscher T, Weinert-Sepalage D, Görisch H (2007) Identification of membrane-bound
quinoprotein inositol dehydrogenase in Gluconobacter oxydans ATCC 621H.
Microbiology 153: 499-506
Hölscher T, Schleyer U, Merfort M, Bringer-Meyer S, Görisch H, Sahm H (2009) D-
glucose oxidation and PQQ-dependent dehydrogenases in Gluconobacter
oxydans. J Mol Microbiol Biotechnol 16: 6-13
Hoshino T, Sugisawa T, Shinjoh M, Tomiyama N, Miyazaki T (2003). Membrane-
bound D-sorbitol dehydrogenase of Gluconobacter suboxydans IFO 3255 -
enzymatic and genetic characterization. Biochim Biophys Acta 1647: 278-88
Imlay JA, Linn S (1987) Mutagenesis and stress responses induced in Escherichia
coli by hydrogen peroxide. J Bacteriol 169: 2967-2976
Imlay JA, Fridovich I (1991) Assay of metabolic superoxide production in Escherichia
Jackson AL, Loeb LA (1999) Microsatellite instability induced by hydrogen peroxide in
Escherichia coli Mutation Research 447_2000: 187-198
Jackson JB (2003) Proton translocation by transhydrogenase. FEBS Letters 545: 18-
24
Jiang C, Xu J, Zhang H , Zhang X, Shi J, Li M , Ming F (2009) A cytosolic class I
small heat shock protein, RcHSP17.8, of Rosa chinensis confers resistance to a
VI References
93
variety of stresses to Escherichia coli, yeast and Arabidopsis thaliana. Plant, Cell
and Environment:1-14
Jongejan A, Machado SS, Jongejan JA (2000) The enantioselectivity of
quinohaemoprotein alcohol dehydrogenases: mechanistic and structural aspects.
J Molec Cat 8: 121-163
Jünemann S (1997) Cytochrome bd terminal oxidase. Biochim Biophys Acta 1321:
107-127
Kalnenieks U (2006) Physiology of Zymomonas mobilis: Some unanswered
questions. Adv Micobial Physiol 51: 73-117
Kalnenieks U, Rutkis R, Kravale Z, Strazdina I, Galinina N (2007). High aerobic
growth with low respiratory rate: The ndh deficient Zymomonas mobilis. J
Biotechnol 131S: 263-265
Kalnenieks U, Galinina N, Strazdina I, Kravale Z, Pickford JL, Rutkis R, Poole RK
(2008) NADH dehydrogenase deficiency results in low respiration rate and
improved aerobic growth of Zymomonas mobilis. Microbiology 154: 989-994
Katzen F, Becker A, Lelmini MV, Oddo CG, Ielpi L (1999) New mobilizable vectors
suitable for gene replacement in Gram negative bacteria and their use in mapping
of the 39 end of the Xanthomonas campestris pv. campestris gum operon. Appl
Environ Microbiol 65: 278-282
Kersters K, De Ley J (1968) The occurrence of the Entner-Doudoroff pathway in
bacteria. Antonie van Leewenhoek 34: 393-408
Kersters K, Lisdiyanti P, Komagata K, Swings J (2006) The family Acetobacteriaceae:
The genera Acetobacter, Acidomonas, Asaia, Gluconacetobacter, Gluconobacter,
and Kozakia, p. 163-200. In Dworkin M, Falkow S Rosenberg E,, Schleifer K-H,
Stackebrandt E (eds), The Prokaryotes. Vol. 5, 3rd edition. Springer-Verlag
GmbH, Heidelberg
Klasen R, Bringer-Meyer S, Sahm H (1992) Incapability of Gluconobacter oxydans to
produce Tartaric Acid. Biotechnol Bioeng 40: 183-86
Kouvelis VN, Saunders E, Brettin TS, Bruce D, Detter C, Han C, Typas MA, Pappas
KM (2009) Complete genome sequence of the ethanol producer Zymomonas
mobilis NCIMB 11163. J Bacteriol 191: 7140–7141
Kovacs N (1956) Identification of Pseudomonas pyocyanea by the oxidase reaction.
Nature 29:703
Kovach ME, Elzer PH, Hill DS, Robertson GT, Farris MA, Roop RM, Peterson KM
(1995) Four new derivatives of the broad-host-range cloning vector pBBR1MCS,
carrying different antibiotic-resistance cassettes. Gene 166: 175-176
Krajewski V (2008) Modifikation des Glucosestoffwechsels in Gluconobacter
oxydans. Dissertation Heinrich-Heine Universität Düsseldorf

VI References
94
Kulhanek M (1989) Microbial dehydrogenations of monosaccharides. Adv Appl
Microbiol 34: 141-81
Laemmli UK (1970) Cleavage of structural proteins during the assembly of the head
of bacteriophage T4. Nature 227: 680-685
Lebrun F, Bazus A, Dhulster P, Guillochon D (1998) Solubility of heme in heme-iron
enriched bovine hemoglobin hydrolysates. J Agric Food Chem 46: 5017-5025
Lenz O, Schwartz E, Dernedde J, Eitinger M, Friedrich B (1994) The Alcaligenes
eutrophus H16 hoxX gene participates in hydrogenase regulation. J Bacteriol 176:
4385-4393
Levering PR, Weenk G, Olijve W & Harder W (1988) Regulation of gluconate and
ketogluconate production in Gluconobacter oxydans ATCC 621-H. Arch Microbiol
149: 534-539
Lindroth P and Mopper K (1979) High performance liquid chromatographic
determination of subpicomole amounts of amino acids by pre-column
fluorescence derivatization with ophthaldialdehyde. Anal Chem 51: 1667-1674
Luo B, Grönke K, Takors R Wandrey C, Oldiges M (2007) Simultaneous
determination of multiple intracellular metabolites in glycolysis, pentose
phosphate pathway and tricarboxylic acid cycle by liquid chromatography-mass
spectrometry. J Chromatography A 1147: 153-164
Manoilov SE, Sedykh NV, Firsova VI, Vennikas OR, Chelyadina LD (1996) Effect of
the catalase inhibitor 3-amino-1,2,4- triazole on oxidation-phosphorylation
coupling and the state of the mitochondrial adenosine system in the liver of albino
rats. Biophys and Biochem 6: 576-577
Matsushita K, Ohno Y, Shinagawa E, Adachi O, Ameyama M (1980) Membrane-
bound D-glucose dehydrogenase from Pseudomonas sp.: Solubilisation,
purification and characterization. Agric Biol Chem 44:1505-1512
Matsushita K, Shinagawa E, Adachi O, Ameyama M (1987) Purification,
characterization and reconstitution of cytochrome o-type oxidase from
Gluconobacter suboxydans. Biochim Biophys Acta 894: 304-312
Matsushita K, Nagatani Y, Shinagawa E, Adachi O, Ameyama M (1989a). Effect of
extracellular pH on the respiratory chain and energetics of Gluconobacter
suboxydans. Agric Biol Chem 53: 2895-2902
Matsushita K, Nagatani YI, Shinagawa E, Adachi O, Ameyama M (1991)
Reconstitution of the ethanol oxidase respiratory chain in membranes of
quinoprotein alcohol dehydrogenase-deficient Gluconobacter suboxydans subsp.
α strains. J Bacteriol 173: 3440-3445
Matsushita K, Toyoma H, Adachi O (1994) Respiratory chains and bioenergetics of
acetic acid bacteria. Adv Microb Physiol 36: 247-301
Matsushita K, Yakushi T, Toyama H, Shinagawa E and Adachi O (1995) Function of
multiple heme c moieties in intramolecular electron transport and ubiquinone
VI References
95
reduction in the quinohemoprotein alcohol dehydrogenase-cytochrome c complex
of Gluconobacter suboxydans. J Biol Chem 271: 4850-4857
Matsushita K, Fujii Y, Ano Y, Toyama H, Shinjoh M, Tomiyama N, Miyazaki T,
Sugisawa T, Hoshino T, Adachi O (2003) 5-Keto-D-gluconate production is
catalysed by a quinoprotein glycerol dehydrogenase, major polyol
dehydrogenase, in Gluconobacter species Appl. Environ Microb 69: 1959-1966
Matsushita K, Kobayashi Y, Mitzugushi M, Toyama H, Adachi O, Sakamoto K,
Miyoshi H (2008) A tightly bound quinone functions in the ubiquinone reaction
sites of quinoprotein alcohol dehydrogenase of an acetic acid bacterium,
Gluconobacter suboxydans. Biosci Biotech Biochem 72: 2723-2731
Mauk MR, Rosell FI, Mauk AG (2009) Metal ion facilitated dissociation of heme from
b-type heme proteins. J Am Chem Soc 131:16976-16983
Maurer LM, Yohannes E, Bondurant SS, Radmacher M, Slonczewski JL (2005) pH
regulates genes for flagellar motility, catabolism and oxidative stress in
Escherichia coli K-12. J Bacteriol 187: 304-319
McHugh JP, Rodrıguez-Quinones F, Abdul-Tehrani, H, Svistunenko DA, Poole RK,
Cooper CE, Andrews SC (2003) Global iron-dependent gene regulation in
Escherichia coli a new mechanism for iron homeostasis J Biol Chem 278: 29478-
29486
Meiberg JBM, Spa HA (1983) Microbial production of gluconic acids and gluconates.
J Microbiol 49: 89-90
Merfort M, Herrmann U, Bringer-Meyer S, Sahm H (2006a) High yield 5-keto-D-
gluconic acid formation is mediated by soluble and membrane-bound gluconate-
5-dehydrogenases of Gluconobacter oxydans. Appl Microbiol Biotechnol 73: 443-
451
Merfort M, Herrmann U, Ha S-W, Elfari M, Bringer Meyer S, Görisch H, Sahm H
(2006b) Modification of the membrane-bound glucose oxidation system in
Gluconobacter oxydans significantly increases gluconate and 5-keto-D-gluconic
acid accumulation. Biotechnol J 1: 556-563
Merford M (2009) PhD-Thesis, Forschungszentrum Jülich GmbH, Germany
Messner KR, Imlay JA (1999) The identification of primary sites of superoxide and
hydrogen peroxide formation in the aerobic respiratory chain and sulfite reductase
complex of Escherichia coli. J Biol Chem 274: 10119-10128
Millers MJ and Gennis RB (1985) The cytochrome d complex is a coupling site in the
aerobic respiratory chain of Escherichia coli. J Bacteriol Chem 260: 14003-14008
Minamino T, Imadaab K, Namba K (2008a) Mechanisms of type III protein export for
bacterial flagellar assembly. Mol BioSyst 4: 1105-1115
Minamino T, Namba K (2008b) Distinct roles of the Flil ATPase and proton motive
force in bacterialflagellar protein export. Nature 451: 485-489
VI References
96
Miyazaki T, Tomiyama N, Shinjoh M, Hoshino T (2002) Molecular cloning and
functional expression of D-sorbitol dehydrogenase from Gluconobacter
suboxydans IF03255, which requires pyrroloquinoline quinone and hydrophobic
protein SldB for activity development in E. coli. Biosci Biotechnol Biochem 66:
262-270
Mogi T, Matsushita K, Murase Y, Kawahara K, Miyoshi H, Ui H, Shiomi K, Omura S,
Kita K (2009). Identification of new inhibitors for alternative NADH dehydrogenase
(NDH-II). FEMS Microbiol Lett 291: 157-161
Moritz B, Striegel K, de Graaf AA, Sahm H (2000). Kinetic properties of the glucose 6-
phosphate and 6-phosphogluconate dehydrogenases from Corynebacterium
glutamicum and their application for predicting pentose phosphate pathway flux in
vivo. Eur J Biochem 267: 3442-3452
Mostafa HE, Heller KJ, Geis A (2002) Cloning of Escherichia coli lacZ and lacY genes
and their expression in Gluconobacter oxydans and Acetobacter liquefaciens.
Appl Environ Microbiol 68: 2619-2623
Mouncey NJ, Kaplan S (1998) Oxygen regulation of the ccoN gene encoding a
component of the cbb3 oxidase in Rhodobacter sphaeroides 2.4.1T: involvement
of the FnrL protein. J Bacteriol 180: 2228-2231
Mullis KB and Faloona FA (1987) Specific synthesis of DNA in vitro via a
polymerasecatalysed chain reaction. Methods Enzymol 155: 335-350
Nicholls DG and Ferguson SJ (2002) Bioenergetics. Academic Press, Elsevier
Science Ltd
Niebisch A, Bott M (2001) Molecular analysis of the cytochrome bc1-aa3 branch of the
Corynebacterium glutamicum respiratory chain containing an unusual diheme
cytochrome c. Arch of Microbiol 175: 282-294
Nöh K, Wahl A, Wiechert W (2006) Computational tools for isotopically instationary 13C labeling experiments under metabolic steady state conditions. Metabolic
Engineering 8: 554-577
Oiijve W (1978) PhD Thesis, University of Groningen, The Netherlands
Olijve W., Kok JJ (1979) Analysis of growth of Gluconobacter oxydans in glucose
containing media. Arch Microbiol 121: 283-90
Osyczka A, Moser CC, Daldal F, Dutton PL (2004) Reversible redox energy coupling
in electron transfer chains. Nature 427: 607-612
Pappin DJ, Hojrup P, Bleasby AJ (1993) Identification of proteins by peptide-mass
fingerprinting. Curr Biol 3: 327-32
Parsell DA, RT Sauer (1989) Induction of a heat shock-like response by unfolded
protein in Escherichia coli: dependence on protein level not protein degradation.
Genes Dev 3: 1226-1232

VI References
97
Patschkowski T, Bates DM, Kiley PJ (2000) Mechanisms for sensing and responding
to oxygen deprivation. Bacterial stress responses. Storz G, Hengge-Aronis R,
eds., ASM Press, Washington, D. C.
Polen T, VF Wendisch (2004) Genomewide expression analysis in amino acid-
producing bacteria using DNA microarrays. Appl Biochem Biotechnol 118: 215-
232
Polen T, Schluesener D, Poetsch A, Bott M, Wendisch VF (2007) Characterization of
citrate utilization in Corynebacterium glutamicum by transcriptome and proteome
analysis. FEMS Microbiol Lett 273: 109-119
Pope NR, Cole JA (1982) Generation of a membrane potential by one of two
independent pathways for nitrite reduction by Escherichia coli. Journal of Gen
Microbiol 128:219-222
Pronk JT, Levering PR, Olijve W, Van Dijken JP (1989) Role of NADP dependent and
quinoprotein glucose dehydrogenase in gluconic acid production by
Gluconobacter oxydans. Enzyme Microb Technol 11: 160-164
Prust C (2004) Dissertation: Entschlüsselung des Genoms von Gluconobacter
oxydans 621H – einem Bakterium von industriellem Interesse. Mathematisch-
Naturwissenschaftliche Fakultäten der Georg-August-Universität zu Göttingen
Prust C, Hoffmeister M, Liesegang H, Wiezer A, Fricke WF, Ehrenreich A, Gottschalk
G, Deppenmeier U (2005). Complete genome sequence of the acetic acid
bacterium Gluconobacter oxydans. Nat Biotechnol 23: 195-200
Rabinow P (1996) Making PCR: A story of biotechnology. University of Chicago
Press
Raspor P, Goranovič D (2008) Biotechnological applications of acetic acid bacteria.
Crit Rev Biotechnol 28: 101-124
Sahm H, Bringer-Meyer S, Sprenger GA (2006) The Genus Zymomonas. In Dworkin
M, Falkow S, Rosenberg E, Schleifer K-H, Stackebrandt E (eds.), The
Prokaryotes. Vol. 5, 3rd edition. Springer-Verlag GmbH, Heidelberg: 201-221
Sambrook J, Fritsch EF, Maniatis T (1989) Molecular Cloning. A laboratory manual.
Cold Spring Harbor Laboratory, Cold Spring Harbor, New York
Sambrook J, Russel DW (2000) Molecular cloning: a laboratory manual. Cold Spring
Harbour Laboratory Press, Cold Spring Harbour, New York
Sauer U, Canonaco F, Heri S, Perrenoud A, Fischer E (2004) The soluble and the
membrane-bound transhydrogenases UdhA and PntAB have divergent functions
in NADPH metabolism of Escherichia coli. J Bacteriol 279: 6613-6619
Schäfer A, Tauch A, Jäger W, Kalinowski J, Thierbach G, Pühler A (1994) Small
mobilizable multi-purpose cloning vectors derived from the Escherichia coli
plasmids pK18 and pK19: selection of defined deletions in the chromosome of
Corynebacterium glutamicum. Gene 145: 69-73
VI References
98
Schaffer S, Weil B, Nguyen VD, Dongmann G, Günther K, Nickolaus M, Hermann T,
Schedel M (2000) Regioselective oxidation of aminosorbitol with Gluconobacter
oxydans, a key reaction in the industrial synthesis of 1-deoxynojirimycin. In:
Biotechnology, Biotransformations l.: Kelly DR. Wiley-VCH, Weinheim, 296-308
Schleyer U, Bringer-Meyer S, Sahm H (2008) An easy cloning and expression vector
system for Gluconobacter oxydans. J Food Microbiol 125: 91-95
Shimizu T, Yamasaki S, Tsukamoto T, Takeda Y (1999) Analysis of the genes
responsible for the O-antigen synthesis in enterohaemorrhagic Escherichia coli
0157. Microb Pathog 26: 235-247
Shinagawa E, Matsushita K, Adachi O, Ameyama M (1984) D-Gluconate
dehydrogenase, 2-keto-D-gluconate yielding, from Gluconobacter
dioxyacetonicus: purification and characterization. Agricult Biol Chem 48: 1517-
1522
Shinagawa E, Matsushita K, Adachi O, Ameyama M (1990) Evidence for electron
transfer via ubiquinone between quinoproteins D-glucose dehydrogenase and
alcohol dehydrogenase of Gluconobacter suboxydans. J Biochem 107: 863-867
Sievers M, Gaberthül C, Boesch C, Ludwig W, Teuber M (1995). Phylogenetic
position of Gluconobacter species as a coherent cluster separated from all
Acetbacter species on the basis of 16S ribosomal RNA sequences. FEMS
Microbiol Lett 126: 123-126
Simon R, Priefer U, Piihler A (1983) A broad host range mobilization system for in
vivo genetic engineering: transposon mutagenesis in Gram-negative bacteria.
Biotechnology 1: 784-791
Skerra A, Schmidt TGM (2000) Use of the Strep-Tag and Streptavidin for detection
and purification of recombinant proteins. In Methods in Enzymology. Academic
Press, San Diego 326: 271-304
Smith PK, Krohn RI, Hermanson GT, Mallia AK, Gartner FH, Provenzano MD,
Fujimoto EK, Goeke NM, Olson BJ, Klenk DC (1985) Measurement of protein
using bicinchoninic acid. Anal Biochem 150: 76-85
Smyth GK (2005) limma: linear models for microarray data. In: Bioinformatics an
computional biology solutions using R and bioconductor. Springer-Verlag NY
Soemphol W, Adachi O, Matsushita K, Toyama H (2008) Distinct physiological roles
of two membrane-bound dehydrogenases responsible for D-sorbitol oxidation in
Gluconobacter frateurii. Biosci Biotechnol Biochem 72: 842–850
Sootsuwan K, Lertwattanasakul N, Thanonkeo P, Matsushita K, Yamada, M (2008)
Analysis of the respiratory chain in ethanologenic Zymomonas mobilis with a
cyanide-resistant bd -type ubiquinol oxidase as the only terminal oxidase and its
possible physiological roles. J Mol Microbiol Biotechnol 14: 163–175
Spiro S, Guest JR (1987) Regulation and over-expression of the fnr gene of
Escherichia coli. J Gen Microbiol 133: 3279-3288
VI References
99
Spiro S (1994) The FNR family of transcriptional regulators. Antonie van
Leeuwenhoek, Springer Netherlands, Volume 66
Stroud RM, Miercke LJW, O’Connell J, Khademi S, Lee JK, Remis J, Harries W,
Robles Y, Akhavan D (2003) Glycerol facilitator GlpF and the associated
aquaporin family of channels. Curr Op Struct Biol 13: 424-431
Sugisawa T, Hoshino T (2002) Purification and properties of membrane-bound D-
sorbitol dehydrogenase from Gluconobacter suboxydans IFO 3255. Biosci
Biotechnol Biochem 66: 57-64
Swings J (1992) The genera Acetobacter and Gluconobacter. In: Barlows A, Trüper
HG, Dwarkin M, Harder W, Schleifert KH The Prokaryotes. Springer Verlag, New
York, 2268-2286
Szyperski T, Glaser RW, Hochuli M, Fiaux J, Sauer U, Bailey JE, Wüthrich K (1999)
Bioreaction network topology and metabolic flux ratio analysis by biosynthetic
fractional 13C labeling and two-dimensional NMR spectroscopy. Metab Eng 1:
189-197
Tanaka M, Murakami S, Shinke R, Aoki K (1999) Reclassification of the strains with
low G+C contents of DNA belonging to the genus Gluconobacter Asai 1935.
Biosci Biotechnol Biochem 63: 989-992
Thöny-Meyer L, Fischer F, Künzler P, Ritz D, Hennecke H (1995) Escherichia coli
Genes Required for Cytochrome c Maturation. J Bacteriol 177: 4321-4326
Tonouchi N, Sugiyama M, Yokozeki K (2003) Coenzyme specificity of enzymes in the
oxidative pentose phosphate pathway of Gluconobacter oxydans. Biosci
Biotechnol Biochem 67: 2648-2651
Toyama H, Mathews FS, Adachi O, Matsushita K (2004) Quinohemoprotein alcohol
dehydrogenases: structure, function, and physiology. Arch Biochem Biophys 428:
10-21
Toyama H, Furuya N, Saichana I, Ano Y, Adachi O, Matsushita K (2007) Membrane-
bound, 2-keto-D-gluconate-Yielding D-gluconate dehydrogenase from
“Gluconobacter dioxyacetonicus” IFO 3271: Molecular properties and gene
disruption. Appl Environ Microbiol 73: 6551-6556
Trevors JT, Stradoub ME (1990) Electroporation of pKK1 silver-resistance plasmid
from Pseudomonas stutzeri AG259 into Pseudomonas putida CYM318. Curr
Microbiol 21: 103-7
Trumpower B (1990a) Cytochrome bc1 complexes of microorganism. Microbiol
Reviews 54: 101-129
Trumpower B (1990b) The proton motive Q-cycle. J biol chem 265: 11409-11412
Tseng CP, Albrecht J, Gunsalus RP (1995) Effect of microaerophilic cell growth
conditions on expression of the aerobic (cyoABCDE and cydAB) and anaerobic
VI References
100
(narGHJI, frdABCD, and dmsABC) respiratory pathway genes in Escherichia coli.
J Bacteriol 178: 1094-1098
Van Bogelen RA, Kelley PM, Neidhardt FC (1987) Differential induction of heat
shock, SOS, and oxidation stress regulons and accumulation of nucleotides in
Escherichia coli. J Bacteriol 169: 26-32
van der Oost J, Schepper M H, Stouthamer A, Westerhoff H, van Spanning RJM, de
Gier JWL (1995) Reversed cytochrome c electron transfer through the bc1-
complex enables an oxidase mutant (Aaa3/cbb3) of Paracoccus denitrificans to
grow on methylamine. FEBS Lett 371: 267-270
Verkhovskaya ML, Garcia-Horsman A, Puustinen A, Rigaud JL, Morgan JE,
Verkhovsky MI, Wikstrom M (1997) Glutamic acid 286 in subunit I of cytochrome
bo3 is involved in proton translocation. Biochem 94: 10128-10131
Wagner MA, Zahrl D, Rieser G, Koraimann G (2009) Growth phase- and cell division-
dependent activation and inactivation of the sigma 32 regulon in Escherichia coli.
J Bacteriol 191: 1695-1702
Weenk G, Olijve W, Harder W (1984) Ketogluconate formation by Gluconobacter
species. Appl. Microbiol. Biotechnol. 20: 400-405
Wiechert W (2001) 13C Metabolic flux analysis. Metabolic Engineering 3: 195-206
Wiechert W, Möllney M, Petersen S, de Graaf AA (2001) A universal framework for 13C metabolic flux analysis. Metabolic Engineering 3: 265-283
Wiechert W and Nöh K (2005) From stationary to instationary metabolic flux analysis.
Adv Biochem Engin/Biotechnol 92: 145-172
Yamada Y, Yukphan P (2008) Genera and species in acetic acid bacteria. Int J Food
Microbiol 125: 15-24
Yanisch-Perron C, Vieira J, Messing J (1985) Improved Ml3 phage cloning vectors
and host strains: nucleotide sequences of the M13mp18 and pUCl9 vectors. Gene
33: 103-119
Yoshpe-Purer Y. and Hensi Y (1976) Factors affecting catalase level and sensitivity
to hydrogen peroxide in Escherichia coli. Appl Environm Microbiol 32: 465-469
Zahn JA, Arciero DM, Hooper AB, Coats JR, DiSpirito AA (1997) Cytochrome c
peroxidase from Methylococcus capsulatus Bath Arch Microbiol 168: 362-372
Zamboni N, Fendt SM, Rühl M, Sauer U (2009) 13C-based metabolic flux analysis.
Nature Protocols 4: 878-892
Zeilstra-Ryallis JH, Gabbert K, Mouncey NJ, Kaplan S, Kranz RG (1997) Analysis of
the fnrL gene and its function in Rhodobacter capsulatus. J Bacteriol 179: 7264-
7273
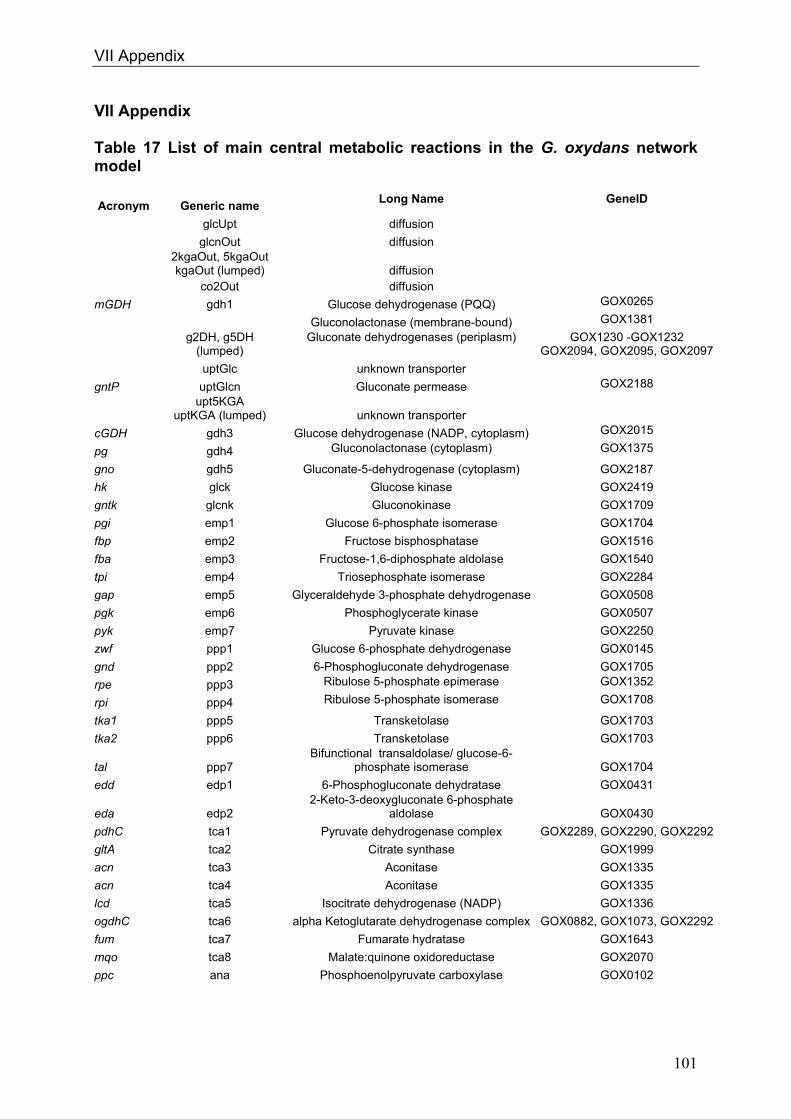
VII Appendix
101
VII Appendix Table 17 List of main central metabolic reactions in the G. oxydans network model
Acronym Generic name Long Name GeneID
glcUpt diffusion
glcnOut diffusion
2kgaOut, 5kgaOut kgaOut (lumped) diffusion
co2Out diffusion
mGDH gdh1 Glucose dehydrogenase (PQQ) GOX0265
Gluconolactonase (membrane-bound) GOX1381
g2DH, g5DH
(lumped) Gluconate dehydrogenases (periplasm) GOX1230 -GOX1232
GOX2094, GOX2095, GOX2097
uptGlc unknown transporter
gntP uptGlcn Gluconate permease GOX2188
upt5KGA
uptKGA (lumped) unknown transporter
cGDH gdh3 Glucose dehydrogenase (NADP, cytoplasm) GOX2015
pg gdh4 Gluconolactonase (cytoplasm) GOX1375
gno gdh5 Gluconate-5-dehydrogenase (cytoplasm) GOX2187
hk glck Glucose kinase GOX2419
gntk glcnk Gluconokinase GOX1709
pgi emp1 Glucose 6-phosphate isomerase GOX1704
fbp emp2 Fructose bisphosphatase GOX1516
fba emp3 Fructose-1,6-diphosphate aldolase GOX1540
tpi emp4 Triosephosphate isomerase GOX2284
gap emp5 Glyceraldehyde 3-phosphate dehydrogenase GOX0508
pgk emp6 Phosphoglycerate kinase GOX0507
pyk emp7 Pyruvate kinase GOX2250
zwf ppp1 Glucose 6-phosphate dehydrogenase GOX0145
gnd ppp2 6-Phosphogluconate dehydrogenase GOX1705
rpe ppp3 Ribulose 5-phosphate epimerase GOX1352
rpi ppp4 Ribulose 5-phosphate isomerase GOX1708
tka1 ppp5 Transketolase GOX1703
tka2 ppp6 Transketolase GOX1703
tal ppp7 Bifunctional transaldolase/ glucose-6-
phosphate isomerase GOX1704
edd edp1 6-Phosphogluconate dehydratase GOX0431
eda edp2 2-Keto-3-deoxygluconate 6-phosphate
aldolase GOX0430
pdhC tca1 Pyruvate dehydrogenase complex GOX2289, GOX2290, GOX2292
gltA tca2 Citrate synthase GOX1999
acn tca3 Aconitase GOX1335
acn tca4 Aconitase GOX1335
lcd tca5 Isocitrate dehydrogenase (NADP) GOX1336
ogdhC tca6 alpha Ketoglutarate dehydrogenase complex GOX0882, GOX1073, GOX2292
fum tca7 Fumarate hydratase GOX1643
mqo tca8 Malate:quinone oxidoreductase GOX2070
ppc ana Phosphoenolpyruvate carboxylase GOX0102
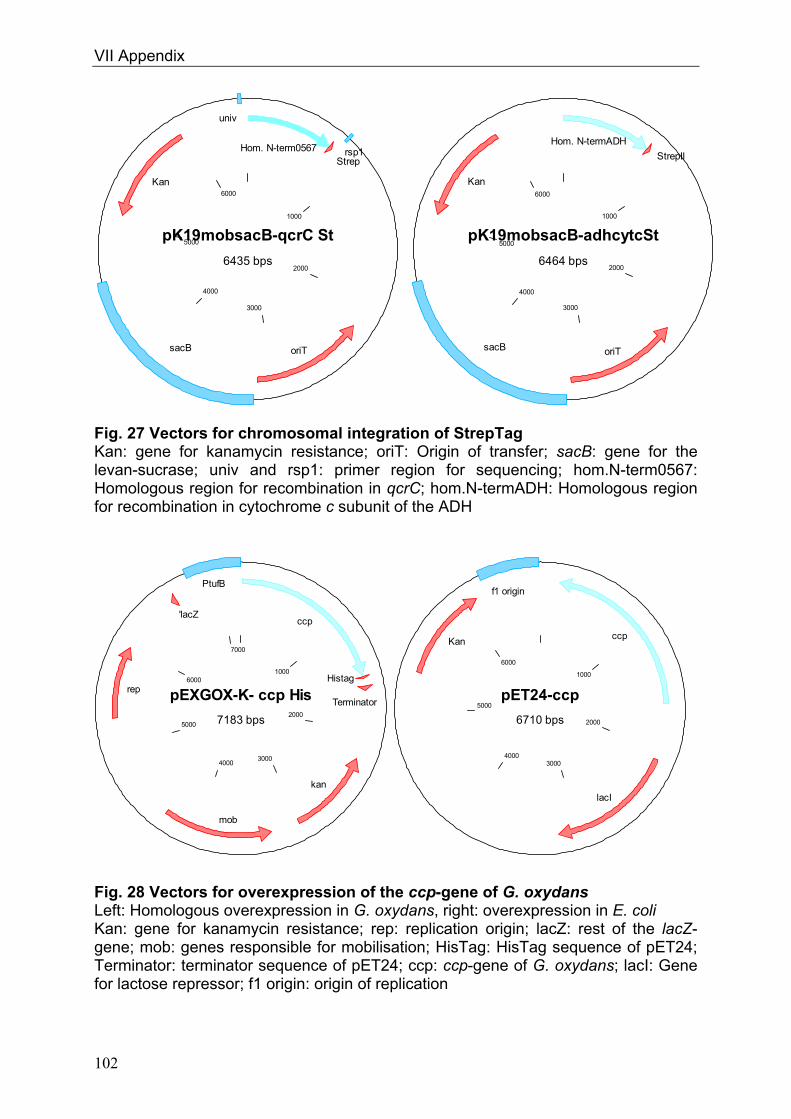
VII Appendix
102
pK19mobsacB-adhcytcSt
6464 bps
1000
2000
3000
4000
5000
6000
Hom. N-termADH
StrepII
oriTsacB
Kan
pK19mobsacB-qcrC St
6435 bps
1000
2000
3000
4000
5000
6000
Hom. N-term0567Strep
rsp1
oriTsacB
Kan
univ
pEXGOX-K- ccp His
7183 bps
1000
2000
30004000
5000
6000
7000
ccp
Histag
Terminator
kan
mob
rep
'lacZ
PtufB
pET24-ccp
6710 bps
1000
2000
30004000
5000
6000
ccp
lacI
Kan
f1 origin
Fig. 27 Vectors for chromosomal integration of StrepTag Kan: gene for kanamycin resistance; oriT: Origin of transfer; sacB: gene for the levan-sucrase; univ and rsp1: primer region for sequencing; hom.N-term0567: Homologous region for recombination in qcrC; hom.N-termADH: Homologous region for recombination in cytochrome c subunit of the ADH Fig. 28 Vectors for overexpression of the ccp-gene of G. oxydans Left: Homologous overexpression in G. oxydans, right: overexpression in E. coli Kan: gene for kanamycin resistance; rep: replication origin; lacZ: rest of the lacZ-gene; mob: genes responsible for mobilisation; HisTag: HisTag sequence of pET24; Terminator: terminator sequence of pET24; ccp: ccp-gene of G. oxydans; lacI: Gene for lactose repressor; f1 origin: origin of replication
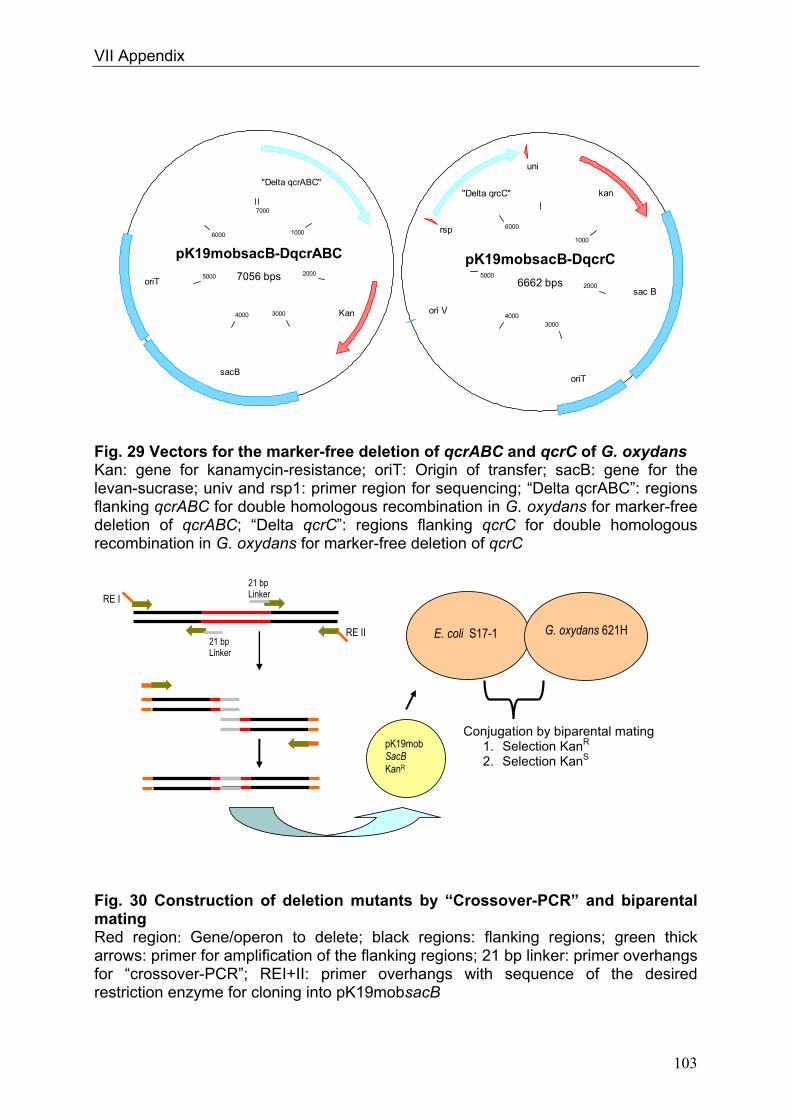
VII Appendix
103
pK19mobsacB-DqcrC
6662 bps
1000
2000
30004000
5000
6000
kan
sac B
oriT
ori V
rsp
"Delta qrcC"
uni
pK19mobsacB-DqcrABC
7056 bps
1000
2000
30004000
5000
6000
7000
"Delta qcrABC"
Kan
sacB
oriT
Fig. 29 Vectors for the marker-free deletion of qcrABC and qcrC of G. oxydans Kan: gene for kanamycin-resistance; oriT: Origin of transfer; sacB: gene for the levan-sucrase; univ and rsp1: primer region for sequencing; “Delta qcrABC”: regions flanking qcrABC for double homologous recombination in G. oxydans for marker-free deletion of qcrABC; “Delta qcrC”: regions flanking qcrC for double homologous recombination in G. oxydans for marker-free deletion of qcrC
Fig. 30 Construction of deletion mutants by “Crossover-PCR” and biparental mating Red region: Gene/operon to delete; black regions: flanking regions; green thick arrows: primer for amplification of the flanking regions; 21 bp linker: primer overhangs for “crossover-PCR”; REI+II: primer overhangs with sequence of the desired restriction enzyme for cloning into pK19mobsacB
RE I
RE II 21 bp Linker
21 bp Linker
pK19mobSacB KanR
E. coli S17-1 G. oxydans 621H
Conjugation by biparental mating 1. Selection KanR 2. Selection KanS
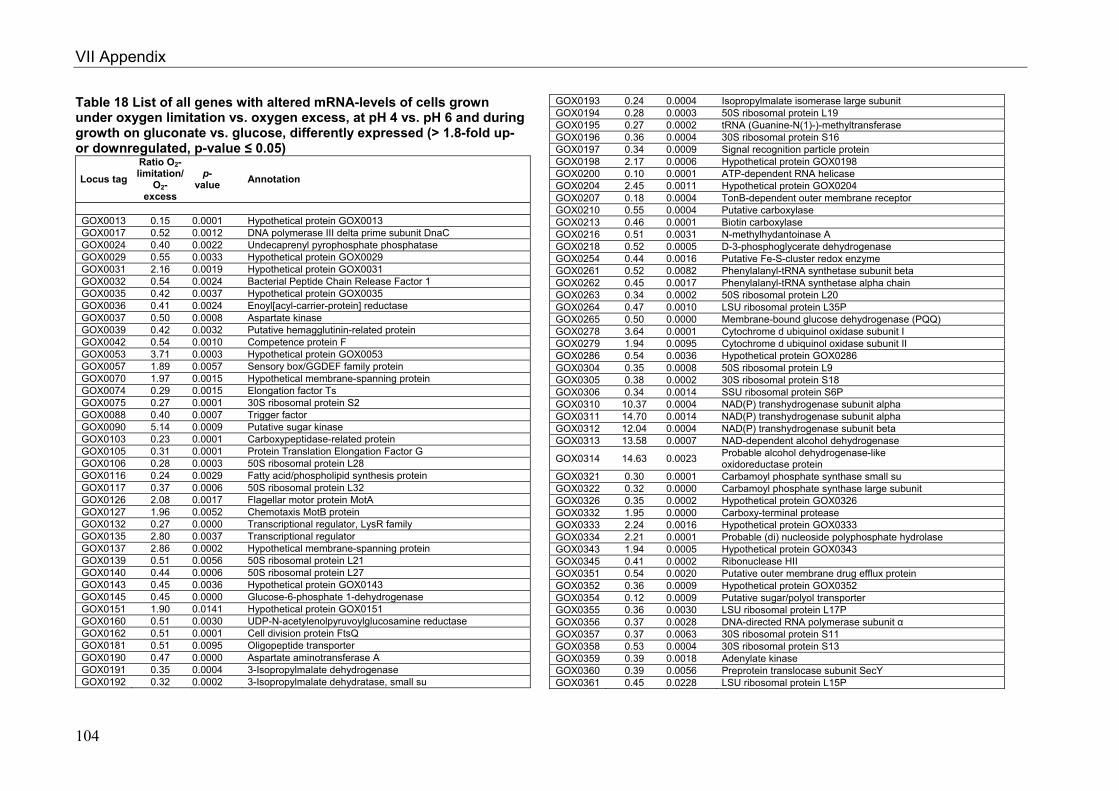
VII Appendix
104
Table 18 List of all genes with altered mRNA-levels of cells grown under oxygen limitation vs. oxygen excess, at pH 4 vs. pH 6 and during growth on gluconate vs. glucose, differently expressed (> 1.8-fold up- or downregulated, p-value ≤ 0.05)
Locus tag
Ratio O2-limitation/
O2-excess
p- value
Annotation
GOX0013 0.15 0.0001 Hypothetical protein GOX0013 GOX0017 0.52 0.0012 DNA polymerase III delta prime subunit DnaC GOX0024 0.40 0.0022 Undecaprenyl pyrophosphate phosphatase GOX0029 0.55 0.0033 Hypothetical protein GOX0029 GOX0031 2.16 0.0019 Hypothetical protein GOX0031 GOX0032 0.54 0.0024 Bacterial Peptide Chain Release Factor 1 GOX0035 0.42 0.0037 Hypothetical protein GOX0035 GOX0036 0.41 0.0024 Enoyl[acyl-carrier-protein] reductase GOX0037 0.50 0.0008 Aspartate kinase GOX0039 0.42 0.0032 Putative hemagglutinin-related protein GOX0042 0.54 0.0010 Competence protein F GOX0053 3.71 0.0003 Hypothetical protein GOX0053 GOX0057 1.89 0.0057 Sensory box/GGDEF family protein GOX0070 1.97 0.0015 Hypothetical membrane-spanning protein GOX0074 0.29 0.0015 Elongation factor Ts GOX0075 0.27 0.0001 30S ribosomal protein S2 GOX0088 0.40 0.0007 Trigger factor GOX0090 5.14 0.0009 Putative sugar kinase GOX0103 0.23 0.0001 Carboxypeptidase-related protein GOX0105 0.31 0.0001 Protein Translation Elongation Factor G GOX0106 0.28 0.0003 50S ribosomal protein L28 GOX0116 0.24 0.0029 Fatty acid/phospholipid synthesis protein GOX0117 0.37 0.0006 50S ribosomal protein L32 GOX0126 2.08 0.0017 Flagellar motor protein MotA GOX0127 1.96 0.0052 Chemotaxis MotB protein GOX0132 0.27 0.0000 Transcriptional regulator, LysR family GOX0135 2.80 0.0037 Transcriptional regulator GOX0137 2.86 0.0002 Hypothetical membrane-spanning protein GOX0139 0.51 0.0056 50S ribosomal protein L21 GOX0140 0.44 0.0006 50S ribosomal protein L27 GOX0143 0.45 0.0036 Hypothetical protein GOX0143 GOX0145 0.45 0.0000 Glucose-6-phosphate 1-dehydrogenase GOX0151 1.90 0.0141 Hypothetical protein GOX0151 GOX0160 0.51 0.0030 UDP-N-acetylenolpyruvoylglucosamine reductase GOX0162 0.51 0.0001 Cell division protein FtsQ GOX0181 0.51 0.0095 Oligopeptide transporter GOX0190 0.47 0.0000 Aspartate aminotransferase A GOX0191 0.35 0.0004 3-Isopropylmalate dehydrogenase GOX0192 0.32 0.0002 3-Isopropylmalate dehydratase, small su
GOX0193 0.24 0.0004 Isopropylmalate isomerase large subunit GOX0194 0.28 0.0003 50S ribosomal protein L19 GOX0195 0.27 0.0002 tRNA (Guanine-N(1)-)-methyltransferase GOX0196 0.36 0.0004 30S ribosomal protein S16 GOX0197 0.34 0.0009 Signal recognition particle protein GOX0198 2.17 0.0006 Hypothetical protein GOX0198 GOX0200 0.10 0.0001 ATP-dependent RNA helicase GOX0204 2.45 0.0011 Hypothetical protein GOX0204 GOX0207 0.18 0.0004 TonB-dependent outer membrane receptor GOX0210 0.55 0.0004 Putative carboxylase GOX0213 0.46 0.0001 Biotin carboxylase GOX0216 0.51 0.0031 N-methylhydantoinase A GOX0218 0.52 0.0005 D-3-phosphoglycerate dehydrogenase GOX0254 0.44 0.0016 Putative Fe-S-cluster redox enzyme GOX0261 0.52 0.0082 Phenylalanyl-tRNA synthetase subunit beta GOX0262 0.45 0.0017 Phenylalanyl-tRNA synthetase alpha chain GOX0263 0.34 0.0002 50S ribosomal protein L20 GOX0264 0.47 0.0010 LSU ribosomal protein L35P GOX0265 0.50 0.0000 Membrane-bound glucose dehydrogenase (PQQ) GOX0278 3.64 0.0001 Cytochrome d ubiquinol oxidase subunit I GOX0279 1.94 0.0095 Cytochrome d ubiquinol oxidase subunit II GOX0286 0.54 0.0036 Hypothetical protein GOX0286 GOX0304 0.35 0.0008 50S ribosomal protein L9 GOX0305 0.38 0.0002 30S ribosomal protein S18 GOX0306 0.34 0.0014 SSU ribosomal protein S6P GOX0310 10.37 0.0004 NAD(P) transhydrogenase subunit alpha GOX0311 14.70 0.0014 NAD(P) transhydrogenase subunit alpha GOX0312 12.04 0.0004 NAD(P) transhydrogenase subunit beta GOX0313 13.58 0.0007 NAD-dependent alcohol dehydrogenase
GOX0314 14.63 0.0023 Probable alcohol dehydrogenase-like oxidoreductase protein
GOX0321 0.30 0.0001 Carbamoyl phosphate synthase small su GOX0322 0.32 0.0000 Carbamoyl phosphate synthase large subunit GOX0326 0.35 0.0002 Hypothetical protein GOX0326 GOX0332 1.95 0.0000 Carboxy-terminal protease GOX0333 2.24 0.0016 Hypothetical protein GOX0333 GOX0334 2.21 0.0001 Probable (di) nucleoside polyphosphate hydrolase GOX0343 1.94 0.0005 Hypothetical protein GOX0343 GOX0345 0.41 0.0002 Ribonuclease HII GOX0351 0.54 0.0020 Putative outer membrane drug efflux protein GOX0352 0.36 0.0009 Hypothetical protein GOX0352 GOX0354 0.12 0.0009 Putative sugar/polyol transporter GOX0355 0.36 0.0030 LSU ribosomal protein L17P GOX0356 0.37 0.0028 DNA-directed RNA polymerase subunit α GOX0357 0.37 0.0063 30S ribosomal protein S11 GOX0358 0.53 0.0004 30S ribosomal protein S13 GOX0359 0.39 0.0018 Adenylate kinase GOX0360 0.39 0.0056 Preprotein translocase subunit SecY GOX0361 0.45 0.0228 LSU ribosomal protein L15P
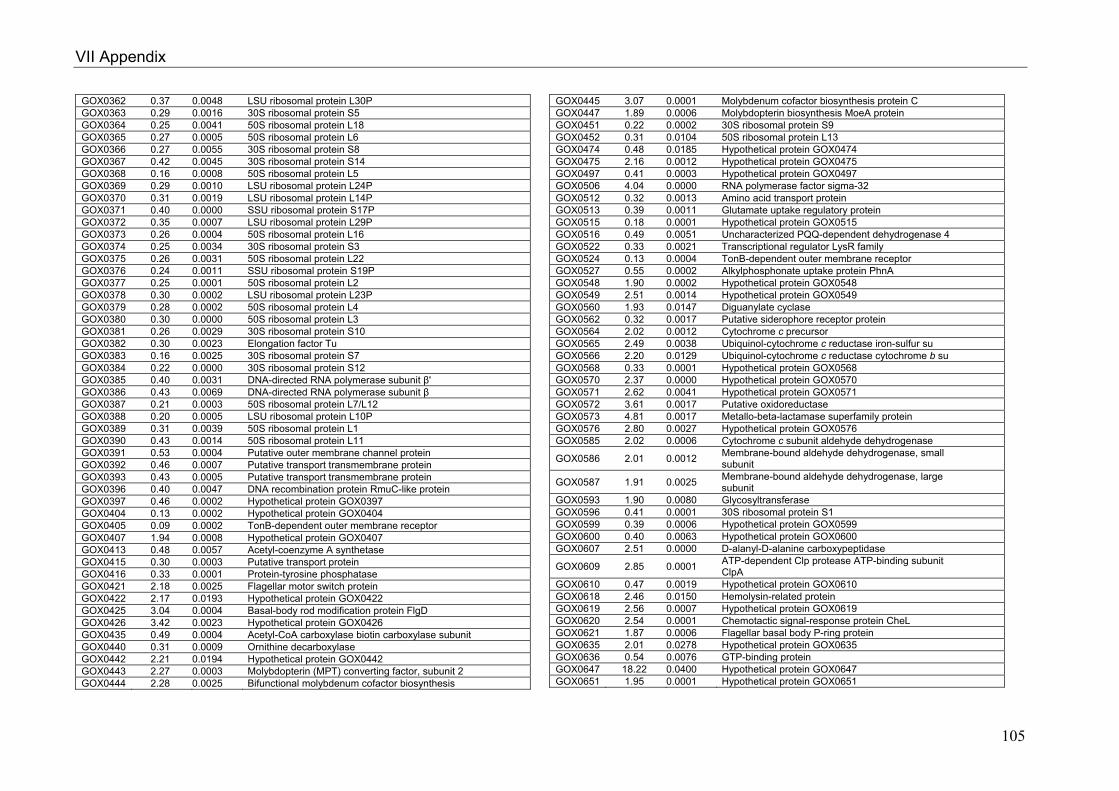
VII Appendix
105
GOX0362 0.37 0.0048 LSU ribosomal protein L30P GOX0363 0.29 0.0016 30S ribosomal protein S5 GOX0364 0.25 0.0041 50S ribosomal protein L18 GOX0365 0.27 0.0005 50S ribosomal protein L6 GOX0366 0.27 0.0055 30S ribosomal protein S8 GOX0367 0.42 0.0045 30S ribosomal protein S14 GOX0368 0.16 0.0008 50S ribosomal protein L5 GOX0369 0.29 0.0010 LSU ribosomal protein L24P GOX0370 0.31 0.0019 LSU ribosomal protein L14P GOX0371 0.40 0.0000 SSU ribosomal protein S17P GOX0372 0.35 0.0007 LSU ribosomal protein L29P GOX0373 0.26 0.0004 50S ribosomal protein L16 GOX0374 0.25 0.0034 30S ribosomal protein S3 GOX0375 0.26 0.0031 50S ribosomal protein L22 GOX0376 0.24 0.0011 SSU ribosomal protein S19P GOX0377 0.25 0.0001 50S ribosomal protein L2 GOX0378 0.30 0.0002 LSU ribosomal protein L23P GOX0379 0.28 0.0002 50S ribosomal protein L4 GOX0380 0.30 0.0000 50S ribosomal protein L3 GOX0381 0.26 0.0029 30S ribosomal protein S10 GOX0382 0.30 0.0023 Elongation factor Tu GOX0383 0.16 0.0025 30S ribosomal protein S7 GOX0384 0.22 0.0000 30S ribosomal protein S12 GOX0385 0.40 0.0031 DNA-directed RNA polymerase subunit β' GOX0386 0.43 0.0069 DNA-directed RNA polymerase subunit β GOX0387 0.21 0.0003 50S ribosomal protein L7/L12 GOX0388 0.20 0.0005 LSU ribosomal protein L10P GOX0389 0.31 0.0039 50S ribosomal protein L1 GOX0390 0.43 0.0014 50S ribosomal protein L11 GOX0391 0.53 0.0004 Putative outer membrane channel protein GOX0392 0.46 0.0007 Putative transport transmembrane protein GOX0393 0.43 0.0005 Putative transport transmembrane protein GOX0396 0.40 0.0047 DNA recombination protein RmuC-like protein GOX0397 0.46 0.0002 Hypothetical protein GOX0397 GOX0404 0.13 0.0002 Hypothetical protein GOX0404 GOX0405 0.09 0.0002 TonB-dependent outer membrane receptor GOX0407 1.94 0.0008 Hypothetical protein GOX0407 GOX0413 0.48 0.0057 Acetyl-coenzyme A synthetase GOX0415 0.30 0.0003 Putative transport protein GOX0416 0.33 0.0001 Protein-tyrosine phosphatase GOX0421 2.18 0.0025 Flagellar motor switch protein GOX0422 2.17 0.0193 Hypothetical protein GOX0422 GOX0425 3.04 0.0004 Basal-body rod modification protein FlgD GOX0426 3.42 0.0023 Hypothetical protein GOX0426 GOX0435 0.49 0.0004 Acetyl-CoA carboxylase biotin carboxylase subunit GOX0440 0.31 0.0009 Ornithine decarboxylase GOX0442 2.21 0.0194 Hypothetical protein GOX0442 GOX0443 2.27 0.0003 Molybdopterin (MPT) converting factor, subunit 2 GOX0444 2.28 0.0025 Bifunctional molybdenum cofactor biosynthesis
GOX0445 3.07 0.0001 Molybdenum cofactor biosynthesis protein C GOX0447 1.89 0.0006 Molybdopterin biosynthesis MoeA protein GOX0451 0.22 0.0002 30S ribosomal protein S9 GOX0452 0.31 0.0104 50S ribosomal protein L13 GOX0474 0.48 0.0185 Hypothetical protein GOX0474 GOX0475 2.16 0.0012 Hypothetical protein GOX0475 GOX0497 0.41 0.0003 Hypothetical protein GOX0497 GOX0506 4.04 0.0000 RNA polymerase factor sigma-32 GOX0512 0.32 0.0013 Amino acid transport protein GOX0513 0.39 0.0011 Glutamate uptake regulatory protein GOX0515 0.18 0.0001 Hypothetical protein GOX0515 GOX0516 0.49 0.0051 Uncharacterized PQQ-dependent dehydrogenase 4 GOX0522 0.33 0.0021 Transcriptional regulator LysR family GOX0524 0.13 0.0004 TonB-dependent outer membrane receptor GOX0527 0.55 0.0002 Alkylphosphonate uptake protein PhnA GOX0548 1.90 0.0002 Hypothetical protein GOX0548 GOX0549 2.51 0.0014 Hypothetical protein GOX0549 GOX0560 1.93 0.0147 Diguanylate cyclase GOX0562 0.32 0.0017 Putative siderophore receptor protein GOX0564 2.02 0.0012 Cytochrome c precursor GOX0565 2.49 0.0038 Ubiquinol-cytochrome c reductase iron-sulfur su GOX0566 2.20 0.0129 Ubiquinol-cytochrome c reductase cytochrome b su GOX0568 0.33 0.0001 Hypothetical protein GOX0568 GOX0570 2.37 0.0000 Hypothetical protein GOX0570 GOX0571 2.62 0.0041 Hypothetical protein GOX0571 GOX0572 3.61 0.0017 Putative oxidoreductase GOX0573 4.81 0.0017 Metallo-beta-lactamase superfamily protein GOX0576 2.80 0.0027 Hypothetical protein GOX0576 GOX0585 2.02 0.0006 Cytochrome c subunit aldehyde dehydrogenase
GOX0586 2.01 0.0012 Membrane-bound aldehyde dehydrogenase, small subunit
GOX0587 1.91 0.0025 Membrane-bound aldehyde dehydrogenase, large subunit
GOX0593 1.90 0.0080 Glycosyltransferase GOX0596 0.41 0.0001 30S ribosomal protein S1 GOX0599 0.39 0.0006 Hypothetical protein GOX0599 GOX0600 0.40 0.0063 Hypothetical protein GOX0600 GOX0607 2.51 0.0000 D-alanyl-D-alanine carboxypeptidase
GOX0609 2.85 0.0001 ATP-dependent Clp protease ATP-binding subunit ClpA
GOX0610 0.47 0.0019 Hypothetical protein GOX0610 GOX0618 2.46 0.0150 Hemolysin-related protein GOX0619 2.56 0.0007 Hypothetical protein GOX0619 GOX0620 2.54 0.0001 Chemotactic signal-response protein CheL GOX0621 1.87 0.0006 Flagellar basal body P-ring protein GOX0635 2.01 0.0278 Hypothetical protein GOX0635 GOX0636 0.54 0.0076 GTP-binding protein GOX0647 18.22 0.0400 Hypothetical protein GOX0647 GOX0651 1.95 0.0001 Hypothetical protein GOX0651
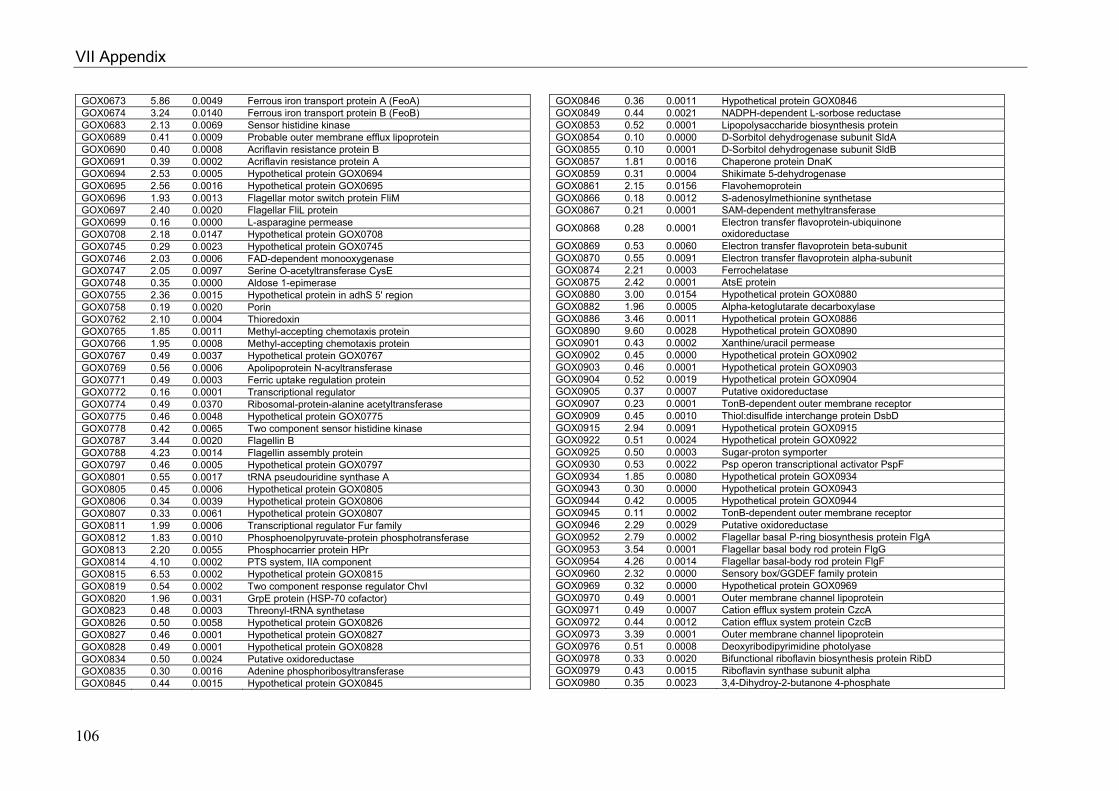
VII Appendix
106
GOX0673 5.86 0.0049 Ferrous iron transport protein A (FeoA) GOX0674 3.24 0.0140 Ferrous iron transport protein B (FeoB) GOX0683 2.13 0.0069 Sensor histidine kinase GOX0689 0.41 0.0009 Probable outer membrane efflux lipoprotein GOX0690 0.40 0.0008 Acriflavin resistance protein B GOX0691 0.39 0.0002 Acriflavin resistance protein A GOX0694 2.53 0.0005 Hypothetical protein GOX0694 GOX0695 2.56 0.0016 Hypothetical protein GOX0695 GOX0696 1.93 0.0013 Flagellar motor switch protein FliM GOX0697 2.40 0.0020 Flagellar FliL protein GOX0699 0.16 0.0000 L-asparagine permease GOX0708 2.18 0.0147 Hypothetical protein GOX0708 GOX0745 0.29 0.0023 Hypothetical protein GOX0745 GOX0746 2.03 0.0006 FAD-dependent monooxygenase GOX0747 2.05 0.0097 Serine O-acetyltransferase CysE GOX0748 0.35 0.0000 Aldose 1-epimerase GOX0755 2.36 0.0015 Hypothetical protein in adhS 5' region GOX0758 0.19 0.0020 Porin GOX0762 2.10 0.0004 Thioredoxin GOX0765 1.85 0.0011 Methyl-accepting chemotaxis protein GOX0766 1.95 0.0008 Methyl-accepting chemotaxis protein GOX0767 0.49 0.0037 Hypothetical protein GOX0767 GOX0769 0.56 0.0006 Apolipoprotein N-acyltransferase GOX0771 0.49 0.0003 Ferric uptake regulation protein GOX0772 0.16 0.0001 Transcriptional regulator GOX0774 0.49 0.0370 Ribosomal-protein-alanine acetyltransferase GOX0775 0.46 0.0048 Hypothetical protein GOX0775 GOX0778 0.42 0.0065 Two component sensor histidine kinase GOX0787 3.44 0.0020 Flagellin B GOX0788 4.23 0.0014 Flagellin assembly protein GOX0797 0.46 0.0005 Hypothetical protein GOX0797 GOX0801 0.55 0.0017 tRNA pseudouridine synthase A GOX0805 0.45 0.0006 Hypothetical protein GOX0805 GOX0806 0.34 0.0039 Hypothetical protein GOX0806 GOX0807 0.33 0.0061 Hypothetical protein GOX0807 GOX0811 1.99 0.0006 Transcriptional regulator Fur family GOX0812 1.83 0.0010 Phosphoenolpyruvate-protein phosphotransferase GOX0813 2.20 0.0055 Phosphocarrier protein HPr GOX0814 4.10 0.0002 PTS system, IIA component GOX0815 6.53 0.0002 Hypothetical protein GOX0815 GOX0819 0.54 0.0002 Two component response regulator ChvI GOX0820 1.96 0.0031 GrpE protein (HSP-70 cofactor) GOX0823 0.48 0.0003 Threonyl-tRNA synthetase GOX0826 0.50 0.0058 Hypothetical protein GOX0826 GOX0827 0.46 0.0001 Hypothetical protein GOX0827 GOX0828 0.49 0.0001 Hypothetical protein GOX0828 GOX0834 0.50 0.0024 Putative oxidoreductase GOX0835 0.30 0.0016 Adenine phosphoribosyltransferase GOX0845 0.44 0.0015 Hypothetical protein GOX0845
GOX0846 0.36 0.0011 Hypothetical protein GOX0846 GOX0849 0.44 0.0021 NADPH-dependent L-sorbose reductase GOX0853 0.52 0.0001 Lipopolysaccharide biosynthesis protein GOX0854 0.10 0.0000 D-Sorbitol dehydrogenase subunit SldA GOX0855 0.10 0.0001 D-Sorbitol dehydrogenase subunit SldB GOX0857 1.81 0.0016 Chaperone protein DnaK GOX0859 0.31 0.0004 Shikimate 5-dehydrogenase GOX0861 2.15 0.0156 Flavohemoprotein GOX0866 0.18 0.0012 S-adenosylmethionine synthetase GOX0867 0.21 0.0001 SAM-dependent methyltransferase
GOX0868 0.28 0.0001 Electron transfer flavoprotein-ubiquinone oxidoreductase
GOX0869 0.53 0.0060 Electron transfer flavoprotein beta-subunit GOX0870 0.55 0.0091 Electron transfer flavoprotein alpha-subunit GOX0874 2.21 0.0003 Ferrochelatase GOX0875 2.42 0.0001 AtsE protein GOX0880 3.00 0.0154 Hypothetical protein GOX0880 GOX0882 1.96 0.0005 Alpha-ketoglutarate decarboxylase GOX0886 3.46 0.0011 Hypothetical protein GOX0886 GOX0890 9.60 0.0028 Hypothetical protein GOX0890 GOX0901 0.43 0.0002 Xanthine/uracil permease GOX0902 0.45 0.0000 Hypothetical protein GOX0902 GOX0903 0.46 0.0001 Hypothetical protein GOX0903 GOX0904 0.52 0.0019 Hypothetical protein GOX0904 GOX0905 0.37 0.0007 Putative oxidoreductase GOX0907 0.23 0.0001 TonB-dependent outer membrane receptor GOX0909 0.45 0.0010 Thiol:disulfide interchange protein DsbD GOX0915 2.94 0.0091 Hypothetical protein GOX0915 GOX0922 0.51 0.0024 Hypothetical protein GOX0922 GOX0925 0.50 0.0003 Sugar-proton symporter GOX0930 0.53 0.0022 Psp operon transcriptional activator PspF GOX0934 1.85 0.0080 Hypothetical protein GOX0934 GOX0943 0.30 0.0000 Hypothetical protein GOX0943 GOX0944 0.42 0.0005 Hypothetical protein GOX0944 GOX0945 0.11 0.0002 TonB-dependent outer membrane receptor GOX0946 2.29 0.0029 Putative oxidoreductase GOX0952 2.79 0.0002 Flagellar basal P-ring biosynthesis protein FlgA GOX0953 3.54 0.0001 Flagellar basal body rod protein FlgG GOX0954 4.26 0.0014 Flagellar basal-body rod protein FlgF GOX0960 2.32 0.0000 Sensory box/GGDEF family protein GOX0969 0.32 0.0000 Hypothetical protein GOX0969 GOX0970 0.49 0.0001 Outer membrane channel lipoprotein GOX0971 0.49 0.0007 Cation efflux system protein CzcA GOX0972 0.44 0.0012 Cation efflux system protein CzcB GOX0973 3.39 0.0001 Outer membrane channel lipoprotein GOX0976 0.51 0.0008 Deoxyribodipyrimidine photolyase GOX0978 0.33 0.0020 Bifunctional riboflavin biosynthesis protein RibD GOX0979 0.43 0.0015 Riboflavin synthase subunit alpha GOX0980 0.35 0.0023 3,4-Dihydroy-2-butanone 4-phosphate

VII Appendix
107
synthase/GTP cyclohydrolase II GOX0981 0.44 0.0008 6,7-Dimethyl-8-ribityllumazine synthase GOX0984 0.51 0.0000 Coenzyme PQQ synthesis protein D GOX0986 0.37 0.0000 Pyrroloquinoline quinone biosynthesis protein PqqB GOX0987 0.44 0.0038 Coenzyme PQQ synthesis protein A GOX0990 0.56 0.0007 ATP phosphoribosyltransferase catalytic subunit GOX0996 2.34 0.0017 Transposase (class II) GOX1000 1.96 0.0328 Hypothetical protein GOX1000
GOX1003 0.44 0.0014 Septum formation associated protein (Maf-like protein)
GOX1010 0.54 0.0002 Levanase precursor
GOX1015 0.42 0.0013 TonB-dependent receptor of ferrichrome transport system
GOX1017 0.11 0.0001 TonB-dependent outer membrane receptor GOX1022 0.41 0.0060 Transcriptional regulator GOX1024 2.63 0.0000 Heat shock protein 90 GOX1025 3.69 0.0043 Flagellar hook-associated protein FlgL GOX1026 2.76 0.0049 Flagellar hook-associated protein 1 FlgK GOX1027 2.83 0.0022 Flagellar hook protein FlgE GOX1029 0.47 0.0041 Hypothetical protein GOX1029
GOX1038 1.87 0.0027 Septum formation associated protein (Maf-like protein)
GOX1041 1.81 0.0005 Hypothetical protein GOX1041 GOX1070 0.46 0.0075 Transcription termination factor Rho GOX1087 0.34 0.0003 Acetolactate synthase large subunit GOX1088 0.35 0.0001 Acetolactate synthase 3 regulatory subunit GOX1089 0.37 0.0006 Ketol-acid reductoisomerase GOX1090 0.27 0.0006 S-adenosylmethionine decarboxylase proenzyme GOX1091 0.11 0.0003 Spermidine synthase GOX1092 0.51 0.0000 Transcriptional regulator MarR family GOX1099 1.86 0.0003 Hypothetical protein GOX1099 GOX1107 3.16 0.0009 O-antigen biosynthesis protein RfbC GOX1108 0.49 0.0007 Hypothetical protein GOX1108 GOX1110 0.48 0.0032 ATP synthase B' chain GOX1111 0.40 0.0055 ATP synthase B' chain GOX1112 0.51 0.0027 ATP synthase C chain GOX1114 0.31 0.0001 Vitamin B12-dependent ribonucleotide reductase GOX1131 2.17 0.0001 Pyrroline-5-carboxylate reductase GOX1132 3.01 0.0015 Hypothetical protein GOX1132
GOX1137 0.44 0.0014 Probable lipopolysaccharide modification acyltransferase
GOX1138 0.52 0.0051 Catalase GOX1141 0.31 0.0002 LSU ribosomal protein L25P GOX1142 0.31 0.0008 Peptidyl-tRNA hydrolase GOX1151 0.54 0.0016 Hypothetical protein GOX1151 GOX1173 0.39 0.0014 Outer membrane heme receptor GOX1174 0.49 0.0079 Purine-cytosine permease GOX1176 0.50 0.0001 Hypothetical protein GOX1176 GOX1179 0.44 0.0003 Putative sugar uptake ABC transporter permease
GOX1190 2.07 0.0036 Glucose-1-phosphatase GOX1192 0.49 0.0070 Probable transcriptional regulator GOX1197 0.22 0.0006 Hypothetical protein GOX1197 GOX1198 0.25 0.0003 Sulfite reductase (Ferredoxin) GOX1199 0.35 0.0014 Putative oxidoreductase GOX1230 0.23 0.0003 Gluconate 2-dehydrogenase, cytochrome c subunit GOX1231 0.19 0.0001 Gluconate 2-dehydrogenase alpha chain GOX1232 0.26 0.0002 Gluconate 2-dehydrogenase gamma chain GOX1235 0.55 0.0098 Heat shock protein HSP33 GOX1236 0.33 0.0009 Ornithine carbamoyltransferase GOX1237 0.35 0.0010 Acetylornithine aminotransferase GOX1238 1.87 0.0029 D-aminopeptidase GOX1239 2.32 0.0032 Hypothetical protein GOX1239 GOX1244 0.44 0.0004 Putative enolase-phosphatase GOX1245 0.45 0.0034 Riboflavin kinase GOX1246 2.33 0.0817 TonB-dependent receptor protein GOX1247 1.92 0.0022 Hypothetical protein GOX1247 GOX1248 2.28 0.0014 Hypothetical protein GOX1248 GOX1269 0.29 0.0002 Hypothetical protein GOX1269 GOX1273 2.26 0.0016 Hypothetical protein GOX1273 GOX1280 1.82 0.0050 Hypothetical protein GOX1280 GOX1282 0.48 0.0004 Ribonuclease PH GOX1286 0.16 0.0004 Hypothetical protein GOX1286 GOX1287 0.12 0.0004 Biopolymer transport ExbB protein GOX1288 0.16 0.0000 Biopolymer transport ExbD protein GOX1289 0.18 0.0004 Biopolymer transport ExbD protein GOX1290 0.39 0.0000 Hypothetical protein GOX1290 GOX1291 1.82 0.0054 Flagellar basal body L-ring protein GOX1302 2.16 0.0028 Paraquat-inducible protein A GOX1303 1.96 0.0004 Paraquat-inducible protein B GOX1313 0.51 0.0111 F0F1 ATP synthase subunit beta GOX1314 0.50 0.0030 ATP synthase epsilon chain GOX1322 2.25 0.0135 Transposase (class I) GOX1329 5.29 0.0003 Small heat shock protein GOX1335 0.13 0.0002 Aconitate hydratase GOX1336 0.17 0.0002 Isocitrate dehydrogenase GOX1351 0.29 0.0002 Putative isomerase GOX1352 0.54 0.0013 Ribulose-phosphate 3-epimerase GOX1355 2.27 0.0102 Hypothetical protein GOX1355 GOX1359 2.59 0.0024 Excinuclease ABC subunit A GOX1360 1.82 0.0038 Hypothetical protein GOX1360 GOX1365 0.33 0.0000 ABC transporter permease protein GOX1366 0.33 0.0000 ABC transporter ATP-binding protein GOX1370 0.52 0.0060 Ferredoxin, 2Fe-2S GOX1381 0.39 0.0003 Gluconolactonase GOX1392 0.49 0.0000 Hypothetical protein GOX1392 GOX1414 2.18 0.0052 Chaperone protein DnaJ GOX1416 0.15 0.0003 Porin B precursur GOX1417 0.52 0.0002 Ferrichrome receptor FcuA

VII Appendix
108
GOX1418 0.19 0.0000 Carbohydrate-selective porin GOX1424 2.26 0.0045 Hypothetical protein GOX1424 GOX1432 0.46 0.0014 NADP-D-sorbitol dehydrogenase GOX1433 1.99 0.0005 Putative DnaJ-like protein GOX1434 0.56 0.0107 Hypothetical protein GOX1434 GOX1436 0.44 0.0004 Adenosine deaminase
GOX1440 0.49 0.0023 S-adenosylmethionine:tRNA ribosyltransferase-isomerase
GOX1442 8.96 0.0007 Hypothetical protein GOX1442 GOX1449 1.82 0.0022 Hypothetical protein GOX1449 GOX1455 0.27 0.0004 ATP-dependent RNA helicase GOX1462 2.69 0.0051 Putative oxidoreductase
GOX1463 3.42 0.0011 ATP-dependent Clp protease, ATP-binding subunit ClpB
GOX1483 0.50 0.0002 Capsule polysaccharide export protein GOX1486 0.53 0.0065 Capsule polysaccharide export ATP-binding protein GOX1489 0.55 0.0009 Putative glycosyltransferase GOX1490 0.50 0.0001 Putative glycosyltransferase GOX1500 4.07 0.0003 Hypothetical protein GOX1500 GOX1501 3.88 0.0000 Hypothetical protein GOX1501 GOX1509 1.85 0.0042 Hypothetical protein GOX1509 GOX1516 0.38 0.0040 Fructose 1,6-bisphosphatase II GOX1521 2.07 0.0012 Hypothetical protein GOX1521 GOX1525 2.18 0.0030 Flagellar biosynthetic protein FliQ GOX1526 2.55 0.0006 Flagellar hook-basal body protein FleE GOX1527 2.65 0.0031 Flagellar basal body rod protein FlgC GOX1528 3.41 0.0062 Flagellar basal-body rod protein FlgB GOX1541 0.53 0.0034 Hypothetical protein GOX1541 GOX1542 0.40 0.0002 Putative aluminum resistance protein GOX1543 0.43 0.0011 Hypothetical protein GOX1543 GOX1549 2.06 0.0006 Methyl-accepting chemotaxis protein GOX1550 2.32 0.0003 Chemotaxis protein CheX GOX1551 2.16 0.0001 Chemotaxis protein CheY GOX1552 1.98 0.0004 Chemotaxis protein CheA GOX1560 1.89 0.0013 Hypothetical protein GOX1560 GOX1563 0.21 0.0044 Hypothetical protein GOX1563 GOX1567 0.48 0.0008 DedA family protein GOX1569 0.40 0.0003 Tricorn protease homolog GOX1572 0.43 0.0004 Amino acid ABC transporter ATP-binding protein
GOX1573 0.53 0.0047 Amino acid ABC transporter binding protein and permease protein
GOX1576 2.70 0.0023 Transposase (class II)
GOX1577 2.82 0.0000 ATP-dependent Clp protease ATP-binding subunit ClpA
GOX1578 2.92 0.0015 Hypothetical protein GOX1578 GOX1579 0.39 0.0015 Hypothetical protein associated with nus operon GOX1582 0.51 0.0008 Translation initiation factor IF-2 GOX1587 0.53 0.0071 Putative 2-nitropropane dioxygenase GOX1593 0.52 0.0002 Nucleoside hydrolase
GOX1613 3.78 0.0019 Sensory box/GGDEF family protein GOX1617 2.32 0.0004 Hypothetical protein GOX1617 GOX1628 2.00 0.0023 Protease GOX1636 4.60 0.0016 5-aminolevulinate synthase GOX1639 0.51 0.0004 Hypothetical protein GOX1639 GOX1641 0.52 0.0001 Bacteriophytochrome protein GOX1642 0.20 0.0000 Carboxypeptidase-related protein GOX1645 0.51 0.0004 Hypothetical protein GOX1645 GOX1646 0.55 0.0042 Hypothetical protein GOX1646 GOX1654 2.39 0.0004 Hypothetical protein GOX1654 GOX1662 0.39 0.0067 Hypothetical protein GOX1662 GOX1664 2.22 0.0022 Recombination factor protein RarA GOX1671 0.29 0.0041 O-succinylhomoserine sulfhydrylase GOX1675 0.37 0.0000 NADH dehydrogenase type II GOX1688 3.06 0.0000 Peptidoglycan-associated lipoprotein GOX1689 1.99 0.0011 Hypothetical protein GOX1689 GOX1697 2.44 0.0059 Hypothetical protein GOX1697 GOX1698 2.00 0.0089 Aminopeptidase GOX1699 0.27 0.0004 Hypothetical protein GOX1699 GOX1703 0.47 0.0089 Transketolase GOX1704 0.44 0.0163 Bifunctional transaldolase/phosoglucose isomerase GOX1705 0.44 0.0228 6-phosphogluconate dehydrogenase-like protein GOX1719 1.85 0.0024 Adenine deaminase GOX1734 0.55 0.0007 Hypothetical protein GOX1734 GOX1736 0.47 0.0032 Hypothetical protein GOX1736 GOX1742 2.37 0.0094 Hypothetical protein GOX1742 GOX1745 2.13 0.0026 Hypothetical protein GOX1745 GOX1747 0.55 0.0007 Aaspartyl-tRNA synthetase GOX1752 2.27 0.0001 Deoxyguanosinetriphosphate triphosphohydrolase GOX1768 2.22 0.0038 Alkylated DNA repair protein AlkB GOX1773 3.29 0.0019 Putative LacX protein GOX1774 4.03 0.0002 Putative ATP-sensitive potassium channel protein GOX1775 1.99 0.0012 SpoU rRNA methylase family protein GOX1779 6.93 0.0000 Putative LysM domain protein GOX1780 0.27 0.0005 30S ribosomal protein S4 GOX1781 0.18 0.0009 Bacterial Peptide Chain Release Factor 3 GOX1796 0.45 0.0049 TonB-dependent outer membrane receptor GOX1814 0.50 0.0023 Undecaprenyl pyrophosphate synthetase GOX1815 0.45 0.0111 Phosphatidate cytidylyltransferase
GOX1827 0.51 0.0012 Pputative inner membrane protein translocase component YidC
GOX1828 0.44 0.0001 GTPase EngB GOX1829 0.49 0.0021 Acetylglutamate kinase GOX1832 0.43 0.0013 Succinyl-diaminopimelate desuccinylase GOX1834 0.50 0.0001 tRNA pseudouridine synthase A GOX1841 3.32 0.0002 Hypothetical protein GOX1841 GOX1851 0.19 0.0002 Putative oxidoreductase GOX1852 0.23 0.0004 Glutamate synthase GOX1857 0.12 0.0001 Uncharacterized PQQ-containing DH1

VII Appendix
109
GOX1858 2.02 0.0007 Hypothetical protein GOX1858 GOX1861 0.53 0.0037 glutathione synthetase GOX1863 3.42 0.0003 Hypothetical protein GOX1863 GOX1864 2.97 0.0016 Protoheme IX farnesyltransferase GOX1870 2.32 0.0320 Hypothetical protein GOX1870 GOX1873 0.41 0.0007 DNA mismatch repair protein GOX1875 2.05 0.0012 Hypothetical protein GOX1875 GOX1883 2.13 0.0011 Porphobilinogen deaminase GOX1890 1.90 0.0021 Hypothetical protein GOX1890 GOX1895 4.12 0.0015 Hypothetical protein GOX1895 GOX1896 6.43 0.0017 Coproporphyrinogen III oxidase GOX1898 2.08 0.0012 Hypothetical protein GOX1898 GOX1900 2.09 0.0163 Putative carboxymethylenebutenolidase GOX1903 0.12 0.0001 TonB-dependent receptor protein GOX1911 2.82 0.0016 Cytochrome o ubiquinol oxidase subunit II GOX1912 2.70 0.0105 Cytochrome o ubiquinol oxidase subunit I GOX1913 3.56 0.0000 Cytochrome o ubiquinol oxidase subunit III GOX1914 3.81 0.0040 Cytochrome o ubiquinol oxidase subunit IV GOX1917 2.12 0.0152 ATP-dependent DNA helicase GOX1923 2.06 0.0016 Hypothetical protein GOX1923 GOX1928 2.94 0.0000 Hypothetical protein GOX1928 GOX1942 2.25 0.0008 Hypothetical protein GOX1942 GOX1951 2.42 0.0036 Hypothetical protein GOX1951 GOX1953 7.10 0.0004 5-Methylcytosine-specific restriction enzyme GOX1957 0.40 0.0000 Putative thiol:disulfide interchange protein II GOX1971 0.26 0.0009 Galactose-proton symporter GOX1972 0.27 0.0009 Putative transport protein GOX1980 1.82 0.0033 Putative corrin/porphyrin methyltransferase GOX1982 0.25 0.0001 Hypothetical protein GOX1982 GOX1988 5.54 0.0006 Pyridoxamine 5'-phosphate oxidase GOX1992 2.73 0.0000 Osmotically inducible protein C GOX1994 0.51 0.0079 Ribonucleotide-diphosphate reductase subunit beta GOX1995 2.52 0.0016 Hypothetical protein GOX1995 GOX1999 0.50 0.0008 Citrate synthase GOX2010 0.40 0.0454 1-Acyl-sn-glycerol-3-phosphate acyltransferase GOX2015 0.44 0.0031 NAD(P)-dependent glucose 1-dehydrogenase GOX2028 0.17 0.0001 Hypothetical protein GOX2028 GOX2030 0.16 0.0045 Chaperone protein DnaK GOX2039 0.41 0.0024 Acyl-carrier-protein S-malonyltransferase GOX2041 0.47 0.0008 Acyl carrier protein GOX2042 0.55 0.0161 3-Oxoacyl-(acyl carrier protein) synthase II GOX2051 2.52 0.0024 Hypothetical protein GOX2051 GOX2052 2.83 0.0064 Hypothetical protein GOX2052 GOX2053 2.34 0.0339 Hypothetical protein GOX2053 GOX2062 0.51 0.0036 Hypothetical protein GOX2062 GOX2063 2.38 0.0002 Hypothetical protein GOX2063 GOX2066 8.58 0.0013 Glutaminase GOX2069 2.94 0.0014 Transcriptional regulator GOX2071 0.52 0.0027 D-Lactate dehydrogenase
GOX2073 0.39 0.0031 Formyltetrahydrofolate deformylase
GOX2074 0.41 0.0000 5-Methyltetrahydrofolate-S-homocysteine methyltransferase
GOX2109 1.80 0.0015 Hypothetical protein GOX2109 GOX2134 0.40 0.0001 Peptidyl-dipeptidase DCP GOX2135 0.47 0.0000 Hypothetical protein GOX2135 GOX2136 0.47 0.0010 Aminopeptidase GOX2142 0.45 0.0000 Hypothetical protein GOX2142 GOX2143 0.38 0.0012 ABC transporter ATP-binding protein GOX2147 0.50 0.0061 Endonuclease GOX2151 0.42 0.0021 Hypothetical protein GOX2151 GOX2152 2.58 0.0007 Hypothetical protein GOX2152 GOX2153 2.63 0.0020 Hypothetical protein GOX2153 GOX2163 3.04 0.0001 Cold shock protein GOX2165 2.11 0.0090 Transposase (class II) GOX2167 2.81 0.0044 F0F1 ATP synthase subunit beta GOX2168 3.14 0.0035 ATP synthase epsilon chain GOX2169 2.79 0.0049 ATP synthase subunit AtpI GOX2170 3.13 0.0139 Transmembrane protein GOX2171 3.30 0.0076 ATP synthase subunit a GOX2172 2.99 0.0007 ATP synthase subunit c GOX2173 2.64 0.0062 ATP synthase subunit b GOX2174 2.38 0.0084 F0F1 ATP synthase subunit alpha GOX2175 1.96 0.0089 ATP synthase gamma chain GOX2187 0.44 0.0006 Gluconate 5-dehydrogenase GOX2199 5.62 0.0000 Probable myosin-crossreactive antigen GOX2200 5.37 0.0000 Probable myosin-crossreactive antigen GOX2205 2.02 0.0083 Hypothetical protein GOX2205
GOX2206 2.00 0.0042 5-methyltetrahydropteroyltriglutamate--homocysteine methyltransferase
GOX2207 2.20 0.0119 Methylenetetrahydrofolate reductase GOX2209 2.05 0.0218 Truncated transposase (class I) GOX2225 2.10 0.0001 Thiamine biosynthesis protein ThiC GOX2228 1.90 0.0000 Thiamine-phosphate pyrophosphorylase GOX2237 1.98 0.0005 Protein translocase subunit SecB GOX2243 1.88 0.0015 Hypothetical protein GOX2243 GOX2246 3.52 0.0001 Hypothetical protein GOX2246 GOX2248 1.82 0.0009 Hypothetical protein GOX2248 GOX2252 2.60 0.0001 Hypothetical protein GOX2252 GOX2253 2.46 0.0001 Putative oxidoreductase GOX2255 1.84 0.0002 Hypothetical protein GOX2255 GOX2256 0.52 0.0040 Putative aminotransferase GOX2258 0.45 0.0004 Putative phytoene synthase GOX2260 0.42 0.0005 Squalene-hopene cyclase GOX2272 2.51 0.0002 Membrane-bound dipeptidase
GOX2274 2.83 0.0001 CDP-diacylglycerol-glycerol-3-phosphate 3-phosphatidyltransferase
GOX2278 2.53 0.0001 Hypothetical protein GOX2278 GOX2293 0.51 0.0055 Lipoyl synthase

VII Appendix
110
GOX2299 0.49 0.0027 Adenylosuccinate lyase GOX2308 3.08 0.0000 Delta-aminolevulinic acid dehydratase GOX2310 0.54 0.0068 Serine hydroxymethyl transferase GOX2311 2.03 0.0014 Hypothetical protein GOX2311
GOX2313 1.97 0.0027 Lipopolysaccharide core biosynthesis mannosyltransferase
GOX2326 3.03 0.0003 Hypothetical protein GOX2326 GOX2366 2.04 0.0148 Hypothetical protein GOX2366 GOX2373 3.72 0.0018 Ring-hydroxylating dioxygenase GOX2376 0.44 0.0033 Putative aldehyde dehydrogenase GOX2379 3.62 0.0003 Hypothetical protein GOX2379 GOX2386 1.88 0.0012 Hypothetical protein GOX2386 GOX2392 1.86 0.0054 DNA repair protein RadC GOX2397 2.32 0.0004 Small heat shock protein GOX2398 0.55 0.0064 50S ribosomal protein L31 GOX2401 0.48 0.0002 Protein-export membrane protein GOX2402 0.39 0.0025 Preprotein translocase subunit SecD GOX2406 2.53 0.0034 Putative RNA polymerase sigma-E factor protein 1 GOX2408 0.53 0.0082 Putative sensory transduction histidine kinase GOX2409 2.26 0.0000 Transport ATP-binding protein CydD GOX2410 2.48 0.0030 Transport ATP-binding protein CydD GOX2413 3.24 0.0003 Hypothetical protein GOX2413 GOX2443 1.95 0.0008 Hypothetical protein GOX2443 GOX2455 2.55 0.0036 Putative phage-related protein GOX2457 2.75 0.0006 Phage DNA Packaging Protein GOX2461 2.19 0.0070 Hypothetical protein GOX2461 GOX2470 2.54 0.0048 Hypothetical protein GOX2470 GOX2471 2.32 0.0100 Putative transcriptional regulator GOX2487 3.80 0.0008 Outer membrane protein TolC GOX2488 2.35 0.0002 Hypothetical protein GOX2488 GOX2491 0.35 0.0002 Dihydroxy-acid dehydratase GOX2494 1.87 0.0046 Hypothetical protein GOX2494 GOX2500 2.13 0.0011 Formamidopyrimidine-DNA glycosylase
GOX2520 4.15 0.0010 Hypothetical protein GOX2520 GOX2536 1.85 0.0072 Hypothetical protein GOX2536 GOX2546 0.42 0.0039 Replication protein A GOX2547 0.52 0.0008 Replication protein B
GOX2560 0.49 0.0029 RND-type multidrug efflux pump, membrane permease
GOX2561 0.50 0.0012 RND-type multidrug efflux pump, outer membrane protein
GOX2571 1.83 0.0042 Hypothetical protein GOX2571 GOX2578 0.46 0.0019 Putative isochorismatase GOX2579 0.51 0.0011 Transcriptional regulator GOX2580 0.42 0.0003 Hypothetical protein GOX2580 GOX2603 0.42 0.0007 Replicator initiator RepC GOX2616 0.35 0.0041 DotI GOX2646 3.15 0.0021 DNA integration/recombination/invertion protein GOX2647 2.15 0.0000 Hydroxyacylglutathione hydrolase GOX2649 1.84 0.0028 LysR family transcriptional regulator GOX2650 1.82 0.0103 Putative C4-dicarboxylate transport protein GOX2659 2.38 0.0009 Transposase GOX2660 1.91 0.0027 Transposase GOX2662 1.95 0.0024 Hypothetical protein GOX2662 GOX2668 1.93 0.0032 MucR family transcriptional regulator GOX2675 2.47 0.0003 Transposase GOX2684 3.17 0.0001 NAD(P)H-dependent 2-cyclohexen-1-one reductase GOX2685 2.77 0.0021 Transposase GOX2698 1.85 0.0007 Hypothetical protein GOX2698 GOX2699 2.17 0.0000 Hypothetical protein GOX2699 GOX2701 0.51 0.0062 DNA integration/recombination/invertion protein GOX2719 10.98 0.0001 Transposase GOX2720 12.34 0.0002 Hypothetical protein GOX2720 GOX2725 1.94 0.0079 Hypothetical protein GOX2725 GOX2733 2.00 0.0074 Hypothetical protein GOX2733
Locus tag
Ratio pH4/pH6
p-value Annotation
GOX0013 1.96 0.0052 Hypothetical protein GOX0013 GOX0204 0.39 0.0349 Hypothetical protein GOX0204 GOX0207 0.22 0.0023 TonB-dependent outer membrane receptor GOX0208 0.43 0.0473 Putative glucarate/galactarate transporter GOX0209 0.42 0.0036 Hypothetical protein GOX0209 GOX0210 0.44 0.0049 Putative carboxylase GOX0211 0.40 0.0033 Hypothetical protein GOX0211 GOX0212 0.44 0.0062 Biotin carboxyl carrier protein of acetyl-CoA carboxylase GOX0213 0.47 0.0016 Biotin carboxylase GOX0216 0.48 0.0007 N-methylhydantoinase A GOX0244 2.19 0.0458 Hypothetical membrane-spanning protein GOX0278 2.22 0.0111 Cytochrome d ubiquinol oxidase subunit I GOX0291 2.34 0.0009 Putative ferredoxin subunit of ring-hydroxylating dioxygenase
GOX0352 2.20 0.0262 Hypothetical protein GOX0352 GOX0433 2.50 0.0045 Hypothetical protein GOX0433 GOX0470 2.24 0.0339 Putative peroxidase GOX0497 2.31 0.0005 Hypothetical protein GOX0497 GOX0524 0.19 0.0087 TonB-dependent outer membrane receptor GOX0553 2.75 0.0065 Hypothetical protein GOX0553 GOX0576 2.11 0.0250 Hypothetical protein GOX0576 GOX0647 12.91 0.0015 Hypothetical protein GOX0647 GOX0652 0.34 0.0276 Xanthine dehydrogenase Xdh C protein GOX0653 0.34 0.0009 Xanthine dehydrogenase XdhB protein GOX0679 3.20 0.0443 Conserved protein of the SAM superfamily GOX0707 3.47 0.0421 DNA starvation/stationary phase protection protein Dps GOX0726 2.76 0.0088 Hypothetical protein GOX0726 GOX0756 1.83 0.0155 Alcohol dehydrogenase 15 kDa subunit GOX0768 0.49 0.0214 Transcriptional regulator
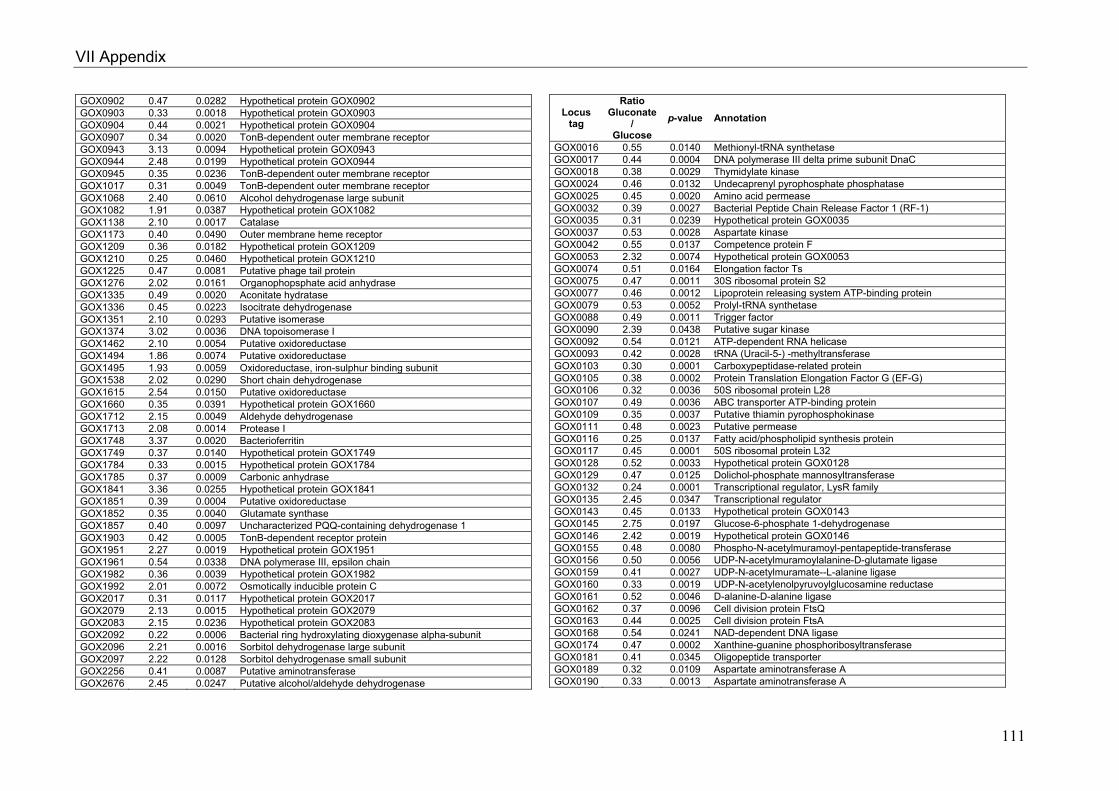
VII Appendix
111
GOX0902 0.47 0.0282 Hypothetical protein GOX0902 GOX0903 0.33 0.0018 Hypothetical protein GOX0903 GOX0904 0.44 0.0021 Hypothetical protein GOX0904 GOX0907 0.34 0.0020 TonB-dependent outer membrane receptor GOX0943 3.13 0.0094 Hypothetical protein GOX0943 GOX0944 2.48 0.0199 Hypothetical protein GOX0944 GOX0945 0.35 0.0236 TonB-dependent outer membrane receptor GOX1017 0.31 0.0049 TonB-dependent outer membrane receptor GOX1068 2.40 0.0610 Alcohol dehydrogenase large subunit GOX1082 1.91 0.0387 Hypothetical protein GOX1082 GOX1138 2.10 0.0017 Catalase GOX1173 0.40 0.0490 Outer membrane heme receptor GOX1209 0.36 0.0182 Hypothetical protein GOX1209 GOX1210 0.25 0.0460 Hypothetical protein GOX1210 GOX1225 0.47 0.0081 Putative phage tail protein GOX1276 2.02 0.0161 Organophopsphate acid anhydrase GOX1335 0.49 0.0020 Aconitate hydratase GOX1336 0.45 0.0223 Isocitrate dehydrogenase GOX1351 2.10 0.0293 Putative isomerase GOX1374 3.02 0.0036 DNA topoisomerase I GOX1462 2.10 0.0054 Putative oxidoreductase GOX1494 1.86 0.0074 Putative oxidoreductase GOX1495 1.93 0.0059 Oxidoreductase, iron-sulphur binding subunit GOX1538 2.02 0.0290 Short chain dehydrogenase GOX1615 2.54 0.0150 Putative oxidoreductase GOX1660 0.35 0.0391 Hypothetical protein GOX1660 GOX1712 2.15 0.0049 Aldehyde dehydrogenase GOX1713 2.08 0.0014 Protease I GOX1748 3.37 0.0020 Bacterioferritin GOX1749 0.37 0.0140 Hypothetical protein GOX1749 GOX1784 0.33 0.0015 Hypothetical protein GOX1784 GOX1785 0.37 0.0009 Carbonic anhydrase GOX1841 3.36 0.0255 Hypothetical protein GOX1841 GOX1851 0.39 0.0004 Putative oxidoreductase GOX1852 0.35 0.0040 Glutamate synthase GOX1857 0.40 0.0097 Uncharacterized PQQ-containing dehydrogenase 1 GOX1903 0.42 0.0005 TonB-dependent receptor protein GOX1951 2.27 0.0019 Hypothetical protein GOX1951 GOX1961 0.54 0.0338 DNA polymerase III, epsilon chain GOX1982 0.36 0.0039 Hypothetical protein GOX1982 GOX1992 2.01 0.0072 Osmotically inducible protein C GOX2017 0.31 0.0117 Hypothetical protein GOX2017 GOX2079 2.13 0.0015 Hypothetical protein GOX2079 GOX2083 2.15 0.0236 Hypothetical protein GOX2083 GOX2092 0.22 0.0006 Bacterial ring hydroxylating dioxygenase alpha-subunit GOX2096 2.21 0.0016 Sorbitol dehydrogenase large subunit GOX2097 2.22 0.0128 Sorbitol dehydrogenase small subunit GOX2256 0.41 0.0087 Putative aminotransferase GOX2676 2.45 0.0247 Putative alcohol/aldehyde dehydrogenase
Locus tag
Ratio Gluconate
/ Glucose
p-value Annotation
GOX0016 0.55 0.0140 Methionyl-tRNA synthetase GOX0017 0.44 0.0004 DNA polymerase III delta prime subunit DnaC GOX0018 0.38 0.0029 Thymidylate kinase GOX0024 0.46 0.0132 Undecaprenyl pyrophosphate phosphatase GOX0025 0.45 0.0020 Amino acid permease GOX0032 0.39 0.0027 Bacterial Peptide Chain Release Factor 1 (RF-1) GOX0035 0.31 0.0239 Hypothetical protein GOX0035 GOX0037 0.53 0.0028 Aspartate kinase GOX0042 0.55 0.0137 Competence protein F GOX0053 2.32 0.0074 Hypothetical protein GOX0053 GOX0074 0.51 0.0164 Elongation factor Ts GOX0075 0.47 0.0011 30S ribosomal protein S2 GOX0077 0.46 0.0012 Lipoprotein releasing system ATP-binding protein GOX0079 0.53 0.0052 Prolyl-tRNA synthetase GOX0088 0.49 0.0011 Trigger factor GOX0090 2.39 0.0438 Putative sugar kinase GOX0092 0.54 0.0121 ATP-dependent RNA helicase GOX0093 0.42 0.0028 tRNA (Uracil-5-) -methyltransferase GOX0103 0.30 0.0001 Carboxypeptidase-related protein GOX0105 0.38 0.0002 Protein Translation Elongation Factor G (EF-G) GOX0106 0.32 0.0036 50S ribosomal protein L28 GOX0107 0.49 0.0036 ABC transporter ATP-binding protein GOX0109 0.35 0.0037 Putative thiamin pyrophosphokinase GOX0111 0.48 0.0023 Putative permease GOX0116 0.25 0.0137 Fatty acid/phospholipid synthesis protein GOX0117 0.45 0.0001 50S ribosomal protein L32 GOX0128 0.52 0.0033 Hypothetical protein GOX0128 GOX0129 0.47 0.0125 Dolichol-phosphate mannosyltransferase GOX0132 0.24 0.0001 Transcriptional regulator, LysR family GOX0135 2.45 0.0347 Transcriptional regulator GOX0143 0.45 0.0133 Hypothetical protein GOX0143 GOX0145 2.75 0.0197 Glucose-6-phosphate 1-dehydrogenase GOX0146 2.42 0.0019 Hypothetical protein GOX0146 GOX0155 0.48 0.0080 Phospho-N-acetylmuramoyl-pentapeptide-transferase GOX0156 0.50 0.0056 UDP-N-acetylmuramoylalanine-D-glutamate ligase GOX0159 0.41 0.0027 UDP-N-acetylmuramate--L-alanine ligase GOX0160 0.33 0.0019 UDP-N-acetylenolpyruvoylglucosamine reductase GOX0161 0.52 0.0046 D-alanine-D-alanine ligase GOX0162 0.37 0.0096 Cell division protein FtsQ GOX0163 0.44 0.0025 Cell division protein FtsA GOX0168 0.54 0.0241 NAD-dependent DNA ligase GOX0174 0.47 0.0002 Xanthine-guanine phosphoribosyltransferase GOX0181 0.41 0.0345 Oligopeptide transporter GOX0189 0.32 0.0109 Aspartate aminotransferase A GOX0190 0.33 0.0013 Aspartate aminotransferase A
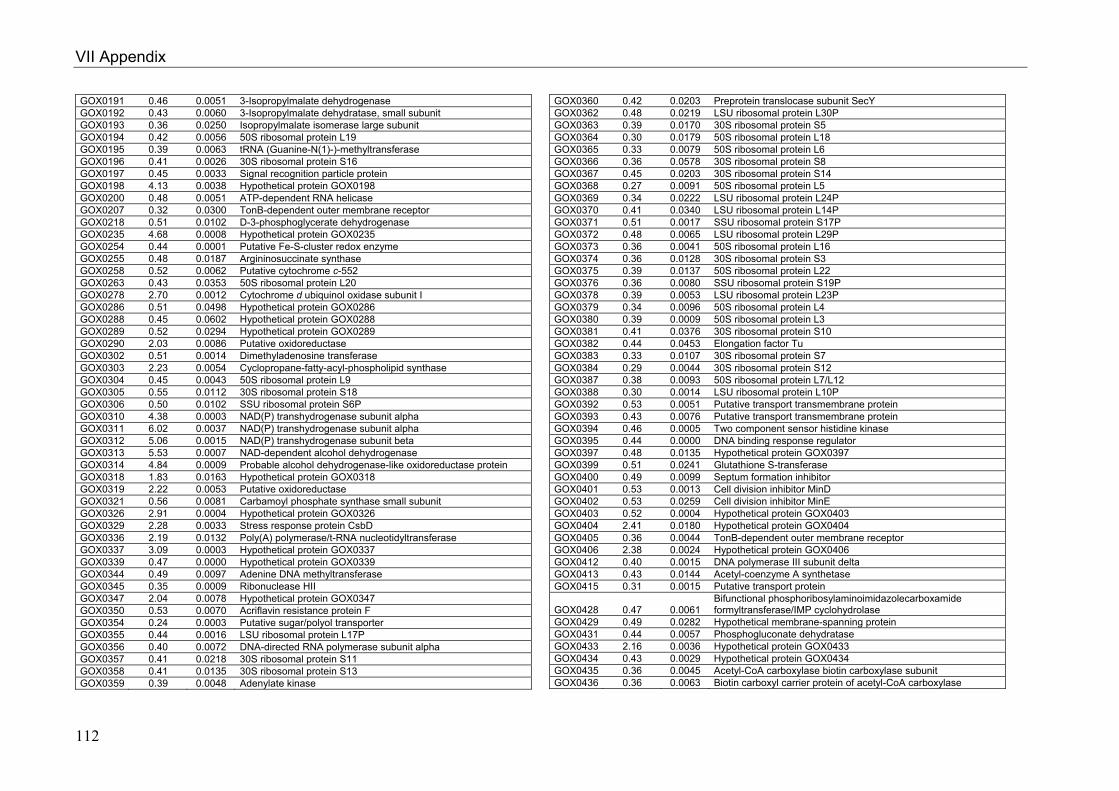
VII Appendix
112
GOX0191 0.46 0.0051 3-Isopropylmalate dehydrogenase GOX0192 0.43 0.0060 3-Isopropylmalate dehydratase, small subunit GOX0193 0.36 0.0250 Isopropylmalate isomerase large subunit GOX0194 0.42 0.0056 50S ribosomal protein L19 GOX0195 0.39 0.0063 tRNA (Guanine-N(1)-)-methyltransferase GOX0196 0.41 0.0026 30S ribosomal protein S16 GOX0197 0.45 0.0033 Signal recognition particle protein GOX0198 4.13 0.0038 Hypothetical protein GOX0198 GOX0200 0.48 0.0051 ATP-dependent RNA helicase GOX0207 0.32 0.0300 TonB-dependent outer membrane receptor GOX0218 0.51 0.0102 D-3-phosphoglycerate dehydrogenase GOX0235 4.68 0.0008 Hypothetical protein GOX0235 GOX0254 0.44 0.0001 Putative Fe-S-cluster redox enzyme GOX0255 0.48 0.0187 Argininosuccinate synthase GOX0258 0.52 0.0062 Putative cytochrome c-552 GOX0263 0.43 0.0353 50S ribosomal protein L20 GOX0278 2.70 0.0012 Cytochrome d ubiquinol oxidase subunit I GOX0286 0.51 0.0498 Hypothetical protein GOX0286 GOX0288 0.45 0.0602 Hypothetical protein GOX0288 GOX0289 0.52 0.0294 Hypothetical protein GOX0289 GOX0290 2.03 0.0086 Putative oxidoreductase GOX0302 0.51 0.0014 Dimethyladenosine transferase GOX0303 2.23 0.0054 Cyclopropane-fatty-acyl-phospholipid synthase GOX0304 0.45 0.0043 50S ribosomal protein L9 GOX0305 0.55 0.0112 30S ribosomal protein S18 GOX0306 0.50 0.0102 SSU ribosomal protein S6P GOX0310 4.38 0.0003 NAD(P) transhydrogenase subunit alpha GOX0311 6.02 0.0037 NAD(P) transhydrogenase subunit alpha GOX0312 5.06 0.0015 NAD(P) transhydrogenase subunit beta GOX0313 5.53 0.0007 NAD-dependent alcohol dehydrogenase GOX0314 4.84 0.0009 Probable alcohol dehydrogenase-like oxidoreductase protein GOX0318 1.83 0.0163 Hypothetical protein GOX0318 GOX0319 2.22 0.0053 Putative oxidoreductase GOX0321 0.56 0.0081 Carbamoyl phosphate synthase small subunit GOX0326 2.91 0.0004 Hypothetical protein GOX0326 GOX0329 2.28 0.0033 Stress response protein CsbD GOX0336 2.19 0.0132 Poly(A) polymerase/t-RNA nucleotidyltransferase GOX0337 3.09 0.0003 Hypothetical protein GOX0337 GOX0339 0.47 0.0000 Hypothetical protein GOX0339 GOX0344 0.49 0.0097 Adenine DNA methyltransferase GOX0345 0.35 0.0009 Ribonuclease HII GOX0347 2.04 0.0078 Hypothetical protein GOX0347 GOX0350 0.53 0.0070 Acriflavin resistance protein F GOX0354 0.24 0.0003 Putative sugar/polyol transporter GOX0355 0.44 0.0016 LSU ribosomal protein L17P GOX0356 0.40 0.0072 DNA-directed RNA polymerase subunit alpha GOX0357 0.41 0.0218 30S ribosomal protein S11 GOX0358 0.41 0.0135 30S ribosomal protein S13 GOX0359 0.39 0.0048 Adenylate kinase
GOX0360 0.42 0.0203 Preprotein translocase subunit SecY GOX0362 0.48 0.0219 LSU ribosomal protein L30P GOX0363 0.39 0.0170 30S ribosomal protein S5 GOX0364 0.30 0.0179 50S ribosomal protein L18 GOX0365 0.33 0.0079 50S ribosomal protein L6 GOX0366 0.36 0.0578 30S ribosomal protein S8 GOX0367 0.45 0.0203 30S ribosomal protein S14 GOX0368 0.27 0.0091 50S ribosomal protein L5 GOX0369 0.34 0.0222 LSU ribosomal protein L24P GOX0370 0.41 0.0340 LSU ribosomal protein L14P GOX0371 0.51 0.0017 SSU ribosomal protein S17P GOX0372 0.48 0.0065 LSU ribosomal protein L29P GOX0373 0.36 0.0041 50S ribosomal protein L16 GOX0374 0.36 0.0128 30S ribosomal protein S3 GOX0375 0.39 0.0137 50S ribosomal protein L22 GOX0376 0.36 0.0080 SSU ribosomal protein S19P GOX0378 0.39 0.0053 LSU ribosomal protein L23P GOX0379 0.34 0.0096 50S ribosomal protein L4 GOX0380 0.39 0.0009 50S ribosomal protein L3 GOX0381 0.41 0.0376 30S ribosomal protein S10 GOX0382 0.44 0.0453 Elongation factor Tu GOX0383 0.33 0.0107 30S ribosomal protein S7 GOX0384 0.29 0.0044 30S ribosomal protein S12 GOX0387 0.38 0.0093 50S ribosomal protein L7/L12 GOX0388 0.30 0.0014 LSU ribosomal protein L10P GOX0392 0.53 0.0051 Putative transport transmembrane protein GOX0393 0.43 0.0076 Putative transport transmembrane protein GOX0394 0.46 0.0005 Two component sensor histidine kinase GOX0395 0.44 0.0000 DNA binding response regulator GOX0397 0.48 0.0135 Hypothetical protein GOX0397 GOX0399 0.51 0.0241 Glutathione S-transferase GOX0400 0.49 0.0099 Septum formation inhibitor GOX0401 0.53 0.0013 Cell division inhibitor MinD GOX0402 0.53 0.0259 Cell division inhibitor MinE GOX0403 0.52 0.0004 Hypothetical protein GOX0403 GOX0404 2.41 0.0180 Hypothetical protein GOX0404 GOX0405 0.36 0.0044 TonB-dependent outer membrane receptor GOX0406 2.38 0.0024 Hypothetical protein GOX0406 GOX0412 0.40 0.0015 DNA polymerase III subunit delta GOX0413 0.43 0.0144 Acetyl-coenzyme A synthetase GOX0415 0.31 0.0015 Putative transport protein
GOX0428 0.47 0.0061 Bifunctional phosphoribosylaminoimidazolecarboxamide formyltransferase/IMP cyclohydrolase
GOX0429 0.49 0.0282 Hypothetical membrane-spanning protein GOX0431 0.44 0.0057 Phosphogluconate dehydratase GOX0433 2.16 0.0036 Hypothetical protein GOX0433 GOX0434 0.43 0.0029 Hypothetical protein GOX0434 GOX0435 0.36 0.0045 Acetyl-CoA carboxylase biotin carboxylase subunit GOX0436 0.36 0.0063 Biotin carboxyl carrier protein of acetyl-CoA carboxylase
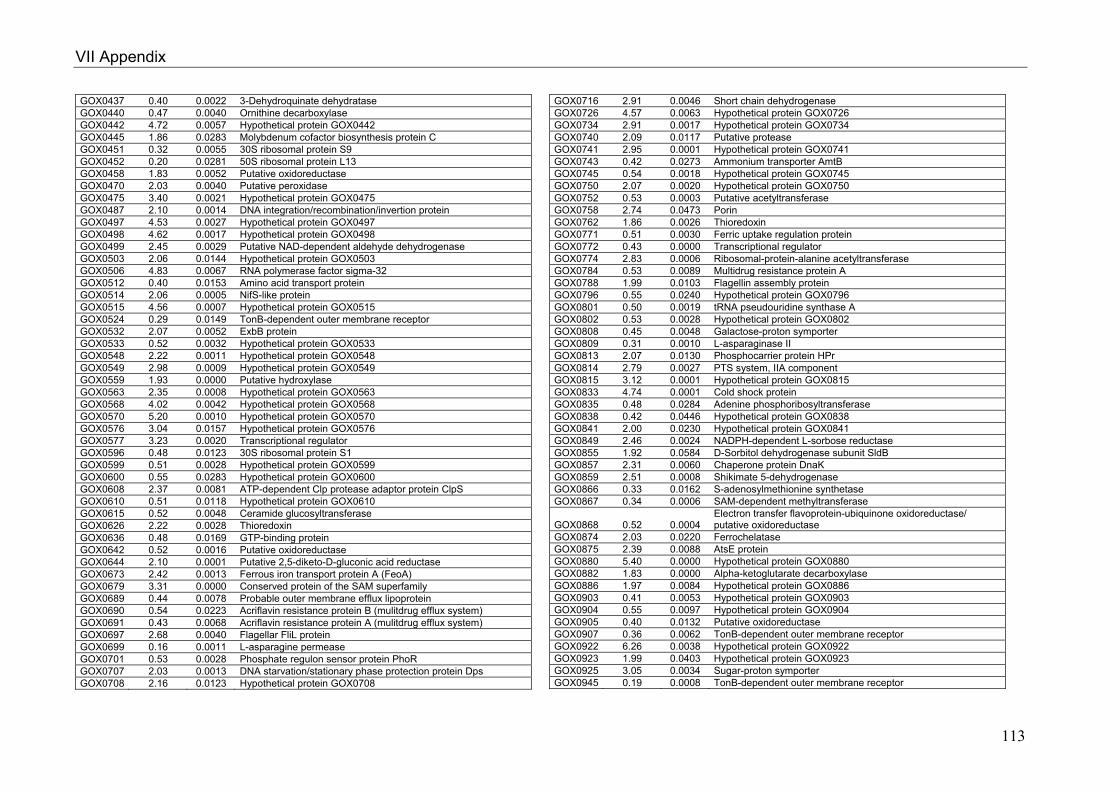
VII Appendix
113
GOX0437 0.40 0.0022 3-Dehydroquinate dehydratase GOX0440 0.47 0.0040 Ornithine decarboxylase GOX0442 4.72 0.0057 Hypothetical protein GOX0442 GOX0445 1.86 0.0283 Molybdenum cofactor biosynthesis protein C GOX0451 0.32 0.0055 30S ribosomal protein S9 GOX0452 0.20 0.0281 50S ribosomal protein L13 GOX0458 1.83 0.0052 Putative oxidoreductase GOX0470 2.03 0.0040 Putative peroxidase GOX0475 3.40 0.0021 Hypothetical protein GOX0475 GOX0487 2.10 0.0014 DNA integration/recombination/invertion protein GOX0497 4.53 0.0027 Hypothetical protein GOX0497 GOX0498 4.62 0.0017 Hypothetical protein GOX0498 GOX0499 2.45 0.0029 Putative NAD-dependent aldehyde dehydrogenase GOX0503 2.06 0.0144 Hypothetical protein GOX0503 GOX0506 4.83 0.0067 RNA polymerase factor sigma-32 GOX0512 0.40 0.0153 Amino acid transport protein GOX0514 2.06 0.0005 NifS-like protein GOX0515 4.56 0.0007 Hypothetical protein GOX0515 GOX0524 0.29 0.0149 TonB-dependent outer membrane receptor GOX0532 2.07 0.0052 ExbB protein GOX0533 0.52 0.0032 Hypothetical protein GOX0533 GOX0548 2.22 0.0011 Hypothetical protein GOX0548 GOX0549 2.98 0.0009 Hypothetical protein GOX0549 GOX0559 1.93 0.0000 Putative hydroxylase GOX0563 2.35 0.0008 Hypothetical protein GOX0563 GOX0568 4.02 0.0042 Hypothetical protein GOX0568 GOX0570 5.20 0.0010 Hypothetical protein GOX0570 GOX0576 3.04 0.0157 Hypothetical protein GOX0576 GOX0577 3.23 0.0020 Transcriptional regulator GOX0596 0.48 0.0123 30S ribosomal protein S1 GOX0599 0.51 0.0028 Hypothetical protein GOX0599 GOX0600 0.55 0.0283 Hypothetical protein GOX0600 GOX0608 2.37 0.0081 ATP-dependent Clp protease adaptor protein ClpS GOX0610 0.51 0.0118 Hypothetical protein GOX0610 GOX0615 0.52 0.0048 Ceramide glucosyltransferase GOX0626 2.22 0.0028 Thioredoxin GOX0636 0.48 0.0169 GTP-binding protein GOX0642 0.52 0.0016 Putative oxidoreductase GOX0644 2.10 0.0001 Putative 2,5-diketo-D-gluconic acid reductase GOX0673 2.42 0.0013 Ferrous iron transport protein A (FeoA) GOX0679 3.31 0.0000 Conserved protein of the SAM superfamily GOX0689 0.44 0.0078 Probable outer membrane efflux lipoprotein GOX0690 0.54 0.0223 Acriflavin resistance protein B (mulitdrug efflux system) GOX0691 0.43 0.0068 Acriflavin resistance protein A (mulitdrug efflux system) GOX0697 2.68 0.0040 Flagellar FliL protein GOX0699 0.16 0.0011 L-asparagine permease GOX0701 0.53 0.0028 Phosphate regulon sensor protein PhoR GOX0707 2.03 0.0013 DNA starvation/stationary phase protection protein Dps GOX0708 2.16 0.0123 Hypothetical protein GOX0708
GOX0716 2.91 0.0046 Short chain dehydrogenase GOX0726 4.57 0.0063 Hypothetical protein GOX0726 GOX0734 2.91 0.0017 Hypothetical protein GOX0734 GOX0740 2.09 0.0117 Putative protease GOX0741 2.95 0.0001 Hypothetical protein GOX0741 GOX0743 0.42 0.0273 Ammonium transporter AmtB GOX0745 0.54 0.0018 Hypothetical protein GOX0745 GOX0750 2.07 0.0020 Hypothetical protein GOX0750 GOX0752 0.53 0.0003 Putative acetyltransferase GOX0758 2.74 0.0473 Porin GOX0762 1.86 0.0026 Thioredoxin GOX0771 0.51 0.0030 Ferric uptake regulation protein GOX0772 0.43 0.0000 Transcriptional regulator GOX0774 2.83 0.0006 Ribosomal-protein-alanine acetyltransferase GOX0784 0.53 0.0089 Multidrug resistance protein A GOX0788 1.99 0.0103 Flagellin assembly protein GOX0796 0.55 0.0240 Hypothetical protein GOX0796 GOX0801 0.50 0.0019 tRNA pseudouridine synthase A GOX0802 0.53 0.0028 Hypothetical protein GOX0802 GOX0808 0.45 0.0048 Galactose-proton symporter GOX0809 0.31 0.0010 L-asparaginase II GOX0813 2.07 0.0130 Phosphocarrier protein HPr GOX0814 2.79 0.0027 PTS system, IIA component GOX0815 3.12 0.0001 Hypothetical protein GOX0815 GOX0833 4.74 0.0001 Cold shock protein GOX0835 0.48 0.0284 Adenine phosphoribosyltransferase GOX0838 0.42 0.0446 Hypothetical protein GOX0838 GOX0841 2.00 0.0230 Hypothetical protein GOX0841 GOX0849 2.46 0.0024 NADPH-dependent L-sorbose reductase GOX0855 1.92 0.0584 D-Sorbitol dehydrogenase subunit SldB GOX0857 2.31 0.0060 Chaperone protein DnaK GOX0859 2.51 0.0008 Shikimate 5-dehydrogenase GOX0866 0.33 0.0162 S-adenosylmethionine synthetase GOX0867 0.34 0.0006 SAM-dependent methyltransferase
GOX0868 0.52 0.0004 Electron transfer flavoprotein-ubiquinone oxidoreductase/ putative oxidoreductase
GOX0874 2.03 0.0220 Ferrochelatase GOX0875 2.39 0.0088 AtsE protein GOX0880 5.40 0.0000 Hypothetical protein GOX0880 GOX0882 1.83 0.0000 Alpha-ketoglutarate decarboxylase GOX0886 1.97 0.0084 Hypothetical protein GOX0886 GOX0903 0.41 0.0053 Hypothetical protein GOX0903 GOX0904 0.55 0.0097 Hypothetical protein GOX0904 GOX0905 0.40 0.0132 Putative oxidoreductase GOX0907 0.36 0.0062 TonB-dependent outer membrane receptor GOX0922 6.26 0.0038 Hypothetical protein GOX0922 GOX0923 1.99 0.0403 Hypothetical protein GOX0923 GOX0925 3.05 0.0034 Sugar-proton symporter GOX0945 0.19 0.0008 TonB-dependent outer membrane receptor
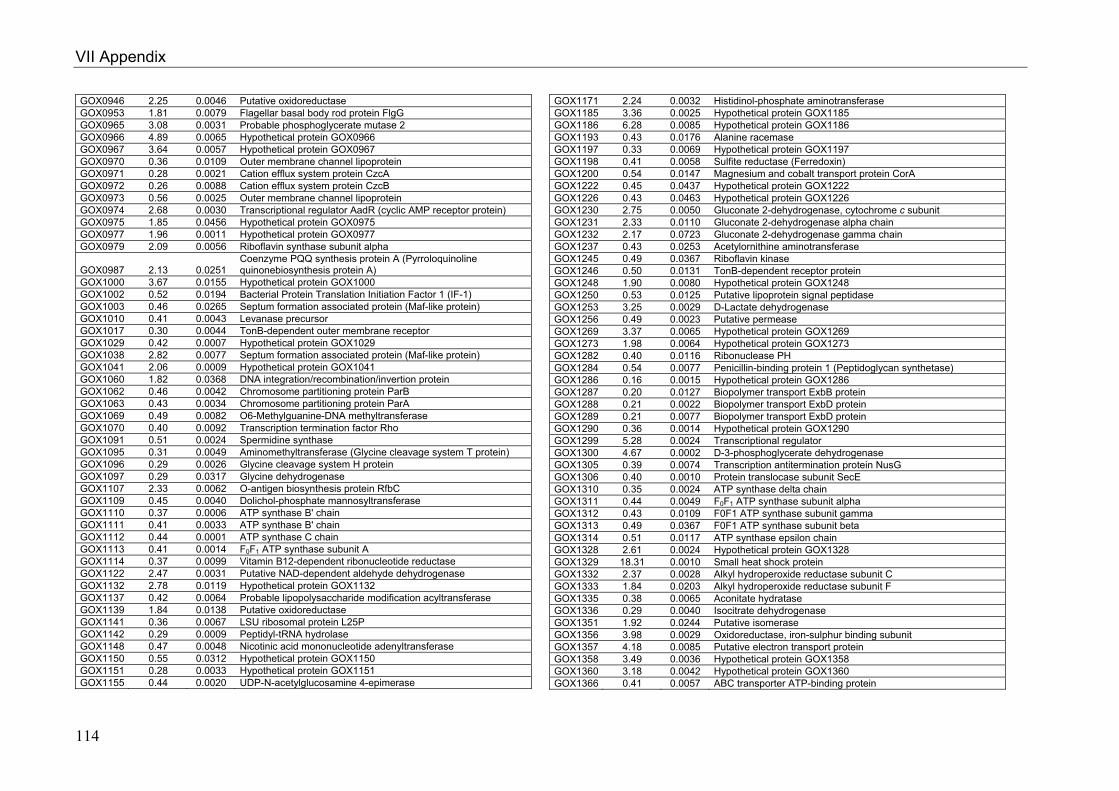
VII Appendix
114
GOX0946 2.25 0.0046 Putative oxidoreductase GOX0953 1.81 0.0079 Flagellar basal body rod protein FlgG GOX0965 3.08 0.0031 Probable phosphoglycerate mutase 2 GOX0966 4.89 0.0065 Hypothetical protein GOX0966 GOX0967 3.64 0.0057 Hypothetical protein GOX0967 GOX0970 0.36 0.0109 Outer membrane channel lipoprotein GOX0971 0.28 0.0021 Cation efflux system protein CzcA GOX0972 0.26 0.0088 Cation efflux system protein CzcB GOX0973 0.56 0.0025 Outer membrane channel lipoprotein GOX0974 2.68 0.0030 Transcriptional regulator AadR (cyclic AMP receptor protein) GOX0975 1.85 0.0456 Hypothetical protein GOX0975 GOX0977 1.96 0.0011 Hypothetical protein GOX0977 GOX0979 2.09 0.0056 Riboflavin synthase subunit alpha
GOX0987 2.13 0.0251 Coenzyme PQQ synthesis protein A (Pyrroloquinoline quinonebiosynthesis protein A)
GOX1000 3.67 0.0155 Hypothetical protein GOX1000 GOX1002 0.52 0.0194 Bacterial Protein Translation Initiation Factor 1 (IF-1) GOX1003 0.46 0.0265 Septum formation associated protein (Maf-like protein) GOX1010 0.41 0.0043 Levanase precursor GOX1017 0.30 0.0044 TonB-dependent outer membrane receptor GOX1029 0.42 0.0007 Hypothetical protein GOX1029 GOX1038 2.82 0.0077 Septum formation associated protein (Maf-like protein) GOX1041 2.06 0.0009 Hypothetical protein GOX1041 GOX1060 1.82 0.0368 DNA integration/recombination/invertion protein GOX1062 0.46 0.0042 Chromosome partitioning protein ParB GOX1063 0.43 0.0034 Chromosome partitioning protein ParA GOX1069 0.49 0.0082 O6-Methylguanine-DNA methyltransferase GOX1070 0.40 0.0092 Transcription termination factor Rho GOX1091 0.51 0.0024 Spermidine synthase GOX1095 0.31 0.0049 Aminomethyltransferase (Glycine cleavage system T protein) GOX1096 0.29 0.0026 Glycine cleavage system H protein GOX1097 0.29 0.0317 Glycine dehydrogenase GOX1107 2.33 0.0062 O-antigen biosynthesis protein RfbC GOX1109 0.45 0.0040 Dolichol-phosphate mannosyltransferase GOX1110 0.37 0.0006 ATP synthase B' chain GOX1111 0.41 0.0033 ATP synthase B' chain GOX1112 0.44 0.0001 ATP synthase C chain GOX1113 0.41 0.0014 F0F1 ATP synthase subunit A GOX1114 0.37 0.0099 Vitamin B12-dependent ribonucleotide reductase GOX1122 2.47 0.0031 Putative NAD-dependent aldehyde dehydrogenase GOX1132 2.78 0.0119 Hypothetical protein GOX1132 GOX1137 0.42 0.0064 Probable lipopolysaccharide modification acyltransferase GOX1139 1.84 0.0138 Putative oxidoreductase GOX1141 0.36 0.0067 LSU ribosomal protein L25P GOX1142 0.29 0.0009 Peptidyl-tRNA hydrolase GOX1148 0.47 0.0048 Nicotinic acid mononucleotide adenyltransferase GOX1150 0.55 0.0312 Hypothetical protein GOX1150 GOX1151 0.28 0.0033 Hypothetical protein GOX1151 GOX1155 0.44 0.0020 UDP-N-acetylglucosamine 4-epimerase
GOX1171 2.24 0.0032 Histidinol-phosphate aminotransferase GOX1185 3.36 0.0025 Hypothetical protein GOX1185 GOX1186 6.28 0.0085 Hypothetical protein GOX1186 GOX1193 0.43 0.0176 Alanine racemase GOX1197 0.33 0.0069 Hypothetical protein GOX1197 GOX1198 0.41 0.0058 Sulfite reductase (Ferredoxin) GOX1200 0.54 0.0147 Magnesium and cobalt transport protein CorA GOX1222 0.45 0.0437 Hypothetical protein GOX1222 GOX1226 0.43 0.0463 Hypothetical protein GOX1226 GOX1230 2.75 0.0050 Gluconate 2-dehydrogenase, cytochrome c subunit GOX1231 2.33 0.0110 Gluconate 2-dehydrogenase alpha chain GOX1232 2.17 0.0723 Gluconate 2-dehydrogenase gamma chain GOX1237 0.43 0.0253 Acetylornithine aminotransferase GOX1245 0.49 0.0367 Riboflavin kinase GOX1246 0.50 0.0131 TonB-dependent receptor protein GOX1248 1.90 0.0080 Hypothetical protein GOX1248 GOX1250 0.53 0.0125 Putative lipoprotein signal peptidase GOX1253 3.25 0.0029 D-Lactate dehydrogenase GOX1256 0.49 0.0023 Putative permease GOX1269 3.37 0.0065 Hypothetical protein GOX1269 GOX1273 1.98 0.0064 Hypothetical protein GOX1273 GOX1282 0.40 0.0116 Ribonuclease PH GOX1284 0.54 0.0077 Penicillin-binding protein 1 (Peptidoglycan synthetase) GOX1286 0.16 0.0015 Hypothetical protein GOX1286 GOX1287 0.20 0.0127 Biopolymer transport ExbB protein GOX1288 0.21 0.0022 Biopolymer transport ExbD protein GOX1289 0.21 0.0077 Biopolymer transport ExbD protein GOX1290 0.36 0.0014 Hypothetical protein GOX1290 GOX1299 5.28 0.0024 Transcriptional regulator GOX1300 4.67 0.0002 D-3-phosphoglycerate dehydrogenase GOX1305 0.39 0.0074 Transcription antitermination protein NusG GOX1306 0.40 0.0010 Protein translocase subunit SecE GOX1310 0.35 0.0024 ATP synthase delta chain GOX1311 0.44 0.0049 F0F1 ATP synthase subunit alpha GOX1312 0.43 0.0109 F0F1 ATP synthase subunit gamma GOX1313 0.49 0.0367 F0F1 ATP synthase subunit beta GOX1314 0.51 0.0117 ATP synthase epsilon chain GOX1328 2.61 0.0024 Hypothetical protein GOX1328 GOX1329 18.31 0.0010 Small heat shock protein GOX1332 2.37 0.0028 Alkyl hydroperoxide reductase subunit C GOX1333 1.84 0.0203 Alkyl hydroperoxide reductase subunit F GOX1335 0.38 0.0065 Aconitate hydratase GOX1336 0.29 0.0040 Isocitrate dehydrogenase GOX1351 1.92 0.0244 Putative isomerase GOX1356 3.98 0.0029 Oxidoreductase, iron-sulphur binding subunit GOX1357 4.18 0.0085 Putative electron transport protein GOX1358 3.49 0.0036 Hypothetical protein GOX1358 GOX1360 3.18 0.0042 Hypothetical protein GOX1360 GOX1366 0.41 0.0057 ABC transporter ATP-binding protein
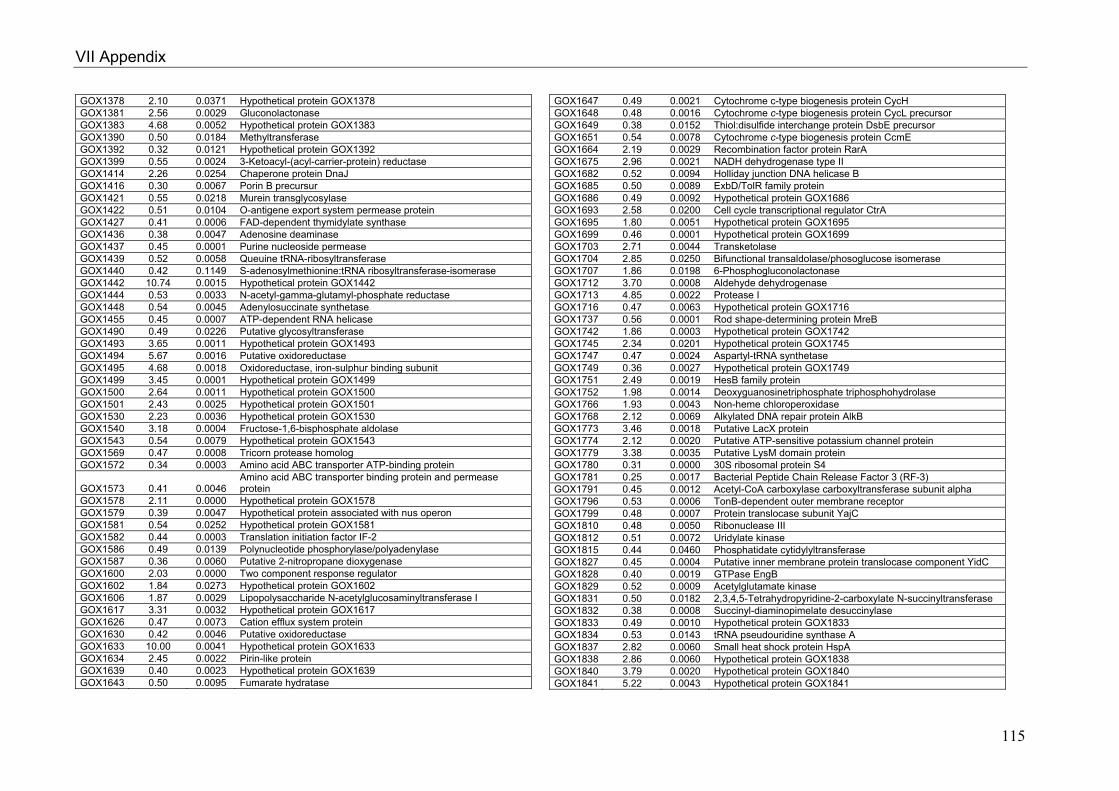
VII Appendix
115
GOX1378 2.10 0.0371 Hypothetical protein GOX1378 GOX1381 2.56 0.0029 Gluconolactonase GOX1383 4.68 0.0052 Hypothetical protein GOX1383 GOX1390 0.50 0.0184 Methyltransferase GOX1392 0.32 0.0121 Hypothetical protein GOX1392 GOX1399 0.55 0.0024 3-Ketoacyl-(acyl-carrier-protein) reductase GOX1414 2.26 0.0254 Chaperone protein DnaJ GOX1416 0.30 0.0067 Porin B precursur GOX1421 0.55 0.0218 Murein transglycosylase GOX1422 0.51 0.0104 O-antigene export system permease protein GOX1427 0.41 0.0006 FAD-dependent thymidylate synthase GOX1436 0.38 0.0047 Adenosine deaminase GOX1437 0.45 0.0001 Purine nucleoside permease GOX1439 0.52 0.0058 Queuine tRNA-ribosyltransferase GOX1440 0.42 0.1149 S-adenosylmethionine:tRNA ribosyltransferase-isomerase GOX1442 10.74 0.0015 Hypothetical protein GOX1442 GOX1444 0.53 0.0033 N-acetyl-gamma-glutamyl-phosphate reductase GOX1448 0.54 0.0045 Adenylosuccinate synthetase GOX1455 0.45 0.0007 ATP-dependent RNA helicase GOX1490 0.49 0.0226 Putative glycosyltransferase GOX1493 3.65 0.0011 Hypothetical protein GOX1493 GOX1494 5.67 0.0016 Putative oxidoreductase GOX1495 4.68 0.0018 Oxidoreductase, iron-sulphur binding subunit GOX1499 3.45 0.0001 Hypothetical protein GOX1499 GOX1500 2.64 0.0011 Hypothetical protein GOX1500 GOX1501 2.43 0.0025 Hypothetical protein GOX1501 GOX1530 2.23 0.0036 Hypothetical protein GOX1530 GOX1540 3.18 0.0004 Fructose-1,6-bisphosphate aldolase GOX1543 0.54 0.0079 Hypothetical protein GOX1543 GOX1569 0.47 0.0008 Tricorn protease homolog GOX1572 0.34 0.0003 Amino acid ABC transporter ATP-binding protein
GOX1573 0.41 0.0046 Amino acid ABC transporter binding protein and permease protein
GOX1578 2.11 0.0000 Hypothetical protein GOX1578 GOX1579 0.39 0.0047 Hypothetical protein associated with nus operon GOX1581 0.54 0.0252 Hypothetical protein GOX1581 GOX1582 0.44 0.0003 Translation initiation factor IF-2 GOX1586 0.49 0.0139 Polynucleotide phosphorylase/polyadenylase GOX1587 0.36 0.0060 Putative 2-nitropropane dioxygenase GOX1600 2.03 0.0000 Two component response regulator GOX1602 1.84 0.0273 Hypothetical protein GOX1602 GOX1606 1.87 0.0029 Lipopolysaccharide N-acetylglucosaminyltransferase I GOX1617 3.31 0.0032 Hypothetical protein GOX1617 GOX1626 0.47 0.0073 Cation efflux system protein GOX1630 0.42 0.0046 Putative oxidoreductase GOX1633 10.00 0.0041 Hypothetical protein GOX1633 GOX1634 2.45 0.0022 Pirin-like protein GOX1639 0.40 0.0023 Hypothetical protein GOX1639 GOX1643 0.50 0.0095 Fumarate hydratase
GOX1647 0.49 0.0021 Cytochrome c-type biogenesis protein CycH GOX1648 0.48 0.0016 Cytochrome c-type biogenesis protein CycL precursor GOX1649 0.38 0.0152 Thiol:disulfide interchange protein DsbE precursor GOX1651 0.54 0.0078 Cytochrome c-type biogenesis protein CcmE GOX1664 2.19 0.0029 Recombination factor protein RarA GOX1675 2.96 0.0021 NADH dehydrogenase type II GOX1682 0.52 0.0094 Holliday junction DNA helicase B GOX1685 0.50 0.0089 ExbD/TolR family protein GOX1686 0.49 0.0092 Hypothetical protein GOX1686 GOX1693 2.58 0.0200 Cell cycle transcriptional regulator CtrA GOX1695 1.80 0.0051 Hypothetical protein GOX1695 GOX1699 0.46 0.0001 Hypothetical protein GOX1699 GOX1703 2.71 0.0044 Transketolase GOX1704 2.85 0.0250 Bifunctional transaldolase/phosoglucose isomerase GOX1707 1.86 0.0198 6-Phosphogluconolactonase GOX1712 3.70 0.0008 Aldehyde dehydrogenase GOX1713 4.85 0.0022 Protease I GOX1716 0.47 0.0063 Hypothetical protein GOX1716 GOX1737 0.56 0.0001 Rod shape-determining protein MreB GOX1742 1.86 0.0003 Hypothetical protein GOX1742 GOX1745 2.34 0.0201 Hypothetical protein GOX1745 GOX1747 0.47 0.0024 Aspartyl-tRNA synthetase GOX1749 0.36 0.0027 Hypothetical protein GOX1749 GOX1751 2.49 0.0019 HesB family protein GOX1752 1.98 0.0014 Deoxyguanosinetriphosphate triphosphohydrolase GOX1766 1.93 0.0043 Non-heme chloroperoxidase GOX1768 2.12 0.0069 Alkylated DNA repair protein AlkB GOX1773 3.46 0.0018 Putative LacX protein GOX1774 2.12 0.0020 Putative ATP-sensitive potassium channel protein GOX1779 3.38 0.0035 Putative LysM domain protein GOX1780 0.31 0.0000 30S ribosomal protein S4 GOX1781 0.25 0.0017 Bacterial Peptide Chain Release Factor 3 (RF-3) GOX1791 0.45 0.0012 Acetyl-CoA carboxylase carboxyltransferase subunit alpha GOX1796 0.53 0.0006 TonB-dependent outer membrane receptor GOX1799 0.48 0.0007 Protein translocase subunit YajC GOX1810 0.48 0.0050 Ribonuclease III GOX1812 0.51 0.0072 Uridylate kinase GOX1815 0.44 0.0460 Phosphatidate cytidylyltransferase GOX1827 0.45 0.0004 Putative inner membrane protein translocase component YidC GOX1828 0.40 0.0019 GTPase EngB GOX1829 0.52 0.0009 Acetylglutamate kinase GOX1831 0.50 0.0182 2,3,4,5-Tetrahydropyridine-2-carboxylate N-succinyltransferase GOX1832 0.38 0.0008 Succinyl-diaminopimelate desuccinylase GOX1833 0.49 0.0010 Hypothetical protein GOX1833 GOX1834 0.53 0.0143 tRNA pseudouridine synthase A GOX1837 2.82 0.0060 Small heat shock protein HspA GOX1838 2.86 0.0060 Hypothetical protein GOX1838 GOX1840 3.79 0.0020 Hypothetical protein GOX1840 GOX1841 5.22 0.0043 Hypothetical protein GOX1841

VII Appendix
116
GOX1847 0.47 0.0153 Ribonuclease D GOX1849 1.99 0.0000 Putative oxidoreductase GOX1850 1.95 0.0013 Hypothetical protein GOX1850 GOX1857 11.96 0.0169 Uncharacterized PQQ-containing dehydrogenase 1 GOX1858 1.98 0.0104 Hypothetical protein GOX1858 GOX1867 0.49 0.0014 Putative processing protease protein GOX1871 0.55 0.0169 Hypothetical protein GOX1871 GOX1873 0.42 0.0047 DNA mismatch repair protein GOX1875 2.56 0.0003 Hypothetical protein GOX1875 GOX1879 3.58 0.0002 Superoxide dismutase GOX1885 0.51 0.0077 Preprotein translocase subunit SecB GOX1886 2.42 0.0043 Putative translocase transmembrane protein GOX1890 2.94 0.0050 Hypothetical protein GOX1890 GOX1896 1.89 0.0183 Coproporphyrinogen III oxidase GOX1903 0.17 0.0003 TonB-dependent receptor protein GOX1905 0.55 0.0096 Lysyl-tRNA synthetase GOX1910 3.23 0.0118 Hypothetical protein GOX1910 GOX1918 2.72 0.0123 Leucine aminopeptidase GOX1937 0.44 0.0203 Exopolyphosphatase GOX1938 0.54 0.0088 CDP-diacylglycerol pyrophosphatase GOX1940 0.54 0.0054 Putative acid phosphatase GOX1946 2.39 0.0003 Two component response regulator GOX1952 2.49 0.0243 Hypothetical protein GOX1952 GOX1953 4.37 0.0008 5-Methylcytosine-specific restriction enzyme GOX1957 0.45 0.0008 Putative thiol:disulfide interchange protein II GOX1960 0.43 0.0036 Dephospho-CoA kinase GOX1968 0.50 0.0133 Hypothetical protein GOX1968 GOX1971 2.27 0.0072 Galactose-proton symporter GOX1972 2.30 0.0122 Putative transport protein GOX1982 0.19 0.0011 Hypothetical protein GOX1982 GOX1992 1.95 0.0034 Osmotically inducible protein C GOX1995 2.32 0.0066 Hypothetical protein GOX1995 GOX2028 12.24 0.0048 Hypothetical protein GOX2028 GOX2030 0.18 0.0009 Chaperone protein DnaK GOX2034 0.56 0.0309 Metalloprotease GOX2035 0.49 0.0110 Hypothetical protein GOX2035 GOX2036 5.26 0.0025 Putative oxidoreductase GOX2050 1.86 0.0036 Hypothetical protein GOX2050 GOX2062 0.55 0.0089 Hypothetical protein GOX2062 GOX2063 2.22 0.0114 Hypothetical protein GOX2063 GOX2064 2.34 0.0161 Hypothetical protein GOX2064 GOX2066 3.53 0.0011 Glutaminase GOX2073 0.37 0.0001 Formyltetrahydrofolate deformylase GOX2074 0.48 0.0094 5-Methyltetrahydrofolate-S-homocysteine methyltransferase GOX2078 1.89 0.0195 Hypothetical protein GOX2078 GOX2079 31.69 0.0003 Hypothetical protein GOX2079 GOX2083 2.42 0.0032 Hypothetical protein GOX2083 GOX2088 4.50 0.0040 Glycerol-3-phosphate dehydrogenase GOX2089 3.93 0.0141 Glycerol uptake facilitator protein
GOX2090 4.58 0.0099 Glycerol kinase GOX2096 0.44 0.0568 Sorbitol dehydrogenase large subunit GOX2097 0.49 0.0440 Sorbitol dehydrogenase small subunit GOX2108 1.84 0.0259 NADH-dependent iron-containing alcohol dehydrogenase GOX2109 7.65 0.0007 Hypothetical protein GOX2109 GOX2112 0.54 0.0087 Outer membrane protein GOX2114 2.14 0.0048 Transcriptional regulator GOX2126 0.55 0.0043 ABC transporter ATP-binding protein GOX2127 0.44 0.0008 ABC transporter permease protein GOX2134 0.55 0.0027 Peptidyl-dipeptidase DCP GOX2135 0.52 0.0051 Hypothetical protein GOX2135 GOX2143 0.48 0.0138 ABC transporter ATP-binding protein GOX2151 0.55 0.0234 Hypothetical protein GOX2151 GOX2154 2.07 0.0170 Hypothetical protein GOX2154 GOX2163 2.97 0.0041 Cold shock protein GOX2167 2.09 0.0459 F0F1 ATP synthase subunit beta GOX2169 2.09 0.0117 ATP synthase subunit AtpI GOX2171 2.39 0.0149 ATP synthase subunit a GOX2172 1.83 0.0326 ATP synthase subunit c GOX2181 2.42 0.0245 Putative polyol dehydrogenase GOX2182 2.42 0.0218 Probable mannitol/sorbitol ABC transporter permease protein GOX2183 2.43 0.0330 Probable mannitol/sorbitol ABC transporter ATP-binding protein GOX2184 2.26 0.0317 Probable mannitol/sorbitol ABC transporter permease protein GOX2185 3.05 0.0300 Periplasmic mannitol/sorbitol binding protein GOX2186 2.34 0.0336 Ribulokinase GOX2187 4.54 0.0009 Gluconate 5-dehydrogenase GOX2188 3.46 0.0008 Gluconate permease GOX2199 4.69 0.0012 Probable myosin-crossreactive antigen GOX2200 4.47 0.0003 Probable myosin-crossreactive antigen GOX2203 2.37 0.0086 Hypothetical protein GOX2203 GOX2205 0.48 0.0046 Hypothetical protein GOX2205
GOX2206 0.47 0.0272 5-Methyltetrahydropteroyltriglutamate--homocysteine methyltransferase
GOX2211 1.95 0.0017 Hypothetical protein GOX2211 GOX2217 10.78 0.0023 Triosephosphate isomerase GOX2218 4.96 0.0012 Ribose-5-phosphate isomerase B GOX2219 4.08 0.0076 Ribose ABC transporter, periplasmic binding protein GOX2220 1.95 0.0000 Ribose ABC transporter, ATP-binding protein GOX2222 1.85 0.0060 Dihydroxyacetone kinase GOX2223 2.16 0.0029 Transposase (class V) GOX2231 3.82 0.0007 Putative sugar transporter GOX2246 3.38 0.0008 Hypothetical protein GOX2246 GOX2250 1.88 0.0030 Pyruvate kinase GOX2257 2.55 0.0033 Hypothetical protein GOX2257 GOX2258 0.42 0.0039 Putative phytoene synthase GOX2260 0.51 0.0086 Squalene-hopene cyclase GOX2279 2.31 0.0128 Enolase GOX2288 1.87 0.0008 Indole-3-glycerol phosphate synthase GOX2361 2.28 0.0049 Hypothetical protein GOX2361
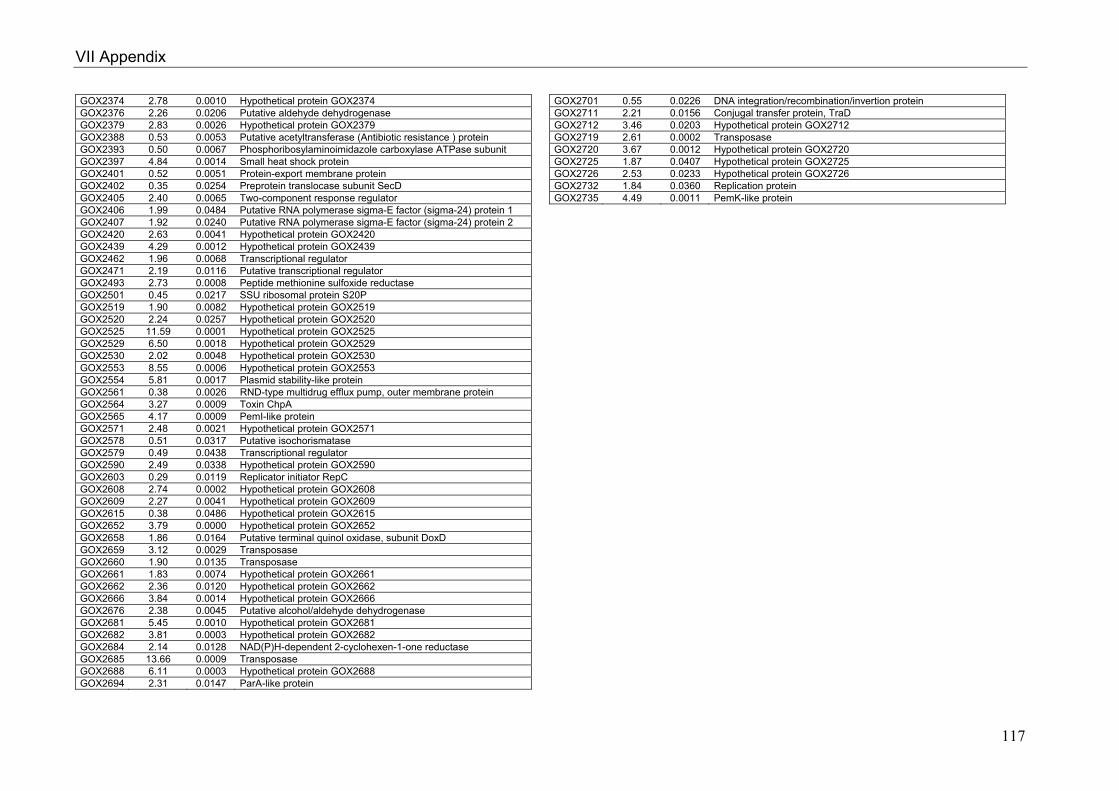
VII Appendix
117
GOX2374 2.78 0.0010 Hypothetical protein GOX2374 GOX2376 2.26 0.0206 Putative aldehyde dehydrogenase GOX2379 2.83 0.0026 Hypothetical protein GOX2379 GOX2388 0.53 0.0053 Putative acetyltransferase (Antibiotic resistance ) protein GOX2393 0.50 0.0067 Phosphoribosylaminoimidazole carboxylase ATPase subunit GOX2397 4.84 0.0014 Small heat shock protein GOX2401 0.52 0.0051 Protein-export membrane protein GOX2402 0.35 0.0254 Preprotein translocase subunit SecD GOX2405 2.40 0.0065 Two-component response regulator GOX2406 1.99 0.0484 Putative RNA polymerase sigma-E factor (sigma-24) protein 1 GOX2407 1.92 0.0240 Putative RNA polymerase sigma-E factor (sigma-24) protein 2 GOX2420 2.63 0.0041 Hypothetical protein GOX2420 GOX2439 4.29 0.0012 Hypothetical protein GOX2439 GOX2462 1.96 0.0068 Transcriptional regulator GOX2471 2.19 0.0116 Putative transcriptional regulator GOX2493 2.73 0.0008 Peptide methionine sulfoxide reductase GOX2501 0.45 0.0217 SSU ribosomal protein S20P GOX2519 1.90 0.0082 Hypothetical protein GOX2519 GOX2520 2.24 0.0257 Hypothetical protein GOX2520 GOX2525 11.59 0.0001 Hypothetical protein GOX2525 GOX2529 6.50 0.0018 Hypothetical protein GOX2529 GOX2530 2.02 0.0048 Hypothetical protein GOX2530 GOX2553 8.55 0.0006 Hypothetical protein GOX2553 GOX2554 5.81 0.0017 Plasmid stability-like protein GOX2561 0.38 0.0026 RND-type multidrug efflux pump, outer membrane protein GOX2564 3.27 0.0009 Toxin ChpA GOX2565 4.17 0.0009 PemI-like protein GOX2571 2.48 0.0021 Hypothetical protein GOX2571 GOX2578 0.51 0.0317 Putative isochorismatase GOX2579 0.49 0.0438 Transcriptional regulator GOX2590 2.49 0.0338 Hypothetical protein GOX2590 GOX2603 0.29 0.0119 Replicator initiator RepC GOX2608 2.74 0.0002 Hypothetical protein GOX2608 GOX2609 2.27 0.0041 Hypothetical protein GOX2609 GOX2615 0.38 0.0486 Hypothetical protein GOX2615 GOX2652 3.79 0.0000 Hypothetical protein GOX2652 GOX2658 1.86 0.0164 Putative terminal quinol oxidase, subunit DoxD GOX2659 3.12 0.0029 Transposase GOX2660 1.90 0.0135 Transposase GOX2661 1.83 0.0074 Hypothetical protein GOX2661 GOX2662 2.36 0.0120 Hypothetical protein GOX2662 GOX2666 3.84 0.0014 Hypothetical protein GOX2666 GOX2676 2.38 0.0045 Putative alcohol/aldehyde dehydrogenase GOX2681 5.45 0.0010 Hypothetical protein GOX2681 GOX2682 3.81 0.0003 Hypothetical protein GOX2682 GOX2684 2.14 0.0128 NAD(P)H-dependent 2-cyclohexen-1-one reductase GOX2685 13.66 0.0009 Transposase GOX2688 6.11 0.0003 Hypothetical protein GOX2688 GOX2694 2.31 0.0147 ParA-like protein
GOX2701 0.55 0.0226 DNA integration/recombination/invertion protein GOX2711 2.21 0.0156 Conjugal transfer protein, TraD GOX2712 3.46 0.0203 Hypothetical protein GOX2712 GOX2719 2.61 0.0002 Transposase GOX2720 3.67 0.0012 Hypothetical protein GOX2720 GOX2725 1.87 0.0407 Hypothetical protein GOX2725 GOX2726 2.53 0.0233 Hypothetical protein GOX2726 GOX2732 1.84 0.0360 Replication protein GOX2735 4.49 0.0011 PemK-like protein
VII Appendix
118
Acknowledgement
119
Acknowledgement
The present work was carried out at the Institut für Biotechnologie 1,
Forschungszentrum Jülich. My sincere thanks go to Prof. Dr. Hermann Sahm for the
assignment of the theme, for his encouragement and his interest in the progress of
this work. This work was pushed forward due to his scientific discussions and his fair
comments.
I would like to thank Prof. Dr. Michael Bott for taking over the review of my thesis and
his support for the completion of the work.
I am most grateful to Dr. Stephanie Bringer-Meyer for her supervision and her
encouragement. She was always patient and enthusiastic in answering scientific
problems and had many good advises for the progress of my work.
I would like to thank our industrial partner “DSM nutritional products” for the good
cooperation and for the constant information exchange. My special thanks go to Dr.
Petra Simic, Dr. Nigel Mouncey and Dr. Hans-Peter Hohmann.
Especially I would like to thank my teammates Vera Krajewski, Verena Engels,
Tobias Georgi, Ursula Degner, Carsten Bäumchen, Florian Heuser, Marthe
Chmielus, Stefanie Schweikert, Janine Richhardt, Helga Etterich, Solvej Siedler, Tino
Polen and Frank Lausberg for their friendliness and good advises.
I thank all the members of the IBT 1 and IBT 2 for the friendly and familiar
atmosphere and their cooperativeness. I am thankful for the support by the DasGip
AG, especially for the readiness for support of Dr. Christoph Bremus and Christian
Mörl.
Above all, I want to show my gratefulness and appreciation to my parents Brigitte
Balfen and Achim Hanke, to my family and to my friends for their support, example
and tolerance during my studies and life.
120
Declaration
This thesis is a presentation of my original research work. Wherever contributions of
others are involved, every effort is made to indicate this clearly, with due reference to
the literature, and acknowledgement of collaborative research and discussions.
Jülich, Dezember 2009
Tanja Hanke
Related Documents