\jto\< 6 i^r OtAA STATE OF ILLINOIS WILLIAM G. STRATTON, Governor DEPARTMENT OF REGISTRATION AND EDUCATION VERA M. BINKS, Director STUDIES OF WATERFLOOD PERFORMANCE III. - Use of Network Models Walter Rose ILLINOIS GEOLOGICAL SURVEY LIBRARY DIVISION OF THE ILLINOIS STATE GEOLOGICAL SURVEY JOHN C. FRYE, Chief URBANA CIRCULAR 237 1957

Welcome message from author
This document is posted to help you gain knowledge. Please leave a comment to let me know what you think about it! Share it to your friends and learn new things together.
Transcript

\jto\< 6 i^r OtAA
STATE OF ILLINOIS
WILLIAM G. STRATTON, Governor
DEPARTMENT OF REGISTRATION AND EDUCATIONVERA M. BINKS, Director
STUDIES OF WATERFLOODPERFORMANCE
III. - Use of Network Models
Walter Rose
ILLINOIS GEOLOGICAL
SURVEY LIBRARY
DIVISION OF THE
ILLINOIS STATE GEOLOGICAL SURVEYJOHN C. FRYE, Chief URBANA
CIRCULAR 237 1957

Digitized by the Internet Archive
in 2012 with funding from
University of Illinois Urbana-Champaign
http://archive.org/details/studiesofwaterfl237rose
"S^STUDIES OF WATERFLOOD PERFORMANCE
III. — USE OF NETWORK MODELSWalter Rose
ABSTRACT
This study was undertaken to further the utility of network
model methods for solving petroleum engineering problems. Such
models are used to analyze a mathematical equivalent of a repre-
sentative volume element of a porous continuum, giving attention
to the microscopic details of pore sizes, shapes, and degree of
interconnections. From this analysis, macroscopic effects can be
synthesized, such as the dependence of capillary pressure and rel-
ative permeability on fluid saturation and distribution; and, in prin-
ciple, important characteristics of reservoir performance maybeinferred.
Formerly only two-dimensional networks have been used be-
cause the computations for three-dimensional models are labor-
ious. Moreover, analog model solutions have been restricted to
steady-state flow problems. Now certain new computer methodsmake it possible to study the characteristics of larger and morecomplex three -dimensional networks. Continuous rather than step
functions of pore size distribution canbe employed with a variable
pore shape and a randomized degree of interconnections in the
selected networks. This minimizes arbitrary boundaries and a-
chieves a model which in the statistical sense has a high degree of
point-to-point identity with the prototype reservoir rock. In con-
sequence, results are possible which may be supposed to have a
direct bearing on the mechanics of petroleum recovery, such as
waterflooding.
INTRODUCTION
According to one point of view, the success of waterflooding operations
depends on conditions of favorable sweep efficiency and favorable displacement
efficiency. Sweep efficiency is largely a function of the selected flood pattern
as modified by gravity effects and the anisotropies of the formation itself. Dis-
placement efficiency, of course, is zero in the unswept regions of the reser-voir; but in the swept regions it will have a finite value controlled by a host of
vaguely understood determining factors (Rose, 1957).
In field operations exact values for the sweep and displacement efficien-
cies are not known separately, and frequently their combined effect can be only
guessed. Thus, in practice, the operator has a rough estimate of the amount of
oil left in the reservoir after primary depletion, and years later he notes he has
successfully produced a certain additional volume of oil. The ratio of the oil
produced by the secondary recovery operation to that left after primary deple-
tion is the recovery factor, which in the fundamental sense is directly related
to the product of the sweep and displacement efficiencies.
[1]

2 ILLINOIS STATE GEOLOGICAL SURVEY
Obviously it would be a great advantage to have a quantitative value for
the recovery factor before beginning a secondary recovery operation. Theeconomics of the project could then be predicted with reasonable certainty.
As it turns out, much effort has been directed to this purpose (Muskat, 1949,
Ch. 12, 14) through the development of core analysis, the study of laboratory
models, and the use of various analytic methods of inquiry. Two categories of
difficulties are encountered in any attempt to predict recovery factors, how-ever. First, it is not practical to stipulate the exact character of the reservoir
system with regard to initial and boundary conditions of fluid saturations and
pressures, nor can the variations of permeability and porosity be specified.
Second, the inherent non-steady nature of secondary recovery processes makesexact solutions largely intractable.
This paper discusses a new method of studying displacement efficiencies.
The method involves the construction of a model of a small volume element of
the reservoir so that the transient history of the movement of the flood front
through the prototype reservoir can be synthesized. Such an application repre-
sents a microscopic approach, calculated to show the dependence of the dis-
placement efficiency (in swept regions) on the various controlling factors (for
example, injection rate, initial saturation conditions, and reservoir rock tex-
ture).
Emphasizing the displacement efficiency component of the recovery fac-
tor parameter (to the exclusion of the sweep efficiency component) appears
justified, partly because more is known already about sweep efficiencies. Theyare generally high when the permeability stratification and mobility ratio are
favorable, having values approaching unity (100 percent) in some cases (Aronof-
sky and Ramey, 1956). Sweep efficiencies, in addition, are not wholly dependent
on the nature of the reservoir system, but can be controlled and improved byoperating practices such as the proper geometric location of input and produc-
tion wells, selective plugging (or fracturing and acidizing) certain zones, in-
fill drilling, control of mobility ratio, making use of gravity effects (Jordan et
al., 1957) and so forth.
Factors that affect displacement efficiency are far less understood, as
will be seen. It is true that if one were able to imagine the proper initial sat-
uration conditions, a simple restored state type of core analysis experiment
would give the displacement efficiency directly. The literature contains, how-ever, many contradictory results obtained in this way, especially as bearing
on the relationship between displacement efficiency and flood rate (Calhoun and
LaRue, 1951; Moore and Slobod, 1956). Considering the complications of labor-
atory procedure, the inconclusiveness of reports on core analysis is not sur-
prising.
The method of study here described involves construction of so-called net-
work models of small volume elements of the reservoir prototype. Recent workby Fatt (1956) has suggested this application possibility. The network model, as
used by Fatt, was intended actually to represent the microscopic texture of res-
ervoir rock, and he attempted to construct therefrom the detailed distribution of
the immiscible fluid saturants of the pore spaces which would result from fluid
-
fluid displacement processes. Fatt also attempted to establish the relationships
between relative permeabilities which were associated with the interstitial fluid
distributions.

USE OF NETWORK MODELS 3
Muskat (1949) had previously cited two reasons why it is necessary "to
visualize the problem of fluid flow through porous media from a statistical
(macroscopic) point of view." He mentioned: "from a practical point of viewit is not feasible to give quantitative description of the microscopic geometryof the flow system, as defined by myriads of complicated passageways bounded
by the ensemble of grains and their cementing material." Then he noted:
". . . previous studies of the classical hydrodynamics equations show that they
are far too complex to permit integration for any such systems of irregular
and multiply-connected flow channels, comprising the pores of oil-bearing rocks,
even if they could be quantitatively defined."
In effect, Fatt challenged the necessary correctness of Muskat's first ob-
jection, and he circumvented the need to consider the truth of the second.
In the exact sense, Muskat is right in saying that the detailed microscopic
character of porous media, such as reservoir rock, cannot be quantitatively
defined, much less used to solve the fundamental hydrodynamic equations of
fluid flow and displacement. Following Fatt, however, this paper asserts that
limiting cases of rock texture can be stipulated with sufficient exactness so
that network models can be constructed which will be useful in establishing (in
a semi -quantitative way) the separate importance of the various factors that
control fluid flow and fluid displacement (that is, displacement efficiencies and
recovery factors).
A network model may be defined as the mathematical representation of a
system of interconnected pore spaces in which there is an element of point-to-
point identity with the reservoir prototype as regards pore shapes, lengths,
widths, and orientation. To be perfectly general, the character of the reservoir
rock prototype might be stipulated in accordance with the proposition that uponselecting a random point located in the volume element of interest, there will be
statistical probabilities that: 1) the point is located in pore space rather than
in space occupied by the solid phase; 2) wherever the point is located, it is a
certain distance from a pore -solid phase boundary; 3) said interfacial boundaryhas a certain shape, orientation, and surface roughness character; and 4) said
pore space is located a certain distance from an interpore junction point and
filled either with interstitial water, oil, or free gas. Hence, the same statisti-
cal probabilities should be the character of the network model if exact simili-
tude is to be achieved.
Although Fatt implied the theoretical possibility of constructing exact
network models, he did not impose such severe requirements on his initial
work. In point of fact, he found it convenient (and perhaps thought it adequateto the intended purpose) to consider only pore size distribution and degree of
pore interconnection, and he made the latter regular and uniform in a waywhich he himself noted was both arbitrary and unrealistic. Thus, the networkmodels employed in Fatt's pioneering work did not take into account pore shapes,
variable degree of interconnection, and other textural characteristics of real
reservoir rock.
Fatt's work was also limited in other ways because he did not have accessto the high-speed computer facilities which the present paper shows are requiredfor any comprehensive use of network models. (For example, Fatt says in re-sponse to the discussion of Rose et al. (Fatt, 1956): ". . . the use of high speed

ILLINOIS STATE GEOLOGICAL SURVEY
Prototype pore space
Network model form
KEY
o - oil filled
w - water filled
Tube model
Fig. 1. - Achieving similitude between reservoir pore space prototype and tube
and network model forms.
computers . . . will make possible tests of the network model that I could not
even consider while limited to my pencil-and-paper accounting procedure.")
Fatt, therefore, considered rather small networks (both with regard to
number of pores and number of pore sizes) in only two dimensions, and re-
stricted his work to static equilibrium saturation end-points and steady-state,
single-phase flow; moreover, laboriously constructed analog models were re-
quired to investigate relative permeability and resistivity index phenomena.Finally, initial and boundary conditions, and implied histories of displacement,
were frequently arbitrary and unrealistic in deference to the need for simplic-
ity.
In the present paper the view is still held that exact network model anal-
ogies are at least theoretically possible; and, moreover, as high-speed com-puter facilities are now available, the usefulness and validity of network modelstudies can be increased greatly. Thus, three-dimensional models composedof tens of thousands of pores and hundreds of pore sizes can be imagined wherethe transient effects leading to the static equilibrium and steady state end-
points can be considered; moreover the need to construct analog models of the
network model may be obviated largely by certain newly developed computing
methods as described herein.
USE OF NETWORK MODELS
Prototype Model
O.IMM
KEY
rock matrix
oil filled pores
water filled pores
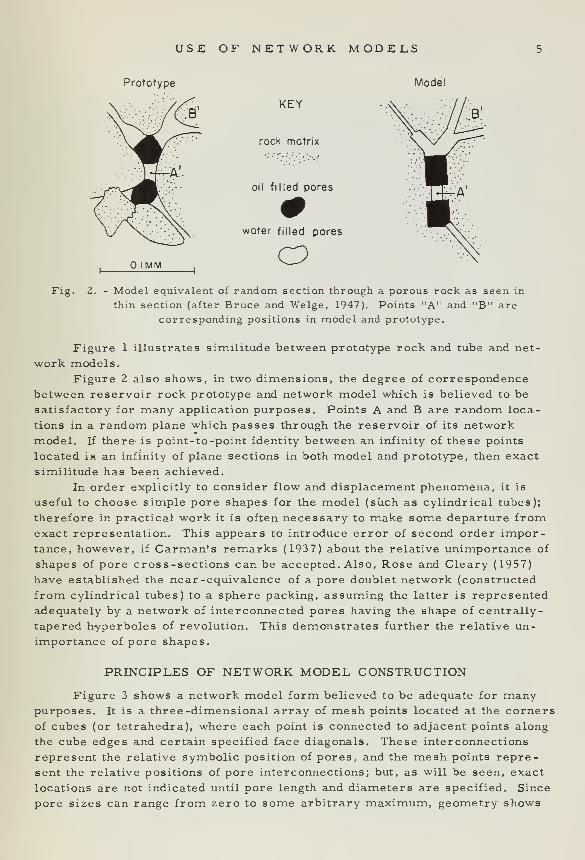
oFig. 2. Model equivalent of random section through a porous rock as seen in
thin section (after Bruce and Welge, 1947). Points "A" and "B" are
corresponding positions in model and prototype.
Figure 1 illustrates similitude between prototype rock and tube and net-
work models.
Figure 2 also shows, in two dimensions, the degree of correspondencebetween reservoir rock prototype and network model which is believed to be
satisfactory for many application purposes. Points A and B are random loca-
tions in a random plane which passes through the reservoir of its network
model. If there- is point-to-point identity between an infinity of these points
located in. an infinity of plane sections in both model and prototype, then exact
similitude has been achieved.
In order explicitly to consider flow and displacement phenomena, it is
useful to choose simple pore shapes for the model (such as cylindrical tubes);
therefore in practical work it is often necessary to make some departure fromexact representation. This appears to introduce error of second order impor-tance, however, if Carman's remarks (1937) about the relative unimportance of
shapes of pore cross-sections can be accepted. Also, Rose and Cleary (1957)
have established the near -equivalence of a pore doublet network (constructed
from cylindrical tubes) to a sphere packing, assuming the latter is represented
adequately by a network of interconnected pores having the shape of centrally-
tapered hyperboles of revolution. This demonstrates further the relative un-
importance of pore shapes.
PRINCIPLES OF NETWORK MODEL CONSTRUCTION
Figure 3 shows a network model form believed to be adequate for manypurposes. It is a three-dimensional array of mesh points located at the corners
of cubes (or tetrahedra), where each point is connected to adjacent points along
the cube edges and certain specified face diagonals. These interconnections
represent the relative symbolic position of pores, and the mesh points repre-
sent the relative positions of pore interconnections; but, as will be seen, exact
locations are not indicated until pore length and diameters are specified. Since
pore sizes can range from zero to some arbitrary maximum, geometry shows

ILLINOIS STATE GEOLOGICAL SURVEY
I
ggggg^g^.
6 7 8 9a be
221
Fig. 3. - The tetrahedron (3-D) network form. Insert shows interconnectionbetween eight adjacent mesh points.
that the degree of interconnection of pores (at mesh points) can range from zero
to a maximum of 22 (that is, when all the pores joining at a given mesh point
have a finite size).
In order to use the tetrahedral network model for solving problems, it
must be possible to scale into the model values for the following textural char-
acteristics of the reservoir rock prototype, namely: 1) porosity; 2) specific
surface area; 3) tortuosity; 4) pore diameter sizes and size distribution; 5)
type and degree of pore interconnection; and 6) pore lengths. (As implied above,
pore shapes and surface roughness characteristics are not here considered.
Obviously, it is also impossible to consider fluid-solid phase interactions,
such as clay swelling effects, at this stage.)
Fatt, in his previous work, ignored items 1), 2), 3) and part of 5). Hespecified item 4) by a pore -size distribution curve, item 5) he referred to
degree of interpore connections by his "beta" factor, and item 6) he referred
to various arbitrary functions.

USE OF NETWORK MODELS 7
The Pore Interconnection Concept
Regarding the interconnection between pores, it can be shown that merelyspecifying the beta factor is not definitive. For example, the two-dimensionaltriple hexagonal pattern and the three-dimensional cubic pattern both have a
beta factor of 10 (that is, each pore is connected to five others at each terminal
end). However, in tracing possible paths between two adjacent mesh points,
both patterns have one one -pore path and four three -pore paths; but the triple
hexagonal form has two two-pore paths and the cubic form has no two-porepaths. Interconnecting paths of four or more continuous pores perhaps can be
neglected. (This is certainly implied by the analytics of the various pore-
doublet studies which have been made [Rose and Witherspoon, 1956; and Roseand Cleary, 1957].) Nevertheless, geometry will show considerable differences
in this respect between the two subject network patterns.
Fatt stated that relative permeability phenomena were more dependent
on the beta factor than on the pore size distribution; hence, it may be predicted
that the nature of the interpore connections (in addition to the number of inter
-
pore connections) will have a similar importance. Therefore, it is convenient
to introduce the notation shown in table 1 to more completely specify networkform, where the three or four numbers following the beta factor indicate re-
spectively the single, double, triple, and quadruple pore path interconnections
between adjacent mesh point junctions.
Table 1. - Certain Regular Network Model Forms
Beta
Name factor
Simple bundle CO
Tetrahedral (3-D) 22
Cubic (3-D) 10
Rhombohedral (3-D.) 10
Triple hexagonal (2-D) 10
Double hexagonal (2-D) 7
Square (2-D) 6
Single hexagonal (2-D) 4
Composite bundle 2
Path characterizing number A B
1
1 4 8
10 4
10 3
1 2 4 (2, 4, 4)
1 2 or 121 2
1
1
12
6
8
6
6
4
3
2
12
6
4
6
3
4
3
2
At this point it is worth while to note that Fatt's triple hexagonal pattern
reduces to the double .or single hexagonal patterns, or to the square pattern, by
systematically designating certain pores as having zero size. Likewise, the
three-dimensional tetrahedron pattern can be made to reduce to cubic and other
three-dimensional forms (of lesser beta factor); and, in fact, if only one plane
is considered, the various two-dimensional patterns discussed by Fatt also are
obtained.
With such variations in mind, the possibility of randomly "knocking" out
pores by specifying zero sizes can be considered. Thus, Fatt and his reviewers
noted the relevancy of providing for random pore interconnections in network
models. This was suggested by examination of thin sections, and presumably
the zero-pore device mentioned above is a satisfactory way to achieve this.

8 ILLINOIS STATE GEOLOGICAL SURVEY
(It may be assumed that the random location of zero-sized pores is a properprocedure only when dealing with large networks such as discussed in this
paper. The general rule seems to hold that the network model must be large
enough to have a character of homogeneity and isotropy, even though the micro-scopic elements, such as pore size and length, vary markedly from point to
point.)
For such random interconnections, the beta factor and the characteriz-
ing number showing path interconnections will have values less than those indi-
cated in table 1; moreover, such values will not necessarily be unique numbersdescriptive of the situation at a particular set of adjacent mesh points, but
rather they will be of statistical significance only (in a way related to the prob-
ability of zero-sized pores occurring).
A further comparison can be made, however, to emphasize the importanceof considering the nature of interpore connection as well as degree of pore
branching. Rose (1957) discussed the network model form of the (regular)
rhombohedral packing of uniform-sized spheres. This form may be designated
as "rhombohedron (3-D)," and it has each octrahedral pore junction connected
to eight tetrahedral pore junctions (Rose, 1957a, fig. 1). Each of the eight
tetrahedral pore junctions is connected to three other octrahedral pore junc-
tions. In consequence, the beta factor is 10, as it is in the cubic (3-D) networkform; but the path characterizing number of the cubic -network is (1040), where-as for the rhombohedron it is (1030). Thus it is seen that a single three-pore
path is the difference between the simple and symetrical cubic form and the
more complex and assymetrical rhombohedron form.
The Tetrahedron Model
The special advantage of the tetrahedron (3-D) network form (fig. 3 and
table 1) is that it is characterized by a high degree of interpore connections
and pore path possibilities; and in all probability, no reservoir rock prototype
ever will be found in nature where such a high degree of pore branching will
be required in the corresponding network model. Hence, assigning zero sizes
to certain pores of the tetrahedron network will reduce the beta factor and alter
the path characterizing number, in accordance with the probability of occur-
rence and location of the zero pores to be simulated. Explicitly, the beta factor
for the case of no zero pores is given by:
ft = A + B - 2 (1)
where A and B are the terms given in table 1 which indicate, respectively, the
number of pores joining at any two adjacent mesh points. (Note - Evidently,A + B
[ -] defines approximately the ratio between total pores and total mesh
points in a given network.)
It follows, then, that if the probability that any random pore in the net-
work has zero size is P , the beta factor is reduced to:
Pz=[(1 - P z )(£ + 2)] - 2 (2)
Thus, referring again to table 1, it is seen that making one -third of the pores
in the triple -hexagonal network of zero size, reduces the beta factor to six.
Selecting these zero pores in a certain regular fashion results in producing a

USE OF NETWORK MODELS 9
square network form that has a path characterizing number of (102 . . .); con-
versely, a random location of the zero pores causes the randomization of the
beta factor and the path characterizing number throughout the resultant net-
work. Likewise, the cubic network form can be derived from the tetrahedron
(3-D) form by letting all of the diagonal pores be of zero size (that is, P 2 =
0.5).
It is thus apparent that starting with the tetrahedron (3-D) network modelform, many variations in model representation of prototype texture can be
achieved by the simple device of assigning zero sizes for regularly or randomlyselected pores, so that the resultant networks have any beta factor (less than
22) and any path characterizing number (less than 148. . .), as may be desired
to simulate the pore texture of some given reservoir rock. The beta factor and
the path characterizing number, moreover, can be made to vary around somemean value throughout the network as occasionally will better represent the
anisotropies of reservoir rock, and this is achieved by random, rather than
regular, location of the zero pores.
This paper does not contain detailed instructions for the construction of
network models which will represent any particular reservoir prototype; it
rather demonstrates that the construction possibility exists, and that it is nowpractical to think about building network models for solving probler. s. It is
not essential to the present discussion, therefore, to prove that beta factors
greater than 22 and pore characterizing numbers greater than (148. . .) neveroccur in nature, as already suggested by the thin sections shown by Winsaueret al. (1952).
It is also beyond the scope of this paper to actually construct in networkform the model of any particular porous media system. For example, the net-
work model form of a rhombohedral packing of uniform size spheres has al-
ready been discussed, and it is clearly implicit in the foregoing remarks that
a modified tetrahedral network model form can be devised to have close simili-
tude to porous media packings composed of randomly sized and shaped particles
in random array. The latter, cemented or uncemented, and with or without
other anisotropies, is equivalent to the natural sedimentary sandstones which
comprise many petroleum reservoirs.
Having arrived at a suitable form for the network model (namely, the
zero-pore modified tetrahedral form), there is still the problem of introducing
control of porosity, permeability, pore size and length distribution, pore shape
and tortuosity, specific surface area, and other intensive properties of texture,
if a valid model of the reservoir prototype is to be achieved. There also is the
problem of representing initial and boundary conditions, so that reservoir per-
formance problems can be solved with the network model. These questions are
answered in part in the succeeding sections of this paper. One final matter
should be discussed before considering such applications, however.
Looking, for example, at the various two-dimensional network forms
proposed by Fatt, one gains the feeling that permeability always will be direc-
tional, and that the regularity of pore orientation will be a limiting factor.
This view, however, is believed to be unjustified, as suggested by the following
considerations:

10 ILLINOIS STATE GEOLOGICAL SURVEY
1) Given a network model which is big enough, the fluid flow capacity will
not depend on direction any more than in the reservoir rock.
2) In any case, and at least from the microscopic viewpoint, flow direc-
tion is less important than pore size and pore path-interconnection. Actually,
the angle of pore orientation implied by the network form is largely of symbolic
significance.
3) Finally, the network model is obtained by superimposing a grid over
the volume element of the reservoir rock of interest, and then scaling into the
model the characteristics which are found at each mesh point. In accord with
all approximation processes of this type, one always has the opportunity to
choose smaller incremental values (a finer grid) in order to make the result-
ant step -functions more closely approximate the continuous functions of nature.
NETWORK MODEL CONSTRUCTION
Given the tetrahedron (fig. 3) as the network model form to be considered,
the extensive and intensive properties of the system can be specified by intro-
ducing the following notation:
r - radius of ith pore having £. lengthi J
{. - length of jth pore having r. radius
V - volume hrr
.
. {..) of r , £ .pores
ij 'J iJ i J
A - area (Zwr
.
. £ . .) of r. , £ .pores
ij iJ iJ i J
N .- number of r., £. pores
ij » J
N - total number of all pore elements in network
N - number of pore following any X, Y, Z path
(i.e., a measure of the external dimensions of the model)
V_ - bulk volumeB
V - pore volumeP
f - fractional porosity
S - fractional saturation
A - specific surface area per unit pore volume
A - interfacial specific surface area per unit pore volume
C - length scaling factor, cms. per arbitrary length unit
w - subscript, designating wetting phase saturation
V /L - model cross -sectional area perpendicular to flow directionB
L - flow length of model
Accordingly, the bulk volume, cross -sectional area, and length of the
network model, respectively, are given by:
V D = [fNC] 3;
VB = [£N
TC] 2
; L=[fN.C] (3)
where the average pore length, £ , is simply: £ = j ij
N

USE OF NETWORK MODELS 11
3_Pore volume is given by: \f = C zN. . V. . ; so porosity can be expressed
P ij ij
2N..V..r y*i* -[*NL P-
Likewise, the saturation terms will have the form:
(4)
SN. V..
S = ™ 1JW(5)w 2N. V.
and the specific surface area terms will have the form:
IN., a.A 1J 1J
CIN..V..(6)
AT =J [2 £ . N. r.
2/2N.. V.. (7)
I C ~ iw iw iw ij ij
where p. is the local beta factor for each wetting -phase saturated pore r^wconnected to nonwetting -phase saturated pores.
If pore size and length distribution functions are given, Equations (3),
(4) and (6) can be solved explicitly, upon specifying the magnitude of the scal-
ing factor, C. Likewise, Equations (5) and (7) are solvable if the distribution
of wetting and nonwetting phases is known.
The Permeability Problem
To calculate permeability, the need for high-speed computing methodsis apparent. Fatt (1956) has shown that the application of Kirkhoff's laws leads
to the consequence that an (N + 1) order determinant must be solved in order
to obtain the specific resistance of a network made up of N elements. For the
problem at hand, where a tetrahedral form network of 1,728 tubes (12^) is
being considered, this introduces severe limitations if "brute force" methodsare employed to solve the requisite set of simultaneous equations.
For example, the ILLIAC digital computer facilities at" the University of
Illinois is limited to solving 143 simultaneous equations by the direct method;
but recently (Golub, 1957) a new program has been written which makes it pos-3
sible to solve problems involving, for example, 12 elements with a reasonable
amount of labor. In principle, then, it is simply necessary to specify the poreradius and length distribution functions, together with the impermeable -barrier
boundary conditions, and an explicit solution is obtained.
Although it is beyond the scope of this paper to consider the details of
such computing possibilities, it can be noted that foreknowledge of the eigen-
values of the matrix (specifically, the ratio of the minimum to the maximumvalues) greatly increases the rate of convergence and stability of the solution.
Also to be noted is the limitation of Golub's program to the solution of simul-taneous equations where zero coefficients are prevalent, as this diminishes the
computer storage problem. Fortunately, the latter condition is met in the prob-lem at hand.
When more than one immiscible fluid is saturating the pore space, the
reduced conductivities to fluid flow for each fluid (that is, the relative per-

12 ILLINOIS STATE GEOLOGICAL SURVEY
meabilities) also can be calculated by the method described above. This is
done by modifying the network through locating zero pores except where the
fluid of interest is to be found, resulting in a variable decrease in the effec-
tive beta factor and path characterizing number associated with each meshpoint. In the limit, these numbers approach zero, which is to say that the rel-
ative permeability goes to zero as path continuity is broken, even though a
finite (and perhaps large) amount of the fluid of interest still saturates the
pore space.
The Tortuosity Problem
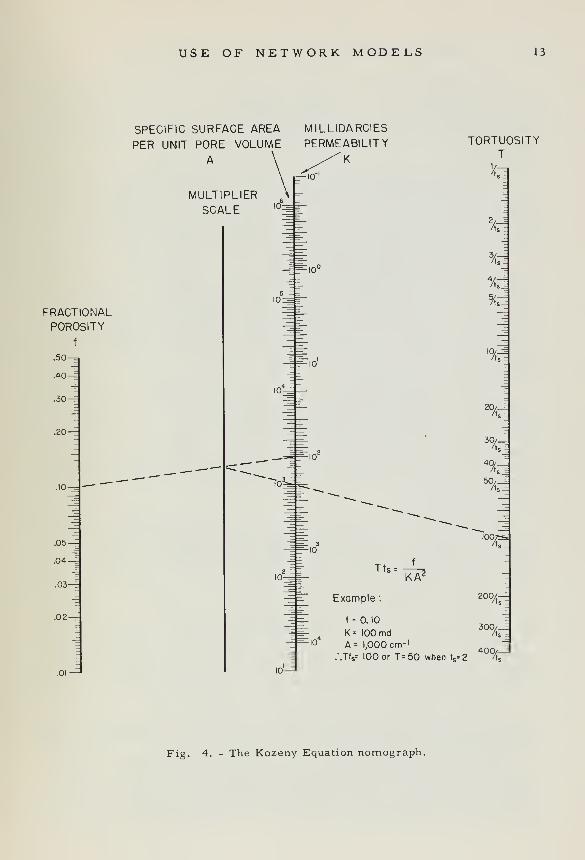
The foregoing focuses attention on the important tortuosity concept about
which there has been so much confusion. This may be defined as the constant
of proportionality which appears in the Kozeny-Carman equation for fluid flow
as:
K = f/ T t s A 2(8)
where K is permeability, f is porosity, t s is the pore shape factor (having a
constant value usually close to 2), A is the specific surface area per unit pore
volume, and T is the tortuosity. Figure 4 is a nomograph which is useful for
rapid calculations with Equation (8).
In the derivation of the Kozeny-Carman equation, T takes on the dimen-sional sense of being the square of the ratio of the actual pore path length to
the bed thickness; and in the case of unconsolidated sandstones, this pore ori-
entation factor apparently has a real and simple geometric meaning. But, as
Carman notes (1956), some workers consider it unreasonable to retain this
concept in the case of consolidated porous media because of the high values of
tortuosity which have been measured (for example, Rose and Bruce, 1949, re-
port values as high as 400 for certain well-cemented sands).
Nevertheless, the view taken here is that the tortuosity term has a real
physical significance, even though it may be difficult to arrive at a general
definition of it for use in describing consolidated porous media. This can be
illustrated nicely by reference to the network model, for here tortuous paths
easily are visualized. Thus, it is clear that pore orientation (network form)
and pore interconnection (the beta factor and the path characterizing number)have a direct influence on the flow conductivity, as does the frequency and dis-
tribution of zero pores. Finally, pore size distribution itself also will be im-portant.
Thus, given the square network form, it is apparent that the value for
tortuosity will approximate unity if all the pores are of the same size and
length, but under these same conditions it will be greater than unity for the
single -hexagonal network form (namely, T= 2.25). As the distribution of pore
sizes is broadened, however, tortuosity should increase for all network formswhen these various pore sizes are randomly distributed in space. This is be-
cause it is likely that the most conductive paths through the randomly located
larger pores will tend not to be the shortest-distance paths. Likewise, de-
creasing the beta factor and/or the path characterization number, as for ex-
ample by increasing the number of zero pores and/or decreasing the satura-
tion of the pore saturant of interest, will also cause the tortuosity to be in-
creased.
USE OF NETWORK MODELS 13
SPECIFIC SURFACE AREA
PER UNIT PORE VOLUMEA
MULTIPLIER
SCALE
FRACTIONALPOROSITY
f
.50^
.40-1
,30-f
.20—
.10— -
.05-
.04-
.03-
.02-
.01—"
io6=
— 1
§:
5 :
10^
_i r~
i y
-roy
f=-
H~
io2 -
Ji T~
io1-^
MILLIDARCIESPERMEABILITY
10"'
Tts-KA'
Example
f = 0. 10
K= 100 md104
A = 1,000 cm- 1
TORTUOSITYT
%f.
20/^/tc -
30/_:
40/_='t.
A
100,r
200/-
300,ftl
:.Tts= 100 or T= 50 when ts=24°%
Fig. 4. - The Kozeny Equation nomograph.
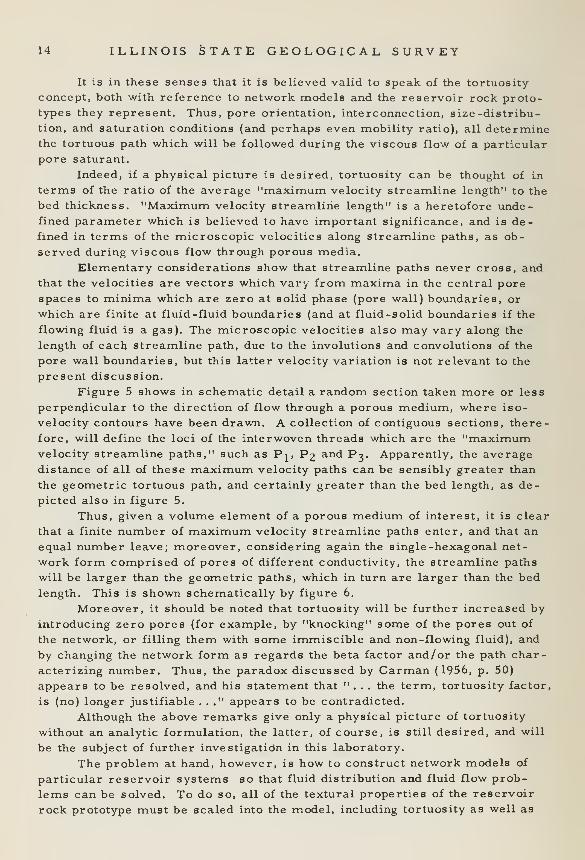
14 ILLINOIS STATE GEOLOGICAL SURVEY
It is in these senses that it is believed valid to speak of the tortuosity
concept, both with reference to network models and the reservoir rock proto-types they represent. Thus, pore orientation, interconnection, size -distribu-
tion, and saturation conditions (and perhaps even mobility ratio), all determinethe tortuous path which will be followed during the viscous flow of a particular
pore saturant.
Indeed, if a physical picture is desired, tortuosity can be thought of in
terms of the ratio of the average "maximum velocity streamline length" to the
bed thickness. "Maximum velocity streamline length" is a heretofore unde-fined parameter which is believed to have important significance, and is de-
fined in terms of the microscopic velocities along streamline paths, as ob-
served during viscous flow through porous media.
Elementary considerations show that streamline paths never cross, andthat the velocities are vectors which vary from maxima in the central pore
spaces to minima which are zero at solid phase (pore wall) boundaries, or
which are finite at fluid-fluid boundaries (and at fluid-solid boundaries if the
flowing fluid is a gas). The microscopic velocities also may vary along the
length of each streamline path, due to the involutions and convolutions of the
pore wall boundaries, but this latter velocity variation is not relevant to the
present discussion.
Figure 5 shows in schematic detail a random section taken more or less
perpendicular to the direction of flow through a porous medium, where iso-
velocity contours have been drawn. A collection of contiguous sections, there-
fore, will define the loci of the interwoven threads which are the "maximumvelocity streamline paths," such as Pi, P^ and P-j. Apparently, the average
distance of all of these maximum velocity paths can be sensibl/ greater than
the geometric tortuous path, and certainly greater than the bed length, as de-
picted also in figure 5.
Thus, given a volume element of a porous medium of interest, it is clear
that a finite number of maximum velocity streamline paths enter, and that an
equal number leave; moreover, considering again the single -hexagonal net-
work form comprised of pores of different conductivity, the streamline paths
will be larger than the geometric paths, which in turn are larger than the bed
length. This is shown schematically by figure 6.
Moreover, it should be noted that tortuosity will be further increased by
introducing zero pores (for example, by "knocking" some of the pores out of
the network, or filling them with some immiscible and non-flowing fluid), and
by changing the network form as regards the beta factor and/or the path char-
acterizing number. Thus, the paradox discussed by Carman (1956, p. 50)
appears to be resolved, and his statement that "... the term, tortuosity factor,
is (no) longer justifiable . . ." appears to be contradicted.
Although the above remarks give only a physical picture of tortuosity
without an analytic formulation, the latter, of course, is still desired, and will
be the subject of further investigation in this laboratory.
The problem at hand, however, is how to construct network models of
particular reservoir systems so that fluid distribution and fluid flow prob-
lems can be solved. To do so, all of the textural properties of the reservoir
rock prototype must be scaled into the model, including tortuosity as well as

USE OF NETWORK MODELS 15
Microscopic iso-velocity contours
Unit bed length parallel to flow direction
* *> Geometric tortuous path
* > Streamline tortuous path
Fig. 5. - A schematic representation of the iso-velocity contours, and the maxi-
mum velocity streamline loci (P[, P^ and P3), depicted in microscopic
section perpendicular to the direction of flow. Lower drawing shows
difference between geometric and streamline paths.
porosity, permeability, capillary pressure-saturation relation, saturation and
saturation distribution, specific surface area, beta factor, pore path intercon-
nections, etc. In particular cases, values for these parameters "will be knownfrom core analysis, as they characterize particular reservoir rock prototypes.
For example, tortuosity is obtained by formation factor (electrical) measure-ments, as first proposed by Wyllie and Rose (1950), specific surface area is
obtained by the method of Rose and Wyllie (1950), and the other values are ob-
tained by standard methods.

16 ILLINOIS STATE GEOLOGICAL SURVEY
Streamline
path = II units
Relative tube
resistance
KBed thickness= 5 units
Geometric path = 7units
Fig. 6. - Tortuosity and geometric tortuosity illustrated by the single -hexagonal
network form oriented parallel to the direction of flow. Numbers beside
tube elements refer to relative resistance to flow.

USE OF NETWORK MODELS 17
Equation (3) through (7), and the succeeding discussion of ILLIAC pro-
gramming of the permeability problem, suggest ways to build network modelsscaled with all textural properties except tortuosity which, at present, must be
scaled by indirect methods. For example, a network form with suitable beta
factor and path characterization number may be chosen to give a reasonable
representation of the "geometric" tortuosity of the prototype. The actual tor-
tuosity of the resultant network model can then be calculated from Equation
(8), and if this is sensibly less than the value characteristic of the prototype,
modifications are then introduced to achieve similitude. For example, a dif-
ferent pore size and length distribution can be selected so that gross features
such as porosity and permeability are not altered, and apparently this is a valid
and necessary procedure if a more reasonable scaling of tortuosity is to be ob-
tained.
Perhaps better procedures can be proposed in time, but it should be em-phasized that the tortuosity concept cannot be neglected in the construction of
valid network models. The unsupported statement of Gates (in his written dis-
cussion appended to Fatt's paper, 1956) must be rejected, where he says: "Theuse of the (network) model eliminates the 'bugger factor, 1 sometimes termedtortuosity, which is used to make theoretical calculations on the bundle of tube
models fit - experimental data." Clearly, the network model which fails to con-
sider the tortuous texture of reservoir rock will not give reasonable .solutions
of reservoir problems, except perhaps in trivial cases.
NETWORK MODEL USE
The intent of this paper is to show that valid network models of porous
reservoir rock can be constructed and used in the solution of reservoir per-
formance problems, such as those encountered in the study of waterflooding.
To this end, Fatt's pioneering work has been taken as the point of departure,
and it has been shown that bigger (3-D) and better-scaled models can be con-
structed. In the following description of their use, all solutions refer to digital
computer methods.
Fatt's previous proposal to solve flow problems by building RC -electrical
analogs of the network models, of course, is impractical when considering
large networks, and when desiring numerical accuracy in the results. Analog
models are also unnecessary, as will be shown.
The first step is to choose a network model form (for example, the tetra-
hedral 3-D form) and size, and then to scale in the prototype textural proper-ties as discussed in the previous section. For example, given the 12 model of
figure 3, and the pore size distribution of figure 7, and choosing Fatt's func-
tional relationship between pore radius and length as: •
*i=C
iri
a< 9)
porosity values can be calculated as shown in table 2.
In a like manner, given the network form and the pore size and length
distribution functions, and given the sequence of the capillary pressure desat-
uration process as obtained by Fatt's method, a variety of problems can be in-
vestigated by the simple device of variously regarding the arbitrary pore size

18 ILLINOIS STATE GEOLOGICAL SURVEY
32
28-
24-
20-
o> 16-
it I2H
6-
4-
, ! r-2 3 4 5 6 7 8
Radius size
1.2
1.0
o"E -6
^ .4-o
C/5
•i & <
B
^
• \
^^^^
0.4 0.6 0.8 1.0 1.2 1.4
r- Pore radius, microns =2ycose
Pc
1.6
Fig. 7. - A network model pore-size distribution function, as suggested by the re-
plot of the data of Rose and Bruce (1949).
Ncote: £r
(dS /dr) (dr) = S

USE OF NETWORK MODELS 19
Table 2. - Various Porosity Values for the
Cubic Network Form
f a Ci
0.477 -2 103
0.242 -1 103
0.117 10 3
0.028 1 10 3
0.005 2 10 3
0.279 1 10 2
0.050 2 10 2
0.500 2 10
numbers and their relationship to actual pore size. Thus, taking the pore size
distribution of figure 7 again, and the desaturation sequence given as table
I-III of Fatt's paper (1956), the representations of figure 8 are obtained, which
show how skewing the significance of the size distribution function alters the
capillary pressure curve. Previously herein (table 1), it was implied that the
length scaling factor, C, should have a constant value, but in obtaining figure 8
an arbitrary connection was assumed. Specifically, the relationships shown in
table 3 were selected.
o.i 0.2 0.3 0.4 0.5 0.6 7
Fractional wetting phase saturation, Sw
8 0.9 1.0
Fig. 8. - Relationship between capillary pressure curves and pore size distribu-
tion as determined by network model analysis (table 3).

20 ILLINOIS STATE GEOLOGICAL SURVEY
Table 3. - Arbitrary Designations of Pore Size
Fatt's tube Equivalent Equivalent Equivalent
Saturation radius value for value for value for
Stage designation Curve "A" Curve "B" Curve "C"
(a) 4.96 10.0 10.0 10.0
(b) 4.45 8.0 9.0 9.5
(c) 3.96 6.5 8.0 9.0
(d) 3.67 5.0 7.0 8.5
(e) 3.54 4.5 6.5 8.0
(f) 3.27 4.0 6.0 7.5
(g) 2.92 3.5 5.5 7.0
(h) 2.62 3.0 5.0 6.5
(i) 2.32 2.5 4.5 6.0
U) 1.91 2.0 3.5 5.5
(k) 1.53 1.5 2.5 3.5
(1) 1.00 1.0 1.5 2.0
(m) 0.54 0.5 0.5 0.5
The above discussion and table point to one of several features of flex-
ibility by which the results of one programmed problem become applicable to
the solution of a number of specific network problems. This, of course, is a
common characteristic of all model procedures, and it is now emphasized in
connection with network model work because every valid simplification mustbe utilized if practical solutions are to be obtained.
Varying the magnitude of the scaling parameters is an obvious device,
but less apparent is the idea that the initial specification of the pore size dis-
tribution function only freezes the relative size of the various pores (that is,
which pore is bigger) without saying anything about their relative magnitudes(that is, how much bigger). In fact, it is this latter device which has been used
in the construction of table 3. It follows as a general statement, therefore, that
any selected network. will provide solutions applicable to a limitless number of
assumed textural properties of the prototype. The variable properties include
permeability, relative permeability, specific surface area, tortuosity, etc., in
addition to porosity and the capillary pressure relationship which have beenexplicitly treated above.
Programming Procedures
The next step in problem solving, after having chosen the network formand size, and having scaled in the desired textural parameters, is to programthe problem for digital computing. Programming is done, for example, bylocating the information of table 4 in the computer's memory and/or input
source of instructions.

USE OF NETWORK MODELS 21
Table 4. - Requirements for Digital Computer Programming
1) Mesh point and pore element initial and boundary information
(N.B. One address in the computer memory stores this informa-
tion for each element):
pore size (zero or finite)
pore shape (cylindrical or other)
pore length (random, constant, or related to
pore size)
initial pore saturant (oil, water, or gas)
identification of adjacent pores (related to beta
factor).
2) Gross boundary conditions:
source and sink location
impermeable flow barriers
other relevant streamline boundaries
boundary pressure conditions in the various
fluid phases.
3) Intended scanning sequence to simulate the desired time -history
of fluid movement and /or saturation change:
the restored state programthe primary production process programthe projected secondary recovery process program.
4) Desired print-out sequence:
initial condition information about the magnitudeof the prototype 's various (intensive) textural
characteristics in the various senses which are
to be consideredsolution of the conductivity (permeability) problemrelaxation information to give the relative flow
capacities (see below)
specification of the saturation changesdepiction of the flood -front advance as a function of
time.
5) Intermediate storage program which tags relevant information
about altered conditions at the memory address of each elementand mesh point at the end of each scan, such that subsequent scans
provide print-out data which move forward in time.
The computer solution method implied by the organization of table 4 in-
volves storing necessary information in the memory, and necessary instruc-
tions either in the memory or as a part of the input tape program, so that a
sequence of events occur which is equivalent to whatever is supposed to be
happening (or whatever is assumed will happen) in the prototype system. Theprint-out, then, is the final result. Preferably this should be organized in a
form convenient for immediate analysis and interpretation. Any experienced
programmer can organize problems of the complexity contemplated in this
paper.
22 ILLINOIS STATE GEOLOGICAL SURVEY
Of special interest is the scanning feature, which is a device for system-atically, sequentially and repetiously "asking" the following type questions with
reference to each pore element:
1) What is the pore size and length and what is the pore saturant?
2) What are the size, lengths, and pore saturants of the contiguous
pore elements and what are their spatial location?
3) If there were no fluid flow (static equilibrium), would the pressurebe sufficient to cause a change in the nature of the pore saturant
in response to capillary pressure effects?
4) If condition 3) holds, is there a connected entry path for the displac-
ing phase, and a connected exit path for the displaced phase ?
5) For whatever boundary pressure conditions are assumed, what
would be the local mesh point pressure (cf. relaxation methoddiscussion, below) and what in consequence would be the rela-
tive fluid conductivity?
It is to be noted that all of these questions can be phrased in such a waythat a "yes, no" answer suffices, which explains how the unique scanning pro-
cedure is so easily adapted to digital computing. For example, the question
about pore size is asked with reference to a size interval, so that the answercan be yes or no. Similarly, when the question is asked of a given pore element,
can a displacing phase enter and can a displaced phase e-scape, the answer will
follow a pattern such as the following:
Yes, if the pressure conditions are right, and if there is a con-
tinuous entry path back to the displacing phase source at the network
boundary, and if there is a continuous escape path for the displaced
phase connected to the external sink boundary; otherwise, no.
Finally, when the question is asked about the local mesh point pressure, it is
done in accordance with the principle of the relaxation method, where a "no"
answer says an assumed pressure value does not satisfy the equation of con-
tinuity and the imposed boundary conditions. In this case, a "ho" answer will
be repeated until the correct assumption is made, and then the "yes" answertags the pressure approximation so that the information is available for later
use.
The above type questions are asked until the answers no longer change,
and then a print-out is made which will give the new conditions of saturation,
saturation change, and saturation distribution. At this point, the input programinvokes new pressure conditions, and the scanning process is repeated until
the desired complete history of fluid movement and fluid displacement has been
observed, recorded, and interpreted.
Concurrent with these scanning steps, of course, the effective permeabil-
ity relationship to saturation and saturation distribution are obtained for each
pore saturant, by the method of solving the network matrix already discussed.
A more interesting possibility is to make use of established relaxation methods(already available in ILLIAC's library of programs) to trace the history of
flood -front advance and to evaluate relative permeabilities.

USE OF NETWORK MODELS 23
An Application of the Relaxation Method
Dykstra and Parsons (1952) have discussed the application of relaxation
methods to solve certain oilfield model problems. In their work, they thought
of porous media in the macroscopic sense as a continuous conductor, which
(as an approximation) could be represented by a regular grid of interconnected
tubes. These tubes would have the same radius and length if an isotropic med-ium is being considered, so that upon applying the equation of continuity at
each grid intersection (mesh point), a correct guess about the local pressures
throughout the network is indicated by:
lim SAP = (10)
where the AP's are the pressure differences between the local mesh point of
interest and all other contiguous mesh points (one tube element distance away).
The local P values themselves initially are guessed, making use of whateverphysical intuition is possible, so that the first set of summations have finite
values greater or less than zero. By successive approximation, then, the pres-
sure values are adjusted upwards or downwards (using the initial residual to
improve the indications of physical intuition) until all the summations approachzero closely. (A general form for the residuals, 8 , to be relaxed to zero is:
- — p. + 2 p. where Pj refers to the pressure at the mesh point of inter-
est, and the P^'s are the pressures at the adjacent mesh points.) Finally, a
decision is made that sufficient accuracy has been obtained in the result, and
that further relaxations would only entail unprofitable continued computation.
A balance also can be made between the grid spacing and the number of in-
tended computations, so that the maximum accuracy is obtained with the least
amount of effort.
In network model analysis, analogous relaxation procedures can be de-
veloped, and these are especially adaptable to digital computing. In this case,
there is no need to superimpose a relaxation grid over the model, since the
latter already is in network form. That is, the flow in and out of given meshpoints can be considered directly on the basis of conservation of matter, so
that local pressure points can be evaluated. The relaxation approximationsare carried forth, however, using the relation:
4
lim I -j— AP.. =0 (11)
where Equation (11) reduces to Equation (10) in the event all the pore sizes and
lengths are the same. Note, the fluid conductance of a network made up of
tubes in series and parallel is:
n1
I
I tl/ri
Figures 9 and 10 depict the solution of relative permeability problemsby the relaxation method. In figure 9, an array of uniform-sized tube elementsis assumed, having the interconnection given by the state "f" desaturation pro-
cess of Fatt's table I-III (1956); and noted thereon are the relaxed pressure

24 ILLINOIS STATE GEOLOGICAL SURVEY
SOURCE, P=UO
J 10
9PN^s>*̂
V
ZERO PORES'
SINK, P =
VERO PORES*
28i_
rr<
54Jr Q
oCD
28f
Residual Local mesh point
pressure
Fig. 9. - Triple -hexagonal network model showing mesh point pressures in the
wetting phase saturated portion, as obtained by relaxation analysis.

USE OF NETWORK MODELS 25
values (and residuals) locally occurring at each mesh point. Relative perm-eability of the wetting phase can then be calculated by relating the flow across
any arbitrary boundary at saturation, Sw , to the flow when Sw is unity, as given
by:
Krw =U/V (12)
where. U is- calculated by the summation of Equation (11), considering only the
wetting phase saturated pores going across the arbitrary boundary; and V is
calculated by the summation of Equation (11), considering all the pores going
across this boundary and the AP's when Sw is unity. For example, the wetting
phase saturated pore elements in figure 9, crossing the XY boundary, can be
selected to calculate U, and these pores plus the zero-pores (oil saturated)
which go across the XY boundary can be selected to calculate V.
Figure 10 is another problem of relative permeability of the wetting
phase for the same triple-hexagonal pattern of uniform-sized pores, inter-
connected according to the "h" desaturation stage of Fatt's table I-III. In this
case, a field map has been drawn by using the relaxed pressure values as
guides to draw arbitrary equipotentials and streamlines. This device provides
an alternate method of graphical solution, and table 5 shpws some results which
have been obtained.
Table 5. - Typical Relative Permeability Values
S K Notesw rw
0.90 0.840 Calculated by Equation (12)
0.70 0.548 Calculated by Equation (12)
0.70 0.554 Calculated by field mappingtechnique of Moore (1952)
Reference to figure 1 -II of Fatt's paper (1956) shows that equivalent re-
sults have been obtained. Thus established is the general validity of the anal-
ysis methods which give the data of table 5, through the demonstrated conform-ance to the more laboriously obtained analog model methods employed by Fatt.
This conformance is of added interest, for it will be recalled that Fatt assumeda random desaturation sequence and that table 5 shows data pertaining to a cap-
illary pressure desaturation sequence. This seems to imply that, given a ran-
dom location of pores of random sizes, there is little difference between the
consequence of the two mechanisms. If fully established, this circumstancecould be utilized to great advantage in simplifying the programming of mixture
-
flow problems because pore size need not be considered explicitly in develop-ing the sequence of saturation change.
Obviously, relative permeabilities of the nonwetting phase also can be
calculated by the methods given above, where the first (that is, Equation 12) is
suitable for digital computing, and the .second (that is, the graphical method) is
of interest in pointing to the valid representation of a discontinuous network by
a continuous medium. More important is the application of the latter to visu-
alize the transient flood-front advance as fluid saturations are changing with
time and position throughout the network during fluid displacement.

26 ILLINOIS STATE GEOLOGICAL SURVEY
SOURCE
SINK
Immobile nonwettmg phase
- Streamline
Equipotential contour
Fig. 10. - Triple -hexagonal network model with superimposed field map of stream-
lines and equipotential contours through the wetting phase saturated por-tion. Equipotential contours obtained from relaxation analysis; flow
tubes, by the method of Moore (1952).

USE OF NETWORK MODELS 27
Other Applications
It will be recalled that Fatt originally used certain simplifications for
tracing saturation changes involving the following:
1) There is a continuous path for the entry of a displacing phaseinto the particular pore element of interest; and
2) The static equilibrium boundary pressures in the displacing
and displaced phase reservoirs creates a capillary pressure con-
dition that means the displacing phase should enter, and the dis-
placed phase should leave, the particular pore element of interest.
These simplified conditions inadequately represent what actually happens.
First, there must be an exit path for the displaced phase as Rose et al. asserted
(cf. discussion following Fatt's paper, 1956). Second, it is the internal and lo-
cal pressures, and not the external boundary pressures, which determinewhether or not imbibition or drainage displacement will occur. And as noted
above, the relevant mesh point pressure values can be obtained by a pro-
grammed relaxation process. This means, of course, that the transient flood-
front advance can be obtained as a succession of steady-states, according to
standard methods (cf. for example, Muskat, 1949).
The foregoing suggests an application possibility of extreme importance,
since heretofore it has been practical to consider only the gross aspects of
flood-front advance, such as those related to gross boundary conditions, and
even then most studies have been limited to a consideration of isotropic reser-
voirs and unity mobility ratio. The network model, however, provides a wayto synthesize the complete history of displacement processes, starting with
the microscopic details. Nonuniform reservoir anisotropics, complex initial
and boundary conditions, and non-unity mobility ratio situations can be handled
as simply as more trivial cases.
Still another application possibility is to program network analyzer solu-
tions in two successive stages. The first part can be a conventional analysis
wherein the network model has microscopic point-to-point similarity with a
small volume element of the reservoir of interest. After the details of the
displacement process have been evaluated, a second network model is con-
structed to represent the gross aspects of the reservoir at large. In such an
application, each tube group in the second network has a length and radius such
that it represents the porosity and permeability of the volume elements which
are the prototype of the first network model.
For example, let Lv , L and L„ be the external dimensions of the volume1 X y Z
element, and choose the second network of cubic form, and let rx , r and r
be the radii of the three tubes in the coordinate directions which together are
to represent the volume element. Then, the permeability in the coordinate
directions, k__, k and k , and the porosity will be given by:'x y z
k=fr 2 /8 k=fr 2 /8 k=fr / 8xx y y z z
f =
rx Lx + ryLy
+ rzLz
Lx LyLz <
13>

28 ILLINOIS STATE GEOLOGICAL SURVEY
Hence, by Equation (13), one can calculate the length and radius of the tube
elements of the second network, which represent the permeability and porosity
of the volume element prototype of the first network model. This approachwould seem to permit analysis of cross-flow phenomena, stratification effects,
and productivity indices of complex reservoir systems.
The above remarks about the importance of information on non-steady-
state flow do not signify that there will be no future interest in relative perm-eability values for steady-state flow. In fact Richardson (1957) recently has
shown the great utility of steady-state data for waterflood calculations. It is
unfortunate, but a fact, that very little relative permeability data have been ob-
tained to date and reported in the literature, a scarcity due for the most part
to the difficulty of laboratory procedure. It is of interest, therefore, that anal-
ysis can be made of three-phase relative -permeability relationships using net-
work model methods.
Gas
Water
Fig. 11. - Ternary relative permeability diagram obtained from network modelanalysis.
For example, figure 11 is a conventional ternary plot of three-phase
relative -permeability data obtained using a network system having the pore
sizes of figure 7, and the methods of study discussed above and previously
(Rose 1957). As can be seen, the water and oil isoperms are similar to those

USE OF NETWORK MODELS 29
reported previously (Muskat, 1949), but the gas isoperms suggest a higher con-
ductivity for the gas in the three-phase saturation region than in the two-phase
region. This is not an unreasonable expectation in accordance with the idea
that the previously established paths of oil continuity in the three-phase region
will aid the flow of gas. Hence, figure 11 may be taken as reasonably represent-
ative of relative permeability data, and the network model methods of analysis
reported in this paper may be taken as valid approaches to an understanding of
the performance of petroleum reservoirs.
CONCLUSIONS
Model studies are necessary in order to understand the details of petro-
leum recovery because field observation methods are inadequate and analytic
studies are difficult. The network model offers especially unusual possibili-
ties for evaluating and predicting future reservoir performance. For example,
they provide a direct means for determining the displacement efficiency which
indicates the success of waterflooding operations. Thus, this paper has beenwritten with the general objective of furthering the utility of network modelmethods .for solving reservoir engineering problems. Specific accomplishmentsinclude:
1) A statement of the importance of the displacement efficiency concept,
and the unique ways this may be evaluated by network model analysis.
2) An enumeration of the reservoir rock intensive and extensive proper-ties which must.be scaled in the network model to achieve similitude, and an
indication of how this scaling may be done.
3) The development of the "path characterization number" concept, the
idea of "zero" pores, and notions regarding "maximum velocity streamlines."
These innovations have led to new views about the important tortuosity concept
which minimize the importance of "geometric" tortuosities.
4) An application of probability theory which asserts that a random point
selected in prototype space has a certain probability of being located in a pore,
and that this probability should characterize the model at all points. Other
probabilities refer to defining the size, shape, orientation, and continuity of
pores; to the pore saturants; to the proximity of fluid -fluid boundaries to solid
phase surfaces; and to the size, shape, orientation, and continuity of these inter-
faces.
5) The procedure for describing the transients of flood -front advance so
that factors affecting recovery can be evaluated through an application of the
relaxation method.
6) The proof of the necessity for considering large (3-D) networks, and
hence an indication of the necessity for digital computing methods.
7) An analysis of the requirements for programming various categories
of network model problems on digital computers such as ILLIAC.8) The indication that single network model solutions will have general
application to a variety of problems, through control of scaling factors and
other arbitrary specifications relating model to prototype.
9) The results of certain preliminary network model studies, establish-
ing the validity and utility of the methods outlined in this paper.

30 ILLINOIS STATE GEOLOGICAL SURVEY
Much remains to be done. Building and using network models require
a heretofore unknown accuracy in specification of prototype characteristics.
The development of digital computing methods is only in its infancy. Numer-ical checks, not yet available, are necessary to prove the full value of the var-
ious application possibilities. Still and all, the considerations treated in this
paper add strength to the view that network model methods of analysis offer
the clue, not elsewhere available, for finding practical solutions to important
reservoir problems.
Acknowledgment
Helpful discussions with Paul Witherspoon and David Geiger during the
eajrly stages of this work must be acknowledged. Don Pierre provided someof the calculations, as did Richard Strauser of the Department of Mining and
Metallurgical Engineering, University of Illinois.
REFERENCES
Aronofsky, J. S., and Ramey, H. J., Jr., 1956, Mobility-ratio - its influence oninjection or production histories in five-spot waterflood: Trans. A.I.M.E.,v. 207, p. 205.
Bruce, W. A., and Welge, H. J., 1948, The restored-state method for determin-ation of oil in place and connate water: Drilling and Production Prac-tice, 1947, p. 166, A.P.I. , New York.
Calhoun, John, and LaRue, J. W., 1951, The effect of velocity in waterflooding:Producers Monthly, v. 15, no. 6, p. 21.
Carman, P. C, 1937, Fluid flow through granular beds: Trans. Inst. Chem.Engineers, v. 15, p. 154.
Carman, P. C, 1956, Flow of gases through porous media: Academic PressInc.
Dykstra, H., and Parsons, R. L., 1951, Relaxation methods applied to oil field
research: Trans. A.I.M.E., v. 192, p. 227 .
Fatt, Irving, 1956, The network model of porous media. I. Capillary pressurecharacteristics. II. Dynamic properties of a single size tube network.
III. Dynamic properties of networks with tube radius distribution: Jour.
Pet. Tech., v. 8, no. 7, p. 144, July, 1956. (Also discussions appendedthereto by Gates, Josendal, and Rose et al., p. 177, 178, 179; also Trans.
A.I.M.E., v. 207, p. 144.)
Golub, Gene, 1957, University of Illinois ILLIAC Library program of routines.
Jordan, J. K., McCardell, W. M., and Hocott, C. R., 1957, Effect of rate on
oil recovery by waterflooding: Oil and Gas Jour., v. 55, no. 19, p. 98.
Moore, A. D., 1952, Mapping techniques applied to fluid mapper patterns: Proc.
A.I.E.E., v. 71, p. 1.
USE OF NETWORK MODELS 31
Moore, T. F., and Slobod, R. L., 1956, The effect of viscosity and capillarity
on the displacement of oil by water: Producers Monthly, v. 20, no. 10,
p. 20.
Muskat, Morris, 1949, Physical principles of oil production: McGraw Hill BookCo., New York.
Richardson, J. G., 1957, The calculation of waterflood recovery from steady-
state relative permeability data: Jour. Pet. Technology, v. 9, no. 5, p.
64.
Rose, Walter, 1957, Studies of waterflood performance. I. Causes and charac-
ter of residual oil: Illinois Geol. Survey Bull. 80, p. 147-163.
Rose, Walter, and Bruce, W. A., 1949, Evaluation of capillary character in
petroleum reservoir rock: Trans. A.I.M.E., v. 186, p. 127.
Rose, Walter, and Cleary, James, Further indications of pore doublet theory:
Producers Monthly, in press, August, 1956 (Illinois Geol. Survey Reprint
Series)
Rose, Walter, and Witherspoon, Paul, 1956, Studies of waterflood performance.
II. Trapping oil in a pore doublet: Illinois Geol. Survey Circ. 224 (also,
reprint in December, 1956, Producers Monthly).
Rose, Walter, and Wyllie, M. R. J., 1950, Specific surface areas and porosities
from microphotographs: Bull. A.A.P.G., v. 34, no. 8, p. 1948.
Winsauer, W. O., Shearin, H. M., Jr., Masson, P. H., and Williams, Milton,
1952, Resistivity of brine -saturated sands in relation to pore geometry:Bull. A.A.P.G., v. 36, no. 2, p. 253.
Wyllie, M. R. J., and Rose, Walter, 1950, Some theoretical considerations re-
lated to the quantitative evaluation of the physical characteristics of
reservoir rocks from electric logs: Trans. A.I.M.E., v. 189, p. 105.
Illinois State Geological Survey Circular 237
31 p., 11 figs., 5 tables, 1957


nnmzzi<£cuidoP£vtco6v\l
CIRCULAR 237
ILLINOIS STATE GEOLOGICAL SURVEYURBANA jib.
Related Documents