This PDF is a selection from an out-of-print volume from the National Bureau of Economic Research Volume Title: Studies in International Taxation Volume Author/Editor: Alberto Giovannini, R. Glen Hubbard, and Joel Slemrod, eds. Volume Publisher: University of Chicago Press Volume ISBN: 0-226-29701-2 Volume URL: http://www.nber.org/books/giov93-1 Conference Date: Sept. 26-28, 1991 Publication Date: January 1993 Chapter Title: Explaining the Low Taxable Income of Foreign-Controlled Companies in the United States Chapter Author: Harry Grubert, Timothy Goodspeed, Deborah L. Swenson Chapter URL: http://www.nber.org/chapters/c8000 Chapter pages in book: (p. 237 - 276)

Welcome message from author
This document is posted to help you gain knowledge. Please leave a comment to let me know what you think about it! Share it to your friends and learn new things together.
Transcript

This PDF is a selection from an out-of-print volume from the National Bureauof Economic Research
Volume Title: Studies in International Taxation
Volume Author/Editor: Alberto Giovannini, R. Glen Hubbard, and Joel Slemrod,eds.
Volume Publisher: University of Chicago Press
Volume ISBN: 0-226-29701-2
Volume URL: http://www.nber.org/books/giov93-1
Conference Date: Sept. 26-28, 1991
Publication Date: January 1993
Chapter Title: Explaining the Low Taxable Income of Foreign-ControlledCompanies in the United States
Chapter Author: Harry Grubert, Timothy Goodspeed, Deborah L. Swenson
Chapter URL: http://www.nber.org/chapters/c8000
Chapter pages in book: (p. 237 - 276)

7 Explaining the Low Taxable Income of Foreign-Controlled Companies in the United States Harry Grubert, Timothy Goodspeed, and Deborah Swenson
The low taxable income reported by foreign-controlled companies in the United States has recently attracted a great deal of attention. For instance, the abnormally low rate of return of foreign-controlled companies has fueled con- cern in Congress over U.S. taxation of these companies and, more specifi- cally, concern that foreign firms operating in the United States are able to escape U. S. taxation.
A glance at the aggregate data shows the reason for congressional concern over this issue. Table 7.1 shows that the ratio of taxable income to assets was only .58 for foreign-controlled companies, as compared with 2.14 for domes- tically controlled companies in 1987. Moreover, this differential persists when the data are separately presented for nonfinancial, manufacturing, and whole- sale industries and when the ratios are recomputed uskg sales rather than assets as the scaling factor in the denominator.
The low earnings and tax payments of foreign-controlled firms can result from many factors, including transfer price manipulation, greater debt costs than their U.S. counterparts, various effects of mergers and acquisitions, start- up costs, fluctuations in exchange rates, and differences in the cost of capital. Before proceeding, we briefly examine how each of these factors might lower the rate of return of foreign-controlled corporations.
Transfer pricing may be used to price goods, intangibles, and management services such that taxable income is shifted to a low-tax jurisdiction. The in-
Harry Grubert is an international economist in the Office of Tax Analysis, U.S. Treasury De- partment. Timothy Goodspeed is assistant professor of economics at Florida International Univer- sity. Deborah Swenson is assistant professor at the Fuqua School of Business, Duke University.
The authors are indebted to Paul Dobbins for constructing the basic data files and providing them in a form that greatly simplified the statistical work. He also did much of the initial program- ming and made many helpful suggestions. Donald Rousslang, Joel Slemrod, and Gordon Wilson also offered many helpful suggestions. Nothing in this paper should be construed as a Treasury Department position.
237

238 H. Grubert, T. Goodspeed, and D. Swenson
centive for shifting income out of the United States depends in part on the tax system of the home country. For example, a clear incentive exists to shift income to a home country that has both a low statutory tax rate and a tax exemption on foreign dividends. However, the bilateral comparison between U.S. and home-country tax rates should not be overemphasized, because in- come can easily be shifted to some tax haven interposed between the two. Most industrialized countries do not have the strict antiabuse rules that are contained in U. S. law limiting the routing of sales or services income through a tax haven.2
With the data that are available, it is difficult to identify transfer price dis- tortions directly. Part of the strategy of this paper is to evaluate the extent to which the foreign-domestic differential is attributable to other explanations. By controlling for other factors that contribute to the differential, we can set an upper bound on the significance of transfer price manipulation. It is also possible to look at indirect evidence of earnings management, such as the distribution of foreign-controlled companies’ profitability ratios. That is, do foreign returns concentrate around zero, or are the aggregate foreign results attributable to extreme losses by a limited number of companies?
Higher debt costs are a second means by which foreign-controlled compa- nies might achieve relatively low U.S. taxable income. This may reflect more debt from unrelated lenders. Large debt costs may also result from “earnings stripping,” in which large interest payments are made to related offshore com- panies. In either case, high debt costs will lead to low taxable income, be- cause interest expenses are deductible.
Foreign direct investment in the United States in the form of acquisitions can have a number of accounting and tax consequences, which in turn af- fect the measured foreign rate of return. This may be particularly relevant because the major source of new direct investment in the United States since at least the late 1970s has been acquisitions rather than greenfield s ta r t -~ps .~ One consequence is the straightforward increase in the book value of assets, which lowers the measured ratio of taxable income to assets. A second con- sequence of asset revaluation is that a firm that maintains a given ratio of debt to assets will experience an increase in interest expenses, which in turn erodes the firm’s taxable income. Finally, an acquisition would often, particularly before 1987, lead to a step-up in basis and higher depreciation deductions, again leading to lower taxable income.
1. The significance of the exemption is that foreign taxes paid are of no value as a credit against home-country taxes. There may be other aspects of home-country tax systems that are relevant. For example, countries with some form of corporate tax integration usually do not pass foreign tax credits through to the personal level.
2. The recent Price Waterhouse (1991) study on U.S. International Tax Policy outlines these differences between U.S. and foreign practice.
3. See the annual articles in the Survey of Currenr Business on U.S. business enterprises ac- quired or established by foreign investors. In 1989, for example, acquisitions accounted for 86 percent of investment outlays.
239 Low Taxable lncome of Foreign-Controlled Companies
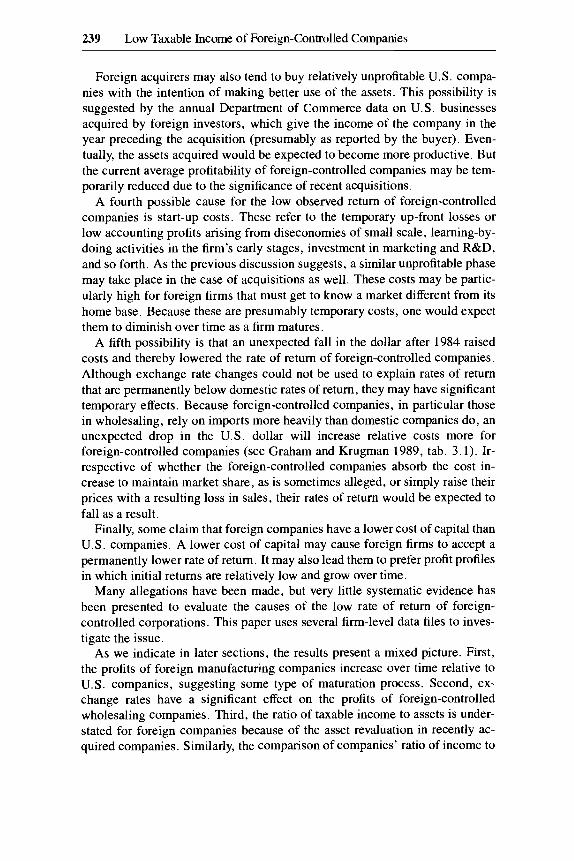
Foreign acquirers may also tend to buy relatively unprofitable U.S. compa- nies with the intention of making better use of the assets. This possibility is suggested by the annual Department of Commerce data on U.S. businesses acquired by foreign investors, which give the income of the company in the year preceding the acquisition (presumably as reported by the buyer). Even- tually, the assets acquired would be expected to become more productive. But the current average profitability of foreign-controlled companies may be tem- porarily reduced due to the significance of recent acquisitions.
A fourth possible cause for the low observed return of foreign-controlled companies is start-up costs. These refer to the temporary up-front losses or low accounting profits arising from diseconomies of small scale, learning-by- doing activities in the firm’s early stages, investment in marketing and R&D, and so forth. As the previous discussion suggests, a similar unprofitable phase may take place in the case of acquisitions as well. These costs may be partic- ularly high for foreign firms that must get to know a market different from its home base. Because these are presumably temporary costs, one would expect them to diminish over time as a firm matures.
A fifth possibility is that an unexpected fall in the dollar after 1984 raised costs and thereby lowered the rate of return of foreign-controlled companies. Although exchange rate changes could not be used to explain rates of return that are permanently below domestic rates of return, they may have significant temporary effects. Because foreign-controlled companies, in particular those in wholesaling, rely on imports more heavily than domestic companies do, an unexpected drop in the U.S. dollar will increase relative costs more for foreign-controlled companies (see Graham and Krugman 1989, tab. 3.1). Ir- respective of whether the foreign-controlled companies absorb the cost in- crease to maintain market share, as is sometimes alleged, or simply raise their prices with a resulting loss in sales, their rates of return would be expected to fall as a result.
Finally, some claim that foreign companies have a lower cost of capital than U.S. companies. A lower cost of capital may cause foreign firms to accept a permanently lower rate of return. It may also lead them to prefer profit profiles in which initial returns are relatively low and grow over time.
Many allegations have been made, but very little systematic evidence has been presented to evaluate the causes of the low rate of return of foreign- controlled corporations. This paper uses several firm-level data files to inves- tigate the issue.
As we indicate in later sections, the results present a mixed picture. First, the profits of foreign manufacturing companies increase over time relative to U.S. companies, suggesting some type of maturation process. Second, ex- change rates have a significant effect on the profits of foreign-controlled wholesaling companies. Third, the ratio of taxable income to assets is under- stated for foreign companies because of the asset revaluation in recently ac- quired companies. Similarly, the comparison of companies’ ratio of income to

240 H. Grubert, T. Goodspeed, and D. Swenson
sales is distorted by differences in the role of outside purchases and of invest- ment income. These effects explain about half of the differential between the rates of return of foreign- and domestically controlled companies. This still leaves us with a significant difference that we are unable to explain by forces other than transfer pricing. Moreover, we find, even after accounting for these other factors, that foreign-controlled firms were more likely to maintain a rate of return close to zero over the 1980-87 period.
We can also reject some other explanations of foreign companies’ low tax- able income. First, debt and earnings stripping do not seem to be important in explaining the low taxable income of foreign-controlled companies. Second, U.S. companies acquired by foreigners seem to be similar in profitability to the average U. S. company prior to acquisition. Furthermore, cost-of-capital advantages do not seem to be important. For one thing, the parents of foreign- controlled companies are more profitable than comparable U.S. companies.
The remainder of the paper is organized as follows. Section 7.1 provides a brief discussion of our data sources and other issues that relate the data. Based on data from a cross section of firms in 1987, section 7.2 presents evidence on revaluation effects, debt and earnings stripping, and cross-country differ- ences. In section 7.3, we turn to the 1980-87 panel of firms to shed light on the importance of exchange rate and maturation effects. Section 7.4 contains a look at the distribution of foreign companies’ returns to determine whether it is consistent with income shifting. Again using the 1980-87 panel, we gauge the propensity of foreign and domestic firms to persist in particular rate- of-return categories. Section 7.5 is an exploration of the relationship between foreign parent characteristics and their U.S. subsidiaries’ profitability, while in section 7.6 we compare the profitability of foreign targets before acquisi- tion with the profitability of the average U.S. nonfinancial company. Finally, we summarize and conclude in section 7.7.
7.1 Data Issues
7.1.1 Description of Data
As noted above, we use several firm-level data files to cast more light on the issue. The basis of these data is information collected from IRS Form 1120, the basic corporate tax form. Information from these forms is collected and edited by the Statistics of Income Division (SOI) of the Internal Revenue Service and is then provided to the Treasury Department. SO1 uses a stratified sampling procedure. The data include all companies reporting assets of $50 million or more, although a company with fewer assets may also be chosen with certainty if its “proceeds,” a measure of cash flow, are large enough. In addition, there is a sample of smaller firms.
Form 1120 contains various useful variables, including a company’s year of incorporation, gross income, deductions, taxable income, cost of goods sold,
241 Low Taxable Income of Foreign-Controlled Companies
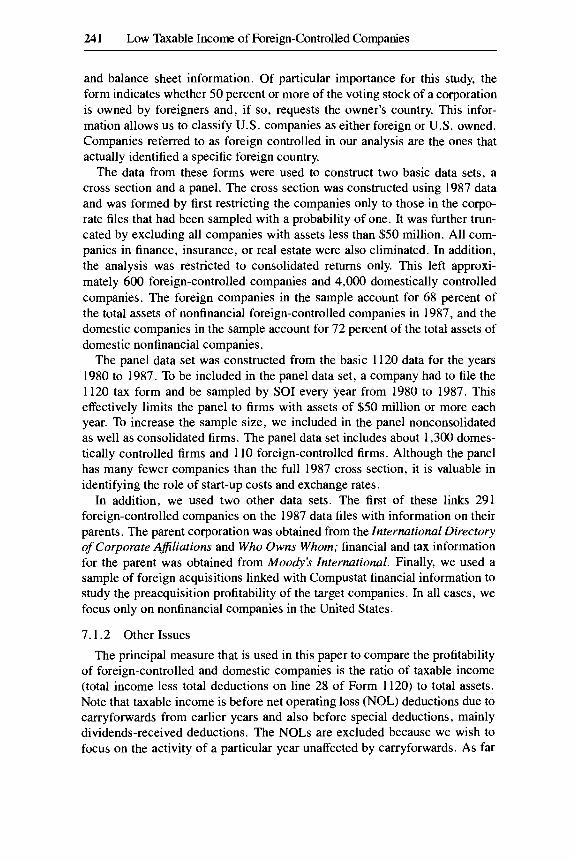
and balance sheet information. Of particular importance for this study, the form indicates whether 50 percent or more of the voting stock of a corporation is owned by foreigners and, if so, requests the owner’s country. This infor- mation allows us to classify U.S. companies as either foreign or U.S. owned. Companies referred to as foreign controlled in our analysis are the ones that actually identified a specific foreign country.
The data from these forms were used to construct two basic data sets, a cross section and a panel. The cross section was constructed using 1987 data and was formed by first restricting the companies only to those in the corpo- rate files that had been sampled with a probability of one. It was further trun- cated by excluding all companies with assets less than $50 million. All com- panies in finance, insurance, or real estate were also eliminated. In addition, the analysis was restricted to consolidated returns only. This left approxi- mately 600 foreign-controlled companies and 4,000 domestically controlled companies. The foreign companies in the sample account for 68 percent of the total assets of nonfinancial foreign-controlled companies in 1987, and the domestic companies in the sample account for 72 percent of the total assets of domestic nonfinancial companies.
The panel data set was constructed from the basic 1120 data for the years 1980 to 1987. To be included in the panel data set, a company had to file the 1120 tax form and be sampled by SO1 every year from 1980 to 1987. This effectively limits the panel to firms with assets of $50 million or more each year. To increase the sample size, we included in the panel nonconsolidated as well as consolidated firms. The panel data set includes about 1,300 domes- tically controlled firms and 110 foreign-controlled firms. Although the panel has many fewer companies than the full 1987 cross section, it is valuable in identifying the role of start-up costs and exchange rates.
In addition, we used two other data sets. The first of these links 291 foreign-controlled companies on the 1987 data files with information on their parents. The parent corporation was obtained from the International Directory of Corporate Afiliations and Who Owns Whom; financial and tax information for the parent was obtained from Moody’s International. Finally, we used a sample of foreign acquisitions linked with Compustat financial information to study the preacquisition profitability of the target companies. In all cases, we focus only on nonfinancial companies in the United States.
7.1.2 Other Issues
The principal measure that is used in this paper to compare the profitability of foreign-controlled and domestic companies is the ratio of taxable income (total income less total deductions on line 28 of Form 1120) to total assets. Note that taxable income is before net operating loss (NOL) deductions due to carryforwards from earlier years and also before special deductions, mainly dividends-received deductions. The NOLs are excluded because we wish to focus on the activity of a particular year unaffected by carryforwards. As far
242 H. Grubert, T. Goodspeed, and D. Swenson
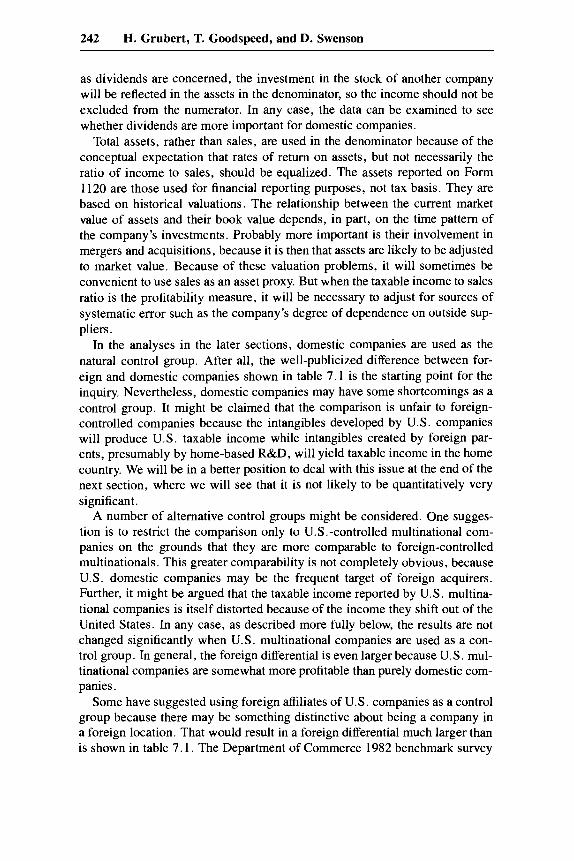
as dividends are concerned, the investment in the stock of another company will be reflected in the assets in the denominator, so the income should not be excluded from the numerator. In any case, the data can be examined to see whether dividends are more important for domestic companies.
Total assets, rather than sales, are used in the denominator because of the conceptual expectation that rates of return on assets, but not necessarily the ratio of income to sales, should be equalized. The assets reported on Form 1120 are those used for financial reporting purposes, not tax basis. They are based on historical valuations. The relationship between the current market value of assets and their book value depends, in part, on the time pattern of the company’s investments. Probably more important is their involvement in mergers and acquisitions, because it is then that assets are likely to be adjusted to market value. Because of these valuation problems, it will sometimes be convenient to use sales as an asset proxy. But when the taxable income to sales ratio is the profitability measure, it will be necessary to adjust for sources of systematic error such as the company’s degree of dependence on outside sup- pliers.
In the analyses in the later sections, domestic companies are used as the natural control group. After all, the well-publicized difference between for- eign and domestic companies shown in table 7.1 is the starting point for the inquiry. Nevertheless, domestic companies may have some shortcomings as a control group, It might be claimed that the comparison is unfair to foreign- controlled companies because the intangibles developed by U.S. companies will produce U.S. taxable income while intangibles created by foreign par- ents, presumably by home-based R&D, will yield taxable income in the home country. We will be in a better position to deal with this issue at the end of the next section, where we will see that it is not likely to be quantitatively very significant.
A number of alternative control groups might be considered. One sugges- tion is to restrict the comparison only to U.S.-controlled multinational com- panies on the grounds that they are more comparable to foreign-controlled multinationals. This greater comparability is not completely obvious, because U.S. domestic companies may be the frequent target of foreign acquirers. Further, it might be argued that the taxable income reported by U.S. multina- tional companies is itself distorted because of the income they shift out of the United States. In any case, as described more fully below, the results are not changed significantly when U.S. multinational companies are used as a con- trol group. In general, the foreign differential is even larger because U.S. mul- tinational companies are somewhat more profitable than purely domestic com- panies.
Some have suggested using foreign affiliates of U.S. companies as a control group because there may be something distinctive about being a company in a foreign location. That would result in a foreign differential much larger than is shown in table 7.1. The Department of Commerce 1982 benchmark survey

243 Low Taxable Income of Foreign-Controlled Companies
Table 7.1 Taxable Income as a Percentage of Total Assets and Sales in Foreign- and U.S.-Controlled Companies (1987 aggregate data*)
Taxable Taxable Income/Assets Income/Sales
Foreign U.S. Foreign U.S.
All Industries .58% 2.14% .89% 4.37% Nonfinancial 1.01 3.79 1 .oo 3.51 Manufacturing 1.60 4.94 2.39 4.21 Wholesale trade .68 3.24 .29 1.41
Nore: Taxable income is total income less total deductions (line 28 on Form 1120) before net operating loss and special deductions. Sales refer to gross receipts or sales (line 1 on the Form 1120). Data may differ slightly from tables in SO1 Bulletin 10 (Summer), 1990, because of differences in definitions. *Based on tabulations of 1987 corporate tax file.
on foreign direct investment indicates that foreign affiliates’ pretax income was 8.76 percent of total assets, while their parents earned only 4.76 percent on total assets. But there are many problems with using U.S. affiliates.abroad. First, they do not mirror foreign companies in the United States, which are much more likely to be the result of acquisitions than of start-ups. Second, it would be necessary to deal with the different economic environments and in- centives to shift income in each foreign location. Accordingly, we stick with all domestically controlled U. S . companies, including both multinational and strictly domestic companies, as the control group, both because the public controversy has started on that basis and because the alternatives seem less valid. We will also report results when other control groups are used.
7.2 Evidence from 1987 Corporate Cross Section
We begin by using the 1987 cross-section data to analyze five issues: start- up or acquisition effects, debt and earnings stripping, variations across foreign countries, the use of income over sales as a dependent variable, and the poten- tial use of various types of expenses as transfer pricing mechanisms.
7.2.1 Start-up or Acquisition Effects
The first column of table 7.2 gives the benchmark first regression for the relationship between the ratio of taxable income and total assets, denoted by r,, and dummies indicating industry and foreign-controlled status. The results mirror the aggregate data in table 7.1 and reveal a very large negative and statistically significant foreign effect of 3.57 percentage point^.^ (The overall
4. In the 1987 sample, the mean r, for domestic companies is 4.07, and .87 for foreign- controlled companies. These are very close to the aggregate 3.79 and 1.01 for nonfinancial com- panies in table 7. I even though the 1987 sample means are unweighted and the sample is restricted

244 H. Grubert, T. Goodspeed, and D. Swenson
Table 7.2 Alternative regressions for Taxable Income to Asset Ratio (1987 file- nonfinancial corporations)*
Intercept
Foreign
Manufacturing
Wholesale
Transportation and utilities
Food
Electronics
Chemicals
Age 1: 5 5 years
Age 2: >5-510
Age 3: > I s 5 1 5
Age 4: > 15-520
Age 5: >2&530
Debt-assets
Intangible plus other assets
Rz adjusted
,0286 (9.73)
( - 7.46) .0280
(6.86) ,0105
(1.89) - ,0098
- .0357
(-1.81)
(-1.12)
( - 3.10)
(4.03)
- ,0088
- .0201
,0320
.033
.0500
- ,0267
,0227
,0056
(12.67)
(-5.48)
(5.52)
(.01)
(2.11) - ,0063
( - .80)
- ,0114
- ,0187 (-2.90)
,0297
- ,041 1
- ,0252
(3.77)
(-9.62)
(-4.73)
(-3.49) - .0217
- ,0218 ( - 3.87)
(-2.61) - ,0142
,052
,1437
- .0259 ( - 5.73)
,0136 (3.55)
,0073 (1.42) - .0079 (1.57) - ,000 (-.ow - ,0318
(-5.31) ,0186
(2.55) - ,0176
(-4.29)
( - 2.47)
( - 1.94)
(- 1.92)
(1.32) - ,1461
( - 26.01)
(-3.03)
(28.54)
- ,0123
- ,0112
- ,0110
- .0066
- ,0299
,186
*Regressions are unweighted; t-values in parentheses.
mean of r, in the sample is 3.69 percent.) The importance of other variables will be identified by the extent to which their inclusion reduces this foreign- domestic differential.
The next column of table 7.2 shows how the results change when dummy variables based on the company’s date of incorporation are added. The age
only to companies with assets in excess of $50 million. As we will see in comparing the ratio of taxable income to sales, table 7.1 understates the difference in sales margins because of the large number of small, low-margin domestic companies included in the aggregate data.
Incidentally, for companies in electronics, food, and chemicals, both the specific-industry dummy and the manufacturing dummy apply. The specific-industry coefficient, therefore, reflects the industry’s return net of the average manufacturing return.

245 Low Taxable Income of Foreign-Controlled Companies
dummies are all significant, with the expected pattern of younger companies having lower profits, and reduce the foreign effect by 25 percent. Does the significant effect of age reflect the start-up costs of new companies? This is unlikely because the average size of companies in the sample that were incor- porated in the past five years is very large, $919 million in total assets, which is not much smaller than the average of $1,046 million for all companies in the sample. Recently incorporated foreign-controlled companies average $662 million in total assets.
Rather than start-up costs of newly established companies, the date of in- corporation dummies appear to reflect the revaluation of assets following mergers and acquisitions. Although reincorporation is not legally necessary as a result of a merger or acquisition, it seems a common consequence. As noted in the introduction, the revaluation of assets after an acquisition can affect the measured ratio of taxable income to assets in several ways. One is simply the direct effect of increasing the denominator in the taxable income to asset ratio. Depreciation expenses can also increase because of a step-up in basis (which has become more difficult after the Tax Reform Act of 1986). Finally, the value of assets interacts with leverage because, with a given debt- asset ratio, interest expenses rise as asset valuation increases.
The significance of asset revaluations is confirmed by the next table, 7.3, which gives the correlation of other variables with the age variables. The first column of table 7.3 gives the regression results for companies’ debt-asset ratio on the age and industry variables. The sign and significance of the date of incorporation variables suggest that acquisitions and not start-ups are being identified. The next column is even more persuasive because it uses the ratio of intangible plus “other” assets to total assets as the dependent variable. If an acquiring company pays more for its target than the value of its tangible and financial assets, it would put the remainder, including goodwill, in this resid- ual category. The age effect is highly significant and much larger for more recent dates of incorporation. Finally, as we will see later in this section when we use sales in the denominator and purge the profitability measure of all revaluation effects, profit margins are not significantly related to the date of incorporation.
Returning to table 7.2, we see that the regression in the third column in- cludes as independent variables the ratios of debt and intangible assets to total assets. They are introduced to identify the role of debt and asset revaluations more directly. They are each highly significant, particularly the debt-asset ra- tios, but the foreign effect is not greatly reduced. Overall, the age, debt, and intangible variables reduce the foreign effect by about 28 p e r ~ e n t . ~
5 . When a separate r, regression is performed for foreign companies only, the coefficients are, in general, similar to the pooled ones. In particular, the coefficient for the debt-asset ratio is virtually unchanged.

246 H. Grubert, T. Goodspeed, and D. Swenson
Table 7.3 Debt and Intangible Assets versus Age (1987 cross section)*
Intangible and Other Dependent Variables Debt-Assets Assets-Total Assets?
Intercept
Manufacturing
Chemicals
Food
Electronics
Transportation and utilities
Wholesale
Age 1: 5 5 years
Age 2: >5-510
Age 3: >1&515
Age 4: > 15-520
Age 5: >2&i30
Foreign
R2 adjusted
,626 (63.2) - .062
( - 6.04) - ,075
( - ,381) .033
(1.70) - ,086
( - 5.35) ,019
(1.39) .02 1
(53) .I43
(13.52) ,082
(6.28) .068
(4.37) ,075
(5.30) .049
(3.59)
.080
.077 (13.72) - .Ooo
( - .01) - ,001
( - .07) ,046
(4.14) - ,017
( - 1.82) ,027
(3.45) - ,040
(-5.09) ,091
(14.86) ,037
(4.83) ,025
(2.86) .028
(3.49) .015
(1.96) ,004
(.58) ,068
*t-values in parentheses. ?The numerator includes intangible plus “other” assets reported in Schedule L on Form 1120.
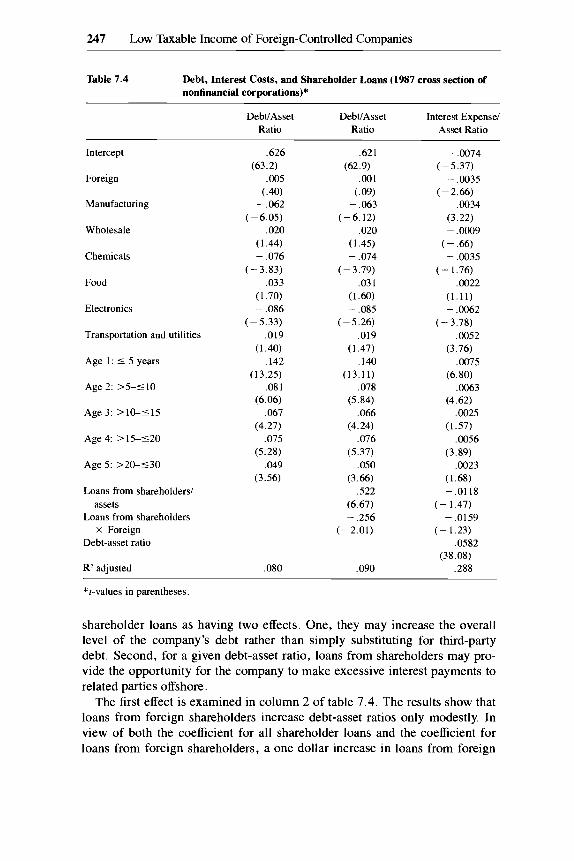
7.2.2 Debt and Earnings Stripping
The first column of table 7.4, which gives the regression results when the debt-asset ratio is the dependent variable, shows why the inclusion of debt- asset ratios in the earnings regression does not affect the estimated foreign differential substantially. There is virtually no difference between foreign and domestic leverage ratios, holding age and industry constant. In fact, even without adjustment for age and industry, the difference is small, with the av- erage foreign debt to asset ratio in the 1987 cross section about 3 percentage points greater than the overall sample mean of 66 percent.
The next two columns of table 7.4 look further into the issue of debt and earnings stripping. They use information on loans from shareholders reported on tax returns. (We should caution that some taxpayers may not specifically identify shareholder loans on their tax return.) It is convenient to think of
247 Low Taxable Income of Foreign-Controlled Companies
Table 7.4 Debt, Interest Costs, and Shareholder Loans (1987 cross section of nonfinancial corporations)*
DebVAsset DebUAsset Interest Expense/ Ratio Ratio Asset Ratio
Intercept
Foreign
Manufacturing
Wholesale
Chemicals
Food
Electronics
Transportation and utilities
Age 1: 5 5 years
Age 2: >5-510
Age 3: >10-515
Age 4: > 15-520
Age 5: >20-530
Loans from shareholders/ assets
Loans from shareholders X Foreign
Debt-asset ratio
R' adjusted
.626
,005 (.40)
(63.2)
- ,062 (-6.05)
.020 (1.44) - .076
( - 3.83) ,033
(1.70) - ,086
(-5.33) ,019
(1.40) ,142
(13.25) ,081
(6.06) ,067
(4.27) ,075
(5.28) .049
(3.56)
,080
,621
.001 (.09) - ,063
(-6.12) ,020
(1.45) - ,074
(-3.79)
(62.9)
.03 1 (1.60) - ,085
(-5.26) .019
(1.47) .I40
(13.11) .078
(5.84) ,066
(4.24) ,076
(5.37) ,050
(3.66) ,522
(6.67) - ,256
( - 2.01)
,090
- .0074 ( - 5.37) - .0035
( - 2.66) .0034
(3.22) - ,0009
( - .66) - .0035
( - 1.76) ,0022
(1.11) - .GO62
( - 3.78) ,0052
(3.76) ,0075
(6.80) ,0063
(4.62) ,0025
,0056
,0023
(1.57)
(3.89)
(1.68) -.0118
( - 1.47) - ,0159
.0582 (38.08)
,288
(-1.23)
*t-values in parentheses.
shareholder loans as having two effects. One, they may increase the overall level of the company's debt rather than simply substituting for third-party debt. Second, for a given debt-asset ratio, loans from shareholders may pro- vide the opportunity for the company to make excessive interest payments to related parties offshore.
The first effect is examined in column 2 of table 7.4. The results show that loans from foreign shareholders increase debt-asset ratios only modestly. In view of both the coefficient for all shareholder loans and the coefficient for loans from foreign shareholders, a one dollar increase in loans from foreign

248 H. Grubert, T. Goodspeed, and D. Swenson
shareholders increases debt by about 25 cents. Because the average foreign shareholder loan-asset ratio is only 3.7 percent, the overall effect is small.
The third column of table 7.4 looks at the impact of shareholder loans on interest payments as a percentage of total assets, holding the debt-asset ratio constant. It indicates that, if anything, loans from foreign shareholders reduce the ratio of interest payments to assets for a given debt-asset ratio. More im- portant, the coefficient of the foreign variable is negative and significant; for- eigners’ interest expense, holding the debt-asset ratio constant, is significantly lower than for domestic companies. The interest cost differential, in view of the average debt-asset ratio of about two-thirds, seems to be about fifty basis points.
Summing up, even though loans from shareholders may not be well re- ported on corporate tax returns, the similarity between foreign and domestic leverage ratios and foreign companies’ low interest costs suggest that debt and earnings stripping are not important in explaining the foreign differential.
7.2.3
To this point, we have estimated a pooled foreign coefficient. In order to determine whether the pooling is supported or whether finer country charac- teristics are at work, we create country dummies for the twelve parent coun- tries with the most foreign affiliates in the United States. Table 7.5 modifies the basic taxable income to assets and debt to assets regressions by including parent country dummies instead of the general foreign dummy. The first col- umn indicates generally small differences in debt-asset ratios among the major investing countries, although the debt-asset ratio of Japanese-owned compa- nies is almost 10 percentage points higher than that of domestically controlled companies and the debt-asset ratio of companies whose parents are based in the Netherlands is 6 percentage points higher.
In the regression reported in the second column of table 7.5, the debt-asset ratio is held constant. What stands out in the second column is the relative uniformity of the country profitability differentials where there are more than a small number of observations. The Japanese differential is by no means un- usual, being about the same as that of the United Kingdom and substantially smaller than that of West Germany.
One question is whether the pattern of country differentials is consistent with the differences that might be expected in countries’ cost of capital. There is continuing controversy about how to measure differences in the cost of cap- ital across countries (see Poterba 1991). A consistent set of cost-of-capital estimates is also not available for the countries listed in table 7.5. Accord- ingly, we chose a simple indicator that suggests itself, namely the extent to which a country is a capital exporter. This is measured by the size of the country’s current account surplus in the balance of payments as a percentage of gross domestic product (GDP). Countries presumably export capital be- cause they have lower returns at home than they can earn abroad on world
Country Effects and the Cost of Capital

249 Low Taxable Income of Foreign-Controlled Companies
Table 7.5 Country Effects for Debt and Taxable Income to Assets (1987 cross section)*
Country (Number of Companies)
Taxable Debt/ Income1 Assets Assets
Canada (75)
Japan (86)
United Kingdom (122)
Netherlands Antilles (26)
Netherlands (65)
West Germany (42)
France (35)
Sweden (20)
Switzerland (30)
Bermuda and Panama (10)
Australia (14)
Italy (3)
Other foreign
Debt-asset ratio
R2 adjusted
- ,011 ( - .35)
,097 (3.31) - .064
( - 2.62) ,015
.059 (1.78)
,009
~ 2 9 )
~ 2 3 ) - ,075
(-1.68) - ,008
(-.14) - .037
( - .78) ,062
(.74) - ,069
( - .99) .362
(2.39) .034
(.93)
,084
- ,018 ( - 1.60) - .025
( - 2.32) - ,026
( - 2.85) - ,038
(-2.01) - ,014
(-1.18) - .048
(-3.15) - ,027 (-.a) - ,031
( - 1.40) - .029
( - 1.61) .019
(. 62) - .049
( - 1.88) - ,155
( - 2.06) - .024
(-1.74) - .149
( - 26.8) ,184
~~~ ~
*Industry and age variables not displayed; r-values in parentheses under coefficients
markets (assuming relatively neutral treatment for foreign and domestic in- come). However, when the capital-exports variable is added instead of the country dummies, it has no explanatory power.
7.2.4 Ratio of Income to Sales as the Dependent Variable
Up to this point, the basis for the comparison of foreign and domestic com- panies has been the ratio of taxable income to assets, I,. The age dummies were used to control for the revaluation of assets following acquisitions, but the date of incorporation is an imperfect acquisition measure. Some compa- nies reincorporated in recent years because certain states have advantages in defending against a takeover. Conversely, acquisitions can take place without

250 H. Grubert, T. Goodspeed, and D. Swenson
a reincorporation. Therefore, sales are convenient to use as an alternative de- nominator because they are free from asset valuation problems. In other words, sales may be a good proxy for the market value of assets.
But, because of the effect of revaluations on taxable income, a simple ratio of taxable income to sales is itself not free from the consequences of asset revaluations after an acquisition. First, as noted earlier, interest expenses can increase with a given debt-asset ratio. Also, depreciation expenses can in- crease after acquisition because of the potential step-up in basis. Accordingly, we construct an adjusted sales margin in which interest expenses and depre- ciation are added to income.
In a final sales margin variation, we attempt to get closer to an operating earning concept by starting with the adjusted margin and taking out interest, dividends, and royalties received. The use of sales as a capital proxy presum- ably applies only to operating assets, not to financial investments. This oper- ating income adjustment might be particularly relevant for foreign dividends, which may be much more important for domestically controlled multination- als than for foreign companies.
Table 7.6 presents results for each of the three sales margin concepts. There are two regressions for each margin. The first has just the foreign and industry variables. The second adds age, the debt-asset ratio, the ratio of purchases to total expenses, and the inverse of total assets as independent variables.6 The purchases to total expenses ratio is intended to control for the possibility, which in fact turns out to be true, that foreign-controlled companies are more dependent on outside suppliers-that is, they are less integrated than domes- tic companies. Foreign companies would then be expected to have lower profit margins because any sales level corresponds to a smaller amount of capital investment. Finally, the inverse of total assets is used as a size variable.
The results in table 7.6 reveal that there is still a large significant foreign differential even when all of the revaluation consequences of acquisitions are taken out of the comparison. When the adjusted margin, including deprecia- tion and interest expenses, is used, the foreign differential in the first regres- sion is 5.6 percentage points and highly significant. If anything, this differen- tial is greater than is apparent in the aggregate data in table 7.1, which may be distorted by the presence of a large number of small, low-margin domestic companies. When the other variables are added, the foreign differential be- comes 5.0 percentage points, a reduction of about l l percent. The reduction in the differential, using the pure profit margin (before adjustment), is much larger, about 30 percent, in part because of the debt and age variables. But this result may be somewhat suspect because of the positive sign on the pur- chases variable. One notable feature of these results is that the age variables are small and insignificant when interest and depreciation expenses are added
6. Purchases are taken from Schedule A on Form 1120, describing the components of costs of goods sold. Total expenses are revenues less net income.

251 Low Taxable Income of Foreign-Controlled Companies
Table 7.6 Sales Margins*
Independent Taxable Adjusted Operating Variable Income/Sales Income/Salest Income/Sales$
Foreign - .043 ( - 5.02)
Manufacturing ,057 (7.77)
Wholesale .036 (3.67)
Transportation .008 and utilities (.86)
Food - ,016 (-1.15)
Electronics - ,013 (-1.08)
Chemicals - ,034 (2.36)
Purchasesito-
DebVassets tal expenses
litotal assets
Age I : 5 5 years
Age 2: >5- 510
Age 3: >lCk 515
Age 4: >15- 520
Age 5: >2C- 530
R* adjusted ,002
- .030 ( - 3.54)
0.28 (3.95)
,012 (1.20)
,018 (1.92) - ,011
( - .81) - ,031
( - 2.79) ,011
(.86) ,055
(5.21) - .223
( - 21.97) - 1170
( - 2.55) - ,032
(-4.33) - ,020
(-2.17) - .023
( - 2.15) - ,006
( - ,060) -- ,006 (. 66) .047
- .056 (-6.19) - ,014
( - 1.83) - .053
( - 5.03) .098
(9.50) - .026
( - 1.74) - ,015
(-1.25) ,035
(2.36)
,052
- ,050 (-5.48) - ,012
( - 1.56) - .008
( - .67) ,067
(6.40) - .012
( - .79) - ,026
(-2.19) ,024
(1.65) -.113
(-9.73) - ,091
(-8.21)
(5.57) - ,011
(-.16) .004
(.46) - ,000
.012 (1.11)
,006 ( .94) ,090
- 2809
(-.9)
- ,051 (-6.00)
,013 (1.74) - ,023
( - 2.32) ,109
(1 1.21) - ,021
( - 7.47) - ,024
( - 2.12) ,024
(.73)
,047
- ,044 (-5.06)
,007 (1 .OO)
,003 (.31) ,090
(9.05) - ,010
(-0.73) - .034
( - 2.96) ,013
(.93) - ,066
(-6.06) - .lo8
( - 10.27)
( - 3.87) - .004
- 1847
( - .55) - ,005
( - .52) - .018
( - 1.59) - .005
( - .46) - ,005
( - .48) ,080
*t-values of the coefficients in parentheses. ?Adjusted income is taxable income plus interest expense and depreciation deductions. $Operating income is adjusted income less dividends, royalties, and interest received.
to the numerator, in contrast to the unadjusted net income regressions, rein- forcing the view that the date of incorporation variables reflect asset revalua- tion rather than operating start-up losses.’
In the final two regressions in table 7.6, using the ratio of the operating income to sales as the dependent variable, the foreign differential is reduced slightly. It is 5.1 percent with the industry dummies only, compared to 5.6
7. It might be argued that start-ups have higher depreciation expenses, but the data indicate that the depreciation-sales ratio is correlated with the age variables, although the depreciation-asset ratio is not, which is consistent with the asset valuation interpretation.

252 H. Grubert, T. Goodspeed, and D. Swenson
percent before the investment income is removed. This reduction is consistent with the difference between the two groups in the ratio of aggregate invest- ment income to sales, which is 2.73 percent for domestic companies and 2.17 percent for ones that are foreign controlled. The foreign effect falls to 4.4 percent when the age, debt, and purchases variables are introduced. Combin- ing the adjustment both for investment income and for purchases and the other independent variables (i.e., going from the initial foreign effect of 5.6 percent for the adjusted margin to the 4.4 percent in the last column) achieves a reduc- tion in the foreign effect of about 22 percent.
The size variable turns out to be significant in these profit margin regres- sions. A similar size variable, the inverse of sales, is sometimes significant in the taxable income to asset regressions. (The reason for the switch from assets to sales is to remove any spurious correlation with the denominator in the dependent variable.) In neither case does its inclusion significantly alter the foreign effect. All the regressions in this section are unweighted. When the observations were weighted (by total wage costs), the results were not signif- icantly altered. The main effect of weighting was to remove some anomalies in the results, such as the significant positive coefficient for the purchases variable in the unadjusted-margin regression.
7.2.5 Expense Patterns
The 1987 cross section can also be used to see whether foreign-controlled companies have a pattern of expenses different from that of domestic compa- nies and whether any difference is related to reported taxable income. This may provide evidence on the potential degree of transfer pricing abuses. The first issue is the dependence of the company on purchases from other firms. It might be expected that foreign companies that rely more on purchases have a greater opportunity to shift income abroad, because many of these transac- tions could be with offshore related companies. Also, a higher ratio of pur- chases to total expenses may itself reflect excessive prices paid to affiliates. “Other” expenses, which include royalty payments, management fees, and other overhead charges by affiliated companies, are another interesting cate- gory. Accordingly, the regressions in table 7.7 include variables formed by interacting the foreign dummy with the ratio of purchases to total expenses and the ratio of other expenses to total expenses. For each variable, there is both a taxable income to asset regression and an adjusted-margin regression.
Columns 2 and 4 of table 7.7 do not reveal any consistent relationship be- tween foreign companies’ reliance on purchases and their profit margins or rates of return. In the I, regression, the coefficient of the interaction of the foreign and purchases variables is basically zero. In the adjusted margin re- gression, the foreign purchases variable is positive and significant, not the pattern expected if there is income shifting.8
8. The lack of significance of the foreign purchases variable demonstrates that including the ratio of purchases to total expenses in the regressions in table 7.7 did not “overadjust” for the

253 Low Taxable Income of Foreign-Controlled Companies
Table 7.7 Purchases and Other Expenses (1987 cross section)*
Independent Variable
Foreign
Debt/asset ratio
Other expenses/total expenses
Foreign X Other expenses
Purchases/total expenses
Foreign X Purchases
R2 adjusted
Taxable Income/Assets
- ,020 - .027 ( - 3.25) (-3.35)
-.150 - ,150 (-27.2) ( -27.1)
,001 (.33) - ,054
(-1.64) .023
(3.74) .oO03
(.02) ,187 ,190
Adjusted Income/Sales
- .010 ( - .79) - .078
(-6.49) ,120
(15.8) - ,337
(-4.71)
,123
-.116 (-6.28) - .083
( - .68)
- ,147 (11.56)
,134 (4.03)
,075
*Age and industry dummies not shown; t-values in parentheses
Columns 1 and 3 of the table, which give the results for the ratio of “other” to total expenses, are more indicative of the possibility of income shifting. The interaction of the foreign and other-expenses variable is negative with borderline significance in the r,, taxable income to asset regression, and again negative and highly significant in the adjusted margin regression. Foreign companies do not on average have a higher share of other expenses than do- mestic companies, but the ones that do will have lower profit margins and rates of return.
7.2.6 Foreign and Domestic Intangibles and Other Control Group Issues
Finally, we can return to some of the control group issues raised earlier. One is the possibility that a comparison of the U.S. profitability of foreign- controlled and domestic companies is intrinsically unfair because each com- pany’s intangibles tend to be developed in its home base. Thus, a U.S.-based company’s income will include a return on its intangibles, including income derived from exports and foreign operations (through royalties), whereas a foreign company will have to pay royalties back to its parents. This asymme- try in the source of intangibles does not, however, seem to be a significant factor in explaining the foreign differential. First, it applies only to start-ups, not to acquisitions of U.S. companies, which are a quantitatively much more significant vehicle for foreign ownership. Second, the foreign differential is
difference between foreign and domestic companies. For it might be claimed that foreign compa- nies’ measured dependence on outside suppliers just reflects their overpaying for their materials. If that were the case, one would expect a large negative coefficient for the foreign purchases variable in the profit margin equation because the purchases variable would indicate more than a simple adjustment for the capital actually used by the company. Similarly, the foreign purchase coefficient should be negative in the taxable income to assets regression.

254 H. Grubert, T. Goodspeed, and D. Swenson
not larger in high-technology industries such as chemicals or electronics. Along the same lines, the foreign differential is not much affected when the ratio of R&D to assets or sales is added as an explanatory variable. In addi- tion, to the extent that foreign income and royalties bias any comparison of foreign and domestic companies, we have already abstracted from this effect in creating the operating earnings concept in table 7.6. Finally, nontax data on royalties published in the Survey of Current Business indicates that they do not significantly alter the profitability measures. U.S. parents received $7.0 billion of royalties in 1987, while U.S. affiliates of foreign companies paid $1 .O billion to parents. If royalties received were taken out of domestic com- panies’ income and royalties paid were added back to foreign-controlled com- panies’ income, the average domestic-foreign income differential would be little affected.
Earlier we also discussed the use of U.S .-based multinational corporations (MNCs) as the control group rather than all U.S. companies. The extent to which the results are altered was examined either by adding an MNC dummy as another variable or by restricting the analysis only to MNCs and foreign- controlled companie~.~ We added an MNC dummy variable to the profitability regression reported in the third column of table 7.2. Although the coefficient for the MNC variable is positive, it is small and insignificant. The MNC vari- able is larger and significant when only the foreign and industry dummies are included in a regression corresponding to the first column of table 7.1. Ac- cordingly, adding the age, debt, and other variables explains a somewhat larger percentage of the initial foreign-MNC differential, about 40 percent compared to the 28 percent referred to earlier. But the differential between foreign-controlled companies and MNCs is substantially larger to start with, so the unexplained differential is slightly larger.
When sales margins are used as the profitability measure, as in table 7.6, the MNC dummy remains positive and significant for the taxable income mar- gin and the adjusted margin regressions even when other explanatory van- ables are included. This may reflect the larger foreign investment income of multinational corporations, because the MNC coefficient is much smaller and insignificant in the operating margin regression where investment income has been removed. Thus, apart from any asymmetry in the importance of foreign investment income when sales margins are used, using MNCs as the control group does not affect the results much. The unexplained foreign-domestic dif- ferential is generally slightly larger because of the somewhat greater profit- ability of multinational companies.
To sum up the analysis of the basic control group in section 7.2, adding explanatory variables such as the date of incorporation and the debt-asset ratio
9. A U.S.-controlled company was designated as an MNC if it received a foreign tax credit in excess of $1 million or any gross-up credit for foreign dividends (indicating at least 10 percent ownership of a foreign company) or had filed a Form 547 1, the information return for foreign- controlled companies.

255 Low Taxable Income of Foreign-Controlled Companies
reduces the foreign-domestic difference in profitability by about 25 percent. The results are robust across countries and are not affected much by using taxable income over sales rather than taxable income over assets as the depen- dent variable. Further, expense patterns of foreign- and domestically con- trolled companies do not by themselves indicate large transfer pricing prob- lems.’O Still, we are left without about 75 percent of the initial difference in foreign and domestic returns to explain.
7.3 Exchange Rate and lkend Effects in the Panel
The 1980-87 panel is made up only of companies that filed a corporate tax return in each of the eight years. Because no new entrants during the period are included, it can be used to identify any maturation or learning effects as foreign companies grow from start-up status or begin to benefit from the up- front investments in their acquisitions. This maturation effect might be ex- pected to be particularly notable in manufacturing because of the greater sig- nificance of economies of scale and investments in technology.
The panel can also be used to identify any effects of exchange rates on the relative profitability of foreign-controlled companies. As noted in the intro- duction, because foreign-controlled companies use a disproportionate amount of imported components, their profits relative to domestic companies may be affected by fluctuations in the price of the U.S. dollar. The year 1987 may therefore give an inaccurate picture of foreign companies because by then the U.S. dollar had fallen by about 30 percent in real terms from its peak in 1985. If there is an exchange rate effect on rates of return, it should be particularly visible in foreign-controlled wholesaling companies because they import pro- portionately much more than manufacturing and other companies.
Any relationship between the price of the dollar and foreign-controlled companies’ rates of return need not necessarily reflect “pricing to market ,” or the attempt to maintain long-term market share by absorbing higher costs, Even in a conventional model, an increase in costs will reduce rates of return if the importer has made investments on the expectation of lower costs and greater demand by ultimate consumers. There may also be a very short run exchange rate effect to the extent that importers have trade credit extended to them by exporters denominated in foreign currency. In any case, the exchange rate effect should not last indefinitely, because in the long run the importer’s capital should adjust to any new, permanently lower price of the dollar. Still, these short-run effects may be important for an extended period of time.
We attempt to identify any trend or exchange rate effects in a pooled regres-
10. As we will discuss more fully in dealing with the distribution of returns, there may be no correlation between purchases and profitability, because the intrinsically more profitable compa- nies have more leeway in shifting profits from the United States.
1 1. Lichtenberg and Siege1 (1987) found that total factor productivity in manufacturing plants tended to gradually improve after a change in ownership.

256 H. Grubert, T. Goodspeed, and D. Swenson
sion for 1980 through 1987. We interact foreign manufacturing and foreign wholesaling dummies in turn with a time trend and with an index of the real value of the dollar published by the Federal Reserve Board. The exchange rate and trend variables each take on a single value in all observations in a given year. As always, domestic companies are included in the pooled regression. A separate dummy variable for each year is also included to reflect changes in business conditions and tax provisions.
Table 7.8 presents regression results based on the panel. It indicates that the real price of the dollar has a highly significant effect on foreign wholesalers’ taxable income. Their profits go up when the real value of the dollar increases. The impact is also large quantitatively. For example, the Federal Reserve Board index for the real value of the dollar went from 132.0 in 1985 (and 128.5 in 1984) to 90.6 in 1987, implying a decline of 4.7 percentage points in foreign wholesalers’ taxable income to asset ratio. The exchange rate coef- ficient for foreign-controlled manufacturers is also positive, but it is predict- ably much smaller than the wholesale coefficient and is statistically insignifi- cant.
The interaction of the time trend with the foreign manufacturing dummy indicates a highly significant positive-trend effect for foreign-controlled man- ufacturers. There is no comparable trend for U.S.-controlled companies over the period. (The foreign wholesaling trend coefficient is negative but statisti- cally insignificant and smaller in magnitude). The improving foreign manu- facturing return over time is also quantitatively large, with the taxable income to asset ratio increasing by .68 percentage points each year. Thus, at the be- ginning of the period in 1980, the foreign-domestic differential for manufac- turing companies in the panel was very large, but it declined substantially from 1980 to 1987.
These exchange rate and trend effects are also clearly visible if each year in the panel is looked at separately. The negative differential for foreign manu- facturers was about 10 percentage points in 1980 and fell quite consistently until it was about 3.5 percentage points in 1987. Foreign wholesalers in the panel had apositive 6.5 percentage point differential in 1984 (the peak in the dollar being in early 1985) and moved to a negative differential of about 3 percentage points in 1987.
How much should the exchange rate and trend effects evident in table 7.8 change our view of the foreign differential in 1987? First consider the ex- change rate. The extent to which foreign wholesalers’ 1987 profitability is distorted by exchange rates depends on the expected long-run exchange rate on which the foreign importers based their investment decisions. Surely it was not the extremely high value of the dollar in 1984 and early 1985. If we use the average real value of the dollar from 1980 through 1989 as a more realistic norm, the coefficient in table 7.8 suggests that foreign wholesalers’ real return in 1987 was 1.6 percentage points less than the long-run average. Because foreign wholesalers account for 17.5 percent of total nonfinancial foreign-

257 Low Taxable Income of Foreign-Controlled Companies
Table 7.8 Exchange Rate and ’Rend Effects in Taxable Income over Assets Regression (1980-1987 panel)*
Independent Variable Coefficient
Foreign x Manufacturing
Foreign x Wholesale
Foreign manufacturing x Trend
Foreign wholesale X Trend
Foreign manufacturing X Exchange rate
Foreign wholesale X Exchange rate
Foreign
Debt-asset ratio
R2 adjusted
- ,063 (-1.93) - ,063
(-1.64) ,0068
(3.33) - ,0035
(-1.47) .OOO26
,00113 ( ,881
(3.25) - .0249
(-2.88) - .189
(-53.4) .24
*Year, age, and basic industry dummies not displayed; r-values in parentheses.
controlled assets, the overall 1987 foreign return would be .28 percentage points higher under “normal” circumstances. In terms of our sample, foreign wholesalers account for 24.4 percent of the foreign observations, so the esti- mated foreign differential in the regressions would be .38 percentage points smaller under normal circumstances.
Let us now turn to the quantitative significance of the trend effect. The improving profits of foreign-controlled manufacturers in the panel suggest that the 1987 differential may be distorted by the presence of recent entrants in the form of start-ups or acquisitions. The precise significance of the im- proving profitability of foreign manufacturing companies over time in ex- plaining the overall 1987 differential is a difficult issue. A company would be willing to take an initial lower return if it can expect to see its rate of return increase steadily in the future. But how long can this profitability improve- ment be expected to continue? Also, where is the typical 1987 foreign manu- facturing company in its growth process? Some long-established companies should have returns above comparable domestic companies.
One way we attempt to evaluate the approximate significance of the manu- facturing trend effect is to start with hypothetical domestic and foreign invest- ments and construct the different time paths of taxable income. The domestic company is assumed to have a constant real return of 10 percent on total as- sets. After deducting interest payments based on a debt-asset ratio of .6 and a 10 percent interest rate, its taxable income to asset ratio is .04, close to the mean in the 1987 cross section. Taking the present value of the respective

258 H. Grubert, T. Goodspeed, and D. Swenson
income streams, we find that investors would be indifferent between this con- stant return and the foreign prototype with an initial 5 percent return on total assets that grows by 6 percentage points per year for twenty years and is con- stant at that level thereafter. After interest deductions, the foreign investment will initially have negative taxable income.
Next, it is necessary to match the time path of the foreign company’s tax- able income with the time distribution of foreign investment. The Department of Commerce data on acquisitions and start-ups, available since 1979, can be used to calculate the distribution of 1979-87 vintages. Data on the stock of foreign direct investment at the end of 1978 and 1987 suggest that about one- third of 1987 foreign-controlled assets were in foreign hands at the beginning of 1979. If we assume that this pre-1979 investment has a mean vintage of fifteen years, we find that the average foreign taxable income to asset ratio was .030 in 1987, compared to .04 for domestic companies. These estimates do not seem very sensitive to the assumptions made.
Another way of gauging the significance of the manufacturing maturation effect is using the regression equation in table 7.8 to calculate the 1987 taxable income to asset ratio of foreign manufacturing companies, including the ad- justment for the exchange rate. That yields a domestic-foreign differential in 1987 of - .013, or about 1.3 percentage point less than had remained in the 1987 cross section after the age, debt, and intangible asset variables were added. Thus, both methods of evaluating the manufacturing trend seem to yield approximately the same 1 percentage point difference.
Manufacturing companies account for 63 percent of total nonfinancial foreign-controlled assets and for 47 percent of the companies in the 1987 cross section. A manufacturing return 1 .O percentage point higher would, therefore, reduce the domestic-foreign differential by .5 of .6 percentage points.
In summary, it appears that the exchange rate and growth effects discussed in this section can explain about 1 .0 percentage point of the 1987 domestic- foreign difference in the ratio of taxable income to assets. When this is com- bined with the amount of the differential explained by the age, debt, and other variables in section 7.2, approximately one-half of the initial differential re- mains.
7.4 Distribution of the Ratio of ’hxable Income to Assets-Extreme Losses or Concentration around Zero
The distribution of foreign-controlled companies’ taxable income can pro- vide evidence on how likely it is that manipulation of income is taking place. Persistent large losses in relation to assets or sales would not suggest (very successful) tax planning, because the foreign company could lower its world- wide tax bill by shifting some of its losses to other jurisdictions. If foreign companies’ low average profitability were due to a relatively small number with extreme losses while the remainder resembled domestically controlled

259 Low Taxable Income of Foreign-Controlled Companies
companies, it would be difficult to claim that foreign companies are engaging in widespread income shifting.
On the other hand, what distribution would be consistent with earnings shifting? First, the value of shifting large profits to low-tax locations and the value of shifting large losses to other high-tax locations would lead one to expect a concentration of companies around zero taxable income (in relation to assets). If shifting were costless, all companies would be at exactly zero taxable income at all times. In the general case, bookkeeping costs, potential penalties, and legal scruples prevent perfect shifting, but a concentration near zero would still be the expected pattern. In particular, if there is widespread income shifting, there would be a large disparity at the very high profitability part of the distribution. Companies with intrinsic high profitability could shift substantial profits from the United States and still leave income large enough not to attract the suspicion of tax auditors. It is presumably difficult for tax administrators to attack “normal” or average profitability levels. l2
7.4.1 Description of the Distribution
Table 7.9 shows the 1987 distribution of the ratio of taxable income to total assets for foreign-controlled and domestic companies. The three components of table 7.9 apply, respectively, to all nonfinancial companies in the 1987 cross section, all wholesaling and manufacturing companies, and all nonfi- nancial companies with assets in excess of $250 million. In each case, data in the table reveal a very clear concentration of foreign companies around zero. For the most comprehensive group in the first two columns of the table (dis- played in figure 7.1), about 37 percent of the foreign companies are in the interval from - .025 to + .025. In contrast, the domestic distribution not only has a higher mean but is much flatter in the central range. Furthermore, the frequency of very profitable companies, with r, in excess of .20, is three times greater for domestic companies than for foreign ones. In contrast, the differ- ence in the frequency of extreme losses is not very large, with 3.4 percent of the foreign companies versus 2.0 percent of the domestic ones having r, less than - .15.
If anything, the remaining columns of table 7.9 strengthen this picture of foreign taxable income concentrated around zero. In the case of manufactur- ing and wholesaling companies (which account for more than 70 percent of the foreign observations), the foreign distribution remains about the same while the domestic distribution is flatter. The discrepancy in the high profit- ability range is even greater. In the last two columns, which restrict the anal- ysis to only the companies with total assets in excess of $250 million, the concentration of foreign companies around zero is even more evident, with
12. Shifting large profits out of the United States may be easier than eliminating losses. In the latter case, the company may already have worldwide losses. The incentive to shift losses may be reduced because of their value as carryforwards or carrybacks. It may also be easier to justify charges for services by the parent of the affiliate than the reverse.

260 H. Grubert, T. Goodspeed, and D. Swenson
Table 7.9 Distribution of Taxable Income over Assets for Foreign and Domestic Companies (1987 cross section)
All Manufacturing All Nonfinancial and Nonfinancial > Companies Wholesale Only $250 Million
Taxable IncomdAssets Foreign Domestic Foreign Domestic Foreign Domestic ~~
5 - . I5 > -0.15 to - .I0 > - . l o to -.075 > - ,075 to - .05 > -.05 to -.025 > - ,025 to 0 > 0 to ,025 > ,025 to .05 > .05 to ,075 > .075 to .10 > .10 to . I5 > .I5 to .20 > .20
,034 ,0445 ,029 .055 ,098 ,185 ,183 ,122 ,087 ,058 ,053 ,036 ,015
.02
.025 ,025 ,040 .068 ,116 ,149 ,144 ,120 .080 ,106 ,054 .048
,030 ,040 .028 ,044 .082 .187 .185 ,143 ,089 ,061 ,061 ,033 ,016
,018 .022 .016 ,032 .062 ,104 ,139 ,133 ,124 ,086 ,133 .067 ,061
,013 ,022 ,018 ,045 ,071 ,232 ,223 ,129 ,080 ,058 ,067 ,022 ,018
.012 ,017 ,012 ,033 .057 ,118 ,178 ,175 ,143 ,077 ,091 ,043 ,046
0 . 1 3
0 1 2
0 . 1 1
0 . 1 0
0.09
0 0 8
0 . 0 7
0 . 0 6
0 . 0 5
0 . 0 4
0 03
0.00 . . . . . . . . . . . . . . . . . . . . . . . . . . . . . . . . . . . . . . . . . . . .
-0.20 - 0 . 1 5 - 0 1 0 -0.05 0 . 0 0 0.05 0 . 1 0 0 . 1 5 0.20 0 . 2 5
T o x o b l e I n c o m e t o A s o e i s
. 0.00 . . . . , . . . . , . . . . , . . . . I . . . . . . . . . . . . . . . . . . . . . . . .
-0.20 - 0 . 1 5 - 0 1 0 - 0 0 5 0 . 0 0 0.05 0 . 1 0 0 . 1 5 0.20 0 . 2 5
T o x o b l e I n c o m e t o A s o e i s
Fig. 7.1 Distributions of the ratio of taxable income to assets

261 Low Taxable Income of Foreign-Controlled Companies
more than 45 percent in the - .025 to + .025 interval, and the frequency of foreign and domestic companies with extreme losses is virtually identical. I 3
The more concentrated nature of the foreign distribution is confirmed by statistical tests. For companies with assets in excess of $250 million, the stan- dard deviation of foreign-controlled companies’ taxable income to asset ratio is .070, compared to .095 for domestic companies. Given the number of com- panies in each group (223 and 1,383), the difference is highly significant using a standard F-test. When various nonparametric tests for the difference in two distributions are applied, such as the Wilcoxon rank-sum test, the scores are always highly significant.
Is the concentration of foreign-controlled companies around zero taxable income a fortuitous outcome in a single year, 1987, or is it apparent in other years as well? The 1980-87 panel can be used to answer this question. The left part of table 7.10 gives the distribution of r, in the panel with each year counting as a separate observation. (Broader income categories are used be- cause of the relative sparseness of the companies in the panel). The concentra- tion of foreign companies around zero is virtually identical to the 1987 cross section, which is remarkable in view of the large changes in tax laws and economic conditions over this period. As would be expected, averaging over the eight years concentrates both foreign and domestic companies around their means, but the difference in the distributions seems, if anything, more striking.
7.4.2 Persistence near Zero
If a significant number of foreign companies make an effort to remain close to zero taxable income, their behavior over time can also be expected to differ from domestic companies. They would be more likely to persist in the area around zero. Also, foreign companies finding themselves above the region near zero might be expected to reduce their taxable income in succeeding periods.
Table 7.11 shows that this behavior over time that would be consistent with income management seems to take place. The table gives the probit results for the probability that a company will be in a given profit interval given its posi- tion in the previous year, after controlling for industry, age, and year effects. The lagged profit range dummies are interacted with the foreign dummy to see if foreign-controlled companies behave differently from domestic ones.
Of particular interest are firms whose returns center around zero. The third column of table 7.1 1 gives the coefficients for the probability of being in the - .025 to .025 interval. The coefficient of the interaction of the foreign dummy with the variable indicating presence in the central interval in the pre- vious year is positive, large, and highly significant. In other words, foreign
13. In the less than - .15 category, average foreign profitability exceeds domestic profitability. The aggregate differential is therefore not due to extreme foreign losses.

262 H. Grubert, T. Goodspeed, and D. Swenson
Table 7.10 Taxable Income Distribution from 1980-87 Panel
Each Year as a Average from Single Observation 1980 to 1987
Taxable Income/ Assets Ratio Foreign Domestic Foreign Domestic
5 -.075 ,104 ,052 ,068 .048 > - ,075 to - ,025 ,157 ,075 ,068 .05 1 > - .025 to + ,025 .375 ,242 .475 .249 > - .025 to ,075 ,149 .270 ,112 ,336 > .075 to .I5 ,115 .208 ,103 .202 > . I5 ,101 ,152 ,075 .114
Table 7.11 Probit Results for Probability of Being in a Given Income-Assets Interval (1980-1987 Panel)*
Prob. Prob. Prob. Prob. Position in Prob . > -.075 > -.025 > ,025 > ,075 Prob. Previous Year 5 -.075 to -.025 to ,025 to .075 to .15 > . I5
> - .075 to - ,025 - ,586 (-7.41) - 1.472
( - 19.60) - 1.872
> - ,025 to .025
> ,025 to .075 (21.77) - 1.941
( -20.64) > .I5 - 2.124
(18.21)
> ,075 to . I5
5 -.075 X - ,032 Foreign ( - .21)
x Foreign ( - .93)
Foreign (.22)
> - ,075 to - ,025 - .I32
> - ,025 to ,025 X - .031
> ,025 to .075 X ,534 Foreign (2.62)
> ,075 to . I5 X .325 Foreign (1.25)
> .I5 x Foreign ,105 ( . 26)
,061 (.75) - ,442
(-6.31) - ,918
( - 1 1.92) - 1.231
( - 13.99) - 1.571 (13.53)
.307 (1.93)
,289 (2.27) - .090
( - .83) .I35
(.67) - ,050
(-.16) ,023
(.06)
,281 (3.45)
.356 (1 1.95)
,088 (1.25) - ,587
(-7.62) - 1 . 1 1 (1 1.58) - ,230
(-1.25) -.I36
(-1.04) ,226
(3.19) ,227
(1.69) ,232
(1.29) - ,222
( - .71)
.326 (3.36)
,586 (6.96)
1.29 ( 15.54)
,644 (7.58) - ,260
(-2.71) - .262
(-1.05) - ,173
( - 1.08) - ,195
( - 2.03) - .495
(-3.61) -.I51
( - .91) ,302
(1.44)
,281 (2.31)
.345 (2.95)
,854 (7.55) 1.767
(1 5.66) 1.075
(9.27) - . I 1 1
( - .35) - ,164
( - .75) - ,269
( - 1.78) ,237
(1.60) - ,064 (e.44) - ,076 (e.44)
-.117 ( - .72)
,241 ( I .75) ,064
(.49) ,876
(7.01) 2.38
(18.96) - ,351
( - .86) - ,043
(-.16) -4.90 ( - - ,005
( - .02) ,136
(.81) ,068
(.43)
*Industry, year, and age dummies not displayed; t-ratios in parentheses.
companies are much more likely to persist in the - .025 to .025 area. Further- more, the fourth column, giving the probability of being in the interval just above (.025 to .075), indicates that foreign companies are much less likely to persist there than domestic companies. (They are also less likely to move into this interval from the central region.) some of the foreign-controlled compa-
263 Low Taxable Income of Foreign-Controlled Companies
nies leaving the .025 to .075 interval move up, but more move to lower prof- itability levels, including the central area. Particularly notable is the fact, as shown in column 1, that foreign companies in the .025 to .075 interval are much more likely to move down to the lowest profitability category, below - .075, than domestic companies.
The probit coefficients can be used to illustrate the quantitative difference between foreign and domestic firms. For example, the probability that a man- ufacturing company in 1987 with a date of incorporation five to ten years earlier will persist in the - .025 to .025 range is . 10 (or 22 percent) greater if it is foreign. If the company had been in the .025 to .075 interval, the proba- bility of its remaining there is .19 (or 38 percent) lower if it is foreign.
The first and sixth columns of table 7.1 1 indicate that foreign and domestic companies are about equally likely to persist at the extremes of profitability, below - .075 and above .15. Foreign companies are much more likely to persist in the - .075 to - .025 interval, which generally seems a relatively temporary state for all companies.
7.4.3 Relationship to Previous Results
It appears appropriate at this point to attempt to integrate the results in this section with the earlier ones, or at least to resolve any apparent contradictions. For example, the previous section indicated that exchange rates were signifi- cant in explaining the profitability of foreign wholesalers. Foreign manufac- turers were shown to have rising profitability over time. Are the persistence results in table 7.11 affected by the inclusion of these exchange rate and trend variables? The major conclusions are not altered. The strong persistence of foreign companies near zero remains, and the exchange rate and trend vari- ables are insignificant for this central state. Similarly, the nonpersistence of foreign companies in the interval just above zero is also essentially unaffected, but the trend is almost significant in causing foreign manufacturing companies to be more likely to be in this state. Furthermore, the exchange rate and trend variables, for wholesalers and manufacturers, respectively, are also significant in some of the probits for the other states. For example, the exchange rate is significant in reducing the probability that foreign wholesalers will be in the lowest profitability interval. Also, the trend significantly increases the proba- bility that foreign manufacturers will be in the interval from .075 to .15.
Is the distribution of profitability distorted by the asset revaluation effects discussed in section 7.2? One way of judging this is by looking only at com- panies incorporated in the past five years. Although the mean return for do- mestic companies decreases, the large difference between the foreign and do- mestic distributions is still notable. The foreign distribution remains much more concentrated in the - .025 and .025 interval. The foreign and domestic distributions are very similar at the low end up to - .025, when the foreign distribution jumps up sharply and then falls rapidly above .025. In contrast, the domestic distribution is much flatter in the region above - .025. Our in-

264 H. Grubert, T. Goodspeed, and D. Swenson
terpreting the difference in distributions as suggesting income shifting is therefore not contradicted by the earlier results.
It may also be of interest to see how the results in section 7.2 are affected if the 1987 cross section is limited only to companies with positive taxable in- come. Some might argue that companies that show losses must actually be losing money, because they do not have any incentive to reduce taxable in- come below zero. (Because of loss carryovers and prospective audits, this is not strictly correct.) When only companies with positive income are included, the foreign differential reported in section 7.2 remains significant but is some- what reduced in magnitude. For example, the 2.59 percent differential for r, in the last column of table 7.2 becomes 1.96 percent with a t-value of almost four. The differential in sales margins is reduced somewhat more but remains highly significant. (The r, and the operating income to sales margin differen- tials, in fact, become virtually identical.) The significance of some of the other variables changes. For example, the age dummies are much smaller and largely insignificant in the rf regression, while purchases become much more significant in the sales margins regressions.
To summarize this section, both the distribution of rf in 1987 and its changes over time revealed by the 1980-87 panel are consistent with the pat- tern expected if income shifting by foreign companies is prevalent. Foreign companies tend to concentrate near a zero ratio of taxable income to assets and persist there. The low average taxable income of foreign-controlled com- panies does not seem to be attributable to any large extent to the greater fre- quency of extreme losses. On the other hand, there is a very large domestic- foreign discrepancy in the frequency of highly profitable companies.
7.5 Alfiliate Taxable Income and the Characteristics of the Parent Company
Financial information on the foreign parent company may provide insight on the financial incentives of the affiliate as well as on its ability to manipulate income. For example, if the affiliate is small relative to the parent, it may be more likely that the afiliate is able to incur losses for a long time before be- coming successful. The small relative size of the affiliate may also indicate that it is at an early stage in its growth process. Other aspects of the parent’s activities may also be relevant. Information on the parent’s U.S. acquisition activity would indicate whether the subsidiary is more likely to have been a start-up rather than the result of an acquisition. In addition, the presence of an affiliate in a tax haven may enhance the parent’s ability to shift income from the U.S. to low-tax jurisdictions.
The relationship between the parent’s (book) income and the affiliate’s tax- able income is also of interest. Admittedly, taxable income and book income may differ substantially. Furthermore, accounting standards vary across coun- tries, particularly with respect to affiliates’ inclusion in the parent’s “consoli-

265 Low Taxable Income of Foreign-Controlled Companies
dated” financial reports. Still, common products and management would lead one to expect a positive correlation between parent and subsidiary profitabil- ity. Further, this correlation could increase as the affiliate becomes large rela- tive to the parent, for two reasons: first, the affiliate becomes a larger compo- nent of the parent’s worldwide profit; second, it is more likely to be included in the parent’s consolidated financial reports.
To investigate these issues, we linked a subsample of the foreign-controlled companies in the 1987 cross section with financial information on their con- trolling parent. Who Owns Whom and the International Directory of Corpo- rate Afiliations were used to identify the owners of the corporations filing U.S. tax returns. On this basis, approximately 400 parent firms were identi- fied. The sample size was reduced to 291 because some did not have financial information listed in Moody’s International.
Table 7.12 gives regression results for the U.S. subsidiaries’ taxable in- come to asset ratio when variables based on the parent’s characteristics are included as explanatory variables. The size variable is the ratio of the affili- ate’s total sales to the parent’s. The haven variable is a dummy set equal to one if Moody’s lists a subsidiary in a tax haven. The acquisition data are derived from Mergers and Acquisitions magazine and include acquisitions by the par- ent from 1974 through 1987. (These acquisition data are described more fully in section 7.6.) The acquisitions variable is the ratio of the reported total value of acquisitions by the parent to the total assets of the subsidiary. Profit rate is the ratio of the parent’s pretax net income to its total assets. The profit-size variable is the interaction of the parent profit rate with the size variable.
The only new variables that are consistently significant are the ones based on the parent’s profit rate. In the first column of table 7.12, the parent’s profit rate has a significant positive coefficient. But when the profit rate to size vari- able is introduced in the second regression, the simple profit rate is no longer significant. As expected, the affiliate’s profitability is more closely related to the parent’s when the affiliate accounts for a large share of the parent’s world- wide operation. The coefficient for the profit-size variable tends to be close to one. Furthermore, when the leverage ratio is not included as a variable, the constant term in the regressions is small and not very significant. Thus, it appears that when the affiliate is so large that it virtually represents the parent’s entire worldwide operation, the affiliate’s taxable income to asset ratio tends to approximate the parent’s profit rate. But it is also necessary to consider the negative coefficient on the relative size variable. A negative coefficient would be expected in this case because there must be an offset to the increasing weight of the parent’s profit rate as the affiliate’s size increases relative to the parent.I4 But the negative coefficient is much larger than expected. Accord- ingly, the coefficients indicate that if the affiliate constitutes the parent’s entire
14. In other words, the relationship is of the form rA = rp.S + (1 - S)r, where rA is the affil- iate profit rate, rp is the parent’s, S is relative size, and r is some average &hate profitability.

266 H. Grubert, T. Goodspeed, and D. Swenson
Table 7.12 Affiliate Taxable Income to Assets and Parent Characteristics (1987 parent-affiliate link)*
Constant
Subsidiary saledparent
Haven sales
Acquisitions/affiliate
Parent pretax
Size x Parent profit
Affiliate debt-asset
R2 adjusted
assets
income/assets
rate
ratio
,054 (2.00) ,036
(1.80) .001 (.la ,022
(1.06) .250
(2.78)
- .lo4 (-4.10)
,113
,085 (3.08) - ,084
( - 2.20) .Ooo
.037 (1.82) -.132
( - .97) 1.51 (3.66) - ,106
(-4.30) .156
,074 (2.95) - .061
( - 2.06) - .OOo (.lo) .033
(1.66)
1.21 (4.54) - .lo3
(-4.21) ,156
.011 (.52) - ,079
( - 2.61) - .002
( - .30) ,028
(1.35)
1.34 (4.91)
,098
,002 (. 10)
- ,002 ( - .20)
.026 (1.23)
.81 (4.39)
,077
*Age and industry dummies not displayed; t = values in parentheses.
operation, its profitability only approximates the parent’s when the parent is highly profitable. Also, as indicated by the .25 coefficient for the parent’s profit rate in the first column, the relationship between parent and affiliate profitability seems in general much weaker.
Turning to the other independent variables in table 7.12, the affiliate’s size relative to the parent is of borderline significance and positive in column 1, when the sign is not affected by the presence of the size to profit rate variable. The positive sign is consistent with some type of start-up effect. (The parent’s absolute size is never close to being significant, which casts doubt on any cost of capital or long horizon interpretation.) The value-of-acquisitions variable is sometimes close to being significant, although the coefficient is positive and not easy to interpret. It may suggest that acquisitions are more profitable than start-ups or that they become profitable more quickly than start-ups. Finally, the tax haven coefficient is virtually zero in all specifications. This may reflect a problem in methodology alluded to in earlier sections. It is possible that only the most profitable firms incur the costs of establishing tax haven affiliates, if the presence of supernormal profits is required to justify the haven expendi- ture. If these highly profitable foreign firms shifted income until their profit rates were identical with less profitable foreign subsidiaries in the United States, no effect would be noted on the tax haven variable, even though the haven was responsible for the subsidiaries’ reduction in U.S. taxable income.
Even though accounting rules are not standardized across countries, it is of interest to compare the profitability of foreign parents with similar companies based in the United States. Using the data from Moody’s International, we find that the average parent’s pretax profit rate is 8.49 percent (and 4.99 after provision for tax). This compares with 5.97 percent pretax for the average

267 Low Taxable Income of Foreign-Controlled Companies
U.S. nonfinancial company in the 1987 Compustat. To the extent that U.S. and foreign accounting data are comparable, foreign parents seem on the av- erage to be more profitable than the average U.S. company. This superior profitability does not suggest a lower required return on capital, although the role of the cost of capital is clouded by the fact that we would expect multi- national companies to have better economic prospects.
Further, even in view of the difference between the taxable and book in- come concepts, the discrepancy appears very large between the parents’ aver- age 8.49 pretax profit rate and the 2.28 percent taxable income rate reported on the average by their subsidiaries. In contrast, the average 5.97 percent profit rate for domestic nonfinancial companies in Compustat is only modestly greater than the 4.07 percent taxable income rate in the 1987 sample. Among major investing countries, the largest discrepancy between parent and afFiliate profitability is in companies from the United Kingdom. Affiliates from Japan had low relative returns before adjusting for leverage, but their parents also were relatively unprofitable compared to parents from other countries; the discrepancy between parent and affiliate returns was therefore close to the average.
7.6 Profitability of Companies prior to Foreign Ownership
Acquisition of U.S. assets has prevailed as the primary means of foreign entry into U.S. business. Foreign activity in 1987 proved no exception. Ac- cording to Commerce Department data, new foreign operations in 1987 com- prised 543 acquisitions and 435 establishments. Despite the approximate nu- merical equality of these two methods, acquisitions accounted for 84.2 percent of the $40.4 billion spent on foreign entry into the United States. In light of the prominence of foreign merger activity, it seems important to see whether characteristics of the acquired firms themselves are responsible for the relatively low foreign earnings.
To assess the possibility that the low profitability of foreign-controlled com- panies is caused by the low profitability of the U.S. targets they acquired, we turn to a sample of 118 foreign acquisitions that were completed between the years 1980 and 1987.15 The regressions in table 7.13 involve not only those U.S. firms that were subject to foreign takeover but also U.S. firms from the Compustat industrial file. In order to replicate the general regression form presented in earlier sections of this paper, we use the ratio of book income to total assets as the dependent variable in the first two columns of table 7.13. The foreign target dummy is set at a value of one for U.S. companies in the year prior to being acquired by a foreign owner. The results indicate that for-
15. This sample of foreign mergers is a subset of those analyzed in an event study by Swenson (1991). The larger sample includes all foreign acquisitions that occurred between 1974 and 1987 and were listed in the quarterly rosters of the publication Mergers and Acquisirions as well as having Cornpustat information on the financial characteristics of the target.

268 H. Grubert, T. Goodspeed, and D. Swenson
Table 7.13 Profitability and Growth of U.S. Companies prior to Foreign Ownership*
Dependent Variable
Book Book 4-Year 4-Year Income/ Income/ Sales Asset Assets Assets Growth Growth
Constant .050 ,050 0.402 0.485 (1 9.69) (16.57) (20.25) (24.54)
Foreign target dummy - .0033 - .0040 0.25 0.071 (yes = 1) (-0.48) (-0.70) (0.37) (1.45)
Food ,0066 (1.67)
Chemical .0050 (1.58)
Electronics ,005 (0.130)
Year dummies Yes Yes Yes Yes R’ adjusted 0.007 0.012 0.010 0.018
*t-values in parentheses.
eign targets were, on average, less profitable than comparable U.S. companies but that the difference is small and not statistically significant. Hence, the low profitability of foreign-controlled companies does not seem to be attributable to the low quality of the assets acquired. The second regression includes dummy variables for each year, as well as for selected industries. Once again, there is no indication that foreign firms purchase abnormally low profit firms.
The fact that foreign-controlled companies have a very low ratio of taxable income to sales even though they earned normal profits prior to being acquired suggests several possibilities. Foreign owners may have made large invest- ments after acquiring their U. s. companies, which depresses their earnings in the initial years of operation, or foreign firms may have been willing to take lower profits in the short run while operations were modified. Alternatively, the low profitability subsequent to takeover may arise from the diversion of profits to foreign locations.
Rates of return are not the only dimension on which the performance of targets of foreign acquisition may deviate from the performance of domestic companies. As indicators of differences in the time path of firm activity, col- umns 3 and 4 of table 7.13 consider the four-year growth rates of sales and assets. Again the sample includes industrial firms from the Compustat files, and the foreign target dummy variable indicates those U.S. firms that become the target of a foreign acquisition in the subsequent year. The results show that prior to their acquisition, foreign targets were growing somewhat faster than comparable U.S. companies. In the case of asset growth, the foreign target

269 Low Taxable Income of Foreign-Controlled Companies
coefficient is of borderline statistical significance. This is consistent with the finding in Swenson (1991) that foreign targets tended to have higher price- earnings ratios than did the targets of domestic acquisition, as this is an indi- cator that future earnings are expected to grow.
This evidence on the growth of firms targeted for foreign acquisition may give some confirmation to the trend effect described in section 7.3. But the trend or maturation effect may reflect other factors as well. As suggested above, foreign owners may, after they acquire a company, make large initial investments in order to better utilize the assets. In addition, the 1980-87 cross-section data involve foreign operations that started prior to 1980. To the extent that foreign investment activity before 1980 may have involved a larger share of start-ups than was true in the 1980s, the acquisition data will not provide a complete picture.
7.7 Summary and Conclusions
Aggregate statistics indicate that foreign-controlled companies in the United States report strikingly less taxable income than do their domestically controlled counterparts. Although many possible explanations have been pro- posed, their validity has not been established in previous work. We have ex- amined firm-level data to evaluate the relative merit of these explanations.
Of the initial foreign-domestic differential, we find that about 50 percent is definitely attributable to the special characteristics of foreign-controlled com- panies and not to transfer pricing. First, the revaluation of the book value of assets following acquisitions can distort the comparison of the ratio of taxable income to assets. Second, a maturation process is indicated by the fact that profitability of foreign-controlled manufacturing companies rises over time relative to comparable domestically controlled firms. Foreign investors may, therefore, accept lower initial returns in exchange for high long-run profits. Third, the taxable income of foreign-controlled wholesale companies relative to their domestically controlled counterparts is found to rise as the real value of the dollar increases relative to other currencies. In particular, the large drop in the dollar since 1985 has depressed recent returns of foreign investors in wholesaling.
Other commonly suggested reasons for the foreign-domestic differential have less explanatory power. First, we find that debt and earnings stripping do not appear to be major reasons for the low taxable income of foreign- controlled companies. In general, the debt-asset ratio of foreign-controlled companies is not notably different from that of domestically controlled com- panies, and their interest expense for a given level of debt is significantly lower. Although foreign-controlled companies have an apparent preference for operations with rising profit profiles, there is not much evidence that any advantage in the cost of equity capital explains the foreign income differential. Neither parent size nor whether a parent is from a capital-exporting country is
270 H. Grubert, T. Goodspeed, and D. Swenson
important. Furthermore, foreign parents seem in general to be more profitable than the typical U.S. company.'6 Additionally, we find that the evidence does not support the hypothesis that foreign firms tend to acquire relatively unprof- itable firms. Low profitability is a characteristic of foreign-controlled compa- nies irrespective of their country or origin. It is not restricted to companies based in only a few countries or operating in a narrow range of industries.
The distribution of foreign rates of return between 1980 and 1987, however, does provide indirect evidence that income shifting is partially responsible for the low rate of return of foreign firms. Not only were foreign firms heavily concentrated around a zero rate of return but they also tended to persist in the zero region, and they were more likely to transit back to the zero region from a higher profit range. This phenomenon seems remarkable when placed in the context of ongoing tax reforms, economic cycles, and large exchange rate fluctuations and seems indicative of foreign company efforts to reduce U.S. taxable income through earnings manipulation. While the degree of transfer pricing distortions is perhaps smaller than might be feared, income shifting seems to be at least partially responsible for the remaining gap in taxable income.
References
Graham, Edward M., and Paul R. Krugman. 1989. Foreign direct investment in the United States. Washington, D.C.: Institute for International Economics.
Lichtenberg, Frank, and Donald Siegel. 1987. Productivity and changes in ownership of manufacturing plants. Brookings Papers on Economic Activity, 643-73.
Poterba, James M. 1991. Comparing the cost of capital in the United States and Ja- pan: A survey of methods. Federal Reserve Bank of New York Quarterly Review
Price Waterhouse. 1991. U.S. international tax policy for a global economy. Prepared
Swenson, Deborah L. 1991. International mergers and acquisitions in the U.S.: Do
15:20-32.
for the National Chamber Foundation.
foreign bidders pay more? Manuscript.
Comment Jeffrey K. MacKie-Mason
Foreign-controlled corporations report lower taxable profit rates than do U.S .- controlled corporations. To no one's surprise, there has been suspicion that
16. The unexplained differential in the ratio of taxable income to assets is almost 2 percentage points. In view of debt-asset ratios of about two-thirds, this would imply that the cost of equity capital would have to be more than 7 percentage points lower for foreign companies to explain the remaining differential. An equity cost of capital advantage of anything resembling this magnitude seems highly implausible.
Jeffrey K. MacKie-Mason is associate professor of economics and public policy at the Univer- sity of Michigan and a faculty research fellow of the National Bureau of Economic Research.

271 Low Taxable Income of Foreign-Controlled Companies
foreign corporations are hiding their profits and not paying their “fair share” of taxes. Of course, it may be true that foreign-controlled corporations are simply less profitable. Before this .paper by Grubert, Goodspeed, and Swen- son, there was precious little evidence to help us distinguish between these (and other) explanations for the well-known difference in profit rates.
What we learn from this paper is that almost every plausible hypothesis finds some support in the data as a partial explanation for the profit rate differ- ence. There is not one simple, dominant story. On the central hypothesis- that the profits are being hidden, presumably through transfer pricing-the authors suggest that as much as 50 percent of the difference in reported profits may be due to transfer pricing.
On the other hand, it may be that none of the profit rate difference is due to transfer pricing. The authors provide no direct evidence either way. Their re- search design is to use the “residual method.” They attempt to explain the puzzle with every story they can, and then, as they write in their introduction, “This still leaves us with a significant difference that we are unable to explain by forces other than transfer pricing.”
The extent to which we can believe the importance of transfer pricing de- pends on how convinced we are that (1) a complete list of alternatives was considered and ( 2 ) the full extent of the alternative effects was measured. I find myself convinced that they have done a fine job in identifying many dif- ferent effects, but there are some plausible effects left untested. Further, sev- eral of the stories they do consider are measured with low-power, indirect tests. Thus, I am not very confident in the magnitude of the residual nor whether the extent of transfer pricing is cause for more policy effort than is already under way.
I do not think that it was a mistake for the authors to use the residual method for investigating the importance of transfer pricing. Indeed, they have little choice. By their nature, transfer pricing activities are guarded as private infor- mation. Direct measurement is not feasible. This paper represents a careful and thoughtful effort to learn what we can from available data, and we learn much from it. We must be cautious, however, about drawing stronger infer- ences than the residual method can support.
Even if we do not learn the final word on transfer pricing, there is much to be learned on the importance of the other stories. For the remainder of my comments, I will focus on the measurements the authors do undertake rather than on those they do not.
First, since the paper considers so many explanations, I think it would be helpful to organize them. Each of the stories in the paper falls into one of four categories:
1. “True” economic profits are different for foreign- and domestic- controlled firms, because there is some incentive for foreigners to own low- profit firms.
2 . Ex ante, expected true profits are the same, but shocks lead to different ex post realized profit rates.

272 H. Grubert, T. Goodspeed, and D. Swenson
3 . True profits are the same, but some accounting rule difference or anom-
4. True profits are the same, but foreign owners arrange to report lower aly in the data leads to different reported profits.
profits through transfer pricing and other income-shifting techniques.
I . Foreigners own lower-proJit Jirms. Foreign investors might systematically own lower-profit firms if, for example, they face a lower real cost of capital. The authors test this point only indirectly, by assuming that being a capital exporter proxies for a low cost of capital. Entering the ratio of current account surplus to gross domestic product as an explanatory variable has no explana- tory power in the profit rate regressions, but that is not a very convincing rejection of the possibility of capital cost differences.
The authors note that a disproportionate number of foreign-controlled firms are recent acquisitions. They do not provide an equilibrium explanation for this' but observe that the different ownership composition could bias foreign firms toward low reported profit rates. In particular, a step-up in asset basis upon acquisition would increase the denominator of a profit-assets ratio.* In- deed, the profit rate differential drops from about 3.6 percent to 2.6 percent when age-of-incorporation dummies are introduced. This result seems quite strong and important.
The apparently important differences between the types of firms that are foreign- and domestic-controlled suggest that carrying the analysis one step further would be useful. The authors use age of incorporation as a proxy for acquisitions (and possibly other sources of real profit differences), but it is possible to identify actual acquisitions by year, using, for example, the data in Mergerstat. If the authors did that, they could really sharpen the test of acquisition effects by changing the control group, comparing foreign-acquired firms to only domestic-acquired firms rather than to all domestic-controlled firms. That would help us determine whether the profit rate difference is due to the fact that the firm was acquired or to the fact that foreigners own the firm.
2. Expected projits the same, but foreigners had bad stochastic realizations. The analysis in the first half of the paper is based on a cross section of reported profit rates in one year (1987). Was that just a bad year for foreign owners? The authors use a 1980-87 panel to investigate the possibility that exchange rate movements are the culprit. Exchange rates seem important for wholesal- ers, but the authors do a good job of showing that this effect has a rather small
1. Tax policy seems to provide some incentive for a higher rate of foreign acquisitions, espe- cially in recent years. See Gordon and MacKie-Mason (1991) and Scholes and Wolfson (1988).
2. No typology is perfect: the step-up in basis is really an accounting artifact, or one of my type 2 stones. But it also seems plausible to think that for other reasons the true profit rate of recently acquired firms may differ from stable, mature firms.

273 Low Taxable Income of Foreign-Controlled Companies
effect on the aggregate profit rate difference. Of course, a number of other possible sources of unexpectedly bad foreign performance are not tested, such as changes in trade and tax policies.
3. Accounting rule artifacts. With one exception, the authors do not discuss the possibility that the profit rate gap is due simply to differences in reporting rules. (The exception is the step-up in basis upon acquisition, as discussed above.) Perhaps it is obvious that the reporting rules are blind to location of ownership. Even if there were a smoking gun, I am not conversant enough in international tax reporting rules to identify it. One thing I have learned, how- ever, is that the U.S. rules for multinationals are sufficiently complex that I would believe almost anything. If there is a simple reason why the data cannot be explained by accounting rule differences, I would have liked the authors to at least briefly educate the rest of us.
4 . True profits are the same, but foreignjirms do more income shifting to avoid U S . taxes. Although the authors have no direct tests that reveal income shift- ing, they do provide some intriguing evidence to support interpreting the re- sidual as due in part to shifting. They hypothesize that if foreign firms were more aggressively managing their taxable income, we should expect to see their profit rates concentrated around zero. Indeed, this appears to be the case. Unfortunately, the authors choose to present the results with graphs and tables and eschew presentation of any nonparametric tests of the hypothesized differ- ences between the distributions of foreign- and domestic-controlled profit rates, making it difficult to be sure how convincing the differences are. The weight of the evidence clearly is consistent with the presence of some income shifting, however.
The authors test a number of other, mostly lesser explanations that fall into the above four categories. Their exposition of the results is clear and interest- ing and does not need repeating by me. Instead, I would like to close with three concrete suggestions that I think would increase the overall effectiveness of the paper.
First, I would find it quite helpful to have a better sense of the target of analysis. The paper is motivated by table 7.1, which shows a difference in profit rates. Since the authors have income statements and balance sheets, it would be a simple matter to provide a decomposition of the profit differences into revenue and cost elements. Suppose we found that the difference was mostly due to differences in depreciation deductions but not in revenues? Or perhaps that the assets denominator was the culprit, largely due to differences in intangibles rather than in plant and equipment? We could then design tests that were more narrowly focused and powerful. Also, our thinking about al-

274 H. Grubert, T. Goodspeed, and D. Swenson
temative explanations would likely be stimulated. Simply saying that profit rates are different is too vague.
Second, I think we might learn quite a bit from attention to a different con- trol sample. Nearly all of the foreign-owned firms are presumably parts of multinationals. Comparing these firms against only domestic-controlled mul- tinationals (rather than all domestic firms) would focus the investigation of the sources of profit differences. Just as with my proposal to compare foreign and domestic acquired firms, we could learn about the extent to which it is foreign firms that are different, versus multinational firms.
Last, the authors could have learned more from another nice, near- experiment available in their data. They investigate the phenomenon of low- profit foreign-acquired firms by studying the profits of the target firms before acquisition. In these analyses, in the last part of the paper, they compare for- eign acquisition targets to all U.S. corporations and discuss a number of rea- sons that might explain their finding that targets have insignificantly different profits before but significantly lower profits after the acquisition. The much more informative and relatively clean analysis would be to compare the before-and-after profitability of foreign targets that were later acquired by do- mestic firms. Even a simple two-way analysis of the following sort could be revealing:
Profit Rate
U.S. acquirer I I Foreign acquirer 1 I
Does the profit rate fall after acquisition, regardless of the acquirer’s loca- tion? Is the decrease larger for foreign acquisitions? The same simple calcu- lations could be done with a further restriction of the U.S. acquirer group to multinationals, an even more closely comparable control group.
This is a long paper but very rich with informative analysis. At the end, however, we are still left without a strong sense of the importance of transfer pricing. And there is still much that can be learned about the causes of profit rate differences from the data the authors have collected. Nonetheless, my critical remarks should not obscure the fact that this paper provides a number of new and interesting results, and we now know much more than before about the profit rate differences between foreign- and domestic-controlled cor- porations.
3. In response to my earlier comments, the authors did include a paragraph reporting that their main results continue to hold when the control group is restricted to domestic MNCs; I am glad to see that. However, they do not go beyond affirming their initial analysis. They could take advan- tage of this natural control group to improve our understanding of the sources of profit rate differ- ences.

275 Low Taxable Income of Foreign-Controlled Companies
References
Gordon, R. H., and J. K. MacKie-Mason. 1991. Effects of the Tax Reform Act of 1986 on corporate financial policy and organizational form. In Do taxes mutter? The impact of the Tax Reform Act of 1986, ed. J. Slemrod. Cambridge, Mass.: MIT Press.
Scholes, M. S., and M. A. Wolfson. 1988. The effects of changes in tax laws on corporate reorganization activity. Working Paper. Stanford Graduate School of Busi- ness.

This Page Intentionally Left Blank
Related Documents