Studies in IMMIGRATION & REFUGEE POLICY March 2012 Fiscal Transfers to Immigrants in Canada: Responding to Critics and a Revised Estimate by Herbert Grubel and Patrick Grady Key findings In 2011, we estimated that in 2005 Canada’s immigrant selection policies resulted in an average fiscal burden on taxpayers of $6,000 for each immigrant. Later that year, Mohsen Javdani and Krishna Pendakur from the economics department at Simon Fraser University (J&P hereafter) presented an alternative estimate of this fiscal burden of $450. This study concludes that J&P’s lower estimate is due mainly to their choice of a different immigrant cohort and assumptions about the immigrants’ absorption of government spending on pure public goods, education, and public housing. After taking into account some new data and some issues raised by J&P, this study presents new estimates that show that the fiscal burden imposed by the average recent immigrants is $6,000, which for all immigrants is a total of between $16 billion and $23 billion per year, figures virtually identical to those found in our earlier study. This study also rejects arguments made by J&P that immigrants are needed to meet labour shortages, that they bring productivity-increasing economies of scale, and that their children will repay the fiscal burden. New evidence does not provide any grounds for optimism that the offspring of recent immigrants are going to be able to earn enough to compensate current and future generations of Canadians for the fiscal transfers made to their parents by existing Canadians. This study also presents new evidence showing that immigrants who were admitted mainly on the basis of pre-arranged jobs have superior economic performance, which supports the policy recommendation made in our 2011 study.

Welcome message from author
This document is posted to help you gain knowledge. Please leave a comment to let me know what you think about it! Share it to your friends and learn new things together.
Transcript

Studies in IMMIGRATION & REFUGEE POLICYMarch 2012
Fiscal Transfers to Immigrants in Canada: Responding to Critics and a Revised Estimate by Herbert Grubel and Patrick Grady
Key findings
In 2011, we estimated that in 2005 Canada’s immigrant selection policies resulted in an average fiscal burden on taxpayers of $6,000 for each immigrant. Later that year, Mohsen Javdani and Krishna Pendakur from the economics department at Simon Fraser University (J&P hereafter) presented an alternative estimate of this fiscal burden of $450.
This study concludes that J&P’s lower estimate is due mainly to their choice of a different immigrant cohort and assumptions about the immigrants’ absorption of government spending on pure public goods, education, and public housing.
After taking into account some new data and some issues raised by J&P, this study presents new estimates that show that the fiscal burden imposed by the average recent immigrants is $6,000, which for all immigrants is a total of between $16 billion and $23 billion per year, figures virtually identical to those found in our earlier study.
This study also rejects arguments made by J&P that immigrants are needed to meet labour shortages, that they bring productivity-increasing economies of scale, and that their children will repay the fiscal burden. New evidence does not provide any grounds for optimism that the offspring of recent immigrants are going to be able to earn enough to compensate current and future generations of Canadians for the fiscal transfers made to their parents by existing Canadians.
This study also presents new evidence showing that immigrants who were admitted mainly on the basis of pre-arranged jobs have superior economic performance, which supports the policy recommendation made in our 2011 study.

www.fraserinstitute.org / Fraser Institute
Studies inImmigration and Refugee Policy
2012
Fiscal Transfers to Immigrants in Canada:
Responding to Critics and a Revised Estimate
by Herbert Grubel and Patrick Grady

Fraser Institute / www.fraserinstitute.org

Fiscal Transfers to Immigrants in Canada: Responding to Critics and a Revised Estimate / iii
www.fraserinstitute.org / Fraser Institute
Contents Summary / v
Highlights / vi Introduction / 1
1 The main cause of the difference in estimates / 2
2 Evaluating the sources of the fiscal burden—taxes paid / 9
3 Government benefits consumed / 12
4 Using a different base for comparison / 15
5 Revised estimates / 16
6 Other disagreements on the influence of immigrants on Canada / 20
7 New immigrant selection criteria for Federal Skilled Workers (FSW) / 31
8 Summary and conclusions / 35
References / 37
About the authors / 40
Acknowledgments / 40
Publishing information / 41
Supporting the Fraser Institute / 42 Purpose, funding, & independence / 43 About the Fraser Institute / 44
Editorial Advisory Board / 45

iv / Fiscal Transfers to Immigrants in Canada: Responding to Critics and a Revised Estimate
Fraser Institute / www.fraserinstitute.org

Fiscal Transfers to Immigrants in Canada: Responding to Critics and a Revised Estimate / v
www.fraserinstitute.org / Fraser Institute
Fiscal Transfers to Immigrants in Canada: Responding to Critics and a Revised Estimate
Summary
This paper responds to the criticism by Mohsen Javdani and Krishna Pendakur of our estimate of the net fiscal transfer to recent immigrants. Specifically, Javdani and Pendakur question our estimate that in fiscal year 2005/06 the average fiscal burden imposed on Canadian taxpayers was around $6,000 for each immigrant. They counter with a much lower estimate of $450 per immigrant. We welcome this opportunity to explain the differences in these estimates and why our original estimate is still the most accurate available on the net fiscal cost of recent immigration.
The difference between the two estimates is due to two main factors. First, Javdani and Pendakur used estimates of the incomes of immigrants that arrived over the period 1970 to 2004, which were higher than the incomes of the 1987 to 2004 immigrant cohort used in our study. Second, they con-sidered 10% of total government spending to involve “pure public goods” such as defence, the consumption of which by immigrants is alleged to occur at zero cost to Canadians.
We reject both of these factors as invalid, the first because it does not address the core of our analysis, i.e. the fiscal implications of the low average incomes of immigrants who arrived between 1987 and 2004; and the second because pure public goods are not quantitatively significant in the longer run.
After correcting for minor errors in our study pointed out by the critics, we found that the net fiscal transfers to recent immigrants remain roughly the same—around $6,000 per capita or about $16 billion annually—just as we had reported in our original study. We also provide new information that rejects the notion that these fiscal costs will be repaid in the future through a variety of benefits brought by immigrants and their offspring. Finally, we present information about the economic success of immigrants who have held job offers, which supports our proposal for using such offers as the main immigrant selection criterion.

vi / Fiscal Transfers to Immigrants in Canada: Responding to Critics and a Revised Estimate
Fraser Institute / www.fraserinstitute.org
Highlights
Mohsen Javdani and Krishna Pendakur (J&P hereafter, 2011) have called into question our estimate that the average fiscal burden imposed on Canadian taxpayers was around $6,000 for each immigrant and have countered with their own much lower estimate of $450. We welcome this opportunity to explain the differences in these estimates and why our original estimate is still the most accurate available on the net fiscal cost of recent immigration.
Our critics’ finding that there is a fiscal transfer of $450 implies that they accept the most basic propositions underlying our study, namely: In the Canadian welfare state, Canadians with higher incomes are taxed more than Canadians with lower incomes while government services benefit both groups in roughly equal amounts. Under this system, immigrants who add to the number of lower income earners force those with higher incomes to pay more taxes.
These considerations imply the need for precise estimates of the tax increases caused by current immigrant selection policies that have produced the low incomes of recent immigrants. Both studies found that immigrants have average incomes below the average Canadian, 72 percent according to our study, 89 percent according to J&P. This difference is due to the differ-ent cohorts of immigrants considered—those who arrived between 1987 and 2004 in our study, and those who arrived between 1970 and 2004 in the J&P study.
J&P argued that our use of the 1987-2004 cohort was inappropriate because the immigrants tended to be younger than the Canadians with whom they were compared. Given the life-cycle of incomes, the average for that cohort is alleged to introduce a downward bias that is eliminated by their use of the longer cohort.
In the next section we present additional evidence that refutes this proposition by comparing the incomes of immigrants and Canadians of the same age.
A second source of the lower estimate of the fiscal burden produced by J&P stems from their assumption that ten percent of government spending is alleged to consist of what economists call “pure public goods” such as defence. According to this theory, the benefits from such spending received by every-one in Canada are not diminished by benefits received by new immigrants.
We consider this adjustment to be unwarranted since pure public goods do not, in all the most important cases, exist in the long run, which is relevant in determining the fiscal burden caused by current and future immigrants admitted under present selection policies. Instead, almost all

Fiscal Transfers to Immigrants in Canada: Responding to Critics and a Revised Estimate / vii
www.fraserinstitute.org / Fraser Institute
government spending, including that on such pure public goods like defence is a function of the size of Canada’s population and national income.
A third source of the lower estimate of the fiscal burden by J&P stems from their assertion that immigrants on average pay the same amount of real estate taxes as do Canadians. This argument is based on a complex and poorly explained model, which uses implicit assumptions about the number of per-sons and family units per housing unit occupied by immigrants as compared with the practices of Canadians.
It also flies in the face of common sense to imply that immigrants in large Canadian cities, where most settle, have enough financial resources to own homes in the same proportion as Canadians. In another part of their paper J&P cite data, which show that recent immigrants use fewer housing subsidies than Canadians but neglect to note that in this same study, earlier immigrants are recorded as using more such subsidies than Canadians.
A fourth source of difference in the estimates of the fiscal burden in the two studies involves the relative use of publicly financed education. J&P cite data, which show that immigrants absorb more of these services than Canadians, which implies that we had underestimated the size of the fiscal transfers going to immigrants.
After taking these sources of discrepancy into account and correcting some small computational errors in our study resulting from inconsistencies identified by J&P, we re-estimated the amount of fiscal transfers received by recent immigrants. It turns out that, even after all the required adjustments in the fiscal year 2005/06, recent immigrants on average received an excess of $6,000 in benefits over taxes paid, an amount virtually identical to that found in our original study. Depending on assumptions about the number of immigrants to which this per capita figure is applied, the estimated total fiscal burden in that year remains between $16 and $23 billion as we found before.
In other sections we deal with common arguments repeated by J&P that immigrants raise the well-being of Canadians through a number of chan-nels that cannot be measured in dollars or accrue as fiscal benefits to future generations of Canadians. We present analysis and data that sheds serious doubt on the existence of such non-measurable and future fiscal benefits. We argue that immigrants do not raise labour productivity, are not needed to meet labour shortages, and are not subject to discrimination that is respon-sible for their low productivity that could be ended easily through public information. Furthermore, data shows that if the offspring of recent immi-grants have the same economic success as do the offspring of preceding immi-grant cohorts, in the future they will not pay enough taxes to cover the costs incurred by their immigrant parents.
This paper also reviews a study that is not yet published but has been cited by economists who had access to it. This study shows that immi-grants who were selected on the basis of having pre-arranged job offers have

viii / Fiscal Transfers to Immigrants in Canada: Responding to Critics and a Revised Estimate
Fraser Institute / www.fraserinstitute.org
considerably better economic success than immigrants who were selected under the previously used system. While this change improves Canada’s immigrant selection system, many more changes are needed. Nevertheless, the results of the study lend support to our proposal to increase reliance on market signals in the selection of immigrants most likely to benefit Canada.

Fiscal Transfers to Immigrants in Canada: Responding to Critics and a Revised Estimate / 1
www.fraserinstitute.org / Fraser Institute
Introduction
In our study (Grubel and Grady, 2011—G&G hereafter) we estimate that in 2005 Canada’s immigrant selection policies resulted in an average fis-cal burden on taxpayers of $6,051 for each immigrant. Mohsen Javdani and Krishna Pendakur (2011—J&P hereafter) present an alternative estimate of this fiscal burden of $450.
We welcome the attention paid to our study by J&P and the clarifica-tion of a range of issues that it enables us to make. We are also pleased with their acknowledgement in their Executive Summary that: “We do conclude, however, that there is a sizeable cost in terms of lower tax revenue to having a large population of relatively poorly paid immigrants” (2011: 13).
This statement implies that J&P accept the most fundamental notion underlying our study. In our welfare state, Canadians with higher incomes are taxed at progressively higher rates than Canadians with lower incomes while government services benefit both groups in roughly equal amounts. Under this system, immigrants with lower incomes add to the fiscal burden of Canadians with higher incomes.1
As a result of the agreement on this fundamental proposition, the dis-agreement between J&P and ourselves is reduced to what should be the rela-tively technical task of estimating the most accurate and reliable values of the transfers to recent immigrants. These estimate values will provide the government with the necessary information on which to base future chan-ges in immigrant selection policies—changes designed to benefit Canada economically.
1 The net fiscal impact is also recognized as a serious economic issue in the United States. In 1997, the National Science Foundation conducted a comprehensive study of immigra-tion including its fiscal impacts and found a significant net fiscal transfer to immigrants (US National Science Foundation, 1997).

2 / Fiscal Transfers to Immigrants in Canada: Responding to Critics and a Revised Estimate
Fraser Institute / www.fraserinstitute.org
1 The main cause of the difference in estimates
The main reason why the J&P estimate of the fiscal burden is so much lower than ours is that they considered the earnings of immigrants who arrived dur-ing the period 1970-2004, while we focused on those who arrived during the more recent period 1987-2004. These are immigrants who performed much worse than earlier immigrants for a number of reasons, including their greater numbers, their different source countries as well as changes in immigration policy that placed less emphasis on employability and more on more difficult to measure factors such as educational attainment, knowledge of both lan-guages, and humanitarian objectives such as family reunification.
Their inclusion of the earlier, more successful, pre-1987 immigrants in the analysis is important because it raises the average incomes and tax pay-ments of all immigrants and thus reduces the estimated fiscal burden that is produced by the group classified as recent immigrants.
This differential treatment of the 1970 to 1986 cohort of immigrants is the reason that the average income of recent immigrants calculated by G&G was 72 percent of that of other Canadians while J&P estimated it to be 89 per-cent. It is worth noting that both estimates were made using the same Public Use Microdate File (PUMF) supplied by Statistics Canada, which provides demographic information on a representative sample of 844,476 persons. Of this total, 64,792 are in the cohort of immigrants who arrived during the years 1987-2004 (and who reported income or income tax) and 98,793 are in the larger 1970-2004 cohort used by J&P.
J&P justify the use of the larger cohort by arguing that “G&G investi-gate only recent immigrants, who are younger than the immigrant popula-tion as a whole. To the extent that their youth results in lower incomes, and their lower incomes result in lower tax revenues, it would be more revealing to examine the entire immigrant population, so as to capture their entire life cycle of incomes” (J&P, 2011: 6). They go on to argue that the immigrants who arrived in the 1970-86 period are older, which would eliminate this age bias and reflect more accurately the true incomes and tax payments of immigrants.
We address the issue raised by J&P by estimating that the average age of the 1987 to 2004 cohorts of immigrants is 37.1 years.2 This compares with
2 Since the PUMF does not include a specific variable for age, the average age had to be estimated by using an age group variable attached to each record in the sample. It broke the sample into 22 groups. We estimated the age of the individual by taking the average

Fiscal Transfers to Immigrants in Canada: Responding to Critics and a Revised Estimate / 3
www.fraserinstitute.org / Fraser Institute
the average age of 39.7 of all Canadian residents excluding recent immigrants in the sample. In our view, this is not a large enough difference to affect mater-ially the main estimate of the fiscal burden presented in our original study.
The more fundamental point is that we chose the shorter 1987 to 2004 period in order to quantify the effects of the surge of immigrants after 1986, which is clearly evident from figure 1. After the ramp-up was largely completed in 1991, the annual level of immigrants settled was 231,000, much higher than the average of 138,000 during the period 1950 and 1986. Moreover, as can be seen in figure 1, the annual rates of immigration during the earlier period fluctuated widely in response to Canadian business cycles while this sensitiv-ity is largely absent after 1991.
While it is not relevant to the present analysis, it is worth noting that the upsurge in immigration, which had started in 1986, was caused by the deliberate decision of Prime Minister Brian Mulroney’s government to bring more immigrants into Canada. This decision was justified officially on the economic grounds that more immigrants were needed to compensate for Canada’s declining birth rate, but according to Windsor (1990) was also driven by the political desire to cater to the votes of earlier immigrants interested in having family members join them and in enlarging the size of their ethnic communities.
Along with the upsurge of immigration after 1986 came a shift in the composition of immigrants away from the traditional source countries of
of the start and end point of the group, excluding those under 15 years and over 64 for whom income tax data was not available. For instance, for someone in age group 12 cov-ering those 40 to 44, their age was estimated as 42.
0
50
100
150
200
250
300
2007
2004
2001
1998
1995
1992
1989
1986
1983
1980
1977
1974
1971
1968
1965
1962
1959
1956
1953
1950
Figure 1: Number of immigrants to Canada
Thou
sand
s pe
r yea
r
Source: Statistics Canada, Table 075-001-Historical statistics
Figure 1: Number of immigrants to Canada
4 / Fiscal Transfers to Immigrants in Canada: Responding to Critics and a Revised Estimate
Fraser Institute / www.fraserinstitute.org
Europe and the United States towards non-traditional source countries in the developing world. As a result, the share of visible minority immigrants, who have had much more difficulty than others competing in the Canadian labour market, almost doubled from 38 percent before 1991 to 74 percent after 1991.3
The effects of the surge in immigration after 1986 on the average incomes of different cohorts of immigrants has been documented and put into historic perspective in a study by Picot and Sweetman (2011), which became available only after our study had been completed. Their findings are shown in figure 2, which traces the ratio of the earnings of immigrant males to those of Canadian males for different cohorts over time.
The interpretation of this figure is facilitated by considering the top line, which shows the average earnings of immigrants from the 1975-1979 cohort relative to the earnings of comparable Canadians. During the first five years after arrival, this cohort earned about 85 percent of what Canadians earned. This percentage increased through time and reached about 98 percent after the immigrants had been in Canada for 21-25 years.
The lines below trace the income percentages for cohorts that arrived after 1979. As can be seen, these percentages became smaller for every sub-sequent cohort during their first five years after arrival and remained so in
3 Calculations by the authors from the Census PUMF.
0.5
0.6
0.7
0.8
0.9
1.0
21 to 2516 to 2011 to 156 to 101 to 5
Figure 2: Earnings of immigrants compared to those of comparable Canadian-born full-time full-year workers aged 16-64, Males
Ln (i
mm
./Can
. bor
n ea
rnin
gs
Years since immigration
Source: Picot and Sweetman (2011: 16) Census of Population. Earnings are predicted values based on a model.
1975-1979 cohort
2000 to 2004
1995 to 1999
1990 to 1994
1980 to 1984
1985 to 1989
Figure 2: Earnings of immigrants compared to those of comparable Canadian-born full-time full-year workers aged 16-64, Males

Fiscal Transfers to Immigrants in Canada: Responding to Critics and a Revised Estimate / 5
www.fraserinstitute.org / Fraser Institute
the later years—except for the 1995-1999 cohort, which had incomes above those of the 1990-1994 cohort, perhaps because they arrived when the econ-omy was strong. However, the first period incomes of the 2000-2004 cohort, which the authors indicate were estimated using a model, were only slightly above those of the 1990-1994 cohort. It should be noted that similar results were found for females.
While this study confirms the downward trend in the economic per-formance of recent immigrant cohorts that is crucial to our estimate of the fiscal burden, it is crucial for another reason. J&P suggest that the low average incomes of the 1987-2004 cohort were due to their young ages. The validity of this assertion is undermined by the fact that Picot and Sweetman used income data that compared “the earnings of immigrants to the Canadian-born with similar characteristics (i.e., education, age, marital status, etc.)” (2011: 15). In other words, the comparison of earnings involves immigrants and Canadians at the same stage in their age-income profile.
Since the data used by Picot and Sweetman shows a strong and con-sistent decline in the ratio of the incomes of immigrants and Canadians with similar characteristics through time, we believe this supports our view that our study is not significantly biased by the alleged younger age of immigrants relative to the age of Canadians. As a result, we reject J&Ps suggestion that we significantly underestimated the incomes and taxes paid by immigrants. In calculations below, we therefore retain the 1987 to 2004 cohort as the relevant immigrant group for the purposes of analysis of incomes and taxes.
The data found in figure 2 also sheds light on the question raised often in public discussions as to whether immigrants tend to earn the same or even more than Canadians after they have been in Canada for a long period. During this time they will have likely acquired relevant work and language skills and are fully integrated into the labour market. As can be seen from figure 2, the ratio of earnings of recent cohorts of immigrants to Canadian-born workers does not become equal, even after they have been in Canada 21 to 25 years.
The same figure shows that the maximum ratio after 21 to 25 years is reached by immigrants from the 1975-79 cohort, which had much higher incomes immediately after arrival in Canada than did later arrival cohorts. The 1980-84 cohort, which had lower initial earnings, had lower incomes than Canadian-born workers in every comparable period, and after 21 to 25 years still had lower incomes than the 1975-79 cohort.
These data suggest that the relatively low average incomes of recent immigrants will not be eliminated through time. Therefore, the fiscal burden they impose will remain, albeit its size should decline the longer the immi-grants are in Canada—at least until they enter their retirement years. However, under the present immigration policies, new immigrants will continue to impose the fiscal burden and do so increasingly if their relative numbers

6 / Fiscal Transfers to Immigrants in Canada: Responding to Critics and a Revised Estimate
Fraser Institute / www.fraserinstitute.org
increase and their initial and lifetime earnings remain below the Canadian average or become even less, as they have in recent years.
While it is not directly relevant to our analysis of the fiscal burden of recent immigrants, it is worth noting what Picot and Sweetman consider the main causes of declining average incomes of immigrant cohorts dur-ing the last 30 years. “There was a movement in immigration away from the traditional source regions such as Western Europe, the United States, and Australia towards Asian, African, and Caribbean countries. A bundle of char-acteristics that are difficult to disentangle follow from this: notably issues with language skills, educational quality, cultural differences, possibly ethnical/racial discrimination, etc.” (Picot and Sweetman, 2011: 19). Other explana-tions offered involve developments in Canada’s labour market and changes in returns to work experience and occupations like Information Technology.
The findings by Picot and Sweetman are further illuminated by some other studies summarized next. They shed light on different aspects of the decline in the economic performance of recent immigrants and are relevant to the future design of improved immigrant selection policies by the government.
Average incomes before and after 1986: Statistics CanadaThe first of these studies is from Statistics Canada (2003) and shows the average incomes of immigrants and Canadian-born workers for different age groups by gender. The main finding relevant here is that in 1980 Canadian-born male workers between the ages of 30 to 54 earned $51,300 while immi-grant men of the same age who had arrived during the preceding five years had earnings of $45,500. The gap in earnings in favour of Canadian-born males was $5,800.
Important for the present purposes of analysis is the fact that the same calculation for the year 2000 showed an inflation-adjusted gap of $12,300. Similar results exist for females and males at different levels of educational attainment, including university graduation. This study shows clearly that there has been a significant deterioration in the economic performance of immigrants who arrived after the 1986 surge in annual rates of immigration.
The second of these studies, Earnings and Incomes of Canadians over the Past Quarter Century, is also from Statistics Canada (2008), and is based on the most recent 2006 census. The basis of comparison are immigrant earners who arrived in four five-year cohorts between 1975 and 2004 and who are in the core working age group (25-54) to those of their Canadian-born counterparts:
“During the past quarter century, the earnings gap between recent immigrants and Canadian-born workers widened significantly... In 1980, recent immigrant men... earned 85 cents for each dollar received by Canadian-born men... the corresponding number was 67 cents in 2000... (and) by 2005, the ratio had dropped to 63 cents” (Statistics Canada, 2008:21).
Fiscal Transfers to Immigrants in Canada: Responding to Critics and a Revised Estimate / 7
www.fraserinstitute.org / Fraser Institute
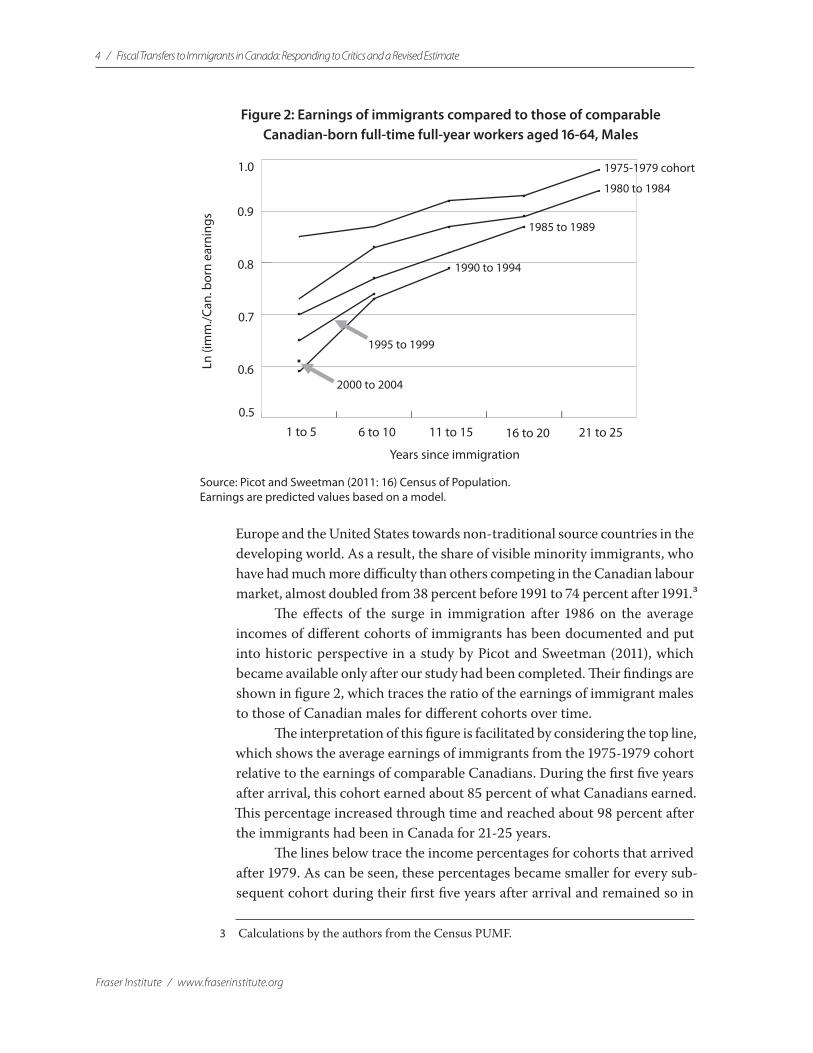
Figure 3 provides a visual representation of some other relevant facts found in this Statistics Canada study. Considering the last set of bars in the fig-ure that refer to females without university degrees, the 1980 census showed that the average immigrant female earned 86 percent of the amount earned by the average Canadian female. In the later censuses of 1990, 2000, and 2005, these percentage figures declined steadily to only 56 percent in the latest census. Similar results for other groupings of immigrants shown in the graph reveal the same pattern.
0.0
0.1
0.2
0.3
0.4
0.5
0.6
0.7
0.8
0.9
1.0
Females without university degree
Males withoutuniversity degree
Females with university degree
Males with university degree
Figure 3: Ratios of recent immigrant to Canadian-born earnings, census years
1980
2005
2000
1990
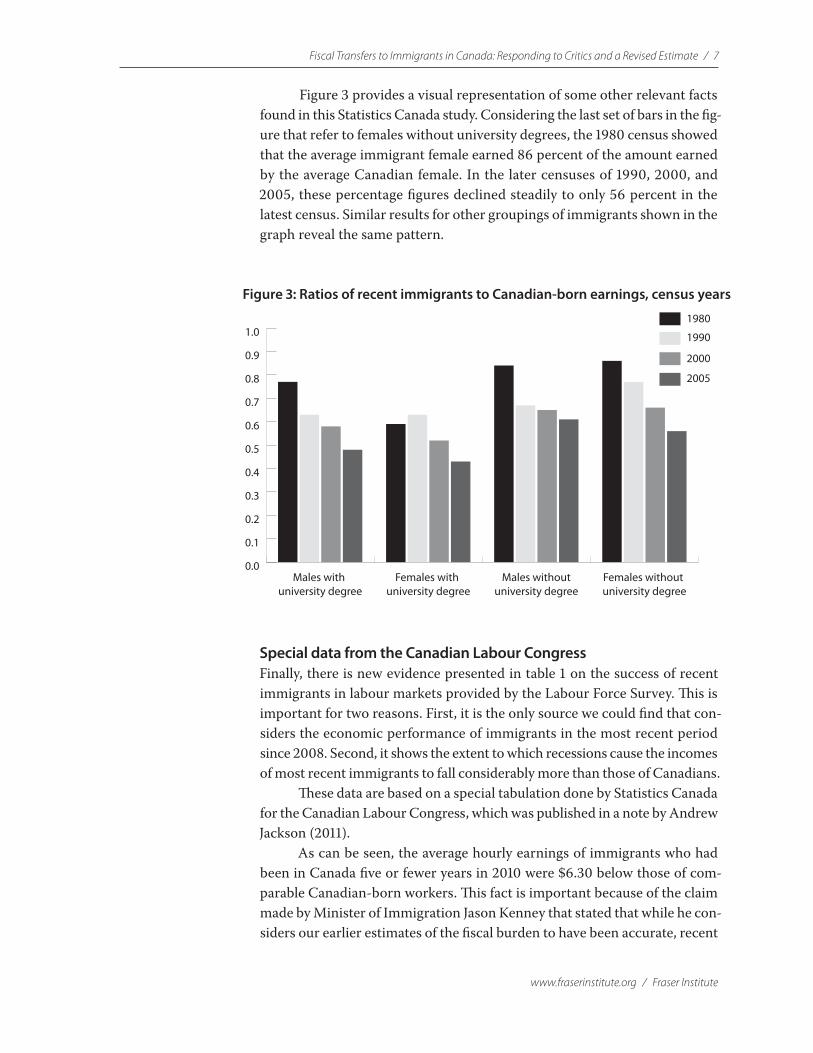
Special data from the Canadian Labour CongressFinally, there is new evidence presented in table 1 on the success of recent immigrants in labour markets provided by the Labour Force Survey. This is important for two reasons. First, it is the only source we could find that con-siders the economic performance of immigrants in the most recent period since 2008. Second, it shows the extent to which recessions cause the incomes of most recent immigrants to fall considerably more than those of Canadians.
These data are based on a special tabulation done by Statistics Canada for the Canadian Labour Congress, which was published in a note by Andrew Jackson (2011).
As can be seen, the average hourly earnings of immigrants who had been in Canada five or fewer years in 2010 were $6.30 below those of com-parable Canadian-born workers. This fact is important because of the claim made by Minister of Immigration Jason Kenney that stated that while he con-siders our earlier estimates of the fiscal burden to have been accurate, recent
Figure 3: Ratios of recent immigrants to Canadian-born earnings, census years
8 / Fiscal Transfers to Immigrants in Canada: Responding to Critics and a Revised Estimate
Fraser Institute / www.fraserinstitute.org
changes in admissions criteria have improved the economic performance of new immigrants making these estimates obsolete (O’Neil, 2011).
The data also show that by several indicators these recent immigrants have been affected much more adversely by the recession than Canadian-born workers. Thus, between 2008 and 2010 the average hourly earnings of recent immigrants in the country less than five years rose by only 6 cents while those of Canadian-born workers rose by $1.32. In addition, these very recent immigrants experienced a much greater increase in the rate of unemployment between the business cycle peak in 2008 and 2010. It rose from 11.0 percent to 14.7 percent while that of Canadian-born workers rose only from 4.6 per-cent to 6.1 percent. The table also shows that these very recent immigrants had a considerably worse record than the Canadian-born with respect to their employment rates and the proportion who had hourly earnings under $20 per hour.
Far from making our estimate of the fiscal burden obsolete or just too high, these new data suggest that we may in fact be underestimating it.
Table 1: The labour market performance of recent immigrants and the 2008 �nancial crisis (age 25-54)
Recent immigrants < 5 years
Canadian-born
Unemployment rate
Employment rate
Average hourly earnings
Average hourly earnings under $20/hour
2010
2008
2010
2008
2010
2008
2010
2008 11.0%
14.7%
66.6%
63.5%
$18.68
$18.74
64.8%
67.1%
$23.72
$25.04
42.9%
37.9%
4.6%
6.1%
84.1%
82.4%
Source: Statistics Canada data, reported in an note by Andrew Jackson on the Centre for Policy Alternatives website: http://www.behindthenumbers.ca/2011/10/17/recent-immigrants-and-the-crisis/
Table 1: The labour market performance of recent immigrants and the 2008 financial crisis (age 25-54)

Fiscal Transfers to Immigrants in Canada: Responding to Critics and a Revised Estimate / 9
www.fraserinstitute.org / Fraser Institute
2 Evaluating the sources of the fiscal burden—taxes paid
The preceding analysis should provide sufficient information about the merit of each study. However, for those who are interested, the following considers in more detail how estimates of different types of tax revenue are affected by the methodologies adopted by G&G and J&P.
Table 2 shows the types of per capita taxes collected by all levels of government in Canada and for which disagreements between the two stud-ies exist. Columns 1 and 2 present the amounts by which the payments made by other Canadians exceed those made by recent immigrants, as estimated by G&G and J&P, respectively.
Column 3 presents the difference between the two estimates and col-umn 4 indicates the percentage that each type of tax revenue represents out of the sum of the differences shown in column 3.
Turning to a discussion of the differences in estimates found in the two studies, we first consider the personal income tax. The gap of payments between other Canadians and immigrants estimated by J&P is much smaller than that estimated by G&G. The small J&P number is entirely due to their use of income data for the 1970-2004 immigrant cohort, which is 89 percent of that of other Canadians and is much higher than that for the 72 percent for
(1) Personal Income Tax
(2) General Sales Taxes
(3) Other Taxes
(4) Corporate Income Taxes
(5) Property & Related Taxes
Total
2,460
607
669
1,465
960
6,161
1,087
239
263
879
3
2,471
1,373
368
406
586
957
3,690
G&G J&P 1 minus 2 Di�erence
37.2
10.0
11.0
15.9
25.9
100.00
Estimates by Di�erence % of Total
(1) (2) (3) (4)
Type of Tax
Table 2: A comparison of estimates of lower revenues paid by recent immigrants ($ per capita)
Source: G&G, 2011: 6 and J&P, 2011: 19.Source: G&G, 2011: 6 and J&P, 2011: 19.
Table 2: A comparison of estimates of lower revenues paid by recentimmigrants ($ per capita)

10 / Fiscal Transfers to Immigrants in Canada: Responding to Critics and a Revised Estimate
Fraser Institute / www.fraserinstitute.org
the 1987-2004 cohort used by G&G. For reasons outlined above, we do not consider the record of immigrants over this longer period to be relevant to our study and we find this adjustment to our estimates unjustified. The 37.2 percent figure in column 4 shows that the disagreement over personal income taxes plays a big role in explaining the reduced tax revenues postulated by J&P.
Rows 2 and 3 of table 2 show revenues from General Sales Taxes and Other Taxes. For both of these categories, the J&P estimates of the lower pay-ments made by immigrants than other Canadians are not as low as those made by G&G. The explanation of this difference is once again due to the fact that J&P used the larger immigrant cohort and the resulting higher incomes of immigrants. For reasons presented above, we find unjustified the resultant reduction in the gap in tax revenue equal to 21 percent of the total postulated by J&P.
Row 4 shows the revenue estimates for the corporate income tax presented in the two studies. As in the case of the other types of taxes discussed above, the lower figure by J&P is due to the use of the higher incomes for the cohort they chose. For reasons given above, we therefore reject the need to adjust downward by $586, or 15.9 percent, our estimate of the gap in tax revenue between other Canadians and immigrants.4
Row 5 shows a difference in the estimates in the two studies that represents the significant 25.9 percent of the total. This difference is based on the J&P esti-mate that recent immigrants on average pay virtually the same amount of taxes on real estate and other property as do other Canadians, whereas G&G assumed that they pay only 41 percent.
In discussing the two estimates it is important to realize that no data on real estate holdings by immigrants and other Canadians exist because munici-pal records do not identify the immigrant status of owners. For this reason, both studies used information considered to be relevant, but subject to large margins of uncertainty.
The lower G&G estimate of 41 percent was based on the view that recent immigrants primarily from developing countries, on average, have relatively small amounts of financial wealth when they arrive and that their low average incomes slow their accumulation of assets needed for a down payment and reduce their
4 Our estimate of the corporate income taxes paid by immigrants was assumed to have been only 20 percent on the grounds that recent immigrants who arrived with few financial assets and needed to save for the acquisition of housing were unlikely to hold many common shares. However, in an earlier draft of our study, we had concluded that the relevant percentage figure was 30. This number was retained in the text but not applied to the calculation. At the end of this paper we present new estimates of the fiscal burden made in the light of the J&P analysis, which used the 30 percent figure. We consider this figure appropriate but subject to revision if and when solid information on share holdings by immigrants becomes available. Such infor-mation is unlikely to become available soon, however, since records of financial asset holdings by banks and other intermediaries contain no information on the relevant background of the owners and Statistics Canada has not obtained it directly from Canadian residents.

Fiscal Transfers to Immigrants in Canada: Responding to Critics and a Revised Estimate / 11
www.fraserinstitute.org / Fraser Institute
ability to service mortgages. As a result, they are likely to rent apartments or buy lower priced homes. This is especially the case since 80 percent of immigrants have settled in Canada’s major cities—Toronto, Montreal, and Vancouver—where housing costs and real estate taxes are very high by both national and inter-national standards.
In addition, taxes on housing paid by immigrants per capita are likely to be low because, in order to afford any housing at all, immigrants are much more likely than other Canadians to share homes with relatives or other immigrant families. For this reason the taxes paid per capita are lowered correspondingly, even if the housing is owned and taxes are paid by an immigrant.
J&P used data on the value of housing in different metropolitan areas found in the 2006 census and used information about the share of immigrants in each area to infer the amount of value of real estate held and the real estate taxes paid by them. A similar approach was used to infer the amount of taxes paid by renters. They used a complex and poorly explained statistical algorithm to arrive at the dubious conclusion that the average recent immigrant pays virtually the same amount of real estate taxes as does the average Canadian (99.8 percent).
Their results are based on the fact that immigrants tend to settle in big cities, where real estate prices and taxes are much higher than the average in the rest of the country, while relatively few live in other parts of the country where taxes are low. As a result, the average real estate taxes paid by the immigrants living mainly in these big cities are so high that they are equal to the average paid by other Canadians in the big city and the rest of Canada combined.
While we have great respect for the statistical and econometric skill of J&P, we remain skeptical of their results. Do their calculations adequately reflect the tendency of immigrant families to share accommodations with different generations and other groups? Furthermore, immigrants in 2001 account for about 18 percent of the total population of Canada but 43.7 and 37.5 percent of the population in Toronto and Vancouver, respectively. We would like to see the detailed calculation, which leads them to the conclusion that the average of the high taxes paid by Canadians in the big cities and the low taxes in the rest of the country combined equals the average of the high taxes paid by immigrants in the big cities. What was the assumed level of taxes paid by Canadians and the immigrants in the large cities? How much lower are the average taxes they assumed to being paid by Canadians in the rest of the country?
Nevertheless, since there are large margins of uncertainty with respect to this issue, we have raised our estimates from 41 to 70 percent. As a result, in table 2, the figure found in column 1, line 5 should be $488 rather than $960. The difference of $472 due to this adjustment implies that the overall fiscal burden imposed on other Canadians through their lower tax payment falls from $6,161 to $5,689, a drop of 7.7 percent. We also use the 70 percent figure in our new estimate of the fiscal burden based on a number of other revisions that are found below.

12 / Fiscal Transfers to Immigrants in Canada: Responding to Critics and a Revised Estimate
Fraser Institute / www.fraserinstitute.org
3 Government benefits consumed
Both studies assumed that for 11 out of 15 categories of government spend-ing found in official data, immigrants and other Canadians received the same amount of benefits. This is because of the lack of information on spending on recent immigrants in these categories. For one category, Labour, Employment, and Immigration, the estimates differ by an insignificant amount. There are major disagreements with J&P only over the three spending categories shown in table 3 of our original study on the relative amounts of benefits received by immigrants and other Canadians.5
The first of these concerns: “Protection of Persons and Property.” G&G assumed that immigrants receive $383 less than other Canadians in these benefits on the grounds that immigrants’ incomes are only 72 percent of those of other Canadians. J&P’s estimates are $233 justified by assuming that immigrants’ incomes were 89 percent of other Canadians according to their study of the 1970-2004 cohort. Their specific adjustment if adopted by us would actually increase the fiscal burden imposed by immigrants slightly, but since we consider the use of the longer cohort to be inappropriate for our purposes of analysis, we reject the revision suggested by J&P.
The second category of government spending is Education. G&G assumed that immigrants consumed 9 percent more, or $242 per capita, of education spending than other Canadians, mainly on the grounds that many of the school-age children of immigrants require special language training and attention to other special needs. Moreover, many adult immigrants take advantage of special programs of instruction involving English and French as second languages. J&P used the 2006 census data to estimate the propor-tion of children in the 1970-2004 immigrant cohort that attended Canadian elementary and secondary schools. They found that these children were only 76 percent of the children of Canadian residents, which implies that the cost of schooling immigrant children at that level was less than that for Canadians. However, they also discovered that the proportion of children from that immi-grant cohort attending postsecondary education was 117 percent of that of Canadians. Combining these percentage figures with estimates of the cost of the appropriate levels leads J&P to conclude that immigrants receive $195 less per capita in education services than do other Canadians.
However, J&P also found that for the 1987-2004 immigrant cohort, the attendance of immigrant children in these institutions is above that for other
5 See G&G, Immigration and the Welfare State, 2011: 9.

Fiscal Transfers to Immigrants in Canada: Responding to Critics and a Revised Estimate / 13
www.fraserinstitute.org / Fraser Institute
Canadians and implies that they consume on average $671 more. In table 7 below we use this information in the preparation of our revised estimates.
The third category in table 3 concerns Housing. G&G assumed that immigrants consumed 10 percent more of the benefits from this government spending than do other Canadians based on the consideration that the low average incomes of recent immigrants create a greater than average need for subsidized housing. J&P assumed that immigrants used only 90 percent of these government services. They justified this figure by referencing a study by Fleury (2009), which found that in 2004, “only 20.4 percent of recent low-income immigrants used subsidized housing, while this number is 22.5 percent for low-income native Canadians” (J&P, 2011: 23).
However, J&P did not tell the full story. Here is the part of a table on which their quoted sentence is based:
(1) Protection of persons and property
(2) Education
(3) Housing
Total
-383
242
15
-126
G&G J&P 1 minus 2 Di�erence
Estimates by Di�erence % of Total
(1) (2) (3) (4)
Types of Bene�ts
Table 3: Bene�ts received by immigrants and other Canadians
Source: G&G, 2011: 9 and J&P, 2011: 24.
-100
190
10
100
-233
437
29
233
-150
-195
-14
-359
Government or other subsidy for rent
Table 4: Housing data cited by J&P
Low-income adults Earlier immigrantsRecent immigrantsNative-born Canadians
22.5% 38.4%20.4%
Source: Fleury (2007), Table 15.
Table 3: Benefits received by immigrants and other Canadians
Table 4: Housing data cited by J&P

14 / Fiscal Transfers to Immigrants in Canada: Responding to Critics and a Revised Estimate
Fraser Institute / www.fraserinstitute.org
Referring to this table, Fleury notes: “It is nonetheless interesting to observe that poor immigrants who are more established and who were rent-ers were more likely to live in subsidized housing” (2009: Section 11). We find it strange that J&P, who in other areas of their study insist on the need to consider the conditions of earlier immigrants, completely disregard this finding in the Fleury study.
More generally, we are at a loss to explain the difference between the use of housing subsidies by recent and earlier immigrants found by Fleury, especially since the poverty rates among recent immigrants are much higher than those for earlier immigrants shown in figure 4. There are a number of questions raised by the Fleury study. Are the lower rates of use by more recent immigrants due to their relative lack of information about the availability of housing subsidies? Where do immigrants live during the early years after arrival? Do they mainly live with other immigrants in over-crowded housing owned by other immigrants? If so, what is the implication for the per capita real estate taxes by the average immigrant?
In sum, the preceding analysis leads us to the conclusion that there is no need for any adjustment to our estimates of the amount of government services consumed by recent immigrants in the 1987-2004 cohort relative to that consumed by Canadians. Therefore in table 6 below we use the pre-viously employed 110 percent figure to estimate the dollar value of housing expenditures absorbed by recent immigrants.
0
5
10
15
20
25
30
35
30 +20+19 18171615 14131211 10 98765432Can.born Number of years since immigration
Perc
ent
Figure 4: Percentage of immigrants below LICO, 2005 Census
Source: Statistics Canada, Earnings and Income over the Past Quarter Century, 2006 Census, Catalogue 97-563 X.
Figure 4: Percentage of immigrants below LICO, 2005 Census

Fiscal Transfers to Immigrants in Canada: Responding to Critics and a Revised Estimate / 15
www.fraserinstitute.org / Fraser Institute
4 Using a different base for comparison
The PUMF data base allows Canadians to be put into five different groups:6
(1) All Canadians = (2)+(3)+(4)(2) Recent Immigrants (arrived during the period 1987-2004)(3) Persons born in Canada(4) Non-recent immigrants (arrived before 1987)(5) All other Canadians minus recent immigrants = (1) minus (2)
In our study we expressed the incomes and tax payments of group (2), containing 64,792 records, as a percentage of the incomes and tax pay-ments of group (1), which contains 692,509 records.7 J&P pointed out that we should have used group (3), not group (1), for comparison. They are right that we did not use the correct group, but, given that our focus is on recent immigrants, the correct group is actually (5), not (3) , which includes 627,458 records. We were aware of this in preparing our study, but we did not make this calculation since we judged that it would have complicated the analysis and exposition. However, in response to the criticism by J&P we accept that we did not use exactly the right group for comparison and now use group (5), which in our view is most appropriate, as the base for comparison with group (2) in table 5.8
As table 6 and other calculations below show, this adjustment raises the estimated gap between taxes paid by recent immigrants and the rest from $5,486 to $5,739, or $253. As a result, our estimated total fiscal burden per immigrant is increased by this same amount.
6 There is also a small non-permanent resident category which for the purposes of simpli-city is included with non-recent immigrants.
7 This is smaller than the total number in the PUMF database because it excludes those for whom income and income tax data was not available or not applicable, which is applied to all persons less than 15 years of age.
8 While this somewhat complicates the calculations, it has the advantage of dividing all resident Canadians into two groups and thus can be used to similarly allocate all taxes and expenditures between the two groups.

16 / Fiscal Transfers to Immigrants in Canada: Responding to Critics and a Revised Estimate
Fraser Institute / www.fraserinstitute.org
5 Revised estimates
The next three tables present our revised estimates of the basic data on incomes and income taxes paid (table 5), the distribution of taxes paid (table 6), and government spending (table 7). The differences between our original and the new estimates are discussed above in some detail.
Table 6 shows data that provide the main basis for our findings that recent immigrants impose a substantial fiscal burden on all Canadians. The last column indicates key estimates of the differences in the amount of taxes paid by all Canadians (minus recent immigrants) and the taxes paid by recent immigrants for the different types of taxes collected by all Canadian governments.
Table 7 shows the benefits received by recent immigrants through expenditures by all levels of government.
The bottom line of our original and revised estimates is found in the calculation of the fiscal transfer imposed by the average recent immigrant, using the formula:
FT = (To – Ti) + (Gi – Go)
Where FT is the average per capita fiscal transfer, T is the average per capita taxes paid,G is the average per capita benefit received through program spendingSubscript o denotes “other Canadians” Subscript i denotes recent immigrants
In our original study the numbers were:
FT = ($16,501 – $10,340) + ($15,797 – $15,907) = $6,161 - $110 = $6,051
Based on the new numbers:
FT = ($17,372 - $11,299) + ($16,138 - $15,882) = $6,073 + $256 = $6,329
As can be seen, the annual fiscal burden imposed by the average recent immigrant on the taxpayers of Canada in our new estimate is $6,329, or $278 more than we had estimated it to be in our original study. This increase is largely due to the use of information on higher enrolment of immigrant chil-dren in educational institutions supplied by J&P and by the use of the more

Fiscal Transfers to Immigrants in Canada: Responding to Critics and a Revised Estimate / 17
www.fraserinstitute.org / Fraser Institute
appropriate population base (excluding recent immigrants arriving between 1987 and 2004) with which recent immigrants are compared.
The figure of $6,329 average annual per capita fiscal transfer from other Canadians to recent immigrants can be put into some perspectives that should enter into any public discussions and government decisions about changes to existing immigration policies.
First, if the average immigrant pays taxes and receives benefits for 45 years between his or her arrival and end of life, every recent immigrant bene-fits from transfers worth $284,805, disregarding all effects of discounting and inflation.
Second, during the 18-year period from 1987 to 2004, a total of 3.9 mil-lion immigrants arrived in Canada. In 2006 they would have imposed a cost of $24.7 billion if none of the immigrants had emigrated, died, or returned to their native countries. However, because of these factors, of those 3.9 mil-lion immigrants only 2.7 million still remained in Canada. The annual fiscal subsidies to these remaining immigrants in 2006 were $17 billion.
Between 2005 and 2010 approximately another 1.5 million immigrants arrived in Canada. Assuming that their numbers were not changed by mor-tality and other factors and that their economic record is the same as that of the 1987-2004 cohort, in the year 2011, they will have added another $9.5 billion to the $17 billion noted above, for a total of $26 billion.
In sum, our new estimates that were made in response to criticisms made by J&P are virtually the same as those made in our first study. They thus confirm the validity of our most basic findings: Canada’s immigrant selec-tion policies result in the imposition of a significant fiscal burden on taxpayers, including past immigrants, which will continue to grow, reduce living stan-dards, and hamper economic growth unless the existing policies are changed.
Our original study presents the principle on which such changes should be based: Remove the creation and administration of admissions criteria from the responsibility of politicians and civil servants and shift them to the private sector. That sector should be able to select immigrants productive enough to earn the minimum salary set by government with the goal of having them pay for the government services they consume. The considerations found in our original study suggest that it should be possible to work out such a policy without encountering any serious or fundamental problems, though the details of such a new policy will have to be developed in consultations among governments, the general public who pay taxes, and stakeholders.

18 / Fiscal Transfers to Immigrants in Canada: Responding to Critics and a Revised Estimate
Fraser Institute / www.fraserinstitute.org
(1) Immigrants 1987-2004
(5) All Canadians minus recent immigrants
(1)/(5)
$25,396
$36,288
70.0%
Average income
Table 5: Income and taxes paid by recent immigrants and non-recent immigrants including native born Canadians in 2005
Source: Calculations by authors for recent immigrants and non-recent immigrants done from Census 2006 PUMF (Statistics Canada, 2009). Total income is provided by the variable “totinc” in the �le, and income tax by the variable “inctax”, both of which are averaged across individuals to calculate averages. All recent immigrants and Canadians reporting income or income tax were included in the sample.
Average employment
income
Average income tax paid
Number of ob-servations in
sample
64,792
627,458
$3,438
$6,319
54.4%
$21,267
$26,890
79.1%
Personal income taxes
Health & social insurance levies
General sales taxes
Corporate taxes
Property & related taxes
Other taxes and revenues
Total
173,435
84,193
69,461
56,293
46,081
101,142
530,605
(2)$ millionsType of tax
Table 6: Taxes paid by Canadian and recent immigrants, all levels of government, 2005/06
Note: The total taxes paid include those paid by recent immigrants. The dollars per capita �gures paid all Canadians minus recent immigrants were calcu-lated taking into account the ratio of taxes paid by recent immigrants so that the sum of the dollars paid by the two groups weighted by their share of the population equals the total taxes paid. Personal income taxes include taxes on payments to non-residents. Health & social insurance levies include payroll taxes. Corporate taxes include capital taxes, and natural resource licenses and fees. Property and related taxes exclude capital taxes. Other taxes and revenues include all other revenues except for the sales of goods and services, which amounted to $42,966. The total consolidated government rev-enues reported by Statistics Canada including the sales of goods and services totals $573,571 million in the 2006 �scal year. Per capita components may not add to the totals because of separate rounding.
(3)Percentage
of total revenue
(4)Dollars per
capita for all Canadians
(4a)Dollars per
capita for all Canadians
minus recent immigrants
(5)Tax paid by
recent immigrants as
% of all Canadians
minus recent immigrants
34.7
16.8
13.1
11.1
9.9
14.4
100
5,486
2,663
2,197
1,781
1,458
3,199
16,784
5,739
2,633
2,263
1,910
1,501
3,295
17,372
54.4
100
70
30
70
70
N/A
Source: Statistics Canada, 2010; calculations by authors.
(1) (6)Dollars per
capita paid by recent
Immigrants
3,122
2,663
1,584
573
1,051
2,306
11,299
(7)Di�erence in per-capita tax paid: (6) - (4a)
-2,617
0
-679
-1,337
-451
-989
-6,073
Table 6: Taxes paid by Canadian and recent immigrants, all levels of government, 2005/2006
Table 5: Income and taxes paid by recent immigrants and non-recent immigrants including native born Canadians in 2005

Fiscal Transfers to Immigrants in Canada: Responding to Critics and a Revised Estimate / 19
www.fraserinstitute.org / Fraser Institute
Table 7: Bene�ts received by Canadians and recent immigrants, all levels of government, 2005/06
General government services
Protection of persons and property
Health
Social Sevices
Education
Elementary and secondary education
Postsecondary education
Special retaining services
Other education
Recreation and culture
Labour, employment, and immigration
Housing
Regional planning and development
Transportation and communication
Resource conservation and industrial development
Environment
Foreign a�airs and international assistance
Research establishments
Other expenditures
Total
(2)Total
expenditure ($ millions)
(3)Per-capita bene�ts
received by all Canadians
(3a)Dollars per
capita for all Canadians
minus recent immigrants
(4)Bene�ts
received by recent immi-
grants as % of (3a)
(5)Per-capita bene�ts
received by recent immi-
grants ($)
(6)Di�erence in
per capita bene�ts (5) - (3a)
20, 074 635 635 635100 0
43,299
99,531
164,568
47,134
32,887
3,598
1,140
14,268
2,480
4,527
2,235
24,838
19,760
13,158
5,585
1,859
1,738
502,680
1,370
3,150
5,208
1,491
1,041
114
36
452
78
143
71
786
625
416
177
59
55
15,907
1,411
3,150
5,208
1,472
997
114
36
452
77
144
71
786
625
416
177
59
55
15,882
70
100
100
113
146
100
100
100
120
110
100
100
100
100
100
100
100
988
3,150
5,208
1,663
1,456
114
36
452
92
158
71
786
625
416
177
59
55
16,138
Note: Spending categories for which the immigrants are estimated to receive lower or higher bene�ts are shown (e.g., Protection of persons and property). Per capita components may not add to the totals because of separate rounding.
Source: Statistics Canada, 2010; calculations by authors.
(1)Category of
Bene�t
-423
0
0
191
459
0
0
0
15
14
0
0
0
0
0
0
0
256
Table 7: Benefits received by Canadian and recent immigrants, all levels of government, 2005/2006
20 / Fiscal Transfers to Immigrants in Canada: Responding to Critics and a Revised Estimate
Fraser Institute / www.fraserinstitute.org
6 Other disagreements on the influence of immigrants on Canada
J&P include in their criticism a number of issues that in our experience are raised frequently by advocates of immigration and supporters of the current immigrant selection process. The following presents our reasons for disput-ing the merit of several types of allegations they made about the costs caused, and contributions made, of immigrants to the Canadian economy and the well-being of all Canadians.
J&P obtained their unrealistically low estimate of $450 for the total fiscal transfer by arguing that government spending on what is called “pure public goods” should not be considered a benefit received by immigrants for which they should be expected to pay. Using this argument they lower their estimate of the fiscal burden by $1,692, a very large sum which is not reflected in our calculations above. Since it involves an aspect of government spend-ing that was not specifically addressed in our original study as it was not considered relevant, it was not included in the preceding section, where the focus was on other more concrete and reconcilable differences in estimates that appear in government spending and taxation statistics.
Because of the quantitative significance of the public goods adjust-ment made by J&P, however, it is useful to discuss the different views on the nature of public goods held by J&P and ourselves. According to basic eco-nomic theory, pure public goods involve spending that creates benefits, which accrue to the population as a whole. The most commonly cited example is spending on defence. According to the theory used by J&P, immigrants do not cause defence spending to rise and it is therefore not appropriate to con-sider any part of the cost of defence to be a benefit received by immigrants.
There are very few other examples of pure public goods spending, the most important of which is from basic research in natural and health sciences the results of which, by their very nature, cannot be patented. The benefits to Canadians—and the entire world—are not diminished by the arrival of immi-grants. J&P cite studies by other economists, which argue that about 5 to 15 percent of all government spending is on such alleged pure public goods. In their calculation they assumed that 10 percent of government spending is on pure public goods, even though the Canadian study they cited provided an estimate of only 4.4 percent (Akbari, 1989).
We disagree with the position taken by J&P on the nature of pure public goods for the analytical purposes at hand. While it is true that in the short run spending on pure public goods, like defence, is not increased by

Fiscal Transfers to Immigrants in Canada: Responding to Critics and a Revised Estimate / 21
www.fraserinstitute.org / Fraser Institute
population increases; in the longer run, like the period considered, spending on such pure public goods is a function of the size of Canada’s population and national income.
To illustrate our view on the nature of pure public goods in the longer run, we consider it inconceivable that if Canada’s national income and popu-lation were half of what they are today, the absolute level of military spending would be the same. We postulate that it would more likely be half of what it is today.
In support of this proposition we note that NATO, at the insistence of the United States, has been measuring the contribution of allies to the com-mon defence in relation to GDP or in per capita terms, instead of setting targets for absolute levels (Congressional Budget Office, 2001). In national public and political discussions of current and past defence spending, refer-ence always is to percentages of national income or total government program spending. Spending on other pure public goods like research and develop-ment and some health policies is also subject to similar considerations, espe-cially when international organizations discuss the appropriate amount of spending by individual nations.
We also note that there is much government spending that does not involve pure public goods but that has important public goods aspects, such as spending on health, education, and even public protection. The costs to Canadians resulting from such spending are increased because immigrants impose above-normal costs.
This effect arises, for example, from the need facing teachers and school boards to spend more per immigrant student to meet their needs for language training and help with acculturation; from the need facing law enforcement agents to deal with ethnic gangs in some urban centres; and from the need facing health care providers to deal with immigrants that have had little mod-ern health care in their native countries.
We do not adjust our estimates of the fiscal burden of immigrants to account for these costs of immigrants because they are impossible to meas-ure even approximately, but merely mention them here to suggest that they should be considered as an offset to the reduction in the costs of spending on pure public goods that is suggested by J&P and that may exist in the short run.
In support of the preceding analysis we note that the economic theory literature on pure public goods is very similar to that on the existence of zero marginal cost found in many industries such as transportation and enter-tainment. When a theatre is not sold out or a bus is not full, admitting more users is virtually without additional costs. Given the fundamental economic theorem that welfare is maximized if the prices in an economy are equal to the marginal cost of production, customers should be admitted without a charge. Of course, this policy is not in effect for theatres and buses for the
22 / Fiscal Transfers to Immigrants in Canada: Responding to Critics and a Revised Estimate
Fraser Institute / www.fraserinstitute.org
practical reason that few people would buy tickets knowing that they could use the service at no cost once the show starts or the bus leaves.
Labour market discriminationAccording to J&P, existing evidence suggests that recent immigrants are more productive and would earn higher incomes if Canadian employers did not discriminate in their hiring and compensation policies and if they prop-erly recognized the value of educational attainment from varying countries. Therefore, if these societal obstacles to the economic success of recent immi-grants were removed, the fiscal burden would be reduced or eliminated. J&P conclude that “Policy proposals to reduce the immigration level...are in fact ignoring the problem (of discrimination and underutilization) rather than trying to solve it” (2011: 34).
We are, of course, all in favour of policies that improve the productiv-ity and pay of recent immigrants, but with some qualifications.
J&P are clearly optimistic that recent immigrants are not really less pro-ductive than other Canadians but that their poor economic records are due to the discrimination and ignorance of Canadian employers. They argue that immigrant earnings could be raised by a simple and cheap campaign to edu-cate employers rather than costly investments in language and skills training.
In support of the role played by the discrimination and ignorance on part of Canadian employers, J&P provide the results of a study which dis-tributed 6,000 fake, identical resumes to potential employers. It found that those with English sounding names had a 40 percent higher callback rate than those with Chinese, Indian, or Pakistani names, which in J&P’s view proves the existence of discrimination and ignorance among Canadian employers.
However, there is also another, more likely explanation of the main result of this study, which they fail to entertain. It is that many Canadian employers have experience hiring people from different ethnic backgrounds, which showed that recent immigrants with Chinese, Indian, and Pakistani names on average have poorer language (or other) skills that hamper their productivity. That these language deficiencies are beyond dispute is evidenced by the existence of substantial and costly government programs designed to relieve them.
Until such deficiencies are eliminated—and that is a never-ending job under present immigrant selection policies which brings in large numbers of new immigrants every year suffering from the same handicaps—it is easy to understand why potential employers avoid the cost of interviewing job applicants that are likely to have language deficiencies and go for applicants that do not. These labour market practices involve rational decision mak-ing, not discrimination based on socially repulsive motives. This interpreta-tion of the results of the study using fake resumes also implies that the lower

Fiscal Transfers to Immigrants in Canada: Responding to Critics and a Revised Estimate / 23
www.fraserinstitute.org / Fraser Institute
productivity of recent immigrants cannot be eliminated simply by getting rid of discrimination and ignorance among employers.
Similar conditions exist with respect to the quality of educational achievements of recent immigrants from these countries. At a recent Vancouver meeting, Jason Kenney, Canada’s Minister of Immigration, noted that his staff is reviewing the merit of the existing points system used for the selection of immigrants. One aspect of the present policy that he identified as an issue of special concern is that the same number of points is given to an applicant who has a university degree from Harvard as to one who has a degree from a small, obscure university in a developing country.9
These considerations imply that employer reluctance to hire graduates with first and professional degrees from universities in developing countries may be motivated more by rational considerations rather than by discrimina-tion based on ethnicity. This conclusion is qualified because professional asso-ciations have the power given to them by governments to raise the incomes of their members by setting standards so high that the supply of accredited practitioners is reduced.
It is difficult to know the extent to which the exclusion of professionals with foreign training in today’s Canada is responsible for the small number of immigrants admitted to the professions. After all, in recent times the scarcity of many professionals, especially in the field of medicine, has created public pressures to modify admissions criteria. At any rate, the appropriateness of current professional standards will undoubtedly be examined in the context of the government’s announced efforts to evaluate objectively the quality of professional training provided by many foreign institutions of higher learn-ing in developing countries.
We support this effort if it does not cost too much and is effective. But we also stress that the need for it would be diminished greatly if the govern-ment were to adopt our proposed reforms to the existing immigrant selec-tion policies, which would make it in the interest of the potential employer to evaluate properly the competence and economic prospect of candidates applying for immigration visas.
But if J&P are instead proposing an expansion of employment equity programs, we are adamantly opposed. It makes no sense to us to bring people
9 Grubel, in 1976, taught finance to undergraduates for a year at the University of Nairobi under an international assistance program financed by the Canadian International Development Agency. His experience shows clearly that the competence of the average undergraduate of the University of Nairobi was much lower than the average under-graduate from Yale, Stanford, the University of Chicago, the University of Pennsylvania, or Simon Fraser University, where he also taught. Chances are that this difference has not changed much since 1976.

24 / Fiscal Transfers to Immigrants in Canada: Responding to Critics and a Revised Estimate
Fraser Institute / www.fraserinstitute.org
into the country and to give them preferences in hiring over other Canadians who have the same or superior qualifications for the job, but are rejected because they do not qualify for preferential treatment under employment equity legislation. We believe that revamping the immigrant selection process to avoid the need for affirmative action in the future is a superior alterna-tive to its use. Affirmative action programs only stoke the resentment of the broader community, which does not like to see new immigrants getting pre-ferment over other Canadians, and will lead to an undesired backlash against immigrants.
Economies of scale in labour marketsJ&P cite a number of theoretical studies which show that, in principle, the hiring of immigrant workers results in higher productivity and living stan-dards through increased specialization of production and the variety of out-put. In the economics literature, such benefits are considered to arise from economies of scale (the more of a good is produced, the lower the cost of production) and economies of scope (the larger a market for a good, the more variety of it can be produced at low cost).
We disagree that immigrants are needed to reap the benefits from economies of scale and scope because, in today’s world of free trade and low costs of transportation and communication, these benefits are already available to Canadian producers through exports and to consumers through imports. The high incomes of countries like Switzerland and Germany are associated with high levels of trade relative to national income while immi-gration has been small relative to the size of their population.
J&P also refer to literature that suggests that lower wages of immigrants result in lower prices for consumers. Again, these benefits are questionable in a world of free trade, where prices for consumer goods are determined abroad and established in Canada through trade. The prices of non-traded services are ultimately related to those of traded goods through the cost of labour used in both industries.
J&P also raise the argument that highly-skilled immigrants increase the productivity of unskilled Canadian-born workers by providing proper supervision and management. The magnitude of any such benefits is open to question, given the low quality of many of the allegedly highly-skilled immi-grants referred to above and the large number of immigrants with low skills that need supervision. Moreover, there is no doubt that in the absence of immigration the excellent system of higher education in Canada is capable of producing all the skilled workers needed for the proper supervision and management of Canadian-born workers with low skills.
J&P also note studies that found increased bilateral trade between Canada and countries from which immigrants have come. However, we doubt that this effect can possibly be large for exports, given that over three-quarters

Fiscal Transfers to Immigrants in Canada: Responding to Critics and a Revised Estimate / 25
www.fraserinstitute.org / Fraser Institute
of Canada’s exports went to the United States over the period in question and natural resources provided the bulk of non-US exports. It is difficult to envision that the efforts of immigrants from China and India do much, if anything, to increase the sale in these countries of Canadian lumber, cop-per, oil and gas, and even the Canadian manufactured machinery used in these industries. It is thus not surprising that the two main studies available confirm this view, finding that the increase in trade resulting from immigra-tion was not only very small but consisted mainly of an increase in imports of consumer items from the newcomers’ countries of origin and therefore had a negative effect on our balance of trade (Head and Reis, 1998; Partridge and Furtan, 2008).
At the same time, J&P fail to mention a significant negative economic effect that arises from the continued relationships between immigrants in Canada and their families in their home countries. These immigrants regu-larly send abroad large remittances that cause downward pressures on the exchange rate and make imports more expensive for consumers in Canada.
Generational benefitsJ&P argue that our estimate of the fiscal burden imposed by recent immi-grants neglects the fact that their offspring will not only repay some or all of the costs imposed on the current generation of Canadians but also could provide net benefits for the current and future generations combined. They cite sophisticated theoretical studies, the latest of which concludes that the overall fiscal impact of immigration is unclear and depends on the amount of pure public goods in government spending.
We have already expressed above our skepticism about the existence and quantitative significance of pure public goods in the longer run. We are also skeptical about the ability of largely unverified theoretical models to provide reliable information about the real world. After all, the conclusions from theoretical models are determined by assumptions, which in turn can be chosen to produce any conclusions desired by the analyst.
For these reasons, we introduce here empirical information that sheds light on the actual economic performance of second-generation immigrants who are the children of immigrants who were born in Canada.10
Table 8 shows the average earnings in the year 2005 for second-gener-ation immigrants, broken down by different countries of origin, for men and women, and by different levels of educational attainment.11
10 The children of immigrants who were born abroad are known as being 1.5 generation offspring and are not included in this tabulation.
11 More detailed analysis of the performance of second-generation immigrants providing information on numbers and average employment earnings by age is provided in Grady (2011).

26 / Fiscal Transfers to Immigrants in Canada: Responding to Critics and a Revised Estimate
Fraser Institute / www.fraserinstitute.org
Table 8: Average employment income of immigrants and non-immigrants in 2005 by gender ($)
2nd generation immigrants men
Chinese
South Asian
Black
Filipino
Latin American
Southeast Asian
Arab
West Asian
Korean
Japanese
Visible minority n.i.e.
Multiple visible minority
Total visible minority
Not a visible minority
Total non-immigrant
Vis. Min./Non Imm.
2nd generation immigrants women
Chinese
South Asian
Black
Filipino
Latin American
Southeast Asian
Arab
West Asian
Korean
Japanese
Visible minority n.i.e.
Multiple visible minority
Total visible minority
Not a visible minority
Total non-immigrant
Vis. Min./Non Imm.
Certi�cate or diploma below
Bachelors
University certi�cate or degree
Bachelor’s degree
University certi�cate, diploma or degree
above Bachelors Total
23,867
19,425
20,264
20,360
19,837
13,800
23,475
17,805
19,769
32,002
24,026
19,699
21,080
39,897
36,946
57.1
58,745
49,474
44,365
38,338
36,234
35,984
57,956
38,373
51,959
64,895
58,111
51,838
52,495
82,960
78,673
66.7
51,732
42,604
41,705
36,239
34.678
31,754
58,717
32,701
47,652
55,218
44,438
46,509
46,583
75,970
71,565
65.1
80,165
64,214
52,052
48,726
N/A
48,050
56,442
N/A
63,521
86,730
N/A
65,744
68,542
95,585
92,544
74.1
37,126
27,916
23,808
23,702
21,328
17,207
31,604
23,400
31,893
42,176
28,980
27,299
29,234
49,587
44,076
66.3
18,839
15,244
16,768
17,245
13,417
11,683
15,867
13,111
14,698
21,830
17,431
15,296
16,491
25,814
23,673
69.7
42,623
35,514
35,429
34,489
31,078
32,980
33,225
35,438
33,623
39,647
34,832
35,663
37,687
47.073
45,612
82.6
39,889
32,023
32,680
34,366
28,910
29,350
31,167
34,131
32,072
37,749
32,777
32,609
35,116
43,152
41,690
84.2
51,943
42,870
43,137
35,067
37,573
42,868
38,541
N/A
37,166
44,575
41,363
44,603
44,881
55,120
54,770
81.9
29,009
22,445
21,351
21,845
15,814
15,763
20,488
19,548
24,107
28,146
22,044
21,057
23,354
31,318
28,204
82.8
Source: Grady (2011), using data from Statistics Canada tabulations on website.
Table 8: Average employment income of immigrants and non-immigrants in 2005 by gender ($)

Fiscal Transfers to Immigrants in Canada: Responding to Critics and a Revised Estimate / 27
www.fraserinstitute.org / Fraser Institute
The table shows immigrants who are officially considered to belong to a “visible minority” and those who do not. The latter group are mainly from the United States and Europe, which account for a small and declining share of recent immigrants.
As can be seen in table 8, for the lowest level of education, the average incomes of visible minority second-generation males is 57.1 percent of the average incomes of Canadian-born males. It is 74.1 percent for those with a degree above the bachelor’s. For intermediate levels of education the per-centage figures are in the mid-sixties. The second half of table 8 shows cor-responding figures for females, which across all levels of education are higher than those for males. The incomes of immigrant females with a bachelor’s degree average 84.2 percent of Canadian-born counterparts.
It is interesting to note that across all categories in the table, the incomes of second-generation immigrants that do not belong to a visible minority are well above those of the Canadian-born in each category. We have not examined the good economic performance of non-visible-minority immigrants and look forward to future investigations of the issue.
Noteworthy are also significant differences in the earnings of second-generation immigrants by countries. Those from Japan and China domin-ate in all categories. Research is needed to explain this fact and differences among other countries.
Unfortunately, the data in table 8 on the economic performance of the second-generation offspring of recent immigrants certainly does not provide any grounds for optimism that the offspring of recent immigrants are going to be able to earn enough to compensate current and future generations of Canadians for the fiscal transfers made to their parents by existing Canadians.
Of course, it is still possible that later generations of offspring of recent immigrants will have well above the earnings of the other Canadian-born. But until data are available to shed light on this possibility, an optimistic guess would be that these future generations of descendants of recent immigrants will be fully integrated into the Canadian economy and will have the same average incomes as other Canadians. Around this average will be those who are caught in the poverty trap that accompanies their parents’ low incomes, others will benefit from membership in their ancestors’ cultures that value education, hard work, entrepreneurship and savings, just as is the case with the income distribution of all Canadians.
Labour shortagesOne of the most widely used arguments in support of immigration is the need for workers to fill the jobs Canadians do not want or for which they are not trained. In our paper, we dealt with this alleged need for immigrants and concluded that it is built on shaky assumptions and that meeting it has an

28 / Fiscal Transfers to Immigrants in Canada: Responding to Critics and a Revised Estimate
Fraser Institute / www.fraserinstitute.org
important adverse consequence for Canada’s labour productivity and living standards.
Our analysis can be summarized briefly as follows. In the absence of immigrants filling job vacancies requiring special skills, wages would rise and attract Canadians to fill them. Importantly, these higher wages would induce employers to substitute capital and new technology to save on labour and allow employers to pay the higher wages without a loss of profits. Increased demand for unskilled workers would similarly induce employers to find cap-ital and technologies to make do with the number of workers available. At the same time, the higher wages that the employers would be able to pay would induce more Canadians to join the labour force and thus increase the labour force participation rate.
The main advocates for more immigrants to fill job vacancies are Canadian employers. It is easy to understand their motivation. The immi-grants keep wages down, which raises their profits and allows them to avoid the need to invest in the training of Canadian-born workers and labour sav-ing capital and technology.
There are two things wrong with immigration policies designed to meet the goals of employers. First, the benefits they derive exist only in the short run. As is the case with all government subsidies, competition from within and outside of Canada tends to wipe out all extra profits and can only delay adjustments required to accommodate changing global patterns of compara-tive advantage.
Second, and most importantly, the implicit subsidies to employers occur at a significant cost to society as a whole. Because the subsidies pre-vent the substitution of capital and technology for labour, there are lower productivity increases, which throughout history have been the driving force behind the growth in Canadian living standards.
Finally, it is worth noting that the competition in the labour market from immigrants has some more subtle costs. Jobs taken by immigrants pre-vent young Canadian-born students from entering prestigious, rewarding, and highly paid occupations that play important roles in our society such as doctors, engineers, and professors. The mechanism is straightforward. The availability of an excess supply of foreign professionals means that the gov-ernment is not required to increase the number of places in universities for Canadians wanting to enter these fields. On the other end of the skills spec-trum, immigrants with low skills drive down the earnings of the Canadians they compete with, including many Aboriginal Canadians.
J&P do not criticize the preceding analysis, but focus on the alleged inconsistency with our proposal that immigrants should be admitted only if they have an employment contract from a Canadian employer with pay at a specified minimum rate. They ask “why would Canadian employers have any incentive to offer jobs to foreigners to work in Canada?” (J&P, 2011: 40).

Fiscal Transfers to Immigrants in Canada: Responding to Critics and a Revised Estimate / 29
www.fraserinstitute.org / Fraser Institute
This criticism is unwarranted. Our analysis of the hidden cost of the current immigrant selection process is not designed to stop all immigration, but to avoid the fiscal burden it imposes on all Canadians, which is caused by the poor economic performance of recent immigrants and the characteristics of the welfare state. Under our proposal, immigrants with low skills and pay would be excluded and the labour market adjustments we analyzed would take place in response to the resultant job vacancies. However, workers with sufficient skills and pay would continue to immigrate. There would be no labour market shortages and the market adjustments would not take place.
In our paper, we raised the concern that much of the present and future labour shortages are due to the immigrants who increase the demand for market goods and services and housing, along with the need to build and staff hospitals, schools, and infrastructure like roads and sanitation.
This effect of immigrants on labour shortages may be illustrated by reference to the demand for and supply of physicians. At the present rate of about 250,000 new immigrants every year, in 10 years there will be 2.5 mil-lion new Canadians demanding medical care. Since the average Canadian physician takes care of 470 patients, this demand translates into the need for 5,329 additional physicians, which is added to the many needed to replace those who retire and to care for the increasing health care demands of an aging population.
An important public debate is taking place in Australia about the opti-mum level of future immigration, which has produced a study that is directly relevant to our discussion of the labour shortages created by immigrants. Birrell et al. (2011), the authors of this study, summarized their findings as follows:
The case for higher migration partly rests on estimates of the number of skilled workers that employers require. The most widely quoted source on the scale of this need has been prepared by the government’s workforce advisory body, Skills Australia. It con-cludes that, Australia will need an extra 2.4 million skilled workers by 2015 and an extra 5.2 million by 2025. Such enormous numbers cannot be achieved without very high net migration.
However, these forecasts were determined by the assump-tions that the econometric modellers (Access Economics) were required to work with. These included that net overseas migration would grow from 220,000 in 2010 to 250,000 by 2025 and that Australia’s aggregate GDP would grow at nearly four per cent per annum over the period to 2025...In other words, the...projections are based on a circular argument, grounded on the assumptions fed into the model... (2011:ii)The same circular argument is used to justify future high levels of immi-
gration in Canada: The immigrants needed to fill job vacancies are due to the

30 / Fiscal Transfers to Immigrants in Canada: Responding to Critics and a Revised Estimate
Fraser Institute / www.fraserinstitute.org
demand for labour created by the demand for goods and services and the need for housing and infrastructure projects caused by these same immigrants. While not all prospective labour shortages in Canada are due to projected rates of immigration, the preceding analysis implies that they would be much less if immigration were reduced. Such a reduction would almost certainly take place if our proposal for reform were adopted and resulted in not only reduced fiscal burdens, but also much fewer labour shortages.

Fiscal Transfers to Immigrants in Canada: Responding to Critics and a Revised Estimate / 31
www.fraserinstitute.org / Fraser Institute
7 New immigrant selection criteria for Federal Skilled Workers (FSW)
After our earlier paper was in production, an important study by Begin, Goyette, and Riddell (2010) was presented that sheds light on the potential benefits of replacing the entire current immigrant selection process with the one we had proposed and which puts primary reliance on applicants holding a qualified job offer from a Canadian employer.12 This new paper drew on confidential data from Revenue Canada to estimate the average yearly earn-ings for immigrant cohorts from the years 2000-2006 (see table 9).
The unique feature of this study and table is that it compares the earn-ings of immigrants who had been selected using the criteria of the long used Federal Skilled Worker (FSW) selection system with the earnings of immi-grants selected under the Immigration and Refugee Protection Act (IRPA) of 2002. Because of its interpretation of a court decision, the government was required to admit applicants under the FSW system whose processing had not been completed in 2002, while at the same time, it began to admit applicants who were assessed under the new IRPA system. During the years 2004-2006, there were income data for enough immigrants to make a mean-ingful statistical comparison of average incomes of the two groups possible. These data are highlighted in table 9 and show that the new selection system (IRPA) brought immigrants with considerably higher incomes than the old system (FSW).13
Table 10 shows the weight given to the individual selection criteria used under the two systems. The most important and major changes involved gives more points for general education, language proficiency, and work experience; and reduced or eliminated those given for occupation and specific vocational preparation.
Riddell (2010) summarized changes in the characteristics of the immi-grants selected under the new criteria: 24 percent had either a Master’s degree
12 This paper was presented at a conference in Ottawa, the main findings of which are sum-marized by Nadeau (2011).
13 These results seem to be behind Minister Jason Kenney’s remarks to Peter O’Neil (2011) that “The most recent data I find really exciting indicates a significant turnaround in eco-nomic results for immigrants in the past three years in particular.” However, the “past three years” refers to the period ending in 2006 before the 2008 financial crisis, which had a devastating impact on the labour market performance of recent immigrants as shown in table 1.
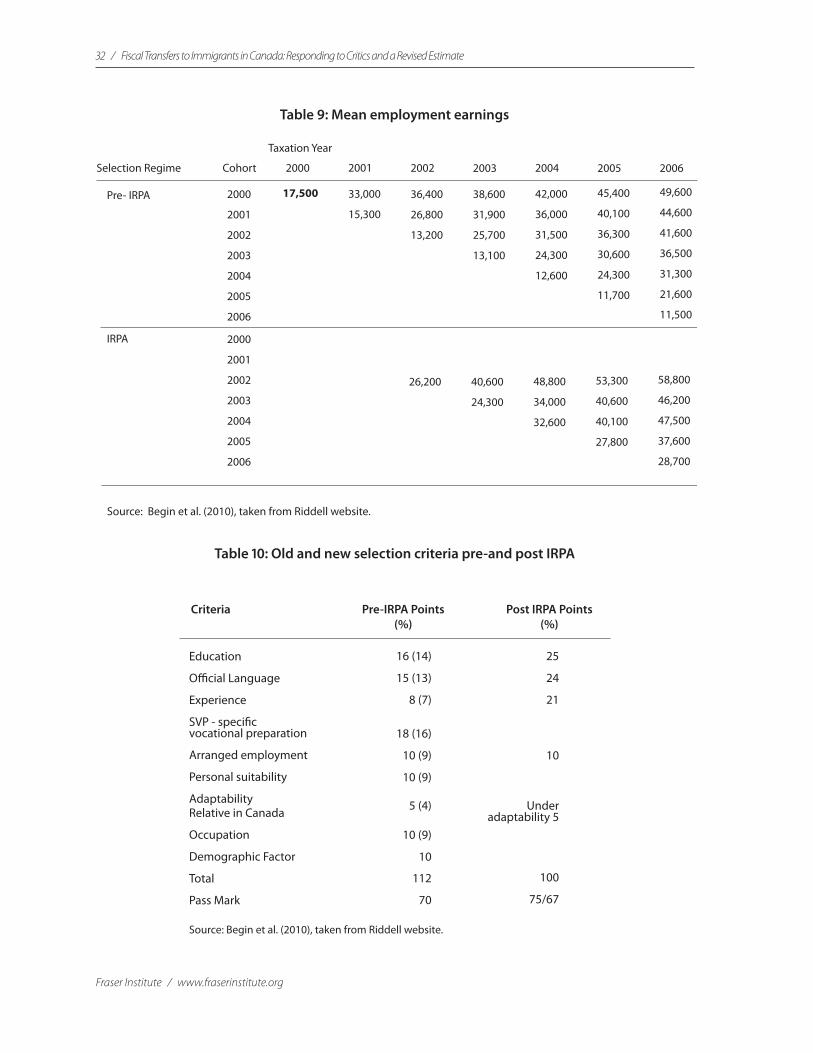
32 / Fiscal Transfers to Immigrants in Canada: Responding to Critics and a Revised Estimate
Fraser Institute / www.fraserinstitute.org
Table 10: Old and New Selection Criteria Pre-and Post IRPA
Criteria Pre-IRPA Points (%)
Post IRPA Points (%)
Education
O�cial Language
Experience
SVP - speci�c vocational preparation
Arranged employment
Personal suitability
AdaptabilityRelative in Canada
Occupation
Demographic Factor
Total
Pass Mark
16 (14)
15 (13)
8 (7)
18 (16)
10 (9)
10 (9)
5 (4)
10 (9)
10
112
70
25
24
21
10
Under adaptability 5
100
75/67
Source: Begin et al. (2010), taken from Riddell website.
Table 9: Mean Employment Earnings
Selection Regime
Pre- IRPA 2000
2001
2002
2003
2004
2005
2006
Cohort 2000 20052004200320022001
IRPA 2000
2001
2002
2003
2004
2005
2006
Taxation Year
2006
17,500 33,000
15,300
36,400
26,800
13,200
38,600
31,900
25,700
13,100
42,000
36,000
31,500
24,300
12,600
45,400
40,100
36,300
30,600
24,300
11,700
49,600
44,600
41,600
36,500
31,300
21,600
11,500
26,200 40,600
24,300
48,800
34,000
32,600
53,300
40,600
40,100
27,800
58,800
46,200
47,500
37,600
28,700
Source: Begin et al. (2010), taken from Riddell website.
Table 9: Mean employment earnings
Table 10: Old and new selection criteria pre-and post IRPA

Fiscal Transfers to Immigrants in Canada: Responding to Critics and a Revised Estimate / 33
www.fraserinstitute.org / Fraser Institute
or a Ph.D. under pre-IRPA, versus 41 percent under IRPA; 24 percent of pre-IRPA arrivals reported not knowing either French or English upon land-ing, versus 4 percent under IRPA; source countries for the top 5 countries accounted for 57 percent pre-IRPA and 40 percent under IRPA—China dropped from 29 percent to 16 percent of the total IRPA flow; top 5 occu-pations accounted for 81 percent pre-IRPA, but are 67 percent under IRPA; professionals in natural and applied sciences dropped from 60 percent pre-IRPA to 29 percent under IRPA, of those from China dropped from 24 per-cent of total pre-IRPA flow to 6 percent under IRPA; 2004 and 2005 arrival cohorts selected under IRPA regime had higher employment rates than those selected under pre-IRPA regime.
Most important for the assessment of our proposal for granting immi-grant visas is the analysis of the earnings of immigrants under the two regimes, where the earnings were adjusted for the province of the immigrants’ resi-dence. The following is a quote from Riddell (2010):
The earnings of IRPA arrivals are most significantly affected by:1. Arranged Employment Offer (AEO): • Increases employment earnings by 74% on the
landing year;• The gap decreases by 9% every subsequent year; 2. Language points: • The effect peaks for those who have obtained between
16-20 points, which correspond to 38% to 39% higher earnings;
3. Previous work experience in Canada:• Increases employment earnings by 27%...
Other factors that positively affect employment earnings: • Age • Education • Work experience • Partner’s education
(Riddell, 2010: slides 33, 34)
These results suggest to us that the current immigrant selection sys-tem could be simplified and made more efficient by relying exclusively on applicants’ holding pre-arranged employment offers, as we had suggested in our original paper. As the data show, language proficiency, work experience, as well as desirable levels of age and education, all contribute to the likely success of immigrants who have not benefitted from arranged employment offers. It is exactly these characteristics, which are used by employers when

34 / Fiscal Transfers to Immigrants in Canada: Responding to Critics and a Revised Estimate
Fraser Institute / www.fraserinstitute.org
offering jobs to applicants and those who possess them would therefore be able to obtain such offers.
In this context it is worth remembering that under our proposal for a system that relies entirely on immigrants’ holding job offers, the immediate family of successful applicants would be admitted simultaneously and would be eligible for finding employment in Canada on their own.
However, even if the selection is greatly improved for FSWs under the new system, it would still not deal with the problem of the poor performance of family class immigrants, mainly parents and grandparents, but also other siblings. Under our proposal, immigrants in this class would no longer be allowed to come to Canada unless they could also meet the new selection cri-teria or their relatives in Canada post a bond with a trustee bank, which would have been used to pay for all expected future medical and economic needs.
The implementation of this policy would not change existing practi-ces fundamentally since the offspring of parents and grandparents living in Canada already have to sponsor them by pledging that they will pay for all the expected future medical and economic needs of their parents and grand-parents. The problem with the existing system is that these pledges are often not met and government enforcement is lax because the offspring often are financially unable to meet their obligation and fines Thus, our proposed policy in principle merely ensures that pledges of financial support are indeed met.
Another recent study that supports the critical contribution that a job offer can make to the success of immigrants in labour markets is MacDonald, Warman, and Worswick (2011). They examine the process of immigrant selec-tion and occupational outcomes of International Medical Graduates (IMGs) in the US and Canada. The main difference in immigrant selection between these two countries is that Canada utilizes a point system and the United States choses IMGs through employer nomination. Their main finding is that “In Canada, IMGs are less likely to be employed as a physician than are IMGs in the US and a large percentage of the IMGs in Canada either find work in lower skill occupations or are not employed.” (MacDonald et al, 2011: i). Concerning this result, they observe that “credential recognition by employers may ensure that the international medical graduate (IMG) who becomes a resident of the US is much more likely to be able to find suitable employment given his/her training [than the one who becomes a resident in Canada].” (MacDonald et al, 2011: 34).
The selection systems used to admit immigrants qualifying as business class immigrants, refugees, and live-in caregivers are not covered by our pro-posal and should be examined as part of a more general overhaul of Canada’s current immigrant selection system and would also need to be tightened.

Fiscal Transfers to Immigrants in Canada: Responding to Critics and a Revised Estimate / 35
www.fraserinstitute.org / Fraser Institute
8 Summary and conclusions
Mohsen Javdani and Krishna Pendakur challenged the findings of our study that the present system for the selection of immigrants in Canada has admit-ted a cohort of immigrants from 1987-2004 that imposed a fiscal burden on other Canadians valued at more than $6,000 per immigrant about $16 billion in 2006 and about $23 billion in 2011.
The challengers estimated that instead the fiscal burden in 2005/6 was only $450 per immigrant, based on the average incomes and tax payments by an immigrant cohort from 1970-2004 and on an unwarranted speculative downward adjustment for public goods. They justified the use of the 1970-2004 cohort by claiming that the smaller cohort used by us underestimates the true earnings of immigrants since the immigrants included were younger and had not reached their full earnings capacity.
This paper reviews the mounting evidence that the recent immigrants in the 1987-2004 cohort had a significantly lower degree of economic success than did immigrants who had arrived before, mainly because their numbers were substantially larger and invariant to economic cycles and they had been selected by applying more aggressively several important new selection poli-cies that had been adopted in the preceding decade.
The paper also presents newly available evidence showing that the income gap between recent immigrants and Canadians has been increasing in comparisons of the two groups with the same gender, education, work experience, and, importantly, age. In other words, the lower incomes and tax payments of recent immigrants relative to those of Canadians are likely to exist over all stages of their lives, which invalidates the criticism of our estimates made by J&P.
After taking the opportunity to correct some minor errors in our ori-ginal study and using a different base for the comparison of the incomes of other Canadians and immigrants, our revised estimate of the fiscal burden is virtually unchanged from that found in the original paper that was criti-cized by J&P.
Javdani and Pendakur presented some additional theoretical and empirical arguments that resulted in the lower estimate of the fiscal burden they presented which claimed that the burden was reduced by the existence of non-measurable benefits brought by immigrants. The present paper ana-lyzed these arguments carefully and found them wanting.
In particular, it rejected the argument that taxes paid by immigrants lowered the cost of pure public goods for other Canadians without reducing the benefits they provide. This benefit exists only in the short run, as for
36 / Fiscal Transfers to Immigrants in Canada: Responding to Critics and a Revised Estimate
Fraser Institute / www.fraserinstitute.org
example, spending on defence in the longer run is mainly a function of national income that is determined in part by immigration. In addition, the large numbers of immigrants in recent years have increased the cost of deliv-ery of health care, education, and welfare for other Canadians through crowd-ing and special needs, which is not reflected in our estimates of the fiscal burden imposed by recent immigrants and is entirely ignored by J&P.
The paper also introduces new data from Statistics Canada that shows that second-generation immigrants, the children of immigrants in Canada, on average have lower incomes than other Canadians for every level of educa-tion. This casts serious doubt on the conjecture by J&P that the fiscal burdens imposed by the current generation of immigrants will be repaid by their offspring.
The paper concludes with the presentation of new evidence suggesting that Federal Skilled Worker immigrants who were admitted on the basis of pre-arranged employment offers had much higher incomes than comparable immigrants admitted under previously existing criteria. This evidence implies that our reform proposals for the exclusive use of such job offers would result in a significant decrease, if not elimination, of the fiscal burden that exists under the present selection system.

37 / Fiscal Transfers to Immigrants in Canada: Responding to Critics and a Revised Estimate
Fraser Institute / www.fraserinstitute.org
References
Akbari, Ather H. (1989). The Benefits of Immigration to Canada: Evidence on Tax and Public Services. Canadian Public Policy, 15, 4: 424-435.
Birrell, Bob, Ernest Healy, Katharine Betts, and Fred T. Smith (2011).Immigration and the Resources Boom Mark 2. Centre for Population and Urban Research, Monash University.
Canada, Citizenship and Immigration Canada (2011). Preliminary tables – Permanent and temporary residents, 2010 Canada - Permanent residents by category, 2006-2010. Citizenship and Immigration Canada. <http://www.cic.gc.ca/english/resources/statistics/facts2010-preliminary/01.asp>, as of January 11, 2012.
Fleury, Dominique (2007). A Study of Poverty and Working poverty among Recent Immigrants to Canada. Human Resources and Social Development Canada.
Grady, Patrick (2010). Recent Immigrants Have Experienced Larger Increases in Unemployment Due to the Recession. Global Economics Limited. <www.global-economics.ca/immigration_rnu2.htm>, as of January 11, 2011.
Grady, Patrick (2011). How are the Children of Visible Minority Immigrants Doing in the Canadian Labour Market? Global Economics Limited. <www.global-economics.ca/immigration_2nd_generation.pdf >, as of January 11, 2011.
Grubel, Herbert, and Patrick Grady (2011). Immigration and the Welfare State 2011. Fraser Institute Studies in Immigration and Refugee Policy.
Head, Keith, and John Ries (1998). Immigration and Trade Creation: Econometric Evidence from Canada. Canadian Journal of Economics, 31(1): 47-62.
Jackson, Andrew (2011). Recent Immigrants and the Crisis. Blog (October 17). Canadian Centre for Policy Alternatives. <http://www.behindthenumbers.ca/2011/10/17/recent-immigrants-and-the-crisis/>, as of January 11, 2012.
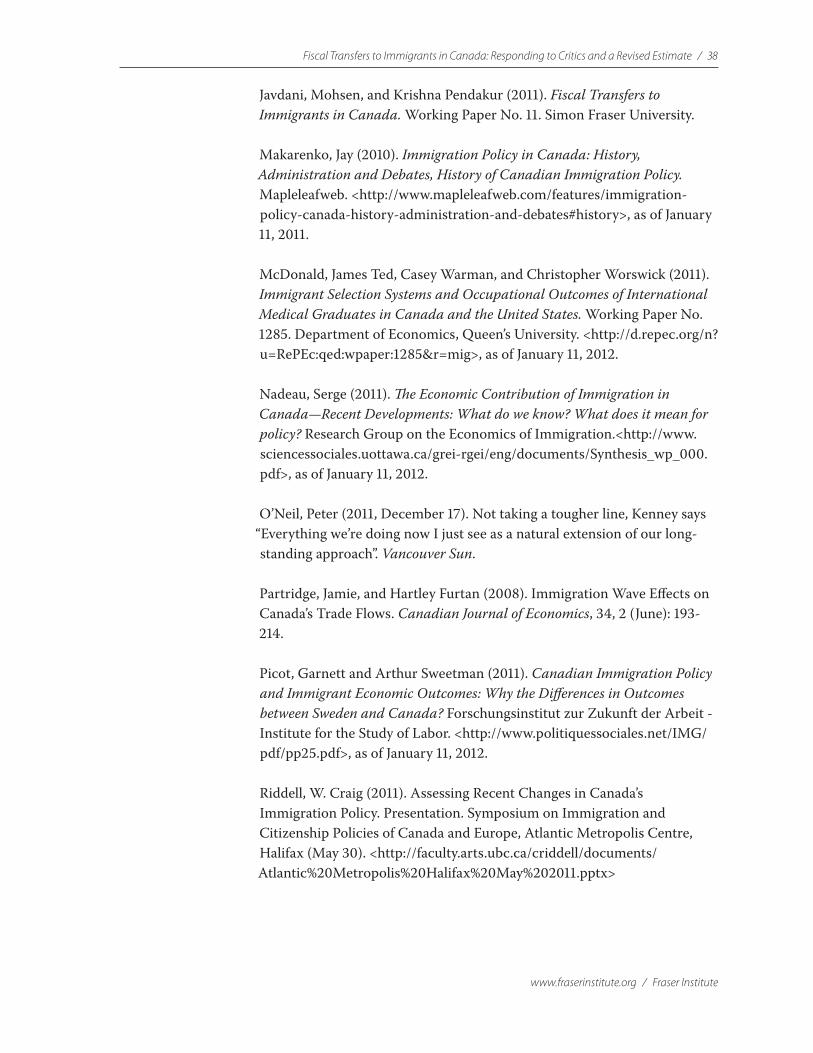
Fiscal Transfers to Immigrants in Canada: Responding to Critics and a Revised Estimate / 38
www.fraserinstitute.org / Fraser Institute
Javdani, Mohsen, and Krishna Pendakur (2011). Fiscal Transfers to Immigrants in Canada. Working Paper No. 11. Simon Fraser University.
Makarenko, Jay (2010). Immigration Policy in Canada: History, Administration and Debates, History of Canadian Immigration Policy. Mapleleafweb. <http://www.mapleleafweb.com/features/immigration-policy-canada-history-administration-and-debates#history>, as of January 11, 2011.
McDonald, James Ted, Casey Warman, and Christopher Worswick (2011). Immigrant Selection Systems and Occupational Outcomes of International Medical Graduates in Canada and the United States. Working Paper No. 1285. Department of Economics, Queen’s University. <http://d.repec.org/n?u=RePEc:qed:wpaper:1285&r=mig>, as of January 11, 2012.
Nadeau, Serge (2011). The Economic Contribution of Immigration in Canada—Recent Developments: What do we know? What does it mean for policy? Research Group on the Economics of Immigration.<http://www.sciencessociales.uottawa.ca/grei-rgei/eng/documents/Synthesis_wp_000.pdf>, as of January 11, 2012.
O’Neil, Peter (2011, December 17). Not taking a tougher line, Kenney says “Everything we’re doing now I just see as a natural extension of our long-standing approach”. Vancouver Sun.
Partridge, Jamie, and Hartley Furtan (2008). Immigration Wave Effects on Canada’s Trade Flows. Canadian Journal of Economics, 34, 2 (June): 193-214.
Picot, Garnett and Arthur Sweetman (2011). Canadian Immigration Policy and Immigrant Economic Outcomes: Why the Differences in Outcomes between Sweden and Canada? Forschungsinstitut zur Zukunft der Arbeit - Institute for the Study of Labor. <http://www.politiquessociales.net/IMG/pdf/pp25.pdf>, as of January 11, 2012.
Riddell, W. Craig (2011). Assessing Recent Changes in Canada’s Immigration Policy. Presentation. Symposium on Immigration and Citizenship Policies of Canada and Europe, Atlantic Metropolis Centre, Halifax (May 30). <http://faculty.arts.ubc.ca/criddell/documents/Atlantic%20Metropolis%20Halifax%20May%202011.pptx>
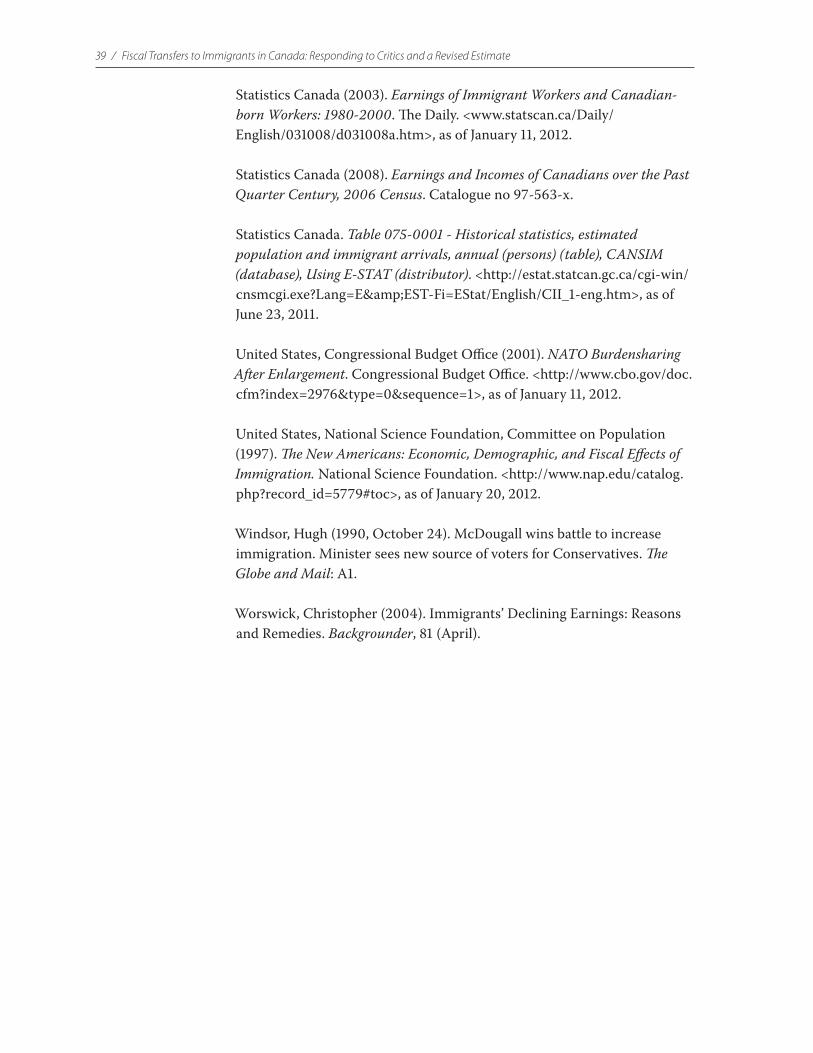
Statistics Canada (2003). Earnings of Immigrant Workers and Canadian-born Workers: 1980-2000. The Daily. <www.statscan.ca/Daily/English/031008/d031008a.htm>, as of January 11, 2012.
Statistics Canada (2008). Earnings and Incomes of Canadians over the Past Quarter Century, 2006 Census. Catalogue no 97-563-x.
Statistics Canada. Table 075-0001 - Historical statistics, estimated population and immigrant arrivals, annual (persons) (table), CANSIM (database), Using E-STAT (distributor). <http://estat.statcan.gc.ca/cgi-win/cnsmcgi.exe?Lang=E&EST-Fi=EStat/English/CII_1-eng.htm>, as of June 23, 2011.
United States, Congressional Budget Office (2001). NATO Burdensharing After Enlargement. Congressional Budget Office. <http://www.cbo.gov/doc.cfm?index=2976&type=0&sequence=1>, as of January 11, 2012.
United States, National Science Foundation, Committee on Population (1997). The New Americans: Economic, Demographic, and Fiscal Effects of Immigration. National Science Foundation. <http://www.nap.edu/catalog.php?record_id=5779#toc>, as of January 20, 2012.
Windsor, Hugh (1990, October 24). McDougall wins battle to increase immigration. Minister sees new source of voters for Conservatives. The Globe and Mail: A1.
Worswick, Christopher (2004). Immigrants’ Declining Earnings: Reasons and Remedies. Backgrounder, 81 (April).
39 / Fiscal Transfers to Immigrants in Canada: Responding to Critics and a Revised Estimate

www.fraserinstitute.org / Fraser Institute
About the author
Patrick GradyPatrick Grady is an economist who used to work in the Department of Finance and Bank of Canada. He has a Ph.D. in economics from the University of Toronto and has written many articles and five books on economic and fiscal issues, including The Economic Consequences of Quebec Sovereignty published by the Fraser Institute. As a consultant with Global Economics Ltd. <www.global-economics.ca>, he has worked for governments across Canada and in 35 countries in Eastern Europe, Asia, Africa, Latin America, and the Caribbean.
Herbert GrubelHerbert Grubel is Professor of Economics (Emeritus) at Simon Fraser University and a Senior Fellow at the Fraser Institute. He acts as a trustee for two mutual funds operated by Saturna Capital of Bellingham, Washington. He was born in Germany in 1934 and has a B.A. from Rutgers University (1958) and a Ph.D. in economics from Yale University (1963). Professor Grubel has taught full-time at Yale University, Stanford University, the University of Chicago, and the University of Pennsylvania, and has had temporary appoint-ments at universities in Berlin, Singapore, Cape Town, Nairobi, Oxford, Canberra, and Bologna. He also was a Reform Party Member of Parliament in Ottawa from 1993 to 1997, serving as the Finance Critic from 1995 to 1997.
Professor Grubel has published 18 books and 190 professional articles in economics, dealing with international trade and finance and a wide range of economic policy issues. His recent research interests include capital gains taxation, monetary union, and immigration policy. His personal website con-taining precise references to his publications is found at <www.sfu.ca/~grubel>. Acknowledgments
We thank Niels Veldhuis and Martin Collacott for their encouragement and useful comments and Emma Tarswell for her editing. The authors take full and complete responsibility for any remaining errors or omissions. As the authors have worked independently, the views expressed in this study do not necessarily reflect the views of the supporters, trustees, or other staff of the Fraser Institute.
Fiscal Transfers to Immigrants in Canada: Responding to Critics and a Revised Estimate / 40

Fraser Institute / www.fraserinstitute.org
Publishing information
DistributionThese publications are available from <http://www.fraserinstitute.org> in Portable Document Format (PDF) and can be read with Adobe Acrobat® 7 or Adobe Reader®, versions 7 or later. Adobe Reader® X, the most recent version, is avail-able free of charge from Adobe Systems Inc. at <http://get.adobe.com/reader/>. Readers who have trouble viewing or printing our PDF files using applications from other manufacturers (e.g., Apple’s Preview) should use Reader® or Acrobat®.
Ordering publicationsFor information about ordering the printed publications of the Fraser Institute, please contact the publications coordinator:
•e-mail: [email protected] •telephone: 604.688.0221 ext. 580 or, toll free, 1.800.665.3558 ext. 580 •fax: 604.688.8539.
MediaFor media enquiries, please contact our Communications Department:
•604.714.4582 •e-mail: [email protected].
CopyrightCopyright © 2012 by the Fraser Institute. All rights reserved. No part of this pub-lication may be reproduced in any manner whatsoever without written permis-sion except in the case of brief passages quoted in critical articles and reviews.
Date of issueMarch 2012
ISSNISSN 1925-4628
CitationGrubel, Herbert, and Patrick Grady (2012). Fiscal Transfers to Immigrants in Canada: Responding to Critics and a Revised Estimate. Studies in Immigration and Refugee Policy. Fraser Institute.
Editing, typesetting, and designEmma Tarswell
Cover designBill Ray
41 / Fiscal Transfers to Immigrants in Canada: Responding to Critics and a Revised Estimate

www.fraserinstitute.org / Fraser Institute
Supporting the Fraser Institute
To learn how to support the Fraser Institute, please contact
•Development Department, Fraser Institute Fourth Floor, 1770 Burrard Street Vancouver, British Columbia, V6J 3G7 Canada
•telephone, toll-free: 1.800.665.3558 ext. 586
•e-mail: [email protected]
Lifetime patrons
For their long-standing and valuable support contributing to the success of the Fraser Institute, the following people have been recognized and inducted as Lifetime Patrons of the Fraser Institute.
Sonja Bata
Charles Barlow
Ev Berg
Art Grunder
Jim Chaplin
Serge Darkazanli
John Dobson
Raymond Heung
Bill Korol
Bill Mackness
Fred Mannix
Con Riley
Catherine Windels
Fiscal Transfers to Immigrants in Canada: Responding to Critics and a Revised Estimate / 42

Fraser Institute / www.fraserinstitute.org
Purpose, funding, & independence
The Fraser Institute provides a useful public service. We report objective information about the economic and social effects of current public policies, and we offer evidence-based research and education about policy options that can improve the quality of life.
The Institute is a non-profit organization. Our activities are funded by charitable donations, unrestricted grants, ticket sales, and sponsorships from events, the licensing of products for public distribution, and the sale of publications.
All research is subject to rigorous review by external experts, and is conducted and published separately from the Institute’s Board of Trustees and its donors.
The opinions expressed by the authors are those of the individuals themselves, and do not necessarily reflect those of the Institute, its Board of Trustees, its donors and supporters, or its staff. This publication in no way implies that the Fraser Institute, its trustees, or staff are in favour of, or oppose the passage of, any bill; or that they support or oppose any particular political party or candidate.
As a healthy part of public discussion among fellow citizens who desire to improve the lives of people through better public policy, the Institute wel-comes evidence-focused scrutiny of the research we publish, including veri-fication of data sources, replication of analytical methods, and intelligent debate about the practical effects of policy recommendations.
43 / Fiscal Transfers to Immigrants in Canada: Responding to Critics and a Revised Estimate

www.fraserinstitute.org / Fraser Institute
About the Fraser Institute
Our vision is a free and prosperous world where individuals benefit from greater choice, competitive markets, and personal responsibility. Our mission is to measure, study, and communicate the impact of competitive markets and government interventions on the welfare of individuals.
Founded in 1974, we are an independent Canadian research and edu-cational organization with locations throughout North America and inter-national partners in over 85 countries. Our work is financed by tax-deductible contributions from thousands of individuals, organizations, and foundations. In order to protect its independence, the Institute does not accept grants from government or contracts for research.
Nous envisageons un monde libre et prospère, où chaque personne bénéfi-cie d’un plus grand choix, de marchés concurrentiels et de responsabilités individuelles. Notre mission consiste à mesurer, à étudier et à communiquer l’effet des marchés concurrentiels et des interventions gouvernementales sur le bien-être des individus.
Peer review —validating the accuracy of our research
The Fraser Institute maintains a rigorous peer review process for its research. New research, major research projects, and substantively modified research conducted by the Fraser Institute are reviewed by a minimum of one inter-nal expert and two external experts. Reviewers are expected to have a recog-nized expertise in the topic area being addressed. Whenever possible, external review is a blind process.
Commentaries and conference papers are reviewed by internal experts. Updates to previously reviewed research or new editions of previously reviewed research are not reviewed unless the update includes substantive or material changes in the methodology.
The review process is overseen by the directors of the Institute’s research departments who are responsible for ensuring all research pub-lished by the Institute passes through the appropriate peer review. If a dis-pute about the recommendations of the reviewers should arise during the Institute’s peer review process, the Institute has an Editorial Advisory Board, a panel of scholars from Canada, the United States, and Europe to whom it can turn for help in resolving the dispute.
Fiscal Transfers to Immigrants in Canada: Responding to Critics and a Revised Estimate / 44

Fraser Institute / www.fraserinstitute.org
Members
Past members
Editorial Advisory Board
* deceased; † Nobel Laureate
45 / Fiscal Transfers to Immigrants in Canada: Responding to Critics and a Revised Estimate
Prof. Armen Alchian
Prof. Terry L. Anderson
Prof. Robert Barro
Prof. Michael Bliss
Prof. James M. Buchanan†
Prof. Jean-Pierre Centi
Prof. John Chant
Prof. Bev Dahlby
Prof. Erwin Diewert
Prof. Stephen Easton
Prof. J.C. Herbert Emery
Prof. Jack L. Granatstein
Prof. Herbert G. Grubel
Prof. James Gwartney
Prof. Ronald W. Jones
Dr. Jerry Jordan
Prof. Ross McKitrick
Prof. Michael Parkin
Prof. Friedrich Schneider
Prof. Lawrence B. Smith
Mr. Vito Tanzi
Prof. Friedrich A. Hayek* †
Prof. H.G. Johnson*
Prof. F.G. Pennance*
Prof. George Stigler* †
Sir Alan Walters*
Prof. Edwin G. West*
Related Documents