STUDIES IN COAL WASHABILITY

Welcome message from author
This document is posted to help you gain knowledge. Please leave a comment to let me know what you think about it! Share it to your friends and learn new things together.
Transcript
STUDIES
IN
COAL WASHABILITY
COUNCIL OF SCIENTIFIC & INDUSTRI~L. RESEARCH
STUDIES
IN
COAL WASHABILITY (PARTS 1, 2 & 3)
BY
J. W. WHITAKER
AND
G. G. SARKAR
FUEL RESEARCH INSTITUTE
JEALGORA, MANBHUM, BIHAR
FOREWORD
THE problem of coal-washing in India has to be faced. With the exhaustion of
the better quality low-ash seams of the Jharia field, and with the growth of
mechanical mining methods, purification of the coal to be used for cokmg becomes
essential. It is desirable that the ash in coking coal shall be reduced to a definite
ligure, 15 to 17 per cent {depending on the volatile yield of the coal'), and that
it shall be uniform both in quality and quantity. This uniformity can be achieved
most simply by coal-washing. Washed coal, however, is a valuable asset whether or
not the coal is to be used for coking.
Before the installation of a coal washery, the washability of the coal has to be
considered in the light of the results of sink and float tests of comparatively large
laboratory samples. Broadly speaking, the coals of India are difficult to wash, and
a clear understanding of the results of sink and float tests, and of washability curves,
becomes of unusual importance. The present booklet has been prepared to help in
this direction.
The treatment of the subject-matter of Part 1 is largely on orthodox lines, but
special attention has been drawn to the value of the characteristic curve and also to
its use as a yield/gravity curve. In P.art 2 an " ash units " curve is developed as a
supplementary method of showing the sink and float results. This curve has been
found serviceable for demonstrating the proportionate distribution of pure coal and
of foreign matter {and ash) in the washed coal, in the middlings, and in the rejects.
It serves also as a check on the normal washability curves and deductions made
therefrom.
In Part 3 there is an analysis of actual results obtained from sink and
float tests on a particular seam, broken to different degrees- before carrying out the
tests. The results utilized in Part 3 were obtained by various members of the
testing staff of the Institute : we are indebted to them, and in particular to
Mr. J. N. Majumdar, M:Sc., who has kindly helped in reading the proofs.
It is intended to follow these present studies, which are largely introductory, by
further studies on the washability features. of coals from the different coalfields
of India. J. w. w. G. G. S.
PART 1
THE MEANING OF COAL WASHABILITY
INDIAN coals are in the main difficult to wash. A study of washability tests and curves is essential to the understanding of the cleaning potentialities.
GENERAL CONSIDERATIONS
The term washability implies the extent to which it is practicable t<f clean a coal, i.e. to remove the dirt.* When 'we attempt to remove such dirt, . it is seldom possible to make a perfect separation and obtain pure coal on the one hand and entire dirt on the other. More frequently, in fact invariably, only a part of the dirt is removed, so that we get only relatively pure coal, and at the same time there is a certain loss of some of the coaly or combustible matter along with the dirt. Washability curves and washability data are designed not only to show how much dirt may be removed in actual practice, but at the same time to show the quantity of washed coal that will be obtained with different degrees of purification or dirt removal. For example, if the original coal contains 22 per cent of ash, we may wash it so that we reduce the ash content in the washed coal almost to any value below 22 per cent. It may be that we desire ( or can tolerate ) an ash content of 10 per cent in the cleaned coal; in which case we may obtain a yield of ( say ) 70 per cent of cleaned coal. On the other hand, it may be that we desire ( or can tolerate ) an ash content of 15 per cent in the cleaned coal, in which case we may obtain perhaps a yield of 90 per cent.
Coal as found in the mine is not a homogeneous substance : it is not the same throughout. Varying quantities of mineral
*Dirt, according to a famous definition, is " matter in the wrong place ••.
impurities are always present, sometimes as distinct lumps or layers, sometimes as scattered particles disseminated throughout a section or sections of the seam. It is, of course, only the organic or combustible matter from which it is possible to obtain heat and which we can trnly regard as really pure coal. The dirt or mineral matter gives rise to ash and often adversely affects combustion in a furnace. In any case, this dirt has to be ( uselessly) transported and disposed of sooner or later. Generally, the mineral matter or actual dirt in the coal is about 10 per cent greater in amount than the ash. In symbols, MM=1·1 xash. The mineral matter consists of :
Mineral matter giving fixed ash-1. Inorganic material originally present
with coal-forming plants, givmg rise to inherent ash.
2. Mineral matter deposited simultaneously with the vegetable matter in the peat bog or drift stage and thus often disseminated throughout the coal mass. This may be termed intergrown mineral matter.
Mineral matter giving free ash-3. Sedimentary material deposited just
before or just after the vegetable matter, and constituting more or less clearly defined partings or dirt bands, parallel to the bedding plane.
+. Ferruginous and calcareous matter, often occurring as nodules, lumps or flakings in cracks and joint planes of the more or less mature coal.
The inherent ash, i.e. that of the original vegetation, is small and rarely exceeds 1 per cent. lntergrown ash, on the contrary, may be small or large in amount. The inherent and intergrown ash ( 1 and 2 above ) may be . taken together as constituting the
"fixed ash " of the coal, i.e. ash derived from the foreign matter which cannot easily be removed by cleaning by ordinary methods. The dirt bands and partings ( 3 and 4 ) , by comparison, can often be partly or who\ly removed. It is these last sources which give rise to the" free or accidental ash". The dirt consists generally of hydrated aluminium silicate, with varying amounts of iron oxide, iron pyrites, and some lime and magnesia, whether we consider the mineral matter of the fixed-ash or of the free-ash. In some coals, however, there are certain deviations from this generalization.
The methods employed for the removal of the impurities depend upon differences of physical properties of the impurities on the one hand and of the coal on the other. Differences in frictional resistance, in surface tension, in wettability, and in resilience, are utilized in certain cleaning methods. But the most common and important of all properties made use of is the specific gravity. In ordinary coal-washing, whether in trough, or jig, or gravity washers, specific gravity differences are all important.
Coal* containing only "fixed ash " has a specific gravity ranging from 1·25 to 1·6 (generally below 1·4 ). Shale, sand, and calcite have specific gravities ranging from 2·5 to 2·75 : while pyrites has a specific gravity of 5·0. The difference in specific gravity between clean coal and clean shale is so marked that from a mixture of the two (not intergrown with each other, i.e. no fixed-ash), a clear-cut separation can easily be made by utilizing a liquid of any intermediate specific gravity, say 2·0, leaving clean coal floating on the surface, and pure shale sinking to the bottom of the liquid.
Most Indian coals, however, have a considerable proportion of fixed-ash, i.e. they contain much finely disseminated or intergrown foreign matter. Indeed, in some seams there is practically an unbroken series from pure coal, through coal with increasingly higher proportions of mineral matter, continuing through more or less carbonaceous shales until shale itself ( free from carbonaceous matter ) terminates the series. These coals are difficult to ckan by any method.
DIVISION OR CUT
Nevertheless, it is possible by ordinary coal-washing to divide such coals into two
•Coal free from all foreign matter generally has asp. gr. of about 1·3.
2
or more fractions - one of low ash, and the other or others of higher. This is especially important for coking coals such as those of the Jharia and Bokaro fields. These coals are of a truly caking nature, and, but for excessive ash, they generally ·yield good, strong, satisfactory metallurgical coke. In blast-furnace practice using the high-grade ores of India, it has been found that coke with an ash content not exceeding 20 to 23 per cent is satisfactory, so long as the value i> steady. This means that the ash of the coal must not exceed 15 to 17 per cent, the exact value depending upon the amount of volatile matter plus moisture in .the coal. ~ coal with 25 per cent of volatiles plus mmsture, and 17 per cent of ash, will yield coke of ~~~~:l' i.e. of 22·7 per ~ent of ash: but with 30 per cent of volatiles plus mmsture (in the washed coal), the _ash .in the C?ke rises to 24·3 per cent, whtch IS excesstve. Clearly, the requisite degree of purification or washing depends upon the volatiles of the ( washed ) coal.
To investigate the possibilities of ash reduction and of the yields of washed coal and " rejects" that may be obtained from the coal (the " rejects" may, of course, be quite serviceable for steam-raising as pointed out later), we first carry out sink and float tests on a representative sample of the coal as produced at the mine - in other words, on a true "run of mine" sample. The sample is all important : it should represent truly the quality of coal which the coalwasher will be called upon ( later) to process or clean.
SINK AND FLOAT TESTS ( Specific Gravity Separation )
A sample of 500 lb. is usually adequate, but 1000 lb. or more may be required if the seam is thick, or if several seam-sections from different areas are to be tested as a single sample. The coal when received is usually broken to pass a 2-in. or 3-in. mesh, and then sieved into a number of screen-size portions, e.g. 3-2 in., 2-1 in., 1-l in., H in., H in., and t-O in. It is necessary to break down the coal in the first place, as some dirt or foreign matter is frequently intergrown or interleaved with the coal, and separation of the dirt is clearly impracticable if the solid pieces are left in sizes too large. Unnecessary breakage, however, is to be avoided : it gives rise to much dust and causes slurry, drainage, and other troubles in
the washing plant. The optimum breakage is a matter for experiment, and in many cases it is by no means easy to determine. The problem is, of course, more complicated if a number of seams are to be washed simultaneously, as breaking to a 3-in. or even 4-in. size may be adequate for one seam while breaking to a 2-in. or l-in. size or even less may· be required for another. Moreover, the manner of breaking has its influence, especially with coals in which the vitrain is very friable and the durain is tough and strong, which is usual. Any unnecessary violence in the breaking is to be avoided, not merely in the preparation for the laboratory tests, but also and mainly in actual practice.
The sample, therefore, is broken and screened into a number of size portions, and each portion is weighed. Each portion is then treated as follows. First, it is thrown into a bath containing a liquid of definite specific gravity, say 1·50. The amount floating is removed, dried, and weighed ; and next immersed in a liquid of specific gravity 1·40, and the floatings weighed, and next treated similarly in a liquid of specific gravity 1·30. The sinkings from the original 1·50 specific gravity liquid are dried and weighed, and then immersed in a liquid of specific gravity 1·60, the sinks being removed, dried and weighed, and then treated in liquids of increasing specific gravities -generally up to 1·8, but if necessary up to 2·0. By this means we obtain a series of specific gravity fractions in weighed amounts of t~e .whole ( screen size ) portion. It remams to find the amount of ash in each float and sink fraction. This is done by incinerating a weighed representative quantity of each, i.e. by .burning away its combustible matter in air at a temperature of about 75o•c. and then weighing the ash. For this ashing or incineration test, it is necessary first to powder the fractions to get a representative quantity for the test. From this series of tests, we accumulate ( for each size ) a series of results showing the percentage . of material floating in each specific graVlty range, and the ash content of such " floats,..
LABORATORY NOTES 1. Organic liquids are usually employed as the
separating media in the above sink and float tests. The usual liquids are mixtures of carbon tetrachloride ( specific gravity 1·6 ) and benzene (specific gravity 0·9 ). By mixing these in the right proportions, we may obtain a liquid of any intermediate specilic gravity between 0·9 and 1·6.
It is essential in hot countries such as India to check the specilic gravity of the liquid mixtures dculy. and even to correct the changes in specific gravity which occur during the day. If the coal will later be washed in water at 30°C., the sink and float tests should be done at this temperature. For specific gravities above 1·6 we may use mixtures of bromoform (specific gravity 2·8) and carbon tetrachloride.
2. In hot or dry weather, an important precaution before testing· is to wet thoroughly both the original coal and any fraction separated and then allow the surface water to dry oft. In other word.s. we work with moist material throughout. Otherwise, as the moisture of the coal dries off, air enters the pores and the buoyancy o( the par~ ticles is affected. This is most marked with high~ oxygen coals, i.e. coals with high natural moisture, Coa1s freshly mined are generally moisture·saturated, even if they appear dry.
The results of the sink and float tests for any particular portion are expressed as in Table 1.
TABLE 1
SPECIFIC GRAVITY OP
SEPARATION
Less than 1·4 Htot-5 1·5 to 1-6 1·6 to 1·7 More than 1·7
FLOATINGS ASH OF BACH YIELD FLOATING
( PER CENT ) ( PER CEN"t )
30 9 20 12 26 23
6 47 18 78
100
In the above table, for simplicity of treatment, the values have been rounded to whole numbers, and a very limited range of specific gravities employed. The table may refer to the whole coal or to any particular screen size. In actual testing, 6 or 7 such tables, one for each screen size, are often requisite : the values are usually taken .., 2 decimal places, and never rounded ; and for difficult coals increments of 0·05 in the specific gravity of the liquid medium are employed.
In certain cases, e.g. where modern gravity washing plant is installed, it may be desirable to screen off from the broken coal ( reduced to pass 3-in. mesh ) all the small particles below ,.\, in. or l in. • The sink and float tests may then be done on the whole of coal above .( .. or l in. A larger quantity than
•These portions are screened off from the laboratory tests, if later they will be screened off in the actual washing plant- i.e. not sent to the washer. In certain cases the dust below f• or .;. in. may similarly be separated ( pneumatically) to avoid slurry and drainage d.iJ!iculties.
3
500 lb. may be tested, if there is much large material (say 2l in.) among the coal after breaking to pass the 3-in. mesh. (The reason for the larger sample for large-size pieces is to avoid errors of uneven distribution. ) Many makers of coal-washing plant prefer, however, to have a full sink and float test on each screen size of the original coal.
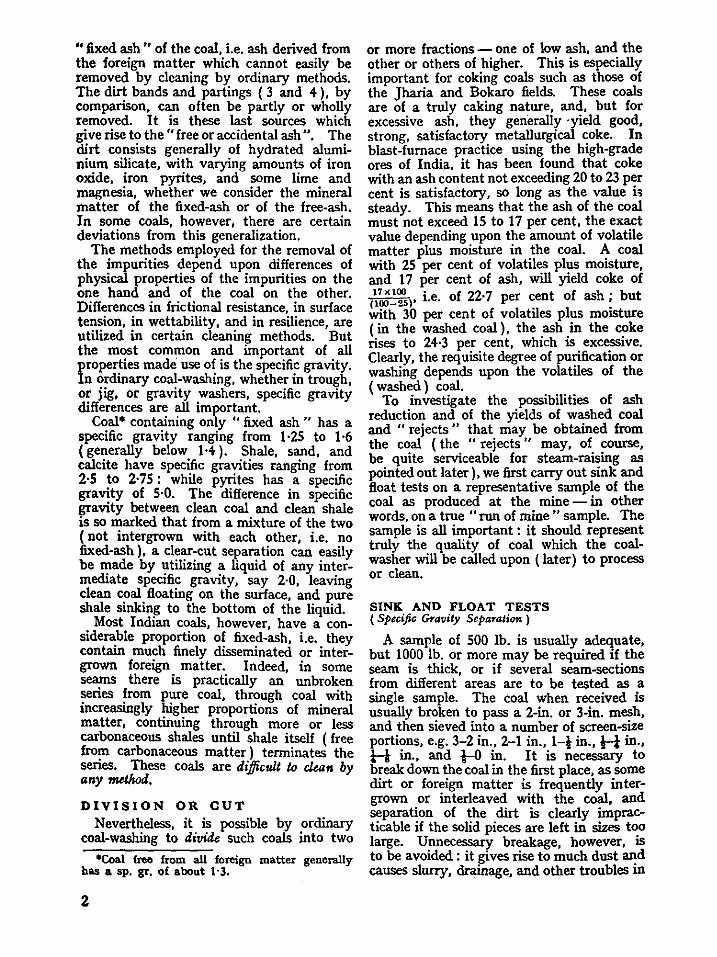
THE CHARACTERISTIC CURVE
In order to show graphically the cleaning potentialities of the coal, it is best to construct first from the data of Table 1 a curve known both as the Washability Characteristic Curve or the Instantaneous Ash Curve. In plotting such a curve, it is important that a square diagram be used. This is true of all normal washability curves ; otherwise, the distortion which results, when different scales are used for the horizontal and vertical axes, is difficult to allow for. In other words, the length of the vertical scale, covering 100 per cent yield, should be made equal to the length of the horizontal scale, covering 100 per cent ash. Uniformity in procedure is also desirable in the plotting : the vertical yield scale increases downwards ; the horizontal ash scale increases to the right.
The characteristic curve for the coal under consideration is shown in Fig. 1.
The important feature in the plotting is that the specific gravity or yiel1 for any par-
CHARACTERISTIC CURVE.
t:l< 0
~ OIF-
~ ······~ ~ I ;
\ ...... ,
-~ ~ I
\ .n ~T•••••'-
' I I
fY
\f.J 20
......... r--.......... '\
40 60
ASH PERCENT
FIG. I
~ 80 RIOO
ticular fraction is not plotted opposite the ash given by that fraction. It is the half-way or mean value of the specific gravity or yield frac_tion that is so plotted. For example, agamst the ash value of 9 per cent (TABLE 1) is plotted the yield value of{!' or 15 per cent to give point A. Similarly, against the ash value of 12 per cent is plotted the yield value of 30+ ~. i.e. 40 per cent, to give point B. The curve obtained shows, therefore, the average ash given by any specific gravity fraction. The deflection of this curve from the vertical measures the rate o~ change _of ash with increasing ( total) yteld_. It 1s usual ~o show the specific gravtty of each fraction of floats alongside ~he vertical scale of yields, as in Fig. 1. It 1S to be noted that the characteristic curve does 1101 show the ash of the total yield of floats obtained from washing the coal at the indicated specific gravity. Thus, if we wash at 1·5 specific gravity, the ash of all the floats is 1101 12 per cent, although the yield is 50 per cent (TABLE 1).
The shape of the characteristic curve requires study. If it is roughly a straight line joining Q with any point such as R on: the ash axis, the coal is said ( perhaps wrongly ) to be unwashable. * The significance of the straight line is that there is every gradation ( present in quantity ) of the mixtures of coal and its impurities. Nevert~eless, a;; ~tated earlier, it may well be poss1ble to divtde or cut such a coal into 2 or more fractions, one with lower ash and the other with higher ; and the asli ot' each will depend upon the density or specific gravity of separation employed. By this means, for example, we might obtain from 100 tons of a crude coal 50 tons of coal with an ash of 17 per cent and 50 tons of coal with an ash of 27 per cent, the ash of the
. . al al b . 17 27 ongm co emg ( 2 + 2 ) = 22 per cent. Clearly, such a coal in the raw state is unsuitable for coking, as it would yield a coke containing about 30 per cent of ash : but after washing, the lighter half of it might be coked, the ~eavier residue with 27 per cent of ash bemg used for combustion at thermal power-generating plant. Modem powdered-coal boiler plant can consume coal. with 50 per cent ash--;- and with high effic1ency. Many of the ( rmpure ) caking
*Strictly, a vertical characteristic shows an unwashable coal.
IIAI
coals of the ]haria and Bokaro fields may, therefore, well be treated in the above manner, even if on testing they show such washability characteristics as were formerly thought to indicate an " unwashable " coal. It is almost essential, however, to have a market for the washery rejects.
Fig. 1 requires still further examination. If point Q at 0 yield shows the lightest coal to have an ash of about 8 per cent, and point R (the heaviest ) to have an ash of 90 per cent, the ash ( if the characteristic approaches a straight line ) of the whole coal is roughly 8~00, i.e. 49 per cent. The ash values at Q and R are obtained either by extrapolation or by incineration of specimens of the floats in the least specific gravity liquid that can be usefully employed (usually 1·25 ), and of the heaviest specimens of the sinks- to find which a very dense liquid, e.g. bromoform plus carbon tetrachloride, may be used. .
When stone or shale, free from carbonaceous matter, is the chief impurity, the value of the ash at R usually lies between 85 and 90 per cent, and approaches 90 with many coals. If, however, there is no ( free ) stone or shale present, the value of the ash of the heaviest sinks may be much smaller ; and, with certain Indian coals, it can fall to a figure as low as 50 per cent. This signifies
YIEL~
0 .
1·4!1- 20 \ \
1·50· 40
1·55• 60
1·6!1- 80
100 0
.!\ ' t ~ r-,.
20 40 60 60 ASI-l PER CENT
CHARACTERISTIC FOR DIFFICULT COAL
AG.2.
100
not only that the pure coal and foreign matter are intimately mixed, but also that even in the heaviest part of the rejects, there is a large amount of coaly or combustible matter inextricably intermingled, and that there is present no absolute dirt or shale at all.
Both the shape and the position of the characteristic curve are of significance. The curve in Fig. 1 is that of an easily washable coal. As stated above; if the characteristic of the coal approaches a straight line, the more difficult is it to get clear-cut results by washing ; and this is all the more true when the curve approaches verticality, i.e. becomes nearly parallel to the vertical axis. But if the characteristic lies throughout near the vertical axis, it is unlikely that the coal needs washing. In any case, washing will be impracticable unless the coal is broken to a smaller size. On the other hand, if the top intercept be at 8 and the bottom at 40 (per cent ash), the ash of the whole coal may be 24 per cent ( 40:S) or rather less, assuming a nearly straight characteristic. In such a case the coal may or may not be worth washing according to requirements and the market prices and demands.
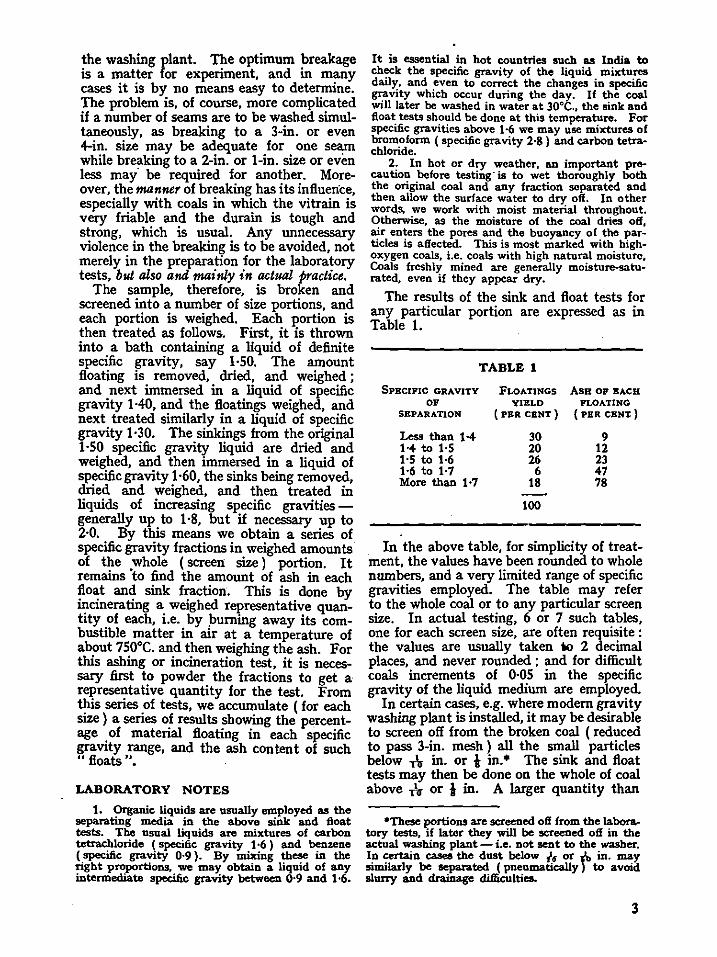
THE CHARACTERISTIC FOR A DIFFICULT COAL
Table 2 and Fig. 2 show the results given by a more typical Indian ( Jharia ) coal.
TABLE 2
SPECIFIC GRA VJTY FLOATlNGS ASH OP' EACH YIELD FLOATING
(PER CENT) (PER CENT)
Below 1·40 20 10 1·40 to 1·50 20 18 1·50 to 1·55 20 24 1·55 to 1-60 20 30 Above 1·60 20 50
The top intercept is at 6, the bottom intercept is at 66 per cent ash ; and the characteristic curve, though not a straight line, has only moderate concavity -less than at C of Fig. 1. The average ash of such a coal will clearly be less than "+,."", i.e. less than 36 per cent. In fact, we shall see later that it is more nearly 26, and we shall assume this figure. Can such a coal be washed effectively? To answer, we need to know the purpose of purification and the yield and amount of ash which can be tolerated in the washed coal- and perhaj,s also the yield
5
and ash of the rejects. If the purpose is to produce coal for coking, and if a washed fraction can be obtained yielding coal of 17 per cent of ash and 25 per cent of volatiles plus moisture ( and giving a good coke of ash content of about 23 per cent), we may perhaps take off this fraction as coking coal. But what Will be the yield of such coking coal ? This will depend on the further analysis of the sink and float results- it is shown later by the total floats/ash curve. Assuming it to be some 60 per cent, we shall have a residue, or rejects, of 40 percent having
( IOOx26 )~( 60x 17) = 39.5 per cent
of ash. There will be 40 tons of this residue for every 100 tons of coal going into the washery. Can we utilize such a residue ? If not, washing is probably quite. uneconomic, as the complete Joss of 40 per cent of the output cannot usually be borne- to say nothing of the additional cost of washing, which may be taken roughly as R 1 to 2 per ton at the present time. Such a residue, we know, may be consumed as powderedcoal in large thermal power-station boilers -but this outlet may not be available, or the supply may exceed the demand. It is clear that the issues require mature consideration and careful weighing.
MIDDLINGS
There is also the possibility of taking from the residue a certain proportion as middlings with an ash of, say, 32 per cent. Whether this is desirable will depend to some degree on market and other conditions: but whether it is possible ( and to what extent ) is shown by the characteristic curve.
For instance, the characteristic curve in Fig. 2 shows that if the washing were done at specific gravity of 1·55, the yield of floats would be 60 per cent, and its ash would be 17·3 per cent. Suppose now a middlings fraction be required of, say, 32 per cent ash. In order to see what the quantity of such middlings would be and also to find the ( higher ) specific gravity of the cut, we draw a perpendicular at the value of 32 per cent ( ash ) from the ash axis upwards to cut the characteristic, and we produce the line to cut the horizontal line through the 60 per cent yield point as shown. There is now a certain ( shaded ) area lying above the characteristic and below the horizontal 60 per cent yield line, and the problem is to find the position of a lower horizontal line which will make an eq!Ull area below the
6
characteristic, both areas being bounded, of course, by the vertical from the 32 per cent ash point. We find the required horizontal passes through the 84 per cent yield point. The true position is not difficult to locate by trial and error. The area of the shaded portion can be verified by counting the squares, and allowing for fractions of a square where necessary. This is by no means tedious, but only a matter of a few minutes. The eye is a good judge of area equalities. The position of the lower line at 84 per cent yield shows that the quantity of such middlings obtainable is 84-60 per cent, i.e. 24 per cent. Hence, if we desire middlings of 32 per cent ash, we can expect a yield of 24 per cent.
We can look at the matter from another angle. Thus, consider the original, easily washable, coal ( FIG. 1 ) and suppose that we first take off the lighter 50 per cent of the raw coal, i.e. we cut at specific gravity 1·5. Next we desire to take a middlings fraction between specific gravities 1·5 and 1·6. The yield will clearly be 26 per cent ( 76-50 of yield), and its ash content some 23 per cent (see C), the shaded areas above and below the characteristic being made equal, as shown. But the case considered with the difficult coal is more typical of the usual problem.
To summarize, in taking off a middlings fraction between any two yield points ( or specific gravities ) , we are concerned with that portion of the characteristic which lies between these two points. The ash of the middlings is given by the average length of · the ash line ( i.e. average abscissa) for this fraction. This occurs near the half-way point for the yield, but it is given more accurately by equalizing the areas on either side of the characteristic, as in Figs. 1 and 2, and finding the position of the dividing line. It is important to grasp the true meaning of the area equalization, and especially to use this procedure when the part of the characteristic for the middlings is markedly curved. The ash for the mid-point on the yield axis in such cases does not give the true percentage ash of the middlings, but only an approximate value.
THE FLOATS/ASH AND SINKS/ASH CURVES (i.e., lnkgotakd Floats Curoe and lnlegotakd Sinks Curoe)
We still require to have a convenient curve to show the percentage ash of the total floats and the yield of such floats ( at any cut), and also a siniilar curve to show
Hl 0
t-
z
\
I QT. For the above work it is best to use
oo a planimeter to find directly the areas under the characteristic curve.
Alternatively, the actual values of Table 1 8 o may be employed, as follows :
If TO ('4 •••••••••• . - \ -At 30 per cent yield the ash is 9% At (30+20) it is (30x9) + (20xt2) ot
CIJ4
1'5 ••• 4 ... c::J
ol~
..
lo 30+20 /O
~ At(30+20+26)itis(30 x 9)~~1~;!~(26x 23) % ~ and so forth.
• ri 60
\\ ~
1\ "'
i'i.i From such calculations we obtain the 40 values of Table 3, columns 1 and 2. It
"'X .. IJ ~ D 0
\ -!
t6 ....... -..
rt ...... a to
OVER l-7 ...... r- f\ r--; ~-100
Qo ' ~0 T 40 60 60 R100
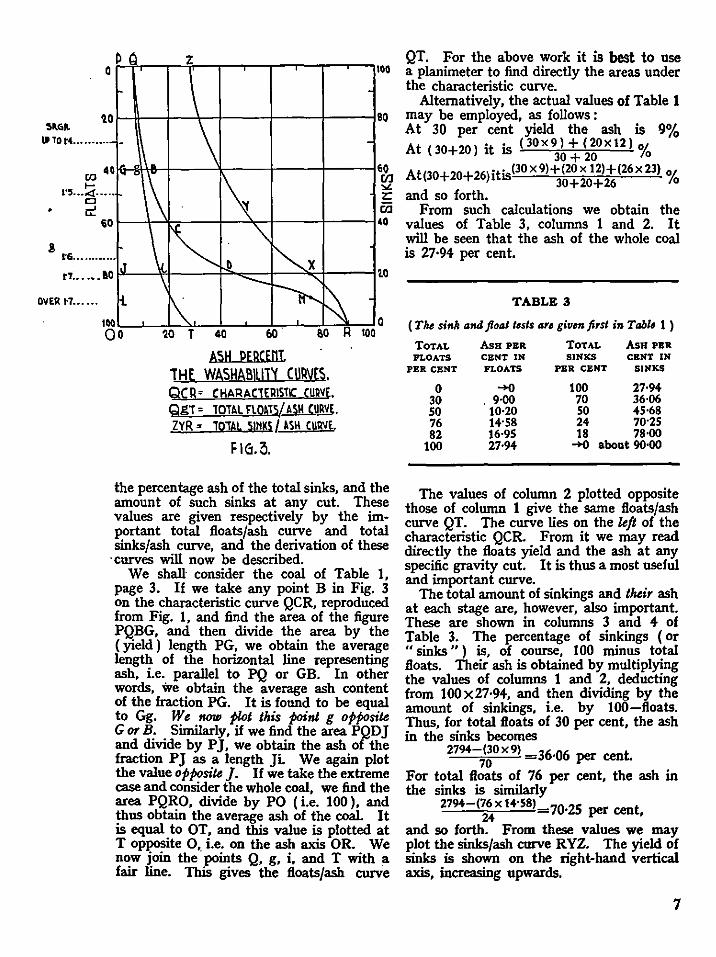
ASH PERCEOT. 1HE. WASHABIUJ'( CURVES, QCR= CHARACJEAISJ!C CUQVE. QgT = JOTAL FLOATSill!U.Um. ZYR = TOTAL SINKS /lSK CUAVl.
F\6.3.
0
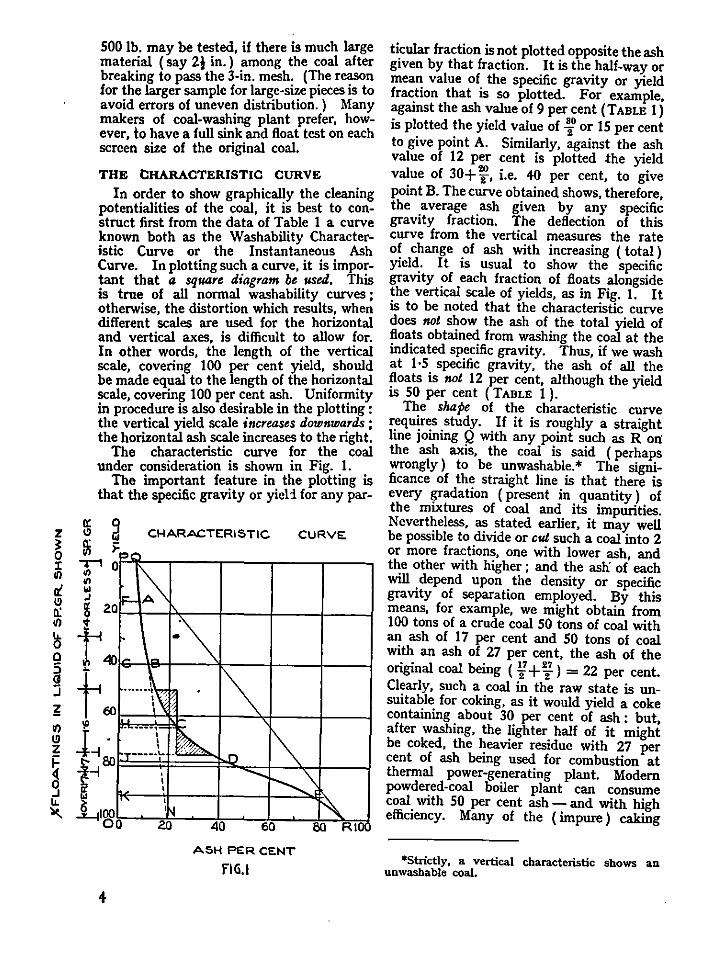
the percentage ash of the total sinks, and the amount of such sinks at any cut. These values are given respectively by the important total floats/ash curve and total sinks/ash curve, and the derivation of these
·curves will now be described. We shall consider the coal of Table 1,
page 3. If we take any point B in Fig. 3 on the characteristic curve QCR, reproduced from Fig. 1, and find the area of the figure PQBG, and then divide the area by the (yield) length PG, we obtain the average length of the horizontal line representing ash, i.e. parallel to PQ or GB. In other words, we obtain the average ash content of the fraction PG. It is found to be equal to Gg. We ti071J plot this ~nt g opposite G or B. Similarly, if we find the area PQDJ and divide by P J, we obtain the ash of the fraction PJ as a length JL We again plot the value opposite]. If we take the extreme case and consider the whole coal, we find the area PQRO, divide by PO (i.e. 100 ), and thus obtain the average ash of the coal. It is equal to OT, and this value is plotted at T opposite o .. i.e. on the ash axis OR. We now join the points Q, g, i, and T with a fair line. This gives the floats/ash curve
will be seen that the ash of the whole coal is 27·94 per cent.
TABLE 3
(The sinh and jloallosls are given fi.sl in Tab/• I )
ToTAL AsH PER TOTAL AsH PER FLOATS CENT IN SINKS CBNT IN
PER CENT FLOATS PER CENT SINKS
0 -+() 100 27·94 30 . 9·00 70 36·06 50 10·20 50 45-68 76 14·58 24 70•25 82 16·95 18 78·00
100 27·94 -+() abont 90·00
The values of column 2 plotted opposite those of column 1 give the same floats/ash curve QT. The curve lies on the left of the characteristic QCR. From it we may read directly the floats yield and the ash at any specific gravity cut. It is thus a most useful and important curve.
The total amount of sinkings aJtd their ash at each stage are, however, also important. These are shown in columns 3 and 4 of Table 3. The percentage of sinkings ( or "sinks") is, of course, 100 minus t~tal floats. Their ash is obtained by multiplY!ng the values of columns 1 and 2, deductmg from 100x27·94, and then dividing by the amount of sinkings, i.e. by 100-floats. Thus, for total floats of 30 per cent, the ash in the sinks becomes
2794-(30 x 9) = 36.06 per cent. 70 .
For total floats of 76 per cent, the ash m the sinks is similarly
2794-(~ x 14·58) 70.25 per cent,
and so forth. From these values we may plot the sinks/ash curve R YZ. The yield of sinks is shown on the right-hand vertical axis, increasing upwards.
7
But it is instructive also to construct the sinks/ash curve RXYZ in the basic way and to calculate the yield of sinks and their ash content as follows. Take any horizontal line (FIG. 3 ) through a yield point, say, 60 per cent sinks. The area lying below this line and that part of the characteristic which it meets, i.e. the area GBDRO measures the product of average ash for the particular fraction and the amount of the fraction. If, therefore, we divide this area by the amount of the fraction OG, we obtain the average ash content of that fraction. In other words, just as we previously worked downwards to construct the floats/ash curve we now work upwards from the ash axis OR. Taking, for example, the 20 per cent of sinks, we first find the area of the figure RDJO, lying below the horizontal line through the point 80 on the vertical ( floats ) axis and bounded by the characteristic curve to R and back to 0. This area is then divided by the length on the sinks yield axis ( 100-80 )=20, and we obtain the average length of the horizontal line representing ash for this yield of sinks. In this way we get the value LM for the ash content of the fraction. This length is plotted vertically over M, and opposite the 20 value for sinks, i.e. opposite the 80 value for floats. Similarly, if we consider any area lying between the characteristic QCR and the horizontal axis OR, we may choose any convenient poi11t, and proceed as above. Thus, taking the area below the horizontal line through 60 per cent floats (i.e. 40 sinks), we may find it ts, say, 2080 units. The area 2080 divided by 40 gives 52, which is the ash per cent o} the sinks. This value 52 is plotted opposite point 40 sinks, i.e. 60 floats. A series of such points (which, of course, includes the points in the last column of Table 3 ), when plotted, gives the " ash in the sinks " curve, which is also known as the " sinks/ash " curve. It lies on the right of the characteristic. From this curve we may read at once the ash percentage of the ( total ) sinks at any particular cut.
Thus, from Fig. 3 if we cut at 80 per cent floats (specific gravity about 1·66 ), the ash in the sinks will be 76 per cent, the amount of sinks being of course 20 per cent- indicated on the right-hand vertical axis. At this selfsame cut we shall also obtain, from the floats/ash curve, the ash in the floats. We can see that it is about 16·5 per cent. If these curves are drawn on good graph paper with the inches divided into
8
tenths and of a size aJ least (10 in. X 10 in.), it is p~ssible to read the first decimal point, and to say, for instance, whether the ash is 16·5 or 16·6 per cent at any partic~ar cut. First-class paper and accurate pl?ttmg a~e essential, and a rather large dtagram ts desirable, preferably 20 in. X 20 in.
To take another example, if we can tolerate 20 per cent of ash in the washed coal, the yield will be ( from QT ) 88 per cent, and in the sinks we shall have an ash content of 83 per cent.
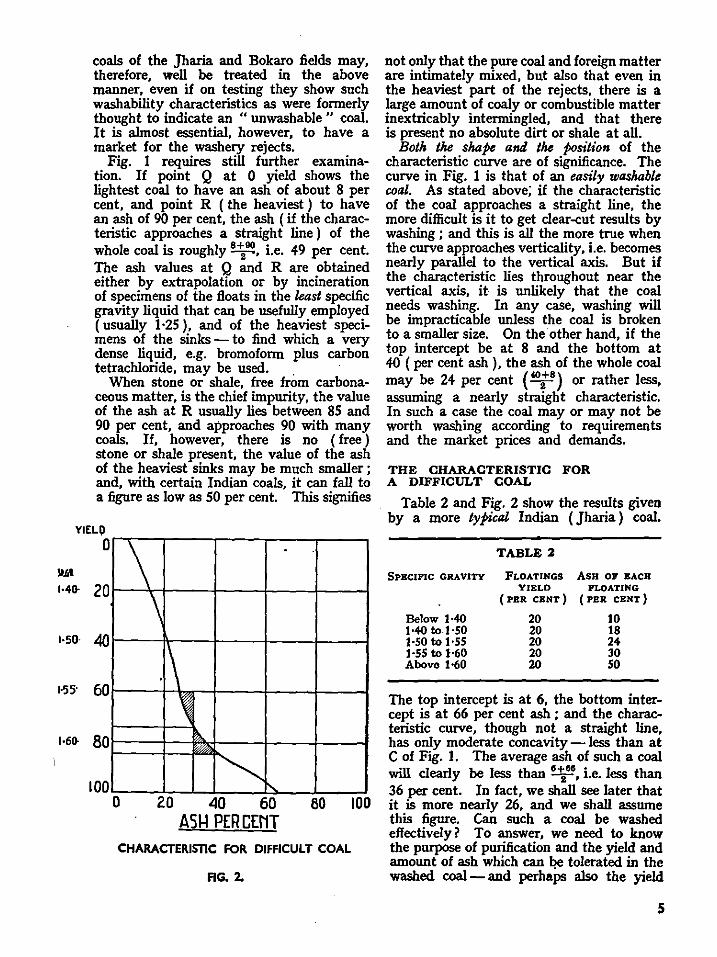
DIFFICULT COAL
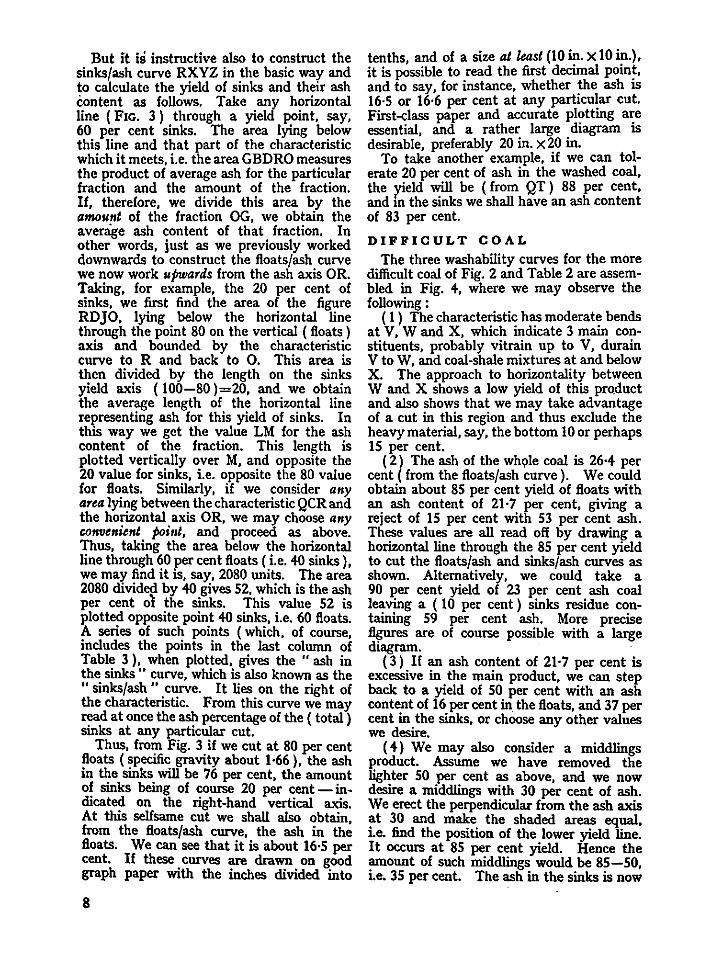
The three washability curves for the more difficult coal of Fig. 2 and Table 2 are assembled in Fig. +, where we may observe the following:
( 1 ) The characteristic has moderate bends at V, W and X, which indicate 3 main constituents, probably vitrain up to V, durain V to W, and coal-shale mixtures at and below X. The approach to horizontality between W and X shows a low yield of this product and also shows that we may take advantage of a cut in this region and thus exclude the heavy material, say, the bottom 10 or perhaps 15 per cent.
( 2 ) The ash of the wh9le coal is 26·+ per cent (from the floats/ash curve). We could obtain about 85 per cent yield of floats with an ash content of 21·7 per cent, giving a reject of IS per cent with 53 per cent ash. These values are all read off by drawing a horizontal line through the 85 per cent yield to cut the floats/ash and sinks/ash curves as shown. Alternatively, we could take a 90 per cent yield of 23 per cent ash coal leaving a ( 10 per cent) sinks residue containing 59 per cent ash. More precise figures are of course possible with a large diagram.
( 3) If an ash content of 21·7 per cent is excessive in the main product, we can step back to a yield of 50 per cent with an ash content of 16 per cent in the floats, and 37 per cent in the sinks, or choose any other values we desire.
( +) We may also consider a middlings product. Assume we have removed the lighter 50 per cent as above, and we now desire a middlings with 30 per cent of ash. We erect the perpendicular from the ash axis at 30 and make the shaded areas equal, i.e. find the position of the lower yield line. It occurs at 85 per cent yield. Hence the amount of such middlings would be 85-50, i.e. 35 per cent. The ash in the sinks is now
53 per cent, the amount of sinks (or rejects) being 15 per cent.
A check on our calculations is advisable : 16 per cent ash in top 50 per cent.:...
sox 16'0 8·00 parts on whole coal 100
30 per cent ash in middlings= 35 x 30 10·50 parts on whole coal
100 53 per cent ash in sinks=
1\~~3 = 7·95 parts 0:1 whole coal
26·45 per cent. The true value is 26·40. More precise figures are clearly attainable, although the
· error is not serious. .
SPECIFIC GRAVITY OF THE CUT -THE CHARACTERISTIC AS A YIELD/GRAVITY CURVE
We do not yet know the best value of the specific gravity to be employed to get the yield and ash content we desire, although we can see from Fig. 2 (or Fig. 4) the approximate value, using the floats/ash curve in each case. It is useful, however, to draw a yield/gravity curve in which the specific gravity of the cut is plotted horizontally and the yield vertically. downwards in the usual way. Such a curve is shown to the right in Fig. 4 : it is dotted. From this curve we can observe that at a specific gravity 1·45, say, the floats yield would be 27 per cent ; and the ash content ( now taken
from the floats/ash curve ) would be about 12 per cent.
To reverse the procedure, if we desire a coal of 17 per cent ash, we first see ( from the floats/ash curve ) what the yield will be. It is about 58 per cent. Next we follow the 58 per cent yield line horizontally until it crosses the yield/gravity curve. At this point the required specific gravity may be read. It is 1·54. Similarly, we may take the specific gravity of the middlings. Thus, if the middlings occur between the yield points of 50 and 85, as in the earlier selection, the specific gravity of the 50 cut is 1·525, and the
. specific gravity of the 85 cut is 1·61. The specific gravity limits of the middlings cuts are thus 1·525 and 1·61.
In Fig. 4 the yield/specific gravity curve, dotted, is roughly parallel with the characteristic curve for values of specific gravity less then 1·6, although the values have not been chosen with particular care. In 1928 and 1929 L. L. F~rmor, ( then ) Director of the Geological Survey of India, showed that for many Indian coals the specific gravity, g, of any fragment or sample was related to its ash content by the formula
A g=k+too•
where k is the specific gravity of the pure ashless brights and A is the percentage ash of the sample or specimen. For coking coals ( and it is these which chiefly require washing ) the value of k lies between 1·28 and 1·25. Taking the value of 1·25 for zero ash
u tl we thus have the following : ·~~~~-r--r---~~~-+~
• • I
TABLE'
ASH PER CENT SPECIFIC GRAVITY OP COAl. SPECIMEN o• 8PECJMBJII'
0 10 20 30 40
1-25 l-35 HS 1·55 1-65
When the ash percentage exceeds 40, the rule no longer holds. The reasons for Fermor's formula are analysed in a paper on the " Densities of Indian Coals " by Whitaker published in the Transactions of the Mining, Geological & Metallurgical Institute of
IDO 0L...--l
2L0.l.--
4.l.0_.......::._Gc;D..__B.J0--.....1100 India in 1949. Fermor's formula is generally
accurate to 2 or 3 per cent in ash percentage PERCENT ASH once the specific gravity of the vitrain is
·FIG. 4. known. It follows, therefore, that if a
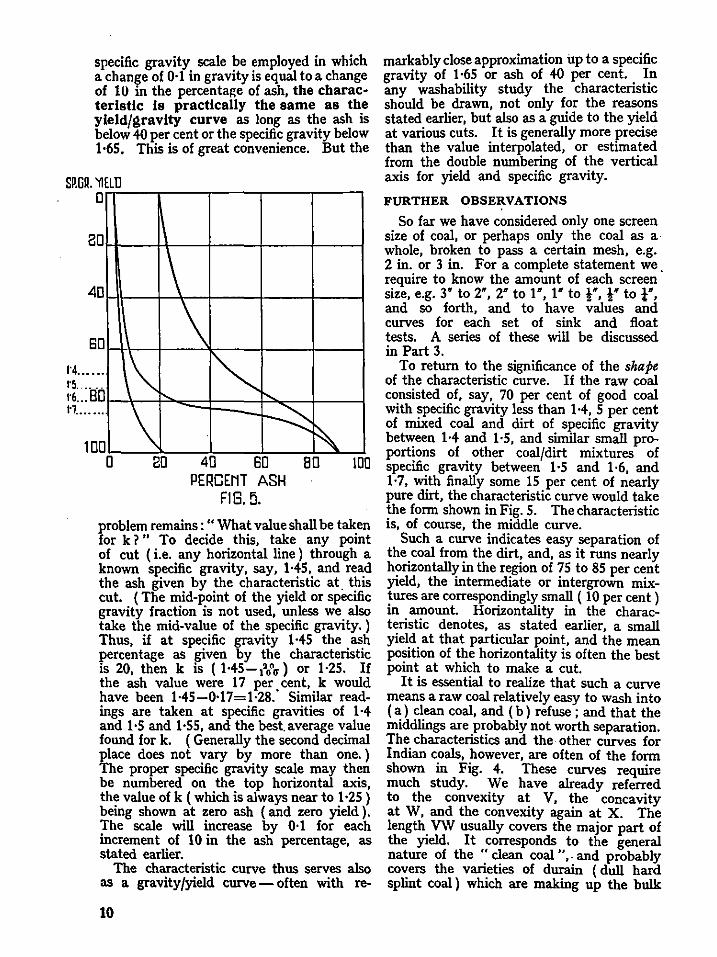
specific gravity scale be employed in which a change of 0·1 in gravity is equal to a change of 10 in the percentage of ash, the charac· terlstlc Is practically the same as the yle1df~ravlty curve as long as the ash is below 40 per cent or the specific gravity below 1·65. This is of great convenience. But the
SP.GQ. 'il[Lll 0
20
40
so 1·4 ••• 0 0
1·5 ..... 1·6 .•• 80 1"1. 0 0 0 0 0 ..
\ \
\\ ~ r-.. \ ~ f\.
markably close approximation up to a specific gravity of 1·65 or ash of 40 per cent. In any washability study the characteristic should be drawn, not only for the reasons stated earlier, but also as a guide to the yield at various cuts. It is generally more precise than the value interpolated, or estimated from the double numbering of the vertical axis for yield and specific gravity.
FURTHER OBSERVATIONS
So far we have considered only one screen size of coal, or perhaps only the coal as a whole, broken to pass a certain mesh, e.g. 2 in. or 3 in. For a complete statement we. require to know the amount of each screen size, e.g. 3" to 2", 2" to 1", 1" to !", !" to !", and so forth, and to have values and curves for each set of sink and float tests. A series of these will be discussed in Part 3.
100 0 80 40 so
PERCENT ASH FIG.5.
80
To return to the significance of the shape of the characteristic curve. If the raw coal consisted of, say, 70 per cent of good coal with specific gravity less than 1·4, 5 per cent of mixed coal and dirt of specific gravity between 1·4 and 1·5, and similar small proportions of other coalfdirt mixtures of
100 specific gravity between 1·5 and 1·6, and
problem remains : " What value shall be taken for k ? " To decide this, take any point of cut ( i.e. any horizontal line ) through a known specific gravity, say, 1·45, and read the ash given by the characteristic at. this cut. (The mid-point of the yield or specific gravity fraction is not used, unless we also take the mid-value of the specific gravity. ) Thus, if at specific gravity 1·45 the ash percentage as given by the characteristic is 20, then k is ( 1·45- Nu) or 1·25. If the ash value were 17 per cent, k would have been 1·45-0·17=1·28." Similar readings are taken at specific gravities of 1·4 and 1·5 and 1·55, and the best. average value found for k. ( Generally the second decimal place does not vary by more than one. ) The proper specific gravity scale may then be numbered on the top horizontal axis, the value of k ( which is always near to 1·25 ) being shown at zero ash ( and zero yield ) . The scale will increase by 0·1 for each increment of 10 in the ash percentage, as stated earlier.
The characteristic curve thus serves also as a gravity/yield curve- often with re-
10
1·7, with finally some 15 per cent of nearly pure dirt, the characteristic curve would take the form shown in Fig. 5. The characteristic is, of course, the middle curve.
Such a curve indicates easy separation of the coal from the dirt, and, as it runs nearly horizontally in the region of 75 to 85 per cent yield, the intermediate or intergrown mixtures are correspondingly small ( 10 per cent) in amount. Horizonta!ity in the characteristic denotes, as stated earlier, a small yield at that particular point, and the mean position of the horizonta!ity is often the best point at which to make a cut.
It is essential to realize that such a curve means a raw coal relatively easy to wash into (a) clean coal, and (b) refuse ; and that the middlings are probably not worth separation. The characteristics and the other curves for Indian coals, however, are often of the form shown in Fig. 4. These curves require much study. We have already referred to the convexity at V, the concavity at W, and the convexity again at X. The length VW usually covers the major part of the yield. It corresponds to the general nature of the " clean coal ",. and probably covers the varieties of durain ( dull hard splint coal ) which are making up the bulk
0 -(v • I I I I
20 c
-
""' 40
g w
>= BD 1- !\o 1-
80
-100
0
\ I I
20 I
40 60
ASH,% fl G.6.
I
-.... ~·
80 !DO
of the seam. In any system of coal purification we must recover the fraction VW, mixed perhaps with the lightest fractions shown by the portion of characteristic curve lying above V. Why the convex bend at V ? This is explained as stated earlier by the change from relatively pure bright coal above V. Such brights (mainly vitrain) have the lowest ash content, and are usually lighter in weight ( less dense ) than the bards covered by the portion VW; and, just as the convexity at X shows a change from ( impure ) coal to ( impure ) shale, so the convexity at V shows the change from vi train to durain, i.e. from the mainly brights to mainly bards. If there is a quantity of fairly homogeneous vi train, the characteristic shows not only convexity at V, but substantial verticality above V, i.e. it lies nearly parallel to the vertical axis if the brights are homogeneous.
The concavity at W, or more truly the approach to horizontality, indicates that the ash content increases rapidly for a slight change in yield. It shows therefore a marked change in the material, and this is clearly the region where we should normally attempt a separation- or, in washery terms, " make a cut ". But a decision ought not to be taken simply on the above grounds. The actual position of the curve on the diagram is of vital importance, as it shows the amount of ash in the fractions.
We have, therefore, also to refer to the floats/ash curve to see what will be the yield and the ash percentage at the proposed (specific gravity) cut; and then to consider ·whether the products we shall obtain will meet the requirements of the market.
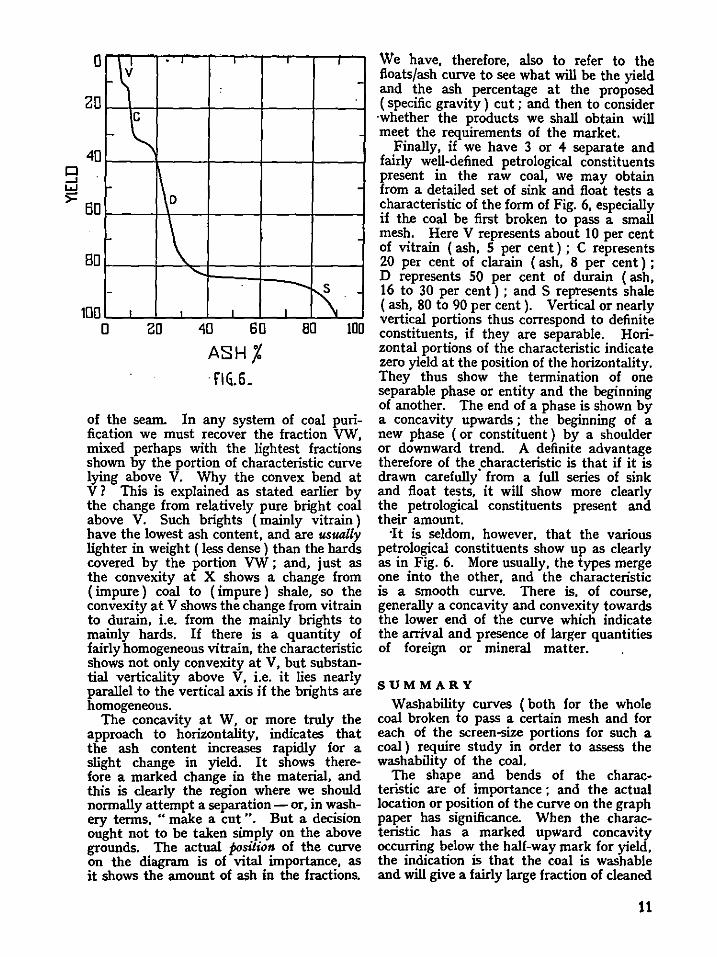
Finally, if we have 3 or 4 separate and fairly well-defined petrological constituents present in the raw coal, we may obtain from a detailed set of sink and float tests a characteristic of the form of Fig. 6, especially if the coal be first broken to pass a small mesh. Here V represents about 10 per cent of vitrain ( ash, 5 per cent) ; C represents 20 per cent of clarain ( ash, 8 per cent ) ; D represents 50 per cent of durain ( ash, 16 to 30 per cent) ; and S represents shale ( ash, 80 to 90 per cent ). Vertical or nearly vertical portions thus correspond to definite constituents, if they are separable. Horizontal portions of the characteristic indicate zero yield at the position of the horizontality. They thus show the termination of one separable phase or entity and the beginning of another. The end of a phase is shown by a concavity upwards ; the beginning of a new phase (or constituent) by a shoulder or downward trend. A definite advantage therefore of the characteristic is that if it is drawn carefully· from a full series of sink and float tests, it will show more clearly the petrological constituents present and their amount.
·It is seldom, however, that the various petrological constituents show up as clearly as in Fig. 6. More usually, the types merge one into the other, and the characteristic is a smooth curve. There is, of course, generally a concavity and convexity towards the lower end of the curve which indicate the arrival and presence of larger quantities of foreign or mineral matter.
SUMMARY
Washability curves (both for the whole coal broken to pass a certain mesh and for each of the screen-size portions for such a coal) require study in order to assess the washability of the coal.
The shape and bends of the characteristic are of importance ; and the actual location or position of the curve on the graph paper has significance. When the characteristic has a marked upward concavity occurring below the half-way mark for yield, the indication is that the coal is washable and will give a fairly large fraction of cleaned
11
coal. If such concavity is mtsSmg, or is but feebly developed, the coal is more difficult to wash, and the more nearly the characteristic curve approaches a vertical line, the more difficult is it to wash the coal.
From the characteristic curve are prepared two other important curves, namely the floats/ash curve and the sinks/ash curve. The former shows at once the ash of any particular yield of washed coal, while the sinks/ash curve shows the ash of the sinks for any particular yield of sinks. From the latter by calculation we may obtain the combustible content of the sinks, and thus assess the actual loss of heat, since for mo~t
12
coals, ash X 1·1 =mineral matter. The positions of the floats/ash and sinks/ash curves may be checked from the results of sink and float tests, after calculation.
From the characteristic curve, we may easily find the ash content of any middlings fraction, and alternatively the yield or amount of middlings of a stipulated ash.
The characteristic can frequently be used as a yield/gravity curve. Alternatively we may plot a separate curve connecting specific gravity and the amount of floats. The specific gravities of the cuts can then be determined for the main product and for the middlings. ·
PART 2
THE ASH UNITS CURVE
THE three washability curves already discussed, namely ( 1 ) the characteristic, ( 2 ) the floatsfash, and ( 3 ) the sinks/ash curves, are the recognized standard curves for demonstrating the results for a sink and float test ; and, as stated earlier, sets of these curves are required for any coal to cover the washability of each screen-size portion. The curves refer to percentages throughout : one has to keep in mind that in many cases the percentage is a fraction of a fraction of the whole coal.·
The information obtained from the sink and float tests and from the three curves, however, can be condensed into a single curve which we shall designate the " Ash Units Curve ", or simply the " Units Curve".
40
THE.
LOWER HllF (DOUBLE SCW:) 5 0 •
6 D . •
0' \\
aN \ 7
:~ II.. • "' 90 • •
.. ~ • .
6 • " . 100
0 10
A 51! UHIT5 CURV£ FIG.7.
~ • 20 .
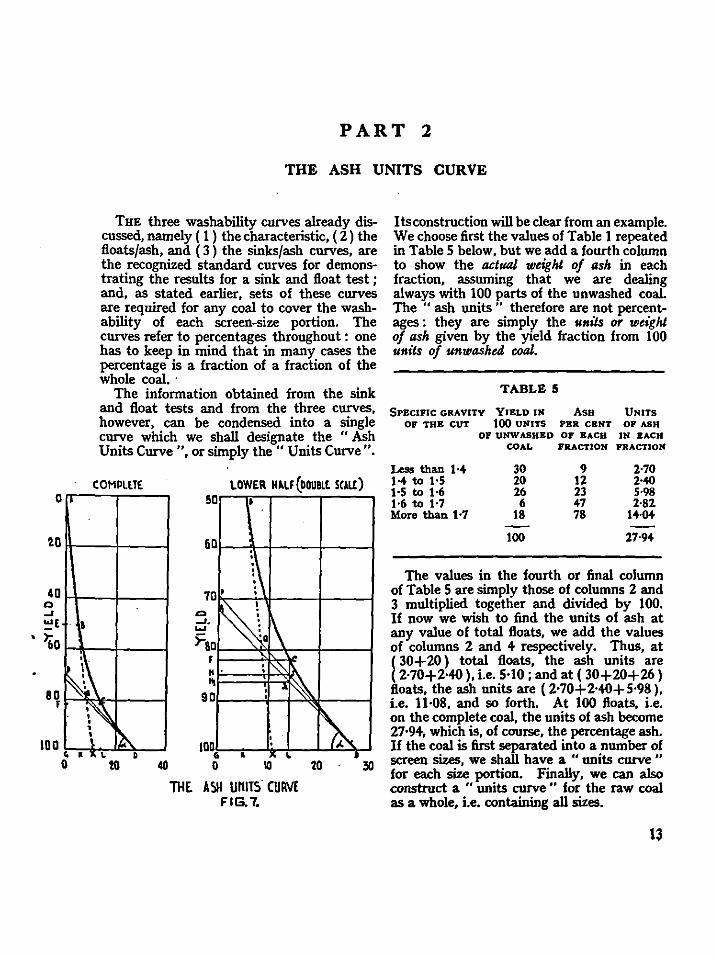
Its construction will be clear from an example. We choose first the values of Table 1 repeated in Table 5 below, but we add a fourth column to show the actual weight of ash in each fraction, assuming that we are dealing always with 100 parts of the unwashed coal. The " ash units " therefore are not percentages : they are simply the units or weight of ash given by the yield fraction from 100 units of unwashed coal.
TABLE 5
SPECIFIC GRAVITY YIELD IN ASH UNITS OF THE CUT 100 UNITS PBR CBNT OF ASH
OF UNW ASHBD OF BACH IN EACH COAL FRACTION FRACTION
Less than 1·4 30 9 2-70 HtoH 20 12 2-40 Htol-6 26 23 5·98 Htol-7 6 47 2-82 More than 1·7 18 78 14·04
100 27-94
The values in the fourth or final column of Table 5 are simply those of columns 2 and 3 multiplied together and divided by 100. If now we wish to find the units of ash at any value of total floats, we add the values of columns 2 and + respectively. Thus, at ( 30+ 20) total floats, the ash units are ( 2·70+2-+0 ), i.e. 5·10; and at ( 30+20+26) floats, the ash units are ( 2·70+2·+0+5·98 ), i.e. 11·08, and so forth. At 100 floats, i.e. on the complete coal, the units of ash become 27·9+, which is, of course, the percentage ash . If the coal is first separated into a number of screen sizes, we shall have a " units curve " for each size portion. Finally, we can also construct a " units curve " for the raw coal as a whole, i.e. containing all sizes.
13
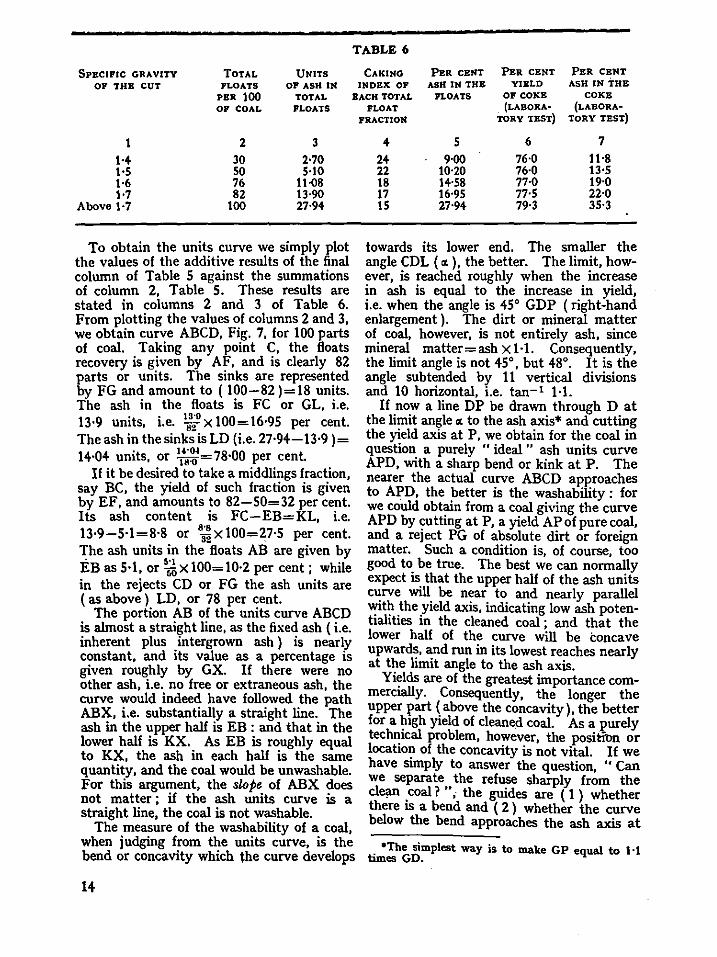
TABLE 6
SPECIFIC GRAVITY TOTAL UNITS CAKING PER CENT PER CENT PER CENT
OF THE CUT FLOATS OF ASH IN INDEX OP ASH IN THE YIELD ASH IN THE
PER 100 TOTAL EACH TOTAL FLOATS OP COKE COKE OP COAL FLOATS
1 2 3
1-4 30 2·70 1-5 so 5·10 1-6 76 11·08 1·7 82 13-90
Above 1·7 too 27-94
To obtain the units curve we simply plot the values of the additive results of the final column of Table 5 against the summations of column 2, Table 5. These results are stated in columns 2 and 3 of Table 6. From plotting the values of columns 2 and 3, we obtain curve ABCD, Fig. 7, for 100 parts of coal. Taking any point C, the floats recovery is given by AF, and is clearly 82 parts or units. The sinks are represented by FG and amount to ( 100-82 )= 18 units. The ash in the floats is FC or GL, i.e. 13·9 units, i.e. •;;• X 100= 16·95 per cent. The ash in the sinks is LD (i.e. 27-94-13-9 )= 14·04 units, or \'~~·= 78·00 per cent.
If it be desired to take a middlings fraction, say BC, the yield of such fraction is given by EF, and amounts to 82-50=32 per cent. Its ash content is FC-EB=KL, i.e.
8'8 13·9-5·1=8·8 or 32 x100=27·5 per cent. The ash units in the floats AB are given by
. 5•1 EB as 5·1, or 50 x 100= 10·2 per cent ; while in the rejects CD or FG the ash units are (as above) LD, or 78 per cent.
The portion AB of the units curve ABCD is almost a straight line, as the fixed ash (i.e. inherent plus intergrown ash ) is nearly constant, and its value as a percentage is given roughly by GX. If there were no other ash, i.e. no free or extraneous ash, the curve would indeed have followed the path ABX, i.e. substantially a straight line. The ash in the upper half is EB : and that in the lower half is KX. As EB is roughly equal to KX, the ash in each half is the same quantity, and the coal would be unwashable. For this argument, the slope of ABX does not matter ; if the ash units curve is a straight line, the coal is not washable.
The measure of the washability of a coal, when judging from the units curve, is the bend or concavity which the curve develops
FLOAT (LABORA• (LABORA·
FRACTION TORY TEST) TORY TEST)
4 5 6 7
24 9·00 76·0 11-8 22 10·20 76·0 13-5 18 14·58 77·0 19·0 17 16·95 77-5 22·0 IS 27·94 79·3 35·3
towards its lower end. The smaller the angle CDL ( ot ), the better. The limit, however, is reached roughly when the increase in ash is equal to the increase in yield, i.e. when the angle is 45° GDP (right-hand enlargement). The dirt or mineral matter of coal, however, is not entirely ash, since mineral matter= ash x 1·1. Consequently, the limit angle is not 45°, but 48°. It is the angle subtended by 11 vertical divisions and 10 horizontal, i.e. tan-• Jot.
If now a line DP be drawn through D at the limit angle "' to the ash axis* and cutting the yield axis at P, we obtain for the coal in question a purely " ideal " ash units curve APD, with a sharp bend or kink at P. The nearer the actual curve ABCD approaches to APD, the better is the washability : for we could obtain from a coal giving the curve APD by ~utting at P, a yield APof pure coal, and a reJect PG of absolute dirt or foreign matter. Such a condition is, of course, too good to be true. The best we can normally expect is that the upper half of the ash units curve will be near to and nearly parallel with the yield axis, indicating low ash potentialities in the cleaned coal ; and that the lower half of the curve will be concave upward~, 9;fid run in its lowest reaches nearly at the lim1t angle to the ash axis.
Yields are of the greatest intportance commercially. Consequently, the longer the upper part (above the concavity) the better for a ~igh yield of cleane!l coal. As a purely tech~tcal problem, however, the position or locatio~ of the concavity is not vital. If we have stmply to answer the question, " Can we separate the refuse sharply from the cle;m .coal ? ", the guides are ( 1 ) whether there IS a bend and ( 2 ) whether the curve below the bend approaches the ash axis at
. •The simplest way is te make GP equal te 1·1 times GD.
the limit angle. Thus, the units curve would still indicate excellent washability technically if it followed from point B downwards a path parallel to PD, although in this case the ash of the whole coal would be about 50 per cent. From 100 parts of such a coal, however, we could separate 50 parts ( AE) with an ash ( EB) of 5-l units ( 10·2 per cent), and reject the other 50 parts ( EG ) with an ash content of about 45 units, i.e. 100 per cent foreign matter and thus entirely noncombustible.
Curve ABCD and the limit angle line DP deserve further consideration in respect of the effects of making a cut at any desired point. When we cut at any point, C for example, we require to know what we shall gain and what we shall lose. From Fig. 7 ( enlargement, right hand) we see that we may obtain a yield of 82 per cent with 13·90 units of ash, i.e. 16·95 per cent ; while the refuse is 18 per cent and contains 14·04 units ( LD) of ash, i.e. 78·0 per cent. These results are good from a raw coal having 27·94 per cent of ash, but in the enlarged graph we can examine the relative fall from perfection .. Follow the line DP from D, and the curve DCB also from D. If the portion DC had been entirely mineral matter, the path of the ash units curve from D would have been that of DJP, not DC. In other words, CJ represents combustible matter and JJ1 represents (chiefly) water of hydration, and J 1L is the ash. CJ measures about 2·5 units, CL is 18. Consequently, the proportion of combustible matter in the rejects is ·~: x 100, i.e. 14 per cent. The loss on ignition would be CJ 1, which is considerably more, and amounts to about 22 per cent showing an ash content of 78 per cent. This agrees with the calculated ash figure of the rejects, i.e.
<27"94- 13"90) x 100=78 per cent. 18
When, therefore, we make a cut at any point at C, we can see graphically by dr?pping a perpendicular from C the relative proportions of combustible and incombustible matter in the rejects, and also the ash of the rejects, and their amount of w~ter of hydration. LJ 1 represents the ash m the rejects, and NJ1 is the ash in the floats. These in the diagram are approximately equal, but they will not be so if we choose any other point of cut. The ratio, however, NJ f ash units in floats LJ: is the ratio o ash unita in sinks"
Moreover, N,J,=GL, and LJ,=LD. In other words, the position of Lon the ash axis shows the relative amount of actual dirt removed. As LD is roughly half of GD, it is clear that roughly half the dirt is being removed in the rejects, although the amount of rejects is only 18 per cent of the whole coal. The distance GL shows that the other half of the dirt- is retained by the washed coal.
If the raw coal consisted only of coal with fixed ash on the one hand, and pure shale on the other, the point of intersection Q of the dotted line ABX with the straight line DP would give the best point of cut. Such a raw coal is, however, seldom encountered in practice.
To return to Table 6: Other values have been included which are of service when the coal is to be used for coking. The caking index of the total ·floats is given in column 4. The caking index is the measure of the agglutinating property of the coal ; it indicates how much sand may be mixed with unit weight of coal before the coke button becomes too weak. Where the coals are rich in durain, the caking index is a guide to the quality of the coke, and also to the amount of feebly caking coal that can be added to a strongly coking coal without destroying the strength of the coke produced from the mixture. In the last 2 columns of Table 6 are also shown the yields of coke and the ash in the coke of each fraction when different specific gravities of cut are employed. These values are of service. It is clear that if a maximum ash of 20 per cent only is allowable in the coke, the specific gravity of the cut must be about 1·62.
ASH UNITS CURVES FOR DIFFICULT COALS
We shall now consider the ash units curve of a coal difficult to wash. The coal chosen is the same as that illustrated earlier with normal washability curves in Fig. 4. The sink and float test results are given in Table 7 - simplified and rounded. It is repeated that in actual practice ( 1 ) we work to at least the first and often to the second decimal · place, and rounding of figures is not permissible ; ( 2) the graphs are best drawn on large first-class graph paper ; each diagram may well be 3 or 4 times the size of the page of this booklet ; ( 3 ) a length of ,u lust 10 in. is desirable for the vertical axis and 10 in. for the horizontal axis: a diagram of larger size is preferable.
15
0
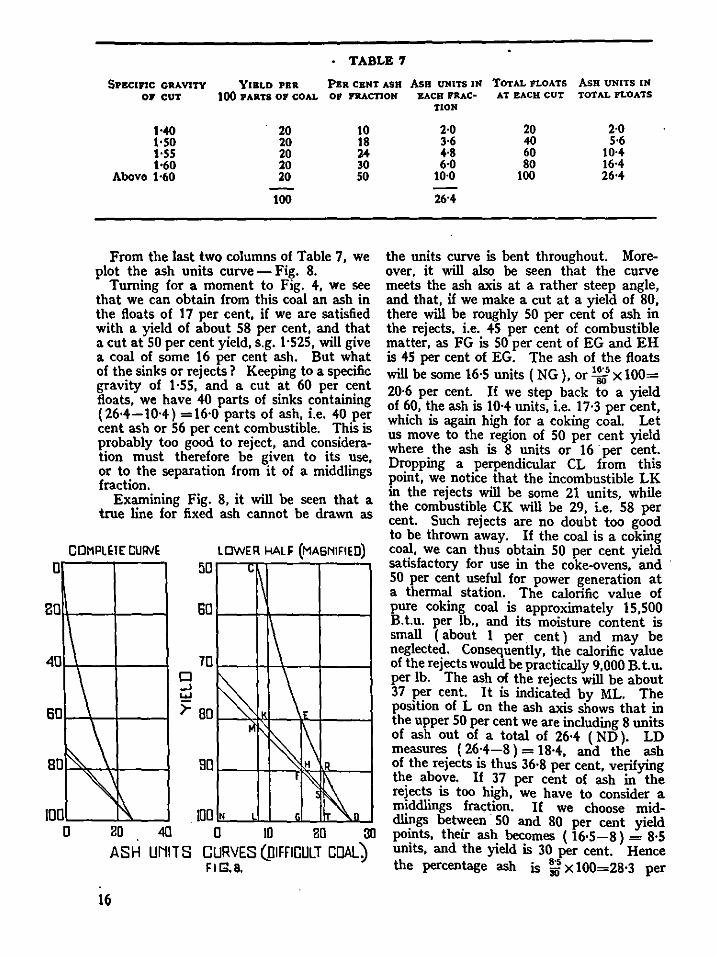
. TABLE 7
SPBCrnc GRAVITY YIBLD PER PltR CENT ASH
OJ' CUT 100 PARTS OF COAL OP ntAcnON
HO 20 10 JoSO 20 18 1-55 20 l4 1-60 20 30
Abovo 1·60 20 50
100
From the last two columns of Table 7, we plot the ash units curve- Fig. 8.
Turning for a moment to Fig. 4, we see that we can obtain from this coal an ash in the floats of 17 per cent, if we are satisfied with a yield of about 58 per cent, and that a cut at 50 per cent yield, s.g. 1·525, will give a coal of some 16 per cent ash. But what of the sinks or rejects ? Keeping to a specific gravity of 1·55, and a cut at 60 per cent floats, we have 40 parts of sinks containing ( 26·4-10·4) =16·0 parts of ash, i.e. 40 per cent ash or 56 per cent combustible. This is probably too good to reject, and consideration must therefore be given to its use, or to the separation from it of a middlings fraction.
Examining Fig. 8, it will be seen that a true line for fixed ash cannot be drawn as
COMPLETE CURVE LOWER HALF (MAGNIFIED)
50
AsH UNITS IN TOTAL FLOATS AsH UNITS IN BACH FRAC· AT EACH CUT TOTAL FLOATS
TION
2·0 20 2·0 3-6 40 5-6 4-8 60 10·4 6·0 80 16·4
10·0 100 26·4
26•4
80,1\----1------l
the units curve is bent throughout. Moreover, it will also be seen that the curve meets the ash axis at a rather steep angle, and that, if we make a cut at a yield of 80, there will be roughly 50 per cent of ash in the rejects, i.e. 45 per cent of combustible matter, as FG is 50 per cent of EG and EH is 45 per cent of EG. The ash of the floats will be some 16·5 units ( NG ), or '!;,' x 100= 20·6 per cent. If we step back to a yield of 60, the ash is 10·4 units, i.e. 17·3 per cent, which is again high for a coking coal. Let us move to the region of 50 per cent yield where the ash is 8 units or 16 per cent. Dropping a perpendicular CL from this point, we notice that the incombustible LK in the rejects will be some 21 units, while the combustible CK will be 29, i.e. 58 per cent. Such rejects are no doubt too good to be thrown away. If the coal is a coking coal, we can thus obtain 50 per cent yield satisfactory for use in the coke-ovens, and · 50 per cent useful for power generation at a thermal station. The calorific value of pure coking coal is approximately 15,500 B.t.u. per lb., and its moisture content is small ( about 1 per. cent ) and may be neglected. Consequently, the calorific value of the rejects would be practically 9,000 B.t.u. per lb. The ash of the rejects will be about 37 per cent. It is indicated by ML. The position of L on the ash axis shows that in the upper 50 per cent we are including 8 units of ash out of a total of 26·4 ( ND ). LD measures ( 26·4-8) = 18·4, and the ash of the rejects is thus 36·8 per cent, verifying the above. If 37 per cent of ash in the rejects is too high, we have to consider a middlings fraction. If we choose middlings between · 50 and 80 per cent yield points, their ash becomes ( 16·5-8) = 8·5 units, and the yield is 30 per cent. Hence the percentage ash is :x100=28·3 per
20 40 ASH UNITS
16
ruo~"--~L-~~~u 0 ID 80 30
CURVES QIIFFII::ULT COAL) FIG. a.
cent. Whether such a course is to be adopted will depend upon the particular conditions which have to be faced ; but in many circumstances, it- may be wise to reject the dirtiest 10 or 20 per cent of the output of raw coal. At present, this is often done crudely by hand-picking. It remains to add that in the rejects, after removing the middlings, the ash is only 50 per cent, i.e. if we choose to reject the dirtiest 20 per cent of the raw coal ; whereas, if we choose to reject only 10 per cent (i.e. below 90 yield point), the ash of the rejects, as indicated by ST, will be more nearly 55 per cent. The ash, however, in the middlings will then be about 31 per cent.
Summarizing, in a coal difficult to wash, the deviation of the ash units curve in its lower reaches from the limit angle is marked. This shows that no matter where we make the cut we shall always have a large amount of combustible matter in the rejects. If the coal has already been broken to as small a size as is practicable, we have first to make a decision whether to attempt washing at all. n it is decided to wash, we have then to determine what fractions we shall take, and whether to attempt to take off a middlings product before the rejects. Decision on these issues can be made only in the light of the demand or shortage of coking or other coals, and of the market conditions.
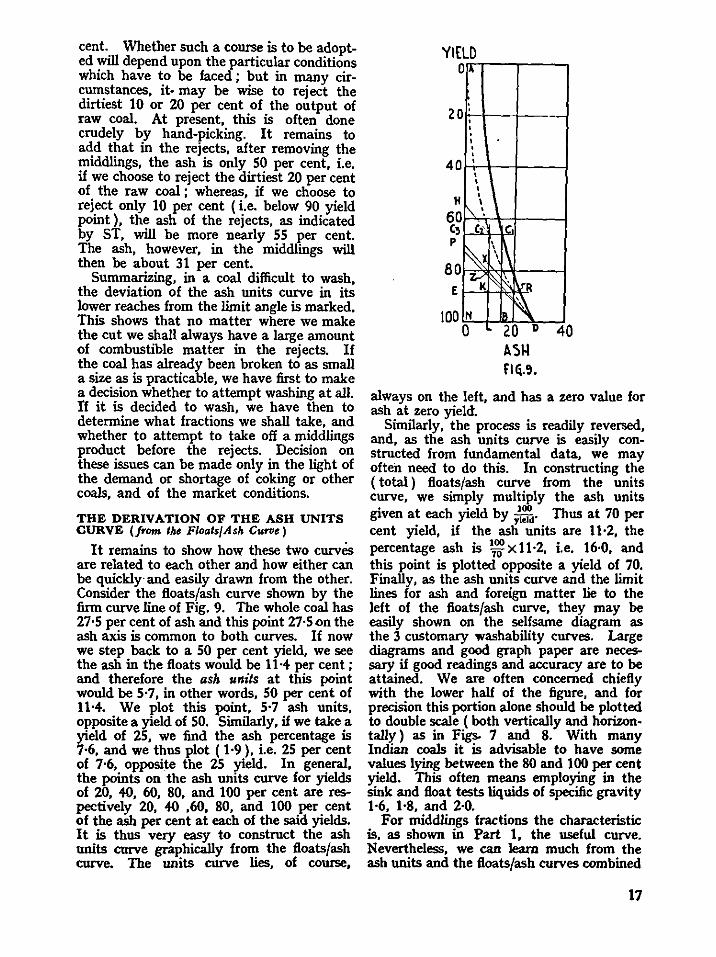
THE DERIVATION OF THE ASH UNITS CURVE (from IM FloalsJA.sh Curoe)
It remains to show how these two curves are related to each other and how either can be quickly· and easily drawn from the other. Consider the floats/ash curve shown by the firm curve line of Fig. 9. The whole coal has 27·5 per cent of ash and this point 27·5<>n the ash axis is common to both curves. If now we step back to a 50 per cent yield, we see the ash in the floats would be 11·4 per cent ; and therefore the ash units at this point would be 5·7, in other words, 50 per cent of 11·4. We plot this point, 5·7 ash units, opposite a yield of 50. Similarly, if we take a yield of 25, we find the ash percentage is 7·6, and we thus plot ( 1·9 ), i.e. 25 per cent of 7·6, opposite the 25 yield. In general, the points on the ash units curve for yields of 20, 40, 60, 80, and 100 per cent are respectively 20, 40 ,60, 80, and 100 per cent of the ash per cent at each of the said yields. It is thus very easy to construct the ash units curve graphically from the floats/ash curve. The units curve lies, of course,
YIELD o,.
zo
40
H
60 c, p
80 E
100
;
' ' ' ' ' ' ' ' ' ' • I "·. '" ~ I~
N
IC
\i\ '
~ D 0 20 40
A~l-1 FICi.S.
always on the left, and has a zero value for ash at zero yield.
Similarly, the process is readily reversed, and, as the ash units curve is easily constructed from fundamental data, we may often need to do this. In constructing the ( total ) floats/ash curve from the units curve, we simply multiply the ash units given at each yield by :0':.. Thus at 70 per cent yield, if the ash units are 11·2, the percentage ash is 17~ X 11·2, i.e. 16·0, and this point is plotted opposite a yield of 70. Finally, as the ash units curve and the limit lines for ash and foreign matter lie to the left of the floats/ash curve, they may be easily shown on the selfsame diagrant as the 3 customary washability curves. Large diagrantS and good graph paper are necessary if good readings and accuracy are to be attained. We are often concerned chiefly with the lower half of the figure, and for precision this portion alone should be plotted to double scale ( both vertically and horizontally ) as in Figs. 7 and 8. With many Indian coals it is advisable to have some values lying between the 80 and 100 per cent yield. This often means employing in the sink and float tests liquids of specific gravity 1-6, 1·8, and 2·0.
For middlings fractions the characteristic is, as shown in Part 1, the useful curve. Nevertheless, we can learn much from the ash units and the floats/ash curves combined
17
QS ln Fig. 9. Thus, if we wish first for a ( floats ) yield of 15 per cent ash, we erect a perpendicular at B, the 15 ash value. It cuts the floats ash curve at C1, showing a yield of 66 per cent. We now draw C1C1C3 to cut the units curve at C1 , and drop the perpendicular C1L. In Fig. 9, Z, the point of mtersection of C,L with DP, happens to lie on the 80 yield line, and the distance C.Z measures 14 units. The combustible in the rejects is thus 1 ,0:~ 061 x100- roughly 41 per cent, showing a mineral content of 59 or ash of 54 per cent. This refuse alone then is hardly serviceable. If however we reject, say, the last 7·5 units of ash, and take the vertical line through the 20 mark on the ash axis, we find it cuts the units curve at R, the yield value (at E) being 88 per cent. Through R we draw the horizontal EKR and also RX parallel to DP, cutting C1L in X. We can now consider the middlings C1R (or C8E ), which amount to 22 per cent.
Of the fraction C3E or C1K, C1X is combustible, and XK is incombustible. C,X measures 11 units, i.e. ~ x 100, or SO per cent. XK is therefore also 50, i.e. roughly 45 of ash and 4·5 of water of hydration. The ash content of the middlings is thus still as high as 45 per cent -verified by
~~X 100=~ X 100=45·5 per cent. Such middlings are generally not of serviceable quality for most purposes, and are thus not worth recovery. Indeed from the coal of Fig. 9, it is probably best to take off only one product, i.e. no middlings. The product may give 15 per cent ash when the washed coal yield will be 66 per cent of the washery input. Alternatively, we may produce a 16 per cent ash coal and have a yield of about 70 per cent- as shown by the floats/ash curve. To analyse the floats at a yield of
18
66 per cent, we draw through C, the line C,H at the limit angle 48° to the horizontal, cutting the yield axis at H. The amount of pure ( mineral-free ) coal•in the washed products is shown graphically as AH, i.e. 55 per cent : the amount of pure coal in the rejects is C.Z or 14 per cent. Together they amount to 69 per cent. [The true value should be ( 100-27·5 x H ), i.e. 69·75.] Regarding the mineral matter or dirt, HC. gives the dirt in the washed coal, and ZL gives the dirt in the sinks, C.L. HC. is 11, ZL is 20, totalling 31 against an arithmetic value of 30· 25. A larger diagram would have reduced these discrepancies.
The probability that the above coal will not give a useful middlings after removal of 66 per cent is seen if we consider the position of point L. NL is 10 units, ND is 27·5. Clearly therefore 17·5 ash units are in the rejects and we have thus removed ~;::X 100, i.e. 63·5 per cent of the ash or dirt, while only losing 34 per cent of the whole. .And this 34 per cent is by no means pure coal : it consists of 14 parts of pure coal, and 20 parts of mineral or foreign matter, as pointed out. Consequently, the true loss of pure fuel is not 100-66, i.e. 34 per cent, but 14 per cent, as represented by C.,Z.
When accurate values are required, the lower half of Fig. 9 should be drawn to a large scale. It is essential to have large and accurate charts for the ash units curve, as for the 3 usual washability curves. The chief advantage of the ash units curve as a supplement to the usual washability curves is that we are enabled to see graphically the relative distribution of the foreign matter and of the pure coal substance in the sinks and in the floats ; and it provides a valuable check on deductions made from the 3 usual curves.
PART 3
WASHABILITY, SIZING, AND BREAKAGE
WE shall now consider a series of curves obtained for a difficult coal tested at the Fuel Research Institute. We are indebted to the staff engaged on washability testing for the results.
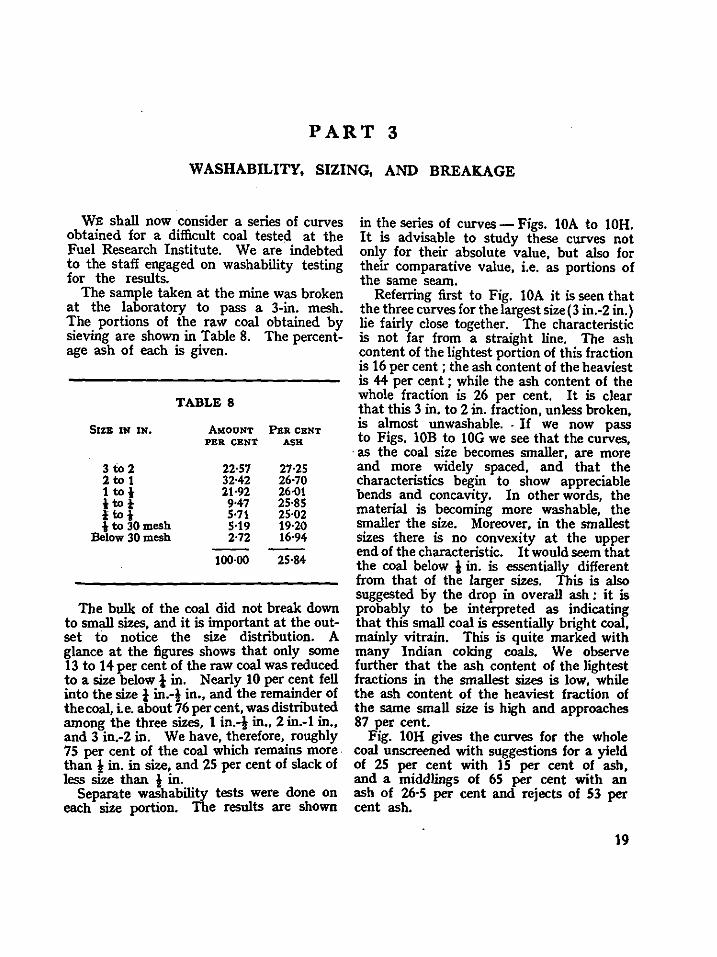
The sample taken at the mine was broken at the laboratory to pass a 3-in. mesh. The portions of the raw coal obtained by sieving are shown in Table 8. The percentage ash of each is given.
TABLE 8
SlZB IN IN. AMOUNT PER CENT PER CENT ASH
3to2 22-57 27-25 2tot 32-42 26·70 !tot 21·92 26·01 itoi 9·47 25-85 ltot 5·71 25-02 t to 30mesh 5-19 19·20
Below 30 mesh 2·72 16·94
100·00 25·84
The bulk of the coal did not break down to small sizes, and it is important at the outset to notice the size distribution. A glance at the figures shows that only some 13 to 14 per cent of the raw coal was reduced to a size below 1 in. Nearly 10 per cent fell into the size 1 in.-! in., and the remainder of the coal, i.e. about 76 per cent, was distributed among the three sizes, 1 in.-! in., 2 in.-1 in., and 3 in.-2 in. We have, therefore, roughly 75 per cent of the coal which remains more. than l in. in size, and 25 per cent of slack of less size than l in.
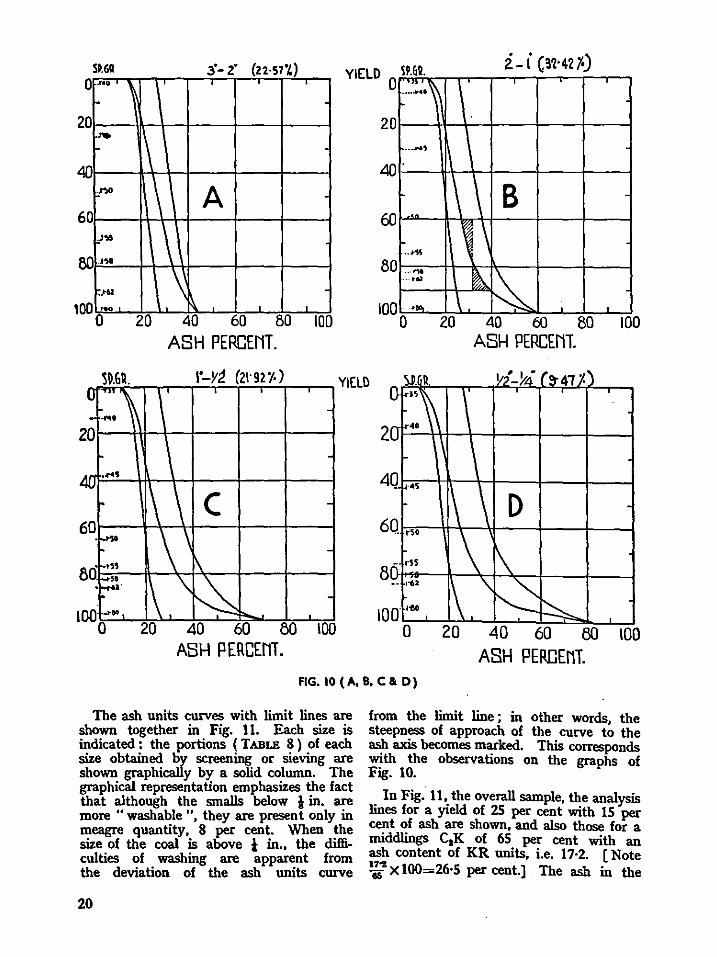
Separate washability tests were done on each size portion. The results are shown
in the series of curves- Figs. lOA to lOR. It is advisable to study these curves not only for their absolute value, but also for their comparative value, i.e. as portions of the same seam.
Referring first to Fig. lOA it is seen that the three curves for the largest size(3 in.-2 in.) lie fairly close together. The characteristic is not far from a straight line. The ash content of the lightest portion of this fraction is 16 per cent ; the ash content of the heaviest is 44 per cent ; while the ash content of the whole fraction is 26 per cent. It is clear that this 3 in. to 2 in. fraction, unless broken, is almost unwashable. - If we now pass to Figs. lOB to lOG we see that the curves,
· as the coal size becomes smaller, are more and more widely spaced, and that the characteristics begin to show appreciable bends and concavity. In other words, the material is becoming more washable, the smaller the size. Moreover, in the smallest sizes there is no convexity at the upper end of the characteristic. It would seem that the coal below i in. is essentially different from that of the larger sizes. This is also suggested by the drop in overall ash : it is probably to be interpreted as indicating that this small coal is essentially bright coal, mainly vitrain. This is quite marked with many Indian coking coals. We observe further that the ash content of the lightest fractions in the smallest sizes is low, while the ash content of the heaviest fraction of the same small size is high and approaches 87 per cent.
Fig. lOH gives the curves for the whole coal unscreened with suggestions for a yield of 25 per cent with 15 per cent of ash, and a middlings of 65 per cent with an ash of 26·5 per cent and rejects of 53 per cent ash.
19
SP.GR 0
3'- z• (Z2·57'L) YIELD SPGR 0
i-i C~N2.%) .uo
' I ' -
6
~ l\ p."" \ A
0 J .. \ .... :.>61 ~
20
40
80
o,~ ~ ' 10 0 20 40 60 50 100
ASH PERCENT.
.... ·: .. ~ I '
1-20
....... '!1
\ B ~ \
60
. ... ~ .•• ¥'\&
~ k ·--t~
... \
80
100 0 20 40 60 80 100
ASH PERCENl
1'-Yt! (21· 92 'l·) .. YIELD :»1.6~ Y2-Jt4 (9"41 Y.) 0 u
' ' '
-- ..... 2 0
.
10 & .....
\ \ c r
0 ...... \
4
6 -
0 '" ,,
:-'" \.\ ~ r<"""
f->oo ~ '
8
20 40 60 50 100
ASH PERCEflT.
~"~
20 ·40
4Q •••
60 . t50
. rSS
• 1"61
..... 100
0
\ ,\
1 \ D .
\ i\ 1\ \ ~ ~
20 40 60 00 100 ASH PERCEnT.
FIG. 10 (A, B, CloD)
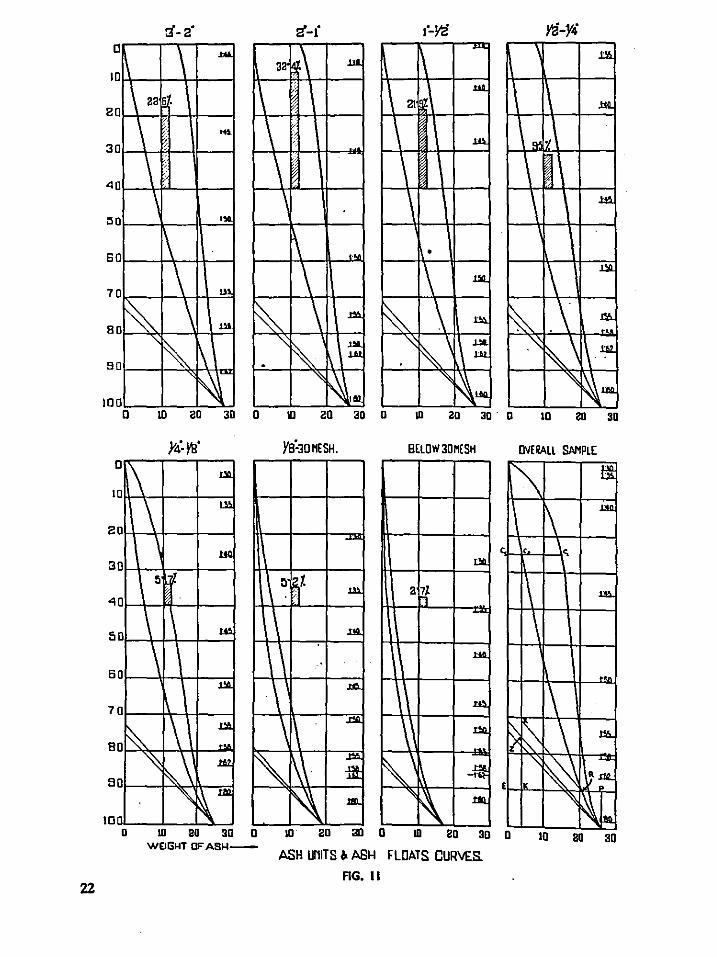
The ash units curves with limit lines are shown together in Fig. 11. Each size is indicated: the portions (TABLE 8) of each size obtained by screening or sieving are shown graphically by a solid column. The graphical representation emphasizes the fact that although the smalls below l in. are more " washable ", they are present only in meagre quantity, 8 per cent. When the size of the coal is above 1 in., the difficulties of washing are apparent from the deviation of the ash units curve
20
from the limit line ; in other words, the steepness of approach of the curve to the ash axis becomes marked. This corresponds with the observations on the graphs of Fig. 10.
. In Fig. 11 •. the overall sample, the analysis lines for a yteld of 25 per cent with 15 per cent of ash are shown, and also those for a middlings C.K of 65 per cent with an ash content of KR units, i.e. 17·2. [Note 1:S .. X 100=26·5 per cent.] The ash in the
~P.G~ • • Y4-Ye (5·71~·>
~~- \ -
-~··\ \ \
\ -
-<4"45 \ E \ ... \ . ~-ss 1\ •••
·Jo6t "\
~ . -~-eo· \ ~ ' ' .
0 zo 40 60 50 10
20
40
60
8f]
100
ASH PERCENT. X ~0 MESH (Z·12'/-)
' \ -
. t\' i\
.. ·:\ \ G - . -- ···~ \ \
20
40
60
. ""''\ :\ '"\.
.. ,,,~\
""" ~ ·--1·60 ~ L
BO -
100 0 2.0 40 60 80 100
ASH PERCENT
• YIELD QrS:.:.P:;:.GQ:::,.-,;.!'8-'T--=30~M:!lEC:S::_:H:;_:(5-~19'.;.'.4:!.)-.--,
2o I\ 40 ... :·· \
.... \ \ F 60.,., '\-\~
·~· 80,~~~-\~~-~--+-~ ·--=':11 \ " ·""-
10 0 ,... r-:--:: 1:::--..
0 20 40 60 80 100
ASH PERCENT
ASH PERCENT_
FIG. 10 ( E, F, G & H)
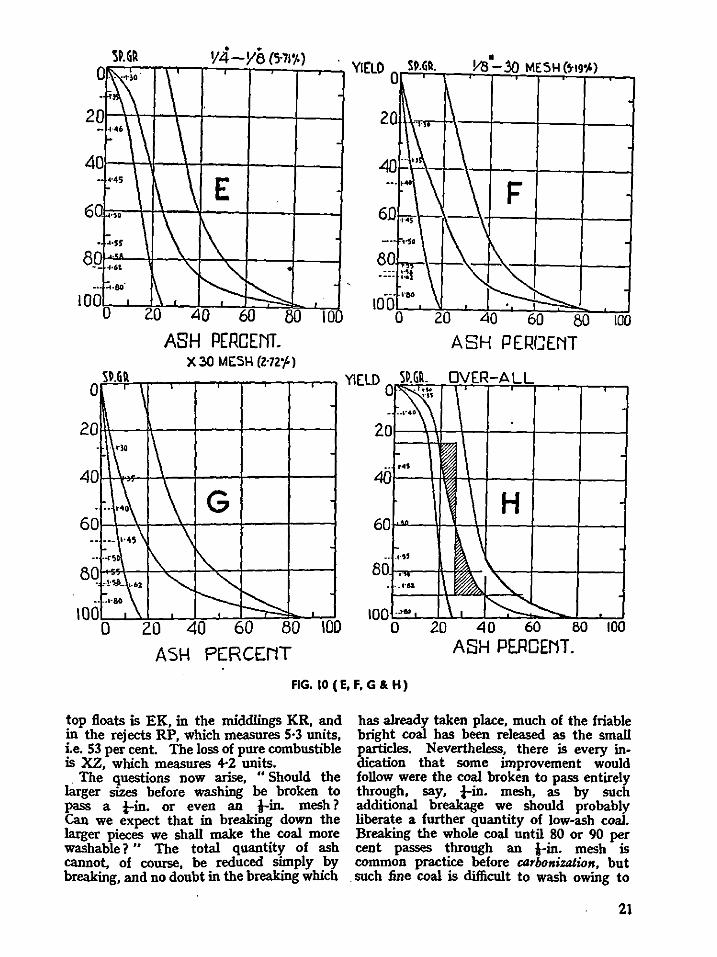
top floats is EK, in the middlings KR, and in the rejects RP, which measures S-3 units, ie. 53 per cent. The loss of pure combustible is XZ, which measures +2 units. . The questions now arise, " Should the
larger sizes before washing be broken to pass a t-in. or even an J-in. mesh? Can we expect that in breaking down the larger pieces we shall make the coal more washable? " The total quantity of ash cannot, of course, be reduced simply by breaking, and no doubt in the breaking which
has already taken place, much of the friable bright coal has been released as the small particles. Nevertheless, there is every indication that some improvement would follow were the coal broken to pass entirely through, say, !-in- mesh, as by such additional breakage we should probably liberate a further quantity of low-ash coal. Breaking the whole coal until 80 or 90 per cent passes through an l-in. mesh is common practice before carbonization, but
. such Jine coal is difficult to wash owing to
21
22
11 \ ....
20 \ za s.
\ ~ ... 30
I ;
4 0 _t \
0 "' 6 0 \ 7 0 _\ ... 8 0~ \ .Lil
' ~ 0 l} s
10 0 ~
32 ~\ ;
I ;
\ I
~ \
~ \ '\ ~ .
""
.l.d
....
.....
~
,\ 1'\~,111
21 :--
I I
1"-Y<:! Yi-Y4
~11.
I
•
1\ ~-
o 10 ao aoo 10 ao aoo to ao aoo 10 20 ao
BELOW 3D MESH OVERAll SAMPLE
[\ ffi:
1\ 1!1>.
- c ~ Llll
:~·~1. 1.1>. 2tf \ m
.m \ .w ..
·~
100~--==--:::~= 0 to
WDGIIT DF AS>-1-10 20 300 to 20 300
ASH UNITS. ASH FLOATS CURVES.
J:C
I
\·\ ..,.
"'' :;
~ Jill.
.u:
\ ~
.... ~ \\ -f.f
~ .tlQ
1\ ~~ \ 1!6.
" ~ E ~.a
~
~ ~ 10 20 30
AG. II
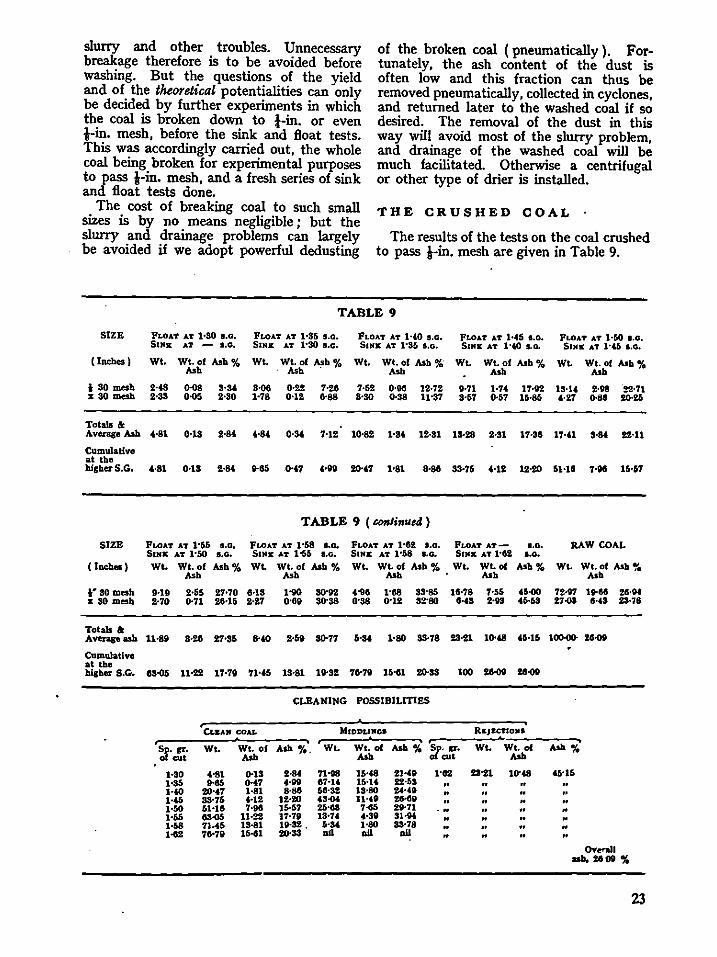
slurry and other troubles. Unnecessary breakage therefore is to be avoided before washing. But the questions of the yield and of the theoretical potentialities can only be decided by further experiments in which the coal is broken down to !-in. or even l-in. mesh, before the sink and float tests. This was accordingly carried out, the whole coal being broken for experimental purposes to pass l-in. mesh, and a fresh series of sink and float tests done.
of the broken coal (pneumatically). Fortunately, the ash content of the dust is often low and this fraction can thus be removed pneumatically, collected in cyclones, and returned later to the washed coal if so desired. The removal of the dust in this way will avoid most of the slurry problem, and drainage of the washed coal will be much facilitated. Otherwise a centrifugal or other type of drier is installed.
The cost of breaking coal to such small sizes is by no means negligible ; but the slurry and drainage problems can largely be avoided if we adopt powerful dedusting
THE CRUSHED COAL
SIZE
(Inches)
i SO mesh • so mesh
Totals & Average Ash
CumulaUvo at tbe higbetS.G.
SIZE
(Inches)
1• SO mesh s SO mesh
Totals & Averaseash
Cumulative at the hlgbeT s.G.
The results of the tests on the coal crushed to pass l-in. mesh are given in Table 9.
TABLE 9
FLOAT AT 1•30 1.0. FLOA'I' A'f 1•35 S.O. FLOAT AT 1•4-0 s.G. FLOAT AT 1•45 1.0. FLOAT AT 1•50 1.0. SUlK •• - I.G, SINK. AT t·SO s.o. StNK AT 1'35 I,Q, SUlK AT l•tQ loG. SINK AT 1•46 I,Q,
WI. Wt.of Ash% WI. Wt. of Asb% Wt. Wt. of Asb %. Wt. Wt. of Ash% w. Wt. of Alb% Ash Ash . Ash Ash Ash
2·<8 0.08 .... 8·06 0·22 7·26 7·52 0·96 12·72 0·71 1•7-' 1'1·92 15·14 2·96 !!·71 2·33 O.OG 2·30 1·78 0·12 0·88 8·SO 0•38 11•37 3·57 0·57 U·85 4·27 0·88 20·211
4·81 o-lS 2·M ,.8, 0· .. 7·12 10·82 1•3& 12·31 13-28 2-31 17·36 17·41 S·M 22·11
4·81 0·13 2·M 9-65 0·,7 HQ 20·i7 1•81 8·88 33·75 H2 12•20 51·16 7·96 15•67
TABLE 9 ( &Onlinue4)
FLOAT AT 1•55 a.o. FLOAT AT 1•58 .... FLOAT AT 1•82 1.0. FLOA'r AT- 1.0 • RAW COAL StHK AT: 1•50 s.o. SIMI: AT: 1-65 .... SIMI: A"t }•58 I. G. Sr11x: A"t J•G2 s.o. Wt. Wt. of Ash% WL Wt. of Ash% WL Wt. of Ash% Wt. Wt. of Ash% Wt. Wt.of Asb%
Ash Ash ..... ..... Ash
IH9 2•55 27•70 4H3 1110 80•92 , ... 1•88 38'85 18·78 7·55 4G.OO 72·97 19·86 26· .. 2·70 0·71 26•16 2·27 0•69 30"38 o·ss 0•12 32'80 15-fS HS 45·69 27.0S IHS Z3·78
11·89 8·26 27•36 HO 2·G9 S0·77 6· .. 1-80 33·78 23·21 UHS 41»-16 100-oo- 20-o9
es.o5 11•22 17•70 71-46 13·81 19-32 '16·70 16•61 ZO·SS 100 26-oQ 20-oQ
CLEANING POSSIBILmES
CI.&A• CO.U. MIDDLINGS REJI:CTI0111
~ ..... w. we. of Ash%. Wt. Wt. of Ash% :r· ... WL Wt. of Ash% cut Ash Ash cut Ash
1·30 4·81 Il-lS 2·M n·M 15·48 21•40 1"02 23-21 10"48 46•16 1-35 9-65 o-•7 •·QQ 87·1t 11H4 2:2·53 .. .. HO 20·o&7 1·81 8·88 58·32 19·80 24·4D
" .. H5 33·76 f,·12 12·20 ..... 11·40 ze.•• " 1-GO 61·US 7·96 15·57 211·63 7·65 :20·71 .. .. " H6 ..... 11·22 17·70 13•7C f,·30 91·94.
" " 1-58 71.45 13·81 10·32' .... 1·80 83•78 .. • 1 ... 78•70 16·G1 20-33 a1l a1l a1l • • • OYenll
ash, 26011%
23
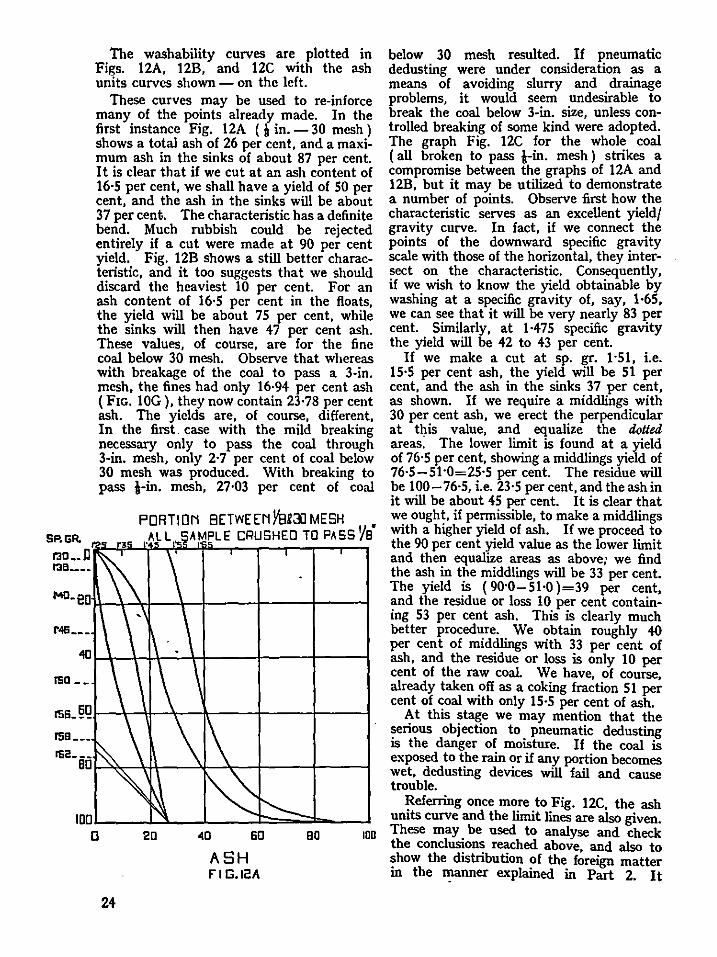
SP.GR. t:!O __ JJ raa __ _
r4a __ _
ISO ••
The washability curves are plotted in Figs. 12A, 12B, and 12C with the ash units curves shown - on the left.
These curves may be used to re-inforce many of the points already made. In the first instance Fig. 12A ( i in.- 30 mesh) shows a total ash of 26 per cent, and a maximum ash in the sinks of about 87 per cent. It is clear that if we cut at an ash content of 16·5 per cent, we shall have a yield of SO per cent, and the ash in the sinks will be about 37 per cent. The characteristic has a definite bend. Much rubbish could be rejected entirely if a cut were made at 90 per cent yield. Fig. 12B shows a still better characteristic, and it too suggests that we should discard the heaviest 10 per cent. For an ash content of 16·5 per cent in the floats, the yield will be about 75 per cent, while the sinks will then have +7 per cent ash. These values, of course, are for the fine coal below 30 mesh. Observe that whereas with breakage of the coal to pass a 3-in. mesh, the fines had only 16·9+ per cent ash (FIG. lOG), they now contain 23·78 per cent ash. The yields are, of course, different, In the first. case with the mild breaking necessary only to pass the coal through 3-in. mesh, only 2·7 per cent of coal below 30 mesh was produced. With breaking to pass l-in. mesh, 27·03 per cent of coal
PORTION 8ETWEENY8R31J MESH • ALL AMPLE CRUSHED ro PASS Ya
3S I'
1'56. ~gl---\--1-1-~~r----+--+---l rsa __ _
below 30 mesh resulted. If pneumatic dedusting were under consideration as a means of avoiding slurry and drainage problems, it would seem undesirable to break the coal below 3-in. size, unless controlled breaking of some kind were adopted. The graph Fig. 12C for the whole coal ( all broken to pass i-in. mesh ) strikes a compromise between the graphs of 12A and 12B, but it may be utilized to demonstrate a number of points. Observe first how the characteristic serves as an excellent yield/ gravity curve. In fact, if we connect the points of the downward specific gravity scale with those of the horizontal, they intersect on the characteristic. Consequently, if we wish to know the yield obtainable by washing at a specific gravity of, say, 1·65, we can see that it will be very nearly 83 per cent. Similarly, at 1·+75 specific gravity the yield will be +2 to +3 per cent.
If we make a cut at sp. gr. 1·51, i.e. 15·5 per cent ash, the yield will be 51 per cent, and the ash in the sinks 37 per cent, as shown. If we require a middlings with 30 per cent ash, we erect the perpendicular at tl)is value, and equalize the doUed areas. The lower limit is found at a yield of 76·5 per cent, showing a middlings yield of 76·5-51·0=25·5 per cent. The residue will be 100-76·5, i.e. 23·5 per cent, and the ash in it will be about +5 per cent. It is clear that we ought, if permissible, to make a middlings with a higher yield of ash. If we proceed to the 90 per cent yield value as the lower limit and then equalize areas as above; we find the ash in the middlings will be 33 per cent. The yield is ( 90·0- 51-0 )=39 per cent, and the residue or loss 10 per cent containing 53 per cent ash. This is clearly much better procedure. We obtain roughly +0 per cent of middlings with 33 per cent of ash, and the residue or loss is only 10 per cent of the raw coal. We have, of course, already taken off as a coking fraction 51 per cent of ~oal with only 15·5 per cent of ash.
At thts stage we may mention that the serious objection to pneumatic dedusting is the danger of moisture. If the coal is exposed to the rain or if any portion becomes wet, dedusting devices will fail and cause trouble.
Referring once more to Fig. 12C, the ash IDDL---...J....3..._..-l __ _...:::t:::=,;::::I= __ _J units curve and the limit lines are also given.
D 20 ~D 60 80 100 These may be used to analyse and check the conclusions reached above and also to
A S H ~how the distribution ?f the !~reign matter F I G.I2A m the manner explamed in Part 2. It
2+
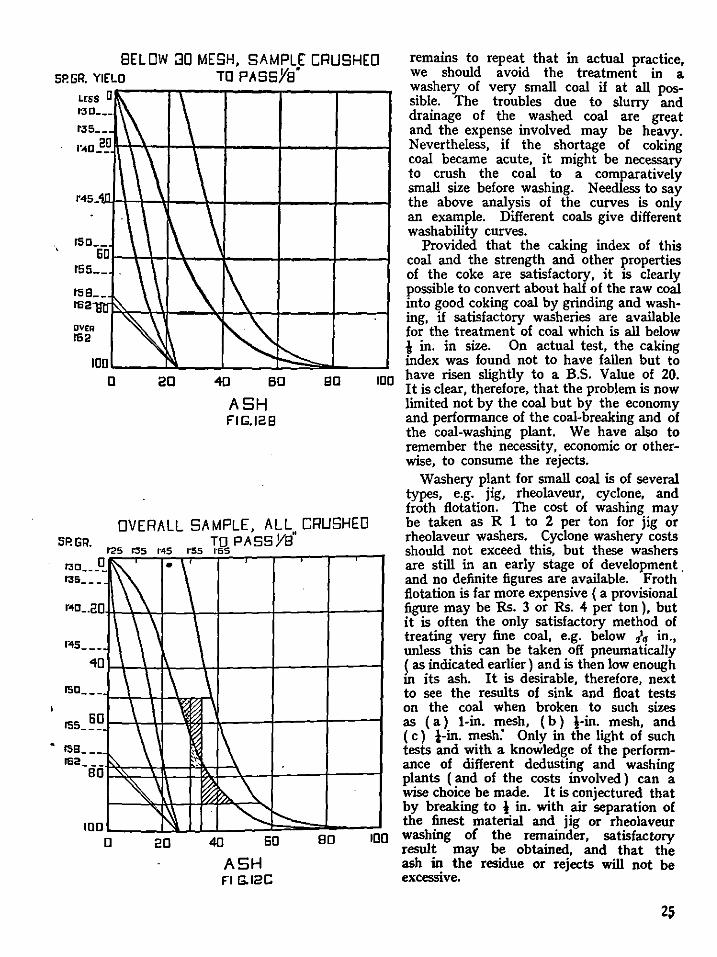
BELOW ::30 MESH, SAMPLE CRUSHED 5P.GR. YIELD TO PASSYs"
r4s_
rso __ ' 60
155 __
t58 __
1'62
DVER 162
IDD D 20 40 60
ASH FIG.I28
80
OVERALL SAMPLE, ALL CRUSHED sP.GR. PAssYs"
1'25 r-35 1"45 1"55 I"
r.m ___ o 135_--
1~5 __
100
100 L._ _ _l1Ll-L-~:1=.-:~~-~. D 20 40 80 IDD
ASH F1 G.I2C
remains to repeat that in actual practice, we should avoid the treatment in a washery of very small coal if at all possible. The troubles due to slurry and drainage of the washed coal are great and the expense involved may be heavy. Nevertheless, if the shortage of coking coal became acute, it might be necessary to crush the coal to a comparatively small size before washing. Needless to say the above analysis of the curves is only an example. Different coals give different washability curves.
Provided that the caking index of this coal and the strength and other properties of the coke are satisfactory, it is clearly possible to convert about half of the raw coal into good coking coal by grinding and washing, if satisfactory washeries are available for the treatment of coal which is all below l in. in size. On actual test, the caking index was found not to have fallen but to have risen slightly to a B.S. Value of 20. It is clear, therefore, that the problem is now limited not by the coal but by the economy and performance of the coal-breaking and of the coal-washing plant. We have also to remember the necessity, economic or otherwise, to consume the rejects.
Washery plant for small coal is of several types, e.g. jig, rheolaveur, cyclone, and froth flotation. The cost of washing may be taken as R 1 to 2 per ton for jig or rheolaveur washers. Cyclone washery costs should not exceed this, but these washers are still in an early stage of development . and no definite figures are available. Froth flotation is far more expensive ( a provisional figure may be Rs. 3 or Rs. 4 per ton), but it is often the only satisfactory method of treating very fine coal, e.g. below .;. in., unless this can be taken off pneumatically ( as indicated earlier) and is then low enough in its ash. It is desirable, therefore, next to see the results of sink and float tests on the coal when broken to such sizes as (a) 1-in. mesh, (b) l-in. mesh, and ( c ) i-in. mesh." Only in the light of such tests and with a knowledge of the performance of different dedusting and washing plants ( and of the costs involved) can a wise choice be made. It is conjectured that by breaking to ! in. with air separation of the finest material and jig or rheolaveur washing of the remainder, satisfactory result may be obtained, and that the ash in the residue or rejects will not be excessive.
REJECTS
The ash of the whole coal is 26 per cent. If we remove 51 per cent of the latter coal as washed coal or floatings with an ash of 15·5 per cent, the ash in the residue is
( 26 x too >;9( 51 x ts·s l, i.e. 37 per cent.
If coal containing this proportion of ash -and it is small coal- can be consumed by drying and pol verizing and burning as powdered _fuel, the posi~ion. is satisfactory, especially If a power-station 15 near at hand, preferably adjoining the washery. If not, we have 2 or 3 different choices. First, we may wash for a less yield, i.e. cut at a ~ess gravity, and thus leave more combustible in the rejects, sufficient to reduce the ash to, say 33 per cent. Secondly, we may break the' coal only to pass l-in. mesh, and cut at a gravity which will give coking coal with 15 to 16 per cent ash; the residue will now have less than 37 per cent ash, and perhaps less than 33. per ~ent. ~his improvement in the rejects 15 obtamed, of course, at the expense of the yield o! coking coal which may now fall to 40 or 35 per cent. ThWly, we may decide (after crus?in~ to any specified degree_). to take a m~ddlmgs fraction for steam-raiSmg, and to adjust the magnitude of the fract!on ( by means ~f the characteristic, as explamed above ) until the ash content is of the permitted or practicable limit. This may mean losing altogether the heaviest 10 or IS per cent. If the "rejects" cannot easily be consumed as small coal in local power plant, the advisability of installing briquetting plant ~ay have to be considered. The necessary pitch for the binder will be at hand from the carbonization of the coking porti?n• if the coke~oven plant is near. There 15 much to be said for the integration of washery, coking plant, briquetting plant, cement plant, and a thermal power-station. The calorific value of the pure coal substance for the coal in question is 15,500 B.t.u. per lb. ~f the ash is 33 per cent, the foreign matter. 15 33 X 1-1, i.e. 36·3 per cent, say 3_7 allowm~ for 0·7 per cent of moisture m the dri~ coal. The calorific value of the fuel 15 thus
15 SOOx ( 100- 37 ), i.e. 9765 B.t.u. per lb. • 100 Fuel of this heat value would require little enrichment to be serviceable, even for the manufacture of cement ; but the amount and composition of the coal ash will require consideration.
The several aspects of the problem, therefore, require study in the light ~f the reserves of coking coal, the needs of the rron and steel industry, power production, 3;0d local ~d~ trial development, and especially the likelihood or desirability of local new industries, e.g. cement, tar distillation, gJ:ISs at_Id ceramic manufacture, and any Jttdustnes requiring a supply of high-quality gaseous fuel. Fertilize~ plant for the m~ufact~re of nitro-chalk 15 commonly associated With coke-oven plant in European countries, the hydrogen of the gas being employed for this purpose. All coke-oven plant does n~t necessarily adjoin a steel-wor~. · There. 15 in such cases a surplus of high calorific value gas from coke-ovens. and numerous other industries are thus encouraged. At the State Mines of the Netherlands, the products manufactured are not only ammonium nitrate and nitro-chalk, but also ( a) nitrophosphate and nitrate of lime ; ( b ) ammonium sulphate, ammonium bicarbonate and ammonium chloride ; ( c ) soda ash ; ( d ) dichlorethane, alcohol, and ether ; (e) benzene, toluene, and xylene ; ( f ) nitro-benzene, aniline, and T.N.T.; (g) naphthalene, anthracene, and phenol ; ( h ) higher phenols, pyridine, and pitch.
THE BREAKING OF COAL
On breaking, the washability of every coal is not of necessity subject to great improvement, to say nothing of the cost of breakage and the washery tr0t1bles incidental to the cleaning of the very fine coal produced. Normally, however, breaking does help. In fact, unless the raw coal is so homogeneous that reduction of the material to any practicable small size does not separate the individual components, i.e. separate the cleaner coal from the dirt or from the dirtier coal, breaking must 1Uldoubtedly help. Experiments are now in hand at the Fuel Research Institute to study the effects of "controlled" breaking. It is the bright coal whicll is of the more strongly caking nature and which normally contains less ash than the dull or hards, and it is these brights that we wish to liberate from their associated " bad company ". The brights are in general less tough and more friable than the dull, hard coal ( durain ) or than the shale. Especially therefore in banded coal, breaking is likely to effect improvement ; and there is reason to hope that, in certain seams, controlled breaking atone may produce
a fair yield of coking coal without any washing at all. The object of controlled breaking of coal is to loosen the association of the hards and brights, and to liberate the friable brights without reducing the whole coal to small size. Screening of the material after the necessary breaking will then yield a small-sized product which can be coked (with or without washing, as the case may be) and a larger-sized product more directly serviceable for power yroduction, etc., as ( 1) it will be dry, ( 2) it will
not be too high in ash, and ( 3 ) it will be of sufficiently large size to be used for normal purposes.
In many cases it will undoubtedly be necessary to wash -and to wash small coal. It is essential therefore that the technique of the washing of small and of fine coal be studied, and that the latest developments and improvements and economics be closely investigated, with special reference to any important differences peculiar to Indian coals and conditions.

PRINTED AT
THB CATHOLIC PRESS, RANCHI

Related Documents