Journal of Education and Practice www.iiste.org ISSN 2222-1735 (Paper) ISSN 2222-288X (Online) Vol.5, No.23, 2014 24 Students’ Satisfaction with Service Quality in Higher Education Institutions: An Empirical Study in University of Gondar Demeke Lakew Workie Lecturer, Statistics Department, College of Sciences, Bahir Dar University Po Box 79, Bahir Dar, Ethiopia E-mail: [email protected] Abstract The study was conducted to explore Students’ Satisfaction with Service Quality in Higher Education Institutions: An Empirical Study in University of Gondar, Ethiopia. The total number of 478 regular under graduating students was considered the study; but 80.34% were returned found valid for analysis. The chi-square test of association and ordinal logistic regression was used for data analysis. The findings from this study showed that the interaction quality (faculty and staff advising and classes) are positively related to the outcome quality (university experience) and ultimately influence student satisfaction. Based on this work the author identified that the faculty advising comes first in increasing the satisfactions of student regarding University experience and staff advisory com es second and then classes environment, and ultimately courses organization and university experience comes first and second respectively in increasing current levels of students’ satisfaction. Keywords: Ordinal Logistic Regression, Testing Parallel Lines, University Experience, Students Satisfaction 1.INTRODUCTION Background In Ethiopia the growing number of higher education institutions and the ever-increasing number of students, forces the institutions to build such an environment which completely satisfies these students’ expectations. The students’ enrolment is growing many folds, as the benefits of earning a university degree become more evident, especially in the Natural Sciences and Technology sectors. Higher learning institutions are also considering this as a business like service industry where objective is to satisfy students in order to retain and increase profit. Likewise satisfying admitted students is important for the institutions’ existence, trying to meet the needs of this ever-increasing number of students as well as the quality they are demanding at this level of education (DeShields et al., 2005). Student satisfaction is not merely dependent on the teaching assessments, but a deep analysis should be there to find out all the factors that contribute to the student satisfaction. Statistics indicate that more than 40% of all college entrants (applicant) leave higher education without earning a degree, 75% of these students drop out in the first two years of college, and institutions can expect that 56% of a typical entering class cohort will not graduate from that college (Ali Kara and Deshields O.W., 2004). Other statistics sited by Ali Kara and Deshields O.W. (2004) indicate that 26.4 % of the freshmen do not return for the following fall semester and 46.2 % of the students do not graduate from college. Also, higher educational institutions that are heavily populated by commuter students have higher dropout rates while institutions with strong residential dormitory programs have lower dropout rates (Baldridge, Kemerer, and Green, 1982). Service is an intangible activity that is the main objective of transaction that serves to meet the needs of customers. Service quality is an ability of an organization to meet or exceed customer expectations. Higher education in developing countries has serious quality problems. In today's competitive academic environment where students have many options available to them, factors that enable education institutions to attract students should be seriously studied (Coelho, 2004). Therefore, it is necessary to invest in quality system and tools for improvement. Early studies focused on academic ability as a predictor of satisfaction and typically found that academic performance explained no more than half of the variance. Some studies have investigated student commitment as involving a firm resolve to complete a college degree and strong attachment to a particular University. Other studies concentrated on the social adjustment of students to academic life and their inner confusion of self-worth. To the best of the researcher knowledge, studies that have examined student satisfaction in higher educational institutions from a more customer-oriented perspective are scarce. Therefore, this study focused on the students’ satisfaction in University of Gondar by analyzing factors that affect University environment, faculty performance, advisory staff classes and course organization. The main objective of the study is to analyze the students’ satisfaction with University facilities. This satisfaction is related to the experience of student in the institution and this experience is affected and depends upon the faculty, advising staff and the environment of classes. If the students’ experience is positive then they are satisfied with the institution. The Student’s experience in institute is based on his/her connection with faculty, advising staff, the environment and interactions in the classrooms. These three was made the first part of the model comprising the first three hypotheses. If the students have positive University experience, they are more

Students’ satisfaction with service quality
Jul 15, 2015
Welcome message from author
This document is posted to help you gain knowledge. Please leave a comment to let me know what you think about it! Share it to your friends and learn new things together.
Transcript

Journal of Education and Practice www.iiste.org
ISSN 2222-1735 (Paper) ISSN 2222-288X (Online)
Vol.5, No.23, 2014
24
Students’ Satisfaction with Service Quality in Higher Education
Institutions: An Empirical Study in University of Gondar
Demeke Lakew Workie
Lecturer, Statistics Department, College of Sciences, Bahir Dar University
Po Box 79, Bahir Dar, Ethiopia
E-mail: [email protected]
Abstract
The study was conducted to explore Students’ Satisfaction with Service Quality in Higher Education Institutions:
An Empirical Study in University of Gondar, Ethiopia. The total number of 478 regular under graduating
students was considered the study; but 80.34% were returned found valid for analysis. The chi-square test of
association and ordinal logistic regression was used for data analysis. The findings from this study showed that
the interaction quality (faculty and staff advising and classes) are positively related to the outcome quality
(university experience) and ultimately influence student satisfaction. Based on this work the author identified
that the faculty advising comes first in increasing the satisfactions of student regarding University experience
and staff advisory com es second and then classes environment, and ultimately courses organization and
university experience comes first and second respectively in increasing current levels of students’ satisfaction.
Keywords: Ordinal Logistic Regression, Testing Parallel Lines, University Experience, Students Satisfaction
1.INTRODUCTION
Background
In Ethiopia the growing number of higher education institutions and the ever-increasing number of students,
forces the institutions to build such an environment which completely satisfies these students’ expectations. The
students’ enrolment is growing many folds, as the benefits of earning a university degree become more evident,
especially in the Natural Sciences and Technology sectors. Higher learning institutions are also considering this
as a business like service industry where objective is to satisfy students in order to retain and increase profit.
Likewise satisfying admitted students is important for the institutions’ existence, trying to meet the needs of this
ever-increasing number of students as well as the quality they are demanding at this level of education
(DeShields et al., 2005).
Student satisfaction is not merely dependent on the teaching assessments, but a deep analysis should be
there to find out all the factors that contribute to the student satisfaction. Statistics indicate that more than 40% of
all college entrants (applicant) leave higher education without earning a degree, 75% of these students drop out
in the first two years of college, and institutions can expect that 56% of a typical entering class cohort will not
graduate from that college (Ali Kara and Deshields O.W., 2004). Other statistics sited by Ali Kara and Deshields
O.W. (2004) indicate that 26.4 % of the freshmen do not return for the following fall semester and 46.2 % of the
students do not graduate from college. Also, higher educational institutions that are heavily populated by
commuter students have higher dropout rates while institutions with strong residential dormitory programs have
lower dropout rates (Baldridge, Kemerer, and Green, 1982).
Service is an intangible activity that is the main objective of transaction that serves to meet the needs of
customers. Service quality is an ability of an organization to meet or exceed customer expectations. Higher
education in developing countries has serious quality problems. In today's competitive academic environment
where students have many options available to them, factors that enable education institutions to attract students
should be seriously studied (Coelho, 2004). Therefore, it is necessary to invest in quality system and tools for
improvement. Early studies focused on academic ability as a predictor of satisfaction and typically found that
academic performance explained no more than half of the variance. Some studies have investigated student
commitment as involving a firm resolve to complete a college degree and strong attachment to a particular
University. Other studies concentrated on the social adjustment of students to academic life and their inner
confusion of self-worth. To the best of the researcher knowledge, studies that have examined student satisfaction
in higher educational institutions from a more customer-oriented perspective are scarce. Therefore, this study
focused on the students’ satisfaction in University of Gondar by analyzing factors that affect University
environment, faculty performance, advisory staff classes and course organization.
The main objective of the study is to analyze the students’ satisfaction with University facilities. This
satisfaction is related to the experience of student in the institution and this experience is affected and depends
upon the faculty, advising staff and the environment of classes. If the students’ experience is positive then they
are satisfied with the institution. The Student’s experience in institute is based on his/her connection with faculty,
advising staff, the environment and interactions in the classrooms. These three was made the first part of the
model comprising the first three hypotheses. If the students have positive University experience, they are more


Journal of Education and Practice www.iiste.org
ISSN 2222-1735 (Paper) ISSN 2222-288X (Online)
Vol.5, No.23, 2014
26
Regression methods, such as logistic and ordinal regression models are useful tools to analyze the
relationship between multiple explanatory variables and students satisfaction results (Thomas and Galamos,
2004). These methods also permit researchers to estimate the magnitude of the effect of the explanatory variables
on the outcome variable. Therefore, ordinal logistic regression method is superior in studying the relationship
between the explanatory and ordinal outcome variables of the study and hence, an ordinal logistic regression was
applied on this study.
Model One: Student’s University Experience=α0+α1Faculty+α2 Advisory Staff + α3 Classes+ε
Model Two: Student’s Satisfaction = β0 + β1 Course Organization + β2Student’s University Experience + ε
2.4 Fitting an Ordinal Logit Model
The ordinal logistic regression model is one of many models subsumed under the rubric of generalized linear
models for ordinal data. In ordinal logistic regression, the event of interest is observing a particular score or less.
All of the odds are of the form:
�� = ����(�����)����(�����) =
����(�����)[�–����(�����)] = ��������������⋯����� , where
Prob(score ≤ j) = ���()(*�+,�-�+,�-�+⋯+,�-�) and j= 1, 2, 3,…J-1.
This is because of the last category does not have an odds associated with it since the probability of scoring up
to and including the last score is 1.
In ordinal logistic regression analysis, the logit is used to build specific models. The ordinal logistic regression
model for logit link is written as (Hosmer and Lemeshow, 1989):
log . /��0/�1 = 2� + β�X� + β6X6 + ⋯+β7X7
The alpha (2�) represents a separate intercept or threshold for each cumulative probability where j = 1, 2, 3…,
number of categories - 1. The threshold (2�) and the regression coefficient (8) are unknown parameters to be
estimated by means of the maximum likelihood method.
In the terminology of ordinal logistic regression analysis a model that simultaneously uses all link function is: 2�
+ 9:;, j=1, 2, 3,…J-1.
In which each cumulative link has its own intercept (2�). Here,
X =
<===> x��x6�…x7�x�6x66 …x76x�Ax6A …x7A…… .x�Cx6C …x7CD
EEEF is called the nx(k+J-1) regression matrix and
8 =
<===> 8�868A…… .8G D
EEEF is the kx1 model parameter.
In order to interpret the ordinal regression model, researchers would first look at the signs of the
regression coefficients. The positive regression coefficient indicated that there was a positive relationship
between the explanatory variable and the ordinal outcome and the negative regression coefficient indicated that
there was a negative relationship between the explanatory variable and ordinal outcome.
2.5 Testing Parallel Lines
The ordinal regression analysis employs a link function to describe the effect of the explanatory variables on
ordered categorical outcome in such a way that the assumptions of normality and constant variance are not
required (McCullagh and Nelder, 1989), whereas, the model assumes that the corresponding regression
coefficients in the link function are equal for each cut-off point (Bender and Benner, 2000). Hence, the violation
of the model assumption 'parallel lines' has to be verified carefully by the test of parallel lines (SPSS, Inc., 2002).
The Null Hypothesis: the model that assumes the lines are parallel (or slope coefficients) are the same across
response categories (or the location parameters are the same across response categories). If the lines or planes are
parallel, the observed significance level for the change should be large, since the general model doesn’t improve
the fit very much and the parallel model is adequate. We do not want to reject the null hypothesis that the lines
are parallel. If we do reject the null hypothesis, it is possible that the link function selected is incorrect for the
data or that the relationships between the independent variables and logits are not the same for all logits.

Journal of Education and Practice www.iiste.org
ISSN 2222-1735 (Paper) ISSN 2222-288X (Online)
Vol.5, No.23, 2014
27
2.6 Statistical Software for Data Analysis
The statistical packages that were used for analyzing data collected in this study is SPSS version 20 as these
packages are powerful enough to handle the analyses at ease. In addition all hypotheses were tested by
considering 5% confidence level.
3.RESULTS AND DISCUSSIONS
3.1Results
In this section results of the analysis and discussions are revealed. The total number of 478 regular under
graduating students was considered the study; but 80.34% were returned found valid for analysis. From the chi-
square analysis of ‘there is no significant relationship between variables’ in the two model was tested.
The chi-square crosstab results of Appendix B of Table 1 and Table 2 showed that 11 cells (44.0%) and
12 cells (48.0%) have expected counts less than 5 with minimum expected count of 0.02 for each independent
variables in model one and two, respectively. This means that the minimum expected cell frequency of five (5)
which will make the chi-square test accurate have violated. Therefore, the five scale categories of the variables
need merged in to three scales categories to make the chi-square test have accurate. After emerging the scale of
variables the chi-square crosstab results of Appendix B of Table 3 and Table 4 showed that 0 cells (0.0%) have
expected counts less than 5 in the two models and the finding of the chi-square test revealed as follows.
From the analysis (table 3.1 below) the results can be read as p (.000< 0.5). Therefore, the null
hypothesis (H0) is rejected at the 0.05 level of significance. Therefore, since 0.000< 0.05, and this means that
there is sufficient evidence to conclude that there were significant relationships between faculty advising, staff
advising and class environment with university experience and intern university experience with student
satisfaction.
Table 3.1: Chi-square test of association
Variables Chi-square value df Sig. (2-sided)
Staffs advising by University experience 118.526 4 0.000
Faculty advising by University experience 185.837 4 0.000
Class environment by University experience 82.350 4 0.000
University experience by current student’s satisfaction 97.892 4 0.000
Course Organization by current student’s satisfaction
3.2 Ordinal Logistic Regression Analysis
The major decisions involved in constructing the ordinal regression models were deciding what explanatory
variables to include in the model equation that would be the best fit to the data set. Because the ordinal logistic
regression models are used under a strong assumption of parallel lines, any departures from this assumption
might result in the incorrect analysis and conclusion (McCullagh, 1980). Therefore, ordinal logistic regression
models that satisfying the parallel lines’ assumption and having larger model fitting statistic were chosen.
The test of parallel lines was designed to make judgment concerning the model adequacy. The null
hypothesis stated that the corresponding regression coefficients were equal across all levels of the outcome
variable. The alternative hypothesis stated that the corresponding regression coefficients were different across all
levels of the outcome variable. The chi-square test result from table 3.2 (χ2 = 8.232 with df 6, and p = 0.222) and
(χ2 = 6.262 with df 4, and p = 0.180) indicated that there was no significant difference for the corresponding
regression coefficients across the response categories for model one and model two, respectively.
Table 3.2: Summary of model fitting statistic, goodness-of-fit and test of parallel lines for model one.
Models Model Fitting
Cox and Snell Nagelkerke McFadden Goodness-of-Fit Test of Parallel Lines
Model 1 0.417 0.477 0.261 49.131 (0.209)* 8.232 (0.222)
*
Model 2 0.373 0.463 0.285 62.879 (0.020)* 6.262 (0.180)
*
*is p-value for goodness-of-fit and test of parallel lines
3.2.1 Results of Ordinal Logistic Regression
The results of ordinal logistic regression analysis for model one and model two were given in Appendix B of
Table 5 and Table 6 respectively. The table showed that the coefficients, their standard errors, the Wald test,
associated p-values (Sig.), the odds and the 95% confidence interval of the coefficients. And the subsequent
interpretations and discussion in the section below revealed to the table.
Journal of Education and Practice www.iiste.org
ISSN 2222-1735 (Paper) ISSN 2222-288X (Online)
Vol.5, No.23, 2014
28
To give interpretation about the coefficients of the predictor variable, compare p-value with 0.05-level of
significance and if the p-value is less than 0.05, then at least one predictor is significantly associated with the
response. Therefore, the table is revealed that the p-values for all respective variables were less than 0.05 in
both models. Thus, there were enough statistical evidence to conclude that the relationship between University
experience with study predicators in model one and Students’ satisfaction with study predictors in model two
were significant.
3.2.2 Interpretation of the Odds Model One
Model One Controlling for the other explanatory variables, dissatisfaction and neutrality of staff advising have 73.4% and
47.1% lower odds than satisfaction of staff advising, respectively, giving a response that indicates higher levels
(good) of University Experience. The dissatisfaction and neutrality of class environment have 68.9% and 54.5%
lower odds than satisfaction of class environment, respectively, giving response that indicates higher levels
(good) of University experience of students and Gondar University when other predictors keep constant. Finally,
the dissatisfaction and neutrality of faculty advising have 94.2% and 83.7% lower odds than satisfaction of
faculty advising, respectively, giving response that indicates higher levels (good) of University experience of
students and Gondar University when other predictors keep constant.
Model Two
The poorness and neutrality of University Experience at Gondar University have 88% and 69.4% lower odds
than goodness of University Experience, respectively, giving response that indicates higher levels (satisfied) of
current level of students’ satisfaction when other predictors keep constant. And controlling for the other
explanatory variables, the dissatisfaction and neutrality of courses organization at Gondar University have 98.7%
and 84.6% lower odds than satisfaction of courses organization at Gondar University, respectively, giving
response that indicates higher levels (satisfied) of current level of students’ satisfaction.
The study revealed that faculty advising, classes and staff advising had a significant relationship with University
experience. They imply that the interaction quality (faculty and staff advising and classes) are positively related
to the outcome quality (university experience) and ultimately influence student satisfaction. At the end, author
argued that faculty advising, advising staff, and classes were the most important variables that influenced
students' university experience, and ultimately satisfaction.
4.Conclusions and Recommendations
4.1Conclusions
In the study it was hypothesized that faculty and staff advising performance, and classes would influence
students’ University experience and in turn University experience and courses organization would influence their
current level of students’ satisfaction.
The results of the study supports the hypotheses predicted and indicate that there is a positive relationship of
faculty and staff advisory and the classes with the student’s University experience and altimetry there is a
positive relationship of course organization and university experience with current level of students’ satisfaction.
The following table shows that the comparison of the hypotheses and the results of the study.
Table 4.1: Comparison of research hypothesis versus the overall of results of the study.
Factors Relationship with University Experience Relationship with Students’ Satisfaction
Hypothesis Results Comment Hypothesis Results Comment
Faculty advising Positive Positive correct
Staff Advising Positive Positive correct
Classes Positive Positive correct
Courses organization Positive Positive correct
University Experience Positive Positive correct
Using the ordinal logistic regression, the study identified the significant explanatory variables with their
control to enhance student satisfactions regarding University experience, and ultimately current levels of
students’ satisfaction. The study revealed that the faculty advising comes first in increasing the student’s
University experience and staff advisory comes second and then classes and ultimately courses organization and
university experience comes first and second respectively in increasing current levels of students’ satisfaction.
4.2 Recommendations
Based upon the major findings of the study, the author would like to recommend the following major points.
� It is better to create opportunities for advisory-student interaction beyond regular office hours to
increase student’s satisfaction with university experience.
Journal of Education and Practice www.iiste.org
ISSN 2222-1735 (Paper) ISSN 2222-288X (Online)
Vol.5, No.23, 2014
29
� University administrative takes a measurement on develop and implement a comprehensive plan for
refurbishing and re-equipping classrooms to make conducive class environment which in turn fulfill the
students’ needs.
� It is recommended that researchers should work more on this area by considering two or more
universities with service quality regardless of student or staffs.
REFERENCES
Alan Agresti, (2002). Categorical Data Analysis, 2nd
ed. John Wiley & Sons, Inc., Hoboken, New Jersey
Ali Kara and Deshields O. W.,(2004). Business Student Satisfaction, Intentions and Retention in Higher
Education: An Empirical Investigation, Pennsylvania State University-York Campus. Vol., 3.
Baldridge, J. V., Kemerer, F. R. and Green, K. C. (1982). The Enrollment Crisis: Factors, Actors, and Impacts.
AAHE-ERIC Higher Education Research Report No. 3, 1982. Washington, D.C.:
Bender, R. and Benner (2000). A Calculating Ordinal Regression Models in SAS and S-Plus. Biometrical
Journal. 42, 677-699.
Cochran W.G., (1977). Applied Logistic Regression, John Wiley and Sons Inc., New York.
Coelho, E. (2004) Adding English: A guide to teaching in multilingual classrooms. Toronto: Pippin Publishing.
DeShields, O., Kara, A., and Kaynak, E., (2005). Determinants of business student satisfaction and retention in
higher education: applying Herzberg’s two-factor theory, International Journal of Educational Management.
19(2), 128-39.
Hosmer, David W. and Lemeshow, Stanley,(1989). Applied Logistic Regression, 2nd
ed . John Wiley & Sons,
New York.
McCullagh, P. and Nelder J. A., (1989). Generalized Linear Models, 2nd
ed. Chapman and Hall, New York.
McCullagh, P., (1980). Regression Models for Ordinal Data (with Discussion), Journal of the Royal Statistical
Society. 42, 109 – 142.
SPSS, Inc. (2002). Ordinal Regression Analysis, SPSS Advanced Models 10.0., Chicago, IL.
Thomas, E. and N. Galambos. (2004). What satis.es students?. Mining Student-Opinion Data with Regression
and Decision Tree Analysis. Research in Higher Education, 45 (3) pp 251-269.
William Mendenhall and Terry Sincich, (2007). Statistics for Engineering and the Science, 5th
edition. Upper
Saddle River, New Jersey.
ACKNOWLEDGEMENT
First of all my heart full and limitless gratitude goes to the almighty of God who guided me for all success I
achieved in my whole life. Next I would like to thanks to all data collectors and respondents who participated in
this study. Last but not least I would like to express my deepest gratitude to all my friends for their unlimited
help and professional guidance in one or another way.

Journal of Education and Practice www.iiste.org
ISSN 2222-1735 (Paper) ISSN 2222-288X (Online)
Vol.5, No.23, 2014
30
Appendix B: SPSS Output Tables
Table 1: Chi-square Crosstab for Model One University Experience Total
Very Poor Poor Fair Good Very
Good
Facility
Advising
Highly Dissatisfied
Count 1 1 0 0 0 2
Expected Count .0 .3 .8 .6 .2 2.0
% of Total 0.3% 0.3% 0.0% 0.0% 0.0% 0.5%
Dissatisfied
Count 2 28 18 4 0 52
Expected Count .4 8.7 22.1 16.7 4.2 52.0
% of Total 0.5% 7.3% 4.7% 1.0% 0.0% 13.5%
Neutral
Count 0 29 93 18 1 141
Expected Count 1.1 23.5 59.9 45.2 11.4 141.0
% of Total 0.0% 7.6% 24.2% 4.7% 0.3% 36.7%
satisfied
Count 0 5 44 84 7 140
Expected Count 1.1 23.3 59.4 44.8 11.3 140.0
% of Total 0.0% 1.3% 11.5% 21.9% 1.8% 36.5%
Highly Satisfied
Count 0 1 8 17 23 49
Expected Count .4 8.2 20.8 15.7 4.0 49.0
% of Total 0.0% 0.3% 2.1% 4.4% 6.0% 12.8%
Staff Advising
Highly Dissatisfied
Count 0 2 0 0 0 2
Expected Count .0 .3 .8 .6 .2 2.0
% of Total 0.0% 0.5% 0.0% 0.0% 0.0% 0.5%
Dissatisfied
Count 2 22 20 3 0 47
Expected Count .4 7.9 19.9 15.1 3.8 47.0
% of Total 0.5% 5.7% 5.2% 0.8% 0.0% 12.3%
Neutral
Count 1 30 82 29 1 143
Expected Count 1.1 23.9 60.5 45.9 11.6 143.0
% of Total 0.3% 7.8% 21.4% 7.6% 0.3% 37.3%
satisfied
Count 0 8 54 70 13 145
Expected Count 1.1 24.2 61.3 46.6 11.7 145.0
% of Total 0.0% 2.1% 14.1% 18.3% 3.4% 37.9%
Highly Satisfied
Count 0 2 6 21 17 46
Expected Count .4 7.7 19.5 14.8 3.7 46.0
% of Total 0.0% 0.5% 1.6% 5.5% 4.4% 12.0%
Class
Highly Dissatisfied
Count 0 1 0 0 0 1
Expected Count .0 .2 .4 .3 .1 1.0
% of Total 0.0% 0.3% 0.0% 0.0% 0.0% 0.3%
Dissatisfied
Count 2 18 25 3 0 48
Expected Count .4 8.0 20.4 15.4 3.9 48.0
% of Total 0.5% 4.7% 6.5% 0.8% 0.0% 12.5%
Neutral
Count 1 33 88 42 4 168
Expected Count 1.3 28.0 71.3 53.8 13.6 168.0
% of Total 0.3% 8.6% 22.9% 10.9% 1.0% 43.8%
satisfied
Count 0 11 48 63 10 132
Expected Count 1.0 22.0 56.0 42.3 10.7 132.0
% of Total 0.0% 2.9% 12.5% 16.4% 2.6% 34.4%
Highly Satisfied
Count 0 1 2 15 17 35
Expected Count .3 5.8 14.9 11.2 2.8 35.0
% of Total 0.0% 0.3% 0.5% 3.9% 4.4% 9.1%
Journal of Education and Practice www.iiste.org
ISSN 2222-1735 (Paper) ISSN 2222-288X (Online)
Vol.5, No.23, 2014
31
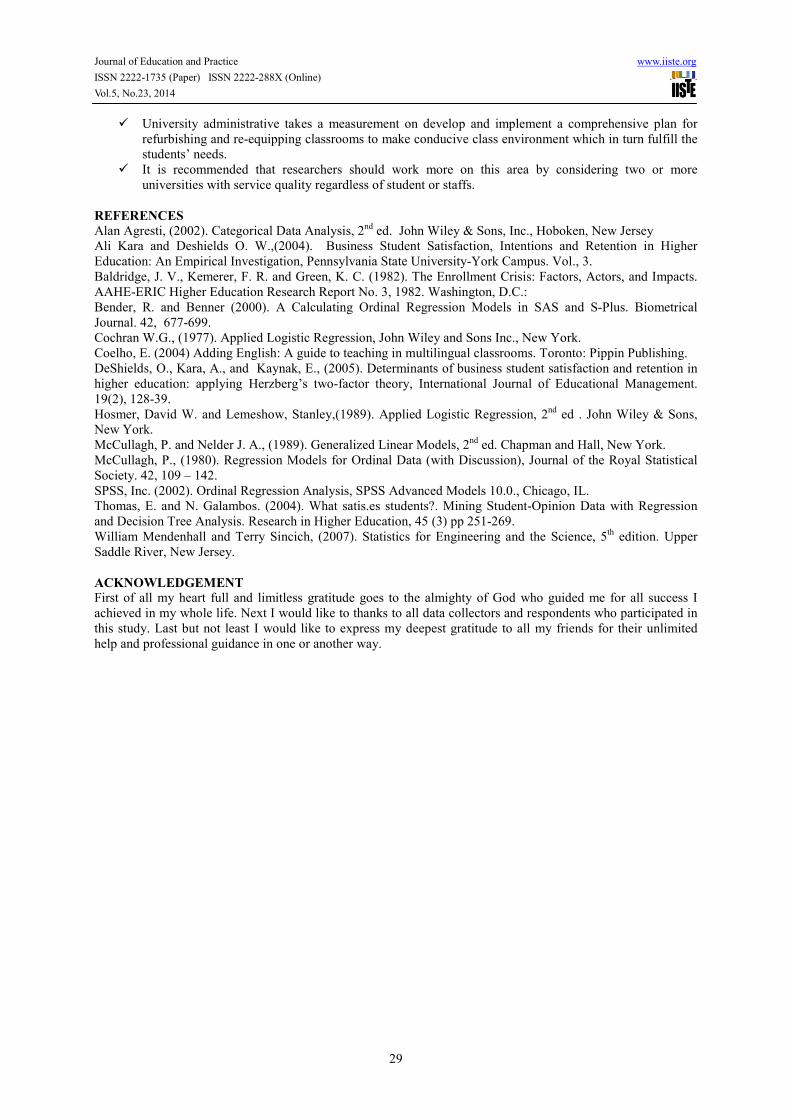
Table 2: Chi-square Crosstab for Model Two Students’ satisfaction Total
Highly Dissatisfied
Dissatisfied Neutral satisfied Highly Satisfied
University Experience
Very Poor
Count 1 0 2 0 0 3
Expected Count .0 .2 .9 1.5 .5 3.0
% of Total 0.3% 0.0% 0.5% 0.0% 0.0% 0.8%
Poor
Count 1 15 27 21 0 64
Expected Count .3 3.8 18.5 31.7 9.7 64.0
% of Total 0.3% 3.9% 7.0% 5.5% 0.0% 16.7%
Fair
Count 0 8 63 80 12 163
Expected Count .8 9.8 47.1 80.7 24.6 163.0
% of Total 0.0% 2.1% 16.4% 20.8% 3.1% 42.4%
Good
Count 0 0 19 81 23 123
Expected Count .6 7.4 35.6 60.9 18.6 123.0
% of Total 0.0% 0.0% 4.9% 21.1% 6.0% 32.0%
Very Good
Count 0 0 0 8 23 31
Expected Count .2 1.9 9.0 15.3 4.7 31.0
% of Total 0.0% 0.0% 0.0% 2.1% 6.0% 8.1%
Courses Organization
Highly
Dissatisfied
Count 0 0 1 0 0 1
Expected Count .0 .1 .3 .5 .2 1.0
% of Total 0.0% 0.0% 0.3% 0.0% 0.0% 0.3%
Dissatisfied
Count 1 12 6 1 0 20
Expected Count .1 1.2 5.8 9.9 3.0 20.0
% of Total 0.3% 3.1% 1.6% 0.3% 0.0% 5.2%
Neutral
Count 1 7 60 28 2 98
Expected Count .5 5.9 28.3 48.5 14.8 98.0
% of Total 0.3% 1.8% 15.6% 7.3% 0.5% 25.5%
satisfied
Count 0 4 41 119 19 183
Expected Count 1.0 11.0 52.9 90.5 27.6 183.0
% of Total 0.0% 1.0% 10.7% 31.0% 4.9% 47.7%
Highly
Satisfied
Count 0 0 3 42 37 82
Expected Count .4 4.9 23.7 40.6 12.4 82.0
% of Total 0.0% 0.0% 0.8% 10.9% 9.6% 21.4%
Table 3: Chi-square Crosstab for Model One after merging the categories University Experience Total
poor neutral Good
Staff Advising
dissatisfied
Count 26 20 3 49
Expected Count 8.5 20.8 19.7 49.0
% of Total 6.8% 5.2% 0.8% 12.8%
neutral
Count 31 82 30 143
Expected Count 25.0 60.7 57.3 143.0
% of Total 8.1% 21.4% 7.8% 37.2%
satisfied
Count 10 61 121 192
Expected Count 33.5 81.5 77.0 192.0
% of Total 2.6% 15.9% 31.5% 50.0%
Faculty Advising
dissatisfied
Count 32 18 4 54
Expected Count 9.4 22.9 21.7 54.0
% of Total 8.3% 4.7% 1.0% 14.1%
neutral
Count 29 93 19 141
Expected Count 24.6 59.9 56.5 141.0
% of Total 7.6% 24.2% 4.9% 36.7%
satisfied
Count 6 52 131 189
Expected Count 33.0 80.2 75.8 189.0
% of Total 1.6% 13.5% 34.1% 49.2%
Class
dissatisfied
Count 21 25 3 49
Expected Count 8.5 20.8 19.7 49.0
% of Total 5.5% 6.5% 0.8% 12.8%
neutral
Count 34 88 46 168
Expected Count 29.3 71.3 67.4 168.0
% of Total 8.9% 22.9% 12.0% 43.8%
satisfied
Count 12 50 105 167
Expected Count 29.1 70.9 67.0 167.0
% of Total 3.1% 13.0% 27.3% 43.5%

Journal of Education and Practice www.iiste.org
ISSN 2222-1735 (Paper) ISSN 2222-288X (Online)
Vol.5, No.23, 2014
32
Table 4: Chi-square Crosstab for Model Two after merging the categories Students’ Satisfaction Total
dissatisfied neutral satisfied
University Experience
poor
Count 17 29 21 67
Expected Count 4.4 19.4 43.3 67.0
% of Total 4.4% 7.6% 5.5% 17.4%
neutral
Count 8 63 92 163
Expected Count 10.6 47.1 105.3 163.0
% of Total 2.1% 16.4% 24.0% 42.4%
Good
Count 0 19 135 154
Expected Count 10.0 44.5 99.5 154.0
% of Total 0.0% 4.9% 35.2% 40.1%
Courses Organization
dissatisfied
Count 13 7 1 21
Expected Count 1.4 6.1 13.6 21.0
% of Total 3.4% 1.8% 0.3% 5.5%
neutral
Count 8 60 30 98
Expected Count 6.4 28.3 63.3 98.0
% of Total 2.1% 15.6% 7.8% 25.5%
satisfied
Count 4 44 217 265
Expected Count 17.3 76.6 171.1 265.0
% of Total 1.0% 11.5% 56.5% 69.0%
Table 5: Parameter Estimates for Model One Estimate Std.
Error
Wald df Sig. Odds 95% Confidence Interval
Lower
Bound
Upper
Bound
Threshold [University Experience = Poor] -4.346 .317 188.027 1 .000 -4.967 -3.725
[University Experience = Neutral] -1.259 .198 40.592 1 .000 -1.646 -.872
Location
[Staff Advising= Dissatisfied] -1.324 .419 9.993 1 .002 0.266069 -2.146 -.503
[Staff Advising = Neutral] -.637 .278 5.269 1 .022 0.528877 -1.181 -.093
[Staff Advising =Satisfied] 0a . . 0 . . .
[Class= Dissatisfied] -1.167 .379 9.467 1 .002 0.311299 -1.911 -.424
[Class= Neutral] -.788 .247 10.198 1 .001 0.454753 -1.271 -.304
[Class=satisfied] 0a . . 0 . . .
[Faculty Advising= Dissatisfied] -2.845 .445 40.871 1 .000 0.058134 -3.717 -1.973
[Faculty Advising = Neutral] -1.814 .300 36.646 1 .000 0.163001 -2.401 -1.227
[Faculty Advising =satisfied] 0a . . 0 . . .
Link function: Logit.
a. This parameter is set to zero because it is redundant.
Table 6: Parameter Estimates for Model Two
Estimate Std. Error Wald df Sig. Odds 95% Confidence
Interval
Lower
Bound
Upper
Bound
Threshold
[Students’ Satisfaction =
Dissatisfied] -5.521 .421 171.742 1 .000
-6.347 -4.695
[Students’ Satisfaction = Neutral] -2.316 .267 75.417 1 .000 -2.838 -1.793
Location
[University Experience=Poor] -2.122 .381 31.014 1 .000 0.119792 -2.869 -1.375
[University Experience = Neutral] -1.183 .317 13.914 1 .000 0.306358 -1.805 -.561
[University Experience =Good] 0a . . 0 . . .
[Courses Organization=Dissatisfied]
-4.324 .571 57.354 1 .000 0.013247
-5.443 -3.205
[Courses Organization = Neutral] -1.874 .278 45.455 1 .000 0.153508 -2.419 -1.330
[Courses Organization =Satisfied] 0a . . 0 . . .
Link function: Logit.
a. This parameter is set to zero because it is redundant.
The IISTE is a pioneer in the Open-Access hosting service and academic event
management. The aim of the firm is Accelerating Global Knowledge Sharing.
More information about the firm can be found on the homepage:
http://www.iiste.org
CALL FOR JOURNAL PAPERS
There are more than 30 peer-reviewed academic journals hosted under the hosting
platform.
Prospective authors of journals can find the submission instruction on the
following page: http://www.iiste.org/journals/ All the journals articles are available
online to the readers all over the world without financial, legal, or technical barriers
other than those inseparable from gaining access to the internet itself. Paper version
of the journals is also available upon request of readers and authors.
MORE RESOURCES
Book publication information: http://www.iiste.org/book/
IISTE Knowledge Sharing Partners
EBSCO, Index Copernicus, Ulrich's Periodicals Directory, JournalTOCS, PKP Open
Archives Harvester, Bielefeld Academic Search Engine, Elektronische
Zeitschriftenbibliothek EZB, Open J-Gate, OCLC WorldCat, Universe Digtial
Library , NewJour, Google Scholar
Related Documents