Student Poster Book of Abstracts 2012 IEEE Power and Energy Society Transmission and Distribution Conference and Exhibition Orlando, Florida May 7-10 2012

Welcome message from author
This document is posted to help you gain knowledge. Please leave a comment to let me know what you think about it! Share it to your friends and learn new things together.
Transcript

Student Poster Book of Abstracts
2012 IEEE Power and Energy Society
Transmission and Distribution Conference and Exhibition
Orlando, Florida May 7-10 2012

1
Welcome Message from the Chair –
IEEE PES Student Activities Subcommittee On behalf of the Student Activities Subcommittee, I welcome you to the Student Poster Contest at the 2012 IEEE Power & Energy Society Transmission and Distribution Conference and Exposition held at Orlando, FL, USA on May 9, 2012. At the time of printing this book, we have 71 extended abstracts from students from different parts of the world confirmed to participate in the 2012 IEEE PES T&D student poster contest. This book of extended abstracts is aimed at documenting the many outstanding research projects, some at their early stages, and providing a glimpse of some of the activities of interest to our society at various educational institutions around the world which is presented at this meeting in form of posters by students. The research topics of these abstracts (posters) fall into 15 categories, namely:
1. Smart Sensors, Communication and Control in Energy Systems
2. Smart Grid Technology 3. Cyber and Physical Security of the Smart
Grid 4. Advanced Computational Methods for
Power System Planning, Operation, and Control
5. System-Wide Events and Analysis Methods 6. Intelligent Monitoring and Outage
Management
7. Integrating Renewable Energy into the Grid
8. Substation and Distribution Automation 9. Dynamic Performance and Control of
Power Systems 10. Market Interactions in Power Systems 11. Asset Management 12. Flexible AC Transmission Systems 13. Power Electronics 14. Electric Machine and Drives 15. Power System Modeling and Simulation
All students are invited to attend the Collegiate/GOLD/Industry Luncheon to be held on May 9, 2012 from 11.30 AM to 1 PM. The student poster contest winners will be announced at closing reception on May 10 between 2.30 PM – 4 PM. Continuous support from the Grainger Foundation, and IEEE Power & Energy Society, and its members, especially, the Power and Energy Education Committee (PEEC) for the student activities is gratefully acknowledged. The subcommittee acknowledges the service of Dr. Aaron St. Leger, Assistant Professor, in the Dept. of Electrical Engineering and Computer Science at the United States Military Academy, West Point, NY, who compiled this book of extended abstracts. Siddharth (Sid) Suryanarayanan Fort Collins, Colorado, USA.

2
IEEE PES Student Activities Subcommittee Chair Dr. Siddharth Suryanarayanan Assistant Professor, Electrical and Computer Engineering Colorado State University Fort Collins, CO 80523-1373, USA [email protected] Vice-Chair Dr. Anurag K Srivastava Assistant Professor School of Electrical Engineering and Computer Science Washington State University PO Box 642752 EME 102 Spokane St Pullman Washington 99164-2752, USA [email protected] Secretary Dr. Hamidreza (Hamid) Zareipour, Associate Professor, Department of Electrical and Computer Engineering, Schulich School of Engineering, University of Calgary, 2500 University Drive NW, Calgary, Alberta, T2N 1N4, Canada [email protected] Webmaster Dr. Jignesh M. Solanki Assistant Research Professor Lane Department of Computer Science and Electrical Engineering West Virginia University 395 Evansdale Drive, Morgantown, WV 26506-6109, USA [email protected]

3
LIST OF PARTICIPANTS AND POSTER TITLES
Smart Sensors, Communication and Control in Energy Systems: No. Student
Reg. No. T&D Reg. No.
Title of Poster Student Names
9 1000063 07-4528 Economic Scheduling of Distributed Energy Storage Devices on Electric Distribution Networks
Reza Arghandeh
10 1000077 07-4470 Control of Aggregate Electric Water Heaters for Load Shifting and Balancing Intermittent Renewable Energy Generation in a Smart Grid Environment
Seyyed Ali Pourmousavi Kani
11 1000022 07-3967 Power System Reliability Enhancement Considering Smart Monitoring and Indication Smart sensors
Bamdad Falahati
Smart Grid Technology: No. Student
Reg. No. T&D Reg. No.
Title of Poster Student Names
12 12345 Analysis and Design of Demand Response Programs Under Weather Uncertainty
Jiayi Jiang
13 1000023 07-4062 Investigating the Development and Real Time Applications of a Smart Grid Test Bed
Saugata Biswas
14 1000064 07-4544 Limiting Ramp Rates of the Wind Power Output using a Battery System
Duehee Lee
15 1000079 07-4592 Offshore Wind Farm Study in South Carolina Power System
Tingting Wang
16 1000083 07-4613 Optimizing EV Charge/Discharge Schedule in Smart Residential Buildings
Diogenes Molina
17 1000094 07-4965 Cost to Benefit Analysis using Direct Load Control Application in Smart Grid
Abdur Rehman
18 1000101 07-5014 Synchrophasor Measurement based Situational Awareness System for Smart Grid - A Scalable Framework
Karthikeyan Balasubramaniam
19 1000105 07-4964 Applications of synchrophasor in utilities. Nagoras Nikitas 20 1000111 07-5203 Coordinated Voltage Regulation in Active Distribution
System Using Centralized Optimal Controller Ravindran Vinoth
21 1000112 07-5249 Artificial Neural Network-Based Classifier for Power System Events
Penn Markham
22 1000113 07-5266 Development of an Agent-Based Distribution Test Feeder with Smart-Grid Functionality
Pedram jahangiri
23 1000005 07-3446
Processing and Visualization of Disturbance Data Stored in a Phasor Data Concentrator Om Dahal

4
Cyber and Physical Security of the Smart Grid: No. Student
Reg. No. T&D Reg. No.
Title of Poster Student Names
24 1000044 07-4390 Using Graph Theory to Analyze the Vulnerability of Smart Electrical Grids
Timothy Ernster
Advanced Computational Methods for Power System Planning, Operation, and Control: No. Student
Reg. No. T&D Reg. No.
Title of Poster Student Names
25 1000001 07-3632 Optimal Power Dispatch via Constrained Distributed Sub-gradient algorithm
Wei Zhang
28 1000034 07-3778 Selection of an Optimal Structuring Element for Mathematical Morphology Based Disturbance Detection Tools
Suresh Gautam
29 1000036 07-4350 Fault Location Identification using Bayesian Data Fusion for SPS
Joseph Dieker
30 1000038 07-4352 Economic Analysis of Grid Level Energy Storage for the Application of Load Leveling
Robert Kerestes
31 1000067 07-3704 Novel fully distributed optimization control of generators for shipboard power system
Yinliang Xu
32 1000070 07-4559 Optimal Dispatch and Coordination of Distributed Energy Resources using Model Predictive Control
Ebony Mayhorn
System-Wide Events and Analysis Methods: No. Student
Reg. No. T&D Reg. No.
Title of Poster Student Names
33 1000035 07-3446 Processing and Visualization of Disturbance Data Stored in a Phasor Data Concentrator
Om Dahal
34 1000041 07-4362 Ensemble Learning Approach for the Estimation of Weather-Related Outages on Overhead Distribution Feeders
Padmavathy Kankanala
35 1000066 07-4044 Distributed State Estimation using Phasor Measurement Units
Woldu Tuku
36 1000097 07-5017 Rotor Angle Difference Estimation for Multi-Machine System Transient Stability Assessment
Zhenhua Wang

5
Intelligent Monitoring and Outage Management: No. Student
Reg. No. T&D Reg. No.
Title of Poster Student Names
37 1000068 07-4546 A Neural Network based Software Engine for Adaptive Power System Stability
Ashikur Rahman
38 1000095 07-4956 A new open conductor identification technique for single wire earth return system
Pengfei Gao
Integrating Renewable Energy into the Grid: No. Student
Reg. No. T&D Reg. No.
Title of Poster Student Names
39 1000029 07-4043
Optimal Operations of Distributed Wind Generation in a Distribution System using PMUs
Manoaj Vijayarengan
40 1000031 07-4307
Hierarchical Probabilistic Coordination and Optimization of DERs and Smart Appliances Renke Huang
41
1000038 07-4352
Medium Voltage DC Network Modeling and Analysis with Preliminary Studies for Optimized Converter Configuration through PSCAD Simulation Environment Brandon Grainger
42 1000049 07-3917 Interface for Inverter Based Distributed Generators Shiva Pokharel 43
1000053 07-4496 Reliability Analysis of Alternate Wind Energy Farms and Interconnections Dongbo Zhao
44 1000069 07-4547
Penetration Level of Photovoltaic (PV) Systems into the Traditional Distribution Grid Santosh Chalise
45 1000076 07-4573
Wind Power in Combined Energy and Reserve Market - Market Modeling and Combined Scheduling Dawei He
46 1000082 07-4600
SOC Feedback Control for Wind and ESS Hybrid Power System Frequency Regulation Jie Dang
47
1000089 07-4722
Energy Storage Control for Integration of Single-Phase Sources into a Three-Phase Micro-Grid with Wind Power Estimation Prajwal Gautam
48 1000092 07-3399
Smart Dispatch of Controllable Loads with High Penetration of Renewables
Simon Kwok Kei Ng
49 1000100 07-5015
Identification and Estimation of Loop Flows in Power Networks with High Wind Penetration
Manish Mohanpurkar
50 1000109 07-5182
Voltage Profile Simulation using OpenDSS in High Penetration PV scenario
Touseef Ahmed Faial Mohammed
51 1000117 07-5277
Self-Regulated Optimal Battery Bridged PV Micro-Source for Smart Grid Applications Paul O'Connor
52 1000121 07-5280
Modeling and Coordinated Control of Grid Connected PV/Wind Inverter in a Microgrid Junbiao Han

6
Substation and Distribution Automation: No. Student
Reg. No. T&D Reg. No.
Title of Poster Student Names
53 1000021 07-4079 Health Monitoring of Substation Components Griet Devriese 54 1000024 07-4092 Fault Diagnosis and Prognosis for Substations Jeong Hun Kim 55
1000115 07-5278 An Investigation of Capacitor Control Actions for Voltage Spread Reduction in Distribution Systems Nicole Segal
56 1000118 790012
Plug-in Hybrid Electric Vehicle Modeling and Its Impact on North American Electric Distribution Network Satish Kasani
Dynamic Performance and Control of Power Systems: No. Student
Reg. No. T&D Reg. No.
Title of Poster Student Names
57 1000072 GW-4540 Design of Decentralized Fuzzy Logic Load Frequency Controller –Implementation to GCC (Gulf Cooperation Council) Interconnected Power Grid
Ahmad Al-Kuwari
58 1000073 07-4518 Design of Power System Stabilizer Based on Microcontroller for Power System Stability Enhancement
Samer Said
59 1000093 07-3288 Wide-Area Measurement Based Nonlinear Control of a Parallel AC/DC Power System
Hua Weng
60 1000114 07-5276 Loading Effects on Nonlinear Observability Measurement for Shipboard Power Systems
Juan Jimenez
61 1000120 07-4576 Comparison of Different Methods for Impedance Calculation and Load Frequency Control in Microgrid
Hessam Keshtkar
Market Interactions in Power Systems: No. Student
Reg. No. T&D Reg. No.
Title of Poster Student Names
62 1000052 07-4495 Arbitrage-Free Energy Storage Options Market Mechanism for Wind Power Integration
Zhenyu Tan
Asset Management: No. Student
Reg. No. T&D Reg. No.
Title of Poster Student Names
63 1000047 07-4339 Inventory and Evolution of Member Communication in a Volunteer Organization: Helping PES Better Disseminate Information to its Members
Laurie Stewart
64 1000048 07-4378 Network Robustness of Large Power Systems Ricardo Moreno

7
Flexible AC Transmission Systems: No. Student
Reg. No. T&D Reg. No.
Title of Poster Student Names
65 1000038 07-4352 High Voltage Power Electronic Technologies for Renewable to Grid Integration
Brandon Grainger
66 1000067 07-4531 System Identification based VSC-HVDC DC Voltage Controller Design
Ling Xu
Power Electronics: No. Student
Reg. No. T&D Reg. No.
Title of Poster Student Names
67 1000038 07-4352 Assessing Merits of GaN for Next Generation Power Electronics
Raghav Ehanna
Electric Machine and Drives: No. Student
Reg. No. T&D Reg. No.
Title of Poster Student Names
68 1000012 07-3733 Short Circuit Analysis of Induction Machines - Wind Power Application
Dustin Howard
69 1000025 07-3785 Design of a Governor and Voltage Regulator for a Laboratory Generator
Anil KC

8
Power System Modeling and Simulation: No. Student
Reg. No. T&D Reg. No.
Title of Poster Student Names
70 1000018 07-3916 Developing PHEV Charging Load Profile Based on Transportation Data Analyses
Zahra Darabi
71 1000030 07-4304 Time Domain Simulation of a Three-Phase Cycloconverter for LFAC Transmission Systems
Yongnam Cho
72 1000037 07-4349 Optimization of Storage Integration into MVDC in Shipboard Power System(SPS)
Amanuel Kesete
73 1000042 07-4045 Optimal Placement of PMUs for Islanding in Sub-transmission network
Abderrohmone Elondaloussi
74 1000061 07-4525 National Long-term Transmission Overlay Design: Process and Preliminary Results
Yifan Li
75 1000062 07-4527 Dynamic Modeling of Doubly-fed Induction Machine Considering the Asymmetric Coil Distribution and Slot Existence
Liangyi Sun
76 1000065 07-4545 Electrical Distribution Architectures for Future Commercial Facilities
Emmanuel Taylor
77 1000102 07-5079 Microgrids and Blackstart operation Sudarshan A Natarajan
78 1000106 07-4690 Short-term Load Forecasting of a University Campus with an Artificial Neural Network
David Palchak
79 1000107 07-5046 Impact of wind penetration on conventional transmission line fault location algorithms
Chaoqi Ji
80 20289851 A Novel Optimization Approach to Solve Power Flow Problem Using Complementarity
Mehrdad Pirnia
81 1000071 07-4556 Off-grid Power Quality: Impacts Arjun Gautam
Keywords—Distribution Network, Energy Storage, Control
I. SUMMARY
TILITIES face increasing pressure to improve reliability
while reducing capital expenditures. Utility-operated
distributed energy storage (DES) devices have the ability to
accomplish both of these tasks. The stored energy may be used
during outages to maintain power to customer equipment. The
utility can simultaneously rely on these devices to reduce
loading and provide voltage support during hours in which the
system is operating under stress, rather than investing in
equipment upgrades.
Utilities operating in regions with competitive electric
energy markets pay different prices at different locations and
at different times of day. These prices are called the
Locational Marginal Prices (LMP). Therefore, the utility can
reduce the cost of operating the storage devices by charging
during periods when the LMP is lower.
In order to be able to serve the load during an outage, the
battery must be charged sufficiently in advance of the outage.
At any given hour, the utility may estimate the number of
hours for which a given DES device could sustain an outage.
During periods of heavier load, a DES unit that is fully
charged cannot sustain an outage for as long as when the load
is lighter. During these periods of lighter load, the utility may
choose to sacrifice some of its outage support hours to
discharge the battery if the price of energy is high enough.
This opportunity motivates the development of an economic
scheduling algorithm that can decide when to charge and
discharge the battery for maximum profit while still keeping
enough reserve capacity to sustain an outage for a sufficient
period of time. Since the load is constantly changing, the
utility can benefit greatly by using a dynamic reserve capacity
requirement.
This optimum scheduling algorithm has as its objective to
maximize profits subject to constraints arising from the DES
Reza. Arghandeh is with with Virginia Tech – ECE Department,
Blacksburg, VA 24061, USA. (e-mail: [email protected]). Jeremy Woyak is with with Virginia Tech – ECE Department, Blacksburg,
VA 24061, USA. (e-mail: [email protected]).
Robert Broadwater is Professor of Virginia Tech – ECE Department, Blacksburg, VA 24061, USA. (e-mail: [email protected]).
Douglas Bish is Assistant Professor of Virginia Tech – ISE Department,
Blacksburg, VA 24061, USA. (e-mail: [email protected]).
specifications, the dynamic reserve requirements, as well as
system-level operating constraints. These system-level
operating constraints include requirements to discharge the
batteries to resolve overloads or to provide voltage support.
When the system-level constraints are violated, the dynamic
reserve requirements may be overridden—it is better to
prevent outages at the present time than to prepare for
unknown potential future outages.
The algorithm and results presented here demonstrate the
potential profits available to the utility under different load
scenarios.
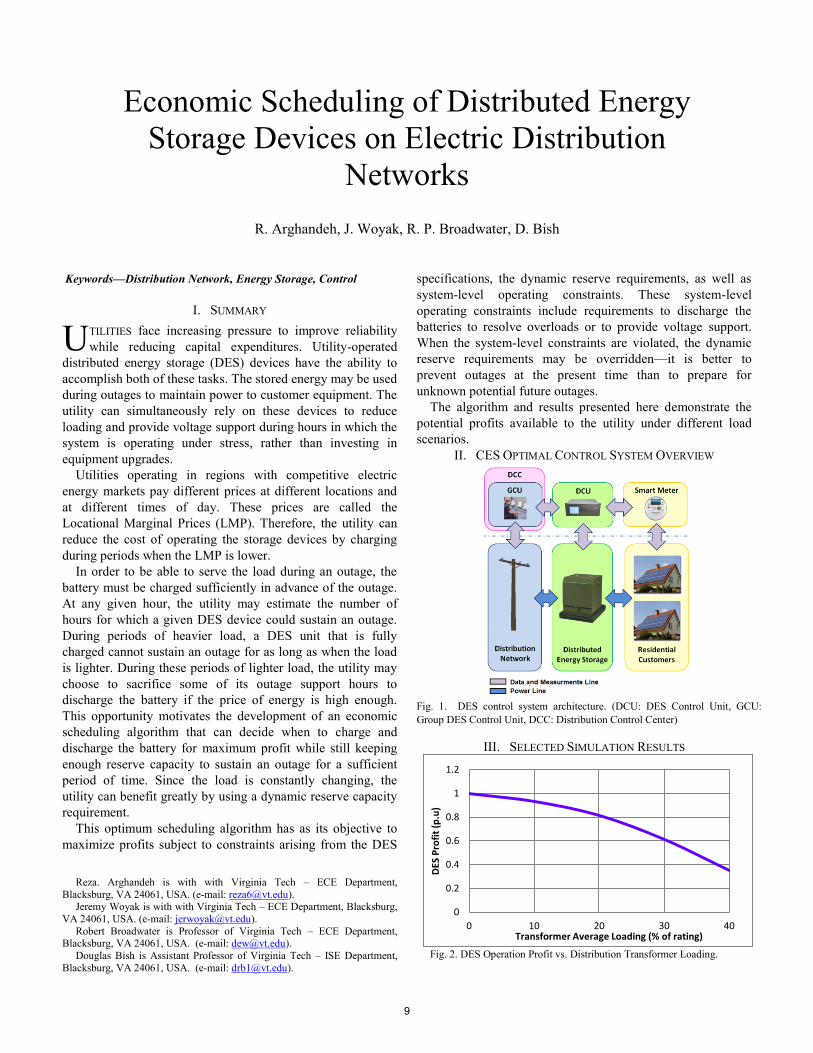
II. CES OPTIMAL CONTROL SYSTEM OVERVIEW
III. SELECTED SIMULATION RESULTS
Economic Scheduling of Distributed Energy
Storage Devices on Electric Distribution
Networks
R. Arghandeh, J. Woyak, R. P. Broadwater, D. Bish
U
Fig. 1. DES control system architecture. (DCU: DES Control Unit, GCU:
Group DES Control Unit, DCC: Distribution Control Center)
Fig. 2. DES Operation Profit vs. Distribution Transformer Loading.
0
0.2
0.4
0.6
0.8
1
1.2
0 10 20 30 40
DES
Pro
fit
(p.u
)
Transformer Average Loading (% of rating)
9
1
HE majority of electrical energy in the United States isproduced by fossil fuels, which release harmfulgreenhouse gas emissions. The U.S. Department of
Energy has established goals for a smart electric power grid,which facilitates the incorporation of clean, renewablegeneration sources, such as wind. A major challenge inincorporating renewable energy sources onto the power grid isbalancing their intermittent and often unpredictable powergeneration. In addition, wind generation is typically higher atnight, when consumer demand is low.
Residential electric water heaters (EWHs), which currentlyaccount for about 20% of the U.S. residential daily energydemand, are the largest contributors to the morning andevening peaks in residential power demand. This simulationstudy tested the hypothesis that controlling the thermostatsetpoints of EWHs can shift EWH electrical energy demandfrom hours of higher demand to hours of lower demand,provide a large percentage of the balancing reserves necessaryto integrate wind energy generation onto the electric powergrid, while maintaining safe water temperatures and withoutsignificantly increasing average daily power demand ormaximum power demand of the EWHs. In the experimentalsimulation, during high demand hours and/or low availablewind power, the thermostat setpoints of a group of EWHs withhigher temperature were set to a minimum, so that the EWHsconsume minimal energy. Conversely, during low-demandhours and/or high-wind periods (when excess wind powergeneration may be available), the thermostat setpoints of agroup of EWHs with lower temperature were increased by theutility to a maximum so that the EWHS absorb the availablepower. In order to assure customers’ safety, a mixing valvewas used on each individual EWH to mix the high-temperaturewater with cold water to reduce the water temperature to a safevalue for customer use before exiting the faucet.
The above strategy proved to be useful in shifting theresidential demand from high-demand hours to low demandperiods, reduced the aggregate residential peak demand, and
* Electrical and Computer Engineering Department,Montana State University, Bozeman, MT.
absorbed most of the excess available wind power during high-wind periods. As a result, the utility’s need for fossil-fueledspinning and non-spinning reserve capacity is reduced, whichwould also result in emission reduction.
Several goals were set for the above EWH powermanagement strategy, which is listed below in priority order. GOAL 1: Maintain customer comfort level GOAL 2: Load shifting from on-Peak to off-Peak hours GOAL 3: Peak load reduction or equality GOAL 4: Total energy demand reduction or equality GOAL 5: Economic benefit to customer GOAL 6: Provide desired balancing reserves
Simulation results show that the EWHs’ thermostat setpointstrategy resulted in a significant load shifting of aggregateresidential load from on-peak to off-peak hours and flattenedthe load profile, which helps reduce the balancing reservesneeded by the utility. The daily energy consumption of EWHsincreased slightly (about 7%) due to heat loss of the EWHs,which is a result of storing high-temperature (150-160oF) hotwater. This increase in EWH energy consumption can becompensated by the cost of the ancillary services that thecustomers provide to the utility. Therefore utilities will needto offer a financial incentive to the customers to encouragethem to participate in the program.
In general, the proposed EWH thermostat setpoint strategycan increase the reliability of the system and economicallybenefit the utility and customers through direct payment. Inparticular, when time-of-use pricing was implemented inconjunction with the afore-mentioned EWH thermostatsetpoint control, the energy consumed during on-peak hourswas reduced significantly, while the EWH water temperatureremained within safe limits.
Control of Aggregate Electric Water Heaters forLoad Shifting and Balancing Intermittent
Renewable Energy Generation in a Smart GridEnvironment
S.N. Patrick*, S.A. Pourmousavi*
Advisor: Dr.M.H. Nehrir*
T
10
Power System Reliability Enhancement Considering Smart Monitoring and Indication
Bamdad Falahati and Yong Fu Department of Electrical and Computer Engineering, Mississippi State University, Mississippi State, 39762, USA
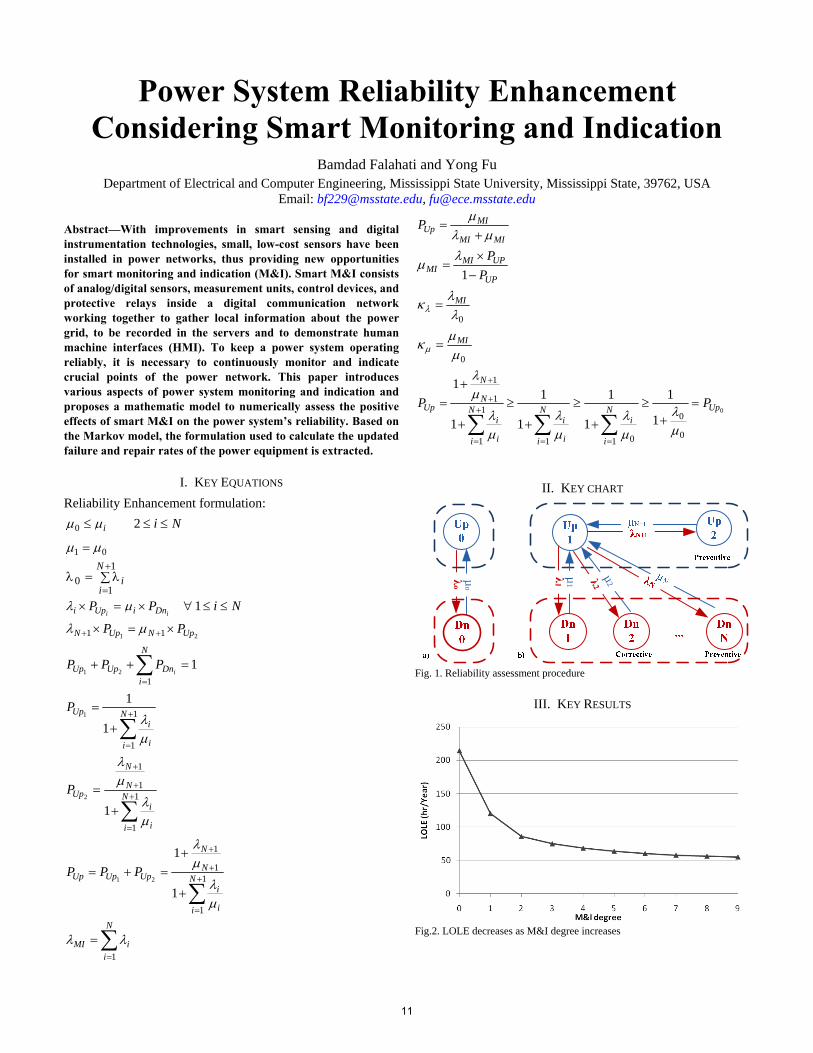
Email: [email protected], [email protected] Abstract—With improvements in smart sensing and digital instrumentation technologies, small, low-cost sensors have been installed in power networks, thus providing new opportunities for smart monitoring and indication (M&I). Smart M&I consists of analog/digital sensors, measurement units, control devices, and protective relays inside a digital communication network working together to gather local information about the power grid, to be recorded in the servers and to demonstrate human machine interfaces (HMI). To keep a power system operating reliably, it is necessary to continuously monitor and indicate crucial points of the power network. This paper introduces various aspects of power system monitoring and indication and proposes a mathematic model to numerically assess the positive effects of smart M&I on the power system’s reliability. Based on the Markov model, the formulation used to calculate the updated failure and repair rates of the power equipment is extracted.
I. KEY EQUATIONS Reliability Enhancement formulation:
Nii ≤≤≤ 20 μμ
01 μμ =
∑λ=λ+
=
1
10
N
ii
NiPPii DniUpi ≤≤∀×=× 1μλ
21 11 UpNUpN PP ×=× ++ μλ
11
21=++ ∑
=
N
iDnUpUp i
PPP
∑+
=
+
= 1
1
1
11 N
i i
iUpP
μλ
∑+
=
+
+
+
= 1
1
1
1
12 N
i i
i
N
N
UpP
μλ
μλ
∑+
=
+
+
+
+=+= 1
1
1
1
1
1
21 N
i i
i
N
N
UpUpUp PPP
μλ
μλ
∑=
=N
iiMI
1
λλ
MIMI
MIUpP
μλμ+
=
UP
UPMIMI P
P−×
=1λ
μ
0λλ
κλMI=
0μμ
κμMI=
0
0
0
1 01
1
1
1
1
1
1
1
1
1
1
1
1
UpN
i
iN
i i
iN
i i
i
N
N
Up PP =+
≥
+
≥
+
≥
+
+=
∑∑∑==
+
=
+
+
μλ
μλ
μλ
μλ
μλ
II. KEY CHART
λ2λo
µ2µo
λ1
µ1
Fig. 1. Reliability assessment procedure
III. KEY RESULTS
Fig.2. LOLE decreases as M&I degree increases
11
Analysis and Design of Demand Response
Programs Under Weather Uncertainty
Jiayi Jiang, Farshid Shariatzadeh, Anurag Srivastava and Sandip Roy
School of Electrical Engineering and Computer Science, Washington State University, Pullman, WA 99163, USA,
Email: [email protected], [email protected], [email protected] and [email protected]
Abstract—This poster begins a study of demand response
programs operating in the presence of weather
uncertainty. Specifically, we model the behavior and
performance of a direct load control (DLC) program for
a home air conditioning system, when weather
(temperature) is uncertain and residential power prices
are variable. We study both performance forecasting and
DLC design in this context, bringing to bear influence-
model- and ensemble-forecast- based weather forecasting
tools to achieve these goals.
I. MOTIVATION AND PROBLEM FORMULATION
Power suppliers and distributors are motivated to
reduce power consumption during high-usage periods,
both to avoid commitment of expensive generation
units and due to stability and security concerns. Direct
load control (DLC) programs, as one type of demand-
response mechanism, permit such reduction of
consumption by compelling or incentivizing end-users
to reduce consumption. DLC programs for private
homes, in particular, provide price incentives to
schedule consumption at low-demand periods: that is,
the varying price of power on the market is passed on
to the consumer, whereupon the consumer is motivated
to reduce usage to reduce cost. Thus, when DLCs are
implemented, the question of how residential end-users
can control/optimize scheduling of high-power-
consumption appliances (HVAC, water heater, lighting,
etc) becomes important. In this poster, we study
control and optimization of a home’s HVAC system,
for DLC. Specifically, we pursue forecasting and in
turn optimal design of an HVAC system in the face of
weather (specifically, temperature) uncertainty. Let us
first present a model for HVAC system operation under
DLC (on a hot day when air conditioning is needed). A
clocked model is assumed, in which signals are tracked
and control actions are taken at discrete time intervals
(labeled k=0,1,2…) over a horizon. First, the customer
is modeled as providing a desired temperature profile
, as well as bounds
, over the
horizon of interest. At each time instance, the actual
indoor temperature is denoted as , the outside
temperature is denoted as , and the price of power
is denoted as (where, in some situations, the price
may have a dependence on the outside temperature).
We assume that current temperature and price are
available to the controller, and that forecasts may or
may not be available. Based on available information,
the controller chooses a goal temperature profile ,
that meets the customer’s bounds but may differ from
the desired profile. The HVAC is then modeled as
being turned on ( =1) and off ( =0) to meet the
controller’s profile, as follows: if
( )(
) , where captures heat
transfer rate between the outside and inside of the
home and describes the cooling provided by the
HVAC, then =1, otherwise =0. For this
operational model, we note that the home temperature
then evolves as
( )(
)
. Finally, we envision the control scheme as
incurring a cost over the time horizon, which reflects
both the power cost and the comfort level of the home.
A plausible cost measure is: ∑ (
) , where D captures the power
consumption per 15 minutes by the air conditioner. Let
us stress that the model described here can be naturally
extended to capture HVAC operations (rather than only
air conditioning), and to consider multiple residential
customers: these extensions will be discussed on the
poster.
On the poster, the above model for HVAC control
for a DLC will be motivated in detail, and simulations
will be provided. In addition, two uses of the model
will be explored:
1) Performance Forecasting – The model will be used
to forecast HVAC performance under weather and
price uncertainty, for a given control scheme (i.e., rule
for choosing the controller temperature profile ).
Specifically, the influence-modeling paradigm will be
brought to bear to generate stochastic scenarios (i.e.,
possible futures or profiles) of outdoor temperature at
the home, and across a region of interest. We will also
explore whether these temperature forecasts can be
translated to price forecasts over a 24-hour time
horizon. Using the stochastic futures of
temperature/price, we will obtain a statistical
characterization of the performance (cost) of the
HVAC operation.
2) Control Design – We will pursue design of both
reactive (i.e., no forecasts are available) and forecast-
based control schemes, to improve or optimize HVAC
control. Specifically, we will 1) compare several
simple control schemes, and 2) seek for designs that
optimize the expected cost.
12
Abstract—With the attempt of making the power grid smarter
and intelligent, many researchers are now concentrating their
research on “Smart Grid” technologies aimed at upgrading the
power system by using state-of-the-art computer based online
monitoring and control tools along with advanced communication
facilities. Presently, smart grid technologies have started
spreading their spectrum over diverse applications in the power
system with the aim of fully automating the power grid, right
from micro to a macro level. Several algorithms have been
developed for smart grid applications which need to be tested and
validated before industrial deployment. This poster is a modest
attempt to present the findings of the effort that has been made to
model a smart power grid in real time by developing a “smart
grid research test bed” and validating different smart grid
algorithms using it. The algorithms that have been or will be
tested using the hardware test bed include a substation
automation algorithm and a real time voltage stability algorithm
(based on synchrophasors). This poster also addresses another
important issue in the synchrophasor industry, viz. PMU testing,
which has been performed in the Lab using the same test bed.
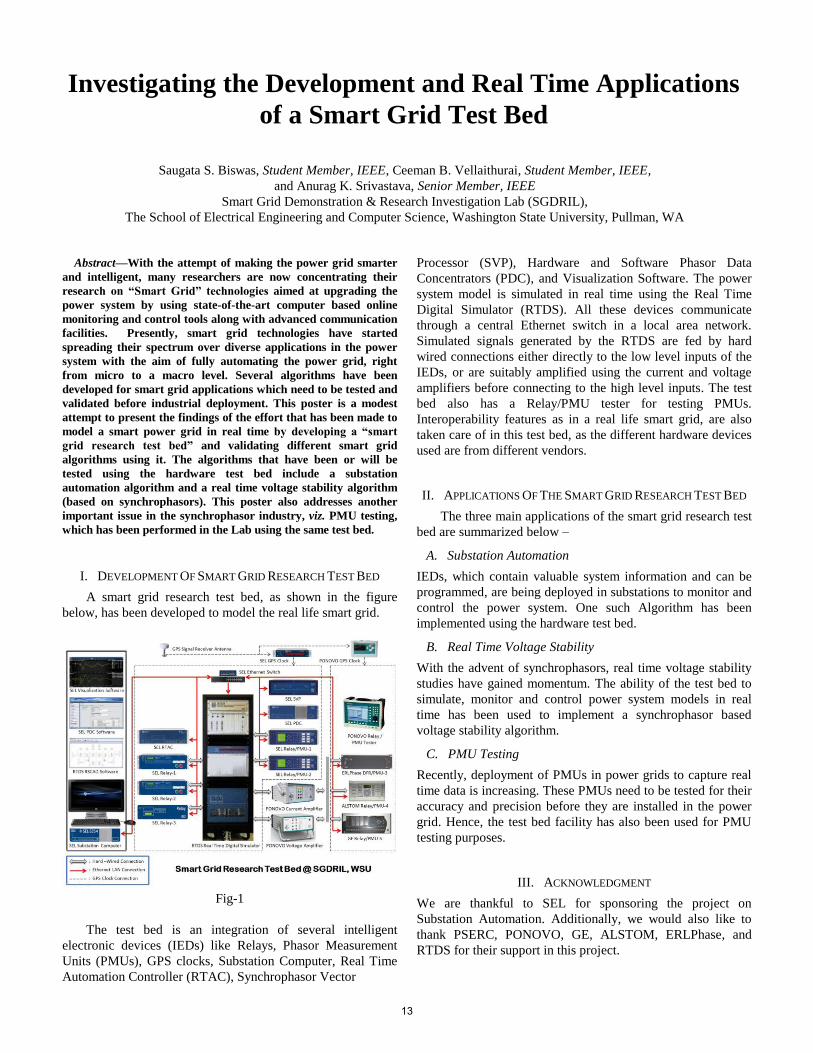
I. DEVELOPMENT OF SMART GRID RESEARCH TEST BED
A smart grid research test bed, as shown in the figure
below, has been developed to model the real life smart grid.
Fig-1
The test bed is an integration of several intelligent
electronic devices (IEDs) like Relays, Phasor Measurement
Units (PMUs), GPS clocks, Substation Computer, Real Time
Automation Controller (RTAC), Synchrophasor Vector
Processor (SVP), Hardware and Software Phasor Data
Concentrators (PDC), and Visualization Software. The power
system model is simulated in real time using the Real Time
Digital Simulator (RTDS). All these devices communicate
through a central Ethernet switch in a local area network.
Simulated signals generated by the RTDS are fed by hard
wired connections either directly to the low level inputs of the
IEDs, or are suitably amplified using the current and voltage
amplifiers before connecting to the high level inputs. The test
bed also has a Relay/PMU tester for testing PMUs.
Interoperability features as in a real life smart grid, are also
taken care of in this test bed, as the different hardware devices
used are from different vendors.
II. APPLICATIONS OF THE SMART GRID RESEARCH TEST BED
The three main applications of the smart grid research test
bed are summarized below –
A. Substation Automation
IEDs, which contain valuable system information and can be
programmed, are being deployed in substations to monitor and
control the power system. One such Algorithm has been
implemented using the hardware test bed.
B. Real Time Voltage Stability
With the advent of synchrophasors, real time voltage stability
studies have gained momentum. The ability of the test bed to
simulate, monitor and control power system models in real
time has been used to implement a synchrophasor based
voltage stability algorithm.
C. PMU Testing
Recently, deployment of PMUs in power grids to capture real
time data is increasing. These PMUs need to be tested for their
accuracy and precision before they are installed in the power
grid. Hence, the test bed facility has also been used for PMU
testing purposes.
III. ACKNOWLEDGMENT
We are thankful to SEL for sponsoring the project on
Substation Automation. Additionally, we would also like to
thank PSERC, PONOVO, GE, ALSTOM, ERLPhase, and
RTDS for their support in this project.
Investigating the Development and Real Time Applications
of a Smart Grid Test Bed
Saugata S. Biswas, Student Member, IEEE, Ceeman B. Vellaithurai, Student Member, IEEE,
and Anurag K. Srivastava, Senior Member, IEEE
Smart Grid Demonstration & Research Investigation Lab (SGDRIL),
The School of Electrical Engineering and Computer Science, Washington State University, Pullman, WA
13

Limiting Ramp Rates of the Wind Power Outputusing a Battery System
Duehee Leeand Ross Baldick
University of Texas at AustinAustin, Texas 78712-0240
Email: dlee, [email protected]
Peter SonXtreme Power Systems, LLC
Kyle, Texas 78640Telephone: (512) 268–8191
www.xtremepower.com
Abstract—The goal of this paper is to establish a battery systemin order to limit ramp rates of the wind power output. Batteryoperation policies are established, and then battery parameters,such as the power rating and battery capacity, are decidedthrough the simulation. The battery system is verified through thesum of all wind power sampled from all wind farms in ElectricityReliability Council of Texas (ERCOT).
I. INTRODUCTION
Wind power output has a lower capacity credit than conven-tional generators because of severe ramp events. Even thoughconventional generators could be dispatched to offset minorramp events, ramp rates bigger than the Ramp Rate Limit(RRL) are still the challenge to the balance between demandand supply. Moreover, sudden and uni-directional ramp eventsmake long and steep supply changes. However, a batterysystem can limit not only single severe power changes, butalso long and steep ramp events.
II. BATTERY MECHANISM
A battery has three operation modes: charging, discharging,and inactive. At every operational interval, a battery is inone of operation modes. Because of internal resistances, itis assumed that there is 10 % loss of discharging energy. Thelevel of charged energy over the battery capacity is measuredby the State of Charge (SOC). Because of the memory effect,it is assumed that a battery can be charged up to 90 %, and canbe discharged down to 10 % of battery capacity. Sum of batteryoutput and wind power output is called the net production. Thedifference between the previous net production and the presentwind power becomes the battery input.
III. DESIGN THE BATTERY SYSTEM
The power rating and battery capacity are decided to designthe battery system. The power rating is decided as the absolutevalue of maximum difference between the ideal wind powerand real wind power output. The ideal wind power alwayssatisfies the RRL. The battery size is decided recursively byrunning a simulation repeatedly, so the battery size is increasedfrom the initial value until the net production satisfies theRLL. Battery operates by following three policies: a) A batterycharges when ramp-up event violates the upper RRL anddischarges when ramp-down event violates the lower RRL.
0 10 20 30 40 50 60 70 80500
1000
1500
2000
2500
3000
3500
4000
Minutes
Win
d P
ow
er(
MW
)
Total Wind Power Generation in ERCOT in June 2009
Fig. 1. Wind power output is compensated by the battery operation. Greenline represents charging, and black dotted line represents discharging.
TABLE ICOMPARISON BETWEEN CONVENTIONAL WAYS AND A BATTERY SYSTEM
Energy [MWh] Curtailment Battery Operation
Energy Loss 2908.5 672.1Reserve Requirement 5256.3 0
b) A battery tries to stay at 0.5 SOC level. c) In other cases,the net production is allowed to follow the wind power output.
IV. SIMULATION & RESULT
Total wind power generation in ERCOT, which is sampledin June 2009 at every minute, is used to verify the batterysystem. Total capacity is 8,000 MW, and maximum windpower is 4,500 MW. The battery operation interval is also oneminute. The RRL is given as 30[MW/minutes]. In TABLE I,conventional ways and a battery system are compared. Forconventional ways, curtailment and reserve services are used.For the battery system, 1188 [MW] / 2770 [MWh] batteryis used. TABLE I shows that a battery can limit ramp ratesless energy loss and zero reserve requirement. A large batterycapacity is used because of double ramp events in Fig. 1.
V. CONCLUSION & FUTURE WORKS
In conclusion, the power rating, battery capacity, and oper-ation policies are decided to reduce violation of ramping limitin the wind power system.
14
Offshore Wind Farm Study in South Carolina Power
System Tingting Wang, Ph.D student
Electrical and Computer Engineering Department
Clemson University, Clemson, SC, 29634
Dr.Elham Makram, Fellow IEEE
Electrical and Computer Engineering Department
Clemson University, Clemson, SC, 29634
Abstract— South Carolina, as part of the eastern American
coastline, possesses potential offshore wind energy over twice the
amount of its state level consumption [1]. The South Carolina
Offshore Wind Project aims to integrate 80MW by 2014 and
1GW by 2020 into the power system. Offshore wind farms, with
large capacity and long distance to the shore, have to consider
the impact on the system before their installation. This poster
mainly studied steady state and switching transient impact on
South Carolina power system.
In steady state analysis part, offshore wind farm configuration
is figured out; the selection of wind power injection interface
buses considering the cost wind farm is introduced. After wind
power is divided among utilities, the maximum wind could be
absorbed by different utilities are studied as well as overloaded
transformers or transmission lines and voltage violation at buses.
For switching transient study, it is difficult to model each
generator with detailed models because of simulation time
constraint. On the other hand, wind farms consisting of large
numbers of relatively small and identical generating units makes
equivalent possible. In this poster, a DFIG based wind farm
equivalent model is presented for switching transient operation
analysis. After the equivalent model results are verified with
detailed model, several switching operations are designed to
study their impact on the system connected.
I. REFERENCE
[1] A Joint resolution requiring recommendations from the wind energy production farms feasibility study committee, “South Carolina’s role in offshore wind energy development”, energy.sc.gov, 2008
15

Optimizing EV Charge/Discharge Schedule in Smart
Residential BuildingsCasey Hubbard, Student Member, IEEE, Coby Lu, Student Member, IEEE, Russell Turner, Student Member, IEEE,
Diogenes Molina, Student Member, IEEE, and Ronald Harley, Fellow, IEEE
Department of Electrical and Computer Engineering
Georgia Institute of Technology
Atlanta, GA, USA
Abstract—As the level of penetration of electric vehicles (EVs)
increases they will begin to play an important role on the
operation of the smart grid. Utilities have recognized that time-
differentiated pricing schemes can help mitigate the negative
impact that high EV penetration would have on congestion by
giving economic incentives to consumers to charge their EV
batteries during off-peak periods. Devices that can automatically
react to time-varying prices optimally can potentially increase the
benefits of widespread EV utilization without the need for active
consumer participation.
This poster presents a mechanism for finding the optimal EV
day-ahead charge/discharge schedule to minimize daily energy
costs in residential buildings assuming time-varying electricity
prices. It is assumed that the building is equipped with
photovoltaic (PV) panels. Day-ahead forecasts of the PV array
output and of the residential load are generated locally and used
to ensure that the optimal policy accounts for the unique
characteristics of the location of the building, its effect on daily
solar irradiance and on the PV panels output, and to exploit the
behavioral patters of the occupants of the residence. EV battery
degradation due to each discharge cycle is estimated to ensure
that long term costs resulting from accelerated battery
replacement do not offset the benefits of day-to-day optimization.
Linear regression models and artificial neural networks are used
online to generate the day-ahead forecasts.
The optimal day-ahead schedule is constrained to ensure that
battery charge/discharge rate limits are respected, and that the
EV is fully charged by the time the consumer is ready to leave the
residence. Simulated annealing and the genetic algorithm are
evaluated in terms of convergence speed and computational costs
to select the more effective optimization algorithm between the
two for this application. Simulation models developed in
MATLAB Simulink coupled with real weather, load, and pricing
data are used to evaluate the adequacy of the proposed
algorithm. The energy resulting from EV discharging is never
sold back to the utility to mitigate some of the technical issues
that arise from vehicle-to-grid (V2G) operation.
The optimization routine is executed at each hour interval to
improve the robustness of the algorithm to inaccurate day-ahead
forecasts and to allow for potential schedule changes due to
unpredictable modifications of the consumer schedule and
departure time. Executing the routine at each hour with a
receding time horizon can also accommodate more demanding
stochastic pricing schemes such as real time pricing.
I. KEY FIGURES
5 10 15 20
0.12
0.14
0.16
0.18
0.2
0.22
0.24
Time[h]
En
erg
y P
rice
[$
/kW
h]
0 10 20 30 400.6
0.8
1
1.2
1.4
1.6
1.8
Time [h]
Bu
ildin
g L
oad
ActualNext-DayForecast
20 40 60 800
200
400
600
800
1000
1200
Time [h]
So
lar
Irra
dia
nce
[W
/m2]
20 40 60 80 100 1200
100
200
300
400
500
Voltage [V]
Pow
er
Ou
tput
[W]
5 10 15 200
0.2
0.4
0.6
0.8
1
Time[h]
EV
at
Ho
me
18 20 22 24 26 28 3040
50
60
70
80
Time [h]
Sta
te o
f C
harg
e [%
]
ScheduledActual
18 20 22 24 26 28 300
1
2
3
4
5
x 10-4
Time [h]
Degra
datio
n C
ost
s [$/k
Wh
]
This work was supported by the Opportunities Research Scholars
program at the department of Electrical and Computer Engineering at
the Georgia Institute of Technology, Atlanta, GA, USA
16

Cost to Benefit Analysis using Direct Load Control Application in Smart Grid
Abdur Rehman, Student Member, IEEE, Malik Baz, Student Member, IEEE, and Anurag K Srivastava, Senior Member, IEEE
Smart Grid Demonstration and Research Investigation Laboratory, The School of Electrical Engineering and Computer Science, Washington State University, Pullman, WA 99163, USA.
Email: [email protected], [email protected]
Abstract—One application of the Smart Grid is for the utility company or distribution system operators to switch off or cycle specific loads during system peak demand. Improper use of these Direct Load Control (DLC) algorithm without planning may lead to instability in the grid resulting in blackouts or brownout. This work addresses the types of loads that can be easily controlled in residential district and the cost to benefit analysis of the DLC operation for the specific load.
I. INTRODUCTION With smart grid initiative, some of the consumer loads has a
potential to be regulated and or controlled directly by the utility company or distribution system operators [1]. These loads are identified as those unnecessary to be on the grid around the clock and if they were switched off or shifted, it would not affect the consumer much in a negative way. The aspect of the utilities controlling the loads is known as Direct Load Control (DLC). The benefits for the utility to control these kind of loads are numerous. These types of loads operating at peak times can stress the lines as well as the grid as a whole, thus resulting in blackout or brownout. If DLC is not used properly in planned way, it may also result in blackout or brownout [2].
These types of loads would be generally controlled by the utilities in the event of peak system demand or to meet specific grid conditions [3-5]. The duration of the DLC load would be minimal; until the utility can re-gain the balance in the system, thus controlling the load only for a crucial amount of time. Only subtle, high demand loads will be controlled and it should not be noticeable to the consumer.
The fact that the utility has control over the load, pushes the grid in a whole new direction. In a direction, leading to more economical, stable and reliable operation. The implementation of this type of mechanism in a large scale is only possible today with enhanced communication, favorable policy and incentives. Utilities and distribution system operators (DSO) will not only be able to balance the grids from the generation side, but balance and control it from the load side as well.
III. KEY ANALYSIS Determining the right type of load to control at given time
will enable the utility or DSO to model or simulate the reduction in peak time usage. The power usage on high demand loads in residential area are dynamic and cycle
through either turning on or off. If DLC devices have 2 way communications that allows DSO to see which aggregated loads are turned on in a given geography, they can calculate the cost to benefit ratio (CBR) for exploring possible incentive to be offered to meet the grid reliability goals.
This work attempts to analyze the types of loads that can be controlled easily for a given geography and the cost to benefit analysis for aggregated load. A complex algorithm will be studied to model specific loads for a location of N number of homes, the amount of power each load is drawing, whether the load is turned on or off at the time of DLC operation, the number of loads to turn off to accomplish a reduction of X amount, the CBR for controlling that specific load, and finally, a list of the best possible loads to turn off given the input, starting from the best CBR.
IV. SUMMARY Direct Load Control will enable the utilities to prevent a
possible blackout and or brownout. Giving the utilities, an ability to control the load will empower them to keep the required balance in the system. This work discusses the best plan of action through the cost to benefit ratio of each load.
VI. REFERENCE [1]. Ipakchi, F. Albuyeh, “Grid of the future”, IEEE Power and
Energy Magazine, vol. 7, issue 2, pp. 52 – 62, March-April 2009. [2]. Federal Energy Regulatory Commission, “Assessment of
Demand Response & Advance Metering”, 2 0 0 6 Staff Report, Docket Number. AD-06-2-00 Revised: 2008.
[3]. K. Hamilton, N. Gulhar, “Taking Demand Response to the Next Level”, IEEE Power and Energy Magazine, vol. 8, issue 3, pp. 60 – 65, May-June 2010.
[4]. F. Rahimi, A. Ipakchi, A., “Demand Response as a Market Resource Under the Smart Grid Paradigm”, IEEE Transactions on Smart Grid, vol. 1, issue 1, pp. 82 – 88, June 2010.
[5]. P. Wang, J. Y. Huang, Y. Ding, P. Loh, L. Goel, “Demand side load management of smart grids using intelligent trading/ metering/ billing system”, IEEE Power Tech Conference, Trondheim, pp. 1 – 6., 19-23 June 2011.
17

Synchrophasor Measurement based Situational
Awareness System for Smart Grid – A Scalable
Framework
Karthikeyan Balasubramaniam, and Ganesh Kumar Venayagamoorthy, Senior Member, IEEE
Real-Time Power and Intelligent Systems Laboratory
Holcombe Department of Electrical and Computer Engineering
Clemson University, Clemson, South Carolina 29634, USA
[email protected], and [email protected]
Synchrophasors make power grids more observable by
collecting data from various locations, time-align and process
them as a coherent data set. . In power systems, optimal power
flow dispatch is updated every five minutes. Variations
between dispatches are handled by local controllers with little
or no system wide information. Local controllers with system
wide information have better situational awareness and can
formulate better control strategy. A limiting factor to this
approach is communication delays. Power system wide area
communication delays range from several milliseconds to
several seconds depending on the communication media and
distance. One way to deal with this is to have an intelligent
system which can predict state values for one or more time
steps ahead of time. A novel synchrophasor measurement
based situational awareness system for smart grid using
cellular neural networks (CNN) framework is proposed.
Recurrent neural network (RNN) is used as computational
engine for each cell as RNNs have dynamic memory. By using
information from phasor measurement units (PMUs) that are
optimally located in a power system, each layer predicts a
state variable for one or more time steps.
Fig 1: Each block represents a cell, where RNN is used as computational
engine. Spatial dynamics are captured by connectivity i.e. information flow
between cells, while temporal dynamics are captured by RNN. The four
different layers predict speed deviation, terminal voltage, generator active power output and line flows. In addition to cells being connected to each other
within a layer, there is also information flow between layers. This coupling
enables better prediction.
Data from remote PMUs are replaced by the respective CNN
cells’ time delayed predicted state values for next time step.
This enables local controllers to take real-time control action
with system wide information. A 12-bus test power system is
used to develop and demonstrate the effectiveness of the
proposed situational awareness system.
Fig 2: Voltage prediction layer connectivity. Cells are superimposed on top of one line diagram of 12 bus test system. Voltage prediction at all the 12 buses
is to be carried out and hence there are 12 cells. The blue dashed lines
represent the connectivity between each cell where direction of information flow is indicated by arrows.
0 20 40 60-5
0
5x 10
-3 dw1
time
Spe
ed d
evia
tion
in P
U
actual
predicted
0 20 40 60-5
0
5x 10
-3 dw2
time
Spe
ed d
evia
tion
in P
U
0 20 40 60-5
0
5x 10
-3 dw3
time
Spe
ed d
evia
tion
in P
U
0 20 40 60-5
0
5x 10
-3 dw4
time
Spe
ed d
evia
tion
in P
U
Fig 3: Testing results for speed deviation prediction of all four generators.
Data is sampled at 10 Hz.
18
Applications of synchrophasor in utilities.
Zagoras Nikitas and Ganesh Kumar Venayagamoorthy, Senior Member, IEEE
Real-Time Power and Intelligent Systems Laboratory
Holcombe Department of Electrical and Computer Engineering Clemson University
Clemson, South Carolina 29634, USA
[email protected] and [email protected]
The spate of blackouts on power systems, in the past few years,
throughout the world is driving the need for the wide scale
deployment of synchrophasors also widely known as phasor
measurement units (PMUs). Synchrophasors have become the
measurement system of choice in the electric power systems
industry. This is due to the fact that synchrophasors provide a
variety of information relevant to the status of the grid; while
simultaneously reporting the exact time of the logging. This is
achieved via a satellite interconnection with a Global Positioning
System (GPS). A smarter grid has become a major driving force
towards the development of novel technologies in the electric
energy delivery industry around the world. Scientists and
engineers around the world have developed or are in the process
of developing numerous new applications for the deployment of
synchrophasors. Synchrophasor technology promises to enhance
the planning, design and operation of the power grid. This
technology can give self-healing properties in the grid as in
facilitating the integration of various power generation solutions,
while facilitating the optimization of asset utilization. This
research aims in collecting and categorizing all the applications
that are used or proposed for a future use in the utilities. (Navin
B. Bhatt, 2009)
Synchrophasors, phasor measurement units (PMUs),
applications, utilities, smart grid.
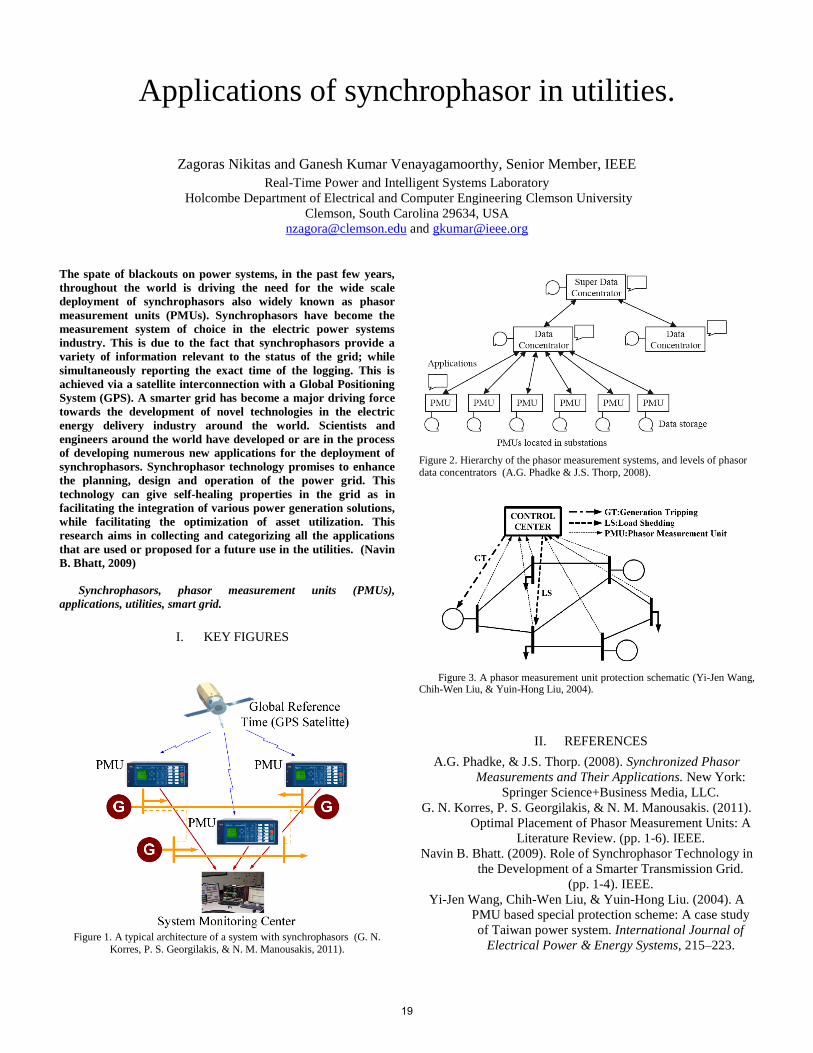
I. KEY FIGURES
Figure 1. A typical architecture of a system with synchrophasors (G. N.
Korres, P. S. Georgilakis, & N. M. Manousakis, 2011).
Figure 2. Hierarchy of the phasor measurement systems, and levels of phasor
data concentrators (A.G. Phadke & J.S. Thorp, 2008).
Figure 3. A phasor measurement unit protection schematic (Yi-Jen Wang, Chih-Wen Liu, & Yuin-Hong Liu, 2004).
II. REFERENCES
A.G. Phadke, & J.S. Thorp. (2008). Synchronized Phasor
Measurements and Their Applications. New York:
Springer Science+Business Media, LLC.
G. N. Korres, P. S. Georgilakis, & N. M. Manousakis. (2011).
Optimal Placement of Phasor Measurement Units: A
Literature Review. (pp. 1-6). IEEE.
Navin B. Bhatt. (2009). Role of Synchrophasor Technology in
the Development of a Smarter Transmission Grid.
(pp. 1-4). IEEE.
Yi-Jen Wang, Chih-Wen Liu, & Yuin-Hong Liu. (2004). A
PMU based special protection scheme: A case study
of Taiwan power system. International Journal of
Electrical Power & Energy Systems, 215–223.
19
1
Abstract-- The basic function of voltage regulation in the
distribution system is to keep the steady state voltage within an
acceptable range all the time. With increasing penetration of grid
connected distributed solar photovoltaic (PV) sources, voltage
regulation is becoming challenging. In particular, capacitor banks
and voltage regulators that normally boost voltage slightly may
push utilization voltages either above or below the standard limits
because of PV’s variable nature. This can adversely affect the
expected 99.999% reliability requirement of smart grid and also
decrease the life span of voltage regulating equipment due to
excessive operations. Wide coordination using remote control,
real time measurement of data, accurate load and solar
forecasting and communication infrastructure enabled by the
smart grid initiative has the potential to limit this effect. This
paper presents a centralized controller which dispatches a
coordinated schedule for the switched voltage regulators,
capacitor banks and desired reactive power of distributed PV
generators based on real time measurements to effectively
regulate the feeder voltage and reduce the line losses, at the same
time satisfying the equality and inequality constraints on the
switching of voltage regulating equipment and power flow
equations at the nodes.
I. KEY EQUATIONS
The Multi objective function for the controller is given by
( ) ( )( )21 2
,
1
minn
desired actual line
i i i i loss i
i
J w V V w P=
= − +
∑ (1)
Subject to the constraints
max
1
1
n
tap i i tap
i
N TAP TAP N−=
= − ≤∑ (2)
max
, , 1
1 1
n n
cap bank i bank i cap
i bank
N CAP CAP N−= =
= ⊕ ≤∑ ∑ (3)
min , maxbranch iV V V≤ ≤ (4)
( ), , , 0L P Q V δ = (5)
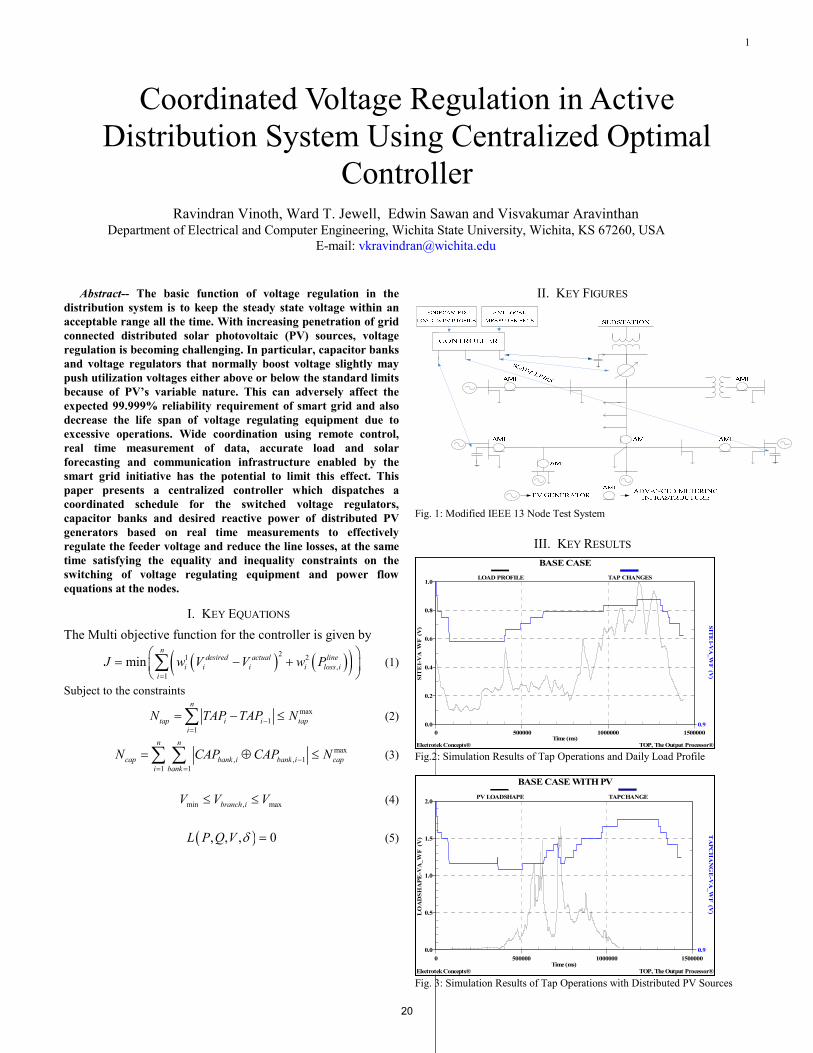
II. KEY FIGURES
Fig. 1: Modified IEEE 13 Node Test System
III. KEY RESULTS
Fig.2: Simulation Results of Tap Operations and Daily Load Profile
Fig. 3: Simulation Results of Tap Operations with Distributed PV Sources
Coordinated Voltage Regulation in Active
Distribution System Using Centralized Optimal
Controller Ravindran Vinoth, Ward T. Jewell, Edwin Sawan and Visvakumar Aravinthan
Department of Electrical and Computer Engineering, Wichita State University, Wichita, KS 67260, USA
E-mail: [email protected]
0.0
0.2
0.4
0.6
0.8
1.0
0.9
0 500000 1000000 1500000
BASE CASE
Electrotek Concepts® TOP, The Output Processor®
SIT
E1-V
A_W
F (V
)
SIT
E1-V
A_W
F (V
)
Time (ms)
LOAD PROFILE TAP CHANGES
0.0
0.5
1.0
1.5
2.0
0.9
0 500000 1000000 1500000
BASE CASE WITH PV
Electrotek Concepts® TOP, The Output Processor®
LO
AD
SH
AP
E-V
A_W
F (V
)
TA
PC
HA
NG
E-V
A_W
F (V
)
Time (ms)
PV LOADSHAPE TAPCHANGE
20

Abstract-- The Frequency Monitoring Network (FNET) uses
Frequency Disturbance Recorders (FDRs) to collect time-synchronized frequency and angle measurements from electric power systems around the world. Once received by the FNET servers, the measurements are time-aligned, stored, and retained for additional processing.
Detection and classification of frequency signatures caused by system disturbances (“events”) are two of the most critical functions of the FNET server application. FNET can detect several different types of disturbances, including generator trips, load shedding, and oscillations. The software-based event classifiers used by the FNET server application have traditionally relied upon empirically-derived models of system behavior. While these perform reasonably well, they are difficult to develop since each classifier must be configured for a particular grid.
This paper presents different configurations of Artificial Neural Network (ANN)-based classifiers for power system events that can successfully identify disturbances in multiple interconnections. Results show that the networks were generally quite accurate (>90%) in terms of choosing the correct event type. Although the classifiers sometimes chose the wrong interconnection for a given category, this is inconsequential since the interconnection for a particular FDR is known a priori. Most likely, two separate networks will be needed to ensure sufficient overall accuracy. In this case, the so-called “monolithic” classifier (Fig. 1) trained with all types of events would first be used to distinguish between 1) load shedding, 2) generator trip, and 3) line trip/oscillation events. A second network (Fig. 2) would then be used to distinguish between line trips and oscillations if the first network places the event in the third category.
Index Terms—Frequency Monitoring Network (FNET), Artificial Neural Network, Phasor Measurement Unit, Frequency Disturbance Recorder (FDR), even classification, power system frequency
I. KEY RESULTS
Fig. 1. Confusion matrix for network containing all types of events.
Fig. 2. Confusion matrix for network containing line trip and oscillation cases only.
Artificial Neural Network-Based Classifier for Power System Events
Penn Markham and Yilu Liu Department of Electrical Engineering and Computer Science
University of Tennessee, Knoxville, 37996
21

1
Development of an Agent-Based Distribution TestFeeder with Smart-Grid Functionality
Pedram Jahangiri, Student Member, IEEE, Di Wu, Student Member, IEEE, Wanning Li, Student Member, IEEE,Dionysios C. Aliprantis, Senior Member, IEEE, and Leigh Tesfatsion, Member, IEEE
Abstract—This poster reports on the development of an agent-based distribution test feeder with smart-grid functionality. Thetest feeder is based on an actual distribution feeder with variousadditional features incorporated, including rooftop photovoltaicgeneration and price-responsive loads (e.g., plug-in electric vehi-cles and intelligent air-conditioning systems). This work aimsto enable the integrated study of wholesale electric powermarkets coupled with detailed representations of the retail-sidedistribution systems.
Index Terms—Air conditioning, electric vehicles, multi-agentsystems, photovoltaic systems, power distribution, smart grid.
Pedram Jahangiri (S’10) received the B.S. and M.S. degrees in electricalengineering from Isfahan University of Technology and Sharif University ofTechnology, Iran, in 2006 and 2008, respectively. He is currently workingtoward the Ph.D. degree in the Department of Electrical and ComputerEngineering at Iowa State University, with research emphasis on smartdistribution systems. He has been previously employed as a researcher bythe Electric Ship Research and Development Consortium, Mississippi StateUniversity, MS, USA, and by the Automation of Complex Power SystemsCenter, RWTH University, Aachen, Germany.
Di Wu (S’08) received the B.S. and M.S. degrees in electrical engineeringfrom Shanghai Jiao Tong University, China, in 2003 and 2006, respectively. Heis currently a Ph.D. candidate in the Department of Electrical and ComputerEngineering at Iowa State University. His research interests include impactsof plug-in electric vehicles on power systems; planning of national energy andtransportation infrastructures; power electronics, with applications in hybridelectric vehicles and wind energy conversion systems.
Wanning Li (S’12) received the B.S. degree in electrical engineering fromHarbin Institute of Technology, China, in 2011. She is currently workingtoward the Ph.D. degree in the Department of Electrical and ComputerEngineering at Iowa State University. Her research interest lies in energymarket risk management, and market efficiency assessment.
Dionysios C. Aliprantis (SM’09) received the Diploma in electrical andcomputer engineering from the National Technical University of Athens,Greece, in 1999, and the Ph.D. from Purdue University, West Lafayette, IN,in 2003. He is currently an Assistant Professor of Electrical and ComputerEngineering at Iowa State University. He was a recipient of the NSF CAREERaward in 2009. He serves as an Associate Editor for the IEEE PowerEngineering Letters, and the IEEE Transactions on Energy Conversion. Hisresearch interests are related to electromechanical energy conversion andthe analysis of power systems. More recently his work has focused ontechnologies that enable the integration of renewable energy sources in theelectric power system, and the electrification of transportation.
Leigh Tesfatsion (M’05) received the Ph.D. degree in economics from theUniversity of Minnesota in 1975. She is Professor of Economics, Mathematics,and Electrical and Computer Engineering at Iowa State University. Herprincipal research area is agent-based test bed development, with a particularfocus on restructured electricity markets. She is an active participant in IEEEPES working groups and task forces focusing on power economics issues.She serves as associate editor for a number of journals, including J. of EnergyMarkets.
22

Processing and Visualization of Disturbance DataStored in a Phasor Data Concentrator
Om P. Dahal and Sukumar M. Brahma
Klipsch School of Electrical and Computer Engineering,New Mexico State University
Las Cruces, NM 88003-8001, USAE-mail: omp,[email protected]
Abstract—Phasor measurement unit (PMU) data stored inPhasor Data Concentrators (PDCs) offer an excellent centralizedrepository of signatures of many events that are typically eithernot logged, or locally logged. The data also provide angleinformation across power systems, and can give quick andaccurate assessment of stress. When the system is stressed, itmay be advantageous to know the smallest of changes in realtime, since such knowledge can better inform control schemesand any adaptive relaying action for Remedial Action Schemes(RAS), thus improving the chances of averting system instability.Therefore, data mining and real time classification of disturbanceevents recorded on PDCs is a useful exercise. Unfortunately, inmost cases, data stored in the PDCs is simply archived, or usedfor some off-line applications.
For this purpose, a suitable data mining and visualizationmethod, as well as a classification method is required. This posterexplores one data visualization method using disturbance filesfrom the PDC owned by the Public Service Company of NewMexico (PNM). This PDC stores data from four PMUs at fourmajor 345-kV substations in the PNM system. The poster showswhat raw PDC data look like, and how these data need to be pre-processed before being used. The performance of the MinimumVolume Enclosing Ellipsoid (MVEE) method is explored to createsignatures from a pre-processed disturbance file from the PDC.Results are presented, and analyzed. Based on the results, scopeof future work is presented.
I. KEY EQUATIONS
If the data window has m samples and number of PMU mea-surements equal n, a measurement matrix S can be constructedas shown in (1):
S := [s1|s2|.....|sm]. (1)
Where, s1, s2,....., sm are column vectors of height n.A minimum volume enclosing ellipsoid EQ,c in Rn is
specified by a n×n symmetric positive-definite matrix Q anda center c ∈ Rn and is defined as:
EQ,c := x ∈ Rn : (x− c)TQ(x− c) ≤ 1. (2)
The problem of determining the minimum volume enclosingellipsoid containing all points of S is equivalent to finding avector c ∈ Rn and n × n positive definite symmetric matrixQ, which minimizes det(Q−1)
12 , subject to (3).
minQ,c det(Q−1)12
subject to
(xi − c)TQ(xi − c) ≤ 1, i = 1, 2, ...,m. (3)
Q > 0The volume of the MVEE is given by:
V ol(EQ,c) =π
n2
Γ(n+22 )
det(Q−1)12 (4)
Where Γ(.) is the standard gamma function in calculus.
II. KEY FIGURES
1600 1620 1640 1660 1680 1700 1720 1740 1760 1780 18001.015
1.02
1.025
1.03
1.035
1.04
1.045
1.05
Number of samples
Vo
ltag
e in
per
un
it
PMU
1PMU
2PMU
3
W0
W1
W2
W3
Fig. 1. Plots of three PMU-voltages from a disturbance file stored on PDC.
1.01
1.03
1.05
1.01
1.03
1.051.01
1.03
1.05
PMU1
PMU2
PM
U3
B
A
Fig. 2. The MVEE for window - W1 in Fig. 1.
23

Using Graph Theory to Analyse the Vunerability of Smart Electrical Grids
Timothy A. Ernnster School of Electrical Engineering & Computer Science
Washington State University Pullman, WA
Anurag K. Srivastava School of Electrical Engineering & Computer Science
Washington State University Pullman, WA
Abstract— Threat assessments play a key role in determining appropriate mitigation strategies to counter credible threats to the power system. In order to further understand the capability of a malicious agent to coordinate an attack on the power grid given limited system information, graph theory based centrality measures are utilized for power systems vulnerability analysis. Results are compared to vulnerability analysis indices utilizing DC power flow based linear sensitivity factors with complete power system information. Correlations of centrality and linear sensitivity factor based vulnerability rankings are performed, and matched pair comparisons of top rankings are presented using the nonparametric Wilcoxon signed rank statistical test. Evidence is presented in support of the edge betweeness centrality measure in determining sensitive line outages based solely on the branch impedance values of a power system. Results obtained for four different test case systems indicate the threat potential of a system attack planned from limited topology information.
I. KEY EQUATIONS The equations for degree, eigenvector, closeness centrality,
vertex betweeness centrality, and edge betweeness centrality:
| |
1 1
1
| | 2
1
∑ ,∈ \ 3
∈
4
∈
5
II. KEY FIGURES
Fig. 1. Polish 2383 Bus System correlations: degree and eigenvector
centrality with the bus injection impact factor (BIIF).
Fig. 2. Polish 2383 Bus System correlations: closeness and vertex betweeness
centrality with the bus injection impact factor (BIIF). 1
III. KEY RESULTS Statistical results indicating similarity between centrality and DC power flow based sensitivity contingency ranking schemes.
TABLE I
WILCOXON SIGNED RANK TEST FOR TOP 10 VULNERABILITIES – CLOSENESS CENTRALITY MATCHED TO THE BIIF INDEX
Test System N Estimated Median
Lower Bound
Upper Bound
Achieved Confidence
IEEE-14 10 1 -1.0 4.5 94.7% IEEE-30 10 3.0 0.0 6.5 94.7% IEEE-57 10 4.5 -1.0 11.5 94.7%
Polish-2383 10 80 20 404 94.7%
TABLE II WILCOXON SIGNED RANK TEST FOR TOP 10 VULNERABILITIES – EDGE
BETWEENESS CENTRALITY MATCHED TO THE LOIF INDEX
Test System N Estimated Median
Lower Bound
Upper Bound
Achieved Confidence
IEEE-14 10 3.0 -1.5 7.0 94.7% IEEE-30 10 5.0 -2.0 11.5 94.7% IEEE-57 10 6.0 -1.5 10.0 94.7%
Polish-2383 10 5.0 -1.5 58 94.7%
IV. SUMMARY Centrality measures can be utilized in evaluating power
system vulnerability to a coordinated branch outage attack. This is useful in developing attack models for an attacker possessing only limited system topology information.
This research was funded by Department of Energy (DoE) Award Number DE-OE0000097 (Trustworthy Cyber Infrastructure for the Power Grid).
24
Optimal Power Dispatch via Constrained Distributed Sub-gradient algorithm
Wei Zhang, Student Member, IEEE, Yinliang Xu, Student Member, IEEE, Wenxin Liu, Member, IEEE New Mexico State University, Las Cruces, NM 88001
Email: wzhang; daneilxu;[email protected]
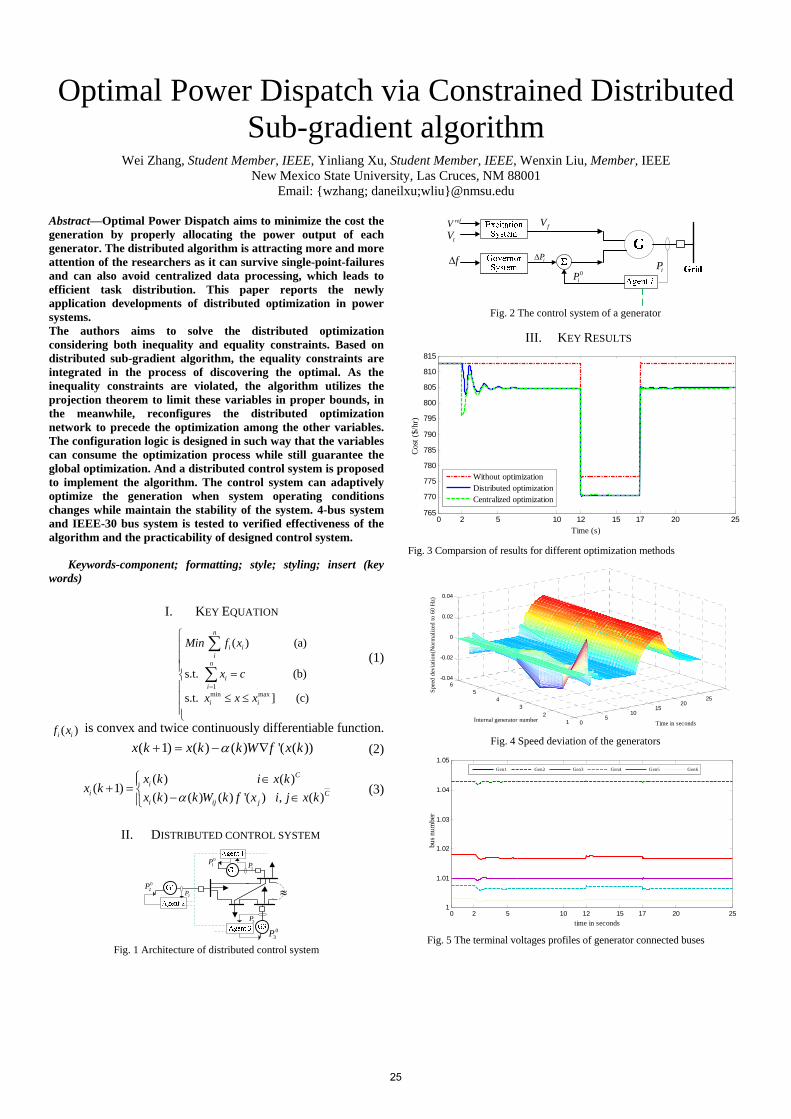
Abstract—Optimal Power Dispatch aims to minimize the cost the generation by properly allocating the power output of each generator. The distributed algorithm is attracting more and more attention of the researchers as it can survive single-point-failures and can also avoid centralized data processing, which leads to efficient task distribution. This paper reports the newly application developments of distributed optimization in power systems. The authors aims to solve the distributed optimization considering both inequality and equality constraints. Based on distributed sub-gradient algorithm, the equality constraints are integrated in the process of discovering the optimal. As the inequality constraints are violated, the algorithm utilizes the projection theorem to limit these variables in proper bounds, in the meanwhile, reconfigures the distributed optimization network to precede the optimization among the other variables. The configuration logic is designed in such way that the variables can consume the optimization process while still guarantee the global optimization. And a distributed control system is proposed to implement the algorithm. The control system can adaptively optimize the generation when system operating conditions changes while maintain the stability of the system. 4-bus system and IEEE-30 bus system is tested to verified effectiveness of the algorithm and the practicability of designed control system.
Keywords-component; formatting; style; styling; insert (key words)
I. KEY EQUATION
1min max
( ) (a)
s.t. (b)
s.t. ] (c)
n
i ii
n
ii
i i
Min f x
x c
x x x
(1)
( ) i if x is convex and twice continuously differentiable function. ( 1) ( ) ( ) '( ( ))x k x k k W f x k (2)
( ) ( ) ( 1)
( ) ( ) ( ) '( ) , ( )
Ci
i Ci ij j
x k i x kx k
x k k W k f x i j x k
(3)
II. DISTRIBUTED CONTROL SYSTEM
02P
03P
01P
2P
3P
1P
Fig. 1 Architecture of distributed control system
f
refVtV
0iP
iP
fV
iP
Fig. 2 The control system of a generator
III. KEY RESULTS
0 2 5 10 12 15 17 20 25765
770
775
780
785
790
795
800
805
810
815
Time (s)
Cost
($/h
r)
Without optimizationDistributed optimizationCentralized optimization
Fig. 3 Comparsion of results for different optimization methods
05
1015
2025
12
34
56
-0.04
-0.02
0
0.02
0.04
Time in secondsInternal generator number
Spee
d de
viat
ion(
Nor
mal
ized
to 6
0 H
z)
Fig. 4 Speed deviation of the generators
0 2 5 10 12 15 17 20 251
1.01
1.02
1.03
1.04
1.05
time in seconds
bus n
umbe
r
Gen1 Gen2 Gen3 Gen4 Gen5 Gen6
Fig. 5 The terminal voltages profiles of generator connected buses
25

sentence is punctuated outside of the closing parenthesis (like this). (A parenthetical sentence is punctuated within the parentheses.)
A graph within a graph is an “inset”, not an “insert”. The word alternatively is preferred to the word “alternately” (unless you really mean something that alternates).
Do not use the word “essentially” to mean “approximately” or “effectively”.
In your paper title, if the words “that uses” can accurately replace the word “using”, capitalize the “u”; if not, keep using lower-cased.
Be aware of the different meanings of the homophones “affect” and “effect”, “complement” and “compliment”, “discreet” and “discrete”, “principal” and “principle”.
Do not confuse “imply” and “infer”.
The prefix “non” is not a word; it should be joined to the word it modifies, usually without a hyphen.
There is no period after the “et” in the Latin abbreviation “et al.”.
The abbreviation “i.e.” means “that is”, and the abbreviation “e.g.” means “for example”.
An excellent style manual for science writers is [7].
IV. USING THE TEMPLATE After the text edit has been completed, the paper is ready
for the template. Duplicate the template file by using the Save As command, and use the naming convention prescribed by your conference for the name of your paper. In this newly created file, highlight all of the contents and import your prepared text file. You are now ready to style your paper; use the scroll down window on the left of the MS Word Formatting toolbar.
A. Authors and Affiliations The template is designed so that author affiliations are not
repeated each time for multiple authors of the same affiliation. Please keep your affiliations as succinct as possible (for example, do not differentiate among departments of the same organization). This template was designed for two affiliations.
1) For author/s of only one affiliation (Heading 3): To change the default, adjust the template as follows.
a) Selection (Heading 4): Highlight all author and affiliation lines.
b) Change number of columns: Select the Columns icon from the MS Word Standard toolbar and then select “1 Column” from the selection palette.
c) Deletion: Delete the author and affiliation lines for the second affiliation.
d) For author/s of more than two affiliations: To change the default, adjust the template as follows.
e) Selection: Highlight all author and affiliation lines. f) Change number of columns: Select the “Columns”
icon from the MS Word Standard toolbar and then select “1 Column” from the selection palette.
g) Highlight author and affiliation lines of affiliation 1 and copy this selection.
h) Formatting: Insert one hard return immediately after the last character of the last affiliation line. Then paste down the copy of affiliation 1. Repeat as necessary for each additional affiliation.
i) Reassign number of columns: Place your cursor to the right of the last character of the last affiliation line of an even numbered affiliation (e.g., if there are five affiliations, place your cursor at end of fourth affiliation). Drag the cursor up to highlight all of the above author and affiliation lines. Go to Column icon and select “2 Columns”. If you have an odd number of affiliations, the final affiliation will be centered on the page; all previous will be in two columns.
B. Identify the Headings Headings, or heads, are organizational devices that guide
the reader through your paper. There are two types: component heads and text heads.
Component heads identify the different components of your paper and are not topically subordinate to each other. Examples include Acknowledgments and References and, for these, the correct style to use is “Heading 5”. Use “figure caption” for your Figure captions, and “table head” for your table title. Run-in heads, such as “Abstract”, will require you to apply a style (in this case, italic) in addition to the style provided by the drop down menu to differentiate the head from the text.
Text heads organize the topics on a relational, hierarchical basis. For example, the paper title is the primary text head because all subsequent material relates and elaborates on this one topic. If there are two or more sub-topics, the next level head (uppercase Roman numerals) should be used and, conversely, if there are not at least two sub-topics, then no subheads should be introduced. Styles named “Heading 1”, “Heading 2”, “Heading 3”, and “Heading 4” are prescribed.
C. Figures and Tables 1) Positioning Figures and Tables: Place figures and
tables at the top and bottom of columns. Avoid placing them in the middle of columns. Large figures and tables may span across both columns. Figure captions should be below the figures; table heads should appear above the tables. Insert figures and tables after they are cited in the text. Use the abbreviation “Fig. 1”, even at the beginning of a sentence.
TABLE I. TABLE TYPE STYLES
Table Head
Table Column Head Table column subhead Subhead Subhead
26

We suggest that you use a text box to insert a graphic (which is ideally a 300 dpi TIFF or EPS file, with all fonts embedded) because, in an MSW document, this method is somewhat more stable than directly inserting a picture.
To have non-visible rules on your frame, use the MSWord “Format” pull-down menu, select Text Box > Colors and Lines to choose No Fill and No Line.
Table Head
Table Column Head Table column subhead Subhead Subhead
copy More table copya
a. Sample of a Table footnote. (Table footnote)
Figure 1. Example of a figure caption. (figure caption)
Figure Labels: Use 8 point Times New Roman for Figure labels. Use words rather than symbols or abbreviations when writing Figure axis labels to avoid confusing the reader. As an example, write the quantity “Magnetization”, or “Magnetization, M”, not just “M”. If including units in the label, present them within parentheses. Do not label axes only with units. In the example, write “Magnetization (A/m)” or “Magnetization A[m(1)]”, not just “A/m”. Do not label axes with a ratio of quantities and units. For example, write “Temperature (K)”, not “Temperature/K”.
ACKNOWLEDGMENT (HEADING 5) The preferred spelling of the word “acknowledgment” in
America is without an “e” after the “g”. Avoid the stilted expression, “One of us (R. B. G.) thanks . . .” Instead, try “R. B. G. thanks”. Put sponsor acknowledgments in the unnum-bered footnote on the first page.
REFERENCES The template will number citations consecutively within
brackets [1]. The sentence punctuation follows the bracket [2].
Refer simply to the reference number, as in [3]—do not use “Ref. [3]” or “reference [3]” except at the beginning of a sentence: “Reference [3] was the first . . .”
Number footnotes separately in superscripts. Place the actual footnote at the bottom of the column in which it was cited. Do not put footnotes in the reference list. Use letters for table footnotes.
Unless there are six authors or more give all authors' names; do not use “et al.”. Papers that have not been published, even if they have been submitted for publication, should be cited as “unpublished” [4]. Papers that have been accepted for publication should be cited as “in press” [5]. Capitalize only the first word in a paper title, except for proper nouns and element symbols.
For papers published in translation journals, please give the English citation first, followed by the original foreign-language citation [6].
[1] G. Eason, B. Noble, and I. N. Sneddon, “On certain integrals of
Lipschitz-Hankel type involving products of Bessel functions,” Phil. Trans. Roy. Soc. London, vol. A247, pp. 529–551, April 1955. (references)
[2] J. Clerk Maxwell, A Treatise on Electricity and Magnetism, 3rd ed., vol. 2. Oxford: Clarendon, 1892, pp.68–73.
[3] I. S. Jacobs and C. P. Bean, “Fine particles, thin films and exchange anisotropy,” in Magnetism, vol. III, G. T. Rado and H. Suhl, Eds. New York: Academic, 1963, pp. 271–350.
[4] K. Elissa, “Title of paper if known,” unpublished. [5] R. Nicole, “Title of paper with only first word capitalized,” J. Name
Stand. Abbrev., in press. [6] Y. Yorozu, M. Hirano, K. Oka, and Y. Tagawa, “Electron spectroscopy
studies on magneto-optical media and plastic substrate interface,” IEEE Transl. J. Magn. Japan, vol. 2, pp. 740–741, August 1987 [Digests 9th Annual Conf. Magnetics Japan, p. 301, 1982].
[7] M. Young, The Technical Writer's Handbook. Mill Valley, CA: University Science, 1989.
27

Selection of Optimal Structuring Element forFault Detection Tools Based on
Mathematical MorphologySuresh Gautam and Sukumar M. Brahma
Klipsch School of Electrical and Computer Engineering,New Mexico State University
Las Cruces, NM 88003-8001, USAE-mail: gautam,[email protected]
Abstract—Recent literature in the area of power systems re-ports the use of Mathematical Morphology (MM) as a promisingtool for different applications; both online and offline applicationsare reported. Real time applications for disturbance detectionare also reported. A function called the structuring element(SE)is the main component of MM that plays a pivotal role inMM operations, and hence all MM-based applications. However,there is no clear guideline for the selection and optimizationof the structuring element for any particular application. Thisdocument reports a study performed to generalize and optimizea structuring element for the detection of power system faults.Different power system fault cases are simulated using timedomain simulation software. The current and voltage waveformsfrom the simulation are used to illustrate the selection process.Results are analyzed and some guidelines are suggested for theselection of an optimal structuring element for power systemfault detection.
I. KEY EQUATIONS
Dilation and erosion:
yd(n) = (f ⊕ g)(n) = maxf(n−m) + g(m), (1)0 ≤ (n−m) ≤ n,m ≥ 0
ye(n) = (f g)(n) = minf(n+m)− g(m), (2)0 ≤ (n+m) ≤ n,m ≥ 0
Closing and opening:
yc(n) = (f • g)(n) = ((f ⊕ g) g)(n) (3)
yo(n) = (f g)(n) = ((f g)⊕ g)(n) (4)
Closing-Opening Difference Operator:
ycodo(n) = [(f • g)(n)− (f g)(n)] (5)
II. KEY FIGURES
0
5
10
15
20
25
0
0.7
1.4
2.1
2.8
3.5
2 4 6 8 10 12 14 16 18 20 22 24 26 28 30 32 34 36 38 40
Del
ay (m
s)
CO
DO
Out
put (
A)
Length of SE
SLG Fault
ThresholdFirst Detected CODO OutputDetection Delay
Fig. 1. CODO output for current waveform with varying length of the SE.
0
1.5
3
4.5
6
7.5
0
0.1
0.2
0.3
0.4
0.5
2 3 4 5 6 7 8 9 10
Del
ay (m
s)
CO
DO
Out
put (
V)
Length of SE
Three Phase Fault
ThresholdFirst Detected CODO OutputDetection Delay
Fig. 2. CODO Output for voltage waveform with varying length of the SE.
28

Fault Location Identification using Bayesian Analysis
for SPS
Joseph Dieker*, Sanjoy Das, Noel N. Schulz, Bala Natarajan, and Caterina Scoglio
Department of Electrical and Computer Engineering
Kansas State University
Manhattan, Kansas, USA
*Email: [email protected]
Abstract—In a shipboard power system there are many
chances for faults along lines. It is very important to
identify the location and isolate these faults in order to
save the equipment and loads. The shipboard system
represented in this poster is a based on an all-electric ship
that is presented by Corzine. It includes both AC and DC
voltages and multiple generators distributed among the
system. The power system is modeled in MATLAB
Simulink using the SimPowerSys toolbox. The model
includes two buses one on the starboard and the other on
the port. Each bus has eight lines that provide power to the
loads. This poster only considers faults at the ends on the
lines. Sensors on the end of the lines will collect data in
order to determine where the fault has occurred. There are
three types of loads in the system: vital, semi-vital, and
non-vital. All the non-vital loads are connected directly to
one of the buses. However, the vital loads are connected to
both buses using switches. The fault location identification
algorithm being presented will use data collected from
simulations of different switch configurations and different
loads (within ±5% of the original value). After the data is
collected, Bayesian techniques are used to determine where
the fault is located. Assuming the distribution is Gaussian,
the mean can be found and the location of the fault can be
determined using Maximum Likelihood (ML)
approximation.
This work supported by the United States Office of Naval Research under grant N00014-10-1-0431 (DEPSCoR program)
29
sublev
elelow theturchThloagepro caphyis stoecis apcochgre
costuThsegthethepecostoco
ge
WewitEnPitt
T
Abstract – Thbmitted on gridveling for the 20
he benefits thbe nearly lipower system
ectrical load byw and dischargOne of the bie elimination rbine generato
hanges in the heir downfall had is level en
enerators becauofile. Load leveling pacity. Both
ydro storage arcompared in
orage used foonomically beused. Batteryplication but wuld be soon.
heapest form ofeat deal of eco
II. The poster
mprehensive udent on grid he poster bacgmented area he poster contaie far left of th
eak shaving andmparison of t
orage. Both thmpared here.
The top mideneration units
This work was su
estinghouse Corpoth the Department ergy, in the Swanstsburgh, PA 15210
T
his article bried level energy s012 IEEE PES T
I. INTRO
hat exist on bemitless and thms. Energy sty charging the ging the storageiggest benefitsof expensive rs are used besystem load however, is thnough, there iuse there aren’t
requires a storsodium sulfure chosen in thithe poster.
or the applicaneficial depen
y storage is notwith some imp Pumped stor
f grid level enenomic gain in
GENERAL POS
is divided insummary of level energy
ckground colohas the same bins the logos ofhe poster, the d load levelingthe NaS batte
he pros and co
ddle section of s that were
upported by fundinorate Research Cen
of Electrical & Cson School of Eng0 USA (e-mails: r
Ec
Robert J. KCenter for En
efly describes storage for the aT&D show in O
ODUCTION ehalf of energyhere is no exctorage can be storage when te when the sys that load levegas turbine
ecause they cacompared to
hat they expenis no need tot any drastic ch
rage device to r (NaS) batteris study and thThis study sh
ation of load ding on the tyt quite ready toprovements to rage on the oergy storage antoday’s power
STER DESCRIPT
nto seven sectthe thesis wostorage used f
or is a light ackground colof the sponsors energy storag
g are comparedery and pumpons of each for
the poster descused for th
ng from the PA Dnter. R. J. Kerestomputer Engineer
gineering at the [email protected], ree
onomic Anthe
Kerestes, Studnergy / ECE D
Em
the poster to application of l
Orlando, Florida
y storage appeaception to thisused to flattenthe system loa
stem load is higeling can yieldgenerators. G
an react to draother generato
nsive. But if o use gas turbhanges in the lo
have a very laries and pumphe results for ehows that ene
leveling can ype of storage to be used for tthe technology
other hand is nd can generat
r systems.
TION tions providingork done by for load leveli
blue and eor. The headerfor this work.
ge applicationsd. Below this ped hydro enerm of storage
cribes the thermhis study. Th
DCED BFTDA andtes and G.F. Reed ring and the Centerniversity of [email protected])
nalysis of Ge Applicatio
dent MemberDepartment, Unmail: rjk39@pi
be oad a.
ar to s in n an d is gh. d is Gas
astic ors. the
bine oad
arge ped ach
ergy be
that this y it the
te a
g a the
ing. each r of On
s of is a
ergy are
mal hree
d the are r for
urgh,
generatiFor eachcurves adispatchthe casecase in wright counits. Tprofiles effect of
Fig. 1: Lodepth of d
Fig. 1effect odepth oright colevelinggeneratiused andand addthere isenergy needed study shhydro economleveling
Robert J(M’1985) the CenteSwanson
Grid Levelon of Load
r, IEEE and Gniversity of Pittitt.edu and reed
ion sources weh source of geare given. Nexh problem is see in which no which energy
orner of the poThe continuou
are discretizedf leveling the s
oad Profile with nodischarge
1 shows the lof energy storagf discharge. Fi
orner of the pg is shown. Theion for the cad the price of t
ded to the prices energy storastorage is thefor a return onhows that it isenergy storag
mically feasibleg.
J. Kerestes (M’2is the Director of
er for Energy, andSchool of Enginee
l Energy Sd Leveling
Gregory F. Retsburgh, [email protected]
ere used, whiceneration the hxt, described onet up for two cenergy storag
storage is usedoster shows thus model of cd so power cansystem load can
o storage (top), 45
oad without enge for 45% deinally in the fi
poster, the ecoe price is calcuse in which ththe coal and oie of energy stoage used. Theen used to caln investment fos economicallyge for load e to use NaS
III. BIOGRAPH
2011) is a Ph.D. f the Electric Powed Professor of Elering at the Univer
torage for
ed, Member, urgh PA, 1521
ch were coal, eat input vs. pn the poster, thcases. The firsge is used andd to level the loe modeling ofcharging and n be allocated n be seen in Fi
% depth of discha
nergy storage aepth of discharinal section, inonomic effect ulated for all thhere is no eneil generation arorage for the cae cost of genlculate the lenor the energy sy feasible to uleveling but battery stora
HIES student and Gre
er Initiative, Assoclectric Power Engrsity of Pittsburgh.
IEEE 3, USA
1
oil and gas. power output he economic st case being d the second oad. The top f the storage
discharging hourly. The g. 1.
arge (mid), 90%
and then the rge and 90% n the bottom
of the load hree forms of ergy storage re calculated ase in which neration and ngth of time storage. This use pumped
it is not age for load
egory F. Reed ciate Director of gineering in the .
30
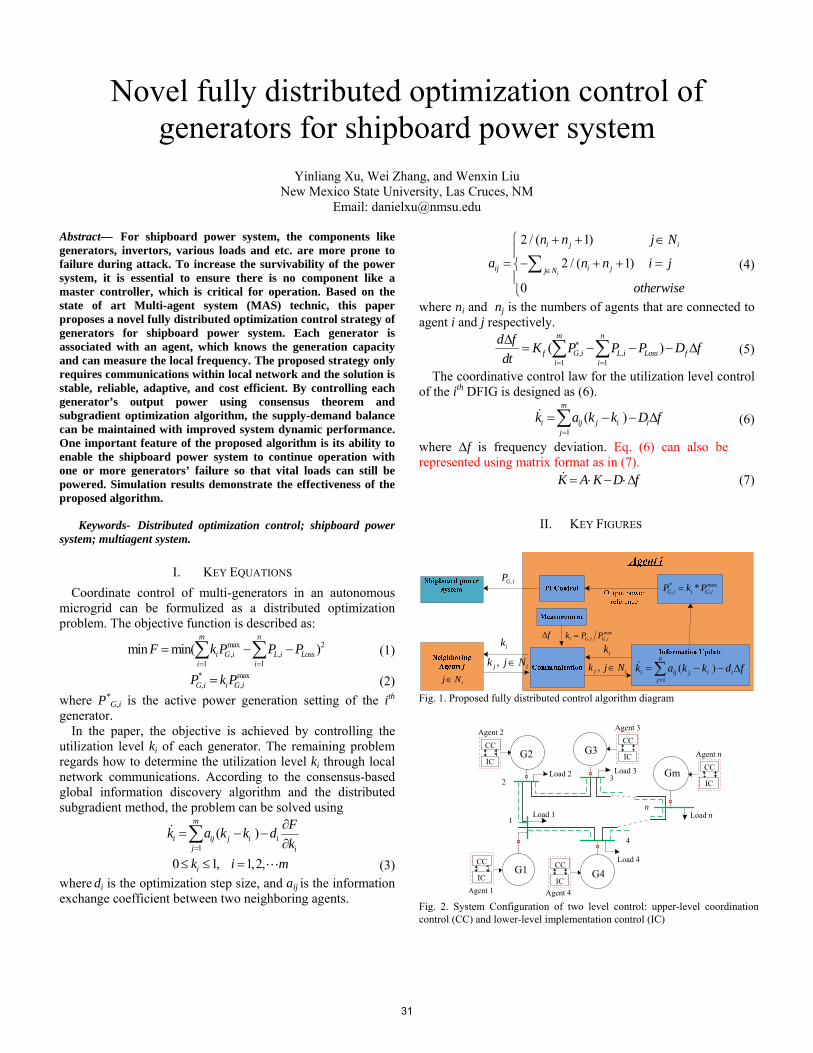
Novel fully distributed optimization control of generators for shipboard power system
Yinliang Xu, Wei Zhang, and Wenxin Liu
New Mexico State University, Las Cruces, NM Email: [email protected]
Abstract— For shipboard power system, the components like generators, invertors, various loads and etc. are more prone to failure during attack. To increase the survivability of the power system, it is essential to ensure there is no component like a master controller, which is critical for operation. Based on the state of art Multi-agent system (MAS) technic, this paper proposes a novel fully distributed optimization control strategy of generators for shipboard power system. Each generator is associated with an agent, which knows the generation capacity and can measure the local frequency. The proposed strategy only requires communications within local network and the solution is stable, reliable, adaptive, and cost efficient. By controlling each generator’s output power using consensus theorem and subgradient optimization algorithm, the supply-demand balance can be maintained with improved system dynamic performance. One important feature of the proposed algorithm is its ability to enable the shipboard power system to continue operation with one or more generators’ failure so that vital loads can still be powered. Simulation results demonstrate the effectiveness of the proposed algorithm.
Keywords- Distributed optimization control; shipboard power system; multiagent system.
I. KEY EQUATIONS
Coordinate control of multi-generators in an autonomous microgrid can be formulized as a distributed optimization problem. The objective function is described as:
max 2, ,
1 1
min min( )m n
i G i L i Lossi i
F k P P P
(1)
* max, ,G i i G iP k P (2)
where P*G,i is the active power generation setting of the ith
generator. In the paper, the objective is achieved by controlling the
utilization level ki of each generator. The remaining problem regards how to determine the utilization level ki through local network communications. According to the consensus-based global information discovery algorithm and the distributed subgradient method, the problem can be solved using
1
( )m
i ij j i ij i
Fk a k k dk
0 1, 1,2,ik i m (3) where di is the optimization step size, and aij is the information exchange coefficient between two neighboring agents.
2 / ( 1)
2 / ( 1)
0i
i j i
ij i jj N
n n j N
a n n i j
otherwise
(4)
where ni and nj is the numbers of agents that are connected to agent i and j respectively.
, ,1 1
( )m n
f G i L i Loss fi i
d f K P P P D fdt
(5)
The coordinative control law for the utilization level control of the ith DFIG is designed as (6).
1
( )m
i ij j i ij
k a k k D f
(6)
where Δf is frequency deviation. Eq. (6) can also be represented using matrix format as in (7).
K A K D f (7)
II. KEY FIGURES
ik
,j ik j N1
( )n
i ij j i ij
k a k k d f
max, ,i G i G ik P P
ij N
ik
,j ik j N
f
* max, ,*G i i G iP k P
,G iP
Fig. 1. Proposed fully distributed control algorithm diagram
1
2 3
nLoad 1
Load 2
Load n
G1CC
IC
G2
Load 3
Load 4
4
CC
IC
CC
ICCC
IC
CC
ICAgent 1
Agent 2Agent 3
Agent 4
Agent nG3
Gm
G4
Fig. 2. System Configuration of two level control: upper-level coordination control (CC) and lower-level implementation control (IC)
31

Optimal Dispatch and Coordination of Distributed Energy Resources using Model Predictive Control
Ebony Mayhorn, Karen Butler-Purry
Texas A&M University, College Station, TX, USA
Karanjit Kalsi, Marcelo Elizondo,
Jianming Lian Pacific Northwest National
Laboratory, Richland, WA, USA
Wei Zhang, Ohio State
University Columbus, OH, USA
Abstract— In an isolated power system (rural microgrid), distributed wind generation can be used to complement distributed fossil fueled generators. The uncertainty and variability due to high penetration of wind generation challenges the system operations. Other distributed energy resources (DERs), such as energy storage and demand response (DR) provided by a population of HVAC loads, can be deployed to help balance the system and to maximize the use of renewable energy. However, DR control and its coordination with other DERs make the problem particularly challenging.
In this work, an optimal control strategy is proposed to coordinate DR, energy storage and diesel generators to maximize wind penetration, while maintaining system economics and normal operation. The problem is formulated as a multi-objective optimization problem with the goals of minimizing fuel costs and changes in power output of diesel generators, minimizing costs associated with low battery life of energy storage, minimizing the use of external control of DR devices, and maintaining spinning reserves. Diesel generators, energy storage and DR are coordinated to compensate for both renewable generation and load variability. DR, represented by a controlled population of HVACs, is dispatched using distributed toggle control. Model predictive control (MPC) is used to solve the aforementioned problem, while making use of a reduced order aggregate model of a HVAC population. Simulation studies demonstrate the efficacy of the closed-loop MPC in compensating for uncertainties in the system caused by wind and demand. Simulations also show how DERs, including DR, can be dispatched similar to conventional generators.
Keywords- model predictive control, coordination of distributed energy resources, demand response, dispatch of distributed energy resources
32
1
Processing and Visualization of Disturbance DataStored in a Phasor Data Concentrator
Om P. Dahal, Student Member, IEEE, Sukumar M. Brahma, Senior Member, IEEE
Abstract—Phasor measurement unit (PMU) data stored inPhasor Data Concentrators (PDCs) offer an excellent centralizedrepository of signatures of many events that are typically eithernot logged, or locally logged. The data also provide angleinformation across power systems, and can give quick andaccurate assessment of stress. When the system is stressed, itmay be advantageous to know the smallest of changes in realtime, since such knowledge can better inform control schemesand any adaptive relaying action for Remedial Action Schemes(RAS), thus improving the chances of averting system instability.Therefore, data mining and real time classification of disturbanceevents recorded on PDCs is a useful exercise. Unfortunately, inmost cases, data stored in the PDCs is simply archived, or usedfor some off-line applications.
For this purpose, a suitable data mining and visualizationmethod, as well as a classification method is required. This posterexplores one data visualization method using disturbance filesfrom the PDC owned by the Public Service Company of NewMexico (PNM). This PDC stores data from four PMUs at fourmajor 345-kV substations in the PNM system. The poster showswhat raw PDC data look like, and how these data need to be pre-processed before being used. The performance of the MinimumVolume Enclosing Ellipsoid (MVEE) method is explored to createsignatures from a pre-processed disturbance file from the PDC.Results are presented, and analyzed. Based on the results, scopeof future work is presented.
Om P. Dahal (e-mail: [email protected]), and Sukumar M. Brahma (e-mail:[email protected]) are with the Klipsch School of Electrical and ComputerEngineering, New Mexico State University, Las Cruces, NM 88003, USA.
33
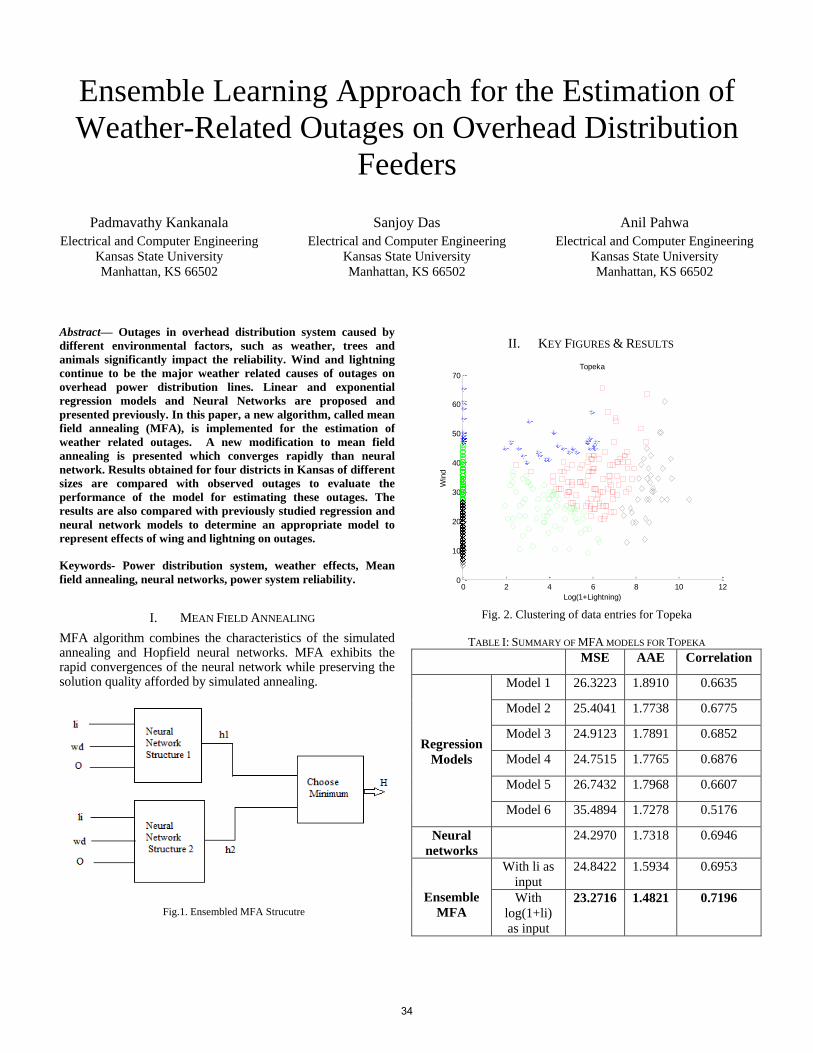
Ensemble Learning Approach for the Estimation of
Weather-Related Outages on Overhead Distribution
Feeders
Padmavathy Kankanala
Electrical and Computer Engineering
Kansas State University
Manhattan, KS 66502
Sanjoy Das
Electrical and Computer Engineering
Kansas State University
Manhattan, KS 66502
Anil Pahwa
Electrical and Computer Engineering
Kansas State University
Manhattan, KS 66502
Abstract— Outages in overhead distribution system caused by
different environmental factors, such as weather, trees and
animals significantly impact the reliability. Wind and lightning
continue to be the major weather related causes of outages on
overhead power distribution lines. Linear and exponential
regression models and Neural Networks are proposed and
presented previously. In this paper, a new algorithm, called mean
field annealing (MFA), is implemented for the estimation of
weather related outages. A new modification to mean field
annealing is presented which converges rapidly than neural
network. Results obtained for four districts in Kansas of different
sizes are compared with observed outages to evaluate the
performance of the model for estimating these outages. The
results are also compared with previously studied regression and
neural network models to determine an appropriate model to
represent effects of wing and lightning on outages.
Keywords- Power distribution system, weather effects, Mean
field annealing, neural networks, power system reliability.
I. MEAN FIELD ANNEALING
MFA algorithm combines the characteristics of the simulated annealing and Hopfield neural networks. MFA exhibits the rapid convergences of the neural network while preserving the solution quality afforded by simulated annealing.
Fig.1. Ensembled MFA Strucutre
II. KEY FIGURES & RESULTS
0 2 4 6 8 10 120
10
20
30
40
50
60
70Topeka
Log(1+Lightning)
Win
d
Fig. 2. Clustering of data entries for Topeka
TABLE I: SUMMARY OF MFA MODELS FOR TOPEKA
MSE AAE Correlation
Regression
Models
Model 1 26.3223 1.8910 0.6635
Model 2 25.4041 1.7738 0.6775
Model 3 24.9123 1.7891 0.6852
Model 4 24.7515 1.7765 0.6876
Model 5 26.7432 1.7968 0.6607
Model 6 35.4894 1.7278 0.5176
Neural
networks
24.2970 1.7318 0.6946
Ensemble
MFA
With li as
input
24.8422 1.5934 0.6953
With
log(1+li)
as input
23.2716 1.4821 0.7196
34

Distributed State Estimation using Phasor Measurement Units
Woldu Tuku* and Noel N. Schulz Department of Electrical and Computer Engineering
Kansas State University Manhattan, KS, USA *[email protected]
Abstract: As the size of electric power system is increasing, the techniques to protect, monitor and control it are becoming more sophisticated. Government, utilities and various organizations are striving to have more reliable power grid. Several research projects are working to minimize risks in the grid. The goal of the research is to achieve a robust and accurate state estimation (SE) of the power grid. Utilities are leading teams to change the traditional way of state estimation to real time state estimation. Currently most of the utilities use traditional centralized SE algorithm. Although the traditional methods have been enhanced with advancement in technologies, including PMUs, most of these advances have remained local with individual utility state estimation. There is an opportunity to establish a coordinated SE approach integration the PMU data across a
system, including multiple utilities and this is using Distributed State Estimation (DSE). This coordination will minimize cascading effects on the power line. DSE is the best option to minimize the communication time and to provide accurate data to the operators. This project will introduce DSE techniques with the help of PMU data for the utilities under Southwest Power Pool (SPP). The proposed DSE algorithm will split the traditional central state estimation into multiple local state estimations and show how to reduce calculating time compared with centralized state estimation. Keywords: State Estimation; Phasor Measurement Unit, Distributed State Estimation, Supervisory control and data acquisition system
35
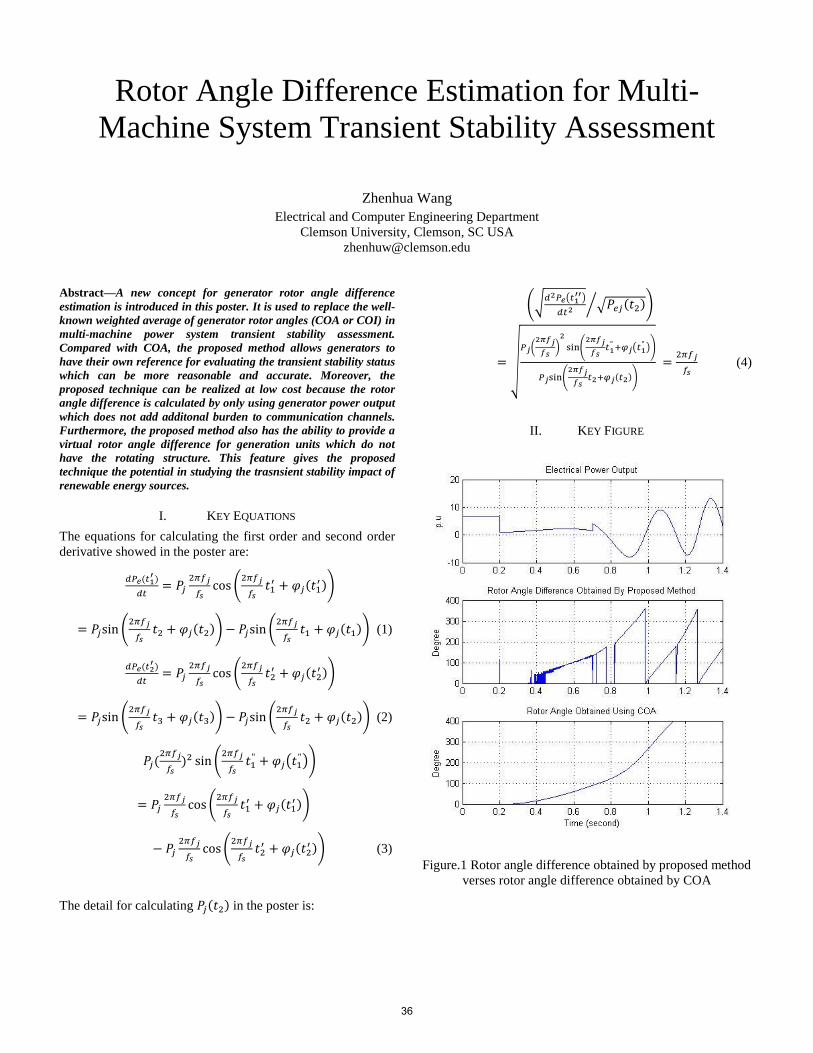
Rotor Angle Difference Estimation for Multi-
Machine System Transient Stability Assessment
Zhenhua Wang
Electrical and Computer Engineering Department
Clemson University, Clemson, SC USA
Abstract—A new concept for generator rotor angle difference
estimation is introduced in this poster. It is used to replace the well-
known weighted average of generator rotor angles (COA or COI) in
multi-machine power system transient stability assessment.
Compared with COA, the proposed method allows generators to
have their own reference for evaluating the transient stability status
which can be more reasonable and accurate. Moreover, the
proposed technique can be realized at low cost because the rotor
angle difference is calculated by only using generator power output
which does not add additonal burden to communication channels.
Furthermore, the proposed method also has the ability to provide a
virtual rotor angle difference for generation units which do not
have the rotating structure. This feature gives the proposed
technique the potential in studying the trasnsient stability impact of
renewable energy sources.
I. KEY EQUATIONS
The equations for calculating the first order and second order
derivative showed in the poster are:
(
)
(
) (
) (1)
(
)
(
) (
) (2)
(
(
))
(
)
(
) (3)
The detail for calculating in the poster is:
(√ (
)
√ ⁄ )
√ (
)
(
(
))
(
)
(4)
II. KEY FIGURE
Figure.1 Rotor angle difference obtained by proposed method
verses rotor angle difference obtained by COA
36

A Neural Network based Software Engine for
Adaptive Power System Stability
Ashikur Rahman and Dr. Allison Kipple
Department of Electrical Engineering and Computer Science
Northern Arizona University
Flagstaff, Arizona
Email: [email protected] and [email protected]
Abstract—This work studies a novel artificial intelligence based
method for the assessment of power system security and
preemptive protection procedures to ensure transient stability.
Keywords-transient; feature vector; neural network; static VAR
compensator (SVC); power system stabilizer (PSS)
I. INTRODUCTION
This work describes a preliminary research investigation into the feasibility of using an Artificial Intelligence (AI) method to predict, detect, and quickly recover from faults in a power system. The goal of the work is to reduce the computational complexity of stability analysis while increasing the flexibility of post-fault recovery procedures, and to introduce a convenient and intelligent power system architecture.
The electric power industry is currently experiencing an unprecedented level of reform. One of the most exciting and potentially profitable contemporary developments is the increasing usage of artificial intelligence techniques in power engineering. Considering today’s situation, methods for securing reliable power need to be re-engineered; one reason is that variable renewable energy sources are being added to the power system at the same time that the system is getting more and more interconnected, is reaching its load limits, and is experiencing different types of loads. In current practice, system operators usually refer to written operating procedures to determine system constraints and (in theory, at least) ensure system reliability and stability. With such a simplified view of system conditions, the operators are unable to develop a full understanding of the system’s operational limits and assess how the system could be adapted to meet the changing conditions. As a result, many systems have been left in a vulnerable condition where, for instance, widespread blackouts can and do occur.
II. METHOD AND SIMULATIONS
The published papers in IEEE proceedings have showed an increasing, though not yet extensive, interest over the past decade in applying AI to power engineering problems. In this case, AI was utilized after first creating a simple two-bus power system in MATLAB Simulink. This model incorporated some variable, regulating and control units which were
indispensable for the study: a variable load, Static VAR Compensator (SVC), Power System Stabilizer (PSS) and hydraulic turbine governor. The model contained a 1000 MVA hydraulic generation plant which was coupled to a load center through a 500 kV, 700 km transmission line. The load center was modeled by a 5000 MW resistive load. The load was additionally served by a local, 5000 MVA hydraulic generation plant.
From the state space point of view, each unit had a transfer function which affected the dynamics of the whole system, and the transfer functions were governed by constants or the model parameters. A variety of faults were simulated, the operating parameters of the SVC and PSS were varied to see the effects on transient stability, and the results were included in training pattern sets. A total of 4,608 training data sets were generated by varying the SVC and PSS controller parameters, fault types and load. A feed-forward neural network using the Levenberg–Marquardt algorithm (LMA) was then trained on the parameter combinations that produced stable and unstable results. The training data were tabulated by analyzing load flow and rotor angle stability which were organized as feature vectors for neural network based classification. The performance of the neural network was measured by different methods, namely regression, training state analysis and a confusion matrix.
The trained network was later used to find the best operating condition settings using an optimum solution finder algorithm. The trained network could then simulate the effects of and possible stable configurations to correct various fault situations within a fraction of a second, which is much smaller than any available numerical differential equation solver.
III. FUTURE WORK
The approach outlined above may additionally be used in fault diagnosis, security assessment, load forecasting, economic dispatch and harmonic analyzing.
IV. ACKNOWLEDGMENT
This project was funded by Arizona Public Service (APS).
37
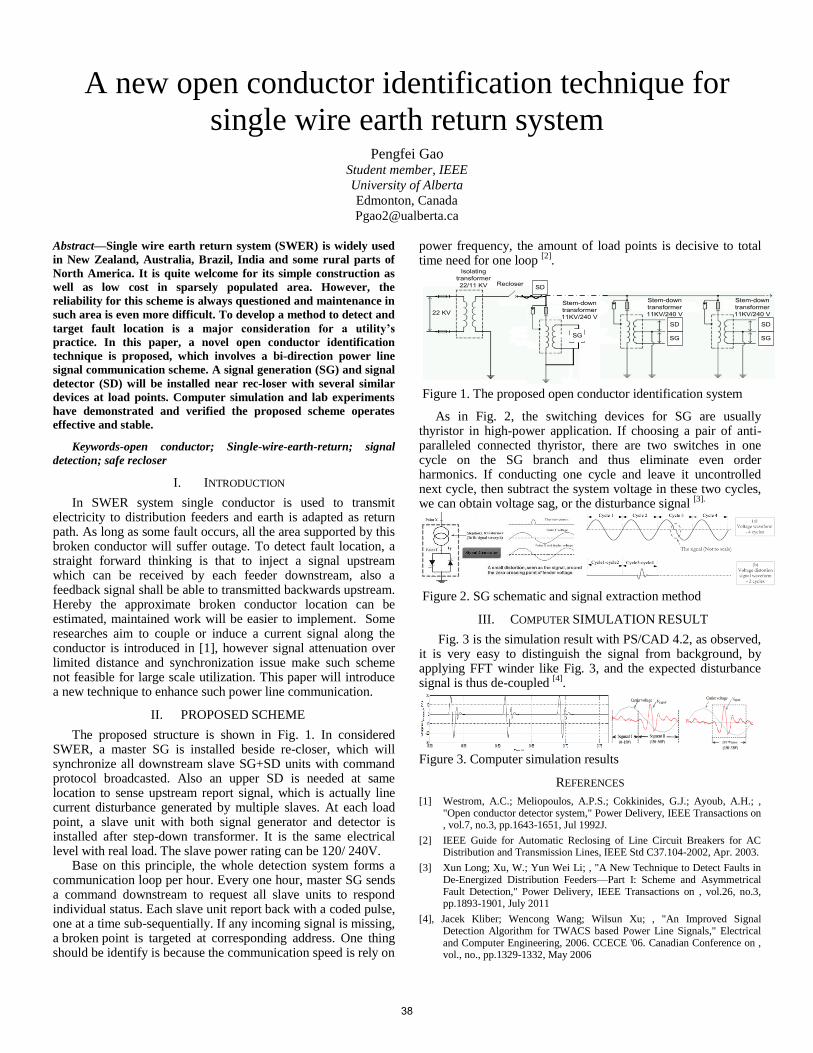
A new open conductor identification technique for
single wire earth return system Pengfei Gao
Student member, IEEE
University of Alberta
Edmonton, Canada
Abstract—Single wire earth return system (SWER) is widely used
in New Zealand, Australia, Brazil, India and some rural parts of
North America. It is quite welcome for its simple construction as
well as low cost in sparsely populated area. However, the
reliability for this scheme is always questioned and maintenance in
such area is even more difficult. To develop a method to detect and
target fault location is a major consideration for a utility’s
practice. In this paper, a novel open conductor identification
technique is proposed, which involves a bi-direction power line
signal communication scheme. A signal generation (SG) and signal
detector (SD) will be installed near rec-loser with several similar
devices at load points. Computer simulation and lab experiments
have demonstrated and verified the proposed scheme operates
effective and stable.
Keywords-open conductor; Single-wire-earth-return; signal
detection; safe recloser
I. INTRODUCTION
In SWER system single conductor is used to transmit electricity to distribution feeders and earth is adapted as return path. As long as some fault occurs, all the area supported by this broken conductor will suffer outage. To detect fault location, a straight forward thinking is that to inject a signal upstream which can be received by each feeder downstream, also a feedback signal shall be able to transmitted backwards upstream. Hereby the approximate broken conductor location can be estimated, maintained work will be easier to implement. Some researches aim to couple or induce a current signal along the conductor is introduced in [1], however signal attenuation over limited distance and synchronization issue make such scheme not feasible for large scale utilization. This paper will introduce a new technique to enhance such power line communication.
II. PROPOSED SCHEME
The proposed structure is shown in Fig. 1. In considered SWER, a master SG is installed beside re-closer, which will synchronize all downstream slave SG+SD units with command protocol broadcasted. Also an upper SD is needed at same location to sense upstream report signal, which is actually line current disturbance generated by multiple slaves. At each load point, a slave unit with both signal generator and detector is installed after step-down transformer. It is the same electrical level with real load. The slave power rating can be 120/ 240V.
Base on this principle, the whole detection system forms a communication loop per hour. Every one hour, master SG sends a command downstream to request all slave units to respond individual status. Each slave unit report back with a coded pulse, one at a time sub-sequentially. If any incoming signal is missing, a broken point is targeted at corresponding address. One thing should be identify is because the communication speed is rely on
power frequency, the amount of load points is decisive to total time need for one loop
[2].
Isolating transformer22/11 KV
22 KV
Recloser
Stem-down transformer11KV/240 V
Stem-down transformer11KV/240 V
SG
Stem-down transformer11KV/240 V
SD
SG SG
SD SD
Figure 1. The proposed open conductor identification system
As in Fig. 2, the switching devices for SG are usually thyristor in high-power application. If choosing a pair of anti-paralleled connected thyristor, there are two switches in one cycle on the SG branch and thus eliminate even order harmonics. If conducting one cycle and leave it uncontrolled next cycle, then subtract the system voltage in these two cycles, we can obtain voltage sag, or the disturbance signal
[3].
Figure 2. SG schematic and signal extraction method
III. COMPUTER SIMULATION RESULT
Fig. 3 is the simulation result with PS/CAD 4.2, as observed, it is very easy to distinguish the signal from background, by applying FFT winder like Fig. 3, and the expected disturbance signal is thus de-coupled
[4].
Figure 3. Computer simulation results
REFERENCES
[1] Westrom, A.C.; Meliopoulos, A.P.S.; Cokkinides, G.J.; Ayoub, A.H.; , "Open conductor detector system," Power Delivery, IEEE Transactions on , vol.7, no.3, pp.1643-1651, Jul 1992J.
[2] IEEE Guide for Automatic Reclosing of Line Circuit Breakers for AC Distribution and Transmission Lines, IEEE Std C37.104-2002, Apr. 2003.
[3] Xun Long; Xu, W.; Yun Wei Li; , "A New Technique to Detect Faults in De-Energized Distribution Feeders—Part I: Scheme and Asymmetrical Fault Detection," Power Delivery, IEEE Transactions on , vol.26, no.3, pp.1893-1901, July 2011
[4], Jacek Kliber; Wencong Wang; Wilsun Xu; , "An Improved Signal Detection Algorithm for TWACS based Power Line Signals," Electrical and Computer Engineering, 2006. CCECE '06. Canadian Conference on , vol., no., pp.1329-1332, May 2006
38

Optimal Operations of Distributed Wind Generation
in a Distribution System using PMUs
Manoaj Vijayarengan*, Noel Schulz
Department of Electrical and Computer Engineering
Kansas State University
Manhattan, KS, USA
*Email: [email protected]
Abstract—Wind energy is becoming one of the most widely
implemented forms of renewable energy worldwide.
Traditionally, wind has been considered a non-dispatchable
source of energy due to the uncertainty of wind speed and
hence the variable availability of wind power. Advances in
technology allow the consideration of the impact of distributed
wind turbines and farms on distribution systems. In this case,
it is possible to combine the clean energy attributes of wind
with the quickly dispatchable nature of a back-up distributed
generation plant or storage facility in order to provide the
maximum amount of locally generated power economically to
the loads present in the distribution feeder. However, a
monitoring system needs to be provided that is capable of
detecting the changes associated with the distribution feeder
load and also the variable generation output that would be
obtained from the wind farms. This task can be accomplished
using Phasor Measurement Units (PMU) which have very high
sampling rates and hence can measure very rapid and dynamic
changes in power levels associated with distribution feeder load
and wind generation. The data which is obtained from these
PMUs can be used to optimize the amount of distributed
generation that can be produced locally at the distribution
feeder, thus resulting in a reduction in the peak load levels
associated with the distribution feeder as seen by the substation
monitoring system. Simulations will work to balance load
requirements, wind output, and storage or controllable
distributed generation providing a stable system utilizing
maximum renewable resources. Standard IEEE Distribution
Test Feeders are used in the study. Various probabilistic
models are implemented for wind energy generation,
distribution feeder load and PMU measurements, and the
models are analyzed by simulations. The strategy being
investigated can also be used to implement other important
applications such as distribution system state estimation,
protection and instability prediction.
Keywords-Wind Power; Distributed Generation; PMU;
Uncertainty
39
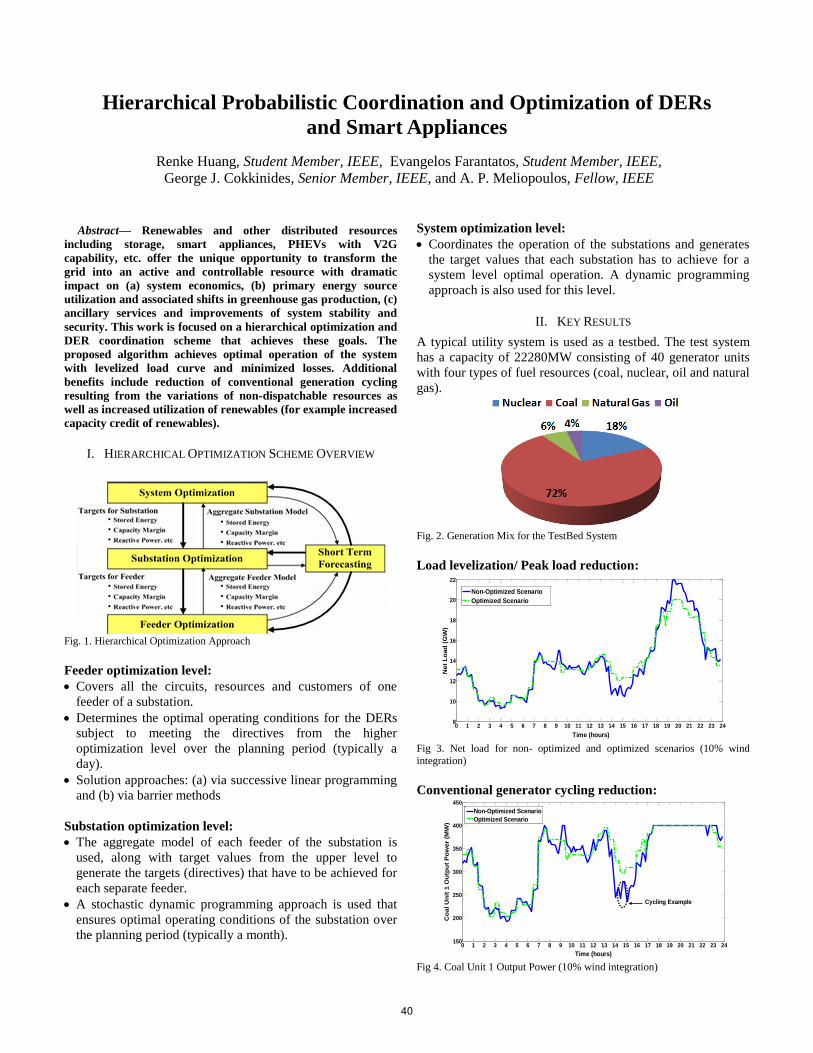
Abstract— Renewables and other distributed resources
including storage, smart appliances, PHEVs with V2G
capability, etc. offer the unique opportunity to transform the
grid into an active and controllable resource with dramatic
impact on (a) system economics, (b) primary energy source
utilization and associated shifts in greenhouse gas production, (c)
ancillary services and improvements of system stability and
security. This work is focused on a hierarchical optimization and
DER coordination scheme that achieves these goals. The
proposed algorithm achieves optimal operation of the system
with levelized load curve and minimized losses. Additional
benefits include reduction of conventional generation cycling
resulting from the variations of non-dispatchable resources as
well as increased utilization of renewables (for example increased
capacity credit of renewables).
I. HIERARCHICAL OPTIMIZATION SCHEME OVERVIEW
Fig. 1. Hierarchical Optimization Approach
Feeder optimization level:
Covers all the circuits, resources and customers of one
feeder of a substation.
Determines the optimal operating conditions for the DERs
subject to meeting the directives from the higher
optimization level over the planning period (typically a
day).
Solution approaches: (a) via successive linear programming
and (b) via barrier methods
Substation optimization level:
The aggregate model of each feeder of the substation is
used, along with target values from the upper level to
generate the targets (directives) that have to be achieved for
each separate feeder.
A stochastic dynamic programming approach is used that
ensures optimal operating conditions of the substation over
the planning period (typically a month).
System optimization level:
Coordinates the operation of the substations and generates
the target values that each substation has to achieve for a
system level optimal operation. A dynamic programming
approach is also used for this level.
II. KEY RESULTS
A typical utility system is used as a testbed. The test system
has a capacity of 22280MW consisting of 40 generator units
with four types of fuel resources (coal, nuclear, oil and natural
gas).
Fig. 2. Generation Mix for the TestBed System
Load levelization/ Peak load reduction:
Fig 3. Net load for non- optimized and optimized scenarios (10% wind
integration)
Conventional generator cycling reduction:
Fig 4. Coal Unit 1 Output Power (10% wind integration)
0 1 2 3 4 5 6 7 8 9 10 11 12 13 14 15 16 17 18 19 20 21 22 23 248
10
12
14
16
18
20
22
Time (hours)
Net
Lo
ad
(G
W)
Non-Optimized Scenario
Optimized Scenario
0 1 2 3 4 5 6 7 8 9 10 11 12 13 14 15 16 17 18 19 20 21 22 23 24150
200
250
300
350
400
450
Time (hours)
Co
al U
nit
1 O
utp
ut
Po
wer
(MW
)
Non-Optimized Scenario
Optimized Scenario
Cycling Example
Hierarchical Probabilistic Coordination and Optimization of DERs
and Smart Appliances
Renke Huang, Student Member, IEEE, Evangelos Farantatos, Student Member, IEEE,
George J. Cokkinides, Senior Member, IEEE, and A. P. Meliopoulos, Fellow, IEEE
40

1
Abstract – This article briefly describes the poster to be
submitted on Medium Voltage DC (MVDC) technology initiatives at the University of Pittsburgh for the 2012 IEEE PES T&D show in Orlando, Florida.
I. INTRODUCTION he need for Medium Voltage DC (MVDC) technology development has been driven by the liberalization of the energy market, which has led to installations of large scale
wind and solar farms at the transmission and distribution level. There are certainly potential increases in efficiency that can be realized by employing a MVDC network. MVDC systems will help reduce the number of conversion stages required for integrating a lower voltage output of a renewable generation resource to the electric grid operating at a much higher voltage. Hence, the MVDC platform can serve as an additional layer of infrastructure in the electric grid between the transmission and distribution levels.
Applications for DC include solar and wind generation, battery storage, and other forms of green energy resources. The penetration of these technologies is rapidly increasing and they all employ or require a DC integration link of some kind. The same is true of the various loads that are being employed today by consumers, including the advancement in electric vehicles and more sensitive power electronics based loads, many of which are operating at low voltage DC levels. Fig. 1 provides a general set-up for a proposed MVDC architecture.
II. GENERAL POSTER DESCRIPTION The poster is divided into eight sections providing a
comprehensive summary of the thesis work done by the student on MVDC technology. The poster background color is an ocean blue and each segmented area has a light gray background. The header of the poster contains the logos of the sponsors for this work. On the far left of the poster, the objectives of the research are presented as well as the outcome of the investigations. Below this segment are two high illustrations of the MVDC concept, one which is provided in Fig. 1 and a diagram of the modeled system found in the thesis work. The thesis model is a subsystem of the multiple year MVDC project (Fig. 1).
Reviewing Fig. 1, one will notice that the architecture is heavily consumed with many different types of power conversion equipment including multilevel inverters,
This work was supported by funding from the PA DCED BFTDA and ABB Corporate Research Center. B.M. Grainger and G.F. Reed are with the Department of Electrical & Computer Engineering and the Center for Energy, in the Swanson School of Engineering at the University of Pittsburgh, Pittsburgh, PA 15210 USA (e-mails: [email protected], [email protected])
rectifiers, and DC/DC converters. Consuming the middle third of the poster, adjacent to the research objectives, are three additional segmented areas. The first area provides a very illustrative and descriptive treatment of the multilevel inverters used in the work, specifically the neutral point clamped topology, and standard pulse width modulation routines. The second area describes the multipulse rectifiers used in the work with colorful and clean illustrations of the rectifier operation. Finally, the third area next to the rectifier description is a discussion of the bidirectional DC/DC converter. This area provides illustrations of theoretical converter operation as well as simulation results.
Fig. 1. Medium Voltage DC Network
Fig. 1 includes a number of renewable energy resources including solar and wind. In the system model for the thesis work, only wind generation was emphasized and modeled. Consuming the bottom third of the poster is the wind turbine induction machine torque characteristics as well as the nonlinear, dynamic power curves of the wind turbine. These curves describe the amount of power expected out of the wind turbine and are a function of blade pitch and mechanical speed. An illustration of the output power of the wind turbine model correlated with these curves is provided.
The last region of the poster shows a validation of the interconnected system components including balance of generation and load, system fault responses with illustration of fault location in the network as well as plots of the total harmonic distortion with comparisons to the three and five level multilevel inverters in the thesis model.
III. BIOGRAPHIES Brandon M. Grainger (M’2006) is a Ph.D. student and Gregory F. Reed (M’1985) is the Director of the Electric Power Initiative, Associate Director of the Center for Energy, and Professor of Electric Power Engineering in the Swanson School of Engineering at the University of Pittsburgh.
DC
AC
DC
DC
DC
AC
DC
AC
Non-Synchronous Generation (Wind)
Distribution Level Storage
DC
DC
Photovoltaic Generation
DC
DC
Fuel Cells
Electric Vehicle
AC
DC
DC
DC
Distribution DC Load Circuits
Sensitive Load
Electronic and AC Loads
Future DC Industrial Facility
DC
DC
AC Transmission Supply
Future DC Data Centers
DC
DC
Existing AC Infrastructure
DC
DC
MVDC
HVDC System
Future HVDC Intertie
AC
DC
DC
DC
Motor
Variable Frequency Drives
Medium Voltage DC Network Modeling and Analysis with Preliminary Studies for Optimized Converter Configuration through PSCAD Simulation Environment
Brandon M. Grainger, Student Member, IEEE and Gregory F. Reed, Member, IEEE Center for Energy / ECE Department, University of Pittsburgh, Pittsburgh PA, 15213, USA
Email: [email protected] and [email protected]
T
41
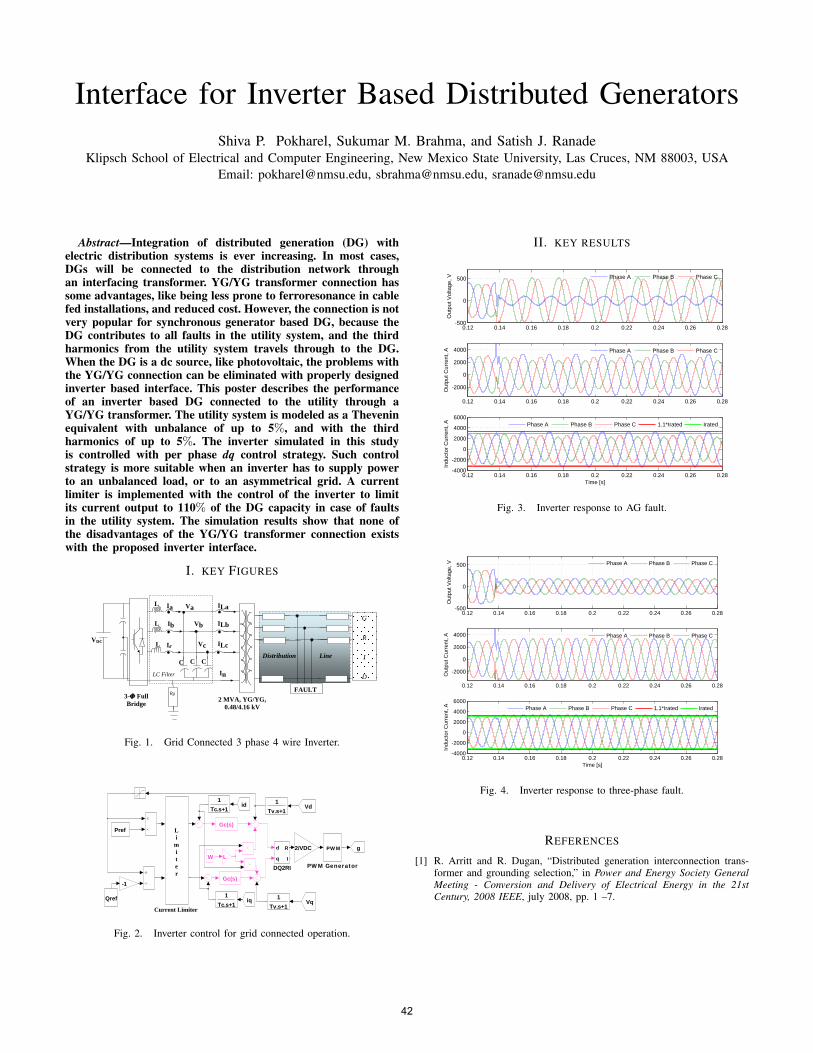
Interface for Inverter Based Distributed GeneratorsShiva P. Pokharel, Sukumar M. Brahma, and Satish J. Ranade
Klipsch School of Electrical and Computer Engineering, New Mexico State University, Las Cruces, NM 88003, USAEmail: [email protected], [email protected], [email protected]
Abstract—Integration of distributed generation (DG) withelectric distribution systems is ever increasing. In most cases,DGs will be connected to the distribution network throughan interfacing transformer. YG/YG transformer connection hassome advantages, like being less prone to ferroresonance in cablefed installations, and reduced cost. However, the connection is notvery popular for synchronous generator based DG, because theDG contributes to all faults in the utility system, and the thirdharmonics from the utility system travels through to the DG.When the DG is a dc source, like photovoltaic, the problems withthe YG/YG connection can be eliminated with properly designedinverter based interface. This poster describes the performanceof an inverter based DG connected to the utility through aYG/YG transformer. The utility system is modeled as a Theveninequivalent with unbalance of up to 5%, and with the thirdharmonics of up to 5%. The inverter simulated in this studyis controlled with per phase dq control strategy. Such controlstrategy is more suitable when an inverter has to supply powerto an unbalanced load, or to an asymmetrical grid. A currentlimiter is implemented with the control of the inverter to limitits current output to 110% of the DG capacity in case of faultsin the utility system. The simulation results show that none ofthe disadvantages of the YG/YG transformer connection existswith the proposed inverter interface.
I. KEY FIGURES
LC Filter
Va
2 MVA, YG/YG, 0.48/4.16 kV
CCC
Vc
Vb
Ia ILa
L
L
L Ib
Ic
ILb
ILc
3-𝜱 Full Bridge
Distribution Line
Rg FAULT
In
G
R
I
D
VDC
Fig. 1. Grid Connected 3 phase 4 wire Inverter.
1
Tc.s+1
1
Tc.s+1
1
Tv.s+1
1
Tv.s+1
Gc(s)
Gc(s)
Qref
Pref
PWM Generator
PWM g
-1
2/VDC
LW
Vd
Vqiq
id
DQ2RI
d
q
R
I
Current Limiter
Li
miter
Fig. 2. Inverter control for grid connected operation.
II. KEY RESULTS
0.12 0.14 0.16 0.18 0.2 0.22 0.24 0.26 0.28-500
0
500
Out
put V
olta
ge, V
Phase A Phase B Phase C
0.12 0.14 0.16 0.18 0.2 0.22 0.24 0.26 0.28
-2000
0
2000
4000
Out
put C
urre
nt, A
Phase A Phase B Phase C
0.12 0.14 0.16 0.18 0.2 0.22 0.24 0.26 0.28-4000
-2000
0
2000
4000
6000
Indu
ctor
Cur
rent
, A
Time [s]
Phase A Phase B Phase C 1.1*Irated Irated
Fig. 3. Inverter response to AG fault.
0.12 0.14 0.16 0.18 0.2 0.22 0.24 0.26 0.28-500
0
500
Out
put V
olta
ge, V
Phase A Phase B Phase C
0.12 0.14 0.16 0.18 0.2 0.22 0.24 0.26 0.28
-2000
0
2000
4000
Out
put C
urre
nt, A
Phase A Phase B Phase C
0.12 0.14 0.16 0.18 0.2 0.22 0.24 0.26 0.28-4000
-2000
0
2000
4000
6000
Indu
ctor
Cur
rent
, A
Time [s]
Phase A Phase B Phase C 1.1*Irated Irated
Fig. 4. Inverter response to three-phase fault.
REFERENCES
[1] R. Arritt and R. Dugan, “Distributed generation interconnection trans-former and grounding selection,” in Power and Energy Society GeneralMeeting - Conversion and Delivery of Electrical Energy in the 21stCentury, 2008 IEEE, july 2008, pp. 1 –7.
42
Reliability Analysis of Alternate Wind
Energy Farms and Interconnections
Dongbo Zhao, Student Member, IEEE,
A. P. Sakis Meliopoulos, Fellow, IEEE
School of Electrical and Computer Engineering
Georgia Institute of Technology
Atlanta, GA, USA
Abstract— With the emerging of new techniques and alternate technologies
and topologies for wind power interconnections to the system, reliability
issues become important for evaluation of alternative technologies and
configurations of wind farms and interconnections. In this poster, AC
systems, HVDC transmission systems, and low frequency transmission,
typically at 20/16.7 Hz, is considered as alternative technologies for
interconnection of remote wind farms to the power grid. Several alternative
configurations of wind farms and transmission technologies are considered.
Reliability models of the entire configuration have been developed that
properly model the various components of the configuration as well as the
probabilistic model of the wind power. These models are utilized to
determine the reliability advantages/disadvantages of the proposed wind
farm/transmission interconnection configurations. These models can be also
utilized in reliability analysis of the overall power system.
This poster gives out the general approach of reliability analysis of
two of the typical alternate configurations of wind farm using low frequency
transmission to point of common coupling to the power system. Reliability
components and their characteristics are modeled, with example calculations
made to demonstrate the use of the approach.
Keywords-Low frequency transmission, reliability indices, adequacy assessment, wind farm
43
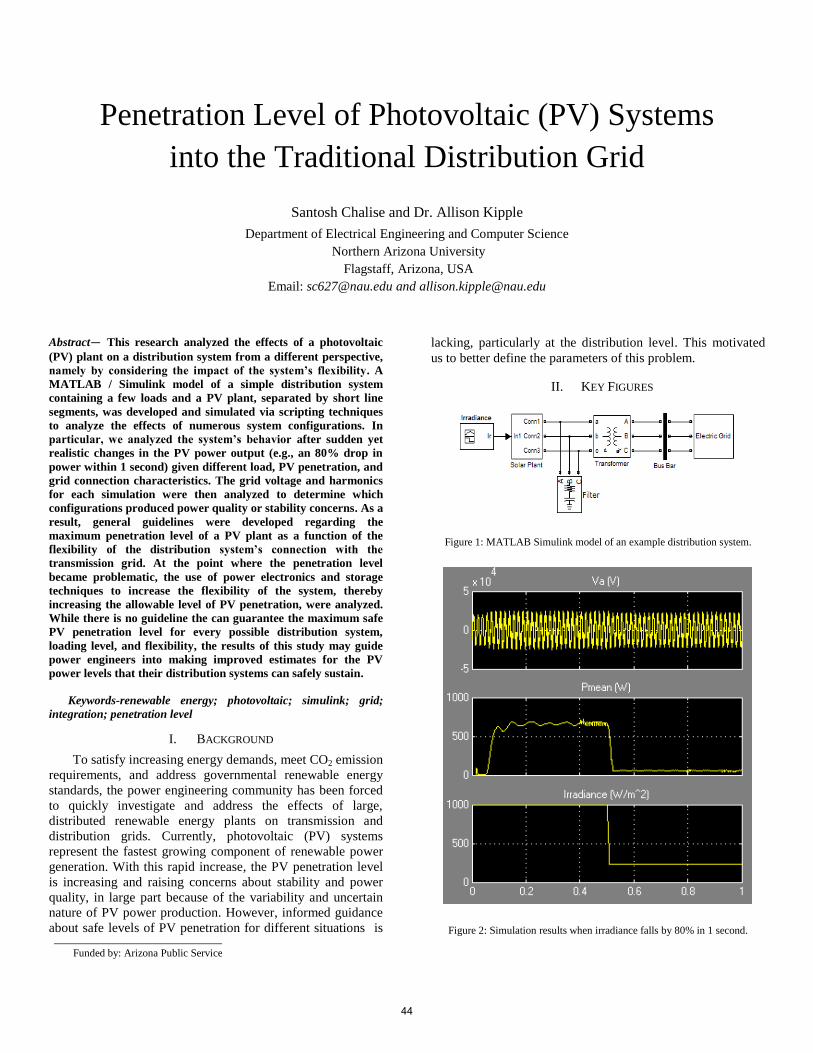
Penetration Level of Photovoltaic (PV) Systems
into the Traditional Distribution Grid
Santosh Chalise and Dr. Allison Kipple
Department of Electrical Engineering and Computer Science
Northern Arizona University
Flagstaff, Arizona, USA
Email: [email protected] and [email protected]
Abstract— This research analyzed the effects of a photovoltaic
(PV) plant on a distribution system from a different perspective,
namely by considering the impact of the system’s flexibility. A
MATLAB / Simulink model of a simple distribution system
containing a few loads and a PV plant, separated by short line
segments, was developed and simulated via scripting techniques
to analyze the effects of numerous system configurations. In
particular, we analyzed the system’s behavior after sudden yet
realistic changes in the PV power output (e.g., an 80% drop in
power within 1 second) given different load, PV penetration, and
grid connection characteristics. The grid voltage and harmonics
for each simulation were then analyzed to determine which
configurations produced power quality or stability concerns. As a
result, general guidelines were developed regarding the
maximum penetration level of a PV plant as a function of the
flexibility of the distribution system’s connection with the
transmission grid. At the point where the penetration level
became problematic, the use of power electronics and storage
techniques to increase the flexibility of the system, thereby
increasing the allowable level of PV penetration, were analyzed.
While there is no guideline the can guarantee the maximum safe
PV penetration level for every possible distribution system,
loading level, and flexibility, the results of this study may guide
power engineers into making improved estimates for the PV
power levels that their distribution systems can safely sustain.
Keywords-renewable energy; photovoltaic; simulink; grid;
integration; penetration level
I. BACKGROUND
To satisfy increasing energy demands, meet CO2 emission
requirements, and address governmental renewable energy
standards, the power engineering community has been forced
to quickly investigate and address the effects of large,
distributed renewable energy plants on transmission and
distribution grids. Currently, photovoltaic (PV) systems
represent the fastest growing component of renewable power
generation. With this rapid increase, the PV penetration level
is increasing and raising concerns about stability and power
quality, in large part because of the variability and uncertain
nature of PV power production. However, informed guidance
about safe levels of PV penetration for different situations is
lacking, particularly at the distribution level. This motivated
us to better define the parameters of this problem.
II. KEY FIGURES
Figure 1: MATLAB Simulink model of an example distribution system.
Figure 2: Simulation results when irradiance falls by 80% in 1 second.
Funded by: Arizona Public Service
44

Wind Power in Combined Energy and Reserve Market
PART I: Market Modeling and Combined Scheduling
D. He, IEEE Student Member, Z. Tan, IEEE Student Member, J. Liang, IEEE Student Member
1
Abstract: This paper mainly focus on market mechanism research,
economic dispatch of wind power in combined energy and reserve
market. Based on proposed market mechanism, wind power energy will
be updated from nowadays lack of dispatch to fully dispatch .If so,
several potential optimal operation control strategies could be re-
considered again, says, integration evaluation. In this paper, firstly, an
original combined market mechanism will be extended to real system
market operation. Secondly, an economic dispatch sample with over
25% penetration of wind power energy running on IEEE benchmark
system will be proposed, unlike an offset road, a novel model of wind
power cost function need be proposed to dispatch itself, in this section,
a reserve market components also need to be considered. Finally a set
of software integrating all these functions will be presented.
Index Terms: wind power energy, reserve market, power system,
economic dispatch, frequency analysis, reserve capacity.
I. INTRODUCTION
oday in most electricity markets, wind producers do not
participate in the reserve markets. Wind power is
treated as offset to loads, requiring additional reserve to
compensate for its variability and intermittency. As the
reduction of non-renewable energy percentage, the system
reserve may become scarce. However the value of fast
reserve will likely increase, providing incentives for wind
plants to provide reserve services. Letting wind generation
resources to participate in the reserve market will be of
mutual interest to system operators and wind producers. J.
Liang et al. recently proposed a new market framework
which allows wind power participate the regulation market
with lower deviation penalties. With the proposed market
model, wind power variations may be divided into the
energy and reserve markets, possibly reducing the need for
additional reserve for intermittent renewable sources. Wind
producers benefit from having increased revenue by
optimally bidding into the energy and reserve markets to
hedge deviation penalties.
In [1], a wind plant’s revenue from the combined energy
and reserve market is given by
E UR E cE E UR cUR URR R R P T P T ,
where the subscript E denotes quantities in the energy
market, subscript UR denotes quantities in the reserve
market, RE (UR) denotes the revenues, πE (UR) denotes the day-
D. He, Z. Tan, and J. Liang are with Department of Electrical and Computer
Engineering, Gatech, Atlanta, GA 30332 USA (e-mail: [email protected]; [email protected]; [email protected]; [email protected])
ahead market prices, and PcE (UR) denotes the day-ahead
commitments. TE (UR) denotes the imbalance revenues
(possibly negative) from actual delivery, given by
( )
( )
E E cE E cE
E
E E cE E cE
P P P PT
P P P P
,
( )
( )
UR UR cUR UR cUR
UR
UR UR cUR UR cUR
P P P PT
P P P P
,
where PE (UR) denotes the delivered energy or UR, πE+ (UR+)
and πE- (UR-) are the deviation prices.
A. Problem Definition
Traditional combined energy and reserve market
mechanism has been used in several electricity markets.
The economic dispatch functions are given below:
Minimize
∑∑ ( ( ( ( ( ( (
( ( Constraints:
1
( ) ( )Ngen
k
k
p t D t
,
1
( ) ( )Ngen
pk p
k
r t R t
,
1
( ) ( )Ngen
nk n
k
r t R t
max( ) ( ) ( ) 0k pk k kp t r t p z t
min( ) ( ) ( ) 0k nk k kp t r t p z t
(
Other Power Flow Constraints with SECUIRITY Equation
( – generated power, controllable variables
Zk (t) – generator state function on (1) / off (0)
Ruk (t) – up reserve
Rdk (t) – down reserve
D(t) – load at time t.
Rp(t) – up reserve requirement at time t.
Rn(t) – down reserve requirement at time t.
C(x) – cost function of each kind of energy
In this work, based on a new wind power market
mechanism, the main problem lies in how to implement this
new mechanism into the original dispatch functions, and
find optimal scheduling.
T
45
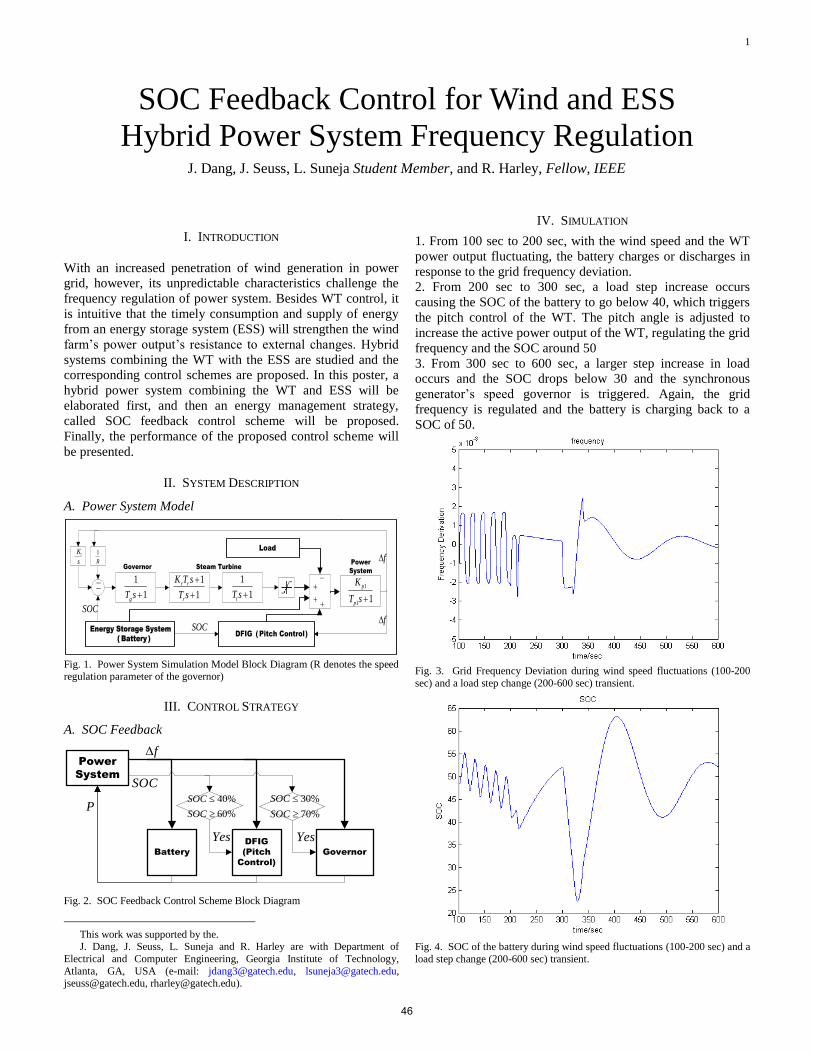
1
I. INTRODUCTION
With an increased penetration of wind generation in power
grid, however, its unpredictable characteristics challenge the
frequency regulation of power system. Besides WT control, it
is intuitive that the timely consumption and supply of energy
from an energy storage system (ESS) will strengthen the wind
farm’s power output’s resistance to external changes. Hybrid
systems combining the WT with the ESS are studied and the
corresponding control schemes are proposed. In this poster, a
hybrid power system combining the WT and ESS will be
elaborated first, and then an energy management strategy,
called SOC feedback control scheme will be proposed.
Finally, the performance of the proposed control scheme will
be presented.
II. SYSTEM DESCRIPTION
A. Power System Model
1
R
iK
s
Energy Storage System
( Battery )DFIG ( Pitch Control)
f
f
Load
SOC
SOC
Governor Steam Turbine
Power
System
1
1gT s
1
1
r r
r
K T s
T s
1
1tT s 1
1 1
p
p
K
T s
Fig. 1. Power System Simulation Model Block Diagram (R denotes the speed regulation parameter of the governor)
III. CONTROL STRATEGY
A. SOC Feedback
Power
System
SOC
Battery
DFIG
(Pitch
Control)
Governor
f
P40%
60%
SOC
SOC
30%
70%
SOC
SOC
Yes Yes
Fig. 2. SOC Feedback Control Scheme Block Diagram
This work was supported by the. J. Dang, J. Seuss, L. Suneja and R. Harley are with Department of
Electrical and Computer Engineering, Georgia Institute of Technology,
Atlanta, GA, USA (e-mail: [email protected], [email protected], [email protected], [email protected]).
IV. SIMULATION
1. From 100 sec to 200 sec, with the wind speed and the WT
power output fluctuating, the battery charges or discharges in
response to the grid frequency deviation.
2. From 200 sec to 300 sec, a load step increase occurs
causing the SOC of the battery to go below 40, which triggers
the pitch control of the WT. The pitch angle is adjusted to
increase the active power output of the WT, regulating the grid
frequency and the SOC around 50
3. From 300 sec to 600 sec, a larger step increase in load
occurs and the SOC drops below 30 and the synchronous
generator’s speed governor is triggered. Again, the grid
frequency is regulated and the battery is charging back to a
SOC of 50.
Fig. 3. Grid Frequency Deviation during wind speed fluctuations (100-200
sec) and a load step change (200-600 sec) transient.
Fig. 4. SOC of the battery during wind speed fluctuations (100-200 sec) and a
load step change (200-600 sec) transient.
J. Dang, J. Seuss, L. Suneja Student Member, and R. Harley, Fellow, IEEE
SOC Feedback Control for Wind and ESS
Hybrid Power System Frequency Regulation
46
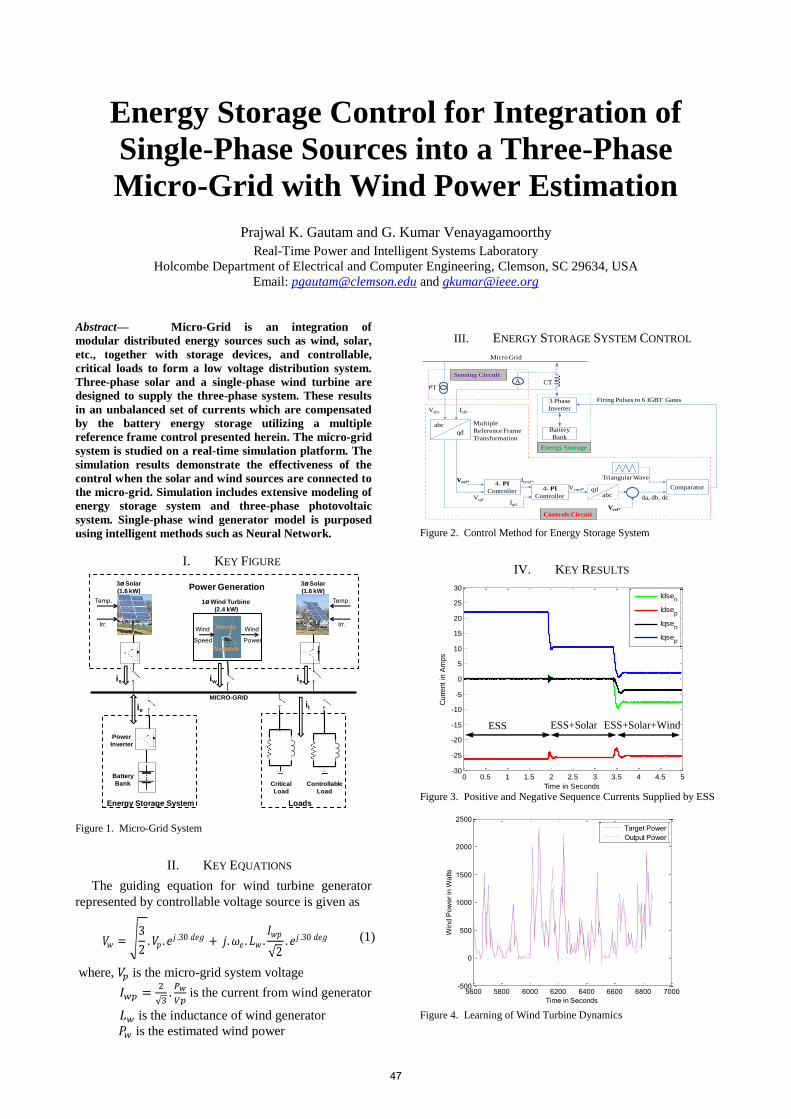
Energy Storage Control for Integration of
Single-Phase Sources into a Three-Phase
Micro-Grid with Wind Power Estimation
Prajwal K. Gautam and G. Kumar Venayagamoorthy
Real-Time Power and Intelligent Systems Laboratory
Holcombe Department of Electrical and Computer Engineering, Clemson, SC 29634, USA
Email: [email protected] and [email protected]
Abstract— Micro-Grid is an integration of
modular distributed energy sources such as wind, solar,
etc., together with storage devices, and controllable,
critical loads to form a low voltage distribution system.
Three-phase solar and a single-phase wind turbine are
designed to supply the three-phase system. These results
in an unbalanced set of currents which are compensated
by the battery energy storage utilizing a multiple
reference frame control presented herein. The micro-grid
system is studied on a real-time simulation platform. The
simulation results demonstrate the effectiveness of the
control when the solar and wind sources are connected to
the micro-grid. Simulation includes extensive modeling of
energy storage system and three-phase photovoltaic
system. Single-phase wind generator model is purposed
using intelligent methods such as Neural Network.
I. KEY FIGURE
Figure 1. Micro-Grid System
II. KEY EQUATIONS
The guiding equation for wind turbine generator
represented by controllable voltage source is given as
III. ENERGY STORAGE SYSTEM CONTROL
Figure 2. Control Method for Energy Storage System
IV. KEY RESULTS
Figure 3. Positive and Negative Sequence Currents Supplied by ESS
Figure 4. Learning of Wind Turbine Dynamics
Power Generation
MICRO-GRID
Energy Storage System
Power
Inverter
Battery
Bank
ie
Controllable
Load
Critical
Load
Loads
il
3ø Solar
(1.6 kW)
is
Temp.
Irr.
Temp.
is
3ø Solar
(1.6 kW)
Irr.
1ø Wind Turbine
(2.4 kW)
iw
Wind
Speed
Wind
Power
Neural
Network
Control Schematics for Energy Storage System
Triangular Wave4- PI
Controller 4- PI
Controller
Comparatorqdabc
Micro Grid
PT
Sensing Circuit
3 Phase
Inverter
A
Battery
Bank
CT
Energy Storage
Controls Circuit
Vabc
Vref*
Iabc
VqdIqd
Icmd*
da, db, dc
Firing Pulses to 6 IGBT Gates
Vcmd*
Vref*
abc
qd
Multiple
Reference Frame
Transformation
0 0.5 1 1.5 2 2.5 3 3.5 4 4.5 5-30
-25
-20
-15
-10
-5
0
5
10
15
20
25
30
Time in Seconds
Curr
ent
in A
mps
Idse
n
Idsep
Iqsen
Iqsep
5600 5800 6000 6200 6400 6600 6800 7000-500
0
500
1000
1500
2000
2500
Time in Seconds
Win
d P
ower
in W
atts
RNN Testing Plot for for 20 min hr of Training data
Target Power Output Power
ESS ESS+Solar ESS+Solar+Wind
𝑉𝑤 = 3
2 .𝑉𝑝 . 𝑒𝑗 .30 𝑑𝑒𝑔 + 𝑗.𝜔𝑒 . 𝐿𝑤 .
𝐼𝑤𝑝
2. 𝑒𝑗 .30 𝑑𝑒𝑔 (1)
where, 𝑉 is the micro-grid system voltage
𝐼
is the current from wind generator
𝐿 is the inductance of wind generator
is the estimated wind power
47
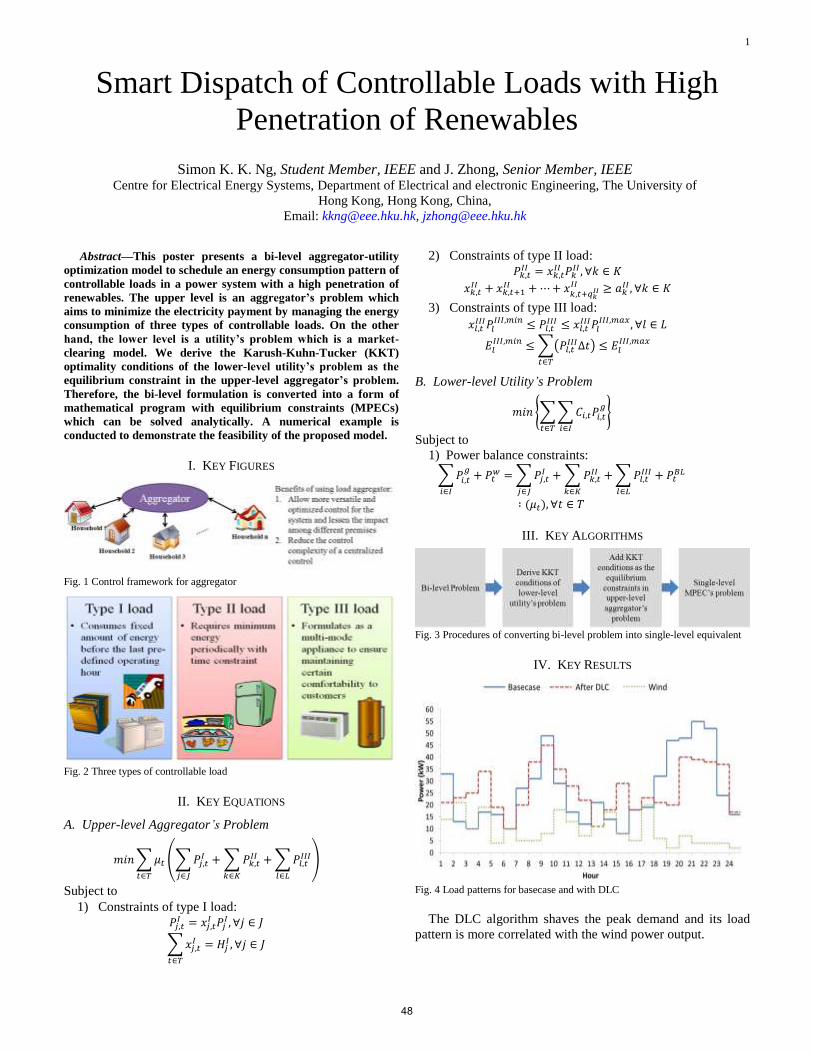
1
Abstract—This poster presents a bi-level aggregator-utility
optimization model to schedule an energy consumption pattern of
controllable loads in a power system with a high penetration of
renewables. The upper level is an aggregator’s problem which
aims to minimize the electricity payment by managing the energy
consumption of three types of controllable loads. On the other
hand, the lower level is a utility’s problem which is a market-
clearing model. We derive the Karush-Kuhn-Tucker (KKT)
optimality conditions of the lower-level utility’s problem as the
equilibrium constraint in the upper-level aggregator’s problem.
Therefore, the bi-level formulation is converted into a form of
mathematical program with equilibrium constraints (MPECs)
which can be solved analytically. A numerical example is
conducted to demonstrate the feasibility of the proposed model.
I. KEY FIGURES
Fig. 1 Control framework for aggregator
Fig. 2 Three types of controllable load
II. KEY EQUATIONS
A. Upper-level Aggregator’s Problem
∑
(∑
∑
∑
)
Subject to
1) Constraints of type I load:
∑
2) Constraints of type II load:
3) Constraints of type III load:
∑(
)
B. Lower-level Utility’s Problem
∑∑
Subject to
1) Power balance constraints:
∑
∑
∑
∑
III. KEY ALGORITHMS
Fig. 3 Procedures of converting bi-level problem into single-level equivalent
IV. KEY RESULTS
Fig. 4 Load patterns for basecase and with DLC
The DLC algorithm shaves the peak demand and its load
pattern is more correlated with the wind power output.
Simon K. K. Ng, Student Member, IEEE and J. Zhong, Senior Member, IEEE Centre for Electrical Energy Systems, Department of Electrical and electronic Engineering, The University of
Hong Kong, Hong Kong, China,
Email: [email protected], [email protected]
Smart Dispatch of Controllable Loads with High
Penetration of Renewables
48
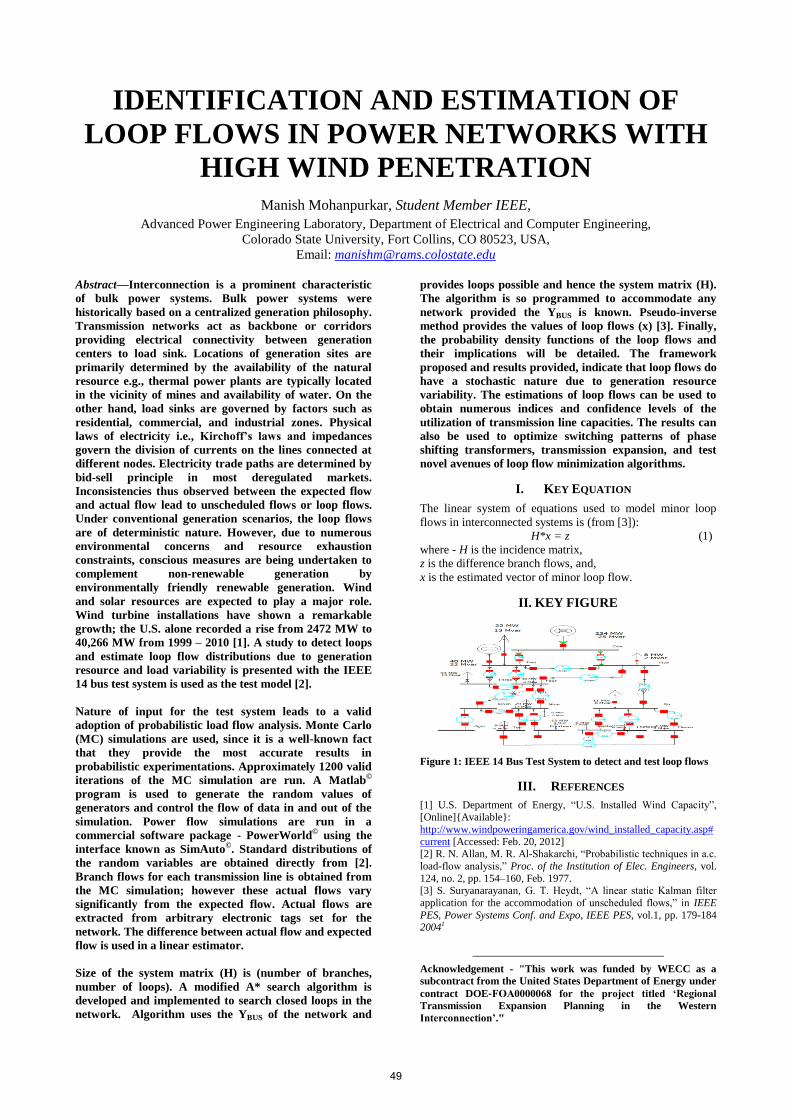
IDENTIFICATION AND ESTIMATION OF
LOOP FLOWS IN POWER NETWORKS WITH
HIGH WIND PENETRATION Manish Mohanpurkar, Student Member IEEE,
Advanced Power Engineering Laboratory, Department of Electrical and Computer Engineering,
Colorado State University, Fort Collins, CO 80523, USA,
Email: [email protected]
Abstract—Interconnection is a prominent characteristic
of bulk power systems. Bulk power systems were
historically based on a centralized generation philosophy.
Transmission networks act as backbone or corridors
providing electrical connectivity between generation
centers to load sink. Locations of generation sites are
primarily determined by the availability of the natural
resource e.g., thermal power plants are typically located
in the vicinity of mines and availability of water. On the
other hand, load sinks are governed by factors such as
residential, commercial, and industrial zones. Physical
laws of electricity i.e., Kirchoff’s laws and impedances
govern the division of currents on the lines connected at
different nodes. Electricity trade paths are determined by
bid-sell principle in most deregulated markets.
Inconsistencies thus observed between the expected flow
and actual flow lead to unscheduled flows or loop flows.
Under conventional generation scenarios, the loop flows
are of deterministic nature. However, due to numerous
environmental concerns and resource exhaustion
constraints, conscious measures are being undertaken to
complement non-renewable generation by
environmentally friendly renewable generation. Wind
and solar resources are expected to play a major role.
Wind turbine installations have shown a remarkable
growth; the U.S. alone recorded a rise from 2472 MW to
40,266 MW from 1999 – 2010 [1]. A study to detect loops
and estimate loop flow distributions due to generation
resource and load variability is presented with the IEEE
14 bus test system is used as the test model [2].
Nature of input for the test system leads to a valid
adoption of probabilistic load flow analysis. Monte Carlo
(MC) simulations are used, since it is a well-known fact
that they provide the most accurate results in
probabilistic experimentations. Approximately 1200 valid
iterations of the MC simulation are run. A Matlab©
program is used to generate the random values of
generators and control the flow of data in and out of the
simulation. Power flow simulations are run in a
commercial software package - PowerWorld© using the
interface known as SimAuto©. Standard distributions of
the random variables are obtained directly from [2].
Branch flows for each transmission line is obtained from
the MC simulation; however these actual flows vary
significantly from the expected flow. Actual flows are
extracted from arbitrary electronic tags set for the
network. The difference between actual flow and expected
flow is used in a linear estimator.
Size of the system matrix (H) is (number of branches,
number of loops). A modified A* search algorithm is
developed and implemented to search closed loops in the
network. Algorithm uses the YBUS of the network and
provides loops possible and hence the system matrix (H).
The algorithm is so programmed to accommodate any
network provided the YBUS is known. Pseudo-inverse
method provides the values of loop flows (x) [3]. Finally,
the probability density functions of the loop flows and
their implications will be detailed. The framework
proposed and results provided, indicate that loop flows do
have a stochastic nature due to generation resource
variability. The estimations of loop flows can be used to
obtain numerous indices and confidence levels of the
utilization of transmission line capacities. The results can
also be used to optimize switching patterns of phase
shifting transformers, transmission expansion, and test
novel avenues of loop flow minimization algorithms.
I. KEY EQUATION
The linear system of equations used to model minor loop
flows in interconnected systems is (from [3]):
H*x = z (1)
where - H is the incidence matrix,
z is the difference branch flows, and,
x is the estimated vector of minor loop flow.
II. KEY FIGURE
Figure 1: IEEE 14 Bus Test System to detect and test loop flows
III. REFERENCES
[1] U.S. Department of Energy, “U.S. Installed Wind Capacity”, [Online]Available:
http://www.windpoweringamerica.gov/wind_installed_capacity.asp#
current [Accessed: Feb. 20, 2012] [2] R. N. Allan, M. R. Al-Shakarchi, “Probabilistic techniques in a.c.
load-flow analysis,” Proc. of the Institution of Elec. Engineers, vol.
124, no. 2, pp. 154–160, Feb. 1977. [3] S. Suryanarayanan, G. T. Heydt, “A linear static Kalman filter
application for the accommodation of unscheduled flows,” in IEEE
PES, Power Systems Conf. and Expo, IEEE PES, vol.1, pp. 179-184 20041
Acknowledgement - "This work was funded by WECC as a
subcontract from the United States Department of Energy under
contract DOE‐FOA0000068 for the project titled ‘Regional
Transmission Expansion Planning in the Western
Interconnection’."
49

Voltage Profile Simulation using OpenDSS in High
Penetration PV Scenario
Touseef Ahmed Faisal Mohammed, H. Krishnaswami
Department of Electrical and Computer Engineering,
University of Texas at San Antonio
San Antonio, Texas, USA
[email protected]; [email protected]
Abstract— High penetration of PV into the power grid changes
the voltage profile in the distribution circuits due to the inherent
variability of PV. These frequent voltage variations can reduce
the reliability of voltage regulators in the grid. There are a
number of modeling and simulations tools available for the study
of such high penetration PV scenarios. This poster will
specifically utilize OpenDSS to simulate grid voltage profile with
a large scale PV system. Results are presented for a model circuit
with hourly variations in PV power output and the load. This
poster will also explain the capabilities of openDSS in performing
these types of high penetration PV grid impact studies.
Keywords-voltage profile; disribution grid; photo voltaic
(PV);distribution system simulator (DSS)
I. INTRODUCTION
OpenDSS [1] was originally developed by Electrotek Concepts, Inc in 1997. It was one of the main tools at Electric Power Research Institute (EPRI) for distribution system simulation tests. In 2008, EPRI made the program open source to promote grid modernization efforts by providing researchers and consultants with a tool to evaluate advanced concepts of smart grid and distribution generation. It was hence renamed from DSS to OpenDSS. This tool has the advantage of performing simulations with variable PV generation, which is expected to reach several GW in the future. The smart grid is expected to integrate several of such distributed PV resources seamlessly. It will accelerate a natural evolution towards more optimal, real-time and intelligent algorithms in distribution system which can be studied through tools like OpenDSS.
In literature, openDSS has been developed used for distributed resource planning, harmonic studies, neutral-earth voltage studies, volt-var control studies, and other special applications. The simulator has also been used to conduct several smart grid research projects, including advanced smart grid functionalities [2], electric vehicle penetration and state estimation. In this poster, a model circuit is used with variable PV generation and load to study the voltage profile with large-scale distributed generation. The results from OpenDSS are presented in the following section.
II. SIMULATION RESULTS
The model distribution circuit used for simulation has a conventional generator, a PV source, transmission lines and a
variable load. Both PV and the load are varying with time and they are scripted in code using the Component Object Model (COM) interface which is a unique feature of OpenDSS. The program is a script-driven simulation engine. The OpenDSS architecture consists of executive model and a system model. Executive model processes the main script commands and System model consists of main circuit solution. Fig. 1 shows the change in voltage at the load bus for four different cases where the PV generator output and the load are varied by +/- 20%.
Fig. 1 Load bus voltage profile with variable PV
Fig. 2 Load profile for a year in p.u. [1]
The simulator has the capability to project the variability in load profile and PV system output for an entire year. Fig. 2 shows that how OpenDSS can plot load profile of a distribution system. Further results with this feature will be presented in the final poster.
REFERENCES
[1] EPRI OpenDSS, Open Distribution System Simulator, Sourceforge.Net;
http://sourceforge.net/projects/electricdss/files
[2] J.W. Smith, W. Sunderman, R. Dugan, “Smart Inverter Volt/Var Control Functions for High Penetration of PV on Distribution Sytems”, PSCE 2011, pp. 1-6, 20-23 March 2011.
This project was partially funded by CPSEnergy through its Strategic Research Alliance with The University of Texas at San Antonio
50
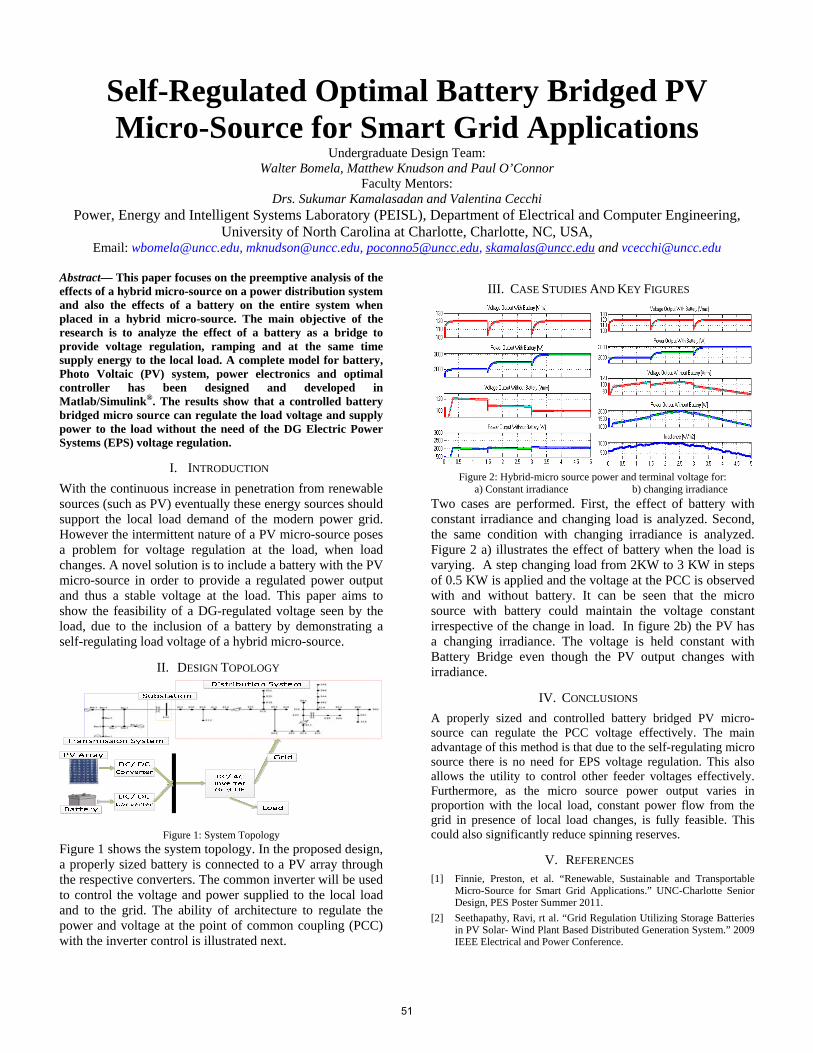
Self-Regulated Optimal Battery Bridged PV Micro-Source for Smart Grid Applications
Undergraduate Design Team: Walter Bomela, Matthew Knudson and Paul O’Connor
Faculty Mentors: Drs. Sukumar Kamalasadan and Valentina Cecchi
Power, Energy and Intelligent Systems Laboratory (PEISL), Department of Electrical and Computer Engineering, University of North Carolina at Charlotte, Charlotte, NC, USA,
Email: [email protected], [email protected], [email protected], [email protected] and [email protected]
Abstract— This paper focuses on the preemptive analysis of the effects of a hybrid micro-source on a power distribution system and also the effects of a battery on the entire system when placed in a hybrid micro-source. The main objective of the research is to analyze the effect of a battery as a bridge to provide voltage regulation, ramping and at the same time supply energy to the local load. A complete model for battery, Photo Voltaic (PV) system, power electronics and optimal controller has been designed and developed in Matlab/Simulink®. The results show that a controlled battery bridged micro source can regulate the load voltage and supply power to the load without the need of the DG Electric Power Systems (EPS) voltage regulation.
I. INTRODUCTION With the continuous increase in penetration from renewable sources (such as PV) eventually these energy sources should support the local load demand of the modern power grid. However the intermittent nature of a PV micro-source poses a problem for voltage regulation at the load, when load changes. A novel solution is to include a battery with the PV micro-source in order to provide a regulated power output and thus a stable voltage at the load. This paper aims to show the feasibility of a DG-regulated voltage seen by the load, due to the inclusion of a battery by demonstrating a self-regulating load voltage of a hybrid micro-source.
II. DESIGN TOPOLOGY
Figure 1: System Topology Figure 1 shows the system topology. In the proposed design, a properly sized battery is connected to a PV array through the respective converters. The common inverter will be used to control the voltage and power supplied to the local load and to the grid. The ability of architecture to regulate the power and voltage at the point of common coupling (PCC) with the inverter control is illustrated next.
III. CASE STUDIES AND KEY FIGURES
Two cases are performed. First, the effect of battery with constant irradiance and changing load is analyzed. Second, the same condition with changing irradiance is analyzed. Figure 2 a) illustrates the effect of battery when the load is varying. A step changing load from 2KW to 3 KW in steps of 0.5 KW is applied and the voltage at the PCC is observed with and without battery. It can be seen that the micro source with battery could maintain the voltage constant irrespective of the change in load. In figure 2b) the PV has a changing irradiance. The voltage is held constant with Battery Bridge even though the PV output changes with irradiance.
IV. CONCLUSIONS A properly sized and controlled battery bridged PV micro-source can regulate the PCC voltage effectively. The main advantage of this method is that due to the self-regulating micro source there is no need for EPS voltage regulation. This also allows the utility to control other feeder voltages effectively. Furthermore, as the micro source power output varies in proportion with the local load, constant power flow from the grid in presence of local load changes, is fully feasible. This could also significantly reduce spinning reserves.
V. REFERENCES [1] Finnie, Preston, et al. “Renewable, Sustainable and Transportable
Micro-Source for Smart Grid Applications.” UNC-Charlotte Senior Design, PES Poster Summer 2011.
[2] Seethapathy, Ravi, rt al. “Grid Regulation Utilizing Storage Batteries in PV Solar- Wind Plant Based Distributed Generation System.” 2009 IEEE Electrical and Power Conference.
Figure 2: Hybrid-micro source power and terminal voltage for: a) Constant irradiance b) changing irradiance
51
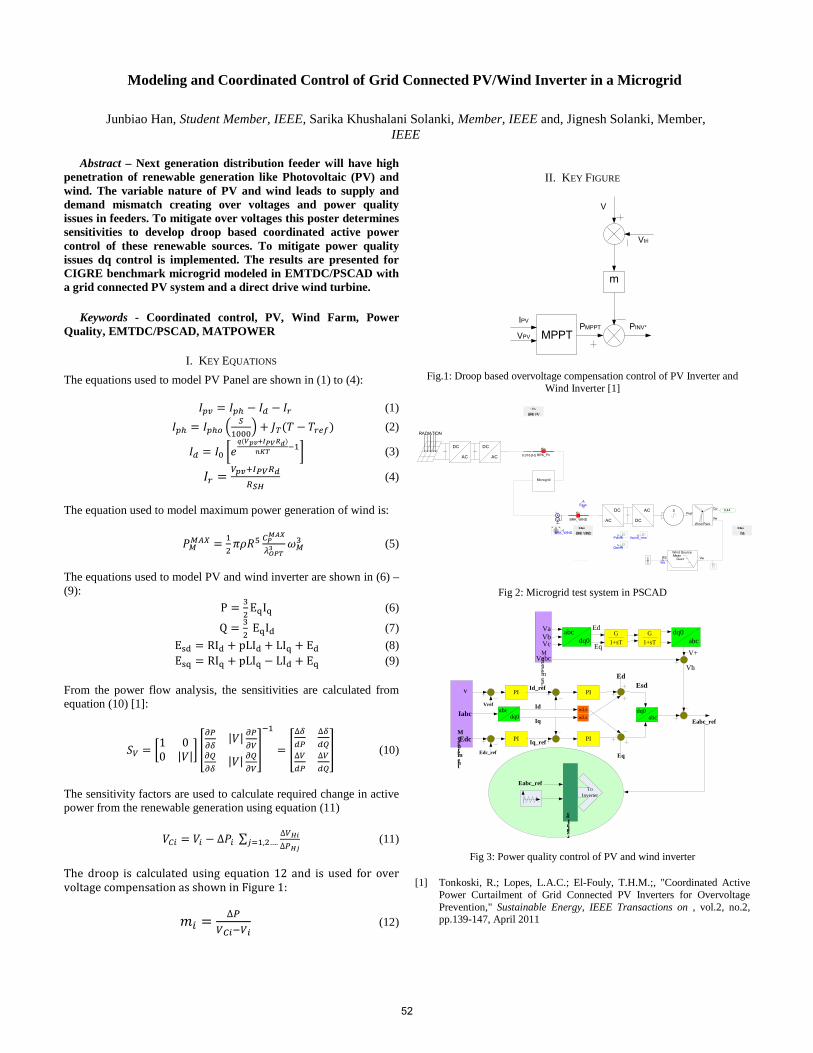
Abstract – Next generation distribution feeder will have high penetration of renewable generation like Photovoltaic (PV) and wind. The variable nature of PV and wind leads to supply and demand mismatch creating over voltages and power quality issues in feeders. To mitigate over voltages this poster determines sensitivities to develop droop based coordinated active power control of these renewable sources. To mitigate power quality issues dq control is implemented. The results are presented for CIGRE benchmark microgrid modeled in EMTDC/PSCAD with a grid connected PV system and a direct drive wind turbine.
Keywords - Coordinated control, PV, Wind Farm, Power Quality, EMTDC/PSCAD, MATPOWER
I. KEY EQUATIONS The equations used to model PV Panel are shown in (1) to (4):
𝐼𝑝𝑣 = 𝐼𝑝ℎ − 𝐼𝑑 − 𝐼𝑟 (1) 𝐼𝑝ℎ = 𝐼𝑝ℎ𝑜
𝑆1000
+ 𝐽𝑇(𝑇 − 𝑇𝑟𝑒𝑓) (2)
𝐼𝑑 = 𝐼0 𝑒𝑞(𝑉𝑝𝑣+𝐼𝑃𝑉𝑅𝑑)
𝑛𝐾𝑇 −1 (3)
𝐼𝑟 = 𝑉𝑝𝑣+𝐼𝑃𝑉𝑅𝑑𝑅𝑆𝐻
(4)
The equation used to model maximum power generation of wind is:
𝑃𝑀𝑀𝐴𝑋 = 12𝜋𝜌𝑅5 𝐶𝑃
𝑀𝐴𝑋
𝜆𝑂𝑃𝑇3 𝜔𝑀3 (5)
The equations used to model PV and wind inverter are shown in (6) –(9):
P = 32
EqIq (6)
Q = 32
EqId (7) Esd = RId + pLId + LIq + Ed (8) Esq = RIq + pLIq − LId + Eq (9)
From the power flow analysis, the sensitivities are calculated from equation (10) [1]:
𝑆𝑉 = 1 00 |𝑉|
𝜕𝑃𝜕𝛿
|𝑉| 𝜕𝑃𝜕𝑉
𝜕𝑄𝜕𝛿
|𝑉| 𝜕𝑄𝜕𝑉
−1
= ∆𝛿𝑑𝑃
∆𝛿𝑑𝑄
∆𝑉𝑑𝑃
∆𝑉𝑑𝑄
(10)
The sensitivity factors are used to calculate required change in active power from the renewable generation using equation (11)
𝑉𝐶𝑖 = 𝑉𝑖 − ∆𝑃𝑖 ∑∆𝑉𝐻𝑖∆𝑃𝐻𝑗𝑗=1,2…. (11)
The droop is calculated using equation 12 and is used for over voltage compensation as shown in Figure 1:
𝑚𝑖 = ∆𝑃𝑉𝐶𝑖−𝑉𝑖
(12)
II. KEY FIGURE
MPPT
m
V
Vtri
PINV*PMPPTIPV
VPV
Fig.1: Droop based overvoltage compensation control of PV Inverter and Wind Inverter [1]
Fig 2: Microgrid test system in PSCAD
V
Iabc
Edc
PI
Vref
Edc_ref
PI
abcdq0
PI
PI
wLswLs
Ed
Eq
To Inverter
Measurement
Id_ref
Id
Iq
Switching functio
dq0abc
Eabc_ref
Eabc_ref
Iq_ref
Measurement
VaVbVc
abcdq0
G1+sT
G1+sT
dq0abc
VabcEq
Ed
Vh
Esd
V+
Fig 3: Power quality control of PV and wind inverter
[1] Tonkoski, R.; Lopes, L.A.C.; El-Fouly, T.H.M.;, "Coordinated Active Power Curtailment of Grid Connected PV Inverters for Overvoltage Prevention," Sustainable Energy, IEEE Transactions on , vol.2, no.2, pp.139-147, April 2011
Esys
BRK_PV0.016 [H]
DC
AC
DC
AC
RADIATION
: Co...BRK PV
BRK_WIND
BRK_WIND
VA
Main ...BRK WIND
Pwind
Qwind
Vwind_rms
Wind Park
PrefCp
Vw
DC
AC
AC
DC
S 0.44
WsVwES
Wind Source
GustMean
Main ...Ws
Microgrid
Modeling and Coordinated Control of Grid Connected PV/Wind Inverter in a Microgrid
Junbiao Han, Student Member, IEEE, Sarika Khushalani Solanki, Member, IEEE and, Jignesh Solanki, Member, IEEE
52

Health Monitoring of Substation Components
Griet Devriese, Student Member, IEEE, Anurag K Srivastava, Senior Member, IEEE Smart Grid Demonstration and Research Investigation Laboratory, The School of Electrical Engineering and Computer Science,
Washington State University, Pullman, WA 99163, USA, Email: [email protected]
Abstract—To provide secure and reliable energy, the electric power grid must function systematically in a managed way. Substations are an integral component of a reliable electric grid and health management of substations is important to continually provide electricity to the consumer. Health monitoring of substation components warrants further discussion and research.
I. HEALTH MONITORING OF CIRCUIT BREAKERS Substations are complex systems within the electric power
system. Many mechanical and electrical devices within substations work together to ensure flawless transmission and distribution of electricity. With ongoing smart grid activities, intelligent electronic devices create tremendous opportunity for data collection and analysis to ensure each substation component is working optimally. Current industry practices, however, do not utilize this data to its full benefit. By correctly interpreting the data from relays, substation engineers can closely monitor the health of each circuit breaker (CB), trip coil (TC), and transformer. By combining these analyses, substation health can be better assessed. Wave analyses provide information about the electrical properties and mechanical state of TC and CB. Through plotting multiple waves on one axis, a trending methodology can be applied. By comparing the current waveform to the previous, the maximum, and the minimum allowed, percent deviations can be calculated. Analyzing particular sections of each wave in this manner yields information about the functionality of the operations occurring within each substation device.
II. KEY FIGURES
Figure 1. Diagram of A through F segments of typical waveform used for
analysis
III. KEY ANALYSIS Comparing the critical points A through F on a trip event
waveform provides insight into the mechanical and electrical functionality of the device. Each segment of the waveform correlates to a physical action occurring within the device. Monitoring the changes in resultant waveforms allows operators to see changes in the behavior and health of the substation equipment [1].
Deviations from the norm in section A-B indicates problems with the electrical characteristics of the solenoid or supply current and voltage to the trip coil. Section B-C indicates the level of restrictive forces on the device plunger travel (such as oils and greases in the coil assembly). Section C-D indicates how well the plunger overcomes the trip bar inertia and can reveal component alignment problems. Section D-E represents travel of the plunger, striker pin, and trip bar. At point E the plunger comes to the end of its travel [2].
The project seeks to utilize the data from Schweitzer Engineering Laboratories (SEL) digital relays commonly installed in substations. By analyzing this data, a numerical health index can be assigned to each device.
IV. SUMMARY Health monitoring of substation devices can reduce the
number of visual inspections needed and increase the efficiency of repairs through better component diagnosis. Combined with the health index, substations health monitoring will result in cost savings and an increase in reliability. Continued work in this research area is expected to lead to prognosis studies and the effective prevention of early component loss or unexpected failures.
V. ACKNOWLEDGEMENTS The authors would like to thank SEL for providing the financial support for this project.
VI. REFERENCES [1] M. Kezunovic, Z. Ren, G. Latisko, D.R. Sevcik, J.S.
Lucey, W. E. Cook, E.A. Koch, “Automated Monitoring and Analysis of Circuit Breaker Operation”, IEEE Transactions on Power Delivery, Vol. 20, 2005.
[2] R. Henderson, “Condition Assessment of Circuit Breakers Using a Trip Coil Profiling Approach”, IEE, Colloquium on Monitors and Condition Assessment, UK, 1996.
53

Fault Diagnosis and Prognosis for Substations
Jeong Hun Kim, Student Member, IEEE and Anurag K Srivastava, Senior Member, IEEE Smart Grid Demonstration and Research Investigation Laboratory (SGDRIL),
The School of Electrical Engineering and Computer Science, Washington State University, Pullman, E-mail: [email protected]
Abstract—A fault is an unexpected change in a system, such as a component malfunction. Faults may lead to variations in operating condition to degrade overall system performance. In recent years, as more intelligent electronic devices (IEDs) at substations are being used, health monitoring of substation becoming more feasible. This poster addresses using available data from IEDs for health management of substations using diagnostic and prognostic approaches.
I. INTRODUCTION The concepts of diagnosis and prognosis for substation are
processes of assessment of a system’s health – past, present and future – based on observed data and available knowledge about the system [1]. Respectively, diagnostics is an assessment about the current and past health of a system based on observed measurements, and prognostics is an assessment of the future health. Since substations are very important and complex systems within the electrical power system, health management of substations is very important to keep the required reliability [2]. With better health monitoring tools of substation using diagnostic and prognostic techniques, not only the efficiency of restorations can be increased, but also the number of inspections can be decreased.
II. FAULT DIAGNOSIS Diagnosis is defined as the identification of the ‘nature and
cause’ of observed response. Behavior of the engineering system may differ from its model making diagnosis more challenging. The concept diagnosis might come from “troubleshooting”, which involves determining why a correctly designed piece of equipment is not functioning as it was intended. The explanation for the faulty behavior being that the particular piece of equipment under consideration is at variance in some way with its design.
This research work seeks to utilize the data from Schweitzer Engineering Laboratories (SEL) digital relays commonly installed in substations for diagnosis. By analyzing data from digital relays, a diagnostic algorithm infers a possible root cause of the fault in a substation. The data from digital relays may include more information other than voltages and currents measured from PT and CT coupled with certain components in a substation. Based on these measured responses, possible fault cases should be listed by comparing normal and abnormal operation from a simple model of substation components. It should be further analyzed to narrow down the list of possible root causes of faults/ failures. Diagnostic algorithms can be implemented using available real time
controller solutions. Algorithms can also have the features of including a probability factor with each possible root cause of faults/ failures.
III. FAULT PROGNOSIS Prognostic problems are essentially prediction problems
based on sequential data. Sequential data may arise in many areas of science and engineering. The data may either be a time series, generated by a dynamical system, or a sequence generated by a 1-dimensional spatial process. One may be interested either in online analysis, where the data arrives in real-time, or in offline analysis, where all the data has already been collected. The prognosis in substation is online analysis on time series of data from digital relays.
This project is focusing on possible propagated faults among substation devices. In order to detect propagated fault the first step is to provide fault data in terms of measurements under abnormal operation of a substation. For experimental studies in a lab setup, communication between SEL devices and Real Time Digital Simulator (RTDS) with a simple substation model in RSCAD can generate real-time data. With changing parameters of certain components on RSCAD model, abnormal operation of substation can be modeled and simulated. With this simulation, fault data under abnormal status can be provided. Then prognostic algorithm built and coded in a SEL substation controller can infer possible propagated faults.
IV. SUMMARY A fault diagnosis and prognosis tools in a substation will
lead to enhanced reliability and economics. Algorithms will monitor the data from IEDs and detect possible faults/ failures with a probability factor. It will also predict propagation of faults/ failures at system level with prognostic techniques such as rule based/ expert system algorithm.
V. ACKNOWLEDGEMENT The authors wish to express special gratitude to SEL for the
financial support for this project.
VI. REFERENCES [1] Heung-Jae Lee, Bok-Shin Ahn, Young-Moon Park, “A Fault Diagnosis
Expert System for Distribution Substations”, IEEE Transactions on Power Delivery, vol.1, pp. 92-97, 2002
[2] D. Dolezilek, “Understanding, Predicting, and Enhancing the Power System Through Equipment Monitoring and Analysis,” proceedings of the 2nd Annual Western Power Delivery Automation Conference, Spokane, WA, April, 2000
54

An Investigation of Capacitor Control Actions for Voltage Spread Reduction in Distribution Systems
Nicole U. Segal and Karen Miu Center for Electric Power Engineering, Department of Electrical and Computer Engineering
Drexel University, Philadelphia, Pennsylvania, U.S.A. [email protected], [email protected]
Abstract— This work investigates capacitor control for voltage spread reduction. In particular, the purpose of the work is to observe the relationship between the numbers of load levels and the numbers of capacitor control actions taken in a day. This is important because with Advanced Distribution Automation (ADA) the amount of sensed voltage and load data increases and a re-evaluation of local control schemes which were based on time of day algorithms or voltage set points is warranted.
Typically, system operators dictate a daily maximum number of capacitor control actions based on the equipment lifetime and maintenance considerations. In [1] and [2] the maximum number of daily switch operations is less than or equal to the number of load levels studied in a day. In this work, voltage spread reduction via capacitor control is studied using an actual distribution circuit given the location and size of capacitors. It is noted under certain circumstances it may be necessary to relax previous capacitor set points for switching.
Simulation results for the system are subjected to multiple load levels. Following [3], it is noted that the peak and minimum load profile as well as the average load profile have been given. Other load levels are created by scaling. Subsequently, control sequences were determined and the number and order of control actions were evaluated.
I. KEY EQUATION
,
, ,
min max p p
i ju U i j N
p a b c
V u V u
where, alphabetically:
N : set of all buses
capn :total number of all capacitors
LLN : number of load levels maxopsn : maximum number of switch operations per
capacitor, load level l p : present phase (a ,b, c) at a bus i u : final capacitor control scheme, load level l U : set of possible capacitor control operations
p
iV : voltage at bus i, phase p
The objective in (1) is subject to electrical constraints, such as, a multi-phase unbalanced power flow with detailed network
components. The system is also subject to operating constraints, such as, the maximum number of switch operations, voltage restrictions and thermal limitations.
II. KEY TABLES Table I, provides a list of the test circuit's electrical components and their count. The capacitor location, size, and type for the test circuit are shown in Table II. Manual and switched capacitors exist in the circuit. Manual capacitors are considered to be always on. Switched capacitors are limited by the utility's existing control and communications equipment and here will have two states, all on and all off.
REFERENCES [1] M. B. Liu, C.A. Cañizares, W. Huang, “Reactive power and voltage
control in distribution systems with limited switching operations,” IEEE Trans. on Power Systems, vol. 24, no. 2, pp. 889-899, May 2009.
[2] Z. Hu, X.Wang, H. Chen, and G. A. Taylor, “Volt/var control in distribution systems using a time-interval based approach,” IEE Proc. Generation, Transmission, and Distribution, vol. 150, no. 5, pp. 548–554, Sep. 2003.
[3] W.-H.E. Liu, S. McArthur, J. Giri, K. Miu, R. Pratt, Wen Jun, B. Uluski, L. Dow, G. Labut, "One day smart grid supersession — Analytics and integration," Power and Energy Society General Meeting, 2011 IEEE , vol., no., pp.1-5, 24-29 July 2011. .
TABLE I COMPONENTS AND COUNT FOR TEST CIRCUIT
Component Count Buses 948 Nodes 1224 Lines 941
Switches 23 Capacitors 5
Loads 282
TABLE II CAPACITOR LOCATION, SIZE AND TYPE FOR TEST CIRCUIT
Capacitor Bus
Number
Size (kVAr)
Type Manual/ Switched
1333 600 Manual 1937 600 Switchable 1292 600 Switchable 1177 1200 Switchable 1015 600 Switchable
55
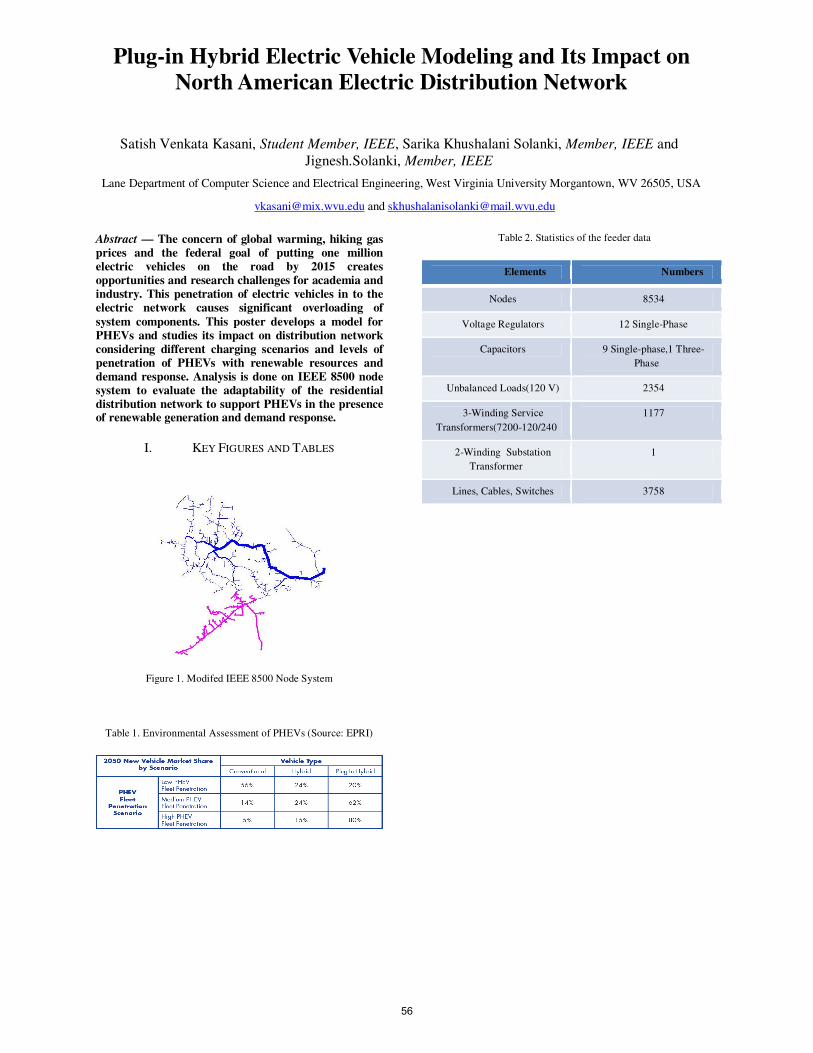
Abstract — The concern of global warming, hiking gas
prices and the federal goal of putting one million
electric vehicles on the road by 2015 creates
opportunities and research challenges for academia and
industry. This penetration of electric vehicles in to the
electric network causes significant overloading of
system components. This poster develops a model for
PHEVs and studies its impact on distribution network
considering different charging scenarios and levels of
penetration of PHEVs with renewable resources and
demand response. Analysis is done on IEEE 8500 node
system to evaluate the adaptability of the residential
distribution network to support PHEVs in the presence of renewable generation and demand response.
I. KEY FIGURES AND TABLES
Figure 1. Modifed IEEE 8500 Node System
Table 1. ( ) Environmental Assessment of PHEVs Source: EPRI
Table 2. Statistics of the feeder data
Elements Numbers
Nodes 8534
Voltage Regulators 12 Single-Phase
Capacitors 9 Single-phase,1 Three-
Phase
Unbalanced Loads(120 V) 2354
3-Winding Service
Transformers(7200-120/240
1177
2-Winding Substation
Transformer
1
Lines, Cables, Switches 3758
Plug-in Hybrid Electric Vehicle Modeling and Its Impact on
North American Electric Distribution Network
Satish Venkata Kasani, Student Member, IEEE, Sarika Khushalani Solanki, Member, IEEE and
Jignesh.Solanki, Member, IEEE
[email protected] and [email protected]
Lane Department of Computer Science and Electrical Engineering, West Virginia University Morgantown, WV 26505, USA
56

DESIGN OF DECENTRALIZED FUZZY LOGIC
LOAD FREQUNCY CONTROLLER-
IMPLIMENTAION TO GCC
INTERCONNECTED POWER GRID
A. Al-Kuwari*, student member, IEEE, A. Selawi*, student member, IEEE, K. Ellithy*, senior member, IEEE
*Department of Electrical Engineering
Qatar University
Doha, Qatar
[email protected], [email protected]., [email protected]
Abstract— This project presents an approach for
designing a decentralized controller for load frequency
control of interconnected power areas. The proposed fuzzy
logic load frequency controller (FLFC) is designed to
improve the dynamic performance of the frequency and tie
line power under a sudden load change in the power areas.
The proposed FLFC consists internally of one fuzzy logic
controller, designed from the intuitive understanding of
the power system’s dynamics. The fuzzy logic controller
designed in this project calculates the control signal for
each area, and it consists of two crisp inputs which are the
area control error and its derivative and one output. The
output of the fuzzy logic controller is the control input to
each area. The proposed FLFC is implemented to the GCC
interconnected power grid. Time-domain simulations
using MATALB/SIMULINK program were performed to
demonstrate the effectiveness of the proposed FLFC. The
simulation results show that the proposed FLFC can
provide good damping and reduce the overshoot. FLFC
also ensures the stability of the power areas for all load
demand changes and changes in the areas parameters.
Moreover, the proposed controller type is relatively simple
and suitable for practical on-line implementation.
Figure 1 illustrates the SIMULINK block diagram
of the two power area in GCC power grid under study
(Qatar-Saudi Arabia interconnected systems). Figure 2
show the dynamic performance of one area with the
existing conventional controller, the decentralized optimal
controller and the designed fuzzy logic controller under
sudden changes in the area load.
Keywords-component; Load Frequency Control, State
Space, Optimal Control, Decentralized Control, Fuzzy Logic
Control
Figure 1. developed block diagram of the two power area
Figure 2. The dynamic performance of area1 with and without the designed FLFC under sudden changes in the area load
-Governor Turbine Rotating mass
and load
-
Governor Turbine Rotating mass
and load
+
-
+
-
∆1
∆2
∆1
∆2
∆1
∆2s
T 21
1
τ+
1
1
R
2
1
R
∆1
∆2
-
-
+
+
+
-
1
2
1
2
∆
∆1
∆2
11 + 1
11 + 2 ∆2 ∆ 2
2
1
∆ 1∆1
Fuzzy Logic Controller
Fuzzy Logic Controller
sT11
1
τ+
11 + 1
22 + 1
0 2 4 6 8 10 12 14 16 18 20-0.25
-0.2
-0.15
-0.1
-0.05
0
0.05Frequency Deviation in Area one
Time ( Sec )
Ch
an
ge
in
Fre
qu
en
cy
( p
u )
With Fuzzy
With Optimal
With AGC
57
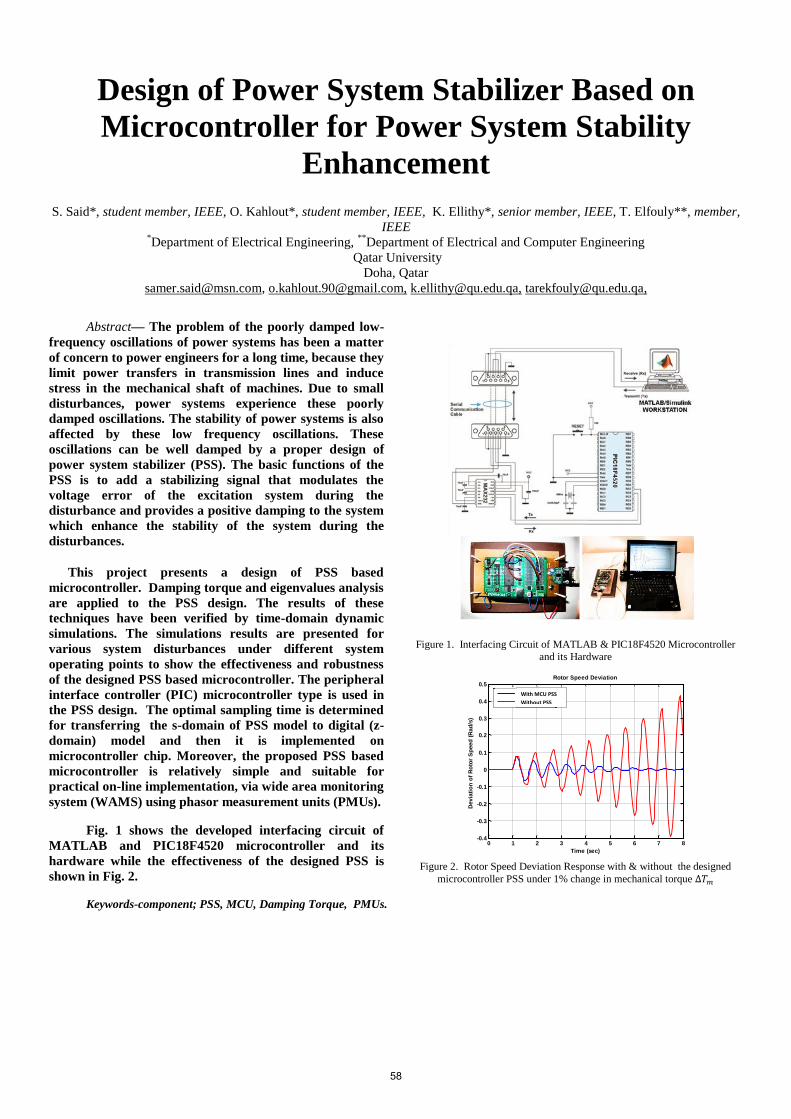
Design of Power System Stabilizer Based on
Microcontroller for Power System Stability
Enhancement
S. Said*, student member, IEEE, O. Kahlout*, student member, IEEE, K. Ellithy*, senior member, IEEE, T. Elfouly**, member,
IEEE *Department of Electrical Engineering,
**Department of Electrical and Computer Engineering
Qatar University
Doha, Qatar
[email protected], [email protected], [email protected], [email protected],
Abstract— The problem of the poorly damped low-
frequency oscillations of power systems has been a matter
of concern to power engineers for a long time, because they
limit power transfers in transmission lines and induce
stress in the mechanical shaft of machines. Due to small
disturbances, power systems experience these poorly
damped oscillations. The stability of power systems is also
affected by these low frequency oscillations. These
oscillations can be well damped by a proper design of
power system stabilizer (PSS). The basic functions of the
PSS is to add a stabilizing signal that modulates the
voltage error of the excitation system during the
disturbance and provides a positive damping to the system
which enhance the stability of the system during the
disturbances.
This project presents a design of PSS based
microcontroller. Damping torque and eigenvalues analysis
are applied to the PSS design. The results of these
techniques have been verified by time-domain dynamic
simulations. The simulations results are presented for
various system disturbances under different system
operating points to show the effectiveness and robustness
of the designed PSS based microcontroller. The peripheral
interface controller (PIC) microcontroller type is used in
the PSS design. The optimal sampling time is determined
for transferring the s-domain of PSS model to digital (z-
domain) model and then it is implemented on
microcontroller chip. Moreover, the proposed PSS based
microcontroller is relatively simple and suitable for
practical on-line implementation, via wide area monitoring
system (WAMS) using phasor measurement units (PMUs).
Fig. 1 shows the developed interfacing circuit of
MATLAB and PIC18F4520 microcontroller and its
hardware while the effectiveness of the designed PSS is
shown in Fig. 2.
Figure 1. Interfacing Circuit of MATLAB & PIC18F4520 Microcontroller
and its Hardware
Figure 2. Rotor Speed Deviation Response with & without the designed
microcontroller PSS under 1% change in mechanical torque
Keywords-component; PSS, MCU, Damping Torque, PMUs.
Fig. 3 Rotor Speed Deviation Response with & without the microcontroller PSS
under 1% change in 𝑻𝒎
0 1 2 3 4 5 6 7 8-0.4
-0.3
-0.2
-0.1
0
0.1
0.2
0.3
0.4
0.5Rotor Speed Deviation
Time (sec)
Devia
tio
n o
f R
oto
r S
peed
(R
ad
/s)
With PSS
Without PSS
With MCU PSS
Without PSS
58
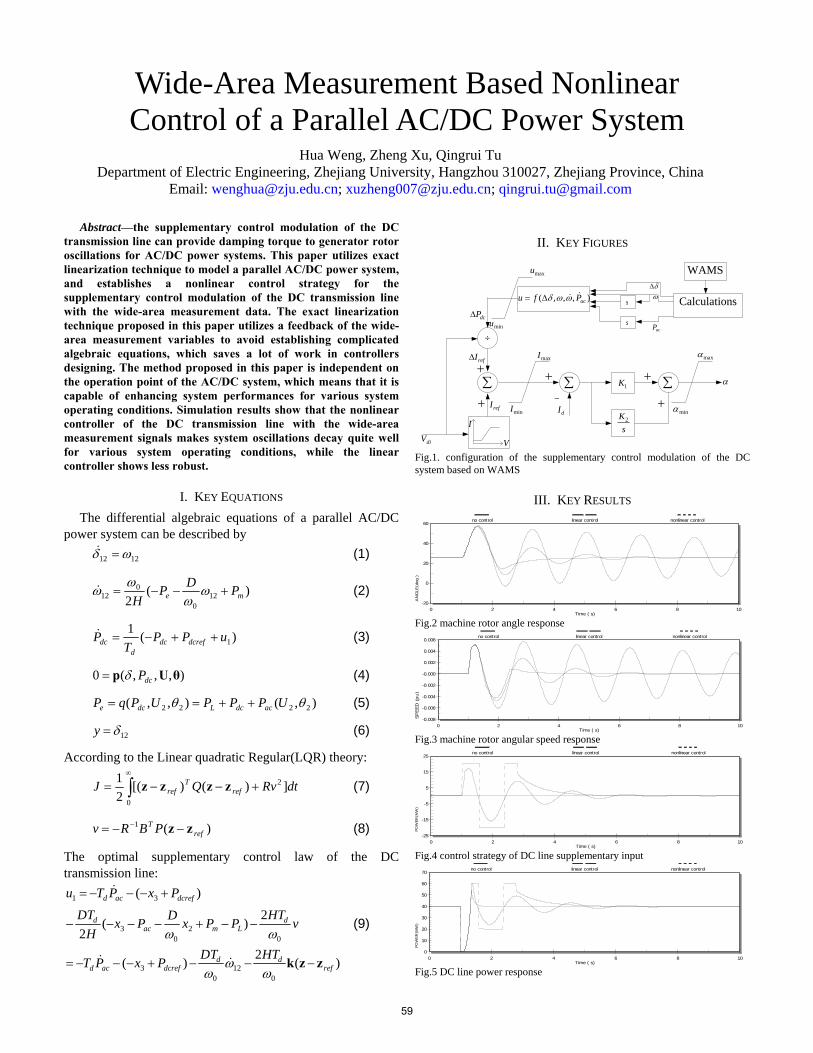
Wide-Area Measurement Based Nonlinear Control of a Parallel AC/DC Power System
Hua Weng, Zheng Xu, Qingrui Tu Department of Electric Engineering, Zhejiang University, Hangzhou 310027, Zhejiang Province, China
Email: [email protected]; [email protected]; [email protected]
Abstract—the supplementary control modulation of the DC transmission line can provide damping torque to generator rotor oscillations for AC/DC power systems. This paper utilizes exact linearization technique to model a parallel AC/DC power system, and establishes a nonlinear control strategy for the supplementary control modulation of the DC transmission line with the wide-area measurement data. The exact linearization technique proposed in this paper utilizes a feedback of the wide-area measurement variables to avoid establishing complicated algebraic equations, which saves a lot of work in controllers designing. The method proposed in this paper is independent on the operation point of the AC/DC system, which means that it is capable of enhancing system performances for various system operating conditions. Simulation results show that the nonlinear controller of the DC transmission line with the wide-area measurement signals makes system oscillations decay quite well for various system operating conditions, while the linear controller shows less robust.
I. KEY EQUATIONS The differential algebraic equations of a parallel AC/DC
power system can be described by (1) 1212
)(2 12
0
012 me PDP
H
(2)
)(11uPP
TP dcrefdc
ddc (3)
),,,(0 θUp dcP (4)
),(),,( 2222 UPPPUPqP acdcLdce (5)
12y (6)
According to the Linear quadratic Regular(LQR) theory:
dtRvQJ refT
ref ])()[(21 2
0
zzzz (7)
(8) )(1ref
T PBRv zz
The optimal supplementary control law of the DC transmission line:
)(2)(
2)(2
)(
012
03
02
03
31
refdd
dcrefacd
dLmac
d
dcrefacd
HTDTPxPT
vHTPPxDPxH
DT
PxPTu
zzk
(9)
II. KEY FIGURES
I
VdiV
refI
refI
dcP
1K
sK2
maxI
minI
max
min
),,,( acPfu
acPs
s
maxu
minu
dI
WAMS
Calculations
Fig.1. configuration of the supplementary control modulation of the DC
III. KEY R
system based on WAMS
ESULTS
-20
0
20
40
60
0 2 4 6 8 10Time ( s)
AN
GLE
(deg
)
ontrol linear controlno c nonlinear control
Fig.2 machine rotor angle response
-0.008
-0.006
-0.004
-0.002
-0.000
0.002
0.004
0.006
0 2 4 6 8 10
SP
EE
D (
pu
)
Time (
no control linear control
s)
nonlinear control
e
Fig.3 machine rotor angular speed respons
-25
-15
-5
5
15
25
0 2 4 6 8 10
R (M
W)
Time ( s)
POW
E
no control linear control nonlinear control
Fig.4 control strategy of DC line supplementary input
0
10
20
30
40
50
60
70
0 2 4 6 8 10
POW
ER (M
W)
Time ( s)
no control linear control nonlinear control
Fig.5 DC line power response
59

Loading Effects on Nonlinear Observability Measurement for Shipboard Power Systems
Juan C. Jimenez and Chika O. Nwankpa Center for Electric Power Engineering, Department of Electrical and Computer Engineering, Drexel University
Philadelphia, PA 19104, USA, Email: [email protected] and [email protected]
Abstract— Existing observability formulations for power systems either evaluate the topology of the system and its embedded sensors or focus on the determination of the state-estimation problem using nonlinear algebraic equations of the system. In either case, the underlying assumption is that the system is at an equilibrium point, and the observability determination relates to the particular equilibrium point in question. Therefore, the observability condition of the system cannot be monitored during perturbations around the system equilibrium points, and existing formulations do not account for the nonlinear dynamics of the system. A simplified model of a shipboard power system that incorporates machines and power electronics converter dynamics is developed and the observability formulation as applied to this system model investigated. A measure of observability is presented through different case studies were loading condition effects are analyzed. This ultimately will lead to the development of system observers for dynamic state estimation and nonlinear control techniques, giving the power system designer/operator the ability to acquire knowledge related to the state of the system during transitions from the desired operating points.
I. KEY EQUATIONS
The general model used to investigate power system dynamics is that of the Differential Algebraic Equations (DAE) type in (1):
( , , )
( , )
F x x N Bu
p h x N
(1)
The observability formulation derived from (1) is given in terms of the Jacobian:
x x wO
x x w
G G GJ
H H H
(2)
Using (2), the system is observable if the following two conditions hold:
1: ( )
2 : ( ) is constant rank on S
x wO
x w
O
G Grank J n rank
H H
rank J
(3)
The condition number of the observability Jacobian is the metric used to measure how observable the system is and it is defined as:
max
min
o
o
J
J
(4)
II. KEY FIGURES
1LiBus #1
3V
11 GG
1eP
1L
3L
4L
1v
2Li
4Li
3Li
2C
4C
3C
1C
4Ci
2Ci
3Ci
2eP
2v
4v
5v
22 GG
Bus #2
Bus #4
Bus #5
Bus #3
4
,pump pump
L
P
i
3
,PM PM
L
P
i
1R
3R
4R
2R2L
Figure 1. Equivalent dc multiconverter shipboard power system
III. KEY RESULTS 0
0
PM
pump
PM PM
pump pump
ΔωPM = 0.003 Δωpump = 0.007
0 20 40 60 80 100 120
0.8
1
1.2
1.4
v4,
v5 in
pu
Bus Voltage
v4
v5
0 20 40 60 80 100 1200
10
20
30
40Condition Number
hMAX=33.03 αMAX=120
ΔωPM = 0.007 Δωpump = 0.003
0 10 20 30 40 50 60 70 80 90 100
0.8
1
1.2
1.4
v4,
v5
in p
u
Bus Voltage
v4
v5
0 10 20 30 40 50 60 70 80 90 1000
10
20
30Condition Number
hMAX =27.83 αMAX =98 Figure 2. Vα and hα curves for different loading conditions
0 20 40 60 80 100 120 140
10
15
20
25
30
35
40
45
50
Condition Number
PM=0.001,pump=0.009
PM=0.002,pump=0.008
PM=0.003,pump=0.007
PM=0.004,pump=0.006
PM=0.005,pump=0.005
PM=0.006,pump
=0.004
PM=0.007,pump
=0.003
PM=0.008,pump=0.002
PM=0.009,pump=0.001
Figure 3. Family of hα curves
60

Abstract—The accuracy of distribution system analysis
depends on precision of component models. One of the
components is the distribution line for which different
methods have been developed starting with the
Carson’s equations and approximating the integrals
involved. This research work compares these different
methods for voltages and line flows by utilizing the
impedances obtained in an unbalanced power flow analysis for IEEE 13 node system.
Proliferation of renewable generation like photovoltaic
and wind generation in distribution system creates
frequency deviations under islanded operation due to
their variable nature. Similarly, a microgrid that is a
group of loads and distributed energy sources including
renewable sources is subjected to frequency deviations.
In this research work, optimized control parameters of
renewable sources, Distributed Generation (DG) units,
and Energy Storage Systems (ESS) are obtained using
differential evolution algorithm for frequency
stabilization. Results are presented for a microgrid
system with photovoltaic, wind, diesel generators and
Energy Storage Systems along with Fuel Cell and Aqua Electrolyzer.
I. KEY EQUATIONS
The original integral equations of Carson’s method
for impedance calculation are given by
0
2 2
0
2 2
2
20
2ln ( ) (1)
2
( )ln ( ) (2)
2 ( )
cos( ) (3)/
p
s
s s
k m
m m
k m
h
s s s
hZ j j J
r
h h dZ j j J
h h d
where
eJ P jQ d d
j
λ
µ µω ω
π π
µ µω ω
π π
λ λλ λ ωµ ρ
−∞
= + Ω
+ += + Ω
− +
= + =+ +
∫
( )
20cos( ) (4)
/
k mh h
m m m
eJ P jQ d d
j
λ
λ λλ λ ωµ ρ
− +∞
= + =+ +
∫
For the load frequency control the microgrid system
considered in this paper is shown in Fig. 1. Power balance equation for this system is given by
(5)s wtg g pv fc r
P P P P P P= + + + −
II. KEY FIGURES
Fig. 1. Configuration of the model microgrid
III. KEY RESULTS
Fig. 2.Power flow results for node voltage in pu with Carson's full
and six different approximation methods in IEEE 13-node system.
Fig. 3.Power flow and frequency response of one of the microgrid
cases.
650 633 671 645 646 692 675 611 652 670 632 680 6840.9
0.92
0.94
0.96
0.98
1
1.02
1.04
Nodes
Vo
ltag
e (
pu
)
Node Voltage (PhaseB) (pu)
Full Carson
Modified CarsonAlvaradoDeriNoda
PizzaroDubanton
Comparison of Different Methods for Impedance Calculation
and Load Frequency Control in Microgrid
Hessam Keshtkar, Graduate Student Member, IEEE, Jignesh Solanki, Member, IEEE and Sarika
Khushalani Solanki, Member, IEEE
[email protected] and [email protected]
Lane Department of Computer Science and Electrical Engineering, West Virginia University Morgantown, WV 26505, USA
61

Abstract—In current electricity markets, ISOs are increasing
the level of capacity and spinning reserve to compensate for the
uncertainty of wind power. Obviously, it is not a sustainable
method. Providing adequate power/energy by high power density
energy storage devices is becoming more and more realizable.
Since wind plants have no obligation to install such an expensive
energy storage device, it is better to create an energy storage
options market and enable ISOs to manage it. This paper
analyzes the economic dispatch problem on both day ahead and
real time market considering the energy storage options. For
fairness, it is assumed a penalty mechanism if wind generation
does not meet its commitment. The ED problem is coordinating
with the Energy Storage Device Owners (ESDOs) through
bidding curve on options. It is expected that the energy storage
options market would significantly reduce the requirement of
reserves, thus reducing the cost for overall system. Lastly, this
paper gives simulation results based on modifications of IEEE
Reliability Test System 1996.
I. KEY EQUATIONS
Day ahead market modeling
With the introduction of wind power generation, the energy
balance equation is shown in equation 1.
∑ ∑
Where (i= ) represents the output of
non-dispatchable wind generation, (i=1,…, ) represents
the ith thermal unit generation. In this paper, we assume the
new market mechanism allows ISOs to buy call options from
energy storage device owners (ESDOs). When the wind power
is unable to fulfill the commitment, the operator can exercise
the call options to balance the system. At the day ahead market,
the unit commitment model for this mechanism is
min ∑ ∑ ) ∑ )
)
s.t
∑ ∑
∑ ∑
∑
) )
where: (i= ) represents the expected
value of , represents the volume of the contract
between ISO and the ith
ESDO at time t, i.e., the ESDO is
responsible for providing active power if the ISO
exercises the option. is the probability that the left side
of equation (3). is 1 if the ith
thermal unit is committed at
time t and 0 otherwise, is 1 if the ISO determines to buy the
call option from the ith ESDO. If the option is not exercised,
then the ESDO’s revenue at time t would be )
(standby cost), otherwise the option would be exercised and the
revenue at would be ) (exercise cost). ) is the
cost for the ith
thermal generator at time t if the thermal unit is
generating . The objective is to minimize the cost for
thermal units and energy storage call options over time.
Real time market modeling
There are two differences between day ahead market and
balancing market: (1) the wind farm would have a much more
reliable forecast of available wind power output for the short
term (minute to hour) that will determine the needs of the
balancing market; (2) the operator has the information that he
needs to determine whether the options should be exercised.
The objective function for real time market is:
min ∑ ) ∑ )
∑ )
is the controllable variable, it is 1 if at time t the ISO
exercises the option and exchange active power with
ESDO, and 0 otherwise. The constraint is:
i=1,2…
Other constraints are the same. In order to get ) and
), a bidding curve should be provided by ESDOs,
whose optimal bidding strategy is to maximize the revenue.
For fairness, the market design also considers the wind plant
penalty if it fails to meet the commitment, i.e., penalty price
times the short of power provided by wind farm.
The overall market design for storage is:
GENCOs
ISO
FERC
DISCOs
TRANSCOs
WINDGEN
ENERGY
STORAGE
OPTION
Demand Bids
Power Allocation
Generation BidsGeneration
Bids Power Allocation
Option Bids
Option Exercise
Reliability Regulation
Penalty
Arbitrage-Free Energy Storage Options Market Mechanism for
Wind Power Integration
Zhenyu Tan, Student Member, IEEE, and A. P. Meliopoulos, Fellow, IEEE
62

Inventory and Evolution of Member Communication in a Volunteer Organization
Helping PES Better Disseminate Information to its Members
Laurie Stewart #*,Dr. Sarah Riforgiate#, Dr. Noel N. Schulz* Department of Communication Studies#
Department of Electrical & Computer Engineering* Kansas State University
Manhattan, KS [email protected]
Abstract— IEEE PES is a growing organization that seeks “to be the leading provider of scientific and engineering information on electric power and energy for the betterment of society, and the preferred professional development source for our members” (PES website). To accomplish this mission, it is critical that communication is effective and clear between staff, volunteer leadership, and members. As PES has grown and changed over the years, its communication practices have evolved as well. A shift from relying on face-to-face communication to virtual communication has made identifying and implementing new technology a necessity if the organization wants to continue to thrive. Email, conference calls, online communities, Twitter, Facebook, and LinkedIn are among the technologies used in PES. Understanding how and why people accept new technology gives PES an advantage in selecting which technology they should adopt and implement. Also, understanding how people engage and implement technology allows PES to share information with their members and encourage greater participation. To address these concerns and questions, in 2012, the IEEE PES President, Dr. Noel Schulz and the PES Governing Board have decided to investigate best communication practices to evaluate and improve PES. This poster presentation highlights communication research and theory that is useful in improving how PES and members interact. Specifically, this poster highlights the best practices for communication as they relate to volunteer organizations like PES. Preliminary findings on the use of new technologies among PES members and practical implications for technology use will be explored. Keywords- communication; volunteer organization; technology
63

Network Robustness of Large Power Systems
Ricardo Moreno
School of Engineering, Universidad de Los Andes,
Bogotá, Colombia
Alvaro Torres
School of Engineering, Universidad de Los Andes,
Bogotá, Colombia
Abstract— while the topology information is, in principle, simple
to understand, the determination of a global robustness criterion
is more complicated. This paper provides a global criterion to
quantify the topological robustness of power system grids based
on the development of a graph theoretic approach to capture the
topological structure of power system grids using appropriately
matrices that identify properties of power networks. The
robustness criterion deduced in this paper provides useful
information to deal with a range of problems in the context of
transmission system expansion.
Keywords:robustness, graph theory, complex networks.
I. INTRODUCTION
The backbone of the power system grid is the transmission system that allows the interconnection between demand and generation resources to perform the function of supplying electric energy. This paper is focused on the network topology in order to quantify the global robustness of the power system grid. Topological properties are deduced from a precise mathematical formulation using graph theoretical concepts.
In recent years, the study of complex networks has attracted a lot of attention in the research community [1], [2]. The study of the power system grid structure allows the identification of complex network characteristics and to have a deeper insight in the behavior of the networks.
While the topology information is, in principle, simple to understand, the determination of a global robustness criterion is more complicated. A first problematic issue lies in the appropriately definition of robustness considering different topological structures. The structure of each power system network in each is determined by two factors, first, the location of generation centers (and the inclusion of dependent location resources as renewables resources), second, the location of load centers such as several main cities.
This paper provides a global criterion to quantify the robustness of power system grids based on the development of a graph theoretic approach to capture the topological structure of power system grids using appropriately matrices that identify topological properties of power networks. The focus of this paper is on the spectral information of power system networks based on the topological characterization of it. Spectral graph theory is a mathematical study of the spectral of matrices that allow the mathematical characterization of networks such as connectivity, the diameter of a graph, clustering coefficients, the expansion, the resilience, the
betweenness among nodes and some more. The spectral information deduced from the topological characterization serves to deal with a range of problems.
II. POWER SYSTEM NETWORK AND ITS ASSOCIATED
GRAPH
We focus on the quantification of the robustness of the power system networks considering the topological structure. For this purpose, it suffices consider the graph model of the power system because it provides a convenient tool for the investigation of structural properties. To make the analysis concrete, we consider a power system consisting of 1N
buses and T lines. We denote by 0 1 N, ,...,V the set of
network nodes and by T1 2, ,...,L the set of
transmission lines and transformers that connect the elements
in the set V . We associate the undirected graph ,G V L
with the power system network. The graph G has the set of
vertices V and the set of edges L .
III. PREPARE YOUR PAPER BEFORE STYLING
To start out, since robustness is closely related to connectivity of the network it’s relevant to include the connectivity property to define a quantification parameter of the robustness. The connectivity property is important but not enough to define precisely the robustness because, in fact, the power system grid is connected, probably weakly connected, and then the paths between some of the nodes may be too long to provide adequate connection. Therefore, the accurately definition of robustness includes a parameter about the extension of the network. For a graph G
associated with the
power system grid with 1N and T lines, the average degree
is given by,
adg
2Td
N +1. (3)
REFERENCES
[1] A.L. Barabasi. Linked, The New Science of Networks.
Perseus, Cambridge, MA, April 2002.
[2] D.J. Watts. Small World, The Dynamics of Networks
between Order and Randomness. Princeton University Press,
Princeton, New Jersey, 1999.
64
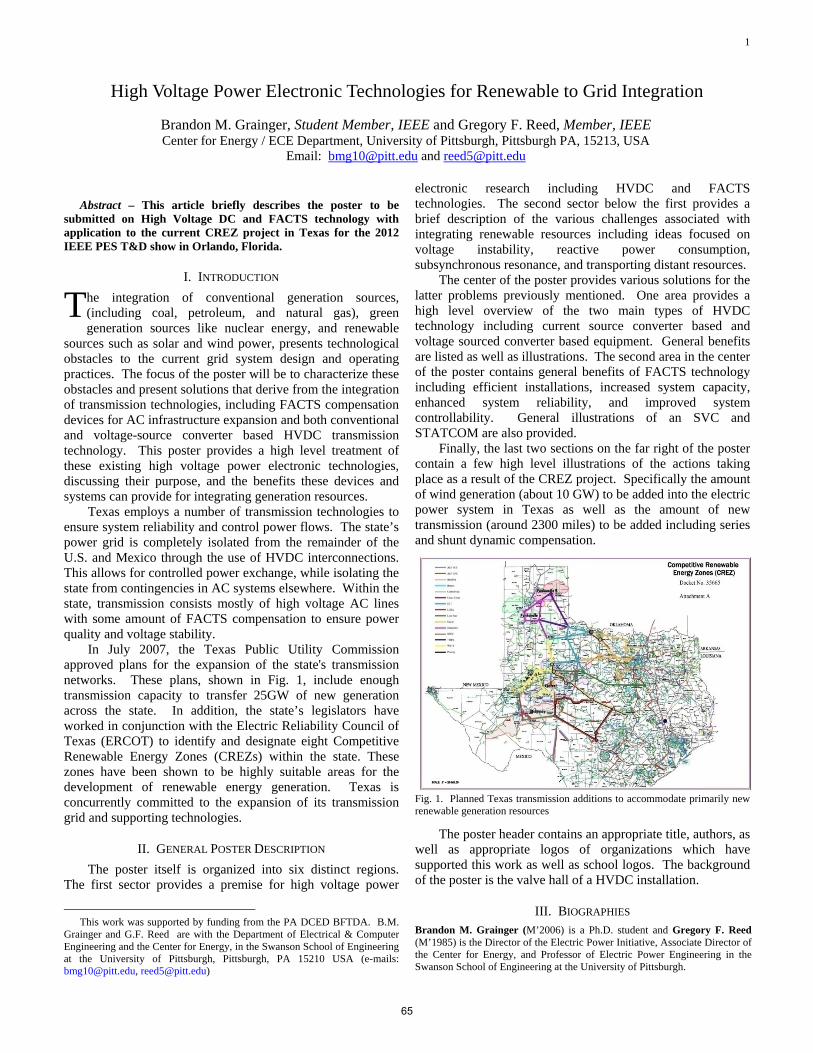
1
Abstract – This article briefly describes the poster to be
submitted on High Voltage DC and FACTS technology with application to the current CREZ project in Texas for the 2012 IEEE PES T&D show in Orlando, Florida.
I. INTRODUCTION he integration of conventional generation sources, (including coal, petroleum, and natural gas), green generation sources like nuclear energy, and renewable
sources such as solar and wind power, presents technological obstacles to the current grid system design and operating practices. The focus of the poster will be to characterize these obstacles and present solutions that derive from the integration of transmission technologies, including FACTS compensation devices for AC infrastructure expansion and both conventional and voltage-source converter based HVDC transmission technology. This poster provides a high level treatment of these existing high voltage power electronic technologies, discussing their purpose, and the benefits these devices and systems can provide for integrating generation resources.
Texas employs a number of transmission technologies to ensure system reliability and control power flows. The state’s power grid is completely isolated from the remainder of the U.S. and Mexico through the use of HVDC interconnections. This allows for controlled power exchange, while isolating the state from contingencies in AC systems elsewhere. Within the state, transmission consists mostly of high voltage AC lines with some amount of FACTS compensation to ensure power quality and voltage stability.
In July 2007, the Texas Public Utility Commission approved plans for the expansion of the state's transmission networks. These plans, shown in Fig. 1, include enough transmission capacity to transfer 25GW of new generation across the state. In addition, the state’s legislators have worked in conjunction with the Electric Reliability Council of Texas (ERCOT) to identify and designate eight Competitive Renewable Energy Zones (CREZs) within the state. These zones have been shown to be highly suitable areas for the development of renewable energy generation. Texas is concurrently committed to the expansion of its transmission grid and supporting technologies.
II. GENERAL POSTER DESCRIPTION The poster itself is organized into six distinct regions.
The first sector provides a premise for high voltage power
This work was supported by funding from the PA DCED BFTDA. B.M.
Grainger and G.F. Reed are with the Department of Electrical & Computer Engineering and the Center for Energy, in the Swanson School of Engineering at the University of Pittsburgh, Pittsburgh, PA 15210 USA (e-mails: [email protected], [email protected])
electronic research including HVDC and FACTS technologies. The second sector below the first provides a brief description of the various challenges associated with integrating renewable resources including ideas focused on voltage instability, reactive power consumption, subsynchronous resonance, and transporting distant resources.
The center of the poster provides various solutions for the latter problems previously mentioned. One area provides a high level overview of the two main types of HVDC technology including current source converter based and voltage sourced converter based equipment. General benefits are listed as well as illustrations. The second area in the center of the poster contains general benefits of FACTS technology including efficient installations, increased system capacity, enhanced system reliability, and improved system controllability. General illustrations of an SVC and STATCOM are also provided.
Finally, the last two sections on the far right of the poster contain a few high level illustrations of the actions taking place as a result of the CREZ project. Specifically the amount of wind generation (about 10 GW) to be added into the electric power system in Texas as well as the amount of new transmission (around 2300 miles) to be added including series and shunt dynamic compensation.
Fig. 1. Planned Texas transmission additions to accommodate primarily new renewable generation resources
The poster header contains an appropriate title, authors, as well as appropriate logos of organizations which have supported this work as well as school logos. The background of the poster is the valve hall of a HVDC installation.
III. BIOGRAPHIES Brandon M. Grainger (M’2006) is a Ph.D. student and Gregory F. Reed (M’1985) is the Director of the Electric Power Initiative, Associate Director of the Center for Energy, and Professor of Electric Power Engineering in the Swanson School of Engineering at the University of Pittsburgh.
High Voltage Power Electronic Technologies for Renewable to Grid Integration
Brandon M. Grainger, Student Member, IEEE and Gregory F. Reed, Member, IEEE Center for Energy / ECE Department, University of Pittsburgh, Pittsburgh PA, 15213, USA
Email: [email protected] and [email protected]
T
65
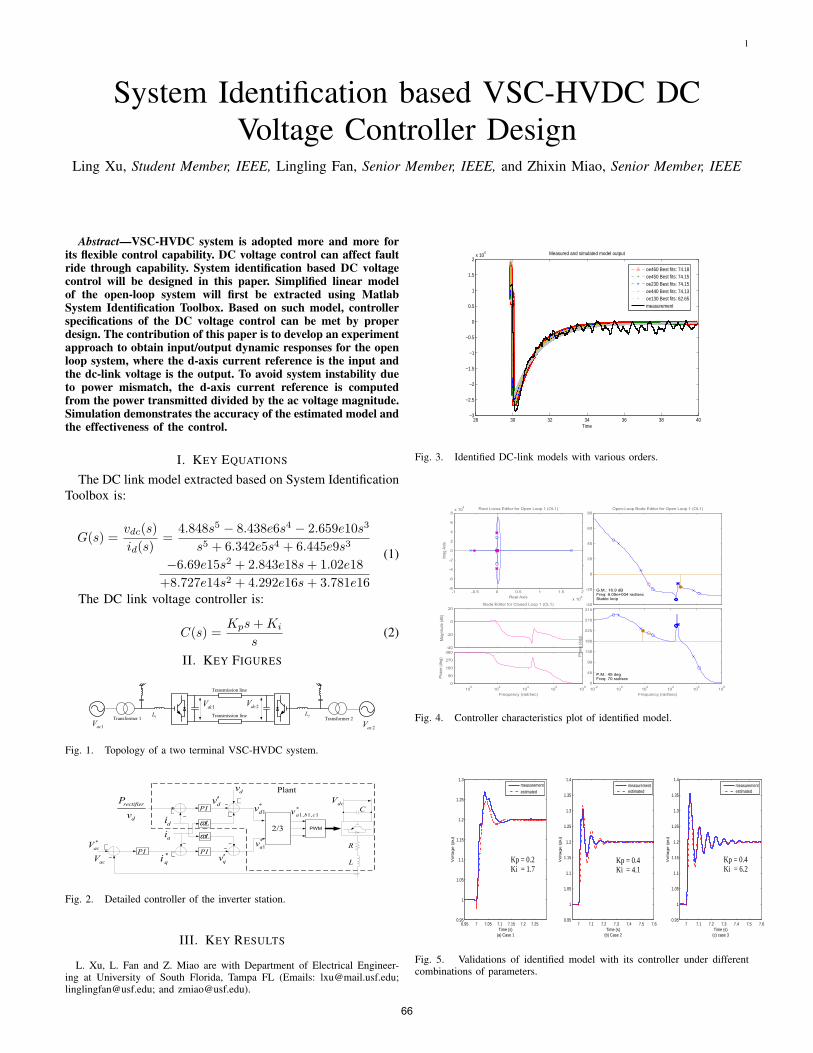
1
System Identification based VSC-HVDC DCVoltage Controller Design
Ling Xu, Student Member, IEEE, Lingling Fan, Senior Member, IEEE, and Zhixin Miao, Senior Member, IEEE
Abstract—VSC-HVDC system is adopted more and more forits flexible control capability. DC voltage control can affect faultride through capability. System identification based DC voltagecontrol will be designed in this paper. Simplified linear modelof the open-loop system will first be extracted using MatlabSystem Identification Toolbox. Based on such model, controllerspecifications of the DC voltage control can be met by properdesign. The contribution of this paper is to develop an experimentapproach to obtain input/output dynamic responses for the openloop system, where the d-axis current reference is the input andthe dc-link voltage is the output. To avoid system instability dueto power mismatch, the d-axis current reference is computedfrom the power transmitted divided by the ac voltage magnitude.Simulation demonstrates the accuracy of the estimated model andthe effectiveness of the control.
I. KEY EQUATIONS
The DC link model extracted based on System IdentificationToolbox is:
G(s) =vdc(s)
id(s)=
4.848s5 − 8.438e6s4 − 2.659e10s3
s5 + 6.342e5s4 + 6.445e9s3
−6.69e15s2 + 2.843e18s+ 1.02e18
+8.727e14s2 + 4.292e16s+ 3.781e16
(1)
The DC link voltage controller is:
C(s) =Kps+Ki
s(2)
II. KEY FIGURES
Transmission line
Transmission line
1dcV
2dcV
2L
2acV
1L
1acV
Transformer 1 Transformer 2
Fig. 1. Topology of a two terminal VSC-HVDC system.
PWM2/3
PI
dv
*
1dv
*
1qv
*
1, 1, 1a b cvdv′
qv′*
qi
di
qi
R
L
CdcV
Lω
−
+
PI−
−
+−
+−
Lω
PI
*
acV +−
acV
+Plant
rectifier
d
P
v
Fig. 2. Detailed controller of the inverter station.
III. KEY RESULTS
L. Xu, L. Fan and Z. Miao are with Department of Electrical Engineer-ing at University of South Florida, Tampa FL (Emails: [email protected];[email protected]; and [email protected]).
28 30 32 34 36 38 40−3
−2.5
−2
−1.5
−1
−0.5
0
0.5
1
1.5
2x 10
4
Time
Measured and simulated model output
oe460 Best fits: 74.18oe450 Best fits: 74.15oe230 Best fits: 74.15oe440 Best fits: 74.13oe130 Best fits: 62.65measurement
Fig. 3. Identified DC-link models with various orders.
100
102
104
106
108
0
90
180
270
360
Frequency (rad/sec)
Ph
ase
(d
eg
)
-40
-20
0
20Bode Editor for Closed Loop 1 (CL1)
Ma
gn
itud
e (
dB
)
10-2
100
102
104
106
108
0
45
90
135
180
225
270
315
P.M.: 45 deg Freq: 70 rad/sec
Frequency (rad/sec)
Ph
ase
(d
eg
)
-40
-20
0
20
40
60
80
G.M.: 16.9 dB Freq: 6.05e+004 rad/secStable loop
Open-Loop Bode Editor for Open Loop 1 (OL1)
Ma
gn
itud
e (
dB
)
-1 -0.5 0 0.5 1 1.5 2
x 106
-8
-6
-4
-2
0
2
4
6
8x 10
4 Root Locus Editor for Open Loop 1 (OL1)
Real Axis
Ima
g A
xis
Fig. 4. Controller characteristics plot of identified model.
6.95 7 7.05 7.1 7.15 7.2 7.250.95
1
1.05
1.1
1.15
1.2
1.25
1.3
Time (s)(a) Case 1
Vo
lta
ge
(p
u)
7 7.1 7.2 7.3 7.4 7.5 7.60.95
1
1.05
1.1
1.15
1.2
1.25
1.3
1.35
1.4
Time (s)(c) case 3
Vo
lta
ge
(p
u)
7 7.1 7.2 7.3 7.4 7.5 7.60.95
1
1.05
1.1
1.15
1.2
1.25
1.3
1.35
1.4
Time (s)(b) Case 2
Vo
lta
ge
(p
u)
measurementestimated
measurementestimated
measurementestimated
Kp = 0.2Ki = 1.7
Kp = 0.4Ki = 4.1
Kp = 0.4Ki = 6.2
Fig. 5. Validations of identified model with its controller under differentcombinations of parameters.
66
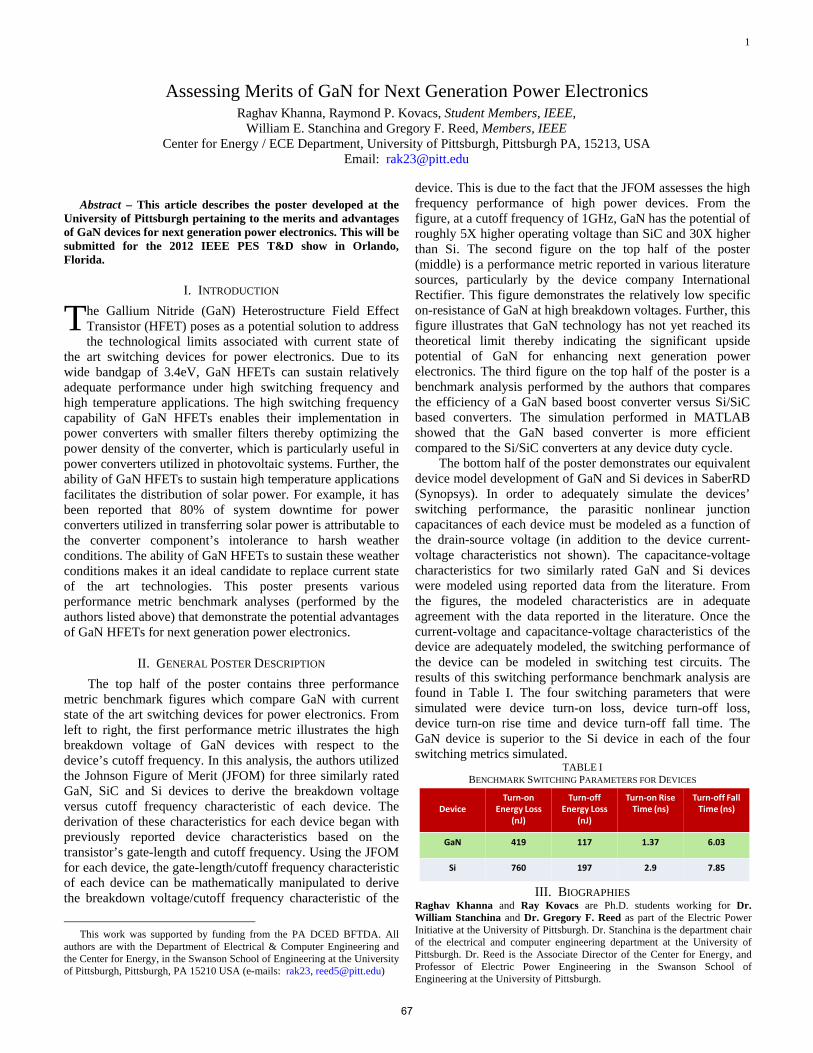
1
Abstract – This article describes the poster developed at the
University of Pittsburgh pertaining to the merits and advantages of GaN devices for next generation power electronics. This will be submitted for the 2012 IEEE PES T&D show in Orlando, Florida.
I. INTRODUCTION he Gallium Nitride (GaN) Heterostructure Field Effect Transistor (HFET) poses as a potential solution to address the technological limits associated with current state of
the art switching devices for power electronics. Due to its wide bandgap of 3.4eV, GaN HFETs can sustain relatively adequate performance under high switching frequency and high temperature applications. The high switching frequency capability of GaN HFETs enables their implementation in power converters with smaller filters thereby optimizing the power density of the converter, which is particularly useful in power converters utilized in photovoltaic systems. Further, the ability of GaN HFETs to sustain high temperature applications facilitates the distribution of solar power. For example, it has been reported that 80% of system downtime for power converters utilized in transferring solar power is attributable to the converter component’s intolerance to harsh weather conditions. The ability of GaN HFETs to sustain these weather conditions makes it an ideal candidate to replace current state of the art technologies. This poster presents various performance metric benchmark analyses (performed by the authors listed above) that demonstrate the potential advantages of GaN HFETs for next generation power electronics.
II. GENERAL POSTER DESCRIPTION The top half of the poster contains three performance
metric benchmark figures which compare GaN with current state of the art switching devices for power electronics. From left to right, the first performance metric illustrates the high breakdown voltage of GaN devices with respect to the device’s cutoff frequency. In this analysis, the authors utilized the Johnson Figure of Merit (JFOM) for three similarly rated GaN, SiC and Si devices to derive the breakdown voltage versus cutoff frequency characteristic of each device. The derivation of these characteristics for each device began with previously reported device characteristics based on the transistor’s gate-length and cutoff frequency. Using the JFOM for each device, the gate-length/cutoff frequency characteristic of each device can be mathematically manipulated to derive the breakdown voltage/cutoff frequency characteristic of the
This work was supported by funding from the PA DCED BFTDA. All
authors are with the Department of Electrical & Computer Engineering and the Center for Energy, in the Swanson School of Engineering at the University of Pittsburgh, Pittsburgh, PA 15210 USA (e-mails: rak23, [email protected])
device. This is due to the fact that the JFOM assesses the high frequency performance of high power devices. From the figure, at a cutoff frequency of 1GHz, GaN has the potential of roughly 5X higher operating voltage than SiC and 30X higher than Si. The second figure on the top half of the poster (middle) is a performance metric reported in various literature sources, particularly by the device company International Rectifier. This figure demonstrates the relatively low specific on-resistance of GaN at high breakdown voltages. Further, this figure illustrates that GaN technology has not yet reached its theoretical limit thereby indicating the significant upside potential of GaN for enhancing next generation power electronics. The third figure on the top half of the poster is a benchmark analysis performed by the authors that compares the efficiency of a GaN based boost converter versus Si/SiC based converters. The simulation performed in MATLAB showed that the GaN based converter is more efficient compared to the Si/SiC converters at any device duty cycle.
The bottom half of the poster demonstrates our equivalent device model development of GaN and Si devices in SaberRD (Synopsys). In order to adequately simulate the devices’ switching performance, the parasitic nonlinear junction capacitances of each device must be modeled as a function of the drain-source voltage (in addition to the device current-voltage characteristics not shown). The capacitance-voltage characteristics for two similarly rated GaN and Si devices were modeled using reported data from the literature. From the figures, the modeled characteristics are in adequate agreement with the data reported in the literature. Once the current-voltage and capacitance-voltage characteristics of the device are adequately modeled, the switching performance of the device can be modeled in switching test circuits. The results of this switching performance benchmark analysis are found in Table I. The four switching parameters that were simulated were device turn-on loss, device turn-off loss, device turn-on rise time and device turn-off fall time. The GaN device is superior to the Si device in each of the four switching metrics simulated.
TABLE I BENCHMARK SWITCHING PARAMETERS FOR DEVICES
III. BIOGRAPHIES
Raghav Khanna and Ray Kovacs are Ph.D. students working for Dr. William Stanchina and Dr. Gregory F. Reed as part of the Electric Power Initiative at the University of Pittsburgh. Dr. Stanchina is the department chair of the electrical and computer engineering department at the University of Pittsburgh. Dr. Reed is the Associate Director of the Center for Energy, and Professor of Electric Power Engineering in the Swanson School of Engineering at the University of Pittsburgh.
DeviceTurn‐on
Energy Loss (nJ)
Turn‐off Energy Loss
(nJ)
Turn‐on Rise Time (ns)
Turn‐off Fall Time (ns)
GaN 419 117 1.37 6.03
Si 760 197 2.9 7.85
Assessing Merits of GaN for Next Generation Power Electronics Raghav Khanna, Raymond P. Kovacs, Student Members, IEEE,
William E. Stanchina and Gregory F. Reed, Members, IEEE Center for Energy / ECE Department, University of Pittsburgh, Pittsburgh PA, 15213, USA
Email: [email protected]
T
67
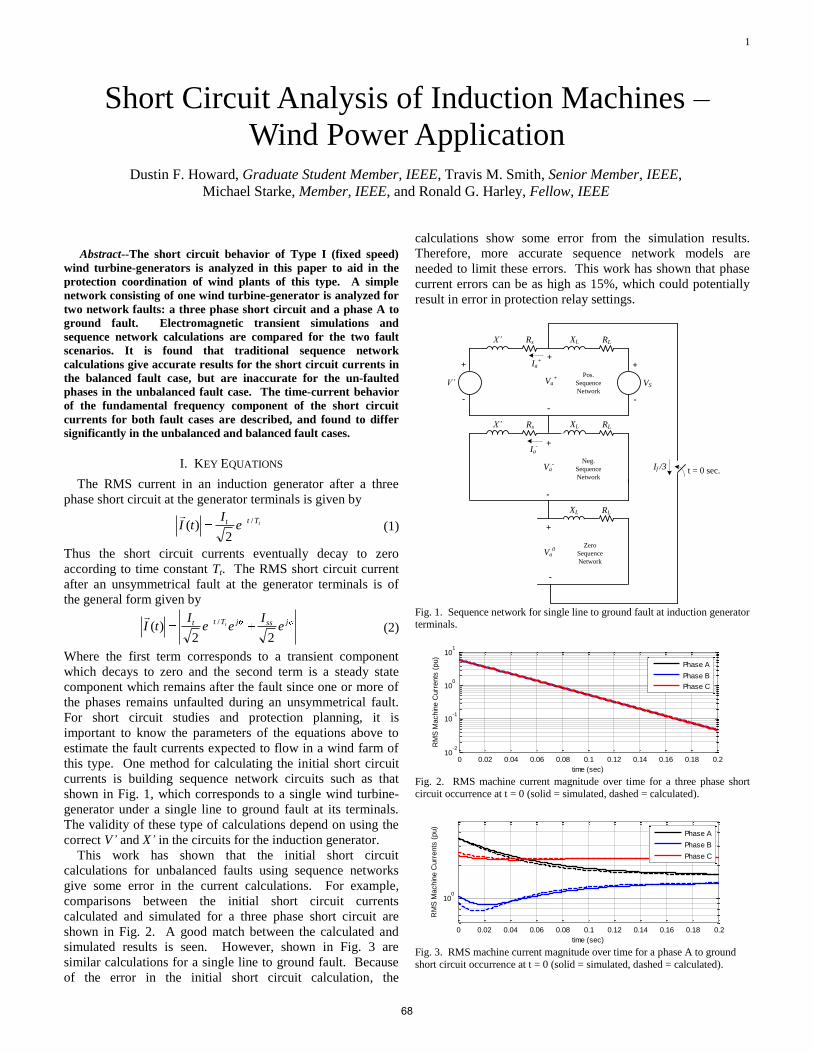
1
Abstract--The short circuit behavior of Type I (fixed speed)
wind turbine-generators is analyzed in this paper to aid in the
protection coordination of wind plants of this type. A simple
network consisting of one wind turbine-generator is analyzed for
two network faults: a three phase short circuit and a phase A to
ground fault. Electromagnetic transient simulations and
sequence network calculations are compared for the two fault
scenarios. It is found that traditional sequence network
calculations give accurate results for the short circuit currents in
the balanced fault case, but are inaccurate for the un-faulted
phases in the unbalanced fault case. The time-current behavior
of the fundamental frequency component of the short circuit
currents for both fault cases are described, and found to differ
significantly in the unbalanced and balanced fault cases.
I. KEY EQUATIONS
The RMS current in an induction generator after a three
phase short circuit at the generator terminals is given by
tTtt eI
tI/
2)(
(1)
Thus the short circuit currents eventually decay to zero
according to time constant Tt. The RMS short circuit current
after an unsymmetrical fault at the generator terminals is of
the general form given by
jssjTtt eI
eeI
tI t
22)(
/
(2)
Where the first term corresponds to a transient component
which decays to zero and the second term is a steady state
component which remains after the fault since one or more of
the phases remains unfaulted during an unsymmetrical fault.
For short circuit studies and protection planning, it is
important to know the parameters of the equations above to
estimate the fault currents expected to flow in a wind farm of
this type. One method for calculating the initial short circuit
currents is building sequence network circuits such as that
shown in Fig. 1, which corresponds to a single wind turbine-
generator under a single line to ground fault at its terminals.
The validity of these type of calculations depend on using the
correct V’ and X’ in the circuits for the induction generator.
This work has shown that the initial short circuit
calculations for unbalanced faults using sequence networks
give some error in the current calculations. For example,
comparisons between the initial short circuit currents
calculated and simulated for a three phase short circuit are
shown in Fig. 2. A good match between the calculated and
simulated results is seen. However, shown in Fig. 3 are
similar calculations for a single line to ground fault. Because
of the error in the initial short circuit calculation, the
calculations show some error from the simulation results.
Therefore, more accurate sequence network models are
needed to limit these errors. This work has shown that phase
current errors can be as high as 15%, which could potentially
result in error in protection relay settings.
Fig. 1. Sequence network for single line to ground fault at induction generator terminals.
Fig. 2. RMS machine current magnitude over time for a three phase short
circuit occurrence at t = 0 (solid = simulated, dashed = calculated).
Fig. 3. RMS machine current magnitude over time for a phase A to ground
short circuit occurrence at t = 0 (solid = simulated, dashed = calculated).
X’ Rs
X’ Rs
VS
+
-
XL RL
XL RL
XL RL
+
-
Va+
+
-
Va-
+
-
Va0
Ia+
Ia-
Pos.
Sequence
Network
Neg.
Sequence
Network
Zero
Sequence
Network
If /3
V’
+
-
t = 0 sec.
0 0.02 0.04 0.06 0.08 0.1 0.12 0.14 0.16 0.18 0.210
-2
10-1
100
101
RM
S M
achin
e C
urr
ents
(pu)
time (sec)
Phase A
Phase B
Phase C
0 0.02 0.04 0.06 0.08 0.1 0.12 0.14 0.16 0.18 0.2
100
RM
S M
achin
e C
urr
ents
(pu)
time (sec)
Phase A
Phase B
Phase C
Short Circuit Analysis of Induction Machines –
Wind Power Application Dustin F. Howard, Graduate Student Member, IEEE, Travis M. Smith, Senior Member, IEEE,
Michael Starke, Member, IEEE, and Ronald G. Harley, Fellow, IEEE
68

Design of a Governor and Voltage Regulator for aLaboratory Generator
Anil KC and Satish J. Ranade
Klipsch School of Electrical and Computer Engineering,New Mexico State University
Las Cruces, NM 88003-8001, USAE-mail: kc,[email protected]
Abstract—Customer driven microgrids are small distributedenergy resources connected to distribution feeder that provideselectricity to customer premises. The penetration of these mod-ular resources provides benefits such as availability of powersupply during disturbances, islanded operation and utilizationof renewable resources. One of the important challenges ofmicrogrid is voltage and frequency control during grid connectedor islanded operation. Microgrids ought to operate stable underfaults and various disturbances. To address these challenges anddevelop solutions a governor and a voltage regulator designhave been proposed and widely used to aid the developmentof microgrid prototype in the laboratory.
A Governor is a proportional controller and a droop speedcontrol scheme is implemented. Governor changes the turbinespeed reference and controls the amount of energy pushed intothe prime mover. An Automatic Voltage Regulator automaticallyadjusts the generator field current to maintain a desired terminalvoltage. The El Paso Electric Power Lab equipped with Lab Voltmachines is used for the operation of DC motor and synchronousgenerator. In particular, motor-generator can be coupled togetherto create a laboratory microgrid.
The turbine or prime mover is simulated using a DC motor.A power electronics based governor is implemented using DC-DC buck converter and PWM controller is generated from theArduino microcontroller based on Atmel processor. Due to theinherent droop characteristic of DC motor a current feedbackis provided so that it behaves as prime mover. The PWM is fedto the buck converter which drives the shaft of the DC motor(prime mover). A PI controller is implemented on software tomake the motor current follow the demanded current from speedcontroller.
A similar hardware design was implemented using a DC-DCbuck converter and PWM controller generated from the Arduinomicrocontroller. The Lab Volt generator bench is equipped with arotor circuit that takes DC inputs. A close loop current controllerfeedback is also provided to make the actual rotor currentfollow a reference current generated from the close loop voltagefeedback. A PI controller is designed on the software to make theactual and required current equal under steady state conditions.
I. KEY FIGURES
Iref
Irotor
Vref Buck
controller
PI
controllerPWM
Load PI
controller
DC inputs
of Rotor
Synchronous
Generator
Vactual
Fig. 1. Block Diagram of Voltage Regulator.
Imotor
ωactual
ωref
Torque
Reference
Power
Reference DC
motor
1/R
Buck
controller
PI
controller
PWM Load
Synchronous
Generator
Fig. 2. Block Diagram of Governor.
69
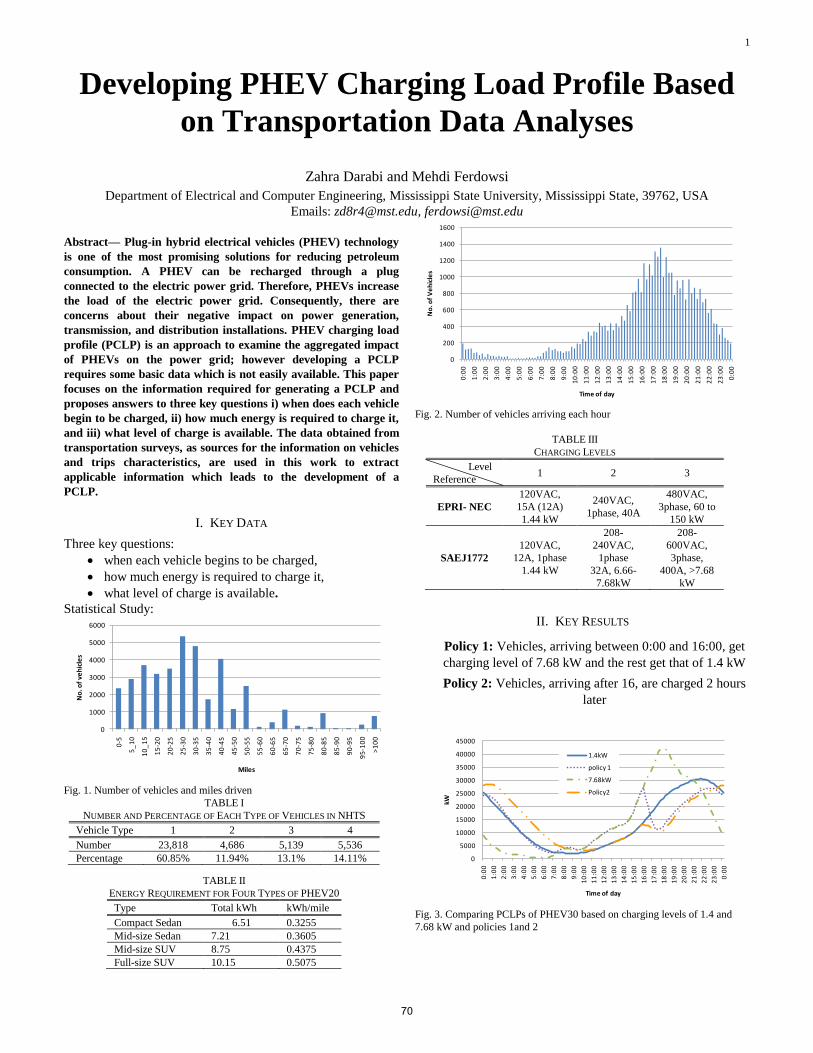
1
Developing PHEV Charging Load Profile Based
on Transportation Data Analyses
Zahra Darabi and Mehdi Ferdowsi
Department of Electrical and Computer Engineering, Mississippi State University, Mississippi State, 39762, USA
Emails: [email protected], [email protected]
Abstract— Plug-in hybrid electrical vehicles (PHEV) technology
is one of the most promising solutions for reducing petroleum
consumption. A PHEV can be recharged through a plug
connected to the electric power grid. Therefore, PHEVs increase
the load of the electric power grid. Consequently, there are
concerns about their negative impact on power generation,
transmission, and distribution installations. PHEV charging load
profile (PCLP) is an approach to examine the aggregated impact
of PHEVs on the power grid; however developing a PCLP
requires some basic data which is not easily available. This paper
focuses on the information required for generating a PCLP and
proposes answers to three key questions i) when does each vehicle
begin to be charged, ii) how much energy is required to charge it,
and iii) what level of charge is available. The data obtained from
transportation surveys, as sources for the information on vehicles
and trips characteristics, are used in this work to extract
applicable information which leads to the development of a
PCLP.
I. KEY DATA
Three key questions:
when each vehicle begins to be charged,
how much energy is required to charge it,
what level of charge is available.
Statistical Study:
0
1000
2000
3000
4000
5000
6000
0-5
5_
10
10
_1
5
15
-20
20
-25
25
-30
30
-35
35
-40
40
-45
45
-50
50
-55
55
-60
60
-65
65
-70
70
-75
75
-80
80
-85
85
-90
90
-95
95
-10
0
>1
00
No
. of
veh
icle
s
Miles
Fig. 1. Number of vehicles and miles driven
0
200
400
600
800
1000
1200
1400
1600
0:0
0
1:0
0
2:0
0
3:0
0
4:0
0
5:0
0
6:0
0
7:0
0
8:0
0
9:0
0
10
:00
11
:00
12
:00
13
:00
14
:00
15
:00
16
:00
17
:00
18
:00
19
:00
20
:00
21
:00
22
:00
23
:00
0:0
0
No
. of
Ve
hic
les
Time of day
Fig. 2. Number of vehicles arriving each hour
II. KEY RESULTS
Policy 1: Vehicles, arriving between 0:00 and 16:00, get
charging level of 7.68 kW and the rest get that of 1.4 kW
Policy 2: Vehicles, arriving after 16, are charged 2 hours
later
0
5000
10000
15000
20000
25000
30000
35000
40000
45000
0:0
0
1:0
0
2:0
0
3:0
0
4:0
0
5:0
0
6:0
0
7:0
0
8:0
0
9:0
0
10
:00
11
:00
12
:00
13
:00
14
:00
15
:00
16
:00
17
:00
18
:00
19
:00
20
:00
21
:00
22
:00
23
:00
0:0
0
kW
Time of day
1.4kW
policy 1
7.68kW
Policy2
Fig. 3. Comparing PCLPs of PHEV30 based on charging levels of 1.4 and
7.68 kW and policies 1and 2
TABLE II
ENERGY REQUIREMENT FOR FOUR TYPES OF PHEV20
Type Total kWh kWh/mile
Compact Sedan 6.51 0.3255
Mid-size Sedan 7.21 0.3605
Mid-size SUV 8.75 0.4375
Full-size SUV 10.15 0.5075
TABLE III
CHARGING LEVELS
Level
Reference 1 2 3
EPRI- NEC
120VAC,
15A (12A)
1.44 kW
240VAC,
1phase, 40A
480VAC,
3phase, 60 to
150 kW
SAEJ1772
120VAC,
12A, 1phase
1.44 kW
208-
240VAC,
1phase
32A, 6.66-
7.68kW
208-
600VAC,
3phase,
400A, >7.68
kW
TABLE I
NUMBER AND PERCENTAGE OF EACH TYPE OF VEHICLES IN NHTS
Vehicle Type 1 2 3 4
Number 23,818 4,686 5,139 5,536
Percentage 60.85% 11.94% 13.1% 14.11%
70

Abstract—This paper presents an advanced time domain model
of a three-phase cycloconverter for Low Frequency alternating
Current (LFAC) transmission systems. The model is based on
the quadratic integration method. The proposed time domain
model has been demonstrated to be accurate, robust, and reliable
as compared to other integration methods such as the trapezoidal
integration. The goal of this paper is to present a realistic model
of a three phase cycloconverter and to integrate this model in an
advanced time domain simulation method for LFAC systems.
Examples of wind farms with LFAC transmission systems are
presented. Furthermore, the proposed method is expected to be
used for transient stability studies, harmonic studies, and fault
studies of wind farms with LFAC transmission systems.
I. KEY EQUATION
The mathematic form of the quadratic integration is illustrated
to the set of general differential equations: BuAxdt
dx (1)
By application of the quadratic integration, the algebraic
companion form is denoted as follows:
(2)
)()(
)()(
htu
B6
h
B24
h5
u
tu
B3
h2B
6
h
B3
hB
24
h
htx
A6
hI
A24
h5I
x
tx
A3
h2A
6
hI
A3
hIA
24
h
mm
where h is the integration time step (interval), I is the identity
matrix, and tm is the mid-point of the integration time step [t-h,
t].
II. MODLE OF CYCLOCONVERTER
This section presents the application of the quadratic
integration to a three-phase six-pulse cycloconverter. This
converter consists of three physical components: three-phase
isolation transformers, electrical switches, and circulating
current circuits as Figure 1.
These physical components are modeled separately by state
differential equations, and the application of quadratic
integration to the equations leads to an algebraic companion
form in terms of voltages and currents at two future points in
time. Standard nodal analysis methods are used to obtain the
algebraic companion form of a three phase six-pulse
cycloconverter from the component algebraic companion
forms.
vaH (t)
vbH (t)
vcH (t)
vaL (t)
vbL (t)
vcL (t)
voL (t)
C1V1 C1V3 C1V5
C1V4 C1V6 C1V2
C1V7 C1V9 C1V11
C1V10 C1V12 C1V8
C2V1 C2V3 C2V5
C2V4 C2V6 C2V2
C2V7 C2V9 C2V11
C2V10 C2V12 C2V8
C3V1 C3V3 C3V5
C3V4 C3V6 C3V2
C3V7 C3V9 C3V11
C3V10 C3V12 C3V8
iaH (t)
ibH (t)
icH (t)
iaL (t)
ibL (t)
i cL (t)
L c L c
L c L c
L c L c
L c L c
L c L c
L c L c Figure 1. Three phase six-pulse cycloconverter.
III. SIMUALATION
The methodology is demonstrated with an example system that includes a LFAC transmission system, which is connected to the equivalent source of an offshore wind farm. The simulations on the LFAC transmission system demonstrate the properties of the quadratic integration over a complex switching subsystem, and realistic three phase six-pulse cycloconverter model can be used for transient stability studies for several applications of LFAC transmission
G
G
Source 1
Source 2
G
Cycloconverter station
50Km 20Hz LFAC Transmission Line
60Hz Transmission Line
DC to 20Hz 20Hz to 60Hz
Figure 2. A LFAC example system
Simulation results show the three-phase voltages and current
at both side of the cycloconverter station of the figure 2 in
steady state. 96.2
-96.20.0
544
-5440.0
55.1
-55.10.0
193.3
-193.30.0
9.00
8.9946.141
46.1408.80 8.834 8.867 8.900 8.933 8.967 9.00
KV
KV
KV
A
A
MW
(a)
(b)
(c)
(d)
(e)
(f)
Figure 3. A LFAC example system
Time Domain Simulation of a Three-Phase
Cycloconverter for LFAC Transmission Systems
Yongnam Cho, Student Member, IEEE, George J. Cokkinides, Senior Member, IEEE, and
A. P. Meliopoulos, Fellow, IEEE
71

Optimizatin of Storage Systems Integration into MVDC in Shipboard Power System(SPS)
Amanuel Kesete*, Noel N. Schulz, Sanjoy Das, Bala Natarajan, Caterina Scoglio
Department of Electrical and Computer Engineering
Kansas State University
Manhattan, KS, USA
*Email: [email protected]
Abstract— Electric storage systems can play very important role in improving quality of service (QOS) in future all-electric ships. Reliable electric power is very critical for smooth operation of ships during normal conditions and survivability of the ships during hostile conditions. This work is aimed at optimizing the integration of battery and ultra-capacitor storage system into the Medium Voltage DC System (MVDC) in Shipboard Power System (SPS). First the models are built and tested before being integrated to the MVDC. The next step is to optimize the integration of the storage systems satisfying constraints like size, weight and volume. Unlike terrestrial systems, ships have very limited space and volume, therefore storage systems have to be optimized satisfying all those constraints. Multi-objective optimization algorithm will be implemented since the objectives are more than two. Battery energy system has high energy density and is used as a backup power source when there is power outage in the ship. Ultra-capacitor storage system is more suitable for handling short time transients or spikes as it has high power density and fast discharging rate. Therefore, the combination of both storage systems is suitable for improving the quality of power supply in future all-electric ships
Keywords: Storage System; Multi-objective
optimization; battery; Ultra-capacitor
This work supported by the United States Office of Naval Research under
grant N00014-10-1-0431 (DEPSCoR program)
72

Optimal Placement of PMUs for Islanding in Sub-
transmission Network
Abderrahmane Elandaloussi, Dr. Noel Schulz, and Dr. Anil Pahwa
Department of Electrical and Computer Engineering, Kansas State University Manhattan, KS USA
[email protected], [email protected], [email protected]
Abstract -- Renewable energy, such as solar and wind
farms, has increased in popularity recently with a
mixture of improved opportunities related to
environmental concerns, decreasing dependence on
petroleum fuel and decreased capital and operational
costs of its technologies. While traditionally the power
system paradigm was to maintain interconnectivity as
much as possible, the increased penetration of various
distributed generation, including wind and solar, is
providing new opportunities to look at operational
cases for intentional islanding or micro-grid
operations. Additionally communications and
controls advances have enabled devices, such as
Phasor Measurement Units (PMUs), to help provide a
real-time snapshot of the power system status
allowing power system personnel to consider islanding
as one of their solutions. Using PMU data to identify
and develop strategies for the real-time operation of
power systems including DG at the sub-transmission
level and below will be important in providing stability
and understanding the impact of renewables on the
systems. This poster will discuss the optimal
placement of PMUs on the sub-transmission level
including strategies for possible islanding of systems
where DG enables micro-grids to maintain reliability.
Discussions will include information on the number of
PMUs and the types of data and analysis needed to
make these decisions.
Keywords: Sub-transmission system; Islanding; PMU
73
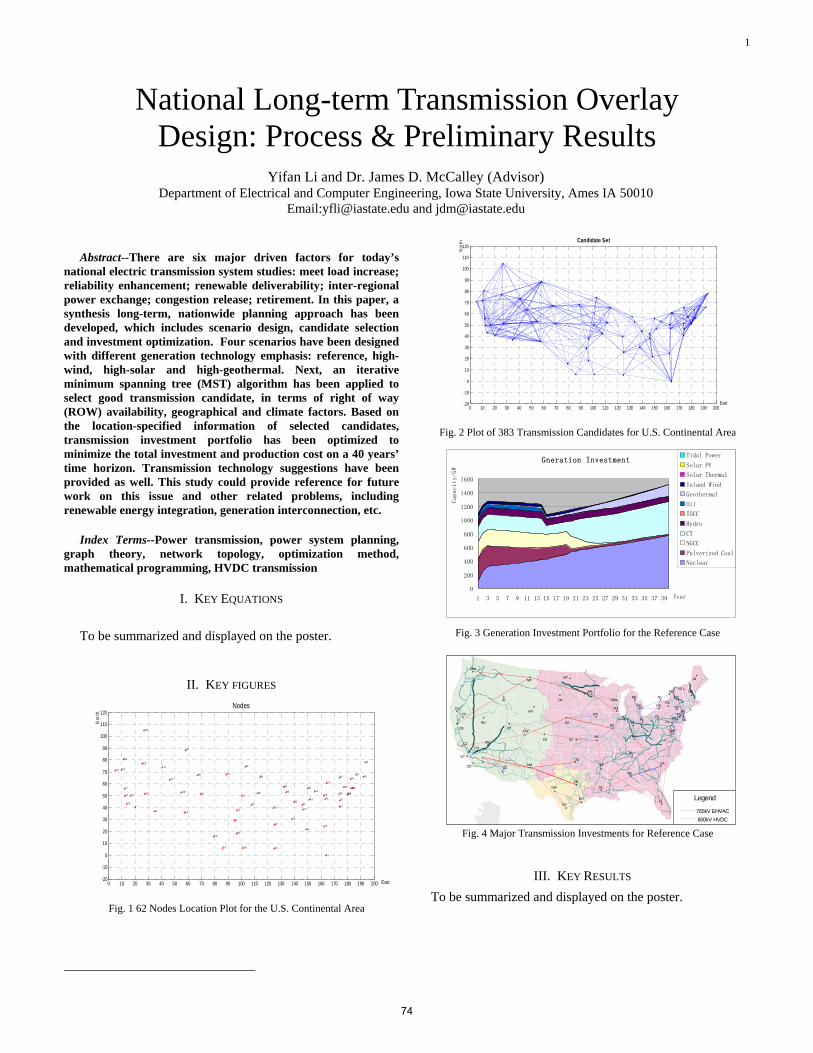
1
National Long-term Transmission Overlay Design: Process & Preliminary Results
Yifan Li and Dr. James D. McCalley (Advisor) Department of Electrical and Computer Engineering, Iowa State University, Ames IA 50010
Email:[email protected] and [email protected]
0 10 20 30 40 50 60 70 80 90 100 110 120 130 140 150 160 170 180 190 200-20
-10
0
10
20
30
40
50
60
70
80
90
100
110
120
East
Nor
th Candidate Set
Abstract--There are six major driven factors for today’s national electric transmission system studies: meet load increase; reliability enhancement; renewable deliverability; inter-regional power exchange; congestion release; retirement. In this paper, a synthesis long-term, nationwide planning approach has been developed, which includes scenario design, candidate selection and investment optimization. Four scenarios have been designed with different generation technology emphasis: reference, high-wind, high-solar and high-geothermal. Next, an iterative minimum spanning tree (MST) algorithm has been applied to select good transmission candidate, in terms of right of way (ROW) availability, geographical and climate factors. Based on the location-specified information of selected candidates, transmission investment portfolio has been optimized to minimize the total investment and production cost on a 40 years’ time horizon. Transmission technology suggestions have been provided as well. This study could provide reference for future work on this issue and other related problems, including renewable energy integration, generation interconnection, etc.
Index Terms--Power transmission, power system planning, graph theory, network topology, optimization method, mathematical programming, HVDC transmission
I. KEY EQUATIONS To be summarized and displayed on the poster.
II. KEY FIGURES
Fig. 1 62 Nodes Location Plot for the U.S. Continental Area
Fig. 2 Plot of 383 Transmission Candidates for U.S. Continental Area
Fig. 3 Generation Investment Portfolio for the Reference Case
Fig. 4 Major Transmission Investments for Reference Case
III. KEY RESULTS To be summarized and displayed on the poster.
0 10 20 30 40 50 60 70 80 90 100 110 120 130 140 150 160 170 180 190 200-20
-10
0
10
20
30
40
50
60
70
80
90
100
110
120
NW
CN
C B CV
CZ
L P
CD
CS
I I
AZ
SN
N NI D
UT
MT
WY
C W
N M
C E
DK
S4
S2
S1
ENEW
ES EH S3
ET
SE
F L
M7
M6
M3
M8
AEM1
P3
M2
M5F E
P1
CI
KY
T V
CA
P2
P4
P7
P8 P5P6 N5
N6NSN4N 1
N2 N3NT
NE
NI
East
Nor
th
Nodes
NW
CNCV
CB
ID
MT
WY
M7
DK
S4
S2CE
CWUT
NN
SN
NMAZ
M6
M3
AE
ETS1
S3
M8
EN
EH
EW
ES
CZCS
IICD
LP
P3
M1
M2
FL
SE
CA
TV
KY
CIP1
M5
FE
P4
P7P2 P5
N5N6
NSP8
P6N1
N2N3
N4
NI
NTNE
Legend
765kV EHVAC800kV HVDC
Gneration Investment
0
200
400
600
800
1000
1200
1400
1600
1 3 5 7 9 11 13 15 17 19 21 2 25 27 29 31 33 35 37 39 Year
Capacity/GW
Tidal Power
Solar PV
Solar Thermal
Inland Wind
Geothermal
Oil
IGCC
Hydro
CT
NGCC
Pulverized Coal
Nuclear
3
74
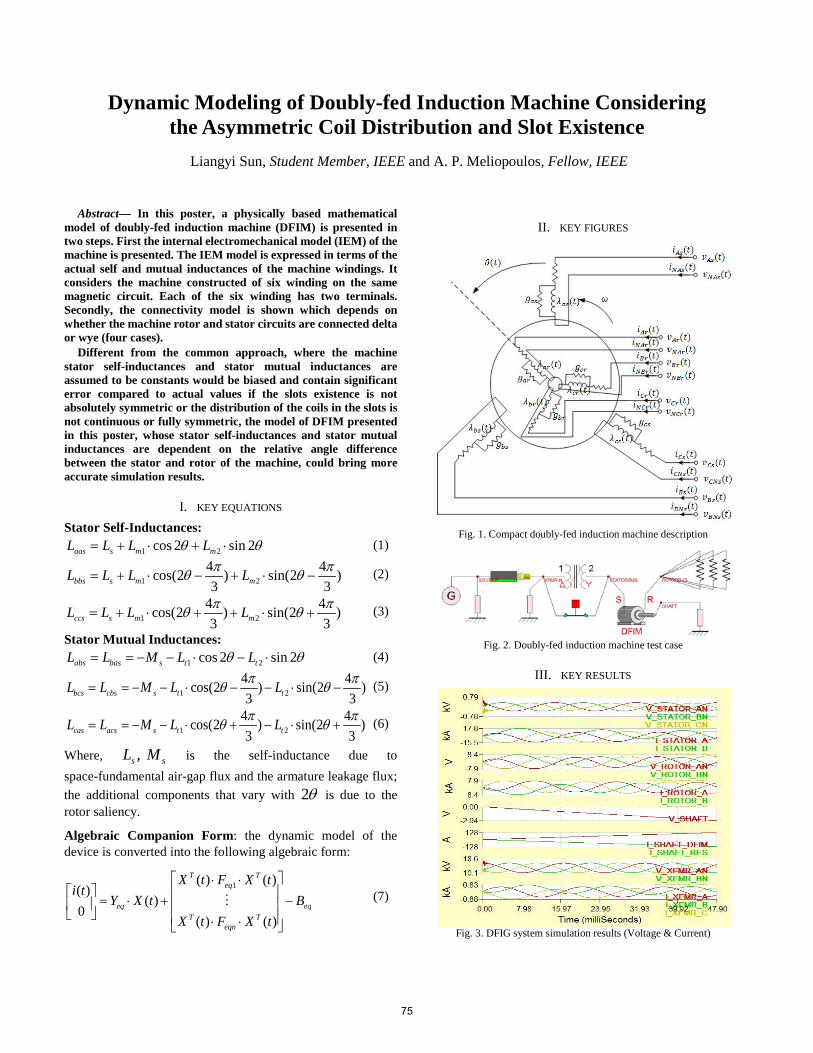
Abstract— In this poster, a physically based mathematical model of doubly-fed induction machine (DFIM) is presented in two steps. First the internal electromechanical model (IEM) of the machine is presented. The IEM model is expressed in terms of the actual self and mutual inductances of the machine windings. It considers the machine constructed of six winding on the same magnetic circuit. Each of the six winding has two terminals. Secondly, the connectivity model is shown which depends on whether the machine rotor and stator circuits are connected delta or wye (four cases).
Different from the common approach, where the machine stator self-inductances and stator mutual inductances are assumed to be constants would be biased and contain significant error compared to actual values if the slots existence is not absolutely symmetric or the distribution of the coils in the slots is not continuous or fully symmetric, the model of DFIM presented in this poster, whose stator self-inductances and stator mutual inductances are dependent on the relative angle difference between the stator and rotor of the machine, could bring more accurate simulation results.
I. KEY EQUATIONS Stator Self-Inductances:
1 2cos 2 sin 2aas s m mL L L Lθ θ= + ⋅ + ⋅ (1)
1 24 4cos(2 ) sin(2 )3 3bbs s m mL L L Lπ πθ θ= + ⋅ − + ⋅ − (2)
1 24 4cos(2 ) sin(2 )3 3ccs s m mL L L Lπ πθ θ= + ⋅ + + ⋅ + (3)
Stator Mutual Inductances: 1 2cos 2 sin 2abs bas s t tL L M L Lθ θ= = − − ⋅ − ⋅ (4)
1 24 4cos(2 ) sin(2 )3 3bcs cbs s t tL L M L Lπ πθ θ= = − − ⋅ − − ⋅ − (5)
1 24 4cos(2 ) sin(2 )3 3cas acs s t tL L M L Lπ πθ θ= = − − ⋅ + − ⋅ + (6)
Where, , s sL M is the self-inductance due to space-fundamental air-gap flux and the armature leakage flux; the additional components that vary with 2θ is due to the rotor saliency.
Algebraic Companion Form: the dynamic model of the device is converted into the following algebraic form:
1( ) ( )( )
( )0
( ) ( )
T Teq
eq eqT T
eqn
X t F X ti t
Y X t BX t F X t
⋅ ⋅ = ⋅ + − ⋅ ⋅
(7)
II. KEY FIGURES
Fig. 1. Compact doubly-fed induction machine description
Fig. 2. Doubly-fed induction machine test case
III. KEY RESULTS
Fig. 3. DFIG system simulation results (Voltage & Current)
Dynamic Modeling of Doubly-fed Induction Machine Considering the Asymmetric Coil Distribution and Slot Existence
Liangyi Sun, Student Member, IEEE and A. P. Meliopoulos, Fellow, IEEE
75
1
Abstract – This article briefly describes the poster to be
submitted on datacenter electrical distribution architectures at
the University of Pittsburgh for the 2012 IEEE PES T&D show in
Orlando, Florida.
I. INTRODUCTION
lobal industries, governments, organizations, and
institutions rely on the operation of datacenters in order
to successfully meet their day-to-day objectives. The
increased reliance on datacenters combined with the shear
growth of the industry sector has led to more careful
considerations for datacenter design.
Historically, datacenters have sprouted where needed, and
have increased capacity as demand for data services has
increased. However, many datacenters are currently operating
at or near capacity, and are not able to expand under the
restraints of their facility electrical distribution systems. For
the reasons stated, stakeholders in the datacenter industry have
begun to consider alternative electrical distribution systems
that provide the same functionality, with greater reliability and
operating efficiency, as well as lower capital costs and ease-
of-installation.
Among the many alternatives proposed, facility-level DC
distribution, at a voltage near 400 V DC, has emerged as the
option providing the most benefit. A number of studies have
shown that DC distribution provides savings, in terms of
energy efficiency, space utilization, and required cooling
within a datacenter.
Growth in the datacenter industry has allowed for
efficiency increases in other sectors of the economy.
Centralized computing facilities allow other industries to focus
their resources on their core competencies. However,
datacenters themselves are unnecessarily inefficient. For every
watt consumed utilized to process data, at least 0.9 watts are
required support power conversion and conditioning
processes, and another 0.6 watts are required to cool the
datacenter equipment. By migrating to a DC distribution
architecture, conversions can be eliminated, increasing the
system efficiency, while decreasing cooling needs.
Research has shown that DC distribution exhibits higher
efficiency, compared to baseline AC systems. However, the
issue of transient propagation in alternative distribution
architectures has not been quantified. The research work of the
University of Pittsburgh focuses on the transient aspect of
datacenter electrical distribution.
This work was supported by funding from the PA DCED BFTDA. E.
Taylor and G.F. Reed are with the Department of Electrical & Computer Engineering and the Center for Energy, in the Swanson School of Engineering
at the University of Pittsburgh, Pittsburgh, PA 15210 USA (e-mails:
[email protected], [email protected])
II. GENERAL POSTER DESCRIPTION
This poster is designed simply, in order to make a visual
impact on the viewer, and provide necessary information in an
efficient manner. This poster is designed as a mechanism for
generating interest and eliciting conversation.
The poster expresses the purpose behind the research
being pursued. The poster illustrates single line diagrams
relevant to the AC benchmark system, as well as the DC
architecture used for comparison. Key characteristics of each
system are described. Results and future work are presented in
a concise manner.
The AC system single line diagram is representative of a
standard datacenter distribution architecture. The facility is fed
from a 480 V, three phase utility supply. This AC supply is
conditioned using double-conversion online uninterruptible
power supply. The conditioned voltage supply is fed through
the facility using AC cable. Power distribution units provide
isolation and protection for the sensitive electronic equipment.
Server power supply units are fed an AC voltage. Within the
server power supply, this voltage is power factor corrected,
rectified, and filtered to provide a 12 V supply. Voltage
regulators further step down the DC voltage to levels suitable
for individual electronic devices, including server processors
and fans.
In the DC comparison system, the utility voltage is
rectified, filtered, and regulated, feeding a facility DC bus. An
active rectifier feeds DC buswork and cabling, distributing DC
voltage throughout the facility. This DC supply is fed directly
into the server power supplies. Server power supplies are only
required to step down and regulate the input voltage. The
server voltage regulators and electronics operate in the same
manner as in the AC system. The DC system provides the
same functionality, with reduced infrastructure and higher
efficiency.
The single line diagrams also demonstrate the way in
which auxiliary facility services are connected into the
electrical distribution network. Additional savings are realized
by feeding variable frequency drives with direct DC power,
eliminating the diode rectifiers commonly found in VFD
topologies.
Although higher efficiencies can be achieved, the
propagation of voltage transients in the DC system must be
thoroughly investigated to ensure equipment safety and system
reliability.
III. BIOGRAPHIES
Emmanuel Taylor (M’2007) is a graduate research assistant and Gregory F.
Reed (M’1985) is the Director of the Power and Energy Initiative and Associate Professor of the Swanson School of Engineering at the University of
Pittsburgh.
Electrical Distribution Architectures for Future Commercial Facilities
Emmanuel Taylor, Student Member, IEEE and Gregory F. Reed, Member, IEEE
G
76
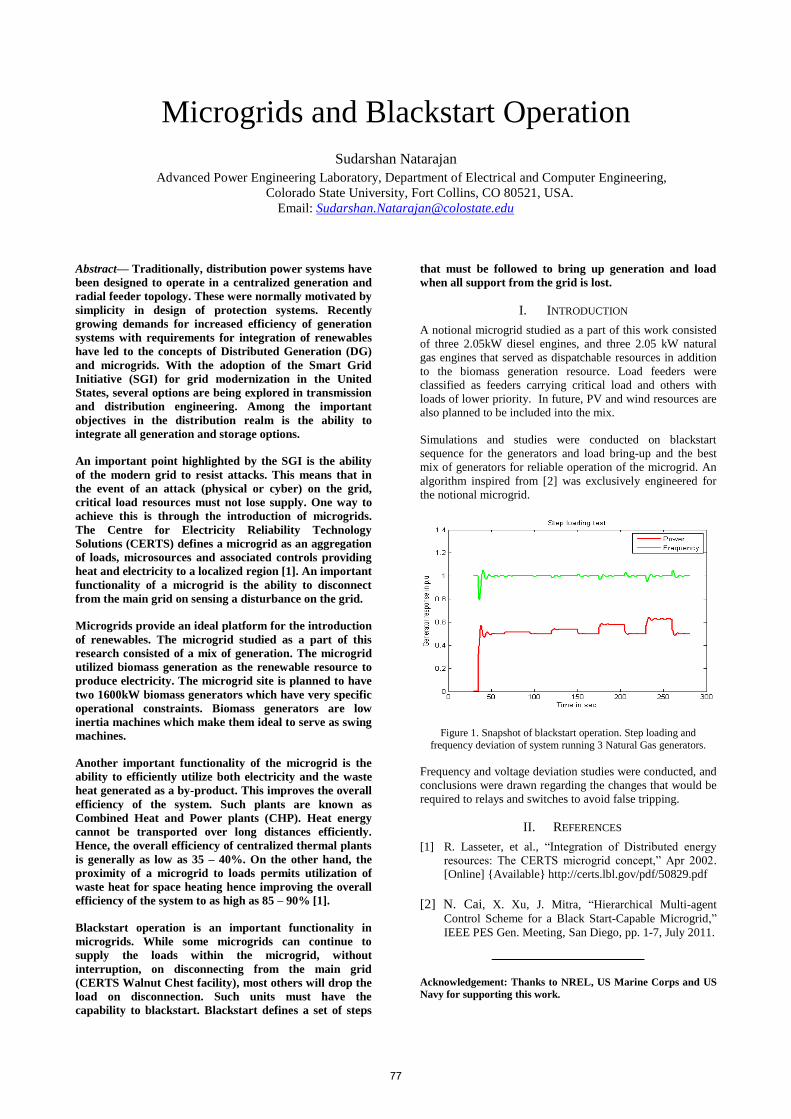
Microgrids and Blackstart Operation
Sudarshan Natarajan
Advanced Power Engineering Laboratory, Department of Electrical and Computer Engineering,
Colorado State University, Fort Collins, CO 80521, USA.
Email: [email protected]
Abstract— Traditionally, distribution power systems have
been designed to operate in a centralized generation and
radial feeder topology. These were normally motivated by
simplicity in design of protection systems. Recently
growing demands for increased efficiency of generation
systems with requirements for integration of renewables
have led to the concepts of Distributed Generation (DG)
and microgrids. With the adoption of the Smart Grid
Initiative (SGI) for grid modernization in the United
States, several options are being explored in transmission
and distribution engineering. Among the important
objectives in the distribution realm is the ability to
integrate all generation and storage options.
An important point highlighted by the SGI is the ability
of the modern grid to resist attacks. This means that in
the event of an attack (physical or cyber) on the grid,
critical load resources must not lose supply. One way to
achieve this is through the introduction of microgrids.
The Centre for Electricity Reliability Technology
Solutions (CERTS) defines a microgrid as an aggregation
of loads, microsources and associated controls providing
heat and electricity to a localized region [1]. An important
functionality of a microgrid is the ability to disconnect
from the main grid on sensing a disturbance on the grid.
Microgrids provide an ideal platform for the introduction
of renewables. The microgrid studied as a part of this
research consisted of a mix of generation. The microgrid
utilized biomass generation as the renewable resource to
produce electricity. The microgrid site is planned to have
two 1600kW biomass generators which have very specific
operational constraints. Biomass generators are low
inertia machines which make them ideal to serve as swing
machines.
Another important functionality of the microgrid is the
ability to efficiently utilize both electricity and the waste
heat generated as a by-product. This improves the overall
efficiency of the system. Such plants are known as
Combined Heat and Power plants (CHP). Heat energy
cannot be transported over long distances efficiently.
Hence, the overall efficiency of centralized thermal plants
is generally as low as 35 – 40%. On the other hand, the
proximity of a microgrid to loads permits utilization of
waste heat for space heating hence improving the overall
efficiency of the system to as high as 85 – 90% [1].
Blackstart operation is an important functionality in
microgrids. While some microgrids can continue to
supply the loads within the microgrid, without
interruption, on disconnecting from the main grid
(CERTS Walnut Chest facility), most others will drop the
load on disconnection. Such units must have the
capability to blackstart. Blackstart defines a set of steps
that must be followed to bring up generation and load
when all support from the grid is lost.
I. INTRODUCTION
A notional microgrid studied as a part of this work consisted
of three 2.05kW diesel engines, and three 2.05 kW natural
gas engines that served as dispatchable resources in addition
to the biomass generation resource. Load feeders were
classified as feeders carrying critical load and others with
loads of lower priority. In future, PV and wind resources are
also planned to be included into the mix.
Simulations and studies were conducted on blackstart
sequence for the generators and load bring-up and the best
mix of generators for reliable operation of the microgrid. An
algorithm inspired from [2] was exclusively engineered for
the notional microgrid.
Figure 1. Snapshot of blackstart operation. Step loading and
frequency deviation of system running 3 Natural Gas generators.
Frequency and voltage deviation studies were conducted, and
conclusions were drawn regarding the changes that would be
required to relays and switches to avoid false tripping.
II. REFERENCES
[1] R. Lasseter, et al., “Integration of Distributed energy
resources: The CERTS microgrid concept,” Apr 2002.
[Online] Available http://certs.lbl.gov/pdf/50829.pdf
[2] N. Cai, X. Xu, J. Mitra, “Hierarchical Multi-agent
Control Scheme for a Black Start-Capable Microgrid,”
IEEE PES Gen. Meeting, San Diego, pp. 1-7, July 2011.
Acknowledgement: Thanks to NREL, US Marine Corps and US
Navy for supporting this work.
77

Short-Term Load Forecasting of a University Campus with an Artificial Neural Network
David Palchak Department of Mechanical Engineering
Colorado State University Fort Collins, CO
Abstract Electrical load forecasting is a tool that has been
utilized by distribution designers and operators as a means for resource planning and generation dispatch. The techniques employed in these predictions are proving useful in the growing market of consumer, or end-user, participation in electrical energy consumption. These predictions are based on exogenous variables, such as weather, and time variables, such as day of week and time of day. The participation of the end-user is a cornerstone of the Smart Grid initiative laid out by the 110th Congress [1], and is being made possible by the emergence of enabling technologies such as advanced metering infrastructure (AMI). The real-time data provided by the AMI, as well as the load forecast, is utilized for the detection of anomalous events, as well as the management of electrical loads, termed demand-side management (DSM).
I. METHODS AND RESULTS This case study focuses on the ability of an artificial
neural network (ANN) to predict the 24-hour load profile of the main campus of Colorado State University. The ANN is trained and validated using real historical data in conjunction with historical local weather data. The architecture of the ANN is decided using a combination of historical success [2]and statistical information about the forecasting performance. Figure 1 shows an example of a 24-hour prediction of the ANN.
Figure 1. Typical load profile and forecast of 24-hour day.
A number of error measures are examined to quantify the
performance of the ANN, and are also used to help determine relevant DSM applications. Mean average percent error (MAPE) is the most widely used measure in neural network
literature. The average MAPE over all 121 test days is 2.48%, which, according to [3], falls in the “normal” range expected for a 24-hour prediction. Other performance measures that provide relevant information about the predictive abilities of the ANN are: 1) the difference in total electric energy between forecast and target over a 24 hour period 2) peak hour miss, and 3) maximum error over the 24 hour period.
The energy difference is the ratio of the difference in electric energy consumption corresponding to the forecast and the observed values to the electric energy consumed corresponding to the observed values, for a 24-hour period (n=24).
𝐸𝑛𝑒𝑟𝑔𝑦 𝑑𝑖𝑓𝑓𝑒𝑟𝑒𝑛𝑐𝑒 =𝐹 − 𝑇!!!
!!!!!
𝑇!!!!
∗ 100 (1)
The average energy difference over all of the test days is 1%, which suggests that this ANN might be well-suited for DSM applications where energy savings is the goal.
The other error measures are not only an indication of the performance, but can improve upon the application of the predictive knowledge gained from this ANN. Knowing the ability of the ANN to predict the peak hour, for example, not only points out limitations of the model, but could result in successful localized applications.
References [1] 110th United States Congress, “‘Smart Grid,’ Title XIII, Energy
Independence and Security Act 2007.”. [2] H. S. Hippert, C. E. Pedreira, and R. C. Souza, “Neural networks for
short-term load forecasting: a review and evaluation,” Power Systems, IEEE Transactions, vol. 16, no. 1, pp. 44–55, 2001.
[3] S. A. Soliman, Electrical load forecasting modeling and model construction. Burlington, MA: Butterworth-Heinemann, 2010.
Acknowledgement This work is supported by the Eaton Corporation and the City of Fort Collins through the FortZED project, as well as the US National Science Foundation Award # 0931748. The authors acknowledge the cooperation of the Colorado State University facilities department; Dr. Chuck Andersen, Professor of Computer Science at Colorado State University for his valuable input on ANNs. Thanks to my advisors, Professor Dan Zimmerle and Dr. Sid Suryanarayanan for their invaluable help on this research.
78

Impact of wind penetration on conventional
transmission line fault location algorithms
Chaoqi Ji
Electrical and Computer Engineering Department
Clemson University, Clemson, SC USA
Abstract—With an increasing capacity of wind power installed in
the world, the impact of wind penetration has been studied in many
areas. In this poster, some widely-used conventional fault location
algorithms for transmission system are applied to a simple
equivalent system during fault condition. The system is connected
to a wind farm equipped with doubly fed induction generator
(DFIG). Real time simulation with relay hardware in loop (HIP) is
performed to compare the validity of fault location algorithms.
Comparisons are made for different fault types and fault locations
with various fault resistance value. Possible reasons are then
discussed based on the fault location results.
Keywords – wind penetration; fault location algorithm; DFIG; real
time simulation; HIP
79

A Novel Optimization Approach to Solve
Power Flow Problem Using Complementarity
Mehrdad Pirnia, Kankar Bhattacharya, Claudio Canizares
Power and Energy Systems Group, Department of Electrical and Computer Engineering, University of Waterloo,
Ontario, Canada, N2L 3G1,
Email: [email protected] , [email protected] , [email protected]
Abstract—A novel optimization based solution to the
power flow problem, using complementarity conditions
which tracks the generator bus voltage level changes
when its minimum or maximum reactive power limits
have been attained is proposed. In order to test the
accuracy of the model, this has been tested on IEEE 14-
bus, 30-bus, 57-bus, 118-bus and 300-bus test systems,
using GAMS PATHNLP solver, and has been
benchmarked against the standard Newton-Raphson
method, which is the most well-known power flow
solution methodology today. The proposed model
converges in a few iterations, with the same results as the
Newton-Raphson solver, using UWPflow [1]. To
investigate the robustness of this approach, the proposed
model has been tested on a large 1200-bus real system,
which can be classified as an ill-conditioned power flow
problem when using a flat start. Using the proposed
complementarity method, the problem converges from a
flat start in a few iterations, while Newton-Raphson
method diverges.
I. KEY EQUATIONS
The proposed optimization model for power flow
problem with complementarity conditions can be
written as [2]:
min
(1) s.t.
(2)
(3)
(4)
(5)
(6)
(7)
II. KEY RESULTS
Proposed Model (Flat Start)
System Major
Iterations
Total time
(Seconds)
IEEE 14bus 7 0.046
IEEE 30bus 3 0.047
IEEE 57bus 5 0.109
IEEE 118bus 9 0.375
IEEE 300bus 9 0.515
Real 1211bus 11 12.281
Table 1. Performance Evaluation for PF-CC with Flat Start
Newton-Raphson (Flat Start)
System Major
Iterations
IEEE 14bus 5
IEEE 30bus 6
IEEE 57bus 4
IEEE 118bus 5
IEEE 300bus 12
Real 1211bus Doesn't
converge
Table 2. Performance Evaluation for Newtone-Raphson Method with Flat start
REFERENCES
[1] "UWPFLOW: Continuation and Direct Methods to
Locate Fold Bifurcations in AC/DC/FACTS Power
Systems". Available:
http://www.power.uwaterloo.ca.
[2] W. Rosehart, C. Roman, and A. Schellenberg,
"Optimal Power Flow With Complementarity
Constraints," IEEE Transactions On Power
Systems, vol. 20, no. 2, 2005.
80
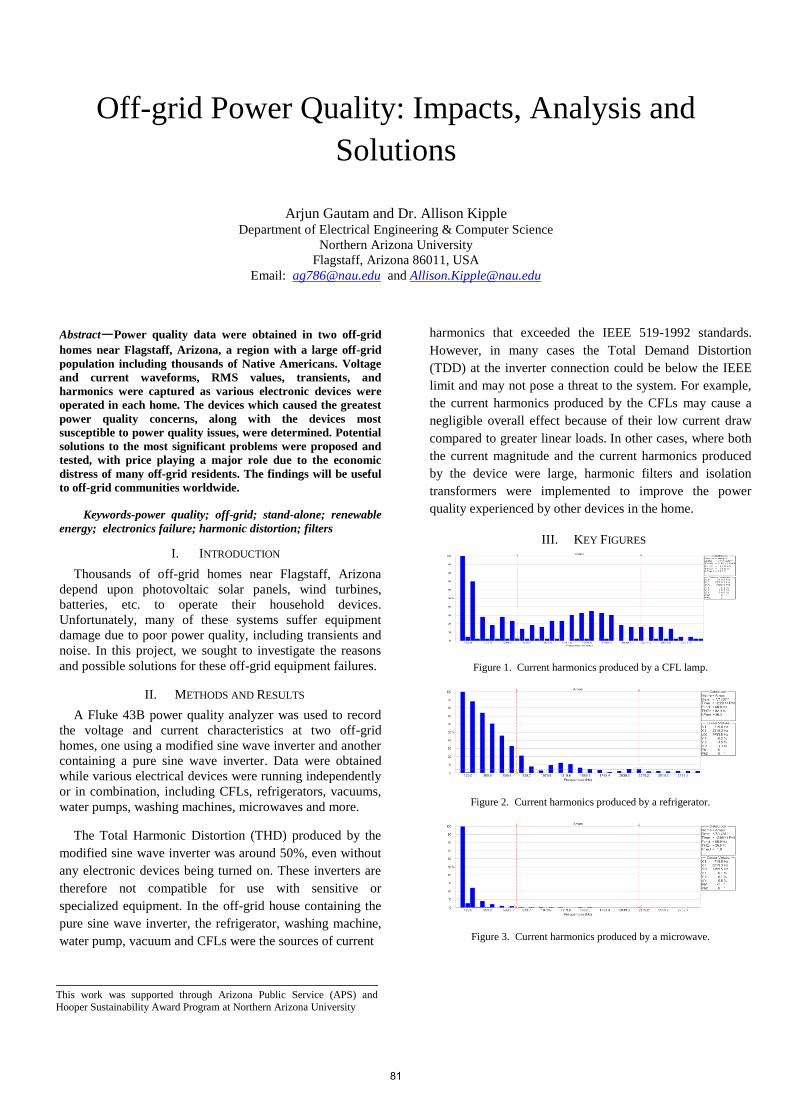
Off-grid Power Quality: Impacts, Analysis and
Solutions
Arjun Gautam and Dr. Allison Kipple
Department of Electrical Engineering & Computer Science
Northern Arizona University
Flagstaff, Arizona 86011, USA
Email: [email protected] and [email protected]
Abstract—Power quality data were obtained in two off-grid
homes near Flagstaff, Arizona, a region with a large off-grid
population including thousands of Native Americans. Voltage
and current waveforms, RMS values, transients, and
harmonics were captured as various electronic devices were
operated in each home. The devices which caused the greatest
power quality concerns, along with the devices most
susceptible to power quality issues, were determined. Potential
solutions to the most significant problems were proposed and
tested, with price playing a major role due to the economic
distress of many off-grid residents. The findings will be useful
to off-grid communities worldwide.
Keywords-power quality; off-grid; stand-alone; renewable
energy; electronics failure; harmonic distortion; filters
I. INTRODUCTION
Thousands of off-grid homes near Flagstaff, Arizona
depend upon photovoltaic solar panels, wind turbines,
batteries, etc. to operate their household devices.
Unfortunately, many of these systems suffer equipment
damage due to poor power quality, including transients and
noise. In this project, we sought to investigate the reasons
and possible solutions for these off-grid equipment failures.
II. METHODS AND RESULTS
A Fluke 43B power quality analyzer was used to record
the voltage and current characteristics at two off-grid
homes, one using a modified sine wave inverter and another
containing a pure sine wave inverter. Data were obtained
while various electrical devices were running independently
or in combination, including CFLs, refrigerators, vacuums,
water pumps, washing machines, microwaves and more.
The Total Harmonic Distortion (THD) produced by the
modified sine wave inverter was around 50%, even without
any electronic devices being turned on. These inverters are
therefore not compatible for use with sensitive or
specialized equipment. In the off-grid house containing the
pure sine wave inverter, the refrigerator, washing machine,
water pump, vacuum and CFLs were the sources of current
harmonics that exceeded the IEEE 519-1992 standards.
However, in many cases the Total Demand Distortion
(TDD) at the inverter connection could be below the IEEE
limit and may not pose a threat to the system. For example,
the current harmonics produced by the CFLs may cause a
negligible overall effect because of their low current draw
compared to greater linear loads. In other cases, where both
the current magnitude and the current harmonics produced
by the device were large, harmonic filters and isolation
transformers were implemented to improve the power
quality experienced by other devices in the home.
III. KEY FIGURES
Figure 1. Current harmonics produced by a CFL lamp.
Figure 2. Current harmonics produced by a refrigerator.
Figure 3. Current harmonics produced by a microwave.
This work was supported through Arizona Public Service (APS) and
Hooper Sustainability Award Program at Northern Arizona University
81
Related Documents