Student Manual Revision: 2021

Welcome message from author
This document is posted to help you gain knowledge. Please leave a comment to let me know what you think about it! Share it to your friends and learn new things together.
Transcript
Student ManualRevision: 2021
Grounded - Explore your world i
OVERVIEW 'Grounded' is an introductory course to Geographical Information System (GIS) software (digital mapping software), designed for secondary school students. The course is aimed at Transition Year students and has been produced to fulfil all the requirements of a Transition Unit.
The overall objective of this course is to teach students how to make their own maps, learning how it can be a strong support to decision-making processes for territorial and environmental plans. There is also a focus on global and local citizenship, using mapping to explore social and environmental issues that are affecting their locality – regarding conservation, sustainability, accessibility and mental health. Throughout the course the students will be reminded to consider the United Nations Sustainable Development Goals.
Most people use a GIS in some form without even realising it e.g. GPS on a phone providing directions. It makes sense that secondary school students become educated in this now integral part of our lifestyle. Learning QGIS will give them the skills to actively contribute to a more informed world.
This course aims to help students prepare for 'adult and working life' by giving them greater responsibility for their own learning. The GIS skills will also benefit them for application in a huge array of careers: environmental management, retail, military, tourism, meteorology, geography, etc.
Commercial/proprietary GIS software (software that cannot be freely shared or modified) is usually very expensive and entails limits on the freedom to copy, share and modify the software. QGIS is a high-quality free software. Learners can use this software anytime and anywhere, for personal projects, to solve professional problems, for research applications, etc.
Exciting possibilities are created when principles of free sharing of knowledge are embraced; a more collaborative world which seeks communication and progression. We hope the student enjoys learning and using QGIS and embraces a future of generosity in all forms with the pursuit of knowledge and understanding at its core.
ACKNOWLEDGEMENTS
T This project, 'Grounded: Explore your world', was funded by iCRAG and SFI. Dr Tiernan Henry at Earth & Ocean Sciences at NUIG was the project director. Grounded was devised and created by Fiona Stapleton of QGIS School.
iCRAG are a team of researchers creating solutions for a more sustainable society. This Project aligns with the iCRAG objective regarding 'Public Perception and Understanding of Geoscience'.
DATA:
Maps throughout this book were created using QGIS software: QGIS Development Team, 2020-2021. QGIS Geographic Information System. Open Source Geospatial Foundation Project. http://qgis.osgeo.org.
Grounded - Explore your world ii
FORWARD FOR THE STUDENT
REQUIREMENTS FOR THE COURSE
Before deciding to teach this course please do a check to ensure that you will have access to the following:
• QGIS software (free download, see Appendix E) • Use of the same computer/laptop for each class or use of a personal USB • Internet connection • Excel
If you are going to access the video tutorials, it is recommended that you wear a headset in order to hear the videos better. There are five lessons. Each lesson is suited for completion over the course of a teaching week (two double class periods or one double and one single class). However, you may save and return to your work at any stage. The remaining 5 weeks are for completion of a Group Project.
FORWARD
The Course aims to guide students to self-teach themselves how to use QGIS.
No prior knowledge or experience in QGIS is required to complete this course.
The lessons are taught using step-by-step Exercises (screenshot-based). The lessons should be taught in sequence as each exercise is built on the foundation of the previous classes. Each Lesson has a video tutorial (approx. 25 mins) to aid students who learn better via audio-visual means. This also encourages independent learning.
Take the opportunity of Transition Year to broaden your experience. This course is a fun and easy way to learn a valuable skill which you can use professionally and personally.
“Teachers can open the door, but you must enter it yourself.”
— Chinese proverb
Grounded - Explore your world iii
INCLUSIVITY STATEMENT Diversity, equity, and inclusion is critical to creating great education content. It is our intent that students from all backgrounds and perspectives be well-served by this course; that students' learning needs be addressed, and that the diversity that the students bring to this class is viewed as a resource, strength and benefit.
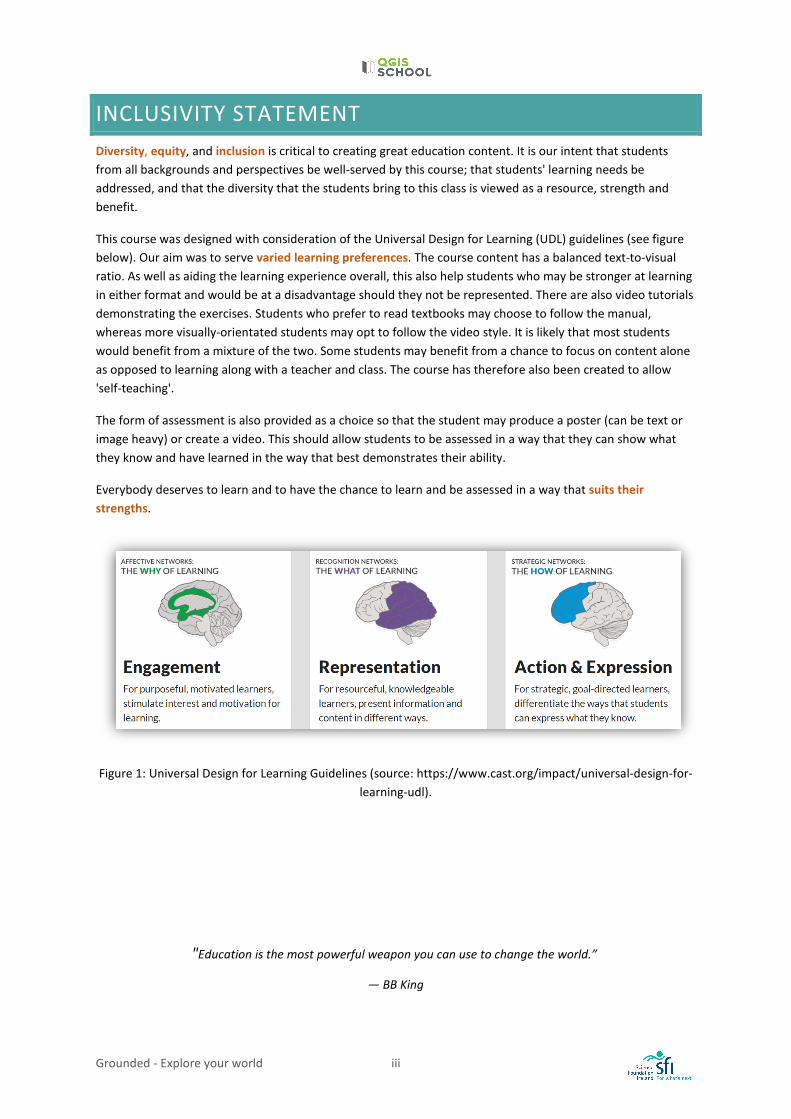
This course was designed with consideration of the Universal Design for Learning (UDL) guidelines (see figure below). Our aim was to serve varied learning preferences. The course content has a balanced text-to-visual ratio. As well as aiding the learning experience overall, this also help students who may be stronger at learning in either format and would be at a disadvantage should they not be represented. There are also video tutorials demonstrating the exercises. Students who prefer to read textbooks may choose to follow the manual, whereas more visually-orientated students may opt to follow the video style. It is likely that most students would benefit from a mixture of the two. Some students may benefit from a chance to focus on content alone as opposed to learning along with a teacher and class. The course has therefore also been created to allow 'self-teaching'.
The form of assessment is also provided as a choice so that the student may produce a poster (can be text or image heavy) or create a video. This should allow students to be assessed in a way that they can show what they know and have learned in the way that best demonstrates their ability.
Everybody deserves to learn and to have the chance to learn and be assessed in a way that suits their strengths.
Figure 1: Universal Design for Learning Guidelines (source: https://www.cast.org/impact/universal-design-for-learning-udl).
"Education is the most powerful weapon you can use to change the world.”
— BB King
Grounded - Explore your world iv
CONTENTS Overview .................................................................................................................................................................. i
Acknowledgements ............................................................................................................................................. i
Forward for the Student ......................................................................................................................................... ii
Inclusivity Statement ............................................................................................................................................. iii
1. Classroom QGIS Course ................................................................................................................................. 1
Lesson 1: Intro to Maps and QGIS ...................................................................................................................... 2
Lesson 2: Map Layout ....................................................................................................................................... 23
Lesson 3: QGIS for Management Decisions...................................................................................................... 35
Lesson 4: QGIS for Environmental Description ................................................................................................ 52
Lesson 5: Mapping to Protect Our Environment .............................................................................................. 79
2. Projects ...................................................................................................................................................... 101
Project Examples ............................................................................................................................................ 102
3. Assessment ................................................................................................................................................ 105
4. Conclusion .................................................................................................................................................. 106
Appendix A: Goals Sheet..................................................................................................................................... 107
Appendix B: Course Certificate ........................................................................................................................... 108
Appendix C: Certificate Application .................................................................................................................... 109
Appendix D: Resources ....................................................................................................................................... 110
Appendix E: Installing QGIS ................................................................................................................................ 111
Appendix F: Poster Guidelines ............................................................................................................................ 115
Appendix G: Peer Assessment ............................................................................................................................ 118
Appendix H: Student Evaluation ......................................................................................................................... 119
Grounded - Explore your world 1
1. CLASSROOM QGIS COURSE
INTRODUCTION Welcome to Grounded – Explore your world, a course where you learn how to use QGIS to make your own maps and investigate the world around you. QGIS is a fun, easy to use software. This course involves a series of exercises with real life scenarios. The exercises are also available via YouTube video tutorials (approx. 25 min), accessible here: https://cutt.ly/9jUZ7bE.
Keep track of your progress throughout the course using the Goals Sheet found in Appendix A. If you need to install the QGIS software then please refer to Appendix E.
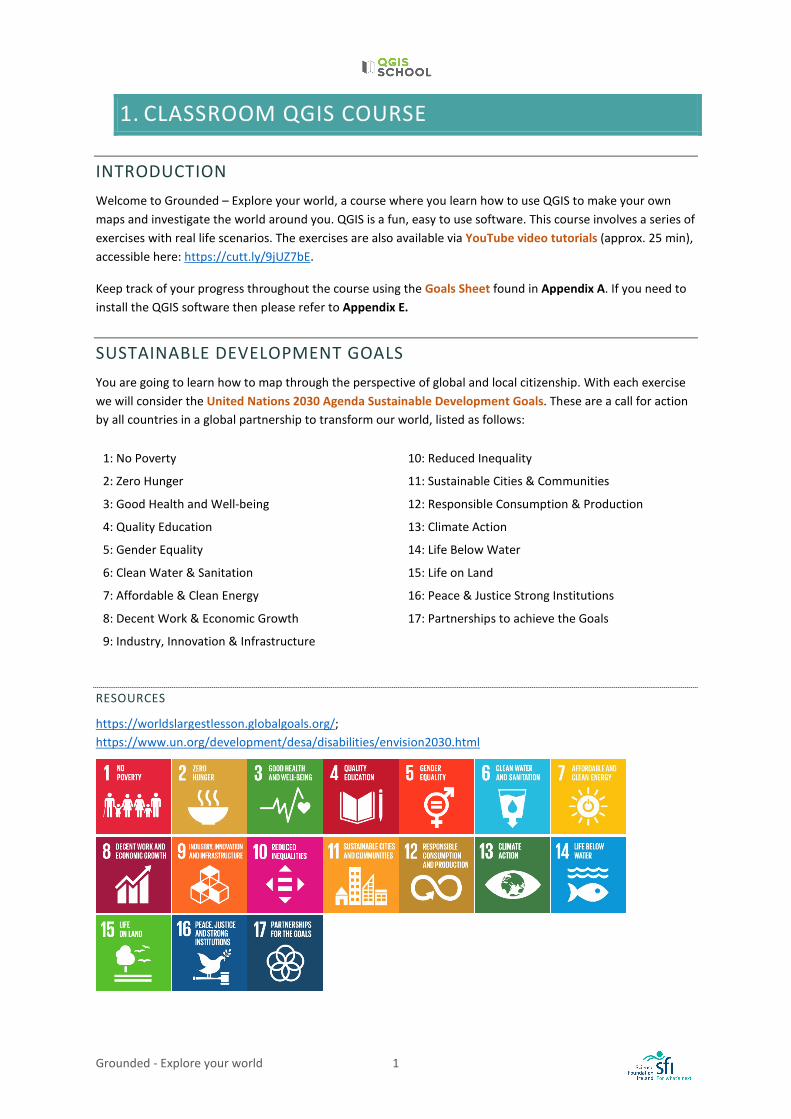
SUSTAINABLE DEVELOPMENT GOALS You are going to learn how to map through the perspective of global and local citizenship. With each exercise we will consider the United Nations 2030 Agenda Sustainable Development Goals. These are a call for action by all countries in a global partnership to transform our world, listed as follows:
1: No Poverty 10: Reduced Inequality
2: Zero Hunger 11: Sustainable Cities & Communities
3: Good Health and Well-being 12: Responsible Consumption & Production
4: Quality Education 13: Climate Action
5: Gender Equality 14: Life Below Water
6: Clean Water & Sanitation 15: Life on Land
7: Affordable & Clean Energy 16: Peace & Justice Strong Institutions
8: Decent Work & Economic Growth 17: Partnerships to achieve the Goals
9: Industry, Innovation & Infrastructure
RESOURCES
https://worldslargestlesson.globalgoals.org/; https://www.un.org/development/desa/disabilities/envision2030.html
Grounded - Explore your world 2
LESSON 1: INTRO TO MAPS AND QGIS
LEARNING OUTCOMES: • Types and utility of maps • Elements of a map • Effect of commuting • Understanding the importance of data management
BACKGROUND Maps can be very useful for numerous applications in your life. For example, they can help you show distances, explain what is happening in your locality, orientate people, explore areas and discover new places. During the Covid-19 pandemic organisations such as the World Health Organisation and governments worldwide used GIS to monitor the outbreak. When was the last time you used a map?
There are many types of maps. They can be used for navigation, establishing ownership, and presenting information.
• Political maps are made to show governmental boundaries of nations, states, counties, cities and towns.
• Cadastral maps are used to show ownership of individual properties. Cadastral mapping is one of the oldest forms of mapping, with ancient Egyptians developing cadastral records to establish ownership of land after flooding of the River Nile.
• A Physical map is a description of the geographical features of a location, their main function is to indicate landforms like deserts, mountains, lakes and plains.
• A Topographic map is a lot like a physical map because it indicates different physical landscape features. Topographic maps are different because they use contour lines rather than colours to show changes in the land elevation instead of land type.
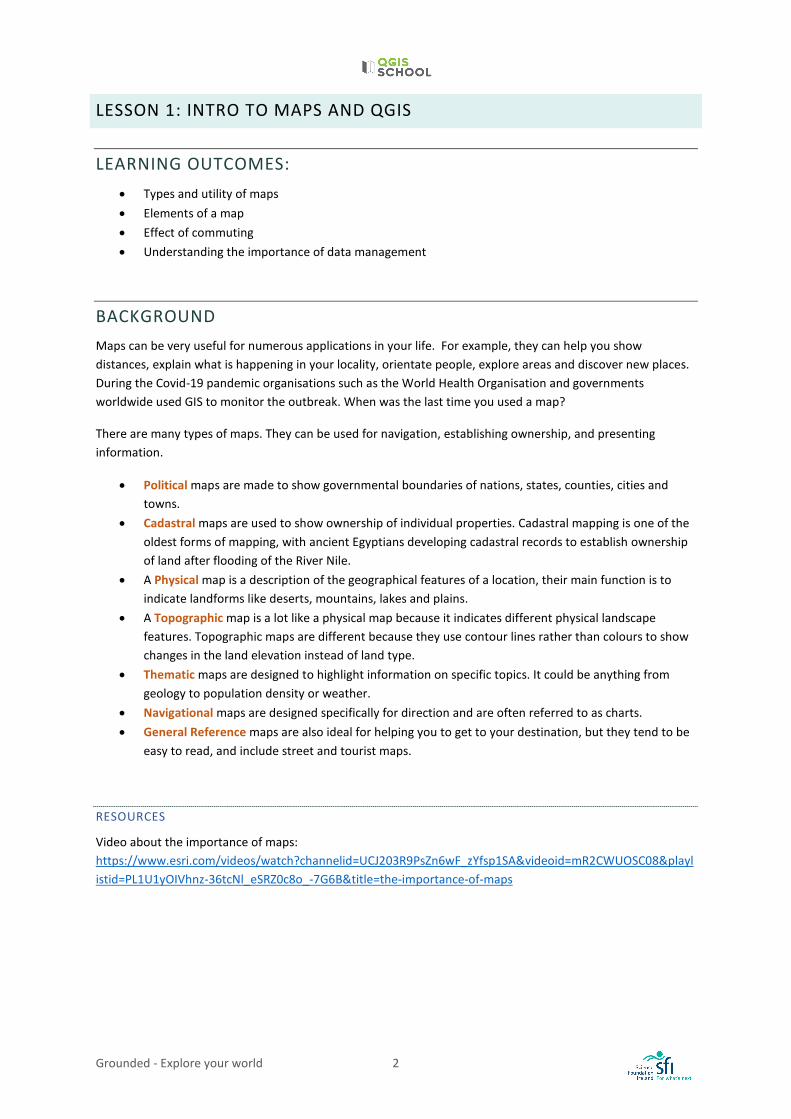
• Thematic maps are designed to highlight information on specific topics. It could be anything from geology to population density or weather.
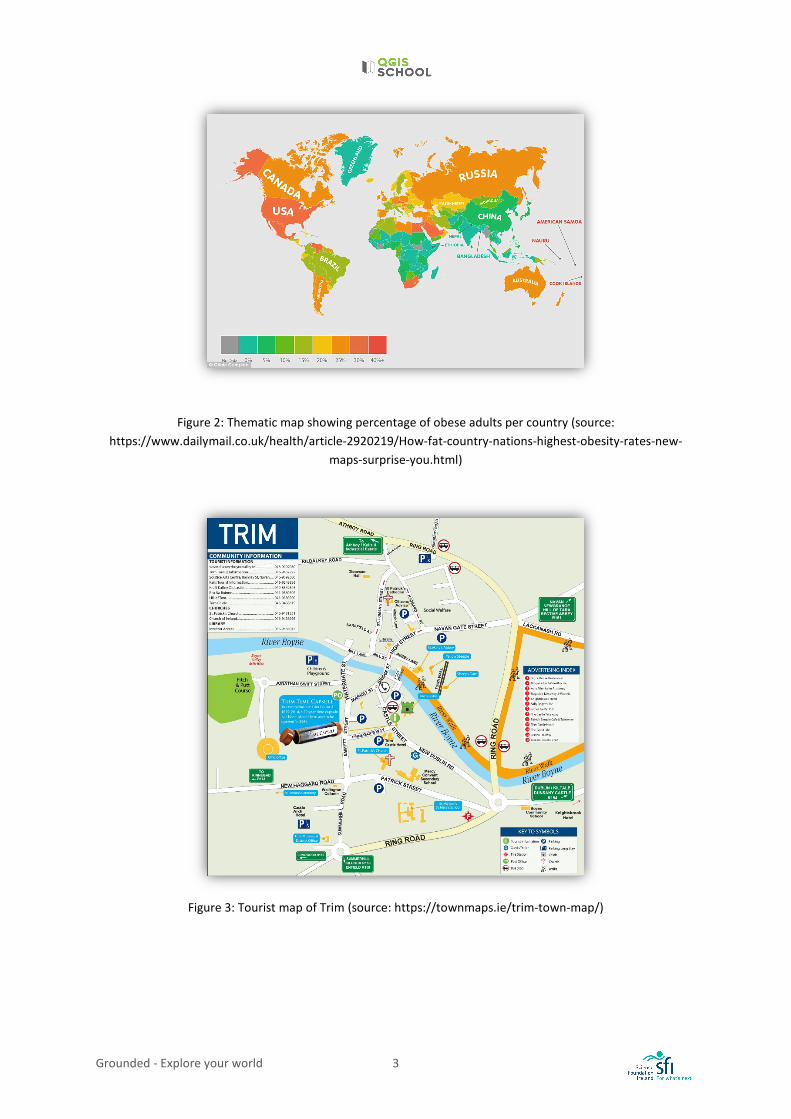
• Navigational maps are designed specifically for direction and are often referred to as charts. • General Reference maps are also ideal for helping you to get to your destination, but they tend to be
easy to read, and include street and tourist maps.
RESOURCES
Video about the importance of maps: https://www.esri.com/videos/watch?channelid=UCJ203R9PsZn6wF_zYfsp1SA&videoid=mR2CWUOSC08&playlistid=PL1U1yOIVhnz-36tcNl_eSRZ0c8o_-7G6B&title=the-importance-of-maps
Grounded - Explore your world 3
Figure 2: Thematic map showing percentage of obese adults per country (source: https://www.dailymail.co.uk/health/article-2920219/How-fat-country-nations-highest-obesity-rates-new-
maps-surprise-you.html)
Figure 3: Tourist map of Trim (source: https://townmaps.ie/trim-town-map/)
Grounded - Explore your world 4
HAND DRAWN MAPS ACTIVITY Before we start making maps digitally we need to think about how to do it without a computer. In this activity you will sketch a rough map showing your commute to school.
Objective:
• Understanding what constitutes a map and why we use maps. • Considering the effect choice of transport has regarding commuting to school.
Task: Map your Commute to School
Your relation has asked what your commute to school is like. You are going to draw them a quick, rough map to help describe to them the journey you take every morning and answer the following questions:
• Could the community be designed to be more sustainable as regards students commuting? • How could your school encourage reducing fossil fuel consumption?
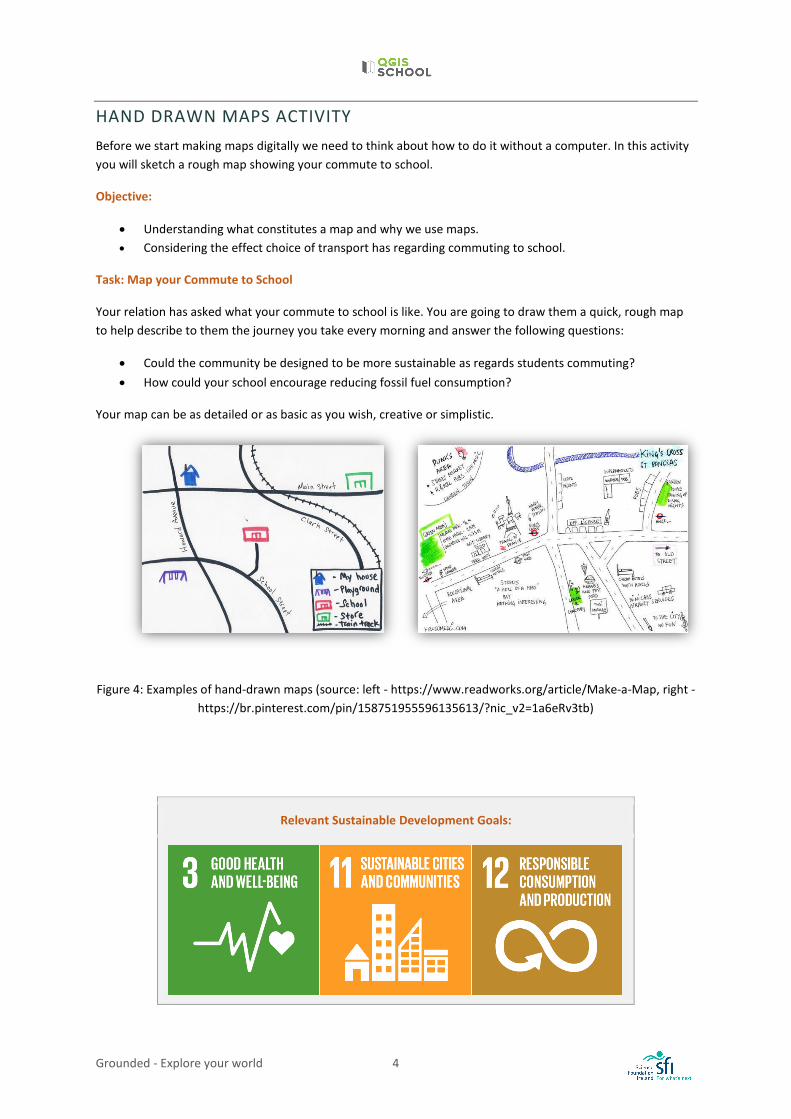
Your map can be as detailed or as basic as you wish, creative or simplistic.
Figure 4: Examples of hand-drawn maps (source: left - https://www.readworks.org/article/Make-a-Map, right - https://br.pinterest.com/pin/158751955596135613/?nic_v2=1a6eRv3tb)
Relevant Sustainable Development Goals:
Grounded - Explore your world 5
Steps:
Before you begin to draw take a second to consider, what do you think would be useful to include in this map? The information included on any map depends on what the map is used for.
1. Include the basics: draw the important features which are required to display the information – Your house and the road (or roads) to your school. Are you going to draw these features as cartoons, or will you just indicate them by doing something like an 'x' or a circle? It's up to you. Is your map obvious or should you include labels to help the reader?
2. Elaborate on this basic picture: • The map could be showing a commute of 100km or 1 km, we need to indicate scale to help
the map reader. Include a bar/line/arrow on your map indicating the approximate distance or length or time it takes to travel between two points.
• Would someone know they were on the right track if they went by your map's information? To help them you should include some key navigational features e.g. buildings like a shop, pub or church, road signs, noticeable features like statues or murals, or even a very distinctive natural feature such as a tree or large rock.
• Is it clear from your map whether you live in a rural or urban setting? (Hint – you could draw numerous buildings for an urban environment or grass/trees for a rural environment).
Note: You don't have to include a north arrow as it might be difficult to include orientation into this type of representation. Not all maps are produced for direction, many are used for visualisation purposes.
There's no right or wrong way to do this mapping activity, you can be as simplistic or as creative as you feel like. The map doesn't have to be highly detailed or polished.
When you're finished compare your map to others in the class. Add in any ideas that others had which you like the look of. Maps are constantly being improved by using other people's ideas.
Now, discuss the commute to school with the class and answer the Task questions.
Grounded - Explore your world 6
EXERCISE 1A: INTRO TO QGIS Now that you have thought about what is involved in creating a map, we will quickly move on to learn how to make one digitally! This is where QGIS comes in. First of all we need to do some preparation by setting up the folder structure, then we can open the program. Organisation is key to a smooth QGIS experience.
Objective:
• Organising the folder structure for creating and saving QGIS data. • Opening QGIS and exploring the workspace.
Task: Folder Organisation and Opening the QGIS Program
In the steps below you will set up your folder structure for saving your QGIS projects and data. Then you will open the program and explore the workspace.
Note: If you cannot use the same computer/laptop for every QGIS class, then you will need to save everything on to a personal USB and work from the device each time. It is important that you save all your QGIS work in the one place.
Exercise 1A Steps:
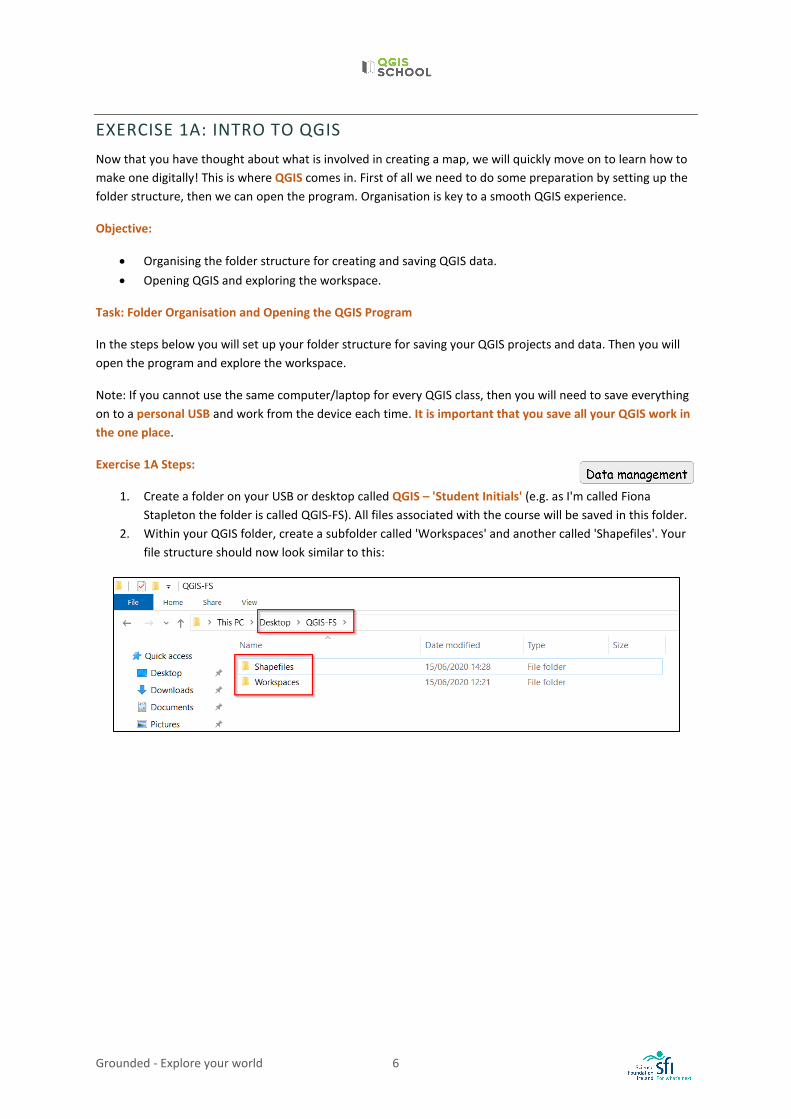
1. Create a folder on your USB or desktop called QGIS – 'Student Initials' (e.g. as I'm called Fiona Stapleton the folder is called QGIS-FS). All files associated with the course will be saved in this folder.
2. Within your QGIS folder, create a subfolder called 'Workspaces' and another called 'Shapefiles'. Your file structure should now look similar to this:
Grounded - Explore your world 7
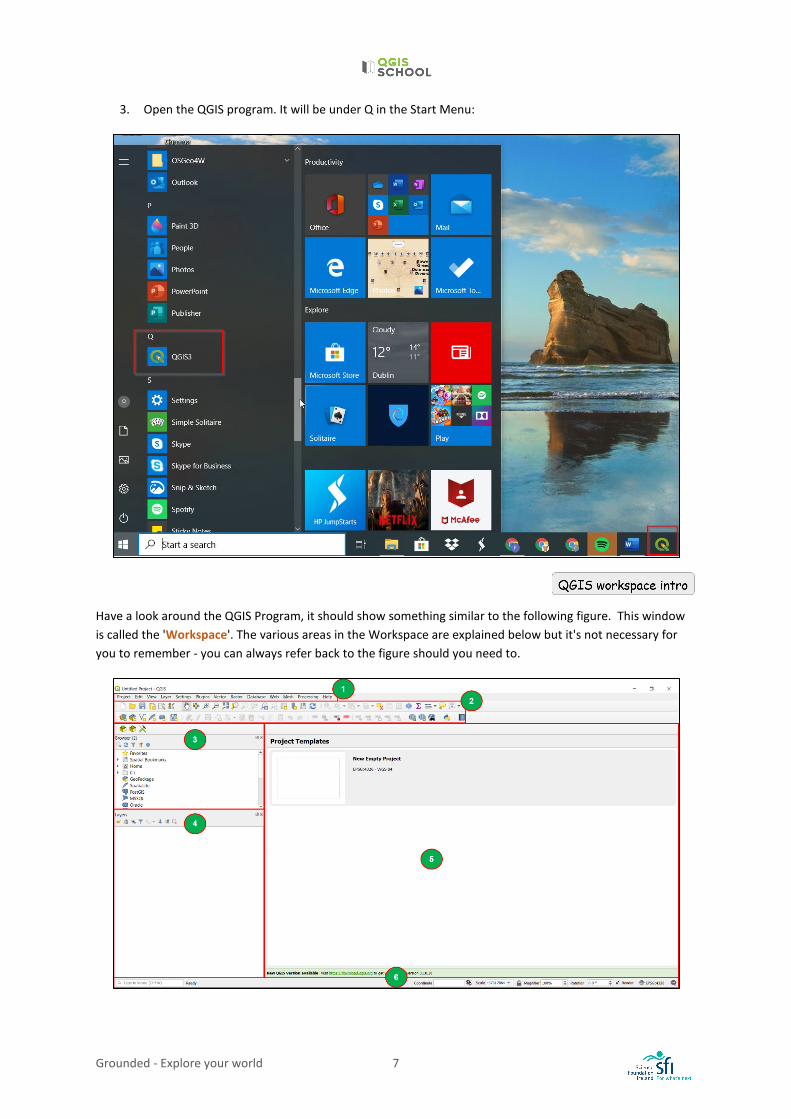
3. Open the QGIS program. It will be under Q in the Start Menu:
Have a look around the QGIS Program, it should show something similar to the following figure. This window is called the 'Workspace'. The various areas in the Workspace are explained below but it's not necessary for you to remember - you can always refer back to the figure should you need to.
Grounded - Explore your world 8
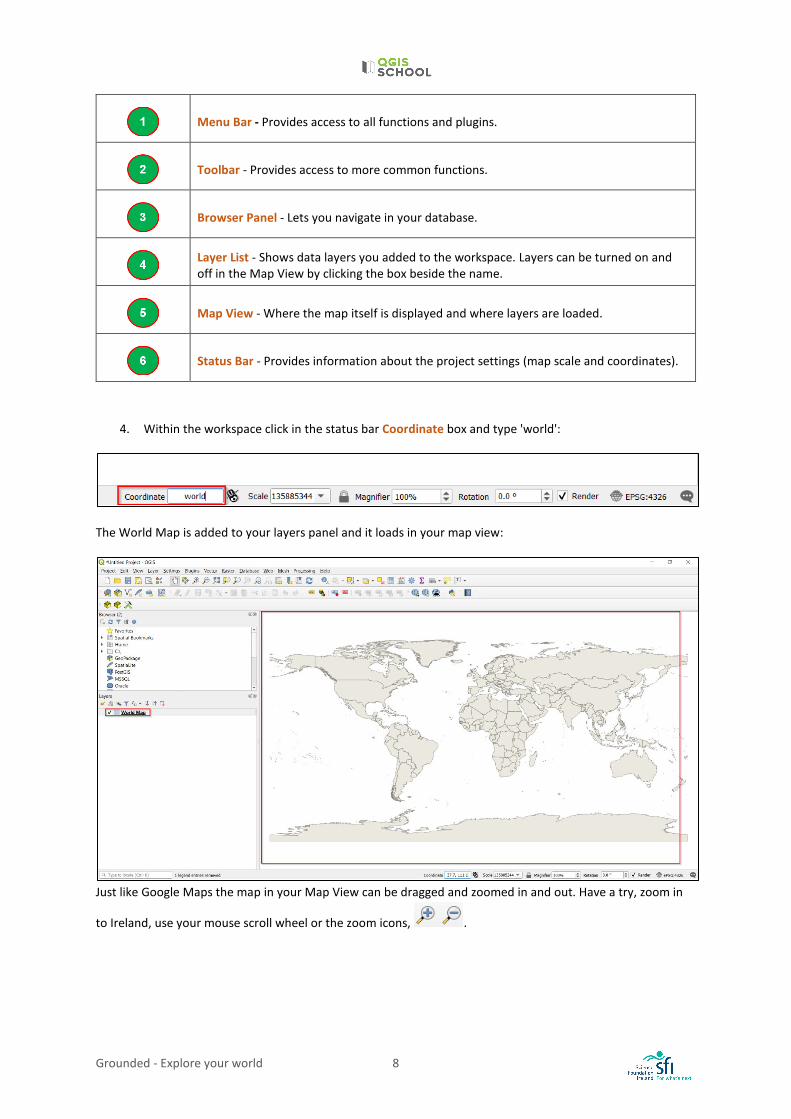
Menu Bar - Provides access to all functions and plugins.
Toolbar - Provides access to more common functions.
Browser Panel - Lets you navigate in your database.
Layer List - Shows data layers you added to the workspace. Layers can be turned on and off in the Map View by clicking the box beside the name.
Map View - Where the map itself is displayed and where layers are loaded.
Status Bar - Provides information about the project settings (map scale and coordinates).
4. Within the workspace click in the status bar Coordinate box and type 'world':
The World Map is added to your layers panel and it loads in your map view:
Just like Google Maps the map in your Map View can be dragged and zoomed in and out. Have a try, zoom in
to Ireland, use your mouse scroll wheel or the zoom icons, .
Grounded - Explore your world 9
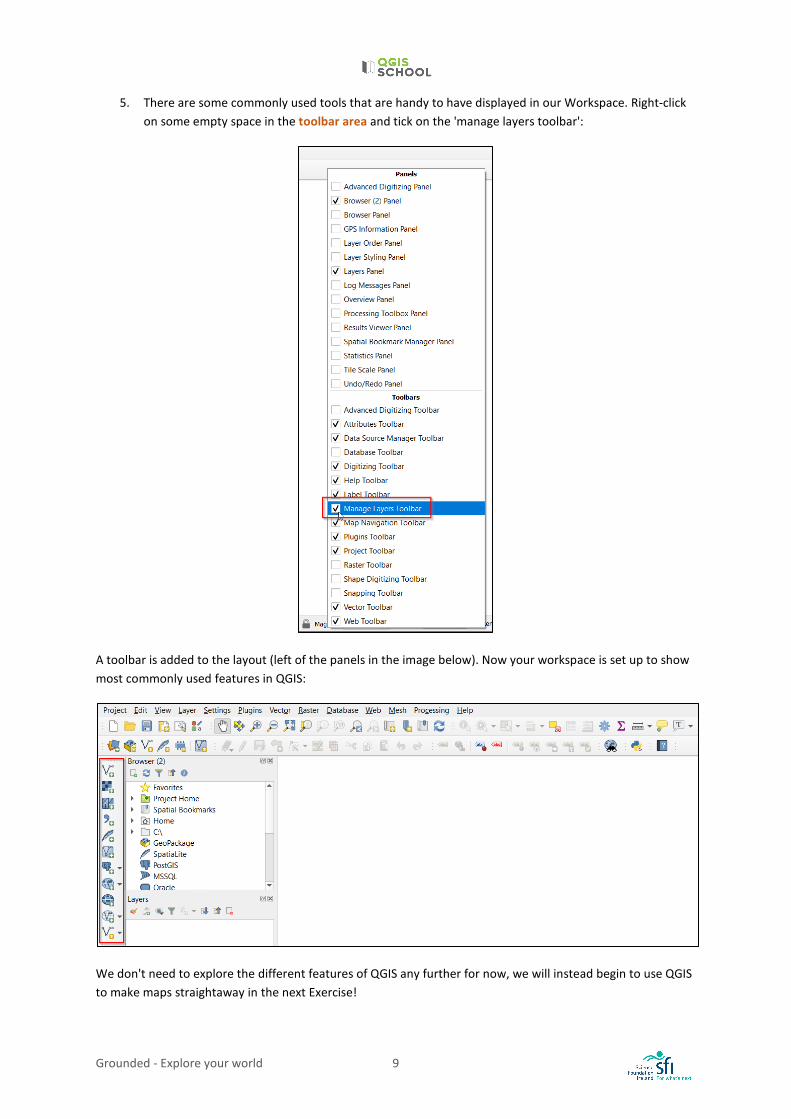
5. There are some commonly used tools that are handy to have displayed in our Workspace. Right-click on some empty space in the toolbar area and tick on the 'manage layers toolbar':
A toolbar is added to the layout (left of the panels in the image below). Now your workspace is set up to show most commonly used features in QGIS:
We don't need to explore the different features of QGIS any further for now, we will instead begin to use QGIS to make maps straightaway in the next Exercise!
Grounded - Explore your world 10
EXERCISE 1B: YOUR FIRST QGIS MAP You are now ready to create your first map using QGIS.
Note: Don't get wound up trying to remember steps or how to do things in QGIS, you can always refer back to this manual or watch the video tutorials (accessible here: https://cutt.ly/9jUZ7bE). You will get better at QGIS through repetition and with time.
Objective:
• Producing a digital map using QGIS.
Task: Showing your School Location
A craft is an activity involving skill in making things by hand. Your local town has launched a 'Craft Initiative' to encourage a more sustainable way of living e.g. producing local knits instead of selling imported clothing, creating wooden Christmas decorations instead of plastic versions.
In order to showcase local goods and encourage uptake of crafts, there is to be a craft fair held in your school. You've been asked by the Craft Fair Committee to make a map showing your school location in relation to surrounding roads. This map will be included in emails, posters, and the school's Facebook, to advertise the event and to help people find the fair.
Relevant Sustainable Development Goals:
Grounded - Explore your world 11
Exercise 1B Steps:
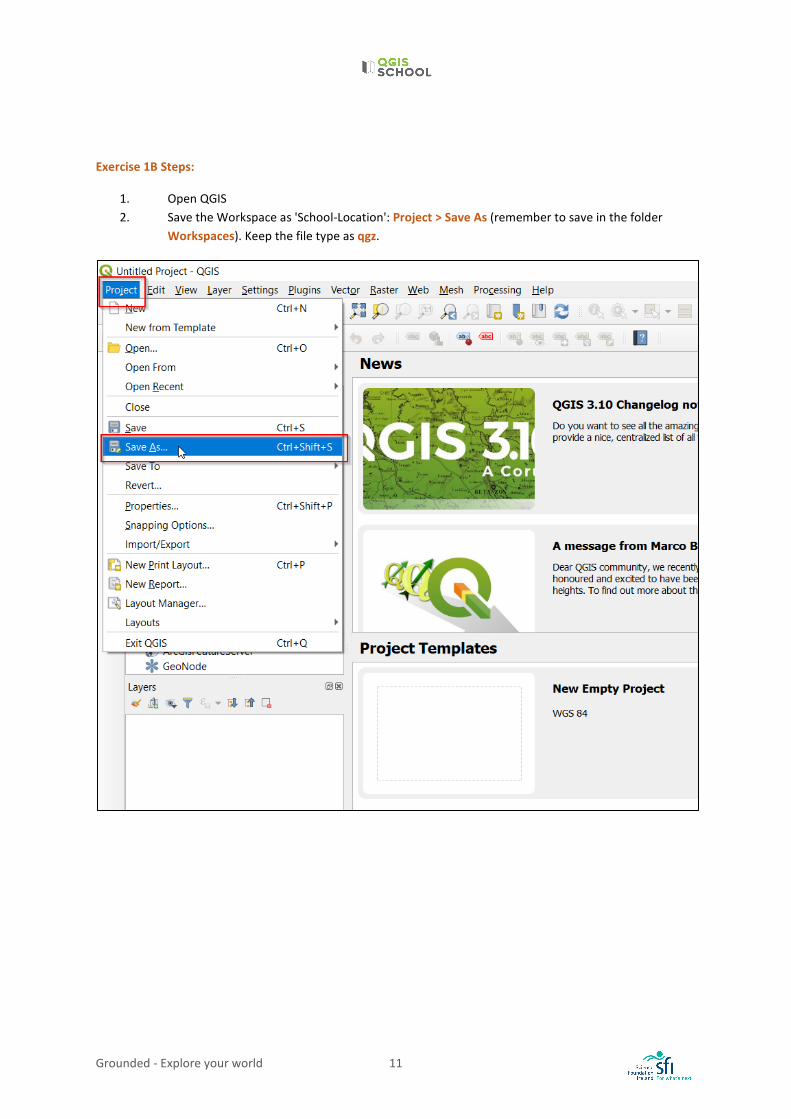
1. Open QGIS 2. Save the Workspace as 'School-Location': Project > Save As (remember to save in the folder
Workspaces). Keep the file type as qgz.
Grounded - Explore your world 12
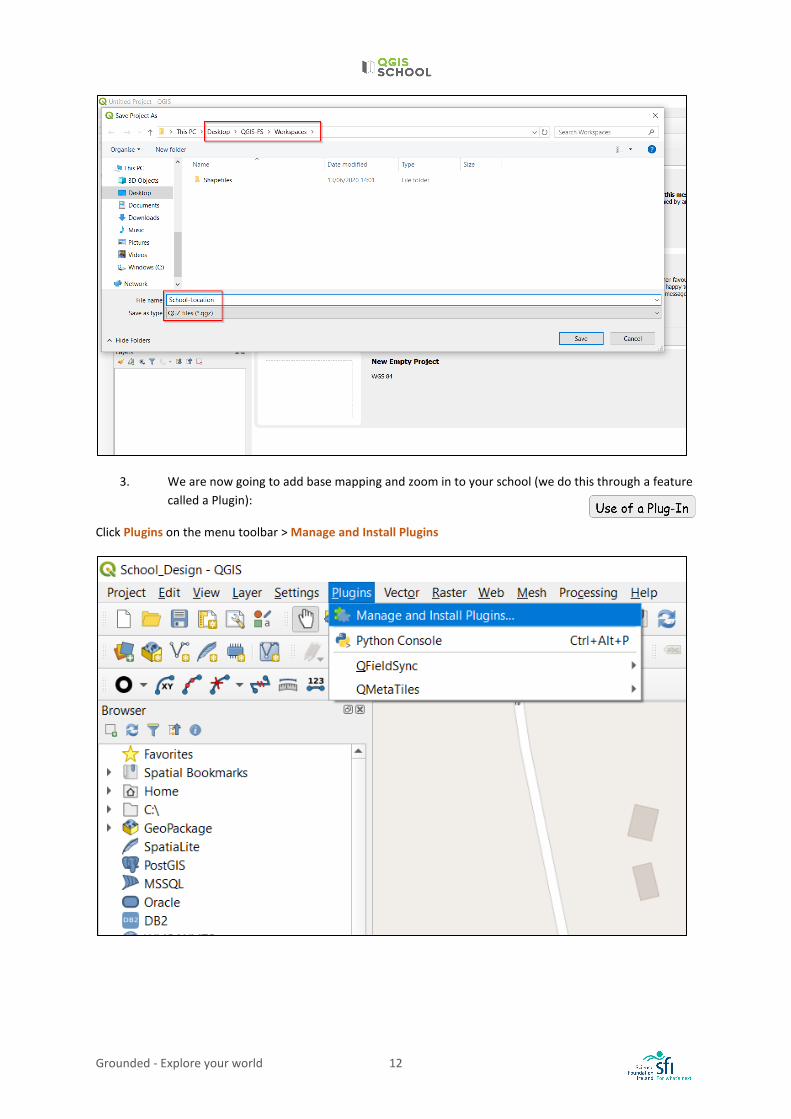
3. We are now going to add base mapping and zoom in to your school (we do this through a feature called a Plugin):
Click Plugins on the menu toolbar > Manage and Install Plugins
Grounded - Explore your world 13
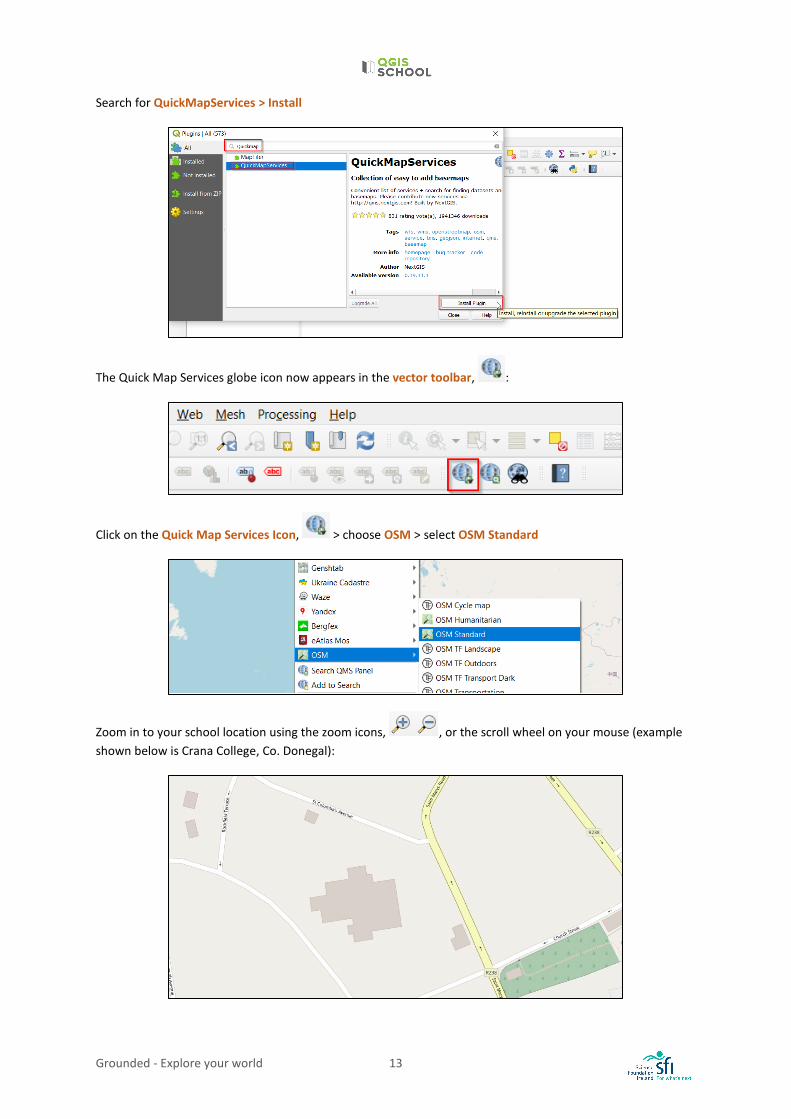
Search for QuickMapServices > Install
The Quick Map Services globe icon now appears in the vector toolbar, :
Click on the Quick Map Services Icon, > choose OSM > select OSM Standard
Zoom in to your school location using the zoom icons, , or the scroll wheel on your mouse (example shown below is Crana College, Co. Donegal):
Grounded - Explore your world 14
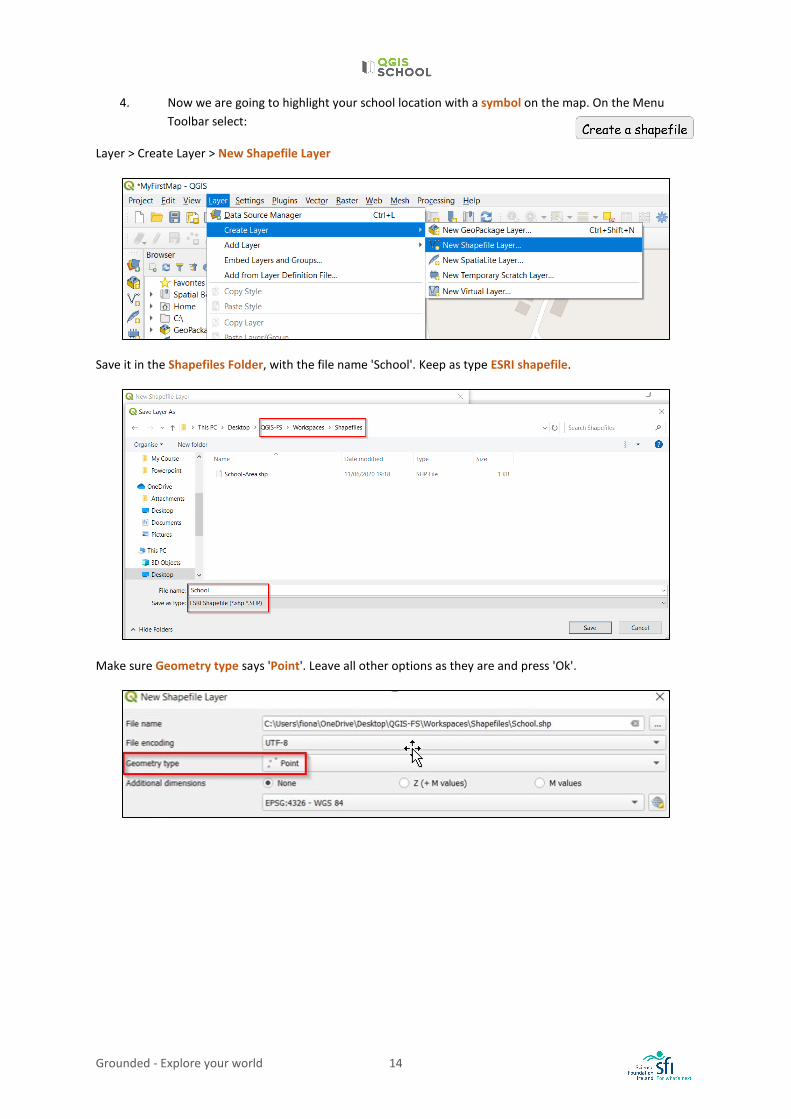
4. Now we are going to highlight your school location with a symbol on the map. On the Menu Toolbar select:
Layer > Create Layer > New Shapefile Layer
Save it in the Shapefiles Folder, with the file name 'School'. Keep as type ESRI shapefile.
Make sure Geometry type says 'Point'. Leave all other options as they are and press 'Ok'.
Grounded - Explore your world 15
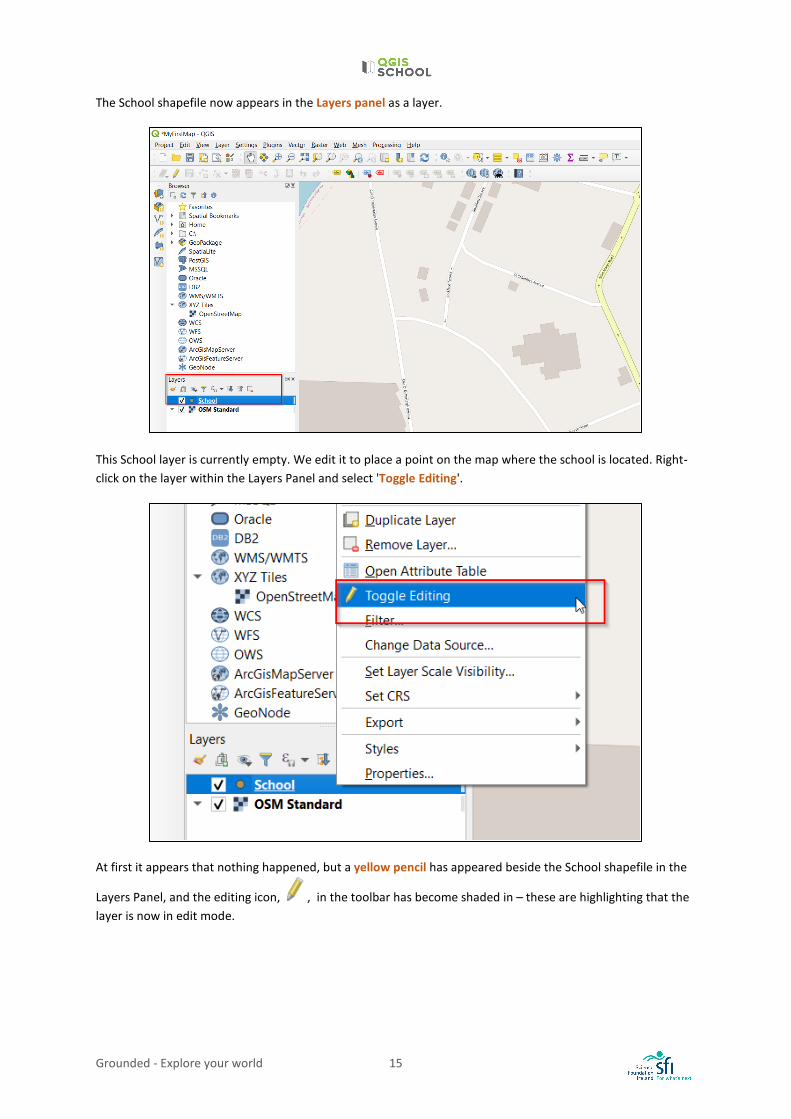
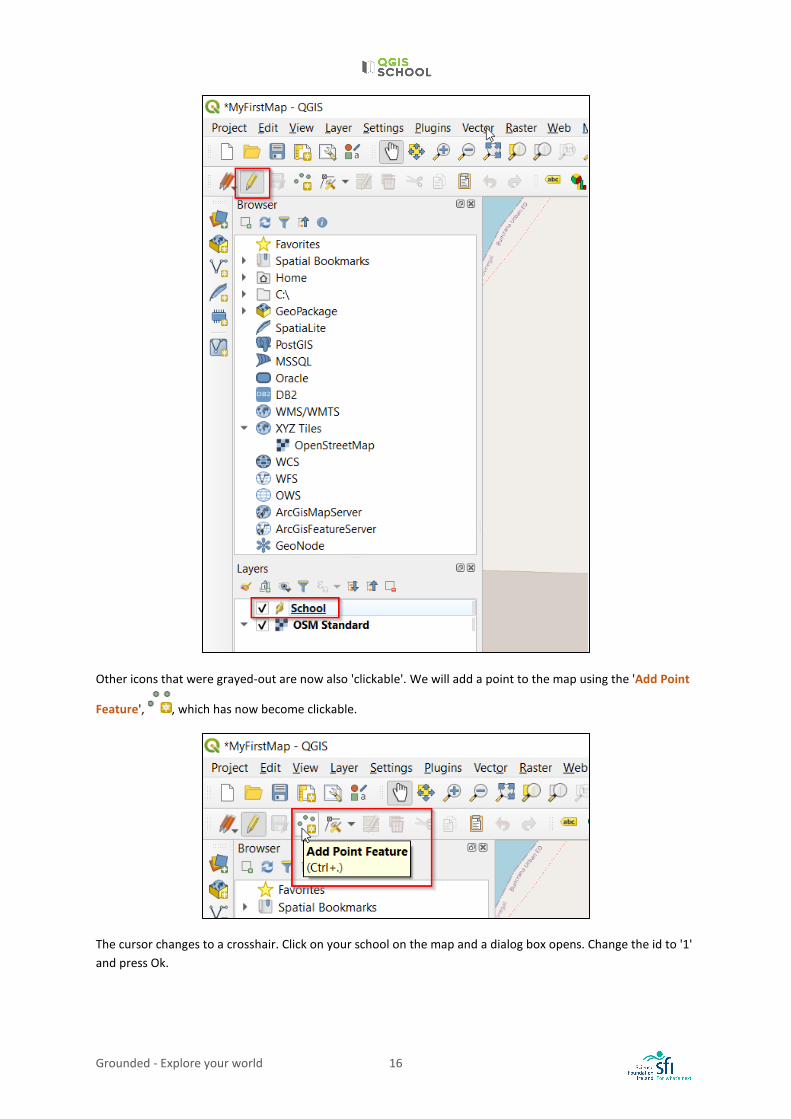
The School shapefile now appears in the Layers panel as a layer.
This School layer is currently empty. We edit it to place a point on the map where the school is located. Right-click on the layer within the Layers Panel and select 'Toggle Editing'.
At first it appears that nothing happened, but a yellow pencil has appeared beside the School shapefile in the
Layers Panel, and the editing icon, , in the toolbar has become shaded in – these are highlighting that the layer is now in edit mode.
Grounded - Explore your world 16
Other icons that were grayed-out are now also 'clickable'. We will add a point to the map using the 'Add Point
Feature', , which has now become clickable.
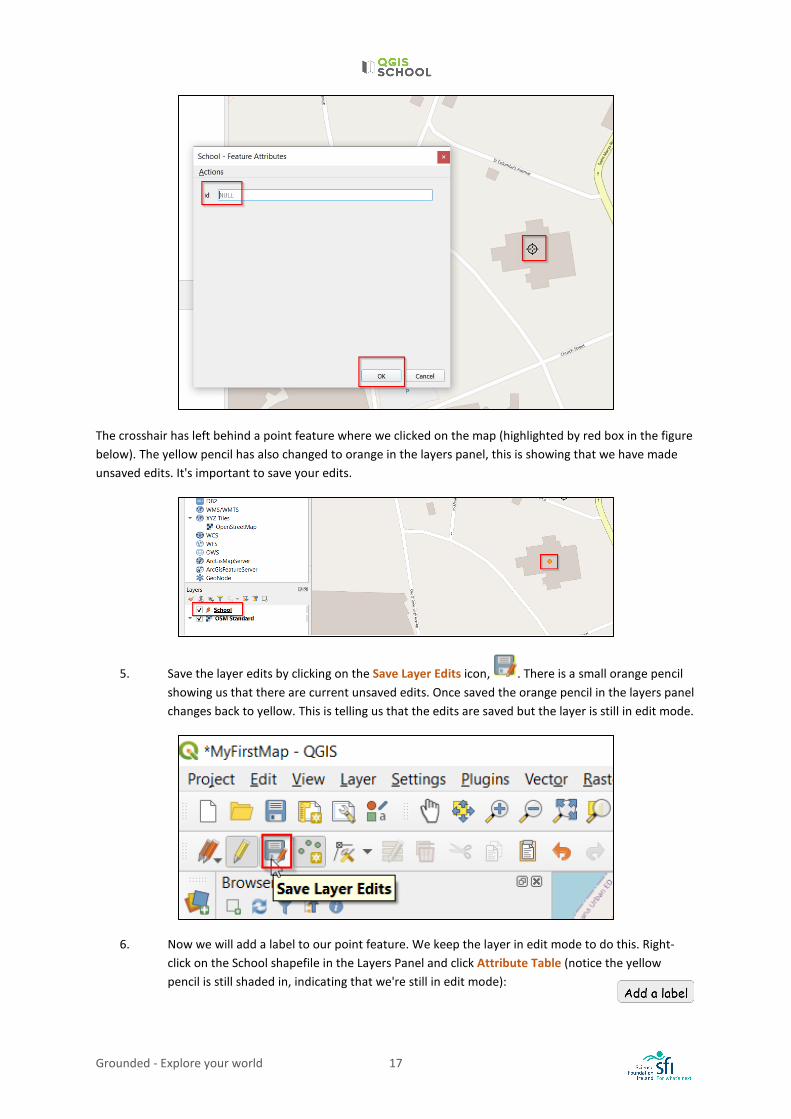
The cursor changes to a crosshair. Click on your school on the map and a dialog box opens. Change the id to '1' and press Ok.
Grounded - Explore your world 17
The crosshair has left behind a point feature where we clicked on the map (highlighted by red box in the figure below). The yellow pencil has also changed to orange in the layers panel, this is showing that we have made unsaved edits. It's important to save your edits.
5. Save the layer edits by clicking on the Save Layer Edits icon, . There is a small orange pencil showing us that there are current unsaved edits. Once saved the orange pencil in the layers panel changes back to yellow. This is telling us that the edits are saved but the layer is still in edit mode.
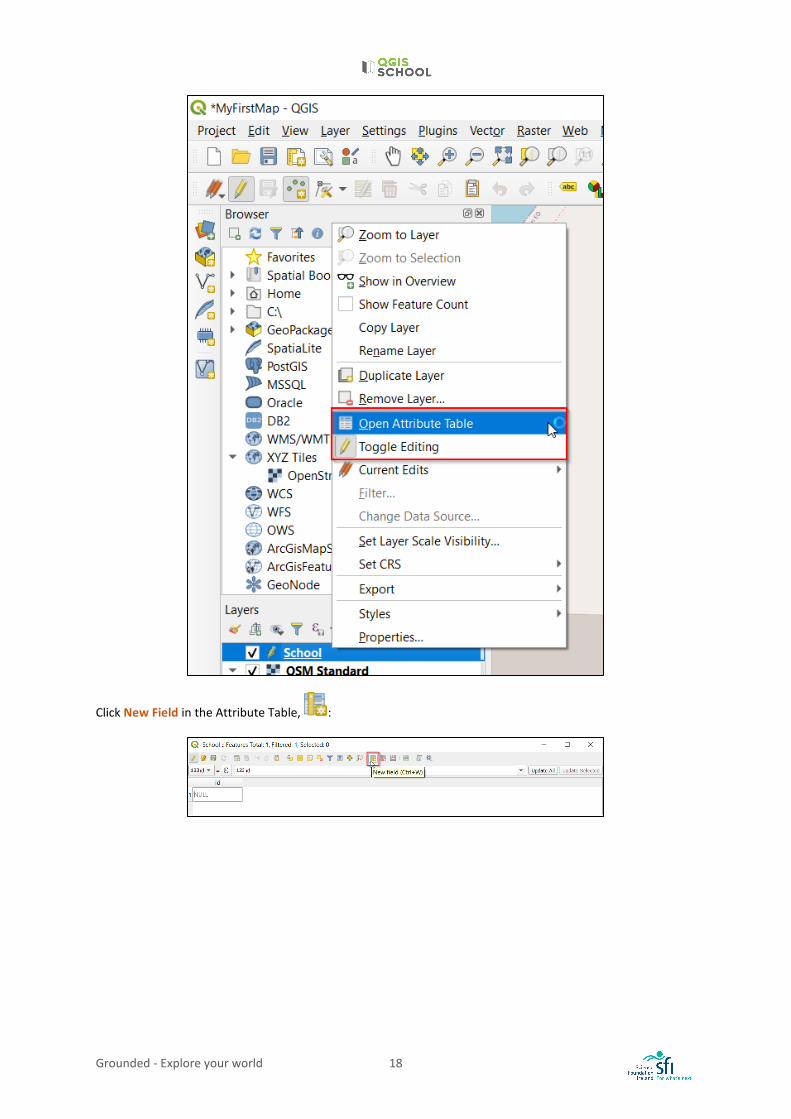
6. Now we will add a label to our point feature. We keep the layer in edit mode to do this. Right-click on the School shapefile in the Layers Panel and click Attribute Table (notice the yellow pencil is still shaded in, indicating that we're still in edit mode):
Grounded - Explore your world 18
Click New Field in the Attribute Table, :
Grounded - Explore your world 19
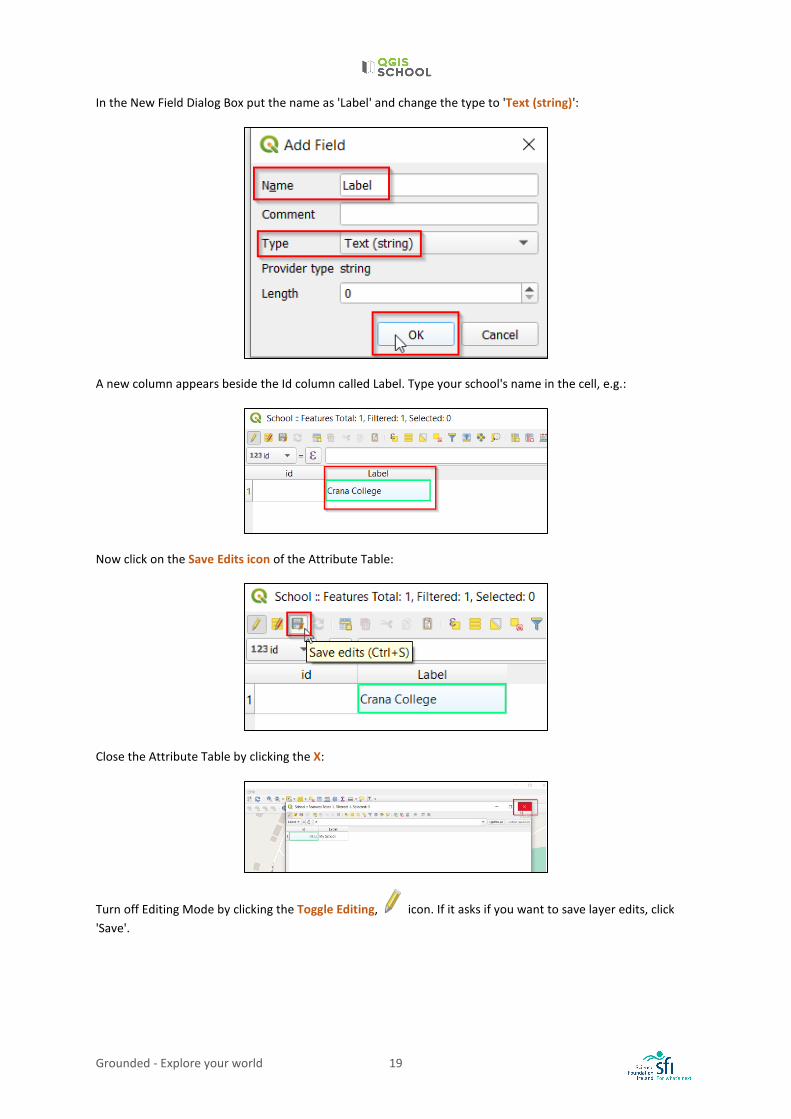
In the New Field Dialog Box put the name as 'Label' and change the type to 'Text (string)':
A new column appears beside the Id column called Label. Type your school's name in the cell, e.g.:
Now click on the Save Edits icon of the Attribute Table:
Close the Attribute Table by clicking the X:
Turn off Editing Mode by clicking the Toggle Editing, icon. If it asks if you want to save layer edits, click 'Save'.
Grounded - Explore your world 20
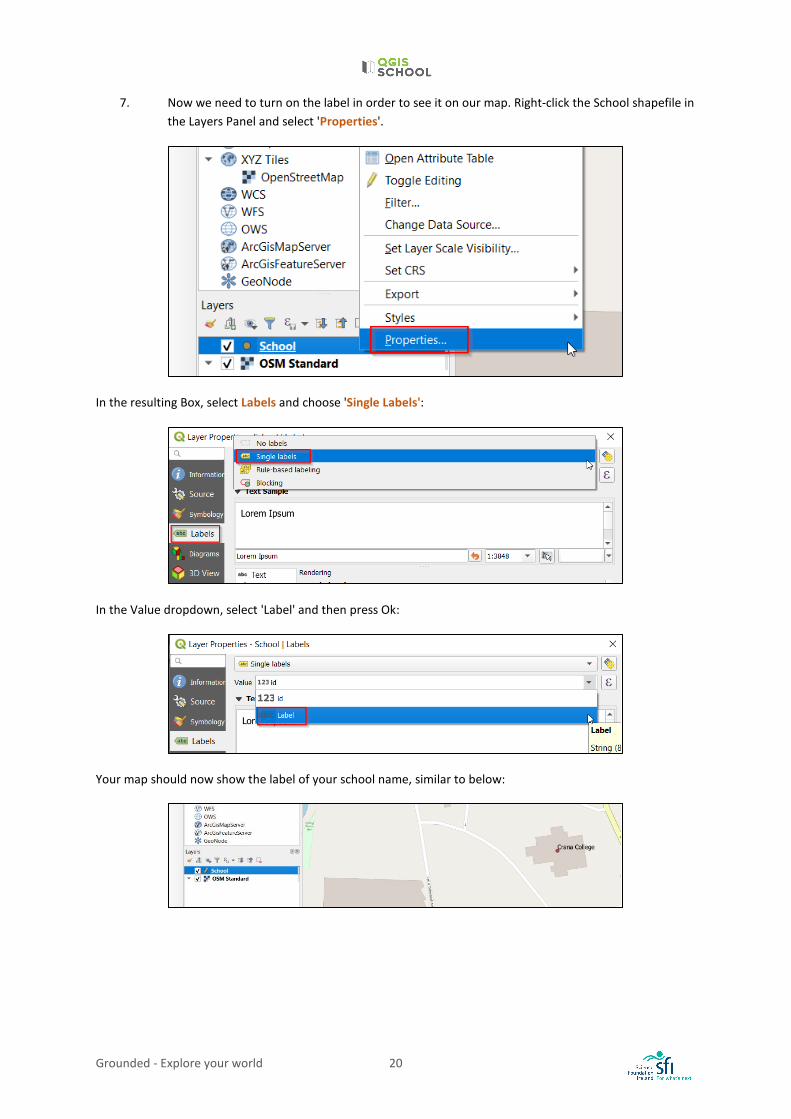
7. Now we need to turn on the label in order to see it on our map. Right-click the School shapefile in the Layers Panel and select 'Properties'.
In the resulting Box, select Labels and choose 'Single Labels':
In the Value dropdown, select 'Label' and then press Ok:
Your map should now show the label of your school name, similar to below:
Grounded - Explore your world 21
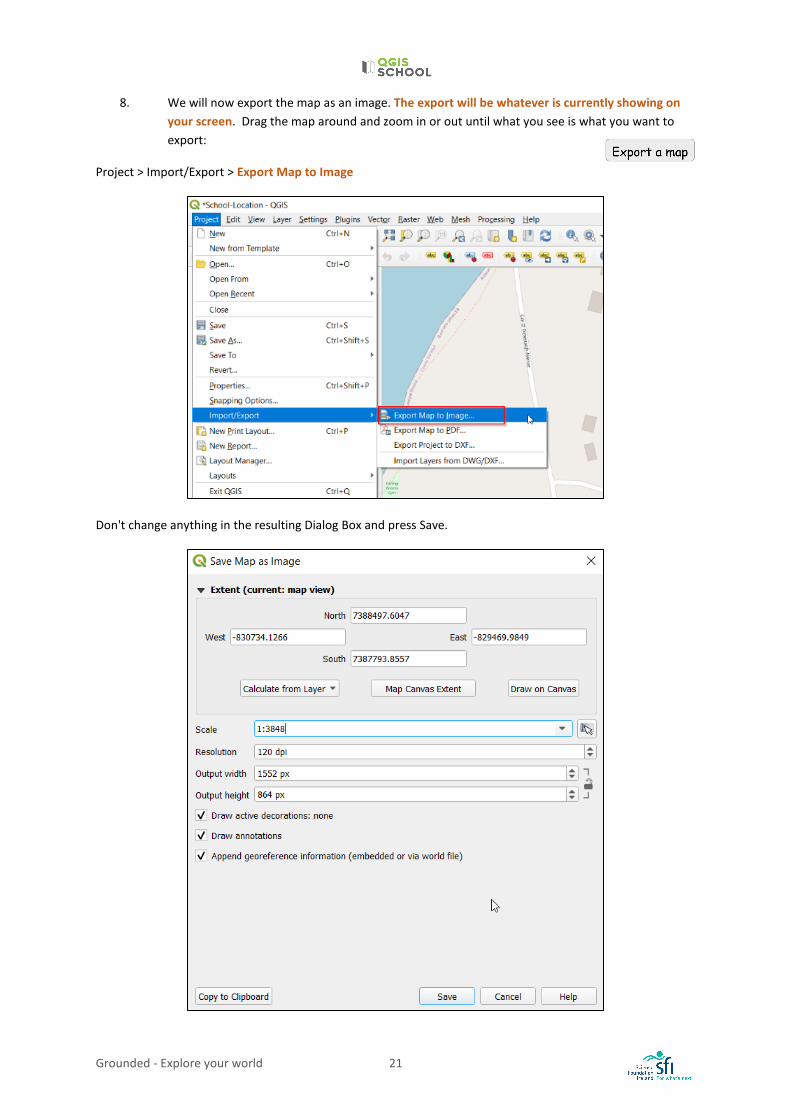
8. We will now export the map as an image. The export will be whatever is currently showing on your screen. Drag the map around and zoom in or out until what you see is what you want to export:
Project > Import/Export > Export Map to Image
Don't change anything in the resulting Dialog Box and press Save.
Grounded - Explore your world 22
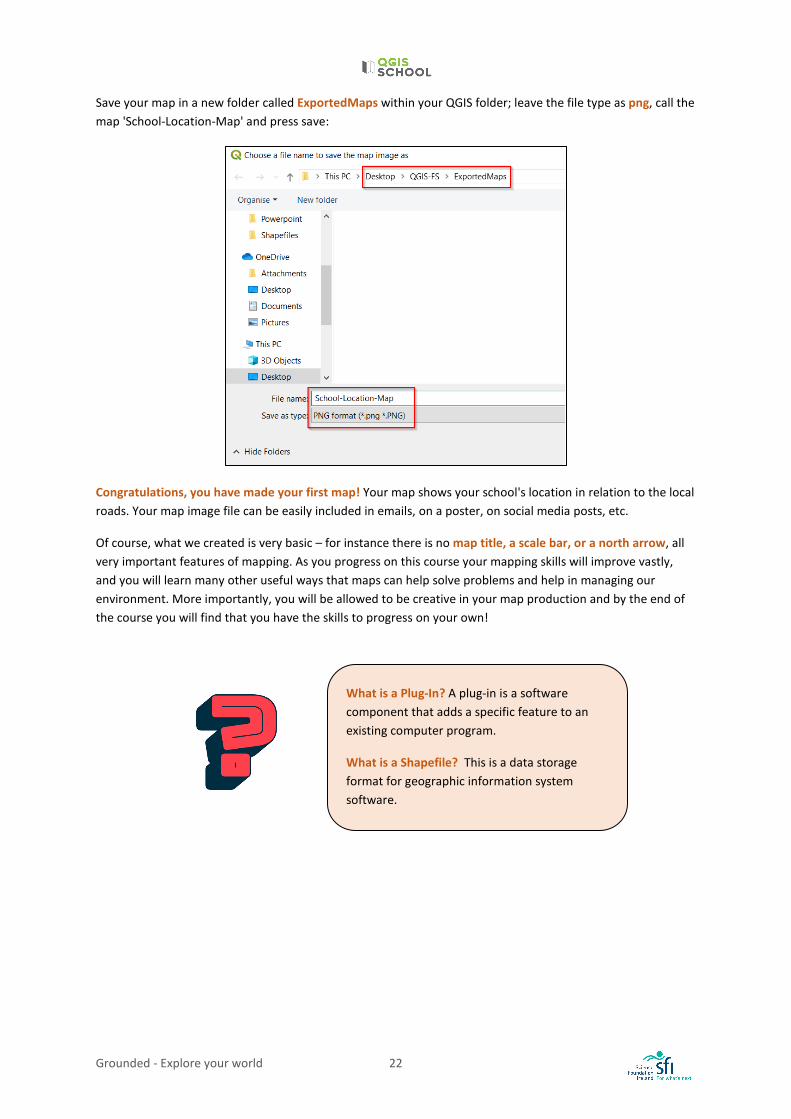
Save your map in a new folder called ExportedMaps within your QGIS folder; leave the file type as png, call the map 'School-Location-Map' and press save:
Congratulations, you have made your first map! Your map shows your school's location in relation to the local roads. Your map image file can be easily included in emails, on a poster, on social media posts, etc.
Of course, what we created is very basic – for instance there is no map title, a scale bar, or a north arrow, all very important features of mapping. As you progress on this course your mapping skills will improve vastly, and you will learn many other useful ways that maps can help solve problems and help in managing our environment. More importantly, you will be allowed to be creative in your map production and by the end of the course you will find that you have the skills to progress on your own!
What is a Plug-In? A plug-in is a software component that adds a specific feature to an existing computer program.
What is a Shapefile? This is a data storage format for geographic information system software.
Grounded - Explore your world 23
LESSON 2: MAP LAYOUT
LEARNING OUTCOMES: • Understanding of map elements
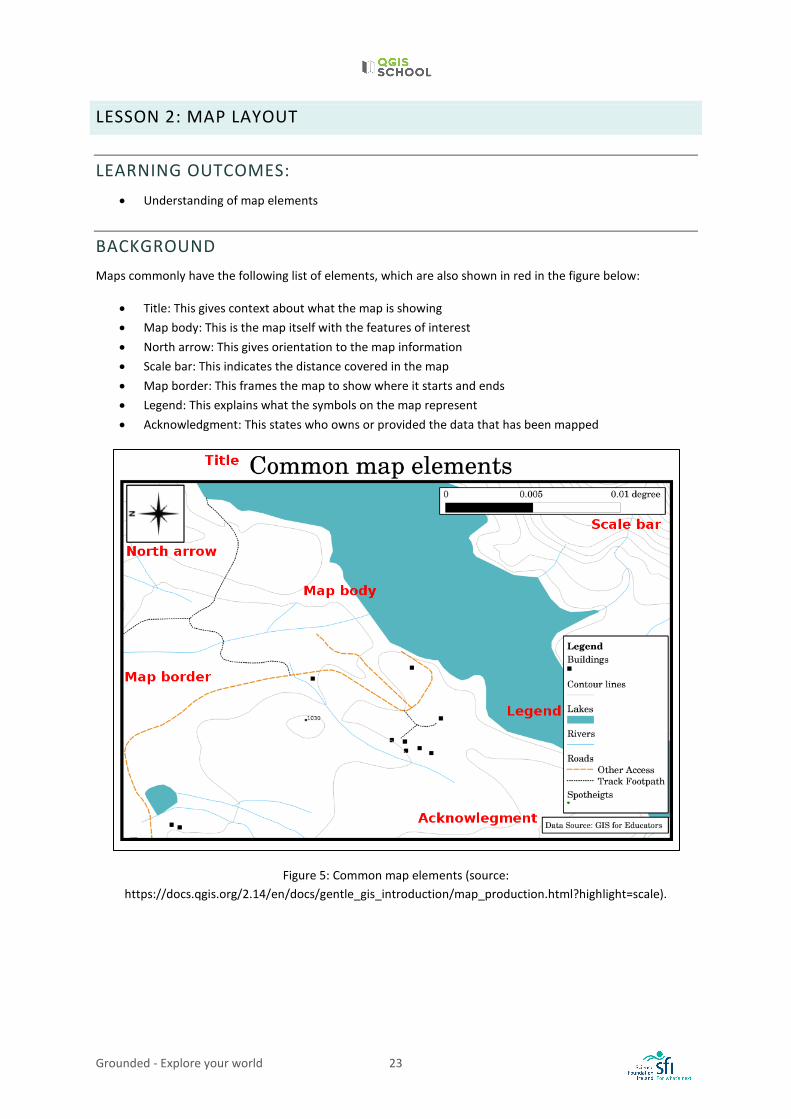
BACKGROUND Maps commonly have the following list of elements, which are also shown in red in the figure below:
• Title: This gives context about what the map is showing • Map body: This is the map itself with the features of interest • North arrow: This gives orientation to the map information • Scale bar: This indicates the distance covered in the map • Map border: This frames the map to show where it starts and ends • Legend: This explains what the symbols on the map represent • Acknowledgment: This states who owns or provided the data that has been mapped
Figure 5: Common map elements (source: https://docs.qgis.org/2.14/en/docs/gentle_gis_introduction/map_production.html?highlight=scale).
Grounded - Explore your world 24
EXERCISE 2: INTRO TO THE PRINT COMPOSER In the previous lesson we learned how to create a basic map. This lesson will develop your skills to show some additional useful information commonly shown on maps.
Don't forget, all the steps are also demonstrated in the video tutorial, accessible here: https://cutt.ly/9jUZ7bE.
Objective:
• Produce a more 'complete' map with common map elements.
Task: Craft Fair Map Draft 2
Following on from Exercise 1B, the Craft Fair committee have a few edit requests for your map. You must edit your map to include the following:
• Title: *School Name* Craft Fair Location Map e.g. 'Crana College Craft Fair Location Map' • Map border • Scale bar • North arrow
Exercise 2 Steps:
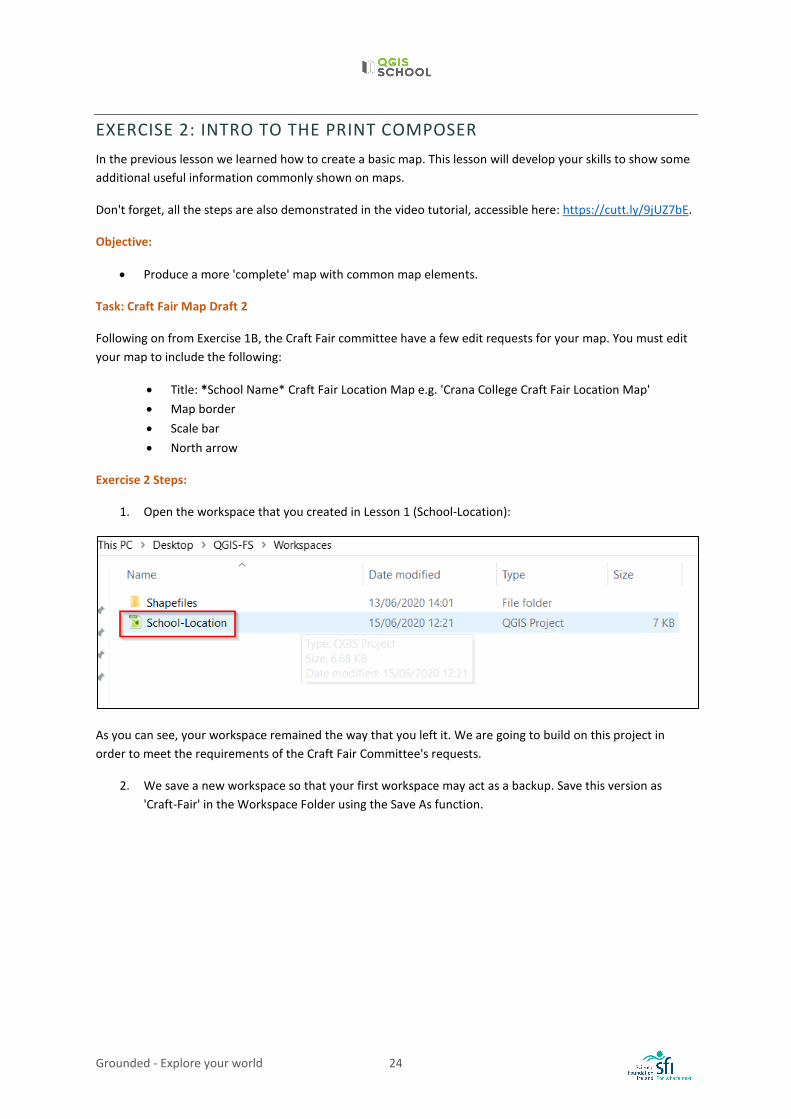
1. Open the workspace that you created in Lesson 1 (School-Location):
As you can see, your workspace remained the way that you left it. We are going to build on this project in order to meet the requirements of the Craft Fair Committee's requests.
2. We save a new workspace so that your first workspace may act as a backup. Save this version as 'Craft-Fair' in the Workspace Folder using the Save As function.
Grounded - Explore your world 25
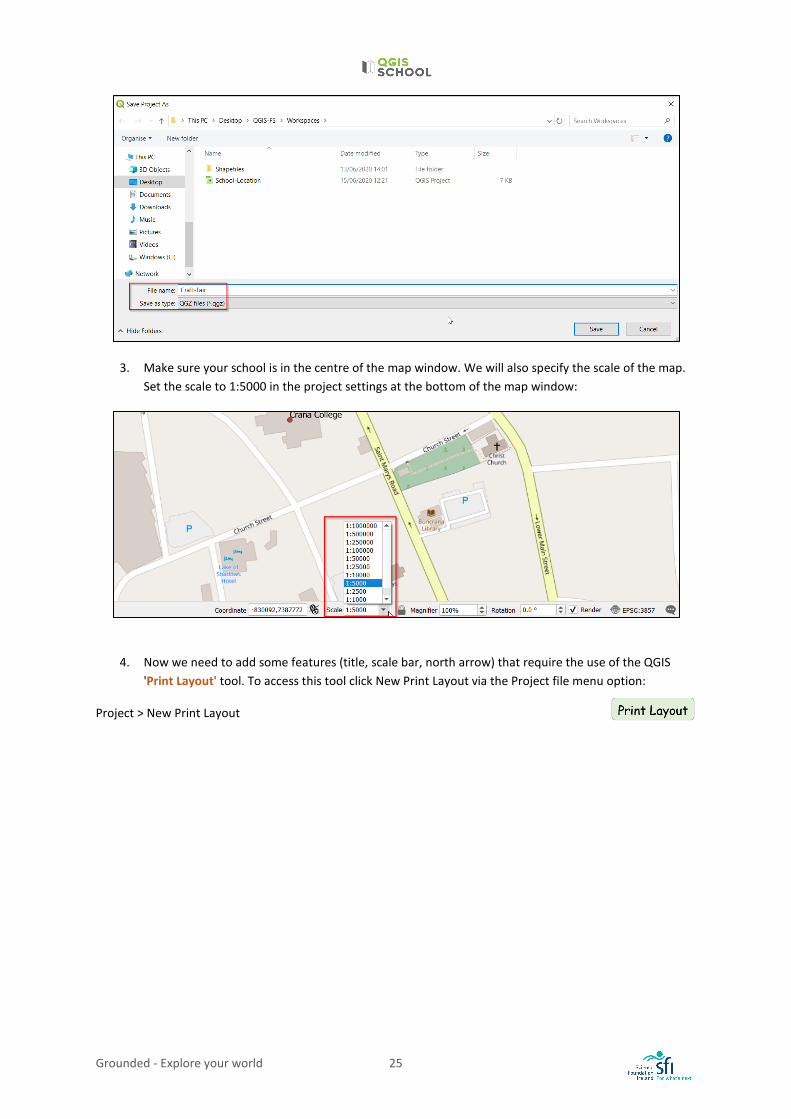
3. Make sure your school is in the centre of the map window. We will also specify the scale of the map. Set the scale to 1:5000 in the project settings at the bottom of the map window:
4. Now we need to add some features (title, scale bar, north arrow) that require the use of the QGIS
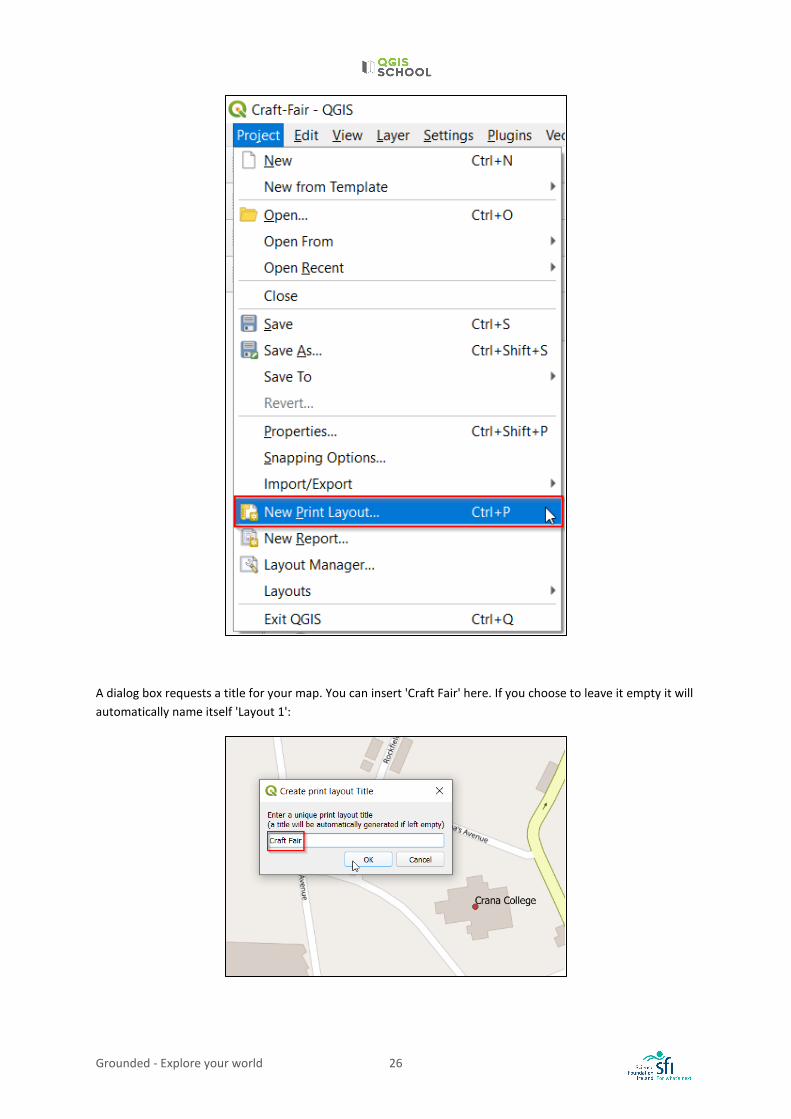
'Print Layout' tool. To access this tool click New Print Layout via the Project file menu option:
Project > New Print Layout
Grounded - Explore your world 26
A dialog box requests a title for your map. You can insert 'Craft Fair' here. If you choose to leave it empty it will automatically name itself 'Layout 1':
Grounded - Explore your world 27
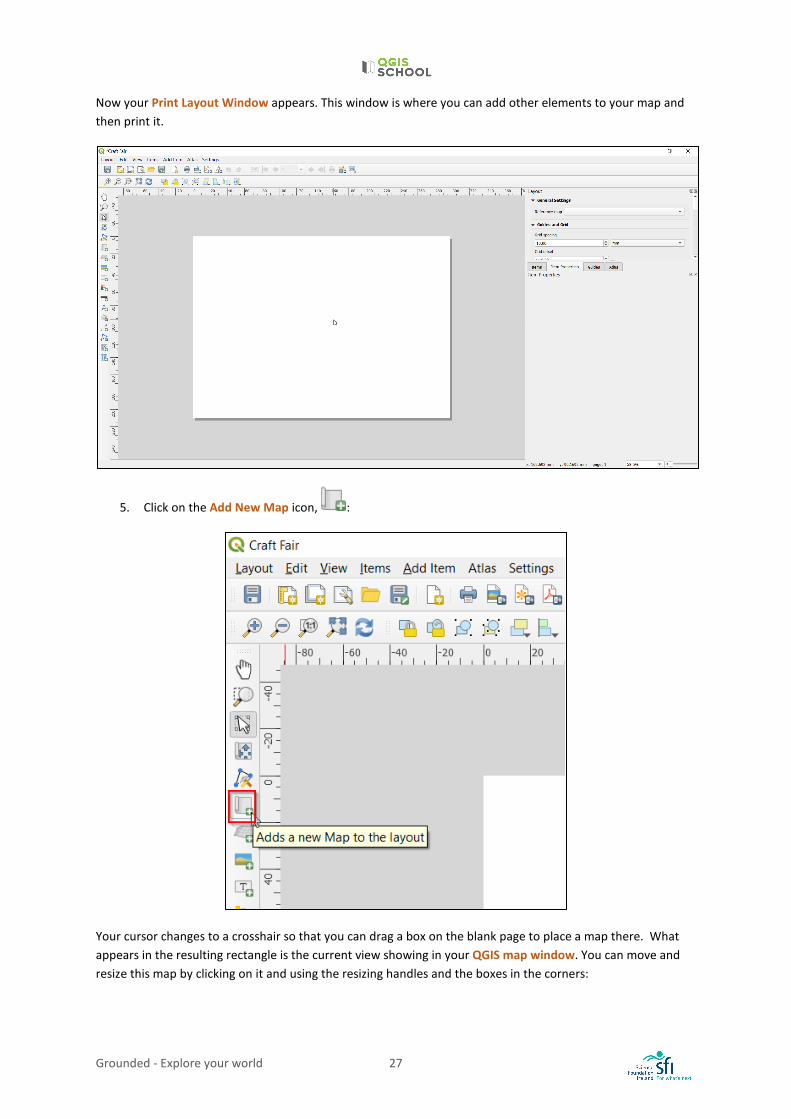
Now your Print Layout Window appears. This window is where you can add other elements to your map and then print it.
5. Click on the Add New Map icon, :
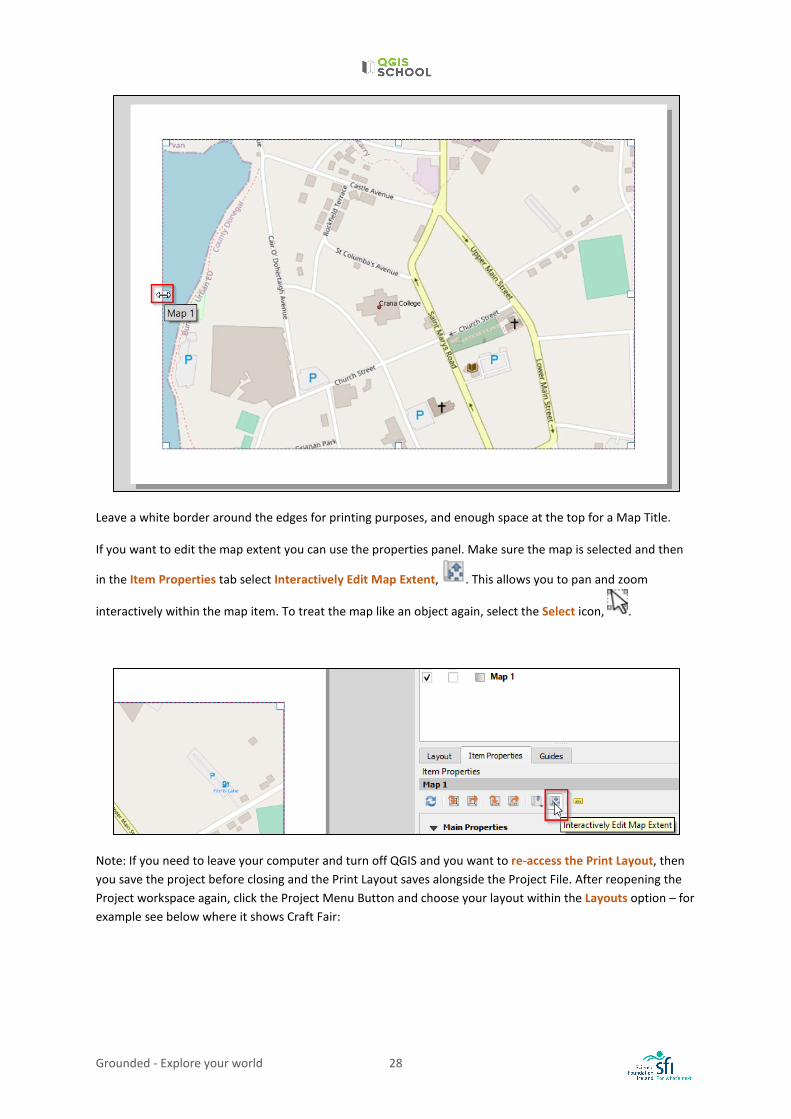
Your cursor changes to a crosshair so that you can drag a box on the blank page to place a map there. What appears in the resulting rectangle is the current view showing in your QGIS map window. You can move and resize this map by clicking on it and using the resizing handles and the boxes in the corners:
Grounded - Explore your world 28
Leave a white border around the edges for printing purposes, and enough space at the top for a Map Title.
If you want to edit the map extent you can use the properties panel. Make sure the map is selected and then
in the Item Properties tab select Interactively Edit Map Extent, . This allows you to pan and zoom
interactively within the map item. To treat the map like an object again, select the Select icon, .
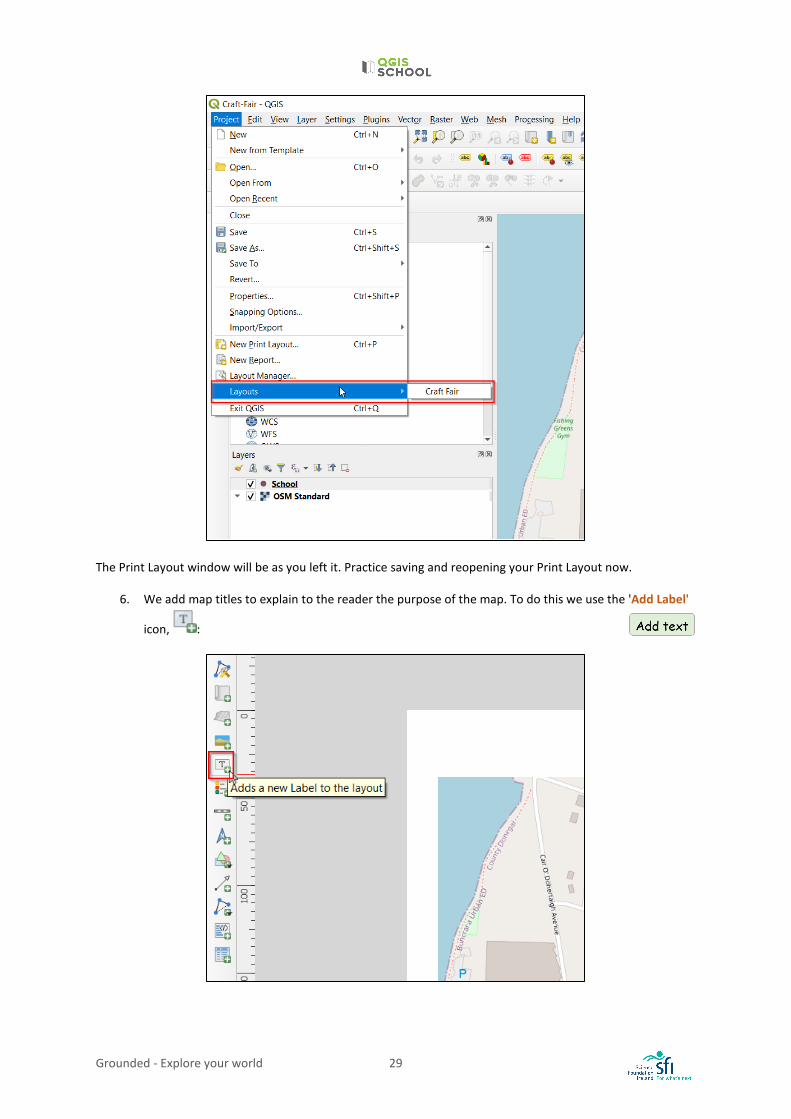
Note: If you need to leave your computer and turn off QGIS and you want to re-access the Print Layout, then you save the project before closing and the Print Layout saves alongside the Project File. After reopening the Project workspace again, click the Project Menu Button and choose your layout within the Layouts option – for example see below where it shows Craft Fair:
Grounded - Explore your world 29
The Print Layout window will be as you left it. Practice saving and reopening your Print Layout now.
6. We add map titles to explain to the reader the purpose of the map. To do this we use the 'Add Label'
icon, :
Grounded - Explore your world 30
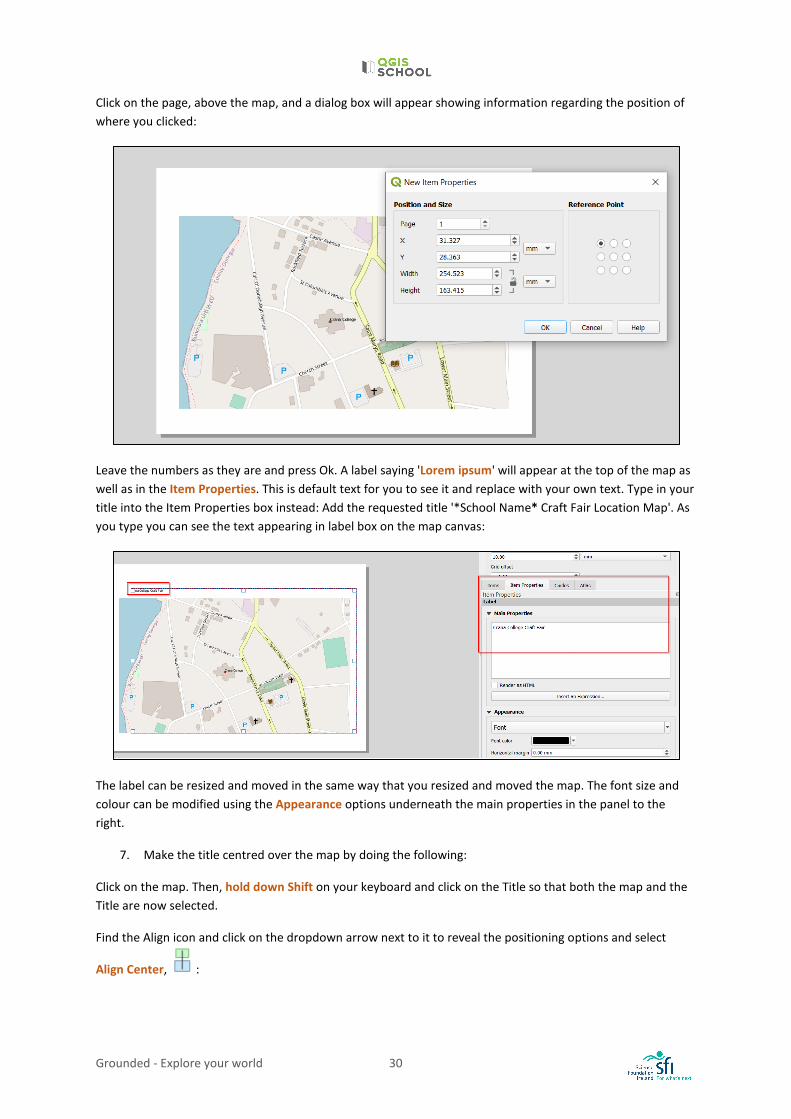
Click on the page, above the map, and a dialog box will appear showing information regarding the position of where you clicked:
Leave the numbers as they are and press Ok. A label saying 'Lorem ipsum' will appear at the top of the map as well as in the Item Properties. This is default text for you to see it and replace with your own text. Type in your title into the Item Properties box instead: Add the requested title '*School Name* Craft Fair Location Map'. As you type you can see the text appearing in label box on the map canvas:
The label can be resized and moved in the same way that you resized and moved the map. The font size and colour can be modified using the Appearance options underneath the main properties in the panel to the right.
7. Make the title centred over the map by doing the following:
Click on the map. Then, hold down Shift on your keyboard and click on the Title so that both the map and the Title are now selected.
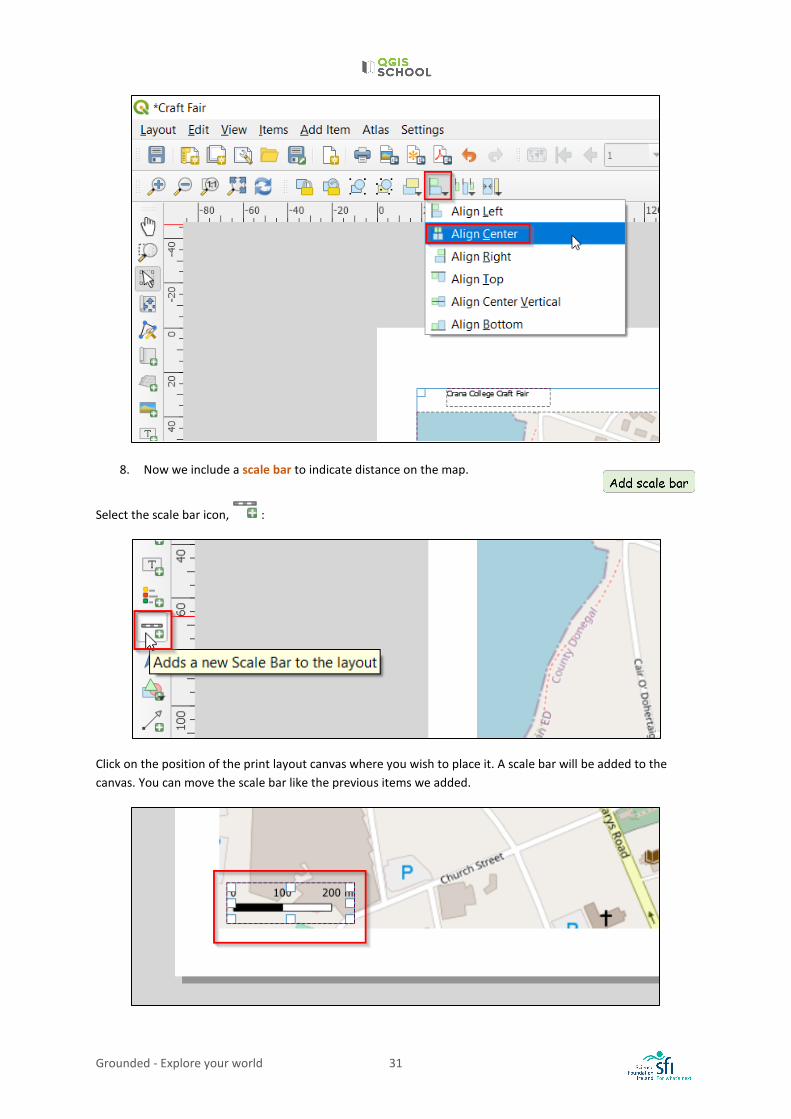
Find the Align icon and click on the dropdown arrow next to it to reveal the positioning options and select
Align Center, :
Grounded - Explore your world 31
8. Now we include a scale bar to indicate distance on the map.
Select the scale bar icon, :
Click on the position of the print layout canvas where you wish to place it. A scale bar will be added to the canvas. You can move the scale bar like the previous items we added.
Grounded - Explore your world 32
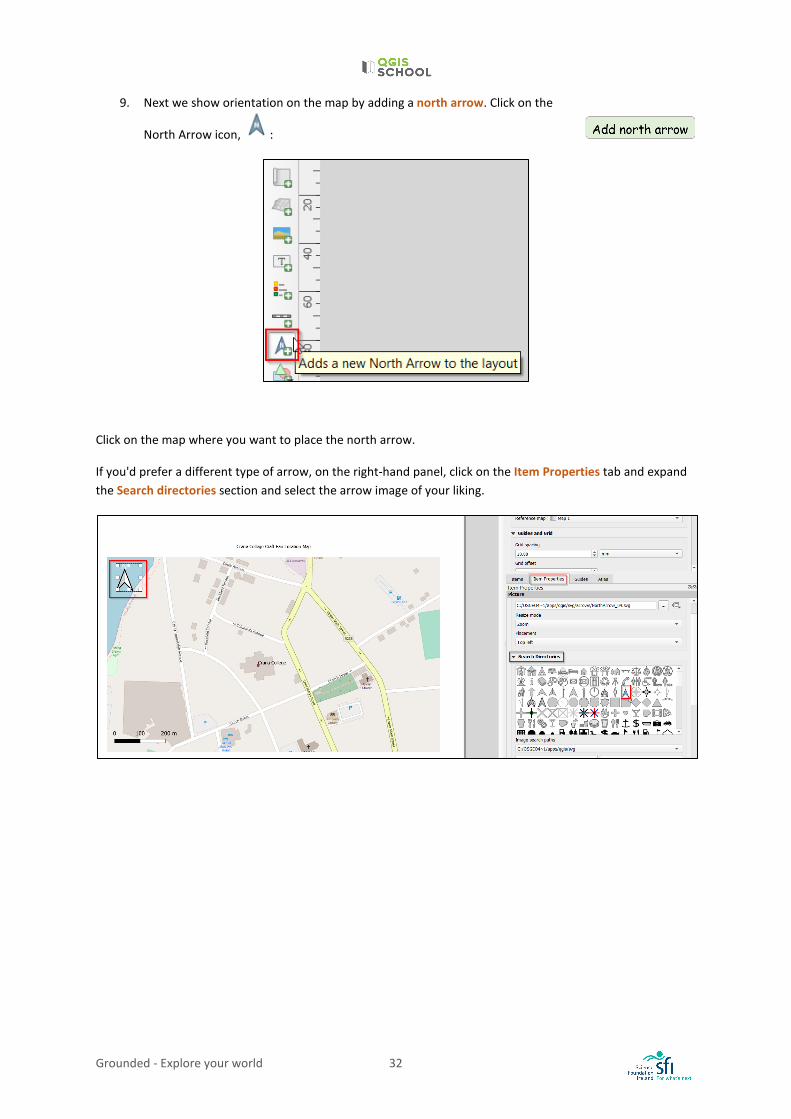
9. Next we show orientation on the map by adding a north arrow. Click on the
North Arrow icon, :
Click on the map where you want to place the north arrow.
If you'd prefer a different type of arrow, on the right-hand panel, click on the Item Properties tab and expand the Search directories section and select the arrow image of your liking.
Grounded - Explore your world 33
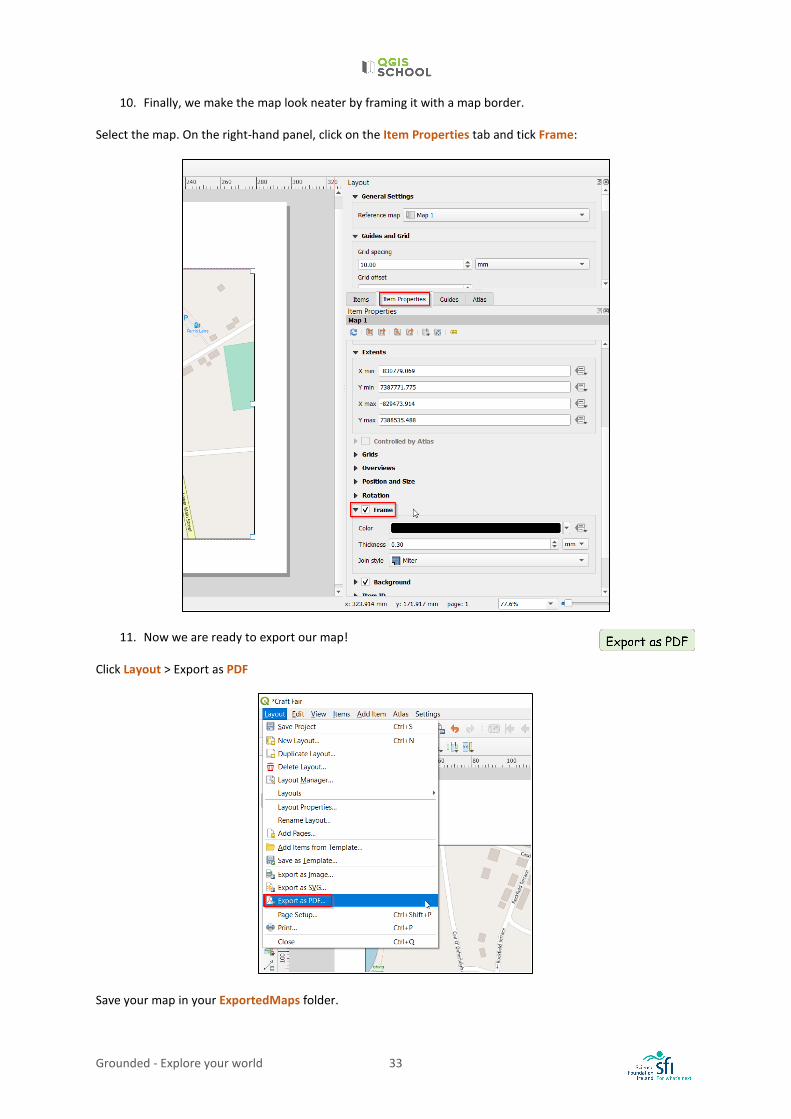
10. Finally, we make the map look neater by framing it with a map border.
Select the map. On the right-hand panel, click on the Item Properties tab and tick Frame:
11. Now we are ready to export our map!
Click Layout > Export as PDF
Save your map in your ExportedMaps folder.
Grounded - Explore your world 34
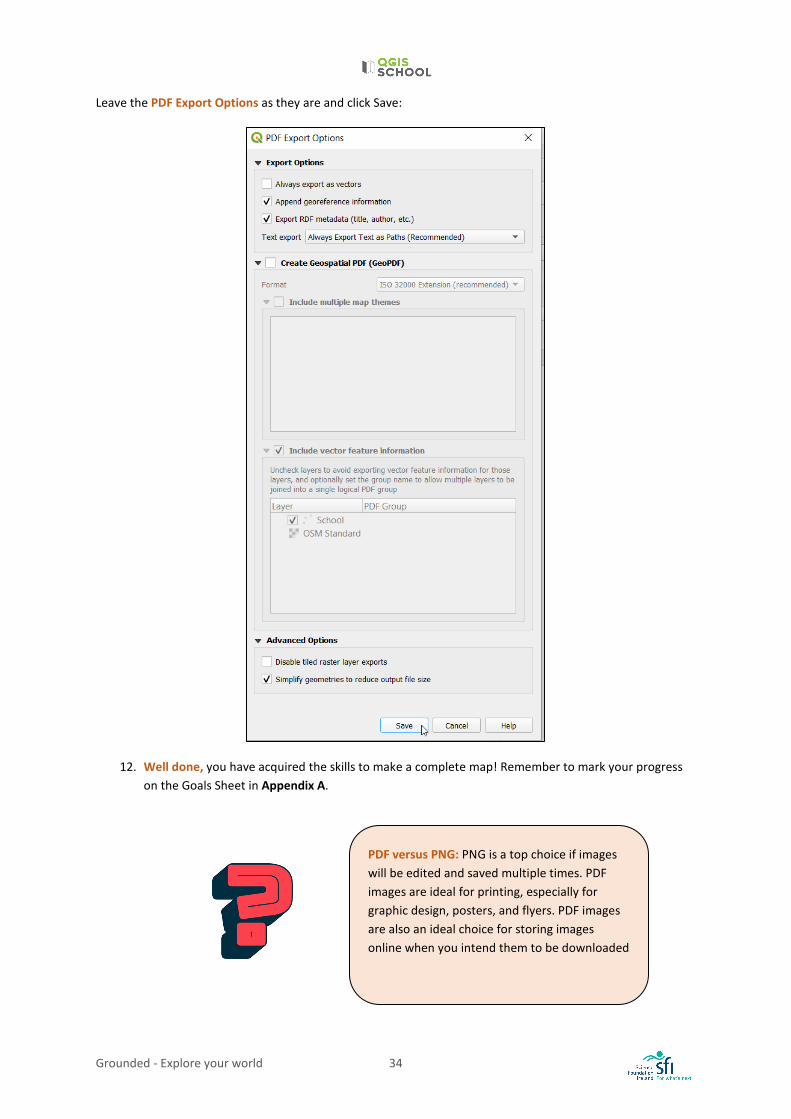
Leave the PDF Export Options as they are and click Save:
12. Well done, you have acquired the skills to make a complete map! Remember to mark your progress on the Goals Sheet in Appendix A.
PDF versus PNG: PNG is a top choice if images will be edited and saved multiple times. PDF images are ideal for printing, especially for graphic design, posters, and flyers. PDF images are also an ideal choice for storing images online when you intend them to be downloaded
Grounded - Explore your world 35
LESSON 3: QGIS FOR MANAGEMENT DECISIONS
LEARNING OUTCOMES: • Introduction to coordinate reference systems • Linking environment with mental health • Consideration of accessibility requirements
BACKGROUND The WHO (World Health Organisation) recommends a minimum of 9 m2 of green areas by person, in urban areas. Green areas are public spaces dedicated for recreation/leisure. This is because green space has been recognised as key for people's mental wellbeing. Research indicates that the amount of green space for individuals is potentially linked with higher rates of depression and other mental health disorders.
Which city or towns in Ireland do you think have high or low amounts of green space per person?
Curitiba city in Brazil has one of the greatest areas of green space per person, with 52 m2 per person, followed by New York, Madrid, and Santiago, Chile. Among the cities with the least green space per person are Tokyo and Buenos Aires with 1.9 m2.
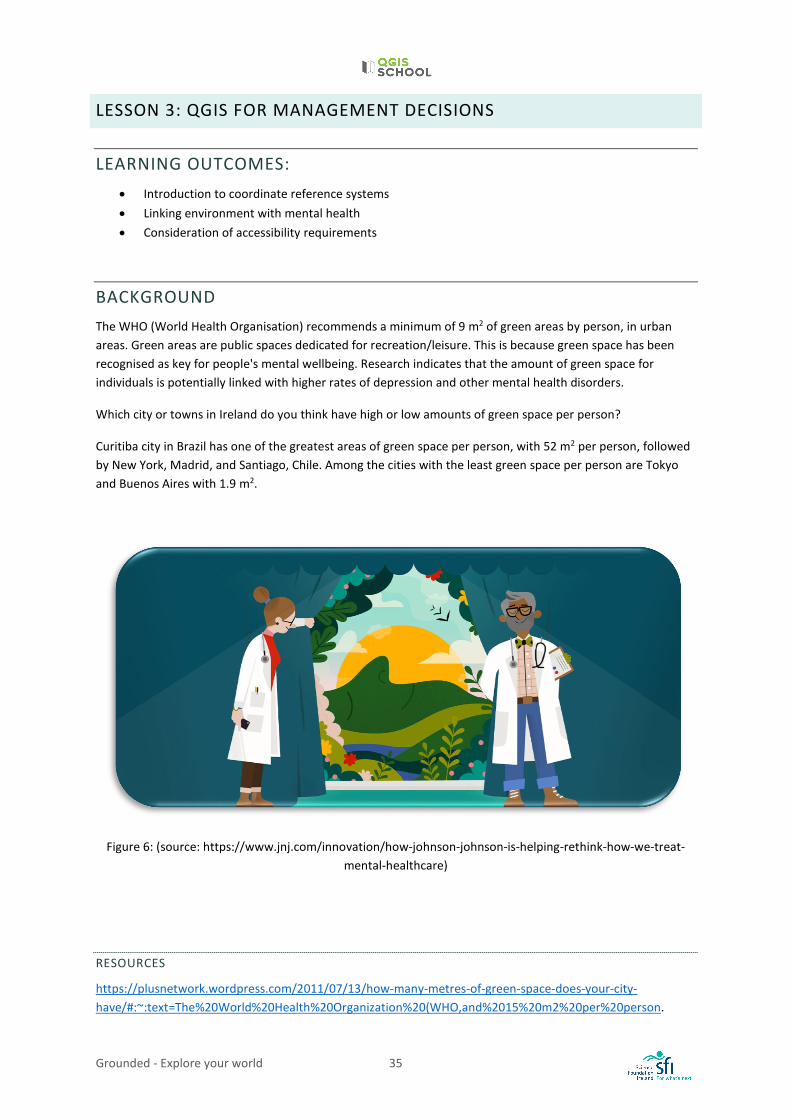
Figure 6: (source: https://www.jnj.com/innovation/how-johnson-johnson-is-helping-rethink-how-we-treat-mental-healthcare)
RESOURCES
https://plusnetwork.wordpress.com/2011/07/13/how-many-metres-of-green-space-does-your-city-have/#:~:text=The%20World%20Health%20Organization%20(WHO,and%2015%20m2%20per%20person.
Grounded - Explore your world 36
EXERCISE 3: USING QGIS TO MEASURE AREA We will develop our GIS skills by solving some more real-world type problems. This Exercise will gather information about your school area for use in practical management decisions.
Don't forget, all the steps are also demonstrated in the video tutorial, accessible here: https://cutt.ly/9jUZ7bE.
Objective:
• To use QGIS to delineate and measure areas. • To realise the utility of Geographic Information Systems for the analysis and presentation of spatial
information, and for supporting decision-making processes.
TASK: School Green Spaces
The government is doing an inspection on all schools to make sure that they are adequately designed to have enough 'green space' for student wellbeing.
You have been tasked with creating a map for the Inspector, showing the amount of green space in the school grounds. You are also asked to address the following questions:
1. What percentage of the school grounds is allocated to green space? 2. Are the green spaces being used effectively (can they be enjoyed)? 3. Is there enough done to cater for people with accessibility requirements? Include any suggestions.
Note – if your school has zero green space, you can complete this exercise to work out what percentage of grounds is allocated to car parking instead.
Relevant Sustainable Development Goals:
Grounded - Explore your world 37
Exercise 3 Steps:
1. To practice creating a project we will not use any of our previous workspaces. Open QGIS and save the blank Workspace as 'School-Green' (Project> Save As).
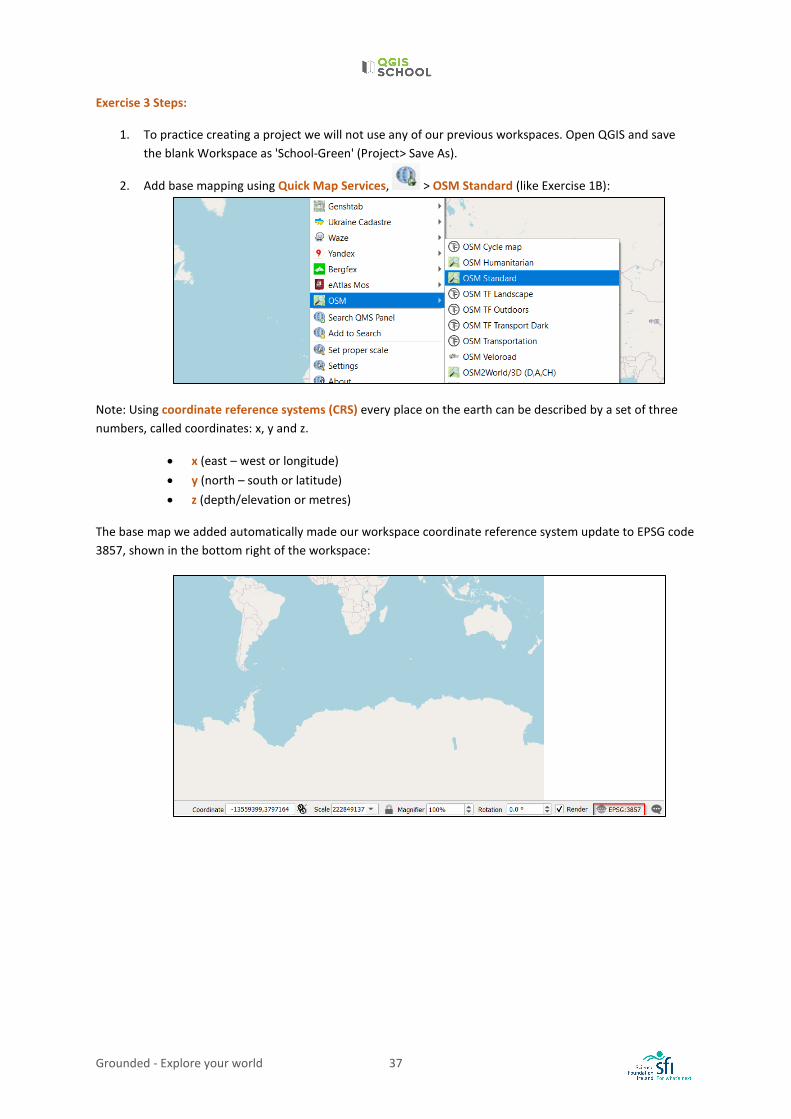
2. Add base mapping using Quick Map Services, > OSM Standard (like Exercise 1B):
Note: Using coordinate reference systems (CRS) every place on the earth can be described by a set of three numbers, called coordinates: x, y and z.
• x (east – west or longitude) • y (north – south or latitude) • z (depth/elevation or metres)
The base map we added automatically made our workspace coordinate reference system update to EPSG code 3857, shown in the bottom right of the workspace:
Grounded - Explore your world 38
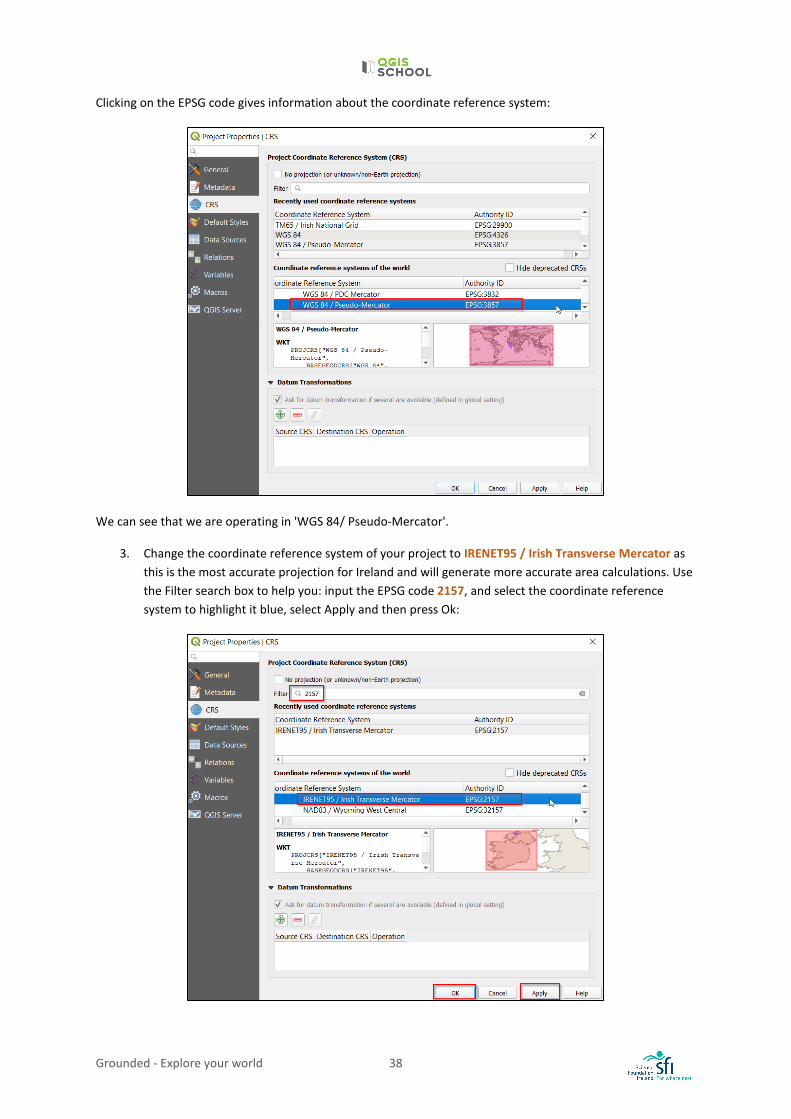
Clicking on the EPSG code gives information about the coordinate reference system:
We can see that we are operating in 'WGS 84/ Pseudo-Mercator'.
3. Change the coordinate reference system of your project to IRENET95 / Irish Transverse Mercator as this is the most accurate projection for Ireland and will generate more accurate area calculations. Use the Filter search box to help you: input the EPSG code 2157, and select the coordinate reference system to highlight it blue, select Apply and then press Ok:
Grounded - Explore your world 39
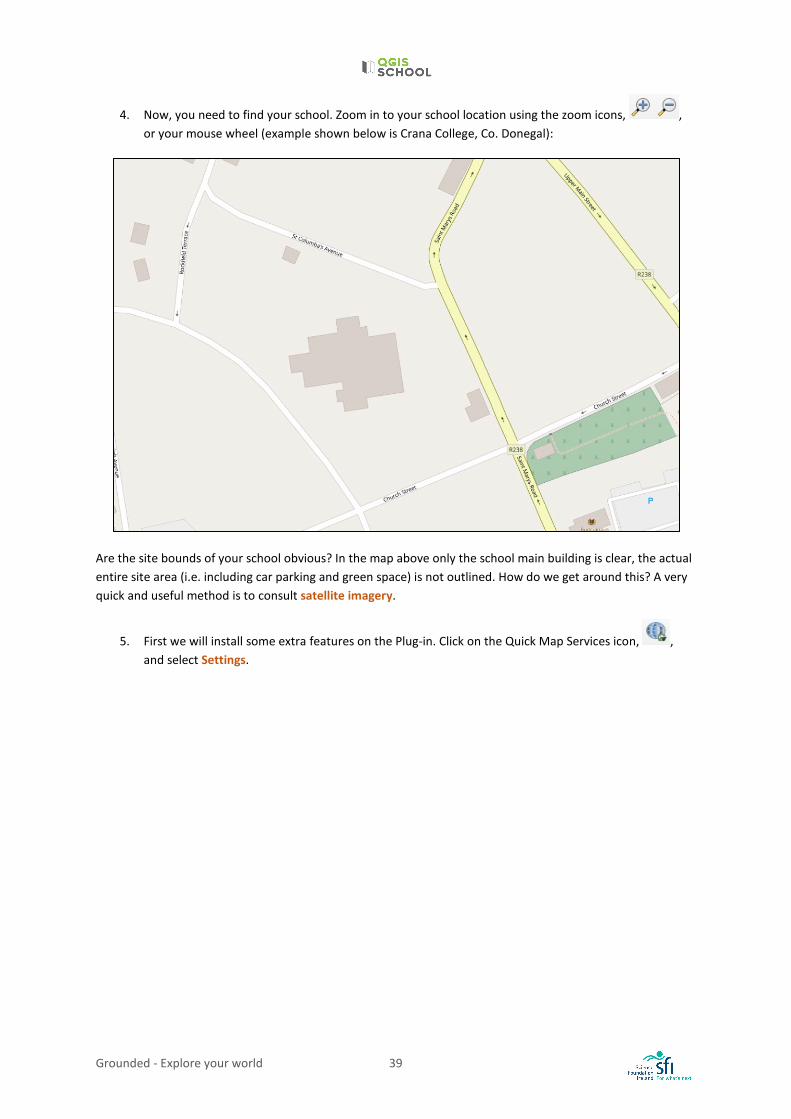
4. Now, you need to find your school. Zoom in to your school location using the zoom icons, , or your mouse wheel (example shown below is Crana College, Co. Donegal):
Are the site bounds of your school obvious? In the map above only the school main building is clear, the actual entire site area (i.e. including car parking and green space) is not outlined. How do we get around this? A very quick and useful method is to consult satellite imagery.
5. First we will install some extra features on the Plug-in. Click on the Quick Map Services icon, , and select Settings.
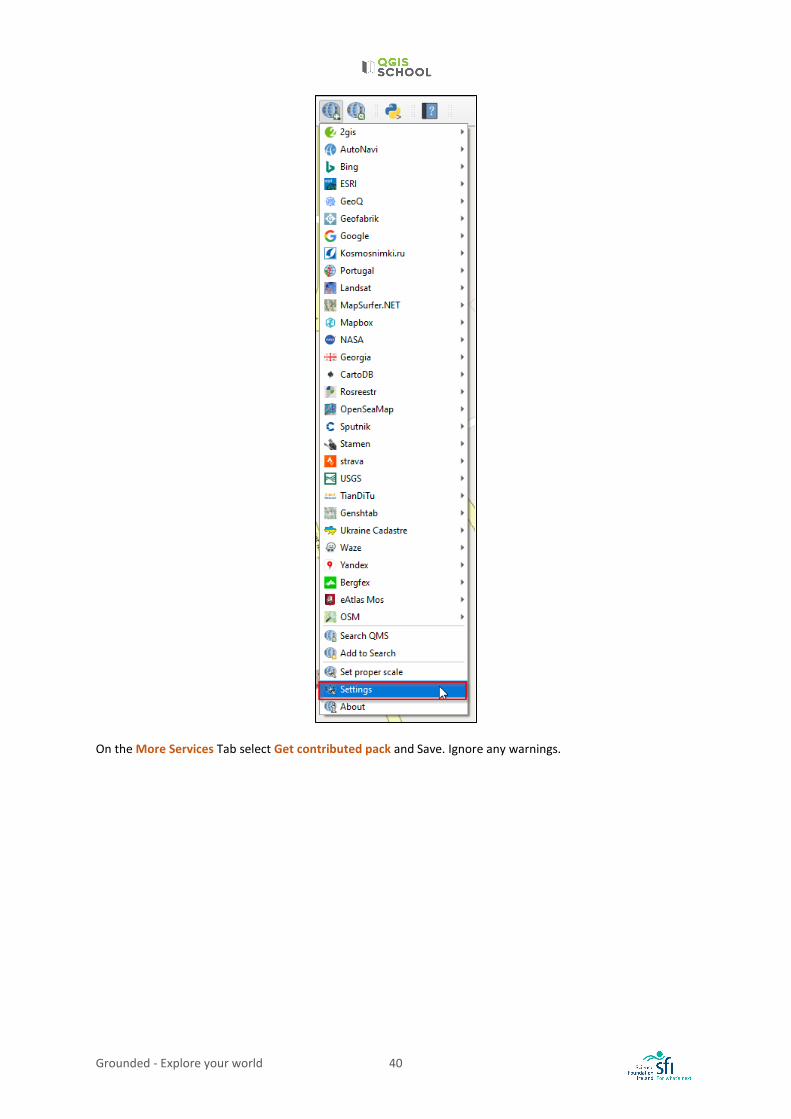
Grounded - Explore your world 40
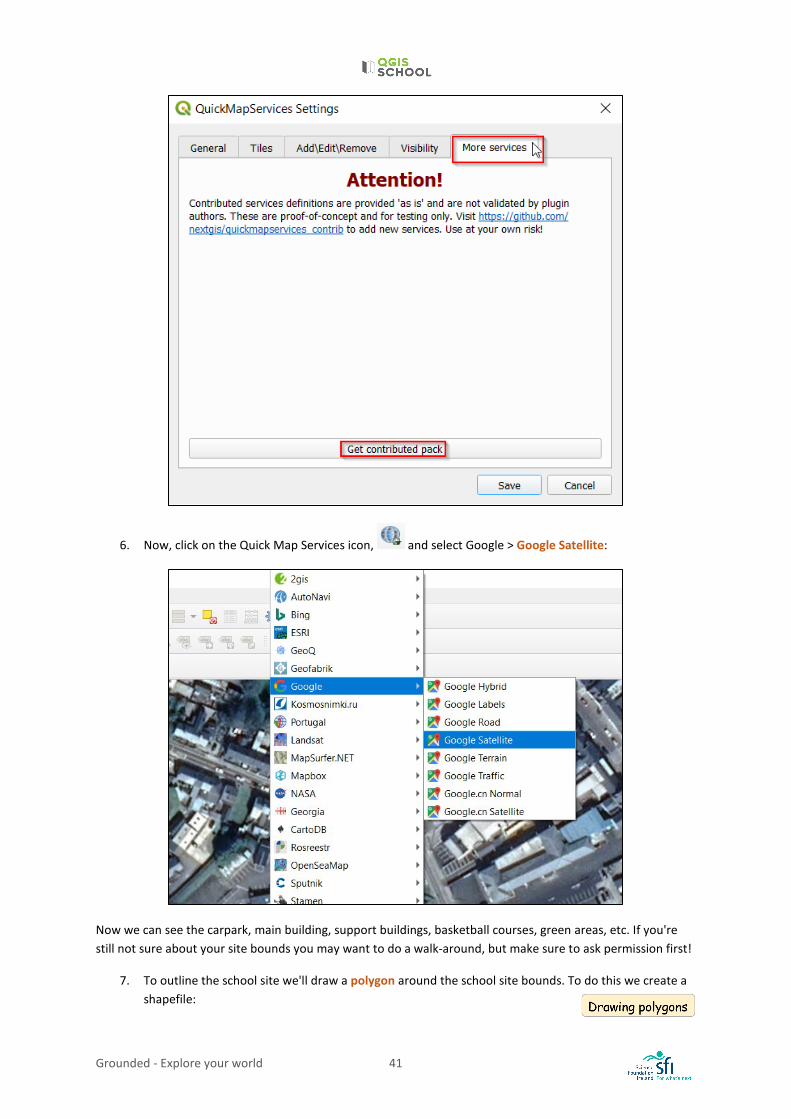
On the More Services Tab select Get contributed pack and Save. Ignore any warnings.
Grounded - Explore your world 41
6. Now, click on the Quick Map Services icon, and select Google > Google Satellite:
Now we can see the carpark, main building, support buildings, basketball courses, green areas, etc. If you're still not sure about your site bounds you may want to do a walk-around, but make sure to ask permission first!
7. To outline the school site we'll draw a polygon around the school site bounds. To do this we create a shapefile:
Grounded - Explore your world 42
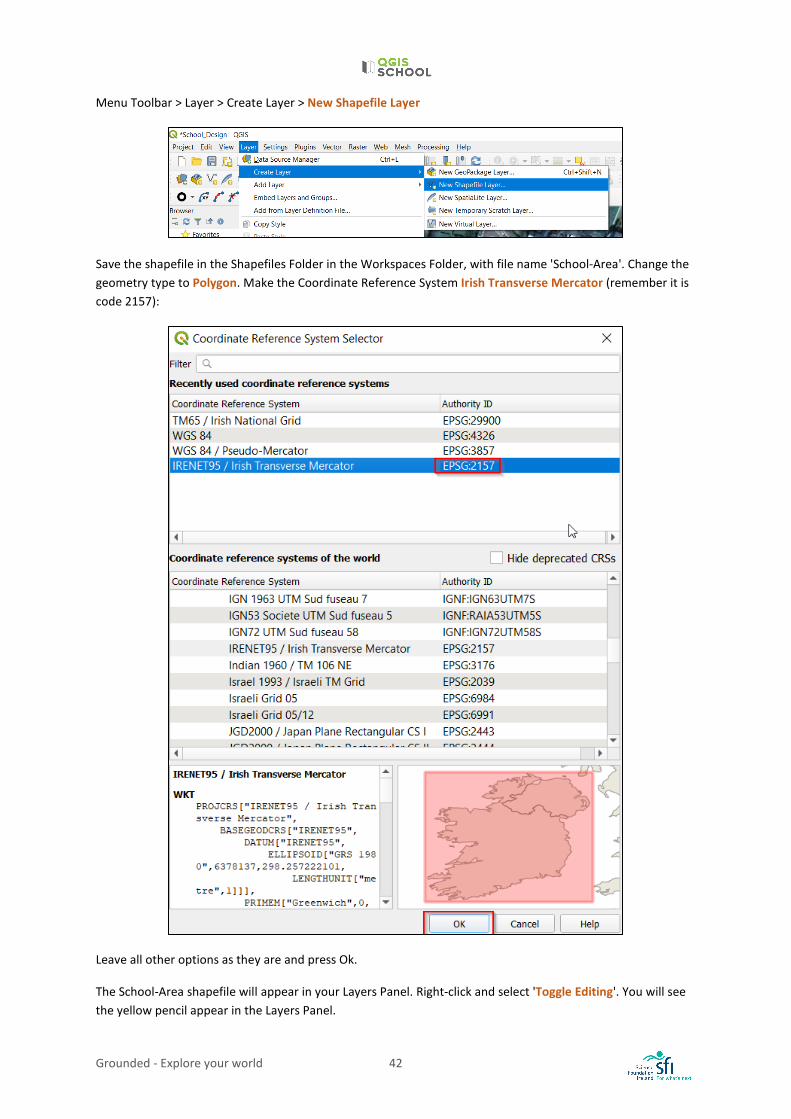
Menu Toolbar > Layer > Create Layer > New Shapefile Layer
Save the shapefile in the Shapefiles Folder in the Workspaces Folder, with file name 'School-Area'. Change the geometry type to Polygon. Make the Coordinate Reference System Irish Transverse Mercator (remember it is code 2157):
Leave all other options as they are and press Ok.
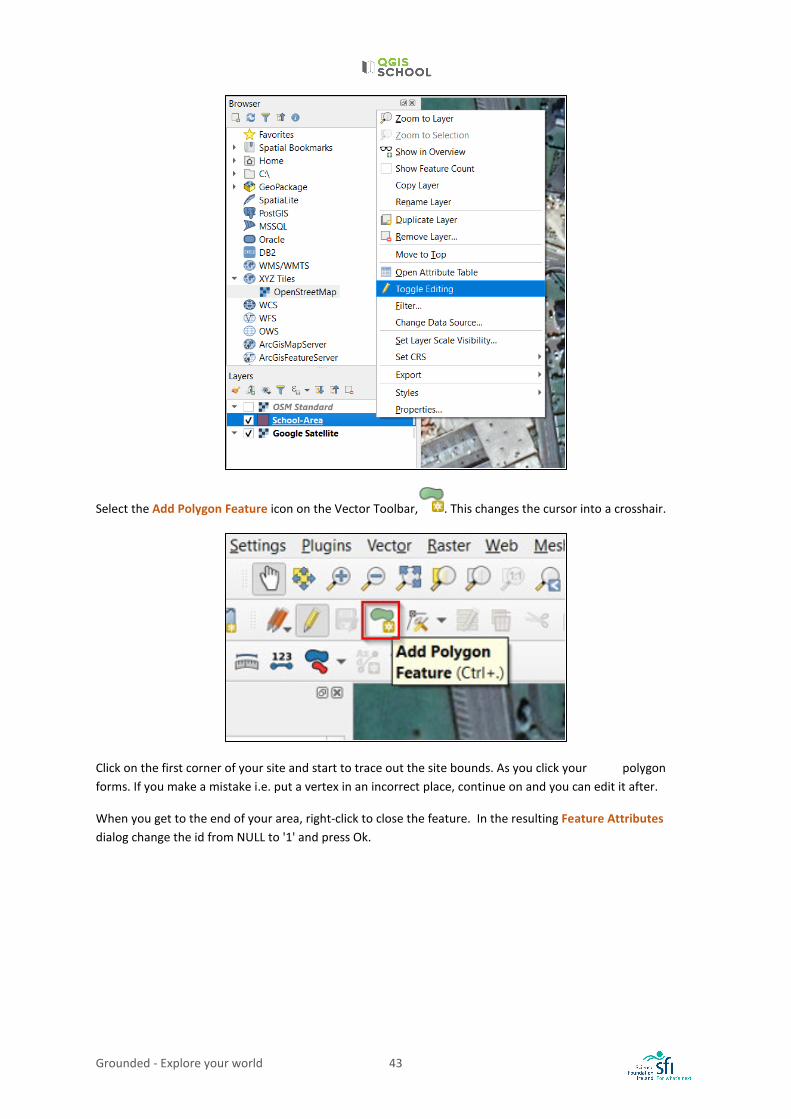
The School-Area shapefile will appear in your Layers Panel. Right-click and select 'Toggle Editing'. You will see the yellow pencil appear in the Layers Panel.
Grounded - Explore your world 43
Select the Add Polygon Feature icon on the Vector Toolbar, . This changes the cursor into a crosshair.
Click on the first corner of your site and start to trace out the site bounds. As you click your polygon forms. If you make a mistake i.e. put a vertex in an incorrect place, continue on and you can edit it after.
When you get to the end of your area, right-click to close the feature. In the resulting Feature Attributes dialog change the id from NULL to '1' and press Ok.
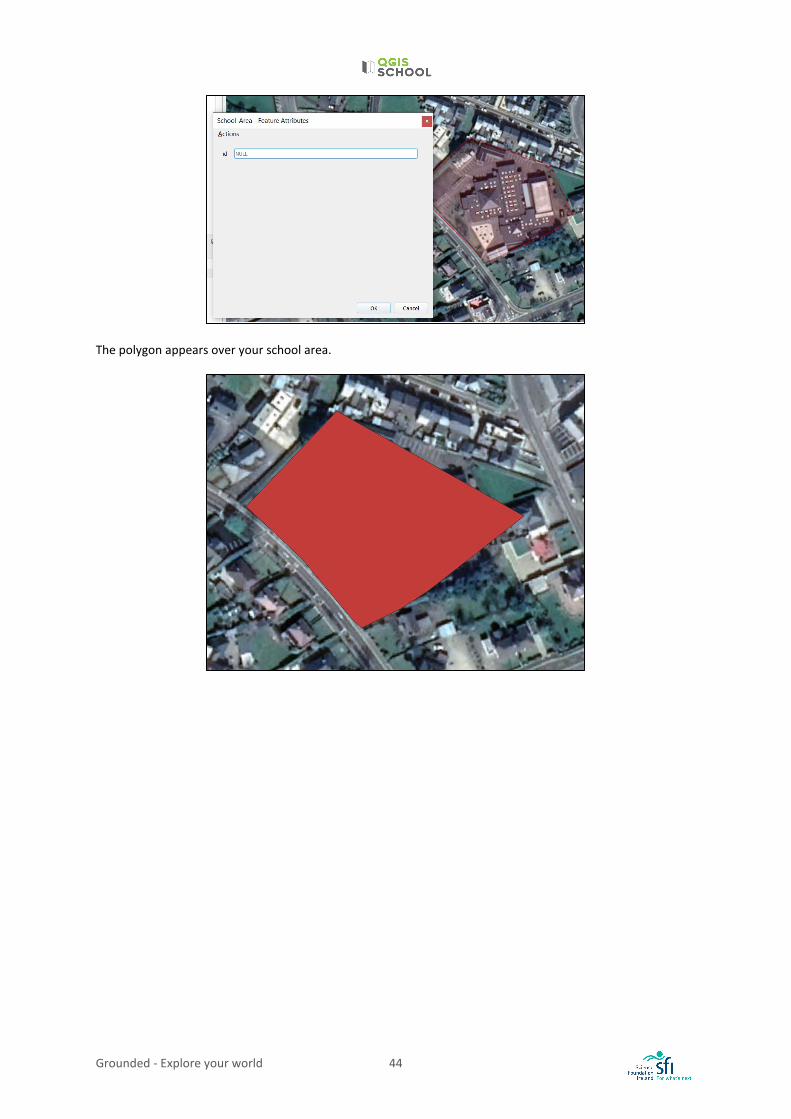
Grounded - Explore your world 44
The polygon appears over your school area.
Grounded - Explore your world 45
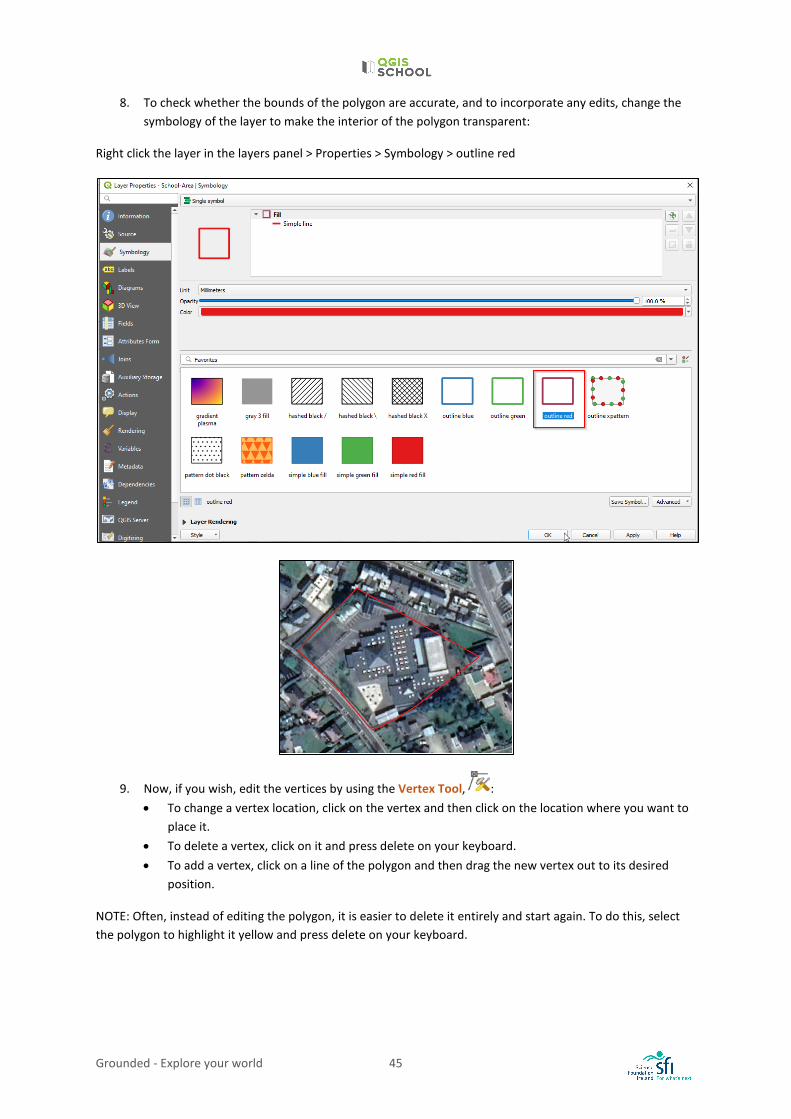
8. To check whether the bounds of the polygon are accurate, and to incorporate any edits, change the symbology of the layer to make the interior of the polygon transparent:
Right click the layer in the layers panel > Properties > Symbology > outline red
9. Now, if you wish, edit the vertices by using the Vertex Tool, : • To change a vertex location, click on the vertex and then click on the location where you want to
place it. • To delete a vertex, click on it and press delete on your keyboard. • To add a vertex, click on a line of the polygon and then drag the new vertex out to its desired
position.
NOTE: Often, instead of editing the polygon, it is easier to delete it entirely and start again. To do this, select the polygon to highlight it yellow and press delete on your keyboard.
Grounded - Explore your world 46
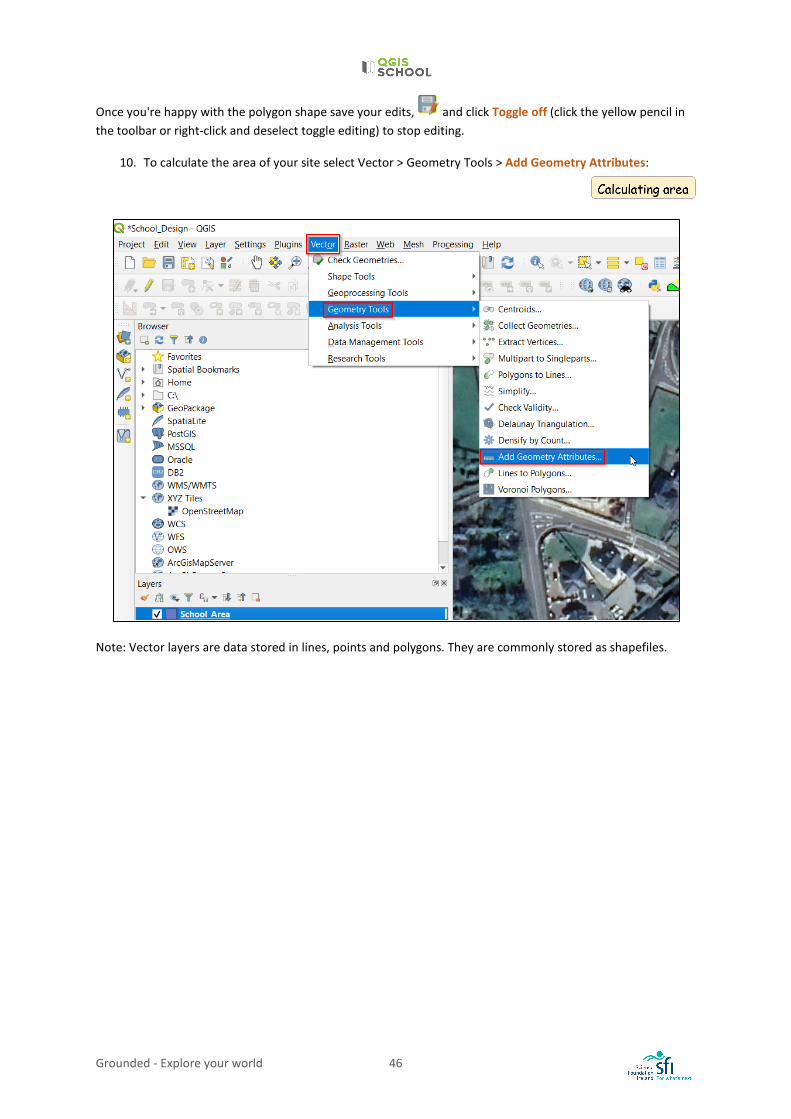
Once you're happy with the polygon shape save your edits, and click Toggle off (click the yellow pencil in the toolbar or right-click and deselect toggle editing) to stop editing.
10. To calculate the area of your site select Vector > Geometry Tools > Add Geometry Attributes:
Note: Vector layers are data stored in lines, points and polygons. They are commonly stored as shapefiles.
Grounded - Explore your world 47
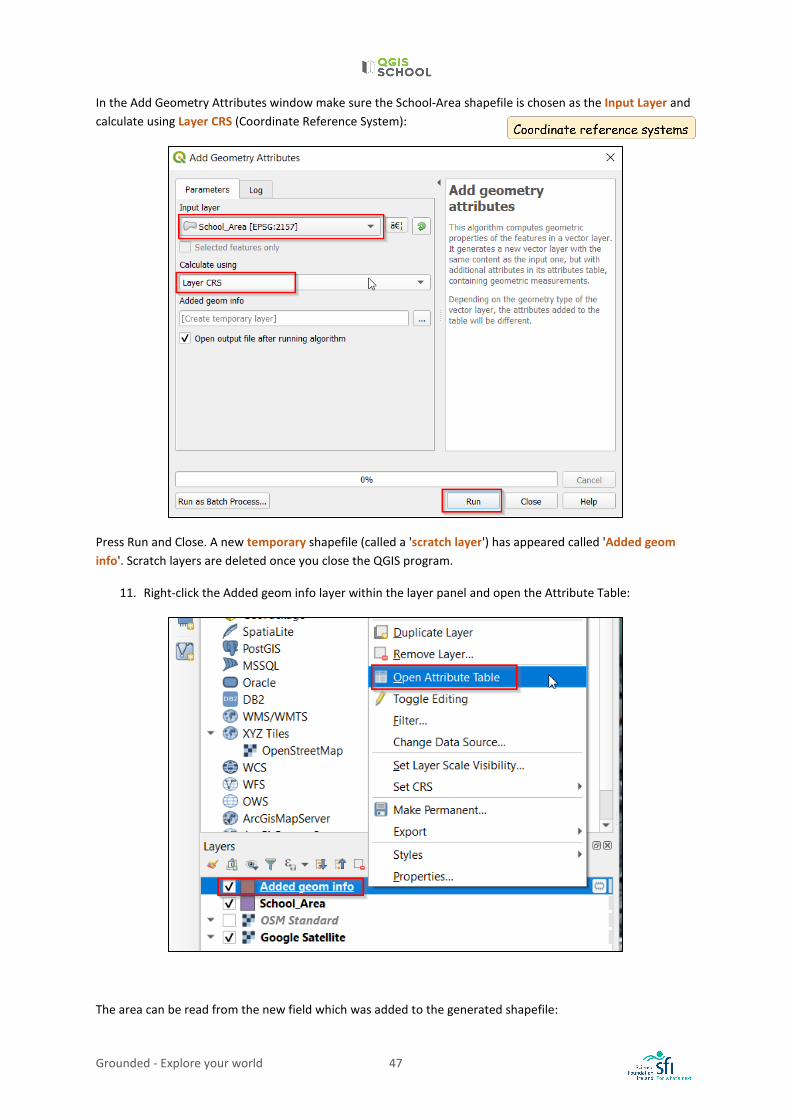
In the Add Geometry Attributes window make sure the School-Area shapefile is chosen as the Input Layer and calculate using Layer CRS (Coordinate Reference System):
Press Run and Close. A new temporary shapefile (called a 'scratch layer') has appeared called 'Added geom info'. Scratch layers are deleted once you close the QGIS program.
11. Right-click the Added geom info layer within the layer panel and open the Attribute Table:
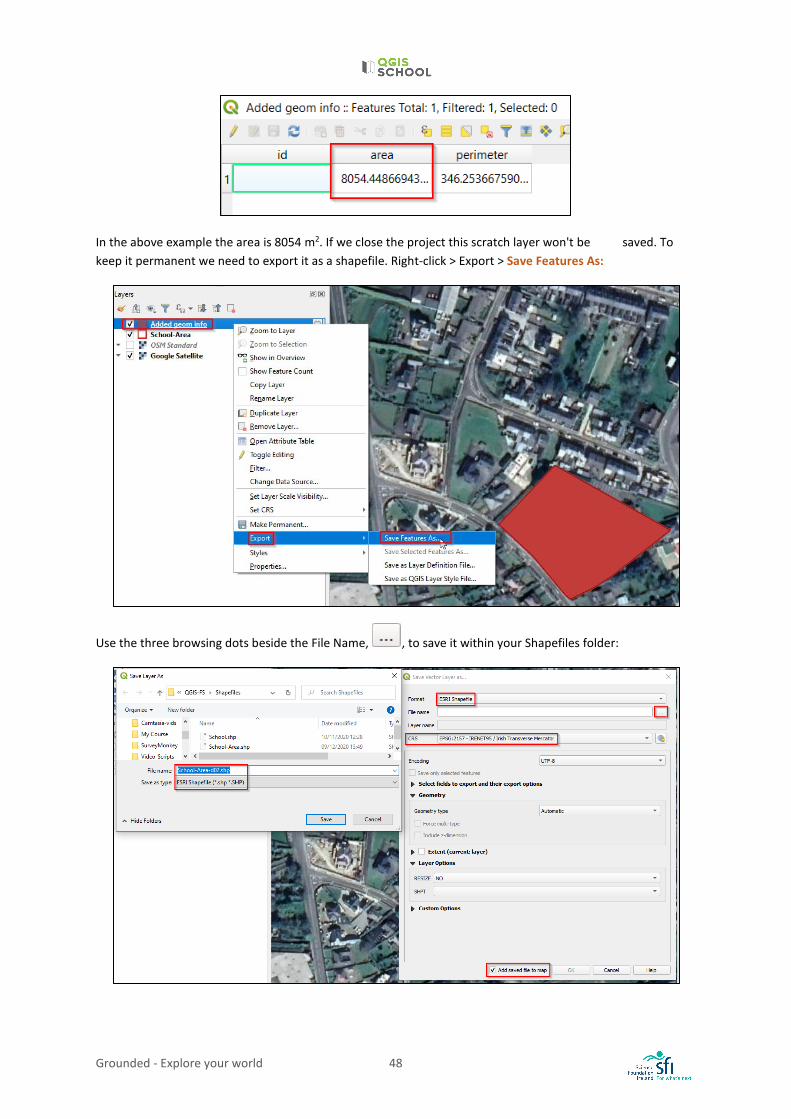
The area can be read from the new field which was added to the generated shapefile:
Grounded - Explore your world 48
In the above example the area is 8054 m2. If we close the project this scratch layer won't be saved. To keep it permanent we need to export it as a shapefile. Right-click > Export > Save Features As:
Use the three browsing dots beside the File Name, , to save it within your Shapefiles folder:
Grounded - Explore your world 49
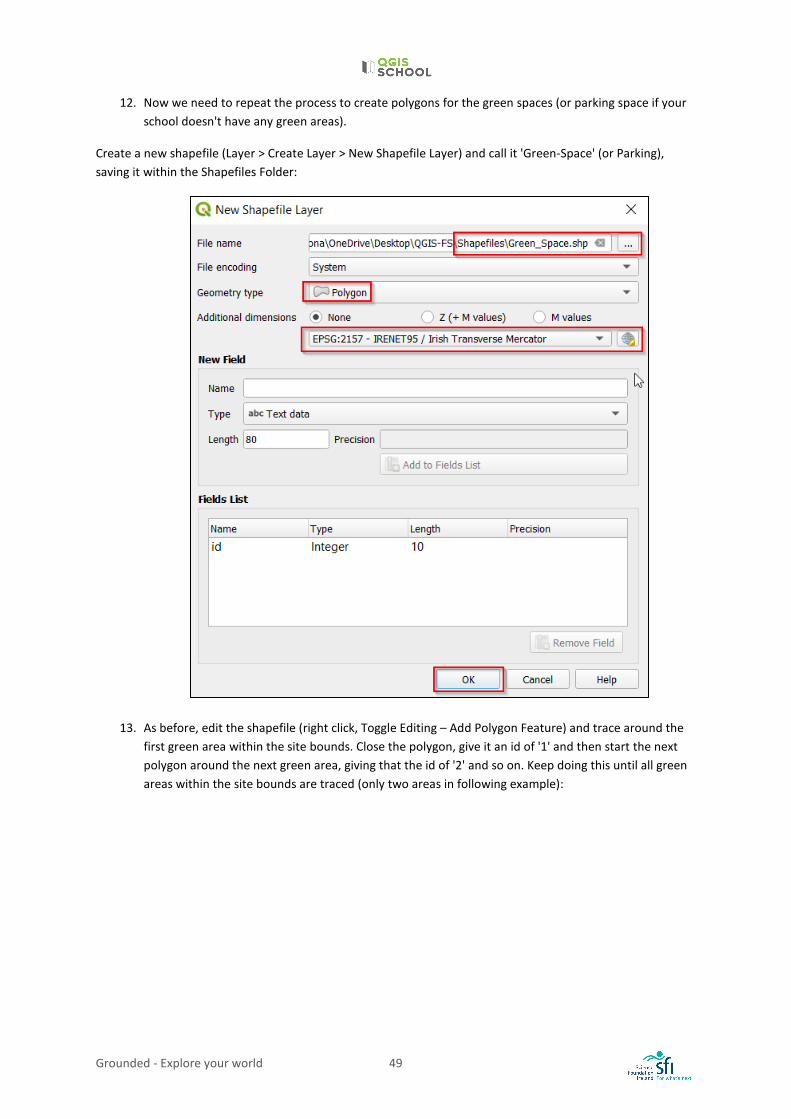
12. Now we need to repeat the process to create polygons for the green spaces (or parking space if your school doesn't have any green areas).
Create a new shapefile (Layer > Create Layer > New Shapefile Layer) and call it 'Green-Space' (or Parking), saving it within the Shapefiles Folder:
13. As before, edit the shapefile (right click, Toggle Editing – Add Polygon Feature) and trace around the first green area within the site bounds. Close the polygon, give it an id of '1' and then start the next polygon around the next green area, giving that the id of '2' and so on. Keep doing this until all green areas within the site bounds are traced (only two areas in following example):
Grounded - Explore your world 50
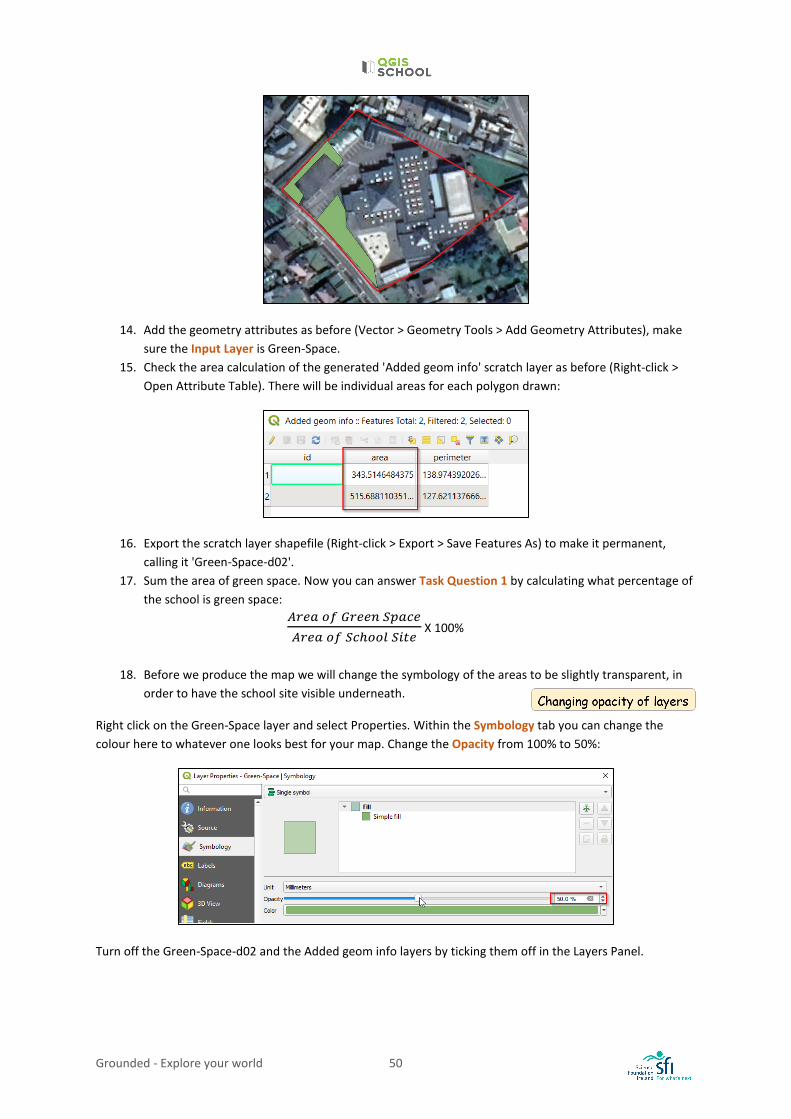
14. Add the geometry attributes as before (Vector > Geometry Tools > Add Geometry Attributes), make sure the Input Layer is Green-Space.
15. Check the area calculation of the generated 'Added geom info' scratch layer as before (Right-click > Open Attribute Table). There will be individual areas for each polygon drawn:
16. Export the scratch layer shapefile (Right-click > Export > Save Features As) to make it permanent, calling it 'Green-Space-d02'.
17. Sum the area of green space. Now you can answer Task Question 1 by calculating what percentage of the school is green space:
𝐴𝐴𝐴𝐴𝐴𝐴𝐴𝐴 𝑜𝑜𝑜𝑜 𝐺𝐺𝐴𝐴𝐴𝐴𝐴𝐴𝐺𝐺 𝑆𝑆𝑆𝑆𝐴𝐴𝑆𝑆𝐴𝐴𝐴𝐴𝐴𝐴𝐴𝐴𝐴𝐴 𝑜𝑜𝑜𝑜 𝑆𝑆𝑆𝑆ℎ𝑜𝑜𝑜𝑜𝑜𝑜 𝑆𝑆𝑆𝑆𝑆𝑆𝐴𝐴
X 100%
18. Before we produce the map we will change the symbology of the areas to be slightly transparent, in
order to have the school site visible underneath.
Right click on the Green-Space layer and select Properties. Within the Symbology tab you can change the colour here to whatever one looks best for your map. Change the Opacity from 100% to 50%:
Turn off the Green-Space-d02 and the Added geom info layers by ticking them off in the Layers Panel.
Grounded - Explore your world 51
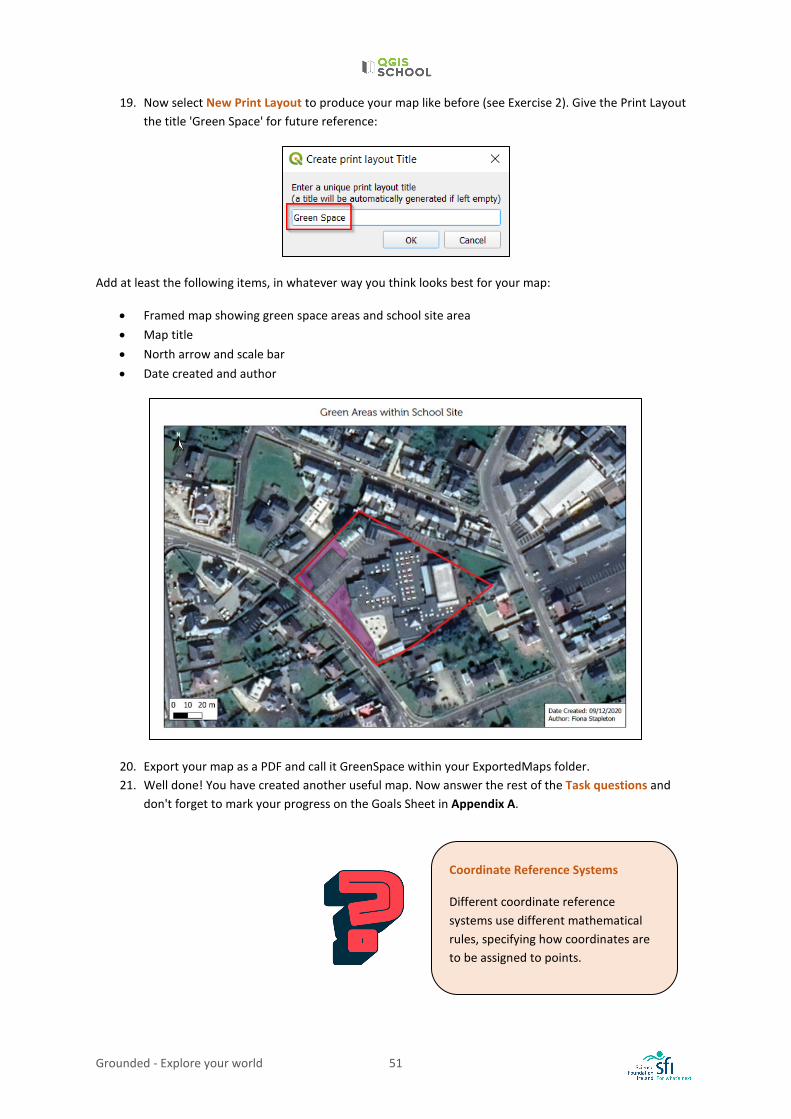
19. Now select New Print Layout to produce your map like before (see Exercise 2). Give the Print Layout the title 'Green Space' for future reference:
Add at least the following items, in whatever way you think looks best for your map:
• Framed map showing green space areas and school site area • Map title • North arrow and scale bar • Date created and author
20. Export your map as a PDF and call it GreenSpace within your ExportedMaps folder. 21. Well done! You have created another useful map. Now answer the rest of the Task questions and
don't forget to mark your progress on the Goals Sheet in Appendix A.
Coordinate Reference Systems
Different coordinate reference systems use different mathematical rules, specifying how coordinates are to be assigned to points.
Grounded - Explore your world 52
LESSON 4: QGIS FOR ENVIRONMENTAL DESCRIPTION
LEARNING OUTCOMES: • Link between environment and tourism
BACKGROUND
DESCRIBING THE NATURAL ENVIRONMENT:
Basic elements that control the features of our natural environment include the soil, bedrock, aquifers, topography and hydrology. Short definitions are given as follows:
Subsoil: material on the immediate surface of the Earth.
Bedrock: the hard, solid rock exposed or buried under soil at the earth's surface.
Aquifer: underground layer of rock or sediments that holds groundwater.
Aquifer vulnerability: the ease with which groundwater may be contaminated by human activities.
Topography: the elevation and depression of the land surface (mountains, valleys, sand dunes).
Hydrology: the study of the distribution and movement of water (rivers, lakes).
OVERTOURISM
It is important that attractions don't suffer from overtourism. Tourism can be a contributing factor to destructive effects such as air and water pollution, soil erosion, depletion of natural resources and destruction of important wildlife habitats.
The Cliffs of Moher received 1.6 million visitors in 2019. The infrastructure and arrival facilities at the site were designed to cater for 400,000 visitors a year. The number of visitors is projected to rise to almost two million by 2025. What pressure is this putting on the environment and/or the tourist attraction itself?
RESOURCES
• https://www.independent.ie/business/irish/climbing-numbers-tourists-overwhelm-facilities-at-the-cliffs-of-moher-38199713.html
• https://www.gsi.ie/en-ie/programmes-and-projects/groundwater/activities/understanding-ireland-groundwater/aquifer-classification/Pages/Aquifer-categories-and-types.aspx
Grounded - Explore your world 53
EXERCISE 4: USING QGIS TO INVESTIGATE GEOLOGY AND HYDROGEOLOGY Don't forget, all the steps are also demonstrated in the video tutorial, accessible here: https://cutt.ly/9jUZ7bE.
Objective:
• Use QGIS to find out some environmental information about an area.
Task: Cliffs of Moher Viewing Platforms
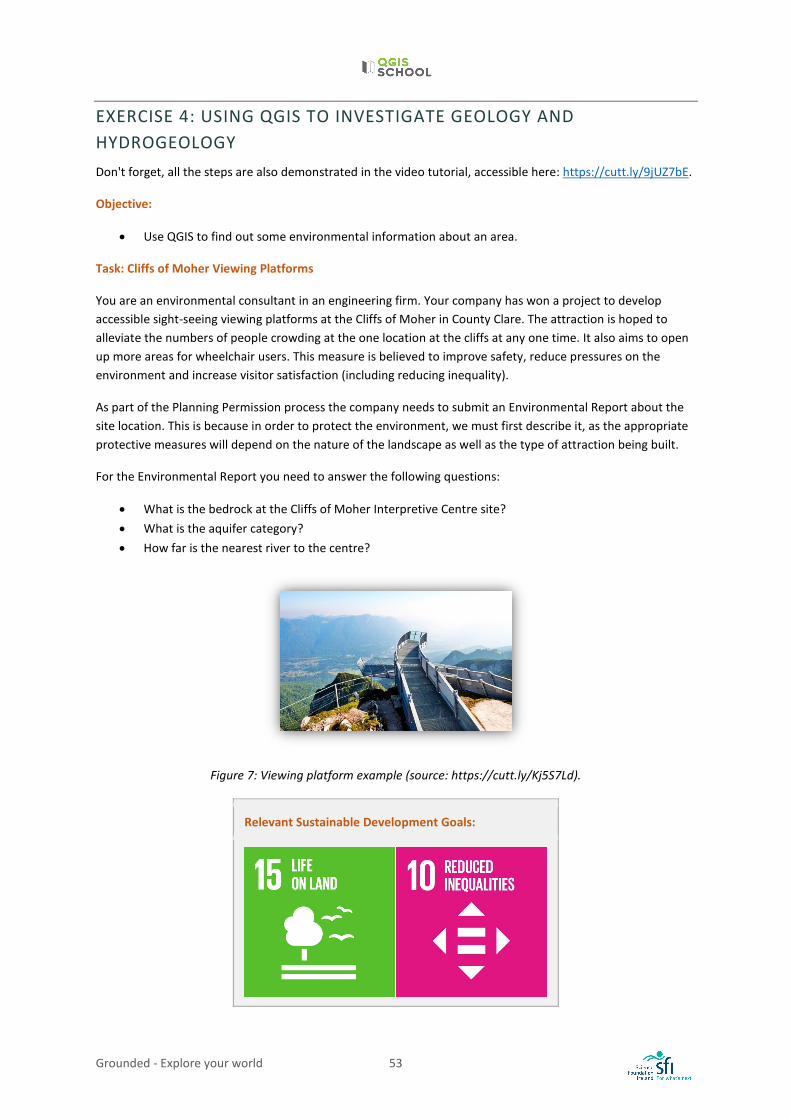
You are an environmental consultant in an engineering firm. Your company has won a project to develop accessible sight-seeing viewing platforms at the Cliffs of Moher in County Clare. The attraction is hoped to alleviate the numbers of people crowding at the one location at the cliffs at any one time. It also aims to open up more areas for wheelchair users. This measure is believed to improve safety, reduce pressures on the environment and increase visitor satisfaction (including reducing inequality).
As part of the Planning Permission process the company needs to submit an Environmental Report about the site location. This is because in order to protect the environment, we must first describe it, as the appropriate protective measures will depend on the nature of the landscape as well as the type of attraction being built.
For the Environmental Report you need to answer the following questions:
• What is the bedrock at the Cliffs of Moher Interpretive Centre site? • What is the aquifer category? • How far is the nearest river to the centre?
Figure 7: Viewing platform example (source: https://cutt.ly/Kj5S7Ld).
Relevant Sustainable Development Goals:
Grounded - Explore your world 54
Exercise 4 Steps:
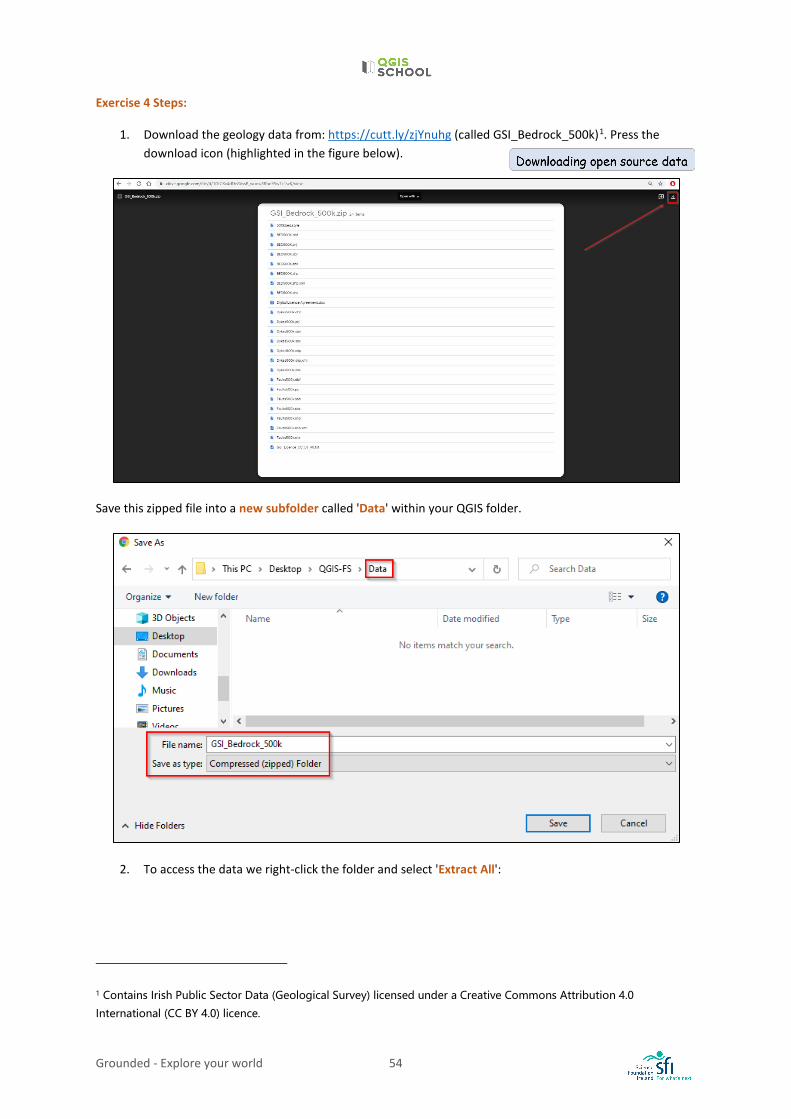
1. Download the geology data from: https://cutt.ly/zjYnuhg (called GSI_Bedrock_500k)1. Press the download icon (highlighted in the figure below).
Save this zipped file into a new subfolder called 'Data' within your QGIS folder.
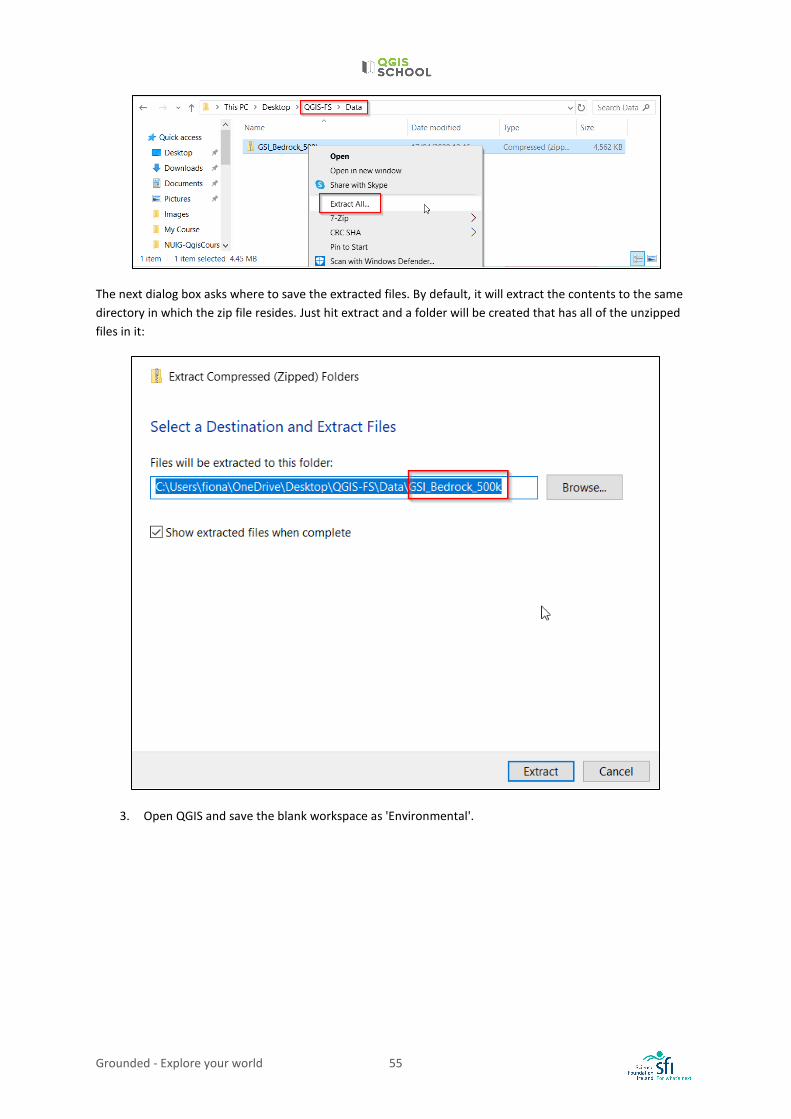
2. To access the data we right-click the folder and select 'Extract All':
1 Contains Irish Public Sector Data (Geological Survey) licensed under a Creative Commons Attribution 4.0
International (CC BY 4.0) licence.
Grounded - Explore your world 55
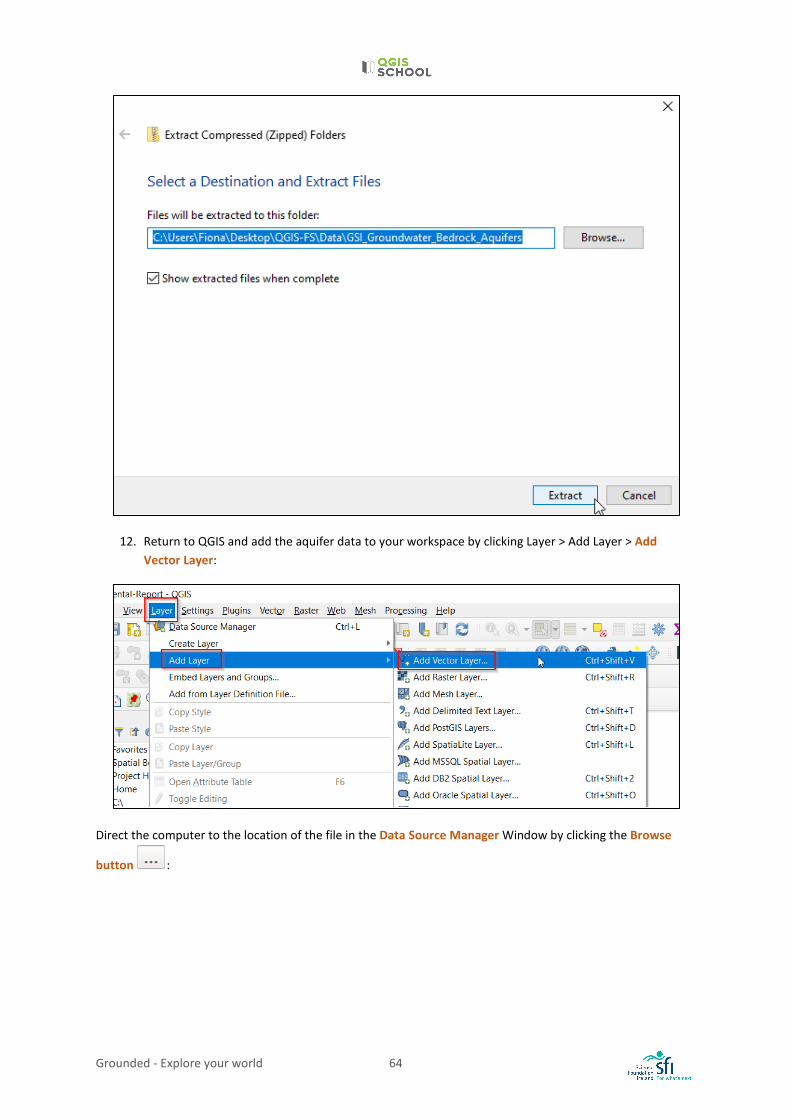
The next dialog box asks where to save the extracted files. By default, it will extract the contents to the same directory in which the zip file resides. Just hit extract and a folder will be created that has all of the unzipped files in it:
3. Open QGIS and save the blank workspace as 'Environmental'.
Grounded - Explore your world 56
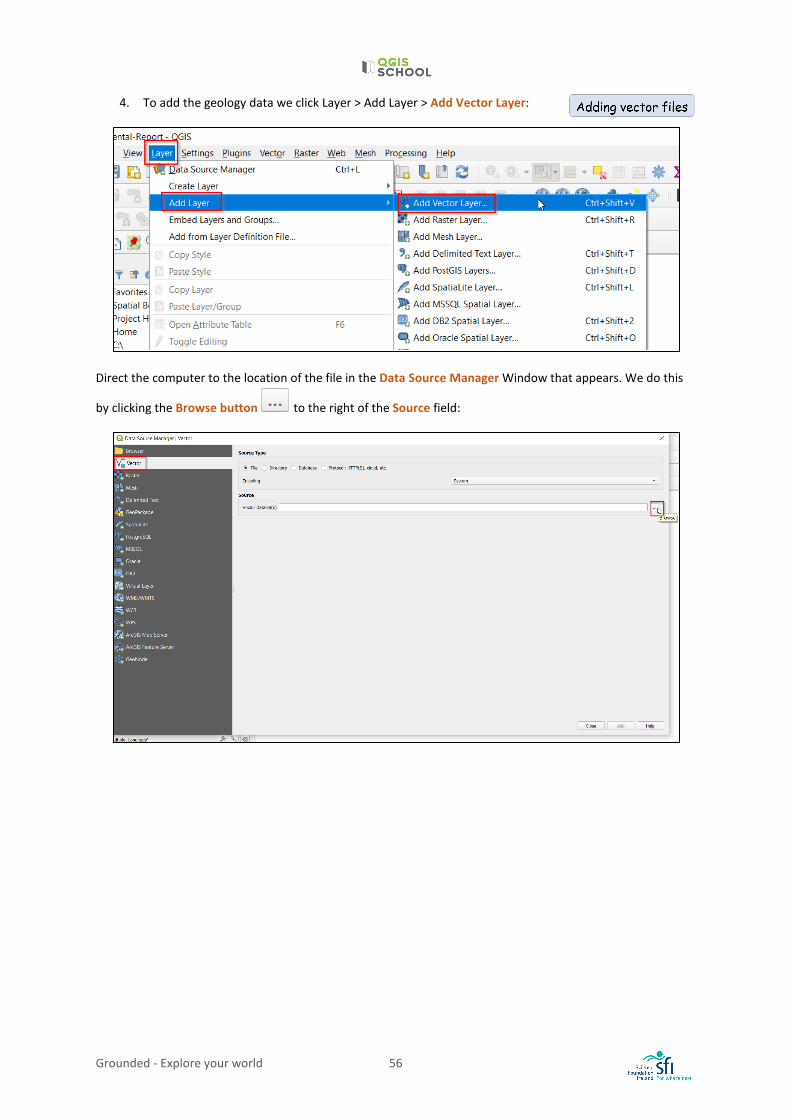
4. To add the geology data we click Layer > Add Layer > Add Vector Layer:
Direct the computer to the location of the file in the Data Source Manager Window that appears. We do this
by clicking the Browse button to the right of the Source field:
Grounded - Explore your world 57
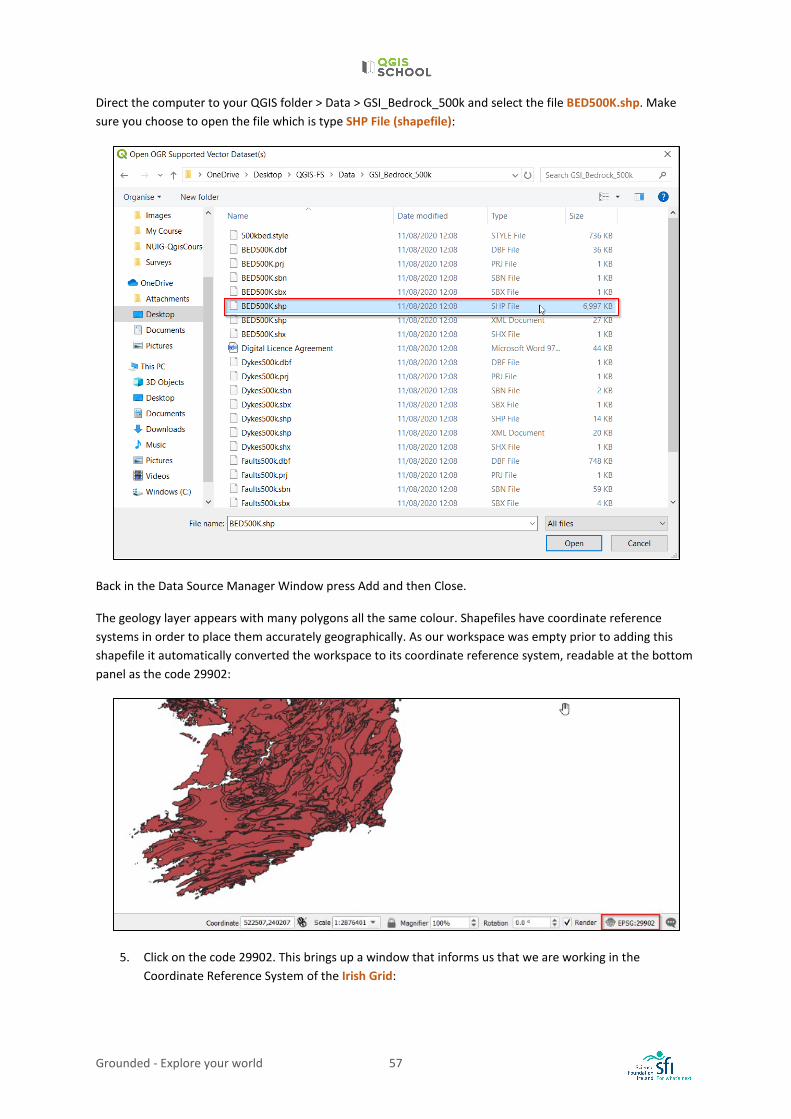
Direct the computer to your QGIS folder > Data > GSI_Bedrock_500k and select the file BED500K.shp. Make sure you choose to open the file which is type SHP File (shapefile):
Back in the Data Source Manager Window press Add and then Close.
The geology layer appears with many polygons all the same colour. Shapefiles have coordinate reference systems in order to place them accurately geographically. As our workspace was empty prior to adding this shapefile it automatically converted the workspace to its coordinate reference system, readable at the bottom panel as the code 29902:
5. Click on the code 29902. This brings up a window that informs us that we are working in the Coordinate Reference System of the Irish Grid:
Grounded - Explore your world 58
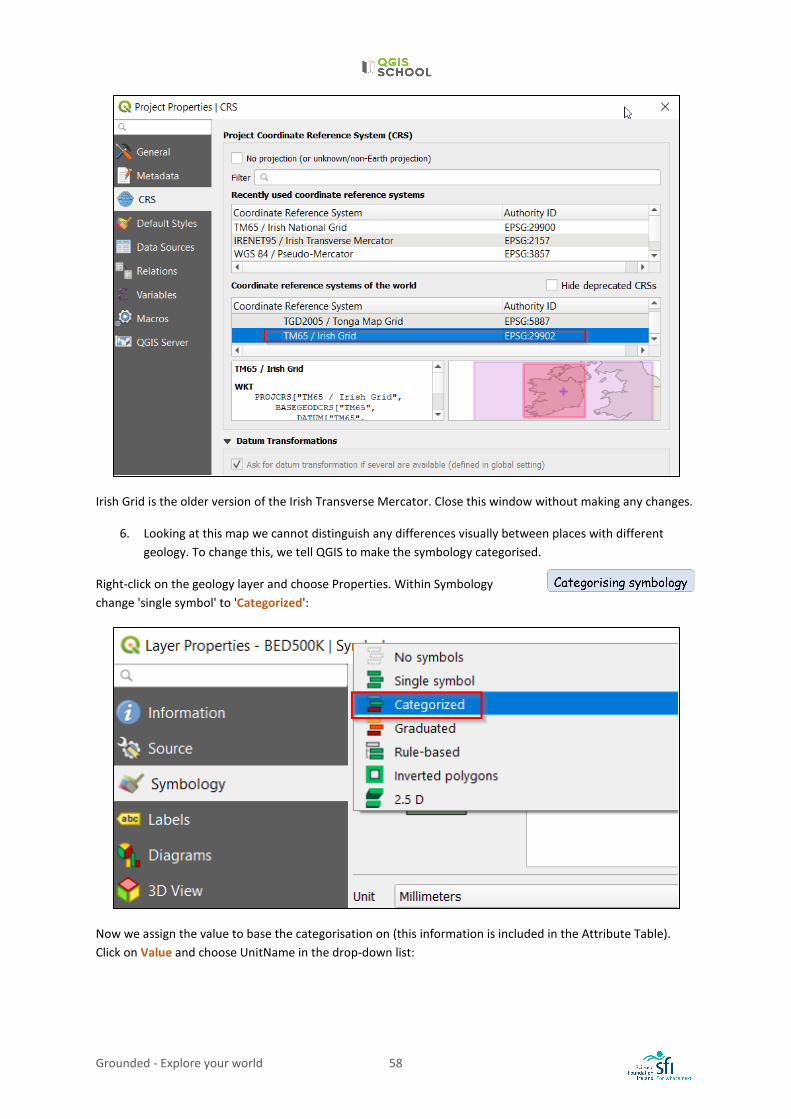
Irish Grid is the older version of the Irish Transverse Mercator. Close this window without making any changes.
6. Looking at this map we cannot distinguish any differences visually between places with different geology. To change this, we tell QGIS to make the symbology categorised.
Right-click on the geology layer and choose Properties. Within Symbology change 'single symbol' to 'Categorized':
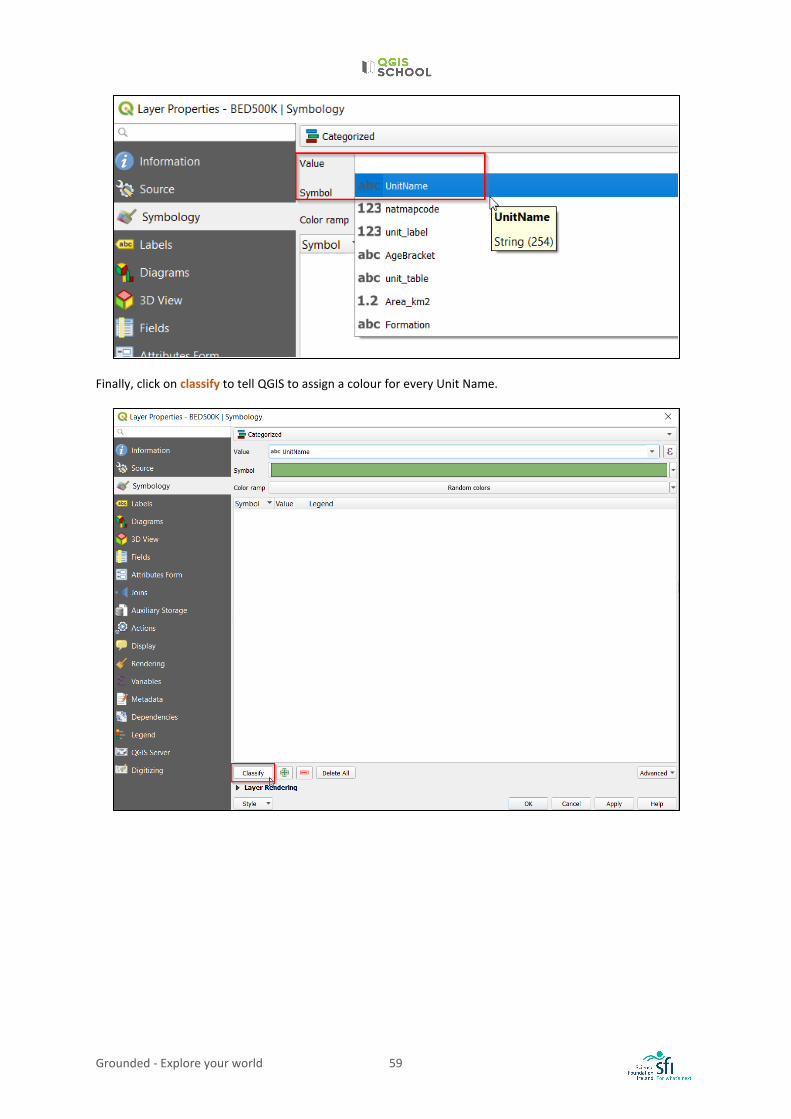
Now we assign the value to base the categorisation on (this information is included in the Attribute Table). Click on Value and choose UnitName in the drop-down list:
Grounded - Explore your world 59
Finally, click on classify to tell QGIS to assign a colour for every Unit Name.
Grounded - Explore your world 60
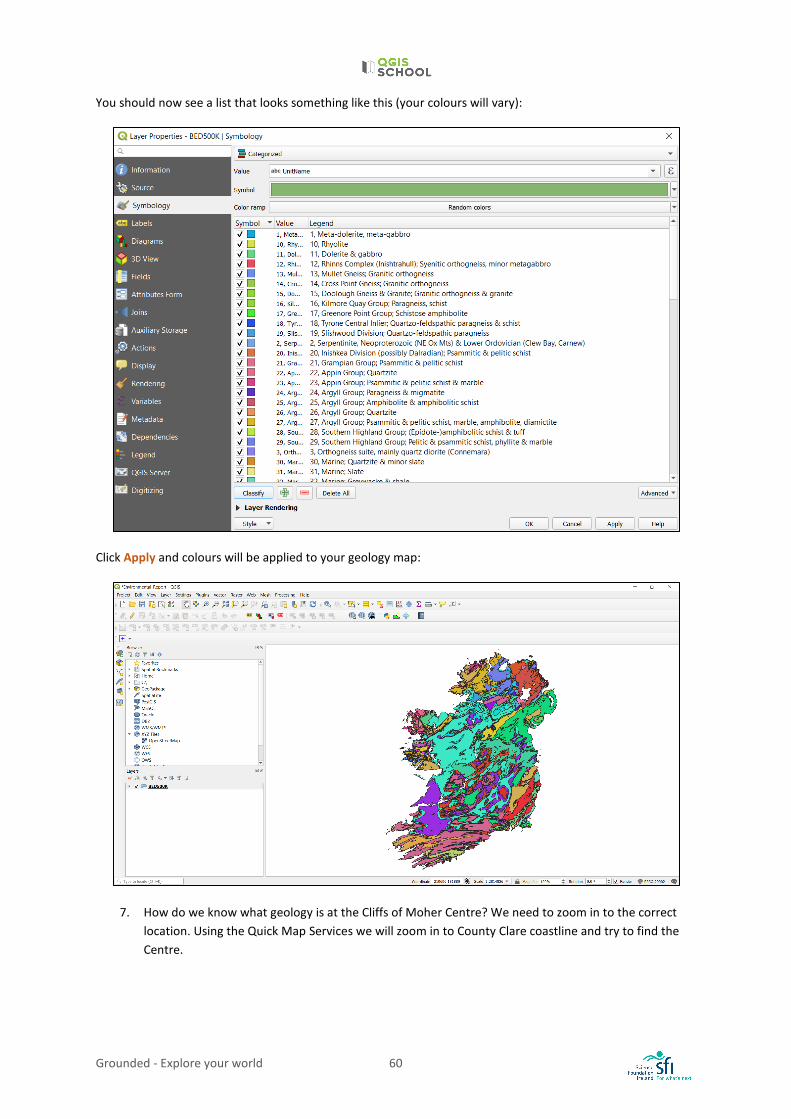
You should now see a list that looks something like this (your colours will vary):
Click Apply and colours will be applied to your geology map:
7. How do we know what geology is at the Cliffs of Moher Centre? We need to zoom in to the correct location. Using the Quick Map Services we will zoom in to County Clare coastline and try to find the Centre.
Grounded - Explore your world 61
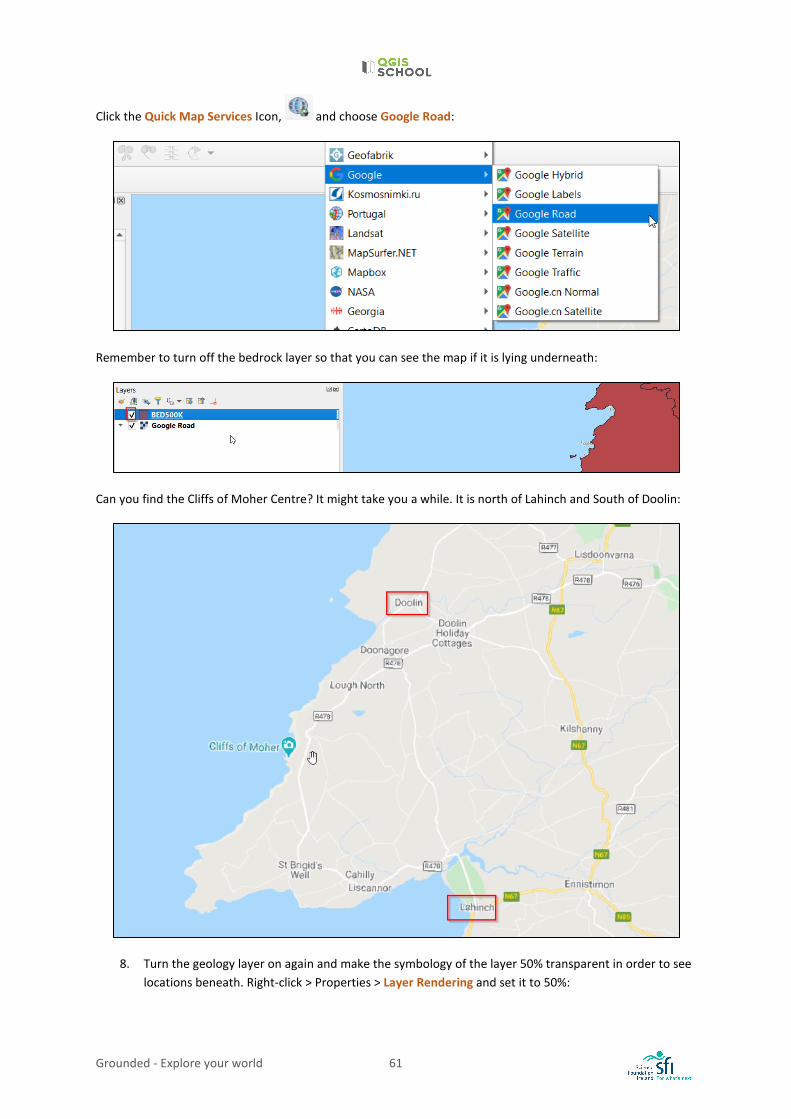
Click the Quick Map Services Icon, and choose Google Road:
Remember to turn off the bedrock layer so that you can see the map if it is lying underneath:
Can you find the Cliffs of Moher Centre? It might take you a while. It is north of Lahinch and South of Doolin:
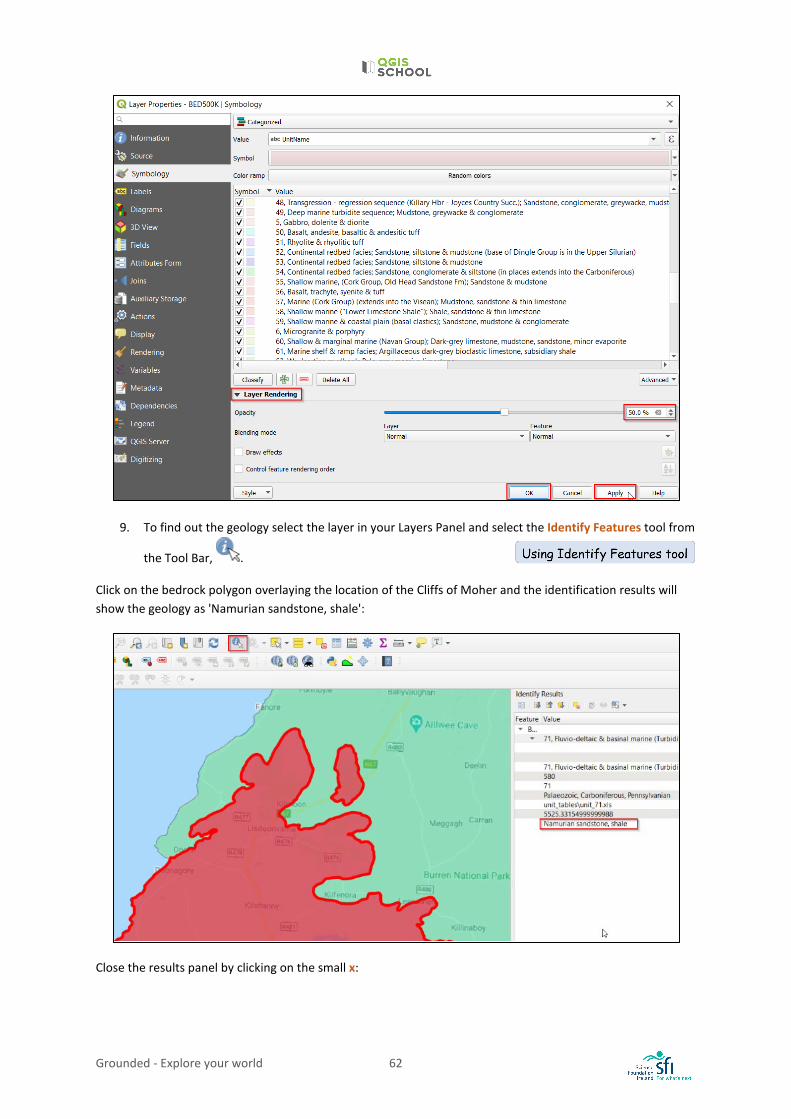
8. Turn the geology layer on again and make the symbology of the layer 50% transparent in order to see locations beneath. Right-click > Properties > Layer Rendering and set it to 50%:
Grounded - Explore your world 62
9. To find out the geology select the layer in your Layers Panel and select the Identify Features tool from
the Tool Bar, .
Click on the bedrock polygon overlaying the location of the Cliffs of Moher and the identification results will show the geology as 'Namurian sandstone, shale':
Close the results panel by clicking on the small x:
Grounded - Explore your world 63
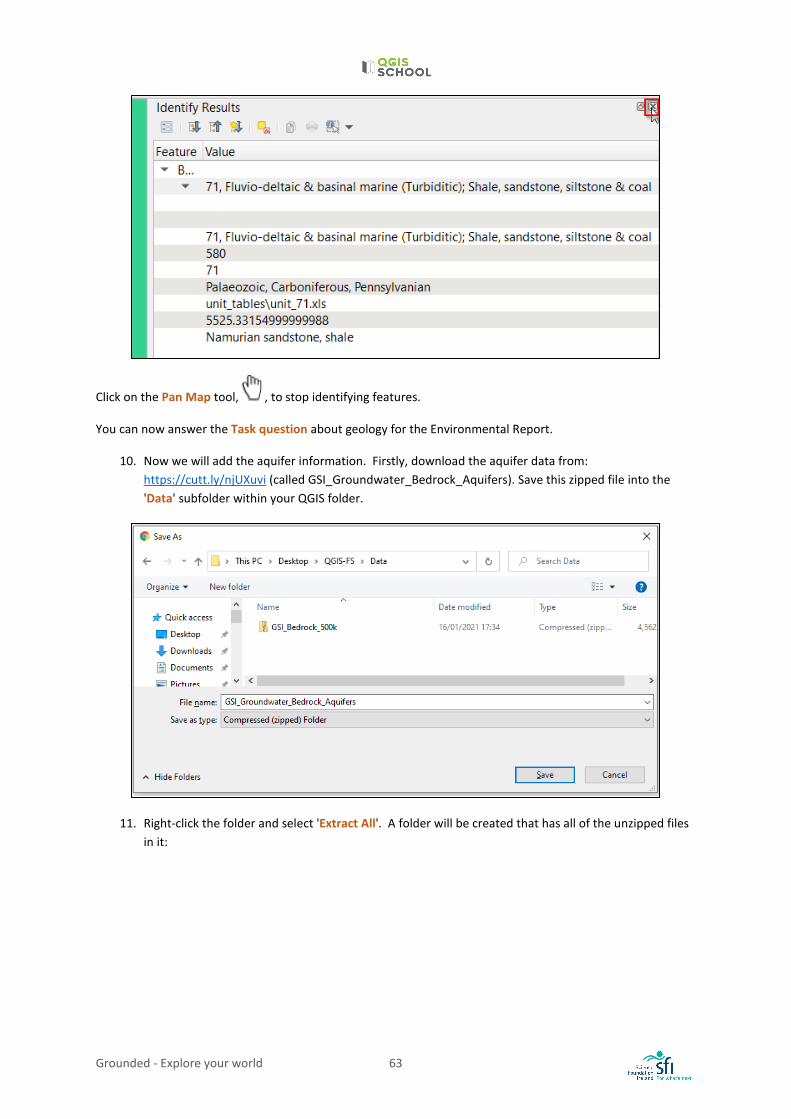
Click on the Pan Map tool, , to stop identifying features.
You can now answer the Task question about geology for the Environmental Report.
10. Now we will add the aquifer information. Firstly, download the aquifer data from: https://cutt.ly/njUXuvi (called GSI_Groundwater_Bedrock_Aquifers). Save this zipped file into the 'Data' subfolder within your QGIS folder.
11. Right-click the folder and select 'Extract All'. A folder will be created that has all of the unzipped files in it:
Grounded - Explore your world 64
12. Return to QGIS and add the aquifer data to your workspace by clicking Layer > Add Layer > Add Vector Layer:
Direct the computer to the location of the file in the Data Source Manager Window by clicking the Browse
button :
Grounded - Explore your world 65
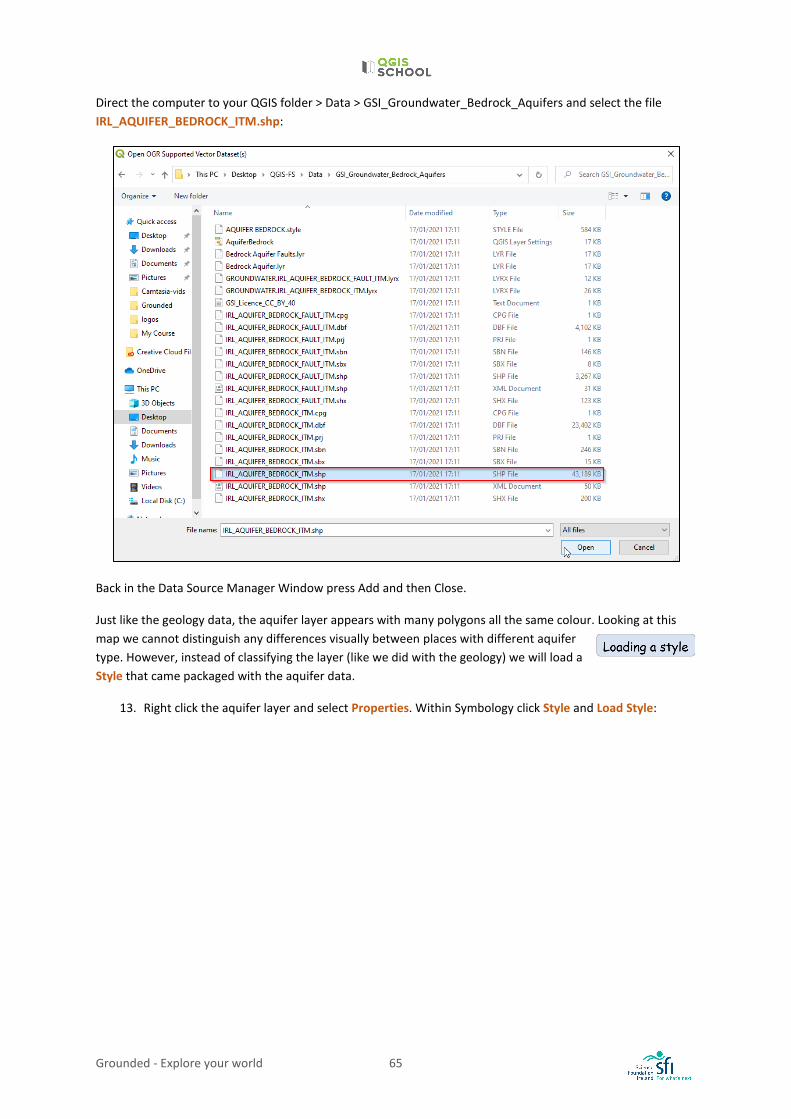
Direct the computer to your QGIS folder > Data > GSI_Groundwater_Bedrock_Aquifers and select the file IRL_AQUIFER_BEDROCK_ITM.shp:
Back in the Data Source Manager Window press Add and then Close.
Just like the geology data, the aquifer layer appears with many polygons all the same colour. Looking at this map we cannot distinguish any differences visually between places with different aquifer type. However, instead of classifying the layer (like we did with the geology) we will load a Style that came packaged with the aquifer data.
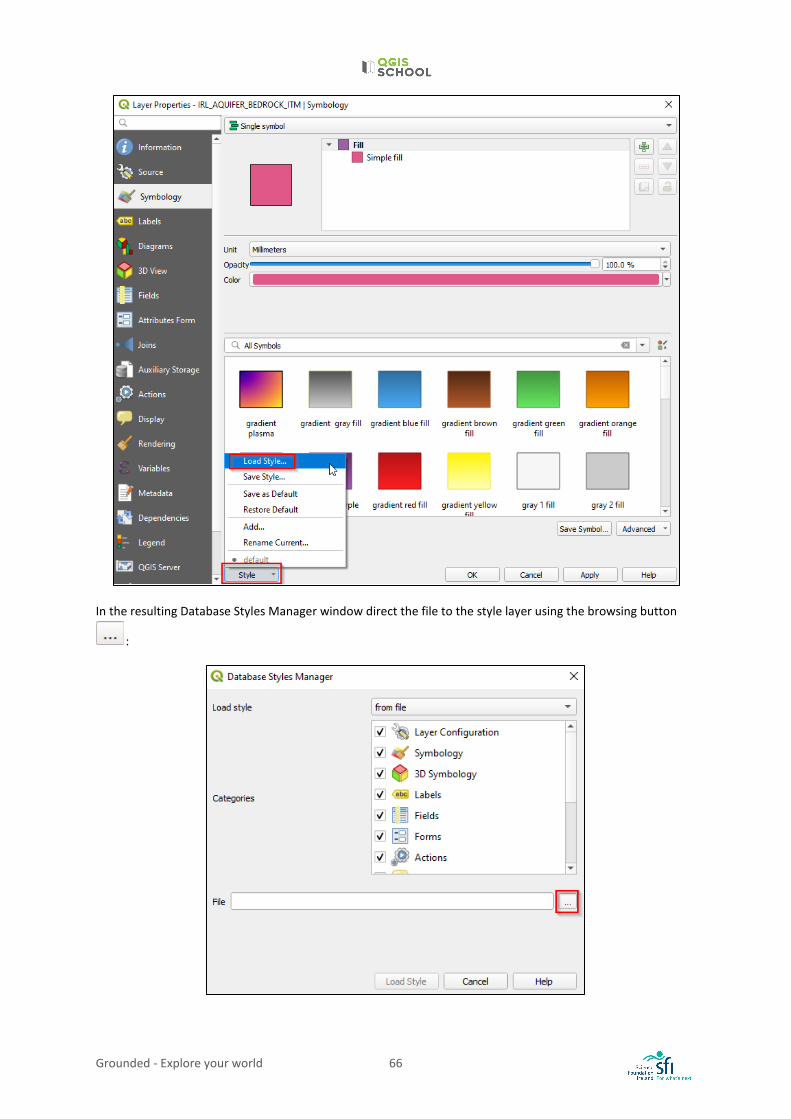
13. Right click the aquifer layer and select Properties. Within Symbology click Style and Load Style:
Grounded - Explore your world 66
In the resulting Database Styles Manager window direct the file to the style layer using the browsing button
:
Grounded - Explore your world 67
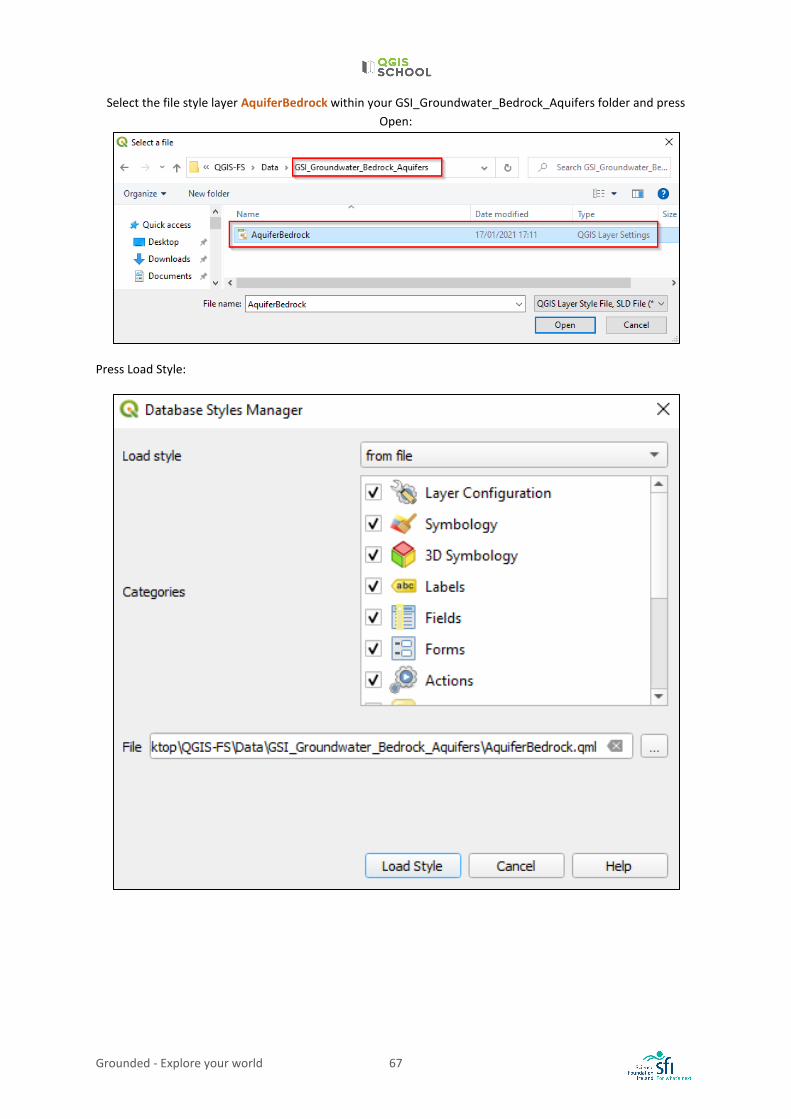
Select the file style layer AquiferBedrock within your GSI_Groundwater_Bedrock_Aquifers folder and press Open:
Press Load Style:
Grounded - Explore your world 68
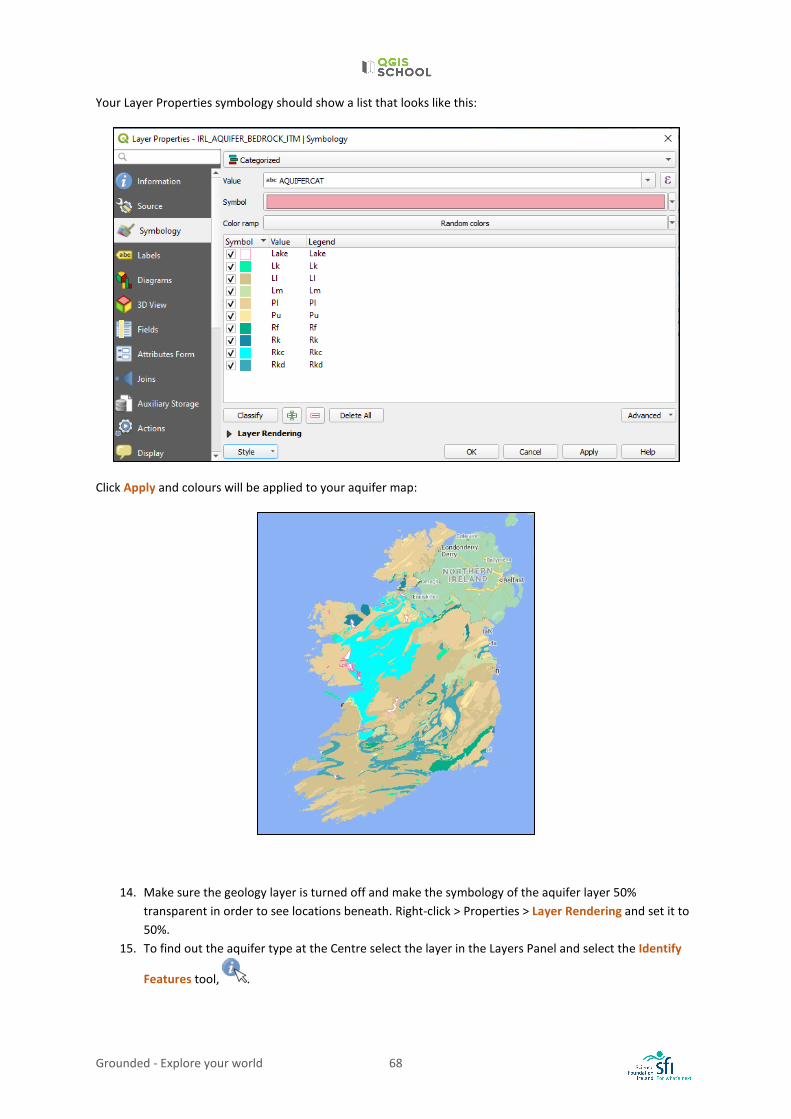
Your Layer Properties symbology should show a list that looks like this:
Click Apply and colours will be applied to your aquifer map:
14. Make sure the geology layer is turned off and make the symbology of the aquifer layer 50% transparent in order to see locations beneath. Right-click > Properties > Layer Rendering and set it to 50%.
15. To find out the aquifer type at the Centre select the layer in the Layers Panel and select the Identify
Features tool, .
Grounded - Explore your world 69
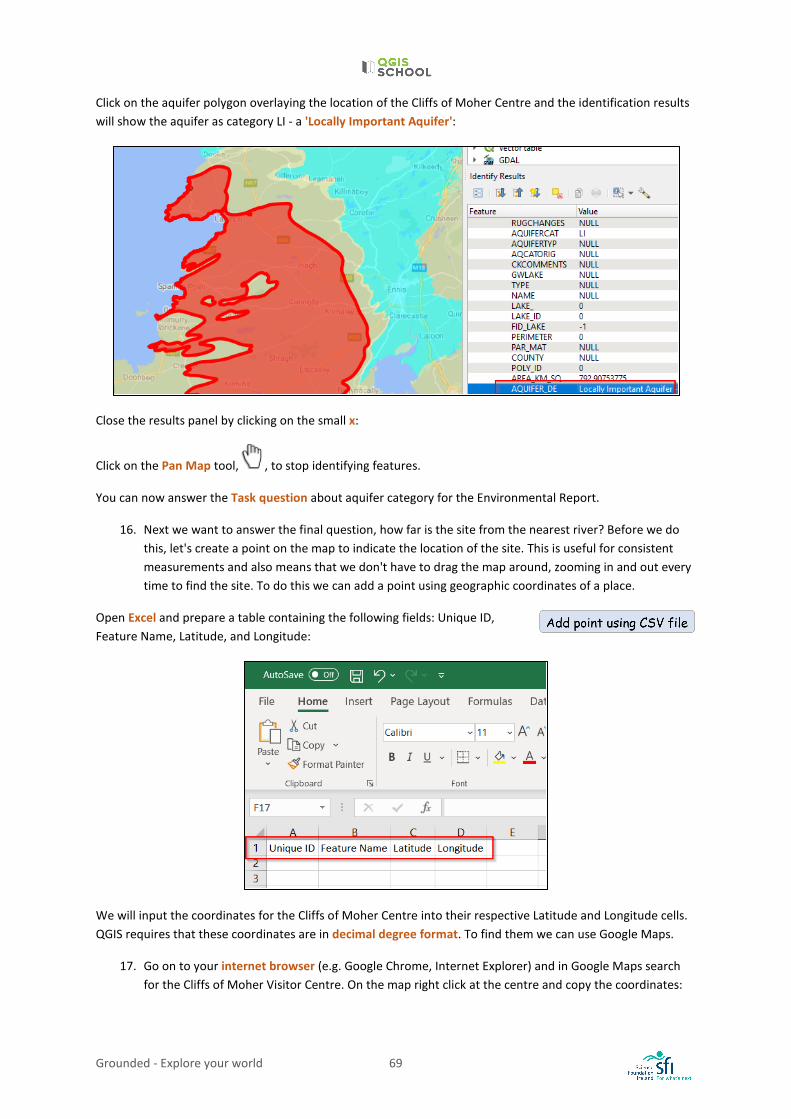
Click on the aquifer polygon overlaying the location of the Cliffs of Moher Centre and the identification results will show the aquifer as category LI - a 'Locally Important Aquifer':
Close the results panel by clicking on the small x:
Click on the Pan Map tool, , to stop identifying features.
You can now answer the Task question about aquifer category for the Environmental Report.
16. Next we want to answer the final question, how far is the site from the nearest river? Before we do this, let's create a point on the map to indicate the location of the site. This is useful for consistent measurements and also means that we don't have to drag the map around, zooming in and out every time to find the site. To do this we can add a point using geographic coordinates of a place.
Open Excel and prepare a table containing the following fields: Unique ID, Feature Name, Latitude, and Longitude:
We will input the coordinates for the Cliffs of Moher Centre into their respective Latitude and Longitude cells. QGIS requires that these coordinates are in decimal degree format. To find them we can use Google Maps.
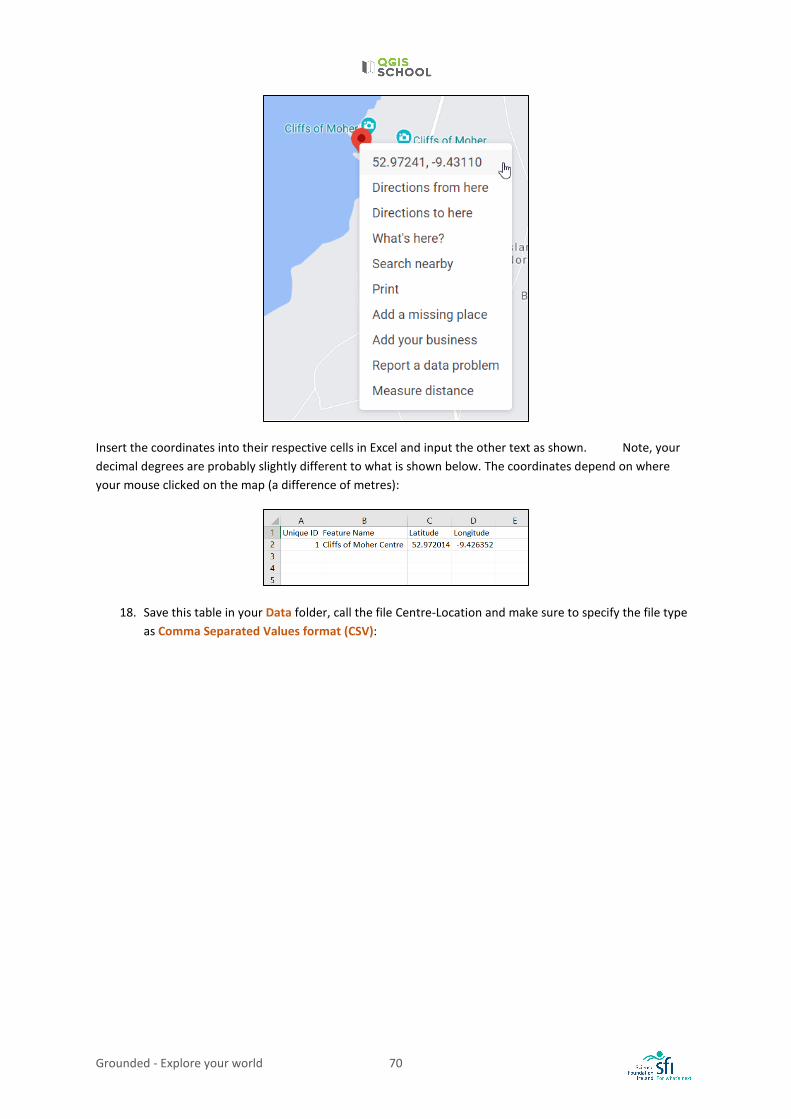
17. Go on to your internet browser (e.g. Google Chrome, Internet Explorer) and in Google Maps search for the Cliffs of Moher Visitor Centre. On the map right click at the centre and copy the coordinates:
Grounded - Explore your world 70
Insert the coordinates into their respective cells in Excel and input the other text as shown. Note, your decimal degrees are probably slightly different to what is shown below. The coordinates depend on where your mouse clicked on the map (a difference of metres):
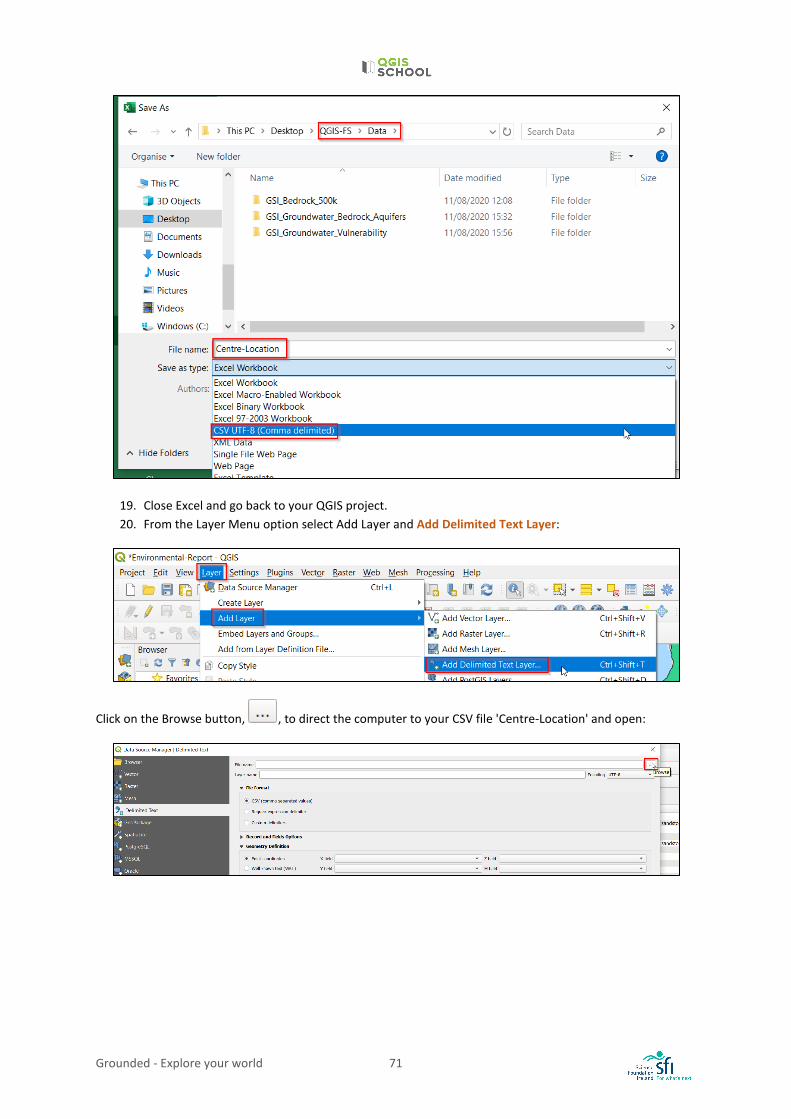
18. Save this table in your Data folder, call the file Centre-Location and make sure to specify the file type as Comma Separated Values format (CSV):
Grounded - Explore your world 71
19. Close Excel and go back to your QGIS project. 20. From the Layer Menu option select Add Layer and Add Delimited Text Layer:
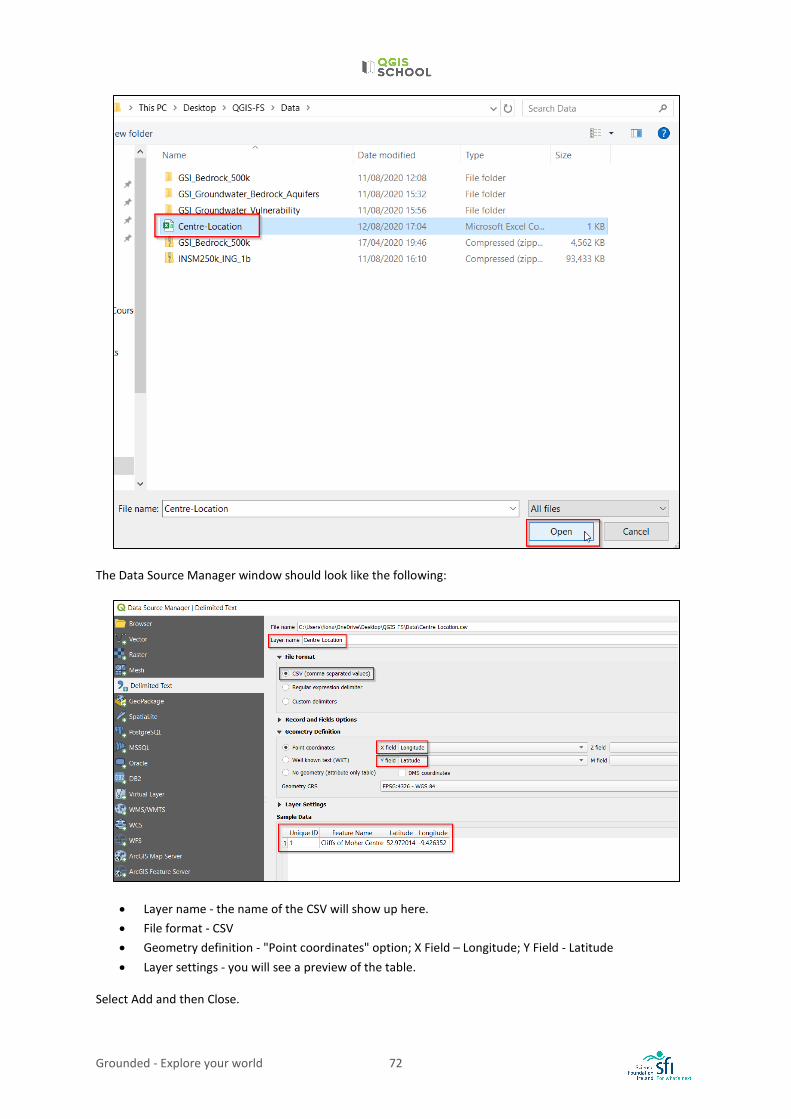
Click on the Browse button, , to direct the computer to your CSV file 'Centre-Location' and open:
Grounded - Explore your world 72
The Data Source Manager window should look like the following:
• Layer name - the name of the CSV will show up here. • File format - CSV • Geometry definition - "Point coordinates" option; X Field – Longitude; Y Field - Latitude • Layer settings - you will see a preview of the table.
Select Add and then Close.
Grounded - Explore your world 73
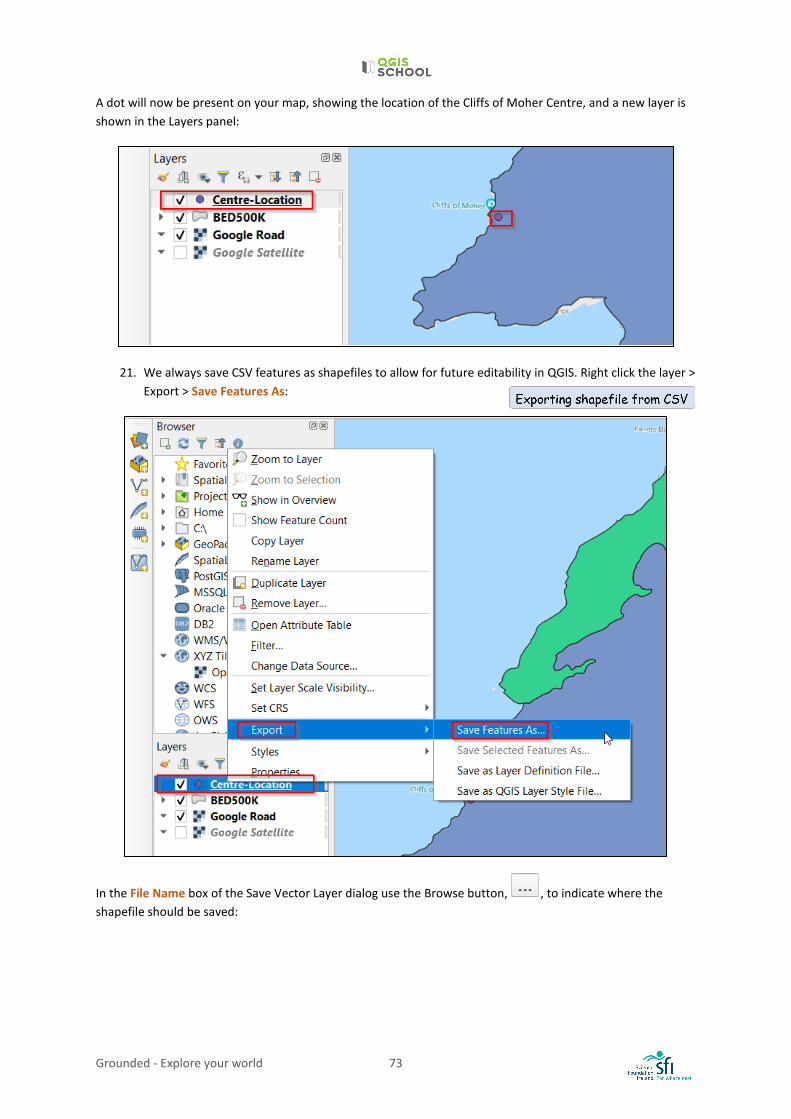
A dot will now be present on your map, showing the location of the Cliffs of Moher Centre, and a new layer is shown in the Layers panel:
21. We always save CSV features as shapefiles to allow for future editability in QGIS. Right click the layer > Export > Save Features As:
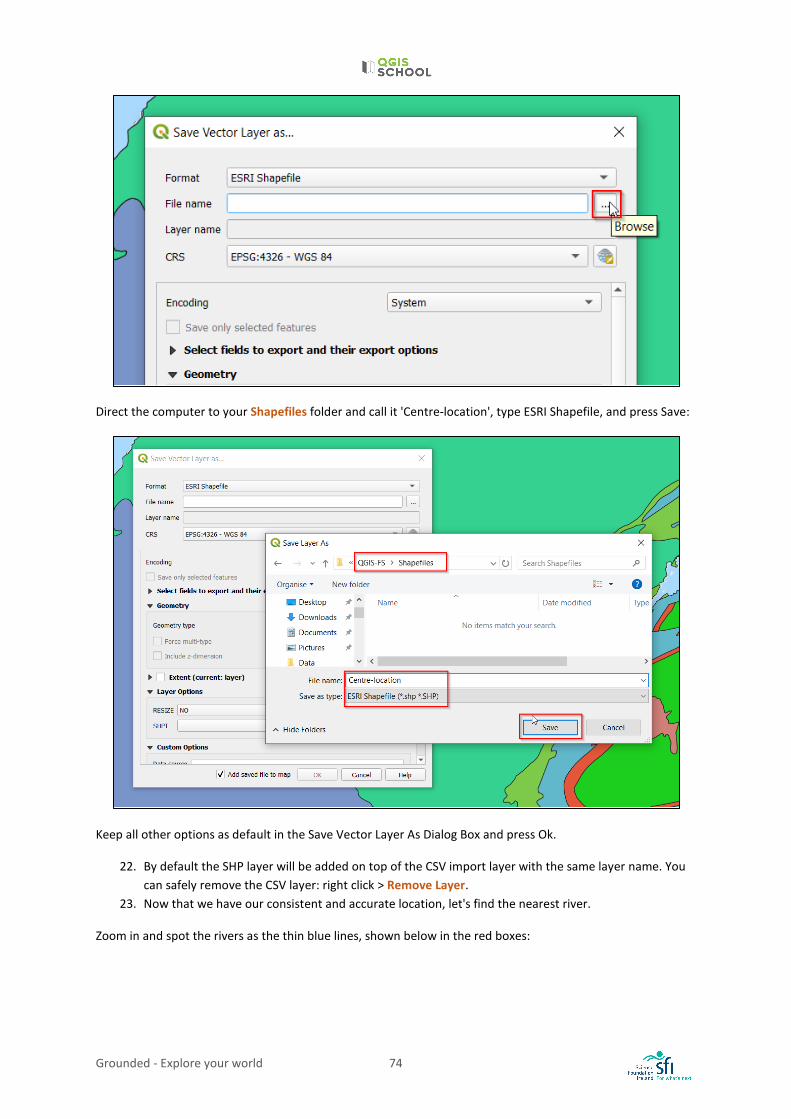
In the File Name box of the Save Vector Layer dialog use the Browse button, , to indicate where the shapefile should be saved:
Grounded - Explore your world 74
Direct the computer to your Shapefiles folder and call it 'Centre-location', type ESRI Shapefile, and press Save:
Keep all other options as default in the Save Vector Layer As Dialog Box and press Ok.
22. By default the SHP layer will be added on top of the CSV import layer with the same layer name. You can safely remove the CSV layer: right click > Remove Layer.
23. Now that we have our consistent and accurate location, let's find the nearest river.
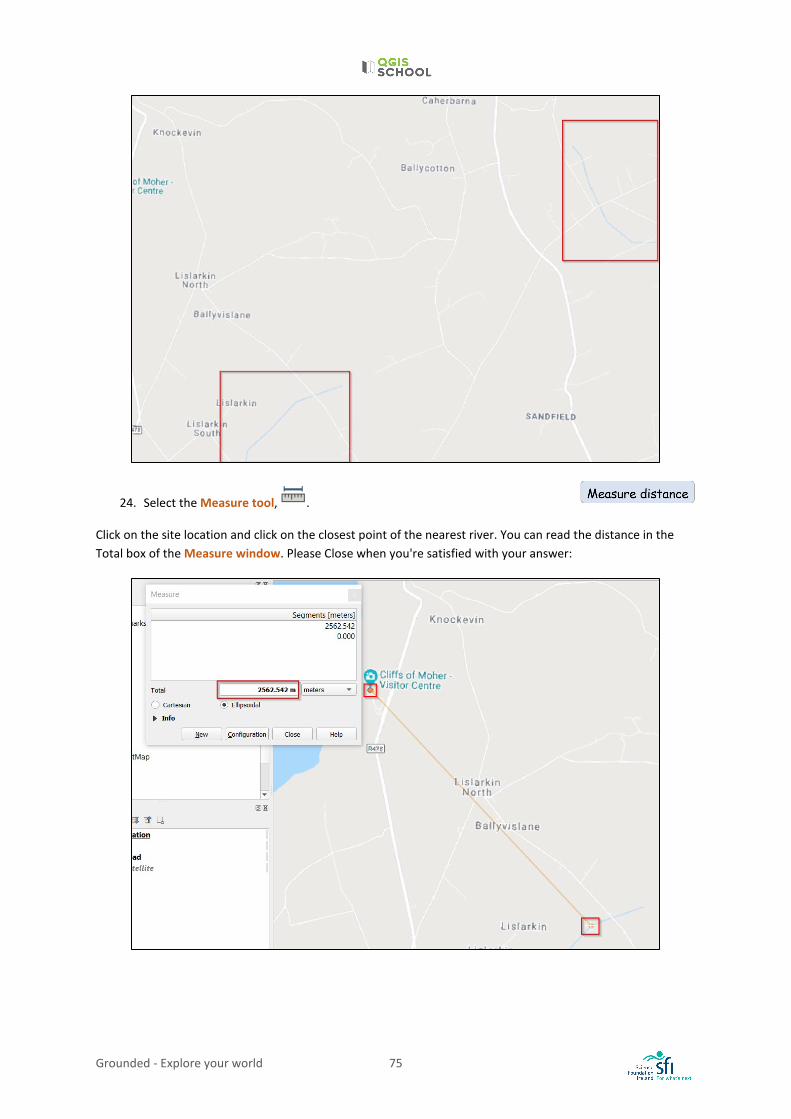
Zoom in and spot the rivers as the thin blue lines, shown below in the red boxes:
Grounded - Explore your world 75
24. Select the Measure tool, .
Click on the site location and click on the closest point of the nearest river. You can read the distance in the Total box of the Measure window. Please Close when you're satisfied with your answer:
Grounded - Explore your world 76
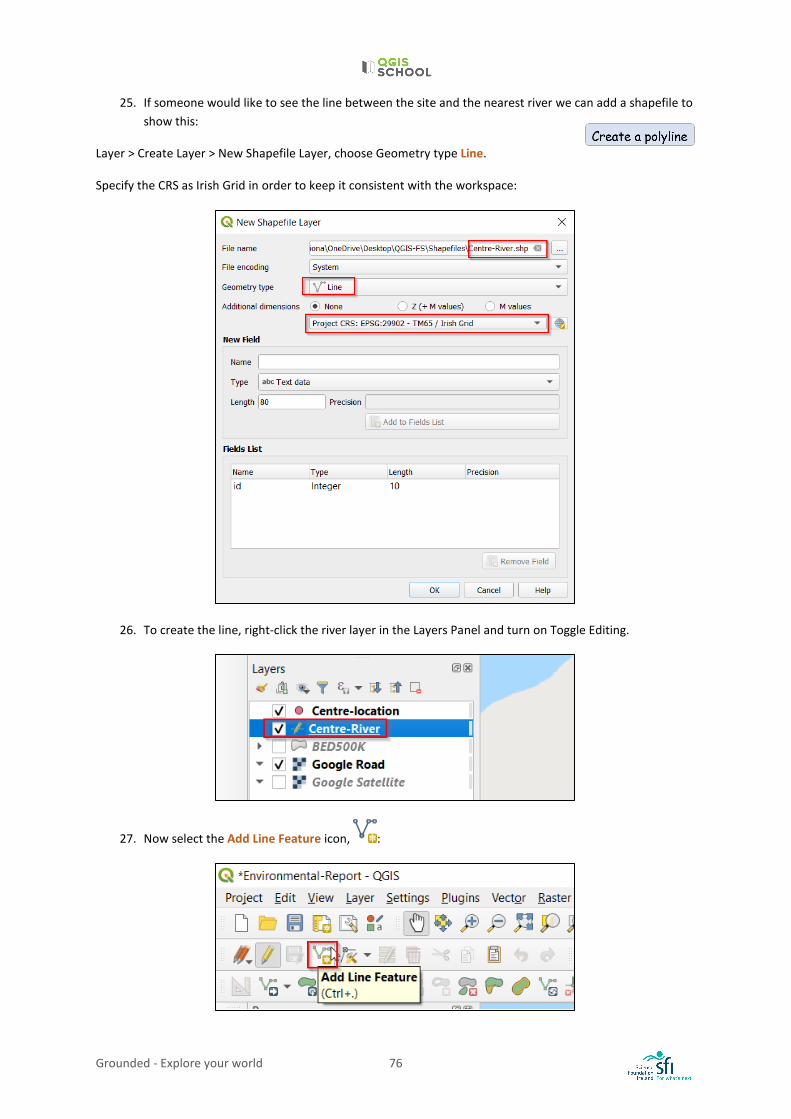
25. If someone would like to see the line between the site and the nearest river we can add a shapefile to show this:
Layer > Create Layer > New Shapefile Layer, choose Geometry type Line.
Specify the CRS as Irish Grid in order to keep it consistent with the workspace:
26. To create the line, right-click the river layer in the Layers Panel and turn on Toggle Editing.
27. Now select the Add Line Feature icon, :
Grounded - Explore your world 77
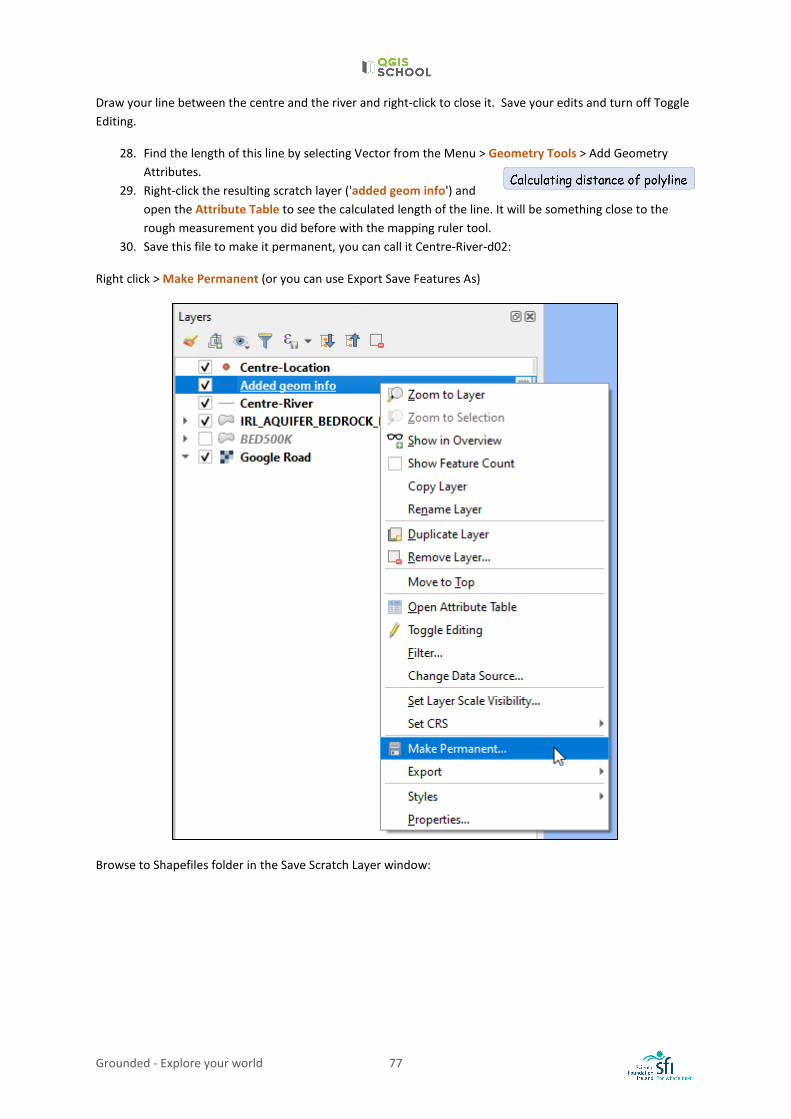
Draw your line between the centre and the river and right-click to close it. Save your edits and turn off Toggle Editing.
28. Find the length of this line by selecting Vector from the Menu > Geometry Tools > Add Geometry Attributes.
29. Right-click the resulting scratch layer ('added geom info') and open the Attribute Table to see the calculated length of the line. It will be something close to the rough measurement you did before with the mapping ruler tool.
30. Save this file to make it permanent, you can call it Centre-River-d02:
Right click > Make Permanent (or you can use Export Save Features As)
Browse to Shapefiles folder in the Save Scratch Layer window:
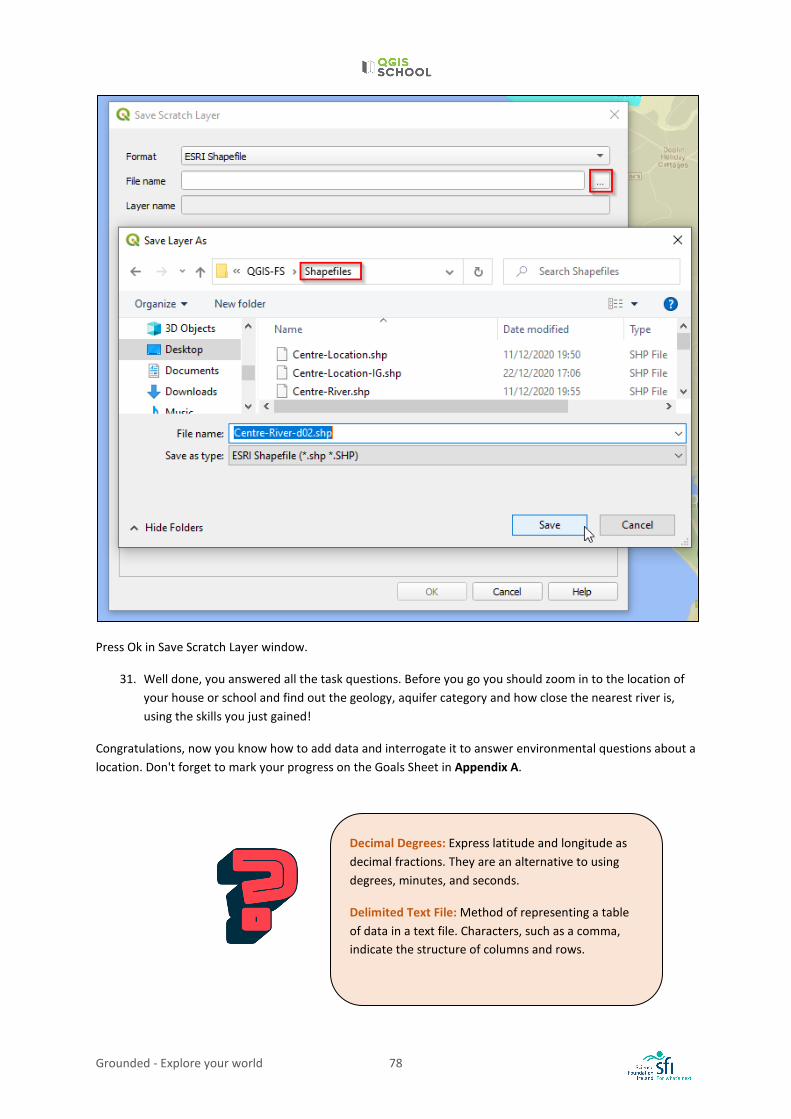
Grounded - Explore your world 78
Press Ok in Save Scratch Layer window.
31. Well done, you answered all the task questions. Before you go you should zoom in to the location of your house or school and find out the geology, aquifer category and how close the nearest river is, using the skills you just gained!
Congratulations, now you know how to add data and interrogate it to answer environmental questions about a location. Don't forget to mark your progress on the Goals Sheet in Appendix A.
Decimal Degrees: Express latitude and longitude as decimal fractions. They are an alternative to using degrees, minutes, and seconds.
Delimited Text File: Method of representing a table of data in a text file. Characters, such as a comma, indicate the structure of columns and rows.
Grounded - Explore your world 79
LESSON 5: MAPPING TO PROTECT OUR ENVIRONMENT
LEARNING OUTCOMES: • Intro to EU conservation Directives • Mapping as a tool for protecting habitats • Intro to open data
BACKGROUND The Government is under pressure to facilitate development and ensure economic growth in a sustainable manner. An important part of environmental reporting is consideration of the habitats. One method of protecting the environment, enforced through European Union Directives, has been to section off areas for conservation of the habitats and their wildlife. These sites are called SACs - Special Areas of Conservation (for habitats) and SPAs - Special Protected Areas (for birdlife). These sites are collectively referred to as Natura 2000 sites.
The National Parks & Wildlife Service (NPWS) is responsible for the designation of conservation sites in Ireland.
OPEN DATA:
Open data can be defined as “data that can be freely used, shared and built-on by anyone, anywhere, for any purpose”2. This type of data stems from external sources around the world. In these instances, data are shared with an open license, such as the public copyright Creative Commons license.
Open Data enhances collaboration, participation and social innovation. Efficiency can be greatly increased with cross-sector sharing of data, providing faster access to information.
Attribution requirements: It is possible that the licence states that people who use the data must credit the owner when they make their product or service available. This is called attribution.
In the following Exercise, the data we are going to use (SACs and SPAs) is open data from the National Parks and Wildlife Service. We will also be using Google Roads open data.
We will make sure to incorporate the attribution requirements for these data sources on our map.
RESOURCES
• What is open data? https://data.gov.ie/edpelearning/en/module1/#/id/co-01 • National Parks and Wildlife protected sites information: https://www.npws.ie/protected-sites • 10 conservation initiatives that have been very successful in delivery of conservation objectives:
https://www.biodiversityireland.ie/biodiversity-irelands-top-10/10-conservation-success-stories/
2Summary of the full Open Definition which the Open Knowledge Foundation created in 2005: https://opendefinition.org/od/2.1/en/.
Grounded - Explore your world 80
EXERCISE 5: QGIS AND HABITAT MAPPING Don't forget, all the steps are also demonstrated in the video tutorial, accessible here: https://cutt.ly/9jUZ7bE.
Objective:
• Use GIS to show protected mapped habitats of an area.
Task:
Following on from Exercise 4, the Planning Decision requires the Cliffs of Moher Viewing Platform project to adhere to EU regulations. This includes ensuring that no Natura 2000 sites are going to be impacted. To show this we produce habitat maps.
The company are also obligated to inform stakeholders (a person with an interest or concern in something) about their plans. It is important to involve all stakeholders, particularly the local community, when planning, designing, and operating tourist attractions so that local knowledge and experience are incorporated. The company are going to hold a Public Consultation meeting in order to present their vision for the attraction.
You are requested to perform habitat mapping to help form part of the Planning Approval documents and which will be presented at a Public Consultation workshop, where the company will present their plan for the attraction to the public.
The Public Consultation Map needs to include the following:
• Location of Proposed Viewing Platform (52.981097, -9.429096) • Any SACs and SPAs within 2km of the Proposed Viewing Platform • Location of Cliffs of Moher Centre and the current Viewing Point • A map legend • The date map was created and the author • Map title: 'Habitat Mapping for Public Consultation' • Attribution of data
Relevant Sustainable Development Goals:
Grounded - Explore your world 81
Exercise 5 Steps:
1. Reopen the Environmental Project from Exercise 4. Save a copy of it and give the new file the name 'Habitats'.
2. As they are not necessary for this mapping exercise, remove the bedrock, aquifer and river layers of the previous exercise (right click > remove layer). We will keep the Centre-Location layer for now.
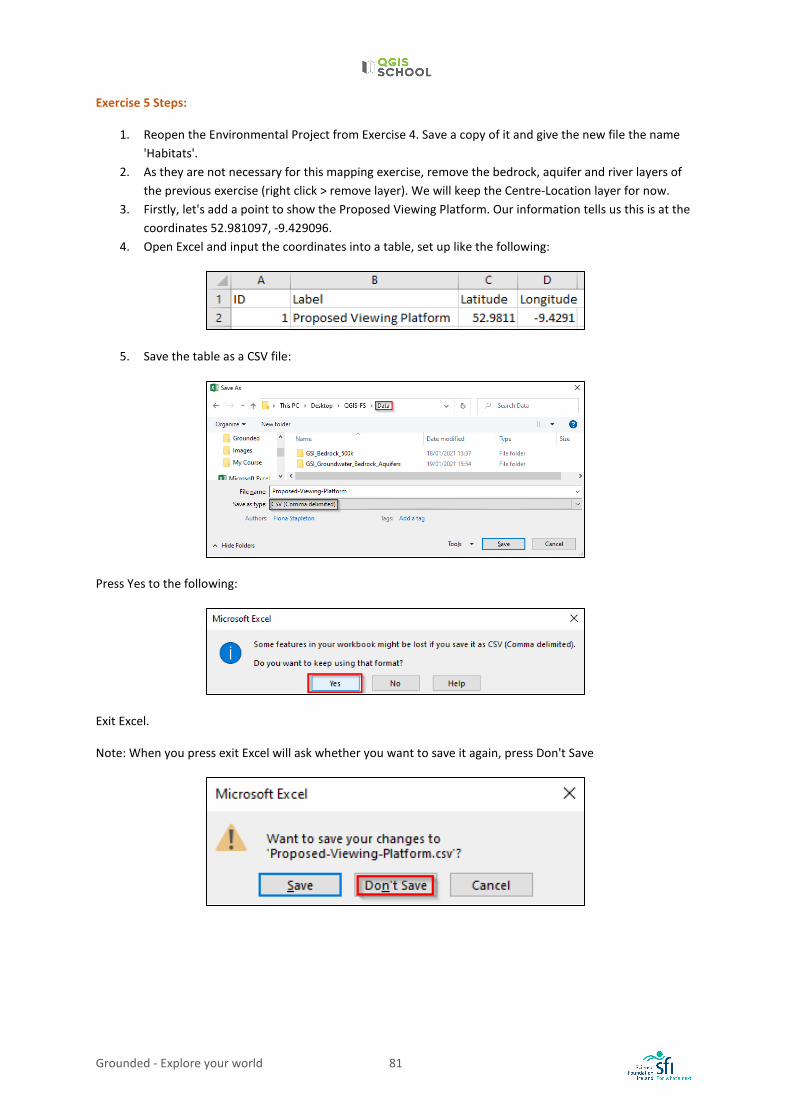
3. Firstly, let's add a point to show the Proposed Viewing Platform. Our information tells us this is at the coordinates 52.981097, -9.429096.
4. Open Excel and input the coordinates into a table, set up like the following:
5. Save the table as a CSV file:
Press Yes to the following:
Exit Excel.
Note: When you press exit Excel will ask whether you want to save it again, press Don't Save
Grounded - Explore your world 82
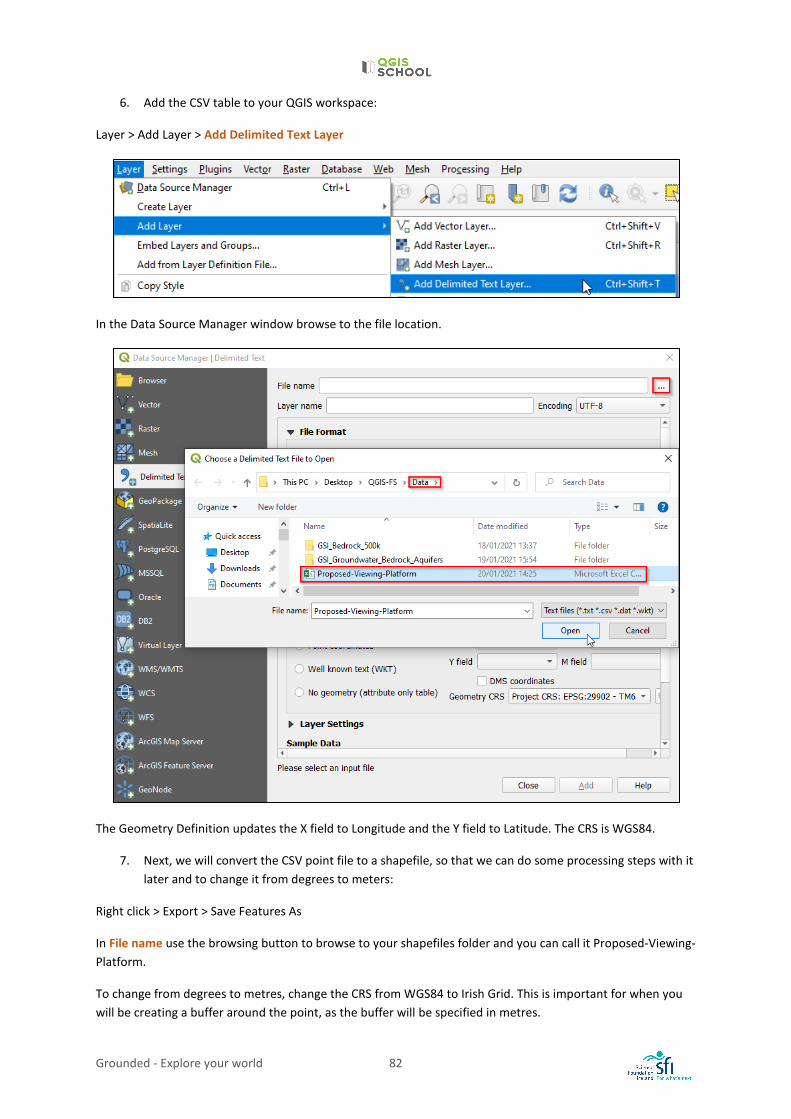
6. Add the CSV table to your QGIS workspace:
Layer > Add Layer > Add Delimited Text Layer
In the Data Source Manager window browse to the file location.
The Geometry Definition updates the X field to Longitude and the Y field to Latitude. The CRS is WGS84.
7. Next, we will convert the CSV point file to a shapefile, so that we can do some processing steps with it later and to change it from degrees to meters:
Right click > Export > Save Features As
In File name use the browsing button to browse to your shapefiles folder and you can call it Proposed-Viewing-Platform.
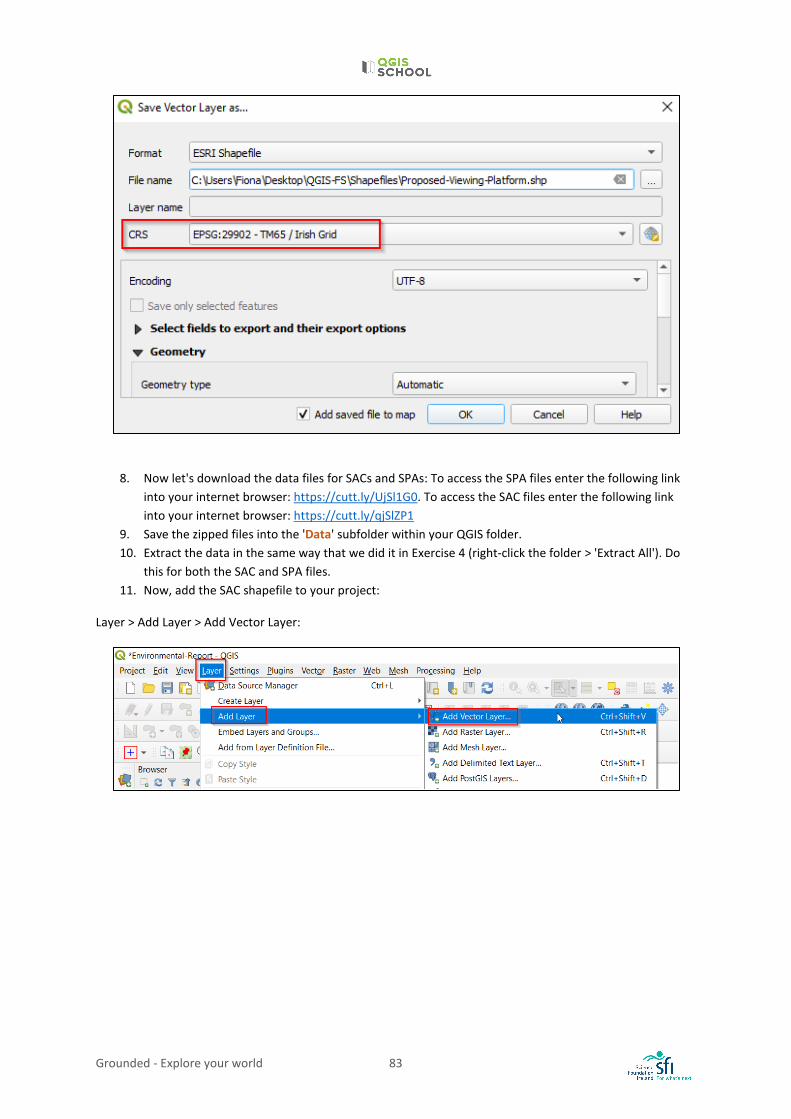
To change from degrees to metres, change the CRS from WGS84 to Irish Grid. This is important for when you will be creating a buffer around the point, as the buffer will be specified in metres.
Grounded - Explore your world 83
8. Now let's download the data files for SACs and SPAs: To access the SPA files enter the following link
into your internet browser: https://cutt.ly/UjSl1G0. To access the SAC files enter the following link into your internet browser: https://cutt.ly/qjSlZP1
9. Save the zipped files into the 'Data' subfolder within your QGIS folder. 10. Extract the data in the same way that we did it in Exercise 4 (right-click the folder > 'Extract All'). Do
this for both the SAC and SPA files. 11. Now, add the SAC shapefile to your project:
Layer > Add Layer > Add Vector Layer:
Grounded - Explore your world 84
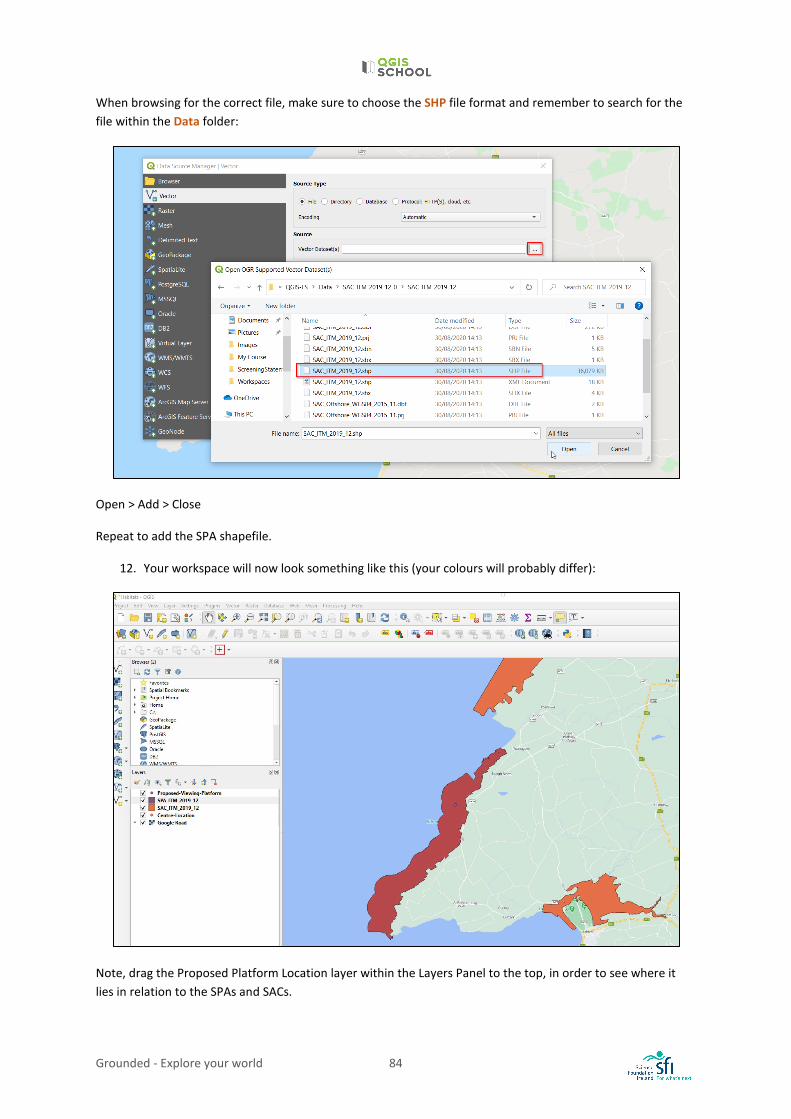
When browsing for the correct file, make sure to choose the SHP file format and remember to search for the file within the Data folder:
Open > Add > Close
Repeat to add the SPA shapefile.
12. Your workspace will now look something like this (your colours will probably differ):
Note, drag the Proposed Platform Location layer within the Layers Panel to the top, in order to see where it lies in relation to the SPAs and SACs.
Grounded - Explore your world 85
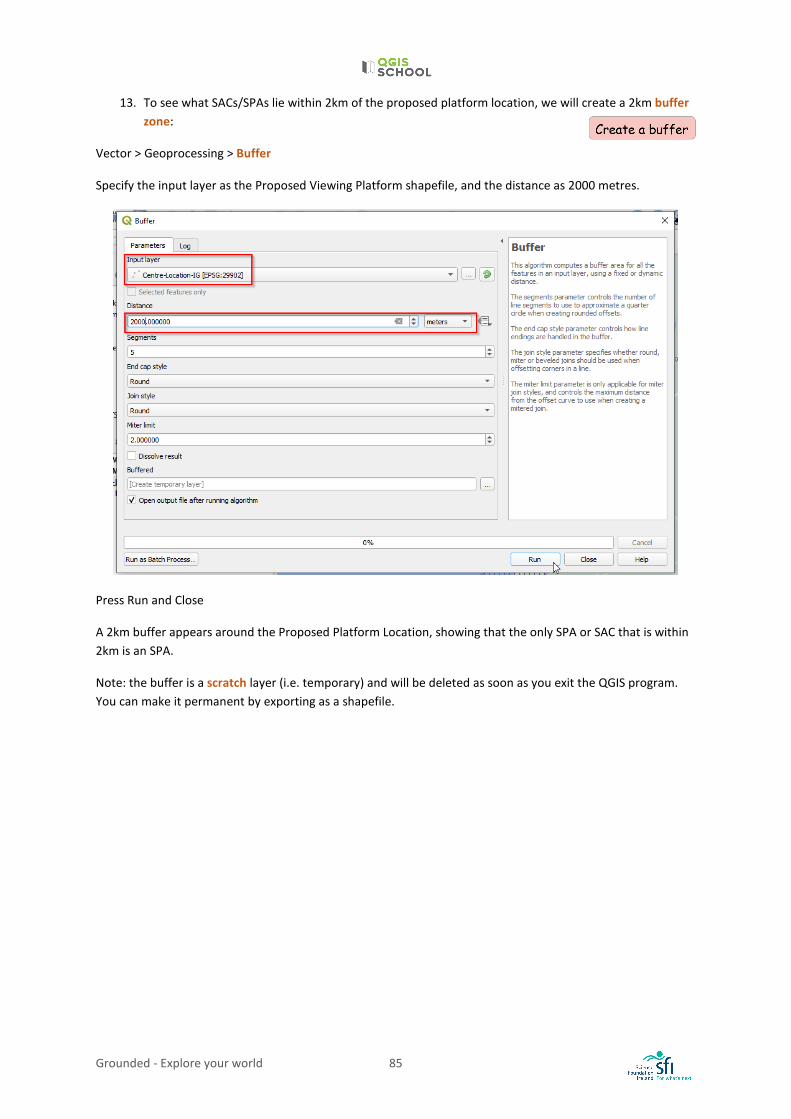
13. To see what SACs/SPAs lie within 2km of the proposed platform location, we will create a 2km buffer zone:
Vector > Geoprocessing > Buffer
Specify the input layer as the Proposed Viewing Platform shapefile, and the distance as 2000 metres.
Press Run and Close
A 2km buffer appears around the Proposed Platform Location, showing that the only SPA or SAC that is within 2km is an SPA.
Note: the buffer is a scratch layer (i.e. temporary) and will be deleted as soon as you exit the QGIS program. You can make it permanent by exporting as a shapefile.
Grounded - Explore your world 86
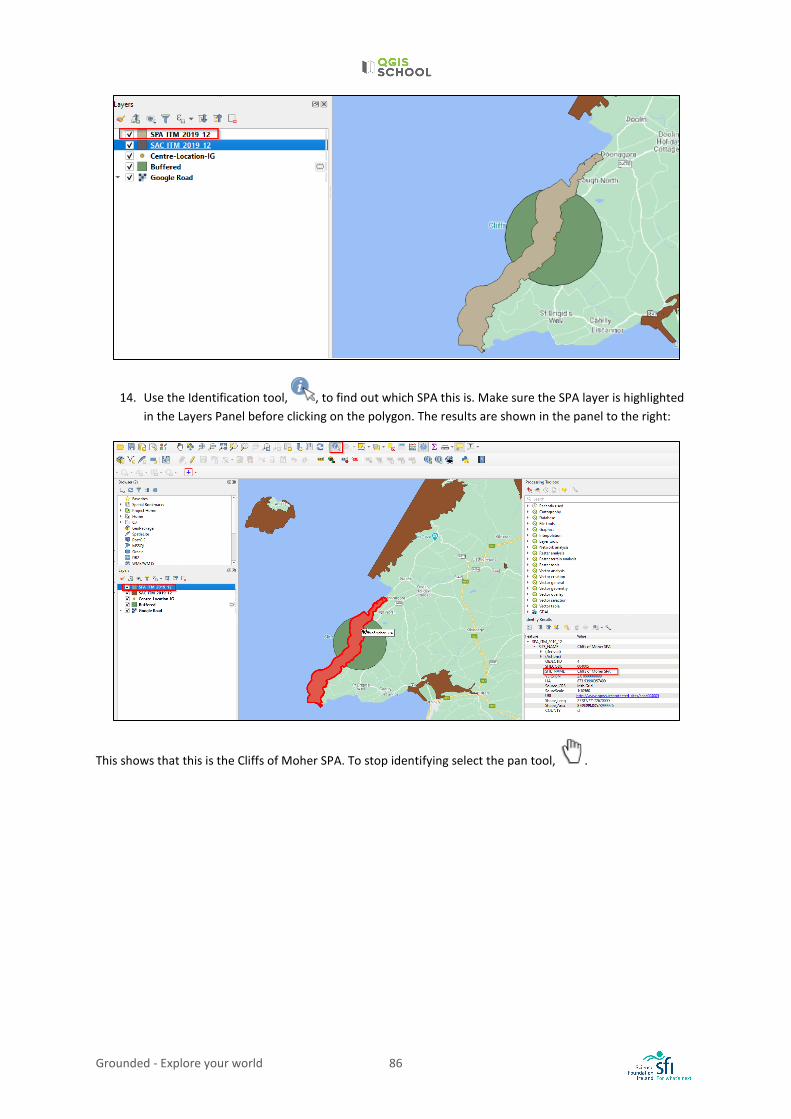
14. Use the Identification tool, , to find out which SPA this is. Make sure the SPA layer is highlighted in the Layers Panel before clicking on the polygon. The results are shown in the panel to the right:
This shows that this is the Cliffs of Moher SPA. To stop identifying select the pan tool, .
Grounded - Explore your world 87
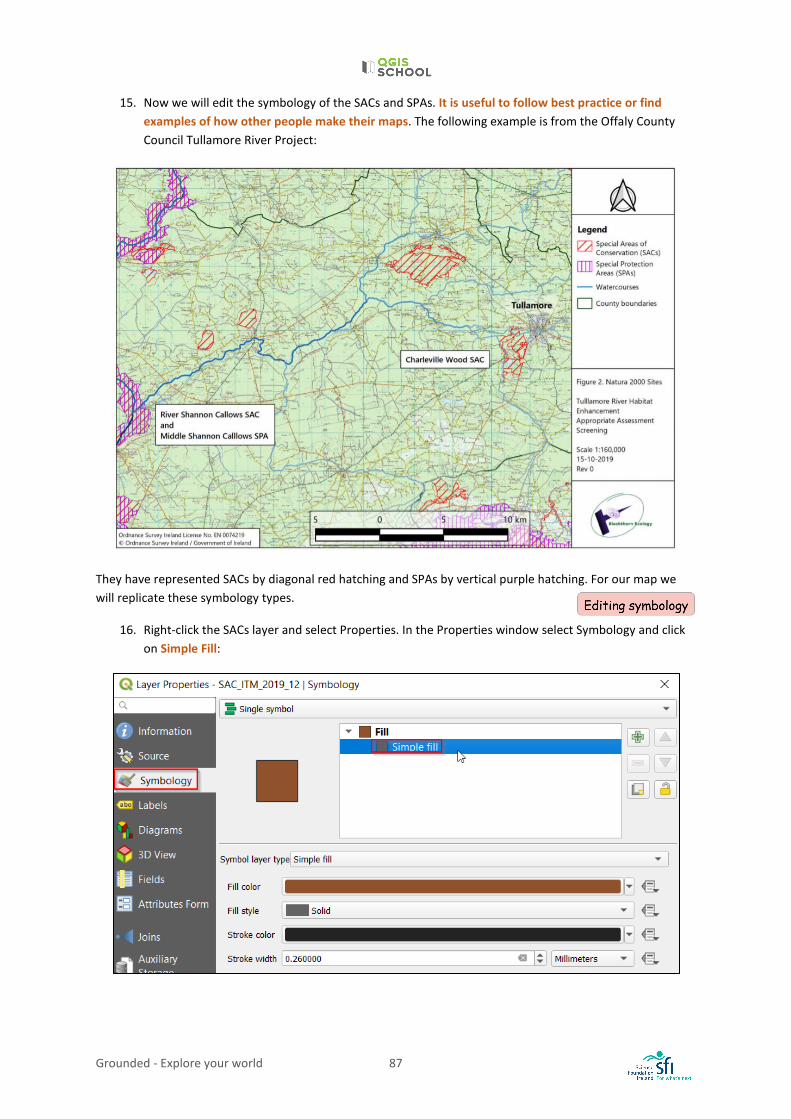
15. Now we will edit the symbology of the SACs and SPAs. It is useful to follow best practice or find examples of how other people make their maps. The following example is from the Offaly County Council Tullamore River Project:
They have represented SACs by diagonal red hatching and SPAs by vertical purple hatching. For our map we will replicate these symbology types.
16. Right-click the SACs layer and select Properties. In the Properties window select Symbology and click on Simple Fill:
Grounded - Explore your world 88
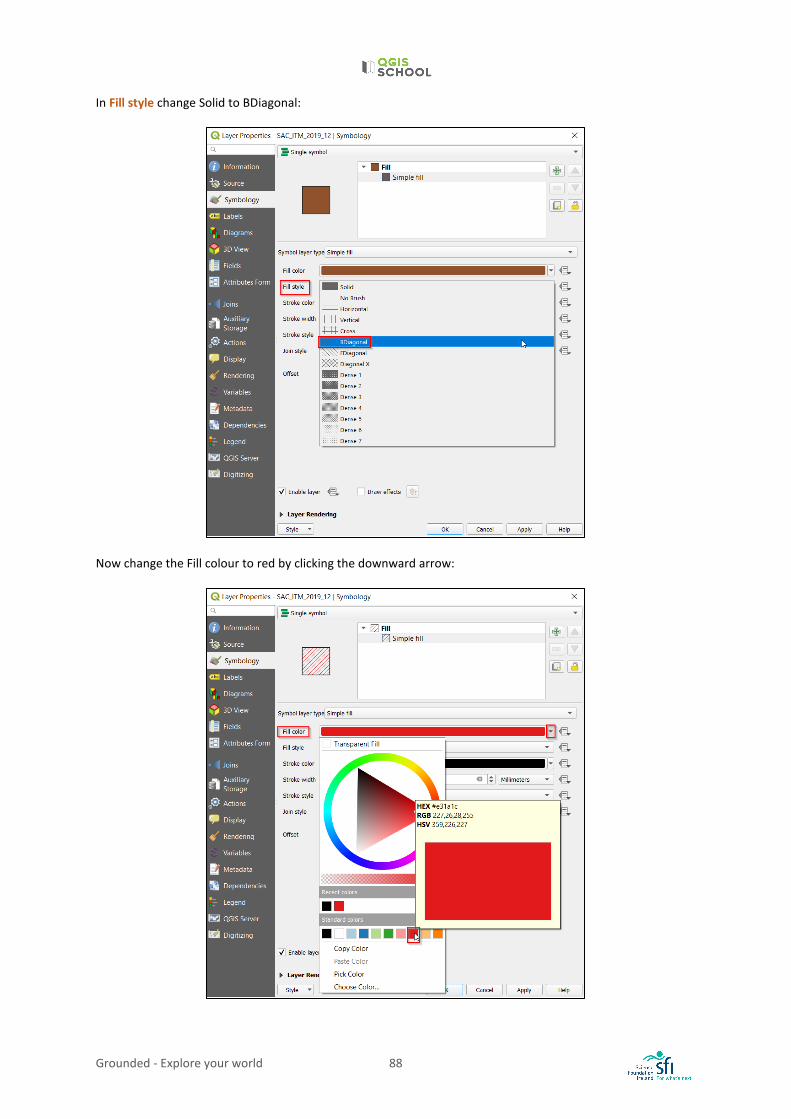
In Fill style change Solid to BDiagonal:
Now change the Fill colour to red by clicking the downward arrow:
Grounded - Explore your world 89
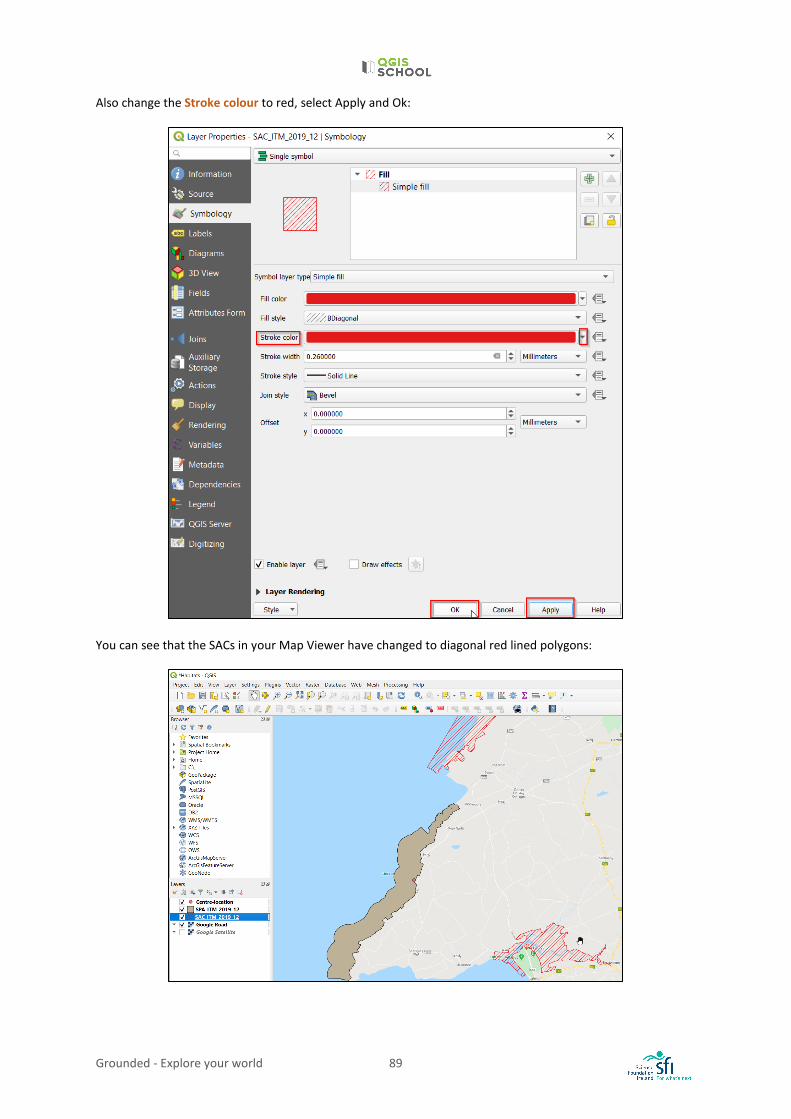
Also change the Stroke colour to red, select Apply and Ok:
You can see that the SACs in your Map Viewer have changed to diagonal red lined polygons:
Grounded - Explore your world 90
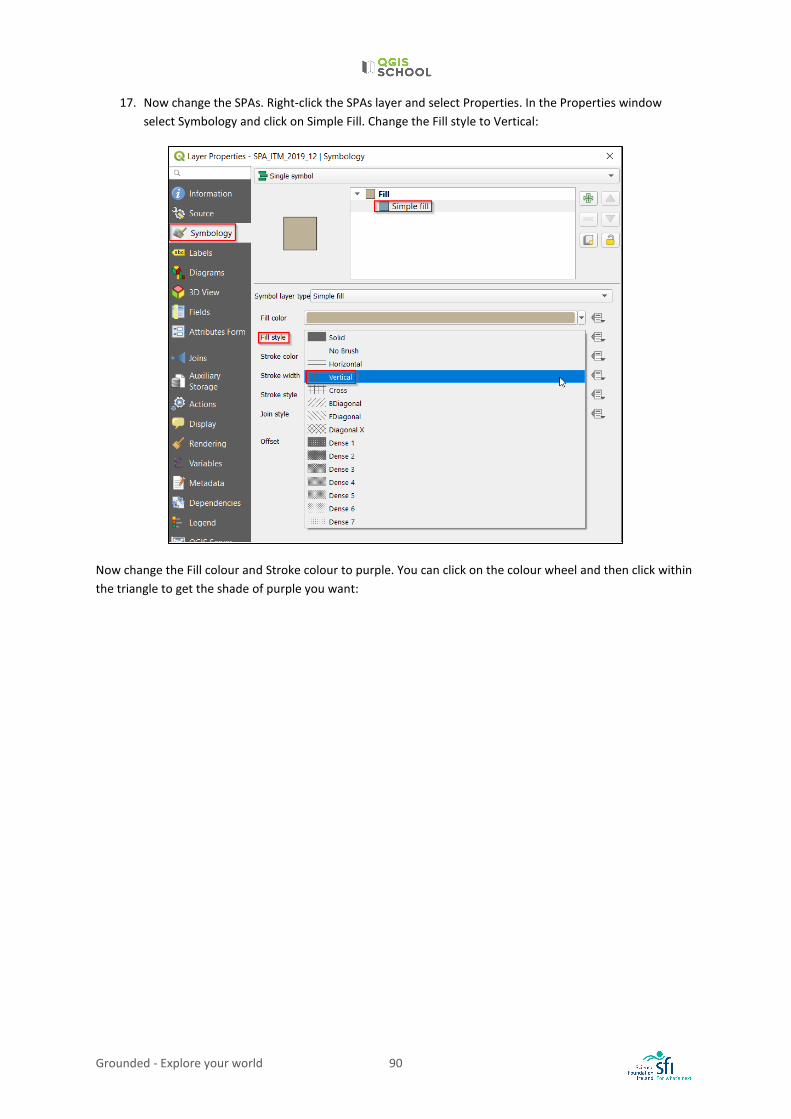
17. Now change the SPAs. Right-click the SPAs layer and select Properties. In the Properties window select Symbology and click on Simple Fill. Change the Fill style to Vertical:
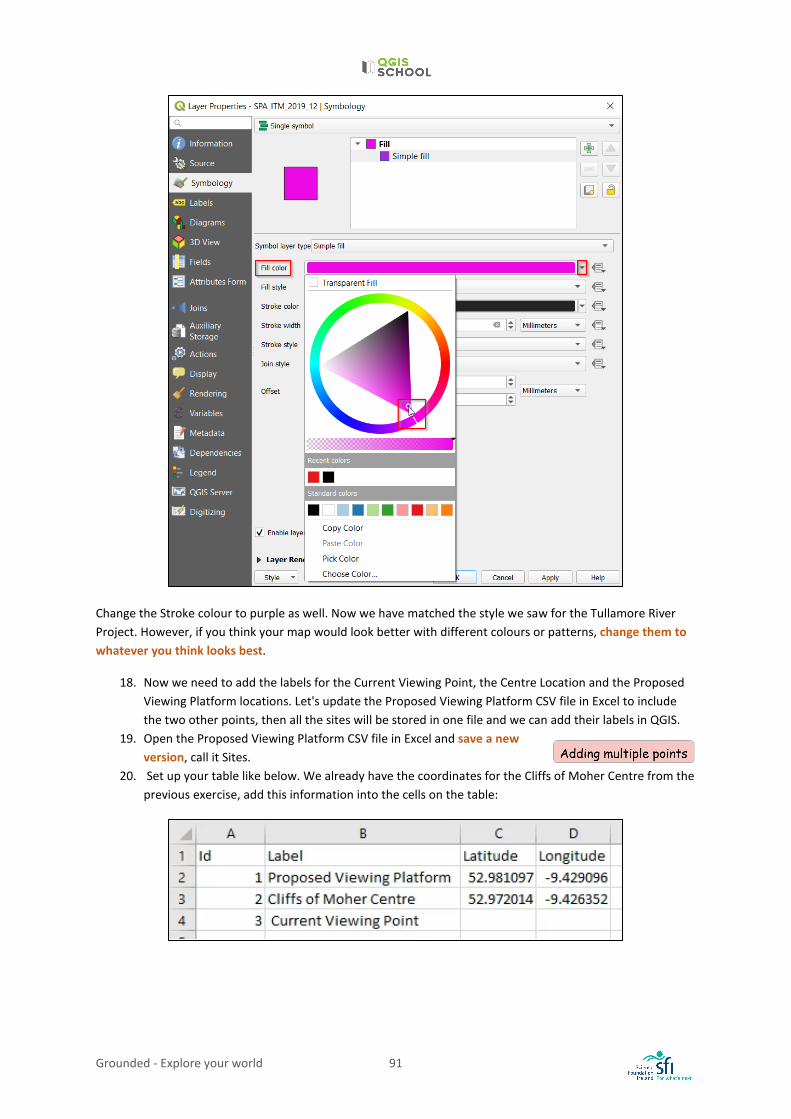
Now change the Fill colour and Stroke colour to purple. You can click on the colour wheel and then click within the triangle to get the shade of purple you want:
Grounded - Explore your world 91
Change the Stroke colour to purple as well. Now we have matched the style we saw for the Tullamore River Project. However, if you think your map would look better with different colours or patterns, change them to whatever you think looks best.
18. Now we need to add the labels for the Current Viewing Point, the Centre Location and the Proposed Viewing Platform locations. Let's update the Proposed Viewing Platform CSV file in Excel to include the two other points, then all the sites will be stored in one file and we can add their labels in QGIS.
19. Open the Proposed Viewing Platform CSV file in Excel and save a new version, call it Sites.
20. Set up your table like below. We already have the coordinates for the Cliffs of Moher Centre from the previous exercise, add this information into the cells on the table:
Grounded - Explore your world 92
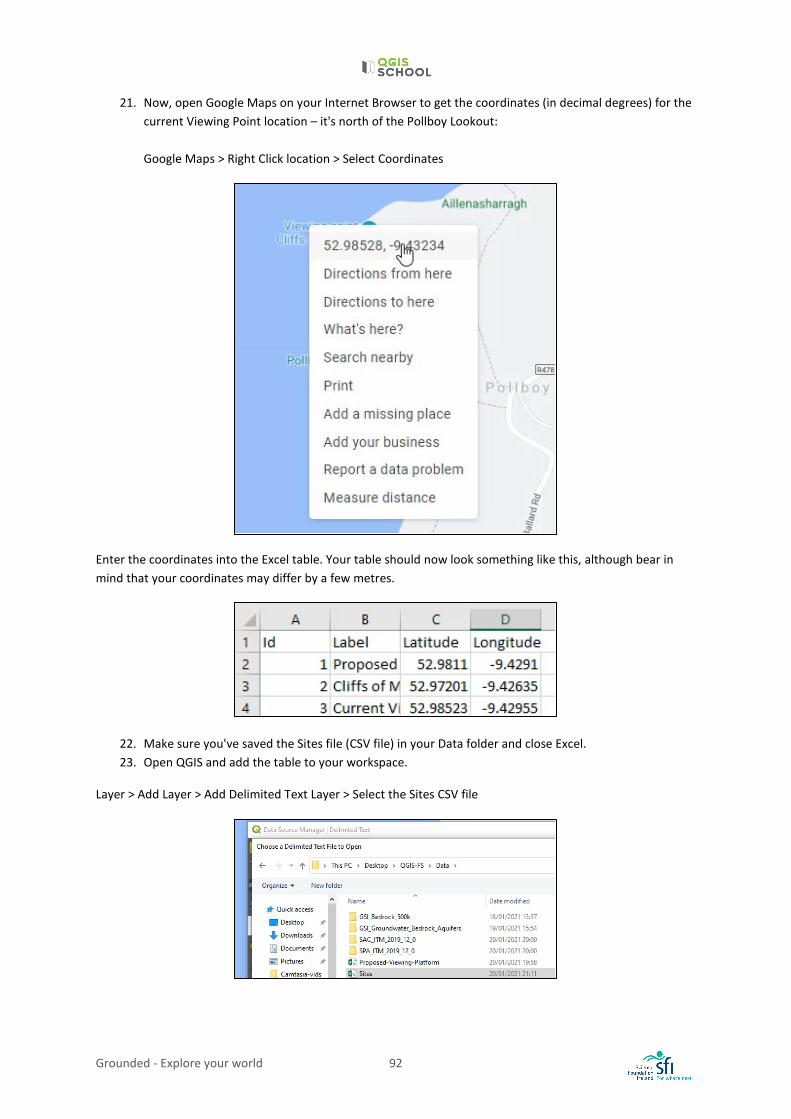
21. Now, open Google Maps on your Internet Browser to get the coordinates (in decimal degrees) for the current Viewing Point location – it's north of the Pollboy Lookout: Google Maps > Right Click location > Select Coordinates
Enter the coordinates into the Excel table. Your table should now look something like this, although bear in mind that your coordinates may differ by a few metres.
22. Make sure you've saved the Sites file (CSV file) in your Data folder and close Excel. 23. Open QGIS and add the table to your workspace.
Layer > Add Layer > Add Delimited Text Layer > Select the Sites CSV file
Grounded - Explore your world 93
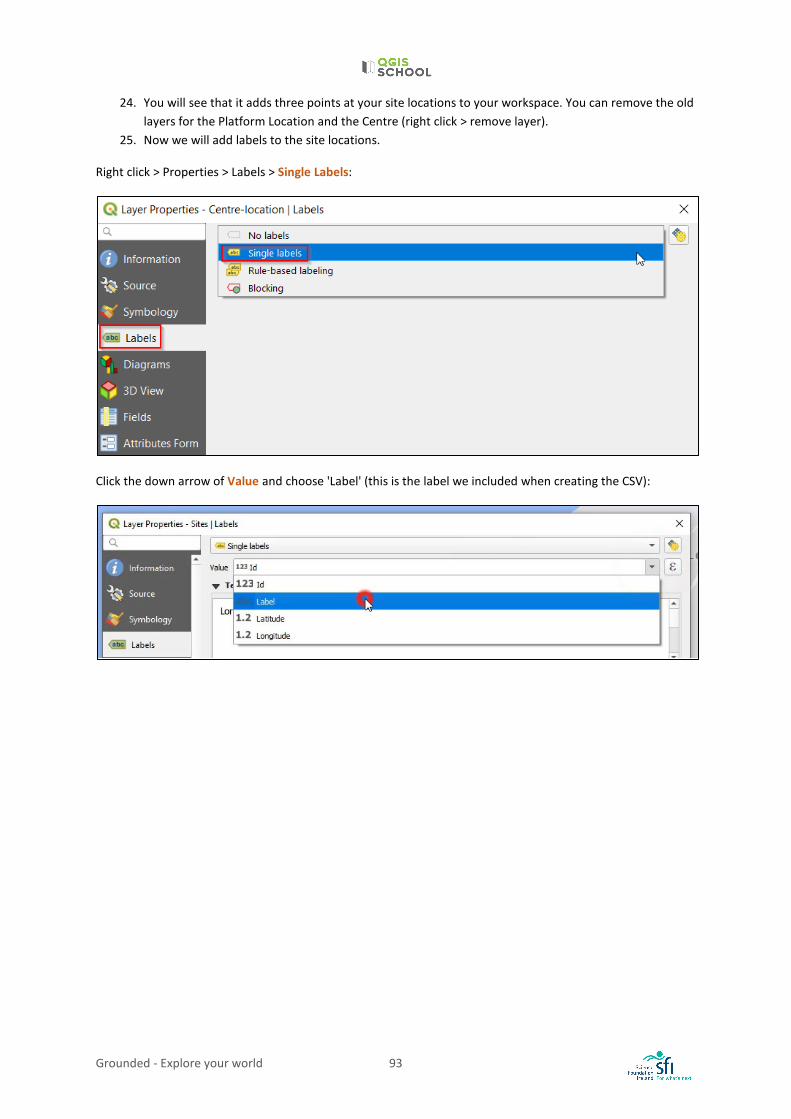
24. You will see that it adds three points at your site locations to your workspace. You can remove the old layers for the Platform Location and the Centre (right click > remove layer).
25. Now we will add labels to the site locations.
Right click > Properties > Labels > Single Labels:
Click the down arrow of Value and choose 'Label' (this is the label we included when creating the CSV):
Grounded - Explore your world 94
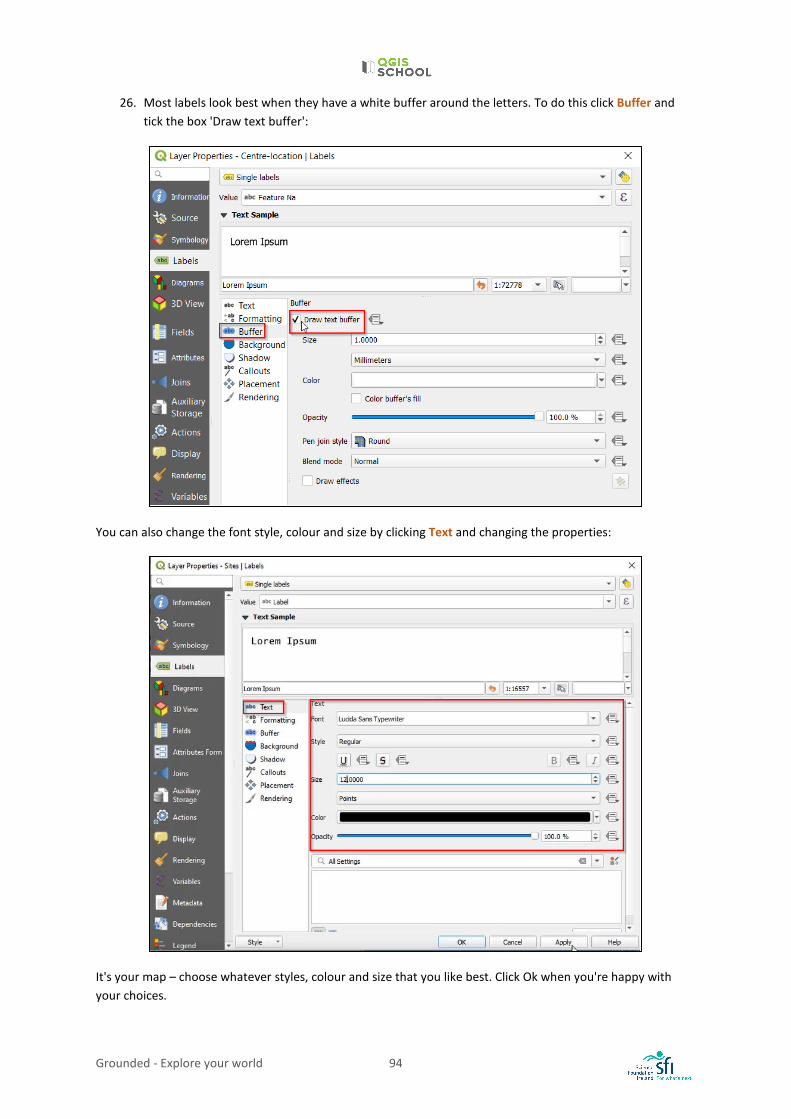
26. Most labels look best when they have a white buffer around the letters. To do this click Buffer and tick the box 'Draw text buffer':
You can also change the font style, colour and size by clicking Text and changing the properties:
It's your map – choose whatever styles, colour and size that you like best. Click Ok when you're happy with your choices.
Grounded - Explore your world 95
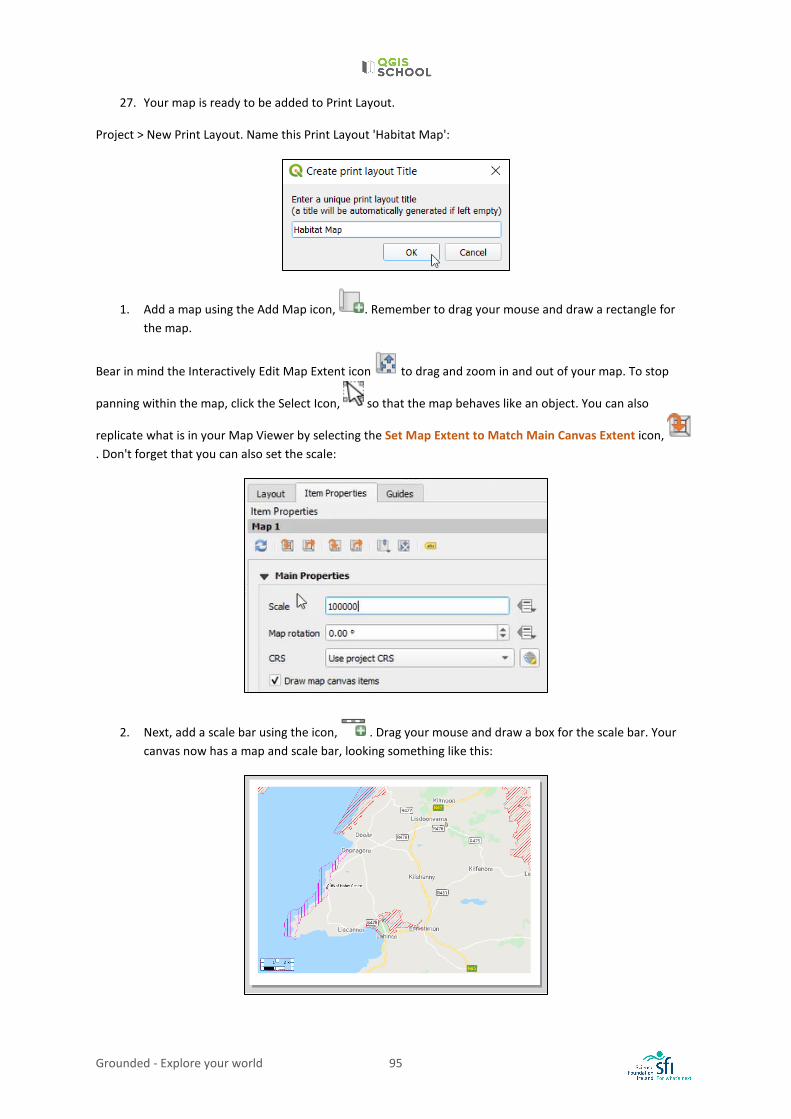
27. Your map is ready to be added to Print Layout.
Project > New Print Layout. Name this Print Layout 'Habitat Map':
1. Add a map using the Add Map icon, . Remember to drag your mouse and draw a rectangle for the map.
Bear in mind the Interactively Edit Map Extent icon to drag and zoom in and out of your map. To stop
panning within the map, click the Select Icon, so that the map behaves like an object. You can also
replicate what is in your Map Viewer by selecting the Set Map Extent to Match Main Canvas Extent icon, . Don't forget that you can also set the scale:
2. Next, add a scale bar using the icon, . Drag your mouse and draw a box for the scale bar. Your canvas now has a map and scale bar, looking something like this:
Grounded - Explore your world 96
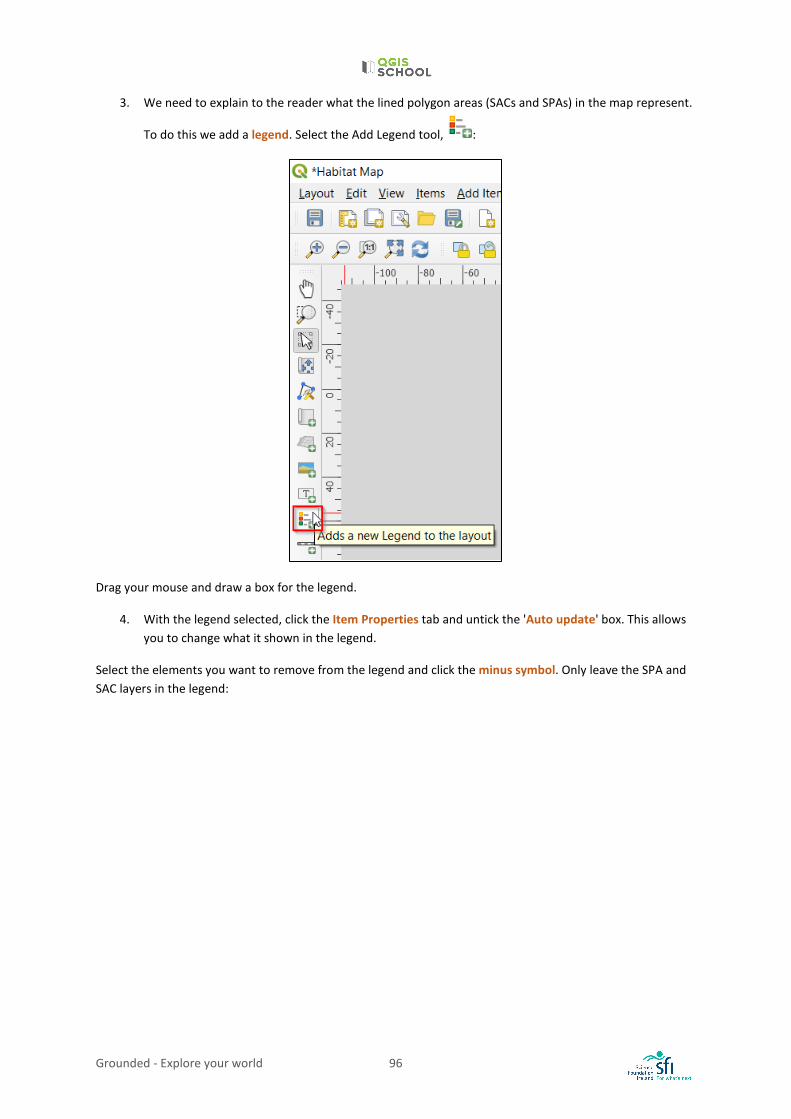
3. We need to explain to the reader what the lined polygon areas (SACs and SPAs) in the map represent.
To do this we add a legend. Select the Add Legend tool, :
Drag your mouse and draw a box for the legend.
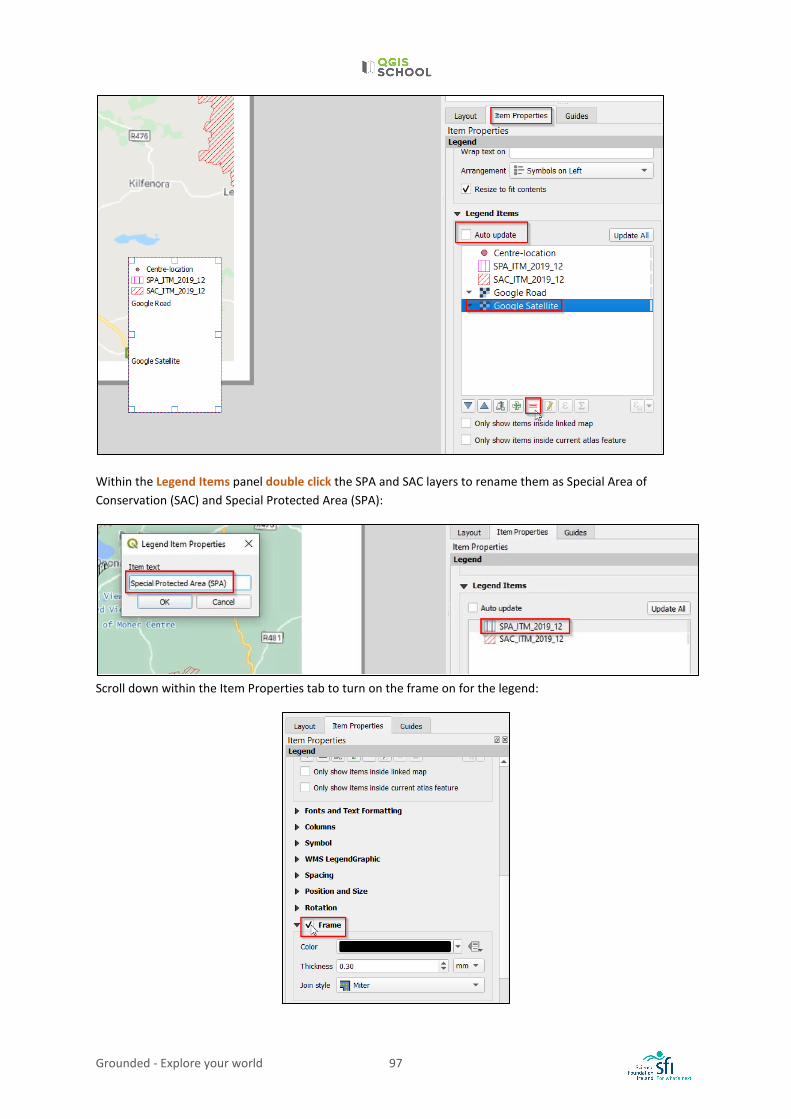
4. With the legend selected, click the Item Properties tab and untick the 'Auto update' box. This allows you to change what it shown in the legend.
Select the elements you want to remove from the legend and click the minus symbol. Only leave the SPA and SAC layers in the legend:
Grounded - Explore your world 97
Within the Legend Items panel double click the SPA and SAC layers to rename them as Special Area of Conservation (SAC) and Special Protected Area (SPA):
Scroll down within the Item Properties tab to turn on the frame on for the legend:
Grounded - Explore your world 98
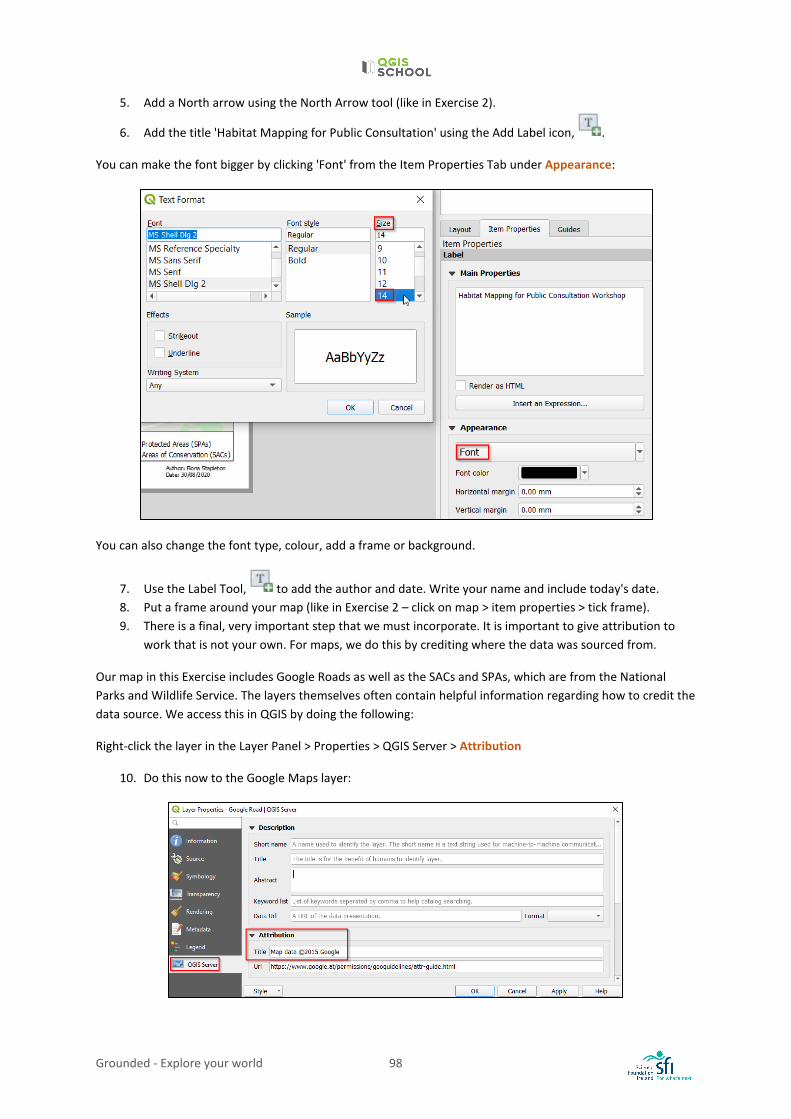
5. Add a North arrow using the North Arrow tool (like in Exercise 2).
6. Add the title 'Habitat Mapping for Public Consultation' using the Add Label icon, .
You can make the font bigger by clicking 'Font' from the Item Properties Tab under Appearance:
You can also change the font type, colour, add a frame or background.
7. Use the Label Tool, to add the author and date. Write your name and include today's date. 8. Put a frame around your map (like in Exercise 2 – click on map > item properties > tick frame). 9. There is a final, very important step that we must incorporate. It is important to give attribution to
work that is not your own. For maps, we do this by crediting where the data was sourced from.
Our map in this Exercise includes Google Roads as well as the SACs and SPAs, which are from the National Parks and Wildlife Service. The layers themselves often contain helpful information regarding how to credit the data source. We access this in QGIS by doing the following:
Right-click the layer in the Layer Panel > Properties > QGIS Server > Attribution
10. Do this now to the Google Maps layer:
Grounded - Explore your world 99
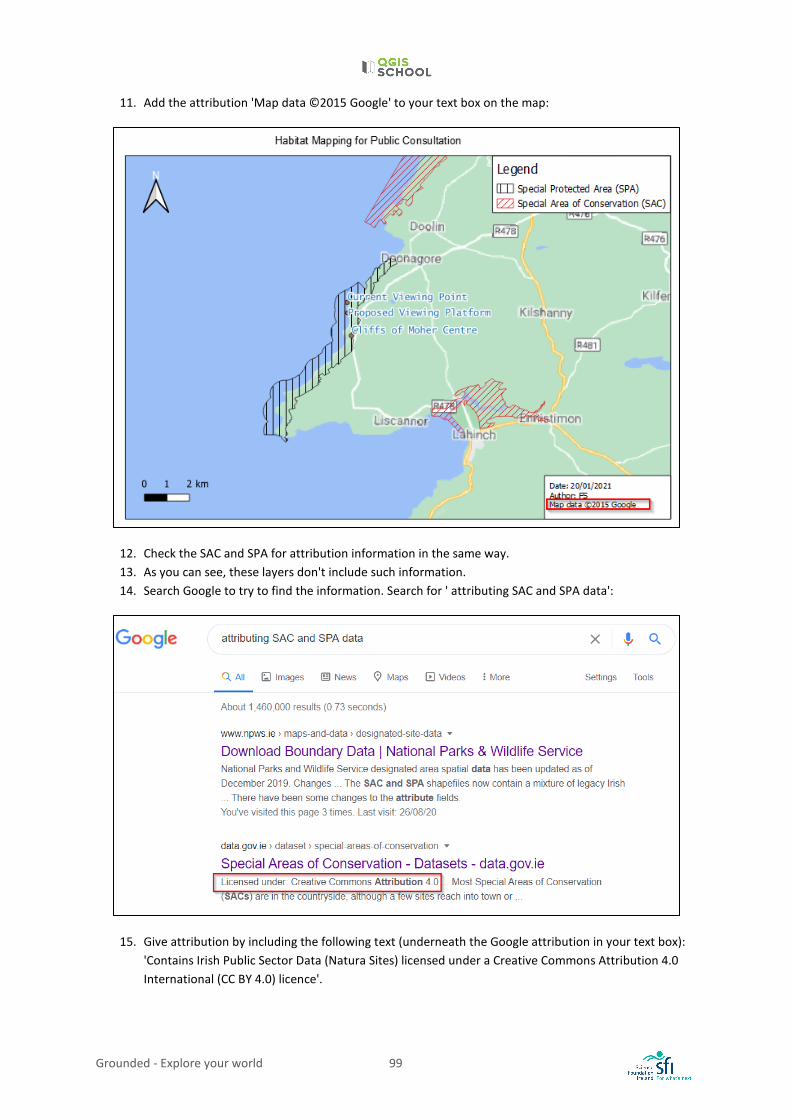
11. Add the attribution 'Map data ©2015 Google' to your text box on the map:
12. Check the SAC and SPA for attribution information in the same way. 13. As you can see, these layers don't include such information. 14. Search Google to try to find the information. Search for ' attributing SAC and SPA data':
15. Give attribution by including the following text (underneath the Google attribution in your text box): 'Contains Irish Public Sector Data (Natura Sites) licensed under a Creative Commons Attribution 4.0 International (CC BY 4.0) licence'.
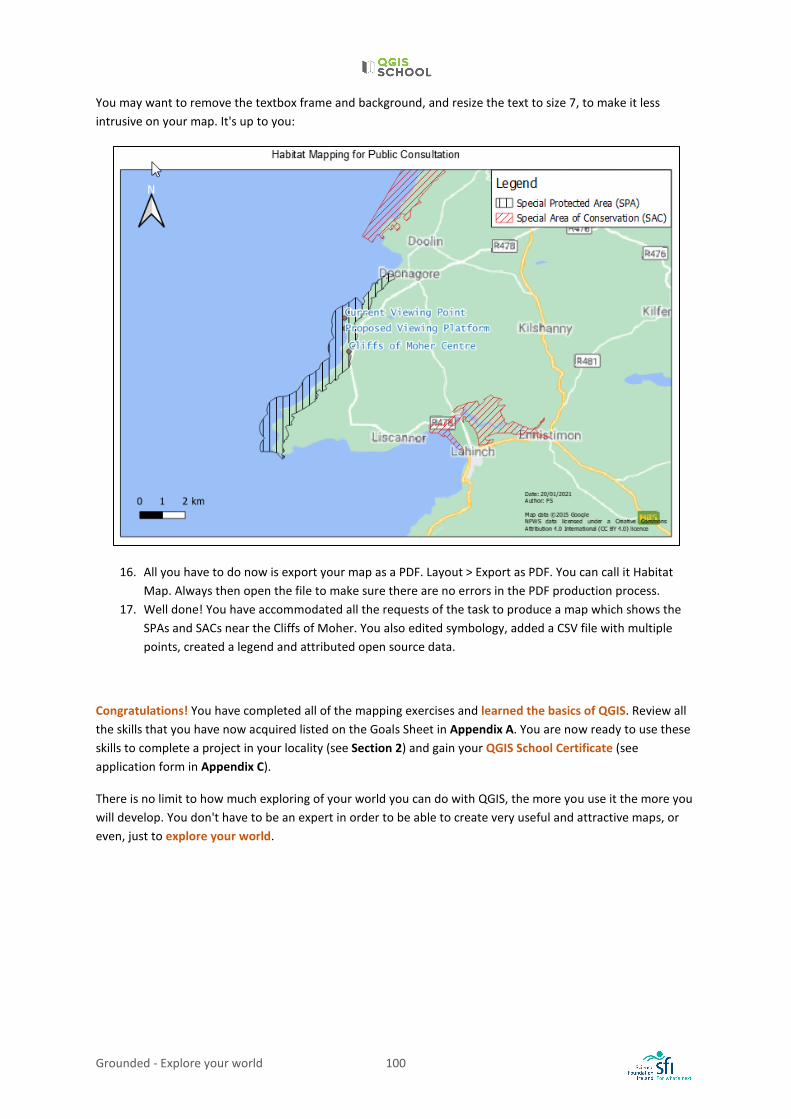
Grounded - Explore your world 100
You may want to remove the textbox frame and background, and resize the text to size 7, to make it less intrusive on your map. It's up to you:
16. All you have to do now is export your map as a PDF. Layout > Export as PDF. You can call it Habitat Map. Always then open the file to make sure there are no errors in the PDF production process.
17. Well done! You have accommodated all the requests of the task to produce a map which shows the SPAs and SACs near the Cliffs of Moher. You also edited symbology, added a CSV file with multiple points, created a legend and attributed open source data.
Congratulations! You have completed all of the mapping exercises and learned the basics of QGIS. Review all the skills that you have now acquired listed on the Goals Sheet in Appendix A. You are now ready to use these skills to complete a project in your locality (see Section 2) and gain your QGIS School Certificate (see application form in Appendix C).
There is no limit to how much exploring of your world you can do with QGIS, the more you use it the more you will develop. You don't have to be an expert in order to be able to create very useful and attractive maps, or even, just to explore your world.
Grounded - Explore your world 101
2. PROJECTS Projects are effective in grounding students with the principles of GIS, as well as for investigating issues both relevant to their locality and in a broader context.
To be awarded the QGIS School certificate (see Appendix B) you must undertake a group project which involves the use of QGIS.
The group work can revolve around group discussion with optional aspects of collaboration, or the project might be fully group orientated.
Each student must submit an individual form of assessment (poster or video – see Section 3).
The following timetable is suggested, but your class is free to modify the timeframe for project completion:
Week 1: Choose and discuss Project with group, strategize – assign roles, background mapping;
Week 2: Fieldwork and/or digital mapping, begin poster template or video script;
Week 3: Create map; draft poster or video;
Week 4: Poster/video submission and/or presentation to teacher, class discussion and feedback.
PROJECT OBJECTIVES:
• Students work together, sharing responsibilities and carrying out of tasks to agreed deadlines. • Student´s appropriation of a local issue from a geographical perspective. • Usage of GIS as a technical tool to investigate the socio-spatial issue. • Presentation of the issue through poster/video delivery which includes a map(s). • Potential to enter competitions such as The Young Environmentalist, Eco UNESCO
Grounded - Explore your world 102
PROJECT EXAMPLES
This section includes project examples that you may replicate in your locality. However your group may modify these examples or come up with your own project idea. The only requirement is that your project uses QGIS in some aspect.
The section is divided into three categories – those suited to any locality, and those better suited to urban or rural environments. One project example of each category is outlined with broad steps, followed by some project idea suggestions.
PROJECTS SUITABLE FOR ANY ENVIRONMENT
PROJECT EXAMPLE: FUN RUN
Objective: Using QGIS as a planning and presentation tool.
TASK: Imagine you are holding a local fundraiser 'Fun Run' for a charity of your choice. Use QGIS to plan your route and create a map for inclusion on posters or in a promotional video. Include the following criteria:
• 5 km in length • Labelled Start/Finish points • Start/Finish points have adequate car parking nearby, highlighted on map • Safety: family friendly footpaths/roads (low traffic, no cliff edges) • Accessible (wheelchair friendly: no uneven terrain, steps or narrow paths)
Broad Steps:
1. Add base mapping e.g. OSM TopoMap (useful for checking slopes) 2. Create a 5km polyline bearing in mind the criteria. 3. Create a point file and include the start and finish points. 4. Create a polygon or point file to highlight the location of the car parking. 5. If possible do a site check and take photographs to add to your poster or video presentation.
OTHER PROJECT IDEAS:
• Wildflower Planting: Identify good locations for planting wildflowers and present it on a map. Calculate area and estimate a fundraising goal to purchase seeds.
• Top 10 things to do in your area/county/Ireland: map of attractions e.g. science, sport, history, art, 'fun', outdoor activity, natural beauty.
• Commuting: Map everyone's commute to school. See who walks, car, bus, cycles; calculate the longest distance; highlight any commonly congested areas.
• Recycling: Create a map showing the location and type of the different recycling facilities in your area. Are the recycling facilities adequate and at appropriate places? Think of travel time and accessibility.
Grounded - Explore your world 103
PROJECTS FOR URBAN AREAS
PROJECT EXAMPLE: LOCAL TOWN ACCESSIBILITY
Objective: Use QGIS to produce a useful map for tourists with accessibility requirements.
TASK: Your local tourist office wants to include a map showing what is available for tourists with accessibility requirements.
Broad Steps:
1. Conduct fieldwork to investigate your local area's accessibility features (e.g. ramps, toilets, doors, handrails) for different amenities: look at eateries (pub, restaurant, café)), things to do (leisure centres, museums, amusement parks, etc.), public toilets, parks.
2. Add point data in QGIS for locations that are accessible 3. Add polygons for areas in parks that are accessible 4. Add point data for 'Things to Do'
• Comment on no. available in general vs no. available for people with impairments (blind, deaf,
physical or mental disability). Is it adequate? • What suggestions could be made to make your town more suitable for everyone?
OTHER PROJECT IDEAS:
• Personal Map: Create your unique map of the town: favourite café, friend or relations' houses, favourite thing to do, where you go to school, your gym/pool/running track, etc.
• Community Garden Location: identify suitable locations in order to seek Council permission to create a community garden.
• Create a historical walk map for your town or city. Highlight attractions and comment whether they are accessible to all. Include the distance of the walk and the time estimate to complete it.
Grounded - Explore your world 104
PROJECTS FOR RURAL OR COASTAL AREAS
PROJECT EXAMPLE: GEOTOURISM
Objective: Demonstrating aspects involved in allowing us to enjoy activities in our locality and how to use GIS to help inform us in protecting against threats.
Task: Create a map showing the location of a nature-based tourist attraction in your locality, to be used on tourism brochures. Also create maps to show the interdependence of this attraction on other local factors (geology, drainage (hydrology), soil type, road access, etc.). These maps will help inform measures to be considered to protect the activity against potential threats in the future.
Broad Steps:
1. Create a map showing the location of a nature-based activity in your locality that is also a tourist attraction e.g. horse-riding, surfing, cycling, natural attraction (e.g. Malin Head).
2. Highlight the location on your map by doing one or all of the following options: a) Add a point (e.g. a point labelled 'surfing' or at an attraction e.g. 'Giant's Causeway') b) Draw a polygon (e.g. draw an area labelled 'Park') c) Draw a line (e.g. draw a route labelled 'mountain bike track')
3. Think about all the environmental factors that make your chosen activity possible and create maps of these relevant factors (landscape (geology), drainage (hydrology), etc.). Comment on threats to your activity (pollution, erosion, development, etc.). Soil data can be downloaded from: http://gis.teagasc.ie/soils/downloads.php.
4. If possible do a site check and take photographs to add to your poster or video presentation.
OTHER PROJECT IDEAS:
• Tree identification: Record the different types of trees in the locality and present their locations on a map.
• Cycling: Map your favourite cycle route. Highlight any dangerous areas (bends, uneven road surface, steep edges, busy traffic). Provide the distance travelled and a time estimate to complete the route.
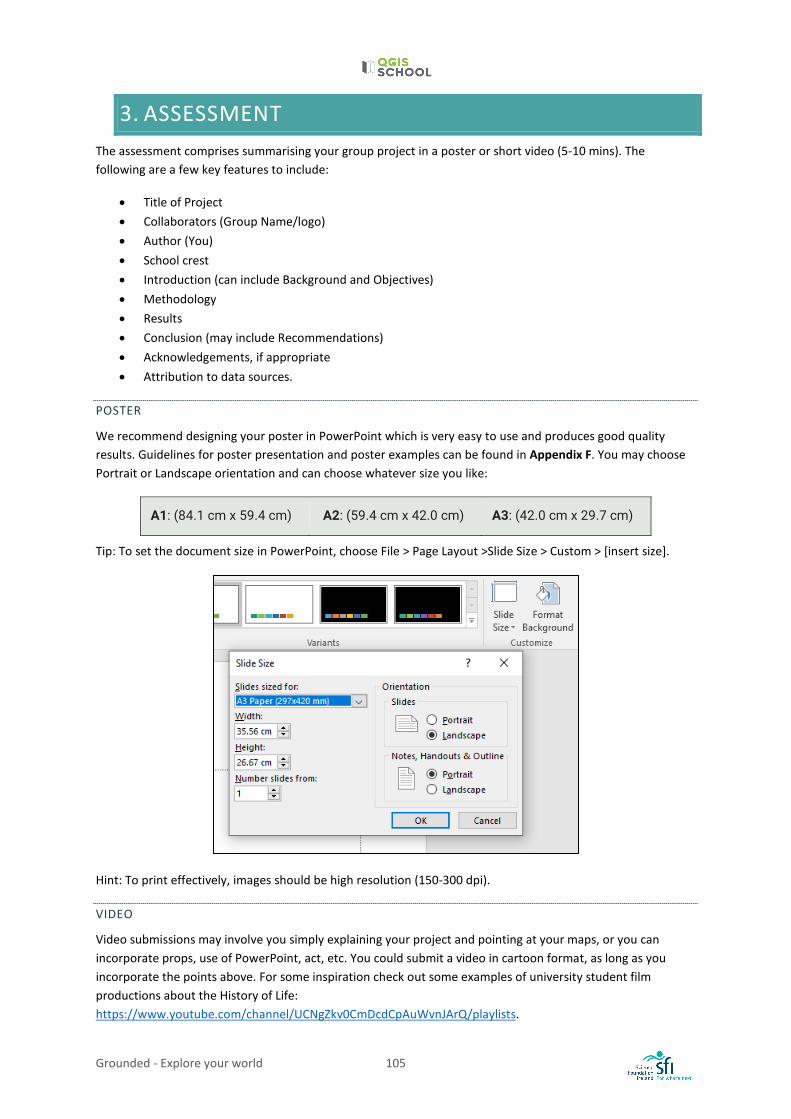
Grounded - Explore your world 105
3. ASSESSMENT The assessment comprises summarising your group project in a poster or short video (5-10 mins). The following are a few key features to include:
• Title of Project • Collaborators (Group Name/logo) • Author (You) • School crest • Introduction (can include Background and Objectives) • Methodology • Results • Conclusion (may include Recommendations) • Acknowledgements, if appropriate • Attribution to data sources.
POSTER
We recommend designing your poster in PowerPoint which is very easy to use and produces good quality results. Guidelines for poster presentation and poster examples can be found in Appendix F. You may choose Portrait or Landscape orientation and can choose whatever size you like:
A1: (84.1 cm x 59.4 cm) A2: (59.4 cm x 42.0 cm) A3: (42.0 cm x 29.7 cm)
Tip: To set the document size in PowerPoint, choose File > Page Layout >Slide Size > Custom > [insert size].
Hint: To print effectively, images should be high resolution (150-300 dpi).
VIDEO
Video submissions may involve you simply explaining your project and pointing at your maps, or you can incorporate props, use of PowerPoint, act, etc. You could submit a video in cartoon format, as long as you incorporate the points above. For some inspiration check out some examples of university student film productions about the History of Life: https://www.youtube.com/channel/UCNgZkv0CmDcdCpAuWvnJArQ/playlists.
Grounded - Explore your world 106
4. CONCLUSION This course taught digital mapping through problem-solving exercises, with consideration of the United Nations 2030 Agenda Sustainable Development Goals. You have developed critical thinking skills and can navigate QGIS software to interrogate data and produce maps. The skills acquired through completing this course are summarised in Appendix A. You are now better placed for many careers, as well as for general citizen involvement with the world around you.
QGIS SCHOOL CERTIFICATE Upon completion of the classroom course and submission of one project, the student may be awarded a QGIS School Certificate, an example is shown in Appendix B.
Each student must submit an application form (Appendix C) to [email protected], with evidence of their QGIS project by choosing a form of assessment:
• Submit an A4 poster (visual or text based) • Submit a short 5-10 minute video
Students may submit both forms of assessment.
FEEDBACK To provide feedback on this course please submit the Student Evaluation sheet in Appendix H to [email protected].
If you have any queries you can contact [email protected] or use the contact information at http://www.nuigalway.ie/eos/.
We hope you enjoyed completing this course as much as we enjoyed creating it.
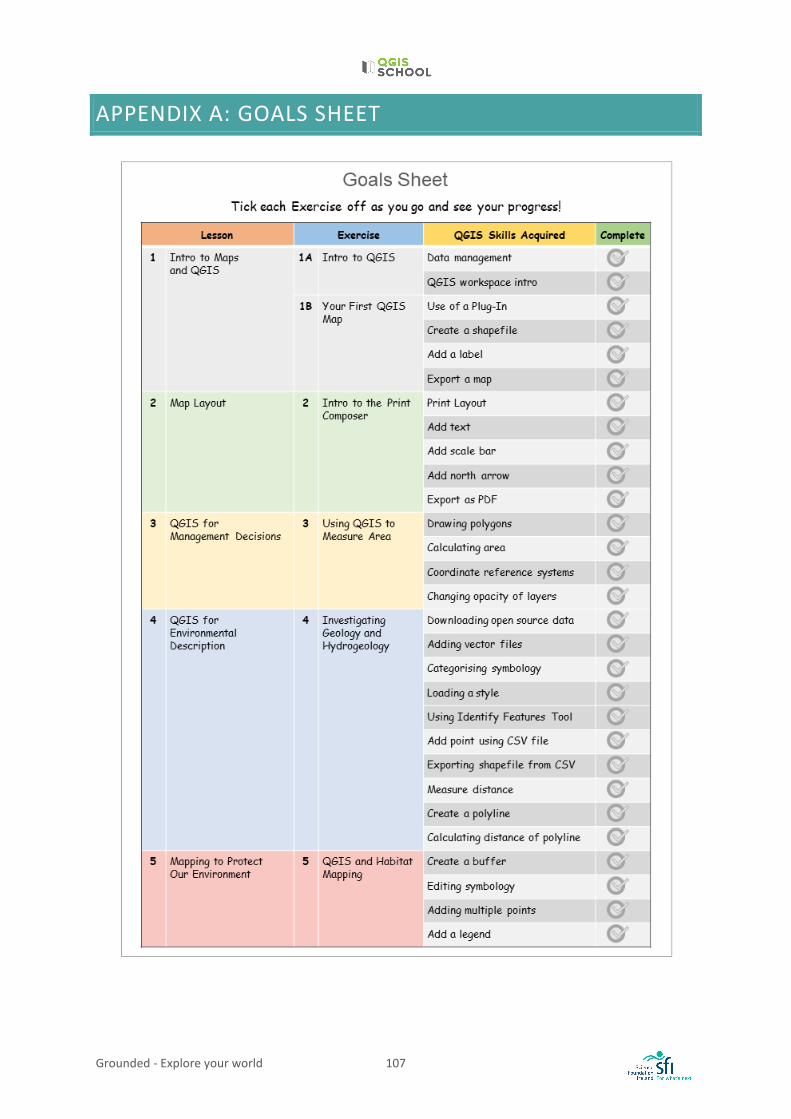
Grounded - Explore your world 107
APPENDIX A: GOALS SHEET
Grounded - Explore your world 108
APPENDIX B: COURSE CERTIFICATE
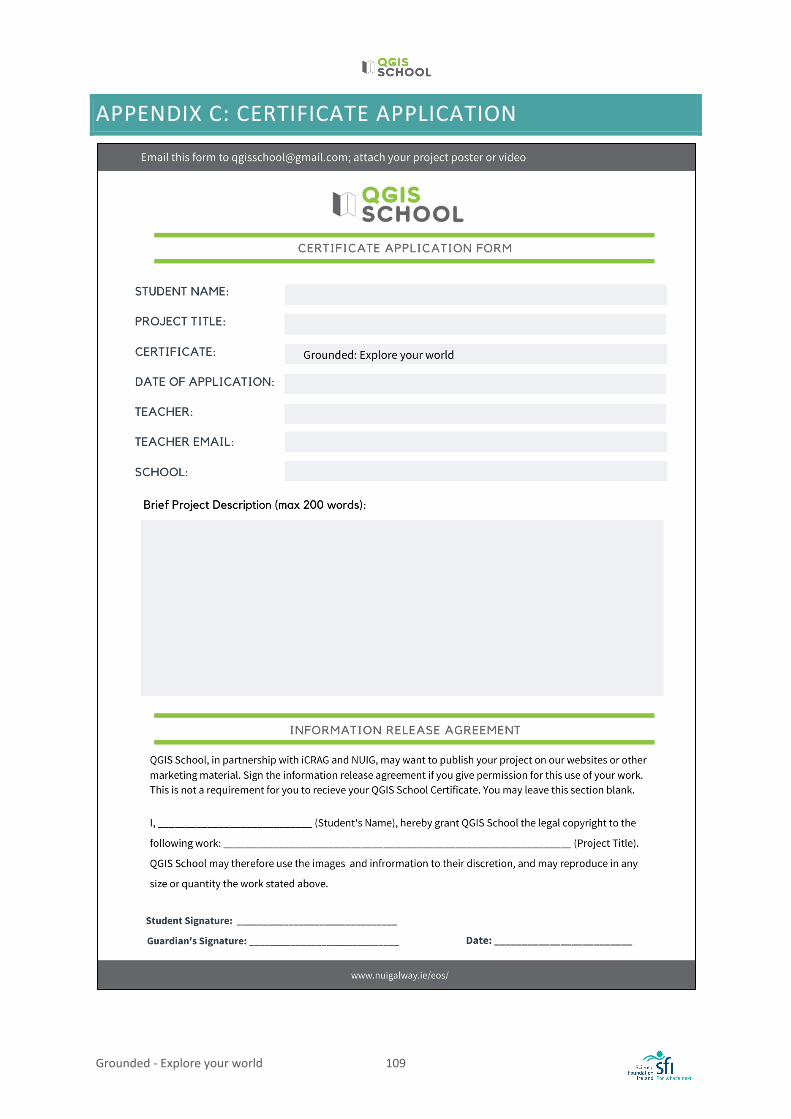
Grounded - Explore your world 109
APPENDIX C: CERTIFICATE APPLICATION
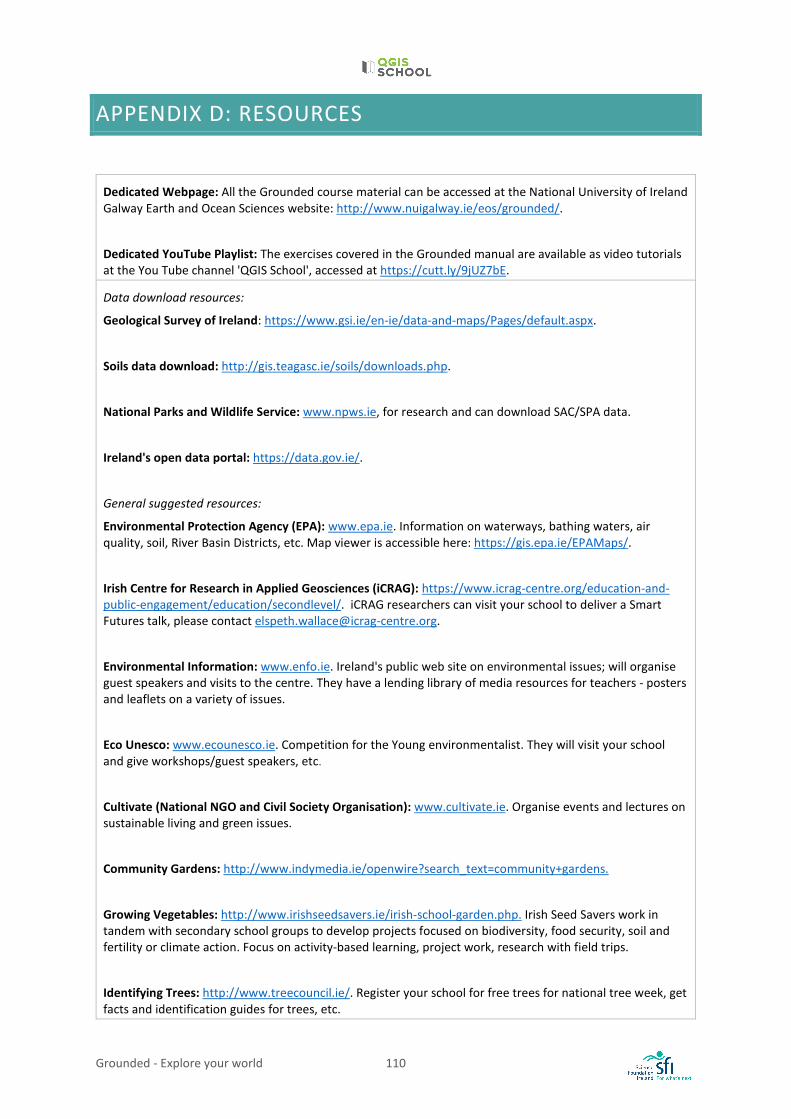
Grounded - Explore your world 110
APPENDIX D: RESOURCES
Dedicated Webpage: All the Grounded course material can be accessed at the National University of Ireland Galway Earth and Ocean Sciences website: http://www.nuigalway.ie/eos/grounded/.
Dedicated YouTube Playlist: The exercises covered in the Grounded manual are available as video tutorials at the You Tube channel 'QGIS School', accessed at https://cutt.ly/9jUZ7bE.
Data download resources:
Geological Survey of Ireland: https://www.gsi.ie/en-ie/data-and-maps/Pages/default.aspx.
Soils data download: http://gis.teagasc.ie/soils/downloads.php.
National Parks and Wildlife Service: www.npws.ie, for research and can download SAC/SPA data.
Ireland's open data portal: https://data.gov.ie/.
General suggested resources:
Environmental Protection Agency (EPA): www.epa.ie. Information on waterways, bathing waters, air quality, soil, River Basin Districts, etc. Map viewer is accessible here: https://gis.epa.ie/EPAMaps/.
Irish Centre for Research in Applied Geosciences (iCRAG): https://www.icrag-centre.org/education-and-public-engagement/education/secondlevel/. iCRAG researchers can visit your school to deliver a Smart Futures talk, please contact [email protected].
Environmental Information: www.enfo.ie. Ireland's public web site on environmental issues; will organise guest speakers and visits to the centre. They have a lending library of media resources for teachers - posters and leaflets on a variety of issues.
Eco Unesco: www.ecounesco.ie. Competition for the Young environmentalist. They will visit your school and give workshops/guest speakers, etc.
Cultivate (National NGO and Civil Society Organisation): www.cultivate.ie. Organise events and lectures on sustainable living and green issues.
Community Gardens: http://www.indymedia.ie/openwire?search_text=community+gardens.
Growing Vegetables: http://www.irishseedsavers.ie/irish-school-garden.php. Irish Seed Savers work in tandem with secondary school groups to develop projects focused on biodiversity, food security, soil and fertility or climate action. Focus on activity-based learning, project work, research with field trips.
Identifying Trees: http://www.treecouncil.ie/. Register your school for free trees for national tree week, get facts and identification guides for trees, etc.
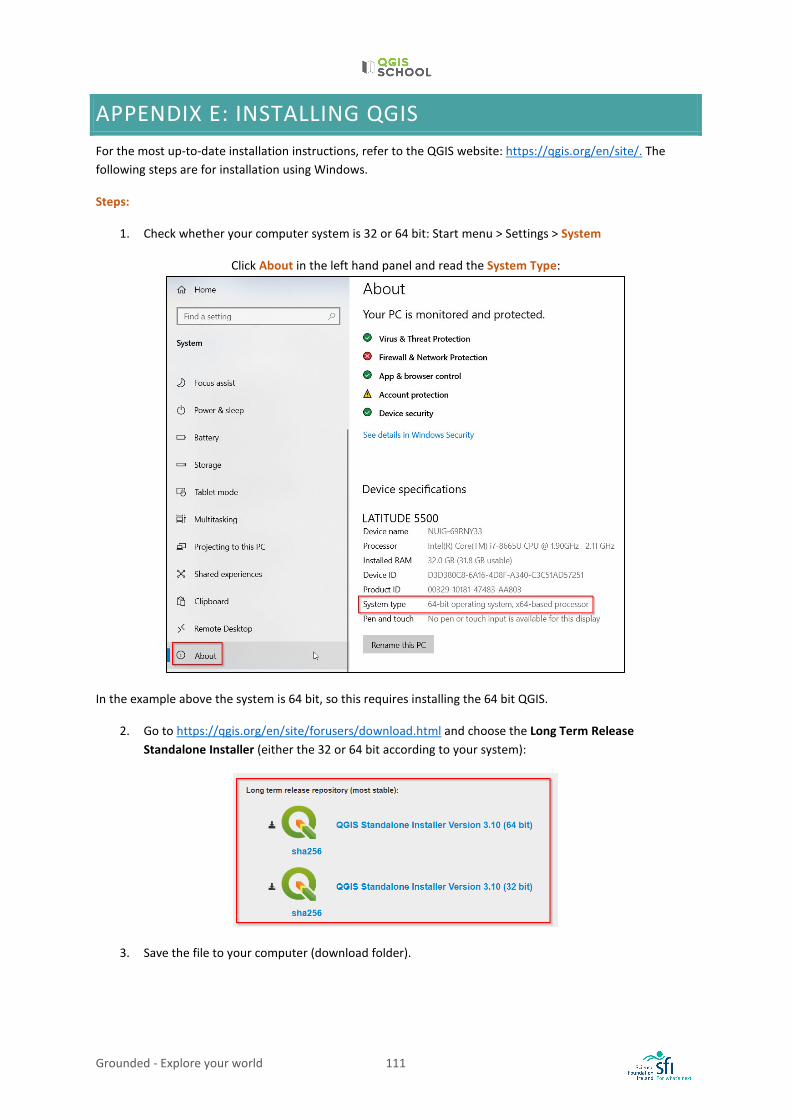
Grounded - Explore your world 111
APPENDIX E: INSTALLING QGIS For the most up-to-date installation instructions, refer to the QGIS website: https://qgis.org/en/site/. The following steps are for installation using Windows.
Steps:
1. Check whether your computer system is 32 or 64 bit: Start menu > Settings > System
Click About in the left hand panel and read the System Type:
In the example above the system is 64 bit, so this requires installing the 64 bit QGIS.
2. Go to https://qgis.org/en/site/forusers/download.html and choose the Long Term Release Standalone Installer (either the 32 or 64 bit according to your system):
3. Save the file to your computer (download folder).
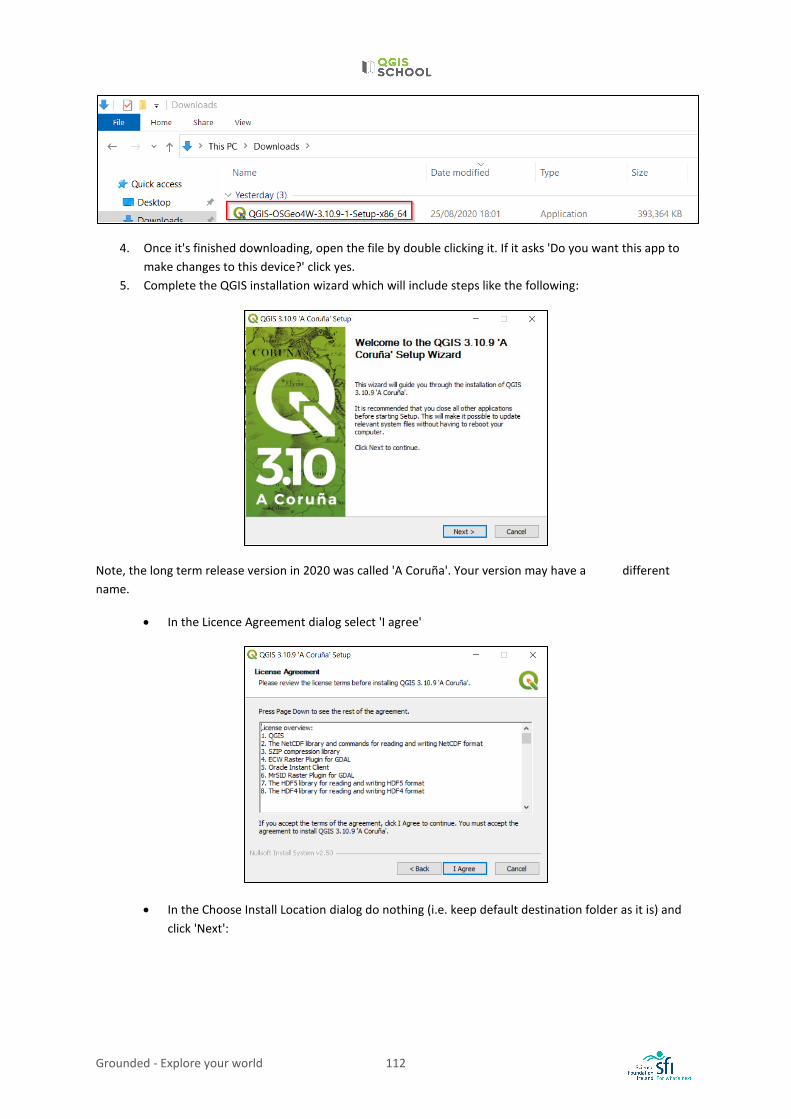
Grounded - Explore your world 112
4. Once it's finished downloading, open the file by double clicking it. If it asks 'Do you want this app to make changes to this device?' click yes.
5. Complete the QGIS installation wizard which will include steps like the following:
Note, the long term release version in 2020 was called 'A Coruña'. Your version may have a different name.
• In the Licence Agreement dialog select 'I agree'
• In the Choose Install Location dialog do nothing (i.e. keep default destination folder as it is) and click 'Next':
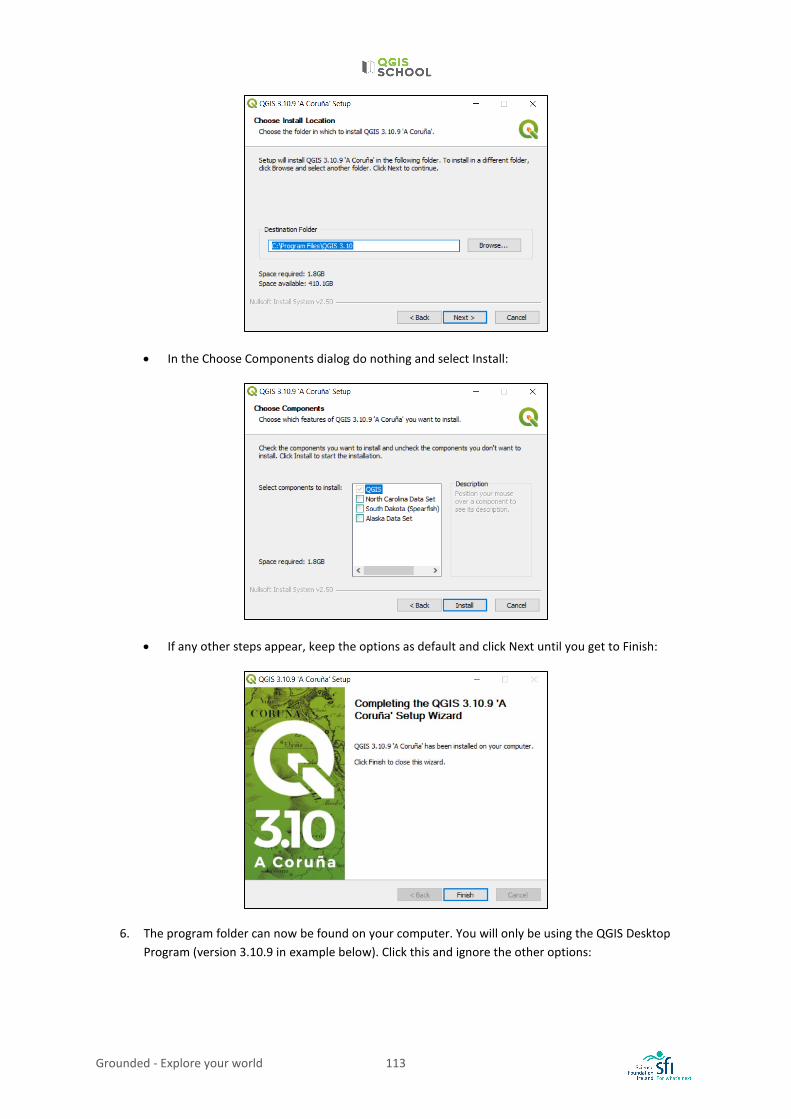
Grounded - Explore your world 113
• In the Choose Components dialog do nothing and select Install:
• If any other steps appear, keep the options as default and click Next until you get to Finish:
6. The program folder can now be found on your computer. You will only be using the QGIS Desktop Program (version 3.10.9 in example below). Click this and ignore the other options:

Grounded - Explore your world 114
7. The Program will start to open:
• The Program is ready to use when you see the following window:
Well done. You have successfully installed QGIS.
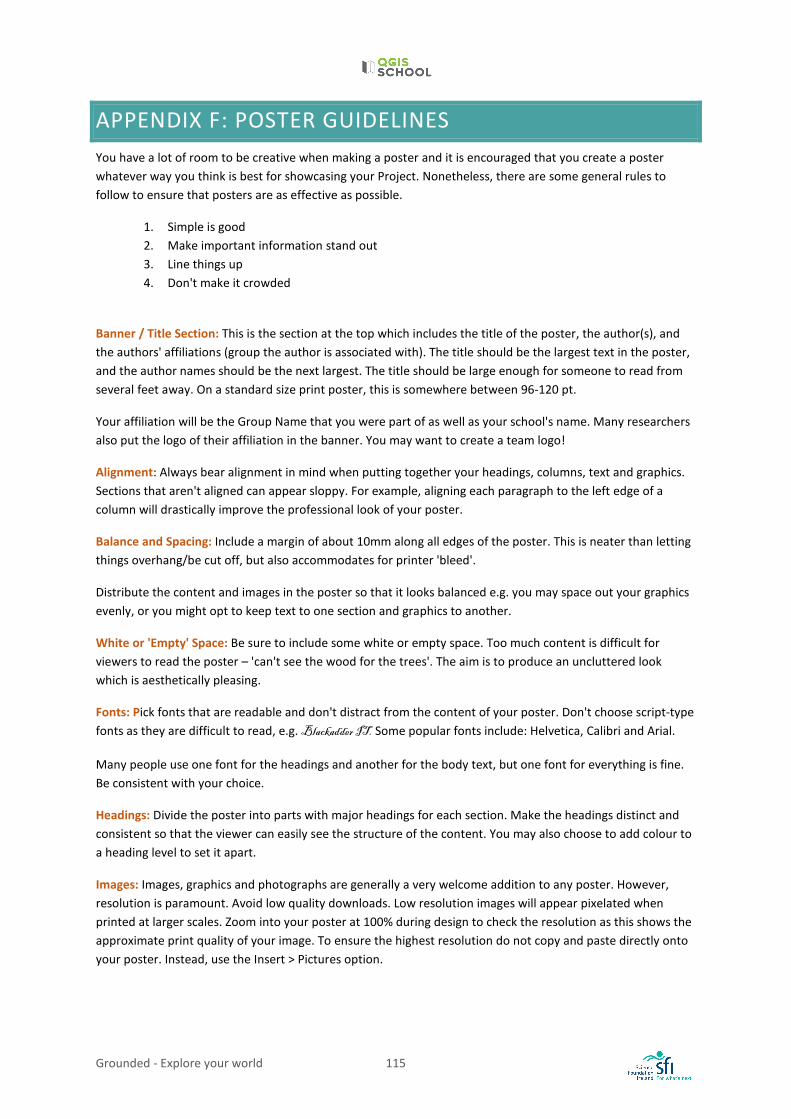
Grounded - Explore your world 115
APPENDIX F: POSTER GUIDELINES You have a lot of room to be creative when making a poster and it is encouraged that you create a poster whatever way you think is best for showcasing your Project. Nonetheless, there are some general rules to follow to ensure that posters are as effective as possible.
1. Simple is good 2. Make important information stand out 3. Line things up 4. Don't make it crowded
Banner / Title Section: This is the section at the top which includes the title of the poster, the author(s), and the authors' affiliations (group the author is associated with). The title should be the largest text in the poster, and the author names should be the next largest. The title should be large enough for someone to read from several feet away. On a standard size print poster, this is somewhere between 96-120 pt.
Your affiliation will be the Group Name that you were part of as well as your school's name. Many researchers also put the logo of their affiliation in the banner. You may want to create a team logo!
Alignment: Always bear alignment in mind when putting together your headings, columns, text and graphics. Sections that aren't aligned can appear sloppy. For example, aligning each paragraph to the left edge of a column will drastically improve the professional look of your poster.
Balance and Spacing: Include a margin of about 10mm along all edges of the poster. This is neater than letting things overhang/be cut off, but also accommodates for printer 'bleed'.
Distribute the content and images in the poster so that it looks balanced e.g. you may space out your graphics evenly, or you might opt to keep text to one section and graphics to another.
White or 'Empty' Space: Be sure to include some white or empty space. Too much content is difficult for viewers to read the poster – 'can't see the wood for the trees'. The aim is to produce an uncluttered look which is aesthetically pleasing.
Fonts: Pick fonts that are readable and don't distract from the content of your poster. Don't choose script-type fonts as they are difficult to read, e.g. Blackadder IT. Some popular fonts include: Helvetica, Calibri and Arial.
Many people use one font for the headings and another for the body text, but one font for everything is fine. Be consistent with your choice.
Headings: Divide the poster into parts with major headings for each section. Make the headings distinct and consistent so that the viewer can easily see the structure of the content. You may also choose to add colour to a heading level to set it apart.
Images: Images, graphics and photographs are generally a very welcome addition to any poster. However, resolution is paramount. Avoid low quality downloads. Low resolution images will appear pixelated when printed at larger scales. Zoom into your poster at 100% during design to check the resolution as this shows the approximate print quality of your image. To ensure the highest resolution do not copy and paste directly onto your poster. Instead, use the Insert > Pictures option.
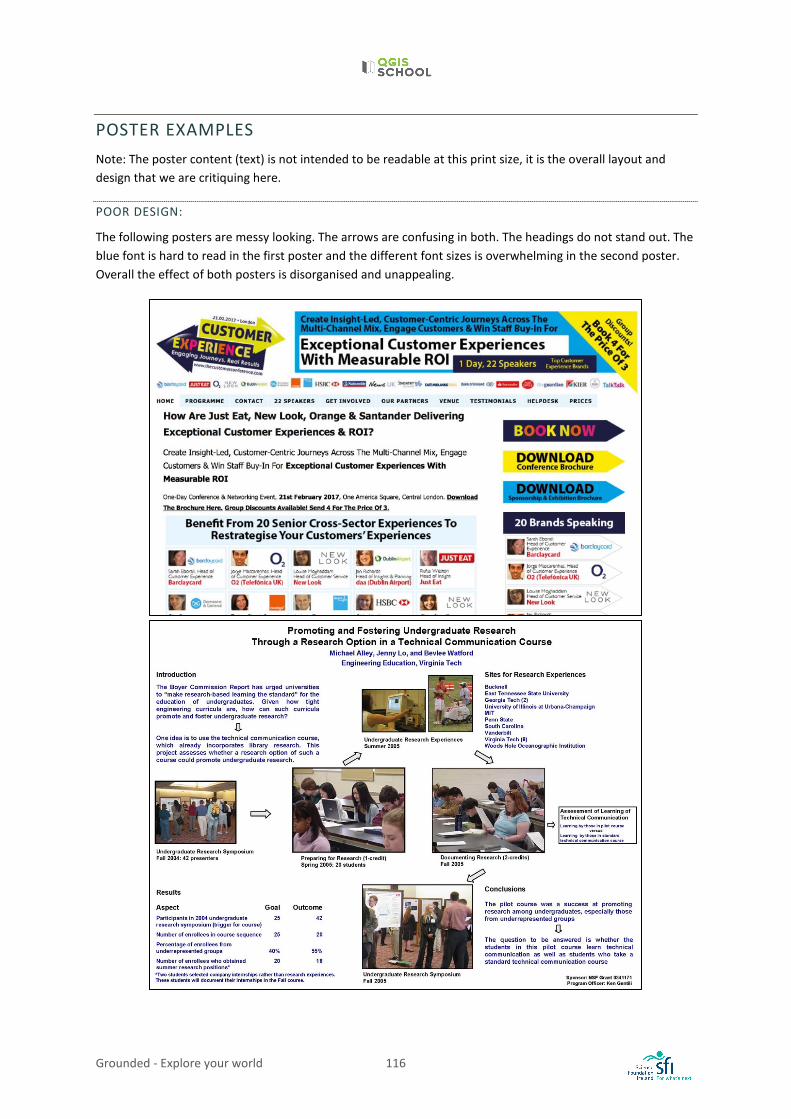
Grounded - Explore your world 116
POSTER EXAMPLES Note: The poster content (text) is not intended to be readable at this print size, it is the overall layout and design that we are critiquing here.
POOR DESIGN:
The following posters are messy looking. The arrows are confusing in both. The headings do not stand out. The blue font is hard to read in the first poster and the different font sizes is overwhelming in the second poster. Overall the effect of both posters is disorganised and unappealing.
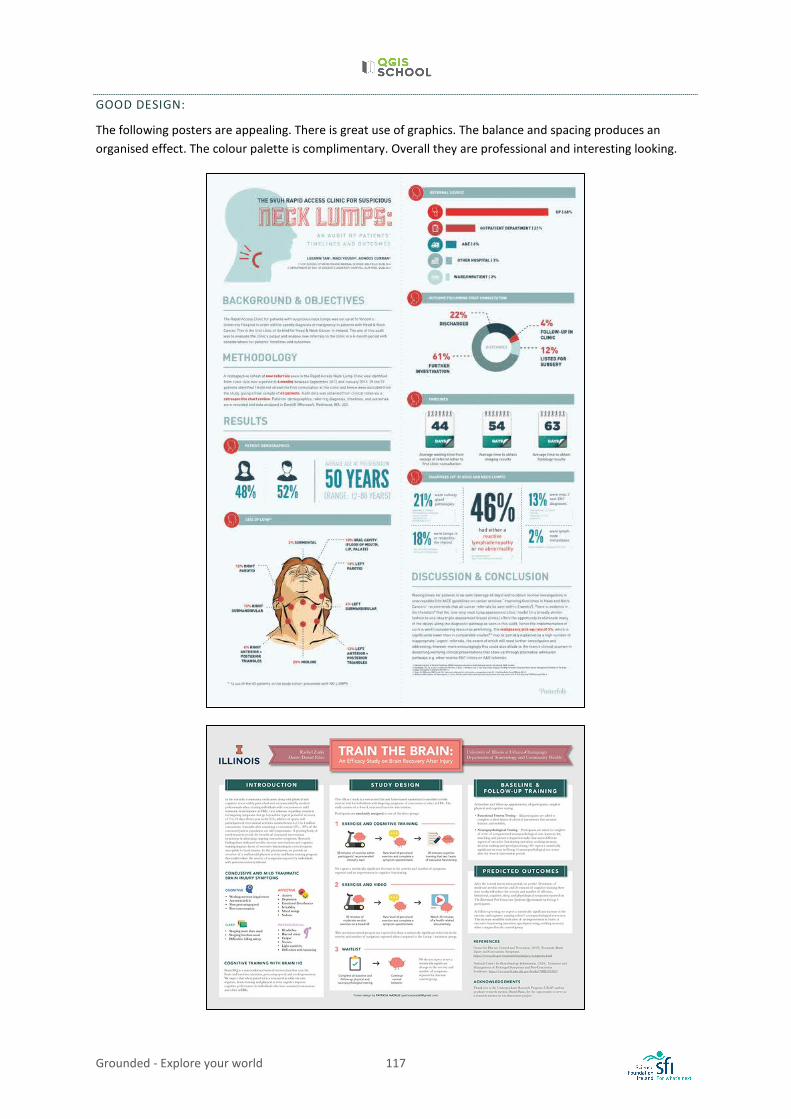
Grounded - Explore your world 117
GOOD DESIGN:
The following posters are appealing. There is great use of graphics. The balance and spacing produces an organised effect. The colour palette is complimentary. Overall they are professional and interesting looking.
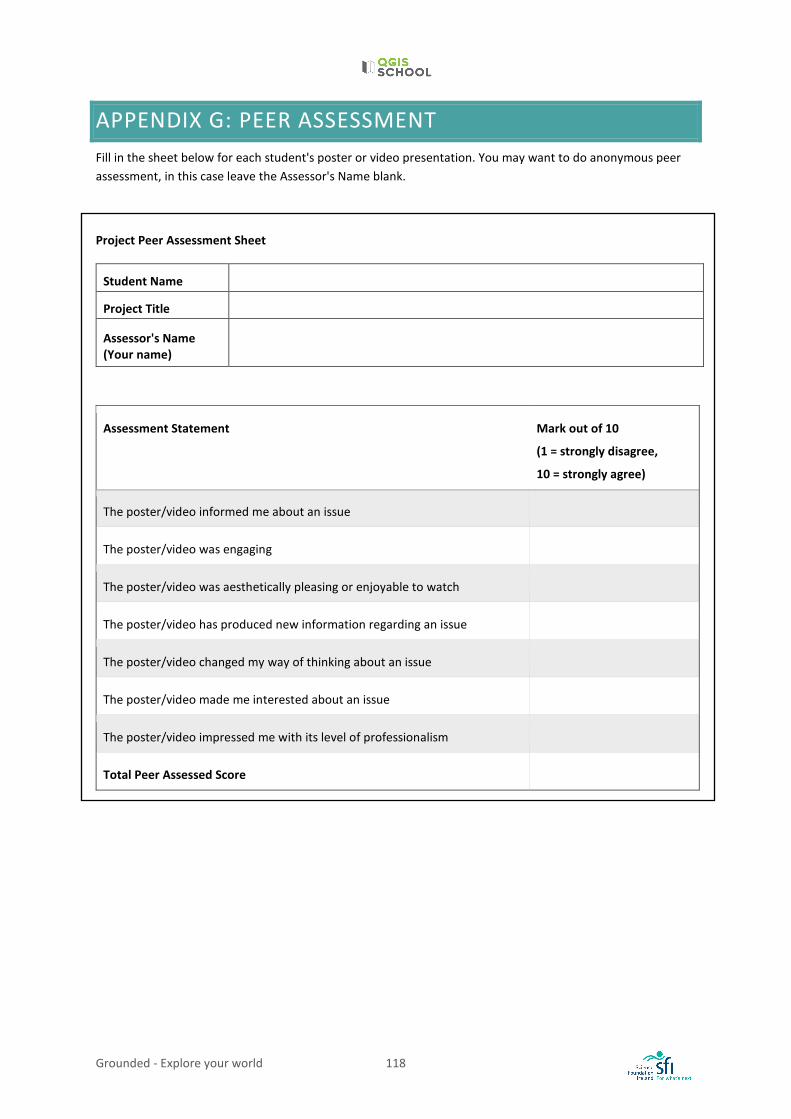
Grounded - Explore your world 118
APPENDIX G: PEER ASSESSMENT Fill in the sheet below for each student's poster or video presentation. You may want to do anonymous peer assessment, in this case leave the Assessor's Name blank.
Project Peer Assessment Sheet
Student Name
Project Title
Assessor's Name (Your name)
Assessment Statement Mark out of 10
(1 = strongly disagree,
10 = strongly agree)
The poster/video informed me about an issue
The poster/video was engaging
The poster/video was aesthetically pleasing or enjoyable to watch
The poster/video has produced new information regarding an issue
The poster/video changed my way of thinking about an issue
The poster/video made me interested about an issue
The poster/video impressed me with its level of professionalism
Total Peer Assessed Score
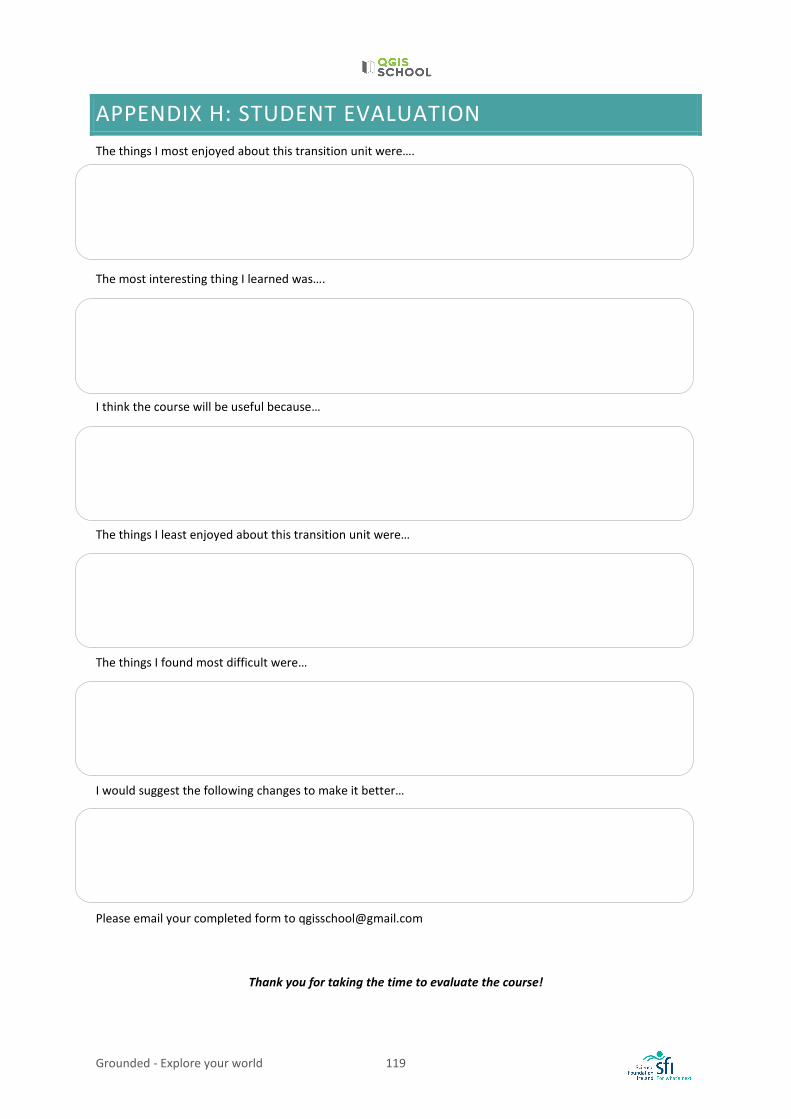
Grounded - Explore your world 119
APPENDIX H: STUDENT EVALUATION The things I most enjoyed about this transition unit were….
The most interesting thing I learned was….
I think the course will be useful because…
The things I least enjoyed about this transition unit were…
The things I found most difficult were…
I would suggest the following changes to make it better…
Please email your completed form to [email protected]
Thank you for taking the time to evaluate the course!

Mapping for the future
Contact:
[email protected] for further
information
or visit
http://www.nuigalway.ie/science-
engineering/school-of-natural-
sciences/disciplines/earth-ocean-
science/grounded/.
Related Documents


