Structure–property relations in molded, nucleated isotactic polypropylene Jan-Willem Housmans a, b , Markus Gahleitner c , Gerrit W.M. Peters a, * , Han E.H. Meijer a a Department of Mechanical Engineering, Eindhoven University of Technology, P.O. Box 513, 5600MB Eindhoven, The Netherlands b The Dutch Polymer Institute (DPI), P.O. Box 902, 5600 AX Eindhoven, The Netherlands c Borealis GmbH, Innovation Center Linz, A-4021 Linz, Austria article info Article history: Received 30 September 2008 Received in revised form 26 February 2009 Accepted 27 February 2009 Available online 27 March 2009 Keywords: Polypropylene Nucleating agent Processing structure–property relation abstract The influence of molecular characteristics and nucleating agents on the morphology distribution and properties of injection molded isotactic polypropylene (iPP) is investigated using optical microscopy, X-ray diffraction and mechanical testing. To have better control over the thermo-mechanical history, instead of a reciprocating screw, a capillary rheometer is used to drive the melt into the simple rect- angular mold. Molecular weight (MW), molecular weight distribution (MWD) and addition of ethylene via copolymerization all influence the thickness of the oriented shear layer, the crystallinity, the type and amount of crystal phases, and the lamellar thickness. The addition of a nucleating agent (DMDBS), dictates the crystallization process, and resulting morphology, and samples with an oriented morphology over the full thickness are created without changing other morphological features, by applying a thermal treatment to the melt prior to injection, which is based on the specific phase behavior of the iPP-DMDBS system. The thermally treated samples show a considerable improvement in mechanical properties. Ó 2009 Elsevier Ltd. All rights reserved. 1. Introduction The market share of polypropylene increases steadily due to a favorable combination of price and performance, and the possi- bility to modify the polymer to broaden its range of properties [1]. Long chains, for example, greatly enhance the formation of threadlike structures [2–6], illustrating that molecular details and processing conditions applied determine morphology and thus properties of the product. The effect of processing conditions on the crystallization kinetics and structure development of semi-crys- talline polymers has been studied extensively [4–12]. Flow accel- erates crystallization and alters morphology, and the effect of shear rate is more pronounced than that of the shear time. Material modifications are implemented on the molecular or the microscopic level. In the first case, the polymer chain itself is changed, e.g. via long chain branching or copolymerization, while in the second case, e.g. particles, or a phase separated second polymer, are added. These modifications change the crystallization kinetics of the polymer, the final morphology and thus the resulting properties, see e.g. [13–21]. Most of the crystallization studies mentioned apply a short- term shearing protocol as originally introduced by Janeschitz- Kriegl and co-workers [8], or some variations thereof, to separate the effect of flow and temperature on the crystallization behavior. The conditions applied are, however, far from those occurring in injection molding, which is one of the most common industrial production processes to shape plastic parts. In injection molding the polymer is fed via a hopper into a screw extruder where it is molten, using as sources external heaters and the heat dissipation in the flow. Via the reciprocating screw moving forward the melt is pushed via the runners into the product cavity, and made to solidify adopting the shape of the cavity, whereafter the mold is opened to eject the product. With this production process, complex-shaped products can be realized with molds consisting of multiple parts and slides, including rotational molds that allow for multi-shot processing using 2 injection units. The thermo-mechanical history experienced by the polymer is complex due to the high deforma- tion rates, the high pressures (compressibility of the polymer) and speeds applied, the geometry of the feeding system and the mold that induces complex flow fields and the high temperature gradi- ents and high cooling rates. Complex histories starting in the screw are sometimes reflected in the complex morphologies found in the product [22]. In this example [22], the authors used a nylon 6 nanocomposite, and observed in cross-sections of their samples, perpendicular to flow direction, dark–light layer sequences in birefringence that were traced back all the way to the sprue section and the explanation given was that these layers are formed already during the melting and conveying in the screw, and subsequently are transported downstream. * Corresponding author. Tel.: þ31 40 247 4840; fax: þ31 40 244 7355. E-mail address: [email protected] (G.W.M. Peters). Contents lists available at ScienceDirect Polymer journal homepage: www.elsevier.com/locate/polymer 0032-3861/$ – see front matter Ó 2009 Elsevier Ltd. All rights reserved. doi:10.1016/j.polymer.2009.02.050 Polymer 50 (2009) 2304–2319

Welcome message from author
This document is posted to help you gain knowledge. Please leave a comment to let me know what you think about it! Share it to your friends and learn new things together.
Transcript
lable at ScienceDirect
Polymer 50 (2009) 2304–2319
Contents lists avai
Polymer
journal homepage: www.elsevier .com/locate/polymer
Structure–property relations in molded, nucleated isotactic polypropylene
Jan-Willem Housmans a,b, Markus Gahleitner c, Gerrit W.M. Peters a,*, Han E.H. Meijer a
a Department of Mechanical Engineering, Eindhoven University of Technology, P.O. Box 513, 5600MB Eindhoven, The Netherlandsb The Dutch Polymer Institute (DPI), P.O. Box 902, 5600 AX Eindhoven, The Netherlandsc Borealis GmbH, Innovation Center Linz, A-4021 Linz, Austria
a r t i c l e i n f o
Article history:Received 30 September 2008Received in revised form26 February 2009Accepted 27 February 2009Available online 27 March 2009
Keywords:PolypropyleneNucleating agentProcessing structure–property relation
* Corresponding author. Tel.: þ31 40 247 4840; faxE-mail address: [email protected] (G.W.M. Pete
0032-3861/$ – see front matter � 2009 Elsevier Ltd.doi:10.1016/j.polymer.2009.02.050
a b s t r a c t
The influence of molecular characteristics and nucleating agents on the morphology distribution andproperties of injection molded isotactic polypropylene (iPP) is investigated using optical microscopy,X-ray diffraction and mechanical testing. To have better control over the thermo-mechanical history,instead of a reciprocating screw, a capillary rheometer is used to drive the melt into the simple rect-angular mold. Molecular weight (MW), molecular weight distribution (MWD) and addition of ethylenevia copolymerization all influence the thickness of the oriented shear layer, the crystallinity, the type andamount of crystal phases, and the lamellar thickness. The addition of a nucleating agent (DMDBS),dictates the crystallization process, and resulting morphology, and samples with an oriented morphologyover the full thickness are created without changing other morphological features, by applying a thermaltreatment to the melt prior to injection, which is based on the specific phase behavior of the iPP-DMDBSsystem. The thermally treated samples show a considerable improvement in mechanical properties.
� 2009 Elsevier Ltd. All rights reserved.
1. Introduction
The market share of polypropylene increases steadily due toa favorable combination of price and performance, and the possi-bility to modify the polymer to broaden its range of properties [1].Long chains, for example, greatly enhance the formation ofthreadlike structures [2–6], illustrating that molecular details andprocessing conditions applied determine morphology and thusproperties of the product. The effect of processing conditions on thecrystallization kinetics and structure development of semi-crys-talline polymers has been studied extensively [4–12]. Flow accel-erates crystallization and alters morphology, and the effect of shearrate is more pronounced than that of the shear time.
Material modifications are implemented on the molecular or themicroscopic level. In the first case, the polymer chain itself ischanged, e.g. via long chain branching or copolymerization, whilein the second case, e.g. particles, or a phase separated secondpolymer, are added. These modifications change the crystallizationkinetics of the polymer, the final morphology and thus the resultingproperties, see e.g. [13–21].
Most of the crystallization studies mentioned apply a short-term shearing protocol as originally introduced by Janeschitz-Kriegl and co-workers [8], or some variations thereof, to separate
: þ31 40 244 7355.rs).
All rights reserved.
the effect of flow and temperature on the crystallization behavior.The conditions applied are, however, far from those occurring ininjection molding, which is one of the most common industrialproduction processes to shape plastic parts. In injection moldingthe polymer is fed via a hopper into a screw extruder where it ismolten, using as sources external heaters and the heat dissipationin the flow. Via the reciprocating screw moving forward the melt ispushed via the runners into the product cavity, and made to solidifyadopting the shape of the cavity, whereafter the mold is opened toeject the product. With this production process, complex-shapedproducts can be realized with molds consisting of multiple partsand slides, including rotational molds that allow for multi-shotprocessing using 2 injection units. The thermo-mechanical historyexperienced by the polymer is complex due to the high deforma-tion rates, the high pressures (compressibility of the polymer) andspeeds applied, the geometry of the feeding system and the moldthat induces complex flow fields and the high temperature gradi-ents and high cooling rates. Complex histories starting in the screware sometimes reflected in the complex morphologies found in theproduct [22]. In this example [22], the authors used a nylon 6nanocomposite, and observed in cross-sections of their samples,perpendicular to flow direction, dark–light layer sequences inbirefringence that were traced back all the way to the sprue sectionand the explanation given was that these layers are formed alreadyduring the melting and conveying in the screw, and subsequentlyare transported downstream.
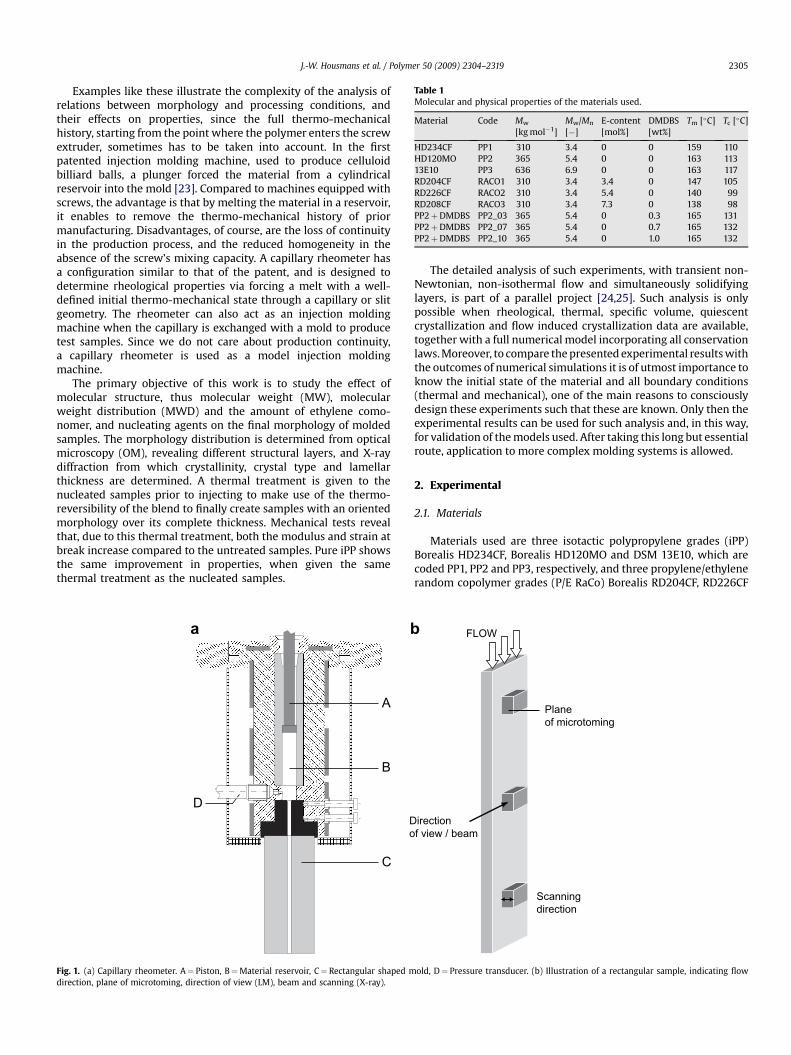
Table 1Molecular and physical properties of the materials used.
Material Code Mw
[kg mol�1]Mw/Mn
[�]E-content[mol%]
DMDBS[wt%]
Tm [�C] Tc [�C]
HD234CF PP1 310 3.4 0 0 159 110HD120MO PP2 365 5.4 0 0 163 11313E10 PP3 636 6.9 0 0 163 117RD204CF RACO1 310 3.4 3.4 0 147 105RD226CF RACO2 310 3.4 5.4 0 140 99RD208CF RACO3 310 3.4 7.3 0 138 98PP2þDMDBS PP2_03 365 5.4 0 0.3 165 131PP2þDMDBS PP2_07 365 5.4 0 0.7 165 132PP2þDMDBS PP2_10 365 5.4 0 1.0 165 132
J.-W. Housmans et al. / Polymer 50 (2009) 2304–2319 2305
Examples like these illustrate the complexity of the analysis ofrelations between morphology and processing conditions, andtheir effects on properties, since the full thermo-mechanicalhistory, starting from the point where the polymer enters the screwextruder, sometimes has to be taken into account. In the firstpatented injection molding machine, used to produce celluloidbilliard balls, a plunger forced the material from a cylindricalreservoir into the mold [23]. Compared to machines equipped withscrews, the advantage is that by melting the material in a reservoir,it enables to remove the thermo-mechanical history of priormanufacturing. Disadvantages, of course, are the loss of continuityin the production process, and the reduced homogeneity in theabsence of the screw’s mixing capacity. A capillary rheometer hasa configuration similar to that of the patent, and is designed todetermine rheological properties via forcing a melt with a well-defined initial thermo-mechanical state through a capillary or slitgeometry. The rheometer can also act as an injection moldingmachine when the capillary is exchanged with a mold to producetest samples. Since we do not care about production continuity,a capillary rheometer is used as a model injection moldingmachine.
The primary objective of this work is to study the effect ofmolecular structure, thus molecular weight (MW), molecularweight distribution (MWD) and the amount of ethylene como-nomer, and nucleating agents on the final morphology of moldedsamples. The morphology distribution is determined from opticalmicroscopy (OM), revealing different structural layers, and X-raydiffraction from which crystallinity, crystal type and lamellarthickness are determined. A thermal treatment is given to thenucleated samples prior to injecting to make use of the thermo-reversibility of the blend to finally create samples with an orientedmorphology over its complete thickness. Mechanical tests revealthat, due to this thermal treatment, both the modulus and strain atbreak increase compared to the untreated samples. Pure iPP showsthe same improvement in properties, when given the samethermal treatment as the nucleated samples.
A
B
D
C
a b
Do
Fig. 1. (a) Capillary rheometer. A¼ Piston, B¼Material reservoir, C¼ Rectangular shaped mdirection, plane of microtoming, direction of view (LM), beam and scanning (X-ray).
The detailed analysis of such experiments, with transient non-Newtonian, non-isothermal flow and simultaneously solidifyinglayers, is part of a parallel project [24,25]. Such analysis is onlypossible when rheological, thermal, specific volume, quiescentcrystallization and flow induced crystallization data are available,together with a full numerical model incorporating all conservationlaws. Moreover, to compare the presented experimental results withthe outcomes of numerical simulations it is of utmost importance toknow the initial state of the material and all boundary conditions(thermal and mechanical), one of the main reasons to consciouslydesign these experiments such that these are known. Only then theexperimental results can be used for such analysis and, in this way,for validation of the models used. After taking this long but essentialroute, application to more complex molding systems is allowed.
2. Experimental
2.1. Materials
Materials used are three isotactic polypropylene grades (iPP)Borealis HD234CF, Borealis HD120MO and DSM 13E10, which arecoded PP1, PP2 and PP3, respectively, and three propylene/ethylenerandom copolymer grades (P/E RaCo) Borealis RD204CF, RD226CF
Scanningdirection
FLOW
irectionf view / beam
Planeof microtoming
old, D¼ Pressure transducer. (b) Illustration of a rectangular sample, indicating flow
6 8 10 12 14 160
0.1
0.2
0.3
0.4
0.5
0.6
2θ [°]
2θ [°]
6 8 10 12 14 160
0.1
0.2
0.3
0.4
0.5
0.6
No
rm
alized
in
ten
sity
No
rm
alized
in
ten
sity
(300)
(130)
(117)
a
b
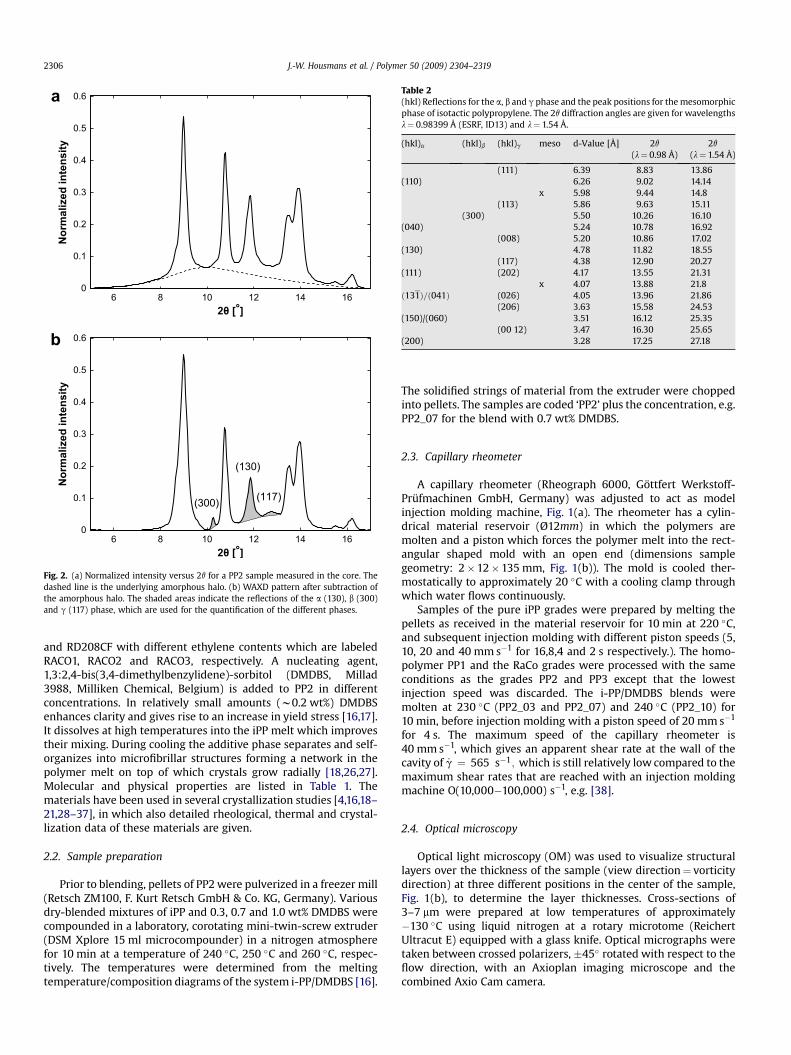
Fig. 2. (a) Normalized intensity versus 2q for a PP2 sample measured in the core. Thedashed line is the underlying amorphous halo. (b) WAXD pattern after subtraction ofthe amorphous halo. The shaded areas indicate the reflections of the a (130), b (300)and g (117) phase, which are used for the quantification of the different phases.
Table 2(hkl) Reflections for the a, b and g phase and the peak positions for the mesomorphicphase of isotactic polypropylene. The 2q diffraction angles are given for wavelengthsl¼ 0.98399 Å (ESRF, ID13) and l¼ 1.54 Å.
(hkl)a (hkl)b (hkl)g meso d-Value [Å] 2q
(l¼ 0.98 Å)2q
(l¼ 1.54 Å)
(111) 6.39 8.83 13.86(110) 6.26 9.02 14.14
x 5.98 9.44 14.8(113) 5.86 9.63 15.11
(300) 5.50 10.26 16.10(040) 5.24 10.78 16.92
(008) 5.20 10.86 17.02(130) 4.78 11.82 18.55
(117) 4.38 12.90 20.27(111) (202) 4.17 13.55 21.31
x 4.07 13.88 21.8ð131Þ=ð041Þ (026) 4.05 13.96 21.86
(206) 3.63 15.58 24.53(150)/(060) 3.51 16.12 25.35
(00 12) 3.47 16.30 25.65(200) 3.28 17.25 27.18
J.-W. Housmans et al. / Polymer 50 (2009) 2304–23192306
and RD208CF with different ethylene contents which are labeledRACO1, RACO2 and RACO3, respectively. A nucleating agent,1,3:2,4-bis(3,4-dimethylbenzylidene)-sorbitol (DMDBS, Millad3988, Milliken Chemical, Belgium) is added to PP2 in differentconcentrations. In relatively small amounts (w0.2 wt%) DMDBSenhances clarity and gives rise to an increase in yield stress [16,17].It dissolves at high temperatures into the iPP melt which improvestheir mixing. During cooling the additive phase separates and self-organizes into microfibrillar structures forming a network in thepolymer melt on top of which crystals grow radially [18,26,27].Molecular and physical properties are listed in Table 1. Thematerials have been used in several crystallization studies [4,16,18–21,28–37], in which also detailed rheological, thermal and crystal-lization data of these materials are given.
2.2. Sample preparation
Prior to blending, pellets of PP2 were pulverized in a freezer mill(Retsch ZM100, F. Kurt Retsch GmbH & Co. KG, Germany). Variousdry-blended mixtures of iPP and 0.3, 0.7 and 1.0 wt% DMDBS werecompounded in a laboratory, corotating mini-twin-screw extruder(DSM Xplore 15 ml microcompounder) in a nitrogen atmospherefor 10 min at a temperature of 240 �C, 250 �C and 260 �C, respec-tively. The temperatures were determined from the meltingtemperature/composition diagrams of the system i-PP/DMDBS [16].
The solidified strings of material from the extruder were choppedinto pellets. The samples are coded ‘PP2’ plus the concentration, e.g.PP2_07 for the blend with 0.7 wt% DMDBS.
2.3. Capillary rheometer
A capillary rheometer (Rheograph 6000, Gottfert Werkstoff-Prufmachinen GmbH, Germany) was adjusted to act as modelinjection molding machine, Fig. 1(a). The rheometer has a cylin-drical material reservoir (Ø12mm) in which the polymers aremolten and a piston which forces the polymer melt into the rect-angular shaped mold with an open end (dimensions samplegeometry: 2�12�135 mm, Fig. 1(b)). The mold is cooled ther-mostatically to approximately 20 �C with a cooling clamp throughwhich water flows continuously.
Samples of the pure iPP grades were prepared by melting thepellets as received in the material reservoir for 10 min at 220 �C,and subsequent injection molding with different piston speeds (5,10, 20 and 40 mm s�1 for 16,8,4 and 2 s respectively.). The homo-polymer PP1 and the RaCo grades were processed with the sameconditions as the grades PP2 and PP3 except that the lowestinjection speed was discarded. The i-PP/DMDBS blends weremolten at 230 �C (PP2_03 and PP2_07) and 240 �C (PP2_10) for10 min, before injection molding with a piston speed of 20 mm s�1
for 4 s. The maximum speed of the capillary rheometer is40 mm s�1, which gives an apparent shear rate at the wall of thecavity of _g ¼ 565 s�1; which is still relatively low compared to themaximum shear rates that are reached with an injection moldingmachine O(10,000�100,000) s�1, e.g. [38].
2.4. Optical microscopy
Optical light microscopy (OM) was used to visualize structurallayers over the thickness of the sample (view direction¼ vorticitydirection) at three different positions in the center of the sample,Fig. 1(b), to determine the layer thicknesses. Cross-sections of3–7 mm were prepared at low temperatures of approximately�130 �C using liquid nitrogen at a rotary microtome (ReichertUltracut E) equipped with a glass knife. Optical micrographs weretaken between crossed polarizers, �45� rotated with respect to theflow direction, with an Axioplan imaging microscope and thecombined Axio Cam camera.
C
D
AB
C
D
AB
C
D
AB
C
D
AB
a
c
b
d
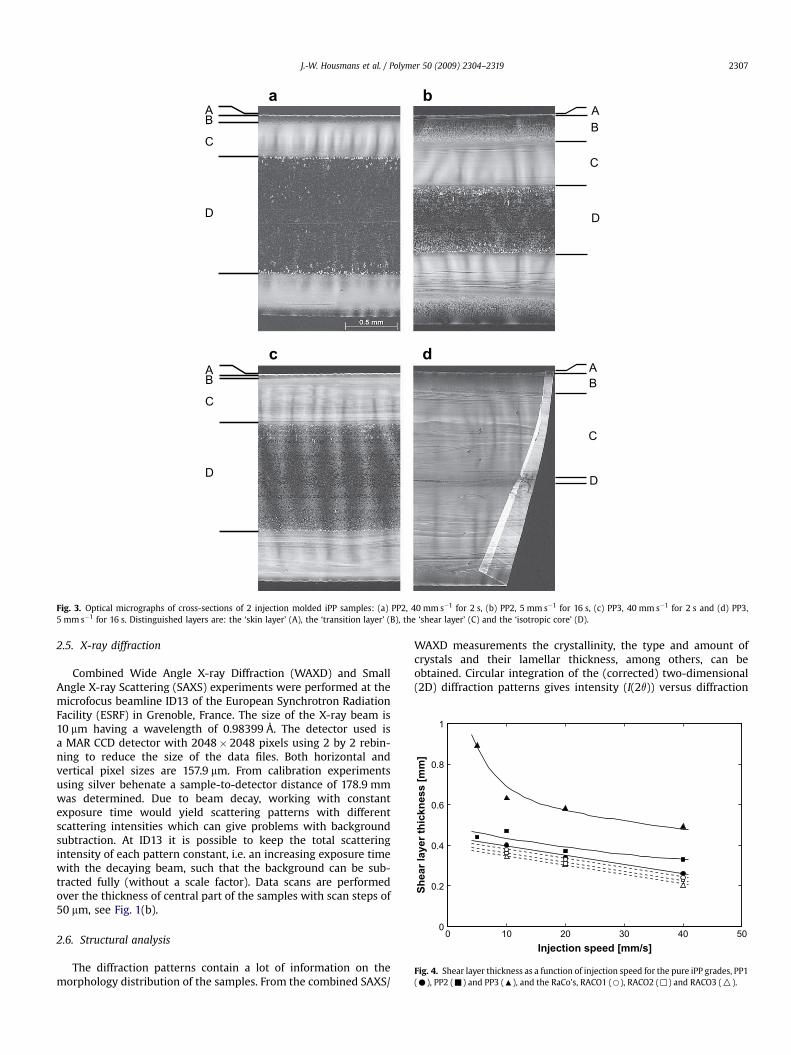
Fig. 3. Optical micrographs of cross-sections of 2 injection molded iPP samples: (a) PP2, 40 mm s�1 for 2 s, (b) PP2, 5 mm s�1 for 16 s, (c) PP3, 40 mm s�1 for 2 s and (d) PP3,5 mm s�1 for 16 s. Distinguished layers are: the ‘skin layer’ (A), the ‘transition layer’ (B), the ‘shear layer’ (C) and the ‘isotropic core’ (D).
0 10 20 30 40 500
0.2
0.4
0.6
0.8
1
Injection speed [mm/s]
Sh
ea
r la
ye
r th
ic
kn
es
s [m
m]
Fig. 4. Shear layer thickness as a function of injection speed for the pure iPP grades, PP1(C), PP2 (-) and PP3 (:), and the RaCo’s, RACO1 (B), RACO2 (,) and RACO3 (O).
J.-W. Housmans et al. / Polymer 50 (2009) 2304–2319 2307
2.5. X-ray diffraction
Combined Wide Angle X-ray Diffraction (WAXD) and SmallAngle X-ray Scattering (SAXS) experiments were performed at themicrofocus beamline ID13 of the European Synchrotron RadiationFacility (ESRF) in Grenoble, France. The size of the X-ray beam is10 mm having a wavelength of 0.98399 Å. The detector used isa MAR CCD detector with 2048� 2048 pixels using 2 by 2 rebin-ning to reduce the size of the data files. Both horizontal andvertical pixel sizes are 157.9 mm. From calibration experimentsusing silver behenate a sample-to-detector distance of 178.9 mmwas determined. Due to beam decay, working with constantexposure time would yield scattering patterns with differentscattering intensities which can give problems with backgroundsubtraction. At ID13 it is possible to keep the total scatteringintensity of each pattern constant, i.e. an increasing exposure timewith the decaying beam, such that the background can be sub-tracted fully (without a scale factor). Data scans are performedover the thickness of central part of the samples with scan steps of50 mm, see Fig. 1(b).
2.6. Structural analysis
The diffraction patterns contain a lot of information on themorphology distribution of the samples. From the combined SAXS/
WAXD measurements the crystallinity, the type and amount ofcrystals and their lamellar thickness, among others, can beobtained. Circular integration of the (corrected) two-dimensional(2D) diffraction patterns gives intensity (I(2q)) versus diffraction
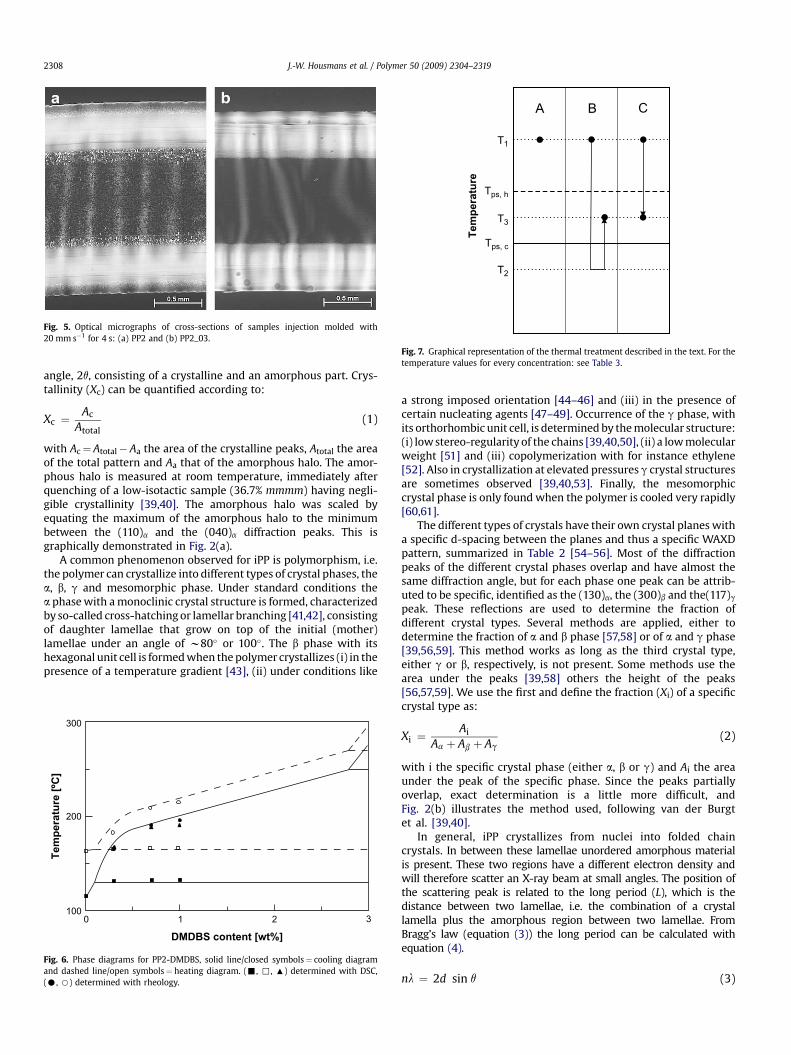
Fig. 5. Optical micrographs of cross-sections of samples injection molded with20 mm s�1 for 4 s: (a) PP2 and (b) PP2_03.
A B C
Tem
peratu
re
T1
Tps, h
T3
Tps, c
T2
Fig. 7. Graphical representation of the thermal treatment described in the text. For thetemperature values for every concentration: see Table 3.
J.-W. Housmans et al. / Polymer 50 (2009) 2304–23192308
angle, 2q, consisting of a crystalline and an amorphous part. Crys-tallinity (Xc) can be quantified according to:
Xc ¼Ac
Atotal(1)
with Ac¼ Atotal� Aa the area of the crystalline peaks, Atotal the areaof the total pattern and Aa that of the amorphous halo. The amor-phous halo is measured at room temperature, immediately afterquenching of a low-isotactic sample (36.7% mmmm) having negli-gible crystallinity [39,40]. The amorphous halo was scaled byequating the maximum of the amorphous halo to the minimumbetween the (110)a and the (040)a diffraction peaks. This isgraphically demonstrated in Fig. 2(a).
A common phenomenon observed for iPP is polymorphism, i.e.the polymer can crystallize into different types of crystal phases, thea, b, g and mesomorphic phase. Under standard conditions thea phase with a monoclinic crystal structure is formed, characterizedby so-called cross-hatching or lamellar branching [41,42], consistingof daughter lamellae that grow on top of the initial (mother)lamellae under an angle of w80� or 100�. The b phase with itshexagonal unit cell is formed when the polymer crystallizes (i) in thepresence of a temperature gradient [43], (ii) under conditions like
0 1 2 3100
200
300
DMDBS content [wt%]
Tem
peratu
re [ºC
]
Fig. 6. Phase diagrams for PP2-DMDBS, solid line/closed symbols¼ cooling diagramand dashed line/open symbols¼ heating diagram. (-, ,, :) determined with DSC,(C, B) determined with rheology.
a strong imposed orientation [44–46] and (iii) in the presence ofcertain nucleating agents [47–49]. Occurrence of the g phase, withits orthorhombic unit cell, is determined by the molecular structure:(i) low stereo-regularity of the chains [39,40,50], (ii) a low molecularweight [51] and (iii) copolymerization with for instance ethylene[52]. Also in crystallization at elevated pressures g crystal structuresare sometimes observed [39,40,53]. Finally, the mesomorphiccrystal phase is only found when the polymer is cooled very rapidly[60,61].
The different types of crystals have their own crystal planes witha specific d-spacing between the planes and thus a specific WAXDpattern, summarized in Table 2 [54–56]. Most of the diffractionpeaks of the different crystal phases overlap and have almost thesame diffraction angle, but for each phase one peak can be attrib-uted to be specific, identified as the (130)a, the (300)b and the(117)g
peak. These reflections are used to determine the fraction ofdifferent crystal types. Several methods are applied, either todetermine the fraction of a and b phase [57,58] or of a and g phase[39,56,59]. This method works as long as the third crystal type,either g or b, respectively, is not present. Some methods use thearea under the peaks [39,58] others the height of the peaks[56,57,59]. We use the first and define the fraction (Xi) of a specificcrystal type as:
Xi ¼Ai
Aa þ Ab þ Ag(2)
with i the specific crystal phase (either a, b or g) and Ai the areaunder the peak of the specific phase. Since the peaks partiallyoverlap, exact determination is a little more difficult, andFig. 2(b) illustrates the method used, following van der Burgtet al. [39,40].
In general, iPP crystallizes from nuclei into folded chaincrystals. In between these lamellae unordered amorphous materialis present. These two regions have a different electron density andwill therefore scatter an X-ray beam at small angles. The position ofthe scattering peak is related to the long period (L), which is thedistance between two lamellae, i.e. the combination of a crystallamella plus the amorphous region between two lamellae. FromBragg’s law (equation (3)) the long period can be calculated withequation (4).
nl ¼ 2d sin q (3)
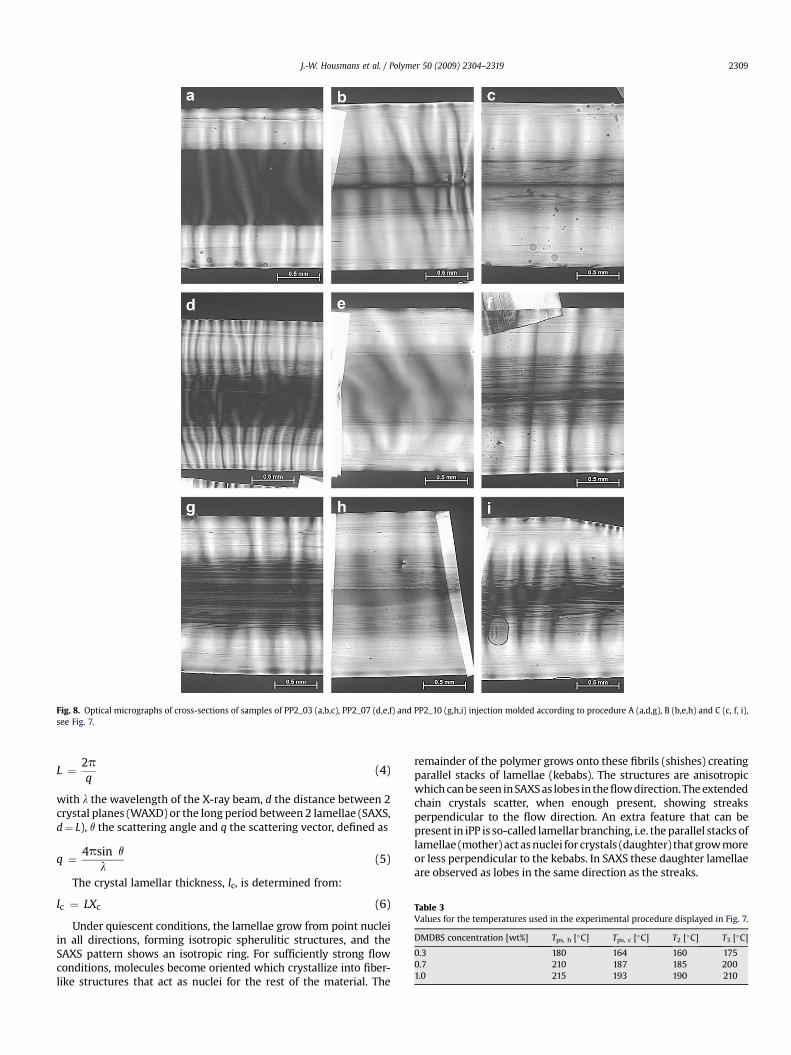
Fig. 8. Optical micrographs of cross-sections of samples of PP2_03 (a,b,c), PP2_07 (d,e,f) and PP2_10 (g,h,i) injection molded according to procedure A (a,d,g), B (b,e,h) and C (c, f, i),see Fig. 7.
Table 3Values for the temperatures used in the experimental procedure displayed in Fig. 7.
DMDBS concentration [wt%] Tps, h [�C] Tps, c [�C] T2 [�C] T3 [�C]
0.3 180 164 160 1750.7 210 187 185 2001.0 215 193 190 210
J.-W. Housmans et al. / Polymer 50 (2009) 2304–2319 2309
L ¼ 2pq
(4)
with l the wavelength of the X-ray beam, d the distance between 2crystal planes (WAXD) or the long period between 2 lamellae (SAXS,d¼ L), q the scattering angle and q the scattering vector, defined as
q ¼ 4psin q
l(5)
The crystal lamellar thickness, lc, is determined from:
lc ¼ LXc (6)
Under quiescent conditions, the lamellae grow from point nucleiin all directions, forming isotropic spherulitic structures, and theSAXS pattern shows an isotropic ring. For sufficiently strong flowconditions, molecules become oriented which crystallize into fiber-like structures that act as nuclei for the rest of the material. The
remainder of the polymer grows onto these fibrils (shishes) creatingparallel stacks of lamellae (kebabs). The structures are anisotropicwhich can be seen in SAXS as lobes in the flow direction. The extendedchain crystals scatter, when enough present, showing streaksperpendicular to the flow direction. An extra feature that can bepresent in iPP is so-called lamellar branching, i.e. the parallel stacks oflamellae (mother) act as nuclei for crystals (daughter) that grow moreor less perpendicular to the kebabs. In SAXS these daughter lamellaeare observed as lobes in the same direction as the streaks.
a
b c d
e f g
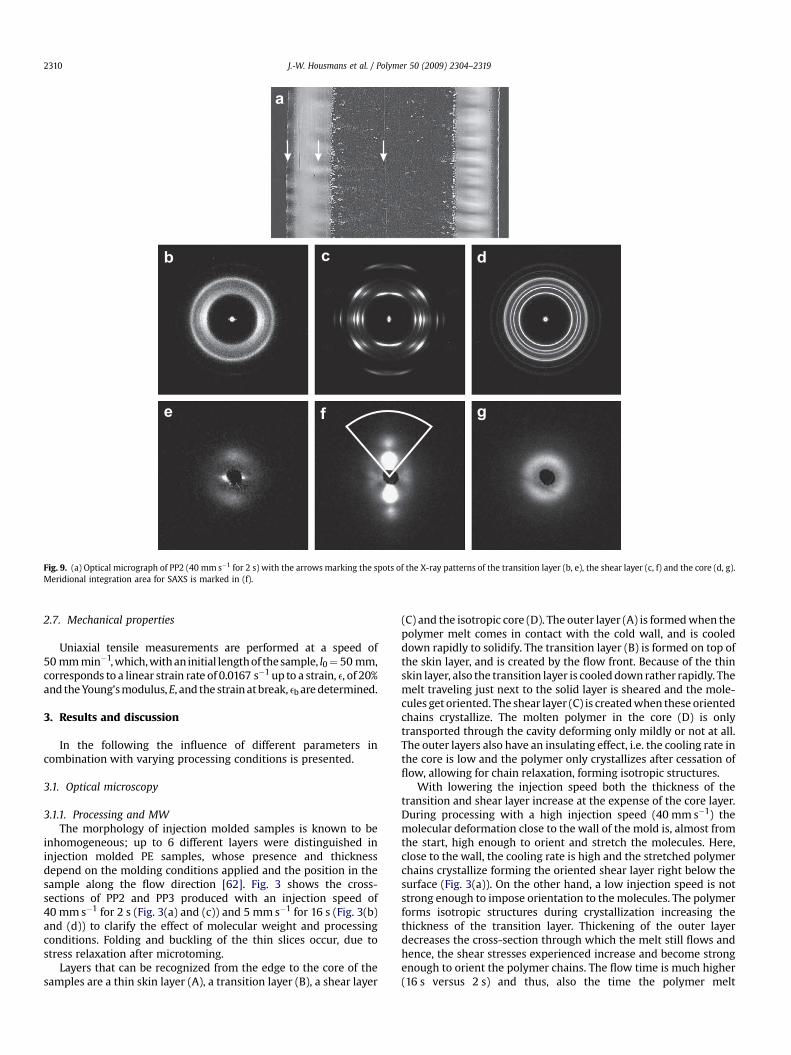
Fig. 9. (a) Optical micrograph of PP2 (40 mm s�1 for 2 s) with the arrows marking the spots of the X-ray patterns of the transition layer (b, e), the shear layer (c, f) and the core (d, g).Meridional integration area for SAXS is marked in (f).
J.-W. Housmans et al. / Polymer 50 (2009) 2304–23192310
2.7. Mechanical properties
Uniaxial tensile measurements are performed at a speed of50 mm min�1, which, with an initial length of the sample, l0¼ 50 mm,corresponds to a linear strain rate of 0.0167 s�1 up to a strain, e, of 20%and the Young’s modulus, E, and the strain at break, eb are determined.
3. Results and discussion
In the following the influence of different parameters incombination with varying processing conditions is presented.
3.1. Optical microscopy
3.1.1. Processing and MWThe morphology of injection molded samples is known to be
inhomogeneous; up to 6 different layers were distinguished ininjection molded PE samples, whose presence and thicknessdepend on the molding conditions applied and the position in thesample along the flow direction [62]. Fig. 3 shows the cross-sections of PP2 and PP3 produced with an injection speed of40 mm s�1 for 2 s (Fig. 3(a) and (c)) and 5 mm s�1 for 16 s (Fig. 3(b)and (d)) to clarify the effect of molecular weight and processingconditions. Folding and buckling of the thin slices occur, due tostress relaxation after microtoming.
Layers that can be recognized from the edge to the core of thesamples are a thin skin layer (A), a transition layer (B), a shear layer
(C) and the isotropic core (D). The outer layer (A) is formed when thepolymer melt comes in contact with the cold wall, and is cooleddown rapidly to solidify. The transition layer (B) is formed on top ofthe skin layer, and is created by the flow front. Because of the thinskin layer, also the transition layer is cooled down rather rapidly. Themelt traveling just next to the solid layer is sheared and the mole-cules get oriented. The shear layer (C) is created when these orientedchains crystallize. The molten polymer in the core (D) is onlytransported through the cavity deforming only mildly or not at all.The outer layers also have an insulating effect, i.e. the cooling rate inthe core is low and the polymer only crystallizes after cessation offlow, allowing for chain relaxation, forming isotropic structures.
With lowering the injection speed both the thickness of thetransition and shear layer increase at the expense of the core layer.During processing with a high injection speed (40 mm s�1) themolecular deformation close to the wall of the mold is, almost fromthe start, high enough to orient and stretch the molecules. Here,close to the wall, the cooling rate is high and the stretched polymerchains crystallize forming the oriented shear layer right below thesurface (Fig. 3(a)). On the other hand, a low injection speed is notstrong enough to impose orientation to the molecules. The polymerforms isotropic structures during crystallization increasing thethickness of the transition layer. Thickening of the outer layerdecreases the cross-section through which the melt still flows andhence, the shear stresses experienced increase and become strongenough to orient the polymer chains. The flow time is much higher(16 s versus 2 s) and thus, also the time the polymer melt
4 6 8 10 12 14 16 18
No
rm
alized
in
ten
sity [a.u
.]
4 6 8 10 12 14 16 18
No
rm
alized
in
ten
isty [a.u
.]
4 6 8 10 12 14 16 18
No
rm
alized
in
ten
sity [a.u
.]
a b
c
2θ [°]
2θ [°]2θ [°]
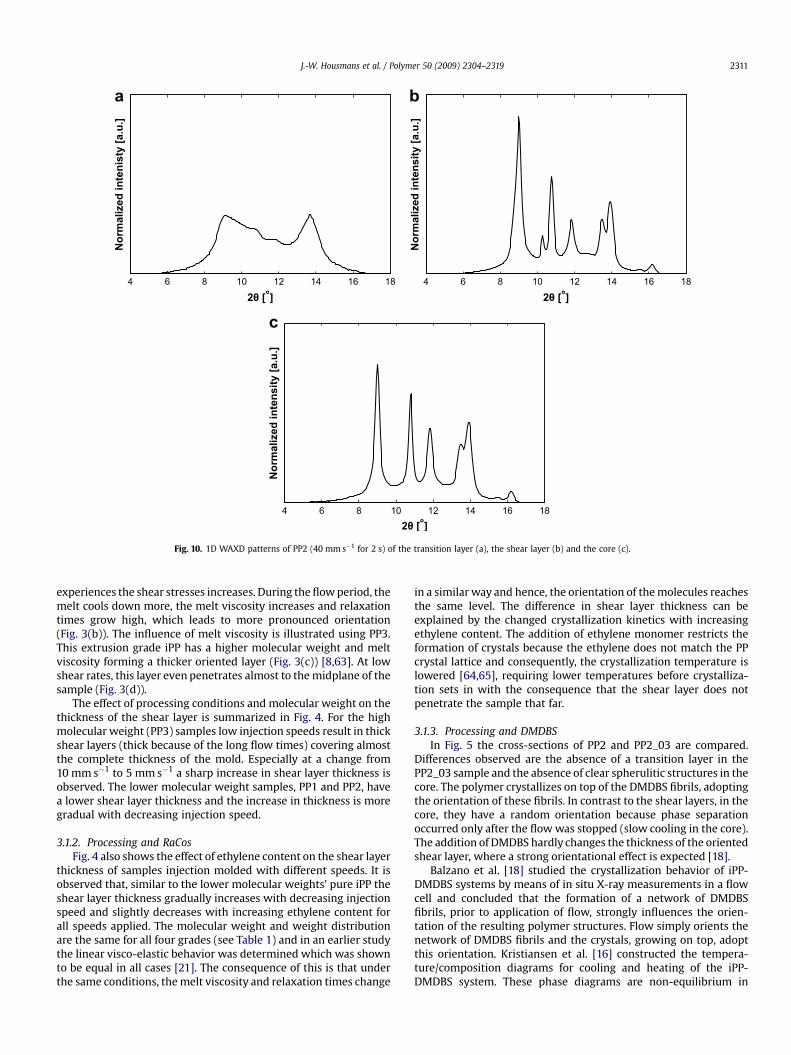
Fig. 10. 1D WAXD patterns of PP2 (40 mm s�1 for 2 s) of the transition layer (a), the shear layer (b) and the core (c).
J.-W. Housmans et al. / Polymer 50 (2009) 2304–2319 2311
experiences the shear stresses increases. During the flow period, themelt cools down more, the melt viscosity increases and relaxationtimes grow high, which leads to more pronounced orientation(Fig. 3(b)). The influence of melt viscosity is illustrated using PP3.This extrusion grade iPP has a higher molecular weight and meltviscosity forming a thicker oriented layer (Fig. 3(c)) [8,63]. At lowshear rates, this layer even penetrates almost to the midplane of thesample (Fig. 3(d)).
The effect of processing conditions and molecular weight on thethickness of the shear layer is summarized in Fig. 4. For the highmolecular weight (PP3) samples low injection speeds result in thickshear layers (thick because of the long flow times) covering almostthe complete thickness of the mold. Especially at a change from10 mm s�1 to 5 mm s�1 a sharp increase in shear layer thickness isobserved. The lower molecular weight samples, PP1 and PP2, havea lower shear layer thickness and the increase in thickness is moregradual with decreasing injection speed.
3.1.2. Processing and RaCosFig. 4 also shows the effect of ethylene content on the shear layer
thickness of samples injection molded with different speeds. It isobserved that, similar to the lower molecular weights’ pure iPP theshear layer thickness gradually increases with decreasing injectionspeed and slightly decreases with increasing ethylene content forall speeds applied. The molecular weight and weight distributionare the same for all four grades (see Table 1) and in an earlier studythe linear visco-elastic behavior was determined which was shownto be equal in all cases [21]. The consequence of this is that underthe same conditions, the melt viscosity and relaxation times change
in a similar way and hence, the orientation of the molecules reachesthe same level. The difference in shear layer thickness can beexplained by the changed crystallization kinetics with increasingethylene content. The addition of ethylene monomer restricts theformation of crystals because the ethylene does not match the PPcrystal lattice and consequently, the crystallization temperature islowered [64,65], requiring lower temperatures before crystalliza-tion sets in with the consequence that the shear layer does notpenetrate the sample that far.
3.1.3. Processing and DMDBSIn Fig. 5 the cross-sections of PP2 and PP2_03 are compared.
Differences observed are the absence of a transition layer in thePP2_03 sample and the absence of clear spherulitic structures in thecore. The polymer crystallizes on top of the DMDBS fibrils, adoptingthe orientation of these fibrils. In contrast to the shear layers, in thecore, they have a random orientation because phase separationoccurred only after the flow was stopped (slow cooling in the core).The addition of DMDBS hardly changes the thickness of the orientedshear layer, where a strong orientational effect is expected [18].
Balzano et al. [18] studied the crystallization behavior of iPP-DMDBS systems by means of in situ X-ray measurements in a flowcell and concluded that the formation of a network of DMDBSfibrils, prior to application of flow, strongly influences the orien-tation of the resulting polymer structures. Flow simply orients thenetwork of DMDBS fibrils and the crystals, growing on top, adoptthis orientation. Kristiansen et al. [16] constructed the tempera-ture/composition diagrams for cooling and heating of the iPP-DMDBS system. These phase diagrams are non-equilibrium in
0 20 40 60 80 1000
0.2
0.4
0.6
0.8
1
crystallinity [%]
sam
ple w
id
th
[m
m], 0 =
co
re
0 20 40 60 80 1000
0.2
0.4
0.6
0.8
1
crystallinity [%]
sam
ple w
id
th
[m
m], 0 =
co
re
PP2
PP3
a
b
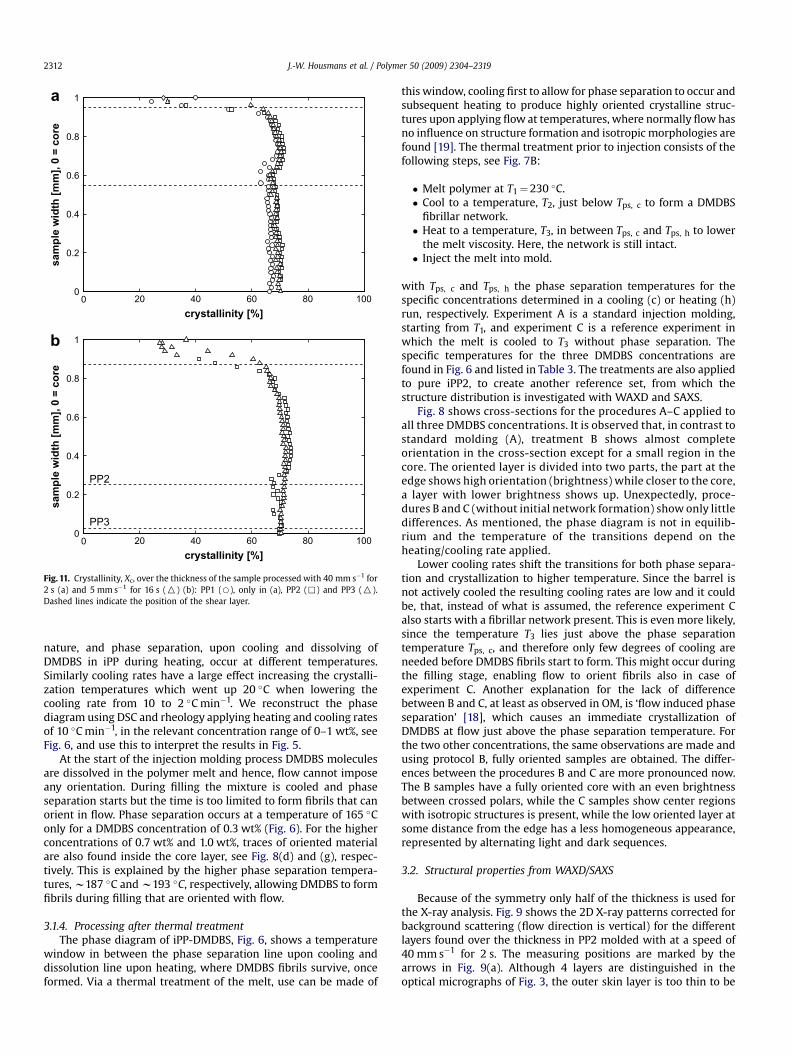
Fig. 11. Crystallinity, Xc, over the thickness of the sample processed with 40 mm s�1 for2 s (a) and 5 mm s�1 for 16 s (O) (b): PP1 (B), only in (a), PP2 (,) and PP3 (O).Dashed lines indicate the position of the shear layer.
J.-W. Housmans et al. / Polymer 50 (2009) 2304–23192312
nature, and phase separation, upon cooling and dissolving ofDMDBS in iPP during heating, occur at different temperatures.Similarly cooling rates have a large effect increasing the crystalli-zation temperatures which went up 20 �C when lowering thecooling rate from 10 to 2 �C min�1. We reconstruct the phasediagram using DSC and rheology applying heating and cooling ratesof 10 �C min�1, in the relevant concentration range of 0–1 wt%, seeFig. 6, and use this to interpret the results in Fig. 5.
At the start of the injection molding process DMDBS moleculesare dissolved in the polymer melt and hence, flow cannot imposeany orientation. During filling the mixture is cooled and phaseseparation starts but the time is too limited to form fibrils that canorient in flow. Phase separation occurs at a temperature of 165 �Conly for a DMDBS concentration of 0.3 wt% (Fig. 6). For the higherconcentrations of 0.7 wt% and 1.0 wt%, traces of oriented materialare also found inside the core layer, see Fig. 8(d) and (g), respec-tively. This is explained by the higher phase separation tempera-tures, w187 �C and w193 �C, respectively, allowing DMDBS to formfibrils during filling that are oriented with flow.
3.1.4. Processing after thermal treatmentThe phase diagram of iPP-DMDBS, Fig. 6, shows a temperature
window in between the phase separation line upon cooling anddissolution line upon heating, where DMDBS fibrils survive, onceformed. Via a thermal treatment of the melt, use can be made of
this window, cooling first to allow for phase separation to occur andsubsequent heating to produce highly oriented crystalline struc-tures upon applying flow at temperatures, where normally flow hasno influence on structure formation and isotropic morphologies arefound [19]. The thermal treatment prior to injection consists of thefollowing steps, see Fig. 7B:
� Melt polymer at T1¼230 �C.� Cool to a temperature, T2, just below Tps, c to form a DMDBS
fibrillar network.� Heat to a temperature, T3, in between Tps, c and Tps, h to lower
the melt viscosity. Here, the network is still intact.� Inject the melt into mold.
with Tps, c and Tps, h the phase separation temperatures for thespecific concentrations determined in a cooling (c) or heating (h)run, respectively. Experiment A is a standard injection molding,starting from T1, and experiment C is a reference experiment inwhich the melt is cooled to T3 without phase separation. Thespecific temperatures for the three DMDBS concentrations arefound in Fig. 6 and listed in Table 3. The treatments are also appliedto pure iPP2, to create another reference set, from which thestructure distribution is investigated with WAXD and SAXS.
Fig. 8 shows cross-sections for the procedures A–C applied toall three DMDBS concentrations. It is observed that, in contrast tostandard molding (A), treatment B shows almost completeorientation in the cross-section except for a small region in thecore. The oriented layer is divided into two parts, the part at theedge shows high orientation (brightness) while closer to the core,a layer with lower brightness shows up. Unexpectedly, proce-dures B and C (without initial network formation) show only littledifferences. As mentioned, the phase diagram is not in equilib-rium and the temperature of the transitions depend on theheating/cooling rate applied.
Lower cooling rates shift the transitions for both phase separa-tion and crystallization to higher temperature. Since the barrel isnot actively cooled the resulting cooling rates are low and it couldbe, that, instead of what is assumed, the reference experiment Calso starts with a fibrillar network present. This is even more likely,since the temperature T3 lies just above the phase separationtemperature Tps, c, and therefore only few degrees of cooling areneeded before DMDBS fibrils start to form. This might occur duringthe filling stage, enabling flow to orient fibrils also in case ofexperiment C. Another explanation for the lack of differencebetween B and C, at least as observed in OM, is ‘flow induced phaseseparation’ [18], which causes an immediate crystallization ofDMDBS at flow just above the phase separation temperature. Forthe two other concentrations, the same observations are made andusing protocol B, fully oriented samples are obtained. The differ-ences between the procedures B and C are more pronounced now.The B samples have a fully oriented core with an even brightnessbetween crossed polars, while the C samples show center regionswith isotropic structures is present, while the low oriented layer atsome distance from the edge has a less homogeneous appearance,represented by alternating light and dark sequences.
3.2. Structural properties from WAXD/SAXS
Because of the symmetry only half of the thickness is used forthe X-ray analysis. Fig. 9 shows the 2D X-ray patterns corrected forbackground scattering (flow direction is vertical) for the differentlayers found over the thickness in PP2 molded with at a speed of40 mm s�1 for 2 s. The measuring positions are marked by thearrows in Fig. 9(a). Although 4 layers are distinguished in theoptical micrographs of Fig. 3, the outer skin layer is too thin to be
0 20 40 60 80 1000
0.2
0.4
0.6
0.8
1
crystallinity [%]
sam
ple w
id
th
[m
m], 0 =
co
re
Fig. 12. Crystallinity, Xc, over the thickness of the sample for PP1 (B) and RACO1 (,),RACO2 (O) and RACO3 (>) processed with 20 mm s�1 for 4 s. Dashed lines indicatethe position of the shear layer.
J.-W. Housmans et al. / Polymer 50 (2009) 2304–2319 2313
detected with the X-ray beam, and only severe edge scattering isobserved. The transition layer consists almost completely ofmesomorphic crystals right next to the skin layer, shown by twobroad rings in Fig. 9(b). At this position, the polymer is quenchedand has no time to form well-defined crystal structures.
a b
c
0 20 40 60 80 1000
0.2
0.4
0.6
0.8
1
crystallinity [%]
sam
ple w
id
th
[m
m], 0 =
co
re
0 20 400
0.2
0.4
0.6
0.8
1
crysta
sam
ple w
id
th
[m
m], 0 =
co
re
A
B/C
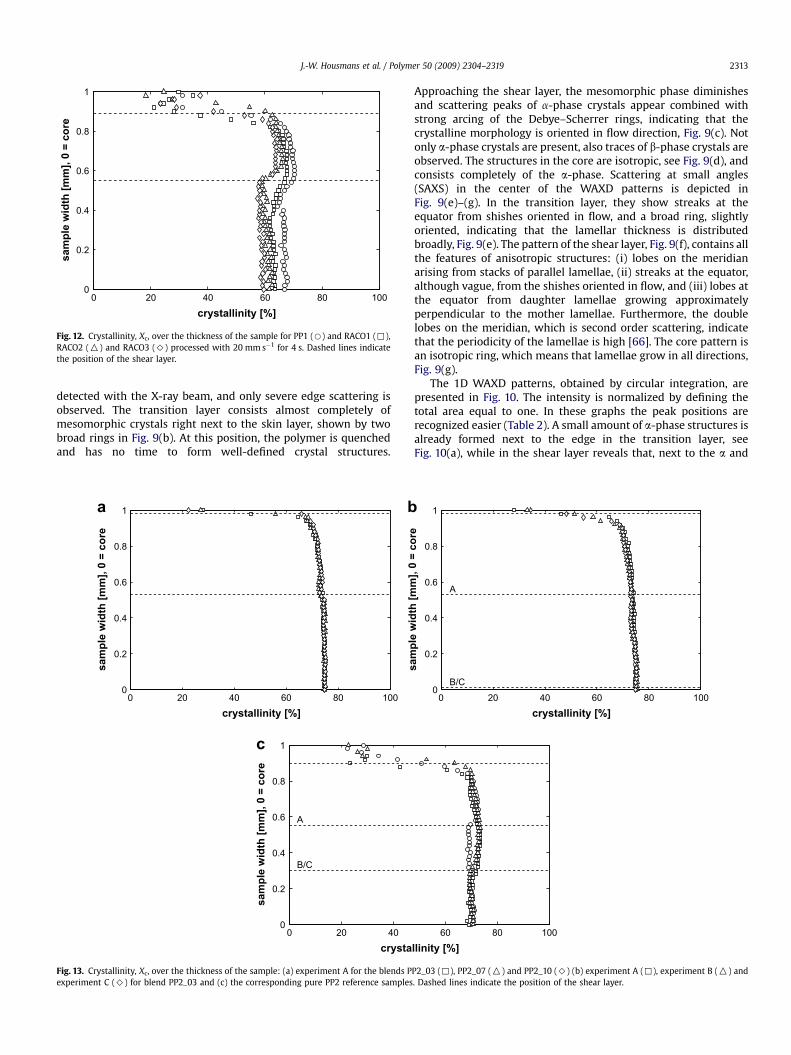
Fig. 13. Crystallinity, Xc, over the thickness of the sample: (a) experiment A for the blends Pexperiment C (>) for blend PP2_03 and (c) the corresponding pure PP2 reference samples
Approaching the shear layer, the mesomorphic phase diminishesand scattering peaks of a-phase crystals appear combined withstrong arcing of the Debye–Scherrer rings, indicating that thecrystalline morphology is oriented in flow direction, Fig. 9(c). Notonly a-phase crystals are present, also traces of b-phase crystals areobserved. The structures in the core are isotropic, see Fig. 9(d), andconsists completely of the a-phase. Scattering at small angles(SAXS) in the center of the WAXD patterns is depicted inFig. 9(e)–(g). In the transition layer, they show streaks at theequator from shishes oriented in flow, and a broad ring, slightlyoriented, indicating that the lamellar thickness is distributedbroadly, Fig. 9(e). The pattern of the shear layer, Fig. 9(f), contains allthe features of anisotropic structures: (i) lobes on the meridianarising from stacks of parallel lamellae, (ii) streaks at the equator,although vague, from the shishes oriented in flow, and (iii) lobes atthe equator from daughter lamellae growing approximatelyperpendicular to the mother lamellae. Furthermore, the doublelobes on the meridian, which is second order scattering, indicatethat the periodicity of the lamellae is high [66]. The core pattern isan isotropic ring, which means that lamellae grow in all directions,Fig. 9(g).
The 1D WAXD patterns, obtained by circular integration, arepresented in Fig. 10. The intensity is normalized by defining thetotal area equal to one. In these graphs the peak positions arerecognized easier (Table 2). A small amount of a-phase structures isalready formed next to the edge in the transition layer, seeFig. 10(a), while in the shear layer reveals that, next to the a and
0 20 40 60 80 1000
0.2
0.4
0.6
0.8
1
sam
ple w
id
th
[m
m], 0 =
co
re
crystallinity [%]
A
B/C
60 80 100llinity [%]
P2_03 (,), PP2_07 (O) and PP2_10 (>) (b) experiment A (,), experiment B (O) and. Dashed lines indicate the position of the shear layer.
a b
c d
0 0.2 0.4 0.6 0.8 10
0.2
0.4
0.6
0.8
1
Xi, i = α, β, γ
sam
ple w
id
th
[m
m], 0 =
co
re
0 0.2 0.4 0.6 0.8 10
0.2
0.4
0.6
0.8
1
Xi, i = α, β, γ
sam
ple w
id
th
[m
m], 0 =
co
re
0 0.2 0.4 0.6 0.8 10
0.2
0.4
0.6
0.8
1
Xi, i = α, β, γ
sam
ple w
id
th
[m
m], 0 =
co
re
0 0.2 0.4 0.6 0.8 10
0.2
0.4
0.6
0.8
1
Xi, i = α, β, γ
sam
ple w
id
th
[m
m], 0
=
co
re
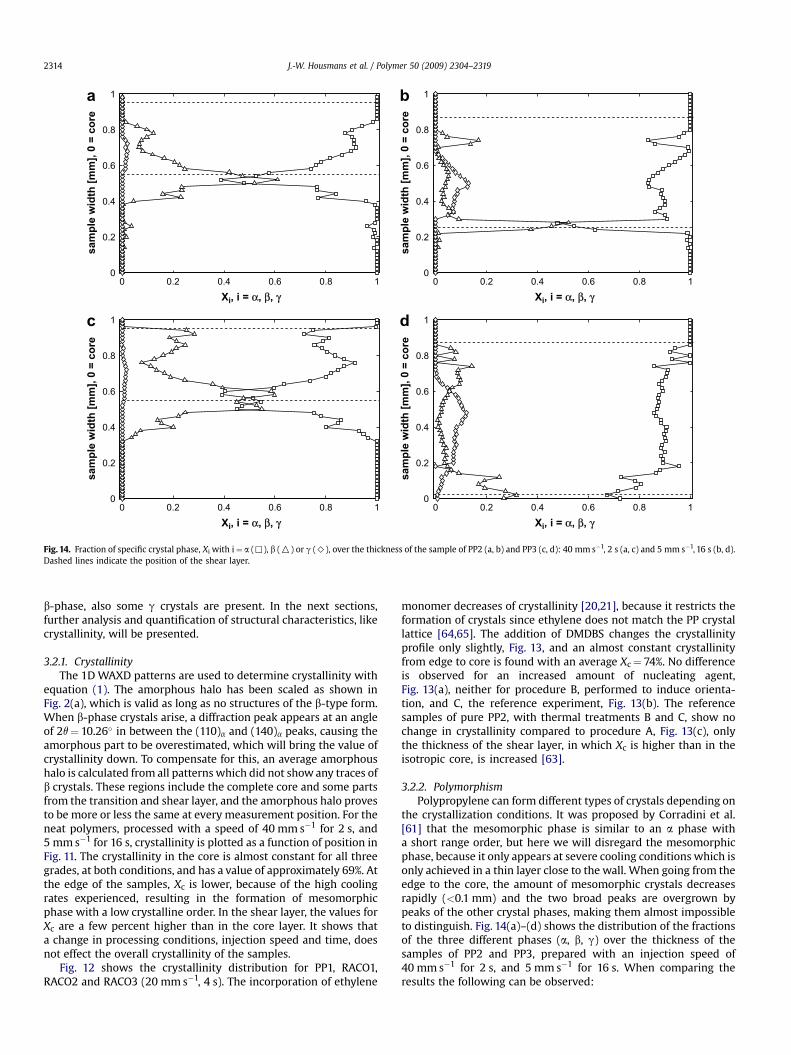
Fig. 14. Fraction of specific crystal phase, Xi with i¼ a (,), b (O) or g (>), over the thickness of the sample of PP2 (a, b) and PP3 (c, d): 40 mm s�1, 2 s (a, c) and 5 mm s�1, 16 s (b, d).Dashed lines indicate the position of the shear layer.
J.-W. Housmans et al. / Polymer 50 (2009) 2304–23192314
b-phase, also some g crystals are present. In the next sections,further analysis and quantification of structural characteristics, likecrystallinity, will be presented.
3.2.1. CrystallinityThe 1D WAXD patterns are used to determine crystallinity with
equation (1). The amorphous halo has been scaled as shown inFig. 2(a), which is valid as long as no structures of the b-type form.When b-phase crystals arise, a diffraction peak appears at an angleof 2q¼ 10.26� in between the (110)a and (140)a peaks, causing theamorphous part to be overestimated, which will bring the value ofcrystallinity down. To compensate for this, an average amorphoushalo is calculated from all patterns which did not show any traces ofb crystals. These regions include the complete core and some partsfrom the transition and shear layer, and the amorphous halo provesto be more or less the same at every measurement position. For theneat polymers, processed with a speed of 40 mm s�1 for 2 s, and5 mm s�1 for 16 s, crystallinity is plotted as a function of position inFig. 11. The crystallinity in the core is almost constant for all threegrades, at both conditions, and has a value of approximately 69%. Atthe edge of the samples, Xc is lower, because of the high coolingrates experienced, resulting in the formation of mesomorphicphase with a low crystalline order. In the shear layer, the values forXc are a few percent higher than in the core layer. It shows thata change in processing conditions, injection speed and time, doesnot effect the overall crystallinity of the samples.
Fig. 12 shows the crystallinity distribution for PP1, RACO1,RACO2 and RACO3 (20 mm s�1, 4 s). The incorporation of ethylene
monomer decreases of crystallinity [20,21], because it restricts theformation of crystals since ethylene does not match the PP crystallattice [64,65]. The addition of DMDBS changes the crystallinityprofile only slightly, Fig. 13, and an almost constant crystallinityfrom edge to core is found with an average Xc¼ 74%. No differenceis observed for an increased amount of nucleating agent,Fig. 13(a), neither for procedure B, performed to induce orienta-tion, and C, the reference experiment, Fig. 13(b). The referencesamples of pure PP2, with thermal treatments B and C, show nochange in crystallinity compared to procedure A, Fig. 13(c), onlythe thickness of the shear layer, in which Xc is higher than in theisotropic core, is increased [63].
3.2.2. PolymorphismPolypropylene can form different types of crystals depending on
the crystallization conditions. It was proposed by Corradini et al.[61] that the mesomorphic phase is similar to an a phase witha short range order, but here we will disregard the mesomorphicphase, because it only appears at severe cooling conditions which isonly achieved in a thin layer close to the wall. When going from theedge to the core, the amount of mesomorphic crystals decreasesrapidly (<0.1 mm) and the two broad peaks are overgrown bypeaks of the other crystal phases, making them almost impossibleto distinguish. Fig. 14(a)–(d) shows the distribution of the fractionsof the three different phases (a, b, g) over the thickness of thesamples of PP2 and PP3, prepared with an injection speed of40 mm s�1 for 2 s, and 5 mm s�1 for 16 s. When comparing theresults the following can be observed:
a b
c d
0 0.2 0.4 0.6 0.8 10
0.2
0.4
0.6
0.8
1
Xi, i = α, β, γ
sam
ple w
id
th
[m
m], 0 =
co
re
0 0.2 0.4 0.6 0.8 10
0.2
0.4
0.6
0.8
1
Xi, i = α, β, γ
sam
ple w
id
th
[m
m], 0 =
co
re
0 0.2 0.4 0.6 0.8 10
0.2
0.4
0.6
0.8
1
Xi, i = α, β, γ
sam
ple w
id
th
[m
m], 0 =
co
re
0 0.2 0.4 0.6 0.8 10
0.2
0.4
0.6
0.8
1
Xi, i = α, β, γ
sam
ple w
id
th
[m
m], 0 =
co
re
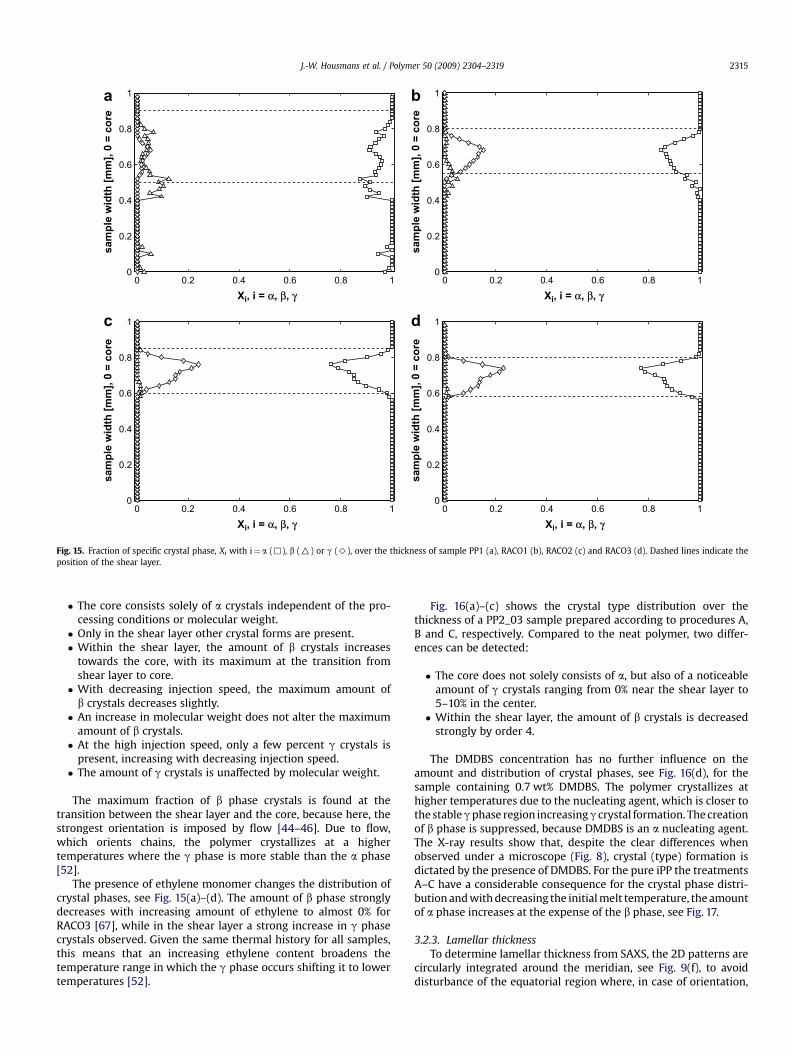
Fig. 15. Fraction of specific crystal phase, Xi with i¼ a (,), b (O) or g (>), over the thickness of sample PP1 (a), RACO1 (b), RACO2 (c) and RACO3 (d). Dashed lines indicate theposition of the shear layer.
J.-W. Housmans et al. / Polymer 50 (2009) 2304–2319 2315
� The core consists solely of a crystals independent of the pro-cessing conditions or molecular weight.� Only in the shear layer other crystal forms are present.� Within the shear layer, the amount of b crystals increases
towards the core, with its maximum at the transition fromshear layer to core.� With decreasing injection speed, the maximum amount of
b crystals decreases slightly.� An increase in molecular weight does not alter the maximum
amount of b crystals.� At the high injection speed, only a few percent g crystals is
present, increasing with decreasing injection speed.� The amount of g crystals is unaffected by molecular weight.
The maximum fraction of b phase crystals is found at thetransition between the shear layer and the core, because here, thestrongest orientation is imposed by flow [44–46]. Due to flow,which orients chains, the polymer crystallizes at a highertemperatures where the g phase is more stable than the a phase[52].
The presence of ethylene monomer changes the distribution ofcrystal phases, see Fig. 15(a)–(d). The amount of b phase stronglydecreases with increasing amount of ethylene to almost 0% forRACO3 [67], while in the shear layer a strong increase in g phasecrystals observed. Given the same thermal history for all samples,this means that an increasing ethylene content broadens thetemperature range in which the g phase occurs shifting it to lowertemperatures [52].
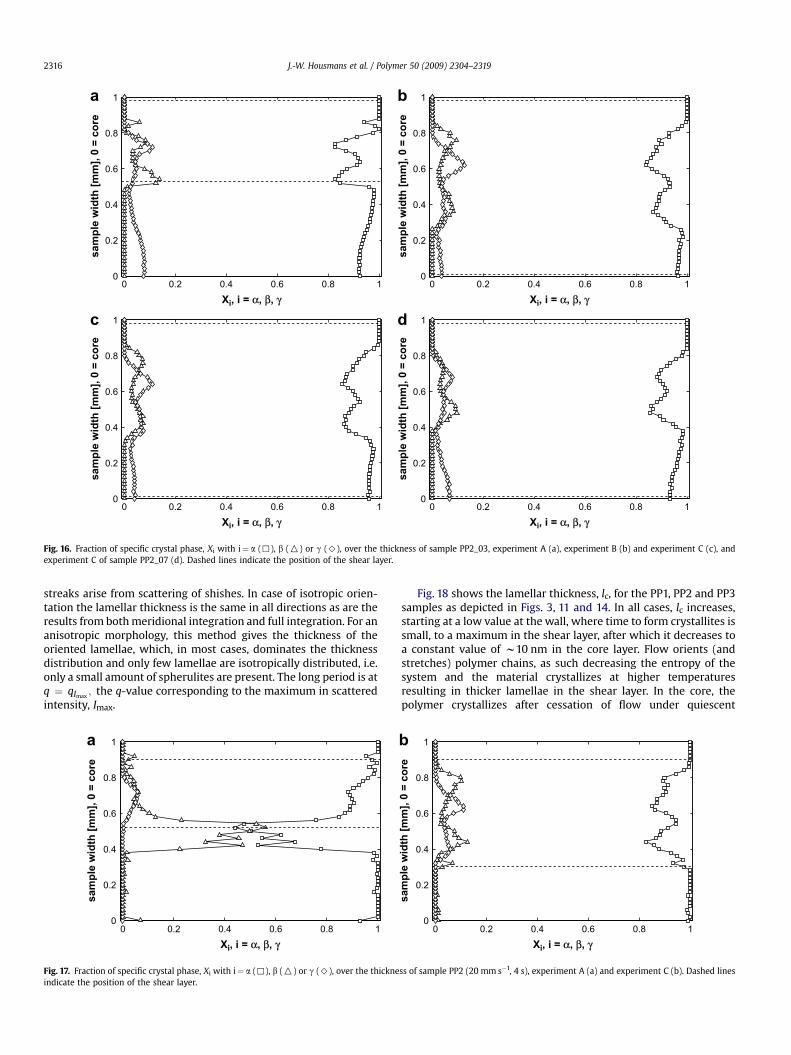
Fig. 16(a)–(c) shows the crystal type distribution over thethickness of a PP2_03 sample prepared according to procedures A,B and C, respectively. Compared to the neat polymer, two differ-ences can be detected:
� The core does not solely consists of a, but also of a noticeableamount of g crystals ranging from 0% near the shear layer to5–10% in the center.� Within the shear layer, the amount of b crystals is decreased
strongly by order 4.
The DMDBS concentration has no further influence on theamount and distribution of crystal phases, see Fig. 16(d), for thesample containing 0.7 wt% DMDBS. The polymer crystallizes athigher temperatures due to the nucleating agent, which is closer tothe stable g phase region increasing g crystal formation. The creationof b phase is suppressed, because DMDBS is an a nucleating agent.The X-ray results show that, despite the clear differences whenobserved under a microscope (Fig. 8), crystal (type) formation isdictated by the presence of DMDBS. For the pure iPP the treatmentsA–C have a considerable consequence for the crystal phase distri-bution and with decreasing the initial melt temperature, the amountof a phase increases at the expense of the b phase, see Fig. 17.
3.2.3. Lamellar thicknessTo determine lamellar thickness from SAXS, the 2D patterns are
circularly integrated around the meridian, see Fig. 9(f), to avoiddisturbance of the equatorial region where, in case of orientation,
a b
c d
0 0.2 0.4 0.6 0.8 10
0.2
0.4
0.6
0.8
1
Xi, i = α, β, γ
Xi, i = α, β, γ
sam
ple w
id
th
[m
m], 0 =
co
re
0 0.2 0.4 0.6 0.8 10
0.2
0.4
0.6
0.8
1
sam
ple w
id
th
[m
m], 0 =
co
re
0 0.2 0.4 0.6 0.8 10
0.2
0.4
0.6
0.8
1
sam
ple w
id
th
[m
m], 0
=
co
re
0 0.2 0.4 0.6 0.8 10
0.2
0.4
0.6
0.8
1
Xi, i = α, β, γ
Xi, i = α, β, γ
sam
ple w
id
th
[m
m], 0 =
co
re
Fig. 16. Fraction of specific crystal phase, Xi with i¼ a (,), b (O) or g (>), over the thickness of sample PP2_03, experiment A (a), experiment B (b) and experiment C (c), andexperiment C of sample PP2_07 (d). Dashed lines indicate the position of the shear layer.
J.-W. Housmans et al. / Polymer 50 (2009) 2304–23192316
streaks arise from scattering of shishes. In case of isotropic orien-tation the lamellar thickness is the same in all directions as are theresults from both meridional integration and full integration. For ananisotropic morphology, this method gives the thickness of theoriented lamellae, which, in most cases, dominates the thicknessdistribution and only few lamellae are isotropically distributed, i.e.only a small amount of spherulites are present. The long period is atq ¼ qImax
; the q-value corresponding to the maximum in scatteredintensity, Imax.
a
0 0.2 0.4 0.6 0.8 10
0.2
0.4
0.6
0.8
1
Xi, i = α, β, γ
sam
ple w
id
th
[m
m], 0 =
co
re
Fig. 17. Fraction of specific crystal phase, Xi with i¼ a (,), b (O) or g (>), over the thickneindicate the position of the shear layer.
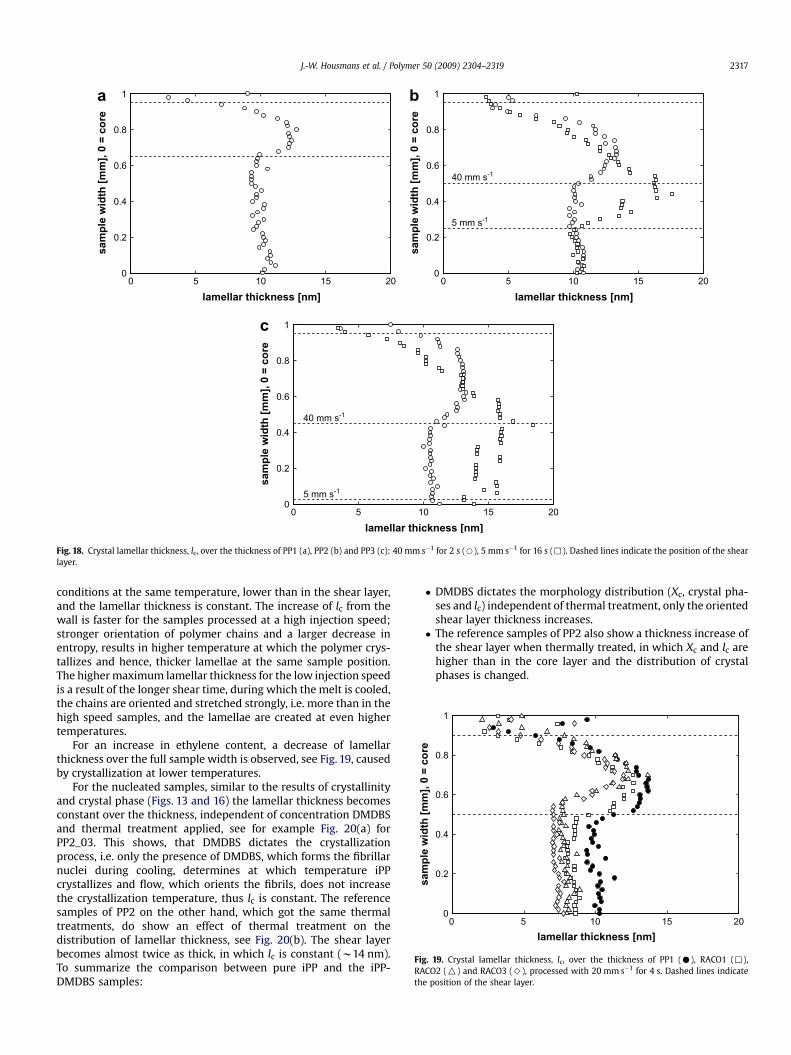
Fig. 18 shows the lamellar thickness, lc, for the PP1, PP2 and PP3samples as depicted in Figs. 3, 11 and 14. In all cases, lc increases,starting at a low value at the wall, where time to form crystallites issmall, to a maximum in the shear layer, after which it decreases toa constant value of w10 nm in the core layer. Flow orients (andstretches) polymer chains, as such decreasing the entropy of thesystem and the material crystallizes at higher temperaturesresulting in thicker lamellae in the shear layer. In the core, thepolymer crystallizes after cessation of flow under quiescent
b
0 0.2 0.4 0.6 0.8 10
0.2
0.4
0.6
0.8
1
Xi, i = α, β, γ
sam
ple w
id
th
[m
m], 0 =
co
re
ss of sample PP2 (20 mm s�1, 4 s), experiment A (a) and experiment C (b). Dashed lines
0 5 10 15 200
0.2
0.4
0.6
0.8
1
lamellar thickness [nm]
sam
ple w
id
th
[m
m], 0 =
co
re
Fig. 19. Crystal lamellar thickness, lc, over the thickness of PP1 (C), RACO1 (,),RACO2 (O) and RACO3 (>), processed with 20 mm s�1 for 4 s. Dashed lines indicatethe position of the shear layer.
a b
c
0 5 10 15 200
0.2
0.4
0.6
0.8
1
lamellar thickness [nm]
sam
ple w
id
th
[m
m], 0 =
co
re
0 5 10 15 200
0.2
0.4
0.6
0.8
1
lamellar thickness [nm]
sam
ple w
id
th
[m
m], 0 =
co
re
40 mm s-1
5 mm s-1
40 mm s-1
5 mm s-1
0 5 10 15 200
0.2
0.4
0.6
0.8
1
lamellar thickness [nm]
sam
ple w
id
th
[m
m], 0 =
co
re
Fig. 18. Crystal lamellar thickness, lc, over the thickness of PP1 (a), PP2 (b) and PP3 (c): 40 mm s�1 for 2 s (B), 5 mm s�1 for 16 s (,). Dashed lines indicate the position of the shearlayer.
J.-W. Housmans et al. / Polymer 50 (2009) 2304–2319 2317
conditions at the same temperature, lower than in the shear layer,and the lamellar thickness is constant. The increase of lc from thewall is faster for the samples processed at a high injection speed;stronger orientation of polymer chains and a larger decrease inentropy, results in higher temperature at which the polymer crys-tallizes and hence, thicker lamellae at the same sample position.The higher maximum lamellar thickness for the low injection speedis a result of the longer shear time, during which the melt is cooled,the chains are oriented and stretched strongly, i.e. more than in thehigh speed samples, and the lamellae are created at even highertemperatures.
For an increase in ethylene content, a decrease of lamellarthickness over the full sample width is observed, see Fig. 19, causedby crystallization at lower temperatures.
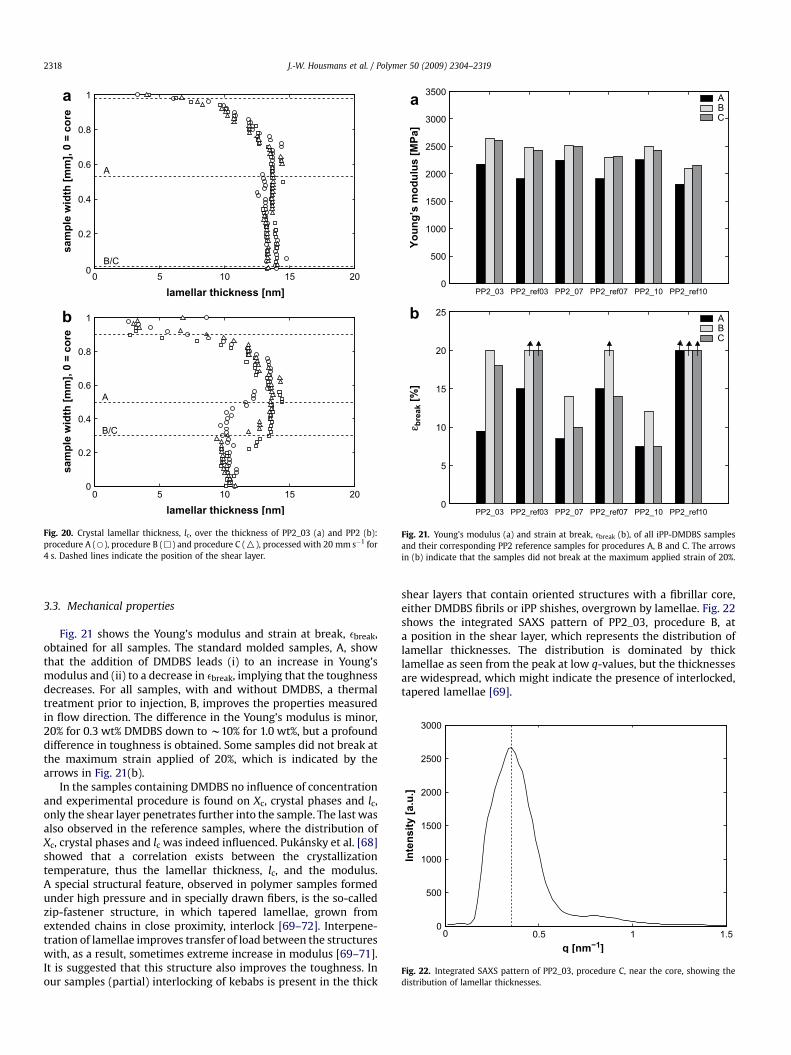
For the nucleated samples, similar to the results of crystallinityand crystal phase (Figs. 13 and 16) the lamellar thickness becomesconstant over the thickness, independent of concentration DMDBSand thermal treatment applied, see for example Fig. 20(a) forPP2_03. This shows, that DMDBS dictates the crystallizationprocess, i.e. only the presence of DMDBS, which forms the fibrillarnuclei during cooling, determines at which temperature iPPcrystallizes and flow, which orients the fibrils, does not increasethe crystallization temperature, thus lc is constant. The referencesamples of PP2 on the other hand, which got the same thermaltreatments, do show an effect of thermal treatment on thedistribution of lamellar thickness, see Fig. 20(b). The shear layerbecomes almost twice as thick, in which lc is constant (w14 nm).To summarize the comparison between pure iPP and the iPP-DMDBS samples:
� DMDBS dictates the morphology distribution (Xc, crystal pha-ses and lc) independent of thermal treatment, only the orientedshear layer thickness increases.� The reference samples of PP2 also show a thickness increase of
the shear layer when thermally treated, in which Xc and lc arehigher than in the core layer and the distribution of crystalphases is changed.
0 0.5 1 1.50
500
1000
1500
2000
2500
3000
q [nm−1
]
In
ten
sity [a.u
.]
Fig. 22. Integrated SAXS pattern of PP2_03, procedure C, near the core, showing thedistribution of lamellar thicknesses.
a
b
PP2_03 PP2_ref03 PP2_07 PP2_ref07 PP2_10 PP2_ref100
500
1000
1500
2000
2500
3000
3500
Yo
un
g’s m
od
ulu
s [M
Pa]
ABC
PP2_03 PP2_ref03 PP2_07 PP2_ref07 PP2_10 PP2_ref100
5
10
15
20
25
ε break [%
]
ABC
Fig. 21. Young’s modulus (a) and strain at break, ebreak (b), of all iPP-DMDBS samplesand their corresponding PP2 reference samples for procedures A, B and C. The arrowsin (b) indicate that the samples did not break at the maximum applied strain of 20%.
a
b
0 5 10 15 200
0.2
0.4
0.6
0.8
1
lamellar thickness [nm]
sam
ple w
id
th
[m
m], 0 =
co
re
A
B/C
0 5 10 15 200
0.2
0.4
0.6
0.8
1
lamellar thickness [nm]
sam
ple w
id
th
[m
m], 0 =
co
re
A
B/C
Fig. 20. Crystal lamellar thickness, lc, over the thickness of PP2_03 (a) and PP2 (b):procedure A (B), procedure B (,) and procedure C (O), processed with 20 mm s�1 for4 s. Dashed lines indicate the position of the shear layer.
J.-W. Housmans et al. / Polymer 50 (2009) 2304–23192318
3.3. Mechanical properties
Fig. 21 shows the Young’s modulus and strain at break, ebreak,obtained for all samples. The standard molded samples, A, showthat the addition of DMDBS leads (i) to an increase in Young’smodulus and (ii) to a decrease in ebreak, implying that the toughnessdecreases. For all samples, with and without DMDBS, a thermaltreatment prior to injection, B, improves the properties measuredin flow direction. The difference in the Young’s modulus is minor,20% for 0.3 wt% DMDBS down to w10% for 1.0 wt%, but a profounddifference in toughness is obtained. Some samples did not break atthe maximum strain applied of 20%, which is indicated by thearrows in Fig. 21(b).
In the samples containing DMDBS no influence of concentrationand experimental procedure is found on Xc, crystal phases and lc,only the shear layer penetrates further into the sample. The last wasalso observed in the reference samples, where the distribution ofXc, crystal phases and lc was indeed influenced. Pukansky et al. [68]showed that a correlation exists between the crystallizationtemperature, thus the lamellar thickness, lc, and the modulus.A special structural feature, observed in polymer samples formedunder high pressure and in specially drawn fibers, is the so-calledzip-fastener structure, in which tapered lamellae, grown fromextended chains in close proximity, interlock [69–72]. Interpene-tration of lamellae improves transfer of load between the structureswith, as a result, sometimes extreme increase in modulus [69–71].It is suggested that this structure also improves the toughness. Inour samples (partial) interlocking of kebabs is present in the thick
shear layers that contain oriented structures with a fibrillar core,either DMDBS fibrils or iPP shishes, overgrown by lamellae. Fig. 22shows the integrated SAXS pattern of PP2_03, procedure B, ata position in the shear layer, which represents the distribution oflamellar thicknesses. The distribution is dominated by thicklamellae as seen from the peak at low q-values, but the thicknessesare widespread, which might indicate the presence of interlocked,tapered lamellae [69].
J.-W. Housmans et al. / Polymer 50 (2009) 2304–2319 2319
4. Conclusions
The morphology distribution in injection molded polypropylenesamples is characterized using optical microscopy and X-raydiffraction. The influences of molecular weight and its distribution,of a change in chain composition and of nucleating agents areinvestigated. Several structural layers are found with a differentlevel of orientation. The thickness of the oriented shear layerdecreases with decreasing MW and MWD, and with an increasingamount of ethylene monomer, for the same processing conditions,while the addition of DMDBS hardly influences the layer thickness,but increases the uniformity of the structural features in the layers.The layers contain different structural objects (spherulites, shish-kebabs), resulting in changes in structural features, i.e. crystallinity,the type and amount of crystal phase and lamellar thickness. Athermal treatment prior to injection, based on the phase diagram ofthe iPP-DMDBS system, leads to an oriented morphology over thefull width of the samples, without changing Xc, crystal phases andlc. All thermally treated samples, including those without DMDBS,show a considerable improvement in mechanical properties.
Acknowledgements
This work is part of the Research Programme of the DutchPolymer Institute (DPI), P.O. Box 902, 5600 AX Eindhoven, TheNetherlands, project no. #454.
References
[1] Gahleitner M, Wolfschwenger J, Bachner C, Bernreitner K, Neissl W. Journal ofApplied Polymer Science 1996;61:649–57.
[2] Lagasse RR, Maxwell B. Polymer Engineering and Science 1976;16:189–99.[3] Keller A, Kolnaar HWH. Flow induced orientation and structure formation. In:
Meijer HEH, editor. Processing ofpolymers, vol.18. New York: VCH; 1997. p.189–268.[4] Vleeshouwers S, Meijer HEH. Rheologica Acta 1996;35:391–9.[5] Somani RH, Hsiao BS, Nogales A, Srinivas S, Tsou AH, Sics I, et al. Macromol-
ecules 2000;33:9385–94.[6] SekiM,ThurmanDW,OberhauserJP,KornfieldJA.Macromolecules2002;35:2583–94.[7] Vega JF, Hristova DG, Peters GWM. Journal of Thermal Analysis and Calori-
metry, special issue, in press.[8] Liedauer S, Eder G, Janeschitz-Kriegl H, Jerschow P, Geymayer W, Ingolic E.
International Polymer Processing 1993;VIII:236–44.[9] Kumaraswamy G, Issaian AM, Kornfield JA. Macromolecules 1999;32:7537–47.
[10] Kumuraswamy G, Verma RK, Issaian AM, Wang P, Kornfield JA, Yeh F, et al.Polymer 2000;41:8931–40.
[11] Baert J, Van Puyvelde P. Polymer 2006;47:5871–9.[12] Baert J, Van Puyvelde P, Langouche F. Macromolecules 2006;39:9215–22.[13] Schrauwen BAG. Ph.D. thesis, Eindhoven University of Technology, The
Netherlands; 2003.[14] Muratoglu OK, Argon AS, Cohen RE, Weinberg M. Polymer 1995;36:921–30.[15] Ergungor Z, Cakmak M, Batur C. Macromolecular Symposia 2002;185:259–76.[16] Kristiansen M, Werner M, Tervoort T, Smith P, Blomenhofer M, Schmidt HW.
Macromolecules 2003;36:5150–6.[17] Kristiansen M, Tervoort T, Smith P, Goossens H. Macromolecules 2005;
38:10461–5.[18] Balzano L, Rastogi S, Peters GWM. Macromolecules 2008;41:399–408.[19] Balzano L, Portale G, Peters GWM, Rastogi S. Macromolecules 2008;41:5350–5.[20] Gahleitner M, Jaaskelainen P, Ratajski E, Paulik C, Reussner J, Wolfschwenger J,
et al. Journal of Applied Polymer Science 2005;95:1073–81.[21] Housmans JW, Peters GWM, Meijer HEH. Journal of Thermal Analysis and
Calorimetry, special issue, in press.[22] Yalcin B, Cakmak M. Polymer 2004;45:2691–710.[23] US Patent 133229, Patented November 19, 1872.[24] Custodio FJMF. Ph.D. thesis, Eindhoven University of Technology, The
Netherlands; 2009.[25] Custodio FJMF. PhD Thesis. Eindhoven University of Technology, The
Netherlands; 2009.
[26] Thierry A, Fillon B, Straupe C, Lotz B, Wittmann JC. Progress in Colloid andPolymer Science 1992;87:28–31.
[27] Shepard TA, Delsorbo CR, Louth RM, Walborn JL, Norman DA, Harvey NG, et al.Journal of Polymer Science, Part B: Polymer Physics 1997;35:2617–28.
[28] Swartjes FHM. Ph.D. thesis, Eindhoven University of Technology, TheNetherlands; 2001.
[29] Swartjes FHM, Peters GWM, Rastogi S, Meijer HEH. International PolymerProcessing 2003;XVIII:53–66.
[30] van der Beek MHE. PhD Thesis, Eindhoven University of Technology, TheNetherlands; 2005.
[31] van der Beek MHE, Peters GWM, Meijer HEH. International Polymer Pro-cessing 2005;XX:111–20.
[32] van der Beek MHE, Peters GWM, Meijer HEH. Macromolecules 2006;39:1805–14.
[33] van der Beek MHE, Peters GWM, Meijer HEH. Macromolecules 2006;39:9278–84.[34] Forstner R, Rendina C, Housmans JW, Peters GWM, Meijer HEH. Journal of
Thermal Analysis and Calorimetry, special issue, in press.[35] Housmans JW. PhD Thesis. Eindhoven University of Technology, The
Netherlands; 2008.[36] Zuidema H, Peters GWM, Meijer HEH. Macromolecular Theory and Simula-
tions 2001;10:447–60.[37] Zuidema H, Peters GWM, Meijer HEH. Journal of Applied Polymer Science
2001;82:1170–86.[38] Ulcer Y, Cakmak M, Miao J, Hsiung CM. Journal of Applied Polymner Science
1996;60:669–91.[39] van de Burgt FPTJ, Rastogi S, Chadwick JC, Rieger B. Journal of Macromolecular
Science, Part B; Physics 2002;B41:1091–104.[40] van der Burgt FPTJ. PhD Thesis, Eindhoven University of Technology, The
Netherlands; 2002.[41] Norton DR, Keller A. Polymer 1985;26:704–16.[42] Lotz B, Wittmann JC. Journal of Polymer Science, Part B; Polymer Physics
1986;24:1541–58.[43] Lovinger AJ, Chua JO, Gryte CC. Journal of Polymer Science Polymer Physics
Edition 1977;15:641–56.[44] Varga J, Karger-Kocsis J. Polymer Bulletin 1993;30:105–10.[45] Varga J, Karger-Kocsis J. Journal of Polymer Science, Part B: Polymer Physics
1996;34:657–70.[46] Jay F, Haudin JM, Monasse B. Journal of Materials Science 1999;34:2089–102.[47] Varga J, Mudra I, Ehrenstein GW. Journal of Applied Polymer Science
1999;74:2357–68.[48] Mathieu C, Thierry A, Wittmann JC, Lotz B. Journal of Polymer Science, Part B:
Polymer Physics 2002;40:2504–15.[49] Marco C, Gomez MA, Ellis G, Arribas JM. Journal of Applied Polymer Science
2002;86:531–9.[50] Alamo RG, Kim MH, Galante MJ, Isasi JR, Mandelkern L. Macromolecules
1999;32:4050–64.[51] Lotz B, Graff S, Straupe C, Wittmann JC. Polymer 1991;32:2902–10.[52] Foresta T, Piccarolo S, Goldbeck-Wood G. Polymer 2001;42:1167–76.[53] Nakafuku C. Polymer 1981;22:1673–6.[54] Bruckner S, Meille SV, Petraccone V, Pirozzi B. Progress in Polymer Science
1991;16:361–404.[55] Mark JE. New York: AIP Press; 1996. p. 409–15 [chapter 30].[56] Kalay G, Zhong Z, Allan P, Bevis MJ. Polymer 1996;37:2077–85.[57] Turner-Jones A, Aizlewood JM, Beckett DR. Makromolekulare Chemie
1964;75:134–54.[58] Somani RH, Hsiao BS, Nogales A, Fruitwala H, Srinavas S, Tsou AH. Macro-
molecules 2001;34:5902–9.[59] Turner-Jones A. Polymer 1971;12:487–508.[60] Brucato V, Piccarolo S, La Carrubba V. Chemical Engineering Science 2002;57:
4129–43.[61] Corradini P, Petraccone V, De Rosa C, Guerra G. Macromolecules 1986;19:
2699–703.[62] Schrauwen BAG, van Breemen LCA, Spoelstra AB, Govaert LE, Peters GWM,
Meijer HEH. Macromolecules 2004;37:8618–33.[63] Fujiyama M, Wakino T. Journal of Applied Polymer Science 1991;43:57–81.[64] Laihonen S, Gedde UW, Werner PE, Matrinez-Salazar J. Polymer 1997;38:
361–9.[65] Laihonen S, Gedde UW, Werner PE, Matrinez-Salazar J. Polymer 1997;38:
371–7.[66] Guinier A, Fournet G. Small-angle scattering of X-rays. New York: Wiley; 1955.[67] Chen HB, Karger-Kocsis J, Wu JS, Varga J. Polymer 2002;43:6505–14.[68] Pukanszky B, Mudra I, Staniek P. Polymer 1997;19:617–26.[69] Odell JA, Grubb DT, Keller A. Polymer 1978;19:617–26.[70] Bashir Z, Odell JA, Keller A. Journal of Materials Science 1984;19:3713–25.[71] Bashir Z, Odell JA, Keller A. Journal of Materials Science 1986;21:3993–4002.[72] Hobbs JK, Humphris ADL, Miles MJ. Macromolecules 2001;34:5508–19.
Related Documents