Structure-specific statistical mapping of white matter tracts Paul A. Yushkevich, a, ⁎ Hui Zhang, a Tony J. Simon, b and James C. Gee a a Penn Image Computing and Science Laboratory (PICSL), Department of Radiology, University of Pennsylvania, Philadelphia, PA, USA b Department of Psychiatry and Behavioral Sciences, M.I.N.D. Institute, University of California, Davis, CA, USA Received 13 September 2007; revised 27 November 2007; accepted 5 January 2008 Available online 26 January 2008 We present a new model-based framework for the statistical analysis of diffusion imaging data associated with specific white matter tracts. The framework takes advantage of the fact that several of the major white matter tracts are thin sheet-like structures that can be effectively modeled by medial representations. The approach involves segmenting major tracts and fitting them with deformable geometric medial models. The medial representation makes it possible to average and combine tensor-based features along directions locally perpendicular to the tracts, thus reducing data dimensionality and accounting for errors in normalization. The framework enables the analysis of individual white matter structures, and provides a range of possibilities for computing statistics and visualizing differences between cohorts. The framework is demonstrated in a study of white matter differences in pediatric chromosome 22q11.2 deletion syndrome. © 2008 Elsevier Inc. All rights reserved. Keywords: Diffusion tensor imaging; Statistical mapping; White matter; DS22q11.2; Medial representation; Skeletons; Deformable models Introduction In recent years there has been increased interest in neuroimaging statistical mapping techniques that are structure-specific. The under- lying belief is that analysis that takes into account the unique properties of specific anatomical structures and focuses its attention on these structures can be more sensitive than analysis performed over the whole brain. Furthermore, analysis that restricts its attention to structures of interest produces inferences that are also structure- specific. Such inferences can be communicated and visualized more effectively than whole-brain results, since they can be described and presented in the context of well-known structures. Thus, for instance, a significant cluster at the tail of the hippocampus is easier to describe and visualize than a cluster at a certain position in Talairach space. Another key feature of structure-specific analysis is the ability to combine or average data along anatomically meaningful directions while respecting the boundaries between structures, as opposed to uniform smoothing over the whole brain. Structure-specific analysis requires a suitable representation for the anatomical structures of interest, and the main aim of this paper is to provide a representation that is particularly well-suited for analyzing white matter structures in diffusion MRI studies. White matter tracts (fasciculi) are thin, sheet-like or tube-like structures, and as such can be effectively described using skeletons. This fact is leveraged in the tract-based spatial statistics (TBSS) approach (Smith et al., 2006) although, in that approach, skeletons are derived for the entire white matter region and no distinction between white matter structures is made. In this paper we propose to use the continuous medial representation (cm-rep) (Yushkevich et al., 2006b) to model individual white matter tracts. The advantage of using cm-reps, as opposed to skeletonization, is that the skeleton of the structure of interest is represented by a parametric surface. A parametric representation of the skeleton allows us to perform manifold-based statistical analyses similar to those used in cortical flat-mapping (e.g., Thompson et al., 2001; Fischl et al., 1999). One of the main motivations for representing white matter tracts using parametric geometrical models is to offer an alternative to smoothing in situations where it is necessary to increase the sensitivity of statistical analysis at the cost of specificity. Whereas isotropic smoothing reduces the locality of detectable statistical differences equally in all directions, geometrical models provide a way to combine and collapse data in the context of the structure of interest, making it possible to reduce the locality along “less interesting” directions while maintaining specificity along the directions that are more meaningful. One way to apply such shape- based averaging is to reduce the dimensionality of a volumetric dataset to a two-manifold that is representative of the overall shape of the dataset. For thin structures, the skeleton is an ideal manifold onto which to project volumetric data because the skeleton captures the overall shape of the structure. In this paper, the new structure-specific analysis framework is used to model major fasciculi with sheet-like geometry: the corpus www.elsevier.com/locate/ynimg NeuroImage 41 (2008) 448 – 461 ⁎ Corresponding author. 3600 Market St., Ste 370, Philadelphia, PA 19104, USA. E-mail address: [email protected] (P.A. Yushkevich). Available online on ScienceDirect (www.sciencedirect.com). 1053-8119/$ - see front matter © 2008 Elsevier Inc. All rights reserved. doi:10.1016/j.neuroimage.2008.01.013

Welcome message from author
This document is posted to help you gain knowledge. Please leave a comment to let me know what you think about it! Share it to your friends and learn new things together.
Transcript
www.elsevier.com/locate/ynimg
NeuroImage 41 (2008) 448–461Structure-specific statistical mapping of white matter tracts
Paul A. Yushkevich,a,⁎ Hui Zhang,a Tony J. Simon,b and James C. Geea
a Penn Image Computing and Science Laboratory (PICSL), Department of Radiology, University of Pennsylvania, Philadelphia, PA, USAb Department of Psychiatry and Behavioral Sciences, M.I.N.D. Institute, University of California, Davis, CA, USA
Received 13 September 2007; revised 27 November 2007; accepted 5 January 2008Available online 26 January 2008
We present a new model-based framework for the statistical analysis ofdiffusion imaging data associated with specific white matter tracts. Theframework takes advantage of the fact that several of the major whitematter tracts are thin sheet-like structures that can be effectivelymodeled by medial representations. The approach involves segmentingmajor tracts and fitting them with deformable geometric medialmodels. The medial representation makes it possible to average andcombine tensor-based features along directions locally perpendicularto the tracts, thus reducing data dimensionality and accounting forerrors in normalization. The framework enables the analysis ofindividual white matter structures, and provides a range of possibilitiesfor computing statistics and visualizing differences between cohorts.The framework is demonstrated in a study of white matter differencesin pediatric chromosome 22q11.2 deletion syndrome.© 2008 Elsevier Inc. All rights reserved.
Keywords: Diffusion tensor imaging; Statistical mapping; White matter;DS22q11.2; Medial representation; Skeletons; Deformable models
Introduction
In recent years there has been increased interest in neuroimagingstatistical mapping techniques that are structure-specific. The under-lying belief is that analysis that takes into account the uniqueproperties of specific anatomical structures and focuses its attentionon these structures can bemore sensitive than analysis performed overthe whole brain. Furthermore, analysis that restricts its attention tostructures of interest produces inferences that are also structure-specific. Such inferences can be communicated and visualized moreeffectively than whole-brain results, since they can be described andpresented in the context of well-known structures. Thus, for instance,a significant cluster at the tail of the hippocampus is easier to describe
⁎ Corresponding author. 3600 Market St., Ste 370, Philadelphia, PA19104, USA.
E-mail address: [email protected] (P.A. Yushkevich).Available online on ScienceDirect (www.sciencedirect.com).
1053-8119/$ - see front matter © 2008 Elsevier Inc. All rights reserved.doi:10.1016/j.neuroimage.2008.01.013
and visualize than a cluster at a certain position in Talairach space.Another key feature of structure-specific analysis is the ability tocombine or average data along anatomically meaningful directionswhile respecting the boundaries between structures, as opposed touniform smoothing over the whole brain.
Structure-specific analysis requires a suitable representation forthe anatomical structures of interest, and the main aim of this paperis to provide a representation that is particularly well-suited foranalyzing white matter structures in diffusion MRI studies. Whitematter tracts (fasciculi) are thin, sheet-like or tube-like structures,and as such can be effectively described using skeletons. This fact isleveraged in the tract-based spatial statistics (TBSS) approach(Smith et al., 2006) although, in that approach, skeletons are derivedfor the entire white matter region and no distinction between whitematter structures is made. In this paper we propose to use thecontinuous medial representation (cm-rep) (Yushkevich et al.,2006b) to model individual white matter tracts. The advantage ofusing cm-reps, as opposed to skeletonization, is that the skeleton ofthe structure of interest is represented by a parametric surface. Aparametric representation of the skeleton allows us to performmanifold-based statistical analyses similar to those used in corticalflat-mapping (e.g., Thompson et al., 2001; Fischl et al., 1999).
One of the main motivations for representing white matter tractsusing parametric geometrical models is to offer an alternative tosmoothing in situations where it is necessary to increase thesensitivity of statistical analysis at the cost of specificity. Whereasisotropic smoothing reduces the locality of detectable statisticaldifferences equally in all directions, geometrical models provide away to combine and collapse data in the context of the structure ofinterest, making it possible to reduce the locality along “lessinteresting” directions while maintaining specificity along thedirections that are more meaningful. One way to apply such shape-based averaging is to reduce the dimensionality of a volumetricdataset to a two-manifold that is representative of the overall shapeof the dataset. For thin structures, the skeleton is an ideal manifoldonto which to project volumetric data because the skeletoncaptures the overall shape of the structure.
In this paper, the new structure-specific analysis framework isused to model major fasciculi with sheet-like geometry: the corpus

449P.A. Yushkevich et al. / NeuroImage 41 (2008) 448–461
callosum (CC), corticospinal tract (CST), inferior longitudinalfasciculus (ILF), superior longitudinal fasciculus (SLF), inferiorfronto-occipital fasciculus (IFO) and uncinate fasciculus (UNC).The framework is demonstrated by application to statisticalmapping of white matter tracts in chromosome 22q11.2 deletionsyndrome (DS22q11.2), which encompasses most cases ofDiGeorge and Velocardiofacial syndromes amongst others. Clusteranalysis performed on the medial surfaces of white matter tractsyields a number of statistically significant findings indicating thatDS22q11.2 is associated with bilateral differences in diffusivity inthree of the fasciculi Simon et al. (2005).
The paper is organized as follows. Background section reviewscurrent approaches to white matter analysis and motivates themedial-based structure-specific mapping framework. The methodsemployed by the framework, including atlas-building, modelinitialization, fitting and statistical analysis, are described inMaterials and methods section. A demonstration of the methodin the context of the DS22q11.2 study is presented in Resultssection. The discussion in Discussion and conclusions sectionfocuses on the next steps in the implementation of the structure-specific analysis framework, such as direct automatic fitting ofmedial tract models to diffusion tensor imaging (DTI) data.
Background
The traditional approach to structure-specific analysis of diffusionimaging data has been to identify regions of interest and integratediffusion-based measurements over these regions, forming a smallnumber of statistical features (Horsfield and Jones, 2002). The adventof fiber tracking algorithms (Mori and van Zijl, 2002) has made itpossible to map out DTI-based statistical features along the length offiber bundles. A number of authors (Jones et al., 2005b; Corougeet al., 2006; Lin et al., 2006; Maddah et al., 2007) identify bundles offibers with similar shape and make inferences on the basis of bundlecenterlines; this approach is well-suited for tubular structures, butlarger sheet-like structures like the corpus callosum have to be dividedinto several tubular bundles. Our approach is designed to analyzesheet-like structures as a whole, and is highly complementary tobundle-based methods: one could use our models for sheet-likefasciculi and bundle-based analysis for tube-like fasciculi.
Cascio et al. (2006) and Sun et al. (In press) collapse DTI-derived features onto the midsagittal cross-section of the corpuscallosum and perform analysis in this two-dimensional space. Suchstructure-specific approaches are powerful because they takeadvantage of the specific geometry of the corpus callosum.However, the dimensionality reduction accomplished by thesemethods is very distinct from our approach: in the former, DTI dataare averaged or combined along the length of fibers and projectedonto a flat region on the midsagittal plane, while in our approachthis data is collapsed onto a manifold representative of the overallshape of a white matter tract.
Another approach to white matter analysis involves adaptingvoxel-based and deformation-based morphometry (Ashburner andFriston, 2000) to diffusion data.Whole-brain morphometry is tailoredfor exploratory analysis, and serves different needs than structure-specific methods. A common approach is to normalize the subjects'structural images (T1, T2, or in some cases, fractional anisotropy (FA)images derived from diffusion-weighted MRI) to a standard whole-brain template (e.g., (Eriksson et al., 2001)). More recently,specialized deformable registration methods for diffusion data havebeen developed (Zhang et al., 2006; Cao et al., 2005). Voxel-based
morphometry in DTI has been applied in a large number of studies.One of the concerns raised about the standard VBM approach in DTIdata is that structure boundaries and within-structure directionalinformation are not taken into account during smoothing and analysis(Jones et al., 2005a). The tract-based spatial statistics (TBSS)framework for DTI morphometry addresses this limitation byincorporating the geometric properties of white matter tracts in theanalysis. This is achieved by using registration to compute a “meanFA” image, thresholding this image, computing the skeleton of thethresholded region, projecting the subjects' FA values onto theskeleton, and performing statistical analysis on the skeleton. TBSSleverages the fact that the skeleton is a natural representation for whitematter structures, which are thin sheet-like or tube-like objects. One ofthe limitations, however, is that by operating on the mean FA image,TBSS ignores orientation information, which can lead to fasciculi thathave different orientation but similar anisotropy being combinedtogether into a single structure. Thus the skeleton computed by TBSSmay not correspond to the skeletons of the individual fasciculi at suchlocations. Recent work by Kindlmann et al. (2007) overcomes thislimitation to some extent by formulating a way to automatically detectsurfaces that separate adjacent fasciculi with differing fiber orienta-tions, and providing a way to estimate the skeletons of adjacentfasciculi separately.
Our paper also represents white matter structures medially.However, unlike TBSS, we use medial models to represent specificwhite matter structures of interest, rather than all of white matter. Inorder to distinguish between adjacent tracts, we derive segmenta-tions of individual fasciculi using fiber tractography. The use ofparametric me-2 dial models with predefined topology simplifiesstatistical analysis and makes it possible for the rich collection ofstatistical tools and visualization approaches developed in thecortical flat-mapping literature to be applied to white matter studies.This is illustrated by the manifold-based cluster analysis presented atthe end of this paper.
Materials and methods
Analysis framework overview
The main aim of this paper is to give a proof-of-conceptdemonstration of a new model-based framework for representingmajor fasciculi and analyzing associated DTI data. This frameworkincludes three main components: segmentation, modeling andstatistical analysis. These components leverage prior work in atlas-based segmentation, deformablemedialmodeling and non-parametricstatistical analysis. Prior to describing these components in detail, wenote that alternative approaches to each of them are available andemphasize that the focus of this paper is on demonstrating theframework as a whole rather than on the implementation of each of itscomponents.
In the current implementation, segmentation, modeling andanalysis all take place in atlas space. That is, all DTI images in astudy are normalized to a common atlas, which is derived from theimages themselves. Working in atlas space facilitates the segmenta-tion and modeling of white matter structures. An alternative,discussed in Discussion and conclusions section, is to performsegmentation, modeling and analysis in subject space. The maindifference between these approaches is in the way that inter-subjectcorrespondences are computed: on the basis of image-based normal-ization in the atlas-based approach, or on the basis of shape in subject-space analysis.

Fig. 1. Three orthogonal views through the right CST in the white matter atlas constructed from 31 subjects (13 children with DS22q11.2 and 18 typicallydeveloping children). The standard color-coding scheme for visualizing the principal direction of diffusion is used: red for left–right, green for anterior–posteriorand blue for inferior –superior. The intensity is scaled by FA.
Fig. 2. Two-dimensional diagram of medial geometry. The red curverepresents the medial surface (skeleton)m. The circle has radius R, given bythe radial scalar field on m. The boundary, shown in blue, consists of twoparts, b+ and b−, derived from the skeleton and radial scalar field by inverseskeletonization (1). The vectorjmR lies in the tangent plane ofm and pointsin the direction of greatest change in R. The arrows pointing fromm to b+ andb− are called spokes.
450 P.A. Yushkevich et al. / NeuroImage 41 (2008) 448–461
Normalization to a DTI atlas
The DTI atlas is constructed by normalizing all DTI images in astudy to a common average image. A number of techniques forcomputing an unbiased average image from a cohort of imageshave been proposed (Thompson and Toga, 1997; Guimond et al.,2000; Joshi et al., 2004; Avants and Gee, 2004). We use a similarapproach (Zhang et al., 2007) that leverages a new deformable DTIregistration algorithm (Zhang et al., 2006), in which imagesimilarity is computed on the basis of full tensor images, ratherthan scalar features. When measuring similarity between tensorimages, it is essential to take into account the fact that when atransformation is applied to a tensor field, the orientation of thetensors is changed (Alexander et al., 2001). A unique property ofour registration algorithm is the ability to model the effect ofdeformation on tensor orientation as an analytic function of theJacobian matrix of the deformation field. By using full tensorinformation in the similarity metric, the method aligns white matterregions better than scalar-based registration methods, as demon-strated by Zhang et al. (In press) in a task-driven evaluation study.
When building the atlas, the initial average image is computedas a log-Euclidean mean (Arsigny et al., 2006) of the inputdiffusion tensor images. The average is then iteratively refined byrepeating the following procedure: register the subject images tothe current average, then compute a refined average for the nextiteration as the Euclidean mean of the normalized images. Thisprocedure is repeated until the average image converges.
To allow asymmetry analysis and to simplify the modeling ofbilateral fasciculi, a symmetric average is constructed by simplyapplying the above averaging procedure to the non-symmetricpopulation average and its mirror image across the midsagittalplane (the midsagittal plane is estimated automatically by solving athree-parameter rigid registration problem, similar to (Ardekaniet al., 1997)). The images of the subjects are then registered to thesymmetric average. The combination of the symmetric averageimage and the warps from the average to each of the subject's DTIimages forms the symmetric DTI atlas. This atlas captures thecorrespondences between the white matter regions of differentsubjects as well as between left and right hemispheres of eachsubject.
Tract segmentation
Six major fasciculi (CC, CST, IFO, ILF, SLF, UNC) weresegmented in the white matter atlas using an established protocolby Wakana et al. (2004), which is based on fiber tracking. TheFACT fiber tracking algorithm (Mori et al., 1999) was applied to
the DTI white matter atlas with the FA threshold of 0.15 and aninner product threshold of 0.7, which prevents angles larger than45° during tracking. A fiber was tracked from the center of anyvoxel with a FAN0.2. Fibers of interest were extracted using amultiple region of interest (ROI) based approach (Conturo et al.,1999; Mori et al., 2002). Two types of ROIs were defined: thosethrough which all fibers in a tract must pass, and those throughwhich none of the fibers may pass. Since in this paper, a 2Dmanifold-based model of fasciculi is employed, only thosefasciculi that have a major portion that is sheet-like weresegmented. Fasciculi that are more appropriately represented bytubular models, such as the tapetum of the CC, the cingulum, thefornix and the optic tract were not segmented. Fasciculi in thecerebellum and brain stem were not considered either. Only thearcuate portion of the SLF, which can be tracked consistently, wassegmented. Binary 3D segmentations of individual fasciculi weregenerated by labeling voxels in the white matter atlas throughwhich at least one fiber passed. The binary segmentations werefurther edited using ITK-SNAP (Yushkevich et al., 2006a) byone of the authors (HZ) to remove extraneous connections: theportion of the CST extending to the cerebellum was removed;regions that cannot be disambiguated between CC and CSTwere attributed to both structures. The second column of Fig. 4shows the binary segmentations for the six selected fasciculi.
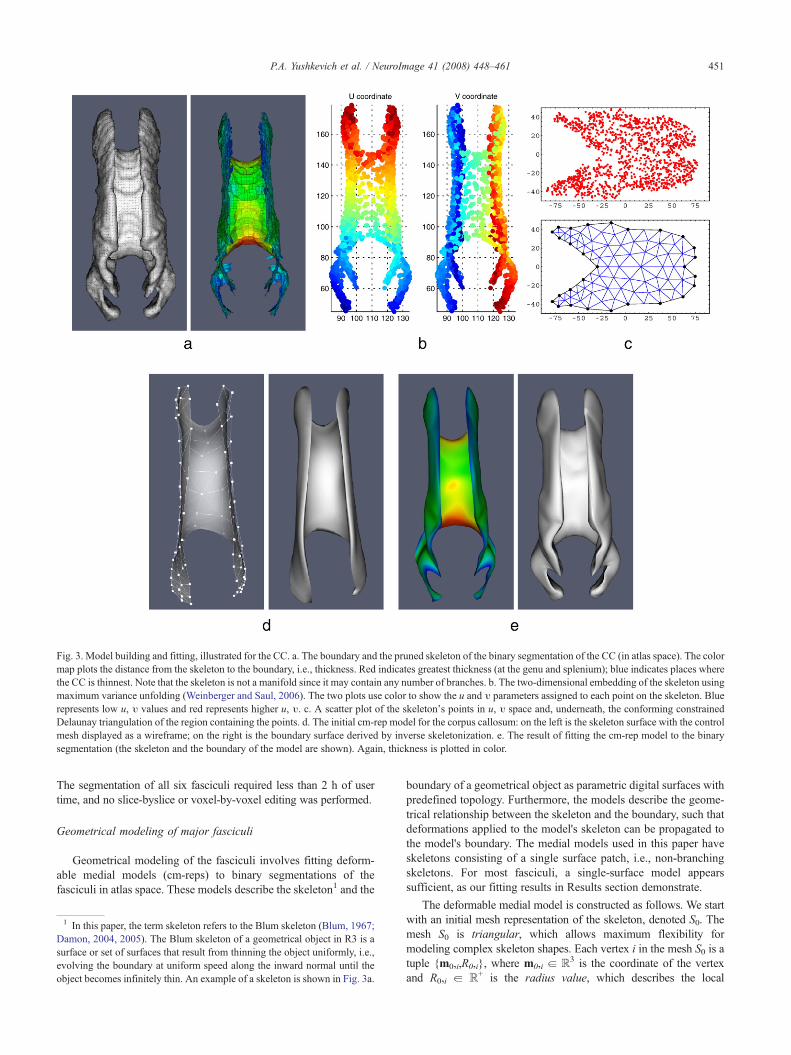
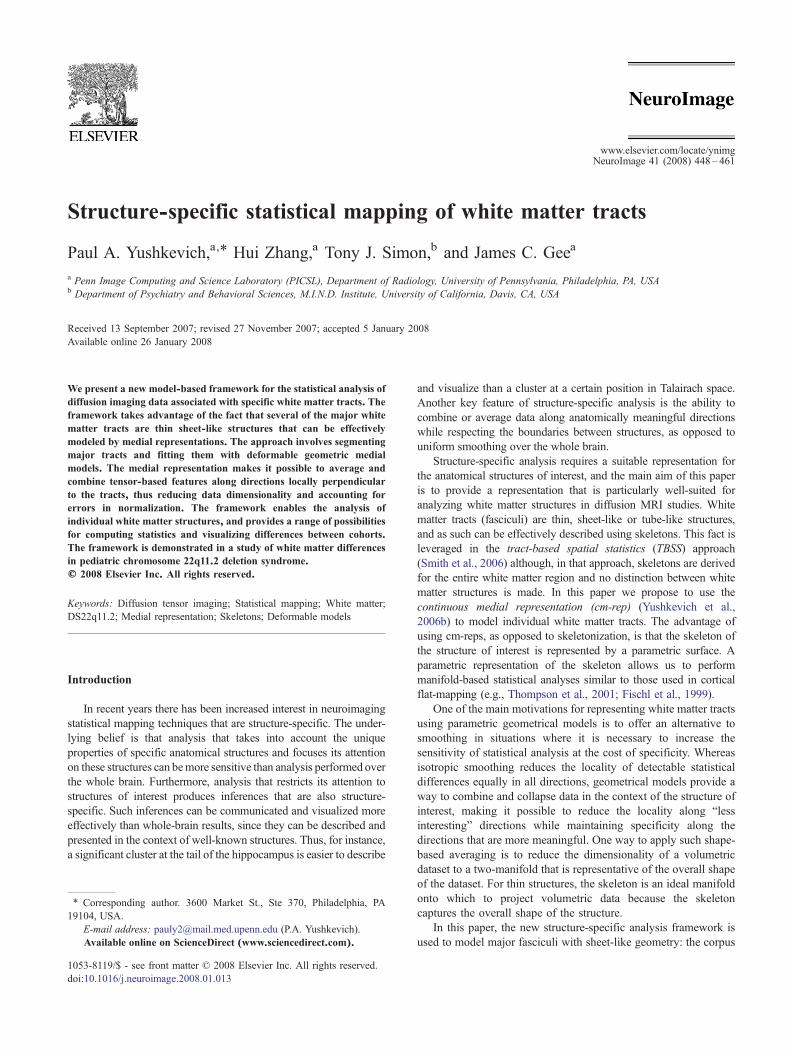
Fig. 3. Model building and fitting, illustrated for the CC. a. The boundary and the pruned skeleton of the binary segmentation of the CC (in atlas space). The colormap plots the distance from the skeleton to the boundary, i.e., thickness. Red indicates greatest thickness (at the genu and splenium); blue indicates places wherethe CC is thinnest. Note that the skeleton is not a manifold since it may contain any number of branches. b. The two-dimensional embedding of the skeleton usingmaximum variance unfolding (Weinberger and Saul, 2006). The two plots use color to show the u and υ parameters assigned to each point on the skeleton. Bluerepresents low u, υ values and red represents higher u, υ. c. A scatter plot of the skeleton's points in u, υ space and, underneath, the conforming constrainedDelaunay triangulation of the region containing the points. d. The initial cm-rep model for the corpus callosum: on the left is the skeleton surface with the controlmesh displayed as a wireframe; on the right is the boundary surface derived by inverse skeletonization. e. The result of fitting the cm-rep model to the binarysegmentation (the skeleton and the boundary of the model are shown). Again, thickness is plotted in color.
451P.A. Yushkevich et al. / NeuroImage 41 (2008) 448–461
The segmentation of all six fasciculi required less than 2 h of usertime, and no slice-byslice or voxel-by-voxel editing was performed.
Geometrical modeling of major fasciculi
Geometrical modeling of the fasciculi involves fitting deform-able medial models (cm-reps) to binary segmentations of thefasciculi in atlas space. These models describe the skeleton1 and the
1 In this paper, the term skeleton refers to the Blum skeleton (Blum, 1967;Damon, 2004, 2005). The Blum skeleton of a geometrical object in R3 is asurface or set of surfaces that result from thinning the object uniformly, i.e.,evolving the boundary at uniform speed along the inward normal until theobject becomes infinitely thin. An example of a skeleton is shown in Fig. 3a.
boundary of a geometrical object as parametric digital surfaces withpredefined topology. Furthermore, the models describe the geome-trical relationship between the skeleton and the boundary, such thatdeformations applied to the model's skeleton can be propagated tothe model's boundary. The medial models used in this paper haveskeletons consisting of a single surface patch, i.e., non-branchingskeletons. For most fasciculi, a single-surface model appearssufficient, as our fitting results in Results section demonstrate.
The deformable medial model is constructed as follows. We startwith an initial mesh representation of the skeleton, denoted S0. Themesh S0 is triangular, which allows maximum flexibility formodeling complex skeleton shapes. Each vertex i in the mesh S0 is atuple {m0,i,R0,i}, where m0,i a R3 is the coordinate of the vertexand R0,i a R+ is the radius value, which describes the local
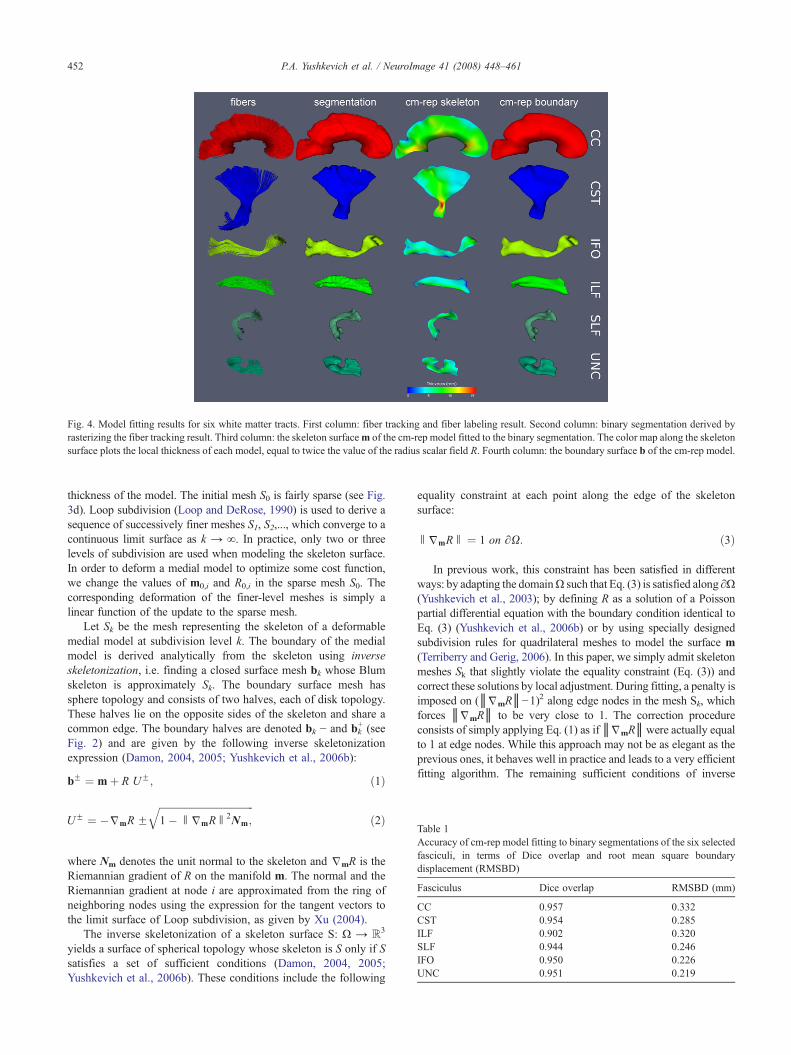
Fig. 4. Model fitting results for six white matter tracts. First column: fiber tracking and fiber labeling result. Second column: binary segmentation derived byrasterizing the fiber tracking result. Third column: the skeleton surfacem of the cm-rep model fitted to the binary segmentation. The color map along the skeletonsurface plots the local thickness of each model, equal to twice the value of the radius scalar field R. Fourth column: the boundary surface b of the cm-rep model.
Table 1Accuracy of cm-rep model fitting to binary segmentations of the six selectedfasciculi, in terms of Dice overlap and root mean square boundarydisplacement (RMSBD)
Fasciculus Dice overlap RMSBD (mm)
CC 0.957 0.332CST 0.954 0.285ILF 0.902 0.320SLF 0.944 0.246IFO 0.950 0.226UNC 0.951 0.219
452 P.A. Yushkevich et al. / NeuroImage 41 (2008) 448–461
thickness of the model. The initial mesh S0 is fairly sparse (see Fig.3d). Loop subdivision (Loop and DeRose, 1990) is used to derive asequence of successively finer meshes S1, S2,..., which converge to acontinuous limit surface as k → ∞. In practice, only two or threelevels of subdivision are used when modeling the skeleton surface.In order to deform a medial model to optimize some cost function,we change the values of m0,i and R0,i in the sparse mesh S0. Thecorresponding deformation of the finer-level meshes is simply alinear function of the update to the sparse mesh.
Let Sk be the mesh representing the skeleton of a deformablemedial model at subdivision level k. The boundary of the medialmodel is derived analytically from the skeleton using inverseskeletonization, i.e. finding a closed surface mesh bk whose Blumskeleton is approximately Sk. The boundary surface mesh hassphere topology and consists of two halves, each of disk topology.These halves lie on the opposite sides of the skeleton and share acommon edge. The boundary halves are denoted bk − and bk
+ (seeFig. 2) and are given by the following inverse skeletonizationexpression (Damon, 2004, 2005; Yushkevich et al., 2006b):
bF ¼ mþ R UF; ð1Þ
UF ¼ �jmR Fffiffiffiffiffiffiffiffiffiffiffiffiffiffiffiffiffiffiffiffiffiffiffiffiffiffiffiffiffiffiffiffiffiffiffiffiffiffi1�OjmRO
2Nm;
qð2Þ
where Nm denotes the unit normal to the skeleton and jmR is theRiemannian gradient of R on the manifold m. The normal and theRiemannian gradient at node i are approximated from the ring ofneighboring nodes using the expression for the tangent vectors tothe limit surface of Loop subdivision, as given by Xu (2004).
The inverse skeletonization of a skeleton surface S: Ω → R3
yields a surface of spherical topology whose skeleton is S only if Ssatisfies a set of sufficient conditions (Damon, 2004, 2005;Yushkevich et al., 2006b). These conditions include the following
equality constraint at each point along the edge of the skeletonsurface:
OjmRO ¼ 1 on AX: ð3Þ
In previous work, this constraint has been satisfied in differentways: by adapting the domainΩ such that Eq. (3) is satisfied along ∂Ω(Yushkevich et al., 2003); by defining R as a solution of a Poissonpartial differential equation with the boundary condition identical toEq. (3) (Yushkevich et al., 2006b) or by using specially designedsubdivision rules for quadrilateral meshes to model the surface m(Terriberry and Gerig, 2006). In this paper, we simply admit skeletonmeshes Sk that slightly violate the equality constraint (Eq. (3)) andcorrect these solutions by local adjustment. During fitting, a penalty isimposed on (║jmR║−1)2 along edge nodes in the mesh Sk, whichforces ║jmR║ to be very close to 1. The correction procedureconsists of simply applying Eq. (1) as if║jmR║were actually equalto 1 at edge nodes. While this approach may not be as elegant as theprevious ones, it behaves well in practice and leads to a very efficientfitting algorithm. The remaining sufficient conditions of inverse

Fig. 5. Left: fiber tracking results for the six selected fasciculi. Right: skeletons of the cm-rep models fitted to the six fasciculi.
453P.A. Yushkevich et al. / NeuroImage 41 (2008) 448–461
skeletonization are inequality constraints and are handled in this paperthe sameway as in (Yushkevich et al., 2006b), i.e., by using additionalpenalty terms during model fitting.
Now, as we apply deformations to the nodes of the sparse-levelskeleton S0, we can use inverse skeletonization to generate aboundary of the medial model at subdivision level k. Furthermore,the correspondence between points on the skeleton and boundarypoints established by Eq. (1) allows us to parameterize the regionenclosed by the boundary, as discussed in Shape-based coordinatesystem section. Overlap between the medial model and a binaryimage can be computed efficiently. Thus, fitting a model to abinary segmentation of a fasciculus is an optimization problemwhere overlap between the model's interior and the segmentation ismaximized and the penalty terms required for inverse skeletoniza-
Fig. 6. Visual assessment of registration accuracy. Each plot above shows a coronexcept for the last plot, which shows the atlas itself. The projection of the medial moThese curves are exactly the same across all nine plots and are provided as a refe
tion to be well-posed are minimized. Model fitting is discussed ingreater detail in (Yushkevich et al., 2006b).
Automatic model building for initialization
Prior to fitting a deformable medial model to a target structure,an initial model must be generated. While it is possible to beginwith a simple stock model, the freedom to choose an arbitrarydomain Ω makes it possible to build data-driven initial models.With the freedom to define cm-reps over arbitrary domains comesthe problem of finding the right domain and the right meshconfiguration for a particular anatomical structure. We accomplishthis by essentially flattening the skeleton of the structure, underconstraints that minimize local distortion.
al slice through one of the subjects' DTI images registered to the DTI atlas,dels of the fasciculi into the cut plane are shown as white curves in each plot.rence.
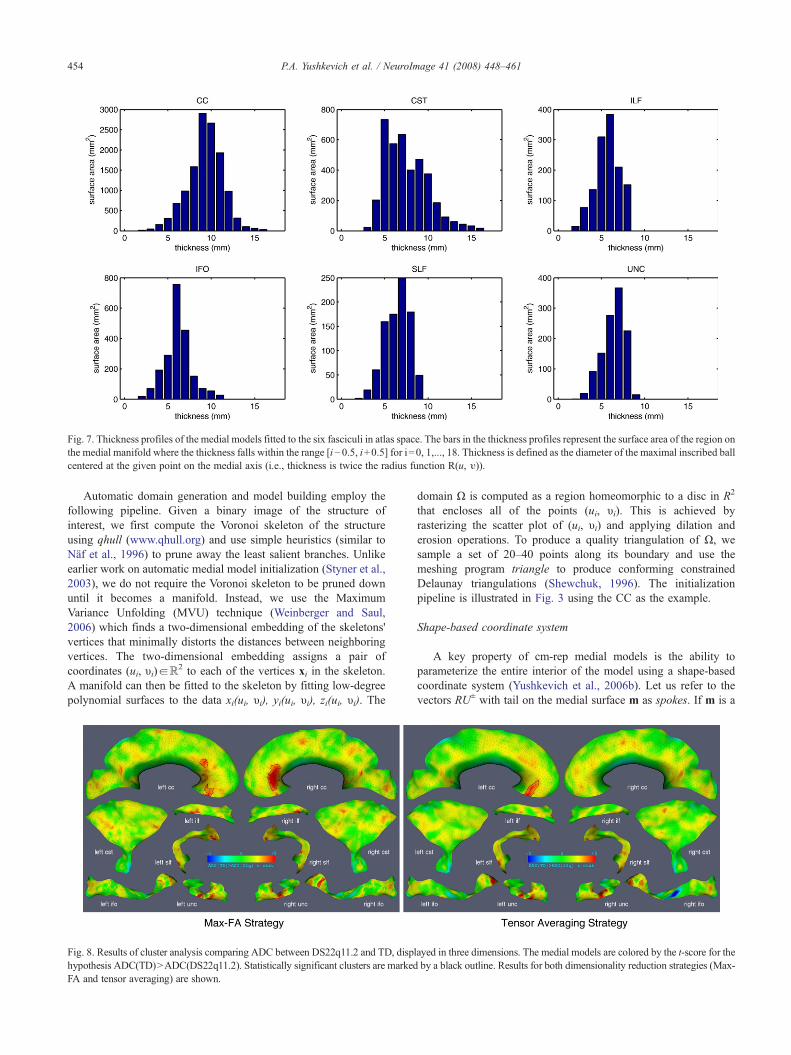
Fig. 7. Thickness profiles of the medial models fitted to the six fasciculi in atlas space. The bars in the thickness profiles represent the surface area of the region onthe medial manifold where the thickness falls within the range [i−0.5, i+0.5] for i=0, 1,..., 18. Thickness is defined as the diameter of the maximal inscribed ballcentered at the given point on the medial axis (i.e., thickness is twice the radius function R(u, υ)).
454 P.A. Yushkevich et al. / NeuroImage 41 (2008) 448–461
Automatic domain generation and model building employ thefollowing pipeline. Given a binary image of the structure ofinterest, we first compute the Voronoi skeleton of the structureusing qhull (www.qhull.org) and use simple heuristics (similar toNäf et al., 1996) to prune away the least salient branches. Unlikeearlier work on automatic medial model initialization (Styner et al.,2003), we do not require the Voronoi skeleton to be pruned downuntil it becomes a manifold. Instead, we use the MaximumVariance Unfolding (MVU) technique (Weinberger and Saul,2006) which finds a two-dimensional embedding of the skeletons'vertices that minimally distorts the distances between neighboringvertices. The two-dimensional embedding assigns a pair ofcoordinates (ui, υi)aR2 to each of the vertices xi in the skeleton.A manifold can then be fitted to the skeleton by fitting low-degreepolynomial surfaces to the data xi(ui, υi), yi(ui, υi), zi(ui, υi). The
Fig. 8. Results of cluster analysis comparing ADC between DS22q11.2 and TD, disphypothesis ADC(TD)NADC(DS22q11.2). Statistically significant clusters are markedFA and tensor averaging) are shown.
domain Ω is computed as a region homeomorphic to a disc in R2
that encloses all of the points (ui, υi). This is achieved byrasterizing the scatter plot of (ui, υi) and applying dilation anderosion operations. To produce a quality triangulation of Ω, wesample a set of 20–40 points along its boundary and use themeshing program triangle to produce conforming constrainedDelaunay triangulations (Shewchuk, 1996). The initializationpipeline is illustrated in Fig. 3 using the CC as the example.
Shape-based coordinate system
A key property of cm-rep medial models is the ability toparameterize the entire interior of the model using a shape-basedcoordinate system (Yushkevich et al., 2006b). Let us refer to thevectors RU± with tail on the medial surface m as spokes. If m is a
layed in three dimensions. The medial models are colored by the t-score for theby a black outline. Results for both dimensionality reduction strategies (Max-

Table 3Statistically significant clusters for the ADC comparison betweenDS22q11.2 and TD, using the ‘Max-FA’ dimensionality reduction strategy
Fasciculus Cluster location Area, mm2 t̄ pcorr t̄ tenav
cc l. anterior 50.7 3.75 0.0162 3.66cc l. anterior 23.9 3.52 0.0427 2.38cc l. anterior 34.0 3.79 0.0274 2.92cc r. anterior 208.9 4.49 0.0015 1.71⁎
left ilf posterior 40.4 3.80 0.0213 2.39left unc anterior medial 53.2 4.07 0.0149 4.18left unc medial 34.5 4.17 0.0268 4.08left slf inferior 26.4 4.15 0.0372 3.06right ilf posterior 49.9 4.10 0.0164 2.52right ifo anterior 48.3 4.25 0.0169 3.32right unc medial 74.4 3.99 0.0090 4.16
See legend in Table 2 for details.
455P.A. Yushkevich et al. / NeuroImage 41 (2008) 448–461
continuous surface and the constraints of inverse skeletonizationare met, the spokes span the interior of the model, i.e., the regionenclosed by the surface b− [ b+. Every point inside this region canbelong to only one spoke. Let us use coordinates (u, υ) to describewhere the tail of a spoke is on the medial surface, and use thecoordinate ξ a [−1, 1] to describe a location along a spoke (whenξN0, it references the spoke RU+, and when ξb0, it references thespoke RU−). Then every point x on the model's interior can beassigned a set of coordinates (u, ʋ, ξ), as follows:
x u; υ; nð Þ ¼ m u; υð Þ þ nR u; υð ÞUþ u; υð Þ if nz0m u; υð Þ � nR u; υð ÞU� u; υð Þ o=w:
�ð4Þ
This assignment is unique, except when (u, υ) a ∂Ω, in which casethe spokes RU+ and RU− coincide. This 3D parametrization of themodel is a powerful tool, as it allows us to analyze data on theinterior of structures in a shape-based coordinate system.
Statistical analysis on medial manifolds
This section describes one of many possible ways to performstructure-specific white matter analysis in cm-rep coordinate space.We assume a simple scenario, where we are interested in analyzingdifferences between two groups of subjects. To further simplify theanalysis, we restrict our attention only to the differences in theapparent diffusion coefficient (ADC). ADC is a scalar measurementof overall diffusivity equal to the mean of the eigenvalues of adiffusion tensor.
The key feature of our statistical analysis approach is theprojection of tensor-derived quantities lying on the interior of afasciculus onto its medial manifold. This projection results in adimensionality reduction along the spoke direction, i.e., the directionorthogonal to the boundary of the fasciculus. Like smoothing,dimensionality reduction increases sensitivity at the cost ofdecreased specificity. However, unlike isotropic Gaussian smooth-ing, data reduction along spoke directions respects the boundariesbetween structures. Furthermore, isotropic Gaussian smoothing
Table 2Statistically significant clusters for the ADC comparison between DS22q11.2and typical development (TD), using the tensor averaging dimensionalityreduction strategy
Fasciculus Cluster location Area, mm2 t̄ pcorr t̄ maxfa
Cc L. anterior 82.9 3.89 0.0096 3.42Left ifo Anterior 88.8 4.49 0.0085 3.11Left unc Anterior Medial 54.7 4.23 0.0184 3.99Left unc Medial 34.4 4.14 0.0346 4.13Right ifo Mid-fasciculus 58.4 −4.44 0.0266 −1.26⁎Right ifo Anterior 26.0 3.60 0.0492 4.16Right ifo Anterior 48.3 3.84 0.0213 2.98Right unc Medial 103.7 4.19 0.0070 3.62
Clusters are defined as connected regions with |t|N3.40 on the fascicularmedial manifold. For each cluster, four values are shown. The first value is thesurface area of the cluster on the medial manifold. Next, t̄ ̄ is the average valueof the t-statistic inside the cluster. Positive values of t indicate greater ADC inTD than in DS22q11.2. Third, the FWER-corrected p-value of the cluster isgiven (the correction treats pointwise hypothesis testing across all 11 fasciculias a single multiple comparison problem). Last, t̄maxfa gives the average overthe cluster of the t-map computed using the ‘Max-FA’ dimensionalityreduction strategy. The difference between t̄ and t̄maxfa gives an indication ofhow sensitive the cluster is to the choice of dimensionality reduction. Asterisk(⁎) indicates the clusters where this difference is most striking.
causes equal loss of specificity in all directions, while, arguably,dimensionality reduction along spokes in thin sheet-like fasciculicauses loss of specificity along the least interesting direction.
We propose and compare two approaches to dimensionalityreduction; other approaches are also possible. In both approaches, wemap the three-dimensional field of diffusion tensorsD(x) defined overthe image domain to two-dimensional tensor fields defined over themedial manifold of each fasciculus. For each fasciculus, this mappingis achieved by sampling diffusion tensors along spokes RU±(u, υ) andderiving a single tensor D̃(u, υ) for each point on the medial manifold.Such a two-dimensional tensor field is computed for each fasciculus ineach subject.
The first strategy is an adaptation of the dimensionalityreduction strategy used in TBSS (Smith et al., 2006) and will bereferred to as the ‘Max-FA’ strategy. In this strategy, we select thediffusion tensor that has the largest FA of all the tensors sampledalong the pair of spokes:
D̃ðu; υÞ ¼ Dðxðu; υ; n*ðu; υÞÞÞ; where
n*ðu; υÞ ¼ arg maxna½�1;1�
FAðDðxðu; υ; nÞÞÞ:ð5Þ
In TBSS, this strategy is adopted to correct for registration errors inatlas building. Since FA tends to be larger on the interior of fasciculi,by searching for the position with the largest FA value along vectorswhich extend from the interior to the fasciculus boundary, one mayrecover inter-subject correspondences distorted by imperfect registra-tion (Smith et al., 2006). However, there is a slight but importantdifference between our ‘Max-FA’ approach and TBSS. The lattercomputes the skeleton of the entire white matter region (defined by anFA threshold) and so the search for the maximum FAvalue may spanmultiple fasciculi if they are not separated by voxels with low FA.Ourapproach searches within the interior of each fasciculus, as defined byour tracking-based segmentation protocol. The effects of thisdifference are examined in Results section.
The second proposed strategy is to compute the average tensoralong each pair of spokes. Following Arsigny et al. (2006), wecompute the tensor average using the log-Euclidean formulation:
D̃ðu; υÞ ¼ exp12
Z 1
�1logDðxðu; υ; nÞÞdn
� �� ð6Þ
This strategy assumes that the registration quality is sufficientlyhigh and uses averaging as the way to increase sensitivity of the
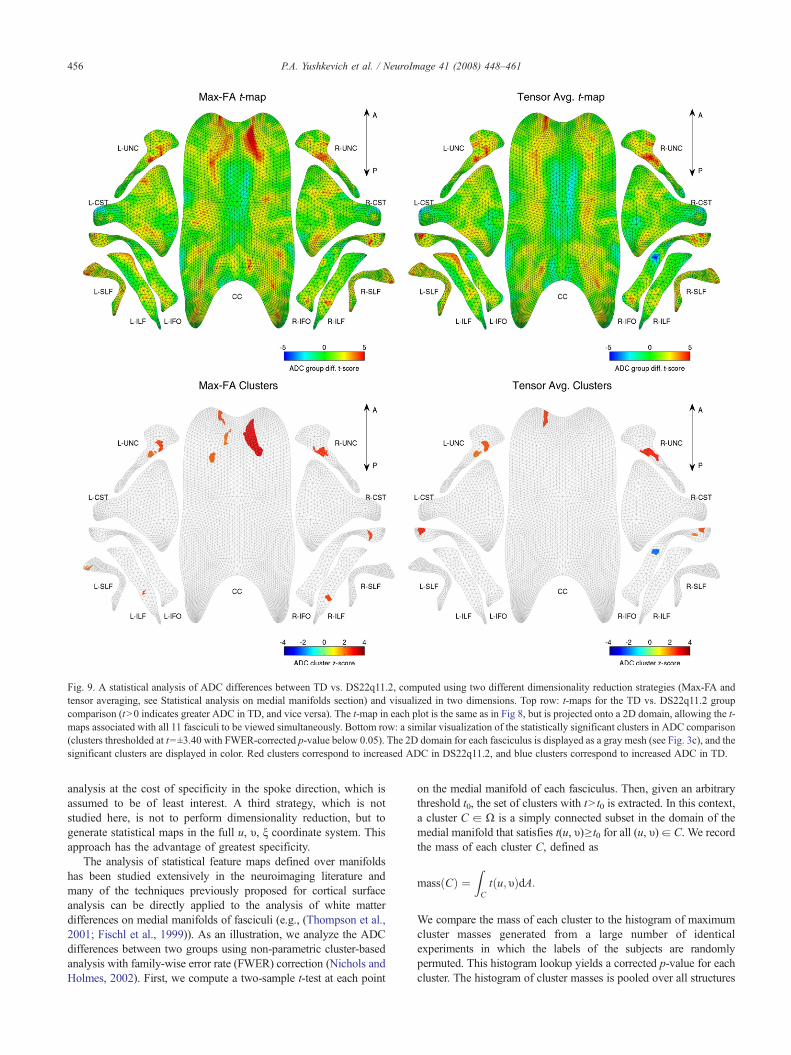
Fig. 9. A statistical analysis of ADC differences between TD vs. DS22q11.2, computed using two different dimensionality reduction strategies (Max-FA andtensor averaging, see Statistical analysis on medial manifolds section) and visualized in two dimensions. Top row: t-maps for the TD vs. DS22q11.2 groupcomparison (tN0 indicates greater ADC in TD, and vice versa). The t-map in each plot is the same as in Fig 8, but is projected onto a 2D domain, allowing the t-maps associated with all 11 fasciculi to be viewed simultaneously. Bottom row: a similar visualization of the statistically significant clusters in ADC comparison(clusters thresholded at t=±3.40 with FWER-corrected p-value below 0.05). The 2D domain for each fasciculus is displayed as a gray mesh (see Fig. 3c), and thesignificant clusters are displayed in color. Red clusters correspond to increased ADC in DS22q11.2, and blue clusters correspond to increased ADC in TD.
456 P.A. Yushkevich et al. / NeuroImage 41 (2008) 448–461
analysis at the cost of specificity in the spoke direction, which isassumed to be of least interest. A third strategy, which is notstudied here, is not to perform dimensionality reduction, but togenerate statistical maps in the full u, υ, ξ coordinate system. Thisapproach has the advantage of greatest specificity.
The analysis of statistical feature maps defined over manifoldshas been studied extensively in the neuroimaging literature andmany of the techniques previously proposed for cortical surfaceanalysis can be directly applied to the analysis of white matterdifferences on medial manifolds of fasciculi (e.g., (Thompson et al.,2001; Fischl et al., 1999)). As an illustration, we analyze the ADCdifferences between two groups using non-parametric cluster-basedanalysis with family-wise error rate (FWER) correction (Nichols andHolmes, 2002). First, we compute a two-sample t-test at each point
on the medial manifold of each fasciculus. Then, given an arbitrarythreshold t0, the set of clusters with tN t0 is extracted. In this context,a cluster C a Ω is a simply connected subset in the domain of themedial manifold that satisfies t(u, υ)≥ t0 for all (u, υ)a C. We recordthe mass of each cluster C, defined as
mass Cð Þ ¼ZCt u; υð ÞdA:
We compare the mass of each cluster to the histogram of maximumcluster masses generated from a large number of identicalexperiments in which the labels of the subjects are randomlypermuted. This histogram lookup yields a corrected p-value for eachcluster. The histogram of cluster masses is pooled over all structures

Fig. 10. Closer examination of the cluster in the right IFO that appears under the tensor averaging strategy but has no equivalent under the ‘Max-FA’ strategy. Topleft: the t-map for the ADC(TD) vs. ADC(DS22q11.2) comparison produced by the tensor averaging strategy (this is the same t-map as in Fig. 8). The cluster ofinterest is the blue spot in the t-map (increased ADC in DS22q11.2). Top right: the spokes along the medial manifold of the right IFO. Each spoke is a linesegment extending from the medial manifold to the corresponding (and also nearest) point on the boundary (see Fig. 2). Spoke RU+ is shown in red and spokeRU− in blue. Bottom left: a color map showing where the ‘Max-FA’ strategy samples the DTI image in relation to the medial manifold of the right IFO. Redindicates that the tensor with maximal FA is located at the end of spoke RU+ (on average over all 31 subjects) and blue indicates that the tensor with maximal FAis at the end of RU−. Green indicates that the tensor with ‘Max-FA’ is, on average, located along the medial manifold. Bottom right: the medial manifold of theright ILF is shown next to the right IFO. The two fasciculi pass close to each other. The ‘Max-FA’ strategy appears to be sampling tensors from the right ILF,which has greater FA values, and causes the statistically significant differences in the adjacent IFO to be missed.
457P.A. Yushkevich et al. / NeuroImage 41 (2008) 448–461
of interest, so that the FWER correction takes into account thenumber of structures that we examine.
Experimental evaluation
Evaluation experiment: subjects and imaging protocol
We demonstrate the proposed structure-specific white matteranalysis paradigm in an ongoing study of DS22q11.2 conductedat the Department of Psychiatry and Behavioral Science, M.I.N.D. Institute of University of California, Davis. DS22q11.2 isassociated with reduced brain volume, and in particular, has beenlinked to morphological changes in white matter (Eliez et al.,2000; Kates et al., 2001; Simon et al., 2005). We are interested intesting the hypothesis that white matter structure is differentbetween children with DS22q11.2 and typically developing chil-dren (TD).
Fig. 11. A closer look at the cluster in the right anterior CC that appears under the ‘The location of the cluster in question is outlined on the medial surface of the CC. Ttensor with maximal FA. Positive values (red) indicate that on average, the maximmidsagittal plane; negative values indicate that maximal FA tensors tend to be locatno bias in the location of the maximal FA tensor. The lateral ventricle is in close promore prone to partial volume errors, is less sensitive in this region.
The participants in the study include 13 children withDS22q11.2 and 18 children with typical development. Diffusion-weighted and structural MRI was acquired for each participant on a3 Tesla Siemens Trio scanner. A single-shot, spin-echo, diffusion-weighted echo-planar imaging (EPI) sequence was used for thediffusion-weighted MRI. The diffusion scheme was as follows:one image with minimum possible diffusion gradient, referred to asthe b=0 image, followed by twelve images measured with twelvenon-collinear and non-coplanar diffusion encoding directionsisotropically distributed in space (b=1000 s/mm2). Additionalimaging parameters for the diffusion-weighted sequence are:TR=6500 ms, TE=99 ms, 90° flip angle, number of averages=6,matrix size=128×128, slice thickness=3.0 mm, spacing betweenslices=3.0 mm, 40 axial slices with in-plane resolution of1.72×1.72 mm.
Diffusion-weighted images were corrected for motion and eddy-current artifacts using the method described in (Mangin et al., 2002),
Max-FA’ strategy but has no equivalent under the tensor averaging strategy.he medial manifold is colored by the relative position along the spokes of theal FA tensor is located on the side of the medial manifold away from the
ed one the side facing the midsagittal plane; and values close to zero indicateximity to the cluster, which may help explain why tensor averaging, which is

458 P.A. Yushkevich et al. / NeuroImage 41 (2008) 448–461
prior to extracting brain parenchyma with the Brain Extraction Tool(Smith, 2002). Diffusion tensor images were then reconstructedfrom the diffusion-weighted images using the standard linearregression approach (Basser et al., 1994). Finally, the resultingtensor volumes were resampled to a voxel space of 128×128×64with voxel dimensions equal to 1.72×1.72×2.5 mm3. Theresampled volume, with axial dimension equal to a power of 2, isbetter suited for registration algorithms that require the constructionof standard multi-resolution image pyramids.
Results
The pipeline described in Materials and methods section wasapplied to all 31 images in the study. First, a symmetric unbiasedpopulation atlas was constructed using image registration; this atlasis illustrated in Fig. 1. A qualitative assessment of registrationaccuracy is presented in Fig. 6, which shows the DTI images fromeight subjects warped into the space of the atlas. No large-scaleregistration errors are evident, although there are small-scaledifferences.
Fiber tracking and tract labeling were used to segment sixfasciculi of interest in atlas space. Fiber tracking results and thecorresponding binary segmentations are shown in the first twocolumns of Fig. 4, and the skeletons and boundary surfaces of medialmodels fitted to each of the binary segmentations are shown in lasttwo columns. The model fitting accuracy for the six fasciculi is listedin Table 1, in terms of Dice overlap between the binary segmentationof a fasciculus and the fitted cm-rep model, as well as root meansquare displacement from the boundary of the fitted cm-rep to theboundary of the binary segmentation. The fitting accuracy is high(~0.95 Dice overlap) for five of the six fasciculi. For the ILF, fittingaccuracy is lower (0.90 Dice overlap), due to branching fibers in theposterior part of the fasciculus (see Fig. 4). Fitting this structuremoreaccurately would require extending our medial modeling approachto allow multi-manifold skeletons, which is the subject of ongoingresearch. A combined view of the six fasciculi and the medialmodels fitted to them is shown in Fig. 5.
Fig. 7 plots the distribution of thickness along the medialmodels fitted to each of the fasciculi. Thickness is also shown as acolor map in Fig. 4. The CC and CST are the thickest fasciculi,with thickness reaching 16 mm. ILF is the thinnest, with maximumthickness below 9 mm. The voxel size of our DTI data is1.72 mm×1.72 mm×3.0 mm. Hence, the dimensionality reductionstrategies proposed above do indeed combine data from multiplevoxels.
For each fasciculus, we tested the hypothesis that ADC is greaterin TD than in DS22q11.2. This hypothesis was tested using both‘Max-FA’ and tensor averaging dimensionality reduction strategies. Ineach case, a t-map was generated over the medial manifold of eachfasciculus. These t-maps are plotted in three dimensions in Fig. 8as color maps over the medial manifolds. An alternative visualizationin the top row of Fig. 9 displays the t-maps in the two-dimensional u,ʋdomain of each fasciculus, making it easy to display the results ofhypothesis testing on a single page. Note that the two-dimensionalprojection of each fasciculus roughly resembles the shape of thefasciculus in three dimensions, making it easier to interpret the two-dimensional t-maps. The 2D visualization is also an effective tool forcomparing the results of different studies or different contrasts withina study.
To find the regions where ADC differences between TD andDS22q11.2 groups are statistically significant, we performed
permutation-based cluster analysis with 10000 random permuta-tions. The cluster threshold t0 was set to 3.40, corresponding to anuncorrected p-value of 0.001. The sets of clusters computed foreach contrast and each dimensionality reduction strategy are shownin a two-dimensional flattened view in the bottom row of Fig. 9.The clusters detected using tensor averaging dimensionalityreduction are listed in Table 2 and the clusters detected with‘Max-FA’ are listed in Table 3. The results consistently point toADC differences in CC, IFO and UNC. However, the study isongoing and we intend to report the complete results, including FAdifferences, in a separate clinically-oriented paper.
More clusters are obtained using the ‘Max-FA’ strategy thanusing tensor averaging. In particular, a large cluster is detected inthe right genu of the CC, for which there is no equivalent in theclusters generated by tensor averaging. However, looking at thedifferences between lists of clusters can be deceptive because acluster's presence or absence can be sensitive to small differencesin the topography of the t-map from which the cluster is generated.A more fair assessment when comparing t-maps generated by twostrategies is to examine the t-values from different strategies over theextent of the same cluster. This comparison is made in Tables 2 and 3.For each cluster, the average t in the ‘native’ t-map is reported (i.e., thesame t-map that was used to generate the cluster), along with theaverage t in the ‘opposite’ t-map. In all cases, the native |t̄ |N3.40,since 3.40 is the clustering threshold. For almost all clusters, theopposite t̄ is also fairly large, indicating agreement between the twostrategies. The two exceptions are the cluster for the tensor averagingstrategy located in the right IFO (t̄ tenav=−4.44, t̄ maxfa=−1.26) andthe cluster for ‘Max-FA’ strategy located in the right genu of the CC(t̄ maxfa=4.49, t̄ tenav=1.71).
Fig. 10 helps explain why the two strategies can producedifferent t-maps. It looks at the aforementioned cluster in the rightIFO, and examines where the tensors with maximal FA are inrelation to the medial manifold of the fasciculus. It turns out thatover the region of the cluster, the tensors with maximal FA arelocated not along the medial manifold but towards the end of thespokes that point in the direction of the adjacent ILF, which passesvery close to the IFO. The tensors in the ILF have larger FA thantensors in the IFO, and the ‘Max-FA’ strategy chooses the former.Thus, although it seems to produce larger and more numerousclusters, the ‘Max-FA’ strategy can also fail to detect statisticallysignificant differences in places where one fasciculus passes closeto another.
The other cluster that is inconsistent between the two strategiesis located in the right genu of the CC. As Fig. 11 shows, this clusteris located where the CC is adjacent on one side to the lateralventricles. Unlike in the case of the right IFO, there is nosystematic shift in the position of the diffusion tensor with maximalFA along the spokes in that area of the CC; on average, the positionof the maximal FA tensor is right on the medial manifold. It islikely that the low sensitivity of the tensor averaging strategy is dueto the partial volume effects between the CC and adjacent highlyisotropic gray and CSF structures.
Discussion and conclusions
This work demonstrates the feasibility of using deformablemedial models for structure-specific statistical mapping of DTIdata in major white matter fasciculi. The cornerstone of thisapproach is the shape-based parametrization of the fasciculi.Medial models are a natural representation for thin sheet-like

459P.A. Yushkevich et al. / NeuroImage 41 (2008) 448–461
structures because the medial manifold effectively summarizes theoverall shape of structures and presents an ideal target fordimensionality reduction. Collapsing tensors by taking the averagealong spokes is an attractive alternative to spatial smoothing ofDTI data. Both approaches trade specificity for sensitivity byaveraging data from multiple locations, but spoke-based averagingalso reduces data dimensionality and explicitly strives to ensurethat averaging is applied within the structure of interest, not acrossits boundaries. However, since averaging takes place in atlas spaceand normalization is never perfect, there is still a possibility fortensor data outside of the structure of interest to be included in theanalysis. The TBSS-inspired approach of summarizing data alongthe spokes by selecting the tensor with maximal FA is also feasiblein our framework and, as shown above, can lead to increasedsensitivity, albeit at the cost of potentially missing significantdifferences in areas of adjoining fasciculi.
The use of skeletons in DTI analysis was pioneered by Smith etal. (2006) in the TBSS approach. Our approach is distinct fromTBSS in several important ways. First, our approach is directed atstatistical mapping of individual fasciculi, while TBSS aims todraw inferences about white matter as a whole. In TBSS,deterministic skeletonization is applied to the set of all voxelswith above-threshold fractional anisotropy. This results in askeleton consisting of hundreds or thousands of branches, someof which may be spurious and sensitive to noise. In contrast, thecm-rep approach yields a single approximating medial surface foreach of the six selected fasciculi. This simple parametricrepresentation allows statistical mapping of individual fasciculiand provides an easy and attractive way to visualize and interpretstatistical differences. It establishes a canonical two-dimensionalcoordinate space for the fasciculi (Fig. 9), where the results fromdifferent white matter studies can be compared.
There are a number of ways to improve the proposed analysisframework. The framework can be extended to incorporate fasciculifor which the sheet-like model is inappropriate, such as the cingulumand the fornix. The tube-based geometrical tract model developed byJones et al. (2005b); Corouge et al. (2006); Lin et al. (2006); Maddahet al. (2007) is particularly well-suited for modeling these structures,and can be used in parallel with our approach.
In the current experiment, cm-rep models were fit to tractsegmentations in atlas space. The dimensionality reduction of tensordata along spokes also occurs in atlas space, meaning that in subjectspace the averaging takes place along curves that are not guaranteed toextend from the medial axis to the boundary, since the deformationsyielded by registration algorithms do not preserve the geometricalrelationship between the boundaries and skeletons of structures.
An alternative approach is to fit cm-rep models to tractsegmentations in subject space. This can be achieved by warpingthe binary segmentations from the template to each of the subjects,and fitting a cm-rep model to each of these warped segmentations.In this way, the registration component would be leveraged to alignthe boundary a structure, while the normalization of the structure'sinterior would be based on the geometrical correspondencesgenerated by cm-rep fitting.
Reliance on expert-driven segmentation of the fasciculi isanother limitation. Although the segmentation of the fasciculi inatlas space requires less than 2 h of expert time, performingsegmentation in subject space would be prohibitively expensive formany studies. Furthermore, the simple six-parameter tensor-basedrepresentation of diffusion in our dataset and simple streamline-based fiber tracking employed by FACT limit the accuracy with
which white matter tracts can be segmented. For instance, the datanear the cortex is too noisy to accurately model the corticalprojections of the fasciculi. However, the limitations of segmenta-tion method do not preclude us from performing statisticalanalysis, as long as it is safe to assume that the segmentationerror is independent of the differences between cohorts in a study.Recent advances in DTI segmentation (Lenglet et al., 2006;O'Donnell and Westin, 2007; Awate et al., 2007) and higherresolution imaging may indeed make it possible to more accuratelylabel fasciculi in atlas space, as well as in individual subjectimages, and to do so automatically or with minimal userinteraction. However, given the fact that deformable medialmodels are themselves a very powerful segmentation tool (Pizeret al., 1999; Joshi et al., 2002), a truly attractive approach would beto fit the deformable medial models employed in this paper directlyto DTI data, rather than to segmentations obtained with othertechniques. This would require incorporating tensor-based andconnectivity-based likelihood metrics into cm-rep fitting, as well astraining shape priors for each of the fasciculi. In addition to shape,priors may incorporate the variation in the angle between spokes ofthe medial model and the principal direction of diffusion in theunderlying DTI data. Model-based segmentation of the fasciculi isone of the key long-term aims of our research.
The statistical methods used in this paper represent just one ofmany possible approaches to structure-specific inference. Forexample, instead of permutation-based cluster analysis, one coulduse point-wise hypothesis testing with false discovery ratecorrection (Benjamini and Yekutieli, 2001). It is also possible tosubdivide the fasciculi according to cortical regions to whichindividual fibers connect, and to compute region-wise statistics.Instead of using features derived from diffusion tensors averagedalong spokes, multivariate analysis may be applied, where eachpoint on the medial manifold is associated with a tuple of diffusiontensors. Such a framework would be more sensitive to groupdifferences occurring on opposite sides of the medial manifold.
In conclusion, we have presented a novel structure-specificframework for analyzing white matter differences betweenpopulations. The technique can be seen both as a model-basedstructure-specific alternative to the TBSS method (Smith et al.,2006) and as an extension of the cortical flat-mapping paradigm towhite matter structures. The six sheet-like fasciculi in the humanbrain are modeled using deformable medial models, which allowthe diffusion tensor data associated with these structures to beprojected onto parametric manifolds or even flattened to a two-dimensional domain. This approach simplifies white matter analysisand provides a compelling way to present results of white matterstudies.
Acknowledgments
This work was supported by the NIH grants AG027785 (PY),NS061111 (PY), HD042974 (TJC), HD046159 (TJC), MH068066(V. Megalooikonomou), and NS045839 (J. A. Detre), as well as thePilot Project Award from the Penn Comprehensive NeuroscienceCenter (PY).
References
Alexander, D.C., Pierpaoli, C., Basser, P.J., Gee, J.C., 2001. Spatialtransformations of diffusion tensor magnetic resonance images. IEEETrans. Med. Imag. 20 (11), 1131–1139.
460 P.A. Yushkevich et al. / NeuroImage 41 (2008) 448–461
Ardekani, B.A., Kershaw, J., Braun, M., Kanno, I., 1997. Automaticdetection of the mid-sagittal plane in 3-d brain images. IEEE Trans. Med.Imag. 16 (6), 947–952.
Arsigny, V., Fillard, P., Pennec, X., Ayache, N., 2006. Log-Euclideanmetrics for fast and simple calculus on diffusion tensors. Magn. Reson.Med. 56 (2), 411–421.
Ashburner, J., Friston, K.J., 2000. Voxel-based morphometry—the methods.NeuroIimage 11 (6 Pt 1), 805–821.
Avants, B., Gee, J.C., 2004. Geodesic estimation for large deformationanatomical shape averaging and interpolation. NeuroImage 23 (Suppl 1),S139–S150.
Awate, S., Zhang, H., Gee, J., 2007. A fuzzy, nonparametric segmentationframework for DTI and MRI analysis: with applications to dti-tractextraction. IEEE Trans. Med. Imag. 26 (11), 1525–1536.
Basser, P.J., Mattiello, J., LeBihan, D., 1994. Estimation of the effective self-diffusion tensor from the nmr spin echo. J. Magn. Reson. B 103 (3),247–254.
Benjamini, Y., Yekutieli, D., 2001. The control of the false discovery rate inmultiple testing under dependency. Ann. Stat. 29 (4), 1165–1188.
Blum, H., 1967. ATransformation for Extracting New Descriptors of Shape.In Models for the Perception of Speech and Visual Form. MIT Press.
Cao, Y., Miller, M.I., Winslow, R.L., Younes, L., 2005. Large deformationdiffeomorphic metric mapping of vector fields. IEEE Trans. Med. Imag.24 (9), 1216–1230.
Cascio, C., Styner, M., Smith, R.G., Poe, M.D., Gerig, G., Hazlett, H.C.,Jomier, M., Bammer, R., Piven, J., 2006. Reduced relationship tocortical white matter volume revealed by tractography-based segmenta-tion of the corpus callosum in young children with developmental delay.Am. J. Psychiatry 163 (12), 2157–2163.
Conturo, T.E., Lori, N.F., Cull, T.S., Akbudak, E., Snyder, A.Z., Shimony, J.S.,McKinstry, R.C., Burton, H., Raichle, M.E., 1999. Tracking neuronal fiberpathways in the living human brain. Proc. Natl. Acad. Sci. U. S. A. 96 (18),10422–10427.
Corouge, I., Fletcher, P.T., Joshi, S., Gouttard, S., Gerig, G., 2006. Fibertract-oriented statistics for quantitative diffusion tensor MRI analysis.Med. Image Anal. 10 (5), 786–798.
Damon, J., 2004. On the smoothness and geometry of boundaries associatedwith skeletal structures II: geometry in the Blum case. CompositioMathematica 140 (6), 1657–1674.
Damon, J., 2005. Determining the geometry of boundaries of objects frommedial data. Int. J. Comput. Vis. 63 (1), 45–64.
Eliez, S., Schmitt, J.E., White, C.D., Reiss, A.L., 2000. Children andadolescents with velocardiofacial syndrome: a volumetric mri study.Am. J. Psychiatry 157 (3), 409–415.
Eriksson, S.H., Rugg-Gunn, F.J., Symms, M.R., Barker, G.J., Duncan, J.S.,2001. Diffusion tensor imaging in patients with epilepsy and malforma-tions of cortical development. Brain 124 (Pt 3), 617–626.
Fischl, B., Sereno, M.I., Dale, A.M., 1999. Cortical surface-based analysis.II: inflation, flattening, and a surface-based coordinate system. Neuro-Image 9 (2), 195–207.
Guimond, A., Meunier, J., Thirion, J.P., 2000. Average brain models: aconvergence study. Comput. Vis. Image Underst. (ISSN: 1077-3142) 77(9), 192–210.
Horsfield, M.A., Jones, D.K., 2002. Applications of diffusion-weighted anddiffusion tensor mri to white matter diseases— a review. NMR Biomed.15 (7–8), 570–577.
Jones, D.K., Symms,M.R., Cercignani, M., Howard, R.J., 2005a. The effect offilter size on vbm analyses of dt-mri data. NeuroImage 26 (2), 546–554.
Jones, D.K., Travis, A.R., Eden, G., Pierpaoli, C., Basser, P.J., 2005b. Pasta:pointwise assessment of streamline tractography attributes. Magn.Reson. Med. 53 (6), 1462–1467.
Joshi, S., Pizer, S., Fletcher, P., Yushkevich, P., Thall, A., Marron, J., 2002.Multi-scale deformable model segmentation and statistical shape analysisusing medial descriptions. IEEE Trans. Med. Imag. 21 (5), 538–550.
Joshi, S., Davis, B., Jomier, M., Gerig, G., 2004. Unbiased diffeomorphicatlas construction for computational anatomy. NeuroImage 23 (Suppl 1),S151–S160.
Kates, W.R., Burnette, C.P., Jabs, E.W., Rutberg, J., Murphy, A.M., Grados,M., Geraghty, M., Kaufmann, W.E., Pearlson, G.D., 2001. Regionalcortical white matter reductions in velocardiofacial syndrome: avolumetric mri analysis. Biol. Psychiatry 49 (8), 677–684.
Kindlmann, G., Tricoche, X., Westin, C.F., 2007. Delineating white matterstructure in diffusion tensor mri with anisotropy creases. Med. Image Anal.11 (5), 492–502.
Lenglet, C., Rousson, M., Deriche, R., 2006. Dti segmentation by statisticalsurface evolution. IEEE Trans. Med. Imag. 25 (6), 685–700.
Lin, F., Yu, C., Jiang, T., Li, K., Li, X., Qin, W., Sun, H., Chan, P., 2006.Quantitative analysis along the pyramidal tract by length-normalizedparameterization based on diffusion tensor tractography: application topatients with relapsing neuromyelitis optica. NeuroImage 33 (1),154–160.
Loop, C., DeRose, T., 1990.Generalized b-spline surfaces of arbitrary topology.Computer Graphics (ACM SIGGRAPH Proceedings), pp. 347–356.
Maddah III, M., W. M. W., Warfield, S.K., Westin, C.F., Grimson, W.E.L.,2007. Probabilistic clustering and quantitative analysis of white matterfiber tracts. In International Conference on Information Processing inMedical Imaging, pp. 372–383.
Mangin, J.F., Poupon, C., Clark, C., Bihan, D.L., Bloch, I., 2002. Distortioncorrection and robust tensor estimation for mr diffusion imaging. Med.Image Anal. 6 (3), 191–198.
Mori, S., van Zijl, P.C.M., 2002. Fiber tracking: principles and strategies—a technical review. NMR Biomed. 15 (7–8), 468–480.
Mori, S., Crain, B.J., Chacko, V.P., van Zijl, P.C., 1999. Three-dimensionaltracking of axonal projections in the brain by magnetic resonanceimaging. Ann. Neurol. 45 (2), 265–269.
Mori, S., Kaufmann, W.E., Davatzikos, C., Stieltjes, B., Amodei, L.,Fredericksen, K., Pearlson, G.D., Melhem, E.R., Solaiyappan, M.,Raymond, G.V., Moser, H.W., van Zijl, P.C.M., 2002. Imaging corticalassociation tracts in the human brain using diffusion-tensor-based axonaltracking. Magn. Reson. Med. 47 (2), 215–223.
Näf, M., Kübler, O., Kikinis, R., Shenton, M., Székely, G., 1996.Characterization and recognition of 3D organ shape in medical imageanalysis using skeletonization. Workshop on Mathematical Methods inBiomedical Image Analysis. IEEE Comput. Soc. , pp. 139–150.
Nichols, T.E., Holmes, A.P., 2002. Nonparametric permutation tests forfunctional neuroimaging: a primer with examples. Hum. Brain Mapp. 15(1), 1–25.
O'Donnell, L.J., Westin, C.F., 2007. Automatic tractography segmentationusing a high-dimensional white matter atlas. IEEE Trans. Med. Imag. 26(11), 1562–1575.
Pizer, S.M., Fritsch, D.S., Yushkevich, P.A., Johnson, V.E., Chaney, E.L.,1999. Segmentation, registration, and measurement of shape variationvia image object shape. IEEE Trans. Med. Imag. 18 (10), 851–865.
Shewchuk, J.R., 1996. Triangle: engineering a 2D quality mesh generator andDelaunay triangulator. In: Lin, M.C., Manocha, D. (Eds.), AppliedComputational Geometry: Towards Geometric Engineering, volume 1148of Lecture Notes in Computer Science. Springer-Verlag, pp. 203–222.From the First ACMWorkshop on Applied Computational Geometry.
Simon, T.J., Ding, L., Bish, J.P., McDonald-McGinn, D.M., Zackai, E.H.,Gee, J., 2005. Volumetric, connective, and morphologic changes in thebrains of children with chromosome 22q11.2 deletion syndrome: anintegrative study. NeuroImage 25 (1), 169–180.
Smith, S.M., 2002. Fast robust automated brain extraction. Hum. BrainMapp. 17 (3), 143–155.
Smith, S.M., Jenkinson, M., Johansen-Berg, H., Rueckert, D., Nichols, T.E.,Mackay, C.E., Watkins, K.E., Ciccarelli, O., Cader, M.Z., Matthews, P.M.,Behrens, T.E.J., 2006. Tract-based spatial statistics: voxelwise analysis ofmulti-subject diffusion data. NeuroImage 31 (4), 1487–1505.
Styner, M., Gerig, G., Joshi, S., Pizer, S., 2003. Automatic and robustcomputation of 3D medial models incorporating object variability. Inte.J. Comput. Vis. 55 (2), 107–122.
Sun, H., Yushkevich, P.A., Zhang, H., Cook, P.A., Duda, J.T., Simon, T.J.,Gee, J.C., in press. Shape-based normalization of the corpus callosumfor DTI-based connectivity analysis. IEEE Tran. Med. Img.
461P.A. Yushkevich et al. / NeuroImage 41 (2008) 448–461
Terriberry, T.B., Gerig, G., 2006. A continuous 3-d medial shape model withbranching. In International Workshop on Mathematical Foundations ofComputational Anatomy MFCA-2006, in conjunction with MICCAI2006.
Thompson, P.M., Toga, A.W., 1997. Detection, visualization and animationof abnormal anatomic structure with a deformable probabilistic brainatlas based on random vector field transformations. Med. Image Anal. 1(4), 271–294.
Thompson, P.M., Vidal, C., Giedd, J.N., Gochman, P., Blumenthal, J.,Nicolson, R., Toga, A.W., Rapoport, J.L., 2001. Mapping adolescentbrain change reveals dynamic wave of accelerated gray matter loss invery early-onset schizophrenia. PNAS 98 (20), 11650–11655.
Wakana, S., Jiang, H., Nagae-Poetscher, L.M., van Zijl, P.C.M., Mori, S.,2004. Fiber tract-based atlas of human white matter anatomy. Radiology230 (1), 77–87.
Weinberger, K.Q., Saul, L.K., 2006. Unsupervised learning of imagemanifolds by semidefinite programming. Int. J. Comp. Vis. 70 (1),77–90.
Xu, G., 2004. Discrete laplace-beltrami operators and their convergence.Comput. Aided Geom. Des. 21 (8), 767–784.
Yushkevich, P., Fletcher, P.T., Joshi, S., Thall, A., Pizer, S.M., 2003.Continuous medial representations for geometric object modeling in 2Dand 3D. Image Vis. Comput. 21 (1), 17–28.
Yushkevich, P.A., Piven, J., Hazlett, H.C., Smith, R.G., Ho, S., Gee, J.C.,Gerig, G., 2006a. User-guided 3D active contour segmentation ofanatomical structures: significantly improved efficiency and reliability.NeuroImage 31 (3), 1116–1128.
Yushkevich, P.A., Zhang, H., Gee, J., 2006b. Continuousmedial representationfor anatomical structures. IEEE Trans. Med. Imag. 25 (2), 1547–1564.
Zhang, H., Yushkevich, P.A., Alexander, D.C., Gee, J.C., 2006. Deformableregistration of diffusion tensor MR images with explicit orientationoptimization. Med. Image Anal.
Zhang, H., Yushkevich, P.A., Rueckert, D., Gee, J.C., 2007. Unbiased whitematter atlas construction using diffusion tensor images. Medical ImageComputing and Computer-Assisted Intervention, MICCAI.
Zhang, H., Avants, B.B., Yushkevich, P.A.,Woo, J.H.,Wang, S., McCluskey,L.F., Elman, L.B., Melhem, E.R., Gee, J.C., in press. High-dimensionalspatial normalization of diffusion tensor images improves the detection ofwhite matter differences in amyotrophic lateral sclerosis. IEEE Transactionson Medical Imaging— Special Issue on Computational Diffusion MRI.
Related Documents