Structure of the spectral radiation data Josh Peterson, Dale Northcutt, Frank Vignola, Kevin Van Den Wymelenberg University of Oregon, Eugene (United States) Edited: 2018‐12‐11 Abstract The University of Oregon’s Solar Radiation Monitoring network has been making solar spectral measurements since the middle of 2015 using an EKO MS‐700 spectroradiometer. The spectral data set is archived and presented in a file format that contains various types of information. This article describes the format of the spectral files. The format utilizes month blocks and data is reported in one‐minute time intervals. The files contain detailed header rows about the site location, instruments used, calibration values utilized, and uncertainties in the calibration values. The spectral data is a global horizontal measurement from 335 nm to 1060 nm in roughly 3.3 nm increments. A variety of time stamps are included in the data file to facilitate the use of the data. The files also contain broadband metrological data as well as general weather condition information. Keywords: solar radiation, spectrum, EKO MS‐700 spectroradiometer Data File Structure ‐ Overview Information on the spectrum of light has become increasingly important in solar radiation monitoring. The solar radiation monitoring lab (SRML) at the University of Oregon has been making spectral measurements for several years. The spectral data was gathered using an EKO MS‐700 spectroradiometer [1]. The EKO spectroradiometer makes measurements from 335 nm to 1060 nm in roughly 3.3 nm increments. The measurement period began in May 2015 and plans are to into the foreseeable future. Data was taken every minute over the entire 24‐hour period of each day. The spectral data is presented in a file format that provides the user with significantly more information than the spectral data gathered by the spectroradiometer. Key features of the file format include: General information about the station. Information on the specific instruments used to make each measurement, including the model number, calibration values, and the uncertainty in the measurement value. Various formats of date and time. The solar position (SZA and AZM) and extraterrestrial radiation (ETR and ETRn). Various supplementary broadband irradiance measurements (GHI, DNI, DHI) as well as general metrological data. This combination of measured and calculated values offers the user a more comprehensive view of conditions for the data set. The purpose of this document is to discuss the format of the data files and how each value was obtained. The files are csv files separated into month blocks that typically range in size between 100 and 130 MB. A schematic diagram of the file format is shown in Figure 1. This article will discuss each of the areas shown in the figure in the following order. Region 1 contains general information about the station. Region 2 contains information about each column. Regions 3 contains non‐measured quantiles such as: date, time, solar position, and extraterrestrial radiation. Region 4 contains measured irradiance quantities such as: GHI, DNI,

Welcome message from author
This document is posted to help you gain knowledge. Please leave a comment to let me know what you think about it! Share it to your friends and learn new things together.
Transcript

Structure of the spectral radiation data
Josh Peterson, Dale Northcutt, Frank Vignola, Kevin Van Den Wymelenberg
University of Oregon, Eugene (United States)
Edited: 2018‐12‐11
Abstract
The University of Oregon’s Solar Radiation Monitoring network has been making solar spectral measurements
since the middle of 2015 using an EKO MS‐700 spectroradiometer. The spectral data set is archived and
presented in a file format that contains various types of information. This article describes the format of the
spectral files. The format utilizes month blocks and data is reported in one‐minute time intervals. The files
contain detailed header rows about the site location, instruments used, calibration values utilized, and
uncertainties in the calibration values. The spectral data is a global horizontal measurement from 335 nm to
1060 nm in roughly 3.3 nm increments. A variety of time stamps are included in the data file to facilitate the
use of the data. The files also contain broadband metrological data as well as general weather condition
information.
Keywords: solar radiation, spectrum, EKO MS‐700 spectroradiometer
Data File Structure ‐ Overview
Information on the spectrum of light has become increasingly important in solar radiation monitoring. The
solar radiation monitoring lab (SRML) at the University of Oregon has been making spectral measurements
for several years. The spectral data was gathered using an EKO MS‐700 spectroradiometer [1]. The EKO
spectroradiometer makes measurements from 335 nm to 1060 nm in roughly 3.3 nm increments. The
measurement period began in May 2015 and plans are to into the foreseeable future. Data was taken every
minute over the entire 24‐hour period of each day.
The spectral data is presented in a file format that provides the user with significantly more information than
the spectral data gathered by the spectroradiometer. Key features of the file format include:
General information about the station.
Information on the specific instruments used to make each measurement, including the model
number, calibration values, and the uncertainty in the measurement value.
Various formats of date and time.
The solar position (SZA and AZM) and extraterrestrial radiation (ETR and ETRn).
Various supplementary broadband irradiance measurements (GHI, DNI, DHI) as well as general
metrological data.
This combination of measured and calculated values offers the user a more comprehensive view of conditions
for the data set. The purpose of this document is to discuss the format of the data files and how each value
was obtained.
The files are csv files separated into month blocks that typically range in size between 100 and 130 MB. A
schematic diagram of the file format is shown in Figure 1. This article will discuss each of the areas shown in
the figure in the following order. Region 1 contains general information about the station. Region 2 contains
information about each column. Regions 3 contains non‐measured quantiles such as: date, time, solar
position, and extraterrestrial radiation. Region 4 contains measured irradiance quantities such as: GHI, DNI,

DHI broadband information along with other metrological data. Region 5 contains the spectral data set. There
are 219 columns of spectral irradiance data. Appendix A is a glossary of commonly used terms. Appendix B,
gives a list of the data in each column and the column numbers for quick access.
Figure 1: Schematic diagram of the file structure. The different regions of the file are labeled 1 ‐ 5. Not
drawn to scale.
File structure region 1.
Station ID information
The upper left corner of each file contains two columns with useful information about the file. An example is
shown in Figure 2. The sample shown is of columns 1‐3 and rows 1‐7.
Figure 2: A sample data set of the data contained in Region 1 of the file structure. columns 1‐3, rows 1‐7.
Station Location is the City, State, and country name of the station. The three names are separated by
an underscore “_”.
Latitude, longitude, and altitude of the station. The latitude and longitude are reported in degrees with
a decimal point representing fractions of a degree. The latitude and longitude are given to an accuracy of
the ±200 meters. The longitude of the station is given as a negative number as East is defined as positive.
The altitude of the station is given in meters above sea level.
The time zone of the station. The time zone is useful for calculating the sun’s position in the sky. The
time zone is a negative number as is conventionally written.

The year and month of the file block are separated by double forward slash marks “//”. This technique
prevents some programs, such as Excel, from auto formatting dates and times into their predetermined
format. By using the double forward slash, the information will not be recognized as a date and the format
of the file will be preserved.
File structure region 2.
Column header information
The header rows in the column information region contain information about each column. There are 9
header rows, with 6 rows of predefined values and 3 empty rows to allow space for notes.
A sample data set highlighting the header rows is shown in Figure 3. The screen shot is of columns 7‐21 and
rows 1‐10 and. In Figure 3, columns 13 ‐ 15 have been condensed to allow for easier viewing of the data set.
Figure 3: Sample data set of header rows. The sample shows columns 7 ‐ 21 and rows 1‐10. Columns 13 ‐ 15
have been condensed to allow for easier viewing.
Row 1. Type of measurement: The type of measurement that is made in this column. The labels are
self‐explanatory. Please refer to this document for a description of the various columns.
Row 2. Instrument: For broadband and general metrological data, the instrument making the
measurement is listed. Columns that are calculated are specified as such. For the spectral data, row 2 is the
wavelength of light being measured.
Row 3. Responsivity (Calibration Factor): The responsivity (or calibration factor) that was used to
convert the measured voltage signal to a broadband irradiance values. The formula relating voltage to
broadband irradiance is given by Equation 1A. The formula used by the spectroradiometer to compute the
spectral irradiance is given by Equation 1B.
Broadband Irradiance (Eq. 1 A)
Spectral Irradiance = Calibration_factor * Counts (Eq. 1 B)
The voltage is measured by the instrument and internally changed to irradiance by dividing by the
responsivity. The voltage of each measurement is not recorded, only the corresponding irradiance and
responsivity are recorded. The spectroradiometer uses a variation of this equation to compute the spectral
irradiance. It should be mentioned that the responsivity is one divided by the calibration factor.
The broadband as well as spectral measurements have either responsivity or calibration factor terms. For
the broadband instruments, the responsivities are computed at an angle of incidence of 45°. For the spectral
measurements the calibration factors are determined at an angle of incidence of 0°. The spectroradiometer
calibration factor will be discussed in more detail during the discussion in region 5.
Row 4. Estimated uncertainty: The estimated uncertainty is the percent uncertainty in the measured
value. The uncertainty is reported for the 95% level of confidence. The methodology used to determine the
broadband radiometer uncertainties is similar to the National Renewable Energy Laboratory’s (NREL)

Broadband Outdoor Radiometer Calibration methods (BORCAL) prior to the year 2015 as discussed by
Wilcox et al. 2002 [2]. The SRML characterizes each instrument at various angles of incidence and plans to
make this information available on the SRML website in the future [3]. Specific details about the uncertainty
of each instrument will be given during the discussion of the instrument.
Row 5. Units of each measurement: Standard units are used for each measurement. Typical units for
irradiance are W/m^2. Note the carrot symbol ^ is used to describe a number raised to a power. Typical
units for spectral irradiance are W/m^2/nm.
Rows 6 – 8. These three rows allow notes about each column. These columns are not as strictly defined
and are a place for the user/editor to make notes about the various columns as they see fit.
Row 9. To avoid confusion the column labels are repeated in row 9. The date/time information labels
are only included in row nine to allow room for the station ID information.
File structure section 3.
Date/Time, SZA/AZM, ETR/ETRn
The data presented from the Eugene Oregon monitoring station has a time interval of one minute. The data
file is separated into three regions. The left most region contains date and time information, solar position
information, and extraterrestrial irradiance information.
A sample data set for section 3 is shown in Figure 4. The sample shown highlights the time stamps near noon
on January 1, 2016. Note that the header row 9 is included to give the column labels.
Figure 4: Sample data set of section 3. The sample shown highlights the various date and time stamps.
Header row 9 is included for column labels.
The date and time of each row are written in three different date/time formats. The time is the time at the
site, given in local standard time.
Column 1. Year.Fractionofyear: The first column is the day of the year with a decimal point
representing the fraction of a year using the formula.
year. fractionofyear year .
(Eq.2)
For example: 2016, January 1st at 12 noon would be 2016.0013661202. The year 2016 was a leap year so
the days in the year for 2016 was 366 (not 365).
Column 2. DOY.Fractionofday: The second column is the day of the year (DOY) with the decimal point
representing the fraction of a day using the formula.
dayofyear. fractionofday dayofyear ∗
(Eq. 3)
For example: 2016, January 1st at 12 noon would be 1.5. The year is not included in this column.

Column 3. YYYY‐MM‐DD‐‐hh:mm ‐ The third column is the traditional view of dates and times, in order
from largest to smallest, year‐month‐day‐‐hour:minute (YYYY‐MM‐DD‐‐hh:mm). Note the double dash
marks “‐‐“, separate the date and the time. This is done to maintain the date and time format that are often
altered when files are imported into spreadsheets.
As an example: 2016, January 1st at 12 noon would be 2016‐01‐01‐‐12:00.
Columns 4 – 5. SZA and AZM: The solar zenith angle (SZA) and solar azimuthal angle (AZM) are
calculated using the SOLPOS algorithm [4] available from the NREL website. The SZA and the AZM are
reported in degrees. The solar zenith angle is computed using refraction through the atmosphere. The
calculation is done for the middle of time interval. Unlike the SOLPOS code the SZA is also given when the
sun is below the horizon.
Columns 6 – 7. ETR and ETRn: The extraterrestrial irradiance (ETR) on a horizontal surface and
extraterrestrial normal irradiance (ETRn) are calculated using the SOLPOS algorithm. The units of ETR and
ETRn are in W/m2. The ETRn is first calculated using Equation 4.
ETRn = 1360.8 * (1.000110 + 0.034221 * Cos[DA] + 0.001280 * Sin[DA] +
0.000719 * Cos[2 DA] + 0.000077 * Sin[2 DA] ) (Eq. 4)
where DA is the day angle in degrees given by the formula.
DA day of year 1 ∗
(Eq. 5)
The ETR is computed from the ETRn using Equation 6.
ETR ETRn ∗ Cos SZA (Eq. 6)
In Equations 4 and 6, the solar constant is defined as 1360.8 W/m2 instead of the previous value of 1367
W/m2. The ETR and ETRn are set to zero when the entire disk of the sun is below the horizon (SZA > 90.267°).
The angular radius of the sun is 0.267°. During the time intervals of sunrise and sunset, when the sun crosses
the SZA = 90.267° boundary, the ETR and ETRn are decreased by a scale factor dependent on the fraction of
time the sun is visible.
File structure section 4.
Metrological data
Along with the spectral irradiance, each data file has an extensive set of supplemental metrological data
that was simultaneously gathered at the site.
A sample data set of section 4 is shown in Figure 5. The sample shown is from January 1, 2016. The 9 header
rows are shown as well as several sample data points from around noon.

Figure 5: Sample data set of section 4. The sample shown highlights the various date and time stamps.
Header row 9 is included for column labels.
Column 8. GHI: The broadband global horizontal irradiance (GHI) was measured using a CMP22
pyranometer manufactured by Kipp and Zonen. The responsivity and uncertainty are reported in the data
files in rows 3 and 4. The uncertainty value reported in row 4 corresponds to uncertainties associated with
the responsivity of the instrument at an angle of incidence of 45°. The uncertainty associated with irradiance
measurements will increase this uncertainty. Due to systematic deviations in the cosine response of the
instrument, there are times of day and the year where the deviation is greater than the values expressed.
The GHI measurement is an average of 60 instantaneous measurements spanning the minute. For example,
the measurement listed at 12:00, would be an average of 60 measurements taken from 11:59:01 ‐ 12:00:00.
The units of the GHI are in W/m2.
Column 9. DNI: The direct normal irradiance (DNI) was measured using a NIP pyrheliometer
manufactured by Eppley. The responsivity and uncertainty are reported in the data files in rows 3 and 4.
The uncertainty value reported in row 4 corresponds to uncertainties associated with the responsivity of
the instrument at an angle of incidence of 45°. The uncertainty associated with irradiance measurements
will increase this uncertainty. The units of the data are in W/m2. The DNI measurement is an average of 60
instantaneous measurements spanning the minute.
Column 10. DHI: The diffuse horizontal irradiance (DHI) was measured using a Schenk Star pyranometer
with a shade ball blocking the sun. The responsivity and uncertainty are reported in the data files in rows 3
and 4. The uncertainty value reported in row 4 corresponds to uncertainties associated with the
responsivity of the instrument at an angle of incidence of 45°. The percent uncertainty was calibrated when
the instrument was under full sunlight. As there is no absolute pyranometer, the uncertainty of the diffuse
measurement is an estimate that is traceable to a reference pyranometer. The reference pyranometer’s
calibration is traceable to the international reference standard measurement. The uncertainty associated
with irradiance measurements will increase calibration uncertainty. The units of the data are in W/m2. The
DHI measurement is an average of 30 to 60 instantaneous measurements spanning the minute.
Column 11. Air temperature: The air temperature is given in degrees Celsius. The uncertainty in the
temperature is ±1%, as indicated by the manufacturer. The temperature measurement is single
instantaneous measurement.
Column 12. Air pressure: The air pressure is given in milliBars. The uncertainty in the pressure is 0.1%,
as indicated by the manufacturer. The pressure measurement is single instantaneous measurement.
Columns 13 ‐ 14. Wind speed and wind direction: The wind speed is given in meters/second with a 2%
uncertainty. The wind direction is given in degrees with 0° corresponding to north and 90° corresponding
to east, etc. The uncertainty in the wind direction is 2%. The wind measurements are single instantaneous
measurements.
Column 15. Relative Humidity: The relative humidity is given in percent. The uncertainty in the relative
humidity is 2%. The wind measurements are single instantaneous measurements.

Column 16. Notes: A column is allotted to allow the user to make notes in the data set. The notes
column separates the measured metrological data and the spectral data contained in region 5.
File structure region 5.
Spectral data
Global horizontal spectral irradiance data was gathered from May 2015 through December 2017 using an EKO
MS‐700 spectroradiometer. Data was gathered both night and day. The spectral irradiance data is an
instantaneous measurement. The units of the spectral irradiance are in W/m2/nm. Periodically there are gaps
in the data due to calibration, maintenance and use of the spectroradiometer for other tests. Missing data
points are given a value of “NA”.
A sample of the spectral data set is shown in Figure 6. The 9 header rows are included as well as several data
points from around noon on January 1, 2016. In the sample there are 7 low wavelength data points shown
and 4 high wavelength samples shown. There is a large portion of the middle wavelengths that are not shown
for brevity. At the time this data set was collected, the spectroradiometer was only gathering data in the
wavelength range 348.8 ‐ 1052.6, which is why there is “NA” in the extreme wavelengths.
Figure 6. Sample of the spectral data set. Wavelengths from 358 ‐ 1046 are not shown for brevity.
The spectral irradiance data set is contained in columns 17 through 235 in the data files. The wavelength
range of the spectral data is 335nm through 1059 nm. There are 219 columns of spectral data. Each spectral
data bin is roughly 3.3 nm apart. The wavelength of each column is listed in row 2 and in row 9 of the data
files.
The wavelength of each spectral data point is determined using Equation 7.
Wavelength = C0 + C1 N + C2 N2 + C3 N3 (Eq. 7)
C0 = 305.366 C1 = 3.33223 C2 = 0.000432354 C3 = ‐0.00000213888
The polynomial constants C0, C1, C2, and C3 were determined by the manufacturer. N is an integer bin number
ranging from 9 to 227. The file structure output of the EKO MS‐700 is designed to complement other
instruments manufactured by EKO with a wider wavelength range. This is the reason Equation 7 begins
recording data at Bin N = 9 instead of Bin 0 as one would expect. Also, the calibration of the instrument at
NREL allowed us to use the instrument in a slightly extended wavelength range (335 ‐ 1059 nm) beyond the
manufacturer’s specifications (350 ‐ 1050 nm). The accuracy of the wavelength measurement is ± 0.3 nm and
the optical resolution (full width at half max) of each bin is 10 nm. For more information regarding the
specifications of the EKO MS‐700 see the manufacturer’s specifications sheet [1].

During the preliminary installation of the instrument, the data logger was incorrectly programmed, and the
voltage measurements were able to extend beyond the range of the data logger. When this occurred, no
values were recorded and data of “NA” was reported. This is the reason why data cuts off at large spectral
irradiance values during high irradiance periods in certain wavelengths. This problem has been resolved in the
latter data files.
The spectroradiometer was calibrated at the factory in 2014. The spectroradiometer was subsequently
calibrated at NREL on a yearly basis against a NIST certified lamp [5,6]. All calibrations are performed at an
angle of incidence of 0°. The results of each calibration are shown in Figure 7.
Figure 7. The calibration factor of the spectroradiometer, during the three different calibrations that were
performed on the instrument.
The percentage difference in the various calibration factors are shown in Figure 8. The percent difference was
computed between each calibration factor and the average of the two calibrations performed at NREL. The
factory calibration deviates from the NREL calibrations at low wavelengths up to ‐18% (not shown in plot).
There is not much known about procedure or accuracy of the factory calibration. The two NREL calibrations
are within ±2% of each other at most wavelengths. All calibrations are within ±2% over the visible wavelength
range.
Figure 8. The percent difference in the three different calibrations.
Spectroradiometers are challenging to calibrate in the low and high wavelength ranges. In the low
wavelengths, the calibration lamp is relatively dim and the spectroradiometer photodiodes are relatively
insensitive, resulting in greater uncertainty. In higher wavelengths, the photodiodes of the spectroradiometer
are sensitive to temperature variations also resulting in greater uncertainty. These larger uncertainties are
visible in the variations that exist in Figure 8 in the wavelengths below 400 nm and above 1000 nm.
The calibration values shown in Figure 7 were used on the instrument in making spectral irradiance
measurements from that day onward in three separate measurement periods. Table 1. lists the start and end
dates of the various measurement periods. The calibration factors were not retroactively averaged.

Table 1. Start and end dates of the three different measurement periods and the calibrations factors used
during each period.
Calibration used Start date End date
Factory calibration 2015‐05‐01 2016‐07‐11
NREL_2016‐07‐12 2016‐07‐12 2017‐10‐30
NREL_2017‐10‐31 2017‐10‐31 2017‐12‐31
The uncertainty of the spectroradiometer was performed using the GUM model and a procedure outlined by
Peterson et al [7,8]. The expanded uncertainty (U95%) at each wavelength is listed in row 4 of the data files.
The uncertainty is between 4.4 and 6.6%. This uncertainty includes uncertainties associated with the
calibration of the instrument and the cosine response of the instrument over the angle of incidence range of
30 and 60°. The manufacturer’s uncertainty for the instrument is less than 7% which is agreement with the
experimental results that were experimentally determined.
The spectroradiometer was calibrated at an angle of incidence of 0°. However, the instrument is used in a
global horizontal setting, where the sun’s position is constantly changing throughout the day. Because the
angle of incoming light is constantly varying, the variations in the cosine response of the instrument must be
understood. Figure 9 shows the expanded uncertainty in the calibration factor vs wavelength under different
conditions. The notation “%u95CF (+)”denotes, the expanded uncertainty in the calibration factor at angles
of incidence between 45° and 60°. The notation “%u95CF (‐)”denotes, the expanded uncertainty in the
calibration factor at angles of incidence between 30° and 45°. The notation “%u95CF (no angle uncertainty)”
denotes the expanded uncertainty in the instrument if there were not any cosine response, which
corresponds to an angle of incidence of θ = 0°.
Figure 9. The uncertainty in the spectroradiometer calibration factor.
The uncertainty values shown in Figure 9 include all uncertainties associated spectral irradiance
measurements, including uncertainties associated with the calibration, uncertainties associated with the
variations in the temperature, and uncertainties associated with the angle of incidence.
Just to be clear, the %U95CF(+) term shown in Figure 9, is our best guess at the uncertainty of the spectral
irradiance measurement made by the instrument under all sky conditions and all zenith angles less than 60°.
Uncertainty values for zenith angles greater than 60° are not known at this time. These uncertainty values are
listed in Row 4 of the data files.
Samples of various spectrum
To give a full understanding of the spectral nature of sunlight, several spectrum examples are shown below.
These plots are intended to illustrate various features of the information contained in the spectral files. Note
that this is a small subset of the entire data set and is only intended to give the reader a better understanding
of the data. A brief description of
Figure 10. DNI vs time. The figures shown below are from 2017‐07‐12. This day was clear the entire day. This
is demonstrated by the DNI vs time plot shown.
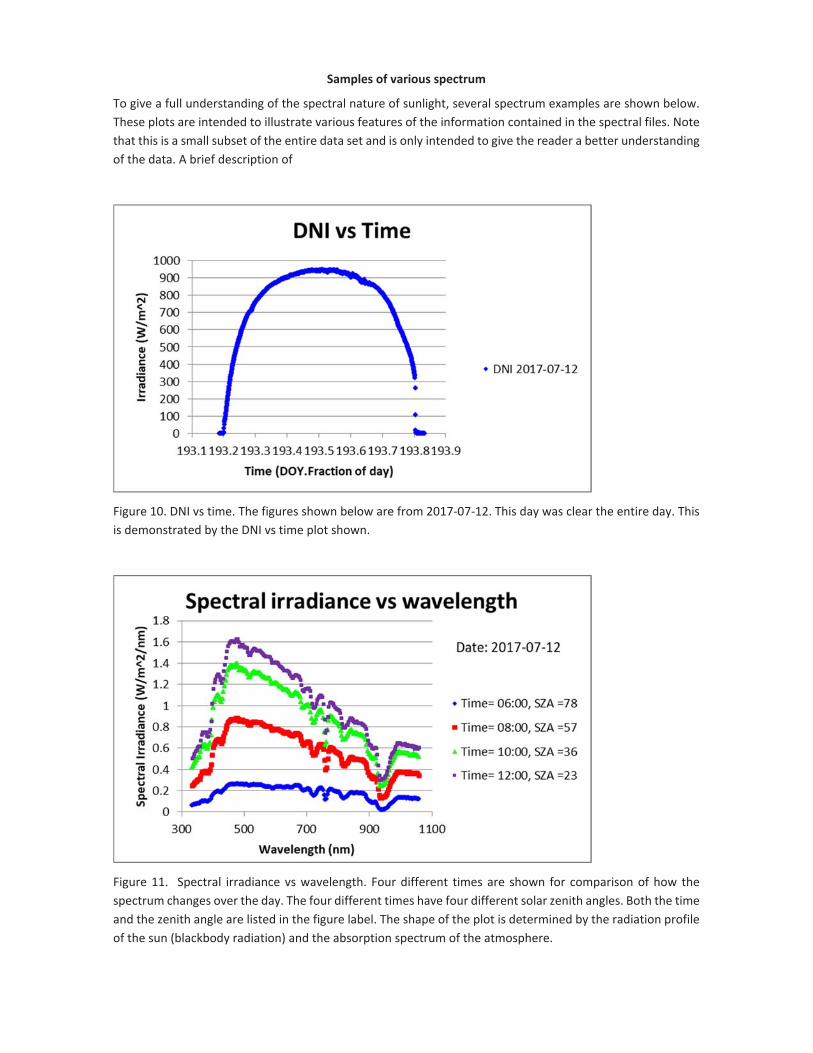
Figure 11. Spectral irradiance vs wavelength. Four different times are shown for comparison of how the
spectrum changes over the day. The four different times have four different solar zenith angles. Both the time
and the zenith angle are listed in the figure label. The shape of the plot is determined by the radiation profile
of the sun (blackbody radiation) and the absorption spectrum of the atmosphere.

Figure 12. Normalized spectral irradiance vs wavelength. To see how the various spectrum changes
throughout the day. The spectrum shown in Figure 11, are divided by the maximum value of that column. For
example, the spectrum of Time 12:00 was divided by a value of 1.6 W/m^2/nm, and the data of Time 10:00
was divided by a value of 1.4. When the sun is low in the sky (early morning when SZA is large), the spectrum
is shifted toward the red. This is because the blue is more scattered.
Figure 13. Spectral irradiance vs time. The spectral irradiance of 4 discrete wavelengths are plotted vs time
for an entire day. Note that the intensity of each wavelength is different however the curves all mimic a GHI
broadband vs time curve (shown in black). The GHI vs time curve has been divided by 1000 to put it on the
same axis as the spectral irradiance plot.
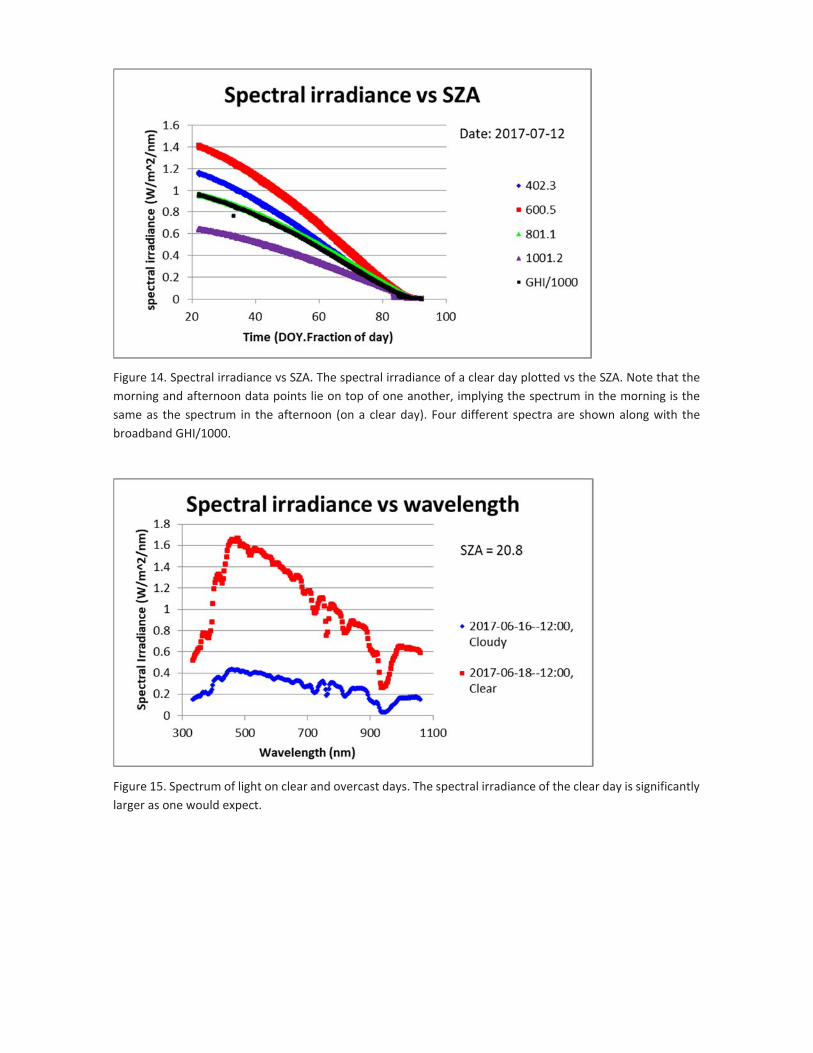
Figure 14. Spectral irradiance vs SZA. The spectral irradiance of a clear day plotted vs the SZA. Note that the
morning and afternoon data points lie on top of one another, implying the spectrum in the morning is the
same as the spectrum in the afternoon (on a clear day). Four different spectra are shown along with the
broadband GHI/1000.
Figure 15. Spectrum of light on clear and overcast days. The spectral irradiance of the clear day is significantly
larger as one would expect.

Figure 16. Normalized spectrum of light on clear and overcast days. Each spectrum has been divided by its
maximum value. The overcast day has a larger of “red” spectrum. The absorption that occurs at 950 nm, is
larger on the overcast day. The relative humidity on the clear day was 45%. On the overcast day the relative
humidity was 70%.
Figure 17. Variations in spectrum at different times of year. The spectrum of two clear days were compared,
July vs November. The spectra were taken during a clear day period and when the SZA was 60°.

13. Acknowledgements
The UO Solar Radiation Monitoring Laboratory would like to thank Dyson Technology Ltd., the Bonneville
Power Administration, the Energy Trust of Oregon, Oregon Department of Energy, the National Renewable
Energy Laboratory, and PGE for support that makes this work possible.
Appendix A
Glossary of commonly used terms
AZM: Solar azimuthal angle.
Broadband: The total irradiance value of all wavelengths of light including UV, visible, and infrared.
Calibration Factor: The calibration factor that converts an electrical signal (or counts) into an irradiance value.
The calibration factor for each instrument is known by performing a calibration of each instrument.
DHI: Diffuse horizontal irradiance
DNI: Direct normal irradiance
DOY: Day of year, January 1 = 1, February 1 = 32, March 1 (Non‐leap year) = 60 etc.
EKO MS‐700 spectroradiometer: The spectroradiometer used to make the spectral measurements. EKO is the
manufacturer of the spectroradiometer.
ETR: Extraterrestrial radiation on a horizontal surface.
ETRn: Extraterrestrial radiation on a normal surface.
GHI: Global horizontal irradiance
LST: Local standard time
NREL: National Renewable Energy Laboratory
SOLPOS: Solar position calculator
SRML: The University of Oregon, solar radiation monitoring lab.
SZA: Solar zenith angle
Appendix B
Condensed column labels and locations
A condensed form of the information contained in the data files are listed in Table 2. The information
contained in each column is listed along with the column numbers. For ease of use in spreadsheet programs,
the alphabetical number of each column is also listed. The following table is intended to be a quick reference.
For a complete description of each column see the main article.

Table 2: Condensed form of the data set. Column numbers are listed along with the information contained
in each column.
Column number
Alphabetical number
Column Label Description
1 A Year.Fractionofyear Date/time
2 B DOY.Fractionofday Date/time
3 C YYYY‐MM‐DD‐‐hh:mm Date/time
4 D SZA Sun position
5 E AZM Sun position
6 F ETR (W/m^2) Calculated extraterrestrial radiation
7 G ETRn (W/m^2) Calculated extraterrestrial radiation
8 H GHI Metrological irradiance data
9 I DNI Metrological irradiance data
10 J DHI Metrological irradiance data
11 K Air_Temperature Atmospheric metrological data
12 L Air_Pressure Atmospheric metrological data
13 M Wind_Speed Atmospheric metrological data
14 N Wind_Direction Atmospheric metrological data
15 O Relative_Humidity Atmospheric metrological data
16 P Notes Blank column (Room for notes)
17 Q 335.4 nm Spectral irradiance
18 R 338.7 nm Spectral irradiance
19 ‐ 234 S ‐ HZ 342.1 ‐ 1055.8 nm Spectral irradiance
235 IA 1059 nm Spectral irradiance
14. References
[1]: EKO Instruments CO., LTD Grating Spectroradiometer MS‐700N Instruction Manual Ver.1 https://eko‐
eu.com/products/solar‐energy/spectroradiometers/ms‐700n‐spectroradiometer
[2]: Wilcox, S., et al. (2002). Improved Methods for Broadband Outdoor Radiometer Calibration (BORCAL).
Proceedings of the ARM Science Team Meeting, St. Petersburg, Florida, April 2002.
[3] http://solardat.uoregon.edu/
[4]: SOLPOS Website: http://rredc.nrel.gov/solar/codesandalgorithms/solpos/solpos.c (October 2017)
[5]: Habte, A.; et al. (2013). Uncertainty Analysis of Spectral Irradiance Reference Standards Used for NREL
Calibrations. 22 pp.; NREL Report No. TP‐5500‐58617.

[6]: ASTM Standard G‐138‐12, “Standard Test Method for Calibration of a Spectroradiometer Using a Standard
Source of Irradiance,” ASTM International, West Conshohocken, PA, www.astm.org.
[7]:BIPM, IEC, IFCC, ISO, IUPAC, IUPAP and OIML. (1995). Evaluation of Measurement Data ‐ Guide to the
Expression of Uncertainty in Measurement. Geneva: ISO TAG 4.
[8]: Peterson, et al. Developing a spectroradiometer data uncertainty methodology. Solar Energy 149 (2017)
60–76.
Related Documents