15 SEPTEMBER 2000 3285 RUIZ-BARRADAS ET AL. q 2000 American Meteorological Society Structure of Interannual-to-Decadal Climate Variability in the Tropical Atlantic Sector ALFREDO RUIZ-BARRADAS,JAMES A. CARTON, AND SUMANT NIGAM Department of Meteorology, University of Maryland at College Park, College Park, Maryland (Manuscript received 21 July 1999, in final form 3 December 1999) ABSTRACT A search for coupled modes of atmosphere–ocean interaction in the tropical Atlantic sector is presented. Previous studies have provided conflicting indications of the existence of coupled modes in this region. The subject is revisited through a rotated principal component analysis performed on datasets spanning the 36-yr period 1958–93. The analysis includes four variables, sea surface temperature, oceanic heat content, wind stress, and atmospheric diabatic heating. The authors find that the first rotated principal component is associated with fluctuations in the subtropical wind system and correlates with the North Atlantic oscillation (NAO), while the second and third modes, which are the focus of interest, are related to tropical variability. The second mode is the Atlantic Nin ˜o mode with anomalous sea surface temperature and anomalous heat content in the eastern equatorial basin. Wind stress weakens to the west of anomalously warm water, while convection is shifted south and eastward. Surface and upper-level wind anomalies of this mode resemble those of El Nin ˜o–Southern Oscillation (ENSO) events. When the analysis is limited to boreal summer, the season of maximum amplitude, the Atlantic Nin ˜ o mode explains 7.5% of the variance of the five variables. Thermodynamic air–sea interactions do not seem to play a role for this mode. The third mode is associated with an interhemispheric gradient of anomalous sea surface temperature and a dipole pattern of atmospheric heating. In its positive phase anomalous heating occurs over the warmer Northern Hemisphere with divergence aloft shifting convection to the north and west of the equator and intensifying the subtropical jet stream, while descending motion occurs on the western side of the Southern Hemisphere. Surface and subsurface structures in the ocean are controlled by surface winds. This interhemispheric mode is strongest in boreal spring when it explains 9.1% of the combined variance of the five variables. Thermodynamic air–sea interactions do seem to control the associated sea surface temperature anomalies, although equatorial dynamics may play a role as well. The authors also examine the connection of the tropical Atlantic to other basins. ENSO events cause patterns of winds, heating, and sea surface temperatures resembling the interhemispheric mode described above. The lag between changes in the Atlantic and Pacific is 4–5 months for the interhemispheric mode. In contrast, no significant impact of ENSO is found on the Atlantic Nin ˜o mode. Likewise, no impact of the midlatitude North Atlantic (the NAO) is found on the Tropics, but some impact of the Tropics is found on the midlatitude North Atlantic. 1. Introduction Early observational studies of the causes of tropical rainfall fluctuations in the Atlantic sector focused at- tention on the connection to anomalies of sea surface temperature (SST) (Merle 1980; Hisard 1980; Moura and Shukla 1981). These studies found two different SST patterns. The first was a northward shift of tropical convection in the western Atlantic in response to an anomalous northward gradient of SST in boreal spring, an interhemispheric mode often referred to as the At- lantic dipole. The second was a southward shift of con- vection in the eastern Atlantic in response to rising SST in boreal summer, a phenomenon we refer to as the Corresponding author address: Dr. James A. Carton, Department of Meteorology, University of Maryland at College Park, College Park, MD 20742-2425. E-mail: [email protected] Atlantic Nin ˜o. The existence of the first mode was con- firmed apparently by studies examining the principal components of SST variability (Weare 1977; Servain 1991; Nobre and Shukla 1996; Chang et al. 1997) and has also been supported by examination of the dynam- ical processes by which SST influences meteorology (Hastenrath and Greischar 1993) and by which meteo- rology influences SST (Carton et al. 1996; Delworth and Mehta 1998). However, it was pointed out by Houghton and Tourre (1992) and Enfield and Mayer (1997) that the requirement of orthogonality of spatial patterns imposes an unnecessary constraint on the anal- ysis. They found that if that constraint was dropped then SST anomaly patterns in the Northern and Southern Hemispheres tend to act independently. Recently, a number of studies have appeared exam- ining decadal tropical and midlatitude Atlantic climate variability. Some of these studies (Rajagopalan et al. 1998; Robertson et al. 1998; Tourre et al. 1999) suggest

Welcome message from author
This document is posted to help you gain knowledge. Please leave a comment to let me know what you think about it! Share it to your friends and learn new things together.
Transcript

15 SEPTEMBER 2000 3285R U I Z - B A R R A D A S E T A L .
q 2000 American Meteorological Society
Structure of Interannual-to-Decadal Climate Variability in the Tropical Atlantic Sector
ALFREDO RUIZ-BARRADAS, JAMES A. CARTON, AND SUMANT NIGAM
Department of Meteorology, University of Maryland at College Park, College Park, Maryland
(Manuscript received 21 July 1999, in final form 3 December 1999)
ABSTRACT
A search for coupled modes of atmosphere–ocean interaction in the tropical Atlantic sector is presented.Previous studies have provided conflicting indications of the existence of coupled modes in this region. Thesubject is revisited through a rotated principal component analysis performed on datasets spanning the 36-yrperiod 1958–93. The analysis includes four variables, sea surface temperature, oceanic heat content, wind stress,and atmospheric diabatic heating. The authors find that the first rotated principal component is associated withfluctuations in the subtropical wind system and correlates with the North Atlantic oscillation (NAO), while thesecond and third modes, which are the focus of interest, are related to tropical variability.
The second mode is the Atlantic Nino mode with anomalous sea surface temperature and anomalous heatcontent in the eastern equatorial basin. Wind stress weakens to the west of anomalously warm water, whileconvection is shifted south and eastward. Surface and upper-level wind anomalies of this mode resemble thoseof El Nino–Southern Oscillation (ENSO) events. When the analysis is limited to boreal summer, the season ofmaximum amplitude, the Atlantic Nino mode explains 7.5% of the variance of the five variables. Thermodynamicair–sea interactions do not seem to play a role for this mode.
The third mode is associated with an interhemispheric gradient of anomalous sea surface temperature and adipole pattern of atmospheric heating. In its positive phase anomalous heating occurs over the warmer NorthernHemisphere with divergence aloft shifting convection to the north and west of the equator and intensifying thesubtropical jet stream, while descending motion occurs on the western side of the Southern Hemisphere. Surfaceand subsurface structures in the ocean are controlled by surface winds. This interhemispheric mode is strongestin boreal spring when it explains 9.1% of the combined variance of the five variables. Thermodynamic air–seainteractions do seem to control the associated sea surface temperature anomalies, although equatorial dynamicsmay play a role as well.
The authors also examine the connection of the tropical Atlantic to other basins. ENSO events cause patternsof winds, heating, and sea surface temperatures resembling the interhemispheric mode described above. The lagbetween changes in the Atlantic and Pacific is 4–5 months for the interhemispheric mode. In contrast, no significantimpact of ENSO is found on the Atlantic Nino mode. Likewise, no impact of the midlatitude North Atlantic (theNAO) is found on the Tropics, but some impact of the Tropics is found on the midlatitude North Atlantic.
1. Introduction
Early observational studies of the causes of tropicalrainfall fluctuations in the Atlantic sector focused at-tention on the connection to anomalies of sea surfacetemperature (SST) (Merle 1980; Hisard 1980; Mouraand Shukla 1981). These studies found two differentSST patterns. The first was a northward shift of tropicalconvection in the western Atlantic in response to ananomalous northward gradient of SST in boreal spring,an interhemispheric mode often referred to as the At-lantic dipole. The second was a southward shift of con-vection in the eastern Atlantic in response to rising SSTin boreal summer, a phenomenon we refer to as the
Corresponding author address: Dr. James A. Carton, Departmentof Meteorology, University of Maryland at College Park, CollegePark, MD 20742-2425.E-mail: [email protected]
Atlantic Nino. The existence of the first mode was con-firmed apparently by studies examining the principalcomponents of SST variability (Weare 1977; Servain1991; Nobre and Shukla 1996; Chang et al. 1997) andhas also been supported by examination of the dynam-ical processes by which SST influences meteorology(Hastenrath and Greischar 1993) and by which meteo-rology influences SST (Carton et al. 1996; Delworthand Mehta 1998). However, it was pointed out byHoughton and Tourre (1992) and Enfield and Mayer(1997) that the requirement of orthogonality of spatialpatterns imposes an unnecessary constraint on the anal-ysis. They found that if that constraint was dropped thenSST anomaly patterns in the Northern and SouthernHemispheres tend to act independently.
Recently, a number of studies have appeared exam-ining decadal tropical and midlatitude Atlantic climatevariability. Some of these studies (Rajagopalan et al.1998; Robertson et al. 1998; Tourre et al. 1999) suggest

3286 VOLUME 13J O U R N A L O F C L I M A T E
that tropical ocean–atmosphere interaction variabilitycan perturb the North Atlantic. This Tropics–midlatitudeconnection is mostly identified through inspection ofspatial patterns from modeling experiments (Robertsonet al. 2000) and empirical analyses (Tourre et al. 1999;Rajagopalan et al. 1998). In both cases, however, cor-relations do not reach high values. However, Robertsonet al. (2000) suggest that sea surface temperature anom-alies in the tropical and subtropical South Atlantic (rath-er than those in the northern tropical Atlantic) affect theNorth Atlantic variability. Mehta (1998) suggests a re-lation between tropical and extratropical annual SSTanomalies, but concludes that ‘‘there was no dynamical–thermodynamical, dipole mode of SST variations.’’ In-stead the author argues for SST anomalies occurringindependently in each hemisphere. Finally, Xie and Tan-imoto (1998) and Tanimoto and Xie (1999) proposethrough modeling and empirical studies that decadal ex-tratropical forcing of the Tropics, excited by the NorthAtlantic oscillation (NAO), can force a dipole patternlinking the two hemispheres.
In addition to the tropical–midlatitude link, there isalso evidence of a tropical connection between El Ninoevents in the Pacific and anomalously warm events inthe northern tropical Atlantic. Lanzante (1996) and En-field and Mayer (1997) show correlations of 0.5 betweenthose areas and events with a 4–5-month lag. Enfieldand Mayer (1997) state that 25% of the variance of theinterhemispheric mode is forced by El Nino–SouthernOscillation (ENSO) events. A relationship between theAtlantic Nino mode and Pacific variability has also beensuggested by previous studies (Servain 1991; Cartonand Huang 1994). They suggest a relaxation of the tradewinds in the western Atlantic leads to an accumulationof warm water. Servain (1991) shows a mean correlationof 20.28 when the southern Atlantic (south of 58N)leads ENSO events (cool events) by 6–11 months; En-field and Mayer (1997) show a correlation of 20.3 withthe principal component time series of their southernAtlantic mode when this lags ENSO events by 4 months,while Zebiak (1993) with his equatorial Atlantic index(38S–38N) found a 20.07 correlation. We reexaminethese relations here in order to determine what fractionof the variance associated with our Atlantic modes couldbe forced remotely.
In spite of all the research cited above, there is stilldisagreement over the identification of coherent modesof variability in the atmosphere and ocean in the tropicalAtlantic and their structure. We believe that part of thedisagreement results from attempts to identify thesemodes based solely on ocean data. Here we revisit theissue of coupled modes in the tropical Atlantic sector.Since modes of the coupled system must involve bothatmospheric and oceanic variables, we undertake a com-bined analysis of variables in both fluids. The variableswe consider include surface variables (SST, surfacewind stress), a measure of ocean dynamical processes(ocean heat content), and a measure of atmospheric con-
vection (diabatic heating). Two of these variables haveonly recently become available as the result of reanalysisprojects. Our approach is to compute the leading struc-tures of recurrent variability from the covariance matrixof the combined normalized variables using the singularvalue decomposition (SVD) method to compute eigen-vectors and eigenvalues efficiently. Then an orthogonalrotation is applied to the extracted eigenvectors. Thepercentages of explained variance decrease rapidly asatmospheric and oceanic variables are added since onlythose motions involving both fluids (and properly rep-resented in the datasets) are identified. Thus the readershould expect the principal modes to explain small frac-tions of the total variance.
In addition to identifying and characterizing coupledmodes of variability and their seasonality we would liketo understand their relationship to other variables andto remote influences. To explore these relationships wepresent a series of studies of the strength of the regres-sion of other variables upon the component time seriesof the modes as well as against indices associated withother phenomena on the tropical Atlantic. In this waywe explore the covariations of a variety of variables notpart of the original analysis.
2. Data and method
Observation data used in this study are monthly seasurface temperature, 0–276-m ocean heat content, windstress, residually diagnosed atmospheric diabatic heat-ing at 500 mb and horizontal divergence at 850 and 200mb. Sea surface temperature and winds are obtainedfrom the Comprehensive Ocean–Atmosphere Data Setanalysis of da Silva et al. (1994), which is available forthe period 1950–93. Subsurface temperatures are avail-able from the ocean data assimilation analysis of Cartonet al. (2000a,b) and Chepurin and Carton (1999) for theperiod 1950–96. The analysis uses nearly all historicaltemperature and salinity measurements as constraints onthe upper levels of an ocean general circulation model.Heat content has been computed by integration of oceantemperature from the surface to 276-m depth. This depthhas been chosen based on results of D. Blankinship(1997, personal communication) who found that at adepth of 240 m 95% of the temperature variability iscaptured.
In the Tropics atmospheric circulation is driven to asignificant degree by the distribution of diabatic heatingand associated convergences near the surface and di-vergences aloft. We examine the relationship of thesefields to oceanic variables by including diabatic heatingin the combined variability analysis. The diabatic heat-ing is residually diagnosed (e.g., Nigam 1994; Nigamet al. 2000) from the National Centers for EnvironmentalPrediction (NCEP) reanalysis for the period 1958–93.The pressure level of diabatic heating included in ouranalysis, 500 mb, has been chosen to be consistent withits climatological maximum (the results are insensitive

15 SEPTEMBER 2000 3287R U I Z - B A R R A D A S E T A L .
to this choice). The levels of divergence/convergence,850 and 200 mb, have been chosen to define the cir-culation above and below the height of maximum heat-ing. A secondary analysis was carried out using theEuropean Centre for Medium-Range Weather Forecasts(ECMWF) reanalysis. The results were consistent withthose produced using the NCEP reanalysis, but the pe-riod of the ECMWF dataset is shorter (1979–93).
Some of the datasets such as surface winds and SSThave long-term trends. In the case of surface winds thesetrends are likely to be spurious, possibly associated withchanges in measurement platforms (Clarke and Lebedev1997). In order to minimize the effect of these trendson the analysis we have removed a linear trend fromall datasets at each spatial location using a least squarestechnique. Following this detrending monthly anomaliesare calculated with respect to the seasonal cycle com-puted from their respective record for the common 36-yr period of 1958–93; our primary dataset was thusformed. This record may be too short for detection ofasynchronous modes at long periods.
Our approach is to carry out a rotated principal com-ponent analysis of the combined variability. The basicanalysis uses the five variables as discussed in the in-troduction. However, the analysis has been repeatedwith one (SST) and three variables (SST and winds).Results for the three-variable case were qualitativelysimilar to those presented here.
Different variables should be normalized before car-rying out a combined analysis. A common approach isto normalize each variable by its local standard devia-tion, thus making different variable types comparablein size, as well as removing the effects of differingspatial distributions of variability. Here we take the al-ternative approach of Nigam and Shen (1993) and nor-malize each variable by another measure of variability,the square root of the spatially integrated temporal var-iance. Additionally, before normalizing anomalies, anarea weighting of the anomalies is done followingChung and Nigam (2000) in order to avoid overem-phasizing the variability in the higher grid-density areas.
The eigenvalues and eigenvectors of the anomaly co-variance matrix are obtained from the SVD analysis ofthe anomaly matrix. The eigenvectors are then rotated.Rotation relaxes the constraint of orthogonality of thespatial patterns but preserves this constraint for the prin-cipal component time series. By relaxing the spatialorthogonality constraint the spatial patterns of the ro-tated eigenvectors should be more directly related to thenatural patterns of variability in the physical system(Richman 1986). A number of algorithm choices arepossible for rotation. Here we follow Houghton andTourre (1992) and apply the varimax technique usingthe IMSL (1989) FROTA routine. We also follow theusual practice and limit the number of eigenvectors torotate. In the results presented below we use the first10 eigenvectors that individually captured 2% or moreof the combined variance (together explaining 38%).
Experiments with 8 and 12 eigenvectors show that theresults are insensitive to this choice.
Correlations between time series were calculated us-ing the Fisher Z transformation. Confidence at the 95%level is obtained in those coeficients taking into accountserial correlation (Angell 1981; Reid et al. 1989).
3. Coupled variability in the tropical Atlantic
In order to focus our attention on that fraction of theatmospheric and oceanic thermal and momentum fieldsassociated with coupled variability we begin with acombined rotated principal component analysis of thecomplete set of monthly anomalies of all calendarmonths in a domain extending from 208S to 308N. Thevariables we choose are heat content (hc), sea surfacetemperature (sst), zonal and meridional wind stress(taux, tauy), and diabatic heating (q) anomalies. Themode that explains the largest fraction of shared vari-ance (5.8%) has a spatial pattern that is primarily as-sociated with movements of the subtropical wind system(poleward of 208N), which is not the subject of thispaper. The next two Tropics-related modes are shownin Figs. 1 and 2 and both explain the same 4.9% of theshared variance. These modes are clearly of significanceas in the rotated analysis of SSTs alone, the correspond-ing SST modes account for 17% and 18.4% of the SSTvariance.1
a. Atlantic Nino
The SST signature of the second mode is mainly con-fined to the eastern equatorial region. The structure ofthis Atlantic equatorial anomaly pattern is more closelyconfined to the eastern basin, but spanning a broaderrange of latitudes than suggested by the results of Zebiak(1993). However, it is quite consistent with the SSTanomaly pattern obtained by compositing warm eventsduring the past several decades (1963, 1966, 1968,1973–74, 1981, 1984, 1987, 1988) and, in particular tothe well-documented SST anomaly pattern in 1984 (Car-ton and Huang 1994). Warming of SST in the easternbasin is accompanied by an eastward shift of warm wa-ter, a relaxation of the equatorial trade winds in thecentral basin, and a southward shift of convection. Thispicture resembles El Nino so we will refer to this modeas the Atlantic Nino. A spectral analysis (not shown)of the principal component of this mode has interdecadaland interannual (2.25 yr) peaks.
To determine the corresponding wind divergence as-sociated with the pattern of diabatic heating in Fig. 1we project the principal component time series onto thedivergence at 850 and 200 mb. Examination of diabatic
1 Explained variance amounts are comparatively smaller in com-bined variability analysis.

3288 VOLUME 13J O U R N A L O F C L I M A T E
FIG. 1. Anomalies of the Atlantic Nino mode and its associated principal component coefficient (PCC) from a 5-variable rotated combinedanalysis: hc9 (108 3 J m22) (upper left), tau9 (dyn cm22) (upper right), sst9 (8C) (middle left), q9 (8C day21) at 500 mb (middle right), andPCC smoothed with a 12-month running mean (lower). Only wind stress anomalies larger than 0.02 dyn cm22 are shown. Explained varianceis 4.9%. Dark (light) shading denotes positive (negative) anomalies.
heating in Fig. 1 shows positive heating anomalies tothe southeast and negative anomalies to the north of theclimatological maximum in heating (e.g., Fig. 1.4 inPhilander 1990), suggesting that the intertropical con-vergence zone (ITCZ) has been shifted southward bythe warming of surface waters. The divergence field is
shown in the left panels of Fig. 3. It is worth notingthat while the 200-mb anomalies are structurally similarto midtropospheric heating, the 850-mb anomalies arenot, particularly, in the western sector. This reflects achange in the vertical distribution of equatorial heatingacross the Atlantic basin [see upcoming Fig 4, (top)].

15 SEPTEMBER 2000 3289R U I Z - B A R R A D A S E T A L .
FIG. 2. Anomalies of the interhemispheric mode and its associated PCC from a 5-variable rotated combined analysis: hc9 (108 3 J m22) (upperleft), tau9 (dyn cm22) (upper right), sst9 (8C) (middle left), q9 (8C day21) at 500 mb (middle right), and PCC smoothed with a 12-month runningmean (lower). Only wind stress anomalies larger than 0.02 dyn cm22 are displayed. Explained variance is 4.9%. Shading as in Fig. 1.
The vertical structure of diabatic heating along theequator associated with the Atlantic Nino mode is shownin Fig. 4 (top). This vertical projection shows warmingthroughout the troposphere above 925 mb, extendingfar onto adjacent continents. The height of maximumheating shifts upward in the air column over the Am-
azon, while in the lowest 75 mb we find diabatic cooling.In order to determine the relative importance of indi-vidual terms in making up the full diabatic heating, weproject the principal component time series on the in-dividual heating terms from the NCEP reanalysis forthe 1973–93 subperiod. The three-dimensional diabatic

3290 VOLUME 13J O U R N A L O F C L I M A T E
FIG. 3. Regression of divergence anomalies (1027 s21) at 200 mb (top) and 850 mb (bottom) levels on the rotated PCC of the AtlanticNino (left) and interhemispheric (right) modes. Dark (light) shading denotes divergence (convergence) anomalies.
FIG. 4. Regression of averaged diabatic heating anomalies (8Cday21) along 2.58S–2.58N and 268–318W on the rotated PCC of theAtlantic Nino (top) and interhemispheric (bottom) modes. Dark (light)shading denotes warming (cooling) anomalies.
heating components from the reanalysis data are gen-erated during a 6-h model forecast. We find total diabaticheating is dominated by the release of latent heat in-duced in deep cloud formation [cf. Fig. 1 and Fig. 5(top)]. Longwave radiation heating at 850 mb [Fig. 5(bottom)] is positively correlated with the SST anom-alies and deep convective heating. The longwave heat-ing results from the trapping of longwave radiation be-neath the tropical clouds. A similar distribution of heat-ing occurs during ENSO variability, with longwaveheating anomalies occurring as in the ‘‘shadow’’ of thedeep convective heating anomalies (Nigam et al. 2000).At lower levels the cooling effect of evaporating rainbecomes an important factor and causes the change ofsign of diabatic heating in the lowest 75 mb observedin Fig. 4. We have repeated the examination using re-sidually calculated diabatic heating from the shorterECMWF reanalysis. The heating results resemble thosedisplayed in Fig. 5 except that the values are higher oncontinental areas.
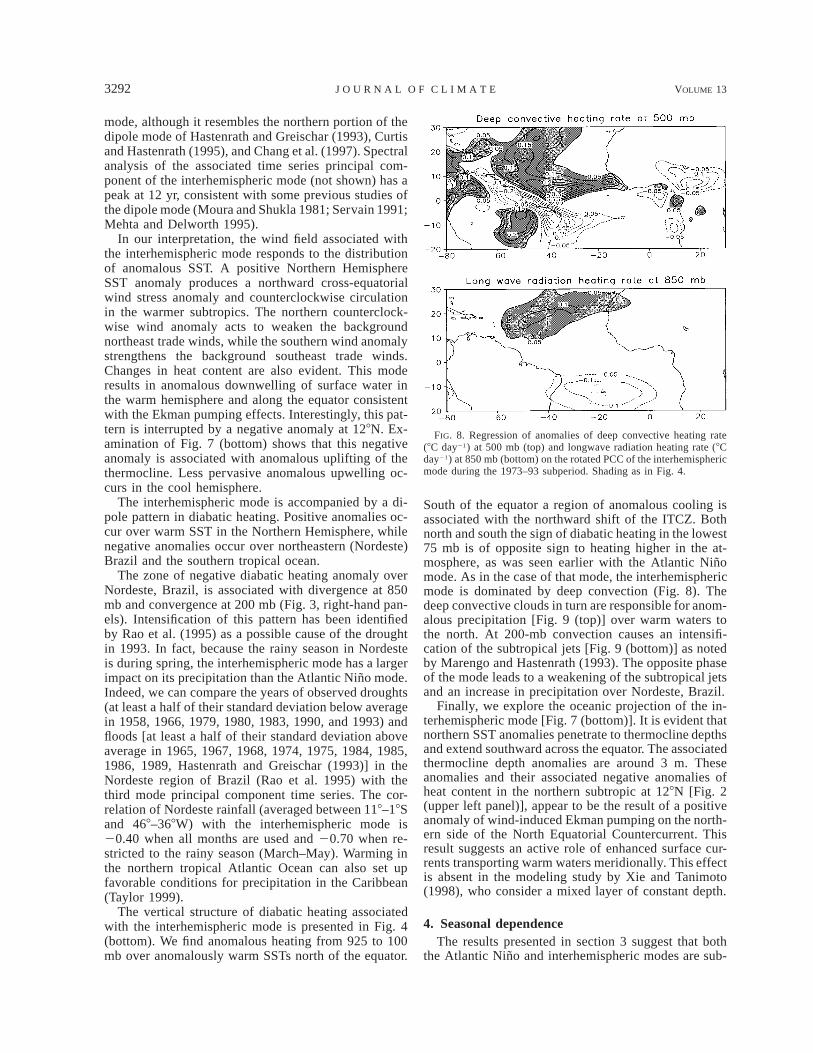
Regression of anomalies of precipitation (from thedataset of Xie and Arkin 1997) during the 1979–93subperiod and anomalies of wind at 200 mb on theAtlantic Nino mode principal component time seriesshow enhanced precipitation along the equatorial At-
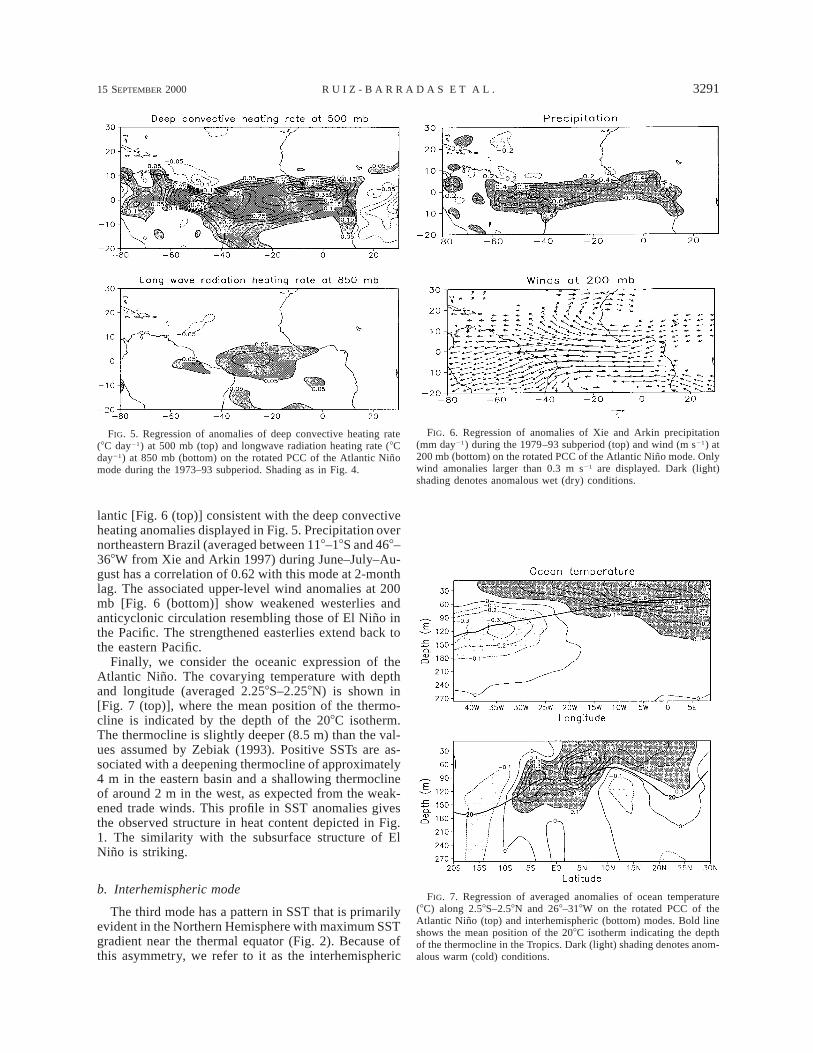
15 SEPTEMBER 2000 3291R U I Z - B A R R A D A S E T A L .
FIG. 5. Regression of anomalies of deep convective heating rate(8C day21) at 500 mb (top) and longwave radiation heating rate (8Cday21) at 850 mb (bottom) on the rotated PCC of the Atlantic Ninomode during the 1973–93 subperiod. Shading as in Fig. 4.
FIG. 6. Regression of anomalies of Xie and Arkin precipitation(mm day21) during the 1979–93 subperiod (top) and wind (m s21) at200 mb (bottom) on the rotated PCC of the Atlantic Nino mode. Onlywind amonalies larger than 0.3 m s21 are displayed. Dark (light)shading denotes anomalous wet (dry) conditions.
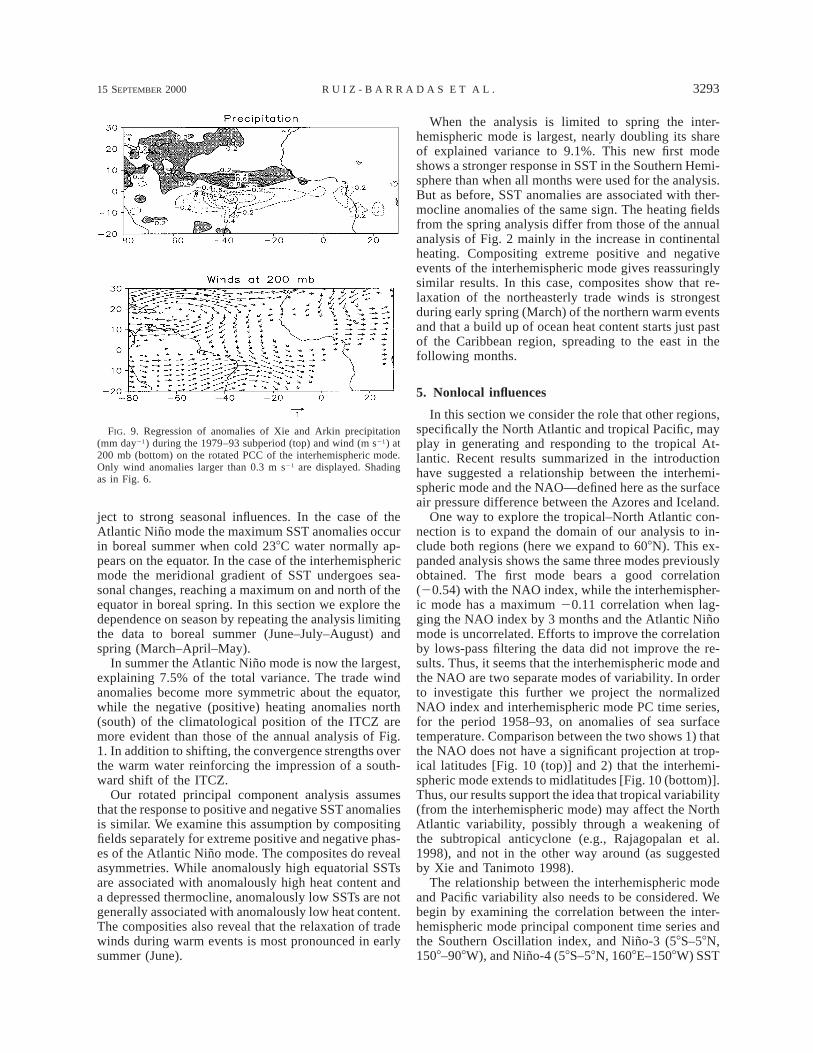
FIG. 7. Regression of averaged anomalies of ocean temperature(8C) along 2.58S–2.58N and 268–318W on the rotated PCC of theAtlantic Nino (top) and interhemispheric (bottom) modes. Bold lineshows the mean position of the 208C isotherm indicating the depthof the thermocline in the Tropics. Dark (light) shading denotes anom-alous warm (cold) conditions.
lantic [Fig. 6 (top)] consistent with the deep convectiveheating anomalies displayed in Fig. 5. Precipitation overnortheastern Brazil (averaged between 118–18S and 468–368W from Xie and Arkin 1997) during June–July–Au-gust has a correlation of 0.62 with this mode at 2-monthlag. The associated upper-level wind anomalies at 200mb [Fig. 6 (bottom)] show weakened westerlies andanticyclonic circulation resembling those of El Nino inthe Pacific. The strengthened easterlies extend back tothe eastern Pacific.
Finally, we consider the oceanic expression of theAtlantic Nino. The covarying temperature with depthand longitude (averaged 2.258S–2.258N) is shown in[Fig. 7 (top)], where the mean position of the thermo-cline is indicated by the depth of the 208C isotherm.The thermocline is slightly deeper (8.5 m) than the val-ues assumed by Zebiak (1993). Positive SSTs are as-sociated with a deepening thermocline of approximately4 m in the eastern basin and a shallowing thermoclineof around 2 m in the west, as expected from the weak-ened trade winds. This profile in SST anomalies givesthe observed structure in heat content depicted in Fig.1. The similarity with the subsurface structure of ElNino is striking.
b. Interhemispheric mode
The third mode has a pattern in SST that is primarilyevident in the Northern Hemisphere with maximum SSTgradient near the thermal equator (Fig. 2). Because ofthis asymmetry, we refer to it as the interhemispheric
3292 VOLUME 13J O U R N A L O F C L I M A T E
FIG. 8. Regression of anomalies of deep convective heating rate(8C day21) at 500 mb (top) and longwave radiation heating rate (8Cday21) at 850 mb (bottom) on the rotated PCC of the interhemisphericmode during the 1973–93 subperiod. Shading as in Fig. 4.
mode, although it resembles the northern portion of thedipole mode of Hastenrath and Greischar (1993), Curtisand Hastenrath (1995), and Chang et al. (1997). Spectralanalysis of the associated time series principal com-ponent of the interhemispheric mode (not shown) has apeak at 12 yr, consistent with some previous studies ofthe dipole mode (Moura and Shukla 1981; Servain 1991;Mehta and Delworth 1995).
In our interpretation, the wind field associated withthe interhemispheric mode responds to the distributionof anomalous SST. A positive Northern HemisphereSST anomaly produces a northward cross-equatorialwind stress anomaly and counterclockwise circulationin the warmer subtropics. The northern counterclock-wise wind anomaly acts to weaken the backgroundnortheast trade winds, while the southern wind anomalystrengthens the background southeast trade winds.Changes in heat content are also evident. This moderesults in anomalous downwelling of surface water inthe warm hemisphere and along the equator consistentwith the Ekman pumping effects. Interestingly, this pat-tern is interrupted by a negative anomaly at 128N. Ex-amination of Fig. 7 (bottom) shows that this negativeanomaly is associated with anomalous uplifting of thethermocline. Less pervasive anomalous upwelling oc-curs in the cool hemisphere.
The interhemispheric mode is accompanied by a di-pole pattern in diabatic heating. Positive anomalies oc-cur over warm SST in the Northern Hemisphere, whilenegative anomalies occur over northeastern (Nordeste)Brazil and the southern tropical ocean.
The zone of negative diabatic heating anomaly overNordeste, Brazil, is associated with divergence at 850mb and convergence at 200 mb (Fig. 3, right-hand pan-els). Intensification of this pattern has been identifiedby Rao et al. (1995) as a possible cause of the droughtin 1993. In fact, because the rainy season in Nordesteis during spring, the interhemispheric mode has a largerimpact on its precipitation than the Atlantic Nino mode.Indeed, we can compare the years of observed droughts(at least a half of their standard deviation below averagein 1958, 1966, 1979, 1980, 1983, 1990, and 1993) andfloods [at least a half of their standard deviation aboveaverage in 1965, 1967, 1968, 1974, 1975, 1984, 1985,1986, 1989, Hastenrath and Greischar (1993)] in theNordeste region of Brazil (Rao et al. 1995) with thethird mode principal component time series. The cor-relation of Nordeste rainfall (averaged between 118–18Sand 468–368W) with the interhemispheric mode is20.40 when all months are used and 20.70 when re-stricted to the rainy season (March–May). Warming inthe northern tropical Atlantic Ocean can also set upfavorable conditions for precipitation in the Caribbean(Taylor 1999).
The vertical structure of diabatic heating associatedwith the interhemispheric mode is presented in Fig. 4(bottom). We find anomalous heating from 925 to 100mb over anomalously warm SSTs north of the equator.
South of the equator a region of anomalous cooling isassociated with the northward shift of the ITCZ. Bothnorth and south the sign of diabatic heating in the lowest75 mb is of opposite sign to heating higher in the at-mosphere, as was seen earlier with the Atlantic Ninomode. As in the case of that mode, the interhemisphericmode is dominated by deep convection (Fig. 8). Thedeep convective clouds in turn are responsible for anom-alous precipitation [Fig. 9 (top)] over warm waters tothe north. At 200-mb convection causes an intensifi-cation of the subtropical jets [Fig. 9 (bottom)] as notedby Marengo and Hastenrath (1993). The opposite phaseof the mode leads to a weakening of the subtropical jetsand an increase in precipitation over Nordeste, Brazil.
Finally, we explore the oceanic projection of the in-terhemispheric mode [Fig. 7 (bottom)]. It is evident thatnorthern SST anomalies penetrate to thermocline depthsand extend southward across the equator. The associatedthermocline depth anomalies are around 3 m. Theseanomalies and their associated negative anomalies ofheat content in the northern subtropic at 128N [Fig. 2(upper left panel)], appear to be the result of a positiveanomaly of wind-induced Ekman pumping on the north-ern side of the North Equatorial Countercurrent. Thisresult suggests an active role of enhanced surface cur-rents transporting warm waters meridionally. This effectis absent in the modeling study by Xie and Tanimoto(1998), who consider a mixed layer of constant depth.
4. Seasonal dependenceThe results presented in section 3 suggest that both
the Atlantic Nino and interhemispheric modes are sub-
15 SEPTEMBER 2000 3293R U I Z - B A R R A D A S E T A L .
FIG. 9. Regression of anomalies of Xie and Arkin precipitation(mm day21) during the 1979–93 subperiod (top) and wind (m s21) at200 mb (bottom) on the rotated PCC of the interhemispheric mode.Only wind anomalies larger than 0.3 m s21 are displayed. Shadingas in Fig. 6.
ject to strong seasonal influences. In the case of theAtlantic Nino mode the maximum SST anomalies occurin boreal summer when cold 238C water normally ap-pears on the equator. In the case of the interhemisphericmode the meridional gradient of SST undergoes sea-sonal changes, reaching a maximum on and north of theequator in boreal spring. In this section we explore thedependence on season by repeating the analysis limitingthe data to boreal summer (June–July–August) andspring (March–April–May).
In summer the Atlantic Nino mode is now the largest,explaining 7.5% of the total variance. The trade windanomalies become more symmetric about the equator,while the negative (positive) heating anomalies north(south) of the climatological position of the ITCZ aremore evident than those of the annual analysis of Fig.1. In addition to shifting, the convergence strengths overthe warm water reinforcing the impression of a south-ward shift of the ITCZ.
Our rotated principal component analysis assumesthat the response to positive and negative SST anomaliesis similar. We examine this assumption by compositingfields separately for extreme positive and negative phas-es of the Atlantic Nino mode. The composites do revealasymmetries. While anomalously high equatorial SSTsare associated with anomalously high heat content anda depressed thermocline, anomalously low SSTs are notgenerally associated with anomalously low heat content.The composities also reveal that the relaxation of tradewinds during warm events is most pronounced in earlysummer (June).
When the analysis is limited to spring the inter-hemispheric mode is largest, nearly doubling its shareof explained variance to 9.1%. This new first modeshows a stronger response in SST in the Southern Hemi-sphere than when all months were used for the analysis.But as before, SST anomalies are associated with ther-mocline anomalies of the same sign. The heating fieldsfrom the spring analysis differ from those of the annualanalysis of Fig. 2 mainly in the increase in continentalheating. Compositing extreme positive and negativeevents of the interhemispheric mode gives reassuringlysimilar results. In this case, composites show that re-laxation of the northeasterly trade winds is strongestduring early spring (March) of the northern warm eventsand that a build up of ocean heat content starts just pastof the Caribbean region, spreading to the east in thefollowing months.
5. Nonlocal influences
In this section we consider the role that other regions,specifically the North Atlantic and tropical Pacific, mayplay in generating and responding to the tropical At-lantic. Recent results summarized in the introductionhave suggested a relationship between the interhemi-spheric mode and the NAO—defined here as the surfaceair pressure difference between the Azores and Iceland.
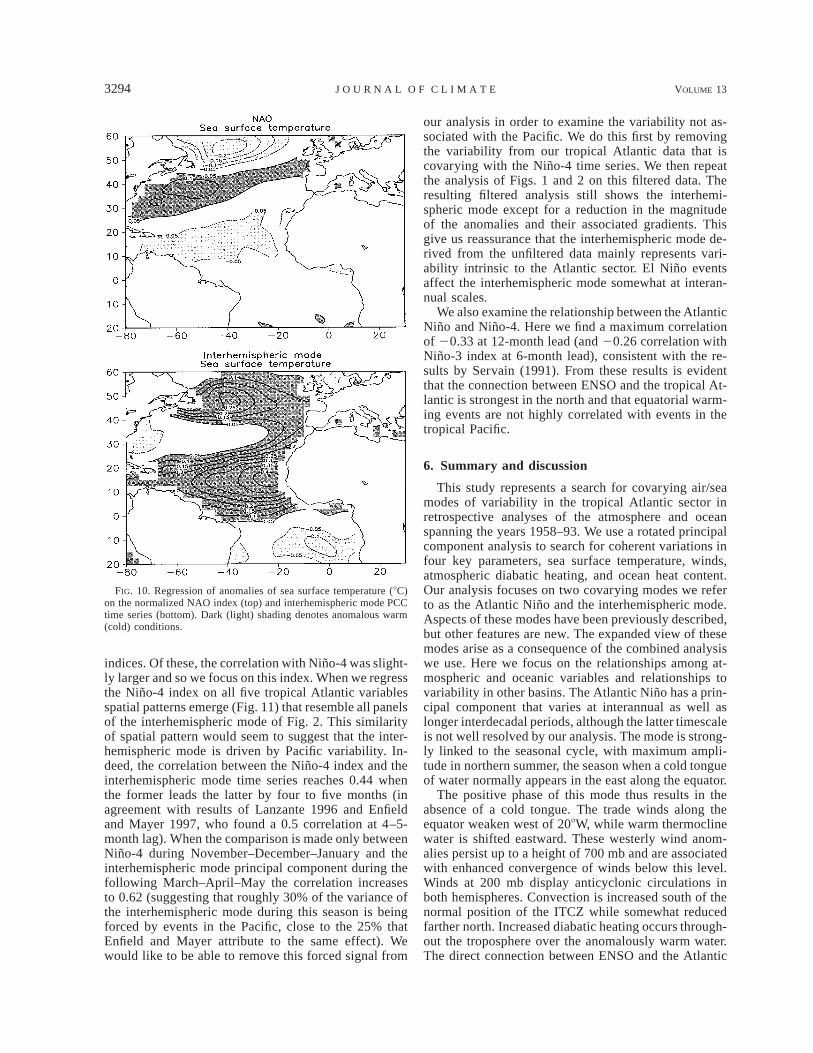
One way to explore the tropical–North Atlantic con-nection is to expand the domain of our analysis to in-clude both regions (here we expand to 608N). This ex-panded analysis shows the same three modes previouslyobtained. The first mode bears a good correlation(20.54) with the NAO index, while the interhemispher-ic mode has a maximum 20.11 correlation when lag-ging the NAO index by 3 months and the Atlantic Ninomode is uncorrelated. Efforts to improve the correlationby lows-pass filtering the data did not improve the re-sults. Thus, it seems that the interhemispheric mode andthe NAO are two separate modes of variability. In orderto investigate this further we project the normalizedNAO index and interhemispheric mode PC time series,for the period 1958–93, on anomalies of sea surfacetemperature. Comparison between the two shows 1) thatthe NAO does not have a significant projection at trop-ical latitudes [Fig. 10 (top)] and 2) that the interhemi-spheric mode extends to midlatitudes [Fig. 10 (bottom)].Thus, our results support the idea that tropical variability(from the interhemispheric mode) may affect the NorthAtlantic variability, possibly through a weakening ofthe subtropical anticyclone (e.g., Rajagopalan et al.1998), and not in the other way around (as suggestedby Xie and Tanimoto 1998).
The relationship between the interhemispheric modeand Pacific variability also needs to be considered. Webegin by examining the correlation between the inter-hemispheric mode principal component time series andthe Southern Oscillation index, and Nino-3 (58S–58N,1508–908W), and Nino-4 (58S–58N, 1608E–1508W) SST
3294 VOLUME 13J O U R N A L O F C L I M A T E
FIG. 10. Regression of anomalies of sea surface temperature (8C)on the normalized NAO index (top) and interhemispheric mode PCCtime series (bottom). Dark (light) shading denotes anomalous warm(cold) conditions.
indices. Of these, the correlation with Nino-4 was slight-ly larger and so we focus on this index. When we regressthe Nino-4 index on all five tropical Atlantic variablesspatial patterns emerge (Fig. 11) that resemble all panelsof the interhemispheric mode of Fig. 2. This similarityof spatial pattern would seem to suggest that the inter-hemispheric mode is driven by Pacific variability. In-deed, the correlation between the Nino-4 index and theinterhemispheric mode time series reaches 0.44 whenthe former leads the latter by four to five months (inagreement with results of Lanzante 1996 and Enfieldand Mayer 1997, who found a 0.5 correlation at 4–5-month lag). When the comparison is made only betweenNino-4 during November–December–January and theinterhemispheric mode principal component during thefollowing March–April–May the correlation increasesto 0.62 (suggesting that roughly 30% of the variance ofthe interhemispheric mode during this season is beingforced by events in the Pacific, close to the 25% thatEnfield and Mayer attribute to the same effect). Wewould like to be able to remove this forced signal from
our analysis in order to examine the variability not as-sociated with the Pacific. We do this first by removingthe variability from our tropical Atlantic data that iscovarying with the Nino-4 time series. We then repeatthe analysis of Figs. 1 and 2 on this filtered data. Theresulting filtered analysis still shows the interhemi-spheric mode except for a reduction in the magnitudeof the anomalies and their associated gradients. Thisgive us reassurance that the interhemispheric mode de-rived from the unfiltered data mainly represents vari-ability intrinsic to the Atlantic sector. El Nino eventsaffect the interhemispheric mode somewhat at interan-nual scales.
We also examine the relationship between the AtlanticNino and Nino-4. Here we find a maximum correlationof 20.33 at 12-month lead (and 20.26 correlation withNino-3 index at 6-month lead), consistent with the re-sults by Servain (1991). From these results is evidentthat the connection between ENSO and the tropical At-lantic is strongest in the north and that equatorial warm-ing events are not highly correlated with events in thetropical Pacific.
6. Summary and discussion
This study represents a search for covarying air/seamodes of variability in the tropical Atlantic sector inretrospective analyses of the atmosphere and oceanspanning the years 1958–93. We use a rotated principalcomponent analysis to search for coherent variations infour key parameters, sea surface temperature, winds,atmospheric diabatic heating, and ocean heat content.Our analysis focuses on two covarying modes we referto as the Atlantic Nino and the interhemispheric mode.Aspects of these modes have been previously described,but other features are new. The expanded view of thesemodes arise as a consequence of the combined analysiswe use. Here we focus on the relationships among at-mospheric and oceanic variables and relationships tovariability in other basins. The Atlantic Nino has a prin-cipal component that varies at interannual as well aslonger interdecadal periods, although the latter timescaleis not well resolved by our analysis. The mode is strong-ly linked to the seasonal cycle, with maximum ampli-tude in northern summer, the season when a cold tongueof water normally appears in the east along the equator.
The positive phase of this mode thus results in theabsence of a cold tongue. The trade winds along theequator weaken west of 208W, while warm thermoclinewater is shifted eastward. These westerly wind anom-alies persist up to a height of 700 mb and are associatedwith enhanced convergence of winds below this level.Winds at 200 mb display anticyclonic circulations inboth hemispheres. Convection is increased south of thenormal position of the ITCZ while somewhat reducedfarther north. Increased diabatic heating occurs through-out the troposphere over the anomalously warm water.The direct connection between ENSO and the Atlantic

15 SEPTEMBER 2000 3295R U I Z - B A R R A D A S E T A L .
FIG. 11. Regression of anomalies of hc (108 3 J m22) (upper left), tau (dyn cm22) (upper right), sst (8C) (middle left), and q (8C day21)at 500 mb (middle right), on the normalized Nino-4 index. Normalized Nino-4 index time series is smoothed with a 12-month running mean(lower panel). Only wind stress anomalies larger than 0.02 dyn cm22 are displayed. Shading as in Fig. 1.
Nino seems to be weak, although it can exist indirectlyas suggested by Carton and Huang (1994).
The second mode we identify is one we refer to asthe interhemispheric mode. This mode has longer de-cadal timescales (12 yr). It is linked to the seasonal cyclewith strongest variations in northern spring. Its corre-sponding pattern of anomalous SST has an interhemi-
spheric gradient with larger fluctuations of the SST inthe Northern Hemisphere than the Southern Hemi-sphere. Its winds indicate a response to an SST gradientconsisting of strong cross-equatorial flow into the warmhemisphere and eastward curvature. Positive diabaticheating occurs in the warm hemisphere throughout thetroposphere from 975 to 200 mb with negative anom-
3296 VOLUME 13J O U R N A L O F C L I M A T E
alies in the lowest 75 mb over warm water. The causeof this low-level diabatic cooling seems to be evapo-ration of raindrops (as occurs in areas of intense pre-cipitation as pointed out by Hastenrath 1991). Winds at200 mb indicate a strengthening of the subtropical jetsin connection with enhanced precipitation to the northand west of the equatorial Atlantic. For both the AtlanticNino and interhemispheric modes deep convection isthe most important term in the balance of anomalousdiabatic heating.
The relation between the interhemispheric mode andthe climate of other ocean basins appears more com-plicated than for the Atlantic Nino. By expanding thedomain of analysis we find that a positive phase of theinterhemispheric mode covaries with warm SST andweakened westerlies to the southeast of Newfoundlandaround 458N. Yet, the NAO, a widely discussed indexof the movement of North Atlantic storm tracks, is notwell correlated with the interhemispheric mode principalcomponent time series. Regressions of atmospheric andoceanic variables on the normalized NAO index and theinterhemispheric mode principal component time serieslead us to conclude that they are two separate modes ofvariablity in the Atlantic. However, there is some pos-sibility that the interhemispheric mode may affect NorthAtlantic variability and eventually the NAO as sug-gested by Rajagopalan et al. (1998). These results arenot consistent with the suggestion of Xie and Tanimoto(1998) that midlatitude variability drives tropical vari-ability or of Robertson et al. (1998) who suggest aninfluence of southern Tropics on NAO.
On the other hand, variability in the tropical PacificOcean does bear a significant relationship to the inter-hemispheric mode. When indicators of Pacific vari-ability such as the Nino-4 index are regressed on tropicalAtlantic variability, patterns do emerge that resemblethe interhemispheric mode. An examination of the lagcorrelation between the two reveals a maximum 0.44correlation when the Pacific leads the Atlantic by 4–5months. However, when this covarying signal is re-moved from tropical Atlantic variables and the analysisis repeated the spatial patterns and principal componenttime series of the interhemispheric mode are still thereexcept for a weakening of the gradients. This result isconsistent with the observation that the timescales ofvariation of the Nino-4 SST and the interhemisphericmode are quite different. Thus we are left with the com-plicated result that spatial patterns resembling the in-terhemispheric mode may be forced by Pacific vari-ability, but that much of the energy in the interhemi-spheric mode cannot be explained simply in terms ofremote influence and probably results from interactionswithin the tropical Atlantic sector itself. Exploration ofthese mechanisms may need to await the developmentof realistic coupled models.
Acknowledgments. The authors are grateful to Dr. C.Chung for his assistance with the principal component
analysis, and to Dr. Eric DeWeaver for diagnosing thediabatic heating from the NCEP reanalysis. AR-B wassupported by a scholarship from the National Universityof Mexico. JAC was supported by the National ScienceFoundation (OCE9530220) and NASA (NASA960912).SN was supported by NOAA PACS GrantNA76GP0479, and NSF Grant ATM9422507.
REFERENCES
Angell, J. K., 1981: Comparison of variations in atmospheric quan-tities with sea surface temperature variations in the equatorialeastern Pacific. Mon. Wea. Rev., 109, 230–243.
Carton, J. A., and B. Huang, 1994: Warm events in the tropicalAtlantic. J. Phys. Oceanogr., 24, 888–903., X. Cao, B. S. Giese, and A. M. da Silva, 1996: Decadal andinterannual SST variability in the tropical Atlantic Ocean. J.Phys. Oceanogr., 26, 1165–1175., G. Chepurin, X. Cao, and B. Giese, 2000a: A Simple OceanData Assimilation analysis of the global upper ocean 1950–95.Part I: Methodology. J. Phys. Oceanogr., 30, 294–309., , and , 2000b: A Simple Ocean Data Assimilationanalysis of the global upper ocean 1950–95. Part II: Results. J.Phys. Oceanogr., 30, 311–326.
Chang, P., L. Ji, and H. Li, 1997: A decadal climate variation in thetropical Atlantic Ocean from thermodynamic air–sea interac-tions. Nature, 385, 516–518.
Chepurin, G., and J. A. Carton, 1999: Comparison of retrospectiveanalyses of the global ocean heat content. Dyn. Atmos. Oceans,29, 119–145.
Chung, C., and S. Nigam, 2000: Weighting of geophysical data inprincipal component analysis. J. Geophys. Res., in press.
Clarke, A. J., and A. Lebedev, 1997: Interannual and decadal changesin equatorial wind stress in the Atlantic, Indian, and PacificOceans and the eastern ocean coastal response. J. Climate, 10,1772–1729.
Curtis, S., and S. Hastenrath, 1995: Forcing of anomalous sea surfacetemperature evolution in the tropical Atlantic during Pacificwarm events. J. Geophys. Res., 100, 15 835–15 847.
da Silva, A. M., A. C. Young, and S. Levitus, 1994: Algorithms andProcedures. Vol. 1, Atlas of Surface Marine Data 1994. NationalOceanic and Atmospheric Administration, 83 pp.
Delworth, T. L., and V. M. Mehta, 1998: Simulated interannual todecadal variability in the tropical and subtropical North Atlantic.Geophys. Res. Lett., 25, 2825–2828.
Enfield, D. B., and D. A. Mayer, 1997: Tropical Atlantic SST vari-ability and its relation to El Nino–Southern Oscillation. J. Geo-phys. Res., 102, 929–945.
Hastenrath, S., 1991: Climate Dynamics of the Tropics, Vol. 8. KlugerAcademic Publishers, 488 pp., and L. Greischar, 1993: Circulation mechanisms related tonortheast Brazil rainfall anomalies. J. Geophys. Res., 98, 5093–5102.
Hisard, P., 1980: The ‘‘El Nino’’ response of the eastern tropicalAtlantic. Oceanol. Acta, 3, 69–78.
Houghton, R. W., and Y. M. Tourre, 1992: Characteristics of low-frequency sea surface temperature fluctuations in the tropicalAtlantic. J. Climate, 5, 765–771.
IMSL, 1989: International Mathematical and Statistical Library Ver-sion 1.1. IMSL Publication.
Lanzante, J. R., 1996: Lag relationships involving tropical sea surfacetemperatures. J. Climate, 9, 2568–2578.
Marengo, J. A., and S. Hastenrath, 1993: Case studies of extremeclimatic events in the Amazon basin. J. Climate, 6, 617–627.
Mehta, V. M., 1998: Variability of the tropical ocean surface tem-peratures at decadal–multidecadal timescales. Part I: The Atlan-tic ocean. J. Climate, 11, 2351–2375., and T. L. Delworth, 1995: Decadal variability of the tropical
15 SEPTEMBER 2000 3297R U I Z - B A R R A D A S E T A L .
Atlantic ocean surface temperature in shipboard measurementsand in a global ocean–atmosphere model. J. Climate, 8, 172–190.
Merle, J., 1980: Variabilite thermique et interannuelle de l’OceanAtlantique equatorial Est. L’hypothese d’un ‘‘El Nino’’ Atlan-tique. Oceanol. Acta, 3, 209–220.
Moura, A. D., and J. Shukla, 1981: On the dynamics of the droughtsin northeast Brazil: Observations, theory and numerical exper-iments with a general circulation model. J. Atmos. Sci., 38, 2653–2675.
Nigam, S., 1994: On the dynamical basis for the Asian summer mon-soon rainfall–El Nino relationship. J. Climate, 7, 1750–1771., and H.-S. Shen, 1993: Structure of oceanic and atmosphericlow-frequency variability over the tropical Pacific and IndianOceans. Part I: COADS observations. J. Climate, 6, 657–676., C. Chung, and E. DeWeaver, 2000: ENSO diabatic heating inECMWF and NCEP reanalyses, and NCAR CCM3 simulation.J. Climate, 13, 3152–3171.
Nobre, P., and J. Shukla, 1996: Variations of sea surface temperature,wind stress, and rainfall over the tropical Atlantic and SouthAmerica. J. Climate, 9, 2464–2479.
Philander, S. G. H., 1990: El Nino, La Nina and the Southern Os-cillation. International Geophysics Series, Vol. 46, AcademicPress, 293 pp.
Rajagopalan, B., Y. Kushnir, and Y. M. Tourre, 1998: Observed de-cadal midlatitude and tropical Atlantic climate variability. Geo-phys. Res. Lett., 25, 3967–3970.
Rao, V. B., K. Hada, and D. L. Herdies, 1995: On the severe droughtof 1993 in northeast Brazil. Int. J. Climatol., 15, 697–704.
Reid, G. C., K. S. Gage, and J. R. McAfee, 1989: The thermal re-
sponse of the tropical atmosphere to variations in equatorialPacific sea surface temperatures. J. Geophys. Res., 94, 14 705–14 716.
Richman, M. B., 1986: Rotation of principal components. Int. J.Climatol., 6, 293–335.
Robertson, A. W., C. R. Mechoso, and Y.-J. Kim, 2000: The influenceof Atlantic sea surface temperature anomalies on the North At-lantic Oscillation. J. Climate, 13, 122–138.
Servain, J., 1991: Simple climatic indices for the tropical AtlanticOcean and some applications. J. Geophys. Res., 96, 15 137–15146.
Tanimoto, Y., and S.-P. Xie, 1999: Ocean–atmosphere variability overthe Pan–Atlantic basin. J. Meteor. Soc. Japan, 77, 31–46.
Taylor, M. A., 1999: October in May: The effect of warm tropicalAtlantic SST on early season Caribbean rainfall. Ph.D. thesis,University of Maryland, 213 pp.
Tourre, Y., B. Rajagopalan, and Y. Kushnir, 1999: Dominant patternsof climate variability in the Atlantic Ocean during the last 136years. J. Climate, 12, 2285–2299.
Weare, B. C., 1977: Empirical orthogonal analysis of Atlantic Oceansurface temperatures. Quart. J. Roy. Meteor. Soc., 103, 467–478.
Xie, P., and P. A. Arkin, 1997: Global Precipitation: A 17-year month-ly analysis based on gauge observations, satellite estimates, andnumerical model outputs. Bull. Amer. Meteor. Soc., 78, 2539–2558.
Xie, S.-P., and Y. Tanimoto, 1998: A Pan–Atlantic decadal climateoscillation. Geophys. Res. Lett., 25, 2185–2188.
Zebiak, S. E., 1993: Air–sea interaction in the equatorial Atlanticregion. J. Climate, 6, 1567–1586.
Related Documents