Structure of a Transition Region Explosive Event Imaging-Spectroscopy with MOSES Lewis Fox 1 , C. C. Kankelborg 1 , R. J. Thomas 2 , D. W. Longcope 1 1 Montana State University, 2 Goddard Space Flight Center

Structure of a Transition Region Explosive Event
Dec 31, 2015
Structure of a Transition Region Explosive Event. Imaging-Spectroscopy with MOSES. Lewis Fox 1 , C. C. Kankelborg 1 , R. J. Thomas 2 , D. W. Longcope 1 1 Montana State University, 2 Goddard Space Flight Center. Abstract. - PowerPoint PPT Presentation
Welcome message from author
This document is posted to help you gain knowledge. Please leave a comment to let me know what you think about it! Share it to your friends and learn new things together.
Transcript

Structure of a Transition Region Explosive Event
Imaging-Spectroscopy with MOSES
Lewis Fox1, C. C. Kankelborg1, R. J. Thomas2, D. W. Longcope1
1 Montana State University, 2Goddard Space Flight Center
AbstractTransition Region Explosive Events (TREEs) have been observed with slit spectrographs since at least 1975, most commonly in lines of C IV (1548A,1550A) and Si IV (1393A, 1402A). We report what we believe to be the first observation of a TREE in He II 304A. With the MOSES sounding rocket, a novel type of imaging spectrograph, we are able to see the spatial and spectral structure of the event. It consists of a bright core expelling two jets, oppositely directed but not collinear. The jets have both line-of-sight and sky-plane motion. The core is a region of high non-thermal doppler broadening, characteristic of TREEs. It is possible to resolve the core broadening into red and blue line-of-sight components. MOSES captured approximately 150 sec of time evolution before the rocket flight ended. We see the beginning (core activation) and middle (jet ejection), but not the end. It is clear from our data-set that TREEs in He II 304A are much less common than observed in other wavelengths.

TR Explosive Events (TREEs)
• Seen in lines from 20,000K to 250,000K, mostly observed in C IV and Si IV at ~100,000K
• Characterized by large non-thermal doppler broadenings, ~100km/s to both sides.
• 3 types: broadened in both wings, predominantly blue, predominantly red. Blue dominance is more common than red.
• ~1500 km in length, lasting ~90 sec• Typically located along magnetic neutral lines, above
cancelling flux in the QS

Published examples of explosive events: Moses et. al. 1994 left, Dere 1994 right

Published examples of explosive events: Dere, Bartoe,& Brueckner 1989
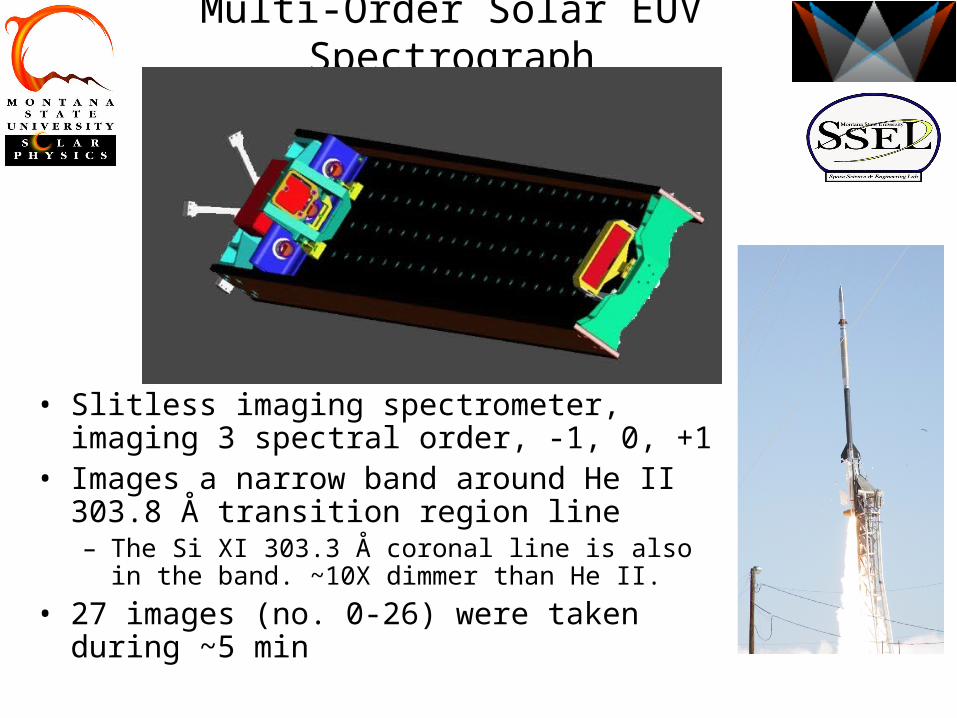
Multi-Order Solar EUV Spectrograph
• Slitless imaging spectrometer, imaging 3 spectral order, -1, 0, +1
• Images a narrow band around He II 303.8 Å transition region line – The Si XI 303.3 Å coronal line is also in the band.
~10X dimmer than He II.
• 27 images (no. 0-26) were taken during ~5 min
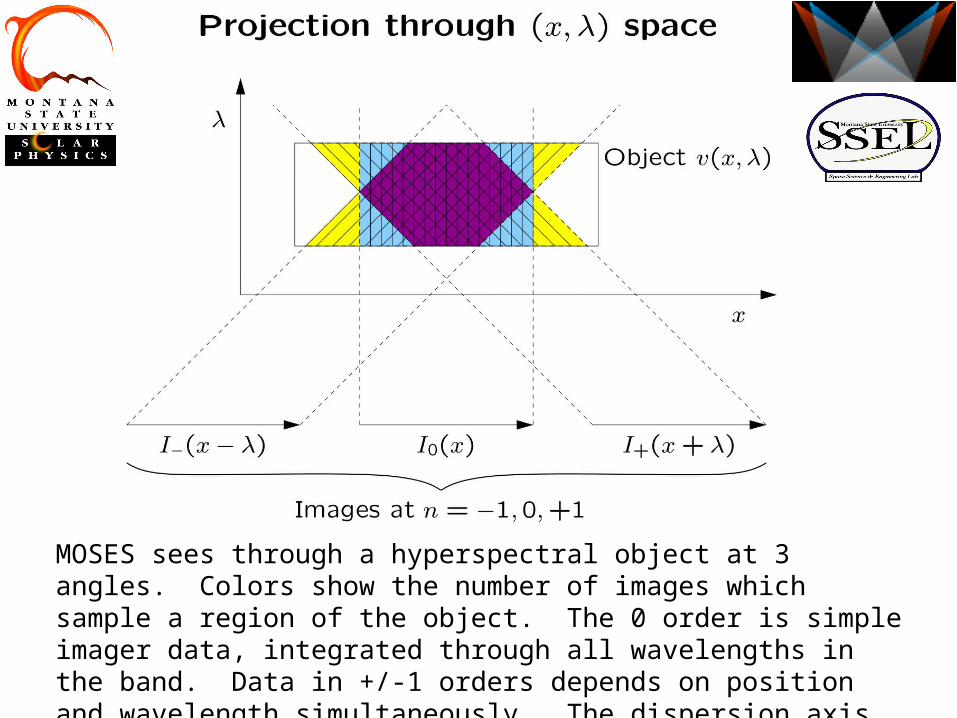
MOSES sees through a hyperspectral object at 3 angles. Colors show the number of images which sample a region of the object. The 0 order is simple imager data, integrated through all wavelengths in the band. Data in +/-1 orders depends on position and wavelength simultaneously. The dispersion axis is parallel to x.
Context Data
• Michelson Doppler Imager (MDI) and EUV Imaging Telescope (EIT) 304 channel on SOHO provide context for our event.
• Correspondence is not perfect because MDI and EIT data are not cotemporal with MOSES.
• We reduce MDI data to a set of magnetic point sources in a potential field model and, extrapolating upward, find the location of the Polarity Inversion Line (PIL)
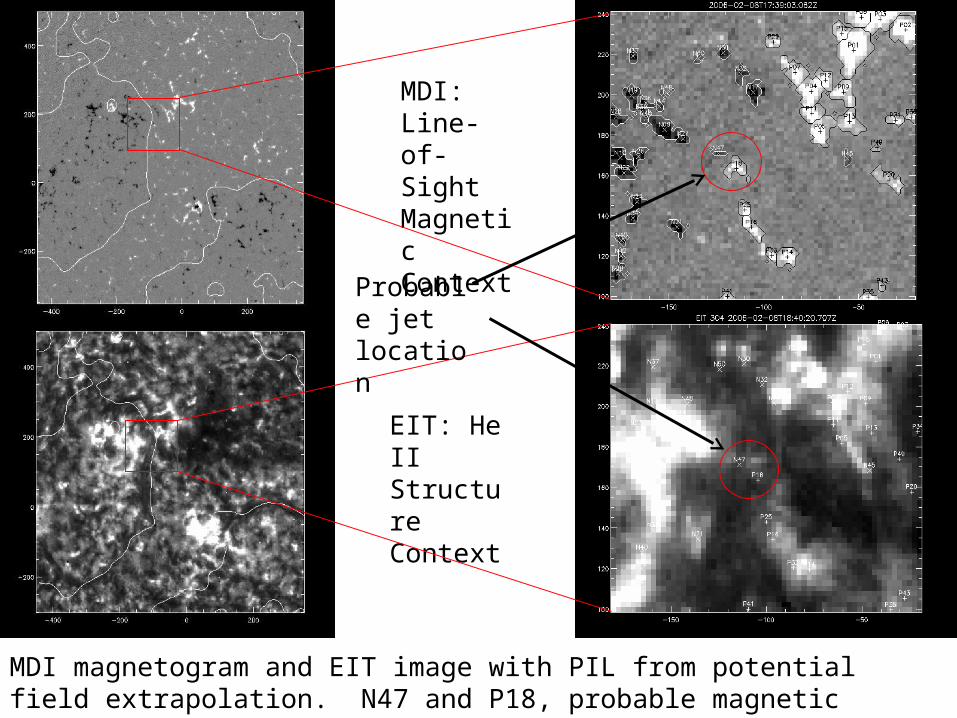
MDI magnetogram and EIT image with PIL from potential field extrapolation. N47 and P18, probable magnetic underpinning of the jet, are colliding.
MDI: Line-of-Sight Magnetic Context
EIT: He II Structure Context
Probable jet location

BipolarJet
The EIT image missed the jet, but caught the major features, including the filament. It appears the jet straddles the PIL
MOSES 0-order (frame 23)
EIT 304A + extrapolated PIL

Frame 23 of the jet. The transverse (sky plane) velocity of the jets is shown by the white arrows. The MDI poles have been corrected for the time difference and placed on the MOSES data.

Procedure part 1
• We analyze a compact bipolar jet with data from +1 and 0 orders only.
• We subtract a “soap-bubble” background, derived from point relaxation holding the boundary pixels and interior local minima fixed. The same background is subtracted from both 0 and +1 data.
• We fit x-axis slices with up to 4 gaussians using a least-squares technique.
• We infer doppler shifts from the difference between +1 and 0 order fits.
• We measure the sky-plane velocities of the jets, fixing by eye their positions in frames 22, 23, and 24 and performing a center difference between frame 24 and 22 to obtain v23.
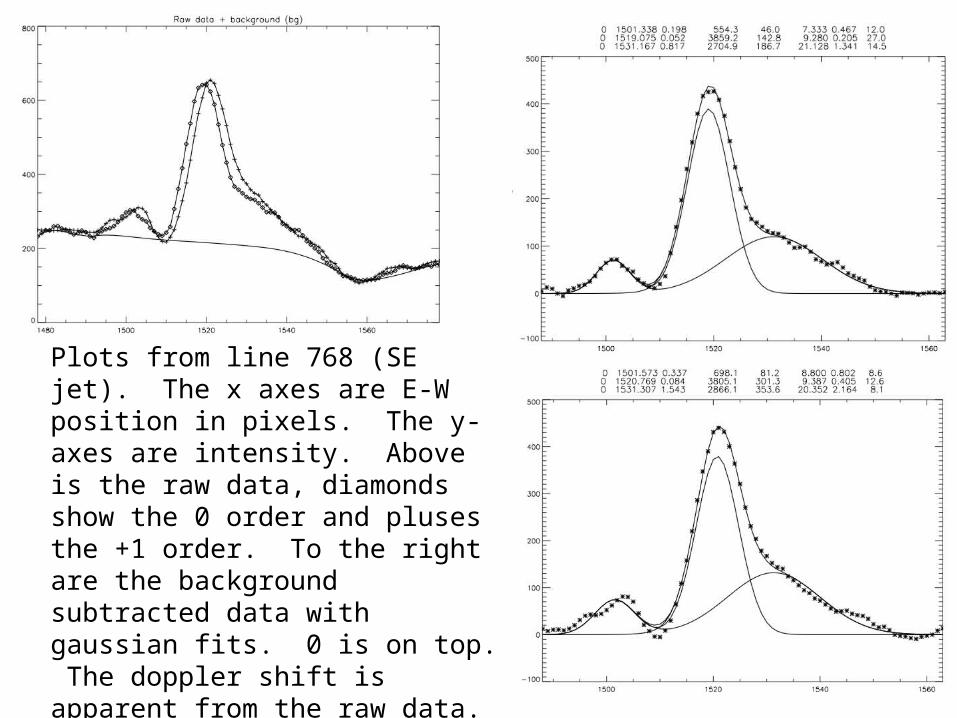
Plots from line 768 (SE jet). The x axes are E-W position in pixels. The y-axes are intensity. Above is the raw data, diamonds show the 0 order and pluses the +1 order. To the right are the background subtracted data with gaussian fits. 0 is on top. The doppler shift is apparent from the raw data. The -axis is aligned with the x axis such that it points E, making this a blue shift.

Line 781 in the explosive region. Non-thermal broadening is seen here. A clear interpretation is a two-component shift, one to blue and one to red. The redshift component is faster giving a net redshift.

Line 792 in the NW jet. This shows a slight red shift.
These three examples demonstrate the essential features of the bipolar jet: Blue shift in the SE jet, red shift in the NW jet, and a nonthermal broadening near the center, possibly due to both blue and red shifts which are unresolved spatially.

An overlay of the jet with the gaussian parameters derived from the fits. Symbol color corresponds to peak gaussian intensity. The length of horizontal lines shows the FWHM width of the fit. The fits were made to the data between the limits shown.

Procedure part 2
• We calculate the centroids of jet features from fits which have centers between the dashed white lines according to the formula:
• We compute the composite width of jet features within the same limits according to:
• In these eqns, Ii, i, i are the total integrated intensity, the center, and the width (std. dev.) of the ith gaussian.
€
T =
μ iIii
∑
Iii
∑ (1)
€
T2 =
Ii(μ i2 +σ i
2)i
∑
Iii
∑−μT
2 (2)

Similar overlay as previously with the fits replaced by the centroids and composite widths calculated according to eqs. 1 and 2 from fits with centers falling between the limits shown by the white dashed lines. Widths have been converted to FWHM. The large black symbols show the centers of 0/+1 order data from 775-781 where the +1 data divides into blue and red shift components around the 0 order.

The doppler velocity computed from the centroids. The MOSES dispersion gives a plate scale of 28.7 km/s/pixel at 304 Å. Positive velocities are blue shifts.
The seven lines 775 - 781 are also treated separately. 775-777 (stars) have two gaussians each in 0 and +1 which are interpreted to give the multi-component velocities shown. 778-781 (triangles) have 1 gaussian in 0 order which splits into two components in +1.

The composite width as a function of y axis on the detector, calculated accord-ing to eq. 2 within the bound-aries shown in the overlay (dashed lines). The width is here given in velocity units, using the MOSES wavelength plate scale as the conversion factor.
The second plot shows the difference between +1 and 0 order composite widths.
The line broadening region is visible between about 772 and 784, with the most significant portion slightly offset to the N between 775 to 782.

Conclusions
• Our event has a “source region” which is releasing energy. The source region has multiple oppositely directed velocity components.
• The source is powering two jets, not aligned, not quite oppositely directed.
• TREEs can be complex. Ours is not simply a “bipolar jet”.
Conclusions
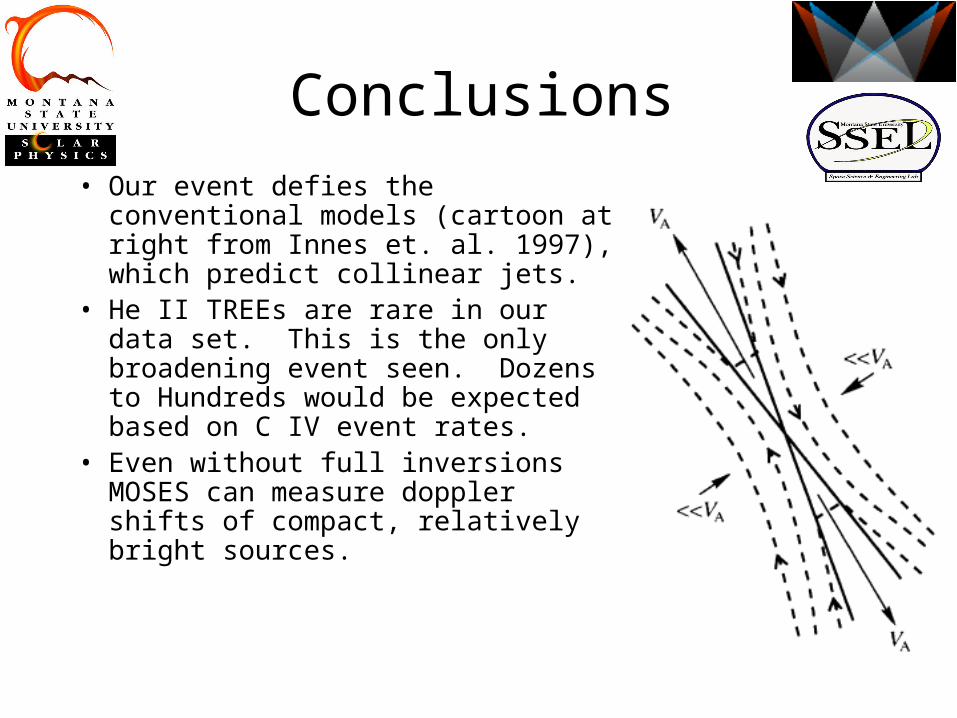
• Our event defies the conventional models (cartoon at right from Innes et. al. 1997), which predict collinear jets.
• He II TREEs are rare in our data set. This is the only broadening event seen. Dozens to Hundreds would be expected based on C IV event rates.
• Even without full inversions MOSES can measure doppler shifts of compact, relatively bright sources.
Related Documents