Western Kentucky University TopSCHOLAR® Masters eses & Specialist Projects Graduate School 12-2013 Structure Maers: Examining Illness Behavior Using Parsons's Sick Role Angela D. Byrd Western Kentucky University, [email protected] Follow this and additional works at: hp://digitalcommons.wku.edu/theses Part of the Inequality and Stratification Commons , Medicine and Health Commons , and the Public Health Education and Promotion Commons is esis is brought to you for free and open access by TopSCHOLAR®. It has been accepted for inclusion in Masters eses & Specialist Projects by an authorized administrator of TopSCHOLAR®. For more information, please contact [email protected]. Recommended Citation Byrd, Angela D., "Structure Maers: Examining Illness Behavior Using Parsons's Sick Role" (2013). Masters eses & Specialist Projects. Paper 1310. hp://digitalcommons.wku.edu/theses/1310

Welcome message from author
This document is posted to help you gain knowledge. Please leave a comment to let me know what you think about it! Share it to your friends and learn new things together.
Transcript

Western Kentucky UniversityTopSCHOLAR®
Masters Theses & Specialist Projects Graduate School
12-2013
Structure Matters: Examining Illness BehaviorUsing Parsons's Sick RoleAngela D. ByrdWestern Kentucky University, [email protected]
Follow this and additional works at: http://digitalcommons.wku.edu/theses
Part of the Inequality and Stratification Commons, Medicine and Health Commons, and thePublic Health Education and Promotion Commons
This Thesis is brought to you for free and open access by TopSCHOLAR®. It has been accepted for inclusion in Masters Theses & Specialist Projects byan authorized administrator of TopSCHOLAR®. For more information, please contact [email protected].
Recommended CitationByrd, Angela D., "Structure Matters: Examining Illness Behavior Using Parsons's Sick Role" (2013). Masters Theses & Specialist Projects.Paper 1310.http://digitalcommons.wku.edu/theses/1310

STRUCTURE MATTERS:
EXAMINING ILLNESS BEHAVIOR USING PARSONS’S SICK ROLE
A Thesis
Presented to
The Faculty of the Department of Sociology
Western Kentucky University
Bowling Green, Kentucky
In Partial Fulfillment
Of the Requirements for the Degree
Master of Arts
By
Angela Byrd
December 2013


I dedicate this thesis to my father, Bob Miller, whose life was shaped
by his wit, resilience, and loyalty – not his disease.

iii
ACKNOWLEDGMENTS
First, I’d like to acknowledge Dr. Groce and Dr. Lovell for sharing their expertise and for
their willingness to serve on my thesis committee. I’d also like to acknowledge Dr. Doug Smith,
the WKU Department of Sociology, WKU’s Potter College of Arts and Letters, and WKU’s
Office of Graduate Studies for supporting my research. Lastly, I’d like to acknowledge Dr. Jerry
Daday for his unfailing mentorship, extraordinary intellect and character, and infectious passion
for teaching and Sociology. Without Dr. Daday’s guidance and support, I would have never
began my MA program, let alone complete and enjoy it as the incredible experience it has been. I
am forever grateful for the opportunity to study under the leadership of Dr. Daday and the
exceptional Sociology faculty at WKU.
iv
CONTENTS
Introduction………………………………………………………………………………..1
Predicting Health Disparities…………………...…………………………………………1
Responding to Disease: Illness Behavior…………………………...……………………11
A Review of Parsons’s Sick Role Theory………………………………………………..16
Methods…………………………………………………………………………………..26
Analyses………………………………………………………………………………….36
Conclusion……………………………………………………………………………….44
Appendix…………………………………………………………………………………49
References………………………………………………………………………………..61
v
LIST OF FIGURES
Figure 1. Construction of Condition Duration Variables……………………..………… 28
Figure 2. Model Setup for Logistic Regression Tables 3-11…………………………….35
Figure 3. Direction of Odds of Statistically Significant Predictors of
Extended Condition Duration and Work Limitation...…………………………….…… 38
vi
LIST OF TABLES
Table 1. Descriptive Statistics…………………………………………………………....49
Tables 2-1 & 2-2. Bivariate Logistic Regression: Predictors of Work Limitation…...50-51
Logistic Regression Showing Influence of Covariates on Condition duration of 1 Year or
More (Model 1) and Work Limitation (Model 2) for Respondents with:
Table 3. a Back or Neck Problem………………………………………………………. 52
Table 4. a Heart Problem………………………………………………………….….… 53
Table 5. a Stroke Problem………………………………………………………………. 54
Table 6. a Blood Pressure Problem………………………………………………...…… 55
Table 7. Diabetes……………………………………………………………………..… 56
Table 8. Cancer…………………………………………………………………………. 57
Table 9. an Emotional Problem………………………………………………………… 58
Table 10. a Lung or Breathing Problem………………………………………………… 59
Table 11. a Weight Problem……………………………………………………………. 60
vii
STRUCTURE MATTERS:
A LOOK AT ILLNESS BEHAVIOR USING PARSONS SICK ROLE
Angela Byrd December 2013 64 Pages
Directed by: Dr. Jerry Daday, Dr. Steve Groce, and Dr. Donielle Lovell
Department of Sociology Western Kentucky University
Although Talcott Parsons’s sick role theory, as described in 1951 in The Social
System, has been severely criticized for its inapplicability to chronic illnesses, a portion
of the theory is still a relevant and necessary factor in terms of understanding and treating
chronic illness today. Using data from the 2012 National Health Interview Survey, this
study looks at the individual effects of sex, age, race, cohabitation, education and region
of residence on the likelihood of chronically ill patients considering themselves limited in
their amount or kind of work as an indicator of sick role adaptation. Results show
statistically significant relationships between work limitation and sex, age, cohabitation,
education and region of residence, when controlling for the duration of the respondents’
condition. Further evaluation of these results is provided.

1
INTRODUCTION
Just as there are roles, or institutionalized ideas and expectations, assigned to an
individual’s given gender, title, familial part, or occupation, Talcott Parsons theorizes that
there are institutionalized ideas and expectations assigned to and adapted by the sick
individual. Whether by compassion or by socialization, we are compelled to feel a certain
level of empathy and consideration toward those afflicted with a physically impairing
condition. Additionally, when we find ourselves sick or physically impaired, we change
our ideas about and expectations of ourselves and expect others to do the same. This
changing of ideas and expectations due to the illness of oneself or another constitutes
Parsons’s “sick role” model. The sick role, when adapted, trumps individuals’ well
role(s) in that it allows them to be exempt from many of their daily obligations and
responsibilities, defining their primary role as both the victims and defenders their health.
Theoretically idealistic and grand, Parsons’s sick role model is not easily detectable in
empirical reality. Not only do individuals’ well roles and characteristics constitute
spectrums of sick role adaptation, but those spectrums must be empirically analyzed
against a continuum of illnesses ranging from acute to chronic. The complexities of the
theory have led researchers to poorly conceptualize their concepts, oversimplify the
model’s construction, and under-analyze contributing factors. This study looks to
overcome these shortcomings of the existing research by looking at a single component
of the sick role model, a specific cohort of respondents, and concisely conceptualized
variables.
PREDICTING HEALTH DISPARITIES
To best understand what factors may influence illness behavior, it is necessary to
2
first discuss the factors that influence illness in terms of morbidity and mortality.
Biomedical and social scientists alike know that health disparities exist among and
between various U.S. populations. Additionally, it is known that the causes of these
disparities exist at both the individual and the structural level. At the individual level, it is
most often health behaviors and risk behaviors that contribute to one’s predisposition
toward morbidity and mortality. “A U.S. Surgeon General’s Report indicated that
unhealthy behaviors or lifestyles account for half of the annual number of deaths in the
United States” (Williams and Collins 1995:373).
Predicting the likelihood of an individual engaging in unhealthy behavior is
difficult because of the complexities inherent in studying individual-level motivators
among a large population. Using secondary data, it is impossible to account for the
individual-level factors contributing to health behavior. Instead, it is valuable to
understand disease as resulting from a “broad range of social, behavioral, nutritional,
psychological, residential, and occupational variables” (Williams and Sternthal
2010:S18). With this in mind, it is no surprise that morbidity (disease) and mortality
(death from disease) rates in the United States are correlated with the master statuses that
influence these variables: gender, race, and socioeconomic status. The objectives of the
following literature review are to 1) summarize health disparities as related to these three
master statuses and 2) illustrate the ways demographics affect health disparities through
structural pathways.
Health Disparities and Gender
One of the most evident and persisting health disparities in the United States is the
dissimilarity in morbidity and mortality rates between men and women. William

3
Cockerham explains, “females report more illness and disability. They may be sick more
often, but usually live longer” (Cockerham 2012:74). This is because “men are more
likely than women to suffer fatal [emphasis added] chronic conditions and diseases – and
suffer from them at an earlier age” (Courtenay 2000:1385). Men’s greater likelihood of
suffering from fatal disease is a key contributor to their shorter life expectancies. “Men in
the United States, on average, die nearly seven years younger than women and have
higher death rates for all 15 leading causes of death,” Courtenay 2000:1385). This pattern
is consistent across races and across levels of socioeconomic status. In 2012, the National
Center for Health Statistics reported that females’ life expectancy at birth is longer than
their male counterparts across Hispanic, black, and white races. Hispanic women’s life
expectancy is five years longer than their male counterparts; white women’s life
expectancy is five years longer than their male counterparts; black women’s life
expectancy is seven years longer than their male counterparts (National Center for Health
Statistics 2012).
Unfortunately, when looking at a population as large and diverse as that of the
United States, it is impossible to account for the variance in biological and risk factors
between and among men and women. Instead, it is of better interest to the social sciences
to recognize that, although some of these gender health disparities may be accounted for
by biological risk factors, these factors interact with “culturally patterned gender behavior
to produce health and illness” (Lane and Cibula 2000:138).
Taking into consideration the ways that culture shapes gender roles, health
disparities between genders in the United States are often discussed in terms of Western
ideals of masculinity and femininity. Throughout history in the United States, the pursuit
4
of masculinity is synonymous with the “pursuit of power and privilege,” which “can
often lead men to harmful health behaviors” (Courtenay 2000:1388). In turn, harmful
health behaviors can even contribute to a greater degree of masculinity. “By dismissing
their health needs and taking risks, men legitimize themselves as the “stronger” sex. In
this way, men’s unhealthy beliefs and behaviors help to sustain and reproduce health
disparities between genders. At the same time, “society reinforces and rewards men’s
poor health habits” (Courtenay 2000:1397).
Women usually behave in ways expected and typical of an idealized femininity in
their personal lives and in their occupations. Women have been, historically speaking,
more encouraged and likely to “utilize healthcare and positive health behaviors, report
illness symptoms, and more often restrict their activities and stay in bed for illness”
because these are all behaviors associated with femininity (Courtenay 2000:1389; Lane
and Cibula 2000:139). “Women have been encouraged to pay attention to their own
health” while men have been expected to research health and provide health care
(Courtenay 2000:1395). In U.S. families, the responsibility for the “nutrition, health
promotion, and hygiene is placed on the woman, which may influence her to take better
care of her own health” (Lane and Cibula 2000:136)
These “masculine” and “feminine” health and risk behaviors are reinforced by
societal structures such as objective culture and the division of labor. To some extent,
men have no choice but to lead unhealthy lifestyles. The products produced and
consumed in the U.S., especially television, movies, video games and social media,
perpetuate hegemonic masculinity and thus men’s unhealthy lifestyle choices. Some
research suggests that institutional structures – “such as the government, military,
5
corporations, technological industries, the judicial system, academia, health care systems
and the media – foster unhealthy beliefs and behaviors among men, and undermine men’s
attempts to adopt healthier habits” (Courtenay 2000:1394). The division of labor
especially contributes to men’s higher rates of morbidity and mortality as the most
dangerous jobs in the United States are performed by men. Thus, men have “higher
accident rates due to an increased exposure to dangerous activities” (Cockerham
2012:73). Although women’s increased participation in the workforce may help to
explain the narrowing gap between men’s and women’s mortality rates over the past
three decades, the gendered segregation of occupations persists (Cockerham 2012:73;
Cotter, Hermerson, and Vannerman 2004).
Social institutions and their effects on gender ideals are interwoven,
interdependent, and mutually influential – so much so that it is impossible to distinguish
one single institution as the greatest contributor to health disparities between genders.
Nonetheless, the disparities exist and are inescapable. Because dissimilarities in men’s
and women’s health behaviors exist across levels of socioeconomic status and across
ethnicities, it can be argued that gender predicts differences in health and longevity
regardless of individual agency and biological risk factors (Courtenay 2000).
Health Disparities and Race
Just as evident and persistent as the health disparities between genders are the
health disparities between races. With the exception of Asians, non-white Americans are
disadvantaged from whites in terms of both morbidity and mortality. For example,
“blacks have higher rates than whites of almost all forms of disability. They also differ
more in terms of prevalence rather than in incidence, which most likely results from a
6
long-term and cumulative process of health disadvantages over the lifecycle” (Hayward
et al. 2000:926). “Native Americans also have health disadvantages relative to non-
Hispanic whites” (Cockerham 2012:83). Furthermore, the disadvantages suffered by
these racial minority groups have affected their mortality rates throughout history in the
U.S.. Williams and Sternthal explain:
The racial gap in health is large. White men and women outlived their
black counterparts by 7.4 and 9.3 years, respectively, in 1950. In 2006,
white men still lived six years longer than African American men and
white women had a four year advantage of their black peers. (Williams
and Sternthal 2010:S16)
More recently, research has shown that racial disparities persist in the U.S. but
may be becoming more complex. In 2012, the National Center for Health Statistics
reported that Hispanic men’s life expectancies are three and eight years longer than white
and black men’s, respectively. Hispanic women’s life expectancies are three and six years
longer than white and black women’s, respectively, even though they occupy
disadvantaged social and economic positions (National Center for Health Statistics 2012;
Cockerham 2012:83). The explanation researchers provide for what Cockerham terms
this “Hispanic Paradox” is the relatively young age of the U.S.’s Hispanic population;
they have not yet reached the age at which most contract fatal chronic diseases
(Cockerham 2012:83). Asian Americans, too, seem to be an exception to the rule as they
“have typically enjoyed high levels of health and are the healthiest racial group in the
U.S.,” despite their minority position (Cockerham 2012:83).
The complexities of health disparities among and between non-white minority
groups notwithstanding, blacks in the U.S. consistently suffer the most in terms of
morbidity and mortality rates. This can be explained, in part, by discrimination and

7
residential segregation. Individual experiences of discrimination cause stress, which is
known to have an adverse effect on health (Williams and Sternthal 2010:S20; Robert and
House 2000:118). In stressful environments, “the body’s physiological defenses against
disease are worn down by continuous exposure to adverse social conditions engendered
by racism” (Hayward et al. 2000; Cockerham 2012:86). These stressful environments are
inherent in the economically poor settings that accompany racially-segregated living
conditions: poor access to adequate education, fewer job opportunities, limited access to
nutritious food, “weak infrastructures, poor interpersonal relationships, more
environmental toxins, and poorer access to and quality of care” (Williams and Sternthal
2010:S20). Still, racial minority groups other than blacks are subjected to discrimination
and residential segregation yet do not match blacks’ morbidity and mortality rates.
Research suggests that blacks experience the greatest health disadvantages because they
occupy the worst socioeconomic positions. Among social scientists, “race is so strongly
correlated with SES that it is sometimes used as an indicator of SES” (Williams and
Collins 1995:363). Thus, it makes sense that blacks, who occupy the worst
socioeconomic positions, also experience the highest morbidity and mortality rates.
Identifying racial health inequalities in terms of SES makes it evident that “the disparity
between races in health is rooted in the fundamental social conditions [emphasis added]
of disease rather than behavioral [or biological] differences” (Hayward et al. 2000:926).
Health Disparities and Socioeconomic Status
Although race and gender are closely related to SES, SES is a “distinct system of
social ordering that [uniquely] contributes to health risks” (Williams and Sternthal
2010:S19). While the relationship between SES and health is “monotonic, it is not linear”
8
(Robert and House 2000:121). The effects of SES on health are intricately intertwined
with the effects of race, age and gender in ways that are not yet fully understood; the
relative effects of SES on health versus the effects of health on SES have yet to be
determined. Nonetheless, SES undoubtedly accounts for “larger contextual factors that
result in structured inequalities and disadvantage” (Angel and Angel 2006:1156). Thus,
researchers agree that “the most fundamental causes of health disparities are
socioeconomic disparities” (Adler and Newman 2002:61).
Studies of “morbidity and mortality in Canada” have shown “the relative impacts
of four key causes of morbidity and mortality: biological determinants, health care,
environmental exposure, and behavior and lifestyle” (Adler and Newman 2002:65). In
these studies, SES “underlies three [of these four] determinants, which together are
associated with an estimated 80 percent of premature mortality” (Adler and Newman
2002:65). Medical sociologists Phelan, Link and Tehranifar assert that SES is a
fundamental cause of health disparities because it “affects multiple disease outcomes,
affects outcomes through multiple risk factors, affects resources available before and
after disease diagnosis, and has effects consistent over time despite replaced intervening
mechanisms” (Phelan, Link and Tehranifar 2010:S29). If SES is a fundamental cause of
health disparities, the “level and distribution of socioeconomic variables in the
communities, states, and nations within which individuals and families live and work” are
of paramount importance to their health (Robert and House 2000:128).
The effects of SES on health are “typically assessed in line with Weberian notions
of stratification such as income, occupation, and education” (Williams and Collins
1995:350). However, “each component [of SES] provides different resources and
9
displays different relationships to various health outcomes” (Adler and Newman
2002:61). Furthermore, as proposed by Nancy Adler and Katherine Newman (2002), it is
through three social, structural pathways (among others) that SES indirectly affects health
outcomes: through environmental exposures, through the social environment, and
through healthcare. Thus, each component of SES must be discussed individually in
terms of its ability to infiltrate these three pathways.
Socioeconomic status and income
Income is the component of SES that most obviously affects health behaviors and
access to healthcare. In terms of environmental exposures, “higher incomes can provide
better [access to] nutrition, housing, schooling and recreation” (Adler and Newman
2002:62). In terms of social environment, higher income also allows individuals to “live
in an advantaged neighborhood [and be] surrounded by an economically advantaged
culture . . . [which] provides formal and informal networks that reinforce healthy
lifestyles” (Phelan, Link and Tehranifar 2010:S30). Lastly, income determines one’s
access to health care if and when health conditions arise. This is especially true in the
United States, “where health care is a commodity rather than a right” and the “rationing
of health services is based on SES rather than clinical need” (Wright and Perry
2010:S111).
Socioeconomic status and occupation
“Among the employed, occupations differ in their prestige, qualifications,
rewards, and job characteristics” (Adler and Newman 2002:65). Occupations associated
with the lowest levels of prestige (which are typically also occupations that require the
lowest levels of skill) most negatively impact the health of their workers. In terms

10
environmental exposures, “lower-status jobs expose workers to both physical and
psychosocial risks. They [also] carry a higher risk of occupational injury and exposure to
toxic substances” (Adler and Newman 2002:65). Furthermore, these same lower-status
occupations often require the performance of unskilled labor. In the U.S.’s capitalist
economy, the performance of unskilled labor ultimately alienates individuals from other
workers, weakening their social environments and diminishing their senses of trust and
cohesion (Marx 1977; Adler and Newman 2002:67). Lastly, these low-status occupations
often have higher rates of contingent workers, who are “significantly more likely to
[have] no health insurance . . . than workers in regular, full-time jobs” (Vallas, 2009:299).
Thus, low-status occupations are associated with poorer access to healthcare.
Socioeconomic status and education
Although income and occupation are two components of SES that influence
health outcomes, the third component, education, is arguably the most influential
component because of its ability to predict the first two. Adler and Newman explain:
Education is perhaps the most basic SES component since it shapes future
occupational opportunities and earning potential. It also provides
knowledge and life skills that allow better-educated persons to gain more
ready access to information and resources to promote health. (Adler and
Newman 2002:61).
Furthermore, the effects of “early educational experiences” on health are beneficial, as
are “years of completed education” (Adler and Newman 2002:61). More education leads
to higher income and higher-status occupations, both which “lead to better health benefits
and safer working conditions” (Phelan, Link and Tehranifar 2010:S31). If SES is a
fundamental cause of health disparities, then education is their greatest predictor.
11
Health Disparities, Demographics and Pathways
Adler and Newman’s recognition of the three social pathways through which SES
influences health outcomes provides researchers with the opportunity to explain the
effects of other demographic variables. Because SES is so intricately connected with
race, age and gender, this research argues that it is also through these three pathways that
race age and gender affect health and illness. The argument here is easy to make. Race,
age, gender and SES are all influential in shaping one’s environmental exposures in terms
of residential and occupational segregation. It is also through one’s neighborhood,
workplace and family that race, age, gender and SES help to shape one’s social networks.
Lastly, individuals’ likelihood and ability to access adequate healthcare is unquestionably
linked to their race, age, gender and SES. (Adler and Newman 2002) Thus, the effects of
demographics on health and illness are mediated by social pathways, which are
inherently structural. This research argues that the effects of demographics on illness
behavior are also mediated by these same structural pathways.
RESPONDING TO DISEASE: ILLNESS BEHAVIOR
Initially, it may seem that individuals’ response to disease is entirely subjective
and dependent on agency, not structure. After all, the experience of illness does differ
from individual to individual and from group to group. Medical sociologist William
Cockerham even defines disease is “an adverse physical state, consisting of a physical
dysfunction within an individual” while defining an illness is “a subjective state,
pertaining to an individual’s psychological awareness of having a disease and usually
causing that person to modify his or her behavior” (Cockerham 2012:167). Health and
longevity may not be all that an individual desires. Instead, other life goals or desires

12
such as social status, freedom from responsibility, “power, manliness, or beauty” may act
as stronger motivators for behavior (McElroy and Jezewski 2000:194; Phelan, Link and
Tehranifar 2010:S35). Personality and emotional variables such as “self-esteem,
perceptions of mastery or control, anger or hostility, feelings of helplessness,
hopelessness and repression or denial,” are now being considered as risk factors for poor
health (Williams and Collins 1995:375). Nonetheless, there is a common thread among
these motivations, desires, personality and emotional variables: they do not form in a
vacuum. Instead, one’s psychological awareness is reliant on his or her stocks of
knowledge, which are intricately interconnected and interdependent with society. An
individual’s goals and desires are a product of culture; “the responses of others are as
important in the illness experience as is the interpretation of the one who is ill” (McElroy
and Jezewski 2000:191). Thus, “the individual level and the microcultural level, [i.e.
agency and structure] interconnect and mutually [emphasis added] influence [illness]
behavior” (McElroy and Jezewski 2000:195).
The extent to which agency and structure interact to produce illness behavior is
evident in the “culturally patterned social and personal elements of sickness” (Kleinman
and Seeman 2000:231). For men, illness “raises self-doubts about masculinity”
(Courtenay 2000:1389). Low SES predicts “elevated rates of a broad range of psychiatric
conditions for both blacks and whites” (Williams and Collins 1995:351). “Younger and
middle-aged people often make concerted efforts to manage their illness. They maintain
hopes and plans, reasons, and responsibilities” (Charmaz 2000:283). These patterns
suggest that the same structural pathways that contribute to health behaviors and thus
health disparities also contribute to illness behavior.
13
Just as questionable as the extent to which an individual has control over his or
her propensity for disease is the extent to which one governs his or her response to it. An
individual’s subjective response to disease is so tortuously intersected with his or her
structural position within society that there is no sense in parsing out the effects of
structure from the effects of agency. Instead, it is critical to predict illness behavior so as
to maximize health, manage chronic disease, and minimize the cost of healthcare.
The Importance of Predicting Illness Behavior: Health, Chronic Disease and Healthcare
Although health and illness are subjectively defined by the individual, “influenced
by the dialectic between the body and the self,” most “laypersons tend to view health as
the capacity to carry out their daily activities” (McElroy and Jezewski 2000:191;
Cockerham 2010:7). Likewise, the biomedical criteria for health “usually includes
instrumental components such as the ability to work and to fulfill expected roles”
(McElroy and Jezewski 2000:191). If modern medicine is to maximize its ability to
promote “health,” as it is unanimously defined, it is necessary to examine the subjective
response to disease as well as the structural factors that contribute to that response.
Understanding and predicting the subjective response to disease is of particular
interest in today’s increasingly complex healthcare setting. Since the development of
modern medicine, healthcare in the U.S. has followed a biomedical model in which
illness is “an abnormal biological affliction or mental abnormality with a 1) cause, 2)
characteristic train of symptoms, and 3) method of treatment,” [numbering and emphasis
added] (Cockerham 2010:166). In the biomedical model, symptoms are followed by a
diagnosis and its prescribed treatment. Following this biomedical model, modern
healthcare has developed sophisticated ways of diagnosing and treating most acute and

14
infectious diseases. Nonetheless, the treatment of chronic illnesses does not fit this
regimen. Due to the very nature of “chronic” illnesses, they are not necessarily treatable.
Instead, more and more Americans are living with chronic conditions for an extended
period of time. Thus, modern medicine must become increasingly concerned with how
individuals live with and manage these chronic illness. Wasserman and Hinote (2012)
explain:
Medicine’s accomplishments in treating infectious disease, both in the
clinic and through public health measures, initiated the epidemiological
transition, where chronic illnesses became the primary mortality threats in
developed countries, mainly due to increased life expectancy (Cockerham
2007) . . . . This is especially problematic because the profiles of chronic
and infectious disease are paradigmatically different. Therefore the
modern conception of medicine, which is matched so well with infectious
disease, likely will increasingly fall short as chronic illnesses constitute a
greater share of the epidemiological picture. (Wasserman and Hinote
2012:147)
Because of the biomedical model’s inability to effectually treat and manage
chronic illnesses, and because of the rising costs of healthcare, chronically ill individuals
are taking matters into their own hands. They are utilizing “lay and experiential
knowledge” which “will increasingly come into conflict with and challenge professional
knowledge” (Conrad and Barker 2010:S72). This is concerning not only in terms of the
well-being of the individual, but also in terms of the cost of an inadequate healthcare
system. A report authored by Williams, Sternthal and LaVeist “estimated that the medical
care and lost productivity costs for racial disparities in health [alone] amount to a $309
billion annual loss to the U.S. economy” (Williams and Sternthal 2010:S23). If modern
medicine is to understand how individuals manage and live with chronic disease, to
promote the well-being of the individual and to minimize the cost of ineffective
healthcare, research must examine the means through which chronically ill individuals

15
are obtaining lay and experiential knowledge, consciously or subconsciously, to shape
their illness behaviors.
Predicting Illness Behavior: Demographics and Social Pathways
Researchers and methodologists could initially argue that “a phenomenological or
symbolic interactionist theoretical framework could best explain illness experiences” and
thus illness behavior (Conrad and Barker 2010:S68). Sociologists Good and Good
advocate for doctors’ use of illness narratives in diagnosing patients, acknowledging that
“beliefs and perceptions held by patients and their families constitute an important
reality, not only for ethnographers, but also for practitioners” (Good and Good
1980:166). What researchers like Good and Good fail to recognize are the structural
factors that may be preventing patient’s ability or willingness to seek professional
medical care to begin with. An ethnographic study cannot be performed on the
unidentified chronically ill individuals that rely on lay and experiential knowledge to treat
their own chronic conditions. Furthermore, illness narratives cannot be generalized to the
larger population, to explain variance in illness behavior between demographics (Conrad
and Barker 2010:S68). Indeed, the means through which chronically ill individuals are
obtaining lay and experiential knowledge to shape their illness behaviors are cultural.
Their patterns of meaning-making exist and should be measured at the microcultural level
of analysis. “In contrast to the medical model, which assumes that diseases are universal
and invariant to time or place,” a social constructionist approach can “emphasize how the
meaning and experience of illness is shaped by cultural and social systems” (Conrad and
Barker 2010:S68).
It is at the microcultural level of analyses that Parsons’s sick role model can and

16
should be employed to examine patterns of illness behavior among the chronically ill.
Research has successfully illustrated how three demographic variables contribute to
health disparities: 1) Gender predicts differences in health and longevity regardless of
individual agency and biological risk factors (Courtenay 2000). 2) Disparities between
races in health are rooted in the fundamental social conditions of disease rather than
behavioral [or biological] differences. 3) Socioeconomic status has been shown to be a
fundamental cause of disease. Research has failed to sufficiently examine the effects of
these demographics on illness behavior. Understanding illness behavior as a subjective
response (i.e. the meanings an individual assigns to disease) that is shaped by culture, it is
only logical to examine the effects of demographics as mediated by the same social
pathways that mediate health disparities: environmental exposures, social environment,
and healthcare. Embedded in these pathways are the roles society expects of the sick
individual as well as the roles the sick expect of themselves. Thus, measuring the extent
to which chronically ill individuals adopt Parsons’s sick role model can illuminate
patterns in the meaning-making involved in illness behavior.
A REVIEW OF PARSONS’S SICK ROLE THEORY
Throughout sixty years of medical sociological research empirically examining
health disparities and behavior, the criteria for physical health typically includes at least
one element allusive to the ability to work and fulfill expected roles. From a structural-
functionalist perspective, the ability to work and fulfill expected roles is not only
necessary to maintain one’s individual balance and functioning; it is also critical if
equilibrium is to be maintained within one’s social system. Similar to the way that illness
can be defined as the psychological awareness of disease, sickness can be defined as the

17
social recognition of illness, “signifying an impaired social role for those who are ill”
(Cockerham 2012:167).
Talcott Parsons was one of the first to acknowledge sickness a socially
constructed phenomenon and define it, in part, as the inability to work and fulfill
expected roles. In his 1951 book The Social System, Parsons posited the theory that
sickness is not only a physical condition, but a social role in and of itself with
“institutionalized expectations and corresponding sentiments and sanctions” (1951:463).
He wrote:
There seem to be four aspects of the institutionalized expectation system
relative to the sick role. First, is the exemption from normal social role
responsibilities, which of course is relative to the nature and severity of
the illness. . . . The second closely related aspect is the institutionalized
definition that the sick person cannot be expected by “pulling himself
together” to get well by an act of decision or will. . . . The third element is
the definition of the state of being ill as itself undesirable with its own
obligation to want to “get well.” . . . Finally, the fourth closely related
element is the obligation – in proportion to the severity of the condition, of
course – to seek technically competent help, namely, in the most usual
case, that of a physician and to cooperate with him in the process of trying
to get well. (Parsons 1951:437)
Parsons’s sick role model had unique value in its time in that it was the first to
“describe a patterned set of expectations defining the norms and values appropriate to
being sick” (Cockerham 2012:4). The first element of Parsons’s sick role, exemption
from normal social role responsibilities, is still consistent with modern day criteria for
illness: the inability to work and fulfill expected roles. Nonetheless, Parsons’s model
“was severely criticized and his views are no longer widely accepted” as much literature
has been aimed at challenging or disproving his theory (Cockerham 2010:166).
Challenging the Theory
Because Parsons sick role theory was presented as only one small component of a
18
much grander, macro-level social systems theory in his 1951 book, The Social System, its
details and logistics were not immediately nor fully outlined. As a result, Parsons’s sick
role theory spawned a surge of sociological research, much that aimed to fill the apparent
gaps in his model. While more current research associated with Parsons’s sick role aims
to test the theory empirically, some earlier work was aimed at challenging the theory
itself.
Rather than test the extent to which sick individuals adhere to Parsons’s sick role,
Emil Berkanovic was one who questioned the construct validity of the sick role theory
itself. Berkanovic was not concerned with how often sick individuals adapted the sick
role. Instead, he explored whether or not the behaviors and exemptions expected of and
assigned to the sick (according to Parsons), are expected and assigned in reality. As
fascinating a question as Berkanovic raised, his methodology was poor. By dispersing
questionnaires to only 130 Los Angeles workers, who were available by convenience,
Berkanovic’s test of construct validity of sick role traits was inadequate (Berkanovic
1972).
Also skeptical were Arnold Arluke, Louanne Kennedy and Ronald Kessler, who
questioned whether Parsons’s model was “the only generally accepted model of
appropriate sickness behavior” and whether it was “equally accepted in all segments of
society” (Arluke et al. 1979:30). Like Berkanovic, the sample used in Arluke, Kennedy,
and Kessler’s study was not generalizable to a population larger than the 1,000 recently-
discharged New York City patients they interviewed. However, their findings cannot be
entirely discounted. Though not supportive of Parsons’s model as a whole, their findings
did support, individually, the four sick role expectations offered by Parsons’s theory

19
(Arluke et al. 1979:32).
Empirically Testing the Theory: Seeking the Help of a Physician
Parsons’s sick role theory posed additional problems to researchers to wished to
test it empirically. In describing a patterned set of norms and values appropriate to being
sick, Parsons was defining what was appropriate illness behavior. Illness behavior can be
defined as “the activity undertaken by a person who feels ill for the purpose of defining
that illness and seeking relief from it” (Cockerham 2012:142). The activity undertaken to
seek relief could include self-care, psychosocial development, or environmental
adaptations. Nonetheless, the vast majority of research pertaining to Parsons’s sick role
seeks to measure the frequency of a single activity and the various predictors of that one
component: whether or not one seeks medical help.
Some research, such as that of Frederic and Sally Wolinsky and David Britt,
suggests that individuals seek medical help to gain “legitimation” of their sick behavior.
The ability of the sick to gain support for maintaining his or her sick role was of specific
interest in their research. Frederic and Sally Wolinsky looked at different cohorts of ages
and socioeconomic statuses, looking for differences in a sick individual’s likelihood to
expect sick role legitimation as well as his or her likelihood to get it. They find that while
older cohorts of low SES are most likely to expect sick role legitimation, or support, it is
the less educated that are most likely to get legitimation (Wolinsky 1981:229).
Like Wolinksy and Britt, Frank Petroni suspected that sick role legitimacy was a
key indicator of an individual’s likelihood to visit a physician. However, Petroni
suspected that this legitimation varied with family size and social class. To test his
hypotheses, Petroni interviewed 67 three-generation families, asking a variety of

20
questions aimed at measuring four variables: legitimacy, family size, social class, and
frequency of physician visits. While family size, illness frequency, and social class were
fairly straightforward in terms of Petroni’s conceptualization, his measurement of sick
role legitimacy was unsatisfactory. To measure sick role legitimacy, Petroni asked the
“available” spouses of respondents how they would react if the respondent were afflicted
with one of several hypothetical illnesses: Is it the sick respondent’s “right to 1) be
helped physically, 2) see a doctor, 3) relinquish other role responsibilities, 4) assume a
dependency role” (Petroni 1969:730). By assuming the sick only obtain role legitimacy
from their spouses, Petroni ignored the fact that role reinforcement takes place in social
institutions outside marriage. Additionally, Petroni’s sample size was too small and
limited to generalize any results or gain any true knowledge of the sick role concept as a
whole.
Additional research looked at stress as a factor contributing to whether or not the
sick individual seeks medical help. In 1961, David Mechanic and Edmund H. Volkart
recognized illness as the psychological awareness of disease and examined illness
behavior as correlated with the frequency of utilizing medical care. Mechanic and
Volkart assert that there is an “analytically separate phenomena of developing illness
(symptoms, disease) and coming under medical care,” or seeking the help of a physician
(Mechanic and Volkart 1961:51). In an attempt to illustrate the variance in those who
seek medical care versus those who do not as caused by stress, Mechanic and Volkart
measured the stress, frequency of medical visits, and “inclination to adopt the sick role”
of 614 freshmen males at a large Western university (Mechanic and Volkart 1961:54). By
utilizing the school’s medical records along with responses to a twice-distributed

21
questionnaire, Mechanic and Volkart found that those most likely to adopt the sick role
were those most likely to seek medical attention. Stress of the respondents seemed to
have little influence on their frequency of medical visits. Unfortunately, Mechanic and
Volkart’s conceptualization was poor in that they measured the respondents’ stress by
their inclination to describe themselves as “lonely” or “nervous.” Likewise, they
measured “inclination to adopt the sick role” by a series of questions regarding how
likely they would have been to visit the doctor in specified hypothetical situations.
Measurement of the number of likely visits to the doctor is measurement of only one of
Parsons’s sick role elements but is represented as measurement of the entire concept – an
unacknowledged fault of Mechanic and Volkart’s work. By limiting their sample to only
males and only college freshmen, Mechanic and Volkart also failed to generate results
that were generalizable to any population larger than that of their study and left too much
unexplained variance in sick role behavior.
H. Reed Geertsen and Robert M. Gray focused on the “family as a factor
influencing the utilization of existing medical services” (Geersten and Gray 1970:639).
Geertsen and Gray suspected that the more “familialism” the mothers perceived, who
were at the time of the study were regarded as the primary caregivers in most households,
the more likely they were to utilize medical services and thus adapt Parsons’s sick role.
Familialism was conceptualized as support for family members, putting family members’
needs before oneself, loyalty, and a sense of responsibility to care for family members
younger or less able (Geertsen and Gray 1970:641). The relationship between familialism
and mothers’ tendency to adopt the sick role was positive in this study. However, like
Petroni and Mechanic and Volkart, the sample size used disallowed the results to be

22
generalized to a larger population. Likewise, by interviewing mothers only, Geertsen and
Gray missed uncovering the effects of familialism on fathers as well as adults with no
children.
Similar research also addressed the impact of SES on sick role adaptation. David
Britt explored the reciprocal relationship between “indicators of social class and forms of
illness” (Britt 1975:178). Britt hypothesized that if, over a one year period, the income
increased for the head of a household, the extent of his self-reported illness (SRI) would
decrease. Britt also expected the reverse to be true: As the frequency of SRI increased,
the income of the head of a household would decrease (Britt 1975:179). To test these
hypotheses, Britt used data from the University of Michigan’s Panel Study of Income
Dynamics, which was originally collected from a stratified random sample of households
in the United States (Britt 1975:179). Although Britt found what he considered a
significant relationship between SRI and income, he did not explore any explanations for
the relationship. Instead, he only noted that the stress involved with low income may
contribute to physical symptoms that contribute to self-reported illness (Britt 1975:181).
“Recent reviews of the evidence of the contribution of medicine to health status indicate
that the role of medicine is frequently overstated and that the removal of economic
barriers alone will not eliminate social disparities in health care utilization” (Williams
and Collins 1995:372).
Complexities of Testing the Theory: Chronic Illness and Expectations
Not only is much of the existing empirical research on Parsons’s sick role not
generalizable, it is inconclusive in that it measures only patients’ likelihood to seek
medical help. This inconclusiveness is understandable considering Parsons’s model
23
consists of four components; besides being obligated to seek medical help, the model
asserts that the illness is not the sick individual’s fault, the sick individual should want to
get well, and the sick individual is exempt from daily obligations and responsibilities. It
is difficult, if not impossible, to empirically measure more than one of these components
at a time. Moreover, it is necessary to account for the variance of each measure along a
spectrum of illness ranging from acute to chronic.
The very nature of a “chronic” illness implies that the afflicted individual will be
ill for an extended period of time and/or cannot get well. Parsons’s failure to address
chronic illness in his sick role model was immediately evident. Thus, measuring the
extent to which the (acutely or chronically) afflicted individual was at fault or wanted to
get well was seemingly meaningless. Fourteen years after the publication of The Social
System, and in response to criticism, Parsons published a journal article in which he
elaborated on his original ideas regarding illness. In the article, he first clarified that acute
and chronic illness can be thought of not only in terms of illness duration, but in levels of
capacity to function:
Health as capacity seems to me to help show the relevance to this analysis,
not merely of acute illness, but of chronic, even terminal, illness. There are
many conditions which are, in any given state of the art of medicine,
incurable. However, recovery is the obverse of the process of deterioration
of health, that is, a level of capacities, and in many of these chronic
situations tendencies to such deterioration can be held in check by the
proper medically prescribed measures based on sound diagnostic
knowledge. (Parsons 1975:259)
Parsons then explained how the capacity to function can be maintained if the
individual seeks medical care and adheres to the prescribed regimen:
The cost consists . . . of adhering to a proper regimen and of deferring to a
competent professional authority in defining what it should be. The fact
then, that diabetes is not, in the sense of pneumonia, “curable,” does not
24
put it in a totally different category from that of acute illness. (Parsons
1975:259)
Despite Parsons’s argument that illness behavior is consistent, regardless of the
acute or chronic nature of the illness, critics of his sick role model were still not satisfied.
By 1976, researchers still sought a “clearly developed social definition of the role of the
permanently disabled or chronically ill” (Segall 1976:164). Some researchers suggested
that the “incurable” characteristic associated with chronic illness and disability lessens
the degree to which the ill are exempt or detached from their normal everyday roles
(Levine and Kozloff 1978:323). To Sol Levine and Martin A. Kozloff, “chronic illness is
often associated with old age, [and so] there may be ambiguity in role expectations”
overall (Levine and Kozloff 1978:324). Others assert that it is not chronic illness nor age
that accounts for the variance in expectations of and assigned to sick, but the presence or
absence of medical institutionalization. Those who are medically institutionalized,
according to John F. Myles, have no choice but to adapt to the sick role. Myles writes,
“Whether or not the individual is really sick becomes irrelevant; what is significant is that
inmates inevitably come to believe that they are sick and to behave accordingly. At a
social-psychological level, therefore, . . . the treatment becomes the cause of the ‘dis-
ease’ (sic)” (Myles 1978:509). Data collected on a stratified random sample of 4,805
respondents, aged 65 and over, supported Myles’s assertion. Most recently, it has been
suggested that there is no one clear set of expectations of illness behavior for the
chronically ill. On one hand, chronically ill individuals are expected to implement a
“routine regimen, self-monitoring and crisis management as prolonged compliance”; on
the other they are expected to perform “as far as possible in normal roles” (Varul
2010:83).

25
Not only does empirically testing Parsons’s sick role theory present problems in
terms of its four-component structure and the acute vs. chronic nature of illness, it also
presents problems in terms of the appropriate level of measurement. While society may
expect sick individuals to perform normal roles, sick individuals may or may not expect
themselves to perform them. Taking into account the degrees of separation between
disease, illness, and sickness, the level at which expectations of illness behavior are
measured will undoubtedly influence the results of any study. This research argues that it
is individuals’ expectations of themselves, their illness behaviors, that are of greatest
interest to the social sciences in light of a changing and complex healthcare landscape.
Using the Sick Role to Measure Illness Behavior
Using Parson’s four-component sick role model as an indicator of meaning-
making and illness behavior, research could measure any one component. However,
measuring the extent to which the chronically ill individual is at “fault” for his or her
behavior or the extent to which he or she “wants” to get well is empirically difficult. It is
possible to measure the extent to which sick individuals consider themselves exempt
from daily obligations and responsibilities.
Like research looking at Parsons’s sick role model overall, research concerning
the sick role and chronic illnesses is inadequate. As previously noted, some studies have
investigated an individual’s “well” role as influential on his or her own expectations of
(and ability to obtain) sick role legitimacy. Others have sought to describe the variance in
sick individuals’ perception of self versus society’s perception of the sick. However, too
little has been done to explore any one component of Parsons’s sick role apart from the
likelihood of the generally-ill to seek medical help. Furthermore, little empirical research

26
investigates sick role adaptation among chronically ill or disabled individuals.
Resultantly, no empirical research measures the factors influencing sick role adaptation in
terms of exemption from daily responsibilities and obligations among chronically ill
populations. This latter deficiency of existing literature is the aim of this present research.
METHODS
Empirical research in the field of medical sociology has demonstrated the
demographic factors that contribute to individuals’ propensity toward chronic illness(es).
The objective of this study is three-fold: First, this study seeks to measure the known
ways demographic factors (sex, age, race, relationship status, education, and region of
residence) influence individuals’ propensity toward chronic illness. Second, this study
seeks to measure the ways demographic factors influence sick-role adaptation among
populations of individuals who are self-reportedly chronically ill. Lastly, this study seeks
to compare the effects of demographic factors on chronic illness with their effects on sick
role adaptation. To compare these effects, two dependent variables are needed: one that
encompasses chronic illness and one that encompasses sick role adaptation. Further
discussion of these two dependent variables will follow.
The Data
The secondary dataset used for this study is the 2012 National Health Interview
Survey (NHIS) conducted by the National Center for Health Statistics (NCHS) which is
part of the Centers for Disease Control and Prevention (CDC). “The National Health
Interview Survey is a cross-sectional household interview survey. The sampling plan
follows a multistage area probability design that permits the representative sampling of
households and noninstitutional groups” (NHIS Codebook 2012).The sample was drawn
from the civilian, noninstitutionalized adult population of the 50 United States and the
27
District of Columbia. Individuals who are in long-term care institutions such as “nursing
homes for the elderly or hospitals for the chronically ill or physically or intellectually
disabled,” were excluded from the survey (NHIS Codebook 2012).
The 2012 NHIS contains multiple levels of data concerning family, household,
adults, and children. Data utilized for this research is the Person-Level, which provides
information on respondents’ health status and limitation of activity (NHIS Codebook
2012).The NHIS 2012 codebook explains how data pertaining to limitation of activity
were obtained:
Information on activity limitations, including questions about work
limitations . . . is collected for each family member. If any limitations are
identified, the respondent is asked to specify the health condition(s)
causing the limitation(s) and indicate how long the family member has had
each such condition. (NHIS Codebook 2012:26)
The Person-Level dataset contains 108,131 persons in 43,345 families. Data were
collected through computer-assisted personal interviews and face-to-face interviews. The
NHIS Person-Level data used a stratified multistage probability sample in which one
adult per family was randomly selected “with enhanced chances of selection for black,
Hispanic or Asian persons aged 65 years or older” (NHIS Codebook 2012).
The Dependent Variables
Because this study seeks to compare the effects of demographic factors on chronic
illnesses with their effects on sick role adaptation, two types of dependent variables are
needed. The dependent variables that measure respondents’ propensity toward each
chronic illness will be discussed first.
Extended condition durations
Research has shown that members of certain demographic groups are not only

28
more likely to at some point in their lives have a chronic illness, they are also more likely
to get it at an earlier age and thus have it for a longer period of time. Therefore, to test
respondents’ propensity toward a chronic illness, the first dependent variables need to
encompass both the existence of a chronic illness and the duration of that illness. These
first dependent variables, condition durations, were constructed for each of the eleven
conditions using two variables (for each condition, eighteen total) from the dataset.
First, if respondents to the NHIS 2012 survey indicated “yes” to the question,
“Are you limited in the kind OR amount of work you can do because of a physical,
mental or emotional problem?” they were then asked which condition caused their
limitation. The respondents examined in this study indicated they had one of the
following eleven chronic conditions: arthritis, back or neck problem, bone or joint injury,
heart problem, stroke problem, blood pressure problem, diabetes, cancer, depression or
emotional problem, lung or breathing problem, or weight problem. These eleven
dichotomous variables are referred to as “chronic conditions” in this research project.
These eleven chronic conditions were chosen due to the variance in the severity of their
accompanying symptoms and the invasiveness of their typically-prescribed medical
treatments. Although not all of these conditions may appear to be chronic conditions, it
should be noted that at least 94% of respondents who indicated each condition also
indicated that condition is chronic. For six out of the eleven conditions, 100% of
respondents indicated that their condition is chronic.
29
Next on the NHIS, respondents who indicated having a chronic condition were
asked, “How long have you had [this condition]?” Optional responses to this question
were 1= Less than 3 months, 2= 3-5 months, 3= 6-12 months, 4= More than 1 year, 7=
Refused, 8= Not ascertained and 9= Don’t know. These eleven ordinal variables are
referred to as “chronic durations.” It should be noted that respondents who did not
indicate a chronic condition were not asked how long they’d had that condition.
To measure effects of demographic factors on both the existence of each chronic illness
and the duration of that illness, neither chronic conditions nor chronic durations can be
used on their own. Chronic conditions does not account for the duration of the illnesses;
chronic durations excludes those that do not have the indicated condition and
unfavorably reduces the sample size of nested regression models. Thus, for the purposes
of this research, each condition’s chronic condition variable was multiplied with its
chronic duration variable to get condition durations. As an example, Figure 1 illustrates
how the diabetes condition duration variable was constructed. The same ordinal variable
construction was used for the other ten examined conditions. Each of the eleven ordinal
condition duration variables were recoded as illustrated in Figure 1, where 0= No chronic
condition, 1= Chronic condition for up to 3 months, 2= Chronic condition for 3 to 5
months, 3= Chronic condition for 6 to 12 months, and 4= Chronic condition for more
than one year.
It should be noted that, for each of the eleven conditions, the majority of
respondents who indicated having that condition also indicated they had had that
condition for more than one year. (See the white condition duration variables in Table 1.)
Because of the skewed distribution of the condition duration variables, it was necessary

30
to collapse each of them into dichotomous variables for adequate use as dependent
variables. Thus, each condition duration variable was also coded as dichotomous, where
0 = No condition or condition for 1 year or less and 1 = Condition for more than 1 year.
These dichotomous, condition duration, dependent variables will hereafter be referred to
as extended condition durations. A summary of each extended condition duration
dependent variable can be found in gray in Table 1.
Sick role adaptation
To compare the effects of demographic factors on chronic illnesses duration with
their effects on sick role adaptation, a second type of dependent variable was needed that
encompasses sick role adaptation. Using the given dataset, one cannot empirically
measure the extent to which an individual is exempted from responsibility or fault for his
or her condition. This is one of Parsons’s four sick role concepts and it is an
institutionalized idea rather than a product of the patient’s individual attributes. Likewise,
because this research is examining chronically ill individuals, the extent to which a
respondent regards his or her condition as undesirable would be empirically difficult to
measure. Finally, the likelihood of respondents seeking medical help has been
overanalyzed by existing literature. This research aims to measure the extent to which
respondents adapt the sick role by considering themselves limited in their daily
obligations and responsibilities.
The extent to which an individual is exempt from his or her daily obligations and
responsibilities is subjective and dependent on the respondent. The interest of this study
is not the opinions of society regarding the sick. Instead, this study aims to measure the
likelihood that respondents will consider themselves limited in their ability to fulfill their

31
daily obligations and responsibilities. Because the majority of individuals in the U.S.
population share the daily obligation or responsibility of work, the extent to which
respondents consider themselves limited in their work is used as an indicator of their sick
role adaptation.
A single question on the 2012 NHIS survey asks, “Are you limited in the kind or
amount of work you can do because of a physical, mental or emotional problem?”
Responses to this question were coded as follows: 0 = Unable to work, 1 = Limited in
work, 2 = Not limited in work, 7=Refused, 8=Not ascertained and 9=Don’t know. The
resulting variable was recoded to be a dichotomous variable where 0 = Not limited in
work and 1 = Limited in or unable to work; this variable will hereafter be referred to as
“work limitation”.
The Independent Variables
Due to the fact that much of the existing literature examines sex, race, and
socioeconomic status as indicators of heath disparities, these same three variables are also
of interest in this study. Unfortunately, information regarding the respondents’ income
was not available in the Person-Level dataset. Education was used as a proxy for SES,
given its high correlation with income and occupation in U.S. society. Preliminary studies
utilizing data on end-stage renal disease patients also suggested that age is a key
contributing factor in sick role adaptation; thus, age was utilized in this study as well.
Lastly, as this study aims to reveal the structural pathways that influence sick role
adaptation, the region of the country in which respondents live and cohabitation were also
used as independent variables.
The sex variable was coded as follows: 0= Male and 1= Female. Likewise, the

32
race variable used was coded to allow us to decipher the effects of being white relative to
all other races: 0= Other and 1= White. The education variable was originally interval-
ratio, indicating years of education. As the types of employment an individual can secure
are more often than not dependent on his or her highest level of education completed, or
degree, the education variable was recoded to reveal the effects of having earned 0= Less
than a high school diploma, 1= High school diploma or GED, 2= Some College, 3=
Bachelor’s degree, or 4= Masters degree or higher.
Since respondents to the 2012 NHIS had to be at least eighteen years of age to
participate in the questionnaires, the minimum age in this dataset is eighteen. The
maximum value of age is eighty-five. When bivariate regression was used to examine the
influence of age on work limitation (Table 2-2), it appeared that each year of age predicts
lesser odds of work limitation, which is not in line with traditional role expectations of
the elderly. Since the type of work an individual does varies throughout the life course, as
do the expectations society has regarding age and work, it is necessary to control for age
in a way that is in line with these changes and expectations. Thus, the age variable in this
dataset was collapsed to allow for examination of being a new worker (age 18-35) or an
experienced worker (age 35-64), relative to those who are seasoned or retired workers
(age 65 and older).
The literature discussed in this study suggests that the extent to which an
individual adapts the sick role is dependent on his or her ability to gain support or
legitimacy, as well as the number of dependents he or she may be supporting financially.
Therefore, an additional variable was needed that could encompass these two influences.
Empirically measuring one’s ability to gain legitimacy and support is problematic
33
because legitimacy and support can come from several sources. The existing literature
suggests that sick-role legitimation comes from both medicalization and a sense of
familialism. Because this study is not concerned with the respondent’s frequency of
medical visits, measuring legitimacy or support as originating from the medical field
would be senseless. Instead, this study aims to measure legitimacy as generated from the
respondents’ immediate social networks, specifically that of a personal relationship.
Respondents’ marital status may not indicate the extent to which they receive
emotional support or legitimacy, nor the extent to which they give or receive financial
support. Likewise, variance in same-sex and non-married but cohabitating couples cannot
be captured by looking at only “married” versus “non-married” respondents. Instead, the
partner living condition of respondents is of most value in terms of measuring legitimacy
and dependency. The 2012 NHIS asked respondents to describe their marital status and
living conditions as one of the following: married and living with a partner, married and
not living with a partner, not married but living with a partner, not married and not living
with a partner, or never married. The resulting variable was recoded as 0= Not living with
partner (married or not married) and 1= Living with partner (married or not married) and
will hereafter be referred to as cohabitation. Family size was not an available variable in
the Person-Level dataset. The region of the country in which respondents live was
dummied to four separate variables: South, Midwest, West, and Northeast. The Northeast
was used as the reference category in all regression models.
Preliminary Analyses
Because previous research has demonstrated the effects of demographics on
chronic illness, no preliminary analyses were performed using extended condition
34
duration as a dependent variable. Preliminary analyses were performed that examined the
individual effects of demographics and chronic conditions on work limitation. Using
bivariate logistic regression, as illustrated in Table 2-1, it is discovered that age,
education, being white, cohabitation, and living in the West are, on their own, statistically
significant predictors of lesser odds of work limitation. On the other hand, being ages 18
to 64, being male, and living in the South are, on their own, statistically significant
predictors of greater odds of reporting work limitation.
One would expect that the existence of any chronic condition would increase
respondents’ odds of work limitation. However, when bivariate logistic regression was
used to look at the individual effects of all chronic conditions, it was discovered that
neither the existence of arthritis nor the existence of a bone or joint injury had a
statistically significant influence on the odds of respondents considering themselves
limited in their amount or kind of work. (See Table 2-2.) As a result, these two conditions
were dismissed from subsequent regression models.
Regression Modeling: Comparing Effects
To compare the effects of demographic factors on extended condition duration
with their effects on work limitation, two separate regression models were needed for
each chronic condition. Because both extended condition duration and work limitation
are dichotomous, logistic regression was used to examine the effects of independent
variables on each dependent variable. Tables 3 through 11 (Appendix) each examine a
different chronic condition. Model 1 and Model 2 within each table both examine the
same chronic condition. Model 1 in each table (3-11) shows the effects of demographics
on extended condition duration (for a given condition). Model 2 in each table (3-11)

35
shows the effects of demographics on work limitation, when controlling for the condition
duration (of that same condition). It should be noted that the condition duration control
variables used in Model 2 are ordinal, so as to measure the effects of a one unit increase
in condition duration on work limitation. Figure 2 illustrates the ways Model 1 and
Model 2 are setup in Tables 3-11.
As preliminary studies have suggested and consistent with the individual effects
of the independent variables, the core hypotheses tested here are as follows:
H1: Being male, and in the South, Midwest or West will lead to greater odds of
reporting extended condition duration for all conditions.
H2: Being highly educated, ages 18-64, white and cohabitating will lead to lesser
odds of extended condition duration for all conditions.
It is anticipated that the duration of respondents’ chronic illness can better predict
their work limitation than can their demographic characteristics. Thus, the third
hypothesis being tested is as follows:
H3: The effects of these demographic characteristics on work limitation will be
spurious when controlling for chronic illness duration.
Figure 2. Model Setup for Logistic Regression Tables 3-11
Model 1:
Demographics
Core IVs
Model 2:
Demographics Condition Duration Work Limitation
Core Ivs Ordinal Control IVs DV
Do gender, age, race, cohabitation, education and region of residence affect work
limitation in the same ways they affect extended condition duration ?
How do gender, age, race, cohabitation, education and region of residence affect
extended condition duration ?
Extended Condition Duration
Dichotomous DVs
36
ANALYSES
Tables 3-11 in the Appendix illustrate the effects of demographics on extended
condition duration and on work limitation for each of the nine conditions. Although the
individual effect of every independent variable in each model is of interest and carries its
own implications, the comparative effects of demographics between Model 1 and Model
2 and across conditions are of particular interest in this study.
The Effects of Demographics on Extended Condition Duration
As was discussed in the review of the literature, the demographic variables used
in this study are known to be predictors of health disparities. If these variables predict
health disparities, they must also predict the propensity toward early-onset of chronic
illness and thus extended condition duration. However, the effects of demographics on
extended condition duration were not consistent across all nine conditions. Instead, it
appeared that the effects of demographics on extended condition duration were specific to
each condition. Model 1 in Tables 3-11 in the Appendix illustrate the influence of
covariates on extended condition duration. For illustrative purposes, Table 3, which
examines respondents who indicated a chronic back or neck problem, will be explained in
detail. The individual effects of each independent variable, holding all other variables
constant, will be discussed.
Only age, race, and cohabitation were statistically significant predictors of
extended condition duration in Table 3. In other words, only age, race and cohabitation
can predict the odds of respondents having a chronic back or neck problem for more than
1 year. Respondents ages 18-34 had .29 lesser odds of reporting extended condition
duration, relative to respondents ages 65 and older; respondents ages 35-64 had .87

37
greater odds of reporting extended condition duration, relative to respondents ages 65 and
older. Respondents who are white had .17 greater odds of reporting extended condition
duration, relative to all other races. Respondents who cohabitate with a partner had .13
greater odds of reporting extended condition duration. Education, gender, and region of
residence were not statistically significant predictors of extended condition duration.
Subsequent analyses of the effects of demographics on extended condition
duration are presented in Model 1 of tables 4-11 and are summarized in the gray columns
of Figure 3. In Figure 3, only statistically significant relationships are shown. A plus (+)
sign represents a relationship where a one unit increase in the IV leads to significantly
greater odds of reporting extended condition duration (gray columns) or work limitation
(white columns); a negative (-) sign represents a relationship where a one unit increase in
the IV leads to significantly greater odds of reporting extended condition duration (gray
columns) or work limitation (white columns).
The effects of demographics on extended condition duration varied and were
unique to each condition. Respondents ages 18-34 had lesser odds of reporting extended
condition duration if they had a back or neck problem, heart problem, stroke problem,
blood pressure problem, or diabetes, relative to respondents ages 65 and older. Because
the likelihood of each of these chronic conditions naturally increases with age, this is
expected and supports the second hypothesis tested. Nonetheless, these same respondents
had greater odds of reporting extended condition duration if they had an emotional
problem. One explanation for these condition-specific effects is the stress associated with
providing for oneself and one’s family as a young, working adult. Compared to
respondents ages 65 and older, respondents ages 18-34 could feel a greater sense of

38
responsibility and unrest due to their fewer life experiences. These negative feelings
undoubtedly contribute to emotional problems such as depression or anxiety and likely
continue well throughout respondents’ young adult, or “new worker” years.
Relative to respondents ages 65 and older, respondents ages 35-64 had lesser odds
of reporting extended condition duration if they had a heart problem, stroke problem,
blood pressure problem, diabetes, cancer, or lung or breathing problem; this also supports
the second hypothesis tested. However, these “experienced workers” had greater odds of
reporting extended condition duration if they had a back or neck problem, an emotional
problem or a weight problem. To explain experienced workers’ greater odds of having a
back or neck problem for more than one year, one must account for number of years they
have been in the workforce. It is likely that respondents ages 35-64 are still working in
professions that take a physical toll on their bodies, including their backs and necks.
Compared to respondents ages 65 and older, respondents ages 35-64 are more likely to
Figure 3. Direction of Odds of Statistically Significant Predictors of Extended Condition Duration and Work Limitation
Chronic Duration < 3 mo
Chronic Duration 3-5 mo
Chronic Duration 6-12 mo
Chronic Duration > 1 yr + + + + + + + + +
Age 18-34 (compared to 65+) - + - + - + - + - + - + + + + +
Age 35-64 (compared to 65+) + + - + - + - + - + - + + + - + + +
Education - - - - - - - - - + - - - - -
Male + + + + + + + + - + + - +
White + - - - +
Cohabitation + - - - - + - + - - - - -
South (relative to Northeast) + + + + + + + + + + - + + +
Midwest (relative to Northeast) + + + + - + + + - + + +
West (relative to Northeast) + + + + + + - + - + +
Constant - + - + - + - + - + - + - + - + - +Gray columns show statistically significant predictors of extended condition duration
White columns show statistically significant predictors of work limitation.
Weight
Problem
Emotional
ProblemCancer
Back or
Neck
Problem
Heart
Problem
Stroke
Problem
Blood
Pressure
Problem
Lung or
Breathing
Problem
Diabetes

39
have jobs and/or personal lives that demand physical activity. Moreover, they are also
likely to experience many of the same pressures and stressors as new workers, which
accounts for their greater odds of reporting an emotional problem. Respondents ages 35-
64 have not been exposed to cigarette smoke or environmental toxins for as long as their
65 and older counterparts have; thus, it is understandable why respondents ages 35-64
have lesser odds of reporting extended condition duration for lung or breathing problems.
With each additional level of education or degree obtained, respondents had lesser
odds of reporting extended condition duration with a heart problem, stroke problem,
blood pressure problem, diabetes, and lung or breathing problem. This also supports the
second hypothesis that was tested. Nonetheless, the effects of education were again
inconsistent across all conditions. Education had no statistically significant effect on
extended condition duration for those with a back or neck problem or those with an
emotional or weight problem. For respondents with cancer, education significantly
predicted greater odds of reporting condition duration. The effects of education on cancer
duration can best be explained by income. Respondents with higher levels of education
typically have more income by which they can afford the pricey and extensive treatments
associated with most types of cancer.
Male respondents had greater odds of reporting extended condition duration if
they had a heart problem or stroke problem. However, the effects of being male on
extended condition duration only supported the second hypothesis for these two
conditions. Male respondents had lesser odds of reporting extended condition duration if
they had an emotional problem or weight problem. These condition-specific effects are
best understood in light of men’s pursuit of hegemonic masculinity, which results in

40
unhealthy behaviors that lead to heart and stroke problems, and the feminine stigma
society attaches to emotional and weight problems.
White respondents had lesser odds of reporting extended condition duration if
they had a stroke problem, blood pressure problem, or diabetes; these effects support the
second hypothesis tested. However, white respondents had greater odds of reporting
extended condition duration if they had a back or neck problem or an emotional problem.
One suggested explanation for these condition-specific effects is the difference in the way
white culture socially acknowledges and accepts these two conditions. It is possible that
white respondents are not more prone to back or neck or emotional problems; they are
just more likely to report them because their culture tells them that is acceptable.
Cohabitating respondents had greater odds of reporting extended condition
duration if they had a back or neck problem, diabetes, or cancer. These findings do not
support the second hypothesis tested. Furthermore, these findings suggest that
cohabitation may lead to unhealthy lifestyles or elevated feelings of stress, which
contribute to respondents’ propensity toward chronic conditions. Nonetheless,
cohabitation may contribute to emotional well-being to some extent as cohabitating
respondents had lesser odds of extended condition duration for an emotional problem.
All individual effects of region of residence on extended condition duration are
relative to respondents who live in the Northeast. Respondents who live in the South had
greater odds of reporting extended condition duration if they have a heart problem, stroke
problem, blood pressure problem, or diabetes; they have lesser odds of reporting
extended condition duration if they have an emotional problem. Respondents who live in
the Midwest have greater odds of reporting extended condition duration if they heart
41
problem, and lesser odds of reporting extended condition duration if they have a blood
pressure problem or emotional problem. Respondents who live in the West had lesser
odds of reporting extended condition duration if they have an emotional problem or lung
or breathing problem. The effects of respondents’ region of residence on extended
condition duration were inconsistent, inconclusive and did not support the first hypothesis
tested.
The Effects of Demographics on Work Limitation
Model 2 in Tables 3-11 in the Appendix illustrate the influence of covariates on
work limitation. Again for illustrative purposes, Table 3, which examines respondents
who indicated a chronic back or neck problem, will be explained in detail. The individual
effects of each independent variable, holding all other variables constant (including
condition duration), will be discussed.
Age, education, gender, cohabitation, and region of residence were statistically
significant predictors of work limitation in Table 3, even when controlling for condition
duration. In other words, age, education, gender, cohabitation, and region of residence
can predict the odds of respondents reporting limitation in their amount or kind of work,
regardless of how long they had had a back or neck problem. Respondents ages 18-34
had 1.23 greater odds of reporting work limitation, relative to respondents ages 65 and
older; respondents ages 35-64 had 1.68 greater odds of reporting work limitation, relative
to respondents ages 65 and older. With each additional level of education or degree
obtained, respondents had .16 lesser odds of reporting work limitation. Male respondents
had .16 greater odds of reporting work limitation, compared to females. Respondents who
cohabitate with a partner had .14 lesser odds of reporting work limitation. All effects of

42
region of residence on work limitation are relative to respondents who live in the
Northeast. Respondents who live in the South had .49 greater odds of reporting work
limitation; respondents who live in the Midwest had .30 greater odds of reporting work
limitation; respondents who live in the West had .17 greater odds of reporting work
limitation.
Interestingly, there was no statistically significant relationship between the
duration of respondents’ back or neck problem and their odds of reporting work
limitation if they had had the condition for a year or less. In other words, respondents
who had had a back or neck problem for a year or less were no more or less likely to
report work limitation than respondents who had no back or neck problem. Respondents
who had had a back or neck problem for more than one year had .83 greater odds of
reporting work limitation than respondents with no back or neck problem.
The direction of the effect of each independent variable on work limitation was
consistent across all nine conditions. All demographic variables except race had a
statistically significant effect on the odds of respondents reporting work limitation, even
when controlling for condition duration. This in no way supports the third hypothesis that
was tested. Subsequent analyses of the effects of demographics and condition duration on
work limitation are presented in Model 2 of tables 4-11 and are summarized in the white
columns of Figure 3.
Across all nine conditions, respondents ages 18-64 had greater odds of reporting
work limitation, relative to those ages 65 and older. This can be explained by the fact that
respondents ages 18-64 are more likely to be working than respondents ages 65 and older
and are therefore more likely to be limited in their amount or kind of work. Each
43
additional level of education or degree predicted lesser odds of reporting work limitation,
as did cohabitation. Respondents with higher levels of education are less likely to be
doing physical labor and are thus less likely to be limited in their amount or kind of work
due to a physical impairment. Respondents who live with a partner had lesser odds of
reporting work limitation. Cohabitating respondents are likely to share financial
obligations with that partner and his or her dependents. Thus they may feel obligated to
“work through” physical limitations. At the same time, respondents who share financial
obligations with a live-in a partner may have the flexibility to adjust the amount or kind
of work they do or gain legitimation for their illness by avoiding work. Thus, the effects
of their physical limitation are minimized. Being white had no statistically significant
relationship with reporting work limitation.
Male respondents had significantly greater odds of reporting work limitation for
all nine conditions. This could suggest that men are more likely to be employed doing
physical labor. This could also suggest that illness behavior that demonstrates or exhibits
men’s physical suffering may also perpetuate hegemonic masculinity. In other words,
men who make rough and tough, “manly” lifestyle and career choices may feel validated
as masculine if those choices were executed to such a degree that they resulted in
(physical) work limitation.
Respondents living in the South, Midwest, or West had greater odds of reporting
work limitation than respondents in the Northeast. This suggests that the workforce in the
Northeast is less forgiving for employees who are limited in the amount or kind of work
they can do. This less forgiving environment could be explained by a number of factors
including the region’s unemployment rate, the proportion of white-collar versus blue-
44
collar jobs offered in the Northeast compared to other regions, and the Northeast climate.
If unemployment is lowest in the Northeast, competition for positions is high and
employees cannot “afford” to admit limitation. If the Northeast has a higher proportion of
white-collar jobs than do other regions, Northeast workers’ on-the-job performance may
be less affected by physical limitations than their blue-collar counterparts’ performance.
Lastly, the cooler climate of the Northeast may require more workers in that region to
work indoors, protecting them from environmental extremes that would afflict limited
workers.
Interestingly, there was no statistically significant relationship between condition
duration and work limitation for respondents who had had their condition for a year or
less for any of the nine conditions. Respondents who had had their chronic condition for
0-12 months were no more or less likely to report limitation in their amount or kind of
work than those with no condition at all, controlling for all other variables.
CONCLUSION
This research shows that illness behavior can be conceptualized in terms of
Talcott Parsons’s sick role, a theory that has long been dismissed as too complex and
inapplicable to chronic illnesses. Furthermore, this research empirically measures the
factors influencing sick role adaptation in terms of exemption from daily responsibilities
and obligations among chronically ill populations, a component of Parsons’s theory that
has been neglected throughout sick role literature. While existing sociological literature
has shown that demographic characteristics such as gender, race and SES can predict
health disparities, it has failed to sufficiently examine how these characteristics also
contribute to the subjective response to disease or illness behavior. This study of 11,580

45
NHIS respondents not only illustrates the effects of demographics on illness behavior, it
also suggests that demographics are a better predictor of illness behavior than of health
disparities.
Summary of Analyses
In this study, demographics inconsistently predicted respondents’ propensity
toward the nine examined conditions. A single demographic characteristic may have
predicted greater odds of reporting one chronic condition and lesser odds of reporting
another. For some of the examined conditions, respondents’ odds of reporting that
condition were not affected by all demographic characteristics. Thus, this study
demonstrates the known fact that while some demographics can predict respondents’
propensity toward a specific chronic condition, they cannot predict respondents’
propensity toward all chronic conditions. Instead, the effects of demographics on a
chronic condition are specific to that condition.
Demographics consistently predicted illness behavior across the nine examined
chronic conditions. Thus, the effects of a demographic variable on illness and on illness
behavior are not the same. Take the effects of gender as an example. Being male
predicted greater odds of reporting extended condition duration for two conditions, lesser
odds of reporting extended condition duration for two conditions, and didn’t predict the
odds of reporting extended condition duration for the remaining five conditions.
However, being male consistently and significantly predicted greater odds of reporting
work limitation for all nine chronic conditions. With the exception of race, the effects of
demographics are as follows: inconsistent in terms of illness, consistent in terms of illness
behavior.
46
Implications: A Call for Public Health, Social Research and Policy
In a society where “health” is generally defined as the capacity to carry out daily
activities and fulfill expected roles, the extent to which individuals consider themselves
limited in their amount or kind of work indicates how they perceive their own health.
Because the effects of demographics on work limitation are significant when controlling
for condition duration, it follows that demographics also affect individuals’ perceptions
of personal health, to some extent regardless of disease or physical symptoms. The U.S.’s
biomedical approach to healthcare fails to examine these group-level patterns of
meaning-making that occur after the onset of disease. In this way, the biomedical
approach fails to help the chronically ill to manage their health. The results are costly in
more ways than one. It is essential that modern medicine adopts an approach to managing
chronic disease that precedes and follows the biomedical model’s sequence of symptoms,
diagnosis, and treatment.
The effects of demographics on illness behavior are mediated by three social
pathways: environmental exposures, social environment, and healthcare. Thus, to
promote “health,” manage chronic disease, and minimize the cost of a failing healthcare
system, these social pathways must be understood and affected. Social pathways can be
affected by public health, social research and policy. Before and after the onset of
disease, public health must continue to educate children and adults about environmental
exposures and social environments that will have an adverse affect on their health.
Likewise, comprehensive healthcare must foster positive behaviors and lifestyles by
offering (if not requiring) support groups and community-developing activities as part of
patients’ treatments plans. Social research must continue to explore how demographics

47
and social pathways intersect to produce illness behavior. Most importantly, policy must
promote these public health and social research initiatives. Additional value and emphasis
should be placed on programs like vocational rehabilitation services, which help those
with chronic conditions to assume their daily roles and responsibilities. It is only by
mediating the effects of demographics on illness behavior that any system can affect
structural and operational improvements in chronic condition care.
Limitations and Implications for Future Research
As with any research utilizing secondary data, there were obvious limitations to
this study. First, the work limitation dependent variable encompasses only one obligation
or responsibility from which individuals can consider themselves exempt: work. To best
measure the extent to which individuals consider themselves exempt from daily
obligations and responsibilities, a survey instrument should include questions about
activities related to one’s work, home, social, educational, and interpersonal
responsibilities. Unfortunately, respondents were not asked about these types of activities
as part of the 2012 NHIS.
This study was also limited in its representation of chronic illnesses. To fully
understand the effects of demographics on extended condition duration and work
limitation, a study would need to examine more than nine chronic conditions. Also, this
study cannot account for the variance in respondents’ odds of extended condition
duration or work limitation within each of the nine conditions that were examined. For
example, included in cancer are breast cancer, testicular cancer, lung cancer, and
leukemia – all which include even more specific “types” of cancer. There are
undoubtedly differences in illness behavior across members of these sub-groups that
48
cannot be measured when cancer is examined as a single condition, as it was in this
study. Lastly, this study was limited in its ability to explain the microcultural patterns of
illness behavior it summaries. By examining patterns of illness behavior at the
demographic level, this research explains patterns between groups but not within them.
Additional research must measure respondents’ likelihood to consider themselves
exempt from a number of daily obligations and responsibilities, not just work. Future
research should also measure the effects of demographics on extended condition duration
and sick role adaptation for a multitude of conditions and for specific conditions. In other
words, a study that examines thirty or more chronic conditions and a study that examines
only types of cancer would be equally valuable.
Most importantly, future research must explore the ways demographics and social
pathways intersect to explain these patterns of illness behavior. By explaining patterns of
illness behavior among and between groups, social scientists can help guide and direct
the future of healthcare – beyond a failing biomedical approach to managing chronic
disease and toward changing the structural and cultural canvas on which chronic disease
outlines the well-being of our society.
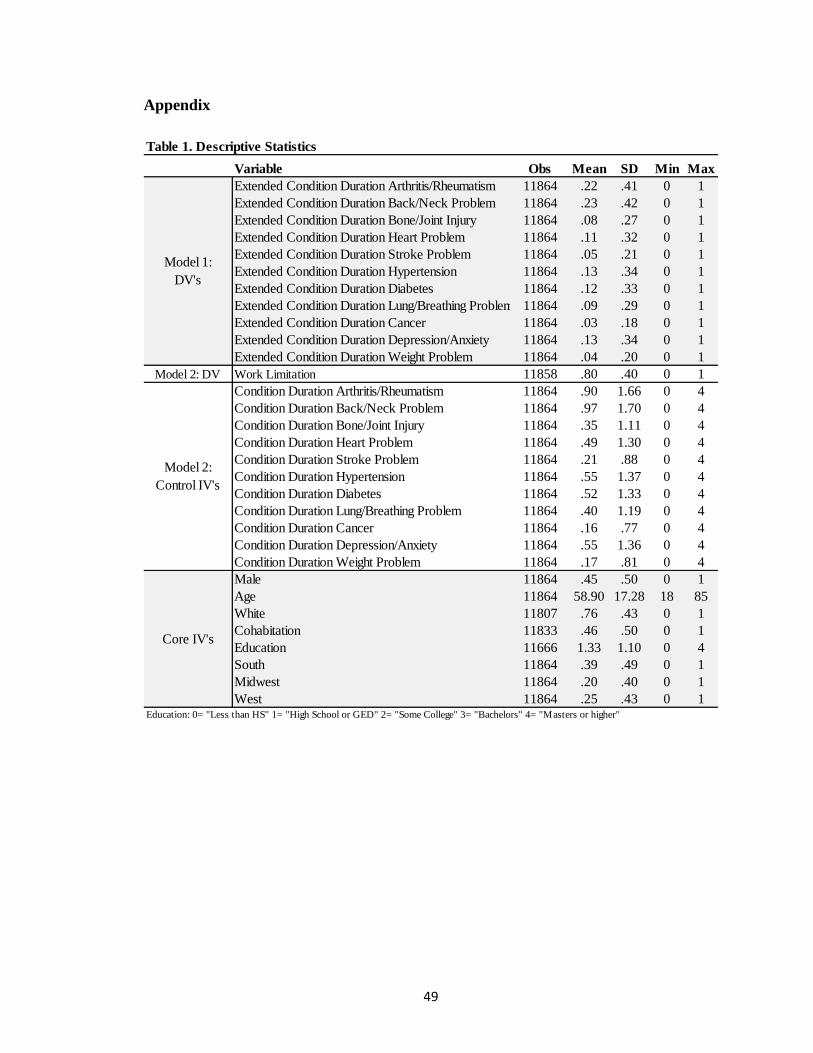
49
Appendix
Table 1. Descriptive Statistics
Variable Obs Mean SD Min Max
Extended Condition Duration Arthritis/Rheumatism 11864 .22 .41 0 1
Extended Condition Duration Back/Neck Problem 11864 .23 .42 0 1
Extended Condition Duration Bone/Joint Injury 11864 .08 .27 0 1
Extended Condition Duration Heart Problem 11864 .11 .32 0 1
Extended Condition Duration Stroke Problem 11864 .05 .21 0 1
Extended Condition Duration Hypertension 11864 .13 .34 0 1
Extended Condition Duration Diabetes 11864 .12 .33 0 1
Extended Condition Duration Lung/Breathing Problem 11864 .09 .29 0 1
Extended Condition Duration Cancer 11864 .03 .18 0 1
Extended Condition Duration Depression/Anxiety 11864 .13 .34 0 1
Extended Condition Duration Weight Problem 11864 .04 .20 0 1
Model 2: DV Work Limitation 11858 .80 .40 0 1
Condition Duration Arthritis/Rheumatism 11864 .90 1.66 0 4
Condition Duration Back/Neck Problem 11864 .97 1.70 0 4
Condition Duration Bone/Joint Injury 11864 .35 1.11 0 4
Condition Duration Heart Problem 11864 .49 1.30 0 4
Condition Duration Stroke Problem 11864 .21 .88 0 4
Condition Duration Hypertension 11864 .55 1.37 0 4
Condition Duration Diabetes 11864 .52 1.33 0 4
Condition Duration Lung/Breathing Problem 11864 .40 1.19 0 4
Condition Duration Cancer 11864 .16 .77 0 4
Condition Duration Depression/Anxiety 11864 .55 1.36 0 4
Condition Duration Weight Problem 11864 .17 .81 0 4
Male 11864 .45 .50 0 1
Age 11864 58.90 17.28 18 85
White 11807 .76 .43 0 1
Cohabitation 11833 .46 .50 0 1
Education 11666 1.33 1.10 0 4
South 11864 .39 .49 0 1
Midwest 11864 .20 .40 0 1
West 11864 .25 .43 0 1Education: 0= "Less than HS" 1= "High School or GED" 2= "Some College" 3= "Bachelors" 4= "Masters or higher"
Model 1:
DV's
Core IV's
Model 2:
Control IV's

50
Table 2-1. Bivariate Logistic Regression: Predictors of Work Limitation
Predictor variable OR / se CI (95%)
Age (overall) .97 *** .97/.98
(.00)
Age 18-34 (compared to 65+) 1.36 *** 1.16/1.59
(.11)
Age 35-64 (compared to 65+) 2.41 *** 2.19/2.65
(.12)
Education .84 *** .81/.87
(.02)
Male 1.19 *** 1.09/1.30
(.06)
White .84 ** .76/.94
(.05)
Cohabitation .94 * .83/1.0
(.04)
South (relative to Northeast) 1.32 *** 1.20/1.45
(.07)
Midwest (relative to Northeast) 1.00 .90/1.13
(.06)
West (relative to Northeast) .84 ** .86/.96
(.04)
Significance: * p < .05 ** p < .01 *** p < .001
Model 1
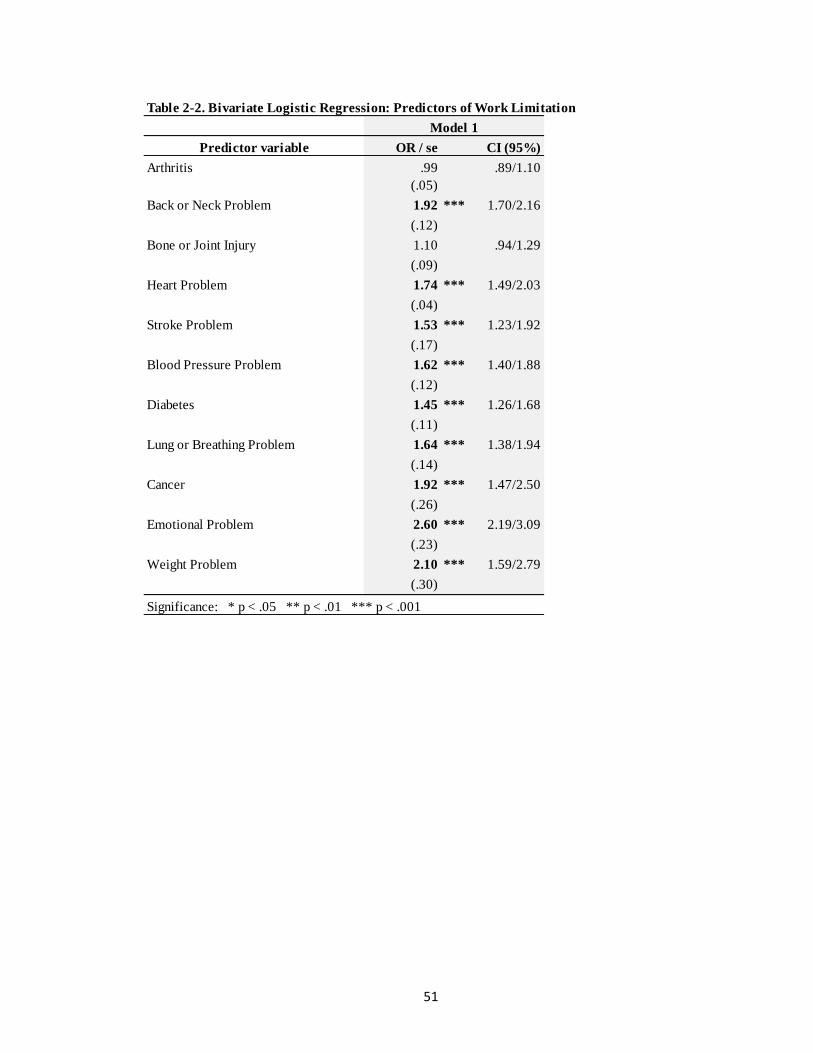
51
Table 2-2. Bivariate Logistic Regression: Predictors of Work Limitation
Predictor variable OR / se CI (95%)
Arthritis .99 .89/1.10
(.05)
Back or Neck Problem 1.92 *** 1.70/2.16
(.12)
Bone or Joint Injury 1.10 .94/1.29
(.09)
Heart Problem 1.74 *** 1.49/2.03
(.04)
Stroke Problem 1.53 *** 1.23/1.92
(.17)
Blood Pressure Problem 1.62 *** 1.40/1.88
(.12)
Diabetes 1.45 *** 1.26/1.68
(.11)
Lung or Breathing Problem 1.64 *** 1.38/1.94
(.14)
Cancer 1.92 *** 1.47/2.50
(.26)
Emotional Problem 2.60 *** 2.19/3.09
(.23)
Weight Problem 2.10 *** 1.59/2.79
(.30)
Significance: * p < .05 ** p < .01 *** p < .001
Model 1
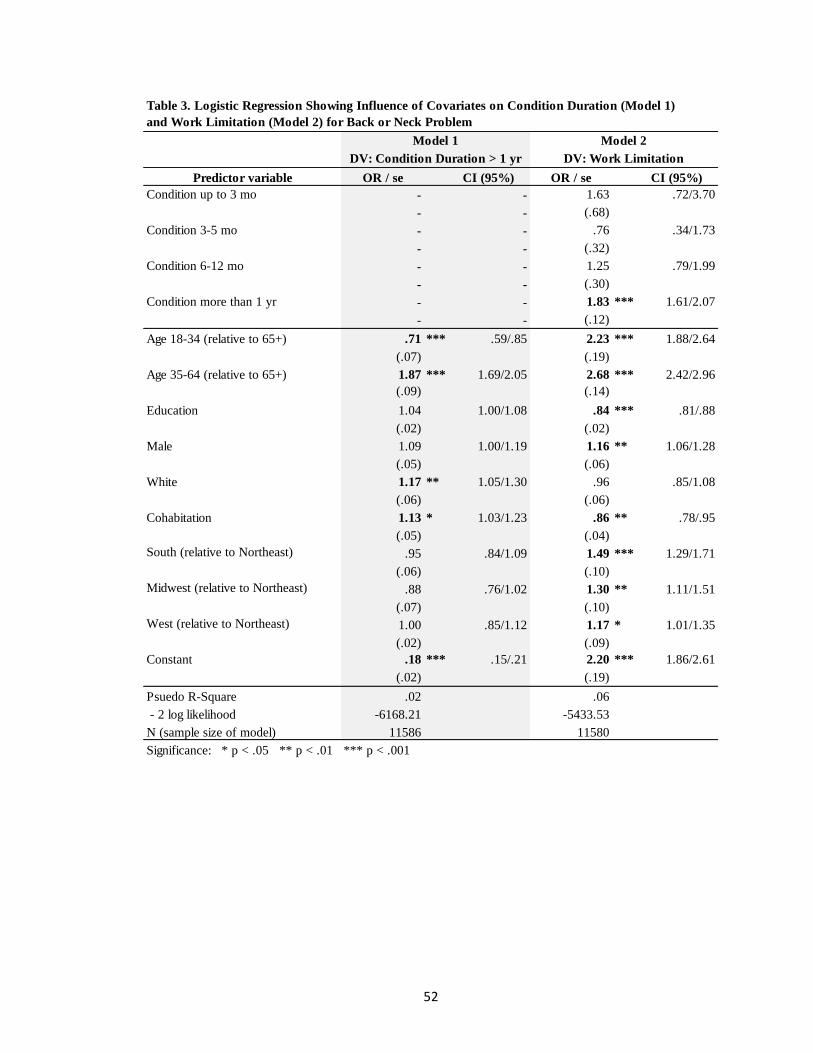
52
Predictor variable OR / se CI (95%) OR / se CI (95%)
Condition up to 3 mo - - 1.63 .72/3.70
- - (.68)
Condition 3-5 mo - - .76 .34/1.73
- - (.32)
Condition 6-12 mo - - 1.25 .79/1.99
- - (.30)
Condition more than 1 yr - - 1.83 *** 1.61/2.07
- - (.12)
Age 18-34 (relative to 65+) .71 *** .59/.85 2.23 *** 1.88/2.64
(.07) (.19)
Age 35-64 (relative to 65+) 1.87 *** 1.69/2.05 2.68 *** 2.42/2.96
(.09) (.14)
Education 1.04 1.00/1.08 .84 *** .81/.88
(.02) (.02)
Male 1.09 1.00/1.19 1.16 ** 1.06/1.28
(.05) (.06)
White 1.17 ** 1.05/1.30 .96 .85/1.08
(.06) (.06)
Cohabitation 1.13 * 1.03/1.23 .86 ** .78/.95
(.05) (.04)
South (relative to Northeast) .95 .84/1.09 1.49 *** 1.29/1.71
(.06) (.10)
Midwest (relative to Northeast) .88 .76/1.02 1.30 ** 1.11/1.51
(.07) (.10)
West (relative to Northeast) 1.00 .85/1.12 1.17 * 1.01/1.35
(.02) (.09)
Constant .18 *** .15/.21 2.20 *** 1.86/2.61
(.02) (.19)
Psuedo R-Square .02 .06
- 2 log likelihood -6168.21 -5433.53
N (sample size of model) 11586 11580
Significance: * p < .05 ** p < .01 *** p < .001
Table 3. Logistic Regression Showing Influence of Covariates on Condition Duration (Model 1)
and Work Limitation (Model 2) for Back or Neck Problem
Model 1 Model 2
DV: Work LimitationDV: Condition Duration > 1 yr

53
Predictor variable OR / se CI (95%) OR / se CI (95%)
Condition up to 3 mo - - 1.37 .60/3.17
- - (.59)
Condition 3-5 mo - - 1.60 .60/4.25
- - (.80)
Condition 6-12 mo - - 1.42 .84/2.40
- - (.38)
Condition more than 1 yr - - 2.10 *** 1.76/2.49
- - (.19)
Age 18-34 (compared to 65+) .11 *** .08/.17 2.39 *** 2.02/2.83
(.02) (.21)
Age 35-64 (compared to 65+) .57 *** .50/.64 2.96 *** 2.67/3.27
(.03) (.15)
Education .87 *** .82/.92 .85 *** .82/.89
(.02) (.02)
Male 1.41 *** 1.26/1.59 1.14 * 1.03/1.25
(.09) (.06)
White 1.05 .92/1.21 .97 .87/1.09
(.08) (.06)
Cohabitation 1.01 .90/1.14 .87 ** .79/.96
(.06) (.04)
South (relative to Northeast) 1.56 *** 1.30/1.88 1.44 *** 1.26/1.65
(.15) (.10)
Midwest (relative to Northeast) 1.36 ** 1.10/1.67 1.26 ** 1.08/1.48
(.14) (.10)
West (relative to Northeast) 1.11 .90/1.37 1.16 * 1.01/1.34
(.12) (.09)
Constant .14 *** .11/.18 2.18 *** 1.84/2.58
(.02) (.19)
Psuedo R-Square .04 .06
- 2 log likelihood -3976.19 -5440.08
N (sample size of model) 11586 11580
Significance: * p < .05 ** p < .01 *** p < .001
DV: Work Limitation
Model 2
DV: Condition Duration > 1 yr
Model 1
Table 4. Logistic Regression Showing Influence of Covariates on Condition Duration (Model 1)
and Work Limitation (Model 2) for Heart Problem

54
Predictor variable OR / se CI (95%) OR / se CI (95%)
Condition up to 3 mo - - 1.73 .58/5.10
- - (.95)
Condition 3-5 mo - - 3.46 .43/27.49
- - (3.66)
Condition 6-12 mo - - 1.55 .80/3.00
- - (.52)
Condition more than 1 yr - - 1.88 *** 1.46/2.43
- - (.24)
Age 18-34 (compared to 65+) .07 *** .03/.15 2.27 *** 1.92/2.68
(.03) (.19)
Age 35-64 (compared to 65+) .51 *** .43/.61 2.88 *** 2.61/3.19
(.05) (.15)
Education .87 *** .80/.94 .85 *** .81/.88
(.04) (.02)
Male 1.31 ** 1.10/1.57 1.16 ** 1.05/1.28
(.12) (.06)
White .73 ** .60/.89 .98 .88/1.10
(.07) (.06)
Cohabitation 1.06 .89/1.27 .87 ** .79/.95
(.10) (.04)
South (relative to Northeast) 1.32 * 1.00/1.74 1.47 *** 1.28/1.68
(.18) (.10)
Midwest (relative to Northeast) 1.05 .76/1.44 1.28 ** 1.10/1.50
(.17) (.10)
West (relative to Northeast) 1.20 .89/1.61 1.16 * 1.01/1.35
(.18) (.09)
Constant .08 *** .06/.12 2.28 *** 1.93/2.70
(.01) (.20)
Psuedo R-Square .04 .05
- 2 log likelihood -2125.30 -5465.46
N (sample size of model) 11586 11580
Significance: * p < .05 ** p < .01 *** p < .001
Table 5. Logistic Regression Showing Influence of Covariates on Condition Duration (Model 1)
and Work Limitation (Model 2) for Stroke Problem
Model 1 Model 2
DV: Work LimitationDV: Condition Duration > 1 yr

55
Predictor variable OR / se CI (95%) OR / se CI (95%)
Condition up to 3 mo - - 1.36 .49/4.14
- - (.77)
Condition 3-5 mo - - 2.60 .32/21.34
- - (2.79)
Condition 6-12 mo - - 1.98 .89/4.40
- - (.81)
Condition more than 1 yr - - 1.72 *** 1.47/2.02
- - (.14)
Age 18-34 (compared to 65+) .10 *** .07/.15 2.34 *** 1.97/2.77
(.02) (.20)
Age 35-64 (compared to 65+) .75 *** .67/.84 2.87 *** 2.60/3.18
(.04) (.15)
Education .85 *** .80/.89 .85 *** .82/.89
(.02) (.02)
Male .89 .80/1.00 1.17 ** 1.07/1.29
(.05) (.06)
White .53 *** .47/.60 1.01 .90/1.14
(.03) (.06)
Cohabitation .89 .80/1.00 .88 * .79/.97
(.05) (.04)
South (relative to Northeast) 1.49 *** 1.26/1.76 1.45 *** 1.26/1.66
(.13) (.10)
Midwest (relative to Northeast) .77 * .63/.95 1.30 ** 1.12/1.52
(.08) (.10)
West (relative to Northeast) 1.04 .86/1.26 1.16 * 1.01/1.35
(.10) (.09)
Constant .37 *** .30/.45 2.10 *** 1.77/2.50
(.04) (.18)
Psuedo R-Square .06 .06
- 2 log likelihood -4274.42 -5454.37
N (sample size of model) 11586 11580
Significance: * p < .05 ** p < .01 *** p < .001
Model 1 Model 2
DV: Work LimitationDV: Condition Duration > 1 yr
Table 6. Logistic Regression Showing Influence of Covariates on Condition Duration (Model 1)
and Work Limitation (Model 2) for Blood Pressure Problem

56
Predictor variable CI (95%) OR / se CI (95%)
Condition up to 3 mo - - 2.50 .57/10.90
- - (1.88)
Condition 3-5 mo - - .87 .17/4.42
- - (.72)
Condition 6-12 mo - - 1.45 .68/3.11
- - (.56)
Condition more than 1 yr - - 1.49 *** 1.28/1.74
- - (.12)
Age 18-34 (compared to 65+) .20 *** .14/.27 2.27 *** 1.92/2.68
(.03) (.19)
Age 35-64 (compared to 65+) .82 ** .73/.92 2.84 *** 2.57/3.14
(.05) (.15)
Education .80 *** .76/.85 .85 *** .82/.89
(.02) (.02)
Male 1.02 .91/1.14 1.17 ** 1.06/1.28
(.06) (.06)
White .74 *** .65/.84 .99 .88/1.11
(.05) (.06)
Cohabitation 1.12 * 1.00/1.26 .86 ** .78/.95
(.07) (.04)
South (relative to Northeast) 1.23 * 1.03/1.45 1.46 *** 1.28/1.68
(.11) (.10)
Midwest (relative to Northeast) .84 .70/1.03 1.29 ** 1.12/1.50
(.09) (.10)
West (relative to Northeast) 1.06 .88/1.28 1.16 * 1.00/1.34
(.10) (.09)
Constant .25 *** .21/.31 2.23 *** 1.88/2.64
(.03) (.19)
Psuedo R-Square .03 .05
- 2 log likelihood -4218.22 -5466.51
N (sample size of model) 11586 11580
Significance: * p < .05 ** p < .01 *** p < .001
DV: Condition Duration > 1 yr
OR / se
Model 2
DV: Work Limitation
Model 1
Table 7. Logistic Regression Showing Influence of Covariates on Condition Duration (Model 1)
and Work Limitation (Model 2) for Diabetes
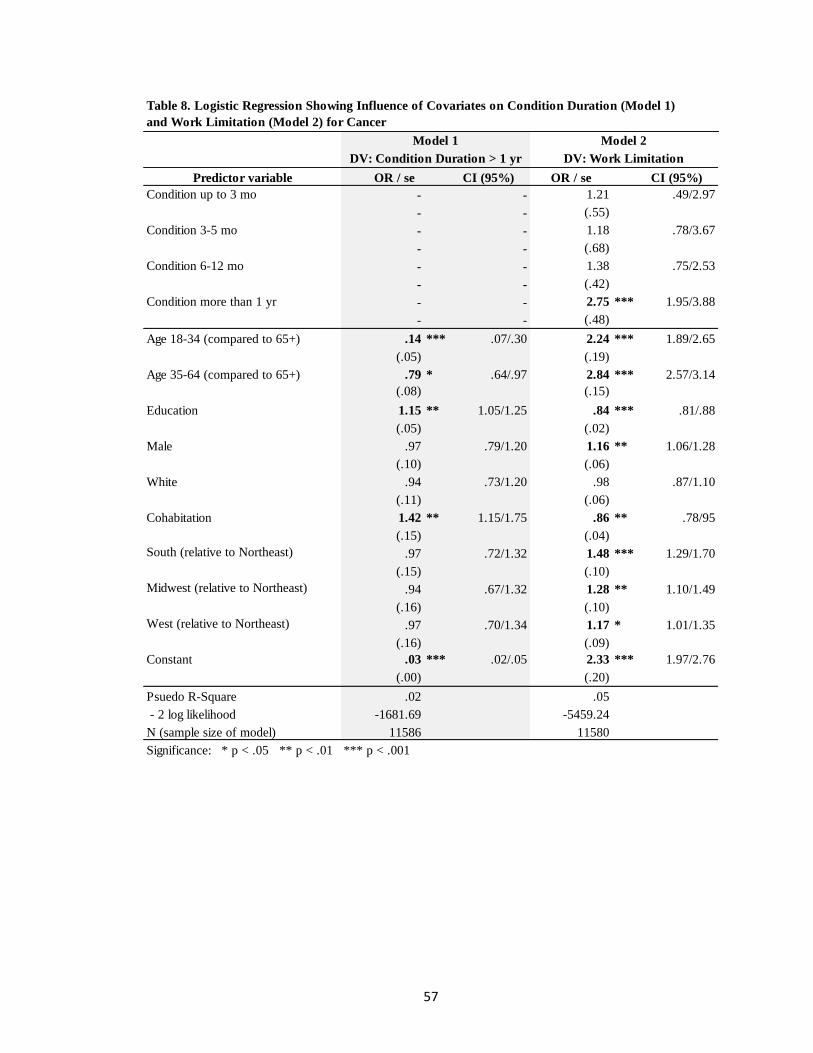
57
Predictor variable CI (95%) OR / se CI (95%)
Condition up to 3 mo - - 1.21 .49/2.97
- - (.55)
Condition 3-5 mo - - 1.18 .78/3.67
- - (.68)
Condition 6-12 mo - - 1.38 .75/2.53
- - (.42)
Condition more than 1 yr - - 2.75 *** 1.95/3.88
- - (.48)
Age 18-34 (compared to 65+) .14 *** .07/.30 2.24 *** 1.89/2.65
(.05) (.19)
Age 35-64 (compared to 65+) .79 * .64/.97 2.84 *** 2.57/3.14
(.08) (.15)
Education 1.15 ** 1.05/1.25 .84 *** .81/.88
(.05) (.02)
Male .97 .79/1.20 1.16 ** 1.06/1.28
(.10) (.06)
White .94 .73/1.20 .98 .87/1.10
(.11) (.06)
Cohabitation 1.42 ** 1.15/1.75 .86 ** .78/95
(.15) (.04)
South (relative to Northeast) .97 .72/1.32 1.48 *** 1.29/1.70
(.15) (.10)
Midwest (relative to Northeast) .94 .67/1.32 1.28 ** 1.10/1.49
(.16) (.10)
West (relative to Northeast) .97 .70/1.34 1.17 * 1.01/1.35
(.16) (.09)
Constant .03 *** .02/.05 2.33 *** 1.97/2.76
(.00) (.20)
Psuedo R-Square .02 .05
- 2 log likelihood -1681.69 -5459.24
N (sample size of model) 11586 11580
Significance: * p < .05 ** p < .01 *** p < .001
DV: Condition Duration > 1 yr
OR / se
Model 2
DV: Work Limitation
Model 1
Table 8. Logistic Regression Showing Influence of Covariates on Condition Duration (Model 1)
and Work Limitation (Model 2) for Cancer

58
Predictor variable CI (95%) OR / se CI (95%)
Condition up to 3 mo - - 1.70 .38/7.57
- - (1.29)
Condition 3-5 mo - -
- -
Condition 6-12 mo - - 1.33 .69/2.56
- - (.44)
Condition more than 1 yr - - 2.16 *** 1.80/2.60
- - (.20)
Age 18-34 (compared to 65+) 5.61 *** 4.65/6.77 1.93 *** 1.63/2.29
(.54) (.17)
Age 35-64 (compared to 65+) 3.83 *** 3.30/4.45 2.62 *** 2.37/2.90
(.29) (.14)
Education .95 .90/1.00 .85 *** .81/.88
(.03) (.02)
Male .71 *** .67/.80 1.19 *** 1.08/1.31
(.04) (.06)
White 1.20 * 1.06/1.38 .96 .86/1.08
(.08) (.06)
Cohabitation .83 ** .74/.93 .88 * .79/.97
(.05) (.04)
South (relative to Northeast) .76 ** .65/.89 1.50 ** 1.31/1.73
(.06) (.11)
Midwest (relative to Northeast) .81 * .68/.97 1.30 ** 1.12/1.52
(.07) (.10)
West (relative to Northeast) .77 ** .65/.91 1.18 * 1.02/1.37
(.07) (.09)
Constant .08 *** .06/.10 2.27 *** 1.92/2.69
(.01) (.19)
Psuedo R-Square .06 .06
- 2 log likelihood -4239.70 -5441.69
N (sample size of model) 11586 11580
Significance: * p < .05 ** p < .01 *** p < .001
Dropped
DV: Work LimitationDV: Condition Duration > 1 yr
OR / se
Model 2Model 1
Table 9. Logistic Regression Showing Influence of Covariates on Condition Duration (Model 1)
and Work Limitation (Model 2) for Emotional Problem

59
Predictor variable CI (95%) OR / se CI (95%)
Condition up to 3 mo - - 1.18 .38/3.68
- - (.69)
Condition 3-5 mo - - 1.28 .26/6.44
- - (1.06)
Condition 6-12 mo - - 2.45 * 1.11/5.42
- - (.99)
Condition more than 1 yr - - 1.65 *** 1.37/1.98
- - (.15)
Age 18-34 (compared to 65+) .67 ** .53/.86 2.21 *** 1.87/2.61
(.08) (.19)
Age 35-64 (compared to 65+) 1.09 .95/1.24 2.82 *** 2.55/3.11
(.07) (.14)
Education .89 *** .84/.95 .85 *** .82/.89
(.03) (.02)
Male 1.01 .89/1.15 1.16 ** 1.06/1.28
(.07) (.06)
White 1.10 .95/1.28 .97 .86/1.09
(.08) (.06)
Cohabitation .92 .81/1.04 .87 * .79/.96
(.06) (.04)
South (relative to Northeast) .86 .72/1.03 1.49 *** 1.30/1.70
(.08) (.10)
Midwest (relative to Northeast) .82 .67/1.00 1.29 ** 1.11/1.50
(.08) (.10)
West (relative to Northeast) .70 *** .57/.85 1.18 * 1.02/1.36
(.07) (.09)
Constant .14 *** .11/.17 2.27 *** 1.91/2.68
(.02) (.20)
Psuedo R-Square .01 .05
- 2 log likelihood -3622.49 -5462.63
N (sample size of model) 11586 11580
Significance: * p < .05 ** p < .01 *** p < .001
OR / se
Model 2Model 1
DV: Work LimitationDV: Condition Duration > 1 yr
Table 10. Logistic Regression Showing Influence of Covariates on Condition Duration (Model 1)
and Work Limitation (Model 2) for Lung or Breathing Problem
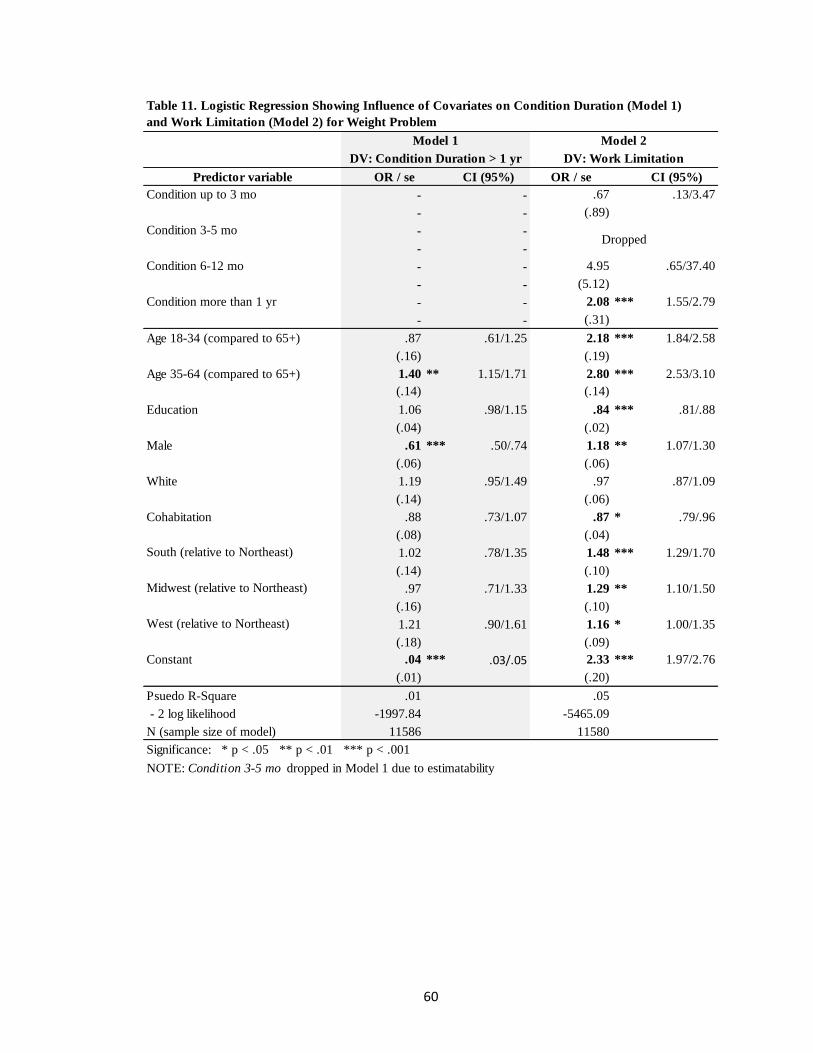
60
Predictor variable CI (95%) OR / se CI (95%)
Condition up to 3 mo - - .67 .13/3.47
- - (.89)
Condition 3-5 mo - -
- -
Condition 6-12 mo - - 4.95 .65/37.40
- - (5.12)
Condition more than 1 yr - - 2.08 *** 1.55/2.79
- - (.31)
Age 18-34 (compared to 65+) .87 .61/1.25 2.18 *** 1.84/2.58
(.16) (.19)
Age 35-64 (compared to 65+) 1.40 ** 1.15/1.71 2.80 *** 2.53/3.10
(.14) (.14)
Education 1.06 .98/1.15 .84 *** .81/.88
(.04) (.02)
Male .61 *** .50/.74 1.18 ** 1.07/1.30
(.06) (.06)
White 1.19 .95/1.49 .97 .87/1.09
(.14) (.06)
Cohabitation .88 .73/1.07 .87 * .79/.96
(.08) (.04)
South (relative to Northeast) 1.02 .78/1.35 1.48 *** 1.29/1.70
(.14) (.10)
Midwest (relative to Northeast) .97 .71/1.33 1.29 ** 1.10/1.50
(.16) (.10)
West (relative to Northeast) 1.21 .90/1.61 1.16 * 1.00/1.35
(.18) (.09)
Constant .04 *** .03/.05 2.33 *** 1.97/2.76
(.01) (.20)
Psuedo R-Square .01 .05
- 2 log likelihood -1997.84 -5465.09
N (sample size of model) 11586 11580
Significance: * p < .05 ** p < .01 *** p < .001
NOTE: Condition 3-5 mo dropped in Model 1 due to estimatability
Dropped
DV: Condition Duration > 1 yr
OR / se
Model 2
DV: Work Limitation
Model 1
Table 11. Logistic Regression Showing Influence of Covariates on Condition Duration (Model 1)
and Work Limitation (Model 2) for Weight Problem

61
REFERENCES
Adler, Nancy E. and Katherine Newman. 2002. “Socioeconomic Disparities in Health:
Pathways and Policies.” Health Affairs 21(2):60-76.
Angel, Jacqueline L. and Ronald J. Angel. 2006. “Minority Group Status and Healthful
Aging: Social Structure Still Matters.” American Journal of Public Health
96:1152–59.
Arluke, Arnold, Louanne Kennedy, Ronald C. Kessler. 1979. “Reexamining the
Sick- Role Concept: An Empirical Assessment.” Journal of Health and Social
Behavior 20(1):30-36.
Berkanovic, Emil. 1972. “Lay Conceptions of the Sick Role.” Social Forces 51(1):53-64.
Brown, Julia S. and May Rawlinson. 1975. “Relinquishing the Sick Role Following
Open-Heart Surgery.” Journal of Health and Social Behavior 16(1):12-27.
Britt, David W. 1975. “Social Class and the Sick Role: Examining the Issue of Mutual
Influence.” Journal of Health and Social Behavior 16(2):178-182.
Charmaz, Kathy. 2000. “Experiencing Chronic Illness.” Pp. 277-292 in The Handbook of
Social Studies in Health and Medicine, edited by Gary Albrecht, Ray Fitzpatrick,
and Susan Scrimshaw. London: Sage.
Cockerham, William C. 2012. Medical Sociology. Boston: Prentice Hall.
Conrad, Peter and Kristin K. Barker. “The Social Construction of Illness: Key Insights
and Policy Implications.” Journal of Health and Social Behavior 51(1):S67-S79.
Cotter, David, Joan Hermersen and Reeve Vanneman. 2004. “Gender Inequality
at Work.” Gender and Work: The Continuity of Change. New York: Russell Sage
Foundation.
62
Courtenay, Will H. 2000. “Constructions of Masculinity and their Influence on Men’s
Well-Being: A Theory of Gender and Health.” Social Science and Medicine
50(10):1385–1401.
Geersten, H. Reed and Robert M. Gray. 1970. “Orientation and Inclination toward
Adopting the Sick Role.” Journal of Marriage and Family 32(4):638-646.
Good, Byron J. and Mary-Jo DelVecchio Good. “The Meaning of Symptoms: A
Cultural Hermeneutic Model for Clinical Practice.” Pp. 165-196 in The Relevance
of Social Science for Medicine, edited by Leon Eisenberg and Arthur
Kleinman. Dordrecht, Holland: D. Reidel Publishing Company.
Hayward, Mark D., Eileen M. Crimmins, Toni P. Miles, and Yu Yang. 2000. “The
Significance of Socioeconomic Status in Explaining the Racial Gap in Chronic
Health Conditions.” American Sociological Review (65):910–30.
Kleinman, Arthur and Don Seeman. 2000. “Personal Experience of Illness.” Pp. 230-242
in The Handbook of Social Studies in Health and Medicine, edited by Gary
Albrecht, Ray Fitzpatrick, and Susan Scrimshaw. London: Sage.
Lane, Sandra D. and Donald A. Cibula. 2000. “Gender and Health.” Pp.136-153 in The
Handbook of Social Studies in Health and Medicine, edited by Gary Albrecht,
Ray Fitzpatrick, and Susan Scrimshaw. London: Sage
Levine, Sol and Martin A. Kozloff. 1978. “The Sick Role: Assessment and Overview.”
Annual Review of Sociology (4):317-343.
Phelan, Jo C., Bruce G. Link, and Parisa Tehranifar. “Social Conditions as Fundamental
Causes of Health Inequalities: Theory, Evidence, and Policy Implications.”
Journal of Health and Social Behavior (51):S28-S40.

63
Mechanic, David and Edmund H. Volkart. 1961. “Stress, Illness Behavior, and the Sick
Role.” American Sociological Review 26(1):51-58.
McElroy, Ann and Mary Ann Jezewski. 2000. “Cultural Variation in the Experience of
Health and Illness.” Pp. 191-209 in The Handbook of Social Studies in Health and
Medicine, edited by Gary Albrecht, Ray Fitzpatrick, and Susan Scrimshaw.
London: Sage.
National Center for Health Statistics. 2009, 2012. “Fact Sheets.” Centers for Disease
Control and Prevention. Atlanta, GA. (http://www.cdc.gov/nchs/)
National Health Interview Survey Codebook. 2012. “Person File: Variable Summary.”
Centers for Disease Control and Prevention. Atlanta, GA. Document Version
Date: May 24, 2013. (ftp://ftp.cdc.gov/pub/Health_Statistics/NCHS/Dataset_
Documentation/NHIS/2012/personsx_summary.pdf)
Myles, John F. 1978. “Institutionalization and Sick Role Identification Among the
Elderly.” American Sociological Review 43(4):508-521.
Parsons, Talcott. 1951. The Social System. Glencoe, IL: Free Press.
Parsons, Talcott. 1975. “The Sick Role and the Role of the Physician Reconsidered.”
Health and Society 53(3):257-278.
Petroni, Frank A. 1969. “Social Class, Family Size, and the Sick Role.” Journal of
Marriage and Family 31(4):728-735.
Robert, Stephanie A. and James S. House. 2000. “Socioeconomic Inequalities in Health:
Integrating Individual-, Community-, and Societal-Level Theory and Research.”
Pp.115-135 in The Handbook of Social Studies in Health and Medicine, edited by
Gary Albrecht, Ray Fitzpatrick, and Susan Scrimshaw. London: Sage.

64
Segall, Alexander. 1976. “The Sick Role Concept: Understanding Illness Behavior.”
Journal of Health and Social Behavior 17(2):162-169.
Shilling, Chris. 2002. “Culture, the ‘Sick Role’ and the Consumption of Health.” British
Journal of Sociology 53(4):621-638.
Vallas, Steven P., William Finlay, and Amy S. Wharton. 2009. The Sociology of Work.
New York: Oxford University Press.
Varul, Matthias Zick. 2010. “Talcott Parsons, the Sick Role and Chronic Illness.” Body &
Society 16(2):72-94.
Wasserman, Jason A. and Brian P. Hinote. 2012. “The End of Modern Medicine: The
Evolution of Disease and Transformations in Medical Practice.” Journal of
Healthcare, Science and Humanities 2(2):145-157.
Williams, David R. and Chiquita Collins. 1995. “U.S. Socioeconomic and Racial
Differences in Health: Patterns and Explanations.” Annual Review of Sociology
(21):349-386.
Williams, David R. and Michelle Sternthal. “Understanding Racial-ethnic Disparities in
Health: Sociological Contributions.” Journal of Health and Social Behavior
(51):S15-S27.
Wolinsky, Frederic D. and Sally R. Wolinsky. 1981. “Expecting Sick-Role Legitimation
and Getting It.” Journal of Health and Social Behavior 22(3):229-242.
Wright, Eric R. and Brea L. Perry. “Medical Sociology and Health Services Research:
Past Accomplishments and Future Policy Challenges.” Journal of Health and
Social Behavior (51):S107-S119

Related Documents


