Structure and rheological properties of water soluble b-glucans from oat cultivars of Avena sativa and Avena bysantina A. Skendi a , C.G. Biliaderis b, * , A. Lazaridou b , M.S. Izydorczyk c a Mediterranean Agronomic Institute of Chania, Alsyllion Agrokepion, P.O. Box 85, Chania GR-73100, Crete, Greece b Department of Food Science and Technology, School of Agriculture, Aristotle University, GR-540 06, Thessaloniki, Greece c Grain Research Laboratory, 1404-303 Main Street, Winnipeg, Man., Canada R3C 3G8 Received 28 May 2002; revised 19 October 2002; accepted 5 November 2002 Abstract Oat b-glucans were extracted (water at 47 8C) from milled seeds of two Greek cultivars (A. sativa cv. Pallini and A. bysantina cv. Kassandra) and partially purified by pH adjustment of the b-glucan solutions to 4.5. Chemical analysis of the extracted gums revealed that they were composed mainly of b-glucans (. 85% d.b.) together with some contaminating proteins (, 9% d.b.). The fine structure of the b-glucan preparations was assessed by 13 C-NMR spectroscopy and high-performance anion-exchange chromatography of the cellulosic oligomers released by the action of lichenase. The tri- and tetra-saccharides accounted for 90.9 – 92.3% of the total oligomers analyzed and the calculated molar ratios of trimers/tetramers varied between 1.99 – 2.11. Molecular size characterization was carried out with high performance size exclusion chromatography combined with a multi-angle laser light scattering and a refractive index detector; for samples with weight average molecular weight (M w ) ranging between 0.27 and 0.78 £ 10 6 , the values of limiting viscosity ([h ]), critical concentration (c**) and coil overlap parameter (c**[h ]) were within 4.9 – 6.4 dl/g, 1.2 – 2.0 g/dl and 7.8 – 10.1, respectively. The shear thinning behavior was dependent on the molecular weight and concentration of the b-glucan preparations. All b-glucan samples were able to form gels, as revealed by dynamic rheometry; the low molecular weight samples exhibited shorter gelation times and higher gelation rates (I E ¼ [dlog G 0 /dt ] max ) than their high molecular weight counterparts. The gelation rate increased with increasing concentration and gel curing temperatures reaching a maximum at 32 8C; for higher temperatures the I E values decreased. For small molecular size b-glucans, a biphasic melting behavior was observed for gels at curing temperatures of 2–32 8C, whereas at higher temperatures melting of the gel network occurred as one-step process. Differential scanning calorimetry showed that gels cured at 24 8C exhibit a broad melting transition; Tm , 63 8C and DH , 5 mJ/mg. The mechanical properties of casted (dispersions) films from two b-glucan preparations, differing in molecular weight, with or without sorbitol, were examined by tensile measurements. The large deformation mechanical tests showed decreases in tensile (Young’s) modulus (E) and strength (s max ), and an increase in percentage elongation with increasing water content and/or addition of sorbitol. The relationships between tensile parameters (E and s max ) and water content showed an increase in stiffness of the films from 2–7% moisture, and a strong softening effect at higher water contents. q 2003 Elsevier Science Ltd. All rights reserved. Keywords: Oat (1 ! 3)(1 ! 4)-b-D-glucan; Molecular weight; Structure; Lichenase; Coil overlap parameter; Flow behavior; Gelation; Melting; Tensile strength; Edible films; Plasticizer 1. Introduction Cereal (1 ! 3)(1 ! 4)-b-D-glucans (b-glucans) occur in the sub-aleurone and endosperm cell walls of the grains. The content of b-glucan in barley, oats, rye and wheat is generally in the range of 3 – 11%, 3 – 7%, 1 – 2%, and , 1%, respectively. In allowing a health claim for an association between consumption of oatmeal, rolled oats and oat bran, and reduced risk of coronary heart disease, the Food and Drug Administration (FDA) in USA has accepted that oat b-glucan is a functional, bio-active ingredient (Cui and Wood, 2000). In clinical studies, b-glucans were shown to reduce serum cholesterol levels and attenuate postprandial blood glucose and insulin responses in a viscosity related fashion (Klopfenstein, 1988; Newman et al., 1989; Wood, 1991; Kahlon et al., 1993; Braaten et al., 1994; Wood et al., 0733-5210/03/$ - see front matter q 2003 Elsevier Science Ltd. All rights reserved. doi:10.1016/S0733-5210(02)00137-6 Journal of Cereal Science 38 (2003) 15–31 www.elsevier.com/locate/jnlabr/yjcrs * Corresponding author. Tel.: þ 30-2310-998785; fax: þ 30-2310- 471257. E-mail address: [email protected] (C.G. Biliaderis).

Welcome message from author
This document is posted to help you gain knowledge. Please leave a comment to let me know what you think about it! Share it to your friends and learn new things together.
Transcript
Structure and rheological properties of water soluble b-glucans
from oat cultivars of Avena sativa and Avena bysantina
A. Skendia, C.G. Biliaderisb,*, A. Lazaridoub, M.S. Izydorczykc
aMediterranean Agronomic Institute of Chania, Alsyllion Agrokepion, P.O. Box 85, Chania GR-73100, Crete, GreecebDepartment of Food Science and Technology, School of Agriculture, Aristotle University, GR-540 06, Thessaloniki, Greece
cGrain Research Laboratory, 1404-303 Main Street, Winnipeg, Man., Canada R3C 3G8
Received 28 May 2002; revised 19 October 2002; accepted 5 November 2002
Abstract
Oat b-glucans were extracted (water at 47 8C) from milled seeds of two Greek cultivars (A. sativa cv. Pallini and A. bysantina cv.
Kassandra) and partially purified by pH adjustment of the b-glucan solutions to 4.5. Chemical analysis of the extracted gums revealed that
they were composed mainly of b-glucans (.85% d.b.) together with some contaminating proteins (,9% d.b.). The fine structure of the
b-glucan preparations was assessed by 13C-NMR spectroscopy and high-performance anion-exchange chromatography of the cellulosic
oligomers released by the action of lichenase. The tri- and tetra-saccharides accounted for 90.9–92.3% of the total oligomers analyzed and
the calculated molar ratios of trimers/tetramers varied between 1.99–2.11. Molecular size characterization was carried out with high
performance size exclusion chromatography combined with a multi-angle laser light scattering and a refractive index detector; for samples
with weight average molecular weight (Mw) ranging between 0.27 and 0.78 £ 106, the values of limiting viscosity ([h ]), critical
concentration (c**) and coil overlap parameter (c**[h ]) were within 4.9–6.4 dl/g, 1.2–2.0 g/dl and 7.8–10.1, respectively. The shear
thinning behavior was dependent on the molecular weight and concentration of the b-glucan preparations. All b-glucan samples were able to
form gels, as revealed by dynamic rheometry; the low molecular weight samples exhibited shorter gelation times and higher gelation rates
(IE ¼ [dlog G0/dt ]max) than their high molecular weight counterparts. The gelation rate increased with increasing concentration and gel
curing temperatures reaching a maximum at 32 8C; for higher temperatures the IE values decreased. For small molecular size b-glucans, a
biphasic melting behavior was observed for gels at curing temperatures of 2–32 8C, whereas at higher temperatures melting of the gel
network occurred as one-step process. Differential scanning calorimetry showed that gels cured at 24 8C exhibit a broad melting transition;
Tm , 63 8C and DH , 5 mJ/mg. The mechanical properties of casted (dispersions) films from two b-glucan preparations, differing in
molecular weight, with or without sorbitol, were examined by tensile measurements. The large deformation mechanical tests showed
decreases in tensile (Young’s) modulus (E) and strength (smax), and an increase in percentage elongation with increasing water content
and/or addition of sorbitol. The relationships between tensile parameters (E and smax) and water content showed an increase in stiffness of the
films from 2–7% moisture, and a strong softening effect at higher water contents.
q 2003 Elsevier Science Ltd. All rights reserved.
Keywords: Oat (1 ! 3)(1 ! 4)-b-D-glucan; Molecular weight; Structure; Lichenase; Coil overlap parameter; Flow behavior; Gelation; Melting; Tensile
strength; Edible films; Plasticizer
1. Introduction
Cereal (1 ! 3)(1 ! 4)-b-D-glucans (b-glucans) occur in
the sub-aleurone and endosperm cell walls of the grains. The
content of b-glucan in barley, oats, rye and wheat is
generally in the range of 3–11%, 3–7%, 1–2%, and ,1%,
respectively. In allowing a health claim for an association
between consumption of oatmeal, rolled oats and oat bran,
and reduced risk of coronary heart disease, the Food and
Drug Administration (FDA) in USA has accepted that oat
b-glucan is a functional, bio-active ingredient (Cui and
Wood, 2000). In clinical studies, b-glucans were shown to
reduce serum cholesterol levels and attenuate postprandial
blood glucose and insulin responses in a viscosity related
fashion (Klopfenstein, 1988; Newman et al., 1989; Wood,
1991; Kahlon et al., 1993; Braaten et al., 1994; Wood et al.,
0733-5210/03/$ - see front matter q 2003 Elsevier Science Ltd. All rights reserved.
doi:10.1016/S0733-5210(02)00137-6
Journal of Cereal Science 38 (2003) 15–31
www.elsevier.com/locate/jnlabr/yjcrs
* Corresponding author. Tel.: þ30-2310-998785; fax: þ30-2310-
471257.
E-mail address: [email protected] (C.G. Biliaderis).

1994b; Kalra and Jood, 2000). Increased gut viscosity by oat
b-glucan may either impede the uptake of dietary
cholesterol or inhibit bile salt reabsorption (Shinnick and
Marlet, 1993). The potential application of b-glucans as
food hydrocolloids has also been proposed based on their
rheological characteristics. Thus, b-glucans, because of the
high viscosity of their solutions, could be used as thickening
agents in sauces, salad dressings, or in ice cream
formulations (Wood, 1986). In addition to solution viscosity
enhancement, b-glucans from oat (Cui and Wood, 2000;
Doublier and Wood, 1995), barley (Cui and Wood, 2000;
Gomez et al., 1997; Morgan and Ofman, 1998; Bohm and
Kulicke, 1999b), and wheat (Cui and Wood, 2000; Cui et al.,
2000) were shown to gel under certain conditions. Oatrim, a
product containing oat b-glucans and amylodextrins, as well
as hydrolyzed oat flour have been proposed as fat-mimetics;
in a gel-form substituting for shortening in oatmeal-raisin
cookies. This product is being used experimentally in
various reduced-fat and soluble fiber-enriched foods, such
as meats, muffins, cakes, frozen desserts, salad dressings,
sauces, gravies, soups, mayonnaise, margarine, breakfast
cereals and candy products (Inglett, 1990; Inglett and
Grisamore, 1991; Inglett and Warner, 1992).
b-Glucans are linear homopolysaccharides composed of
D-glucopyranosyl residues (Glcp) linked via a mixture of
b-(1 ! 3) and b-(1 ! 4) linkages. Numerous structural
studies (Dais and Perlin, 1982; Woodward et al., 1983;
Varum and Smidsrod, 1988; Wood et al., 1994c) have
established that (1 ! 3)(1 ! 4)-b-D-glucans are
unbranched, and that the (1 ! 3) linkages occur singly,
whereas most of the (1 ! 4) linkages occur in groups of two
or three. The resultant structure is a polysaccharide built
mainly from b-(1 ! 3)-linked cellotriosyl (58–72%) and
cellotetraosyl (20–34%) units, but there is evidence for a
minor amount of sequences with consecutive (1 ! 4)
linkages longer than the tetraose type and up to 14 glucosyl
units (Cui, 2001). Markov chain analysis of the distribution
of cellotriosyl and cellotetraosyl segments in water-soluble
barley b-glucans favors a random arrangement of the major
structural building blocks (Staudte et al., 1983). The
apparent molecular weight of isolated mixed-linkage
b-glucan fractions vary from 2.0 £ 104 – 40.0 £ 106
(Fincher and Stone, 1986). The apparent discrepancies in
the Mw estimates of b-glucans from different sources may
be attributed to variation in cell wall structure (thicker cell
walls show greater resistance to extraction of high
molecular weight polymers), different extraction and
isolation methods (solvent and temperature affect the
solubilization), aggregation phenomena (dependent on
the structural features and solvent quality) and depolymer-
ization events (endogenous or microbial b-glucanases from
contaminating microorganisms) taking place during the
extraction step.(Izydorczyk and Biliaderis, 2000) The
fine structure, molecular size and molecular weight
distribution of these cell wall polysaccharides are important
determinants of their physical properties and functionality,
including their physiological responses when they are
considered as ingredients in cereal-based foods and other
formulated products. It is well known that the source (cereal
species, cultivar), processing treatments (milling, tempera-
ture-pH-shear effects, etc.), and interactions with other
constituents (polymers or small molecular weight solutes) in
the primary source or in a composite food matrix are likely
to influence the concentration, structural features, and
dispersibility-solubility of b-glucans and thereby modulate
their physiological action in the gastro-intestinal tract.
Cereal b-D-glucans can form gels under certain con-
ditions. The gelling ability and insolubility of freeze-dried
cereal b-D-glucans follow the order of wheat . barley .
oat; this trend seems to correspond with the ratio of
cellotriosyl to cellotetraosyl units in the cereal b-D-glucan
(,4, 3 and 2 for wheat, barley and oat b-D-glucans,
respectively). In addition to the structural features, molecu-
lar weight also plays an important role in the polysaccharide
conformation (in aqueous systems) and hence, in the
gelation potential of cereal b-D-glucans (Cui and Wood,
2000; Bohm and Kulicke, 1999b).
Over the last decade there has been a rapidly growing
interest in the development and use of biobased packaging
materials. The utility of edible films and coatings lies in their
capacity to act as an adjunct for improving food quality,
extending shelf life, and possibly improving economic
efficient of packaging materials (Kester and Fennema,
1986). Moreover, edible films and biodegradable polymer
films offer alternative packaging options with no contri-
bution to the environmental pollution (Krochta and De
Mulder-Johnston, 1997). The obvious appealing character-
istics of edible films include the renewable nature of their
ingredients, the film’s ability to function as carriers of food
additives (e.g. antioxidants, flavors, antimicrobial agents),
and the potential use of such films in the interior of
heterogeneous food systems as selective barrier to the
transport of vapors, gases, and solutes (Cherian et al., 1995;
Diab et al., 2001). Polysaccharides (cellulose derivatives,
pectin, starch, alginates, chitosan, carrageenans, pullulan
etc.) are well known for having good film—forming
properties. Coatings made with these biopolymers or their
blends are generally considered as effective gas barriers. In
contrast, minimal moisture barrier properties can be
expected, because of the hydrophilic nature of these
materials (Kester and Fennema, 1986). The addition of
plasticising agents (e.g. polyols) to edible films (added at
concentrations ranging from 10 to 60 g/100 g dry matter
depending upon polymer rigidity) is often required to
overcome film brittleness caused by extensive intermole-
cular forces; the plasticizer must be compatible with the
polymer matrix. Plasticizers reduce these forces and increase
the mobility of polymer chains, thereby improving flexibility
and extensibility of the film. This avoids chipping or
cracking of the film during subsequent handling and storage.
The main objective of this study was to examine the
molecular and structural features of several b-glucan
A. Skendi et al. / Journal of Cereal Science 38 (2003) 15–3116

preparations from two Greek oat cultivars belonging to two
different oat species in conjunction with their rheological
properties (viscosity, gelation characteristics). The potential
of using b-glucans as a raw material to form edible films
was also explored; in this respect, the mechanical properties
of b-glucan films as a function of polymer molecular size,
water content and the presence of sorbitol as a plasticizing
co-solute were examined.
2. Materials and methods
2.1. Materials
Whole oat seeds from Avena sativa L., cultivar Pallini
(P), and from Avena bysantina, cultivar Kassandra (two oat
samples K-I, K-II obtained from crops of two consecutive
years), were provided by the National Agricultural Research
Foundation, Cereal Research Institute, Thessaloniki,
Greece. Sorbitol and other chemicals of analytical grade
were obtained either from Sigma-ALDRICH Co. (Gilling-
ham-Dorset) or from Merck (Darmstadt, Germany).
2.2. Extraction and purification of b-glucan
Oat seeds were milled in a Camas mill to pass 0.8 mm
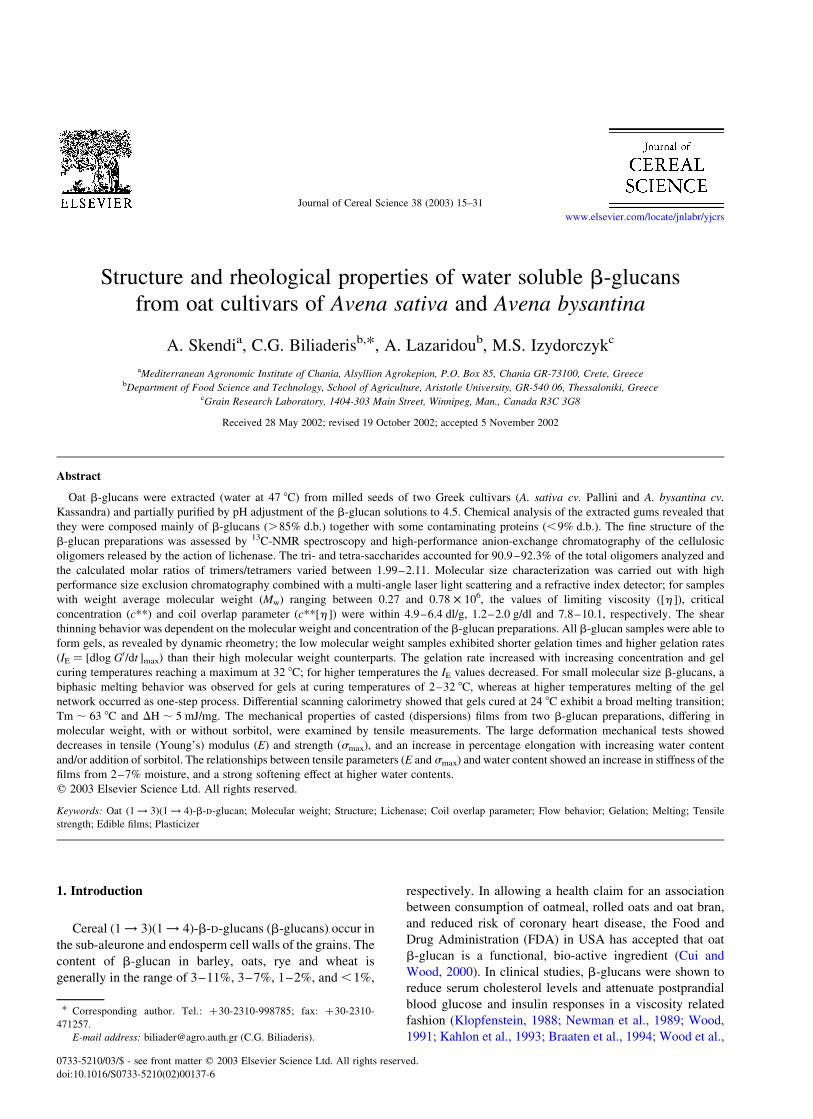
screen. A schematic outline of the extraction and purifi-
cation procedures employed for isolation/purification of b-
glucans is presented in Fig. 1. The reflux of oat flour with
alcohol at 85 8C removed most of the lipids and aimed at the
inactivation of endogenous b-glucanases. The aqueous
extraction of b-glucans at a temperature (47 8C) below the
gelatinization temperature of starch resulted in very little
starch solubilization (samples P1, K-I1, K-II1). A step for
further purification was used to remove some proteins by
adjusting the pH of the b-glucan solutions to 4.5 (samples
P2, K-I2, K-II2).
The protein content of the b-glucan preparations was
determined by the method of Lowry et al. (1951). The
b-glucan content was determined by the method of
McCleary and Glennie-Holmes (1985) using the Mega-
zymew mixed linkage b-glucan assay kit.
2.3. Molecular and structural characterization of b-glucan
Size exclusion chromatography for molecular character-
ization of the isolated/purified b-glucans was carried out
with a high performance size exclusion chromatography
(HPSEC) system which consisted of a pump (Waters 510),
an injection valve (Model 7010, Rheodyne) with a 200 mL
sample loop, a guard column (TSK PWH, TosoHaas GmbH,
Stuttgart, Germany), a SEC column (TSK G5000 PW
column, 7.8 £ 600 mm, TSK PW, TosoHaas GmbH), a
multiangle laser light scattering detector (Dawn DSP, Wyatt
Technology Inc., Santa Barbara, CA) and a RI detector
(Waters 410). The flow rate of the mobile phase (0.15 M
NaNO3 containing 0.02% NaN3), which was filtered
through 0.2 mm and then 0.1 mm of cellulose acetate
membranes, was 0.4 ml min21; chromatography was per-
formed at 25 8C. Calculations of weight-average molecular
weight (Mw) and z-average root-mean-square (RMS) radii
of gyration (Rg) were performed by the Astra 4.72 software
(Wyatt Technology). Calculations were carried out with a
(dn/dc) ¼ 0.147 ml g21. Pullulan standards with known Mw
values (P-50, Mw 47,300; P-400, Mw 404,000; P-800, Mw
788,000) were used to determine the proper experimental
setup and calculations. Estimates of the polydispersity index
(Mw/Mn) were also obtained.
The distribution of cellulosic oligomers in the chain of
b-glucans was determined by lichenase treatment and
chromatography. b-Glucan samples were dissolved in
phosphate buffer (2 mg/mL, 0.01 M, pH 6.5) and incubated
with lichenase [(1–3),(1–4)-b-glucan-4-glucanohydrolase,
EC 3.2.1.73, 4 U/mL] from Megazyme International Ltd.
(Bray, Ireland) for 20 h at 40 8C. The digests were heated to
95 8C (15 min) to inactivate the enzyme. High-performance
anion-exchange chromatography (HPAEC) combined with
pulsed amperometric detection was utilized for analysis of
oligosaccharides released from b-glucan by lichenase
degradation. A Dionex system equipped with a CarboPac
PA1 column (4 £ 250 mm) and a PA1 guard column
(4 £ 50 mm) was used and the running conditions of
Wood et al. (1994a) were adopted. The purity and some
structural features of the b-glucan samples were also
assessed with 13C-NMR spectroscopy (Bruker AM 300 FT
spectrometer, 300 Hz). The proton-decoupled 13C-NMR
spectra were recorded at 70 8C, polysaccharide concen-
tration 2% (w/v) in 50% (v/v) d6-DMSO/H2O; 30,000
pulses with a pulse repetition time of 1.245 s, and an r.f.
pulse angle 80.08 were employed. Chemical shifts are
expressed in parts per million downfield from external
Me4Si but were actually measured by reference to internal
1,4-dioxane (d ¼ 67.4 ppm).
2.4. Rheological measurements
Fresh solutions for all rheological measurements were
made each time in hermetically sealed glass vials by gentle
stirring of the b-glucan samples in double distilled water at
85 8C until complete solubilization of the material. The
intrinsic or limiting viscosities [h ] of aqueous solutions of
b-glucans were measured with Ubbelodhe No. 1 capillary
viscometers at 20 ^ 0.1 8C; calculations were according to
the Huggins equation. The flow and viscoelastic behavior of
the fresh solutions as well as the gel curing—melting events
for the b-glucan preparations were performed on a
rotational Physica MCR 300 rheometer (Physica Messtech-
nic GmbH, Stuttgart, Germany) using a concentric cylinder
(diameter of cup and bob, 28.92 and 26.66, respectively)
and a double gap cylindrical geometry; temperature was
regulated by a Paar Physica circulating bath and a controlled
peltier system (TEZ 150P/MCR) with an accuracy of
A. Skendi et al. / Journal of Cereal Science 38 (2003) 15–31 17
^0.1 8C. Measurements were performed at different
temperatures (5 – 45 8C). Three types of rheological
measurements were performed and the data were analyzed
with the supporting rheometer software US200 V2.21: (a)
flow behavior by measuring steady shear viscosity (h) over
a range of shear rates ð _gÞ of 0.05–1200 (s21); (b) oscillatory
measurements of G0 (storage modulus), G00 (loss modulus),
h0 (dynamic viscosity), h* (complex viscosity) and tand
(G00/G0) were performed with a strain 0.1% and a range of
angular frequencies (0.5–100 rad/s); (c) isothermal gel
curing events and the melting behavior (heating rate at
3 8C/min) of the gels were probed at a strain level of 0.1%
Fig. 1. Extraction and purification scheme of b-glucans from whole flours of two oat cultivars (A. sativa cv. Pallini, P and A. bysantina cv. Kassandra, K).
A. Skendi et al. / Journal of Cereal Science 38 (2003) 15–3118

and a frequency of 1 Hz. A thin layer of paraffin oil was
added to cover the samples in order to prevent evaporation
during measurements.
2.5. Calorimetry
Differential scanning calorimetry (DSC) measurements
were carried out with a PL DSC—Gold calorimeter
(Polymer Labs. Ltd, Epsom, UK). Samples of about 4 mg
dry matter of the b-glucan dispersions (10% w/v) were
sealed hermetically into DSC pans and stored at 24 8C for
92 h. The samples were then heated at a heating rate of
5 8C/min.
2.6. Tensile tests
For large deformation mechanical tests (tensile mode),
b-glucan films (thickness 0.1 ^ 0.02 mm) with or without
added sorbitol (S) were prepared by casting aqueous
solutions (3% w/v). Four different formulations, [K-I2
(100), K-I2-S (85:15 w/w), P2 (100) and P2-S (85:15
w/w)] were obtained by pouring slowly the b-glucan
powder under continuous magnetic stirring in distilled
water at 60 8C and adding sorbitol after complete dispersion
of the b-glucan. The solutions were kept for about half an
hour in a water bath before they were cast over plastic
frames (10 £ 10 £ 1.5 cm). The K-I2, and K-I2-S solutions
were allowed to dry at 37–42 8C for 2 days and after that at
30 8C until complete drying. The P2, and P2-S solutions
were allowed to dry at 45–50 8C for 2 days and then at
30 8C until complete drying.
Before testing, rectangular film strips (5 £ 1 cm) were
cut and conditioned for 12 days at 25 8C at various moisture
contents. Tensile testing was performed with a TA-XT2i
instrument (Stable Micro systems, Godalming, Surrey, UK)
according to the ASTM D828-88 (ASTM, 1989) method at
25 8C. The initial grip separation was set at 40 mm and the
cross head speed at 0.5 mm/min. The thickness of each
sample was measured at three different points with a
micrometer and an average value was obtained. Calcu-
lations of tensile (Young’s) modulus (E), tensile strength
(smax) and percentage elongation were made as described
elsewhere (Biliaderis et al., 1999). The Young’s modulus
(E) was calculated from the initial slope of the stress–strain
curves, while smax and (%) elongation correspond to the
tensile strength and percentage elongation at break,
respectively. Each of the reported moduli and smax values
represent an average of at least ten measurements of
samples similarly conditioned to a certain moisture level in
chambers of fixed relative humidity using saturated salt
solutions. The moisture content of samples used for large
deformation mechanical testing was determined by drying
the samples at 105 8C to constant weight (Biliaderis et al.,
1999).
3. Results and discussion
3.1. Purity and molecular characterization of b-glucans
The b-glucan and protein content of all samples are
given in Table 1. The isolation/purification protocol adopted
in the present study appears to provide b-glucan prep-
arations with a low protein content (,9% d.b.) and a fairly
high level of b-glucans (.85% d.b.). The data in Table 1
clearly show that the additional purification step by
Table 1
Compositional, molecular and structural features of b-glucan preparations isolated from whole oat flours of two Greek cultivars
Samples K-I1 K-I2 K-II1 K-II2 P1 P2
b-glucans (% d.b.) 85.1 89.6 86.2 90.4 84.5 87.3
Protein (% d.b.) 7.2 3.8 6.6 3.1 9.0 6.5
Mwa £ 1026 0.71d ^ 0.04 0.30 ^ 0.00 0.85 ^ 0.03 0.78 ^ 0.01 0.27 ^ 0.00 0.18 ^ 0.00
Mw/Mn 2.28 2.15 1.50 1.58 2.39 2.31
DP 3b 55.14 ^ 1.20 55.27 ^ 1.00 54.56 ^ 1.00 54.66 ^ 1.20 56.53 ^ 1.00 56.79 ^ 0.95
DP 4 36.28 ^ 0.80 36.18 ^ 0.70 36.34 ^ 0.85 36.23 ^ 0.70 35.28 ^ 0.70 35.50 ^ 0.80
DP 5 3.88 ^ 0.01 3.78 ^ 0.02 3.85 ^ 0.03 3.67 ^ 0.02 3.97 ^ 0.04 4.05 ^ 0.04
DP 6 2.43 ^ 0.02 2.35 ^ 0.02 2.50 ^ 0.02 2.38 ^ 0.03 2.33 ^ 0.02 2.26 ^ 0.01
DP 7 0.51 ^ 0.01 0.48 ^ 0.01 0.54 ^ 0.01 0.53 ^ 0.02 0.47 ^ 0.01 0.41 ^ 0.01
DP 8 0.68 ^ 0.03 0.73 ^ 0.02 0.79 ^ 0.02 0.83 ^ 0.03 0.58 ^ 0.01 0.46 ^ 0.01
DP 9 0.92 ^ 0.02 0.97 ^ 0.02 1.21 ^ 0.01 1.27 ^ 0.02 0.68 ^ 0.01 0.47 ^ 0.01
DP 10 0.12 ^ 0.02 0.16 ^ 0.01 0.20 ^ 0.01 0.19 ^ 0.01 0.08 ^ 0.00 0.06 ^ 0.00
DP 11 0.05 ^ 0.01 0.07 ^ 0.01 0.10 ^ 0.00 0.21 ^ 0.00 0.07 ^ 0.00 0.01 ^ 0.00
DP 12 tr. tr. tr. tr. tr. tr.
MolarDP 3/DP 4 2.01 2.02 1.99 2.00 2.11 2.11
DP 3 þ DP 4 (%) 91.42 91.45 90.90 90.89 91.80 92.29
(1 ! 4)/(1 ! 3)c 2.37 2.43 2.51 2.60 2.41 2.34
a From the 2nd peak (major peak) of the HPLC chromatograms.b Weight percent from the chromatograms of the lichenase digests.c From 13c-NMR spectra (peak areas of C6 of (A þ C þ D)/B glucosyl-residues).d Values are means (^S.D.) of triplicate measurements.
A. Skendi et al. / Journal of Cereal Science 38 (2003) 15–31 19
adjusting the pH of the b-glucan solutions to 4.5, reduced
the protein content of the sample (compare preparations P1,
K-I1, K-II1 with their purified counterparts P2, K-I2, K-I2).
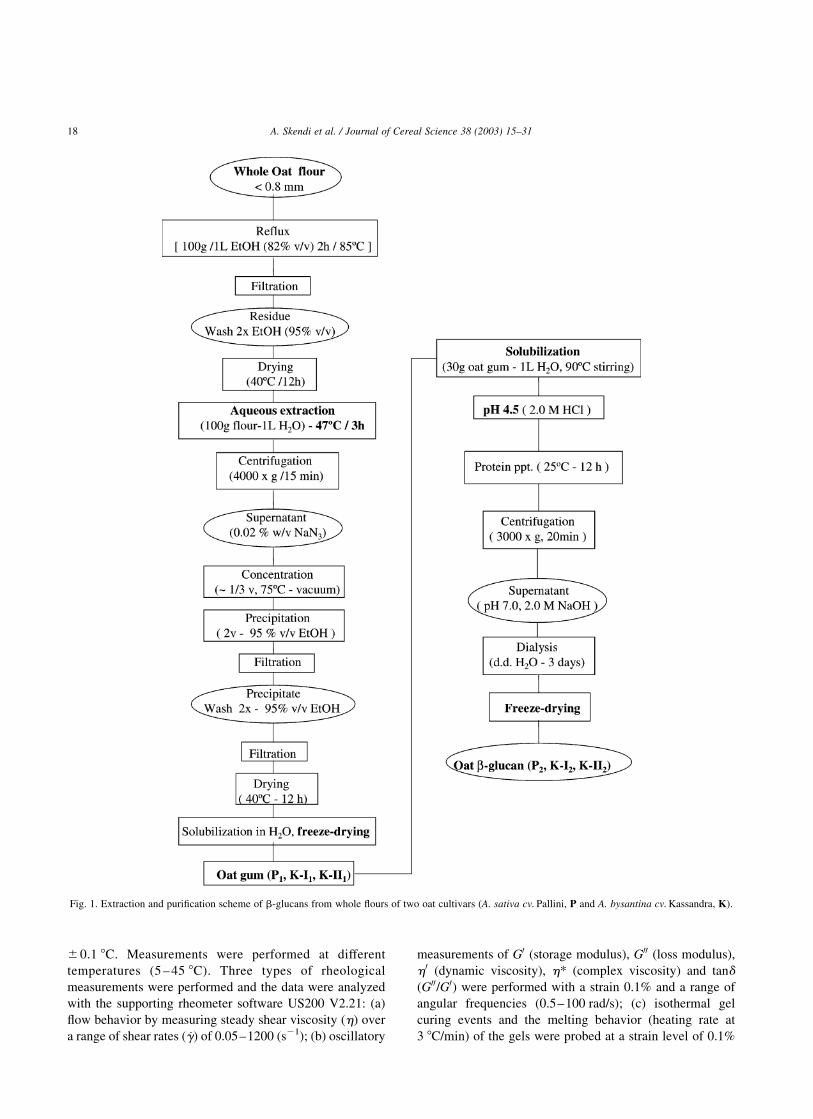
Estimates of molecular characteristics (Mw, Rg, Mw/Mn)
obtained from the HPSEC elution profiles (Fig. 2) of the b-
glucan preparations are summarized in Table 1. The Mw
values varied from 0.18 to 0.85 £ 106 differing from those
of 1–2 £ 106 reported in the literature (Wood, 1991;
Doublier and Wood, 1995; Johansson et al., 2000) for oat
b-glucans. The large variation of the reported molecular
weights of cereal b-glucan reflects the diversity of origin
and/or the methodology used for the determination of the
values. Also, the extraction protocol (solvents, conditions
and sample history) has an impact on the Mw values (Cui
and Wood, 2000). Zhang et al. (1999) have found that the
molecular weight of b-glucan is increased with increasing
extraction temperature. The low Mw values of b-glucan
preparations in the present study can be explained by the
relatively mild extraction conditions used (water extraction
at 47 8C). Moreover, the type of cultivar seems to affect the
molecular weight of b-glucans; b-glucans isolated from
Kassandra exhibited higher molecular weights than those
from Pallini. The data of Table 1 also suggest that any step
taken to further purify the b-glucans result in a significant
reduction of the molecular weight; comparing the prep-
arations P1, K-I1, K-II1 with their purified counterparts P2,
K-I2, K-II2, the most pronounced change was for the K-I.
The polydispersity values, Mw/Mn, varied between
1.50–2.39.
Typical chromatograms of two oat b-glucans prep-
arations before and after purification obtained from the
HPSEC system are shown in Fig. 2. A relatively broad
molar weight distribution was observed for all samples with
a major peak. The purified samples gave a sharper peak,
shifted towards lower hydrodynamic volumes. Interestingly,
the exponent a of the Rg vs Mw relationship ðRg , MawÞ
indicated different conformation for the high and low
molecular weight populations within the same elution peak.
Fig. 2. Size exclusion chromatograms of two oat b-glucan preparations before (K-II1) and after partial purification (K-II2) of the sample.
A. Skendi et al. / Journal of Cereal Science 38 (2003) 15–3120

For the species eluted between the onset of the peak and the
main peak volume, the values of a ranged from 0.13 to 0.42,
whereas for the lower Mw species (species eluted after the
peak volume) ranged from 0.66 to 0.91 (results not shown).
The latter values suggest a more extended and a stiffer
conformation for the low Mw b-glucans. This relation
between the molecular weight and conformation of b-
glucan chains should be explored further. In all chromato-
grams, the peak in the very low molecular weight range
represents the contaminating protein fraction, as verified by
a UV detector. A small peak was also evident in the high
molecular weight region of the chromatogram of each
sample and it may represent high molecular weight species,
although the possibility of having aggregates of b-glucan
under the HPSEC running conditions (0.15 M NaNO3,
25 8C) cannot be excluded. In fact, aggregation phenomena
in b-glucan solutions have been reported in some recent
studies employing HPSEC systems (Zhang et al., 1999;
Wang et al., 2002). According to Wang et al. (2002) a
complete dispersion of the b-glucan solutions and disrup-
tion of their aggregates without polymer degradation can be
achieved by microwave heating in a high-pressure vessel for
4–10 min at 100–121 8C and not by heating and stirring at
80 8C.
The molecular and structural features of b-D-glucans
play an important role in the solubility and conformation,
and hence in their rheological properties (Cui and Wood,
2000). b-Glucans containing blocks of adjacent b-(1 ! 4)
linkages may exhibit a tendency for interchain aggregation
(and hence lower solubility) through strong hydrogen bonds
along the cellulose-like regions; the b-(1 ! 3) linkages
break up the regularity of the b-(1 ! 4) linkage sequence,
making it more soluble and flexible. According to a popular
model, a plausible cause for aggregation of (1 ! 3)(1 ! 4)-
b-D-glucans would be the cellulose-like sequences of more
than three contiguous b-(1 ! 4)-linked glucosyl units
which stick together leading to gels (Fincher and Stone,
1986). An alternative model for gelation has been proposed
lately, according to which association of consecutive
cellotriose units (linked via b-(1 ! 3) bonds) may form
extended junction zones and lead to the development of a
gel network structure (Bohm and Kulicke, 1999b).
The enzyme lichenase, a (1 ! 3)(1 ! 4)-b-D-glucan-4-
glucanohydrolase, specifically cleaves the (1 ! 4)-glycosi-
dic bond of the 3-substituted glucose residues in b-glucans
yielding oligomers with different degree of polymerization
(DP). The major products are 3-O-b-cellobiosyl-D-glucose
(DP 3) and 3-O-b-cellotriosyl-D-glucose (DP 4), but
cellodextrin-like oligosaccharides (DP $ 5) are also pro-
duced from the polymer regions containing more than three
consecutive 4-linked glucose residues. The relative amounts
of oligosaccharides released by lichenase constitute a
fingerprint of the structure of b-glucans. The HPAEC
chromatograms of the different b-glucan samples were
similar and showed only minor differences in the contents of
oligomers with a DP 3–11. The calculated weight percent of
the oligosaccharides for all lichenase digests are summar-
ized in Table 1. As expected, the major products were
trimers and tetramers; the tri- and tetra-saccharides from all
samples accounted for 90.9–92.3% of the total oligomers
analyzed. These values do not differ from those of Doublier
and Wood (1995), Cui et al. (2000) and Wood et al. (1991,
1994c) and who reported 91.9–92.6, 91.9, 91.0, and 89.9%
and respectively, for the contents of DP3 and DP4 of
lichenase hydrolyzates from different oat b-glucan prep-
arations. The calculated molar ratios of trimers/tetramers for
oat b-glucan preparations varied within the narrow range of
1.99–2.11. These findings are very close to those of 2.2,
2.1–2.2, and 1.8–2.3 that have been reported by Cui et al.
(2000), Wood et al. (1991) and Miller et al. (1993),
respectively. Significant structural differences in cereal b-
glucans, as indicated by the trisaccharide-to-tetrasaccharide
ratios, have been reported between different genera of the
cereals (rye 2.7, barley 2.9–3.4, and wheat 3.0–4.5) and not
within the same genera (Cui et al., 2000; Wood et al., 1991).
The purity of the isolated oat b-glucans was further
confirmed by the 13C-NMR spectra of the samples as
showed in Fig. 3. The spectral features were all typical of a
mixed linkage cereal b-glucan as assigned by Cui and Wood
(2000), Cui et al. (2000), Dais and Perlin (1982) and Wood
et al. (1994c). Considering the generalized b-glucan
structure:
assignment of several resonances to carbons of individual b-
glucose residues (A, B, C, D) is feasible based on literature
data (Cui et al., 2000). All spectra showed single resonances
at 86.3 ppm for each carbon of the O-3-linked glucose
(residue B), indicating a single environment for this residue
in the polymer. Similarly, there was a single resonance for
the C-4 of O-3-linked glucose at 69.2 ppm (Varum and
Smidsrod, 1988; Wood et al., 1994c). The expected three
distinct resonances for the three different types of 4-O-
substituted residues (A, C, and D) at about 79.3–79.9 ppm
(Cui et al., 2000; Dais and Perlin, 1982) were not resolved,
giving instead a single resonance. Among the other resolved
resonances, one can distinguish the carbon anomeric region
(C-1) at ,103 ppm; the resonance at 103.7 corresponds to
C-1 of A residue and the 103.2 to C-1 of the B, C, and D
residues. On the other hand, the doublet at ,61 ppm (C-6
region) corresponds to the C-6 of B residues (O-3-linked
glucan) at 61.7 ppm and to the C-6 of A, C, and D residues
at 61.1 ppm. The relative intensities of the latter two
resonances can thus be used as an index of the ratio of
(1 ! 4)/(1 ! 3) linkages on the b-glucan chain. The
calculated ratios of the two types of linkages in the native
A. Skendi et al. / Journal of Cereal Science 38 (2003) 15–31 21

b-glucan structures were within a range of 2.34–2.60 for all
six samples analyzed (Table 1), which is in agreement with
the values of 2.2–2.6 reported by Dais and Perlin (1982).
3.2. Solution rheology
The intrinsic viscosities, [h ], (Table 2) were obtained by
extrapolation of viscometric data to zero concentration
according to the Huggins equation:
hspec=c ¼ ½h� þ kH½h�2c
where hspec ¼ (hsolution/hsolvent) 2 1, and kH is the Huggins
constant.
As expected, the [h ] values of the samples increased
with increasing Mw. The calculated values of 4.9–6.4 (dL/g)
were in the same range of 2.58–9.63 (dL/g) and 2.0–7.4
(dL/g) found by others researchers for oat b-glucans
preparations with Mw ranging between 100–1200 £ 103
and Mn between 63–330 £ 103, respectively (Doublier and
Wood, 1995; Varum and Smidsrod, 1988).
Intrinsic viscosity provides a convenient measure of the
hydrodynamic volume of individual polymer coils, and
when multiplied by concentration gives an index of total
degree of space-occupancy, the reduced concentration
(c[h ]). Double logarithmic plots of hsp vs. c[h ] for most
disordered polysaccharides superimpose closely, falling
into distinct linear regions, regardless of the polymer
primary structure and its molecular weight (Morris et al.,
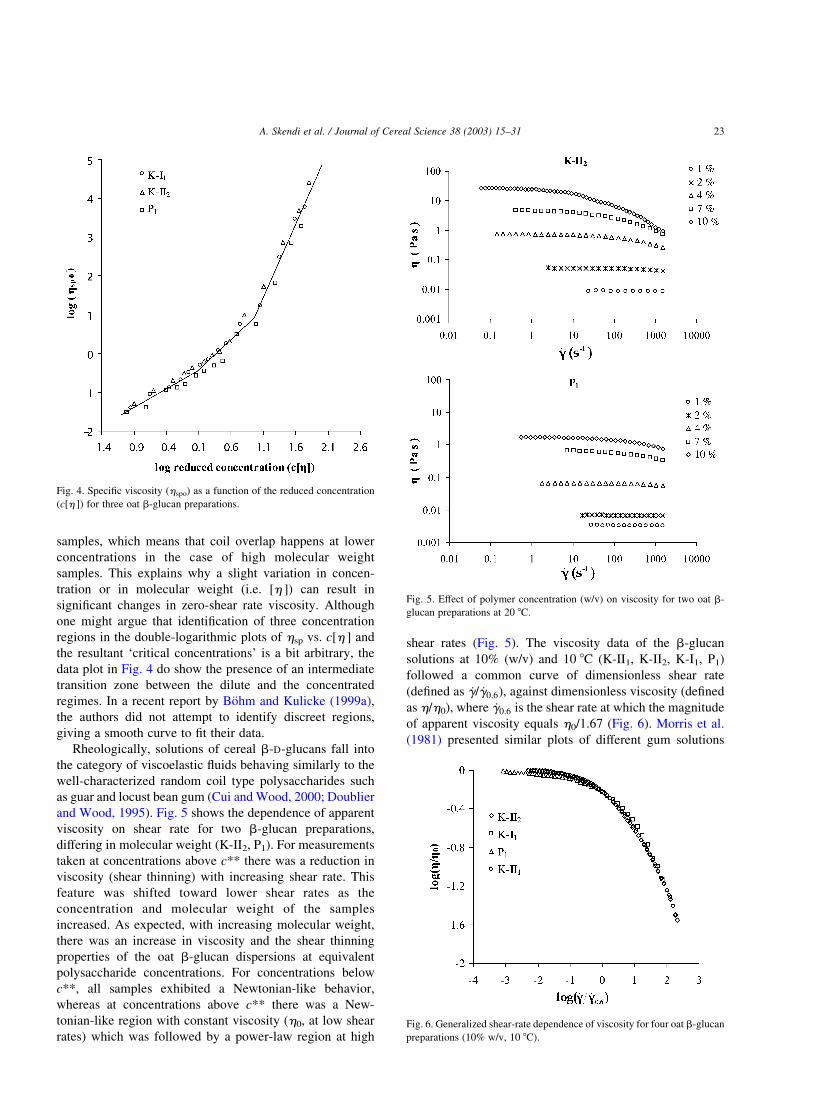
1981). As shown in Fig. 4, the results obtained for three oat
b-glucan isolates comply reasonably well this generaliz-
ation, showing three linear regions, with the slopes and
intercepts listed in Table 2. The first transition (at
concentration c*) is attributed to initial contact between
the individual coils when, in aggregate, their swept-out
volume becomes equal to the total volume of the solution,
and normally occurs when the degree of space-occupancy
reaches c[h ] , 1. The two regions of higher concentration-
dependence correspond, respectively, to initial compression
and subsequent interpenetration of the polymer coils in
response to increasing space-occupancy, and the concen-
tration at their point of intersection is denoted as c**. The
intermediate zone between the dilute (c , c*) and concen-
trated (c . c**) domains appears to be characteristic of
polymers with rigid, rod-like conformation (Cuvelier and
Launay, 1986). It seems that for rod polymers the transition
between the dilute and concentrated regimes is smoother
than for flexible polymers. The transition domain at
intermediate concentrations has already been reported for
some synthetic polymers as well as for xanthan, hydro-
xylmethylcellulose (Cuvelier and Launay, 1986), b-glucan
(Doublier and Wood, 1995), wheat arabinoxylan (Izydorc-
zyk and Biliaderis, 1992), okra and dika nut polysaccharides
(Ndjouenkeu et al., 1996), and microbial levan (Kasapis
et al., 1994). The observed rheological behavior of b-glucan
is not surprising, since the chain of this polymer has been
characterized as an expanded partially stiff worm-like
cylinder (Gomez et al., 1997; Bohm and Kulicke, 1999a).
The slope values of the double logarithmic plots of (hsp)0
against c[h ] at the three regimes were 1.0 (c , c*), 1.6
(c* , c , c**), and 3.8 (c . c**). These values are in
agreement with those reported by Doublier and Wood
(1995) for other oat b-glucan preparations. Measured values
of coil overlap parameter c**[h ] varied widely (compared
with the c*[h ]) between 7.8 and 10.1. The values for c* and
c** (Table 2) also seem to increase with a decrease in
molecular weight and intrinsic viscosity [h ] of the b-glucan
Fig. 3. 13C NMR spectra of two representative samples of oat b-glucans.
Table 2
Concentration-dependence of ‘zero-shear’ viscosity (slopes and critical concentration values) of three b-glucan isolates
Samples Slope1 Slope2 Slope3 c*[h ] c**[h ] c* (g/dL) c** (g/dL) [h ] (dL/g)
K-II2 1.00 1.51 3.79 1.22 7.75 0.192 1.219 6.4
K-I1 0.95 1.67 3.73 1.25 9.90 0.224 1.770 5.6
P1 0.87 1.48 3.69 1.11 10.05 0.225 2.038 4.9
All samples 0.97 1.57 3.76 1.20 9.10 - - -
A. Skendi et al. / Journal of Cereal Science 38 (2003) 15–3122
samples, which means that coil overlap happens at lower
concentrations in the case of high molecular weight
samples. This explains why a slight variation in concen-
tration or in molecular weight (i.e. [h ]) can result in
significant changes in zero-shear rate viscosity. Although
one might argue that identification of three concentration
regions in the double-logarithmic plots of hsp vs. c[h ] and
the resultant ‘critical concentrations’ is a bit arbitrary, the
data plot in Fig. 4 do show the presence of an intermediate
transition zone between the dilute and the concentrated
regimes. In a recent report by Bohm and Kulicke (1999a),
the authors did not attempt to identify discreet regions,
giving a smooth curve to fit their data.
Rheologically, solutions of cereal b-D-glucans fall into
the category of viscoelastic fluids behaving similarly to the
well-characterized random coil type polysaccharides such
as guar and locust bean gum (Cui and Wood, 2000; Doublier
and Wood, 1995). Fig. 5 shows the dependence of apparent
viscosity on shear rate for two b-glucan preparations,
differing in molecular weight (K-II2, P1). For measurements
taken at concentrations above c** there was a reduction in
viscosity (shear thinning) with increasing shear rate. This
feature was shifted toward lower shear rates as the
concentration and molecular weight of the samples
increased. As expected, with increasing molecular weight,
there was an increase in viscosity and the shear thinning
properties of the oat b-glucan dispersions at equivalent
polysaccharide concentrations. For concentrations below
c**, all samples exhibited a Newtonian-like behavior,
whereas at concentrations above c** there was a New-
tonian-like region with constant viscosity (h0, at low shear
rates) which was followed by a power-law region at high
shear rates (Fig. 5). The viscosity data of the b-glucan
solutions at 10% (w/v) and 10 8C (K-II1, K-II2, K-I1, P1)
followed a common curve of dimensionless shear rate
(defined as _g= _g0:6), against dimensionless viscosity (defined
as h/h0), where _g0:6 is the shear rate at which the magnitude
of apparent viscosity equals h0/1.67 (Fig. 6). Morris et al.
(1981) presented similar plots of different gum solutions
Fig. 4. Specific viscosity (hspo) as a function of the reduced concentration
(c[h ]) for three oat b-glucan preparations.
Fig. 5. Effect of polymer concentration (w/v) on viscosity for two oat b-
glucan preparations at 20 8C.
Fig. 6. Generalized shear-rate dependence of viscosity for four oat b-glucan
preparations (10% w/v, 10 8C).
A. Skendi et al. / Journal of Cereal Science 38 (2003) 15–31 23

using a shear rate of _g0:1; i.e. corresponding to the change in
apparent viscosity of h0/10. In the plots of Fig. 6, the ratio of
h0/1.67 was used instead, since it was not feasible to obtain
a 10-fold decrease in viscosity for all samples studied
(within the accessible range of shear rates). The data for all
four b-glucan samples seemed to follow a common master
curve using this transformation of viscosity values vs. shear
rate. A number of rheological models can be used to
describe the shear rate dependence of apparent viscosity
data. Morris (1984) suggested the model:
h ¼ h0=½1 þ mð _g= _g0:6Þp�
The data from the generalized shear thinning profiles (Fig. 6)
can be fitted well (r 2 ¼ 0.996) within experimental error
( p , 0.05) by this equation:
h ¼ h0=½1 þ 0:714ð _g= _g0:6Þ0:66�
A further generality of behavior observed for disordered
polymer chains interacting solely by physical entanglements
is that the complex viscosity (h*) from small-deformation
oscillation measurements and the steady-shear viscosity (h)
from rotational measurements superimpose closely at
equivalent numerical values of frequency (v, rad s21) and
shear rate ( _g; s21). This direct relationship between
rheological response to destructive and non-destructive
deformation is known as the Cox-Merz rule (Cox and Merz,
1958). This rule has been confirmed experimentally for
several synthetic polymers (Ferry, 1960), as well as for most
random coil biopolymer solutions (Morris et al., 1981;
Andrade et al., 1999):
h p ðvÞ ¼ hð _gÞlv¼ _g
In contrast to disordered biopolymers, solutions of poly-
saccharides with a rigid, ordered chain conformation
showing a weak-gel behavior (e.g. xanthan) violate the
Cox-Merz rule; i.e. dynamic viscosity (h*) from small
deformation measurements is substantially higher than
steady shear viscosity (h) at equivalent rates of deformation,
indicating a tenuous network which remains intact under
low-amplitude oscillation but is disrupted by continuous
shear (Lapasin and Pricl, 1999).
The application of the Cox-Merz rule for two different
oat b-glucan solutions at 7 and 10% (w/v) at 20 8C is
presented in Fig. 7. There were no large departures from the
empirical Cox-Merz correlation for these samples, except in
the case of 10% dispersion of K-II2, which was declined
from the rule at high shear rates. The latter may indicate the
presence of high-intensity entanglements and/or intermole-
cular aggregation for this system at rest. Similarly, other
researchers have found that solutions of b-glucans (Bohm
and Kulicke, 1999a; Autio, 1988) and konjac flour (Jacon
et al., 1993) follow the Cox-Merz rule at low polymer
concentrations. However, at high polymer concentrations
deviations were observed in that h* was higher than h,
especially at high values of v= _g (Fig. 7). This may suggest
associations and molecular clusters due to chain aggregation
which are sensitive to shear forces (Bohm and Kulicke,
1999a).
3.3. Gelation properties
The most rigorous method of directly measuring the
gelation time (tc) employs the application of a low-
frequency, small amplitude oscillation strain to the system.
The gelation capacity of aqueous b-glucan dispersions was
monitored isothermally at different temperatures and
polymer concentrations for the different b-glucan prep-
arations; i.e. the time-dependent evolution of G0, G00 and
tand was monitored periodically at 1 Hz frequency and
strain level of 0.1%. The mechanical spectra (are not shown)
of the freshly prepared b-glucan solutions were typical of a
viscoelastic liquid (G00 . G0) where the moduli are highly
dependent on frequency. However, after an induction period
the b-glucan solutions began to adopt gel properties; the
mechanical spectra became typical of elastic gel networks
(G0 q G00, the moduli being less dependent on frequency,
and the dynamic viscosity, h0, decreased sharply). Two
representative kinetic profiles of the gelation process (gel
curing at 24 8C) for b-glucan preparations (10% w/v
Fig. 7. Cox-Merz rule for two oat b-glucan preparations at 7 and 10% (w/v), 20 8C.
A. Skendi et al. / Journal of Cereal Science 38 (2003) 15–3124

aqueous dispersions) differing in molecular weight are
shown in Fig. 8. The induction period for gelation was
longer for the sample with the higher molecular weight (K-
II2), compared to that with the lower Mw (P1). After this
induction period, there was a rapid rise in the G0, whereas
the G00 showed a much slower rate of increase. The increase
in the rate of G0 development was more pronounced for P1
than the K-II2. Bohm and Kulicke (1999b)) also found that
the logarithm of G0 as a function of time generally evolved
as a sigmoidal curve for barley b-glucans, and it varied with
the concentration and molecular weight of the polymer. The
slope of log G0(t) at the turning point (maximum slope) was
chosen by these authors as a measure of the gelation rate; it
was named as ‘elasticity increment, IE00, and calculated as
IE ¼ (dlog G0/dt)max. Its dimension is reciprocal time and
indicates the number of decades G0 increases at maximum
per unit time. For the 10% (w/v), 24 8C systems, the IE
values were 0.328, 0.050 h21 for P1, and K-II2, respectively.
A high IE value reflects rapid gelation. The gelation time,
defined as the time where G0 ¼ G00 (i.e. tand ¼ 1), seems to
increase with an increase in the molecular weight of the
sample; thus the gelation time for P1 and K-II2 were at 6.8
and 43.3 h, respectively (Fig. 8).
Doublier and Wood (1995) reported that partially
hydrolyzed oat gums exhibited gel-like behavior and
speculated that gelation in native oat gum solutions may
be prevented because of high viscosity; in fact, none of
the unhydrolyzed, very high molecular weight oat
b-glucan solutions (Mw 1.2 £ 106) showed any tendency
to form gel. The influence of molecular weight on
gelation kinetics can be explained by the higher mobility
of shorter chains(Doublier and Wood, 1995; Bohm and
Kulicke, 1999b); molecules with smaller molecular size
are more mobile and diffuse more easily, exhibiting a
greater probability of forming aggregates. Similarly, in a
previous study on aggregation kinetics of amylose
aqueous solutions it has been demonstrated that the
initial rate of G0 increase was faster, and the time taken
to reach a pseudoplateau region was less with decreasing
amylose chain length (Clark et al., 1989). A closer look
at the fine structure data of all samples (Table 1), in
relation to the observed gelation rates, did not reveal any
major differences among the samples. It is interesting
also to note that the P1 sample with the greatest tendency
to gel had the lowest proportion of long cellulosic-like
chain segments. It would appear, therefore, that molecu-
lar weight rather than fine structure is the most important
determinant of the gelling behavior for oat b-glucans.
The gelation time and the gelation rate of P1 as a
function of concentration are shown in Fig. 9a. The
gelation rate increased with polymer concentration,
whereas an inverse relationship between concentration
and gelation time was observed; the gelation time of P1
decreased continuously from 8.3 h at 9% (w/v) to 1.8 h
at 14% (w/v). The concentration determines the chain
Fig. 8. Gelation kinetics for two oat b-glucan preparations at 10% (w/v)
(frequency 1 Hz, strain 0.1%, 24 8C).
Fig. 9. Concentration- (at 24 8C, a) and temperature- (at 10% w/v, b)
dependence of gelation kinetics for P1; frequency 1 Hz, strain 0.1%,
IE ¼ (dlog G0/dt)max, gelation time is defined as the time when G0 . G00.
A. Skendi et al. / Journal of Cereal Science 38 (2003) 15–31 25

segment density in polymer solutions, and hence the
probability of contact between the coils, which is a basic
requirement for establishment of a three-dimensional
network. This explains why faster gelation happens when
the polymer concentration increases. Similar observations
have been made by Bohm and Kulicke (1999b) and
Clark et al. (1989) for barley b-glucans and amylose
gels, respectively.
It has been proposed that the gelation or setting time is
inversely proportional to the initial gelation rate (Oakenfull
and Scott, 1986, 1988). A gel is typified by its nearly
frequency-independent storage modulus (plateau modulus)
G0max that is related to the number of cross-links in the
network structure:
G0max ¼ cRT =Me
where c, concentration; R, gas constant; T, absolute
temperature, Me, molar mass between two cross-links.
According to this relationship, the larger the G0max, the
smaller the entanglement molar mass; i.e., the higher
the cross-link density. When the experimental data of
G0max vs. concentration were fitted into an empirical
quadratic equation (r 2 ¼ 0.96), an estimate of 8.4% (w/v)
for the ‘critical gelling concentration’ was obtained by
extrapolation of this function.
The effect of temperature on the gelation time and rate
for P1 b-glucan dispersions (10% w/v) is illustrated in
Fig. 9b. Increasing storage temperatures from 2 to 45 8C first
decreased the gelation time and then increased it; a
minimum plateau was observed in the range of 18–37 8C.
In contrast, the IE increased with increasing temperature,
and reached a maximum at 32 8C with a value of 0.39 h21.
Further increases in temperature from 32 to 45 8C resulted in
a decline of IE. A similar behavior for barley b-glucans
gelation was observed by Bohm and Kulicke (1999b).
These researchers compared the temperature dependence of
crystallite growth rate from polymer melts with that from
the elasticity increment, IE, of the b-glucan gels and
concluded that the gelation of (1 ! 3)(1 ! 4)-b-glucans
could be described in terms of a sporadic nucleation
mechanism similar to crystallization kinetics from polymer
melts. In polymer melts, sporadic nucleus formation is zero
above the melting point and it starts to increase with
supercooling. Further lowering of the temperature
diminishes molecular motion and, at the glass transition
temperature, nucleus formation becomes again zero.
Fig. 10 shows the evolution of storage (G0) modulus of
K-II2 and P1 b-glucan gels (10% w/v) during heating at a
constant heating rate (3 8C/min), measured with a strain of
0.1% and a frequency of 1 Hz. Compared to the one-step
transition for the K-II2, a two-step drop in the storage
modulus (G0) was observed for the low molecular weight
sample, possibly reflecting different events that take place
upon heating of the gels. The temperature at which G0 ¼ G00
was defined as the melting temperature of the network.
The melting temperature was higher for the high molecular
weight sample (68.2 8C, K-II2) compared to that for the low
molecular weight sample (62.1 8C, P1). A higher melting
point of structurally similar gels points to a larger extension
of the junction zones and/or a better organization of the
ordered domains in the network structure (Bohm and
Kulicke, 1999b; Flory, 1956).
A direct comparison between the rheological and DSC
data is also made in Fig. 10, although a slightly higher
heating rate for the DSC measurements was employed
(5 8C/min vs. 3 8C/min). The interacting polysaccharide
chain segments at the junction zones make an enthalpic
contribution to the development of the network structure;
i.e. following storage of the b-glucan dispersions, a broad
endothermic gel ! sol transition occurs at 55–75 8C.
Thus, calorimetry provides evidence for the presence of
structural domains in the aging network; estimates of the
melting point and melting enthalpy for P1 gel were 63.3 8C
and 4.98 ^ 0.68 mJ/mg, respectively. These findings are in
agreement with the data of Morgan and Ofman (1998), who
observed an endothermic peak at around 58 8C for Glugagel,
a gelling barley b-glucan preparation. Also, the DSC
thermal events match (temperature range) with the second,
high-temperature drop in G0, suggesting that the first drop in
modulus of the P1 sample simply reflects a loosening of the
network structure (aggregates) without a significant change
in structural order (conformation) of the chain segments
involved in the junction zones.
The melting temperature of b-glucan preparations was
independent of the polysaccharide concentration (10–14%
w/v). On the other hand, the trend in melting temperature for
the P1 gels (10% w/v) obtained at different gel curing
temperatures (between 2 to 45 8C), was an inverse
bell-shape relation, as for the gelation time presented in
Fig. 9b; i.e., low melting temperatures were seen at
Fig. 10. Storage modulus (G0) and heat flow as a function of temperature
during melting of oat b-glucan gels (10% w/v) cured at 24 8C for 92 h.
Conditions for dynamic rheometry: samples P1 and K-II2, strain 0.1%,
frequency 1 Hz, and heating rate of 3 8C/min (rheometer); differential
scanning calorimetry (DSC) of P1 sample with a heating rate of 5 8C/min.
A. Skendi et al. / Journal of Cereal Science 38 (2003) 15–3126

intermediate storage temperatures (12–32 8C). This implies
that conditions favoring a quick gelation result in less
organized gel network structures. Fig. 11 shows the storage
modulus (G0) profile upon heating for P1 gels (10% w/v)
prepared at three different storage temperatures. For systems
obtained at gel curing temperatures less than 32 8C, a
two-step melting was observed, whereas with gel curing at
temperatures above 32 8C the networks exhibited a single
melting transition at higher temperatures.
3.4. Tensile properties of b-glucans films
Fig. 12 illustrates the effect of moisture and sorbitol on
the load-deformation curves of oat b-glucan (K-I2) films,
obtained by tensile tests at 25 8C. With increase of the
moisture and sorbitol (plasticizer) content, the maximum
force at break and the slope of the curves decreased,
whereas the elastic deformation increased, reflecting the
gradual transition from brittle to ductile failure of the
material.
Fig. 13 shows the effect of varying moisture content, and
addition of sorbitol on the mechanical properties of the
films, as calculated from the force–distance curves and
described by the tensile modulus (E), tensile strength (smax)
and percentage elongation. These films were prepared using
two oat b-glucan preparations differing in molecular size.
In general, at low moisture contents, films exhibited high
tensile modulus, high tensile strength, and low elongation
values, at room temperature, typical of glassy materials.
With increasing water content there were gradual decreases
in modulus and tensile strength, and an increase in
elongation for all films. These changes are typical of
polymers going through their glass transition. Also, as
showed in Fig. 13, the addition of sorbitol at 15% (d.b.)
resulted in decreases of E and smax and in a significant
increase of elongation values, especially at high moisture
contents. The effects of water and sorbitol on the
mechanical properties of b-glucan films can be attributed
to their plasticizing properties, as has been shown in
previous studies for many biopolymer systems (Diab et al.,
2001; Biliaderis et al., 1999; Slade and Levine, 1991; Kirby
et al., 1993; Park et al., 1993; Bader and Goritz, 1994;
Lawton, 1996; Le Meste et al., 1996; Van Soest et al.,
1996a,b; Fontanet et al., 1997; Park and Ruckenstein, 2001;
Lazaridou and Biliaderis, 2002). The observed range of
smax values (20–80 MPa) for oat b-glucan films is
comparable to many medium-strength commercial films,
e.g. HPDE and LDPE films (Juran, 1988).
For most of the b-glucan films a bell-shape curve,
describing the relationship between the tensile parameters
(E, smax) and moisture was found (Fig. 13). Such behavior
has been previously reported for mechanical parameters of
foods and their components (Diab et al., 2001; Biliaderis
et al., 1999; Fontanet et al., 1997; Lazaridou and Biliaderis,
2002; Nicholls et al., 1995; Harris and Peleg, 1996).
The most striking feature of these plots is the apparent
increase in stiffness as the moisture rises from 2 to 7%,
whereas the softening/plasticizing effect of water becomes
dominant above this level. Several suggestions have been
made to explain such material toughening on partial
plasticization with water. According to Harris and Peleg
(1996), glassy biopolymers at low moisture are extremely
Fig. 12. Effect of moisture content on load-deformation curves (tensile test)
of K-I2 films: with 15% (w/w) (a) and without added sorbitol (b).
Fig. 11. Storage modulus (G0) as a function of temperature during melting
of P1 gels obtained at different gel curing temperatures; b-glucans at 10%
w/v, strain 0.1%, frequency 1 Hz, heating rate 3 8C/min).
A. Skendi et al. / Journal of Cereal Science 38 (2003) 15–31 27

brittle and very fragile, offering no resistant to applied load.
With low levels of hydration, the plasticized matrix
becomes more cohesive, more structural elements remain
intact (offering more resistance to fracture), and the material
would deform rather than disintegrate on compression.
For extruded flat bread, Fontanet et al. (1997) have ascribed
the hardening phenomenon to short range reorganization of
the material as a result of increased molecular mobility by
adding small amounts of water.
Moreover, the examination of the data for the tensile
parameters of Fig. 13 revealed that E, smax, and elongation
values (the latter at high moisture levels) are higher for the
high molecular weight sample (K-I2) compared to those of
the low molecular weight sample (P2) at certain moisture
and sorbitol levels. Similar observations have been made for
other biopolymers. For methyl cellulose and hydroxypropyl
cellulose, Park et al. (1993) have shown an increase of
tensile strength and elongation as the molecular weight
of cellulose increased, whereas for thermoplastic starch
Van Soest et al. (1996b) have reported an increase of
elongation with molecular weight, but no significant
influence on tensile modulus and tensile strength.
In previous studies on synthetic polymers, a possible
mechanism for increasing the apparent modulus with
molecular weight has been suggested by Kennedy et al.
(1994, 1995). Focusing on the interlamellar (amorphous)
Fig. 13. Effect of moisture content and sorbitol at 15% (w/w) on Young modulus, tensile strength and elongation of edible films made from two oat b-glucan
preparations (K-I2, P2).
A. Skendi et al. / Journal of Cereal Science 38 (2003) 15–3128
region of linear polymers, these researchers ascribed this
behavior to an increased number of chain entanglements per
molecule with increasing chain length; as a disordered chain
moves or slips through the impediment of entanglements, its
apparent modulus will increase with molecular weight.
Van Soest et al. (1996b) examined two different molecular
weight grades of extruded thermoplastic starch and found
higher elongation values in the rubbery state for the sample
with the higher molecular weight.
4. Conclusions
Aqueous extractions of whole oat flours at relatively low
temperatures yielded low molecular weight oat b-glucans.
Further purification of the preparations by adjusting the pH
of the b-glucans solutions to 4.5 resulted in materials of
lower protein content and with even lower molecular
weight. The present study revealed that cultivar type had
an impact on the molecular characteristics of the isolated oat
b-glucans. b-Glucans from Pallini cultivar (A. sativa)
showed smaller molecular weight and limiting viscosity
values, compared to the preparations from Kassandra
cultivar (A. bysantina). For the isolated b-glucans, the
general structural features, as revealed by 13C-NMR and
lichenase treatment-HPAEC analyses, were typical of
mixed linkage cereal b-glucans and did not show great
variations among the two cultivars and the different
preparations examined. Differences in the critical concen-
trations (c* and c**), viscosity and shear thinning properties
as well as gelling potential among the samples can be
mainly explained in terms of differences in molecular size of
the polymeric preparations. Apart from the dynamic
rheological measurements, melting of the gel network was
also detectable by calorimetry. The b-glucans seemed to be
a promising film-forming hydrocolloid, which could be
potentially useful as a biodegradable edible food packaging
material. The physicochemical properties of b-glucan films
under tensile deformation were found to be dependent on the
molecular weight of the polymer and the plasticizer (water
and sorbitol) content. Sorbitol, added as a co-plasticizer,
improved the extensibility, but decreased the mechanical
strength of the film. Further studies are needed to explore in
detail the relationships among the molecular/structural
features, species-cultivar effects and the rheological proper-
ties of oat b-glucans.
Acknowledgements
This work has been carried with the financial support from
the Commission of the European Communities, project
QLKI-CT-2000–00535 ‘Design of Foods with Improved
Functionality and Superior Health Effects Using Cereal
Beta-Glucans’. It does not necessarily reflect its views and in
no way anticipates the Commission’s future policy in this
area. A. Skendi also acknowledges the receipt of a fellowship
from MAICH during the course of her M.Sc. studies.
References
Andrade, C.T., Azero, E.G., Luciano, L., Goncalves, M.P., 1999. Solution
properties of the galactomannans extracted from the seeds of
Caesalpinia pulcherrima and Cassia javanica: comparison with locust
bean gum. International Journal of Biological Macromolecules 26,
181–185.
ASTM. Annual Book of ASTM Standards, D828-88. American Society for
Testing and Materials, Philadelphia, USA. (1989).
Autio, K., 1988. Rheological properties of solutions of oat b-glucans. In:
Phillips, G.O., Wedlock, D.J., Williams, P.A. (Eds.), Gums and
Stabilizers for the Food Industry 4, IRL Press, Oxford, Washington
DC, pp. 483–488.
Bader, H.G., Goritz, D., 1994. Investigations on high amylose corn starch
films. Starch 46, 435–439.
Biliaderis, C.G., Lazaridou, A., Arvanitoyannis, I., 1999. Glass transition
and physical properties of polyol-plasticised pullulan-starch blends at
low moisture. Carbohydrate Polymers 40, 29–47.
Bohm, N., Kulicke, W.M., 1999a. Rheological studies of barley
(1 l 3)(1 l 4)-b-D-glucan in concentrated solution: investigation of
the viscoelastic flow behaviour in the sol state. Carbohydrate Research
315, 293–301.
Bohm, N., Kulicke, W.M., 1999b. Rheological studies of barley
(1 ! 3)(1 ! 4)-b-D-glucan in concentrated solution: mechanistic and
kinetic investigation of the gel formation. Carbohydrate Research 315,
302–311.
Braaten, J.T., Wood, P.J., Scott, F.W., Wolynetz, M.S., Lowe, M.K.,
Bradley-White, P., Collings, M.W., 1994. The effect of oat gum on
serum cholesterol levels of hypercholesterolemic subjects. European
Journal of Clinical Nutrition 48, 465–474.
Cherian, G., Gennadios, A., Weller, C., Chinachoti, P., 1995. Thermo-
mechanical behavior of wheat gluten films: effect of sucrose, glycerin,
and sorbitol. Cereal Chemistry 72, 1–6.
Clark, A.H., Gidley, M.J., Richardson, R.K., Ross-Murphy, S.B., 1989.
Rheological studies of aqueous amylose gels: the effect of chain length
and concentration on gel modulus. Macromolecules 22, 346–351.
Cox, W.P., Merz, E.H., 1958. Correlation of dynamic and steady shear flow
viscosities. Journal of Polymer Science 28, 619–622.
Cui, S.W., 2001. Polysaccharides gums from agricultural products:
processing, structure and functionality, Technomic Publishing Com-
pany Inc, Lancaster, USA.
Cui, W., Wood, P.J., 2000. Relationships between structural features,
molecular weight and rheological properties of cereal b-D-glucan. In:
Nishinari, K., (Ed.), Hydrocolloids—Part 1, Elsevier Science BV,
Amsterdam, pp. 159–168.
Cui, W., Wood, P.J., Blackwell, B., Nikiforuk, J., 2000. Physicochemical
properties and structural characterization by two-dimensional
NMR spectroscopy of wheat b-D-glucan—comparison with other
cereal b-D-glucans. Carbohydrates Polymers 41, 249–258.
Cuvelier, G., Launay, B., 1986. Concentration regimes in xanthan gum
solutions deduced from flow and viscosity properties. Carbohydrate
Polymers 6, 321–333.
Dais, P., Perlin, A.S., 1982. High-field C-NMR spectroscopy ofb-D-glucans,
amylopectin, and glycogen. Carbohydrate Research 100, 103–116.
Diab, T., Biliaderis, C.G., Gerasopoulos, D., Sfakiotakis, E., 2001.
Physicochemical properties and application of pullulan edible films
and coatings in fruit preservation. Journal of the Science of Food and
Agriculture 81, 988–1000.
Doublier, J.L., Wood, P.J., 1995. Rheological properties of aqueous
solutions (1 ! 3)(1 ! 4)-b-D-glucan from oats (Avena Sativa L.).
Cereal Chemistry 72, 335–340.
A. Skendi et al. / Journal of Cereal Science 38 (2003) 15–31 29

Ferry, J.D., 1960. Viscoelastic properties of polymers, John Wiley & Sons
Inc, New York.
Fincher, G.B., Stone, B.A., 1986. Cell walls and their components in cereal
grain technology. In: Pomeraz, Y., (Ed.), Advances in Cereal Science
and Technology, American Association of Cereal Chemists, St. Paul,
MN, pp. 207–295.
Flory, P.J., 1956. Principles of Polymer Chemistry, Cornell Univesity
Press, Ithaka and London.
Fontanet, I., Davidou, S., Dacremont, C., Le Meste, M., 1997. Effect of
water on the mechanical behaviour of the extruded flat bread. Journal of
Cereal Science 25, 303–311.
Gomez, C., Navarro, A., Manzanares, P., Horta, A., Carbonell, J.V., 1997.
Physical and structural properties of barley (1 l 3)(1 l 4)-b-D-
glucan. Part II. Viscosity, chain stiffness and macromolecular
dimensions. Carbohydrate Polymers 32, 17–22.
Harris, M., Peleg, M., 1996. Patterns of textural changes in brittle cellular
cereal foods caused by moisture sorption. Cereal Chemistry 73,
225–231.
Inglett, G.E., 1990. USDA’s oatrim replaces fat in many food products.
Food Technology 44, 100.
Inglett, G.E., Grisamore, S.B., 1991. Maltodextrin fat substitude lowers
cholesterol. Food Technology 45, 104.
Inglett, G.E., Warner, K., 1992. Amylodextrin containing b-glucan from
oats as a fat substitute in some cookies and candies. Cereal Foods World
37, 589.
Izydorczyk, M.S., Biliaderis, C.G., 1992. Effect of molecular size on
physical properties of wheat arabinoxylan. Journal of Agricultural and
Food Chemistry 40, 561–568.
Izydorczyk, M.S., Biliaderis, C.G., 2000. Structural and functional aspects of
cereal arabinoxylans and b-glucans. In: Doxastakis, G., Kiosseoglou, V.
(Eds.), Novel Macromolecules in Food Systems, Elsevier Science BV,
Amsterdam, pp. 361–384.
Jacon, S.A., Rao, M.A., Cooley, H.J., Walter, R.H., 1993. The isolation and
characterization of a water extract of konjac flour gum. Carbohydrate
Polymers 20, 35–41.
Johansson, L., Virkki, L., Maunu, S., Lehto, M., Ekholm, P., Varo, P., 2000.
Structural characterization of water soluble b-glucan of oat bran.
Carbohydrate Polymer 42, 143–148.
Juran, R., 1988. Modern Plastics Encyclopedia, McGraw-Hill, New York,
pp. 550–559.
Kahlon, T.S., Chow, F.I., Knuckles, B.E., Chiu, M.M., 1993. Cholesterol-
lowering effects in hamsters of b-glucan-enriched barley fraction,
dehulled whole barley, rice bran, and oat bran and their combinations.
Cereal Chemistry 70, 435–440.
Kalra, S., Jood, S., 2000. Effect of dietary barley b-glucan on cholesterol
and lipoprotein fractions in rats. Journal of Cereal Science 31,
141–145.
Kasapis, S., Morris, E.R., Gross, M., Rudolph, K., 1994. Solution
properties of levan polysaccharide from Pseudomonas syringae pv.
phaseolicola, and its possible primary role as a blocker of
recognition during pathogenesis. Carbohydrate Polymers 23, 55–64.
Kennedy, M.A., Peacock, A.J., Mandelkern, L., 1994. Tensile properties of
crystalline polymers: linear polyethylene. Macromolecules 27,
5297–5310.
Kennedy, M.A., Peacock, A.J., Failla, M.D., Lucas, J.C., Mandelkern, L.,
1995. Tensile properties of crystalline polymers: random copolymers of
ethylene. Macromolecules 28, 1407–1421.
Kester, J.J., Fennema, O.R., 1986. Edible films and coatings: a review. Food
Technology 40, 47–59.
Kirby, A.R., Clark, S.A., Parker, R., Smith, A.C., 1993. The deformation
and failure behaviour of wheat starch plasticized with water and
polyols. Journal of Materials Science 28, 5937–5942.
Klopfenstein, C.F., 1988. The role of cereal beta-glucans in nutrition and
health. Cereal Foods World 33, 883–886.
Krochta, J.M., De Mulder-Johnston, C., 1997. Edible biodegradable
polymer films: challenges and opportunities. Food Technology 51,
61–74.
Lapasin, R., Pricl, S., 1999. Rheology of industrial polysaccharides:
theory and applications, Aspen Publishers, Inc, Gaithersburg, US.
Lawton, J.W., 1996. Effect of starch type on the properties of starch
containing films. Carbohydrate Polymers 29, 203–208.
Lazaridou, A., Biliaderis, C.G., 2002. Thermophysical properties of
chitosan, chitosan-starch and chitosan-pullulan films near the glass
transition. Carbohydrate Polymers 48, 179–190.
Le Meste, M., Roudaut, G., Davidou, S., 1996. Thermomechanical
properties of glassy cereal foods. Journal of Thermal Analysis 47,
1361–1375.
Lowry, O.H., Rosebrough, N.J., Farr, A.L., Randall, R.J., 1951. Protein
measurement with the Folin phenol reagent. Journal of Biological
Chemistry 193, 265–275.
McCleary, BV, Glennie-Holmes, M., 1985. Enzymic quantification of
(1 . 3)(1 . 4)-b-D-glucan in barley and malt. Jounal of The Institute
of Brewing 91, 285–295.
Miller, S.S., Wood, P.J., Pietrzak, L.N., Fulcher, R.G., 1993. Mixed linkage
b-glucan. Protein content, and kernel weight in Avena species.
Cereal Chemistry 70, 231–233.
Morgan, K.R., Ofman, D.J., 1998. Glucagel, a gelling b-glucan from
barley. Cereal Chemistry 75, 879–881.
Morris, E.R., 1984. Applications of hydrocolloids. In: Phillips, G.O.,
Wedlock, D.J., Williams, P.A. (Eds.), Gums and Stabilizers for the
Food Industry 20, Pergamon Press, Oxford, UK, pp. 57–78.
Morris, E.R., Cutler, A.N., Ross-Murphy, S.B., Rees, D.A., Price, J., 1981.
Concentration and shear rate dependence of viscosity in random coil
polysaccharide solutions. Carbohydrate Polymers 1, 5–21.
Ndjouenkeu, R., Goycoolea, F.M., Morris, E.R., Akingbala, J.O., 1996.
Rheology of okra (Hibiscus esculentus L.) and dika nut
(Irvingia gabonensis) polysaccharides. Carbohydrate Polymers 29,
263–269.
Newman, R.K., Newman, C.W., Graham, H., 1989. The hypocholes-
teromic function of barley b-glucans. Cereal Foods World 34,
883–886.
Nicholls, R.J., Appelqvist, I.A.M., Davies, A.P., Ingman, S.J., Lillford, P.J.,
1995. Glass transitions and the fracture behaviour of gluten and starches
within the glassy state. Journal of Cereal Science 21, 25–36.
Oakenfull, D.G., Scott, A., 1986. New approaches to the investigation of
food gels. In: Phillips, G.O., Wedlock, D.J., Williams, P.A. (Eds.),
Gums and stabilizers for the food industry 30, Elsevier Applied Science,
London, pp. 465–475.
Oakenfull, D.G., Scott, A., 1988. Size and stability of the junction zones in
gels of iota and kappa carrageenan. In: Phillips, G.O., Wedlock, D.J.,
Williams, P.A. (Eds.), Gums and Stabilizers for the Food Industry 40,
IRL Press, Oxford, pp. 127–134.
Park, J.S., Ruckenstein, E., 2001. Viscoelastic properties of plasticized
methylcellulose and chemically crosslinked methycellulose. Carbo-
hydrate Polymers 46, 373–381.
Park, H.J., Weller, C.L., Vergano, P.J., Testin, R.F., 1993. Permeability and
mechanical properties of cellulose-based films. Journal of Food
Science, 1361–1364, 1370.
Shinnick, F.L., Marlet, J.A., 1993. Physiological responses to dietary oats in
animal models. In: Wood, P.J., (Ed.), Oat bran, American Association
of Cereal Chemists, St. Paul, MN, pp. 113–137.
Slade, L., Levine, H., 1991. Beyond water activity: recent advances based
on an alternative approach to the assessment of food quality and safety.
CRC Critical Reviews in Food Science and Nutrition 30, 115–360.
Staudte, R.G., Woodward, J.R., Fincher, G.B., Stone, B.A., 1983.
Water soluble (1 ! 3)(1 ! 4)-b-D-glucans from barley (Hordeum
vulgare) endosperm. III. Distribution of cellotriosyl and cellotetraosyl
residues. Carbohydrate Polymers 3, 299–312.
Van Soest, J.J.G., De Wit, D., Vliegenthart, J.F.G., 1996a. Mechanical
properties of thermoplastic waxy maize starch. Journal of Applied
Polymer Science 61, 1927–1937.
Van Soest, J.J.G., Benes, K., De Wit, D., 1996b. The influence of starch
molecular mass on the properties of extruded thermoplastic starch.
Polymer 37, 3543–3552.
A. Skendi et al. / Journal of Cereal Science 38 (2003) 15–3130

Varum, K.M., Smidsrod, O., 1988. Partial chemical and physical
characterization of (1 ! 3),(1 ! 4)-beta-glucans from oat
(Avena Sativa L.) aleurone. Carbohydrate Polymers 9, 103–117.
Wang, Q., Wood, P.J., Cui, W., 2002. Microwave assisted dissolution of
b-glucan in water-implications for the characterization of this polymer.
Carbohydrate Polymers 47, 35–38.
Wood, P.J., 1986. Oat b-glucan: structure, location and properties. In:
Webster, F.H., (Ed.), Oats: Chemistry and Technology, American
Association of Cereal Chemists, St. Paul, MN, pp. 121–152.
Wood, P.J., 1991. Oat b-glucan-physicochemical properties and
physiological effects. Trends in Food Science & Technology 2,
311–314.
Wood, P.J., Weisz, J., Blackwell, B.A., 1991. Molecular characterization of
cereal b-D-glucans structural analysis of oat b-D-glucan and
rapid structural evaluation of b-D-glucans from different sources by
high-performance liquid chromatography of oligosaccharides released
by lichenase. Cereal Chemistry 68, 31–39.
Wood, P.J., Braaten, J.T., Scott, F.W., Riedel, K.D., Wolynetz, M.S.,
Collings, M.W., 1994b. Effect of dose and modification of viscous
properties of oat gum on plasma glucose and insulin following an oral
glucose load. British Journal of Nutrition 72, 731–743.
Wood, P.J., Weisz, J., Blackwell, B.A., 1994c. Structural studies of
(1 ! 3)(1 ! 4)-b-D-glucans by 13C-nuclear magnetic resonance spec-
troscopy and by rapid analysis of cellulose-like regions using high-
performance anion-exchange chromatography of oligosaccharides
released by lichenase. Cereal Chemistry 71, 301–307.
Wood, P.J., Erfle, J.D., Teather, R.M., Eisz, J., Miller, S.S.,
1994a. Comparison of (1-3), (1-4)-b-D-glucan-4-glucanohydrolase
(E.C. 3.2.1.73) from Fibrobacter succinogen and from Bacillus
subtilis and use of high-performance anion-exchange chromatography
in product characterization. Journal of Cereal Science 19, 65–75.
Woodward, J.R., Fincher, G.B., Stone, B.A., 1983. Water soluble
(1 ! 3)(1 ! 4)-b-D-glucans from barley (Hordeum vulgare) endo-
sperm. II. Fine structure. Carbohydrate Polymers 3, 207–225.
Zhang, L., Ding, Q., Meng, D., Ren, L., Yang, G., Liu, Y., 1999.
Investigation of molecular masses and aggregation of b-D-glucan from
Poria cocos sclerotium by size-exclusion chromatography. Journal of
Chromatography A 839, 49–55.
A. Skendi et al. / Journal of Cereal Science 38 (2003) 15–31 31
Related Documents