Structure and Dimensions of Economy Courtesy School of Management, NIT Rourkela MBA (Finance) and Ph.D (Finance Management) Lectures

Welcome message from author
This document is posted to help you gain knowledge. Please leave a comment to let me know what you think about it! Share it to your friends and learn new things together.
Transcript

Structure and Dimensions of Economy
Courtesy
School of Management, NIT Rourkela
MBA (Finance) and Ph.D (Finance Management)
Lectures

Learning Objectives
• Understand the Structure and Dimensions of Economy• Agriculture Sector
• Industry Sector
• Service Sector

Some Statistics on Indian Economy
Tenth-largest in the world by nominal GDP
Third-largest by purchasing power parity (PPP)
One of the G-20 major economies
A member of BRICS
A developing economy that is among the top 20 global traders as per WTO
19th-largest merchandise and the 6th largest services exporter in the world in 2013
Source: http://en.wikipedia.org/wiki/Economy_of_India

Sector Summary
IndicatorsIndia's Real GDP Growth
Rates
Agriculture growth (%)
Industry growth (%)
Services growth (%)
1999-2K 8 2.67 5.96 12.05
2000-01 4.15 -0.01 6.03 5.07
2001-02 5.39 6.01 2.61 6.61
2002-03 3.88 -6.6 7.21 6.74
2003-04 7.97 9.05 7.32 7.89
2004-05 7.05 0.18 9.81 8.28
2005-06 9.48 5.14 9.72 10.91
2006-07 9.57 4.16 12.17 10.06
2007-08 9.32 5.8 9.67 10.27
2008-09 6.72 0.09 4.44 9.98
2009-10 8.59 0.81 9.16 10.5
2010-11 8.91 8.6 7.55 9.67
2011-12 6.69 5.02 7.81 6.57
2012-13 4.47 1.42 0.96 6.96
2013-14 4.74 4.71 0.35 6.78
Source: http://planningcommission.nic.in/data/datatable/data_2312/DatabookDec2014%201.pdf

Agriculture
• India ranks second worldwide in farm output.• Agriculture and allied sectors like forestry, logging and fishing
accounted for 17% of the GDP and employed 51% of the totalworkforce in 2012.
• Agriculture's contribution to GDP has steadily declined from 1951 to2011
• It is still the largest employment source and a significant piece of theoverall socio-economic development of India.
• Crop yield per unit area of all crops have grown since 1950, since thegreen revolution in India due to the
• Special emphasis placed on agriculture in the five-year plans• Steady improvements in irrigation, technology, application of
modern agricultural practices• Provision of agricultural credit and subsidies.
• International comparisons reveal the average yield in India isgenerally 30% to 50% of the highest average yield in the world.
Agriculture
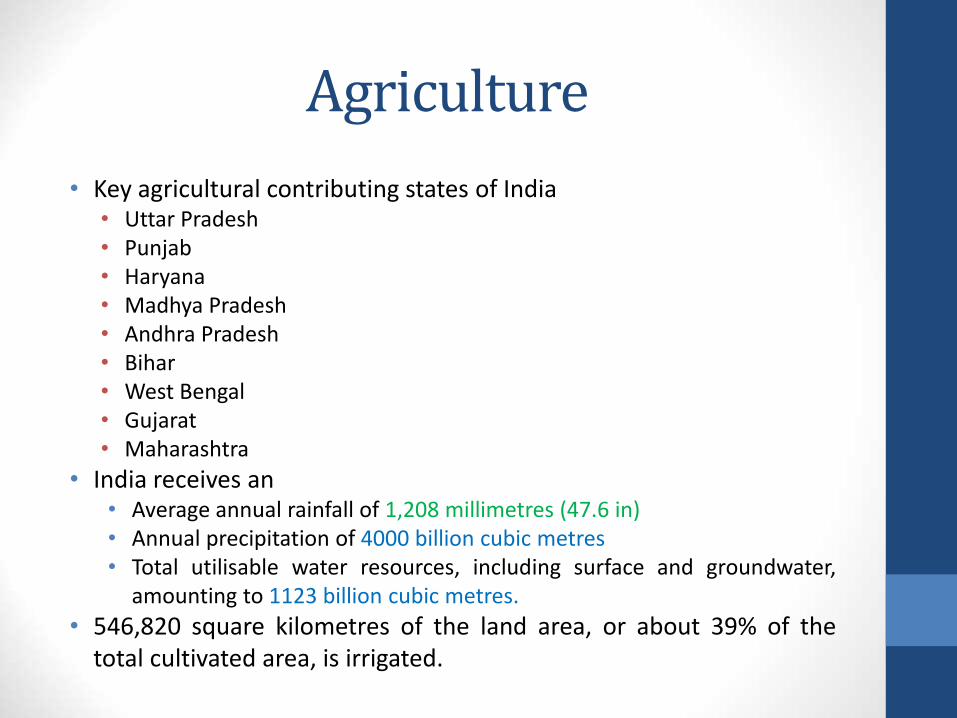
• Key agricultural contributing states of India• Uttar Pradesh• Punjab• Haryana• Madhya Pradesh• Andhra Pradesh• Bihar• West Bengal• Gujarat• Maharashtra
• India receives an• Average annual rainfall of 1,208 millimetres (47.6 in)• Annual precipitation of 4000 billion cubic metres• Total utilisable water resources, including surface and groundwater,
amounting to 1123 billion cubic metres.
• 546,820 square kilometres of the land area, or about 39% of thetotal cultivated area, is irrigated.

Agriculture
• India's inland water resources including rivers, canals, ponds and lakes andmarine resources comprising the east and west coasts of the Indian oceanand other gulfs and bays provide employment to nearly six million people inthe fisheries sector.
• In 2008, India is the World’s
• largest producer in the world of milk, jute and pulses
• second largest cattle population with 175 million animals
• second largest producer of rice, wheat, sugarcane, cotton and groundnuts (10.9% ofworld production)
• second largest fruit and vegetable producer (8.6% of world production)
• third largest fishing industry
• India is also the second largest producer and the largest consumer of silk inthe world, producing 77,000 tons in 2005.
• India exports several agriculture products, such as Basmati rice, wheat,cereals, spices, fresh fruits, dry fruits, buffalo beef meat, cotton, tea, coffeeand other cash crops particularly to the Middle East, Southeast and East Asiancountries. It earns about 10 percent of its export earnings from this trade.

Industry
• Industry accounts for 26% of GDP and employs 22% of the totalworkforce.
• According to the World Bank, India's industrial manufacturing GDPoutput in 2012 was• 10th largest in the world on current US dollar basis ($239.5 billion)• 9th largest on inflation adjusted constant 2005 US dollar basis ($197.1
billion).
• The Indian industrial sector underwent significant changes as aresult of the economic liberalisation in India due to economicreforms of 1991, which• Removed import restrictions• Brought in foreign competition• Led to the privatisation of certain government owned public sector
industries• Liberalised the FDI regime,• Improved infrastructure and• Led to an expansion in the production of fast moving consumer goods

Industry
• Post-liberalisation, the Indian private sector was faced withincreasing domestic as well as foreign competition, includingthe threat of cheaper Chinese imports.
• It has since handled the change by squeezing costs, revampingmanagement, and relying on cheap labour and newtechnology.
• However, this has also reduced employment generation evenby smaller manufacturers who earlier relied on relativelylabour-intensive processes.

Service Sector
• The service sector consists of the "soft" parts of the economy
• It includes activities where people offer their knowledge and time toimprove Productivity, Performance, Potential, Sustainability.
• It is termed affective labor
• The basic characteristic of this sector is the production of services insteadof end products.
• Services (also known as "intangible goods") include attention, advice,access, experience, and discussion.
• The production of information is generally also regarded as a service, butsome economists now attribute it to a fourth sector, the quaternary sector.
Service Sector
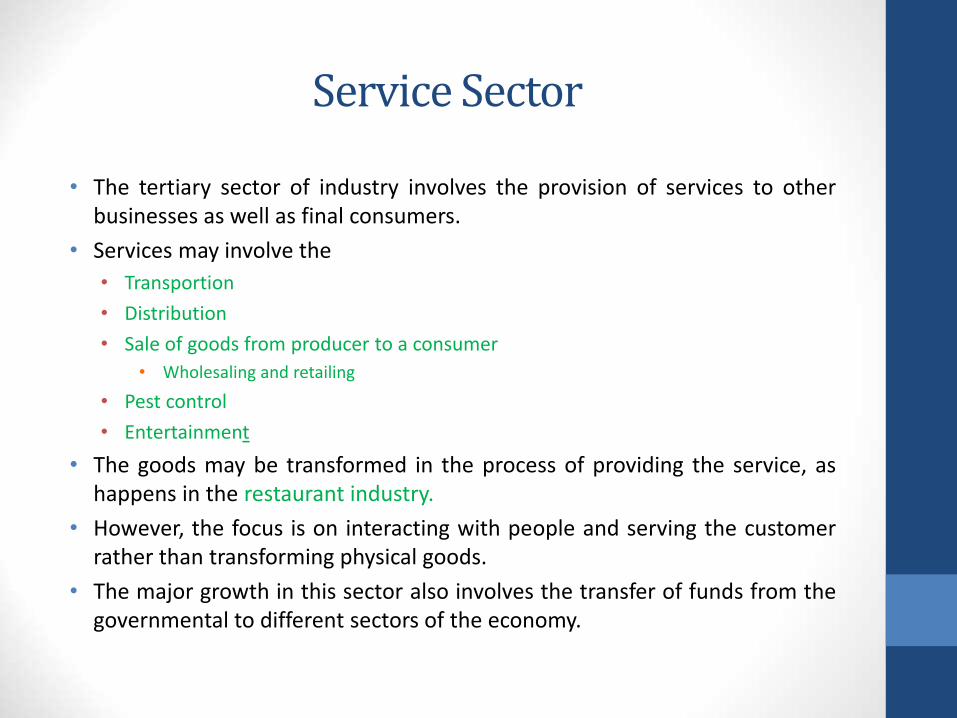
• The tertiary sector of industry involves the provision of services to otherbusinesses as well as final consumers.
• Services may involve the
• Transportion
• Distribution
• Sale of goods from producer to a consumer
• Wholesaling and retailing
• Pest control
• Entertainment
• The goods may be transformed in the process of providing the service, ashappens in the restaurant industry.
• However, the focus is on interacting with people and serving the customerrather than transforming physical goods.
• The major growth in this sector also involves the transfer of funds from thegovernmental to different sectors of the economy.

Service Sector
• For the last 100 years, there has been a substantial shift from the primaryand secondary sectors to the tertiary sector in industrialised countries.
• This shift is called tertiarisation.
• The tertiary sector is now the largest sector of the economy in the Westernworld, and is also the fastest-growing sector.
• In examining the growth of the service sector in the early Nineties,the globalist Kenichi Ohmae noted that:
• "In the United States 70 percent of the workforce worksin the service sector; in Japan, 60 percent, and in Taiwan,50 percent. These are not necessarily busboys and live-inmaids. Many of them are in the professional category.They are earning as much as manufacturing workers, andoften more.”
Service Sector
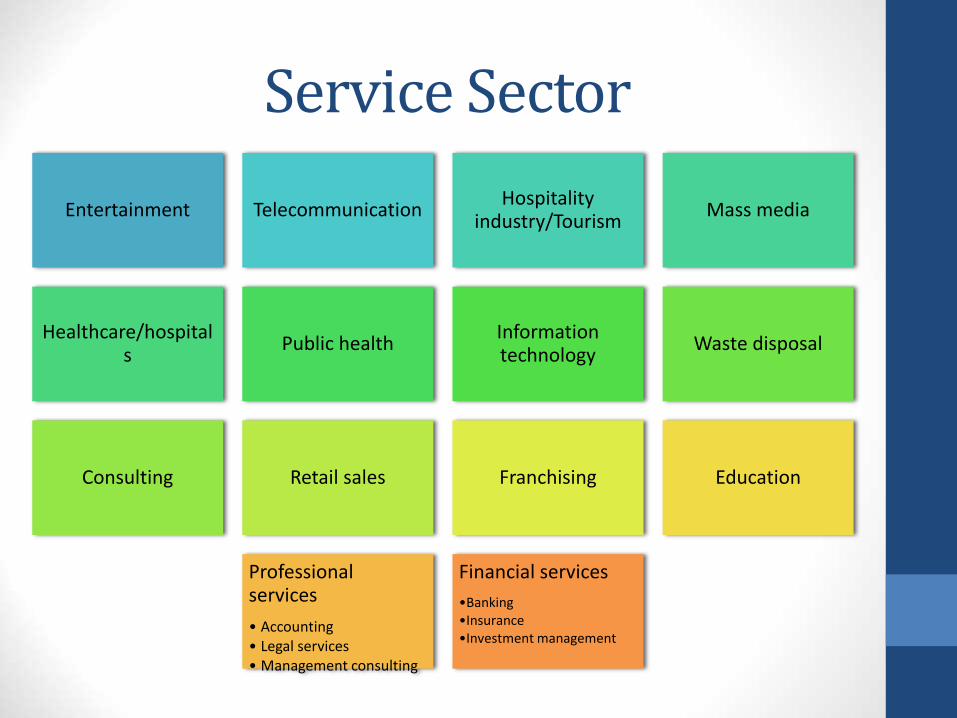
Entertainment TelecommunicationHospitality
industry/TourismMass media
Healthcare/hospitals
Public healthInformation technology
Waste disposal
Consulting Retail sales Franchising Education
Professional services
• Accounting• Legal services• Management consulting
Financial services
•Banking•Insurance•Investment management

China's services sector grows fastest in last three months
• New orders remained strong
• Chinese factories werestruggling at the end of 2014,suggesting a further loss ineconomic momentum.
• Measures taken• Liquidity injections by the central
bank
• Interest rate cuts
• Educations in the amount ofreserves banks must hold toencourage them to lend
• Relatively loosening policy stanceto lift growth
Sources: http://businesstoday.intoday.in/story/china-services-sector-in-december-grows-fastest-in-three-months/1/214261.html

Services sector sees moderate expansion in December: HSBC Survey
• Services sector activity in India expanded in December, but at a slower pace as firms received lesser number of new orders as compared to November 2014.
• staffing levels in the Indian service sector increased
• Business confidence strengthened in December, despite slowdowns in growth of activity and new orders. -

FDI in Services Sector Dips 7.5 Percent to $1.22 Bn in Apr-Sept 2014
• Foreign Direct Investment (FDI) in the country’s services sector fell 7.5 percent to $1.22 billion during the first half of the current fiscal, according todata published by the Department of Industrial Policy and Promotion (DIPP).
• The sector contributes about 60 per cent to India’s GDP in the past twoyears.
• Owing to slowdown in the economy, foreign investment in the servicessector has been losing steam. the FDI inflows into the sector fell
• In 2013-14, $2.2 billion
• In 2012-13., $4.83 In billion
• Similarly, the services sector comprising verticals like banking, insurance,outsourcing, R&D, courier and technology testing, had received FDI worth$1.32 billion during April-September 2013-14.
• Non-services sectors that have witnessed a decline in foreign investmentduring the first quarters of the financial year include construction andmetallurgical industries.
http://www.newindianexpress.com/business/news/FDI-in-Services-Sector-Dips-7.5-Percent-to-1.22-Bn-in-Apr-Sept/2014/12/22/article2582969.ece
FDI in Services Sector Dips 7.5 Percent to $1.22 Bn in Apr-Sept 2014
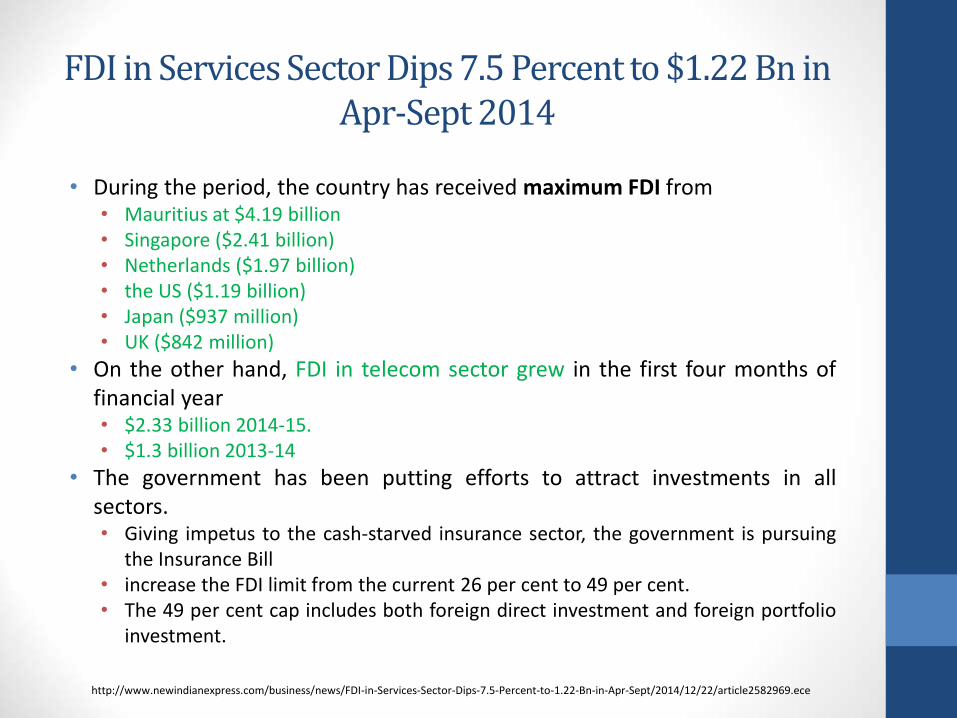
• During the period, the country has received maximum FDI from• Mauritius at $4.19 billion• Singapore ($2.41 billion)• Netherlands ($1.97 billion)• the US ($1.19 billion)• Japan ($937 million)• UK ($842 million)
• On the other hand, FDI in telecom sector grew in the first four months offinancial year• $2.33 billion 2014-15.• $1.3 billion 2013-14
• The government has been putting efforts to attract investments in allsectors.• Giving impetus to the cash-starved insurance sector, the government is pursuing
the Insurance Bill• increase the FDI limit from the current 26 per cent to 49 per cent.• The 49 per cent cap includes both foreign direct investment and foreign portfolio
investment.
http://www.newindianexpress.com/business/news/FDI-in-Services-Sector-Dips-7.5-Percent-to-1.22-Bn-in-Apr-Sept/2014/12/22/article2582969.ece

Industry waits for speedy implementation of reforms
• Many in the steel industry would have waited for the year to be over as early as possible.
• Prices are down by 7-9% particularly in the last 3 months and there is no sign for an early recovery.
• The main worries of steel players hovered around an easy flow of raw materials, Iron Ore and Coal.
• The year witnessed a historical decision of SC to cancel all coal block allocations numbering around 214 since 1993. The decision itself speaks volume of the enormity of corruption that engulfed the mining industry.
• Government plans to remove barriers to investment in infrastructure and production growth in mining.

Will Maharashtra sweeten the story for sugar industry?
• Indian sugar industry has pinned its hopes on Maharashtra in order to bring good days for the sector.
• If the top-ranking sugar producer, produces more ethanol this year, it can result in lesser sugar production, which in turn will help improve prices of the sweetener.
• In 2013-14, Maharashtra had contracted only for one fourth of the ethanol that Uttar Pradesh had contracted.
• Ethanol production capacity in Maharashtra is 75 crore litre

Made in India: Manufacturing is the best route to development
• There should be • duty cuts
• easier land acquisition norms
• fiscal incentives for research and development especially in sectors like defence.
• Comprehensive gold policy including mining, gold metal loans
• setting up of special economic zones for sale of rough diamonds by mining firms.
To boost manufacturing growth under 'Make in India' programme, industry leaders and top government officials have suggested PM Mr. Narendra Modi
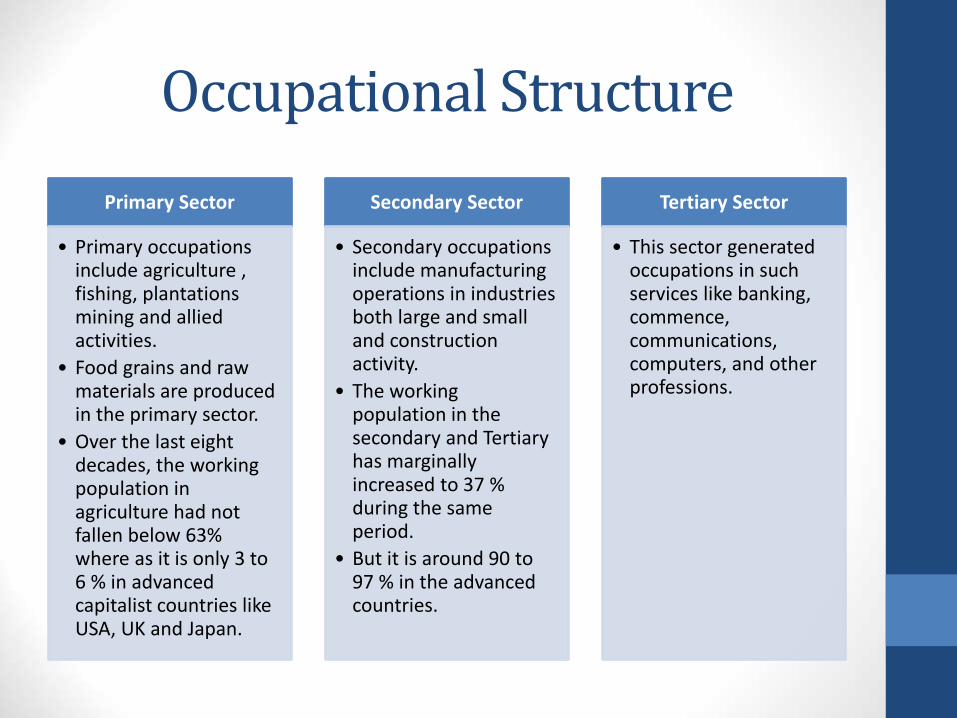
Occupational Structure
Primary Sector
• Primary occupations include agriculture , fishing, plantations mining and allied activities.
• Food grains and raw materials are produced in the primary sector.
• Over the last eight decades, the working population in agriculture had not fallen below 63% where as it is only 3 to 6 % in advanced capitalist countries like USA, UK and Japan.
Secondary Sector
• Secondary occupations include manufacturing operations in industries both large and small and construction activity.
• The working population in the secondary and Tertiary has marginally increased to 37 % during the same period.
• But it is around 90 to 97 % in the advanced countries.
Tertiary Sector
• This sector generated occupations in such services like banking, commence, communications, computers, and other professions.

Categories of
economic activities
Ricardo sector
High Technology
sector
Heckscher-Ohlin
sectors

Ricardo sectors
Ricardo sectors are those which use natural resources intensively in their production process.
Resource intensive agricultural commodities are the most important factors of production used in the production process of these sectors.
Twenty-seven out of seventy two sectors are regarded as Ricardo sectors.

Ricardo sectors
Production of agricultural crops and other allied activities like
milk and milk products, animal services, forestry and logging,
fishing
Minerals like coal and lignite, crude petroleum and natural gas,
iron ore, metallic and non metallic minerals
Agrobased sectors like sugar and, cotton textiles, jute, mesta, hemp textiles, other textiles, food and beverages, tobacco and tobacco
products, wood and wood products, paper and paper
products etc
The industries like leather products, petroleum products,
cement

HECKSCHER-OHLIN SECTORS:
The sectors that use relatively standardized production technologies are regarded as Heckscher-Ohlin sectors (H-O sectors).
In other words, H-O category contains the sectors which are either capital or labour intensive.
The number of H-O sectors is twenty-two.

HECKSCHER-OHLIN SECTORS:
This category consists of capital intensive sectors like
iron & steel,fertilizers, synthetic fiber and resin, non-ferrous basic metals, rubber
and plastic products etc.
labour intensive sectors like printing and publishing, furniture and fixtures,
miscellaneous manufacturing etc.
Being labour intensive sectors banking and insurance,
transport services, trade, other services and public
administration also find place in this category .

HIGH-TECHNOLOGY SECTORS:
The sectors requiring relatively higher proportion of research and development are included into the second category called High-Technology sectors (H-T sectors).
This category contains most of the sophisticated technology-using manufacturing and these sectors require higher proportion of research and development.
There are all total twenty-three sectors in this category.

HIGH-TECHNOLOGY SECTORS:
sectors like
• Industrial electrical and non-electrical machines
•Electronic equipment
•Transport equipment
•Communication equipment
•Pesticides
•Heavy chemicals
Education and research, medicines and drugs, medical and health,
communication are also regarded as H-T sectors

Overview of the Sectors
RICARDO SECTORS
•Paper and paper products, newsprint
•Other textiles
•Leather products
•Cement
•Other food products and beverages
•Coal tar products
•Cotton textiles
•Petroleum products
•Jute, hemp and mesta textiles
•Animal services
•Other non metallic mineral products
•Sugar and khandsari boora
•Communication equipment
•Heavy chemicals
H-T SECTORS
•Pesticides
•Industrial machinery
•Tractors and agri.
•Electrical wires, cables and appliances
•Electronic equipment
•Batteries
•Motor Vehicles
•Other transport equipment
•Electrical industrial machinery
•Ships and boats
•Other non electrical machines
•Drugs and medicines
•Construction
•Structural clay products
•Rail equipment
•Watches and clocks
•Other chemicals
•Medical and health
•Other electrical machinery
•Machines tools
•Office computing machines
H-O SECTORS
•Iron and steel
•Non ferrous basic metals
•Implements Fertilizers
•Hand tools and metal products
•Soaps, cosmetics and glycerin
•Paints, varnishes, lacquers
•Rubber and plastic products
•Synthetic fiber and resin
•Misc. manufacturing
•Printing and publishing
•Tea and coffee processing
•Electricity

Significant Structural Changes in India’s Economic Structure Since Independence
•significance of primary sector declines while that of secondary and tertiary sectors increases
Changing Sectoral Distribution of Domestic Product
•A large number of basic industries which produce capital equipment and useful raw materials have been set up making the country’s industrial structure pretty strong.
Growth of Basic Capital Goods Industries
•Social overhead capital broadly includes transport facilities, irrigation systems, energy production, educational system and organisation and health facilities.
Expansion in Social Overhead Capital
•The growth of commercial banks and cooperative credit societies has been really spectacular and as a result of it the importance of money-lenders has declined.
Progress in the Banking and Financial Sector

What are the Factors that Determines Occupational Structure of an economy?
• Geographical Factors:• Sources of energy were discovered and rapid improvements were made in the capital equipment used in industries• Factors like the fertility of soil, climate and availability of minerals declined in determining the occupations of the
people.
• Development of Productive Forces:• Technology does not acquire sophistication• Productivity of labour remains low.
• Division of labour and Specialisation:• Continuous development of productive forces creates conditions for increasingly complex division of labour.• With the introduction of division of labour in production, labour productivity rises and transfer of population from
primary industries to secondary and tertiary industries takes place.
• Level of Per Capita Income:• Per capita income is low, a substantially large portion of the national income is spent on goods produced in the
primary sector. As such, sizable labour force in these countries remains employed in agriculture, animal husbandry,fishery and forestry.
• When growth takes place and per capita income rises, demand for manufactured goods increases and in its responsetheir output is also expanded. This creates more jobs in the secondary sector. India’s per capita income is one of thelowest in the world.
• Changing Structure:• A large part of the workers in the agricultural sector be transferred to industrial and service sectors. The argument for
the transference of workers from agriculture is that, it will raise Ike productivity per worker. Hence, the quicker thepace of such transference, the belter it is.
• Since productivity per head in industries and services is generally higher than in agriculture, such transference ofworkers from low to high productivity sectors will result in higher national productivity per head resulting in anincrease in total production. Besides, there will be diversification in economic activities.
• As a consequence of these developments, national income will rise, and if the rate of population growth remainswithin reasonable limits, per capita income will also rise.

References
• http://www.yourarticlelibrary.com/economics/4-significant-structural-changes-in-indias-economic-structure-since-independence/2754/
Related Documents