DOT/FAA/AR-08/51 Air Traffic Organization Operations Planning Office of Aviation Research and Development Washington, DC 20591 Structural Testing and Analysis of Honeycomb Sandwich Composite Fuselage Panels December 2008 Final Report This document is available to the U.S. public through the National Technical Information Service (NTIS), Springfield, Virginia 22161. U.S. Department of Transportation Federal Aviation Administration

Welcome message from author
This document is posted to help you gain knowledge. Please leave a comment to let me know what you think about it! Share it to your friends and learn new things together.
Transcript

DOT/FAA/AR-08/51 Air Traffic Organization Operations Planning Office of Aviation Research and Development Washington, DC 20591
Structural Testing and Analysis of Honeycomb Sandwich Composite Fuselage Panels December 2008 Final Report This document is available to the U.S. public through the National Technical Information Service (NTIS), Springfield, Virginia 22161.
U.S. Department of Transportation Federal Aviation Administration

NOTICE This document is disseminated under the sponsorship of the U.S. Department of Transportation in the interest of information exchange. The United States Government assumes no liability for the contents or use thereof. The United States Government does not endorse products or manufacturers. Trade or manufacturer's names appear herein solely because they are considered essential to the objective of this report. This document does not constitute FAA certification policy. Consult your local FAA aircraft certification office as to its use. This report is available at the Federal Aviation Administration William J. Hughes Technical Center’s Full-Text Technical Reports page: actlibrary.tc.faa.gov in Adobe Acrobat portable document format (PDF).

Technical Report Documentation Page 1. Report No. DOT/FAA/AR-08/51
2. Government Accession No. 3. Recipient's Catalog No.
5. Report Date December 2008
4. Title and Subtitle STRUCTURAL TESTING AND ANALYSIS OF HONEYCOMB SANDWICH COMPOSITE FUSELAGE PANELS
6. Performing Organization Code
7. Author(s) Frank A. Leone, John G. Bakuckas, Peter Shyprykevich, and Curtis Davies
8. Performing Organization Report No.
10. Work Unit No. (TRAIS) 9. Performing Organization Name and Address
Federal Aviation Administration William J. Hughes Technical Center Airport and Aircraft Safety Research and Development Division Airworthiness Assurance Branch Atlantic City International Airport, NJ 08405
11. Contract or Grant No.
13. Type of Report and Period Covered Final Report
12. Sponsoring Agency Name and Address U.S. Department of Transportation Federal Aviation Administration Air Traffic Organization Operations Planning Office of Aviation Research and Development Washington, DC 20591
14. ANM-100
Sponsoring Agency Code
15. Supplementary Notes This research was a joint sponsored activity with the Aging Aircraft/Continued Airworthiness Program and the Advanced Materials and Structures Program. 16. Abstract This study investigated the damage tolerance characteristics and failure mechanisms of six honeycomb sandwich composite fuselage panels subjected to quasi-static pressurization and axial loading using the Full-Scale Aircraft Structural Test Evaluation and Research (FASTER) fixture located at Federal Aviation Administration William J. Hughes Technical Center, Atlantic City International Airport, NJ. The FASTER fixture is capable of testing full-scale fuselage panel specimens under conditions representative of those seen by an aircraft in actual operation. The faster fixture is capable of applying pressurization, axial, hoop, and shear loads to a fuselage panel. The damage tolerance of composite sandwich panels with impact damage, holes, and notches under in-plane tensile and compressive loading was previously investigated at coupon and element-scale levels. A typical airframe predominantly experiences in-plane loads, although damaged regions may experience localized out-of-plane bending and bulging due to internal pressurization. The objective of these tests was to study the effects of holes and notches on the damage tolerance of full-scale, curved composite panels that reflect a typical sandwich fuselage structure subjected to combined loading. All six panels were loaded quasi-statically up to failure, studying damage growth and strain redistribution behavior with increasing load and recording the residual strength. The test articles were instrumented with strain gages near the damage and in the far-field regions for strain surveys. A digital image correlation method was used to obtain full-field displacement and strain measurements at equal load intervals and after any visible surface damage was observed. The acoustic emission method was used to monitor for damage growth in real time and served as an early warning for imminent failure. Several nondestructive inspection methods, including flash thermography and computer-aided tap testing, were used to scan for nonvisual damage. 17. Key Words Composite, Honeycomb, Residual strength, Damage tolerance, Fuselage
18. Distribution Statement This document is available to the U.S. public through the National Technical Information Service (NTIS), Springfield, Virginia 22161.
19. Security Classif. (of this report) Unclassified
20. Security Classif. (of this page) Unclassified
21. No. of Pages 259
22. Price
Form DOT F 1700.7 (8-72) Reproduction of completed page authorized

ACKNOWLEDGMENTS
The authors wish to acknowledge the support of David Galella and Paul Swindell of the Federal Aviation Administration William J. Hughes Technical Center for facilitating the nondestructive test equipment used in this study, Didem Ozevin and Valery Godinez from Physical Acoustics Corporation for their support in the acoustic-emission studies, and K.S. Raju and John Tomblin of Wichita State University for their contributions. In addition, thanks are due to Mr. Bao Mosinyi from Syport Systems for his assistance in the experimental phase of the work. The authors would also like to acknowledge Professors J. Awerbuch, A. Lau, and T. Tan from the Department of Mechanical Engineering and Mechanics of Drexel University for their input and guidance.
iii/iv

TABLE OF CONTENTS
Page
EXECUTIVE SUMMARY xi 1. INTRODUCTION 1
2. EXPERIMENTAL PROCEDURE 1
2.1 Full-Scale Aircraft Structural Test Evaluation and Research Facility 1 2.2 Panel Description 2 2.3 Panel Configurations 3 2.4 Panel Preparation 3 2.5 Inspection and Monitoring Methods 5
2.5.1 Strain Gages 5 2.5.2 Deformation and Strain Photogrammetry 5 2.5.3 Acoustic Emission 7 2.5.4 Thermography 8 2.5.5 Computer-Aided Tap Test 8
2.6 Applied Loads 9
3. ANALYSIS PROCEDURE 10
4. RESULTS AND DISCUSSION 11
4.1 Strain Surveys 11 4.2 Residual Strength Tests 12
4.2.1 Panel CP1B 12 4.2.2 Panel CP2 21 4.2.3 Panel CP3 22 4.2.4 Panel CP4 23 4.2.5 Panel CP5 24 4.2.6 Panel CP6 25 4.2.7 Residual Strength Test Summary 26
5. CONCLUDING REMARKS 26
6. REFERENCES 27
v

APPENDICES A—Engineering Drawings B—Strain Survey Data C—Residual Strength Data D—Analysis Comparisons
vi

LIST OF FIGURES
Figure Page 1 The FASTER Fixture 2 2 (a) Radial Linkage Plates and Bonded Pressure Box Seal During Cure Time,
(b) Application of Hard Plastic Through-the-Thickness Seal, (c) Rubber Through-the-Thickness Seal, and (d) Radial Linkages 4
3 (a) Photogrammetry System Setup for Panel CP3, (b) Panel CP3 Calculated
Longitudinal Strain Field, and (c) Example of Applied Stochastic Pattern and Strain Calculation Method 6
4 Acoustic Emission Sensor Layout for Panel CP4 7 5 Computer-Aided Tap Tester Impactor 8 6 Panel CP5 FE Model and Panel CP5 Photogrammetry Data Showing Hoop Strain
for 9.0-psi Pressure 666-lb/in. Hoop Load and 100-lb/in. Longitudinal Load 11 7 Comparison of (a) Longitudinal and (b) Hoop Strain Data from Gages Located in
Three Corners of the Baseline Panel for Longitudinal Loading and Pressurization and Hoop Loading, Respectively 12
8 Panel Coordinate System 13 9 Full-Field Hoop Strain Distribution History for Hoop Loading and
Pressurization of Test Panel CP1B 14 10 Hoop Strain Distribution History for Hoop Loading and Pressurization of
Test Panel CP1B up to Failure 14 11 Strain Redistribution for Residual Strength Test of CP1B 15 12 Energy and Load Versus Time for the Residual Strength Test of Panel CP1B 16 13 Acoustic Emission Location Plot of CP1B Residual Strength Test 16 14 Acoustic Emission Event Histograms Versus Location Along the Axis of the
Longitudinal Notch for the Residual Strength Test of Panel CP1B 17 15 Thermography Images After 10″ Cut Added to CP1B, Prior to the Residual
Strength Test 18 16 Thermography Image of External Fracture on Panel CP1B in Quadrants I and IV 19
vii

17 Thermography Images of Inset A From 16 Showing Various Indications 19 18 Composite Stiffness Image From CATT of Area Shown in Inset A of Figure 16 19 19 Thermography Image of Fracture on Panel CP1B in Quadrants II and III 20 20 Detailed Image of Damage From Figure 19 Upper Left 20 21 A CATT Stiffness Image of Area Shown in Figure 20 20 22 Thermography Image of Internal Fracture on Panel CP1B in Quadrants I and IV 21 23 Thermography Image of Internal Fracture on Panel CP1B in Quadrants II and III 21 24 (a) Panel CP2 Posttest Damage and (b) Location of CP2 Visible Damage 22 25 (a) Panel CP3 Longitudinal Strain Distribution at 8.0-psi Pressure, 592-lb/in. Hoop
Load and (b)1400-lb/in. Longitudinal Load and Panel CP3 Post-Failure 22 26 Panel CP4 Extent of Posttest Convex Facesheet Damage 23 27 (a) Panel CP5 Hoop Strain Distribution at 13.5-psi Pressure, 1000-lb/in. Hoop Load
and 100-lb/in. Longitudinal Load and (b) Panel CP5 Post-Failure 24 28 (a) Panel CP6 Normal Strain Distribution at 16.2-psi Pressure, 1200 lb/in. Hoop Load
and 1200-lb/in. Longitudinal Load and (b) Panel CP6 Post-Failure 26
viii

LIST OF TABLES Table Page 1 Summary of Panel Damage Configurations 3 2 Finite Element Model Input Material Properties 10 3 Residual Strength Test Results Summary 26
ix

x
LIST OF ACRONYMS AE Acoustic emission CATT Computer-Aided Tap Tester FAA Federal Aviation Administration FASTER Full-Scale Aircraft Structural Test Evaluation and Research FE Finite element ISU Iowa State University PAC Physical Acoustics Corporation RTV Room-temperature vulcanization

EXECUTIVE SUMMARY
This study investigated the damage tolerance characteristics and failure mechanisms of six honeycomb sandwich composite fuselage panels subjected to quasi-static pressurization and axial loading using the Full-Scale Aircraft Structural Test Evaluation and Research (FASTER) fixture located at the Federal Aviation Administration William J. Hughes Technical Center, Atlantic City International Airport, NJ. The FASTER fixture is capable of testing full-scale fuselage panel specimens under conditions representative of those seen by an aircraft in actual operation. The lay-up of the test articles represents a typical general aviation sandwich composite aircraft fuselage structure. The damage tolerance of composite sandwich panels with impact damage, holes, and notches under in-plane tensile and compressive loading was previously investigated at coupon and element-scale levels. A typical airframe predominantly experiences in-plane loads, although damaged regions may experience localized out-of-plane bending and bulging due to internal pressurization. The objective of these tests was to study the effects of holes and notches on the damage tolerance of full-scale, curved composite panels that reflect a typical sandwich fuselage structure subjected to combined loading. The test articles were instrumented with strain gages near the simulated damage regions and in the far-field regions for strain surveys. A digital image correlation method was used to obtain full-field displacement and strain measurements at equal load intervals and after any visible surface damage was observed. The acoustic emission method was used to monitor damage growth in real time and to serve as an early warning for imminent failure. Several nondestructive inspection methods, including flash thermography and computer-aided tap testing, were used to scan for nonvisual damage. The test results provided data on the residual strength and failure modes of fuselages constructed of honeycomb sandwich composite structure. These fuselages are typically without intermediate stiffeners or frames to contain damage growth after a catastrophic failure event. This study validated test data and predictions from earlier coupon and element-scale research and provided an accurate assessment of sandwich damage tolerance and design principles for use in aircraft.
xi/xii

1. INTRODUCTION.
Rising operating costs are driving aircraft manufacturers to reduce weight and improve efficiency by using more composite materials in aircraft design. Composite honeycomb sandwich fuselage designs have been used quite successfully in general aviation and commuter aircraft. Compared to conventional structure, the advantages included weight savings, an increase in bending rigidity and in-plane strength and stiffness, and improved stability. A technical challenge in airplane sandwich design is to adequately predict residual strength of a damaged structure [1]. Classical damage tolerance philosophy, which has been used in the design of conventional metallic airplane structures for a long time, cannot be directly applied to composite sandwich structure for several reasons. First, damage in composite structure is seldom representative of a single dominant crack needed to apply continuum fracture mechanics principles. Due to its heterogeneous nature, damage in composite sandwich structure is much more complex than in conventional metallic materials. It can be quite extensive, yet nonvisual, and can pose difficulties with regard to inspections and estimating the residual strength, given a known damage state. In addition, there was a general lack of understanding of the failure mechanisms and their interaction in the overall structural response. Linear engineering models typically are not equipped to handle the complex nonlinear behavior exhibited by composite sandwich structure and usually have limited predictive capability. Empirical approaches, based on experimental data from coupon, subcomponent, and full-scale testing, are time-consuming and very costly. As summarized in reference 1, there was a lack of models to predict the structural response, damage progression, and residual strength. The Federal Aviation Administration (FAA) has performed several studies to address these concerns. Methodologies were developed and validated in a building-block approach at the coupon and subcomponent levels [1-5]. In this study, the damage tolerance characteristics of several honeycomb sandwich composite fuselage panels were studied. Panels were subjected to quasi-static pressurization and longitudinal loading. The objective of these tests was to study the effects of various damage scenarios, such as holes and notches, on the strain redistribution behavior and residual strength of composite panels that reflect typical honeycomb sandwich fuselage structure subjected to combined loading. Typically, these fuselages are without intermediate stiffeners or frames to contain damage growth after a catastrophic event, such as a blade separation. Therefore, knowledge of composite structures’ ability to withstand damage growth, given severe initial damage states, is of particular interest. This study will provide test data to validate predictions from earlier coupon and subelement research and will provide an accurate assessment of sandwich damage tolerance and design principles for use in aircraft. 2. EXPERIMENTAL PROCEDURE.
2.1 FULL-SCALE AIRCRAFT STRUCTURAL TEST EVALUATION AND RESEARCH FACILITY.
These honeycomb sandwich composite aircraft fuselage damage tolerance studies were conducted at the Full-Scale Aircraft Structural Test Evaluation and Research (FASTER) facility, located at the FAA William J. Hughes Technical Center, Atlantic City International Airport, NJ.
1

The FASTER fixture, shown in figure 1, is capable of subjecting full-scale curved fuselage panels to loadings representative of those experienced by an aircraft under actual operation conditions.
Figure 1. The FASTER Fixture The FASTER fixture features a unique adaptation of mechanical, fluid, and electronic components and is capable of applying pressurization, hoop, longitudinal, and shear loads to a fuselage panel [6]. The panel is set on top of a D-shaped pressure box and bonded with an elastomeric seal. The system is capable of using either air or water as the pressurizing medium, although water was used in each of the composite panel tests. Hoop- and longitudinal-edge loads are applied to the panel by 14 hoop and 8 longitudinal water-actuated lever arms. Loads were applied to the panels via 28, 0.5″ diameter holes along each hoop edge and along 16 holes on each longitudinal edge. 2.2 PANEL DESCRIPTION.
The fuselage panels used in this study were constructed of a honeycomb sandwich composite material representative of those currently used in certain general aviation-class aircraft. The panels were fabricated by Adam Aircraft Industries (Englewood, CO) using a Toray Composites T700SC-12K-50C/#2510 plain weave carbon fabric prepreg of 0.0085″ thickness in the facesheets and a Plascore PN2-3/16-3.0 Nomex honeycomb core of 0.75″ thickness in the central test section. The lay-up within the test section of the panel was [45/0/45/Core]s. The material within the load application region, along the panel edges, was reinforced to avoid local failures at the load application points. The honeycomb core in the load application region was filled with a stiffening epoxy and had a reduced thickness of 0.375″. The facesheets in the load application region also contained additional plies to increase the in-plane stiffness. The lay-up within the load application section of the panel was [45/45/0/45/0/45/0/45/0/45/0/45/ 45/Core]s. The panels were 125″ long and 73″ wide with an internal radius of 74″. Detailed drawings of the panel geometry are provided in appendix A. Unlike the metallic aircraft fuselage panels
2

previously evaluated using the FASTER fixture, the composite panels had no frames or other substructure components. 2.3 PANEL CONFIGURATIONS.
Six panels (designated CP1 through CP6) were tested throughout the course of this study. A summary of these six panels is provided in table 1, and further details are provided in appendix A. Panel CP1 contained no artificial damage and was used to collect baseline data for use in the calibrations of inspection methods and computer models. After the required baseline data was collected from this panel, artificial damage was introduced in the form of a 3″ x 3″ cross through the exterior (convex) facesheet. This configuration of the original panel was designated as CP1A. A more severe artificial-damage state was later introduced to panel CP1A in the form of a 10″ long by 1/16″ wide longitudinal notch through the full thickness of the panel. This configuration of the original panel was designated as CP1B.
Table 1. Summary of Panel Damage Configurations
Panel No. Damage Configuration CP1 Baseline
CP1A 3″ x 3″ cross, exterior (convex) facesheet CP1B 10″ x 1/16″ longitudinal notch, through the thickness CP2 10″ diameter hole, exterior (convex) facesheet CP3 10″ x 1/2″ circumferential notch, through the thickness CP4 10″ x 1/2″ circumferential notch, through the thickness CP5 10″ x 1/2″ longitudinal notch, through the thickness CP6 10″ x 1/2″ 45º inclined notch, through the thickness
Panel CP2 contained a 10″ diameter hole through the exterior (convex) facesheet. Panel CP2 was intended to represent a debonded repair patch. Panels CP3 and CP4 contained 10″ long, 1/2″ wide longitudinal through-the-thickness notches. Panel CP5 contained a 10″ long, 1/2″ wide circumferential through-the-thickness notch. Panel CP6 contained a 10″ long, 1/2″ wide through-the-thickness notch oriented 45º from the longitudinal direction of the panel. Damage scenarios in panels CP3 through CP6 were intended to represent sites of high-energy discrete source damage, such as that resultant of a blade separation. 2.4 PANEL PREPARATION.
The panels were connected to the FASTER fixture pressure box via an elastomeric seal installed along the outer edge of the test section. The seal was bonded to the panel using PR-1422 Class B aircraft fuel tank sealant over an area approximately 4″ wide along the outer perimeter of the test section, as shown in figure 2(a). The pressure box seals were connected to the pressure box by tightening a series of equally spaced bolts over a layer of room-temperature vulcanization (RTV) silicone sealant.
3

Panels that contained through-the-thickness damage required that a seal be installed on the interior (concave) facesheet to contain the pressurizing medium during the tests involving the application of hoop loads and pressurization. A thin, hard plastic sheet was bonded directly to the panel using PR-1422 Class B aircraft fuel tank sealant, figure 2(b). The width of the bonded area between the hard plastic sheet and the panel was approximately 2″. The hard plastic layer served to stop the seal from bulging through the through-the-thickness damage openings. The next layer of the patch was a thin rubber sheet, approximately 20″ by 10″, bonded to the panel and hard plastic sheet by PR-1422 Class B aircraft fuel tank sealant. RTV silicone sealant was applied along the edges of each rubber seal to prevent water ingression under the patch, figure 2(c).
(a) (b)
(c) (d)
Figure 2. (a) Radial Linkage Plates and Bonded Pressure Box Seal During Cure Time,
(b) Application of Hard Plastic Through-the-Thickness Seal, (c) Rubber Through-the-Thickness Seal, and (d) Radial Linkages
4

The composite panels were radially constrained by ten custom linkages, attached by 6″ by 6″ curved aluminum plates bonded to the concave surface of each panel using PR-1422 Class B aircraft fuel tank sealant, figure 2(d). Each curved aluminum plate contained a threaded center hole that served as a connection point for the linkages. The opposite ends of the linkages were bolted to the base of the pressure box. To avoid unintended application of out-of-plane bending to the panels, the linkages contained two hinges and a double universal joint to allow for sufficient degrees of freedom. The exact locations of the radial linkage connection plates on the concave surface of the panel are detailed in appendix A. 2.5 INSPECTION AND MONITORING METHODS.
2.5.1 Strain Gages.
Strain gages were installed on each of the composite panels to ensure symmetry of load application and for real-time monitoring of the panel strains. Strain readings were recorded during holds occurring at equal load intervals up to the maximum applied loads. Strain and load data were also continuously recorded to a buffer file at a frequency of 150 Hz. The test section of each panel was instrumented with biaxial strain gages oriented to measure strain in the longitudinal and hoop directions. Back-to-back pairs were installed on both the concave and convex surfaces of the panels. Each panel was instrumented with these pairs of strain gages spaced 12″ apart along one-half of the test section perimeter, with an additional pair in an adjacent corner. As such, the symmetry of loads and strains across the panel could be evaluated by comparing the measured results from the three gaged corners of the panels. Additional strain gages were installed in proximity to the sites of expected strain concentrations near the artificial damage sites. Detailed strain gage maps for each panel are provided in appendix A. 2.5.2 Deformation and Strain Photogrammetry.
Full-field deformation and strain data were recorded during the loading of the test panels using the ARAMIS three-dimensional deformation and strain photogrammetry system. The system, using two 4-megapixel cameras, is capable of accurately measuring full-field strain within 50 με. Prior to testing, the areas to be monitored by the photogrammetry system were coated with a high-contrast stochastic speckle pattern. Flat black spray paint was used to create a random pattern over a flat white layer. The coarseness of the pattern directly affects the resolution of the measured strain field. Baseline images were taken using both cameras at zero load. Additional images were recorded using both cameras at either 10% or 20% intervals, up to the maximum planned load. The system setup is shown in figure 3(a). A grid of user-definable resolution is superimposed over one of the captured baseline images to define the set of points to be used in the deformation and strain calculations. The grayscale distribution within each grid element is used to first recognize and locate the same element in the corresponding baseline image, and then in the subsequent loaded image pairs. A deformation gradient tensor, F, is calculated between each of the image pairs. The deformation gradient tensor transforms one set of spatial coordinates to another, and can be decomposed into the rigid body rotation tensor, R, and the right stretch tensor, U. The right stretch tensor is approximately
5

equal to the strain tensor summed with an identity matrix. An example of the calculated longitudinal strain field for panel CP3 is shown in figure 3(b). An example of the stochastic pattern and the rigid body rotation and stretch decomposition of the deformation gradient tensor is shown in figure 3(c).
25˚
(a) (b)
X1
Baseline Deformed
θ
θ
X2
X1 : 1-direction baseline length X2 : 2-direction baseline lengthx1 : 1-direction current lengthx2 : 2-direction current lengthθ : rigid body rotation
x = F Xx = (RU) XU = E + I
(c)
Figure 3. (a) Photogrammetry System Setup for Panel CP3, (b) Panel CP3 Calculated
Longitudinal Strain Field, and (c) Example of Applied Stochastic Pattern and Strain Calculation Method
6

Deformation and strain data measurements using this photogrammetric system were validated by comparing calculated full-field displacement and strain results to strain gage data and finite element (FE) results. To compare with pointwise strain gage data, the full-field data is averaged over the area covered by a strain gage. Since no strain gages were located in the areas monitored by the photogrammetry system, symmetry across the major axes of the panels was assumed for comparison purposes. 2.5.3 Acoustic Emission.
The acoustic emission (AE) method uses a system of sensors to monitor for internal stress waves resultant of damage formation and propagation within a material. As such, AE is a real-time, passive, nondestructive evaluation method, meaning it is not necessary to artificially excite the material to characterize the state of damage. Because of the complex nature of composite materials, the waveforms recorded by the sensors are significantly altered during its propagation through the material. Rather than attempting to transform the recorded waveform back to its original shape, certain characteristics of the waveform are extracted and analyzed. These characteristics include amplitude, rise time, duration, counts, and energy. AE data were collected during these tests to monitor damage growth in real time to serve as an early-warning system for any major impending failure events and to assist in locating areas of interest for further nondestructive and destructive posttest analyses. Equipment was supplied by Physical Acoustics Corporation (PAC). Emission characteristic and waveform data were collected at a maximum rate of 5 MHz with a hit definition time of 0.8 milliseconds and a hit lockout time of 1 millisecond. The threshold value was set to 40 dB. PAC Model 1220 preamplifiers were used, having a gain of 40 dB, a 20-kHz high-pass filter, and a 400-kHz low-pass filter. PAC model R15 sensors were initially used, having an operating range between 50 and 200 kHz and a resonant frequency of 150 kHz. A later spectroscopic study showed that PAC R6 sensors, having an operating range between 35 and 100 kHz and a resonant frequency of 55 kHz, were more sensitive to the spectrum of the emissions being detected. Sensors were placed at 45-degree intervals around the areas of interest of each test panel, see figure 4. AE data were collected only for residual strength tests; no data were collected during strain surveys.
Figure 4. Acoustic Emission Sensor Layout for Panel CP4
7

2.5.4 Thermography.
The EchoTherm® flash thermography system, developed by Thermal Wave Imaging, Inc., was used to inspect the panels for nonvisual defects and damage. In flash thermography, a brief pulse of light energy from a flash lamp is used to heat the surface of a sample, while an infrared camera records changes in the surface temperature as the sample cools. The surface temperature falls predictably as heat from the surface diffuses into the sample. The surface cooling is affected by internal flaws, such as disbonds, voids, or inclusions, which obstruct the flow of heat into the sample [7]. The FAA Airworthiness Assurance Nondestructive Inspection Validation Center at Sandia National Laboratories provided the system and established the inspection procedure using a sample of the composite sandwich panels. The system provides an image of approximately 6″ by 5″ and is capable of taking single or multiple images established in a grid pattern. The concave and convex surfaces of each panel were inspected before and after the residual strength tests. 2.5.5 Computer-Aided Tap Test.
Tap testing was conducted as another method to detect nonvisual damage. For these panel tests, tap testing was performed using the Computer-Aided Tap Tester (CATT) developed by Iowa State University (ISU). The CATT is a portable inspection device based on the “coin tap” method, but with capabilities that allow it to produce quantitative images from what has traditionally been only an audible test. The CATT consists of a brass-tipped accelerometer (impactor), electronic circuitry for conditioning the signal and measuring the impact duration, and a laptop computer that contains data acquisition and processing software, figure 5.
Figure 5. Computer-Aided Tap Tester Impactor Based on previous ISU research, it was found that for a wide variety of composite aircraft components, a simple spring model may be used to describe the response to a tap [8]. From the spring model, the local stiffness may be deduced by knowing the measured impact duration and the mass of the impactor. The impact duration, as well as the deduced local stiffness, can then be used for producing an image of the tested area. The images reveal not only the defects and
8

damages in a part, but also the normal panel structure, such as core splices and ply overlays. The impact duration image shows damage as regions of abnormally large impact duration, whereas the image, based on the computed local stiffness, shows the quantitative stiffness value of the structure as a function of position. This stiffness was shown to agree with that obtained from mechanical load tests and is independent of the mass of the tapper used. Prior to a residual strength test, tap test data was collected only from areas in close proximity to the artificial damage sites and from areas suspected of additional pretest damage, such as skin-to-core disbonds. After a residual strength test, the originally measured areas and the regions surrounding any surface damage were inspected. Data points were collected in a 0.25″ resolution grid. 2.6 APPLIED LOADS.
The loads for the residual strength test of each panel were applied in a configuration for which failure was most likely for the given state of initial damage. To gather strain distribution data for multiple loading configurations for each state of damage, low-load strain surveys were conducted for each panel, prior to its residual strength test. The strain surveys also served to ensure that the applied loads were properly balanced and that any desired symmetry was maintained. The applied load magnitudes of the strain surveys were typically between 25% and 30% of the maximum applied loads of the residual strength tests. Three loading configurations were applied during the strain surveys for each panel: (1) hoop loading and pressurization, (2) longitudinal loading, and (3) combined hoop loading, longitudinal loading, and pressurization. During each strain survey, both strain gage and full-field strain and displacement data were collected in five equal increments up to the maximum loads specified in table B-1 in appendix B. Loads were increased between steps over a period of thirty seconds, pausing at each load step to allow all loaders to reach their respective end points before taking any measurements. No AE data was recorded during the strain surveys, since it was assumed that no damage was being generated within the panels. Residual strength tests were conducted for each panel containing an initial artificial damage state. Loads were applied in ten equal load increments up to the predicted failure loads, and up to the maximum capacity of the FASTER fixture (25,000 lb per loader) if a major failure was not achieved at the predicted load levels. The maximum loads for each panel are specified in table C-1 in appendix C. A major failure is characterized by the panel suddenly breaking into two pieces. A minor failure is characterized by either visual surface damage, such as matrix cracking and fiber breakage, or nonvisual subsurface damage as indicated by the AE results and posttest inspections. During the residual strength tests of panels CP4 and CP5, the application of the loads was modified to isolate AE resultant of the fretting of existing fracture surfaces from the AE resultant of new damage formation. Loads were oscillated between 10% and 90% of the difference between the current and previous load steps to generate this pure friction emission data.
9

3. ANALYSIS PROCEDURE.
FE models were developed for each damage configurations. The models were developed and solved using ABAQUS 6.6-3 software. The panels were modeled as thick shells using S4R elements. The geometry of the modeled section of the panels was 110″ long and 67″ along the circumference, with a radius of approximately 74.4″ to the midplane of the panel. Global material properties were determined using the individual lamina material properties, found in table 2, and classical laminate theory. The lay-up used for each model was [45/0/45/Core/45/0/45], with a facesheet lamina thickness of 0.0085″ and a core thickness of 0.75″.
Table 2. Finite Element Model Input Material Properties
Property Toray T700SC-12K-50C/#2510 Plascore PN2-3/16-3.0 Core E11 8,300,000 psi 1 psi E22 8,100,000 psi 1 psi G12 620,000 psi 1 psi ν12 0.085 0 E13 1 psi 6100 psi E23 1 psi 4100 psi
Polar symmetry boundary conditions were placed along the hoop edges to simulate the presence of a full fuselage structure. In addition, zero displacement boundary conditions were applied in the longitudinal direction at the centers of the hoop edges of the panels to fully constrain the model. Pressure loads were applied to the entire concave surface of the model, using the polar symmetry boundary conditions to cause reaction forces equal to the appropriate hoop loads. Uniformly distributed loads were applied along the hoop edges of the model, oriented normal to the edges, to simulate the tensile longitudinal loads resultant of the bending of a fuselage. Models containing through-the-thickness damage configurations had additional shell edge loads applied around the perimeter of their damage. The magnitude of the applied load was equal to the area of the hole or notch, distributed over the edge of the damage. These loads were applied radially outward and in proportion to the pressure load. The average far-field element length for all models was 1″. Panel CP1B contained a 1/16″ wide notch without rounded edges, requiring a near-field element length of approximately 0.015″. All other panels required near-field element lengths of approximately 0.1″. In general, good agreement was found between the analytical predictions and experimental data. Figure 6 compares the strain distribution around one of the notch tips of panel CP5 during its residual strength test. Models were validated by comparing the diminishment of notch normal strain with increasing distance away from the notch tip, along its axis, predicted by the models and measured experimentally. Detailed comparisons of preliminary analytical results and the
10

experimental data for the strain distributions in close proximity to the notch tips are provided in appendix D.
(a) (b)
Figure 6. (a) Panel CP5 FE Model and (b) Panel CP5 Photogrammetry Data Showing Hoop Strain for 9.0-psi Pressure 666-lb/in. Hoop Load and 100-lb/in. Longitudinal Load
4. RESULTS AND DISCUSSION.
4.1 STRAIN SURVEYS.
Strain surveys were conducted to ensure that balanced loads were applied to each test panel and that a general symmetry across the major axes of the panel existed. This condition is necessary to verify the assumption that the full-field photogrammetry strain results monitored in one quadrant were similar throughout the panel prior to first observable damage. Strain data collected from groups of gages located at three corners of the panel’s test section were used for these comparisons. Representative data obtained from panel CP1 is shown in figure 7. The hoop and longitudinal strain from strain gages located at three corners of the panel are shown for three test runs for hoop and longitudinal loading conditions (500 lb/in.). Strain gage results were repeatable and uniform in the far-field of the test section, verifying that boundary effects from the loaders are negligible. Linearity of strain with load was also observed. Similar strain surveys were conducted for all panels prior to their residual strength tests.
11

Pressurization and Hoop Load
Load Step
0 2 4 6 8 10 12H
oop
Stra
in-500
0
500
1000
1500
2000
2500Longitudinal Load
Load Step
0 2 4 6 8 10 12
Long
itudi
nal S
train
-500
0
500
1000
1500
2000
2500
Max. LoadPressure 0 psiHoop 0 lbf/inLongitudinal 500 lbf/in
Max. LoadPressure 6.8 psiHoop 500 lbf/inLongitudinal 0 lbf/in
1
2 3
Run 1Run 2Run 3Run 1Run 2Run 3Run 1Run 2Run 3
1
2
3
(a) (b)
Figure 7. Comparison of (a) Longitudinal and (b) Hoop Strain Data from Gages Located in Three Corners of the Baseline Panel for Longitudinal Loading and Pressurization and Hoop
Loading, Respectively The detailed raw strain gage and load data from the strain surveys of each of the panels are provided in appendix B. Raw strain data from the strain surveys was reduced to remove any prestrain due to the installation of the panel into the fixture and any nonlinear effects due to any initial slack in the load application mechanisms. In the strain gage reduction, the first three data points were removed, and a linear regression using least squares was used to curve-fit the remaining data to a first-order polynomial. The detailed reduced strain gage data for all panels and loading configurations is shown in appendix B. 4.2 RESIDUAL STRENGTH TESTS.
Residual strength tests were conducted for panels CP1B through CP6. A detailed account of the residual strength test of panel CP1B is given below. Summaries of the residual strength test results of the remaining panels are provided in this section, with greater details found in the appendices. 4.2.1 Panel CP1B.
Panel CP1B contained a through-the-thickness 10″ long, 1/16″ thick longitudinal notch, located in the center of the panel. The maximum planned loads for the residual strength test of panel CP1B were 23.625-psi pressure and 1750-lb/in. hoop load. Ten equal load steps of 2.3625 psi and 175-lb/in. hoop load were planned. At a load of 11.8-psi pressure and 875-lb/in. hoop load the photogrammetry system showed a small local failure at one of the notch tips. At a load of
12

approximately 14.0-psi pressure and 1038-lb/in. hoop load, the panel failed and broke in half along its longitudinal axis. A detailed plot of the applied loads and resulting strains in the proximity of the notch tips for the residual strength test of panel CP1B are provided in appendix C. The coordinate system used for each panel has its origin located at the center of the panel, the x ordinate in the longitudinal direction, and the y ordinate in the hoop direction. Quadrants of the panel are labeled I through IV, moving counterclockwise, as shown in figure 8.
Hoop D
irection
Longitudinal Direction
Figure 8. Panel Coordinate System The hoop strain concentration at the longitudinal notch tip of CP1B extends away from the notch tip at ±45 degrees from the axis of the notch. Comparing figure 9(e) and figure 9(f), the locus of the extensions of the strain concentration moves away from the original notch tip toward the surface damage, which is first visible in figure 9(f). This suggests that the visible damage is an extension of the original notch. Figure 10 shows the hoop strain history for leading and pressurization of a particular panel up to failure.
13

Longitudinal
Hoo
pa. b. c.
d. e. f.
0.0 psi 2.4 psi 4.7 psi
7.1 psi 11.8 psi9.4 psi
Load Step 0 Load Step 2Load Step 1
Load Step 3 Load Step 4 Load Step 5
Figure 9. Full-Field Hoop Strain Distribution History for Hoop Loading and Pressurization of Test Panel CP1B (The maximum recorded full-field hoop strain was approximately 11,700 με.
The scale for each stage is equal, ranging from -600 με to +11,700 με.)
CP1B Strain Distribution History
Distance from Crack Tip (in.)
0 1 2 3 4 5 6
Mic
rost
rain
(Hoo
p D
irect
ion)
0
2000
4000
6000
8000
10000
12000
14000
Step 0, 0.00 psiStep 1, 2.36 psiStep 2, 4.72 psiStep 3, 7.08 psiStep 4, 9.44 psiStep 5, 11.8 psi
Figure 10. Hoop Strain Distribution History for Hoop Loading and Pressurization of Test Panel CP1B up to Failure (Strain data is evaluated along the dashed lines in figure 9.)
14

Strain redistribution before the failure of test panel CP1B is apparent when observing the real strain gage data in proximity to the notch tips, as shown in figure 11. Three strain gage rosettes were installed directly at the longitudinal notch tips, one exterior and two interior. All three exhibited a drop in measured strain after loading beyond the third load step at 7.08-psi pressure. Strain gages 25H and 43H exhibited an additional decrease in measured strain when loaded beyond the fourth load step. Strain gage 33, located 1″ from 25H at the notch tip, exhibited a simultaneous increase in relative measured strain. This strain redistribution behavior is evident of possible damage progression prior to the failure of the panel between the fifth and sixth load steps.
25 43
39 35 31
41 37 33
46 48 50
47 49 5125 43
39 35 31
41 37 33
46 48 50
47 49 51
CP1B Exterior HoopStrain Redistribution
Time to Failure (sec)
-300 -250 -200 -150 -100 -50 0
Mic
rost
rain
(Hoo
p D
irect
ion)
0
5000
10000
15000SG25-H SG33 SG37 SG41
CP1B Interior HoopStrain Redistribution
Time to Failure (sec)
-300 -250 -200 -150 -100 -50 0
Mic
rost
rain
(Hoo
p D
irect
ion)
0
5000
10000
15000SG43-H SG47 SG49 SG51
Longitudinal
Hoop
Figure 11. Strain Redistribution for Residual Strength Test of CP1B Figure 12 shows the applied pressure and amplitude of all detected AE hits versus time. AE was initially observed at the second load step at 4.72-psi pressure. Audible emission was initially observed while loading from the third to the fourth load step at 7.08-psi pressure and steadily increased in volume and rate from the fourth load step until failure at 14.0-psi pressure. Figure 12 shows a steady increase in the amplitudes of the detected emission during the final three load steps, disregarding any emission due to the ultimate panel failure at time t = 340 seconds. The vast majority of AE hits were observed between load steps while the applied loads were being increased.
15

35
1st audible emission
Panel failure
1
2
3
4
5
Time (seconds)
Am
plitu
de (d
B)
0
2
4
6
8
10
12
14
0 100 200 300
40
110
Pressure (psi)
55
50
45
70
65
60
85
80
75
90
95
100
105
Figure 12. Energy and Load Versus Time for the Residual Strength Test of Panel CP1B (The panel failed at time t = 340 seconds, while loading from the fifth to the sixth load step.)
Figure 13 shows the locations of the detected AE events for the residual strength test of panel CP1B. While events were detected in both the far-field and in the vicinity of the notch tips, the majority of the events were located close to the notch tips. Filtering events with a relative energy less than 20 removed the majority of the far-field events, suggesting that these events were not indicative of damage, but instead, were noise from the loaders and other sources.
0 10 20 30 40-10-20-30-40
0
-10
-20
10
20
Longitudinal Position (in.)
Hoo
p Po
sitio
n (in
.)
> 90.0 dB> 80.0 dB> 70.0 dB> 60.0 dB> 50.0 dB≤ 50.0 dB
AE Sensors
Figure 13. Acoustic Emission Location Plot of CP1B Residual Strength Test (A total of 280 events were recorded. Event amplitude is plotted by color.)
16

A series of AE event histograms versus location along the crown of the panel is displayed in figure 14. The three plots represent the events detected during the three final load steps before the failure of panel CP1B at a pressure of 14.0 psi. Only events with energy greater than 20 are considered in the histograms. The number of detected events and the distance between the notch tips and the farthest detected event both increased with time. This suggests damage growth prior to the ultimate failure of the panel.
x-position (inches)
-15 -10 -5 0 5 10 150
2
4
6
8
10
12
14
x-position (inches)
-15 -10 -5 0 5 10 150
2
4
6
8
10
12
14
x-position (inches)
-15 -10 -5 0 5 10 150
2
4
6
8
10
12
14
Load Step: 3 to 4Pressure: 7.08 to 9.44 psi
Load Step: 4 to 5Pressure: 9.44 to 11.8 psi
Load Step: 5 to failurePressure: 11.8 to 14.0 psi
Figure 14. Acoustic Emission Event Histograms Versus Location Along the Axis of the Longitudinal Notch for the Residual Strength Test of Panel CP1B (Load steps 3 to 4 (top), 4 to 5
(middle), and 5 to failure (bottom) are displayed.)
17

Prior to the residual strength test, areas immediately around the 10″ notch tip in CP1B were inspected using both thermography and tap testing. These tests were conducted to ensure that the panel contained no significant hidden damage in those areas due to manufacturing or handling. Although it would have been desirable to have baselined the entire panel, time constraints only permitted inspection of areas immediately in front of the notch in quadrants I and IV, as shown in figure 8, on the exterior, or convex, surface. Figure 15 is a series of thermography images taken in the area surrounding the 10″ through notch. This is a 3 x 3 image grid with the notch visible on the right side of the image. There is a vertical and horizontal core splice visible in the image, along with several internal ply lay-ups. NDI results from these limited tests indicated that no significant defects existed in the vicinity of the notch tip prior to its failure.
Core splice
Ply lay-up
Notch
Core splice
Ply lay-up
Figure 15. Thermography Images After 10″ Cut Added to CP1B, Prior to the Residual Strength Test
After structural failure, thermography and tap testing were conducted on panel CP1B to identify areas of panel damage beyond that which was visually obvious from the exterior surface of the panel. A composite of thermographic images showing the fracture in quadrants I and IV is shown in figure 16. This composite image was constructed using a grid of 7″ x 3″ images starting at the notch tip and centered on the x axis. The notch tip is shown at the far right side of the image. Fracture damage and fiber breakage is very apparent. Ply lay-ups are visible in the ±45° directions as well as in the horizontal and vertical directions. Due to the significant surface damage around the fracture, little subsurface damage under the fracture could be detected. Damaged areas that were detected using thermography are shown above the fracture in figure 16 and are further highlighted in figure 17 using TWI’s Thermal Signal Reconstruction software. There are two subsurface indications that appear to be either delaminations or skin-to-core disbonds and an image of a vertical offshoot of the main fracture. Figure 18 is a corresponding image using tap test data acquired with the CATT system.
18

Inset A
Figure 16. Thermography Image of External Fracture on Panel CP1B in Quadrants I and IV Ply over lays External
adhesive
Delamination Vertical fracture Delamination Figure 17. Thermography Images of Inset A From Figure 16 Showing Various Indications
Ply lay-ups
Area of reduced stiffness
Figure 18. Composite Stiffness Image From CATT of Area Shown in Inset A of Figure 16 Figure 19 shows the composite of the thermographic images of the notch in quadrants II and III using a grid of 8 by 3 images starting at the notch and centered on the negative x axis. The notch tip is shown on the left side of the image. Fiber damage is easily seen in this image. There are several internal ply overlays visible as well. There is a large delamination just above the start of the initial notch area, and it is shown in more detail in figure 20. Figure 21 shows the same area inspected with the CATT system.
19

Starter notch
Figure 19. Thermography Image of Fracture on Panel CP1B in Quadrants II and III
Figure 20. Detailed Image of Damage From Figure 19 Upper Left
Fiber breakage
Large delamination
Ply overlay
Ply overlays Area of reduced stiffness
Figure 21. A CATT Stiffness Image of Area Shown in Figure 20 After the panel was removed from the test fixture, thermographic images of the internal fracture were taken. A 7 by 3 grid was used to image the fracture in both the quadrants I and IV. These images are shown in figure 22. An 8 by 3 grid was used to image the fracture in quadrants II and III, and these images are shown in figure 23. In this figure, the starter notch is not visible since it is behind a rubber gasket used to seal the panel during testing.
20

Figure 22. Thermography Image of Internal Fracture on Panel CP1B in Quadrants I and IV
Figure 23. Thermography Image of Internal Fracture on Panel CP1B in Quadrants II and III 4.2.2 Panel CP2.
Panel CP2 contained a 10″ diameter hole through the exterior, located at the center of the panel. Multiple attempts in all three loading configurations were made to generate visible damage in panel CP2. Three residual strength tests were conducted with a maximum planned load of 1500-lb/in. longitudinal load with loads applied in ten equal steps. Two of these runs reached 100% of the maximum planned load, while the third reached only 97.6% of the maximum planned load due to a mechanical hold on a longitudinal loader. Four residual strength tests were conducted with maximum planned loads of 23.625-psi pressure, 1750-lb/in. hoop load, and 1750-lb/in. longitudinal load with loads applied in ten equal steps. During these four runs, mechanical holds caused the tests to end at 77.1%, 80.0%, 95.9%, and 90.0%, respectively, of the maximum planned loads. Three residual strength tests were conducted with maximum planned loads of 23.625-psi pressure, 1750-lb/in. hoop load, and 0-lb/in. longitudinal load with loads applied in ten equal steps. During these three runs, mechanical holds caused the tests to end at 80.0%, 80.0%, and 90.0%, respectively, of the maximum planned loads. During the final residual strength test run of panel CP2, a small spall was observed along the crown of the panel, along a hoop tangent to the hole (figure 24). The damage was generated upon reaching a load of 21.26-psi pressure and 1575-lb/in. hoop load.
21

(a) (b)
Figure 24. (a) Panel CP2 Posttest Damage and (b) Location of CP2 Visible Damage 4.2.3 Panel CP3.
Panel CP3 contained a through-the-thickness, 10″ long, 0.5″ thick circumferential notch, located in the center of the panel. The maximum predicted loads for the residual strength test of panel CP3 were 8.0-psi pressure, 592-lb/in. hoop load, and 1400-lb/in. longitudinal load. Five equal load steps of 2.0-psi and 118.4-lb/in. hoop load were applied and held for the duration of the residual strength test. Ten equal load steps of 140-lb/in. longitudinal load were then applied. Major failure of the panel was not achieved at this load, so an additional load step was applied. At a load of 8.0-psi pressure, 592-lb/in. hoop load, and 875-lb/in. longitudinal load, the photogrammetry system showed a small local failure at one of the notch tips, effectively extending the notch by 0.5″. At a load of 8.0-psi pressure, 592-lb/in. hoop load, and 1400-lb/in. longitudinal load, the observed surface damage grew to approximately 1.5″ from the original notch tip, as shown in figure 25(a). At a load of approximately 8.0-psi pressure, 592-lb/in. hoop load, and 1510-lb/in. longitudinal load, the panel failed and broke into two pieces, as shown in figure 25(b).
(a) (b)
Figure 25. (a) Panel CP3 Longitudinal Strain Distribution at 8.0-psi Pressure, 592-lb/in. Hoop Load and (b) 1400-lb/in. Longitudinal Load and Panel CP3 Post-Failure
22

A detailed plot of the applied loads and resulting strains in the proximity of the notch tips for the residual strength test of panel CP3 is provided in appendix C. 4.2.4 Panel CP4.
Panel CP4 contained a through-the-thickness, 10″ long, 0.5″ thick circumferential notch, located in the center of the panel. The maximum planned loads for the residual strength test of panel CP4 were 1.0-psi pressure, 74-lb/in. hoop load, and 1400-lb/in. longitudinal load. The low-amplitude pressure and hoop loads were applied to avoid rigid body translation in the fixture in the hoop direction. Two equal load steps of 0.5 psi and 37-lb/in. hoop load were applied and held for the duration of the residual strength test. Ten equal load steps of 140-lb/in. longitudinal load were then applied. Ultimate failure of the panel was not achieved at this load, so an additional load step was applied. Ultimate failure of the panel was still not achieved, but the test was ended due to proximity to the maximum applicable longitudinal load of the FASTER fixture. At load steps three, four, and five, the applied loads were sinusoidally oscillated between 10% and 90% of the difference between the current and the previous load step. This generated AE data characteristic of the fretting of existing damage surfaces. This exercise was performed only at lower loads, and only with three oscillations, to avoid introducing fatigue damage into the panel after more critical damage was generated. At a load of 8.0-psi pressure, 592-lb/in. hoop load, and 1120-lb/in. longitudinal load, the photogrammetry system showed a small local failure at one of the notch tips, effectively extending the damage by 0.5″ (figure 26). An additional spall was observed at the notch tip at the next load step, but did not extend the effective notch.
Figure 26. Panel CP4 Extent of Posttest Convex Facesheet Damage A detailed plot of the applied loads and resulting strains in the proximity of the notch tips for the residual strength test of panel CP4 is provided in appendix C.
23

4.2.5 Panel CP5.
Panel CP5 contained a through-the-thickness, 10″ long, 0.5″ thick longitudinal notch, located along the crown of the panel. The maximum planned loads for the residual strength test of panel CP5 were 15.0-psi pressure, 1110-lb/in. hoop load, and 100-lb/in. longitudinal load. The low-amplitude longitudinal loads were applied to avoid rigid body translation in the fixture in the longitudinal direction. Two equal load steps of 50-lb/in. longitudinal load were applied and held for the duration of the residual strength test. Ten equal load steps of 1.5-psi pressure and 111-lb/in. hoop load were planned. At load steps four, five, six, and seven, the applied loads were sinusoidally oscillated between 10% and 90% of the difference between the current and the previous load step. This generated AE data characteristic of the fretting of existing damage surfaces. This exercise was performed only at lower loads and with three oscillations to avoid introducing fatigue damage into the panel after more critical damage was generated. During the oscillations following load step six, the fixture received a dump command due to a mechanical hold at one of the longitudinal loaders. The test was brought back to its previous load and resumed without further errors. At a load of approximately 12.0-psi pressure, 888-lb/in. hoop load, and 100-lb/in. longitudinal load, the photgrammetry showed a small local failure at one of the notch tips. The failure was a spall measuring approximately 1/16″ by 1/16″, 0.25″ ahead of the original notch tip. At a load of approximately 12.5-psi pressure, 925-lb/in. hoop load, and 100-lb/in. longitudinal load, the surface damage grew to approximately 1/8″ by 1/8″, but remained visibly disconnected from the original notch tip. At a load of approximately 13.0-psi pressure, 962-lb/in. hoop load, and 100-lb/in. longitudinal load, the visible damage connected with the original notch tip and grew to approximately 1.0″ ahead of the original notch tip, as shown in figure 27(a). Shortly after reaching a load of 13.5-psi pressure, 1000-lb/in. hoop load, and 100-lb/in. longitudinal load, the panel failed and broke into two pieces along the its crown, as shown in figure 27(b).
(a) (b)
Figure 27. (a) Panel CP5 Hoop Strain Distribution at 13.5-psi Pressure, 1000-lb/in. Hoop Load
and 100-lb/in. Longitudinal Load and (b) Panel CP5 Post-Failure
24

A detailed plot of the applied loads and resulting strains in the proximity of the notch tips for the residual strength test of panel CP5 is provided in appendix C. 4.2.6 Panel CP6.
Panel CP6 contained a through-the-thickness, 10″ long, 0.5″ thick, 45° inclined notch, located at the center of the panel. The maximum planned loads for the residual strength test of panel CP6 were 20.27-psi pressure, 1500-lb/in. hoop load, and 1500-lb/in. longitudinal load. Fifteen equal load steps of 1.35-psi pressure, 100-lb/in. hoop load, and 100-lb/in. longitudinal load were planned. The loading scheme of CP6 differed from the previous panels. Acousto-ultrasonic measurements were taken during the lower load steps of the residual strength test. The panel was unloaded after reaching load steps one through eight to compare the frequency response of a known, continuously variable signal through opened and closed small-scale damage ahead of the notch tips. After reaching load steps six and eight, the fixture received dump commands due to a mechanical hold at one of the loaders. The test was brought back to its previous loads and resumed. At a load of 12.16 psi-pressure, 900-lb/in. hoop load, and 900-lb/in. longitudinal load, the photogrammetry system showed a small local failure at one of the notch tips. A small spall extended from the hoop tangent of one of the notch tips approximately 0.25″ in the longitudinal direction. At a load of approximately 13.96-psi pressure, 1033-lb/in. hoop load, and 1033-lb/in. longitudinal load, the previously observed surface damage extended an additional 0.25″ in the longitudinal direction. At a load of approximately 14.42-psi pressure, 1067-lb/in. hoop load, and 1067-lb/in. longitudinal load, the previously observed surface damage began propagating in the -45° direction, extending approximately 1 inch normal to the original notch centerline. At a load of 16.22-psi pressure, 1200-lb/in. hoop load, and 1200-lb/in. longitudinal load, the visible surface damage continued to propagate normal to the original notch, extending approximately 1.75″ away from the original notch centerline, as shown in figure 28(a). At a load of approximately 17.12-psi pressure, 1267-lb/in. hoop load, and 1267-lb/in. longitudinal load, the visible surface damage continued to propagate normal to the original notch, extending approximately 2.88″ away from the original notch centerline. Upon reaching a load of 18.81-psi pressure, 1392-lb/in. hoop load, and 1392-lb/in. longitudinal load, the panel failed and broke into two pieces, diagonally, roughly parallel to the original notch, as shown in figure 28(b).
25

(a) (b)
Figure 28. (a) Panel CP6 Normal Strain Distribution at 16.2-psi Pressure, 1200 lb/in. Hoop Load and 1200-lb/in. Longitudinal Load and (b) Panel CP6 Post-Failure
A detailed plot of the applied loads and resulting strains in the proximity of the notch tips for the residual strength test of panel CP6 is provided in appendix C. 4.2.7 Residual Strength Test Summary.
A summary of the failure loads of all six panels is shown in table 3. For panels exhibiting only a minor failure, the load listed is the maximum applied load.
Table 3. Residual Strength Test Results Summary
Maximum Load
Panel Damage Configuration Long
(lb/in.) Hoop
(lb/in.) Pressure
(psi) Failure
CP1B 10″ x 1/16″ longitudinal notch 0 1040 14.0 Major CP2 10″ diameter hole, convex sheet 1750 1750 23.6 Minor CP3 10″ x 1/2″ circumferential notch 1500 592 8.0 Major CP4 10″ x 1/2″ circumferential notch 1540 74 1.0 Minor CP5 10″ x 1/2″ longitudinal notch 100 1000 13.5 Major CP6 10″ x 1/2″ 45º inclined notch 1390 1390 18.8 Major
5. CONCLUDING REMARKS.
A study was conducted to investigate the damage tolerance characteristics and failure mechanisms of six honeycomb sandwich composite fuselage panels subjected to quasi-static pressurization and axial loading. The test articles were instrumented with strain gages near the damage and in the far-field regions for strain surveys. A digital image correlation method was used to obtain full-field displacement and strain measurements at equal load intervals and after
26

27
any visible surface damage was first observed. The acoustic emission method was used to monitor for damage growth in real time and served as an early warning for imminent failure. Several nondestructive inspection methods were used to scan for nonvisual damage, including flash thermography and computer-aided tap testing. For each damage configuration tested, the test panels proved to withstand damage initiation for the most critical loading configuration and, at loads much greater than those experienced during realistic operating conditions, showed potential for the use of similar composite lay-ups in the construction of a commercial transport aircraft. Data generated during this test program will validate test data and predictions from earlier coupon and element-scale research and will provide an accurate assessment of sandwich damage tolerance and design principles for use in aircraft. Future work for this test program includes the refinement of the finite element models to be able to predict strain redistributions as damage progresses from the original artificial holes and notches. Destructive evaluations of each specimen will be conducted to further map the extent of damage and to provide calibration data for future models. 6. REFERENCES.
1. Tomblin, J., Lacy, T., Smith, B., Hooper, S., Vizzini, A., and Lee, S., “Review of Damage Tolerance for Composite Sandwich Airframe Structures,” FAA report DOT/FAA/AR-99/49, August 1999.
2. Tomblin, John S., Raju, K.S., Liew, J., and Smith, B.L., “Impact Damage Characterization and Damage Tolerance of Composite Sandwich Airframe Structures,” FAA report DOT/FAA/AR-00/44, January 2001.
3. Tomblin, John S., Raju, K.S., Acosta, J.F., Smith, B.L., and Romine, N.A., “Impact Damage Characterization and Damage Tolerance of Composite Sandwich Airframe Structures—Phase II,” FAA report DOT/FAA/AR-02/80, January 2001.
4. Shyprykevich, P., Tomblin, J., Ilcewicz, L., Vizzini, A.J., Lacy, T.E., and Hwang, Y., “Guidelines for Analysis, Testing, and Nondestructive Inspection of Impact-Damaged Composite Sandwich Structures,” FAA report DOT/FAA/AR-02/121, March 2003.
5. Tomblin, John S., Raju, K.S., and Arosteguy, G., “Damage Resistance and Tolerance of Composite Sandwich Panels—Scaling Effects,” FAA report DOT/FAA/AR-03/75, February 2004.
6. Bakuckas, J., “Full-Scale Testing and Analysis of Fuselage Structure Containing Multiple Cracks,” FAA report DOT/FAA/AR-01/46, July 2002.
7. ASTM WK12796 Draft Specification “Standard Practice for Infrared Flash Thermography of Composite Panels and Repair Patches Used in Aerospace Applications.”

8. D.K. Hsu, D.J. Barnard, J.J. Peters, and V. Dayal, “Physical Basis of Tap Test as a Quantitative Imaging Tool for Composite Structures on Aircraft,” Review of Progress in Quantitative NDE, Vol. 19B, D.O. Thompson and D.E. Chimenti, eds., American Institute of Physics, New York, 2000, pp. 1857-1864.
28

APPENDIX A—ENGINEERING DRAWINGS
Figure A-1. General Panel Dimensions
A-1

Figure A-2. Radial Linkage Connection Plate Locations
A-2

Figure A-3. CP1 Strain Gage Map (Panel CP1 served as a baseline test and contained no initial artificial damage.)
A-3

Figure A-4. CP1A Strain Gage Map (Panel CP1A contained a 3 x 3 crossed slit through the convex facesheet, located in the center of the panel.)
A-4

Figure A-5. CP1B Strain Gage Map (Panel CP1A contained a 10 long by 1/16 thick through-the-thickness notch, located in the center of the panel and oriented in the longitudinal direction.)
A-5

Figure A-6. CP2 Strain Gage Map (Panel CP2 contained a 10 diameter circular hole through the convex facesheet, located in the center of the panel.)
A-6

Figure A-7. CP3 Strain Gage Map (Panel CP3 contained a 10 long by 1/2 thick through-the-thickness notch, located in the center of the panel and oriented in the circumferential direction.)
A-7

Figure A-8. CP4 Strain Gage Map (Panel CP4 contained a 10 long by 1/2 thick through-the-thickness notch, located in the center of the panel and oriented in the circumferential direction.)
A-8

Figure A-9. CP5 Strain Gage Map (Panel CP5 contained a 10 long by 1/2 thick through-the-thickness notch, located along the 0° axis of the panel with its center shifted 9.75 in the
negative-0 direction. The notch was oriented in the longitudinal direction.)
A-9

Figure A-10. CP6 Strain Gage Map (Panel CP6 contained a 10 long by 1/2 thick through-the-thickness notch, located in the center of the panel and oriented 45° between the longitudinal and
circumferential directions.)
A-10

APPENDIX B—STRAIN SURVEY DATA
B.1 RAW STRAIN GAGE AND LOAD DATA.
Table B-1. Loading Conditions for Strain Surveys
Maximum Load
Panel Load
Condition Pressure
(psi) Hoop
(lb/in.) Longitude
(lb/in.) A 6.75 500 0 B 0.00 0 500 CP1 C 13.50 1000 1000
CP1A B 0.00 0 1500 A 5.90 437.5 0 B 0.00 0 437.5 CP1B C 5.90 437.5 437.5 A 6.75 500 0 B 0.00 0 500 CP2 C 6.75 500 500 A 3.40 252 0 B 0.00 0 300 CP3 C 3.40 252 300 A 3.40 252 0 B 0.00 0 300 CP4 C 3.40 252 300 A 3.40 252 0 B 0.00 0 300 CP5 C 3.40 252 300 A 2.70 200 0 B 0.00 0 200 CP6 C 2.03 150 150
Table B-2. CP1, Load Condition A, Run 1
% Load 0 10 20 30 40 50 60 70 80 90 100 Pressure -0.01 0.70 1.36 2.01 2.68 3.34 4.03 4.68 5.38 6.12 6.73
Hoop-1 377.9 999.4 1598.6 2396.2 3175.7 4009.5 4824.4 5627.5 6454.5 7296.1 7946.5 Hoop-2 -9.1 818.5 1603.6 2387.4 3181.8 3987.9 4816.4 5587.8 6383.9 7188.7 7987.7 Hoop-3 -2.5 784.8 1578.9 2384.3 3177.2 3971.3 4831.5 5590.0 6442.2 7211.5 7996.4 Hoop-4 280.7 880.7 1593.7 2407.5 3213.9 4001.1 4800.8 5607.1 6381.8 7189.9 7999.4
B-1

Table B-2. CP1, Load Condition A, Run 1 (Continued)
% Load 0 10 20 30 40 50 60 70 80 90 100 Pressure -0.01 0.70 1.36 2.01 2.68 3.34 4.03 4.68 5.38 6.12 6.73
Hoop-5 -8.4 795.5 1595.5 2417.6 3229.1 4014.4 4797.3 5608.6 6405.3 7203.8 7990.9 Hoop-6 342.4 812.3 1597.6 2392.6 3196.8 4006.0 4796.2 5600.3 6398.9 7195.7 8006.6 Hoop-7 287.3 969.0 1605.4 2402.3 3210.2 4008.4 4807.9 5610.2 6403.5 7202.2 8005.7 Hoop-8 -44.0 798.2 1596.6 2395.4 3208.8 3999.8 4799.9 5598.1 6402.9 7201.5 8000.9 Hoop-9 -10.9 790.2 1598.3 2399.6 3197.5 3987.5 4815.2 5619.6 6396.3 7192.0 7985.0 Hoop-10 4.3 808.0 1608.1 2410.2 3200.1 3992.9 4796.3 5605.1 6404.2 7199.1 7992.9 Hoop-11 -23.7 806.9 1586.4 2413.5 3195.3 4000.1 4783.0 5586.0 6393.7 7182.5 8004.7 Hoop-12 61.3 835.1 1562.7 2403.0 3210.3 4004.0 4834.6 5696.5 6417.6 7250.3 8010.2 Hoop-13 -7.5 808.8 1595.4 2397.1 3213.7 3992.8 4803.1 5604.3 6404.8 7007.7 7589.4 Hoop-14 -10.3 810.5 1616.2 2392.4 3191.1 3989.3 4796.6 5609.6 6384.5 7190.4 7989.6 Long-1 -37.7 103.0 49.8 30.9 -29.4 41.5 69.9 -16.4 -47.1 -47.1 -18.7 Long-2 -82.6 13.0 64.8 77.8 71.9 -67.2 -49.5 -43.6 46.0 -40.1 107.3 Long-3 34.0 -25.5 -1.3 13.3 9.7 27.9 -1.3 19.4 2.4 -7.3 14.5 Long-4 9.2 6.8 -1.7 3.2 9.2 -2.9 -2.9 -1.7 -0.5 -2.9 3.2 Long-5 92.8 -8.2 8.4 22.7 35.8 32.2 40.5 60.7 105.8 121.3 165.3 Long-6 -9.1 -87.4 52.4 112.6 -32.0 -45.2 37.9 -1.9 5.4 3.0 10.2 Long-7 179.7 219.1 29.2 69.8 48.3 78.2 -9.0 79.4 66.2 -3.0 -0.6 Long-8 26.2 -14.2 22.6 -26.0 -17.7 -10.6 -5.8 4.8 -10.6 -5.8 -8.2 Radial-1R 2303.4 2300.2 2279.7 2246.7 2206.5 2205.7 2197.7 2198.7 2202.5 2203.2 2206.7 Radial-2R -1616.0 -1372.6 -1404.1 -1577.6 -1478.3 -1767.6 -1781.3 -1916.7 -1869.1 -1908.8 -1827.0 Radial-3R -5.4 -4.6 -5.8 -5.0 -4.1 -2.8 -3.0 -3.1 -5.3 -4.6 -4.2 Radial-4R -36.5 -35.4 -35.1 -34.2 -35.4 -33.0 -33.7 -34.2 -33.2 -32.7 -32.4 Radial-5R 5425.3 5487.8 5489.4 5346.6 5105.6 5155.8 5244.7 5078.1 5237.7 5368.1 5345.5 Radial-6R -9.5 -9.5 -9.6 -10.7 -12.4 -11.3 -10.1 -8.5 -9.5 -10.5 -18.9 Radial-7R -10.2 -10.2 -10.4 -9.7 -10.0 -8.3 -8.6 -8.5 -7.7 -7.1 -7.0 Radial-8R 2.0 1.7 0.4 0.9 2.7 2.9 3.7 3.7 2.7 2.9 3.9 Radial-9R 614.1 637.4 649.6 706.0 729.9 740.3 750.3 752.5 742.0 779.0 810.7 Radial-10R 1800.3 2095.4 1921.7 1960.8 2018.2 1760.8 2377.2 1907.2 2072.7 2148.7 2226.3 SG01 -140.0 -176.9 -253.1 -319.9 -393.7 -465.9 -571.7 -676.8 -767.8 -872.3 -971.2 SG02 ####### ####### ####### ####### ####### ####### ####### ####### ####### ####### #######SG03 -48.6 184.9 410.2 614.6 819.0 1017.0 1213.4 1411.4 1631.0 1862.1 2068.0 SG04 ####### ####### ####### ####### ####### ####### ####### ####### ####### ####### #######SG05 -259.0 -279.2 -364.1 -440.0 -534.6 -633.1 -760.1 -863.8 -953.8 -1083.0 -1195.7 SG06 ####### ####### ####### ####### ####### ####### ####### ####### ####### ####### #######SG07 -24.1 195.5 407.2 602.0 795.2 986.3 1175.2 1367.1 1574.8 1798.5 1996.4 SG08 ####### ####### ####### ####### ####### ####### ####### ####### ####### ####### #######SG09 -162.0 -189.6 -276.9 -350.0 -441.0 -538.1 -649.7 -758.1 -851.4 -960.6 -1061.7 SG10 -111.9 -159.2 -233.0 -297.3 -374.2 -451.3 -538.3 -624.4 -701.9 -793.6 -880.0 SG11 -19.0 219.8 442.0 645.6 844.7 1039.3 1230.1 1423.0 1632.9 1857.5 2056.2 SG12 133.8 274.4 449.8 614.9 788.2 963.7 1152.8 1343.0 1526.3 1724.6 1900.6 SG13 -164.1 -212.0 -293.9 -370.2 -458.2 -550.4 -658.6 -770.1 -867.3 -981.2 -1091.5 SG14 -115.7 -167.1 -237.2 -301.4 -376.5 -453.8 -544.7 -636.4 -717.1 -814.2 -905.5 SG15 -24.3 227.1 454.0 663.8 867.3 1067.6 1262.8 1462.7 1679.2 1912.4 2118.3 SG16 140.8 272.9 436.2 590.7 750.9 914.8 1097.3 1281.7 1456.5 1645.6 1814.5
B-2

Table B-2. CP1, Load Condition A, Run 1 (Continued)
% Load 0 10 20 30 40 50 60 70 80 90 100 Pressure -0.01 0.70 1.36 2.01 2.68 3.34 4.03 4.68 5.38 6.12 6.73
SG17 -174.6 -221.7 -286.6 -357.5 -433.6 -512.9 -615.6 -721.7 -814.4 -916.2 -1020.3 SG18 ####### ####### ####### ####### ####### ####### ####### ####### -66292.3 ####### #######SG19 -56.9 194.8 415.5 617.0 806.7 971.3 1166.0 1328.2 1547.4 1762.8 1952.5 SG20 ####### ####### ####### ####### ####### ####### ####### ####### ####### ####### #######SG21 -188.7 -273.9 -358.2 -430.6 -523.8 -603.9 -708.0 -838.1 -944.9 -1077.2 -1198.6 SG22 ####### ####### ####### ####### ####### ####### ####### ####### ####### ####### #######SG23 -6.8 261.7 507.9 736.0 959.8 1178.7 1393.6 1613.3 1852.1 2112.2 2338.3 SG24 ####### ####### ####### ####### ####### ####### ####### ####### ####### ####### #######SG25 -218.3 -233.3 -275.2 -353.5 -440.2 -509.8 -637.9 -760.6 -864.5 -949.9 -1069.4 SG26 ####### ####### ####### ####### ####### ####### ####### ####### ####### ####### #######SG27 -106.7 126.6 344.1 525.0 725.3 913.2 1106.4 1286.1 1494.1 1721.3 1920.9 SG28 ####### ####### ####### ####### ####### ####### ####### ####### ####### ####### #######SG29 -193.5 -65.2 7.2 96.8 136.4 192.4 258.0 289.4 363.4 425.2 473.8
Table B-3. CP1, Load Condition A, Run 2
% Load 0 10 20 30 40 50 60 70 80 90 100 Pressure 0.02 0.67 1.37 2.02 2.68 3.36 4.05 4.77 5.40 6.04 6.80
Hoop-1 506.3 977.3 1631.8 2403.6 3302.2 3977.9 4844.1 5567.7 6455.7 7192.0 8001.2 Hoop-2 6.7 772.8 1607.3 2410.2 3217.0 4006.9 4791.3 5606.1 6390.3 7206.6 7989.3 Hoop-3 37.2 773.9 1642.1 2407.7 3188.0 3988.9 4816.6 5599.7 6421.7 7226.3 7978.2 Hoop-4 199.0 797.1 1601.3 2388.9 3202.8 3998.9 4804.0 5593.0 6390.4 7195.9 7995.4 Hoop-5 -4.8 831.8 1610.2 2399.4 3205.4 4008.5 4809.6 5611.1 6397.4 7191.5 7992.5 Hoop-6 395.6 784.6 1581.3 2396.2 3202.3 3994.6 4803.0 5582.7 6392.8 7201.6 7999.0 Hoop-7 343.1 834.0 1600.2 2409.5 3215.5 3997.2 4811.0 5600.1 6404.6 7193.5 8000.1 Hoop-8 28.6 732.9 1618.9 2395.4 3194.3 3978.8 4798.9 5604.8 6404.1 7188.4 7994.4 Hoop-9 12.4 790.3 1600.6 2397.8 3184.9 4017.0 4798.1 5601.1 6383.2 7204.2 7982.2 Hoop-10 20.3 806.3 1608.6 2399.6 3196.5 3993.6 4793.5 5608.1 6396.6 7202.3 7993.7 Hoop-11 5.4 797.9 1592.3 2379.0 3202.6 3971.8 4798.5 5583.7 6402.2 7162.1 8025.5 Hoop-12 -146.9 805.7 1568.7 2406.7 3166.1 3953.2 4811.5 5570.6 6374.6 7119.1 8011.0 Hoop-13 29.3 794.1 1595.9 2389.8 3199.0 3993.6 4802.2 5581.7 6398.7 6891.5 7465.1 Hoop-14 -10.3 795.6 1571.9 2399.9 3191.1 3997.5 4795.6 5601.6 6400.7 7229.2 8012.8 Long-1 -61.3 -73.1 -60.1 -57.7 -28.2 23.8 -45.9 -61.3 55.7 -32.9 19.1 Long-2 -50.7 -60.1 -57.8 28.3 -55.4 93.1 14.1 63.7 -51.9 42.4 -56.6 Long-3 -6.1 9.7 14.5 -13.4 7.2 -6.1 8.5 7.2 8.5 0.0 1.2 Long-4 35.6 4.4 -18.5 9.2 -1.7 3.2 -1.7 -1.7 -1.7 -8.9 6.8 Long-5 4.9 53.6 64.3 54.8 66.7 66.7 97.5 117.7 130.8 156.9 205.7 Long-6 81.3 28.3 94.5 3.0 6.6 -9.1 7.8 7.8 11.4 -13.9 17.4 Long-7 102.1 -75.8 -83.0 140.3 118.8 -69.9 103.3 -40.0 3.0 -22.1 10.1 Long-8 -54.5 -14.2 -28.4 10.8 -2.3 -14.2 -17.7 -11.8 -3.5 -2.3 7.2 Radial-1R 2204.1 2205.6 2209.9 2203.8 2208.1 2192.0 2148.8 2135.1 2133.0 2160.2 2163.7 Radial-2R -1740.4 -1671.7 -1699.8 -1315.4 -1620.1 -1664.1 -2255.9 -1539.7 -1754.5 -1977.6 -1695.3 Radial-3R -5.1 -5.8 -3.8 -6.6 -4.9 -5.4 -6.8 -3.0 -3.4 -4.9 -3.3
B-3

Table B-3. CP1, Load Condition A, Run 2 (Continued)
% Load 0 10 20 30 40 50 60 70 80 90 100 Pressure 0.02 0.67 1.37 2.02 2.68 3.36 4.05 4.77 5.40 6.04 6.80
Radial-4R -35.1 -35.5 -35.4 -36.5 -33.2 -36.2 -34.3 -33.1 -34.2 -32.3 -31.8 Radial-5R 5466.8 5228.0 5380.6 5331.0 5515.9 5270.1 5364.9 5891.5 5459.3 5590.8 5238.2 Radial-6R -9.5 -9.2 -11.8 -8.9 -9.6 -10.5 -9.6 -11.8 -11.5 -17.7 -15.5 Radial-7R -10.6 -10.9 -9.4 -11.3 -9.7 -9.8 -9.0 -9.1 -8.5 -8.1 -6.7 Radial-8R 1.5 1.3 0.8 0.0 1.7 0.8 0.9 2.7 2.9 2.4 3.7 Radial-9R 816.6 855.2 857.8 870.1 885.7 875.6 871.1 870.3 886.7 904.4 918.4 Radial-10R 2481.2 2476.2 2204.3 2298.8 2476.1 2604.4 2486.2 2553.8 2282.2 2550.5 2635.0 SG01 -141.2 -220.3 -277.3 -336.3 -422.1 -537.6 -617.8 -723.8 -802.7 -890.9 -992.2 SG02 ####### ####### ####### ####### ####### ####### ####### ####### ####### ####### #######SG03 -27.0 179.7 393.9 580.4 772.8 990.8 1188.8 1418.3 1624.1 1837.6 2087.6 SG04 ####### ####### ####### ####### ####### ####### ####### ####### ####### ####### #######SG05 -250.3 -331.4 -400.7 -482.3 -589.0 -732.8 -822.4 -947.3 -1006.0 -1129.0 -1226.4 SG06 ####### ####### ####### ####### ####### ####### ####### ####### ####### ####### #######SG07 -6.0 191.5 393.5 572.6 760.5 967.4 1159.8 1378.9 1572.8 1777.1 2018.1 SG08 ####### ####### ####### ####### ####### ####### ####### ####### ####### ####### #######SG09 -159.1 -223.2 -294.9 -373.2 -475.3 -593.3 -686.7 -799.9 -875.9 -973.8 -1082.7 SG10 -115.7 -183.2 -245.4 -312.3 -392.3 -485.6 -557.9 -649.9 -718.7 -800.3 -895.4 SG11 -5.1 208.9 420.9 607.7 799.8 1006.9 1205.4 1427.9 1625.5 1833.6 2077.1 SG12 131.7 286.9 456.3 623.4 802.7 1009.5 1186.6 1391.0 1559.0 1735.0 1943.1 SG13 -154.1 -243.6 -316.8 -390.2 -485.7 -601.0 -697.6 -808.4 -894.7 -994.9 -1117.1 SG14 -114.7 -193.7 -255.7 -318.8 -399.0 -492.5 -570.7 -663.6 -737.3 -822.1 -925.2 SG15 -11.1 214.9 434.0 623.9 820.6 1031.7 1237.8 1466.0 1672.5 1887.3 2140.9 SG16 138.1 291.5 450.3 601.6 770.3 969.0 1138.4 1331.0 1494.8 1661.7 1858.9 SG17 -162.7 -254.5 -318.8 -377.0 -462.0 -571.0 -658.6 -756.9 -840.4 -933.8 -1048.0 SG18 ####### ####### ####### ####### ####### ####### ####### ####### ####### ####### #######SG19 -44.4 180.1 396.4 560.9 759.6 951.6 1139.5 1348.1 1523.4 1737.1 1973.4 SG20 ####### ####### ####### ####### ####### ####### ####### ####### ####### ####### #######SG21 -201.5 -318.7 -390.4 -447.9 -540.3 -662.8 -755.6 -856.7 -969.4 -1088.2 -1240.5 SG22 ####### ####### ####### ####### ####### ####### ####### ####### ####### ####### #######SG23 4.4 244.6 486.3 690.8 906.9 1136.0 1361.0 1611.9 1843.7 2083.4 2367.6 SG24 ####### ####### ####### ####### ####### ####### ####### ####### ####### ####### #######SG25 -240.1 -298.3 -353.6 -435.8 -523.8 -635.4 -731.6 -828.8 -921.7 -1008.1 -1133.7 SG26 ####### ####### ####### ####### ####### ####### ####### ####### ####### ####### #######SG27 -88.0 110.1 315.0 497.5 698.5 879.5 1071.2 1288.5 1487.2 1694.5 1947.2 SG28 ####### ####### ####### ####### ####### ####### ####### ####### ####### ####### #######SG29 -182.4 -91.3 0.5 58.0 109.5 159.6 220.1 275.3 349.2 413.4 496.3
Table B-4. CP1, Load Condition 1, Run 3
% Load 0 10 20 30 40 50 60 70 80 90 100 Pressure -0.02 0.66 1.36 2.05 2.73 3.40 4.08 4.71 5.43 6.06 6.78
Hoop-1 458.4 949.8 1533.1 2532.1 3208.7 3984.2 4784.1 5583.0 6455.7 7096.2 8023.3 Hoop-2 -2.0 806.1 1586.5 2384.1 3208.2 3990.1 4800.6 5613.7 6390.3 7223.9 7987.5
B-4

Table B-4. CP1, Load Condition A, Run 3 (Continued)
% Load 0 10 20 30 40 50 60 70 80 90 100 Pressure -0.02 0.66 1.36 2.05 2.73 3.40 4.08 4.71 5.43 6.06 6.78
Hoop-3 -0.7 761.3 1602.8 2377.3 3186.2 3991.5 4766.6 5647.1 6410.9 7224.1 7969.2 Hoop-4 371.7 795.2 1601.6 2396.5 3197.2 4003.4 4789.6 5593.5 6386.7 7186.2 7991.7 Hoop-5 0.7 810.0 1605.0 2403.3 3210.9 4000.2 4790.1 5611.7 6401.0 7196.6 7997.9 Hoop-6 345.9 804.8 1594.4 2389.1 3202.3 3995.3 4787.0 5607.1 6389.1 7195.7 7993.5 Hoop-7 341.2 848.4 1625.7 2398.9 3201.2 3999.8 4806.1 5609.6 6401.0 7195.0 8007.3 Hoop-8 14.1 776.4 1626.0 2381.3 3223.3 3876.4 4798.9 5626.6 6402.9 7210.2 8016.2 Hoop-9 -19.9 804.5 1586.1 2400.1 3211.8 3994.7 4789.1 5608.3 6381.9 7186.3 8000.1 Hoop-10 34.5 793.8 1613.8 2405.4 3205.4 4000.0 4793.5 5593.8 6393.5 7205.8 7972.3 Hoop-11 -5.5 825.1 1617.6 2403.1 3168.0 3967.4 4776.6 5565.5 6379.1 7142.1 8023.7 Hoop-12 -84.2 864.6 1415.6 2374.0 3125.5 3875.1 4818.9 5659.1 6461.8 7185.4 7981.5 Hoop-13 -0.1 772.0 1610.5 2390.2 3199.0 4000.2 4794.8 5611.1 6397.4 7185.7 8002.1 Hoop-14 4.6 803.0 1594.1 2437.7 3183.7 3981.8 4773.2 5616.5 6392.0 7199.3 7990.4 Long-1 76.9 -70.7 134.9 80.5 27.3 48.6 55.7 -15.2 -25.8 -60.1 -32.9 Long-2 -64.8 50.7 88.4 50.7 -54.2 -56.6 -55.4 56.6 -55.4 -48.3 35.4 Long-3 0.0 -23.1 0.0 -7.3 3.6 2.4 4.8 2.4 -6.1 -8.5 -6.1 Long-4 20.0 -2.9 -2.9 -5.3 -7.7 -5.3 -7.7 3.2 -6.5 -1.7 -0.5 Long-5 -3.5 59.5 64.3 39.3 48.8 80.9 97.5 126.1 136.8 166.5 234.2 Long-6 -46.4 -9.1 -41.6 -65.7 35.5 -34.4 -1.9 -6.7 -10.3 -3.1 30.7 Long-7 28.0 -87.8 -72.2 109.2 -63.9 -75.8 50.7 -32.8 -26.9 -9.0 26.9 Long-8 44.0 -42.6 -7.0 -3.5 14.3 -21.3 -22.5 -13.0 -3.5 -17.7 -5.8 Radial-1R 2134.4 2028.1 1950.3 1811.6 1695.9 1650.4 1631.4 1631.8 1632.6 1634.3 1637.6 Radial-2R -1619.5 -1666.4 -1395.1 -1718.3 -1702.9 -1484.2 -1648.3 -1825.0 -1786.0 -1805.0 -1630.5 Radial-3R -5.8 -7.6 -6.4 -6.0 -5.8 -3.7 -3.7 -3.3 -5.1 -4.7 -3.1 Radial-4R -36.1 -37.0 -33.9 -34.9 -35.4 -33.6 -34.3 -33.2 -33.8 -31.2 -32.7 Radial-5R 5559.5 5226.4 5381.1 5247.4 5476.0 5364.4 5172.4 5462.0 5194.6 5259.2 5557.9 Radial-6R -8.9 -8.8 -8.1 -9.5 -9.7 -11.1 -10.4 -10.5 -16.1 -14.5 -16.6 Radial-7R -11.3 -12.5 -9.7 -8.7 -11.4 -9.7 -9.7 -8.7 -8.3 -7.9 -7.3 Radial-8R 0.0 1.5 -0.6 0.5 0.8 2.0 3.1 2.3 1.7 1.9 3.9 Radial-9R 923.1 939.3 955.3 946.1 954.3 959.8 987.5 960.6 977.9 956.9 976.9 Radial-10R 2909.2 2713.7 2977.6 2912.7 2848.8 3097.5 3042.8 3037.7 3053.6 2919.5 3958.2 SG01 -212.7 -240.2 -301.8 -405.5 -479.9 -563.9 -636.5 -730.0 -813.7 -898.2 -986.4 SG02 ####### ####### ####### ####### ####### ####### ####### ####### ####### ####### #######SG03 -57.6 144.8 353.7 559.6 767.7 982.0 1189.5 1386.4 1620.7 1830.4 2064.3 SG04 ####### ####### ####### ####### ####### ####### ####### ####### ####### ####### #######SG05 -361.4 -363.1 -449.3 -586.3 -677.0 -770.9 -853.6 -960.8 -1050.9 -1141.3 -1219.5 SG06 ####### ####### ####### ####### ####### ####### ####### ####### ####### ####### #######SG07 -27.9 163.0 357.9 559.7 760.3 965.7 1163.5 1351.7 1573.4 1769.7 1992.6 SG08 ####### ####### ####### ####### ####### ####### ####### ####### ####### ####### #######SG09 -227.1 -242.1 -325.6 -438.2 -526.2 -618.8 -703.8 -809.7 -891.8 -981.7 -1075.9 SG10 -162.1 -195.0 -262.5 -352.0 -423.4 -499.1 -568.8 -653.2 -729.3 -805.4 -886.4 SG11 -32.6 176.2 375.8 581.8 788.8 1002.3 1206.6 1400.5 1626.6 1825.6 2052.4 SG12 175.4 287.3 468.3 673.2 848.9 1028.9 1205.8 1382.6 1574.4 1745.9 1938.5 SG13 -233.6 -264.8 -343.4 -450.4 -539.4 -629.5 -716.5 -820.2 -913.9 -1005.5 -1107.3
B-5

Table B-4. CP1, Load Condition A, Run 3 (Continued)
% Load 0 10 20 30 40 50 60 70 80 90 100 Pressure -0.02 0.66 1.36 2.05 2.73 3.40 4.08 4.71 5.43 6.06 6.78
SG14 -172.1 -209.6 -274.4 -364.0 -437.4 -513.5 -585.6 -672.4 -750.5 -832.0 -916.3 SG15 -38.7 182.1 386.1 595.4 810.0 1028.9 1239.5 1439.2 1673.8 1880.6 2115.0 SG16 191.5 295.7 466.4 659.6 826.8 993.5 1160.3 1329.4 1513.2 1678.8 1862.3 SG17 -254.7 -284.0 -351.0 -445.0 -527.8 -606.2 -683.9 -776.4 -863.0 -953.7 -1042.7 SG18 ####### ####### ####### ####### ####### ####### ####### ####### ####### ####### #######SG19 -76.2 147.0 344.9 529.6 739.0 948.8 1140.1 1321.6 1518.8 1732.9 1945.9 SG20 ####### ####### ####### ####### ####### ####### ####### ####### ####### ####### #######SG21 -260.7 -357.9 -392.8 -517.4 -597.2 -691.3 -786.1 -888.3 -992.8 -1128.9 -1244.8 SG22 ####### ####### ####### ####### ####### ####### ####### ####### ####### ####### #######SG23 -29.9 211.3 432.8 650.6 884.7 1129.5 1365.3 1584.5 1844.9 2079.8 2338.3 SG24 ####### ####### ####### ####### ####### ####### ####### ####### ####### ####### #######SG25 -362.1 -365.2 -438.3 -549.5 -625.5 -704.8 -772.8 -835.4 -927.1 -1031.5 -1112.7 SG26 ####### ####### ####### ####### ####### ####### ####### ####### ####### ####### #######SG27 -120.3 78.1 271.0 468.4 671.0 876.7 1092.8 1263.2 1492.8 1691.0 1923.8 SG28 ####### ####### ####### ####### ####### ####### ####### ####### ####### ####### #######SG29 -246.8 -121.3 -60.7 -0.2 67.7 123.7 204.4 243.2 317.1 405.8 479.1
Table B-5. CP1, Load Condition B, Run 1
% Load 0 10 20 30 40 50 60 70 80 90 100 Pressure -0.01 0.00 0.00 0.01 0.00 0.00 0.00 0.02 0.00 0.00 0.00
Hoop-1 566.8 438.3 332.0 255.0 93.7 18.5 -14.5 -1.7 -12.7 18.5 -7.2 Hoop-2 -19.6 -17.9 17.3 92.8 -21.4 -12.6 6.7 6.7 -5.6 15.5 -9.1 Hoop-3 -9.7 -20.5 13.7 28.2 -18.7 -0.7 24.5 26.4 1.1 13.7 1.1 Hoop-4 -5.4 28.1 91.2 134.0 197.1 277.0 429.3 557.5 682.0 886.3 1016.3 Hoop-5 -2.9 -6.6 18.9 6.2 -17.5 -2.9 -15.7 8.0 6.2 11.6 28.0 Hoop-6 296.5 289.1 290.9 276.2 241.3 261.6 435.9 547.9 663.6 748.0 830.6 Hoop-7 429.4 319.6 258.5 200.9 71.4 -2.3 4.9 4.9 73.2 206.3 296.3 Hoop-8 -80.3 21.4 -131.1 28.6 -14.9 -102.1 28.6 -44.0 14.1 6.8 -0.4 Hoop-9 -12.7 -25.3 32.1 1.6 -10.9 3.4 -5.5 -5.5 -7.3 -2.0 1.6 Hoop-10 22.1 -1.1 7.8 2.5 2.5 4.3 -8.2 -4.7 0.7 9.6 -6.4 Hoop-11 -0.1 7.2 18.1 34.5 -0.1 25.4 -29.1 50.8 19.9 -16.4 -85.5 Hoop-12 -163.5 -143.2 44.7 -106.3 133.2 131.3 -69.5 -215.1 -187.4 -65.8 -32.6 Hoop-13 -14.8 -0.1 7.2 7.2 -0.1 -0.1 -0.1 29.3 29.3 -7.5 -22.2 Hoop-14 -2.9 4.6 12.0 4.6 -10.3 -10.3 4.6 -2.9 -17.8 4.6 12.0 Long-1 -68.4 687.8 1466.4 2130.6 2838.1 3491.0 4183.8 4929.3 5578.0 6334.8 7041.4 Long-2 -67.2 668.5 1476.1 2091.7 2822.5 3387.9 4094.6 4908.2 5634.4 6294.1 6960.3 Long-3 10.9 708.9 1420.2 2119.6 2802.8 3500.2 4191.4 4902.7 5600.7 6305.4 6994.9 Long-4 -12.5 682.9 1407.2 2106.4 2807.6 3508.5 4218.8 4884.2 5586.8 6292.4 7007.1 Long-5 -1.1 799.8 1412.9 2139.0 2863.6 3513.1 4175.4 4925.1 5651.1 6310.0 7031.3 Long-6 -89.8 658.2 1371.2 2108.6 2778.1 3482.2 4190.9 4896.7 5574.9 6307.8 6964.3 Long-7 -92.5 620.3 1329.5 2081.9 2761.0 3576.0 4243.9 4897.0 5643.2 6258.7 7001.4 Long-8 -42.6 763.0 1200.8 2144.3 2847.7 3287.3 4097.0 4901.5 5514.9 6315.2 7039.0
B-6

Table B-5. CP1, Load Condition B, Run 1 (Continued)
% Load 0 10 20 30 40 50 60 70 80 90 100 Pressure -0.01 0.00 0.00 0.01 0.00 0.00 0.00 0.02 0.00 0.00 0.00
Radial-1R 1666.5 1680.0 1670.0 1663.3 1657.4 1646.4 1639.1 1638.4 1632.9 1615.3 1588.2 Radial-2R -1671.2 -1805.1 -1800.9 -1389.4 -1598.1 -1288.0 -1590.5 -1680.6 -1666.2 -1599.4 -1536.0 Radial-3R -6.2 -4.3 -3.8 -5.7 -5.7 -5.1 -6.6 -4.7 -5.3 -5.8 -4.9 Radial-4R -38.0 -35.7 -35.9 -35.1 -36.9 -35.1 -37.4 -36.9 -36.2 -35.9 -35.9 Radial-5R 5216.7 5371.9 5408.0 5319.6 5487.8 5333.6 5534.2 5264.1 5250.1 5021.0 5512.1 Radial-6R -9.2 -11.5 -10.3 -8.6 -8.2 -8.4 -8.5 -8.1 -9.1 -8.1 -9.2 Radial-7R -12.8 -11.9 -11.8 -10.8 -12.0 -11.0 -11.7 -11.7 -11.4 -11.9 -11.0 Radial-8R 0.0 1.0 0.5 0.6 0.4 1.5 -0.4 0.9 1.5 0.6 0.9 Radial-9R 1012.2 1055.4 1092.8 1079.2 1048.0 1078.1 1073.0 1084.2 1038.8 1041.0 1079.8 Radial-10R 3061.6 3202.8 3125.3 3295.8 3271.6 3191.9 3646.3 3649.2 3659.6 3654.8 3710.6 SG01 -205.8 -14.2 174.1 368.0 577.0 757.8 934.1 1100.4 1269.0 1439.5 1624.6 SG02 ####### ####### ####### ####### ####### ####### ####### ####### ####### ####### #######SG03 -63.7 -125.7 -175.9 -241.8 -305.3 -370.4 -431.0 -490.1 -562.4 -626.0 -691.9 SG04 ####### ####### ####### ####### ####### ####### ####### ####### ####### ####### #######SG05 -328.4 -99.9 137.3 356.1 598.6 813.8 998.8 1185.6 1365.7 1562.1 1772.0 SG06 ####### ####### ####### ####### ####### ####### ####### ####### ####### ####### #######SG07 -28.3 -94.6 -146.9 -212.6 -282.5 -348.1 -403.0 -460.5 -530.4 -591.5 -657.0 SG08 ####### ####### ####### ####### ####### ####### ####### ####### ####### ####### #######SG09 -220.7 -16.6 172.6 354.4 550.2 728.9 885.1 1056.9 1222.8 1399.7 1581.6 SG10 -160.1 14.7 176.8 339.3 511.0 676.5 818.9 976.9 1131.4 1288.2 1451.1 SG11 -31.8 -89.3 -139.8 -195.9 -252.2 -309.1 -363.9 -419.9 -489.5 -547.1 -608.0 SG12 151.4 47.9 -52.8 -143.1 -255.9 -358.6 -424.5 -503.9 -582.8 -675.6 -767.6 SG13 -208.5 -24.5 155.9 327.1 514.4 689.6 841.1 1006.1 1164.3 1332.6 1507.3 SG14 -157.6 14.1 182.7 343.6 516.4 679.8 825.2 985.7 1138.9 1296.6 1461.2 SG15 -42.2 -96.1 -143.0 -196.2 -248.5 -300.7 -354.5 -407.7 -474.9 -527.6 -584.2 SG16 152.6 65.9 -26.3 -104.3 -205.5 -297.7 -350.7 -416.8 -479.9 -562.5 -644.2 SG17 -216.9 -39.1 141.2 308.1 492.7 661.7 812.6 974.9 1127.1 1289.1 1456.8 SG18 ####### ####### ####### ####### ####### ####### ####### ####### ####### ####### #######SG19 -63.7 -119.9 -159.2 -208.1 -252.4 -278.0 -322.8 -392.4 -453.6 -498.8 -544.7 SG20 ####### ####### ####### ####### ####### ####### ####### ####### ####### ####### #######SG21 -268.5 -74.7 140.7 323.3 539.4 740.8 933.0 1131.4 1320.9 1521.5 1724.4 SG22 ####### ####### ####### ####### ####### ####### ####### ####### ####### ####### #######SG23 -29.2 -100.2 -173.5 -245.4 -321.6 -395.7 -473.4 -553.5 -647.4 -729.7 -806.8 SG24 ####### ####### ####### ####### ####### ####### ####### ####### ####### ####### #######SG25 -298.2 -105.8 150.9 319.4 537.9 723.0 904.8 1082.4 1237.6 1424.1 1605.4 SG26 ####### ####### ####### ####### ####### ####### ####### ####### ####### ####### #######SG27 -109.9 -178.0 -220.9 -275.7 -332.5 -386.6 -444.2 -499.8 -570.0 -629.2 -689.3 SG28 ####### ####### ####### ####### ####### ####### ####### ####### ####### ####### #######SG29 -242.7 -170.7 -75.8 -16.7 82.1 139.8 219.8 296.2 351.4 418.1 464.5
B-7

Table B-6. CP1, Load Condition B, Run 2
% Load 0 10 20 30 40 50 60 70 80 90 100 Pressure 0.00 0.00 0.01 0.01 0.02 -0.04 0.02 0.03 0.01 0.02 0.03
Hoop-1 -12.7 7.5 -23.7 5.7 -1.7 -1.7 -10.8 0.2 -29.2 -3.5 -16.3 Hoop-2 -10.8 -16.1 -9.1 -3.8 15.5 -19.6 -14.3 -3.8 -14.3 1.5 -10.8 Hoop-3 -4.3 -9.7 6.5 6.5 22.7 -13.3 -13.3 -15.1 10.1 6.5 -7.9 Hoop-4 -1.6 -7.2 -9.1 15.1 211.9 236.1 425.7 499.9 648.5 709.8 804.4 Hoop-5 -4.8 -2.9 -17.5 20.7 -8.4 -4.8 2.5 6.2 8.0 44.3 64.3 Hoop-6 467.2 516.8 579.1 645.3 700.1 727.8 772.0 814.0 845.2 880.1 894.7 Hoop-7 826.9 947.5 1019.2 1100.4 1193.6 1174.0 1102.2 1022.8 918.5 877.2 797.9 Hoop-8 -0.4 43.1 -58.5 28.6 28.6 -0.4 72.2 50.4 14.1 6.8 35.9 Hoop-9 3.4 -2.0 -5.5 -12.7 35.7 -7.3 -3.8 -9.1 -23.5 41.1 -9.1 Hoop-10 2.5 18.5 -1.1 0.7 6.0 -4.7 6.0 4.3 -10.0 2.5 -2.9 Hoop-11 -16.4 -29.1 -40.0 -9.1 -21.9 -7.3 -7.3 83.5 -41.9 105.4 25.4 Hoop-12 -222.4 107.4 -75.0 77.9 -185.5 -211.3 70.5 61.3 -99.0 -152.4 -40.0 Hoop-13 -14.8 7.2 -0.1 7.2 29.3 -22.2 14.6 44.0 -22.2 -36.9 58.7 Hoop-14 12.0 -10.3 -10.3 -10.3 34.4 -2.9 27.0 -2.9 -17.8 -32.7 4.6 Long-1 -19.9 723.2 1419.3 2069.9 2821.8 3486.3 4243.7 4862.5 5632.3 6266.8 6965.7 Long-2 -77.8 700.3 1417.3 2126.7 2862.9 3547.1 4247.6 4840.3 5540.1 6267.5 6974.5 Long-3 1.2 680.9 1375.4 2088.8 2804.3 3502.6 4219.0 4908.1 5593.4 6296.2 6990.1 Long-4 0.7 696.1 1388.1 2092.7 2786.2 3466.4 4170.3 4909.9 5592.8 6311.0 6973.4 Long-5 16.7 1075.4 1373.8 2073.3 2757.0 3440.6 4183.3 4898.3 5545.3 6314.1 6976.6 Long-6 106.6 632.9 1393.1 2073.2 2753.1 3526.8 4244.8 4902.0 5618.2 6259.0 6998.0 Long-7 -79.4 682.3 1343.9 2080.2 2729.0 3476.9 4176.7 4882.0 5634.9 6261.7 7024.1 Long-8 108.1 736.9 1337.4 1948.1 2780.3 3543.6 3969.7 4854.5 5435.4 6337.1 6947.7 Radial-1R 1512.0 1510.4 1501.6 1489.2 1481.0 1477.8 1476.2 1463.4 1448.2 1443.1 1445.1 Radial-2R -1645.2 -2024.5 -1754.6 -1280.6 -1667.6 -1631.4 -1477.5 -1753.2 -1884.3 -1773.9 -1589.4 Radial-3R -5.3 -4.9 -5.1 -5.1 -5.4 -5.4 -4.3 -5.0 -5.3 -4.7 -4.7 Radial-4R -35.3 -36.6 -35.7 -36.1 -36.5 -36.1 -36.1 -36.2 -35.8 -36.2 -35.8 Radial-5R 5070.6 5168.7 5146.6 5321.2 5168.2 5209.7 5471.1 5267.9 5447.4 5362.2 5450.1 Radial-6R -8.0 -7.8 -8.4 -7.8 -7.8 -8.1 -8.1 -8.1 -8.1 -8.6 -7.6 Radial-7R -11.8 -12.4 -11.3 -11.6 -11.2 -11.6 -12.0 -11.7 -11.6 -11.8 -11.7 Radial-8R 0.2 0.8 0.8 0.2 0.2 0.2 0.4 0.2 1.2 0.9 1.2 Radial-9R 1213.0 1197.1 1188.7 1215.6 1224.8 1248.3 1225.7 1234.8 1244.5 1232.6 1160.4 Radial-10R 3739.1 3823.6 3656.2 3837.6 4004.4 3940.1 3928.4 3949.1 3753.7 3923.3 3469.6 SG01 -154.9 -26.4 115.4 270.6 466.8 632.1 825.4 1007.5 1217.1 1392.8 1604.5 SG02 ####### ####### ####### ####### ####### ####### ####### ####### ####### ####### #######SG03 -66.0 -126.5 -178.3 -239.7 -294.1 -375.5 -417.0 -485.2 -551.8 -613.7 -682.5 SG04 ####### ####### ####### ####### ####### ####### ####### ####### ####### ####### #######SG05 -305.4 -126.9 38.1 212.9 429.2 619.4 848.6 1052.6 1303.5 1505.2 1740.4 SG06 ####### ####### ####### ####### ####### ####### ####### ####### ####### ####### #######SG07 -19.2 -80.1 -125.6 -182.9 -239.2 -318.0 -368.6 -433.9 -507.7 -570.2 -642.9 SG08 ####### ####### ####### ####### ####### ####### ####### ####### ####### ####### #######SG09 -162.5 3.6 133.8 282.7 466.5 630.1 821.6 996.8 1207.6 1379.1 1571.3 SG10 -127.6 23.1 142.7 278.7 441.8 592.3 767.6 928.3 1113.6 1269.8 1443.9
B-8

Table B-6. CP1, Load Condition B, Run 2 (Continued)
% Load 0 10 20 30 40 50 60 70 80 90 100 Pressure 0.00 0.00 0.01 0.01 0.02 -0.04 0.02 0.03 0.01 0.02 0.03
SG11 -43.8 -102.3 -146.3 -198.8 -250.0 -321.6 -366.9 -425.1 -493.8 -547.1 -607.7 SG12 126.5 48.9 -9.7 -77.3 -166.2 -255.9 -352.2 -438.5 -558.6 -645.7 -742.2 SG13 -141.5 9.5 143.0 285.5 465.2 616.0 801.9 969.3 1170.4 1334.5 1515.0 SG14 -110.4 37.5 165.3 302.0 469.0 613.0 787.2 948.1 1134.4 1289.7 1462.1 SG15 -58.0 -113.9 -159.7 -210.5 -260.5 -328.8 -369.8 -424.2 -486.9 -536.9 -592.1 SG16 121.6 57.8 1.8 -56.2 -136.3 -210.7 -293.0 -368.1 -473.8 -547.9 -631.1 SG17 -146.7 -4.3 133.3 273.5 451.0 595.2 774.5 938.6 1132.1 ####### 1469.2 SG18 ####### ####### ####### ####### ####### ####### ####### ####### ####### ####### #######SG19 -83.7 -132.6 -157.3 -197.3 -262.8 -324.9 -359.4 -380.6 -458.7 -474.1 -523.9 SG20 ####### ####### ####### ####### ####### ####### ####### ####### ####### ####### #######SG21 -172.9 -11.2 142.3 306.2 524.5 698.6 903.6 1092.3 1322.9 1508.6 1718.1 SG22 ####### ####### ####### ####### ####### ####### ####### ####### ####### ####### #######SG23 -57.7 -126.4 -188.6 -256.7 -331.3 -415.7 -487.1 -559.7 -656.3 -729.3 -796.6 SG24 ####### ####### ####### ####### ####### ####### ####### ####### ####### ####### #######SG25 -170.3 -20.5 128.5 276.9 479.6 616.4 821.6 1007.4 1230.6 1367.2 1582.0 SG26 ####### ####### ####### ####### ####### ####### ####### ####### ####### ####### #######SG27 -152.0 -197.7 -244.3 -297.6 -347.6 -417.1 -453.5 -509.8 -575.9 -627.4 -683.6 SG28 ####### ####### ####### ####### ####### ####### ####### ####### ####### ####### #######SG29 -191.9 -140.9 -87.1 -53.4 35.7 71.6 159.8 227.9 315.5 390.1 456.0
Table B-7. CP1, Load Condition B, Run 3
% Load 0 10 20 30 40 50 60 70 80 90 100 Pressure 0.00 -0.02 0.00 0.01 -0.05 0.02 0.02 0.02 0.02 0.05 0.01
Hoop-1 11.2 -34.7 -16.3 -18.2 -7.2 5.7 0.2 5.7 22.2 -5.3 5.7 Hoop-2 1.5 -23.1 -16.1 -21.4 -5.6 10.3 -10.8 13.8 24.3 -0.3 -9.1 Hoop-3 11.9 -31.3 13.7 -0.7 17.3 4.7 6.5 24.5 28.1 13.7 -4.3 Hoop-4 0.2 -20.2 -9.1 -5.4 2.1 107.9 251.0 338.2 481.3 598.4 702.3 Hoop-5 4.3 -28.4 -1.1 -15.7 -2.9 15.2 -12.0 11.6 6.2 29.8 73.4 Hoop-6 391.9 426.8 538.6 625.0 676.4 725.9 753.4 808.4 837.9 852.6 848.8 Hoop-7 834.2 871.9 1003.0 1148.9 1193.8 1226.1 1157.7 1076.7 985.1 920.4 814.1 Hoop-8 6.8 6.8 -36.7 43.1 35.9 -7.7 50.4 -0.4 50.4 -7.7 6.8 Hoop-9 -0.2 -21.7 -27.1 -5.5 -14.5 -10.9 -21.7 -0.2 -10.9 -7.3 -46.8 Hoop-10 4.3 6.0 0.7 -15.3 -4.7 0.7 -13.6 -10.0 32.8 6.0 6.0 Hoop-11 25.4 -12.8 -16.4 -3.7 14.5 30.8 -40.0 12.7 9.0 -21.9 23.6 Hoop-12 -216.9 -80.6 -261.1 46.6 55.8 100.0 -47.4 114.8 112.9 120.3 -205.9 Hoop-13 -7.5 -36.9 -14.8 -14.8 14.6 14.6 -44.2 14.6 14.6 -14.8 14.6 Hoop-14 12.0 -17.8 4.6 4.6 4.6 -10.3 -10.3 4.6 34.4 -10.3 4.6 Long-1 43.9 707.9 1386.2 2076.3 2795.9 3518.5 4184.2 4873.8 5631.7 6328.2 7037.8 Long-2 82.5 642.6 1344.2 2140.1 2730.8 3446.1 4169.3 4890.5 5552.4 6268.7 7019.3 Long-3 46.1 729.6 1431.2 2111.1 2805.5 3528.5 4180.9 4912.4 5594.0 6297.5 7007.1 Long-4 1.9 726.3 1401.3 2104.0 2780.2 3511.3 4212.0 4903.4 5598.2 6313.5 7009.5
B-9

Table B-7. CP1, Load Condition B, Run 3 (Continued)
% Load 0 10 20 30 40 50 60 70 80 90 100 Pressure 0.00 -0.02 0.00 0.01 -0.05 0.02 0.02 0.02 0.02 0.05 0.01
Long-5 7.2 644.2 1407.1 2076.1 2814.0 3526.5 4174.6 4885.9 5611.2 6309.3 7013.4 Long-6 -85.0 616.1 1413.5 2076.1 2780.8 3497.0 4188.9 4900.4 5595.9 6309.6 6977.6 Long-7 141.5 746.9 1409.6 2059.2 2920.1 3499.9 4219.2 4894.6 5590.0 6305.9 7006.2 Long-8 -43.8 572.0 1456.1 2111.1 2712.7 3554.7 4109.3 4861.1 5552.2 6222.0 7069.9 Radial-1R 1439.2 1424.1 1423.0 1412.6 1399.2 1373.1 1353.2 1343.8 1344.1 1349.1 1336.3 Radial-2R -1758.8 -1786.5 -1497.2 -1560.9 -1537.7 -1561.6 -1542.5 -1927.0 -1669.1 -1547.1 -1873.1 Radial-3R -5.4 -4.2 -5.0 -5.4 -4.2 -4.2 -4.1 -5.0 -4.2 -4.3 -4.9 Radial-4R -35.4 -36.2 -35.7 -36.6 -35.9 -35.8 -35.9 -36.3 -36.2 -35.9 -35.4 Radial-5R 5003.7 5466.3 5432.8 4922.9 5238.2 5276.5 5597.8 5006.5 5272.8 5252.3 5281.9 Radial-6R -8.5 -8.5 -7.6 -7.3 -7.2 -7.2 -8.1 -6.9 -7.4 -7.3 -7.4 Radial-7R -11.4 -11.7 -12.1 -11.8 -12.0 -11.6 -11.4 -11.7 -11.2 -11.4 -11.2 Radial-8R 0.8 0.9 0.4 0.6 0.5 0.2 0.4 0.4 1.2 1.0 1.2 Radial-9R 1163.4 1162.3 1139.8 1169.5 1151.5 1055.0 1013.3 975.8 1033.2 966.4 959.1 Radial-10R 4200.9 3831.7 3973.6 3577.2 3985.1 4038.3 3754.2 4048.0 3933.3 3821.2 3784.2 SG01 -135.1 -15.6 137.6 306.5 465.2 674.7 857.2 1043.1 1237.6 1424.3 1624.7 SG02 ####### ####### ####### ####### ####### ####### ####### ####### ####### ####### #######SG03 -68.1 -130.2 -188.6 -240.9 -320.1 -362.6 -424.0 -491.1 -556.3 -618.3 -699.1 SG04 ####### ####### ####### ####### ####### ####### ####### ####### ####### ####### #######SG05 -276.7 -112.7 69.4 252.2 438.8 672.8 885.6 1098.0 1324.2 1539.9 1774.9 SG06 ####### ####### ####### ####### ####### ####### ####### ####### ####### ####### #######SG07 -23.3 -82.6 -136.5 -184.8 -261.5 -307.2 -372.7 -441.1 -510.6 -575.0 -660.2 SG08 ####### ####### ####### ####### ####### ####### ####### ####### ####### ####### #######SG09 -138.4 14.8 165.1 316.1 476.0 668.6 849.7 1029.9 1221.5 1405.5 1597.6 SG10 -114.2 23.0 161.1 297.5 445.4 618.2 783.6 947.8 1119.3 1287.6 1463.4 SG11 -43.1 -100.4 -151.5 -195.9 -267.9 -305.9 -368.1 -429.3 -491.0 -547.5 -621.1 SG12 112.9 36.4 -32.5 -101.4 -185.8 -279.5 -376.2 -468.6 -568.0 -660.5 -771.9 SG13 -120.2 19.5 167.9 320.7 471.9 668.6 843.0 1012.1 1192.5 1366.7 1548.9 SG14 -98.0 38.5 179.8 323.6 468.9 649.5 814.0 975.4 1146.4 1313.2 1488.3 SG15 -55.7 -111.9 -162.8 -207.9 -277.5 -315.5 -374.0 -431.3 -488.1 -539.7 -608.6 SG16 107.6 42.6 -18.0 -83.3 -155.1 -243.3 -326.3 -404.1 -489.4 -567.9 -664.4 SG17 -129.3 2.4 149.6 305.3 452.5 650.4 818.6 982.0 1156.3 1326.0 1502.7 SG18 ####### ####### ####### ####### ####### ####### ####### ####### ####### ####### #######SG19 -66.3 -130.3 -172.5 -212.4 -257.0 -288.5 -334.4 -383.3 -435.7 -480.7 -560.0 SG20 ####### ####### ####### ####### ####### ####### ####### ####### ####### ####### #######SG21 -154.7 -2.2 157.8 338.1 506.3 737.1 933.9 1123.6 1331.7 1521.7 1740.0 SG22 ####### ####### ####### ####### ####### ####### ####### ####### ####### ####### #######SG23 -53.1 -124.1 -190.7 -252.7 -338.7 -396.1 -482.1 -559.7 -639.0 -711.5 -809.4 SG24 ####### ####### ####### ####### ####### ####### ####### ####### ####### ####### #######SG25 -150.7 -17.5 159.1 325.2 467.4 691.6 845.2 1050.0 1239.5 1411.6 1624.8 SG26 ####### ####### ####### ####### ####### ####### ####### ####### ####### ####### #######SG27 -153.3 -206.6 -254.5 -287.9 -357.9 -402.0 -462.0 -515.0 -570.6 -629.7 -688.2 SG28 ####### ####### ####### ####### ####### ####### ####### ####### ####### ####### #######SG29 -176.7 -140.1 -89.3 -33.9 15.5 114.9 183.8 249.6 327.4 408.9 488.2
B-10

Table B-8. CP1, Load Condition C, Run 1
% Load 0 10 20 30 40 50 60 70 80 90 100 Pressure 0.00 1.39 2.74 4.07 5.43 6.76 8.08 9.42 10.82 12.17 13.46
Hoop-1 22.2 1556.6 3209.0 4804.2 6524.2 8007.5 9637.6 11190.7 12806.7 14469.6 15992.9Hoop-2 24.3 1633.7 3205.0 4809.4 6426.1 8012.9 9585.7 11202.3 12782.6 14393.9 16012.0Hoop-3 13.7 1600.7 3195.5 4775.6 6416.9 7986.2 9582.5 11245.5 12829.7 14382.6 15982.1Hoop-4 3.9 1629.2 3206.8 4806.4 6398.5 7979.5 9590.2 11197.2 12793.7 14396.8 15990.4Hoop-5 33.4 1664.7 3202.1 4815.5 6399.9 7993.3 9615.8 11209.2 12808.7 14416.5 16033.1Hoop-6 263.4 1608.8 3206.3 4796.2 6397.1 7996.1 9600.7 11199.7 12799.3 14400.0 16004.2Hoop-7 21.1 1627.1 3205.1 4811.5 6396.3 8051.2 9591.1 11217.2 12827.7 14396.2 16016.6Hoop-8 14.1 1618.7 3201.5 4792.1 6389.6 7964.6 9561.9 11211.2 12794.2 14406.2 16012.6Hoop-9 -2.0 1568.2 3211.8 4780.6 6415.5 7986.8 9598.2 11201.7 12800.7 14385.3 16019.9Hoop-10 0.7 1647.6 3189.4 4797.6 6409.0 7992.9 9611.4 11195.2 12792.4 14403.9 16002.6Hoop-11 -1.9 1561.3 3177.1 4831.7 6351.3 7993.8 9635.1 11208.5 12831.8 14420.5 16000.0Hoop-12 31.8 1579.6 3245.3 4819.3 6389.4 8047.1 9388.5 11254.3 12802.2 14313.3 15980.7Hoop-13 -0.1 1610.5 3176.9 4802.7 6428.1 7971.8 9619.2 11201.5 12797.5 14400.9 15483.6Hoop-14 12.0 1609.1 3213.5 4796.1 6408.2 8004.6 9586.7 11207.2 12811.8 14401.5 16000.3Long-1 -22.3 1434.6 2794.7 4194.5 5645.9 6979.9 8295.1 9799.2 11223.2 12631.5 14002.0Long-2 -75.5 1412.6 2766.2 4236.1 5537.1 7071.1 8374.1 9767.8 11197.0 12588.1 13993.5Long-3 23.0 1394.8 2786.0 4165.9 5646.2 7002.2 8386.1 9800.4 11199.1 12587.7 14001.8Long-4 47.7 1402.5 2819.9 4190.0 5605.4 6986.7 8414.9 9823.9 11207.8 12600.9 14001.3Long-5 28.6 1490.2 2755.8 4196.8 5624.3 7014.6 8353.8 9784.5 11222.5 12540.1 13933.9Long-6 165.6 1446.1 2861.5 4263.2 5612.8 7042.6 8378.5 9813.2 11207.1 12599.3 13985.7Long-7 -46.0 1464.5 2879.5 4276.1 5367.9 7120.8 8480.9 9807.5 11190.4 12555.0 14020.0Long-8 -2.3 1332.6 2745.9 3980.8 5572.4 6980.9 8404.8 9736.2 11210.1 12585.2 13978.1Radial-1R 2561.4 2561.3 2547.2 2510.5 2507.4 2497.7 2549.9 2636.7 2720.8 2795.0 2918.2 Radial-2R -1544.7 -1359.3 -1576.0 -1599.3 -1708.6 -1748.2 -1453.2 -1521.1 -1923.3 -1733.1 -1698.7 Radial-3R -5.1 -3.5 -1.9 -3.5 -4.1 -3.0 -0.8 1.8 63.4 155.7 245.8 Radial-4R -36.6 -36.2 -33.7 -34.1 -34.3 -32.8 -32.0 7.1 101.9 204.7 316.1 Radial-5R 5519.1 5576.8 5457.1 5463.6 5264.6 5245.8 5460.3 5543.4 5386.5 5418.3 5383.8 Radial-6R -10.1 -9.5 -8.9 -10.8 -16.2 -18.0 -23.4 25.4 116.3 215.4 304.0 Radial-7R -8.9 -8.6 -8.6 -7.7 -7.5 -6.4 -5.0 18.4 102.7 181.6 268.0 Radial-8R 2.7 4.3 6.0 5.1 2.3 5.0 40.1 116.8 223.3 333.4 436.2 Radial-9R 540.6 564.3 562.8 553.0 574.1 578.3 561.6 634.3 754.4 853.2 951.2 Radial-10R 1017.3 1093.1 1149.3 1180.1 1324.2 1355.7 1400.1 1485.5 1497.9 1600.2 1571.3 SG01 -87.7 86.5 268.0 430.5 594.1 781.3 1008.2 1183.0 1363.9 1535.2 1717.9 SG02 ####### ####### ####### ####### ####### ####### ####### ####### ####### ####### #######SG03 -36.7 295.2 583.6 826.3 1089.9 1350.9 1618.0 1884.6 2149.9 2398.6 2625.8 SG04 ####### ####### ####### ####### ####### ####### ####### ####### ####### ####### #######SG05 -150.4 58.8 272.3 460.8 636.2 835.7 1086.6 1281.9 1487.2 1693.0 1893.6 SG06 ####### ####### ####### ####### ####### ####### ####### ####### ####### ####### #######SG07 -22.7 290.6 563.3 787.6 1032.1 1278.3 1539.8 1792.8 2052.9 2294.4 2511.2 SG08 ####### ####### ####### ####### ####### ####### ####### ####### ####### ####### #######SG09 -95.6 78.9 233.9 392.1 531.4 686.5 886.2 1049.0 1217.7 1381.3 1561.1 SG10 -69.5 75.4 216.5 366.1 501.4 653.3 828.9 989.6 1156.1 1317.2 1493.1 SG11 -9.8 339.7 649.8 894.0 1163.6 1435.5 1725.3 1985.4 2249.0 2494.9 2719.5 SG12 59.5 275.4 468.9 652.4 862.2 1072.4 1185.2 1373.0 1555.3 1728.9 1887.4 SG13 -96.1 26.0 161.4 292.8 407.4 529.2 694.2 848.0 999.4 1149.0 1312.0
B-11

Table B-8. CP1, Load Condition C, Run 1 (Continued)
% Load 0 10 20 30 40 50 60 70 80 90 100 Pressure 0.00 1.39 2.74 4.07 5.43 6.76 8.08 9.42 10.82 12.17 13.46
SG14 -65.4 69.0 213.9 357.1 490.7 629.5 793.9 955.0 1110.8 1266.4 1432.7 SG15 -15.3 357.8 679.2 938.0 1220.4 1510.6 1821.6 2097.9 2383.2 2647.1 2892.0 SG16 61.4 279.9 470.4 660.6 876.6 1096.6 1221.2 1420.2 1615.7 1801.3 1974.7 SG17 -95.3 28.3 182.9 319.0 448.6 572.1 731.4 905.8 1073.3 ####### 1415.5 SG18 ####### ####### ####### ####### ####### ####### ####### ####### ####### ####### #######SG19 -44.4 334.2 649.8 896.6 1161.1 1435.6 1734.6 1996.2 2261.7 2498.8 2721.4 SG20 ####### ####### ####### ####### ####### ####### ####### ####### ####### ####### #######SG21 -111.2 29.1 167.1 327.5 448.8 579.6 691.5 873.7 1066.8 1244.9 1433.9 SG22 ####### ####### ####### ####### ####### ####### ####### ####### ####### ####### #######SG23 -12.0 380.9 711.7 983.4 1272.3 1580.2 1919.6 2192.9 2468.5 2718.5 2956.2 SG24 ####### ####### ####### ####### ####### 4739.5 5292.1 ####### ####### -23937.4 #######SG25 -116.1 48.2 230.3 364.0 501.9 663.0 861.2 968.0 1140.3 1336.1 1444.2 SG26 ####### ####### ####### ####### ####### ####### ####### ####### ####### ####### #######SG27 -85.0 243.1 533.6 762.6 1039.4 1295.8 1576.2 1841.8 2120.4 2376.2 2609.1 SG28 ####### ####### ####### ####### ####### ####### ####### ####### ####### ####### #######SG29 -129.3 155.7 412.3 590.9 816.0 1055.5 1301.1 1521.6 1782.6 2009.8 2228.9
Table B-9. CP1, Load Condition C, Run 2
% Load 0 10 20 30 40 50 60 70 80 100 Pressure -0.02 1.35 2.70 4.03 5.41 6.76 8.12 9.45 10.84 13.51
Hoop-1 35.0 1547.4 3272.2 5017.8 6289.5 7931.6 9645.8 11223.7 12827.4 16047.9Hoop-2 -10.8 1579.2 3209.3 4819.0 6401.5 7987.5 9621.6 11211.1 12776.1 15978.6Hoop-3 8.3 1589.9 3209.0 4805.3 6389.9 8064.7 9606.8 11229.3 12774.4 16001.9Hoop-4 11.4 1590.2 3196.5 4792.4 6394.8 7984.3 9594.8 11202.8 12794.2 16001.5Hoop-5 -12.0 1588.3 3203.0 4810.9 6403.5 8021.6 9600.3 11209.2 12814.7 15996.8Hoop-6 -21.1 1594.1 3194.4 4797.1 6411.7 8000.8 9612.6 11192.4 12785.2 15982.1Hoop-7 -7.7 1594.8 3205.9 4806.9 6396.3 8000.1 9597.3 11202.8 12804.9 15995.0Hoop-8 -80.3 1655.0 3216.4 4835.2 6425.9 8029.1 9627.2 11210.1 12800.2 15971.5Hoop-9 26.7 1622.0 3213.9 4787.3 6408.3 8018.3 9589.2 11200.6 12811.9 15995.4Hoop-10 -52.8 1590.6 3204.0 4807.8 6417.9 7977.9 9604.2 11208.4 12769.8 15997.9Hoop-11 -18.2 1572.2 3170.2 4794.8 6376.8 7953.0 9640.6 11165.6 12792.3 15997.0Hoop-12 122.1 1633.0 3208.8 4841.0 6337.8 8201.0 9248.4 11083.6 12845.1 16057.0Hoop-13 44.0 1588.4 3155.1 4802.2 6376.6 7963.7 9633.9 11207.7 12803.6 15912.8Hoop-14 -62.6 1601.6 3198.9 4795.6 6400.7 7988.9 9594.1 11198.6 12795.6 15988.1Long-1 -45.9 1425.0 2822.7 4215.0 5585.6 6975.2 8451.0 9859.3 11164.1 14018.1Long-2 -46.0 1371.2 2873.2 4188.2 5623.2 7080.6 8336.3 9820.6 11178.1 13976.6Long-3 230.6 1429.9 2801.5 4236.7 5590.3 7018.0 8439.5 9803.8 11227.0 13988.1Long-4 63.3 1389.1 2777.5 4186.8 5609.0 6990.3 8380.0 9806.8 11178.9 13990.1Long-5 -14.1 1506.7 2841.0 4225.7 5561.3 6965.9 8363.3 9765.3 11222.5 13925.1Long-6 -107.8 1439.9 2958.7 4145.6 5620.0 7055.9 8419.5 9776.8 11220.3 13968.5Long-7 -80.6 1300.8 2918.6 4153.6 5655.7 7075.5 8422.4 9779.8 11155.8 13968.3Long-8 550.6 1221.0 2942.6 4077.3 5443.0 6922.7 8406.0 9867.7 11248.1 14002.6Radial-1R 0.5 3.3 3.3 18.2 134.6 230.5 358.8 471.6 593.8 790.8 Radial-2R -1923.1 -1708.7 -1625.1 -1698.9 -1541.9 -1660.7 -1752.8 -1657.2 -1518.3 -1329.3
B-12

Table B-9. CP1, Load Condition C, Run 2 (Continued)
% Load 0 10 20 30 40 50 60 70 80 100 Pressure -0.02 1.35 2.70 4.03 5.41 6.76 8.12 9.45 10.84 13.51
Radial-3R -3.0 -3.3 -5.3 -3.7 -0.7 36.3 110.8 190.6 292.0 436.2 Radial-4R -32.7 -31.5 -31.1 -31.1 -17.2 42.8 132.0 215.3 322.2 495.1 Radial-5R 5410.2 5106.2 5246.9 5363.8 5550.4 5212.9 5122.3 5341.2 5170.3 5303.5 Radial-6R -8.9 -9.2 -10.0 -17.8 -4.2 41.4 120.6 192.4 288.2 440.3 Radial-7R -7.5 -8.2 -6.2 -4.7 -0.1 58.5 143.0 213.9 298.5 428.0 Radial-8R 2.4 1.9 2.8 6.2 90.0 170.0 273.1 362.9 462.6 602.8 Radial-9R 258.0 285.8 287.6 299.2 342.7 425.4 543.3 631.6 731.0 873.4 Radial-10R -20638.9 -18490.6 -17128.4 -15736.9 -14662.0 -13391.0 -12489.4 -11512.5 -10912.7 -9599.2 SG01 -3.4 102.6 306.1 530.1 693.9 880.2 1055.3 1229.3 1400.7 1736.3 SG02 ####### ####### ####### ####### ####### ####### ####### ####### ####### #######SG03 -30.7 310.0 596.1 911.5 1209.0 1468.3 1724.9 1965.7 2218.7 2691.8 SG04 ####### ####### ####### ####### ####### ####### ####### ####### ####### #######SG05 -35.7 93.0 319.9 561.7 742.6 944.1 1137.6 1328.9 1522.8 1883.9 SG06 ####### ####### ####### ####### ####### ####### ####### ####### ####### #######SG07 -25.1 293.9 562.9 868.8 1150.6 1412.0 1671.4 1909.4 2155.9 2609.6 SG08 ####### ####### ####### ####### ####### ####### ####### ####### ####### #######SG09 3.6 107.2 269.6 447.0 596.9 752.4 906.4 1064.5 1227.3 1529.4 SG10 -13.8 92.4 242.3 396.9 545.7 706.7 860.3 1016.8 1177.6 1478.1 SG11 7.6 340.3 650.4 989.5 1280.8 1546.6 1809.8 2054.9 2308.1 2791.3 SG12 -16.9 255.5 461.8 575.2 790.4 973.9 1158.7 1337.4 1520.4 1904.5 SG13 -8.2 69.2 205.4 357.5 490.8 627.3 755.0 895.4 1039.9 1305.7 SG14 -9.0 97.7 246.4 400.7 545.2 691.4 831.4 980.9 1131.5 1417.9 SG15 3.7 351.0 674.8 1029.9 1338.5 1625.0 1909.8 2173.4 2446.7 2965.5 SG16 -26.5 250.7 456.3 569.4 792.4 992.3 1190.8 1380.0 1575.2 1981.1 SG17 -21.4 75.5 231.1 400.6 547.0 695.5 834.5 991.3 1150.4 1436.9 SG18 ####### ####### ####### ####### ####### ####### ####### ####### ####### #######SG19 -16.3 325.7 646.0 966.7 1276.0 1528.9 1803.4 2040.2 2286.9 2760.9 SG20 ####### ####### ####### ####### ####### ####### ####### ####### ####### #######SG21 -45.5 58.9 213.2 376.6 503.4 667.4 795.7 972.4 1152.7 1448.9 SG22 ####### ####### ####### ####### ####### ####### ####### ####### ####### #######SG23 -1.6 371.1 707.8 1079.7 1401.1 1689.3 1972.7 2223.9 2493.1 3002.7 SG24 ####### ####### ####### ####### ####### ####### ####### ####### ####### #######SG25 16.1 91.5 270.5 483.2 631.0 780.9 916.0 1076.5 1220.2 1473.4 SG26 34.3 289.8 463.5 538.1 719.3 880.1 1028.6 1175.0 1337.6 1714.5 SG27 -44.8 289.5 581.8 904.6 1202.7 1485.3 1763.2 2014.6 2278.0 2765.9 SG28 ####### ####### ####### 22915.6 -37357.9 ####### ####### ####### ####### #######SG29 ####### ####### 444.7 753.7 978.5 1191.5 1423.7 1649.9 1875.5 2294.4
Table B-10. CP1, Load Condition C, Run 3
% Load 0 10 20 30 40 50 60 70 80 90 100 Pressure -0.01 1.35 2.68 4.03 5.36 6.78 8.08 9.41 10.75 12.12 13.48
Hoop-1 71.7 1639.1 3278.0 4863.4 6399.5 7999.2 9631.2 11252.6 12788.3 14271.2 16059.2Hoop-2 13.8 1607.3 3183.3 4785.3 6422.6 7996.1 9588.4 11194.8 12773.8 14379.5 15980.5Hoop-3 -0.7 1597.1 3194.9 4808.5 6498.0 8028.5 9583.5 11207.2 12784.6 14403.8 16018.4
B-13

Table B-10. CP1, Load Condition C, Run 3 (Continued)
% Load 0 10 20 30 40 50 60 70 80 90 100 Pressure -0.01 1.35 2.68 4.03 5.36 6.78 8.08 9.41 10.75 12.12 13.48
Hoop-4 -22.1 1538.2 3195.0 4784.5 6417.1 7978.4 9587.5 11191.3 12801.1 14403.8 16001.8Hoop-5 4.3 1628.4 3188.7 4794.2 6410.8 7990.4 9594.9 11192.4 12794.1 14396.1 16009.7Hoop-6 164.3 1601.4 3194.7 4807.7 6404.4 8002.4 9601.6 11197.5 12790.1 14403.3 15995.2Hoop-7 4.9 1621.7 3199.0 4801.1 6410.7 8008.8 9620.8 11193.4 12791.8 14390.4 16036.6Hoop-8 -29.5 1553.2 3201.5 4791.6 6404.1 7992.8 9614.6 11187.2 12792.9 14375.7 15981.9Hoop-9 16.0 1596.7 3197.5 4851.9 6422.7 7987.8 9603.6 11183.3 12797.6 14389.3 16000.4Hoop-10 4.3 1599.3 3198.3 4790.0 6409.0 7992.1 9613.3 11193.0 12812.5 14402.4 16008.2Hoop-11 18.1 1590.2 3151.7 4760.3 6382.2 8000.3 9617.1 11184.5 12856.0 14377.3 16022.0Hoop-12 42.9 1673.4 3190.0 4693.6 6323.0 8053.6 9279.8 11325.7 12624.0 14459.2 15883.3Hoop-13 14.6 1617.6 3213.7 4802.2 6406.0 7993.1 9621.1 11177.2 12810.9 14384.7 16018.9Hoop-14 12.0 1623.8 3213.5 4795.6 6415.7 8003.8 9596.0 11212.4 12818.0 14407.6 15998.7Long-1 80.5 1425.9 2820.4 4218.1 5566.7 6969.1 8475.0 9667.1 11288.2 12589.0 14014.3Long-2 133.2 1319.0 2803.6 4127.7 5556.0 7054.4 8431.0 9832.8 11218.2 12618.8 14019.9Long-3 37.6 1376.2 2797.9 4244.8 5594.0 6999.6 8403.5 9812.8 11196.7 12581.6 13987.6Long-4 -35.4 1397.3 2796.8 4210.4 5603.0 6974.5 8376.8 9788.0 11170.5 12609.3 14012.5Long-5 -42.7 1525.4 2908.8 4162.3 5589.8 6981.1 8473.0 9774.1 11160.7 12609.0 14011.5Long-6 -24.7 1342.1 2651.6 4230.7 5605.5 7024.3 8399.3 9797.7 11217.9 12618.6 13998.1Long-7 71.0 1336.4 2829.1 4167.5 5594.8 6970.2 8413.2 9761.2 11240.5 12614.7 14020.4Long-8 -36.7 1315.6 2846.5 4263.1 5403.9 7029.3 8355.3 9858.6 11165.0 12536.5 13976.1Radial-1R 2224.0 2280.4 2271.1 2295.1 2290.3 2281.1 2242.9 2587.8 2687.2 2867.9 3020.5 Radial-2R -1509.2 -1561.4 -1396.7 -1618.2 -1780.2 -1283.2 -1931.4 -1497.2 -1495.3 -1692.0 -1648.5 Radial-3R -1.4 -1.4 -1.9 -3.4 -3.8 -5.0 -2.8 0.7 4.1 92.1 187.4 Radial-4R -33.8 -33.6 -33.1 -34.6 -34.2 -31.0 -29.2 -0.7 74.4 171.4 286.0 Radial-5R 5487.8 5086.8 5382.7 5428.0 5213.4 5451.7 5235.0 5245.3 5402.1 5503.5 5232.3 Radial-6R -6.1 -4.1 -7.6 -14.1 -18.6 -11.2 -19.7 4.0 78.4 177.0 281.3 Radial-7R -10.1 -8.1 -6.6 -7.7 -7.8 -2.9 -4.2 -2.0 41.5 123.7 217.2 Radial-8R 4.8 5.4 4.4 5.4 5.0 6.4 7.8 49.8 136.8 244.2 363.0 Radial-9R 394.9 391.3 406.5 414.9 429.8 429.6 447.7 464.3 559.2 673.9 801.4 Radial-10R -220.8 -3.2 205.3 49.2 188.0 292.4 462.7 597.9 835.3 885.3 858.8 SG01 -183.3 49.4 270.0 440.1 595.7 766.0 955.2 1151.1 1331.6 1507.4 1685.3 SG02 ####### ####### ####### ####### ####### ####### ####### ####### ####### ####### #######SG03 -75.4 284.0 574.9 832.6 1090.0 1372.3 1637.1 1900.8 2153.5 2401.8 2643.6 SG04 ####### ####### ####### ####### ####### ####### ####### ####### ####### ####### #######SG05 -277.5 25.3 283.6 474.0 647.4 826.6 1049.2 1261.2 1466.2 1664.9 1863.3 SG06 ####### ####### ####### ####### ####### ####### ####### ####### ####### ####### #######SG07 -50.9 284.3 551.9 789.1 1023.5 1291.5 1540.8 1790.9 2034.5 2277.8 2514.6 SG08 ####### ####### ####### ####### ####### ####### ####### ####### ####### ####### #######SG09 -142.5 68.5 248.2 397.9 551.5 691.6 885.8 1054.6 1216.7 1383.3 1551.0 SG10 -93.5 69.7 226.3 368.1 512.2 650.9 833.6 994.7 1155.8 1319.2 1482.7 SG11 -65.6 320.0 634.5 897.5 1153.1 1445.3 1716.0 1980.8 2232.0 2481.3 2724.2 SG12 103.2 289.9 467.2 667.1 866.1 1095.4 1238.4 1408.3 1585.8 1762.1 1934.1 SG13 -173.4 12.5 170.6 295.6 418.7 535.5 683.0 837.4 985.7 1134.0 1285.2 SG14 -116.9 58.1 220.0 357.5 493.4 626.8 790.5 951.4 1107.5 1261.7 1416.4 SG15 -69.0 335.2 664.0 940.5 1211.6 1518.5 1812.4 2094.7 2367.7 2637.2 2900.8 SG16 125.6 296.4 473.0 674.9 883.3 1117.6 1286.2 1467.1 1658.3 1846.4 2029.9
B-14

Table B-10. CP1, Load Condition C, Run 3 (Continued)
% Load 0 10 20 30 40 50 60 70 80 90 100 Pressure -0.01 1.35 2.68 4.03 5.36 6.78 8.08 9.41 10.75 12.12 13.48
SG17 -205.8 5.8 184.3 318.3 445.1 571.6 712.5 881.7 1050.0 ####### 1379.4 SG18 ####### ####### ####### ####### ####### ####### ####### ####### ####### ####### #######SG19 -100.4 307.5 622.0 881.6 1135.6 1440.5 1713.6 1994.5 2250.4 2497.6 2735.3 SG20 ####### ####### ####### ####### ####### ####### ####### ####### ####### ####### #######SG21 -216.2 -30.6 154.4 301.3 418.4 549.6 677.9 844.9 1034.6 1216.6 1397.6 SG22 ####### ####### ####### ####### ####### ####### ####### ####### ####### ####### #######SG23 -75.3 351.1 687.4 974.8 1268.7 1591.1 1898.4 2193.3 2457.1 2715.1 2971.7 SG24 ####### ####### ####### ####### ####### ####### ####### ####### ####### ####### #######SG25 -267.5 -13.8 218.4 351.9 484.8 595.5 743.7 910.0 1074.5 1224.8 1383.5 SG26 -9935.2 ####### ####### ####### ####### ####### ####### ####### ####### ####### #######SG27 -76.7 243.5 541.3 795.0 1046.3 1328.4 1600.5 1864.8 2122.4 2366.8 2640.5 SG28 ####### ####### ####### ####### ####### ####### ####### ####### ####### ####### #######SG29 -209.8 117.7 397.5 627.9 819.0 1033.7 1299.4 1543.9 1768.3 1977.2 2217.0
Table B-11. CP1A, Load Condition B, Run 1
% Load 0 10 20 30 40 50 60 70 80 90 100 Pressure -0.03 0.00 0.00 -0.01 0.00 0.02 0.00 -0.01 0.02 0.01 0.00
Hoop-1 84.5 -10.8 55.2 -29.2 31.3 38.7 11.2 3.8 11.2 22.2 -69.5 Hoop-2 3.9 14.4 2.1 2.1 0.3 -34.8 -1.4 16.2 -13.7 -57.6 -19.0 Hoop-3 -35.2 4.4 2.6 8.0 -10.0 -10.0 -1.0 4.4 0.8 -1.0 -4.6 Hoop-4 55.8 -85.3 -16.6 44.7 -18.5 148.7 327.0 496.1 769.2 1066.1 1209.2 Hoop-5 144.6 71.8 -0.9 31.8 0.9 -13.7 -17.3 30.0 -10.0 -10.0 15.4 Hoop-6 -247.9 32.9 7.2 -18.5 -5.6 -7.5 -20.3 -2.0 124.7 170.5 9.0 Hoop-7 198.3 210.9 149.7 29.2 0.4 -8.6 -12.2 0.4 -15.8 -5.0 14.8 Hoop-8 -57.6 -64.9 -6.8 -64.9 44.0 -72.1 -108.4 -43.1 -57.6 -35.8 -130.2 Hoop-9 -99.6 6.1 -11.8 47.3 -13.6 -45.9 49.1 4.3 -45.9 65.2 7.9 Hoop-10 -52.6 -31.2 0.9 20.5 -2.7 -65.1 -20.5 91.8 95.3 -65.1 -63.3 Hoop-11 15.9 26.8 -16.8 -38.6 -25.9 66.8 -15.0 35.9 23.2 34.1 -0.5 Hoop-12 -41.5 -275.5 94.8 185.1 199.8 -142.9 -277.4 -93.2 -141.0 -211.0 -198.2 Hoop-13 -104.5 79.3 -23.6 -8.9 27.9 49.9 64.6 -23.6 123.4 49.9 123.5 Hoop-14 4.6 12.0 27.0 -10.3 -2.9 4.6 4.6 4.6 -32.7 -40.2 -47.7 Long-1 134.4 2224.6 4135.7 6225.5 8144.5 10594.7 12465.4 14304.5 16155.0 18159.8 21788.2Long-2 709.5 2076.4 3947.0 6499.1 8133.5 10360.5 12625.6 15026.6 16934.3 19048.2 20820.8Long-3 1199.1 2062.8 4266.5 6306.8 8421.5 10527.5 12625.4 14621.7 16940.2 18929.6 20880.9Long-4 30.9 2077.5 4297.8 6232.3 8460.5 10514.2 12644.1 14706.8 16818.4 18927.3 20935.9Long-5 511.0 2235.3 4659.6 6219.7 8582.9 10498.4 12601.8 14565.3 16893.0 18908.0 20985.5Long-6 -0.3 2065.5 4320.8 6187.6 8379.9 10381.7 12603.1 14671.8 16711.1 18605.6 19764.0Long-7 1308.5 2278.6 4363.8 6226.3 8111.7 10654.6 12761.1 14660.2 16873.9 18939.3 20969.6Long-8 -198.1 2008.9 3977.9 6188.1 8256.2 10623.2 12450.8 14634.5 16824.8 18689.9 20976.8Radial-1R 0.7 0.7 1.3 1.7 84.3 148.5 211.0 252.0 317.2 358.6 401.9 Radial-2R -1475.0 -1221.0 -1426.6 -1300.4 -1648.1 -1367.3 -1656.2 -1931.7 -1257.0 -1126.9 -1241.5 Radial-3R 0.8 1.2 3.2 37.0 130.4 174.6 213.0 242.6 290.7 324.1 355.4 Radial-4R -35.4 -36.1 -43.5 33.7 114.7 167.0 217.6 253.7 311.5 349.3 396.1 Radial-5R 5072.3 5401.0 5334.2 5460.9 5108.4 5442.0 5399.4 5302.9 4991.9 5342.3 5348.2
B-15

Table B-11. CP1A, Load Condition B, Run 1 (Continued)
% Load 0 10 20 30 40 50 60 70 80 90 100 Pressure -0.03 0.00 0.00 -0.01 0.00 0.02 0.00 -0.01 0.02 0.01 0.00
Radial-6R 3.2 5.1 11.3 8.4 26.7 57.0 57.5 69.5 105.2 107.5 119.6 Radial-7R -14.5 -15.6 -15.1 28.2 91.3 157.7 190.1 234.7 302.3 355.0 397.8 Radial-8R -1.7 -1.4 -0.6 121.5 205.6 287.8 355.3 402.5 489.6 545.9 609.5 Radial-9R 255.8 325.3 344.2 389.3 526.9 636.5 734.3 762.3 869.2 924.0 991.0 Radial-10R -6188.2 -6004.0 -5766.8 -5633.4 -5366.5 -5376.2 -5238.4 -5255.7 -5306.0 -5275.7 -5293.0 SG01 224.5 656.0 1227.5 1745.5 2280.1 2864.0 3378.8 3904.5 4458.0 4978.2 5501.6 SG02 ####### ####### ####### ####### ####### ####### ####### ####### ####### ####### #######SG03 -48.2 -193.1 -371.2 -536.3 -743.5 -970.2 -1202.6 -1456.4 -1704.6 -1944.3 -2189.3 SG04 ####### ####### ####### ####### ####### ####### ####### ####### ####### ####### #######SG05 288.9 767.6 1426.2 2004.4 2621.8 3269.3 3877.5 4464.0 5106.1 5837.3 6387.4 SG06 ####### ####### ####### ####### ####### ####### ####### ####### ####### ####### #######SG07 -73.9 -211.6 -379.1 -508.6 -681.8 -871.0 -1075.2 -1280.0 -1473.6 -1675.0 -1898.6 SG08 ####### ####### ####### ####### ####### ####### ####### ####### ####### ####### #######SG09 236.3 632.6 1209.9 1687.5 2245.3 2802.4 3356.0 3872.6 4435.4 4953.5 5435.0 SG10 187.5 543.1 1058.9 1509.6 2022.5 2532.0 3046.5 3527.3 4053.1 4537.5 4992.0 SG11 -32.7 -145.3 -292.5 -461.2 -667.7 -879.3 -1109.5 -1326.3 -1552.9 -1777.0 -1999.6 SG12 -189.9 -390.7 -753.1 -1071.6 -1396.0 -1686.5 -2003.6 -2284.2 -2605.1 -2897.9 -3140.9 SG13 198.4 614.8 1183.2 1655.0 2195.4 2731.0 3261.3 3759.2 4291.9 4786.9 5272.1 SG14 187.3 566.6 1092.2 1539.9 2045.5 2553.9 3060.4 3537.0 4045.1 4518.4 4988.1 SG15 -26.4 -145.7 -287.1 -441.2 -629.8 -827.4 -1040.1 -1240.9 -1439.6 -1642.4 -1860.6 SG16 -171.1 -359.6 -695.9 -972.1 -1260.0 -1508.8 -1773.8 -2009.1 -2270.8 -2512.8 -2722.2 SG 17 206.6 615.4 1168.3 1636.9 2158.2 2679.1 3186.4 3665.1 4170.9 4645.0 5120.8 SG 18 ####### ####### ####### ####### ####### ####### ####### ####### ####### ####### #######SG19 -24.5 -115.1 -221.5 -348.5 -512.6 -681.3 -849.1 -1019.2 -1188.2 -1361.6 -1559.3 SG20 ####### ####### ####### ####### ####### ####### ####### ####### ####### ####### #######SG21 244.1 654.0 1259.2 1801.2 2365.1 2948.0 3531.9 4083.9 4813.0 5364.2 5915.7 SG22 ####### ####### ####### ####### ####### ####### ####### ####### ####### ####### #######SG23 -1.6 -126.9 -314.0 -547.4 -785.3 -1045.0 -1334.4 -1619.5 -1913.5 -2216.9 -2489.4 SG24 ####### ####### ####### ####### ####### ####### ####### ####### ####### ####### #######SG25 ####### ####### ####### ####### ####### ####### ####### ####### ####### ####### #######SG26 ####### ####### ####### ####### ####### ####### ####### ####### ####### ####### #######SG27 ####### ####### ####### ####### ####### ####### ####### ####### ####### ####### #######SG28 ####### ####### ####### ####### ####### ####### ####### ####### ####### ####### #######SG29 97.0 245.7 481.9 718.4 939.2 1163.2 1367.2 1554.2 1779.3 1963.5 2102.1 SG A 264.7 824.5 1601.5 2288.5 2986.9 3685.4 4336.5 4949.3 5613.1 6233.6 6849.2 SG B 227.0 705.7 1362.1 1941.5 2543.3 3145.8 3712.9 4249.7 4830.7 5371.8 5909.4 SG C 188.8 622.3 1215.2 1730.6 2281.7 2835.8 3365.0 3869.1 4408.4 4916.9 5427.2
Table B-12. CP1B, Load Condition A, Run 1
% Load 0 10 20 30 40 50 60 70 80 90 100 Pressure 0.03 0.63 1.19 1.75 2.36 2.94 3.53 4.15 4.74 5.31 5.93
Hoop-1 -31.0 704.5 1390.2 2098.2 2803.5 3485.9 4203.6 4906.5 5592.5 6315.2 6993.4 Hoop-2 141.0 749.3 1394.1 2076.2 2792.5 3504.4 4185.3 4927.6 5604.3 6330.3 7024.2 Hoop-3 -6.3 757.9 1453.2 2094.9 2793.3 3485.4 4208.7 4888.6 5618.5 6301.5 6996.8
B-16

Table B-12. CP1B, Load Condition A, Run 1 (Continued)
% Load 0 10 20 30 40 50 60 70 80 90 100 Pressure 0.03 0.63 1.19 1.75 2.36 2.94 3.53 4.15 4.74 5.31 5.93
Hoop-4 51.9 763.8 1382.2 2084.8 2791.9 3501.9 4203.1 4896.7 5601.0 6301.6 7011.0 Hoop-5 78.8 648.4 1441.4 2045.5 2785.2 3482.1 4201.4 4920.6 5584.7 6308.9 6994.4 Hoop-6 32.9 725.3 1402.6 2100.5 2801.1 3502.7 4208.5 4910.5 5593.6 6317.1 7027.4 Hoop-7 -29.7 747.7 1420.3 2086.1 2814.0 3508.6 4216.4 4940.2 5602.4 6322.1 7039.7 Hoop-8 -11.9 714.2 1382.1 2093.9 2811.9 3502.3 4207.0 4873.6 5592.8 6297.6 6986.0 Hoop-9 530.3 1387.3 1946.4 2385.7 2854.5 3496.8 4210.6 4924.4 5580.8 6292.9 6981.6 Hoop-10 -26.9 723.6 1434.7 2098.0 2813.7 3477.3 4278.0 4914.7 5610.3 6232.9 7149.4 Hoop-11 268.1 849.8 1371.4 2165.9 2768.6 3478.0 4214.6 4909.3 5653.2 6453.5 6675.7 Hoop-12 -187.1 726.9 1506.2 1804.9 2837.8 3514.6 3992.2 4923.2 5675.4 6420.4 7296.0 Hoop-13 28.2 712.2 1403.4 2124.3 2748.7 3455.2 4235.2 4866.3 5558.0 6183.6 6939.7 Hoop-14 278.3 576.9 1420.1 2144.2 2815.1 3532.0 4189.2 4889.3 5591.2 6293.2 7000.8 Long-1 196.4 -28.1 12.1 8.6 -28.1 44.0 -18.6 -5.6 42.8 -15.1 -2.1 Long-2 61.4 74.3 77.8 67.3 63.7 67.2 75.5 72.0 80.2 79.0 76.7 Long-3 -18.4 342.1 101.8 -7.4 224.3 187.9 -19.6 -17.1 105.4 158.8 -15.9 Long-4 81.3 110.2 77.7 93.4 51.3 62.1 95.8 139.1 135.5 157.1 186.0 Long-5 333.8 260.1 262.5 -30.9 -28.6 -29.7 -29.7 774.6 266.0 -29.8 140.1 Long-6 142.8 -28.2 334.2 209.0 -16.2 -18.6 -29.4 -21.0 85.0 11.5 -21.0 Long-7 -40.1 102.0 -18.6 4.1 28.0 0.5 8.9 -22.2 12.5 63.8 2.9 Long-8 40.1 156.3 200.2 238.2 276.1 292.7 325.9 347.4 379.3 399.5 376.9 Radial-1R 98.0 95.3 89.7 94.3 101.6 111.2 122.2 130.9 136.8 137.0 148.0 Radial-2R 742.6 441.5 207.9 713.1 752.0 860.5 548.1 575.8 633.9 585.9 596.8 Radial-3R 49.1 49.4 42.1 40.6 41.7 43.8 44.9 47.1 46.0 43.0 43.0 Radial-4R 220.3 179.4 92.4 362.9 288.8 429.2 427.1 596.6 594.5 660.3 728.5 Radial-5R -328.6 -271.5 -382.5 -358.2 -221.7 -285.9 -34.2 -119.4 -517.9 -455.3 52.7 Radial-6R 45.1 40.5 39.0 47.5 60.1 71.4 82.6 91.7 98.0 100.6 113.1 Radial-7R -6.3 -12.4 -12.3 -7.5 2.2 9.8 12.7 14.2 15.7 12.9 13.5 Radial-8R 174.1 243.8 308.0 -11.7 183.8 333.4 422.6 258.3 354.5 278.3 447.3 Radial-9R 179.8 144.9 111.9 132.3 132.3 140.3 178.7 170.4 171.9 198.6 162.9 Radial-10R ####### ####### ####### ####### ####### ####### ####### ####### ####### ####### #######SG01 -59.7 -162.8 -239.6 -306.8 -379.5 -457.9 -549.7 -634.6 -720.4 -827.3 -935.9 SG02 -17.5 -102.3 -171.6 -237.3 -306.9 -379.1 -459.3 -533.0 -608.9 -702.5 -798.9 SG03 -5.6 178.4 345.3 531.5 730.0 927.6 1122.7 1309.0 1490.4 1673.7 1877.2 SG04 -57.0 146.8 325.3 474.8 628.0 785.3 951.9 1128.3 1298.4 1487.4 1667.2 SG05 -28.3 -148.3 -231.1 -318.4 -406.3 -489.1 -587.8 -659.6 -763.7 -891.1 -999.1 SG06 5.3 -96.8 -175.1 -258.2 -342.0 -418.9 -507.8 -573.5 -664.9 -777.6 -876.3 SG07 -5.4 161.5 319.0 518.3 731.2 940.0 1141.2 1322.1 1505.2 1684.2 1885.8 SG08 -67.7 119.5 277.4 403.7 527.3 640.4 767.5 895.4 1038.5 1204.7 1341.2 SG09 -18.2 -107.1 -187.2 -293.9 -396.8 -483.9 -579.7 -630.5 -734.7 -857.0 -954.1 SG10 12.8 -71.0 -148.1 -250.0 -345.7 -426.0 -514.2 -556.9 -655.6 -773.1 -865.1 SG11 -60.5 104.2 277.3 474.5 679.4 873.5 1062.5 1230.8 1414.1 1600.4 1792.8 SG12 -39.6 139.2 308.4 478.2 645.6 795.9 953.5 1087.5 1258.7 1443.4 1603.7 SG13 -26.5 -121.1 -226.2 -340.1 -454.0 -559.6 -672.7 -757.0 -878.4 -1015.5 -1139.3 SG14 0.0 -93.8 -189.6 -298.0 -404.6 -500.4 -602.8 -676.0 -783.6 -904.7 -1016.0 SG15 -55.7 119.3 302.3 506.8 720.2 926.1 1127.5 1312.5 1506.1 1701.2 1907.5 SG16 -45.9 142.7 336.8 527.6 719.4 897.1 1079.5 1244.6 1445.3 1651.6 1843.7
B-17

Table B-12. CP1B, Load Condition A, Run 1 (Continued)
% Load 0 10 20 30 40 50 60 70 80 90 100 Pressure 0.03 0.63 1.19 1.75 2.36 2.94 3.53 4.15 4.74 5.31 5.93
SG17 -1344.7 -1423.9 -1514.2 -1598.7 -1666.0 -1763.2 -1861.6 -1943.9 -2054.8 -2173.1 -3303.1 SG18 14.3 -48.1 -113.1 -182.6 -244.4 -304.6 -373.3 -421.8 -499.0 -589.0 -667.8 SG19 -126.6 10.9 148.4 297.4 446.3 426.4 566.6 884.5 1030.5 1179.8 1485.8 SG20 -30.6 136.0 312.0 477.3 641.4 800.8 966.2 1121.6 1298.6 1489.8 1668.5 SG21 -35.3 -118.0 -229.2 -329.0 -423.6 -515.1 -620.9 -718.4 -818.2 -937.7 -1054.8 SG22 2.0 -59.3 -156.5 -225.8 -322.1 -390.8 -493.6 -578.3 -649.8 -743.4 -835.1 SG23 -64.5 126.7 330.4 542.1 762.7 977.3 1189.4 1395.3 1594.2 1797.6 2016.6 SG24 -24.2 158.0 353.0 532.1 702.8 872.3 1051.9 1231.4 1412.7 1613.3 1802.6 SG25-45 -49.2 251.8 644.0 1092.9 1573.7 2021.0 2432.0 2844.9 3195.0 3504.4 3901.5 SG25-H -36.3 597.2 1322.3 2205.9 3151.6 4071.3 4935.4 5772.0 6550.4 7280.1 8174.8 SG25-L -44.5 180.6 412.5 725.2 1053.1 1380.4 1668.7 1953.6 2196.8 2404.8 2681.5 SG26-45 -244.0 110.6 572.6 920.0 1273.7 1597.6 1931.9 2316.1 2665.0 3025.9 3403.4 SG26-H -412.6 400.2 1222.8 1908.2 2584.6 3244.2 3938.3 4673.9 5440.4 6281.0 7109.7 SG26-L -119.7 29.5 225.2 368.3 512.9 647.3 778.3 945.3 1084.0 1216.2 1362.6 SG31 -43.8 -42.2 -33.9 -4.4 24.2 54.6 66.0 95.9 91.0 65.3 64.6 SG32 -61.7 -55.1 -32.9 -21.0 -9.5 4.4 6.5 27.5 25.9 13.0 17.3 SG33 -22.9 314.6 627.0 1018.0 1434.1 1844.7 2234.7 2599.1 2952.3 3294.0 3681.0 SG34 -195.0 109.7 410.8 650.6 885.7 1111.3 1355.3 1612.8 1888.9 2197.9 2476.7 SG35 -46.1 -89.6 -132.5 -152.5 -177.0 -193.4 -231.5 -256.9 -309.5 -385.5 -434.7 SG36 -58.4 -67.8 -62.5 -63.8 -64.9 -62.8 -74.7 -64.6 -80.3 -113.3 -123.7 SG37 13.4 263.9 500.3 795.8 1113.2 1422.4 1720.3 1999.7 2264.3 2522.1 2814.9 SG38 -382.1 218.0 801.0 1252.0 1689.7 2102.2 2560.0 3037.4 3558.5 4146.4 4657.8 SG39 -42.0 -132.3 -206.8 -278.7 -356.5 -430.5 -522.2 -594.1 -694.0 -816.4 -915.8 SG40 -42.4 -72.2 -90.9 -110.5 -130.0 -145.9 -174.8 -186.8 -220.6 -271.2 -302.5 SG41 -26.6 177.0 369.0 610.2 868.6 1122.7 1366.7 1594.1 1813.7 2026.3 2267.4 SG42 -152.7 76.6 300.2 471.3 637.0 792.7 965.1 1146.6 1345.3 1571.7 1764.6 SG43-45 -260.0 260.3 733.6 1153.0 1551.3 1960.9 2389.4 2824.1 3300.9 3830.5 4331.0 SG43-H -505.1 286.3 1050.4 1696.9 2321.5 2940.5 3593.8 4268.0 4994.7 5794.3 6505.9 SG43-L -174.8 35.1 237.6 413.4 585.8 760.6 929.9 1118.5 1306.9 1498.8 1695.8 SG46 -55.3 -62.2 -73.8 -54.5 -68.6 -15.1 83.3 ####### ####### ####### #######SG47 -122.7 145.1 423.4 639.0 844.9 1042.5 1261.8 1559.7 1806.5 2077.9 9519.3 SG48 -61.9 -63.0 -85.4 -96.0 -105.7 -108.2 -122.1 -129.0 -141.8 -165.2 -177.9 SG49 -170.6 62.0 346.4 550.4 743.0 920.3 1117.4 1331.6 1550.7 1799.3 2022.3 SG50 ####### ####### ####### ####### ####### ####### ####### ####### ####### ####### #######SG51 -123.3 110.3 396.0 603.2 799.5 979.1 1173.0 1384.1 1607.3 1858.7 2085.4
Table B-13. CP1B, Load Condition A, Run 2
% Load 0 10 20 30 40 50 60 70 80 90 100 Pressure 0.03 0.60 1.19 1.79 2.37 2.94 3.54 4.17 4.72 5.30 5.88
Hoop-1 260.6 720.9 1401.5 2096.2 2819.3 3529.1 4154.1 4916.6 5616.3 6285.2 6983.5 Hoop-2 -40.0 689.4 1376.8 2107.6 2812.9 3479.1 4355.8 4880.9 5574.4 6268.1 6984.9 Hoop-3 62.2 712.7 1401.3 2165.0 2781.8 3500.8 4140.2 4959.7 5602.2 6272.1 7026.7 Hoop-4 -13.1 648.4 1350.9 2093.9 2796.7 3501.1 4266.3 4901.3 5593.6 6280.5 6991.7 Hoop-5 18.8 741.1 1450.7 2150.8 2808.1 3492.2 4146.9 4926.9 5593.8 6291.9 6999.2
B-18

Table B-13. CP1B, Load Condition A, Run 2 (Continued)
% Load 0 10 20 30 40 50 60 70 80 90 100 Pressure 0.03 0.60 1.19 1.79 2.37 2.94 3.54 4.17 4.72 5.30 5.88
Hoop-6 -24.0 690.3 1406.6 2098.5 2809.6 3498.2 4261.8 4887.4 5606.5 6279.8 6975.3 Hoop-7 107.0 725.9 1402.6 2114.7 2829.5 3497.1 4153.5 4914.0 5625.8 6281.9 6992.2 Hoop-8 46.2 721.3 1411.2 2100.7 2797.4 3486.7 4213.4 4897.3 5593.9 6296.4 7001.9 Hoop-9 657.6 1609.1 2206.3 2724.0 3078.5 3485.0 4172.1 4901.2 5619.6 6302.4 6970.5 Hoop-10 -55.4 780.4 1329.5 2086.9 2861.8 3506.6 4325.3 4813.3 5590.0 6347.5 7113.4 Hoop-11 351.7 824.2 1376.9 2167.3 2903.1 3386.2 4326.4 5269.4 5581.6 6092.4 6444.4 Hoop-12 144.5 748.8 1504.4 1852.4 2784.4 3397.5 4081.7 5035.8 5352.2 6514.9 7069.0 Hoop-13 101.7 712.0 1403.4 2079.8 2785.4 3410.1 4219.6 4853.5 5610.6 6329.5 7007.3 Hoop-14 -27.7 696.1 1390.2 2099.0 2807.6 3508.6 4188.3 4876.3 5607.2 6292.0 7024.6 Long-1 149.1 -19.8 105.4 98.3 -9.2 -17.4 -23.3 100.7 -18.6 61.7 -19.8 Long-2 63.7 48.4 48.4 54.3 61.4 59.0 64.9 61.3 62.5 67.2 76.7 Long-3 -20.8 288.7 -14.7 -24.4 -15.9 62.9 4.7 30.2 265.6 10.8 -36.6 Long-4 5.6 -4.1 -4.1 -2.9 35.6 3.2 8.0 3.2 30.8 72.9 94.6 Long-5 -42.8 -9.6 -19.1 -38.1 686.6 -38.1 741.1 -38.1 -22.6 536.8 213.8 Long-6 16.3 32.0 26.0 26.0 21.2 20.0 5.5 28.4 10.3 21.2 12.7 Long-7 264.3 -34.1 2.9 31.6 -1.9 17.2 57.8 -21.0 35.1 10.1 -23.4 Long-8 11.6 98.2 126.6 161.1 196.6 257.1 201.4 250.0 347.3 408.9 458.8 Radial-1R 82.7 70.7 69.2 69.6 75.1 78.9 88.0 89.5 98.8 111.6 124.2 Radial-2R 428.3 562.5 485.5 314.7 693.8 1018.0 579.6 441.1 499.0 431.9 708.5 Radial-3R 46.0 34.9 32.3 29.6 30.1 32.9 35.2 34.3 36.8 39.5 41.7 Radial-4R 781.3 390.4 468.2 382.8 372.1 -37.1 392.0 273.8 130.2 468.1 346.2 Radial-5R -344.8 -348.5 -588.0 -276.8 -385.8 -242.9 -273.6 -25.5 -344.8 -218.6 -254.2 Radial-6R 35.0 28.9 32.3 39.0 50.5 61.3 72.4 83.5 89.8 101.5 112.3 Radial-7R -1.9 -6.2 -1.6 0.0 3.4 6.9 10.0 21.8 26.0 27.7 35.0 Radial-8R 308.0 447.3 627.8 198.9 386.3 241.5 452.8 472.9 103.4 246.4 227.0 Radial-9R 156.6 167.8 191.7 190.0 168.7 175.9 175.5 196.9 237.3 223.2 222.4 Radial-10R ####### ####### ####### ####### ####### ####### ####### ####### ####### ####### #######SG01 -144.8 -275.9 -335.7 -397.2 -442.8 -506.0 -582.6 -684.0 -750.2 -837.1 -928.2 SG02 -80.4 -187.5 -247.4 -309.5 -357.5 -420.5 -490.3 -582.2 -642.3 -718.5 -800.0 SG03 -15.7 177.3 362.0 555.6 731.8 915.5 1109.4 1314.9 1487.0 1676.4 1862.5 SG04 3.3 230.1 383.9 541.7 686.4 825.3 998.8 1170.0 1314.3 1492.9 1651.1 SG05 -172.0 -303.3 -369.5 -429.1 -466.0 -552.0 -614.9 -746.5 -812.8 -890.0 -992.9 SG06 -118.7 -232.1 -298.1 -359.8 -399.2 -479.9 -539.1 -656.4 -716.0 -786.5 -878.7 SG07 -49.4 120.1 313.2 518.4 704.5 906.3 1103.3 1324.5 1500.1 1685.5 1878.5 SG08 62.6 255.1 382.8 494.9 598.1 709.4 829.2 973.4 1078.7 1211.7 1334.8 SG09 -145.8 -241.2 -317.4 -388.2 -426.2 -536.6 -586.2 -730.6 -794.3 -853.8 -955.0 SG10 -112.0 -204.2 -278.4 -346.9 -377.7 -482.7 -525.4 -662.0 -720.5 -773.5 -868.9 SG11 -63.5 119.3 307.1 500.9 671.6 864.1 1042.2 1257.4 1421.0 1595.0 1777.1 SG12 71.6 248.6 410.1 555.5 681.4 845.5 978.9 1170.8 1303.1 1445.7 1598.8 SG13 -124.8 -229.8 -325.1 -414.8 -482.2 -597.1 -679.1 -829.2 -911.5 -1006.0 -1123.0 SG14 -99.2 -198.4 -288.9 -373.5 -436.2 -542.8 -616.3 -751.5 -824.8 -908.1 -1012.6 SG15 -70.8 117.0 316.4 523.3 708.4 907.6 1103.4 1324.4 1500.1 1691.9 1886.1 SG16 44.7 239.9 425.5 599.7 752.9 939.2 1102.9 1317.5 1482.3 1654.9 1834.3 SG17 -1173.7 -1218.2 -1259.4 -1292.1 -1313.1 -1368.2 -1401.6 -1481.3 -1516.7 -1566.3 -1629.7 SG18 -64.7 -119.3 -178.8 -231.5 -263.4 -333.0 -381.9 -472.7 -518.6 -579.4 -655.0
B-19

Table B-13. CP1B, Load Condition A, Run 2 (Continued)
% Load 0 10 20 30 40 50 60 70 80 90 100 Pressure 0.03 0.60 1.19 1.79 2.37 2.94 3.54 4.17 4.72 5.30 5.88
SG19 -149.5 -178.2 -34.9 297.4 432.0 572.2 721.0 878.7 1007.6 1153.8 1293.9 SG20 39.4 208.6 375.7 533.7 667.0 832.2 985.7 1176.6 1321.5 1485.3 1650.9 SG21 -108.1 -191.5 -296.1 -385.6 -455.1 -548.4 -648.4 -762.8 -833.1 -941.5 -1043.7 SG22 -52.1 -134.6 -212.7 -281.3 -349.9 -432.2 -513.9 -618.3 -671.7 -739.6 -830.7 SG23 -86.0 109.6 330.2 550.5 750.8 955.6 1173.6 1396.1 1579.0 1791.6 1992.9 SG24 28.3 212.5 401.5 582.0 733.1 906.6 1087.9 1290.5 1441.6 1627.5 1800.1 SG25-45 -294.7 34.6 495.4 974.1 1480.5 1881.0 2338.7 2736.9 3100.9 3511.3 3865.3 SG25-H -358.6 286.2 1136.7 2074.4 3000.6 3852.3 4764.8 5647.4 6425.6 7276.5 8081.0 SG25-L -309.7 -89.8 232.8 590.6 930.8 1236.2 1559.2 1835.4 2121.6 2402.7 2665.4 SG26-45 -122.7 297.6 683.9 1021.3 1409.6 1692.5 2071.0 2411.4 2706.9 3099.4 3401.9 SG26-H 3.9 859.6 1566.1 2230.5 2868.4 3505.2 4220.2 4997.9 5629.5 6398.1 7091.8 SG26-L -109.9 61.7 229.7 378.8 557.2 673.2 837.1 959.5 1093.0 1258.0 1374.6 SG31 -185.4 -185.4 -143.0 -93.5 -38.9 -4.3 30.2 21.5 53.0 68.6 72.6 SG32 -129.9 -118.3 -92.0 -67.4 -28.0 -22.9 2.8 -11.6 9.8 26.8 25.1 SG33 -154.0 175.9 564.8 983.0 1360.8 1752.6 2146.4 2556.8 2904.2 3271.7 3637.6 SG34 -6.2 311.2 559.0 784.7 996.1 1218.0 1461.3 1743.1 1957.3 2226.3 2469.0 SG35 -213.9 -263.2 -267.5 -262.1 -252.3 -269.6 -281.0 -345.5 -349.1 -379.1 -419.0 SG36 -157.8 -164.7 -148.4 -131.0 -96.5 -103.6 -86.0 -120.5 -106.2 -99.6 -114.9 SG37 -82.0 163.7 457.5 772.4 1058.6 1356.5 1651.5 1966.5 2227.6 2507.4 2781.9 SG38 46.3 670.0 1132.7 1546.0 1929.0 2336.4 2781.6 3312.3 3698.6 4193.9 4641.8 SG39 -173.8 -265.9 -320.5 -374.1 -408.9 -484.5 -547.9 -669.0 -726.1 -803.7 -897.4 SG40 -137.1 -167.5 -173.0 -176.7 -166.1 -188.1 -193.1 -242.8 -247.9 -263.6 -295.4 SG41 -109.7 92.1 330.3 586.1 820.1 1062.3 1305.6 1563.2 1778.2 2008.2 2237.5 SG42 10.8 251.6 428.6 583.6 729.4 882.2 1051.6 1252.6 1399.3 1588.8 1758.8 SG43-45 -8.9 518.1 937.1 1351.1 1703.2 2128.0 2549.7 3047.5 3449.6 3903.8 4343.0 SG43-H -120.6 689.5 1350.0 1975.1 2532.0 3149.1 3801.8 4551.0 5142.0 5838.0 6488.8 SG43-L -157.0 69.7 256.1 440.6 615.3 784.9 971.9 1158.0 1337.2 1527.6 1701.8 SG46 -124.8 -129.2 -129.3 -120.2 -85.9 ####### ####### ####### ####### ####### #######SG47 6828.4 7733.9 527.1 730.1 919.3 1184.3 1401.8 1654.6 1841.4 2079.0 2294.9 SG48 -125.3 -130.5 -140.4 -137.4 -137.0 -139.3 -142.3 -162.6 -151.3 -161.6 -170.7 SG49 -7.2 257.7 478.5 666.3 853.2 1025.1 1228.8 1453.6 1613.9 1834.1 2020.0 SG50 ####### ####### ####### ####### ####### ####### ####### ####### ####### ####### #######SG51 41.0 319.8 542.6 726.8 915.8 1088.5 1288.7 1512.9 1678.9 1900.2 2086.9
Table B-14. CP1B, Load Condition A, Run 3
% Load 0 10 20 30 40 50 60 70 80 90 100 Pressure -0.01 0.58 1.19 1.79 2.36 2.95 3.54 4.11 4.73 5.32 5.91
Hoop-1 36.84 669.6 1585.0 2107.2 2791.5 3471.9 4195.9 4906.0 5600.6 6282.1 7024.3 Hoop-2 -25.93 715.9 1371.7 2107.6 2798.6 3473.5 4202.5 4870.8 5580.3 6279.3 6960.6 Hoop-3 8.13 678.6 1392.4 2127.1 2779.7 3520.3 4215.5 4906.1 5584.9 6321.3 7032.5 Hoop-4 -63.28 698.6 1440.3 2103.1 2807.6 3474.7 4197.1 4890.6 5588.7 6292.3 6995.9 Hoop-5 -17.60 641.1 1470.9 2087.2 2862.4 3444.6 4230.1 4869.1 5601.8 6299.8 7016.0 Hoop-6 1.71 672.0 1388.3 2120.5 2792.8 3490.6 4215.4 4897.1 5607.2 6298.8 7016.1 Hoop-7 65.61 715.2 1375.7 2132.7 2843.6 3466.1 4199.8 4912.7 5586.9 6259.2 7041.2
B-20

Table B-14. CP1B, Load Condition A, Run 3 (Continued)
% Load 0 10 20 30 40 50 60 70 80 90 100 Pressure -0.01 0.58 1.19 1.79 2.36 2.95 3.54 4.11 4.73 5.32 5.91
Hoop-8 2.61 685.0 1425.6 2100.3 2805.0 3487.7 4213.4 4903.6 5592.8 6296.4 6986.0 Hoop-9 514.23 1430.0 2252.6 2598.0 2982.1 3498.6 4211.5 4896.7 5591.6 6295.3 6843.6 Hoop-10 -42.90 805.4 1409.6 2098.9 2789.0 3475.5 4197.0 4917.5 5599.6 6304.7 7154.8 Hoop-11 331.74 860.6 1478.5 2177.8 2798.0 3590.7 4141.1 4875.8 5596.8 6228.7 7044.6 Hoop-12 -203.70 619.9 1049.1 1870.5 2711.0 3105.6 4266.0 4924.2 5535.4 6330.7 6979.1 Hoop-13 50.22 690.0 1462.1 2086.7 2712.2 3499.3 4234.3 4874.6 5528.6 6263.3 6895.6 Hoop-14 61.89 666.3 1427.4 2106.0 2778.0 3517.1 4203.3 4935.0 5591.2 6262.1 7023.2 Long-1 279.06 -4.4 -17.4 319.2 -13.9 168.0 -23.3 -25.7 -3.3 -26.9 31.0 Long-2 93.18 84.9 64.9 77.8 96.7 84.9 88.5 84.9 83.7 81.4 73.2 Long-3 70.23 105.4 501.2 -28.1 -29.3 -29.3 315.4 -28.1 -34.1 -26.8 -15.9 Long-4 -4.07 -6.5 -2.9 3.2 4.4 23.6 16.4 35.6 41.6 60.9 80.2 Long-5 -46.38 10.6 -50.0 396.6 30.8 315.9 -40.4 -40.4 -27.4 250.6 1126.3 Long-6 11.53 11.5 12.7 4.3 -1.7 -11.4 -6.5 -12.6 -12.6 -10.1 -4.1 Long-7 87.66 -25.7 -31.7 -36.5 139.0 8.9 -32.9 -37.7 -30.5 28.0 38.7 Long-8 47.17 104.1 201.4 209.6 233.4 285.6 324.7 341.4 336.6 334.2 308.2 Radial-1R 71.08 66.1 57.3 66.8 71.6 76.9 85.7 97.4 108.5 121.5 129.0 Radial-2R 551.83 602.5 538.6 850.3 423.7 311.1 541.0 671.4 170.2 719.5 275.9 Radial-3R 34.35 33.5 26.0 26.3 28.5 30.1 32.7 34.1 36.6 40.3 41.1 Radial-4R 347.74 53.5 493.0 139.9 399.0 297.5 536.1 278.6 399.0 341.8 569.1 Radial-5R -428.33 -287.1 -442.4 -162.5 -355.0 -533.5 -402.4 -565.8 -104.2 -195.4 -197.0 Radial-6R 39.43 31.5 32.5 40.5 49.8 62.0 72.0 83.2 92.5 105.2 115.6 Radial-7R 0.71 -3.9 -3.1 0.8 3.9 9.4 17.7 24.5 29.9 38.4 35.8 Radial-8R 204.34 200.0 331.2 262.1 243.7 319.4 345.8 292.9 566.7 441.9 344.7 Radial-9R 209.86 224.0 213.2 238.7 234.6 247.2 258.6 262.6 267.7 334.1 457.7 Radial-10R ####### ####### ####### ####### ####### ####### ####### ####### ####### ####### #######SG01 -130.81 -257.5 -332.2 -378.7 -431.1 -492.9 -568.6 -653.7 -751.7 -833.9 -934.2 SG02 -77.48 -180.8 -249.3 -299.3 -355.3 -415.7 -486.6 -563.0 -649.8 -722.3 -808.6 SG03 -26.53 165.2 357.9 541.2 721.7 912.2 1106.8 1292.3 1492.6 1677.9 1870.7 SG04 -27.81 202.9 381.6 528.0 664.1 819.0 971.9 1129.1 1309.1 1468.2 1661.5 SG05 -153.13 -280.8 -361.6 -401.4 -467.5 -524.8 -619.5 -710.0 -811.9 -890.2 -984.5 SG06 -109.65 -219.3 -294.5 -339.4 -405.4 -461.0 -547.8 -630.4 -721.3 -791.5 -874.0 SG07 -55.21 111.0 304.6 500.1 698.5 898.8 1111.5 1306.1 1509.0 1696.3 1881.9 SG08 20.83 224.0 370.0 477.1 585.6 694.4 813.9 932.1 1068.9 1186.9 1334.9 SG09 -141.30 -224.7 -309.8 -354.8 -443.7 -502.8 -611.4 -699.1 -790.7 -856.4 -928.8 SG10 -110.36 -192.2 -275.0 -316.2 -401.3 -454.3 -554.4 -636.4 -721.8 -781.3 -846.6 SG11 -67.72 105.3 300.6 481.4 671.6 853.6 1054.4 1234.1 1424.0 1597.0 1773.6 SG12 43.41 221.8 394.4 526.5 682.9 819.7 984.1 1130.9 1291.1 1429.3 1581.2 SG13 -113.42 -219.8 -321.9 -391.7 -496.0 -576.4 -695.8 -805.3 -916.7 -1011.0 -1118.1 SG14 -93.73 -192.8 -284.6 -356.2 -452.1 -527.5 -635.1 -733.0 -833.4 -917.0 -1008.3 SG15 -78.22 105.9 312.3 507.4 707.2 901.9 1111.7 1305.1 1508.5 1697.0 1890.7 SG16 16.63 218.5 415.2 574.1 753.4 919.7 1107.4 1280.4 1473.6 1639.2 1822.3 SG17 -1237.91 -1300.5 -1338.5 -1363.2 -1409.1 -1441.6 -1499.6 -1559.9 -1614.9 -1663.3 -1724.5 SG18 -56.28 -124.9 -179.8 -221.3 -282.7 -326.6 -393.8 -467.0 -533.9 -592.9 -660.0 SG19 -169.51 -23.5 125.5 274.5 420.6 557.9 712.3 852.8 832.9 1150.6 1450.4 SG20 11.43 198.6 373.0 515.5 671.7 825.3 988.7 1150.4 1319.8 1474.4 1647.3
B-21

Table B-14. CP1B, Load Condition A, Run 3 (Continued)
% Load 0 10 20 30 40 50 60 70 80 90 100 Pressure -0.01 0.58 1.19 1.79 2.36 2.95 3.54 4.11 4.73 5.32 5.91
SG21 -97.27 -199.7 -271.7 -380.2 -465.9 -556.6 -637.0 -750.3 -850.2 -946.0 -1056.7 SG22 -68.83 -145.5 -201.7 -288.5 -368.9 -452.7 -532.1 -593.5 -687.0 -766.4 -852.4 SG23 -95.06 104.7 313.1 540.5 746.1 962.0 1169.5 1378.9 1592.1 1795.4 2007.1 SG24 -2.78 200.3 385.2 567.2 729.5 910.7 1073.9 1254.8 1438.3 1608.2 1801.0 SG25-45 -285.73 29.7 444.9 989.9 1433.2 1901.9 2328.4 2719.3 3118.9 3517.7 3902.6 SG25-H -359.27 270.6 1087.3 2059.5 2949.6 3873.7 4778.7 5609.5 6473.8 7313.0 8146.9 SG25-L -292.52 -92.3 226.7 588.2 907.7 1252.5 1568.7 1843.8 2134.7 2415.0 2670.8 SG26-45 -177.99 266.1 636.7 1054.4 1362.1 1720.2 2029.0 2346.3 2694.2 3042.7 3446.6 SG26-H -120.97 778.4 1562.7 2210.2 2845.3 3515.6 4200.4 4865.0 5613.1 6313.6 7141.0 SG26-L -128.64 50.5 217.6 405.8 532.5 695.7 821.3 944.4 1084.7 1229.1 1393.8 SG31 -171.88 -183.3 -145.2 -84.8 -51.3 6.1 28.3 37.2 49.1 65.4 64.3 SG32 -127.40 -119.8 -94.2 -50.9 -41.4 -10.1 -0.3 2.0 8.6 21.7 31.4 SG33 -159.01 163.4 557.5 951.7 1348.3 1747.0 2158.2 2533.8 2925.5 3291.2 3651.7 SG34 -68.19 272.8 550.0 765.7 983.8 1208.5 1445.0 1680.4 1943.0 2185.0 2477.7 SG35 -195.16 -258.1 -262.0 -249.9 -261.7 -255.2 -281.0 -319.8 -355.4 -383.3 -434.1 SG36 -152.11 -165.2 -149.0 -112.7 -111.3 -86.8 -93.9 -107.3 -114.3 -111.9 -115.7 SG37 -82.72 156.4 450.8 749.8 1049.6 1352.0 1663.3 1948.4 2244.8 2520.9 2794.8 SG38 -82.02 590.4 1112.2 1503.2 1904.2 2312.1 2747.4 3183.3 3667.8 4112.0 4656.9 SG39 -156.68 -258.3 -320.7 -354.5 -420.0 -469.7 -554.2 -644.1 -735.3 -812.6 -908.8 SG40 -130.20 -166.3 -173.3 -162.1 -177.2 -175.1 -198.8 -228.0 -254.3 -271.7 -298.2 SG41 -113.20 82.3 321.0 563.7 808.3 1053.7 1309.4 1545.0 1788.5 2018.0 2243.8 SG42 -40.93 218.9 418.2 567.0 718.0 870.8 1035.1 1200.3 1385.4 1553.8 1762.4 SG43-45 -81.27 467.1 976.3 1314.1 1716.7 2122.6 2564.4 2976.7 3442.9 3860.8 4350.3 SG43-H -269.85 602.1 1354.4 1915.4 2515.6 3131.7 3777.3 4408.5 5108.4 5746.6 6491.2 SG43-L -185.05 39.0 260.4 433.3 598.5 788.1 964.9 1127.5 1318.8 1495.4 1700.0 SG46 -117.19 -136.6 -125.6 -113.0 -115.8 ####### ####### ####### ####### ####### #######SG47 -10.28 276.5 521.7 714.6 915.1 1175.4 1403.1 1618.2 1855.9 2074.7 2335.0 SG48 -122.99 -141.7 -130.0 -137.4 -144.9 -138.9 -139.7 -157.1 -162.8 -170.2 -183.7 SG49 -58.63 234.1 458.8 662.3 839.0 1027.3 1204.6 1394.7 1598.8 1791.1 2031.6 SG50 ####### ####### ####### ####### ####### ####### ####### ####### ####### ####### #######SG51 -10.23 296.7 529.3 721.9 906.6 1092.0 1265.9 1454.6 1660.5 1854.3 2097.1
Table B-15. CP1B, Load Condition B, Run 1
% Load 0 10 20 30 40 50 60 70 80 90 100 Pressure 0.12 0.08 0.04 0.01 0.00 0.00 0.07 0.08 0.08 0.09 0.08
Hoop-1 0.8 -21.2 8.1 -15.7 -1.1 -1.1 -28.6 8.1 24.6 2.6 19.1 Hoop-2 -3.1 -10.1 -10.1 -18.9 0.4 60.2 9.2 -3.1 -6.6 2.2 -3.1 Hoop-3 3.4 44.9 19.6 -3.8 10.6 12.4 12.4 8.8 14.2 1.6 -11.0 Hoop-4 -15.5 -39.6 -34.1 -41.5 -11.8 -35.9 -2.5 5.0 -2.5 -9.9 -0.6 Hoop-5 -30.3 -14.0 -4.9 38.8 -23.0 0.6 11.5 49.7 -14.0 4.2 4.2 Hoop-6 -18.9 -7.9 10.5 3.2 1.3 -6.0 -2.4 32.5 16.0 5.0 -2.4 Hoop-7 11.1 0.3 -30.2 -10.5 -14.1 43.5 -17.6 -5.1 25.5 -26.6 -3.3 Hoop-8 6.6 -0.7 6.6 -0.7 6.6 35.6 -29.7 -0.7 13.8 21.1 13.8 Hoop-9 435.3 324.1 193.3 136.0 89.4 51.8 26.7 32.1 32.1 35.6 28.5
B-22

Table B-15. CP1B, Load Condition B, Run 1 (Continued)
% Load 0 10 20 30 40 50 60 70 80 90 100 Pressure 0.12 0.08 0.04 0.01 0.00 0.00 0.07 0.08 0.08 0.09 0.08
Hoop-10 38.6 -13.1 -39.8 -38.0 -25.6 -57.6 4.7 -0.6 -23.8 -7.7 1.2 Hoop-11 160.0 114.5 76.4 41.8 69.1 130.9 103.6 49.1 98.1 110.9 96.3 Hoop-12 -189.9 -59.1 -18.6 31.1 -11.2 20.1 -204.6 163.7 -189.9 -53.6 -167.8 Hoop-13 -21.9 29.6 36.9 44.3 44.3 0.2 44.3 73.7 66.3 88.4 59.0 Hoop-14 6.5 -0.9 -15.8 -8.4 -15.8 -38.2 -23.3 6.5 -0.9 6.5 36.4 Long-1 138.4 738.2 1092.5 1704.4 2308.8 3181.2 3798.7 4271.1 4821.3 5522.1 6227.6 Long-2 -2.0 491.7 1315.4 1735.1 2361.9 2908.4 3499.7 4176.2 4792.5 5495.3 6056.8 Long-3 128.2 537.0 1120.6 1792.9 2424.9 3003.3 3767.5 4320.8 4963.7 5569.6 6100.4 Long-4 -41.3 747.5 1351.2 1798.7 2491.2 3054.8 3719.7 4423.2 5005.1 5582.8 6187.1 Long-5 247.5 855.4 1078.8 2019.5 2304.3 2876.5 3546.1 4531.8 5006.8 5700.8 6012.6 Long-6 27.4 533.0 1311.9 1635.9 2275.0 3317.3 3879.4 4388.6 4879.7 5680.8 6270.1 Long-7 274.4 583.4 1315.0 1639.7 2550.1 2917.4 3706.0 4064.1 4768.1 5445.2 5966.1 Long-8 -10.5 504.2 1353.3 1969.0 2648.3 2931.5 3661.8 4305.8 4961.5 5685.4 6284.8 Radial-1R 49.6 50.1 49.8 53.6 57.0 64.7 63.5 65.1 70.3 74.4 77.8 Radial-2R 513.7 374.5 212.3 -36.0 -26.6 276.1 233.6 250.5 732.5 2.1 298.3 Radial-3R 28.0 30.0 35.5 39.2 43.3 65.2 64.0 70.5 82.0 90.3 108.7 Radial-4R 68.6 -161.8 377.2 188.3 -207.6 -81.9 -109.4 -51.1 223.5 -176.9 -67.3 Radial-5R -100.4 -527.3 -358.1 -160.7 -466.4 -358.0 -167.3 -340.2 -204.5 -354.3 -167.3 Radial-6R 40.5 47.5 52.8 58.7 63.0 69.5 68.1 69.0 70.1 69.1 69.0 Radial-7R 1.2 9.3 18.8 25.8 32.6 44.8 44.0 50.1 58.7 71.3 91.7 Radial-8R -130.5 -51.1 89.8 -2.5 157.8 292.9 -60.8 -15.5 -52.2 -55.4 46.6 Radial-9R 1111.1 1076.3 1100.9 1063.8 1130.9 1156.1 1157.2 1175.1 1043.2 1018.1 1096.7 Radial-10R ####### ####### ####### ####### ####### ####### ####### ####### ####### ####### #######SG01 -25.8 109.5 298.3 431.2 608.5 766.9 932.6 1080.2 1236.4 1420.3 1571.3 SG02 -39.0 67.6 217.1 324.8 470.9 600.9 741.1 863.5 994.6 1149.2 1275.2 SG03 -31.2 -80.7 -146.3 -194.2 -257.4 -309.2 -385.7 -446.7 -506.7 -582.4 -640.7 SG04 18.0 -62.6 -184.3 -265.4 -367.8 -466.2 -553.8 -628.0 -717.8 -816.8 -907.0 SG04 17.7 151.0 325.5 461.9 633.8 812.4 981.5 1136.4 1298.6 1490.6 1644.9 SG05 -23.2 124.5 314.8 463.7 648.2 842.1 1022.8 1190.5 1363.2 1568.3 1733.3 SG07 -158.0 -191.9 -227.6 -262.0 -307.1 -335.7 -409.4 -463.5 -510.4 -572.6 -617.0 SG08 -192.8 -283.1 -415.8 -510.8 -620.7 -761.4 -853.7 -941.4 -1047.6 -1167.6 -1271.9 SG09 -3.5 118.2 254.7 383.3 532.6 704.9 856.3 1006.8 1154.8 1329.8 1469.6 SG10 -7.6 116.4 254.0 385.1 534.5 709.3 862.2 1014.8 1163.8 1340.9 1481.3 SG11 -57.3 -96.5 -135.1 -178.4 -228.6 -283.3 -348.3 -404.0 -460.6 -526.0 -579.4 SG12 9.1 -68.8 -160.4 -245.6 -330.1 -449.5 -531.0 -618.4 -707.5 -810.6 -895.3 SG13 14.4 132.7 268.3 395.2 539.3 699.2 846.6 987.0 1133.2 1294.4 1431.2 SG14 -3.8 109.8 243.1 360.3 496.0 642.3 781.7 913.7 1049.1 1202.9 1328.7 SG15 -66.2 -106.7 -148.6 -192.2 -240.0 -288.0 -353.4 -406.5 -460.4 -520.8 -571.8 SG16 5.8 -69.0 -156.3 -240.1 -322.4 -431.3 -510.6 -593.2 -674.8 -772.1 -855.3 SG17 -82.9 32.1 170.2 294.0 432.6 585.4 722.9 857.3 997.4 1147.5 1278.4 SG18 43.9 154.2 279.7 400.7 528.8 673.9 806.8 937.4 1069.0 1211.7 1336.1 SG19 -159.5 -193.9 -408.7 -274.0 -305.6 -345.7 -403.0 -445.9 -488.8 -534.7 -583.3 SG20 -33.6 -101.6 -177.9 -256.2 -328.7 -429.6 -502.8 -581.5 -665.3 -750.3 -830.1 SG21 24.6 161.1 323.2 468.3 628.6 794.5 961.3 1120.1 1282.3 1449.5 1602.1 SG22 2.7 112.9 258.2 378.5 523.8 685.1 810.8 947.8 1091.4 1246.4 1380.4
B-23

Table B-15. CP1B, Load Condition B, Run 1 (Continued)
% Load 0 10 20 30 40 50 60 70 80 90 100 Pressure 0.12 0.08 0.04 0.01 0.00 0.00 0.07 0.08 0.08 0.09 0.08
SG23 -87.1 -143.4 -211.1 -270.2 -335.1 -398.3 -482.8 -554.4 -626.1 -701.1 -769.9 SG24 -22.1 -101.6 -192.3 -283.2 -371.5 -478.0 -569.0 -656.9 -750.7 -844.0 -933.5 SG25-45 178.6 251.6 298.0 380.8 437.6 582.8 606.7 677.0 735.3 807.8 879.8 SG25-H -127.9 -95.8 -76.8 -38.0 -18.5 99.6 37.1 43.3 54.0 64.3 85.9 SG25-L 203.5 336.5 510.0 650.5 814.3 1019.9 1138.5 1274.0 1434.9 1602.8 1753.6 SG26-45 -282.4 -318.2 -452.3 -488.6 -564.9 -624.6 -647.4 -652.2 -728.8 -775.4 -825.3 SG26-H -411.4 -595.8 -874.2 -1094.7 -1302.0 -1622.9 -1783.2 -1943.4 -2184.3 -2430.3 -2672.4 SG26-L -3.6 61.6 98.4 167.3 230.2 298.5 381.7 472.3 529.9 613.2 679.0 SG31 48.6 152.1 281.0 392.7 520.6 669.0 788.1 907.1 1038.1 1179.7 1303.6 SG32 88.9 192.2 306.5 415.0 534.0 657.9 777.5 893.1 1006.7 1136.3 1246.4 SG33 -70.0 -81.3 -71.4 -84.4 -89.8 -75.3 -136.6 -172.0 -186.5 -215.3 -236.1 SG34 -259.0 -353.7 -493.6 -602.6 -715.3 -880.3 -972.0 -1063.9 -1189.4 -1317.2 -1435.3 SG35 61.8 204.0 383.7 533.4 709.4 900.2 1066.1 1224.6 1400.8 1590.9 1755.7 SG36 78.7 213.4 368.4 510.2 668.0 834.3 990.3 1138.8 1289.4 1459.5 1603.5 SG37 8.6 -4.2 -4.0 -16.7 -29.1 -20.8 -77.1 -110.0 -127.8 -158.2 -181.0 SG38 308.7 72.7 -266.9 -530.2 -808.9 -1194.9 -1422.5 -1652.3 -1954.7 -2265.3 -2549.7 SG39 155.7 288.5 444.4 582.1 739.9 913.2 1070.7 1220.7 1378.6 1554.9 1705.5 SG40 59.7 180.5 322.1 447.2 587.3 733.8 869.1 998.2 1131.7 1281.5 1408.7 SG41 -57.7 -70.4 -75.3 -91.5 -108.8 -107.8 -160.3 -193.5 -214.0 -245.6 -272.2 SG42 113.8 28.0 -100.9 -198.2 -304.1 -451.4 -538.4 -625.4 -740.8 -859.2 -967.5 SG43-45 719.1 644.1 580.1 463.1 413.2 204.1 184.7 32.1 -59.2 -205.1 -254.6 SG43-H -1264.0 -1480.0 -1753.5 -2011.8 -2238.1 -2605.8 -2798.1 -3000.6 -3260.1 -3526.7 -3781.2 SG43-L -371.9 -198.7 -103.3 -34.5 42.4 76.5 139.2 205.0 270.2 341.0 393.4 SG46 1540.6 1341.9 1403.1 1358.9 1453.0 1493.7 1599.8 1677.6 1770.9 1883.6 1983.1 SG47 40746.7 41307.1 43143.9 44293.6 44713.3 44941.3 44883.5 45900.8 43141.1 41474.3 40423.8SG48 83.0 187.5 317.7 427.8 554.4 679.3 799.3 911.8 1033.9 1162.5 1276.7 SG49 1443.9 1315.8 1115.0 916.1 699.2 481.1 337.6 208.8 10.2 -177.0 -369.5 SG50 64.0 192.1 342.3 471.9 618.5 773.6 912.2 1042.6 1188.2 1339.4 1474.5 SG51 136.7 48.8 -100.2 -211.6 -333.8 -493.7 -581.6 -669.7 -800.4 -925.1 -1042.8
Table B-16. CP1B, Load Condition B, Run 2
% Load 0 10 20 30 40 50 60 70 80 90 100 Pressure 0.06 0.07 0.06 0.06 0.05 0.05 0.04 0.04 0.04 0.04 0.03
Hoop-1 -21.2 -6.6 -32.2 31.9 55.8 -21.2 6.3 -1.1 -8.4 -15.7 13.6 Hoop-2 -34.7 86.5 118.1 -45.2 -40.0 -22.4 3.9 12.7 -24.2 28.5 -13.6 Hoop-3 -5.6 7.0 16.0 -0.2 -3.8 19.6 -7.4 -11.0 10.6 -7.4 -3.8 Hoop-4 8.7 -21.1 -21.0 -17.3 32.8 -26.6 -22.9 -0.6 1.2 -2.5 3.1 Hoop-5 51.5 77.0 -34.0 17.0 18.8 -37.6 87.9 69.7 15.1 33.3 26.0 Hoop-6 -6.0 5.0 -17.0 -7.9 -17.0 -18.9 -2.4 12.3 -13.4 -2.4 -2.4 Hoop-7 29.1 0.3 -8.7 -1.5 -12.3 20.1 2.1 -1.5 12.9 -6.9 11.1 Hoop-8 -8.0 6.6 6.6 -0.7 13.8 -8.0 -0.7 -0.7 -8.0 -0.7 28.3 Hoop-9 15.9 48.2 101.9 144.9 162.9 187.9 182.6 161.0 89.4 85.8 69.7 Hoop-10 31.5 15.4 -48.7 1.2 -2.4 -2.4 1.2 6.5 6.5 4.7 -0.6 Hoop-11 134.5 20.0 -7.2 -14.5 -1.8 1.9 3.7 12.7 -1.8 23.7 38.2
B-24

Table B-16. CP1B, Load Condition B, Run 2 (Continued)
% Load 0 10 20 30 40 50 60 70 80 90 100 Pressure 0.06 0.07 0.06 0.06 0.05 0.05 0.04 0.04 0.04 0.04 0.03
Hoop-12 -201.0 108.5 82.7 69.8 -24.1 -145.7 -46.2 56.9 40.3 -5.7 -77.6 Hoop-13 -51.3 -21.9 22.2 36.9 88.4 88.4 125.2 110.4 95.8 103.1 117.8 Hoop-14 -45.7 6.5 6.5 21.5 -8.4 -0.9 14.0 -8.4 6.5 -0.9 21.5 Long-1 45.0 533.9 1332.2 1930.8 2370.7 3064.3 3585.4 4405.8 5007.4 5605.4 6016.3 Long-2 157.0 478.7 1124.5 1707.7 2350.6 3164.1 3669.9 4241.1 4915.7 5510.0 6181.7 Long-3 -161.8 632.8 1263.8 1858.1 2475.1 2948.7 3652.7 4325.7 4877.1 5523.0 6159.9 Long-4 -5.2 757.1 1194.9 1942.6 2634.8 3076.5 3621.5 4181.5 4894.0 5406.7 6096.9 Long-5 59.8 596.5 1308.0 1832.7 2251.4 2941.8 3766.3 4330.0 4836.5 5536.4 5985.3 Long-6 -120.7 826.7 1452.8 2012.4 2544.0 3158.4 3590.9 4332.1 5127.2 5586.3 6237.6 Long-7 110.8 496.3 1036.9 1648.9 2635.3 3004.5 3634.9 4240.7 4820.1 5627.2 6042.5 Long-8 12.1 710.5 1042.6 1703.0 2514.8 3033.4 3751.2 4220.5 4750.0 5429.9 6187.7 Radial-1R 46.3 46.7 48.1 50.5 52.5 57.6 60.9 64.2 70.1 75.5 77.9 Radial-2R 592.3 219.2 588.0 449.0 177.6 231.3 454.1 187.7 93.2 529.5 279.2 Radial-3R 25.4 27.0 30.0 34.2 36.0 43.0 54.0 64.4 77.5 91.6 109.8 Radial-4R 91.3 129.1 -461.1 253.7 -6.9 141.5 273.1 14.7 336.8 58.4 -32.8 Radial-5R -547.3 -82.7 -220.0 -296.1 -146.8 -99.9 -160.8 -4.0 -303.1 -220.1 -713.2 Radial-6R 47.7 45.6 45.1 44.8 44.5 47.5 51.3 52.5 58.9 62.2 64.8 Radial-7R 1.0 3.1 8.8 13.7 19.1 25.5 34.7 40.4 61.3 76.7 94.7 Radial-8R -297.9 -195.9 127.1 -71.1 53.6 -179.6 106.6 191.8 -241.8 70.9 128.2 Radial-9R 1114.1 1078.7 933.8 1309.4 1128.9 1095.3 1178.2 1167.7 1129.0 1166.8 1208.8 Radial-10R ####### ####### ####### ####### ####### ####### ####### ####### ####### ####### #######SG01 9.0 152.2 284.0 429.7 608.4 743.6 904.4 1060.6 1236.1 1404.9 1562.1 SG02 -30.4 87.7 196.8 317.6 466.3 579.9 713.4 843.8 989.0 1132.3 1262.9 SG03 -31.7 -89.7 -139.6 -195.3 -263.6 -316.5 -378.3 -440.6 -506.1 -572.2 -634.3 SG04 -59.5 -121.6 -192.4 -268.7 -366.2 -444.6 -538.5 -622.9 -732.8 -830.2 -913.8 SG04 26.2 175.2 322.2 470.4 643.0 791.4 952.3 1119.7 1307.6 1481.5 1643.3 SG05 -7.4 156.0 316.1 476.4 662.7 822.9 996.1 1175.7 1377.3 1562.6 1734.8 SG07 -135.4 -189.0 -230.8 -276.2 -329.4 -371.4 -417.7 -467.4 -507.6 -559.7 -608.9 SG08 -248.3 -326.5 -421.3 -508.5 -610.9 -710.8 -815.2 -922.9 -1068.8 -1180.3 -1282.2 SG09 -13.2 129.7 278.5 412.2 558.3 703.3 843.4 1000.4 1171.7 1325.6 1477.1 SG10 -23.4 120.2 269.8 405.4 552.4 699.5 843.7 1001.7 1174.1 1329.4 1482.3 SG11 -47.4 -95.5 -148.7 -196.2 -248.3 -301.6 -350.9 -408.5 -467.2 -524.3 -582.2 SG12 -14.5 -93.8 -184.7 -258.5 -336.9 -429.2 -514.7 -608.9 -727.0 -816.0 -908.2 SG13 15.2 148.0 286.7 420.5 564.2 703.8 837.4 983.8 1140.4 1287.5 1432.8 SG14 -7.5 119.5 248.6 373.9 509.9 637.4 765.8 902.5 1052.7 1190.3 1327.2 SG15 -61.9 -108.1 -158.9 -207.5 -259.1 -309.9 -357.2 -411.0 -463.8 -518.2 -571.9 SG16 -19.0 -92.9 -179.6 -256.3 -334.6 -422.4 -501.2 -590.1 -690.2 -777.2 -866.2 SG17 -82.4 44.7 173.2 308.8 448.5 579.2 712.4 849.3 992.1 1132.8 1271.6 SG18 62.3 179.9 303.7 431.2 559.3 685.5 810.3 940.7 1074.0 1206.7 1336.0 SG19 -159.5 -193.9 -239.7 -285.5 -325.7 -371.5 -574.8 -626.3 -491.7 -537.6 -583.3 SG20 -32.5 -100.1 -176.1 -255.5 -329.5 -412.2 -488.5 -571.0 -661.9 -746.0 -830.4 SG21 36.5 178.5 329.0 495.3 661.2 806.4 963.1 1119.2 1287.2 1445.0 1608.1 SG22 -14.8 117.3 267.6 388.7 531.9 650.1 797.5 928.8 1070.5 1221.0 1368.9 SG23 -85.0 -144.5 -210.4 -282.9 -355.6 -418.9 -487.6 -556.7 -628.2 -697.9 -770.6 SG24 -60.7 -133.9 -212.6 -306.0 -396.1 -478.6 -570.4 -658.4 -759.0 -852.0 -945.7
B-25

Table B-16. CP1B, Load Condition B, Run 2 (Continued)
% Load 0 10 20 30 40 50 60 70 80 90 100 Pressure 0.06 0.07 0.06 0.06 0.05 0.05 0.04 0.04 0.04 0.04 0.03
SG25-45 204.5 242.7 318.1 377.4 419.3 508.7 572.2 650.8 739.6 814.5 871.8 SG25-H -104.0 -116.6 -89.6 -80.7 -85.1 -44.9 -25.8 -1.0 52.1 75.0 83.8 SG25-L 194.3 326.9 477.9 625.0 787.3 939.0 1092.8 1246.5 1433.5 1597.9 1751.5 SG26-45 -263.5 -293.5 -336.1 -386.2 -473.1 -504.5 -569.8 -609.8 -718.9 -779.5 -846.2 SG26-H -565.6 -678.3 -885.4 -1065.5 -1256.1 -1476.3 -1685.4 -1897.3 -2219.0 -2464.0 -2691.2 SG26-L 39.1 115.6 177.8 243.7 302.2 369.7 428.1 500.8 545.0 611.8 671.6 SG31 28.8 141.1 263.4 385.0 517.0 638.8 763.4 891.2 1035.5 1170.7 1298.7 SG32 148.3 255.6 362.0 469.8 583.8 690.5 797.9 911.0 1025.0 1140.3 1250.5 SG33 -58.3 -84.0 -98.6 -120.5 -135.8 -153.6 -168.2 -190.8 -191.0 -211.1 -233.4 SG34 -256.5 -331.4 -445.4 -549.1 -662.5 -783.5 -899.8 -1020.2 -1185.0 -1313.6 -1431.5 SG35 67.4 220.6 383.6 544.8 723.9 883.0 1048.3 1216.5 1407.6 1585.8 1756.6 SG36 146.3 286.0 426.2 569.0 721.0 862.3 1004.6 1154.0 1308.6 1461.6 1607.8 SG37 39.3 10.4 -7.4 -33.2 -54.6 -73.7 -92.6 -115.6 -124.5 -148.6 -172.6 SG38 292.6 100.8 -172.1 -425.2 -703.6 -992.0 -1274.1 -1564.0 -1951.3 -2262.1 -2546.7 SG39 159.5 301.1 450.6 598.3 758.2 906.8 1057.5 1213.8 1385.6 1548.7 1704.2 SG40 126.1 247.1 369.9 493.3 628.3 751.3 876.9 1007.5 1146.3 1281.5 1409.5 SG41 -25.5 -56.1 -77.0 -104.1 -128.5 -151.4 -172.3 -199.0 -214.2 -240.9 -266.6 SG42 127.5 52.5 -52.7 -149.7 -258.2 -368.5 -477.5 -589.2 -739.5 -858.5 -968.4 SG43-45 789.0 676.8 608.4 443.4 318.0 357.3 182.2 125.9 -13.7 -154.5 -278.1 SG43-H -1387.6 -1526.9 -1774.4 -1991.1 -2206.2 -2468.7 -2688.3 -2940.8 -3272.2 -3536.9 -3776.5 SG43-L -192.6 -131.2 -88.9 -30.0 43.2 68.0 37.9 223.6 51.3 -200.6 -155.9 SG46 773.8 864.8 968.9 1085.9 1211.9 1340.7 1640.9 1727.5 1832.7 1948.3 2044.7 SG47 40236.9 39186.2 39825.7 39274.1 40226.8 37969.5 35266.2 35962.4 36593.2 36530.1 36191.7SG48 115.9 226.5 336.1 454.9 582.7 690.3 804.2 919.1 1040.8 1160.6 1279.7 SG49 1023.7 884.1 732.3 574.8 400.9 1147.8 1034.2 824.0 571.3 395.7 223.0 SG50 110.2 232.6 362.1 498.5 644.5 774.3 908.0 1043.3 1190.0 1331.3 1470.3 SG51 121.2 41.2 -70.8 -179.4 -302.7 -419.2 -536.5 -650.7 -809.3 -936.7 -1057.8
Table B-17. CP1B, Load Condition B, Run 3
% Load 0 10 20 30 40 50 60 70 80 90 100 Pressure 0.02 0.02 0.03 0.02 0.02 0.03 0.06 0.07 0.08 0.08 0.08
Hoop-1 -8.4 -6.6 -4.7 -37.7 17.3 -34.1 -26.7 -2.9 6.3 13.6 9.9 Hoop-2 -34.7 -4.8 -11.9 -25.9 -13.6 -20.6 97.1 -3.1 -6.6 5.7 -3.1 Hoop-3 -2.0 21.4 3.4 10.6 -2.0 5.2 -11.0 21.4 -9.2 -14.6 1.6 Hoop-4 -0.6 40.2 19.8 34.7 -9.9 -6.2 14.2 6.8 -0.6 1.2 -0.6 Hoop-5 24.2 64.2 -1.2 57.0 -4.9 47.9 -10.3 -28.5 17.0 2.4 42.4 Hoop-6 -20.7 -6.0 -15.2 -94.1 -6.0 -17.0 -48.2 -7.9 1.3 19.7 -2.4 Hoop-7 -12.3 36.3 -12.3 -14.1 -6.9 -28.4 -12.3 -5.1 3.9 -5.1 -5.1 Hoop-8 35.6 21.1 -15.2 -15.2 -15.2 13.8 42.8 13.8 -8.0 21.1 6.6 Hoop-9 -18.1 24.9 75.1 -14.5 103.7 80.5 7.0 -0.2 42.8 71.5 85.8 Hoop-10 -30.9 26.1 -2.4 33.2 -29.1 -16.7 6.5 -0.6 1.2 1.2 8.3 Hoop-11 36.4 -1.8 -1.8 -12.7 1.9 47.3 -20.0 29.1 10.9 32.7 56.4 Hoop-12 -223.1 -49.9 -103.3 -29.7 -38.9 -134.7 -11.2 -230.4 -66.5 -274.7 -173.3 Hoop-13 0.2 0.2 36.9 44.3 44.3 81.1 44.3 29.6 44.3 36.9 29.6
B-26

Table B-17. CP1B, Load Condition B, Run 3 (Continued)
% Load 0 10 20 30 40 50 60 70 80 90 100 Pressure 0.02 0.02 0.03 0.02 0.02 0.03 0.06 0.07 0.08 0.08 0.08
Hoop-14 6.5 14.0 21.5 21.5 73.7 -15.8 -15.8 6.5 14.0 6.5 14.0 Long-1 -120.3 652.1 1331.2 1791.6 2362.0 2990.5 3760.9 4251.9 4785.0 5620.7 6006.3 Long-2 74.6 643.8 1191.8 1944.7 2333.6 3145.8 3703.6 4162.9 4795.1 5389.7 6149.3 Long-3 -96.3 488.6 1300.3 1857.1 2456.4 2965.1 3610.9 4262.2 4909.4 5514.4 6108.3 Long-4 122.2 692.3 1122.8 1745.6 2568.1 3030.2 3618.6 4300.2 4927.2 5637.5 6184.1 Long-5 192.8 608.5 1436.4 1873.3 2585.8 2909.1 3578.1 4371.2 4837.2 5587.4 5993.0 Long-6 -32.8 464.5 1225.4 1917.5 2419.5 2961.5 3490.4 4337.7 5005.2 5660.9 6249.0 Long-7 124.0 492.8 1293.6 1696.8 2642.0 3011.0 3712.0 4327.4 4783.8 5529.3 6151.6 Long-8 190.0 574.2 1281.1 1757.7 2207.2 3003.2 3997.5 4451.3 4785.1 5625.5 6191.8 Radial-1R 53.0 50.1 49.4 48.8 52.6 59.6 65.9 75.7 80.4 86.0 90.5 Radial-2R 346.6 224.4 642.5 276.9 201.6 249.1 239.9 448.6 374.4 198.4 436.3 Radial-3R 25.5 27.2 31.6 33.1 41.1 46.7 70.0 87.6 109.5 125.5 142.3 Radial-4R -55.0 158.7 -178.5 -180.6 258.6 0.6 -2.6 -131.6 -146.7 81.6 172.2 Radial-5R -384.6 -285.3 -60.5 -336.5 -449.7 -264.3 -528.9 -337.1 14.9 -179.7 -150.6 Radial-6R 37.7 40.8 39.3 44.1 44.1 53.1 62.5 65.2 68.4 69.7 73.0 Radial-7R 2.9 5.6 11.6 17.6 22.3 35.0 55.8 68.1 84.5 107.3 131.1 Radial-8R 120.6 -29.0 7.2 254.5 66.1 156.2 -148.3 115.2 182.1 260.5 285.8 Radial-9R 1096.7 1160.5 1120.2 1165.1 1165.6 1181.0 1391.8 1341.4 1273.3 1320.8 1370.0 Radial-10R ####### ####### ####### ####### ####### ####### ####### ####### ####### ####### #######SG01 40.3 137.3 309.6 442.1 598.6 746.2 943.4 1102.4 1235.4 1420.6 1574.9 SG02 -11.4 70.0 213.8 322.2 453.3 575.1 740.0 873.2 985.2 1140.7 1269.7 SG03 -44.1 -77.7 -145.2 -199.6 -254.8 -304.1 -371.0 -430.9 -480.7 -553.5 -613.6 SG04 -84.3 -133.0 -218.9 -291.9 -377.7 -478.1 -602.0 -687.6 -759.1 -855.3 -941.3 SG04 51.9 159.5 338.5 478.8 646.3 789.9 984.2 1161.6 1312.0 1503.6 1664.2 SG05 27.6 141.9 336.0 489.0 668.0 820.2 1027.8 1217.7 1376.3 1580.4 1751.6 SG07 -145.0 -174.7 -231.4 -274.8 -318.4 -337.6 -373.7 -418.3 -457.9 -518.8 -566.0 SG08 -265.7 -330.1 -432.9 -523.2 -631.2 -749.5 -889.2 -1011.8 -1112.4 -1227.2 -1332.0 SG09 14.8 119.8 286.1 419.3 571.1 685.3 851.1 1019.6 1164.1 1336.7 1483.6 SG10 0.0 107.7 275.6 410.1 564.8 683.2 853.8 1024.8 1172.8 1346.8 1495.5 SG11 -57.5 -92.4 -150.3 -199.2 -251.0 -282.0 -335.6 -393.5 -445.3 -510.0 -565.8 SG12 -36.9 -95.7 -189.6 -270.8 -361.1 -444.4 -551.1 -657.8 -746.5 -844.1 -931.7 SG13 37.9 140.6 295.6 419.8 572.4 680.5 841.7 996.3 1134.2 1298.6 1440.3 SG14 10.6 108.5 254.7 374.1 516.0 624.5 775.6 920.7 1049.5 1205.1 1336.8 SG15 -69.3 -105.5 -160.1 -208.1 -259.1 -289.0 -337.9 -389.4 -438.1 -498.8 -550.9 SG16 -38.9 -94.9 -186.7 -263.9 -355.0 -426.6 -526.1 -617.7 -703.4 -797.4 -883.0 SG17 -73.8 30.2 175.0 293.1 445.4 556.7 711.7 854.6 990.3 1146.3 1281.2 SG18 72.7 175.1 311.2 425.3 563.7 669.3 810.5 944.8 1074.0 1219.5 1344.9 SG19 -162.4 -193.9 -242.5 -274.0 -328.5 -354.3 -400.1 -434.5 -486.1 -531.8 -580.5 SG20 -38.7 -94.7 -180.3 -251.3 -344.0 -410.0 -504.1 -596.8 -684.4 -772.7 -856.6 SG21 51.9 185.2 343.4 492.2 659.6 804.2 969.3 1129.2 1291.2 1464.2 1620.4 SG22 -5.3 118.0 250.8 364.7 538.4 659.6 801.9 945.0 1089.0 1247.8 1374.8 SG23 -86.9 -145.5 -211.8 -281.2 -350.4 -410.2 -474.9 -539.8 -610.0 -687.0 -756.2 SG24 -81.1 -144.8 -231.1 -313.1 -410.0 -495.5 -594.8 -694.3 -790.2 -884.4 -974.3 SG25-45 206.9 253.1 332.9 390.3 460.8 527.7 638.5 734.8 821.2 884.4 952.9 SG25-H -112.5 -99.7 -78.3 -71.9 -36.3 25.3 111.2 168.6 212.6 219.5 242.8
B-27

Table B-17. CP1B, Load Condition B, Run 3 (Continued)
% Load 0 10 20 30 40 50 60 70 80 90 100 Pressure 0.02 0.02 0.03 0.02 0.02 0.03 0.06 0.07 0.08 0.08 0.08
SG25-L 215.3 327.9 498.4 627.0 803.6 966.0 1179.4 1353.6 1503.8 1681.6 1834.2 SG26-45 -273.8 -302.3 -341.9 -389.4 -473.7 -594.2 -700.0 -767.7 -813.3 -881.7 -948.9 SG26-H -590.4 -720.7 -922.3 -1112.4 -1330.3 -1594.6 -1901.9 -2166.9 -2401.0 -2649.8 -2892.4 SG26-L 51.1 102.9 183.8 239.2 297.7 315.7 371.2 429.6 488.9 561.5 614.0 SG31 47.4 137.6 278.2 387.3 523.3 636.4 792.8 928.6 1048.5 1197.4 1322.4 SG32 170.1 251.8 375.7 471.3 584.1 670.3 793.8 905.5 1007.3 1132.2 1235.0 SG33 -67.5 -76.1 -98.8 -123.7 -127.9 -102.6 -89.4 -96.9 -112.4 -137.3 -156.9 SG34 -261.1 -337.4 -455.7 -561.1 -687.6 -827.7 -994.5 -1138.1 -1261.1 -1395.5 -1521.8 SG35 100.6 219.5 405.0 550.1 730.2 880.2 1084.3 1262.5 1419.3 1618.3 1784.7 SG36 173.1 280.0 443.7 570.9 722.6 841.6 1008.8 1159.7 1295.2 1462.4 1600.7 SG37 37.2 24.7 0.1 -27.2 -40.9 -27.2 -26.1 -38.6 -56.3 -85.9 -108.0 SG38 269.1 83.3 -206.3 -458.3 -763.9 -1092.5 -1488.0 -1824.9 -2114.2 -2437.9 -2737.2 SG39 188.7 296.1 467.8 601.3 761.0 887.9 1068.6 1232.1 1376.5 1557.5 1709.2 SG40 146.7 239.5 381.6 493.2 626.4 734.7 883.8 1016.5 1134.9 1281.9 1403.7 SG41 -30.6 -46.6 -76.2 -105.9 -124.5 -120.6 -129.1 -146.0 -169.0 -201.4 -226.6 SG42 117.1 44.7 -66.9 -164.7 -283.6 -411.5 -564.7 -695.4 -807.1 -932.4 -1048.7 SG43-45 684.5 607.4 507.6 396.5 279.8 143.8 -5.9 -190.6 -350.4 -520.3 -690.3 SG43-H -1400.2 -1557.4 -1796.4 -2012.6 -2263.1 -2538.6 -2873.9 -3168.0 -3432.9 -3701.1 -3967.3 SG43-L -251.5 -167.6 -98.9 -48.7 -6.2 14.4 67.6 115.5 175.8 250.0 309.0 SG46 832.2 903.1 1008.8 1102.4 1229.2 1317.9 1443.0 1552.5 1661.2 1791.6 1893.3 SG47 37363.5 37168.1 36801.5 36874.0 37448.9 36895.2 36593.2 36863.2 36371.1 36000.8 35675.6SG48 131.0 222.1 346.1 445.7 572.8 677.3 808.4 922.8 1030.3 1163.1 1274.2 SG49 1569.7 1533.6 1454.2 1362.2 1090.1 908.1 722.6 522.8 359.8 206.1 79.2 SG50 118.5 224.5 368.6 486.5 634.2 761.9 920.4 1058.2 1187.4 1342.3 1473.4 SG51 101.9 21.1 -93.7 -193.9 -328.6 -476.7 -644.8 -783.6 -904.8 -1039.6 -1167.5
Table B-18. CP1B, Load Condition C, Run 1
% Load 0 10 20 30 40 50 60 70 80 90 100 Pressure 0.00 0.59 1.17 1.76 2.38 2.95 3.55 4.14 4.71 5.30 5.89
Hoop-1 -7.2 733.8 1423.3 2129.6 2828.4 3512.9 4178.4 4886.8 5571.0 6279.1 7027.9 Hoop-2 121.7 608.6 1385.4 2044.8 2781.3 3476.0 4201.6 4905.2 5610.1 6258.7 6960.6 Hoop-3 -4.5 676.7 1428.1 2096.9 2807.0 3504.8 4207.3 4894.5 5610.0 6302.1 6987.5 Hoop-4 -7.5 696.7 1345.2 2057.1 2830.2 3471.7 4207.2 4899.0 5599.7 6300.3 6994.1 Hoop-5 -14.0 712.0 1461.5 2022.1 2851.8 3476.2 4196.4 4877.4 5565.2 6300.3 6999.6 Hoop-6 -18.5 703.1 1393.6 2084.2 2793.1 3507.8 4214.5 4909.1 5601.5 6260.8 6977.6 Hoop-7 8.0 688.1 1456.4 2124.1 2784.5 3475.8 4188.1 4917.3 5588.5 6290.3 6960.2 Hoop-8 38.9 714.1 1396.4 2108.0 2819.8 3502.6 4199.7 4938.9 5600.6 6281.9 7052.7 Hoop-9 410.2 1281.2 1686.1 2114.6 2772.7 3556.3 4187.3 4806.1 5576.0 6280.9 6972.3 Hoop-10 30.2 664.6 1395.2 2060.1 2858.8 3447.4 4139.0 4834.5 5669.7 6217.4 7029.6 Hoop-11 186.3 764.3 1469.3 2072.8 2892.8 3585.6 4074.6 4883.9 5213.9 6241.4 7067.8 Hoop-12 63.5 419.0 1297.7 2108.5 2484.6 3286.5 4220.8 4753.7 5624.4 6249.6 6892.1 Hoop-13 35.5 741.4 1395.8 2087.1 2955.1 3610.0 4213.1 4917.7 5646.8 6278.0 6551.3 Hoop-14 2.2 740.9 1397.4 2196.0 2785.8 3517.5 4204.1 4904.2 5621.6 6299.4 7047.0 Long-1 0.3 674.7 1182.7 1812.3 2333.5 3033.8 3806.7 4408.0 4863.5 5347.3 6238.5
B-28

Table B-18. CP1B, Load Condition C, Run 1 (Continued)
% Load 0 10 20 30 40 50 60 70 80 90 100 Pressure 0.00 0.59 1.17 1.76 2.38 2.95 3.55 4.14 4.71 5.30 5.89
Long-2 67.2 498.6 1089.2 1948.5 2507.5 2964.6 3890.4 4404.3 5049.9 5457.2 6201.5 Long-3 59.3 468.3 1234.1 1789.9 2383.6 3172.2 3709.0 4334.1 4924.7 5520.0 6100.7 Long-4 154.7 692.3 1167.5 1871.2 2288.8 3175.1 3708.4 4359.2 4912.1 5393.9 6212.4 Long-5 -33.3 334.9 1040.6 1848.4 2340.4 3104.0 3682.9 4069.0 4984.5 5690.8 6227.1 Long-6 -17.4 690.6 1111.0 1993.7 2310.6 2970.3 3725.8 4203.9 4758.6 5522.8 6250.7 Long-7 41.1 458.9 1366.1 1957.0 2586.4 2940.6 3547.4 4295.9 4912.7 5612.8 6141.0 Long-8 168.2 685.3 1149.2 1947.5 2304.8 3049.6 3946.8 4254.0 4763.7 5474.9 6250.1 Radial-1R 116.6 102.4 89.5 71.8 74.1 68.7 72.0 79.3 83.9 93.8 108.5 Radial-2R 460.2 762.9 739.6 833.8 667.8 668.4 644.9 723.3 738.4 476.5 744.0 Radial-3R 57.9 45.9 41.9 37.1 36.7 35.7 38.1 40.2 47.1 51.8 64.2 Radial-4R 282.4 234.4 146.9 766.7 622.6 480.6 -153.8 311.1 207.4 307.2 223.0 Radial-5R -220.2 -495.7 -26.6 -369.1 -515.2 -413.9 -501.2 -361.0 -238.0 -323.7 -256.3 Radial-6R 59.1 63.3 62.5 65.5 74.0 70.5 68.1 76.1 86.3 96.7 109.6 Radial-7R 11.1 10.4 15.8 16.5 16.0 13.1 15.7 21.8 29.5 42.3 63.4 Radial-8R 238.9 213.0 46.1 211.9 340.5 324.8 260.0 -87.8 8.3 376.6 217.3 Radial-9R 127.3 121.5 99.4 84.0 70.9 83.0 103.6 109.4 115.4 124.8 216.7 Radial-10R ####### ####### ####### ####### ####### ####### ####### ####### ####### ####### #######SG01 -1.4 7.8 70.2 163.7 191.0 251.2 344.6 395.9 457.1 541.3 628.3 SG02 -6.3 3.9 52.6 125.3 155.0 214.7 295.3 337.1 388.0 454.4 523.9 SG03 38.5 172.1 267.6 347.8 482.1 600.7 713.0 843.8 965.8 1079.3 1194.2 SG04 -163.7 -20.7 88.0 186.5 310.4 447.8 542.5 649.1 749.7 838.5 924.2 SG05 33.1 44.7 107.3 202.5 236.6 305.3 404.1 466.9 552.1 645.0 736.8 SG06 21.1 39.9 99.9 186.6 235.3 321.1 419.1 479.0 557.0 642.9 729.6 SG07 110.1 222.9 307.2 376.6 504.0 618.9 739.4 872.4 993.8 1114.7 1240.1 SG08 -228.4 -100.3 1.6 88.0 195.7 300.5 358.9 422.6 470.4 516.4 558.2 SG09 3.8 23.5 74.6 149.3 170.5 225.8 291.9 337.1 405.3 468.3 536.2 SG10 10.0 39.4 96.5 175.8 216.8 288.6 364.7 417.6 491.0 562.9 639.6 SG11 -3.0 119.5 221.5 316.3 452.8 574.3 698.7 828.8 946.6 1069.6 1190.5 SG12 -118.2 19.6 131.4 221.7 335.8 440.8 533.4 627.3 697.5 777.0 846.9 SG13 0.0 12.6 45.7 97.8 96.2 132.2 173.4 198.2 235.9 272.3 318.4 SG14 -3.1 2.8 33.7 84.6 106.0 153.6 200.3 227.3 268.2 307.9 353.8 SG15 7.6 134.3 242.4 344.4 493.2 623.9 760.3 902.2 1035.9 1174.1 1310.8 SG16 -126.9 23.0 152.7 269.9 413.6 542.5 662.0 778.8 879.2 988.0 1087.3 SG17 -43.5 18.4 89.2 190.2 0.2 241.0 422.9 476.8 75.1 69.0 141.5 SG18 -1.9 46.7 104.6 177.0 231.4 313.0 390.3 448.5 510.3 573.3 649.5 SG19 -60.7 31.0 108.3 2.3 111.2 391.9 475.0 580.9 675.6 772.9 867.6 SG20 -126.7 -6.7 103.4 208.3 336.6 454.7 564.0 666.7 761.6 854.6 936.4 SG21 1.7 37.6 77.4 134.3 167.4 227.2 286.4 335.3 377.3 414.0 482.3 SG22 -6.8 26.8 72.0 122.4 171.3 246.5 323.1 361.1 418.1 452.3 513.7 SG23 -6.3 123.7 237.6 337.8 479.1 606.6 741.5 878.4 1016.0 1159.6 1289.7 SG24 -124.9 0.3 127.0 250.7 391.2 525.7 648.1 761.7 876.4 988.9 1085.2 SG25-45 203.5 596.5 960.4 1295.9 1693.5 2078.5 2506.4 2909.0 3296.8 3694.1 4090.4 SG25-H 385.7 1038.8 1641.8 2208.7 2953.3 3664.6 4442.2 5206.0 5948.1 6707.2 7477.9 SG25-L 221.6 539.5 836.4 1144.7 1498.8 1872.6 2284.8 2664.2 3046.7 3426.7 3823.5 SG26-45 -524.3 -72.4 361.8 774.8 1126.0 1491.7 1833.7 2157.9 2471.0 2790.4 3094.1
B-29

Table B-18. CP1B, Load Condition C, Run 1 (Continued)
% Load 0 10 20 30 40 50 60 70 80 90 100 Pressure 0.00 0.59 1.17 1.76 2.38 2.95 3.55 4.14 4.71 5.30 5.89
SG26-H -965.6 -242.7 479.1 1186.0 1835.8 2528.2 3121.2 3718.4 4303.9 4903.6 5489.7 SG26-L -239.6 25.0 288.9 554.9 769.3 1016.7 1257.2 1474.4 1691.5 1916.0 2142.8 SG31 61.3 155.2 252.0 365.5 465.9 590.4 735.0 854.2 980.3 1105.0 1242.6 SG32 -55.8 53.9 171.8 304.6 400.7 525.9 659.3 769.3 888.1 1004.7 1133.2 SG33 201.2 477.0 707.9 926.2 1243.3 1543.3 1860.7 2182.4 2494.0 2806.6 3122.5 SG34 -418.3 -168.7 69.4 298.2 505.9 722.0 894.0 1074.5 1246.6 1422.7 1586.5 SG35 66.0 141.3 228.0 342.2 429.1 551.4 696.5 810.4 938.0 1061.2 1202.3 SG36 -38.1 80.5 211.8 363.5 471.9 615.8 771.6 898.0 1035.0 1170.7 1319.3 SG37 186.9 384.6 548.8 700.1 933.3 1148.5 1375.5 1609.2 1833.9 2065.1 2294.2 SG38 -866.5 -411.3 15.1 415.5 773.4 1143.2 1414.1 1712.0 1985.5 2269.1 2519.0 SG39 23.4 56.2 108.7 184.8 216.6 282.7 367.8 422.2 489.3 554.4 632.7 SG40 -7.1 70.6 160.1 268.5 341.7 444.2 559.4 650.3 751.8 851.6 963.5 SG41 123.4 279.3 406.8 524.7 708.0 879.7 1062.5 1250.2 1431.4 1615.2 1798.8 SG42 -339.4 -163.0 1.4 153.8 289.3 428.7 529.2 638.6 739.1 842.2 933.1 SG43-45 -575.1 -147.5 289.2 750.6 1171.8 1644.1 2037.0 2444.4 2851.5 3257.7 3654.6 SG43-H -968.9 -314.7 324.9 958.4 1544.0 2165.1 2675.9 3209.5 3731.9 4250.0 4731.8 SG43-L -257.7 13.0 278.7 561.8 811.1 1098.4 1369.1 1617.7 1873.0 2126.8 2382.5 SG46 -20.8 75.3 167.5 276.9 364.4 480.6 668.1 836.4 866.1 1162.2 1368.1 SG47 5418.7 6543.1 7001.2 6905.4 6664.4 6800.8 763.3 6428.5 6508.9 6613.6 1322.6 SG48 -16.7 64.5 145.5 245.7 327.5 438.9 553.8 655.6 760.3 859.3 980.1 SG49 -410.0 -213.9 -12.3 170.5 321.0 467.3 576.0 691.7 798.9 913.1 1001.7 SG50 ####### ####### ####### ####### ####### ####### ####### ####### ####### ####### #######SG51 -410.8 -201.9 16.7 221.5 387.7 559.7 689.5 824.4 954.4 1087.6 1199.5
Table B-19. CP1B, Load Condition C, Run 2
% Load 0 10 20 30 40 50 60 70 80 90 100 Pressure 0.03 0.58 1.17 1.75 2.35 2.94 3.56 4.14 4.73 5.31 5.92
Hoop-1 -56.7 718.9 1390.5 2102.1 2820.5 3485.1 4191.6 4892.3 5605.9 6282.1 7024.3 Hoop-2 255.3 610.2 1322.3 2137.9 2800.1 3510.8 4200.2 4949.1 5618.9 6309.2 7015.1 Hoop-3 -9.9 685.6 1408.5 2062.7 2820.8 3486.4 4260.0 4889.1 5601.0 6346.6 7010.9 Hoop-4 -39.1 776.5 1408.5 2021.8 2740.4 3502.9 4166.8 4867.4 5601.6 6284.9 6994.1 Hoop-5 -28.5 659.1 1314.3 2098.5 2863.9 3472.2 4249.6 4910.1 5648.9 6323.4 6928.6 Hoop-6 10.9 712.2 1393.7 2093.4 2829.2 3490.9 4202.0 4914.6 5603.3 6284.1 7001.4 Hoop-7 31.4 731.2 1390.0 2050.4 2798.4 3502.5 4211.9 4915.5 5640.7 6279.0 7089.8 Hoop-8 9.9 743.2 1389.3 2107.8 2804.7 3509.2 4177.9 4917.6 5622.9 6326.0 7088.3 Hoop-9 569.7 1335.1 1679.1 2039.2 2799.0 3394.3 4305.6 4754.6 5639.3 6272.6 7025.3 Hoop-10 28.4 782.3 1359.7 2188.2 2856.5 3559.0 4190.7 4940.2 5639.9 6342.8 7020.0 Hoop-11 160.9 718.9 1382.2 2116.2 2754.1 3494.1 4209.1 4911.7 5643.4 6118.4 6680.0 Hoop-12 150.1 640.2 1482.1 2038.3 2721.8 3389.0 4242.9 4916.3 5706.0 6279.7 7230.4 Hoop-13 -52.7 690.0 1403.3 2094.3 2800.1 3476.9 4169.0 4918.2 5559.1 6271.3 6984.6 Hoop-14 9.6 673.8 1397.6 2106.2 2777.8 3516.8 4189.2 4912.1 5599.8 6307.5 7016.4 Long-1 111.3 628.7 1229.9 1775.5 2355.5 2908.3 3765.4 4393.4 4766.7 5640.8 6283.9 Long-2 50.7 934.7 1320.1 1799.8 2175.8 3260.2 3826.7 4382.7 5165.4 5667.6 6048.9 Long-3 -18.4 593.2 1248.5 1763.1 2459.6 3087.0 3689.7 4192.9 4753.6 5446.7 6185.0
B-30

Table B-19. CP1B, Load Condition C, Run 2 (Continued)
% Load 0 10 20 30 40 50 60 70 80 90 100 Pressure 0.03 0.58 1.17 1.75 2.35 2.94 3.56 4.14 4.73 5.31 5.92
Long-4 48.9 815.0 1367.1 1905.9 2468.8 3135.1 3757.8 4226.4 4812.2 5578.5 6079.4 Long-5 2.3 737.6 956.1 1743.7 2424.3 3291.4 3617.7 4591.3 5166.3 5337.5 5990.1 Long-6 260.8 831.5 1550.4 1627.4 2535.3 3237.3 3516.4 4074.6 4839.3 5368.1 6080.3 Long-7 87.7 920.8 1207.2 2041.6 2622.9 3226.8 3781.5 4444.7 4746.7 5634.9 6004.3 Long-8 31.7 736.3 1188.2 2058.8 2584.3 3124.0 3772.4 4235.8 4798.1 5587.0 6296.9 Radial-1R 110.2 105.7 93.4 84.6 81.9 82.8 91.1 99.5 107.2 113.2 123.0 Radial-2R 459.0 409.4 323.6 645.1 665.6 691.4 215.2 453.7 516.0 499.9 591.6 Radial-3R 55.5 45.6 42.6 39.0 37.9 39.1 41.0 47.6 51.3 54.4 67.3 Radial-4R 81.1 516.6 458.4 456.8 347.7 303.0 229.0 134.5 397.5 405.0 397.4 Radial-5R -496.4 -423.9 -463.4 -208.9 -315.6 -452.1 -196.5 -800.6 -373.9 -449.9 -146.3 Radial-6R 46.3 43.2 50.4 55.2 57.0 64.1 74.9 84.9 91.2 99.5 108.7 Radial-7R -7.0 0.6 8.1 9.3 10.7 15.6 28.7 49.0 58.0 67.7 77.7 Radial-8R 399.3 121.2 493.8 618.5 499.2 281.0 258.4 327.5 291.9 492.7 307.5 Radial-9R 96.2 113.6 105.0 94.8 112.8 107.8 359.8 111.9 125.3 118.5 88.9 Radial-10R ####### ####### ####### ####### ####### ####### ####### ####### ####### ####### #######SG01 -49.9 20.9 67.6 142.9 204.7 285.2 337.7 407.6 450.6 538.2 606.5 SG02 3.7 61.0 91.8 148.0 194.2 254.9 293.4 348.5 382.2 449.7 501.9 SG03 5.8 118.8 233.2 341.9 465.4 589.9 731.5 852.9 982.1 1088.4 1212.3 SG04 -57.9 44.8 146.3 236.0 351.2 447.1 544.8 629.0 750.8 829.2 930.2 SG05 -20.2 60.6 107.3 168.8 247.5 349.8 400.2 488.5 544.8 632.3 714.7 SG06 27.0 105.6 146.4 203.1 274.6 365.4 412.1 492.5 546.3 628.5 702.3 SG07 24.4 129.5 245.3 357.7 481.0 610.2 765.0 895.3 1023.5 1136.1 1260.1 SG08 -79.4 -3.8 80.8 165.9 234.2 276.1 341.6 372.1 445.4 499.1 559.9 SG09 -10.2 61.5 89.4 118.6 178.1 262.5 283.3 351.4 401.1 457.5 524.3 SG10 31.3 107.4 141.4 176.2 240.7 328.5 357.2 430.8 487.0 547.4 619.9 SG11 -48.9 63.9 186.3 314.6 441.7 564.1 714.9 835.6 960.7 1078.5 1198.5 SG12 -41.2 50.9 156.3 271.0 362.2 428.8 537.2 593.5 679.5 766.7 842.8 SG13 -12.5 38.5 51.8 69.6 98.7 151.5 159.6 197.1 218.7 258.3 301.1 SG14 16.3 68.4 80.1 98.5 129.3 181.8 191.9 231.5 255.1 295.1 333.4 SG15 -40.0 81.2 209.8 342.7 483.5 620.9 780.1 918.4 1059.1 1187.6 1325.0 SG16 -57.8 55.4 182.8 314.8 437.2 535.8 666.9 756.2 871.1 982.3 1088.0 SG17 -702.9 -646.2 -589.3 -523.0 -452.0 -363.6 -304.9 -234.7 -173.2 -96.0 -16.9 SG18 30.3 108.2 148.8 200.4 255.8 332.8 383.6 438.9 489.0 555.4 622.3 SG19 -106.5 -186.7 79.7 177.1 280.2 374.8 486.5 581.1 687.1 775.8 870.2 SG20 -49.9 48.4 156.9 265.2 373.9 466.3 576.8 662.0 764.1 860.5 950.2 SG21 -42.9 59.3 82.1 116.6 158.6 231.5 272.8 302.3 344.7 407.3 453.6 SG22 -12.6 91.8 114.4 137.8 193.2 252.4 294.0 332.7 378.0 448.7 513.6 SG23 -35.6 69.9 203.8 334.8 476.1 610.1 763.2 909.2 1048.1 1170.2 1311.0 SG24 -31.1 60.6 184.9 305.8 425.7 531.6 653.0 763.9 878.2 982.9 1094.2 SG25-45 7.6 394.5 802.4 1194.7 1622.9 2070.9 2515.6 2919.9 3313.0 3668.2 4075.9 SG25-H 77.2 710.9 1403.5 2104.0 2876.2 3690.1 4529.4 5300.7 6046.5 6740.1 7497.4 SG25-L 18.5 396.9 725.2 1076.1 1467.0 1898.1 2310.5 2706.5 3066.2 3436.4 3821.6 SG26-45 -316.5 33.5 420.5 776.6 1141.3 1466.1 1796.5 2073.4 2423.3 2723.2 3072.6 SG26-H -539.4 48.9 692.1 1336.8 1972.8 2531.5 3141.9 3657.0 4289.7 4884.0 5499.8 SG26-L -154.1 92.5 322.6 552.1 790.3 1025.8 1243.2 1440.4 1666.8 1884.7 2125.1
B-31

Table B-19. CP1B, Load Condition C, Run 2 (Continued)
% Load 0 10 20 30 40 50 60 70 80 90 100 Pressure 0.03 0.58 1.17 1.75 2.35 2.94 3.56 4.14 4.73 5.31 5.92
SG31 -18.6 119.1 216.8 328.0 453.7 603.4 727.4 856.1 965.9 1095.0 1226.4 SG32 -59.0 75.6 176.0 286.6 406.5 540.5 649.8 762.1 870.2 992.5 1115.5 SG33 34.4 324.7 605.0 894.4 1213.0 1550.2 1910.7 2239.6 2548.9 2838.2 3146.7 SG34 -244.0 -62.2 146.0 352.1 547.0 702.4 887.0 1031.4 1229.0 1404.3 1590.9 SG35 -19.9 118.7 200.9 303.9 423.1 574.3 689.1 817.4 919.5 1054.1 1185.8 SG36 -53.9 104.7 217.0 343.6 482.3 640.3 764.6 895.7 1017.5 1159.2 1300.7 SG37 55.8 263.0 467.5 674.7 905.6 1147.9 1413.3 1651.7 1878.1 2084.1 2310.2 SG38 -487.5 -185.6 179.9 534.1 858.7 1096.1 1399.1 1618.5 1951.3 2231.3 2532.2 SG39 -27.7 55.3 96.0 149.6 212.0 299.6 348.6 413.9 460.3 534.8 608.7 SG40 -34.2 82.3 158.0 246.9 346.4 464.8 553.5 652.0 737.9 843.3 948.0 SG41 11.2 172.1 334.2 497.1 680.2 874.4 1087.2 1279.5 1461.9 1628.9 1811.0 SG42 -191.4 -77.5 61.6 195.6 317.7 404.8 517.3 595.3 719.7 823.2 935.1 SG43-45 -324.5 67.8 456.3 874.8 1288.5 1665.0 2077.6 2445.3 2856.2 3278.8 3680.1 SG43-H -611.1 -76.7 496.5 1081.0 1646.7 2128.9 2676.5 3141.6 3697.2 4222.4 4754.0 SG43-L -183.7 84.3 319.2 575.2 837.1 1102.8 1357.6 1584.9 1840.3 2107.5 2368.6 SG46 -44.5 84.8 162.3 257.8 361.7 490.9 639.8 797.4 824.8 992.2 1221.5 SG47 -201.6 -54.0 133.9 311.6 476.9 599.5 746.2 866.2 1023.9 1165.6 1313.2 SG48 -46.7 75.0 143.5 232.4 329.7 448.2 550.5 649.6 742.8 859.0 966.5 SG49 -228.7 -110.2 63.0 215.6 354.0 447.4 561.4 644.7 775.8 880.9 997.6 SG50 ####### ####### ####### ####### ####### ####### ####### ####### ####### ####### #######SG51 -215.6 -73.5 113.3 285.9 446.9 560.1 691.2 796.1 945.7 1077.4 1214.1
Table B-20. CP1B, Load Condition C, Run 3
% Load 0 10 20 30 40 50 60 70 80 90 100 Pressure -0.01 0.64 1.16 1.78 2.36 2.93 3.56 4.14 4.71 5.30 5.91
Hoop-1 -27.3 667.7 1383.1 2059.9 2786.0 3483.6 4211.0 4891.9 5610.8 6280.9 7008.5 Hoop-2 5.7 742.2 1445.3 2113.3 2784.5 3479.5 4225.8 4894.2 5562.1 6322.1 7017.6 Hoop-3 -36.9 723.5 1390.4 2100.5 2828.3 3513.8 4181.7 4885.0 5632.9 6298.5 7008.0 Hoop-4 -33.5 802.6 1350.9 2055.2 2865.2 3492.1 4205.0 4941.3 5612.1 6287.4 6992.9 Hoop-5 -48.5 624.6 1341.6 2174.9 2857.0 3485.3 4265.1 4946.0 5546.5 6294.9 7031.2 Hoop-6 60.5 769.3 1399.2 2108.1 2798.3 3480.2 4193.8 4903.1 5595.4 6279.2 7002.1 Hoop-7 -54.9 774.5 1442.2 2100.7 2789.6 3488.4 4221.8 5006.8 5597.0 6285.0 7000.5 Hoop-8 -4.6 699.5 1396.7 2079.4 2812.2 3516.4 4228.3 4896.3 5563.2 6304.9 6988.1 Hoop-9 458.7 1173.6 1577.1 2091.8 2709.7 3469.6 4095.5 4880.5 5616.1 6316.2 7068.0 Hoop-10 -5.5 801.8 1383.0 2176.4 2860.3 3446.7 4167.1 4922.8 5570.5 6302.4 6912.7 Hoop-11 90.0 784.2 1438.7 2167.8 2776.2 3448.6 4241.4 5033.9 5685.3 6300.8 7353.9 Hoop-12 179.6 422.7 1027.1 1827.0 2856.5 3560.3 4133.7 4835.8 5335.9 6250.9 7018.1 Hoop-13 -104.2 734.0 1469.6 2094.9 2785.7 3454.9 4183.3 4918.7 5660.4 6279.2 7022.7 Hoop-14 -20.2 725.9 1397.7 2099.4 2793.0 3524.2 4218.6 4875.3 5590.6 6300.7 7002.9 Long-1 12.1 690.1 1297.3 1815.9 2534.6 3209.4 3714.2 4341.0 4868.9 5436.4 6129.8 Long-2 79.0 461.0 1323.8 1917.9 2644.5 3302.6 3913.5 4214.9 4790.1 5461.3 5899.8 Long-3 -15.9 504.7 1325.1 1694.1 2343.8 3117.3 3648.0 4339.3 4908.4 5452.6 6151.7 Long-4 107.8 610.6 1093.0 1836.3 2316.7 3008.8 3811.4 4277.7 5010.2 5583.3 6092.1 Long-5 255.3 559.5 1050.1 1976.7 2233.7 3030.1 3877.4 4147.8 4770.2 5474.0 6153.5
B-32

Table B-20. CP1B, Load Condition C, Run 3 (Continued)
% Load 0 10 20 30 40 50 60 70 80 90 100 Pressure -0.01 0.64 1.16 1.78 2.36 2.93 3.56 4.14 4.71 5.30 5.91
Long-6 15.1 417.4 1242.3 1711.9 2397.6 3316.8 3440.0 4546.2 4850.9 5520.9 6279.6 Long-7 168.8 449.4 1357.8 2025.1 2446.9 2970.2 3680.7 4119.6 5033.9 5393.7 6139.8 Long-8 44.8 545.4 1352.0 1926.2 2238.6 3229.6 3761.3 4210.5 4972.0 5734.1 5916.7 Radial-1R 103.5 104.6 90.3 93.5 100.3 109.7 120.5 129.2 140.1 137.6 147.7 Radial-2R 273.2 744.2 674.3 468.4 578.0 956.1 605.5 751.3 638.2 200.3 674.9 Radial-3R 51.1 45.6 39.5 40.4 41.7 46.8 55.8 60.9 74.1 79.1 95.5 Radial-4R 480.5 407.7 397.4 452.0 511.8 42.2 151.8 455.2 485.4 514.1 502.2 Radial-5R -89.7 -286.5 -441.9 -331.8 -335.0 -450.5 -343.1 -278.5 -384.2 -271.5 -221.8 Radial-6R 41.5 44.8 50.1 60.2 70.9 83.4 95.7 101.1 111.4 116.9 125.6 Radial-7R -10.9 -4.2 -0.6 13.3 23.1 41.1 61.6 71.9 93.0 101.6 121.8 Radial-8R 223.2 242.6 418.2 395.6 355.5 311.3 378.3 362.1 177.8 213.0 445.3 Radial-9R 59.4 71.1 236.3 75.0 106.9 114.2 103.6 132.4 143.5 147.4 145.8 Radial-10R ####### ####### ####### ####### ####### ####### ####### ####### ####### ####### #######SG01 -54.2 -50.9 73.2 141.5 189.0 300.4 347.2 404.6 483.8 544.6 602.0 SG02 -3.9 -5.2 89.6 137.8 169.4 257.9 293.0 339.2 402.8 449.6 492.8 SG03 -23.2 144.8 226.1 366.5 517.1 622.7 765.9 884.3 994.0 1109.3 1234.2 SG04 -60.6 76.7 134.7 224.4 323.5 382.1 486.4 600.8 677.4 793.6 907.0 SG05 -30.0 -21.9 104.6 187.3 243.6 365.1 418.5 489.0 575.6 643.9 720.3 SG06 14.0 23.2 136.6 208.8 259.4 371.9 423.4 491.1 572.9 634.9 704.8 SG07 -19.6 146.0 233.9 387.0 553.8 677.9 831.4 951.7 1066.5 1177.8 1296.8 SG08 -62.3 40.9 82.7 130.3 181.2 193.6 250.4 312.1 357.0 441.4 507.4 SG09 -14.8 -8.0 80.8 134.9 167.8 254.1 293.4 350.5 410.4 462.7 527.4 SG10 20.7 33.8 124.7 185.7 226.2 319.1 366.3 430.3 495.9 553.1 623.3 SG11 -72.2 83.2 184.3 329.6 483.5 600.8 740.9 859.8 973.9 1093.6 1213.1 SG12 -41.8 86.6 158.0 248.1 344.2 397.2 481.4 558.2 634.2 727.0 811.0 SG13 -16.0 -19.6 47.8 76.6 85.6 144.8 161.1 184.7 225.9 252.4 286.7 SG14 12.1 3.2 68.9 97.9 108.6 169.8 191.0 218.1 260.2 287.4 319.9 SG15 -67.3 95.5 204.7 362.4 528.0 659.5 816.2 953.5 1081.7 1214.9 1351.6 SG16 -58.6 91.1 181.0 302.0 426.7 510.9 625.8 733.4 836.8 956.6 1069.5 SG17 -875.3 -878.3 -828.1 -783.0 -753.2 -674.0 -640.9 -605.6 -555.5 -511.7 -454.4 SG18 24.0 55.3 140.6 203.7 253.3 334.5 383.9 427.7 492.0 545.2 607.2 SG19 -123.7 -3.4 76.8 179.9 294.5 383.4 492.3 589.7 687.0 606.8 887.4 SG20 -46.8 80.7 157.4 257.3 361.4 437.3 538.6 639.0 730.0 836.0 932.3 SG21 -28.4 -2.9 70.1 123.3 169.3 240.1 281.8 304.2 360.8 398.6 444.6 SG22 5.6 39.2 107.1 156.0 199.1 272.1 322.5 349.5 410.8 445.1 485.2 SG23 -75.8 89.3 201.1 354.1 512.6 642.0 792.8 937.6 1061.2 1196.0 1332.4 SG24 -42.5 92.9 190.9 296.8 407.6 495.1 607.0 725.8 824.4 951.4 1063.7 SG25-45 -92.4 371.5 774.9 1292.0 1803.1 2234.8 2651.1 3033.4 3389.8 3760.5 4168.4 SG25-H -108.8 688.3 1353.1 2264.4 3190.1 3986.8 4805.8 5533.1 6230.2 6925.3 7674.0 SG25-L -85.0 316.2 703.1 1159.3 1600.9 2037.5 2441.3 2797.1 3171.2 3517.9 3878.1 SG26-45 -283.2 95.9 430.7 769.4 1111.1 1377.8 1662.9 1994.6 2268.7 2646.2 3029.1 SG26-H -462.8 169.3 731.4 1273.8 1835.3 2312.1 2896.1 3511.1 4055.6 4740.8 5388.9 SG26-L -141.4 83.5 329.3 555.6 773.1 989.2 1185.7 1402.9 1610.4 1855.7 2104.9 SG31 -54.4 59.9 210.2 355.8 488.4 644.4 762.3 870.9 999.2 1112.6 1230.5 SG32 -67.1 29.5 174.8 294.9 404.9 541.1 643.0 749.2 867.0 983.8 1103.0
B-33

Table B-20. CP1B, Load Condition C, Run 3 (Continued)
% Load 0 10 20 30 40 50 60 70 80 90 100 Pressure -0.01 0.64 1.16 1.78 2.36 2.93 3.56 4.14 4.71 5.30 5.91
SG33 -60.9 313.8 579.7 957.6 1342.3 1675.7 2037.7 2343.4 2640.8 2923.5 3217.7 SG34 -208.2 -1.9 157.1 311.7 473.7 596.3 769.8 959.7 1119.3 1337.8 1536.9 SG35 -54.7 39.1 195.8 331.7 449.0 612.4 721.9 825.1 958.4 1068.2 1180.9 SG36 -64.8 44.6 216.7 359.1 486.0 649.4 765.9 887.5 1024.3 1155.3 1290.0 SG37 -17.5 258.7 447.4 725.8 1010.6 1250.7 1514.8 1739.4 1953.6 2156.3 2372.4 SG38 -401.8 -44.3 203.5 442.1 696.9 865.0 1146.9 1465.4 1714.2 2088.7 2419.9 SG39 -44.5 -12.3 94.9 166.1 219.5 315.9 357.5 405.7 476.9 534.3 595.6 SG40 -45.7 26.8 156.1 260.6 351.9 477.4 562.0 648.5 751.3 844.4 940.8 SG41 -48.2 171.6 316.5 538.0 766.0 956.2 1169.4 1348.7 1520.6 1684.7 1857.7 SG42 -159.4 -22.3 69.6 157.7 252.0 310.5 413.8 531.9 622.4 763.1 887.3 SG43-45 -292.1 102.2 476.4 821.5 1181.4 1533.6 1946.8 2361.3 2756.4 3205.0 3612.0 SG43-H -560.9 27.6 519.0 990.2 1475.4 1900.3 2435.1 2986.5 3481.9 4089.8 4633.7 SG43-L -188.2 60.1 323.2 562.7 803.3 1050.2 1297.6 1543.6 1793.9 2064.9 2328.6 SG46 -56.3 32.1 159.5 268.3 371.9 501.7 603.0 766.7 845.9 941.4 1317.6 SG47 -166.2 9.3 145.5 271.2 397.0 493.3 633.9 794.1 922.2 1101.4 1261.5 SG48 -59.4 21.3 138.4 237.4 332.1 457.1 555.7 644.2 756.4 853.8 952.1 SG49 -190.2 -38.4 76.6 178.7 282.2 338.1 437.1 567.2 655.4 809.0 948.2 SG50 ####### ####### ####### ####### ####### ####### ####### ####### ####### ####### #######SG51 -160.7 -3.1 137.4 253.6 372.4 449.7 568.0 718.1 830.1 1010.9 1173.7
Table B-21. CP2, Load Condition A, Run 1
% Load 0 10 20 30 40 50 60 70 80 90 100 Pressure -0.04 0.72 1.29 2.02 2.70 3.36 4.05 4.70 5.43 6.09 6.76
Hoop-1 -17.4 776.5 1598.1 2395.8 3143.7 3969.2 4839.8 5634.3 6443.6 7216.9 8021.9 Hoop-2 4.2 817.9 1580.7 2390.9 3191.9 3991.9 4810.4 5615.8 6384.4 7213.3 8002.4 Hoop-3 31.7 811.8 1599.3 2402.9 3184.6 4004.8 4798.9 5583.2 6419.9 7215.7 7988.7 Hoop-4 248.4 785.3 1562.1 2385.2 3196.8 4010.9 4792.6 5597.6 6412.1 7184.3 8005.6 Hoop-5 -19.4 822.8 1596.0 2412.8 3182.0 3977.3 4802.7 5603.6 6408.3 7209.9 7992.1 Hoop-6 -60.4 802.5 1592.0 2381.5 3194.6 3991.8 4790.0 5598.3 6401.3 7179.2 8009.0 Hoop-7 137.7 794.3 1584.2 2401.0 3203.0 4021.9 4787.8 5594.3 6390.1 7197.2 7996.0 Hoop-8 83.2 787.7 1412.0 2399.8 2958.7 3946.7 4883.0 5667.2 6429.7 7294.5 7961.0 Hoop-9 -76.0 680.6 1616.2 2308.3 3224.1 3894.9 4835.6 5653.1 6370.1 7188.2 7995.2 Hoop-10 31.0 778.0 1665.6 2316.5 3138.0 4058.2 4863.5 5598.0 6327.0 7240.4 8014.3 Hoop-11 -34.3 811.1 1545.4 2512.7 3170.5 4056.2 4732.0 5497.3 6580.7 6954.0 7896.0 Hoop-12 -14.4 722.8 1657.0 2092.1 3142.2 3957.1 4629.3 5617.1 6516.3 7062.5 8092.9 Hoop-13 52.8 678.1 1545.8 2450.7 3002.1 3988.1 4664.3 5466.0 6348.6 7202.5 8076.2 Hoop-14 -16.4 819.7 1595.7 2402.0 3237.7 4044.1 4812.5 5663.3 6372.3 7216.4 7998.6 Long-1 21.2 88.5 88.5 -66.2 85.0 -61.5 86.2 100.3 -17.8 79.1 3.5 Long-2 77.5 -46.4 62.1 116.3 -99.4 -15.7 38.5 29.1 -28.7 29.1 58.6 Long-3 74.4 45.3 44.0 84.1 161.8 279.6 330.6 409.4 525.9 557.6 699.5 Long-4 88.1 109.7 85.7 143.4 165.1 181.9 222.8 267.3 327.5 356.4 434.5 Long-5 -62.4 -118.2 -26.7 -108.7 -56.4 150.4 -82.6 0.6 -65.9 156.3 -63.5 Long-6 234.4 98.3 -89.6 -102.9 -143.8 -136.6 -37.8 89.8 39.3 -1.7 222.3 Long-7 134.6 -13.5 -85.2 138.1 21.1 -89.9 -74.4 -91.1 40.2 11.6 22.3
B-34

Table B-21. CP2, Load Condition A, Run 1 (Continued)
% Load 0 10 20 30 40 50 60 70 80 90 100 Pressure -0.04 0.72 1.29 2.02 2.70 3.36 4.05 4.70 5.43 6.09 6.76
Long-8 -1.5 89.9 14.0 -48.9 12.8 -65.6 16.3 -19.3 2.1 -26.4 -22.8 Radial-1R 134.2 159.4 140.4 155.0 151.1 142.0 135.4 135.3 141.6 145.0 156.4 Radial-2R 534.2 386.4 470.5 590.8 504.3 555.9 1363.7 1322.7 1307.2 539.1 -313.2 Radial-3R 17.3 16.6 8.5 10.8 5.5 -1.6 -4.8 -2.0 -0.1 1.1 2.4 Radial-4R -13.4 -12.9 -13.0 -12.2 -10.6 -12.5 -13.6 -14.0 -13.4 -13.7 -13.8 Radial-5R 6033.2 4726.5 5057.5 5189.0 3985.7 4403.4 4842.9 4709.1 5653.3 4569.0 3545.6 Radial-6R -6.4 0.6 -2.6 16.0 1.4 -0.6 -0.5 7.1 20.2 29.5 44.5 Radial-7R 1.0 13.1 1.3 13.2 1.6 -2.6 -4.2 -2.3 -0.6 -1.8 0.5 Radial-8R 79.3 101.9 78.1 89.9 80.1 66.1 56.5 53.1 51.5 54.2 55.8 Radial-9R ####### ####### ####### ####### ####### ####### ####### ####### ####### ####### #######Radial-10R -1762.1 -1481.4 -1368.7 -1334.2 -1316.8 -1327.8 -1526.5 -1718.9 -1805.3 -1781.7 -1837.6 SG01 107.7 12.8 -126.6 -204.9 -326.4 -428.1 -524.1 -613.7 -710.6 -817.0 -909.3 SG02 84.7 -10.0 -132.0 -207.8 -313.6 -407.8 -493.6 -576.4 -666.7 -760.9 -847.3 SG03 -101.8 168.7 369.4 592.5 793.6 985.8 1183.8 1381.4 1598.2 1803.3 2008.7 SG04 56.2 189.3 429.6 584.9 795.3 997.1 1197.0 1378.1 1562.9 1749.2 1923.2 SG05 125.2 2.5 -162.7 -267.6 -409.4 -533.0 -656.4 -762.7 -886.2 -1004.3 -1119.9 SG06 86.7 -1.5 -116.6 -188.4 -286.0 -371.9 -456.7 -529.6 -3227.3 -1878.0 -1056.6 SG07 -250.3 95.3 274.5 537.6 735.8 928.9 1133.0 1342.3 1577.1 1792.9 2018.5 SG08 248.6 309.3 145.4 242.0 649.0 -1018.7 1048.9 857.3 -15687.3 -16955.6 -18842.0SG09 166.2 40.3 -97.4 -197.9 -316.0 -419.0 -532.8 -624.5 -744.8 -844.7 -950.7 SG10 135.2 29.3 -78.2 -158.1 -251.9 -333.8 -423.8 -496.9 -589.4 -668.8 -754.4 SG11 -136.5 157.1 356.0 587.3 786.0 974.1 1177.8 1373.9 1594.9 1793.1 2003.4 SG12 99.0 241.5 461.0 619.1 814.6 997.5 1192.3 1360.3 1543.9 1707.9 1882.0 SG13 108.6 -15.2 -168.0 -280.4 -410.7 -526.4 -646.2 -753.0 -881.4 -990.9 -1112.9 SG14 269.5 178.7 69.8 -8.2 -99.8 -180.8 -263.7 -337.3 -428.2 -504.7 -590.4 SG15 -147.9 152.0 361.3 607.4 816.3 1017.0 1227.7 1436.9 1671.6 1883.8 2108.6 SG16 260.0 435.2 698.0 892.9 1125.3 1345.1 1573.6 1777.0 1997.3 2206.1 2415.0 SG17 50.2 2.7 -121.5 -188.9 -286.4 -373.1 -454.3 -527.4 -613.5 -682.8 -767.2 SG18 196.7 124.9 3.7 -75.6 -176.6 -271.5 -362.9 -454.9 -553.4 -636.4 -730.1 SG19 -218.2 24.7 210.1 411.9 589.8 757.9 931.6 1105.3 1289.4 1459.0 1643.9 SG20 199.8 350.6 611.1 803.4 1032.8 1256.7 1484.7 1691.8 1910.9 2112.2 2321.5 SG21 2.3 -115.5 -266.3 -364.3 -485.3 -602.9 -714.1 -826.4 -946.7 -1060.0 -1165.5 SG22 -69.5 -157.7 -274.3 -347.0 -440.2 -528.9 -612.7 -697.4 -788.4 -872.6 -953.2 SG23 -13.5 278.3 487.7 723.2 931.5 1134.6 1343.6 1555.6 1786.8 2000.1 2216.5 SG24 208.7 354.1 615.7 792.7 1008.7 1230.6 1451.9 1657.5 1873.9 2078.3 2271.7 SG25 -14.8 21.3 -197.7 -234.7 -375.9 -501.7 -601.5 -686.9 -788.9 -867.0 -963.5 SG26 -41.2 42.0 -124.8 -119.1 -216.5 -298.2 -356.8 -402.5 -457.9 -498.4 -551.3 SG27 88.5 -87.8 -288.2 -453.8 -630.5 -799.4 -962.0 -1124.7 -1314.7 -1478.0 -1658.5 SG28 112.6 -52.9 -244.1 -398.9 -566.7 -725.3 -877.6 -1030.5 -1201.6 -1354.5 -1524.4 SG29 -564.6 130.3 383.6 884.3 1207.9 1528.2 1875.8 2250.4 2672.3 3060.6 3467.0 SG30 -603.0 141.7 431.5 975.1 1335.7 1691.0 2075.6 2487.1 2951.3 3381.8 3828.0 SG31 302.2 425.0 748.8 925.8 1187.3 1440.4 1689.2 1912.4 2145.5 2370.7 2593.5 SG32 292.0 423.0 752.6 933.8 1199.7 1457.3 1709.1 1937.2 2175.2 2403.3 2629.6 SG33 122.1 -51.9 -221.9 -364.9 -513.9 -654.8 -785.0 -918.3 -1073.3 -1198.7 -1341.4 SG34 15647.7 16381.1 17202.6 17442.9 17443.9 17295.4 17293.1 17415.7 18053.1 19030.8 19552.3
B-35

Table B-21. CP2, Load Condition A, Run 1 (Continued)
% Load 0 10 20 30 40 50 60 70 80 90 100 Pressure -0.04 0.72 1.29 2.02 2.70 3.36 4.05 4.70 5.43 6.09 6.76
SG35 -219.3 84.3 101.0 309.2 394.2 485.4 603.3 733.0 880.7 1024.8 1159.6 SG36 -261.7 79.8 87.6 321.8 413.0 511.8 643.3 786.6 952.9 1118.0 1270.6 SG37 437.9 317.4 343.3 342.4 393.5 434.5 489.1 530.6 572.0 639.5 708.0 SG38 213.2 164.5 210.3 220.3 258.7 299.0 349.3 380.6 413.8 454.9 479.9 SG39 -93.4 213.3 417.3 648.8 848.6 1038.5 1244.4 1438.5 1659.1 1856.0 2071.1 SG40 143.1 308.1 556.8 727.5 943.5 1140.9 1355.4 1533.3 1731.0 1903.1 2086.6 SG41 -155.6 130.7 306.6 526.1 696.8 855.7 1033.9 1200.8 1405.7 1582.7 1768.4 SG42 16.4 181.6 385.8 553.8 737.8 902.7 1083.5 1233.7 1415.6 1568.2 1727.7 SG43 197.6 81.5 24.4 -45.7 -100.0 -149.9 -213.3 -263.8 -335.0 -390.5 -451.0 SG45 211.5 87.1 52.5 -4.6 -40.1 -75.1 -122.6 -157.5 -205.8 -240.8 -279.7
Table B-22. CP2, Load Condition B, Run 1
% Load 0 10 20 30 40 50 60 70 80 90 100 Pressure 0.0 0.0 0.0 0.0 0.0 0.0 0.0 0.0 0.0 0.0 0.0
Hoop-1 -13.8 15.6 4.6 121.9 -30.3 6.4 -17.4 -28.4 -4.6 -4.6 77.9 Hoop-2 -18.6 0.7 -11.6 -11.6 11.3 -18.6 32.4 0.7 21.8 -1.0 -4.5 Hoop-3 11.8 -6.2 6.4 37.1 1.0 8.2 6.4 -8.0 -8.0 -8.0 4.6 Hoop-4 21.8 1.4 114.7 265.2 31.1 14.4 18.1 -22.8 -2.4 -26.5 -0.5 Hoop-5 6.1 18.8 -8.5 31.5 24.2 49.7 15.1 -12.1 24.2 -15.8 -19.4 Hoop-6 -5.3 0.2 -144.8 25.9 -31.0 5.7 -3.5 14.9 18.5 9.4 16.7 Hoop-7 -6.2 -4.4 17.2 13.6 33.4 4.6 -51.1 -4.4 -22.3 40.6 -8.0 Hoop-8 17.8 -105.6 -120.1 -3.9 -83.8 134.0 90.5 126.7 97.7 97.7 -105.6 Hoop-9 -131.6 24.3 26.1 106.8 -9.7 -40.2 62.0 -70.7 11.8 -140.6 13.6 Hoop-10 -111.6 -17.1 47.0 -76.0 75.5 -4.7 -59.9 14.9 20.3 -63.5 -68.8 Hoop-11 92.9 -27.0 -45.2 -28.8 -77.9 -141.5 -159.7 -14.3 2.1 -134.3 0.2 Hoop-12 105.4 184.5 -263.1 203.0 83.2 70.3 61.1 -152.6 53.8 134.8 114.6 Hoop-13 38.1 -28.1 60.1 52.8 -64.9 -35.5 -6.0 -42.8 -20.8 -28.1 -28.1 Hoop-14 6.0 -38.7 132.9 95.6 20.9 88.1 -8.9 50.8 -1.4 -23.8 6.0 Long-1 96.8 595.4 1329.2 2086.4 2855.3 3442.8 4133.5 4908.5 5640.9 6232.2 6939.3 Long-2 -45.2 827.4 1578.5 1995.7 2705.1 3533.1 4266.0 4757.6 5600.4 6451.0 6911.4 Long-3 -67.6 557.6 1302.9 2046.9 2747.0 3492.6 4210.8 4952.4 5634.4 6291.7 7008.5 Long-4 58.0 800.4 1262.4 2141.8 2749.1 3467.6 4157.8 4794.1 5631.3 6243.1 7057.0 Long-5 -169.3 632.8 1407.6 2169.0 2705.8 3518.8 4295.5 4920.4 5686.6 6242.1 6946.0 Long-6 59.7 692.1 1471.5 2260.3 2625.0 3522.6 4343.6 4812.1 5587.6 6349.4 6989.6 Long-7 -167.6 747.1 1254.6 2058.0 2903.0 3469.2 4255.6 4875.2 5591.5 6283.3 7017.0 Long-8 61.4 752.0 1414.2 2118.8 2805.5 3466.6 4112.9 5027.6 5626.6 6349.7 6864.1 Radial-1R 120.0 120.9 137.6 130.4 142.3 147.8 162.9 163.9 182.9 180.1 199.6 Radial-2R 470.8 1102.3 1383.3 1186.8 646.5 1101.3 332.8 627.0 569.8 -49.1 -195.2 Radial-3R 34.7 30.5 21.7 13.6 12.8 14.4 17.9 18.4 26.3 23.6 35.8 Radial-4R -12.2 -11.8 -12.6 -14.0 -12.3 -10.7 -10.9 -10.3 -11.8 -11.8 2.9 Radial-5R 4287.1 4845.6 5192.8 5820.9 5039.2 3848.1 3923.3 4408.5 4594.6 4063.7 2213.5 Radial-6R -4.3 0.6 -2.2 -8.3 -0.5 -3.3 1.0 -0.3 13.0 4.1 21.3 Radial-7R 18.6 22.1 28.5 30.3 29.9 35.6 45.3 47.5 63.3 66.5 83.0 Radial-8R 115.2 131.0 153.7 137.1 141.9 156.4 172.9 171.8 190.4 186.9 207.9
B-36

Table B-22. CP2, Load Condition B, Run 1 (Continued) % Load 0 10 20 30 40 50 60 70 80 90 100 Pressure 0.0 0.0 0.0 0.0 0.0 0.0 0.0 0.0 0.0 0.0 0.0
Radial-9R ####### ####### ####### ####### ####### ####### ####### ####### ####### ####### #######Radial-10R -1723.2 -1612.5 -1541.3 -1764.3 -2299.7 -1989.1 -1945.8 -1803.0 -1591.2 -1690.6 -1684.5 SG01 92.8 265.4 435.8 621.2 797.3 991.8 1187.9 1362.8 1557.5 1753.6 1922.8 SG02 68.1 228.0 381.6 552.6 714.7 891.4 1073.1 1236.7 1413.6 1596.4 1753.4 SG03 -105.2 -161.6 -196.7 -279.1 -350.7 -432.0 -511.7 -594.1 -653.5 -767.3 -820.9 SG04 53.2 -47.4 -172.6 -246.2 -355.3 -455.6 -566.0 -647.7 -756.6 -855.5 -960.1 SG05 103.2 297.7 490.1 678.2 853.2 1069.5 1289.4 1462.2 1715.4 1921.1 2117.2 SG06 15.1 180.7 348.6 518.2 689.4 882.5 1074.5 1217.3 1390.6 1572.7 1737.0 SG07 -235.4 -268.0 -266.8 -338.7 -388.3 -462.0 -518.6 -596.8 -656.0 -771.1 -794.8 SG08 40.8 -6656.9 -6881.4 -6953.9 -6851.6 -7261.3 -7888.5 -8359.3 -7738.3 -8682.8 -8799.2 SG09 127.9 299.5 470.5 630.9 771.3 969.6 1166.7 1323.5 1516.5 1701.1 1882.9 SG10 107.0 258.8 404.1 550.6 675.9 853.8 1032.0 1174.1 1343.7 1510.9 1667.5 SG11 -120.1 -167.7 -206.8 -260.4 -314.6 -393.5 -460.5 -536.1 -587.6 -690.4 -734.2 SG12 102.3 -3.3 -124.0 -194.8 -282.9 -379.8 -499.9 -569.8 -671.7 -765.6 -869.7 SG13 73.5 250.0 416.7 572.4 736.1 943.2 1138.9 1307.9 1497.5 1689.3 1871.5 SG14 241.3 400.8 551.2 699.9 845.8 1037.7 1217.8 1371.1 1545.5 1718.3 1881.3 SG15 -128.8 -187.9 -232.0 -295.9 -367.0 -459.7 -535.8 -622.8 -681.2 -796.2 -850.2 SG16 268.2 146.9 17.2 -52.0 -164.7 -277.4 -407.1 -501.1 -617.0 -734.0 -858.7 SG17 39.4 222.5 381.9 529.6 704.6 918.0 1112.1 1275.7 1469.9 1645.4 1826.5 SG18 185.5 331.3 459.3 586.4 733.0 911.9 1077.6 1216.8 1381.8 1533.4 1689.9 SG19 -221.2 -279.5 -315.4 -368.4 -443.1 -525.4 -596.2 -665.0 -720.6 -808.6 -860.3 SG20 192.3 105.4 25.0 -14.8 -112.8 -190.9 -280.2 -340.8 -428.2 -505.1 -602.0 SG21 -8.3 174.3 317.5 486.9 658.0 889.1 1089.2 1256.4 1452.4 1637.8 1825.3 SG22 -82.9 79.2 211.9 365.9 520.7 728.4 911.6 1064.7 1242.4 1409.9 1580.5 SG23 -11.5 -75.9 -112.4 -180.6 -251.2 -349.6 -428.5 -507.7 -564.5 -672.0 -728.4 SG24 217.8 102.8 -3.7 -92.0 -225.1 -367.4 -502.5 -599.4 -726.2 -840.2 -973.1 SG25 -37.6 348.4 719.5 1015.0 1374.9 1801.2 2193.6 2516.4 2932.5 3267.9 3660.4 SG26 -56.9 282.5 613.1 869.3 1183.4 1554.4 1896.4 2173.2 2541.9 2826.3 3172.8 SG27 62.2 247.6 419.3 582.8 768.8 999.0 1210.0 1393.5 1604.9 1811.3 2006.4 SG28 88.5 277.3 451.0 619.4 807.3 1040.5 1254.7 1440.1 1654.2 1861.4 2059.3 SG29 -536.3 -447.7 -288.2 -310.6 -264.5 -245.9 -188.3 -222.1 -74.0 -157.7 -44.5 SG30 -571.3 -498.2 -349.8 -387.0 -356.7 -357.3 -316.0 -367.5 -314.8 -433.8 -337.0 SG31 302.4 138.4 -58.4 -138.5 -300.9 -456.8 -632.7 -741.3 -923.8 -1050.3 -1228.3 SG32 293.5 125.9 -73.3 -155.3 -320.7 -479.4 -658.0 -769.0 -973.9 -1106.7 -1286.6 SG33 101.5 284.4 457.5 638.6 830.0 1074.2 1296.2 1495.9 1699.6 1919.4 2126.0 SG34 15998.7 15575.0 15205.4 15249.5 15066.9 15197.9 15525.5 15701.4 15602.8 15337.1 15195.6SG35 -227.2 -21.5 208.9 318.2 478.5 643.2 834.5 940.5 1152.7 1237.0 1433.4 SG36 -273.0 -27.2 249.4 380.2 573.8 773.1 1003.5 1131.9 1387.3 1491.5 1727.9 SG37 882.1 1280.3 1508.9 1368.0 1606.2 1662.1 1565.7 1820.2 1646.6 2283.1 1933.4 SG38 194.3 229.3 237.7 294.1 314.5 360.7 403.1 449.0 479.7 526.4 543.0 SG39 -73.2 -129.2 -186.1 -250.4 -303.5 -397.0 -479.9 -553.3 -625.3 -731.3 -795.0 SG40 156.0 30.8 -135.7 -236.5 -328.7 -451.6 -608.9 -678.2 -814.5 -916.5 -1061.4 SG41 -128.8 -183.4 -239.0 -309.8 -348.6 -450.3 -528.2 -598.4 -668.0 -768.0 -820.3 SG42 52.6 -57.5 -212.3 -318.7 -388.1 -508.2 -652.5 -714.8 -827.9 -936.4 -1053.2 SG43 130.1 242.8 362.3 483.8 553.6 688.3 817.1 928.6 1050.4 1187.9 1317.0 SG45 145.1 233.2 331.0 431.2 455.8 539.6 629.6 708.0 787.3 888.9 969.5
B-37

Table B-23. CP2, Load Condition C, Run 1
% Load 0 10 20 30 40 50 60 70 80 90 100 Pressure -0.05 0.71 1.33 2.02 2.67 3.37 4.06 4.74 5.45 6.09 6.75
Hoop-1 4.6 791.2 1533.6 2389.8 3187.7 3943.9 4877.8 5583.1 6417.9 7172.5 8055.9 Hoop-2 -62.5 849.5 1562.8 2355.3 3191.9 3999.3 4818.7 5568.4 6366.7 7172.5 7955.9 Hoop-3 -17.0 795.6 1534.1 2397.0 3197.2 4005.2 4780.4 5608.6 6389.2 7195.5 8025.8 Hoop-4 -0.5 790.9 1604.5 2410.7 3198.6 4033.6 4805.2 5579.2 6417.6 7191.5 7962.1 Hoop-5 2.4 768.2 1612.0 2439.6 3200.2 4014.1 4791.3 5594.7 6448.2 7149.6 8038.6 Hoop-6 5.7 729.0 1433.9 2425.1 3214.8 4001.3 4796.8 5594.8 6408.6 7197.2 7977.0 Hoop-7 -15.2 853.7 1636.0 2386.1 3197.6 4016.9 4807.1 5608.8 6400.8 7216.7 8002.4 Hoop-8 -62.0 881.9 1506.3 2420.9 3154.1 4025.3 4723.7 5674.5 6356.4 7155.1 8027.2 Hoop-9 74.5 721.7 1542.5 2474.3 3132.1 3952.9 4725.0 5572.4 6416.1 7163.5 7976.2 Hoop-10 38.1 872.4 1571.0 2476.2 3091.1 4055.2 4732.1 5665.7 6447.6 7155.2 8036.5 Hoop-11 20.2 792.8 1605.2 2430.2 3082.6 4049.5 4765.2 5980.8 6358.3 7163.5 8067.6 Hoop-12 -71.5 822.2 1271.7 2157.8 3242.9 3908.0 4954.2 5359.1 6213.5 6913.7 7776.8 Hoop-13 8.7 883.9 1891.3 2428.0 3133.9 3986.9 4731.0 5635.2 6502.4 7201.1 8003.5 Hoop-14 -38.7 789.7 1573.2 2408.8 3274.4 4013.1 4790.6 5603.6 6438.9 7185.1 8006.8 Long-1 135.8 544.6 1526.2 2204.4 2815.7 3609.7 4150.1 4848.3 5668.8 6389.4 7115.3 Long-2 -79.4 780.1 1211.5 2036.7 2800.0 3656.1 4434.7 5152.5 5515.0 6320.2 6977.4 Long-3 4.0 636.4 1587.9 2277.3 2818.0 3469.9 3999.6 4918.4 5598.8 6263.9 7036.4 Long-4 30.3 759.4 1383.7 2038.1 2719.5 3576.2 4317.8 4812.2 5610.4 6300.9 7048.5 Long-5 -234.6 454.5 1197.0 2254.4 2570.9 3399.1 4363.3 5060.6 5797.8 6246.9 6955.5 Long-6 87.4 723.4 1368.9 2137.2 2583.4 3365.1 4091.9 4974.7 5619.7 6164.0 6930.6 Long-7 127.4 686.1 1328.4 2185.5 2804.5 3679.7 4203.2 5006.6 5532.5 6451.7 6947.7 Long-8 25.8 741.3 1342.7 2022.5 2848.8 3624.8 4215.0 4765.4 5607.1 6470.8 6735.9 Radial-1R 127.3 151.2 152.8 151.9 142.4 143.0 149.6 158.7 174.3 185.3 195.6 Radial-2R 3528.3 4244.7 4564.3 3991.3 3787.7 3569.9 3719.9 4200.7 3893.1 3822.6 3487.7 Radial-3R 7.0 11.0 4.4 2.1 -0.9 -1.3 -0.7 1.6 6.2 9.1 12.4 Radial-4R -8.7 -7.5 -7.1 -7.6 -8.6 -8.7 -7.9 -6.5 -5.6 -5.5 -5.9 Radial-5R 9172.8 9441.1 7956.7 7818.7 8397.4 6125.6 6386.9 7030.9 8362.0 7595.8 8158.0 Radial-6R -5.1 1.4 6.0 8.4 6.0 9.5 18.4 26.9 41.8 54.4 62.6 Radial-7R -1.2 7.1 5.5 3.6 1.0 1.6 5.4 8.9 18.3 26.4 28.6 Radial-8R 59.6 80.5 81.2 80.2 75.4 75.1 79.6 85.7 103.5 116.2 118.8 Radial-9R ####### ####### ####### ####### ####### ####### ####### ####### ####### ####### #######Radial-10R -3168.7 -3098.0 -3056.6 -3060.6 -3049.8 -3002.3 -3024.8 -3054.8 -3091.2 -3102.0 -3156.4 SG01 110.3 191.1 242.5 334.0 392.1 496.4 569.9 659.6 741.3 849.1 902.5 SG02 92.7 157.5 207.7 292.8 349.9 446.7 515.0 597.6 672.5 772.0 821.4 SG03 -133.4 68.8 210.6 330.5 450.7 566.7 699.8 829.1 967.2 1075.0 1209.9 SG04 72.6 137.0 257.7 364.2 480.5 581.5 689.5 792.1 885.4 958.4 1081.5 SG05 117.7 190.5 232.5 319.4 356.5 460.2 534.0 627.2 707.6 803.6 855.9 SG06 76.1 155.7 210.3 302.6 352.1 456.6 535.5 630.0 711.9 806.7 867.8 SG07 -289.0 -13.0 144.0 276.6 406.9 535.1 685.5 829.7 989.9 1120.0 1262.9 SG08 386.8 374.9 454.8 517.8 616.5 678.3 738.9 793.8 839.4 884.0 957.5 SG09 132.2 207.5 247.6 330.7 357.4 454.3 525.8 612.8 680.9 753.2 811.2 SG10 110.0 176.7 224.8 311.3 347.3 444.7 518.2 604.5 672.9 747.8 808.6 SG11 -138.4 78.6 239.5 364.0 499.5 620.7 756.4 887.1 1031.8 1156.0 1286.0 SG12 123.3 180.5 288.4 378.1 504.0 590.2 677.7 761.4 849.9 934.2 1026.3 SG13 88.4 156.4 174.6 250.1 278.3 363.2 422.9 495.1 554.8 624.3 670.4
B-38

Table B-23. CP2, Load Condition C, Run 1 (Continued)
% Load 0 10 20 30 40 50 60 70 80 90 100 Pressure -0.05 0.71 1.33 2.02 2.67 3.37 4.06 4.74 5.45 6.09 6.75
SG14 245.9 330.1 378.7 471.7 520.9 622.6 700.2 788.8 863.4 944.9 1008.8 SG15 -157.2 61.5 223.1 349.5 481.0 604.3 744.3 880.3 1028.3 1152.7 1287.9 SG16 277.5 355.0 499.1 612.5 758.8 869.9 982.3 1088.9 1200.8 1301.7 1416.7 SG17 33.1 153.7 204.4 307.6 367.3 475.0 563.8 661.2 749.7 843.4 917.0 SG18 154.8 220.7 246.8 310.4 341.8 415.8 478.0 544.6 605.8 670.9 722.6 SG19 -174.1 12.8 155.5 263.9 374.5 480.6 595.1 710.2 831.8 933.5 1048.0 SG20 196.2 304.4 477.7 622.6 792.5 942.0 1080.9 1217.4 1353.7 1479.3 1615.0 SG21 -4.2 50.6 83.8 148.6 188.1 272.3 331.5 395.5 454.7 519.9 580.8 SG22 -111.1 -43.2 5.4 81.6 132.1 228.0 300.3 377.6 449.6 526.6 599.2 SG23 -20.8 202.8 357.6 492.6 623.0 748.9 890.4 1032.2 1181.1 1307.8 1438.4 SG24 201.9 266.0 388.3 502.0 638.3 749.3 859.6 968.3 1074.8 1176.1 1283.6 SG25 -80.1 305.9 483.3 737.7 898.7 1163.1 1395.7 1651.4 1899.1 2141.5 2333.7 SG26 -105.5 280.5 464.6 713.8 875.3 1131.7 1365.4 1615.8 1862.2 2097.2 2288.9 SG27 81.2 92.1 81.8 118.2 124.0 180.0 210.7 255.9 294.5 348.3 373.2 SG28 104.9 130.2 131.6 182.2 200.8 270.3 313.6 371.5 422.9 488.2 524.4 SG29 -691.3 7.8 378.2 730.5 1024.9 1365.6 1737.5 2107.4 2496.5 2826.7 3153.9 SG30 -735.1 -3.9 392.7 766.8 1085.8 1449.9 1849.5 2247.5 2667.7 3024.7 3380.6 SG31 339.0 361.0 504.1 621.3 777.2 891.8 1007.0 1112.4 1213.9 1307.8 1438.7 SG32 320.5 349.1 496.8 616.7 773.7 890.2 1009.7 1118.6 1223.8 1320.3 1455.8 SG33 132.8 157.0 188.6 264.0 307.7 402.3 468.4 550.7 628.4 717.3 774.0 SG34 10166.1 10400.2 10469.9 10667.5 11008.7 10541.5 11388.2 11793.4 11975.9 12263.7 12354.7SG35 -283.1 161.8 381.2 638.5 841.4 1106.0 1362.1 1627.7 1903.3 2153.7 2368.0 SG36 -336.8 173.3 422.3 718.3 949.7 1255.8 1549.9 1857.2 2176.6 2468.3 2715.9 SG37 255.0 261.3 323.1 408.3 507.8 612.0 889.1 913.7 983.9 1094.7 1262.3 SG38 238.3 242.6 300.0 381.6 477.5 578.4 656.7 738.3 823.2 914.8 992.7 SG39 -117.3 125.1 284.4 401.0 539.0 651.9 777.6 898.7 1036.5 1159.1 1280.4 SG40 153.6 236.3 341.3 431.4 572.4 653.4 733.1 812.0 896.9 987.6 1074.1 SG41 -168.0 29.4 151.7 237.8 351.6 439.0 529.8 619.1 731.7 843.3 930.7 SG42 47.8 104.0 168.4 232.6 346.4 408.1 466.5 524.5 595.0 681.3 740.7 SG43 183.9 226.8 275.5 347.9 384.9 471.6 533.1 601.7 645.5 692.3 750.9 SG45 208.7 207.4 243.1 302.4 329.7 398.3 447.1 499.6 528.1 562.0 616.1
Table B-24. CP3, Load Condition A, Run 1
% Load 0 20 40 60 80 100 Pressure 0.11 0.72 1.34 2.04 2.71 3.40
Hoop-1 -58.0 853.5 1647.6 2416.6 3246.1 4033.2 Hoop-2 -60.0 819.2 1665.1 2406.6 3196.4 3993.4 Hoop-3 37.1 911.4 1598.5 2458.7 3238.3 4050.1 Hoop-4 11.3 825.7 1572.3 2438.3 3231.6 4035.5 Hoop-5 48.7 747.3 1602.6 2404.3 3230.0 4049.9 Hoop-6 -77.8 832.2 1622.8 2424.8 3228.6 4039.3 Hoop-7 31.4 804.6 1620.1 2429.5 3232.8 4044.5 Hoop-8 -61.7 694.3 1610.6 2420.0 3229.7 4038.5 Hoop-9 5.6 970.0 1742.1 2535.5 3225.1 4026.6
B-39

Table B-24. CP3, Load Condition A, Run 1 (Continued)
% Load 0 20 40 60 80 100 Pressure 0.11 0.72 1.34 2.04 2.71 3.40
Hoop-10 -20.7 812.7 1665.2 2450.9 3201.1 4017.3 Hoop-11 -113.7 923.9 1720.1 2363.5 3238.9 4009.3 Hoop-12 -8.1 777.6 1477.2 2547.4 3195.5 4057.4 Hoop-13 -41.7 869.3 1574.5 2409.1 3220.5 4083.8 Hoop-14 10.1 760.5 1599.9 2407.5 3298.1 3996.9 Long-1 140.6 -31.1 -26.0 48.5 117.9 192.4 Long-2 303.2 199.4 84.4 -44.0 17.4 71.0 Long-3 5.7 19.9 28.1 39.9 137.7 209.5 Long-4 -29.1 37.9 34.8 141.0 203.9 260.6 Long-5 13.6 0.7 24.1 95.7 196.6 268.1 Long-6 176.3 301.5 299.3 377.9 467.7 519.7 Long-7 52.1 63.3 78.0 111.7 177.0 218.5 Long-8 122.2 136.7 123.4 234.4 310.4 369.5 Radial-1R 216.4 74.3 7.3 -5.6 -26.2 -27.8 Radial-2R 97.9 145.9 328.1 321.6 598.2 249.4 Radial-3R 71.0 7.4 -12.4 -19.8 -21.1 -21.1 Radial-4R -17.2 -376.2 -64.1 -311.5 -304.0 -85.7 Radial-5R 154.9 3.0 -14.4 -17.3 -17.2 -17.2 Radial-6R 149.9 86.0 62.7 69.7 76.2 79.6 Radial-7R 134.1 42.8 -6.7 -22.5 -37.0 -55.7 Radial-8R 158.2 15.8 -13.7 -23.0 -40.4 -43.1 Radial-9R 127.2 42.3 13.1 -7.1 -21.1 -35.0 Radial-10R 101.4 25.7 -8.7 -20.2 -35.1 -46.4 SG01 28.3 -100.0 -208.4 -329.4 -411.5 -516.2 SG02 36.9 -78.8 -178.7 -287.3 -363.9 -458.5 SG03 101.4 253.0 438.9 660.3 854.8 1066.9 SG04 -130.9 240.5 500.8 758.6 987.9 1221.1 SG05 15.0 -139.8 -277.8 -420.1 -532.3 -656.0 SG06 15.6 -102.3 -215.5 -332.1 -424.8 -527.8 SG07 192.4 217.5 373.9 595.7 794.3 1014.7 SG08 -165.7 329.6 646.2 917.6 1175.9 1419.2 SG09 -21.4 -138.8 -260.3 -383.4 -487.4 -599.8 SG10 -4.7 -93.7 -187.5 -281.0 -359.1 -445.1 SG11 93.9 222.1 409.8 635.0 841.8 1061.3 SG12 -48.3 314.1 578.3 823.3 1059.8 1291.3 SG13 -14.4 -100.4 -192.9 -294.6 -373.7 -465.9 SG14 2.9 -116.3 -237.2 -361.8 -464.3 -578.8 SG15 84.5 183.8 338.1 537.6 750.1 944.4 SG16 1082.3 1469.2 1758.9 2045.0 2296.5 2547.7 SG17 24.5 -70.4 -188.6 -310.4 -408.3 -524.8 SG18 4.4 -77.0 -177.4 -277.0 -357.4 -451.1 SG19 121.4 215.6 390.0 595.6 787.0 772.6 SG20 -67.6 266.3 518.8 759.6 982.2 1206.4 SG21 -17.7 -123.7 -252.0 -358.2 -454.5 -563.7 SG22 4.1 -95.7 -212.3 -311.6 -401.5 -501.7
B-40

Table B-24. CP3, Load Condition A, Run 1 (Continued)
% Load 0 20 40 60 80 100 Pressure 0.11 0.72 1.34 2.04 2.71 3.40
SG23 112.3 209.0 401.1 620.2 827.0 1044.5 SG24 -132.0 322.4 633.4 899.3 1148.3 1402.3 SG25 -132.4 -53.4 -161.9 -290.7 -369.5 -498.1 SG26 -43.8 -112.5 -235.2 -360.0 -458.6 -581.1 SG27 -18.7 -81.5 -194.6 -308.1 -398.1 -509.9 SG28 53.6 -82.7 -232.5 -371.3 -478.4 -609.4 SG29 97.6 -71.8 -238.8 -387.2 -495.6 -632.8 SG30 296.9 -13.2 -263.7 -449.1 -571.9 -739.7 SG31 -5.5 -77.2 -183.8 -292.4 -379.0 -483.0 SG32 72.3 20.7 -89.3 -204.2 -291.4 -402.6 SG33 -76.1 -65.7 -185.3 -318.9 -409.3 -540.5 SG34 89.6 177.5 311.0 470.0 612.3 764.2 SG35 -53.5 245.6 462.5 662.4 856.4 1045.8 SG36 91.3 241.5 441.0 670.0 883.8 1104.8 SG37 -255.0 495.4 1015.0 1479.2 1948.8 2391.2 SG38 7.2 -84.2 -165.5 -246.0 -321.0 -394.8 SG39 7.9 -63.6 -130.7 -192.7 -249.6 -315.2 SG40 6.5 -40.1 -76.7 -110.8 -151.2 -189.4
Table B-25. CP3, Load Condition A, Run 2
% Load 0 20 40 60 80 100 Pressure 0.02 0.70 1.38 2.04 2.73 3.42
Hoop-1 79.7 904.0 1636.6 2456.2 3266.4 3994.1 Hoop-2 4.7 755.9 1455.8 2461.5 3239.4 4043.9 Hoop-3 -7.1 1231.8 2128.0 2388.8 3212.9 4029.8 Hoop-4 107.6 698.6 1577.9 2380.9 3221.9 4005.1 Hoop-5 -10.2 797.7 1555.1 2413.7 3232.8 4023.4 Hoop-6 -9.0 805.6 1644.2 2428.7 3294.3 4031.0 Hoop-7 -7.1 789.7 1592.8 2419.4 3228.7 4027.1 Hoop-8 -5.3 834.7 1629.0 2430.8 3270.6 4058.3 Hoop-9 10.8 871.3 1611.8 2391.1 3217.8 4054.6 Hoop-10 55.8 799.9 1587.1 2408.5 3231.1 4015.0 Hoop-11 -21.4 776.5 1683.2 2402.3 3218.9 4019.5 Hoop-12 -22.1 749.3 1706.8 2544.4 3150.9 4032.5 Hoop-13 -23.5 834.6 1592.9 2398.2 3220.8 3997.8 Hoop-14 27.9 861.1 1611.5 2425.6 3213.8 4029.0 Long-1 92.3 158.6 182.3 195.8 211.3 244.4 Long-2 128.6 222.4 270.3 322.9 361.9 426.7 Long-3 9.3 5.8 11.7 3.4 3.4 -1.3 Long-4 58.8 86.6 93.8 100.0 87.7 102.1 Long-5 33.7 209.6 244.8 294.1 391.5 471.2 Long-6 212.2 276.5 297.5 346.3 385.0 431.6 Long-7 -8.8 39.6 73.3 86.8 93.6 100.3 Long-8 95.5 106.4 110.0 107.6 99.1 112.4
B-41

Table B-25. CP3, Load Condition A, Run 2 (Continued)
% Load 0 20 40 60 80 100 Pressure 0.02 0.70 1.38 2.04 2.73 3.42
Radial-1R 29.4 -30.5 -30.5 -31.7 -30.4 -31.3 Radial-2R 538.2 506.5 547.1 323.3 286.8 308.2 Radial-3R 3.0 -5.4 -21.7 -21.0 -23.2 -22.2 Radial-4R 1707.6 2079.7 1735.4 1957.0 1692.3 1962.9 Radial-5R 7.3 -21.2 -33.3 -40.1 -39.9 -38.1 Radial-6R -8.2 -13.6 -14.6 -12.6 -11.8 -17.1 Radial-7R 48.2 -7.1 -28.8 -39.8 -59.7 -72.6 Radial-8R -30.3 -67.8 -74.4 -80.3 -85.8 -87.2 Radial-9R 28.4 0.8 -19.6 -32.0 -44.3 -54.7 Radial-10R 14.7 -7.4 -31.1 -43.5 -56.3 -65.6 SG01 -15.8 -117.1 -233.9 -330.9 -441.3 -546.3 SG02 4.5 -89.1 -194.5 -283.8 -384.4 -479.9 SG03 21.5 210.2 423.1 627.0 839.6 1052.0 SG04 20.5 298.5 553.7 794.2 1038.7 1275.6 SG05 -35.7 -171.6 -314.4 -425.9 -564.6 -696.7 SG06 -7.1 -114.0 -231.3 -326.1 -440.9 -549.8 SG07 -8.1 124.6 328.4 535.0 751.2 971.7 SG08 37.9 393.4 671.7 928.5 1201.7 1452.8 SG09 -26.5 -152.6 -279.9 -374.0 -499.2 -620.3 SG10 -7.8 -102.5 -198.8 -272.4 -369.6 -462.9 SG11 22.6 208.1 424.6 624.6 846.4 1070.7 SG12 28.5 337.0 587.8 809.1 1065.7 1305.7 SG13 -22.9 -115.4 -225.3 -285.2 -387.4 -485.1 SG14 -6.8 -124.2 -256.6 -348.3 -473.6 -593.2 SG15 13.5 172.0 373.4 557.8 761.0 966.9 SG16 12436.7 12734.1 13066.1 13286.5 13542.2 13791.6 SG17 -24.1 -119.0 -251.3 -344.7 -471.8 -589.9 SG18 -7.1 -84.6 -194.1 -275.0 -379.2 -476.7 SG19 8.4 165.5 356.9 545.4 748.2 956.7 SG20 35.2 312.6 559.6 772.9 1016.6 1246.1 SG21 175.5 88.0 -30.5 -144.3 -260.4 -366.5 SG22 -4.7 -90.3 -199.7 -305.4 -413.2 -513.3 SG23 21.4 181.5 392.1 604.3 824.6 1040.9 SG24 14.3 339.0 630.5 906.9 1172.1 1432.7 SG25 29.8 18.6 -144.0 -225.4 -365.6 -498.4 SG26 22.3 -59.9 -202.6 -302.8 -432.1 -555.4 SG27 -3.4 -80.9 -213.6 -307.5 -426.6 -540.8 SG28 -32.0 -148.1 -307.8 -408.6 -551.8 -685.0 SG29 44.4 -80.3 -256.9 -359.3 -513.7 -653.3 SG30 -31.3 -220.1 -466.1 -579.2 -775.7 -946.5 SG31 114.3 36.7 -83.4 -169.5 -282.3 -388.9 SG32 1733.9 1673.9 1548.0 1463.8 1349.8 1240.5 SG33 7.0 -34.2 -188.9 -279.0 -420.5 -553.3 SG34 13.9 133.4 286.6 436.2 591.4 752.5 SG35 -7.7 236.8 440.9 657.4 870.0 1068.6
B-42

Table B-25. CP3, Load Condition A, Run 2 (Continued)
% Load 0 20 40 60 80 100 Pressure 0.02 0.70 1.38 2.04 2.73 3.42
SG36 25.2 208.5 427.7 647.8 874.5 1100.8 SG37 47.2 638.4 1116.9 1596.3 2096.1 2551.3 SG38 -3.8 -103.0 -190.1 -255.9 -334.3 -412.6 SG39 7.0 -66.5 -137.0 -195.5 -269.9 -342.5 SG40 5.9 -43.6 -88.0 -129.6 -167.8 -207.3
Table B-26. CP3, Load Condition A, Run 3
% Load 0 20 40 60 80 100 Pressure -0.01 0.69 1.36 2.03 2.74 3.43
Hoop-1 81.3 953.2 1608.0 2497.2 3222.0 4033.7 Hoop-2 39.6 711.1 1627.0 2310.0 3161.3 4055.5 Hoop-3 -1.4 827.1 1632.4 2441.8 3208.5 4038.4 Hoop-4 112.6 902.3 1576.2 2422.0 3256.7 4054.7 Hoop-5 34.1 767.7 1627.9 2411.9 3247.1 4083.6 Hoop-6 3.8 816.8 1614.0 2430.0 3233.8 4029.4 Hoop-7 46.1 872.7 1614.7 2425.4 3238.1 4027.1 Hoop-8 10.0 865.2 1689.9 2483.8 3423.3 4156.4 Hoop-9 30.2 994.6 1721.0 2399.5 3216.0 4028.7 Hoop-10 63.2 795.3 1633.0 2431.8 3217.7 4051.0 Hoop-11 10.1 770.1 1612.1 2409.7 3256.7 4060.9 Hoop-12 20.9 788.6 1525.9 2372.2 3320.9 4099.3 Hoop-13 17.6 805.2 1633.9 2562.2 3220.8 4031.8 Hoop-14 -10.2 797.4 1719.5 2425.1 3220.2 4027.8 Long-1 57.2 138.9 148.2 173.0 188.6 219.6 Long-2 33.7 179.9 220.1 258.1 315.0 361.9 Long-3 143.6 -39.0 39.9 207.2 146.0 48.2 Long-4 50.5 79.4 93.8 94.9 103.1 101.1 Long-5 108.8 210.8 254.2 357.4 440.7 538.1 Long-6 216.7 211.1 267.6 319.6 351.8 424.9 Long-7 -4.3 64.3 71.1 103.7 95.8 110.5 Long-8 111.2 103.9 107.6 117.2 118.4 118.4 Radial-1R -25.1 -33.7 -34.3 -33.6 -33.9 -33.3 Radial-2R 387.1 414.6 321.4 449.4 110.2 121.2 Radial-3R -12.4 -21.3 -13.6 -22.3 -23.6 -22.8 Radial-4R 1214.0 1222.7 1155.3 1061.4 899.8 1333.8 Radial-5R 0.4 -28.6 -29.2 -35.4 -39.9 -39.9 Radial-6R -14.4 -17.6 -16.7 -15.6 -19.6 -13.2 Radial-7R 16.0 -12.5 -27.4 -45.0 -66.0 -78.8 Radial-8R -59.0 -72.7 -74.1 -83.2 -87.4 -87.7 Radial-9R 25.4 7.9 -0.4 -23.5 -35.9 -46.1 Radial-10R -8.4 -18.4 -29.0 -47.9 -60.8 -68.3 SG01 -9.8 -113.0 -210.8 -324.8 -434.1 -545.7 SG02 10.4 -83.8 -174.4 -276.5 -377.7 -478.5 SG03 -10.6 195.4 398.8 609.7 827.9 1047.4
B-43

Table B-26. CP3, Load Condition A, Run 3 (Continued)
% Load 0 20 40 60 80 100 Pressure -0.01 0.69 1.36 2.03 2.74 3.43
SG04 38.4 303.3 530.4 790.4 1038.9 1274.8 SG05 -28.2 -158.8 -279.8 -412.0 -551.0 -690.4 SG06 2.1 -104.1 -205.9 -314.4 -430.0 -546.2 SG07 -72.6 102.4 309.9 506.6 728.5 961.3 SG08 85.0 405.4 648.1 927.3 1200.2 1449.9 SG09 -17.0 -134.5 -250.4 -360.6 -486.0 -615.0 SG10 3.3 -88.1 -175.7 -260.6 -358.1 -458.5 SG11 -21.2 180.2 395.3 602.4 831.1 1062.6 SG12 43.4 329.4 557.9 803.6 1058.8 1301.0 SG13 -17.0 -97.8 -189.3 -279.2 -380.3 -484.4 SG14 2.0 -110.0 -225.0 -338.8 -463.8 -591.4 SG15 -29.8 147.8 345.8 537.8 747.3 960.7 SG16 12314.9 12592.4 12907.1 13156.4 13434.0 13686.8 SG17 -27.8 -119.7 -233.3 -346.2 -473.9 -602.6 SG18 -4.4 -83.5 -178.8 -271.0 -376.4 -481.2 SG19 -43.0 128.4 328.3 525.4 733.8 948.2 SG20 56.9 318.6 544.5 777.0 1023.8 1252.9 SG21 179.9 83.5 -26.7 -129.4 -248.7 -363.9 SG22 -1.2 -95.4 -197.9 -294.7 -405.6 -513.3 SG23 -20.1 163.5 373.0 580.7 807.8 1034.2 SG24 49.8 373.1 641.7 908.9 1187.6 1443.9 SG25 92.7 63.3 -63.6 -175.6 -326.1 -488.8 SG26 44.0 -39.7 -160.8 -278.9 -412.6 -549.5 SG27 13.0 -68.3 -179.0 -288.6 -414.1 -540.3 SG28 -34.5 -138.3 -265.6 -394.3 -539.5 -684.3 SG29 34.7 -75.9 -211.7 -349.7 -506.2 -657.7 SG30 -83.2 -224.8 -393.4 -569.9 -769.2 -961.2 SG31 124.9 44.9 -58.0 -158.1 -272.7 -389.4 SG32 2272.8 2203.4 2098.9 1999.4 1880.7 1757.0 SG33 48.8 -4.9 -130.9 -247.1 -392.5 -549.7 SG34 -34.4 118.0 267.1 405.7 573.3 744.7 SG35 -12.8 239.7 422.2 628.6 842.9 1050.7 SG36 -17.8 192.1 408.6 623.3 856.8 1093.5 SG37 80.3 642.6 1077.1 1574.3 2066.1 2530.8 SG38 0.4 -83.9 -171.7 -240.0 -320.8 -401.1 SG39 17.2 -54.0 -126.7 -185.5 -263.1 -338.3 SG40 13.9 -38.0 -79.2 -115.8 -157.8 -196.3
Table B-27. CP3, Load Condition B, Run 1
% Load 0 20 40 60 80 100 Pressure -0.04 0.02 0.01 -0.01 0.00 0.00
Hoop-1 -21.5 -45.3 26.0 124.3 -0.9 -5.7 Hoop-2 58.0 58.0 44.7 -13.4 -46.7 34.8 Hoop-3 -10.5 -7.6 1.1 2.5 1.1 -3.3
B-44

Table B-27. CP3, Load Condition B, Run 1 (Continued)
% Load 0 20 40 60 80 100 Pressure -0.04 0.02 0.01 -0.01 0.00 0.00
Hoop-4 -26.8 6.3 26.2 14.6 21.2 31.2 Hoop-5 2.8 -43.1 -14.6 -25.7 4.4 -8.3 Hoop-6 -38.0 12.9 -3.0 -6.2 9.7 -6.2 Hoop-7 -4.6 -6.1 17.3 -1.4 18.9 20.5 Hoop-8 -15.9 7.0 29.9 -0.7 -8.3 -0.7 Hoop-9 51.4 40.8 46.1 37.3 40.8 46.1 Hoop-10 -4.3 -2.8 -5.8 -2.8 3.1 -1.3 Hoop-11 -23.8 -8.0 66.1 -11.2 6.2 15.6 Hoop-12 47.3 13.3 25.9 8.0 9.7 4.4 Hoop-13 17.0 46.4 164.0 169.8 222.7 234.5 Hoop-14 -9.0 3.7 35.5 16.4 29.2 29.2 Long-1 -19.7 767.6 1647.8 2562.0 3362.3 4211.7 Long-2 -15.0 656.1 1623.7 2660.4 3481.5 4273.0 Long-3 2.2 1005.8 1820.6 2462.0 3361.4 4184.8 Long-4 1.8 981.4 1869.8 2418.0 3237.2 4153.8 Long-5 -24.0 1024.7 1946.2 2350.4 3234.2 4172.5 Long-6 160.8 995.0 1867.5 2306.8 3494.9 4017.7 Long-7 31.8 972.1 1528.5 2374.7 3177.2 4327.6 Long-8 26.9 558.9 1652.7 2898.2 3279.9 4118.2 Radial-1R -5.4 67.1 75.8 75.2 127.7 142.5 Radial-2R 369.9 391.3 205.6 25.8 -36.8 154.1 Radial-3R -3.9 13.6 17.7 21.8 45.0 63.0 Radial-4R 244.2 177.9 155.8 297.6 -464.1 21.6 Radial-5R -1.4 20.5 15.5 17.8 26.4 32.1 Radial-6R 41.1 58.0 52.2 52.9 57.7 60.7 Radial-7R 20.1 61.7 58.8 74.1 99.8 122.7 Radial-8R 1.8 24.0 25.2 30.2 44.2 52.8 Radial-9R 23.8 55.5 66.6 85.3 106.1 118.2 Radial-10R 17.0 38.1 36.6 43.8 61.9 75.5 SG01 6.7 204.3 411.3 615.3 820.4 1025.2 SG02 16.6 200.0 393.2 582.6 771.1 960.7 SG03 7.0 -36.0 -114.2 -192.6 -259.7 -332.8 SG04 20.1 -117.0 -229.9 -359.4 -483.5 -597.6 SG05 -22.6 220.6 457.9 677.1 924.7 1165.2 SG06 -3.3 207.6 417.2 609.5 826.4 1038.6 SG07 -67.6 -63.9 -145.0 -217.4 -270.5 -345.1 SG08 132.7 -88.7 -228.1 -369.1 -551.6 -700.9 SG09 -27.8 189.7 399.8 573.5 787.9 1000.5 SG10 -12.2 183.9 372.4 528.2 721.3 911.0 SG11 -36.1 -74.0 -153.0 -219.9 -282.8 -357.8 SG12 103.6 -57.8 -167.7 -257.6 -390.1 -504.0 SG13 -11.0 191.8 385.9 552.9 751.3 951.3 SG14 -6.6 227.3 448.6 637.2 865.4 1090.2 SG15 -71.3 -49.3 -159.7 -202.2 -293.5 -358.5 SG16 1278.9 1073.6 897.4 830.8 642.9 489.7
B-45

Table B-27. CP3, Load Condition B, Run 1 (Continued)
% Load 0 20 40 60 80 100 Pressure -0.04 0.02 0.01 -0.01 0.00 0.00
SG17 35.7 262.9 469.2 655.3 876.7 1096.2 SG18 9.0 217.6 414.0 584.6 794.0 1000.0 SG19 -244.2 -275.6 -104.2 -155.6 -207.1 -267.1 SG20 46.6 -68.8 -143.3 -212.4 -313.7 -403.5 SG21 -20.3 211.6 419.0 589.4 831.2 1048.3 SG22 1.2 220.3 418.7 579.3 804.1 1009.8 SG23 -23.1 -77.2 -162.8 -233.2 -314.5 -397.3 SG24 43.1 -130.2 -234.9 -331.1 -483.6 -608.9 SG25 77.6 667.7 1305.6 1893.6 2515.2 3164.5 SG26 4.8 323.2 655.1 960.7 1291.1 1631.3 SG27 33.1 320.5 618.4 900.2 1197.7 1505.8 SG28 30.7 368.0 672.3 951.1 1276.0 1596.3 SG29 43.2 469.4 851.2 1203.6 1623.3 2027.2 SG30 92.4 892.8 1577.1 2215.9 2970.0 3716.3 SG31 22.2 264.3 504.1 720.7 971.5 1223.7 SG32 126.7 427.1 731.1 1007.6 1321.6 1640.1 SG33 53.7 536.9 1039.0 1493.8 2003.6 2528.2 SG34 -21.4 -101.5 -200.6 -269.3 -357.7 -454.2 SG35 74.0 -126.2 -283.9 -393.7 -557.7 -694.0 SG36 -25.5 -87.1 -185.4 -266.9 -360.5 -460.9 SG37 101.9 -253.4 -508.2 -698.0 -1020.7 -1280.4 SG38 -5.4 154.1 313.3 427.6 580.1 733.8 SG39 6.0 176.3 341.5 460.7 621.7 786.5 SG40 6.5 139.6 277.2 365.7 497.1 628.9
Table B-28. CP3, Load Condition B, Run 2
% Load 0 20 40 60 80 100 Pressure -0.02 0.03 -0.02 0.02 -0.01 0.01
Hoop-1 46.4 84.4 87.6 89.2 130.4 133.6 Hoop-2 -13.6 -18.6 -28.6 32.9 -5.3 8.0 Hoop-3 8.7 17.4 -8.6 -2.8 4.4 11.6 Hoop-4 132.4 114.2 200.3 119.2 149.0 230.1 Hoop-5 -0.7 15.1 7.2 -7.1 -18.1 24.6 Hoop-6 -7.4 -5.8 42.0 8.5 5.4 3.8 Hoop-7 77.4 47.7 33.6 46.1 82.1 93.1 Hoop-8 -5.3 25.2 -5.3 17.6 25.2 48.1 Hoop-9 16.1 35.5 23.2 19.6 42.6 49.6 Hoop-10 18.6 43.9 35.0 30.5 48.3 58.8 Hoop-11 14.8 10.1 55.8 76.3 63.7 114.2 Hoop-12 -23.9 37.0 -0.6 -13.1 3.0 -14.9 Hoop-13 -17.7 -5.9 11.7 58.8 88.1 152.8 Hoop-14 2.5 -10.2 -16.6 2.5 8.8 8.8 Long-1 58.2 1004.7 1829.4 2664.3 3263.6 4373.0 Long-2 104.0 932.3 1804.2 2410.4 3491.4 4396.0
B-46

Table B-28. CP3, Load Condition B, Run 2 (Continued)
% Load 0 20 40 60 80 100 Pressure -0.02 0.03 -0.02 0.02 -0.01 0.01
Long-3 -33.1 976.2 1708.9 2701.9 3261.7 4186.7 Long-4 48.5 706.2 1594.0 2540.5 3352.3 4138.2 Long-5 54.8 655.3 1558.4 2533.1 3225.4 4545.2 Long-6 203.4 860.1 1813.9 2663.4 3661.8 3956.8 Long-7 -13.3 716.5 1927.7 2700.3 3492.3 4375.4 Long-8 6.2 1129.1 1381.3 2341.4 3324.7 4339.5 Radial-1R -30.6 4.7 7.9 62.5 60.7 84.7 Radial-2R 286.6 526.6 249.0 345.9 359.5 239.7 Radial-3R -11.7 1.6 -0.4 14.4 16.3 19.8 Radial-4R 1036.1 1127.2 1479.7 1235.5 1218.4 1387.0 Radial-5R -7.0 -0.2 -6.8 6.5 7.2 16.9 Radial-6R -22.1 -14.4 -22.9 -7.8 -13.7 -5.6 Radial-7R 10.7 41.7 39.6 82.7 81.1 107.2 Radial-8R -68.0 -48.6 -52.1 -12.8 -11.3 17.0 Radial-9R 22.8 45.0 51.4 90.5 100.3 128.1 Radial-10R -5.7 14.2 8.5 27.5 29.0 46.4 SG01 -23.0 177.0 365.3 573.3 757.3 981.3 SG02 -1.0 183.4 360.5 551.8 724.7 930.0 SG03 -8.3 -59.6 -142.5 -193.7 -267.4 -340.7 SG04 50.0 -79.3 -181.4 -322.4 -428.6 -560.2 SG05 -43.9 179.8 399.5 652.6 868.8 1127.0 SG06 -9.1 185.0 381.3 598.6 790.9 1017.0 SG07 -83.8 -96.8 -192.4 -215.3 -297.9 -367.1 SG08 106.9 -74.6 -195.9 -400.8 -529.7 -695.0 SG09 -24.6 162.2 365.6 581.1 772.6 996.1 SG10 -4.0 162.0 344.6 537.9 710.8 908.7 SG11 -27.2 -63.8 -152.7 -203.7 -286.1 -357.2 SG12 59.6 -62.3 -165.5 -309.0 -404.5 -520.9 SG13 -26.5 145.2 332.5 540.3 720.9 924.7 SG14 -10.7 185.5 401.2 634.4 840.6 1071.6 SG15 -35.9 -68.8 -156.1 -203.2 -283.7 -350.0 SG16 12394.6 12230.2 12086.9 11898.5 11750.5 11595.0 SG17 -31.5 150.8 355.6 588.5 789.2 1000.6 SG18 -11.0 160.8 354.9 567.4 757.6 957.6 SG19 -262.9 -285.7 -380.0 -420.1 -488.5 -308.7 SG20 69.0 -21.8 -93.7 -204.1 -279.5 -365.3 SG21 175.7 352.4 578.0 814.1 1026.6 1237.4 SG22 -6.5 163.4 376.3 598.6 801.1 999.7 SG23 -26.1 -68.9 -176.5 -244.1 -340.7 -413.1 SG24 66.0 -63.9 -168.6 -336.4 -450.7 -570.2 SG25 56.9 615.2 1239.5 1891.7 2506.2 3155.7 SG26 26.1 322.0 641.9 984.3 1300.1 1640.6 SG27 -2.3 268.8 555.1 866.0 1151.8 1458.3 SG28 -54.4 237.8 533.3 879.9 1168.3 1488.8 SG29 11.0 378.8 746.0 1189.3 1556.6 1963.1
B-47

Table B-28. CP3, Load Condition B, Run 2 (Continued)
% Load 0 20 40 60 80 100 Pressure -0.02 0.03 -0.02 0.02 -0.01 0.01
SG30 -133.5 558.1 1208.8 2027.6 2673.5 3423.6 SG31 114.0 324.3 559.9 816.2 1048.6 1299.2 SG32 1771.6 2034.6 2335.1 2656.0 3008.2 3730.4 SG33 23.5 451.7 946.9 1467.0 1951.5 2470.1 SG34 -27.5 -106.3 -215.1 -305.2 -395.6 -488.2 SG35 12.3 -152.1 -298.4 -470.8 -579.7 -718.7 SG36 -21.5 -80.5 -191.3 -266.9 -370.5 -468.3 SG37 115.2 -150.9 -387.8 -707.5 -922.9 -1185.5 SG38 -7.6 126.6 286.6 438.0 584.8 747.3 SG39 15.2 148.8 313.8 476.7 631.8 789.8 SG40 2.9 111.7 257.9 386.4 522.2 662.0
Table B-29. CP3, Load Condition C, Run 1
% Load 0 20 40 60 80 100 Pressure 0.00 0.69 1.37 2.04 2.68 3.42 Hoop-1 -5.7 931.4 1673.0 2405.8 3204.2 4041.2 Hoop-2 -33.4 744.6 1573.7 2498.2 3255.6 4036.6 Hoop-3 -17.7 812.3 1604.2 2425.8 3207.4 4040.2 Hoop-4 27.9 784.6 1633.5 2465.0 3262.4 4060.2 Hoop-5 17.1 747.5 1639.0 2542.4 3156.5 4040.4 Hoop-6 -1.4 816.5 1629.2 2413.9 3207.3 4025.0 Hoop-7 28.3 693.7 1748.4 2451.7 3194.6 4039.9 Hoop-8 -0.7 785.9 1534.4 2420.5 3191.6 4016.3 Hoop-9 -10.3 721.3 1633.0 2407.3 3159.9 4062.7 Hoop-10 1.6 802.2 1613.3 2391.8 3217.5 4053.8 Hoop-11 -6.5 770.9 1627.3 2436.5 3215.3 4096.8 Hoop-12 -4.6 872.3 1534.6 2388.6 3222.4 3893.5 Hoop-13 -6.5 816.4 1557.1 2433.1 3244.0 4008.2 Hoop-14 3.7 817.7 2007.0 2477.9 3202.7 4074.0 Long-1 -24.9 723.2 1750.4 2402.2 3467.8 4236.5 Long-2 -35.0 691.8 1679.7 2504.7 3577.5 4242.9 Long-3 25.8 751.5 1483.9 2511.0 3226.0 4036.3 Long-4 48.2 952.6 1775.2 2634.0 3255.7 4257.9 Long-5 34.7 806.6 2005.1 2361.6 3529.8 4267.5 Long-6 145.3 905.3 1686.1 2541.2 3167.0 4158.3 Long-7 18.4 1062.1 1818.7 2381.0 3350.4 3958.7 Long-8 221.1 749.6 1701.1 2594.8 3185.9 4187.0 Radial-1R 37.6 32.2 27.7 29.9 57.5 52.3 Radial-2R 449.5 -43.4 474.6 531.1 231.3 256.9 Radial-3R 3.2 -18.0 -17.9 -19.9 -19.4 -19.4 Radial-4R -115.9 83.1 -515.8 -310.0 -61.4 -166.1 Radial-5R -18.9 -10.7 -25.0 -24.2 -28.1 -24.6 Radial-6R 6.5 23.8 18.7 23.4 21.8 30.9 Radial-7R 26.3 26.5 5.9 6.9 -3.8 -0.2
B-48

Table B-29. CP3, Load Condition C, Run 1 (Continued)
% Load 0 20 40 60 80 100 Pressure 0.00 0.69 1.37 2.04 2.68 3.42
Radial-8R 22.4 3.8 -19.8 -10.5 -2.8 -8.9 Radial-9R 43.0 35.8 37.6 31.5 38.0 31.9 Radial-10R 32.4 9.5 3.3 -0.8 -5.5 -7.6 SG01 19.2 74.1 185.4 236.4 357.6 428.4 SG02 24.6 81.6 185.3 240.0 352.5 424.7 SG03 15.1 163.8 285.0 443.9 560.1 721.1 SG04 -10.3 156.0 286.9 433.9 520.1 677.7 SG05 4.6 62.7 158.7 232.2 348.8 426.3 SG06 12.4 74.7 167.5 240.1 347.1 425.0 SG07 -23.2 112.6 229.9 380.7 508.9 672.0 SG08 59.0 233.4 396.3 520.7 612.5 760.4 SG09 -6.2 55.2 130.4 200.9 283.5 351.3 SG10 1.1 73.7 159.4 238.5 329.0 408.5 SG11 -12.3 135.7 276.9 425.8 561.6 727.9 SG12 50.6 211.2 373.9 510.4 635.4 786.7 SG13 6.9 87.4 173.2 241.6 331.6 415.2 SG14 11.9 89.4 177.3 245.3 338.7 420.9 SG15 -37.0 102.8 192.8 349.2 431.5 639.0 SG16 1070.7 1256.0 1423.6 1547.7 1703.7 1822.4 SG17 52.1 133.6 221.1 275.6 365.3 451.3 SG18 20.1 109.7 202.9 273.5 372.0 469.3 SG19 7.2 147.2 278.6 429.9 564.1 715.6 SG20 2.9 179.9 361.6 517.6 649.6 800.7 SG21 0.6 88.3 182.7 233.4 330.3 427.4 SG22 13.0 95.9 187.9 243.4 339.5 434.5 SG23 -0.7 118.0 238.9 394.2 519.3 675.6 SG24 -13.0 198.1 397.2 563.3 695.1 838.0 SG25 102.2 567.7 1063.2 1440.2 1901.4 2388.0 SG26 45.9 212.6 405.4 544.4 734.9 928.6 SG27 51.7 206.3 379.6 507.4 676.6 849.3 SG28 69.3 216.2 373.7 486.2 650.9 814.2 SG29 95.9 296.5 515.5 683.9 914.6 1148.7 SG30 196.6 628.2 1086.6 1462.1 1947.3 2452.7 SG31 40.1 156.1 281.8 370.9 498.0 623.9 SG32 143.9 314.7 498.6 631.9 811.4 993.7 SG33 73.5 415.8 780.8 1049.4 1392.2 1747.9 SG34 -6.3 58.8 121.1 168.0 243.5 313.4 SG35 21.9 94.5 165.9 221.6 294.1 379.1 SG36 5.4 143.9 267.9 392.4 519.0 667.8 SG37 -13.1 272.0 544.6 772.7 994.3 1257.5 SG38 7.7 67.9 127.1 188.1 250.1 308.0 SG39 8.5 96.7 177.5 260.9 340.9 425.5 SG40 1.8 87.2 169.1 251.0 329.7 408.0
B-49

Table B-30. CP3, Load Condition C, Run 2
% Load 0 20 40 60 80 100 Pressure 0.00 0.66 1.36 2.04 2.79 3.40
Hoop-1 -15.5 843.8 1591.9 2413.7 3221.7 4019.1 Hoop-2 1.3 844.0 1561.9 2328.7 3147.7 4036.9 Hoop-3 -7.1 912.0 1555.7 2481.2 3227.0 4012.1 Hoop-4 13.2 819.5 1519.6 2407.6 3261.4 4024.5 Hoop-5 62.7 862.6 1722.6 2491.6 3227.7 4030.9 Hoop-6 -13.7 759.5 1865.0 2398.7 3231.9 4030.6 Hoop-7 -33.7 916.4 1763.1 2490.1 3222.2 4033.0 Hoop-8 -28.2 827.1 1537.2 2376.9 3202.2 4065.5 Hoop-9 10.8 871.3 1631.0 2362.5 3156.4 3923.7 Hoop-10 -3.7 887.7 1627.1 2452.7 3225.5 4032.5 Hoop-11 2.2 847.5 1588.5 2482.3 3318.6 4038.0 Hoop-12 13.7 778.0 1703.1 2372.2 3213.8 4148.5 Hoop-13 -23.5 740.6 1657.4 2474.1 3209.3 4015.0 Hoop-14 -29.3 931.0 1598.6 2431.4 3220.5 3984.1 Long-1 17.8 913.9 1858.5 2422.4 3231.9 4098.2 Long-2 41.5 990.5 1920.5 2762.3 3270.7 4266.9 Long-3 -16.6 978.8 1729.1 2400.6 3457.6 4327.3 Long-4 13.4 788.8 1626.1 2533.5 3439.2 4110.8 Long-5 16.1 680.0 1984.4 2572.0 3416.9 4386.2 Long-6 157.9 658.6 1618.0 2551.8 3266.7 4258.5 Long-7 19.4 1109.1 1574.7 2323.8 3296.9 4065.4 Long-8 59.3 972.5 2067.8 2482.7 3588.0 4067.4 Radial-1R 52.0 -9.7 -1.9 -2.7 58.1 -20.4 Radial-2R 203.0 11.3 500.8 561.8 636.0 512.4 Radial-3R -7.5 -12.6 -14.1 -18.6 -8.7 -11.6 Radial-4R 3135.4 2494.2 2110.8 2419.1 2264.1 2301.8 Radial-5R -19.9 -37.0 -48.4 -41.0 -25.5 -39.5 Radial-6R 18.2 -18.8 -25.8 -16.7 1.3 -14.8 Radial-7R 24.1 -2.9 -4.0 -2.0 26.3 -6.3 Radial-8R 8.8 -19.3 -21.9 -25.3 -1.5 -32.6 Radial-9R 31.6 11.4 1.6 1.2 19.5 -7.1 Radial-10R 30.6 -0.8 -9.1 -14.1 0.6 -27.3 SG01 -15.9 84.1 154.7 208.9 299.6 366.0 SG02 -2.2 93.4 167.3 219.1 304.8 374.5 SG03 -3.1 123.8 274.5 428.8 590.0 715.0 SG04 31.0 184.5 333.8 469.4 573.2 745.2 SG05 -32.5 61.0 151.3 205.5 315.7 382.2 SG06 -5.7 85.5 171.9 227.1 326.1 399.0 SG07 -46.2 47.4 190.9 348.3 530.8 621.5 SG08 62.7 254.5 378.6 515.8 586.8 778.5 SG09 -21.8 54.9 139.1 190.0 284.1 350.1 SG10 -5.6 78.5 167.2 229.4 328.9 407.0 SG11 -13.9 115.4 262.9 420.0 585.7 703.7 SG12 41.6 223.5 344.8 499.3 602.6 779.6 SG13 -17.7 71.2 171.6 223.1 320.4 398.5
B-50

Table B-30. CP3, Load Condition C, Run 2 (Continued)
% Load 0 20 40 60 80 100 Pressure 0.00 0.66 1.36 2.04 2.79 3.40
SG14 -3.9 80.3 178.1 232.7 333.2 410.5 SG15 -24.0 86.0 218.5 366.2 524.1 628.9 SG16 12517.6 12676.2 12760.1 12967.7 13050.8 13203.9 SG17 7.3 94.0 192.7 215.9 307.8 387.1 SG18 -5.6 84.6 187.6 251.0 354.9 441.9 SG19 -25.9 94.1 231.2 388.3 548.3 668.3 SG20 50.3 243.9 380.8 537.2 659.6 836.6 SG21 172.7 250.6 333.7 426.0 527.9 622.3 SG22 -5.8 65.0 151.5 237.3 337.2 429.5 SG23 -18.6 93.5 232.9 376.6 536.2 646.3 SG24 48.9 288.9 464.6 583.5 693.7 873.5 SG25 43.9 588.9 1070.7 1426.2 1889.1 2356.7 SG26 21.6 224.9 417.7 550.0 743.6 919.3 SG27 -0.4 184.1 351.5 468.8 642.7 796.5 SG28 -37.1 122.6 292.6 402.3 581.4 712.5 SG29 34.0 248.5 485.8 652.2 909.7 1091.5 SG30 -91.2 360.4 858.7 1234.4 1789.3 2167.7 SG31 118.5 247.1 374.5 459.5 589.1 705.9 SG32 1382.4 1569.5 2084.9 2218.0 2403.2 2578.4 SG33 21.9 405.0 759.7 1015.4 1356.1 1698.5 SG34 -18.2 16.8 75.6 141.7 201.5 243.6 SG35 -13.9 65.7 131.7 214.8 250.8 348.1 SG36 -12.5 99.8 234.3 369.2 514.2 616.9 SG37 57.1 383.3 607.3 869.5 1032.0 1354.1 SG38 -7.3 52.2 115.3 178.5 259.0 321.7 SG39 2.1 79.2 158.8 240.5 339.3 431.4 SG40 1.4 72.6 148.5 243.9 340.1 430.7
Table B-31. CP3, Load Condition C, Run 3
% Load 0 20 40 60 80 100 Pressure 3.42 3.41 3.39 3.38 3.43 3.43
Hoop-1 4014.7 4033.7 4011.1 4066.3 4020.3 4025.4 Hoop-2 4015.7 4037.3 4033.5 4016.5 4018.2 4006.9 Hoop-3 4080.2 4044.2 3989.0 4049.3 4057.8 4039.4 Hoop-4 4029.9 4033.2 4072.6 4005.9 4004.3 4011.3 Hoop-5 4129.5 4023.4 4053.1 4033.7 4062.2 4042.0 Hoop-6 4018.2 4031.0 4022.6 4030.2 3993.6 4036.9 Hoop-7 4052.2 4027.1 4033.0 4034.2 4038.9 4040.8 Hoop-8 4179.3 4369.3 4339.6 4317.6 4332.0 4202.2 Hoop-9 4034.0 4031.5 4016.4 4008.4 4083.4 4215.6 Hoop-10 4015.3 4023.4 4031.7 4039.9 4016.8 4030.2 Hoop-11 4021.5 4039.6 4043.6 4022.3 4024.6 4037.2 Hoop-12 4015.2 4021.6 4052.8 4132.4 4045.6 4151.2 Hoop-13 4008.3 3989.9 4008.3 4044.4 4008.3 4014.2
B-51

Table B-31. CP3, Load Condition C, Run 3 (Continued)
% Load 0 20 40 60 80 100 Pressure 3.42 3.41 3.39 3.38 3.43 3.43
Hoop-14 4021.5 4039.7 4027.8 4035.0 4027.8 4040.5 Long-1 208.2 803.2 1788.0 2365.3 3501.3 4200.8 Long-2 347.4 802.9 1678.1 2337.9 3204.3 4239.3 Long-3 194.3 991.7 1819.7 2671.2 3315.7 4146.3 Long-4 95.9 898.1 1618.7 2516.8 3267.4 4308.9 Long-5 535.7 961.5 1879.8 2635.1 3171.3 4033.5 Long-6 421.6 905.7 1518.1 2796.4 3426.7 4332.9 Long-7 106.0 758.3 1781.5 2371.9 3398.7 4256.9 Long-8 112.4 1116.0 1944.5 2278.6 3460.8 4275.2 Radial-1R -33.7 -34.7 -34.7 -32.9 -31.0 -29.7 Radial-2R 321.0 132.1 386.6 363.2 285.5 350.6 Radial-3R -22.5 -21.7 -21.4 -16.0 -8.2 -3.6 Radial-4R 1191.5 657.7 1005.4 756.0 465.2 717.5 Radial-5R -39.1 -43.2 -41.8 -44.1 -38.6 -41.0 Radial-6R -14.0 -15.2 -11.8 -18.4 -12.3 -31.2 Radial-7R -76.5 -70.8 -55.5 -49.3 -18.4 -16.3 Radial-8R -87.6 -89.1 -88.9 -80.2 -70.3 -69.2 Radial-9R -44.3 -43.1 -33.9 -22.1 2.2 9.1 Radial-10R -67.3 -64.5 -58.3 -51.8 -32.4 -28.4 SG01 -541.3 -401.8 -205.2 -43.1 171.1 371.3 SG02 -474.6 -342.6 -159.4 -6.4 193.1 380.7 SG03 1044.4 990.0 912.1 851.3 782.7 707.6 SG04 1271.0 1207.3 1095.2 995.6 856.9 754.7 SG05 -683.7 -522.9 -303.0 -98.1 137.7 376.8 SG06 -540.7 -395.7 -201.6 -21.5 184.6 395.8 SG07 959.0 890.7 807.4 736.5 681.5 592.4 SG08 1444.1 1371.4 1245.5 1104.9 948.6 816.0 SG09 -608.2 -462.5 -271.1 -79.2 114.6 332.9 SG10 -452.8 -319.7 -146.4 25.6 200.9 396.9 SG11 1059.7 998.9 921.7 845.4 787.1 701.0 SG12 1296.6 1234.7 1139.7 1022.5 921.4 810.6 SG13 -479.4 -341.1 -160.3 11.8 201.2 394.4 SG14 -586.0 -431.0 -226.0 -28.8 182.9 403.3 SG15 957.8 899.5 824.2 756.6 699.0 621.2 SG16 13675.2 13580.6 13446.0 13294.5 13155.0 13006.0 SG17 -596.6 -444.1 -232.6 -42.0 171.7 377.3 SG18 -476.0 -332.1 -141.1 42.1 244.2 441.5 SG19 948.2 893.8 831.1 768.1 719.6 656.8 SG20 1249.3 1202.2 1123.0 1027.5 942.7 860.8 SG21 -361.6 -218.9 -19.1 193.0 394.7 603.9 SG22 -510.8 -373.8 -182.9 18.8 211.8 412.9 SG23 1032.1 973.3 889.4 800.9 735.8 649.6 SG24 1439.1 1376.9 1268.0 1134.4 1019.1 905.9 SG25 -475.8 12.2 614.5 1146.6 1787.8 2400.5 SG26 -542.0 -297.5 11.9 289.9 627.7 945.4
B-52

Table B-31. CP3, Load Condition C, Run 3 (Continued)
% Load 0 20 40 60 80 100 Pressure 3.42 3.41 3.39 3.38 3.43 3.43
SG27 -533.3 -310.6 -29.8 218.9 524.8 810.7 SG28 -675.6 -452.3 -160.4 109.1 429.3 721.6 SG29 -647.3 -368.2 -3.1 326.7 731.7 1097.1 SG30 -942.1 -452.2 192.6 790.8 1526.7 2178.9 SG31 -383.6 -209.5 18.2 229.4 473.9 710.5 SG32 1765.8 1990.0 2279.1 2544.1 2852.9 3152.6 SG33 -538.8 -169.5 303.5 731.9 1236.3 1723.4 SG34 734.6 635.0 528.9 420.9 351.0 247.6 SG35 1038.5 930.4 791.2 634.6 515.8 381.9 SG36 1087.5 1009.0 910.1 808.1 731.5 619.1 SG37 2519.4 2376.0 2165.4 1898.9 1674.5 1420.0 SG38 -397.7 -292.1 -157.5 -7.1 124.3 289.0 SG39 -334.1 -214.0 -63.1 98.3 243.7 418.1 SG40 -194.6 -104.7 12.0 150.7 263.8 407.4
Table B-32. CP4, Load Condition A, Run 1
% Load 0 20 40 60 80 100 Pressure 0.00 0.68 1.39 2.05 2.71 3.39
Hoop-1 10.7 809.4 1609.9 2428.1 3220.4 4024.1 Hoop-2 47.8 753.4 1648.1 2401.3 3182.7 4013.7 Hoop-3 146.1 809.9 1624.6 2405.5 3245.7 4087.3 Hoop-4 -25.5 811.0 1594.7 2398.3 3219.7 4020.3 Hoop-5 -8.8 756.2 1644.5 2419.5 3261.0 4041.6 Hoop-6 7.2 797.1 1617.2 2420.1 3233.6 4030.2 Hoop-7 51.1 807.0 1610.4 2415.1 3222.2 4030.7 Hoop-8 -10.7 789.2 1582.0 2416.3 3223.0 4022.4 Hoop-9 -16.4 794.1 1653.9 2422.6 3239.5 4074.1 Hoop-10 -14.2 798.6 1627.8 2423.6 3219.6 4028.5 Hoop-11 -16.0 798.4 1669.9 2379.2 3227.1 4018.9 Hoop-12 -18.1 922.7 1680.0 2576.7 3263.6 4025.7 Hoop-13 -10.0 796.0 1614.9 2413.9 3186.7 4058.1 Hoop-14 -24.6 789.4 1624.3 2409.9 3279.9 4037.2 Long-1 -69.0 -12.2 -49.7 45.7 29.8 37.7 Long-2 -79.6 -97.2 86.4 -41.9 -0.7 16.9 Long-3 -8.3 20.5 4.4 9.0 13.6 38.9 Long-4 122.9 150.5 164.8 181.6 190.0 219.9 Long-5 533.4 417.2 520.5 576.8 648.4 701.3 Long-6 108.0 164.7 222.6 262.8 320.7 386.9 Long-7 -10.7 2.5 21.7 34.9 39.7 38.5 Long-8 42.0 15.9 15.9 -0.7 30.1 15.9 Radial-1R -6.6 -9.1 -3.3 18.7 20.2 26.9 Radial-2R 274.2 341.6 -98.5 141.9 595.5 429.6 Radial-3R -18.7 -39.1 -46.6 -47.7 -51.6 -52.7 Radial-4R 342.9 37.8 121.4 -231.8 197.9 255.6
B-53

Table B-32. CP4, Load Condition A, Run 1 (Continued) % Load 0 20 40 60 80 100 Pressure 0.00 0.68 1.39 2.05 2.71 3.39
Radial-5R -29.7 -36.3 -32.8 -29.8 -25.1 -26.7 Radial-6R -92.9 -106.4 -96.0 -81.7 -89.0 -77.6 Radial-7R -25.3 -36.0 -35.8 -36.3 -37.1 -37.4 Radial-8R -16.1 -13.1 -10.8 -2.7 -1.2 15.9 Radial-9R -9.0 -12.1 -11.4 -10.8 -11.7 -12.4 Radial-10R -26.9 -27.9 -26.7 -26.9 -27.3 -29.4 SG01 23.7 -83.7 -194.4 -309.2 -410.5 -519.5 SG02 19.6 -86.0 -192.7 -301.9 -404.1 -507.5 SG03 29.2 218.6 429.5 638.5 830.4 1036.7 SG04 -83.9 175.6 401.0 603.0 822.5 1035.0 SG05 45.4 -82.1 -201.5 -323.3 -433.3 -548.2 SG06 35.2 -75.5 -182.8 -293.2 -397.5 -495.9 SG07 63.6 229.5 453.0 694.0 892.2 1117.7 SG08 -140.7 184.2 424.8 614.9 856.7 1068.1 SG09 37.4 -60.0 -155.7 -256.3 -344.1 -432.9 SG10 38.4 -59.1 -155.8 -258.2 -347.9 -438.7 SG11 37.9 223.8 432.8 644.7 837.7 1036.6 SG12 -117.4 142.5 364.5 557.8 768.4 974.5 SG13 29.1 -68.5 -181.3 -309.3 -411.9 -516.9 SG14 27.4 -63.7 -158.0 -260.1 -345.3 -434.1 SG15 50.3 242.1 464.6 694.6 895.9 1106.9 SG16 -116.6 121.4 339.4 542.4 748.3 956.9 SG17 -475.0 -581.4 -702.6 -841.9 -972.9 -1088.9 SG18 6.7 -68.8 -157.6 -261.9 -347.8 -431.4 SG19 -24.3 150.9 357.7 558.7 745.4 943.5 SG20 -98.4 139.0 365.9 583.7 808.1 1027.8 SG21 0.7 -104.8 -223.0 -350.5 -463.8 -581.2 SG22 -7.3 -100.9 -202.1 -309.3 -406.7 -505.9 SG23 78.4 290.3 525.7 761.6 978.6 1203.6 SG24 -127.1 112.1 346.6 564.4 794.3 1017.9 SG25 -29.3 -69.9 -176.9 -333.2 -429.6 -526.4 SG26 42.3 -23.5 -122.3 -248.7 -343.0 -432.8 SG27 10.3 -76.7 -190.4 -325.3 -433.1 -539.6 SG28 36.6 -63.7 -185.2 -329.9 -449.4 -561.9 SG29 62.5 -29.2 -139.8 -275.0 -384.9 -484.4 SG30 209.0 83.0 -63.0 -254.1 -402.0 -522.1 SG31 12.1 -93.5 -221.3 -359.2 -481.2 -596.8 SG32 -19.7 -102.5 -214.6 -342.4 -448.5 -549.6 SG33 -32.9 -72.9 -179.9 -329.2 -424.7 -519.4 SG34 16.0 189.4 374.2 563.1 737.1 918.8 SG35 -93.3 149.8 334.7 473.8 643.7 806.0 SG36 -393.4 -208.1 72.9 377.0 771.1 664.8 SG37 -190.7 422.9 877.9 1220.1 1653.6 2057.8 SG38 11.2 -55.4 -122.2 -192.6 -253.2 -313.7 SG39 37.7 -20.7 -83.0 -155.7 -218.7 -282.6 SG40 -4.2 -69.4 -118.2 -179.6 -233.2 -283.4
B-54

Table B-33. CP4, Load Condition A, Run 2
% Load 0 20 40 60 80 100 Pressure -0.03 0.69 1.36 2.03 2.73 3.40
Hoop-1 -14.7 812.0 1618.7 2420.5 3235.9 4056.0 Hoop-2 -62.8 749.0 1674.1 2468.7 3222.5 3993.2 Hoop-3 -1.4 833.6 1600.3 2419.5 3202.4 4075.6 Hoop-4 -8.0 802.6 1613.2 2423.9 3221.2 4028.5 Hoop-5 63.5 857.7 1525.3 2362.9 3237.2 4031.6 Hoop-6 -63.2 799.9 1592.9 2417.7 3229.4 4017.4 Hoop-7 -3.0 812.4 1613.7 2427.3 3214.9 4040.9 Hoop-8 1.8 794.5 1601.5 2422.2 3228.9 4029.2 Hoop-9 -37.8 754.2 1601.0 2409.7 3233.3 4075.4 Hoop-10 -4.5 832.9 1605.9 2421.9 3219.7 4032.8 Hoop-11 -0.9 835.1 1622.5 2435.1 3218.9 4055.5 Hoop-12 3.7 685.5 1601.0 2447.5 3252.1 4033.5 Hoop-13 -25.4 826.5 1592.9 2438.4 3224.5 4010.9 Hoop-14 -13.8 792.9 1607.0 2414.0 3234.9 4028.2 Long-1 53.8 106.0 152.5 216.1 192.3 227.5 Long-2 246.6 352.5 497.3 612.7 650.4 768.0 Long-3 -9.3 2.2 35.6 132.3 108.1 166.8 Long-4 301.7 240.5 361.6 409.6 328.1 347.2 Long-5 658.6 886.2 1062.5 1297.5 1431.4 1611.0 Long-6 30.3 0.7 72.8 141.4 83.5 166.2 Long-7 10.1 133.6 36.5 55.7 78.5 121.7 Long-8 31.1 46.5 89.3 115.4 47.7 78.6 Radial-1R -28.0 -26.7 -27.5 -26.7 -26.2 -26.2 Radial-2R 372.5 698.4 -45.8 341.0 153.1 250.0 Radial-3R -75.1 -69.8 -70.2 -68.4 -58.9 -61.1 Radial-4R 150.9 13.5 126.2 244.2 -3.2 -49.6 Radial-5R -37.6 -34.4 -34.7 -29.4 -30.5 -31.2 Radial-6R -234.4 -214.5 -214.8 -204.9 -170.1 -158.3 Radial-7R -72.8 -72.2 -71.8 -73.4 -69.2 -66.5 Radial-8R -36.3 -31.2 -29.8 -27.5 -22.3 -18.4 Radial-9R -18.3 -16.3 -19.4 -16.8 -16.8 -14.4 Radial-10R -51.7 -38.3 -37.7 -35.8 -31.5 -30.4 SG01 -25.9 -100.9 -195.5 -282.1 -413.8 -516.5 SG02 -3.3 -92.8 -189.1 -278.1 -406.7 -504.8 SG03 -88.2 170.0 394.8 609.7 871.5 1075.2 SG04 56.1 236.2 435.8 624.2 792.0 999.7 SG05 -60.0 -130.2 -222.9 -307.8 -434.4 -538.8 SG06 -27.3 -102.6 -189.0 -269.6 -386.0 -479.4 SG07 -180.6 111.0 373.0 627.9 973.1 1193.8 SG08 178.9 346.9 528.7 692.4 783.3 989.8 SG09 -6.5 -76.1 -148.7 -219.8 -331.3 -408.8 SG10 12.8 -66.6 -144.9 -221.1 -335.6 -417.8 SG11 -86.8 153.7 373.0 588.6 853.8 1050.5 SG12 65.3 265.3 452.6 631.4 793.4 986.7 SG13 -9.6 -89.9 -168.2 -254.2 -391.4 -485.8
B-55

Table B-33. CP4, Load Condition A, Run 2 (Continued)
% Load 0 20 40 60 80 100 Pressure -0.03 0.69 1.36 2.03 2.73 3.40
SG14 3.4 -67.7 -137.5 -208.0 -318.9 -398.8 SG15 -102.2 155.4 386.5 615.3 901.9 1111.4 SG16 80.9 269.0 444.3 622.1 791.1 986.8 SG17 325.1 257.1 182.2 99.1 -29.6 -136.0 SG18 4.9 -60.3 -121.8 -188.3 -292.8 -372.7 SG19 -107.6 156.6 377.8 596.0 854.4 1047.1 SG20 77.8 279.7 466.7 660.6 840.4 1052.2 SG21 -2.4 -94.5 -182.5 -272.4 -403.7 -509.9 SG22 12.8 -75.2 -155.2 -234.1 -347.1 -437.9 SG23 -97.0 187.1 437.5 678.7 969.8 1194.9 SG24 59.6 260.0 449.2 643.9 828.2 1043.7 SG25 74.1 36.2 -18.9 -85.7 -304.5 -394.0 SG26 35.2 -16.4 -76.3 -143.6 -295.5 -385.4 SG27 5.2 -65.3 -141.2 -223.6 -374.9 -475.2 SG28 -95.0 -125.8 -177.1 -243.5 -373.1 -474.9 SG29 -138.4 -129.1 -150.7 -190.6 -295.5 -382.2 SG30 -338.5 -208.6 -153.6 -137.9 -231.7 -326.6 SG31 -6.1 -89.9 -181.9 -274.6 -433.8 -544.1 SG32 8.0 -58.7 -134.3 -212.8 -374.2 -469.3 SG33 69.2 28.2 -28.4 -92.5 -318.4 -403.8 SG34 -99.3 120.3 322.4 513.3 752.2 927.3 SG35 16.0 186.5 355.9 497.0 612.9 771.3 SG36 -70.4 185.7 425.1 646.6 903.4 1108.5 SG37 96.0 514.5 930.9 1277.4 1530.5 1919.6 SG38 59.0 -9.1 -63.2 -121.6 -210.1 -260.5 SG39 69.9 2.4 -50.8 -110.7 -192.9 -250.1 SG40 48.6 -19.5 -67.0 -117.3 -176.9 -222.4
Table B-34. CP4, Load Condition A, Run 3
% Load 0 20 40 60 80 100 Pressure 0.00 0.69 1.38 2.03 2.73 3.38
Hoop-1 -8.1 828.5 1600.8 2412.0 3214.0 4034.8 Hoop-2 47.0 887.9 1636.7 2422.2 3253.1 4050.3 Hoop-3 27.2 804.9 1595.9 2430.3 3229.1 4041.1 Hoop-4 26.1 799.1 1572.6 2374.1 3222.6 4023.7 Hoop-5 21.9 876.7 1617.6 2459.8 3235.2 3990.3 Hoop-6 -9.8 804.9 1594.9 2414.1 3239.1 4029.5 Hoop-7 -15.3 803.5 1610.5 2414.8 3219.8 4039.5 Hoop-8 22.7 766.8 1608.4 2421.9 3221.7 4029.2 Hoop-9 -27.9 836.9 1627.5 2414.4 3219.7 4034.1 Hoop-10 5.4 814.7 1614.2 2416.7 3231.0 4042.7 Hoop-11 -6.0 891.0 1625.9 2402.7 3218.6 4052.1 Hoop-12 13.7 628.4 1481.7 2462.4 3295.4 4033.5 Hoop-13 -25.4 813.4 1632.5 2425.0 3230.8 4017.5
B-56

Table B-34. CP4, Load Condition A, Run 3 (Continued)
% Load 0 20 40 60 80 100 Pressure 0.00 0.69 1.38 2.03 2.73 3.38
Hoop-14 -6.8 807.1 1607.0 2413.7 3213.6 4021.2 Long-1 61.7 180.9 239.9 275.1 287.6 317.1 Long-2 449.1 523.2 611.4 718.5 775.1 860.9 Long-3 1.0 3.3 9.1 20.6 36.7 89.7 Long-4 114.8 187.8 250.1 313.6 360.4 389.1 Long-5 618.6 914.4 1151.5 1303.1 1505.3 1663.6 Long-6 16.1 -37.1 16.1 51.6 102.4 153.2 Long-7 -12.7 157.6 -16.3 146.8 -11.5 1.7 Long-8 185.5 109.4 45.3 58.4 84.5 115.4 Radial-1R -27.5 -27.7 -26.3 -26.4 -24.8 -25.4 Radial-2R 102.0 10.1 269.1 146.7 149.0 174.8 Radial-3R -78.7 -73.9 -71.1 -70.8 -62.1 -63.1 Radial-4R -272.2 91.1 104.6 388.1 38.8 15.7 Radial-5R -37.9 -32.4 -31.0 -30.6 -27.9 -28.8 Radial-6R -240.1 -228.6 -217.7 -209.6 -194.0 -172.7 Radial-7R -80.9 -78.8 -79.7 -78.8 -74.6 -72.3 Radial-8R -36.1 -33.2 -30.2 -28.1 -21.9 -19.7 Radial-9R -20.2 -19.4 -17.9 -17.6 -16.6 -17.2 Radial-10R -55.7 -46.6 -41.9 -39.5 -35.3 -37.1 SG01 -34.6 -100.2 -197.9 -285.6 -413.8 -515.1 SG02 -6.3 -90.8 -194.0 -284.3 -407.7 -505.1 SG03 -110.7 154.9 398.8 609.2 864.6 1062.9 SG04 71.8 232.0 419.3 608.4 799.8 986.6 SG05 -85.6 -134.4 -221.4 -310.8 -434.5 -538.1 SG06 -44.5 -105.7 -191.2 -276.5 -388.7 -482.2 SG07 -222.4 87.8 385.9 631.6 952.0 1178.8 SG08 223.4 349.3 495.3 671.4 806.6 977.6 SG09 -27.1 -80.0 -152.8 -227.4 -327.6 -408.6 SG10 -2.4 -68.8 -151.0 -230.8 -335.7 -419.6 SG11 -107.6 137.1 378.0 589.8 843.5 1038.6 SG12 88.0 261.9 435.5 622.7 798.0 972.8 SG13 -27.8 -85.2 -168.8 -257.3 -384.2 -481.5 SG14 -12.8 -66.8 -140.1 -215.3 -318.1 -397.8 SG15 -124.7 133.4 390.0 615.5 890.0 1097.7 SG16 102.4 260.5 424.3 607.7 790.0 968.1 SG17 352.2 307.2 224.1 138.0 28.7 -81.3 SG18 -11.9 -54.9 -120.3 -192.1 -292.0 -369.8 SG19 -147.8 113.5 360.5 584.5 837.2 1035.5 SG20 101.7 274.5 447.9 643.6 839.1 1031.6 SG21 -30.6 -94.7 -175.9 -278.8 -398.5 -502.1 SG22 -8.7 -74.7 -153.0 -243.0 -347.2 -434.4 SG23 -117.4 164.7 437.1 679.7 960.3 1179.3 SG24 95.7 258.0 425.1 626.3 821.5 1018.9 SG25 63.5 61.8 -10.6 -95.2 -278.7 -385.9 SG26 44.9 17.2 -53.1 -133.9 -270.8 -363.6
B-57

Table B-34. CP4, Load Condition A, Run 3 (Continued)
% Load 0 20 40 60 80 100 Pressure 0.00 0.69 1.38 2.03 2.73 3.38
SG27 -11.6 -54.5 -134.1 -226.6 -365.2 -468.0 SG28 -139.0 -117.1 -157.1 -236.8 -361.3 -464.8 SG29 -194.0 -120.5 -124.2 -181.1 -282.7 -371.0 SG30 -460.7 -195.7 -89.2 -115.0 -206.9 -303.4 SG31 -20.4 -79.0 -171.6 -277.0 -423.7 -536.8 SG32 -3.7 -44.8 -125.5 -217.6 -360.7 -462.5 SG33 62.7 56.7 -16.7 -102.8 -286.6 -393.6 SG34 -113.4 109.9 325.1 511.8 739.9 914.9 SG35 33.5 189.6 339.1 496.1 627.5 761.4 SG36 -76.1 182.1 433.4 653.1 905.0 1106.1 SG37 143.8 518.3 884.1 1262.8 1567.7 1897.3 SG38 57.2 -10.2 -72.8 -131.2 -201.4 -255.6 SG39 59.6 -6.7 -67.9 -128.1 -197.1 -254.3 SG40 49.0 -24.5 -77.6 -128.1 -175.6 -221.1
Table B-35. CP4, Load Condition B, Run 1
% Load 0 20 40 60 80 100 Pressure -0.06 0.03 -0.03 0.00 0.01 0.01
Hoop-1 -14.2 -12.6 208.2 -1.0 5.7 25.6 Hoop-2 1.5 23.8 30.6 39.2 63.3 46.1 Hoop-3 -1.6 22.2 52.4 12.7 -12.7 -31.7 Hoop-4 0.1 -11.9 -6.7 -6.7 10.3 22.3 Hoop-5 24.2 -15.7 3.4 -17.5 24.2 25.9 Hoop-6 30.6 -9.5 0.5 -1.1 -16.2 3.9 Hoop-7 -24.5 52.9 7.2 3.7 3.7 66.9 Hoop-8 -17.7 31.0 17.1 -3.8 10.1 3.2 Hoop-9 18.3 -6.5 1.8 -11.4 24.9 13.4 Hoop-10 -10.9 -5.9 -0.9 0.7 4.0 14.0 Hoop-11 34.7 -7.6 -9.3 -14.3 0.9 24.5 Hoop-12 23.9 -18.1 20.5 13.8 -6.3 -19.8 Hoop-13 -3.4 29.6 29.6 29.6 82.4 122.1 Hoop-14 73.6 -31.7 108.7 171.8 10.4 -10.6 Long-1 11.6 781.2 1689.5 2394.9 3276.2 4406.3 Long-2 178.1 759.4 1872.8 2745.2 3331.7 4150.3 Long-3 -53.2 1089.4 1499.4 2638.0 3238.0 4253.7 Long-4 80.9 743.3 1794.2 2537.4 3392.0 4328.4 Long-5 386.6 964.2 1634.9 2571.3 3424.3 4128.4 Long-6 93.8 707.0 1576.8 2575.8 3134.0 4261.9 Long-7 -45.4 807.0 1769.0 2516.5 3559.1 4225.3 Long-8 19.5 1300.7 1921.0 2763.4 3098.9 4221.9 Radial-1R -19.1 23.3 -26.1 23.3 45.3 52.4 Radial-2R 189.5 486.6 345.4 485.8 351.2 179.9 Radial-3R -46.4 21.6 -0.9 44.1 61.0 74.9 Radial-4R 587.7 163.4 -41.5 145.1 687.5 194.1
B-58

Table B-35. CP4, Load Condition B, Run 1 (Continued) % Load 0 20 40 60 80 100 Pressure -0.06 0.03 -0.03 0.00 0.01 0.01
Radial-5R -37.2 -29.3 -31.0 -26.5 -24.7 -23.1 Radial-6R -108.9 -83.6 -96.1 -80.9 -74.8 -67.5 Radial-7R -34.7 2.6 -5.0 24.8 50.0 79.5 Radial-8R -24.7 -6.0 -21.5 -7.7 6.2 28.9 Radial-9R -13.5 -5.8 -4.3 -0.1 12.3 47.3 Radial-10R -30.3 -13.2 -18.7 26.9 51.9 84.4 SG01 11.1 239.3 439.4 655.6 828.0 1065.3 SG02 12.4 220.6 411.3 615.3 779.6 1003.5 SG03 8.8 -34.1 -128.3 -195.7 -255.5 -340.4 SG04 -36.0 -204.0 -299.1 -432.2 -534.5 -666.1 SG05 16.7 235.4 451.0 687.8 878.4 1125.2 SG06 16.4 207.1 397.4 609.8 780.7 1003.1 SG07 4.2 22.0 -94.8 -140.2 -194.6 -265.5 SG08 -35.6 -265.4 -365.8 -555.4 -693.3 -868.4 SG09 19.1 184.9 368.6 579.2 747.9 958.6 SG10 28.2 186.1 365.4 567.6 730.6 936.1 SG11 17.0 -5.9 -96.6 -158.5 -220.9 -294.6 SG12 -60.4 -197.9 -292.7 -434.8 -541.4 -678.8 SG13 20.7 204.5 403.7 623.7 798.6 1022.0 SG14 19.8 185.1 364.2 557.5 714.9 916.1 SG15 24.0 -6.3 -113.6 -181.1 -250.0 -335.8 SG16 -71.3 -209.1 -299.0 -435.8 -537.4 -666.7 SG17 -455.6 -270.0 -63.4 141.7 299.7 528.7 SG18 11.8 178.1 360.1 557.1 717.2 924.4 SG19 -50.1 -53.0 -139.1 -182.2 -225.3 -285.6 SG20 -69.0 -180.6 -233.6 -345.1 -422.2 -519.3 SG21 8.1 207.7 408.8 630.1 814.4 1057.7 SG22 0.7 178.8 354.0 556.8 722.1 938.1 SG23 54.3 14.1 -102.1 -171.3 -246.3 -343.8 SG24 -106.0 -271.8 -330.9 -501.5 -615.9 -762.4 SG25 -5.1 390.7 870.7 1348.2 1744.2 2269.9 SG26 43.8 303.4 594.4 895.8 1139.9 1462.2 SG27 17.0 248.1 503.2 776.0 996.8 1286.9 SG28 25.8 329.2 613.9 943.1 1199.2 1539.5 SG29 40.9 407.4 732.0 1130.6 1429.9 1830.6 SG30 128.5 903.1 1541.6 2351.6 2975.8 3818.7 SG31 13.6 265.8 521.7 802.7 1026.4 1325.6 SG32 -14.0 261.0 552.4 860.4 1109.6 1443.8 SG33 -11.1 430.2 934.2 1440.3 1856.8 2417.6 SG34 -6.0 -42.4 -153.3 -255.2 -328.0 -436.0 SG35 -40.1 -155.3 -250.7 -385.5 -464.3 -598.8 SG36 -555.6 -466.6 -546.7 -598.7 -720.8 -741.4 SG37 -45.5 -331.7 -544.5 -855.3 -1079.6 -1380.2 SG38 -0.9 107.1 250.2 411.2 536.8 688.8 SG39 40.6 143.0 282.0 457.3 597.9 766.7 SG40 -27.2 32.7 145.1 278.2 380.1 500.0
B-59

Table B-36. CP4, Load Condition B, Run 2
% Load 0 20 40 60 80 100 Pressure 0.05 -0.03 0.03 -0.01 -0.03 0.04
Hoop-1 -4.7 93.2 16.9 11.9 6.9 23.5 Hoop-2 -40.5 -61.1 -14.7 -45.6 -28.5 11.0 Hoop-3 -1.4 -10.9 3.4 25.6 3.4 11.3 Hoop-4 48.3 -21.7 -6.3 5.6 34.6 58.5 Hoop-5 -33.6 34.0 63.5 -71.8 37.5 -45.8 Hoop-6 -6.4 -23.1 -6.4 -29.8 -11.4 28.6 Hoop-7 2.3 16.3 -17.0 -15.3 -1.2 -3.0 Hoop-8 -5.1 29.6 -32.9 50.5 1.8 1.8 Hoop-9 11.8 -1.4 0.2 -9.7 1.9 -21.3 Hoop-10 0.5 17.0 -2.9 -6.2 3.8 5.4 Hoop-11 70.0 32.9 10.9 43.0 2.5 43.0 Hoop-12 -40.0 -14.8 33.9 -46.7 65.8 -78.7 Hoop-13 1.0 67.0 7.6 1.0 20.8 -25.4 Hoop-14 -20.8 -13.8 0.2 -34.9 0.2 49.3 Long-1 104.8 733.7 1686.4 2409.1 3431.7 4279.4 Long-2 237.2 969.1 1777.8 2525.8 3376.4 4035.2 Long-3 73.5 849.2 1617.1 2508.6 3361.2 4392.1 Long-4 438.2 807.2 1956.4 2646.0 3564.7 4413.8 Long-5 788.8 788.7 1757.8 2397.4 3334.2 4462.5 Long-6 30.3 1112.6 1818.3 2322.5 3184.8 4372.2 Long-7 -4.3 672.0 1500.9 2363.9 3537.7 4352.9 Long-8 78.6 773.3 2115.7 3147.3 3637.7 4205.1 Radial-1R -28.7 -28.9 -26.9 -28.4 -28.1 -26.7 Radial-2R 231.0 345.5 255.0 357.9 292.6 53.4 Radial-3R -79.4 -75.8 -68.1 -70.8 -64.8 -48.0 Radial-4R 23.7 30.7 -98.6 146.6 343.4 -228.0 Radial-5R -39.4 -39.1 -35.4 -36.7 -36.8 -34.8 Radial-6R -237.5 -234.4 -227.4 -229.3 -232.2 -227.6 Radial-7R -73.6 -70.4 -66.6 -68.7 -66.4 -66.7 Radial-8R -36.4 -36.0 -33.3 -33.2 -33.3 -30.8 Radial-9R -17.5 -17.5 -16.2 -17.2 -18.3 -15.1 Radial-10R -53.5 -51.3 -41.1 -40.8 -39.7 -36.0 SG01 -35.7 128.0 380.9 574.7 792.5 1025.2 SG02 -9.4 148.1 376.5 561.1 769.3 981.2 SG03 -86.4 -156.5 -217.0 -297.0 -386.1 -446.3 SG04 67.9 -12.9 -170.2 -280.7 -402.2 -538.7 SG05 -67.4 92.2 358.4 545.7 778.2 1052.8 SG06 -33.1 112.7 337.1 502.5 713.1 952.1 SG07 -177.2 -261.8 -293.3 -362.7 -457.2 -499.3 SG08 185.4 112.4 -90.7 -219.9 -365.5 -581.3 SG09 -2.6 134.3 339.4 488.2 688.6 935.6 SG10 14.0 148.2 345.7 493.7 690.6 922.9 SG11 -87.8 -157.0 -202.4 -263.9 -349.2 -417.1 SG12 59.6 0.4 -135.1 -238.6 -355.8 -527.4 SG13 -4.2 141.5 362.9 525.9 735.3 984.7
B-60

Table B-36. CP4, Load Condition B, Run 2 (Continued)
% Load 0 20 40 60 80 100 Pressure 0.05 -0.03 0.03 -0.01 -0.03 0.04
SG14 5.0 134.7 335.3 485.0 673.2 892.5 SG15 -103.1 -180.6 -234.6 -302.7 -397.8 -468.2 SG16 73.9 10.6 -123.5 -222.4 -336.2 -495.0 SG17 302.7 450.2 688.3 850.8 1055.9 1295.4 SG18 6.3 138.2 343.8 492.6 683.9 900.3 SG19 -107.6 -162.2 -188.0 -234.0 -300.0 -334.5 SG20 72.0 27.0 -77.1 -152.7 -239.6 -358.8 SG21 3.2 143.9 375.4 553.0 763.1 1000.0 SG22 15.9 142.9 345.6 504.3 695.4 904.3 SG23 -97.6 -171.9 -232.3 -308.4 -406.5 -473.4 SG24 61.1 -7.5 -157.0 -266.5 -386.6 -546.8 SG25 60.7 415.9 912.9 1295.0 1766.6 2290.0 SG26 21.0 239.5 556.0 795.4 1086.5 1411.2 SG27 1.5 191.4 472.5 683.9 945.2 1242.4 SG28 -98.8 119.2 478.2 726.7 1024.7 1397.9 SG29 -142.8 107.1 534.9 825.6 1179.1 1621.7 SG30 -350.7 141.2 1033.3 1628.2 2327.2 3247.9 SG31 -14.0 188.8 480.7 709.6 973.6 1270.6 SG32 -0.2 227.2 549.9 805.6 1100.3 1428.7 SG33 55.1 441.5 972.8 1397.9 1894.0 2438.0 SG34 -98.8 -205.0 -275.8 -342.6 -447.7 -554.9 SG35 13.1 -35.6 -177.4 -265.8 -368.6 -526.8 SG36 -71.2 -146.2 -210.9 -283.8 -386.9 -483.4 SG37 96.4 8.8 -305.2 -530.1 -780.1 -1158.4 SG38 71.4 161.5 298.5 410.0 566.7 745.2 SG39 83.3 184.1 334.7 457.5 623.6 812.7 SG40 57.6 120.6 226.8 315.7 444.7 580.1
Table B-37. CP4, Load Condition B, Run 3
% Load 0 20 40 60 80 100 Pressure -0.03 0.02 -0.04 0.04 -0.04 0.04
Hoop-1 -16.4 -4.7 -13.0 -9.7 -18.0 -3.1 Hoop-2 115.7 -16.5 -124.6 -1.0 7.6 -42.2 Hoop-3 -7.7 12.9 120.8 -6.2 -30.0 -17.3 Hoop-4 24.4 15.8 92.6 -50.7 15.8 0.5 Hoop-5 6.3 75.6 -4.2 6.3 -28.4 -31.9 Hoop-6 -6.4 18.6 20.3 105.4 150.5 82.1 Hoop-7 -6.5 -3.0 -57.5 -1.2 -1.2 178.0 Hoop-8 29.6 -19.0 -26.0 -39.9 22.7 50.5 Hoop-9 -27.9 79.6 91.2 -3.1 -37.8 25.0 Hoop-10 -21.1 5.4 18.7 -6.2 35.3 8.7 Hoop-11 -38.1 44.7 14.3 59.9 -12.7 12.6 Hoop-12 57.4 -6.4 -113.9 -55.1 -24.9 97.7 Hoop-13 -18.8 7.6 27.4 1.0 1.0 -5.6
B-61

Table B-37. CP4, Load Condition B, Run 3 (Continued)
% Load 0 20 40 60 80 100 Pressure -0.03 0.02 -0.04 0.04 -0.04 0.04
Hoop-14 0.2 -13.8 -48.9 -6.8 14.2 0.2 Long-1 17.4 1028.9 1603.3 2377.5 3343.6 4324.4 Long-2 440.8 757.3 1869.4 2714.4 3198.1 4020.7 Long-3 11.4 1077.1 1809.1 2642.3 3572.2 4268.5 Long-4 -31.4 767.7 1834.0 2216.2 3196.2 4437.4 Long-5 558.7 674.9 1916.1 2731.1 3476.8 4393.9 Long-6 111.8 1102.1 1521.6 2347.5 3422.9 4202.8 Long-7 24.5 1183.0 1588.3 2349.8 3346.3 4285.3 Long-8 -20.0 497.8 2141.6 2244.9 3323.4 4384.0 Radial-1R -27.7 -27.2 -27.7 -27.5 -27.3 -26.5 Radial-2R 105.4 319.9 242.5 327.8 186.5 462.3 Radial-3R -75.5 -74.4 -79.4 -70.4 -76.6 -66.5 Radial-4R -140.1 108.4 -225.8 86.3 258.7 334.7 Radial-5R -37.0 -38.9 -36.8 -36.0 -37.5 -36.8 Radial-6R -239.8 -238.1 -236.3 -230.2 -236.9 -231.3 Radial-7R -82.0 -87.7 -89.1 -81.7 -85.4 -79.7 Radial-8R -35.7 -34.8 -35.2 -33.9 -35.9 -32.4 Radial-9R -19.5 -18.7 -19.1 -19.0 -19.1 -17.4 Radial-10R -51.5 -52.7 -56.5 -43.8 -48.8 -36.8 SG01 -55.4 150.9 334.2 532.6 761.7 1012.8 SG02 -22.9 165.3 350.5 520.6 744.8 976.4 SG03 -110.4 -154.2 -255.7 -291.1 -408.3 -474.0 SG04 85.3 -42.6 -128.2 -261.8 -368.0 -516.4 SG05 -100.8 124.3 293.4 527.3 745.2 1013.7 SG06 -57.0 133.8 293.2 488.5 690.0 923.9 SG07 -231.3 -255.1 -375.1 -372.3 -510.4 -550.4 SG08 246.8 68.1 7.8 -215.6 -312.8 -511.3 SG09 -23.7 150.0 309.5 492.9 679.4 906.7 SG10 -3.6 160.2 325.9 496.8 684.4 899.8 SG11 -118.6 -157.2 -250.0 -278.3 -381.6 -442.3 SG12 96.7 -11.5 -93.0 -247.8 -344.3 -491.2 SG13 -26.4 158.1 329.6 527.5 715.4 962.8 SG14 -16.9 147.0 310.0 478.5 654.2 869.8 SG15 -137.6 -180.6 -283.2 -316.1 -426.8 -495.5 SG16 107.6 -7.5 -77.9 -233.5 -319.3 -471.0 SG17 322.2 513.2 685.4 891.8 1077.8 1332.1 SG18 -15.8 152.8 313.2 490.9 660.1 881.1 SG19 -162.2 -179.4 -251.2 -265.6 -354.7 -383.3 SG20 106.3 12.8 -30.8 -165.7 -220.7 -342.2 SG21 -40.1 158.1 351.4 538.6 725.2 976.7 SG22 -19.9 151.2 328.7 489.7 665.5 883.2 SG23 -123.4 -171.3 -284.5 -316.6 -428.6 -497.0 SG24 116.4 -26.9 -108.3 -262.7 -357.4 -523.9 SG25 41.6 459.1 872.7 1285.2 1728.5 2272.4 SG26 22.5 287.4 539.6 805.0 1076.2 1414.2
B-62

Table B-37. CP4, Load Condition B, Run 3 (Continued)
% Load 0 20 40 60 80 100 Pressure -0.03 0.02 -0.04 0.04 -0.04 0.04
SG27 -22.4 215.3 434.7 679.7 915.7 1222.2 SG28 -153.5 158.0 382.1 719.2 965.8 1353.0 SG29 -215.0 156.7 410.0 814.7 1094.5 1562.9 SG30 -517.1 256.6 752.3 1608.0 2156.7 3113.1 SG31 -39.1 213.0 443.6 689.8 942.3 1253.4 SG32 -24.3 253.4 515.3 783.1 1068.2 1414.7 SG33 29.5 484.3 935.2 1366.2 1854.2 2430.4 SG34 -125.3 -198.0 -295.8 -362.8 -492.2 -557.7 SG35 54.2 -36.4 -119.2 -267.6 -370.4 -473.3 SG36 -86.8 -139.2 -241.5 -294.4 -414.9 -481.7 SG37 195.7 -9.2 -198.4 -544.3 -763.7 -1032.1 SG38 66.4 159.2 325.8 425.2 584.4 742.6 SG39 70.6 178.4 354.6 476.6 639.8 810.2 SG40 49.9 103.2 265.0 333.2 469.5 582.0
Table B-38. CP4, Load Condition C, Run 1
% Load 0 20 40 60 80 100 Pressure 0.02 0.68 1.36 2.05 2.68 3.41
Hoop-1 -12.6 811.0 1619.8 2429.7 3199.1 4001.2 Hoop-2 -41.5 777.5 1677.2 2427.1 3239.7 4010.6 Hoop-3 135.0 824.2 1611.9 2448.4 3204.8 4027.4 Hoop-4 -11.9 790.5 1639.1 2418.8 3180.8 4037.8 Hoop-5 -45.2 810.0 1608.1 2381.3 3315.1 4029.9 Hoop-6 94.1 810.5 1620.6 2415.1 3213.9 4039.0 Hoop-7 1.9 810.5 1601.6 2401.0 3243.6 4038.2 Hoop-8 -3.8 816.8 1644.6 2410.1 3237.9 4036.7 Hoop-9 61.3 856.7 1675.4 2448.1 3255.3 4015.0 Hoop-10 12.3 866.4 1727.3 2421.0 3232.2 4024.0 Hoop-11 -78.5 865.7 1718.9 2405.2 3260.2 4000.8 Hoop-12 92.7 791.4 1572.5 2441.4 3214.1 4173.8 Hoop-13 9.8 822.2 1595.1 2454.3 3214.1 3985.9 Hoop-14 -52.7 796.2 1617.3 2424.7 3231.8 4023.6 Long-1 -29.2 708.7 1546.3 2421.0 3418.1 4138.9 Long-2 -56.0 764.2 1747.9 2590.0 3552.9 4227.2 Long-3 67.7 927.4 1633.9 2464.3 3470.5 4363.5 Long-4 116.9 945.9 1657.4 2403.3 3269.9 4068.9 Long-5 241.0 852.8 1755.7 2794.5 3247.0 4090.0 Long-6 125.7 619.7 1453.8 2279.2 3364.4 4349.8 Long-7 -87.4 936.7 1511.0 2400.2 3267.7 3960.8 Long-8 112.1 1048.0 1467.1 2717.3 3499.1 3986.0 Radial-1R 33.5 9.8 38.5 48.4 57.8 104.4 Radial-2R 446.5 362.7 544.7 626.7 827.4 711.6 Radial-3R -9.8 -14.0 -14.8 -8.5 2.5 34.5 Radial-4R 43.2 287.4 235.1 -130.4 662.2 -23.2
B-63

Table B-38. CP4, Load Condition C, Run 1 (Continued) % Load 0 20 40 60 80 100 Pressure 0.02 0.68 1.36 2.05 2.68 3.41
Radial-5R -0.9 -10.7 -14.0 -10.3 -8.0 4.4 Radial-6R 59.2 43.7 49.5 67.9 73.0 99.4 Radial-7R 13.6 -2.5 -1.8 17.8 22.3 56.3 Radial-8R 78.0 72.3 78.5 91.7 88.6 136.9 Radial-9R 48.6 35.4 41.6 45.0 40.4 49.7 Radial-10R 42.9 42.6 47.1 50.9 44.4 58.3 SG01 26.6 117.9 160.0 295.7 382.1 470.1 SG02 26.7 107.6 147.5 272.6 355.7 432.8 SG03 31.4 151.1 299.6 410.9 534.2 678.9 SG04 -71.1 75.0 216.9 287.7 389.1 505.2 SG05 29.2 101.9 153.2 286.8 365.1 467.7 SG06 26.3 88.0 136.2 250.0 322.4 410.4 SG07 65.3 174.4 332.5 466.9 612.2 777.9 SG08 -105.7 74.5 206.2 274.2 363.5 442.8 SG09 12.6 75.2 143.9 250.6 317.4 417.5 SG10 27.4 83.0 144.5 243.5 310.4 398.5 SG11 40.9 171.2 312.6 442.3 579.1 723.9 SG12 -74.7 80.1 199.4 293.6 401.7 488.3 SG13 18.1 87.0 152.8 254.8 326.3 414.8 SG14 23.6 89.9 152.6 251.6 325.5 408.0 SG15 49.0 174.7 317.9 446.2 578.5 730.8 SG16 -82.7 56.4 171.5 271.7 379.5 476.4 SG17 -394.2 -311.2 -261.8 -203.4 -121.8 -54.4 SG18 15.9 94.4 167.5 269.4 356.8 443.3 SG19 -47.2 30.3 234.2 360.6 544.4 707.9 SG20 -79.4 95.7 243.6 388.6 529.6 666.7 SG21 15.8 93.1 166.9 251.4 344.6 432.8 SG22 11.5 81.6 150.8 232.1 322.0 404.5 SG23 67.4 198.5 348.7 491.9 621.1 776.0 SG24 -120.7 35.6 150.0 268.1 373.3 476.1 SG25 -34.6 319.4 609.4 990.8 1315.4 1654.8 SG26 36.3 212.9 360.3 560.9 730.7 907.8 SG27 11.9 140.3 250.2 405.4 532.4 666.3 SG28 33.2 187.2 321.9 510.6 658.6 828.1 SG29 55.0 260.2 446.3 696.4 895.8 1133.6 SG30 158.5 636.8 1092.8 1678.8 2166.4 2724.8 SG31 13.3 138.6 234.5 390.9 514.0 644.9 SG32 -16.2 159.8 295.6 497.4 663.1 837.0 SG33 -37.0 356.3 663.7 1079.7 1433.2 1803.6 SG34 25.5 130.3 221.4 307.1 398.4 490.4 SG35 -52.7 85.1 175.9 227.8 280.5 333.1 SG36 -532.4 -404.0 -184.9 -154.0 70.8 215.7 SG37 -88.8 262.4 514.7 664.4 864.5 1004.8 SG38 -23.9 30.5 112.1 196.2 257.7 333.9 SG39 26.2 68.5 147.2 234.7 307.8 384.4 SG40 -39.7 -7.7 61.5 127.5 180.8 231.1
B-64

Table B-39. CP4, Load Condition C, Run 2
% Load 0 20 40 60 80 100 Pressure 0.00 0.68 1.36 2.04 2.73 3.40
Hoop-1 -28.0 803.8 1673.7 2376.2 3205.7 4034.0 Hoop-2 12.7 762.8 1555.8 2417.7 3237.6 4018.6 Hoop-3 -9.3 827.3 1600.5 2413.6 3248.1 4019.6 Hoop-4 32.9 807.8 1639.0 2432.9 3219.1 4063.9 Hoop-5 49.6 726.0 1631.3 2420.6 3219.6 4015.5 Hoop-6 0.3 733.2 1609.8 2413.1 3222.4 4040.4 Hoop-7 9.3 1269.4 1619.1 2413.7 3223.3 4031.7 Hoop-8 -5.1 843.3 1650.2 2408.0 3347.2 4062.3 Hoop-9 59.8 808.8 1652.3 2502.1 3203.5 4001.1 Hoop-10 43.6 876.1 1615.9 2430.0 3204.8 4077.6 Hoop-11 32.9 762.6 1609.0 2411.2 3332.1 4025.2 Hoop-12 -19.9 774.5 1512.0 2485.9 3253.7 4038.6 Hoop-13 40.6 806.8 1619.3 2471.2 3217.9 4009.3 Hoop-14 56.3 814.1 1635.1 2413.7 3213.9 4026.6 Long-1 76.5 691.8 1869.0 2647.1 3457.5 4196.6 Long-2 531.4 1025.8 1792.9 2287.7 3484.4 4442.4 Long-3 2.2 665.2 1723.9 2335.5 3486.3 4333.4 Long-4 153.1 804.9 1553.6 2573.7 3213.3 4070.0 Long-5 451.7 901.6 1485.1 2479.1 3239.9 4309.8 Long-6 -56.0 605.8 1898.5 2632.8 3443.3 4321.4 Long-7 -16.3 669.8 1978.0 2818.0 3641.7 4134.6 Long-8 523.9 847.1 1277.0 2705.1 3680.1 4295.4 Radial-1R -28.7 -27.9 -27.7 -26.9 -27.3 -28.5 Radial-2R 196.7 100.8 229.7 649.5 362.4 386.8 Radial-3R -67.8 -64.8 -57.8 -59.2 -56.7 -54.3 Radial-4R 148.3 66.3 153.7 141.8 297.6 138.6 Radial-5R -34.9 -33.3 -34.0 -35.2 -35.3 -31.2 Radial-6R -205.7 -199.1 -190.0 -198.7 -197.6 -193.4 Radial-7R -50.9 -49.1 -44.0 -40.8 -59.0 -61.4 Radial-8R -31.4 -28.9 -25.4 -23.2 -18.1 -11.6 Radial-9R -13.6 -14.7 -10.0 -11.3 -10.1 -9.8 Radial-10R -39.5 -39.1 -24.2 -28.4 -23.8 -22.1 SG01 28.2 65.0 184.9 306.8 409.8 470.6 SG02 28.3 58.2 163.9 277.3 373.1 433.1 SG03 1.3 163.9 312.9 423.9 543.1 674.7 SG04 -30.5 111.7 176.9 276.1 378.1 509.5 SG05 11.3 49.4 174.5 280.8 375.4 448.8 SG06 12.0 47.9 152.9 243.8 327.2 396.5 SG07 -11.4 156.4 370.2 500.6 638.2 778.5 SG08 11.0 161.5 156.3 261.9 361.2 469.3 SG09 16.4 73.7 165.3 245.8 329.6 411.6 SG10 20.1 67.1 154.0 230.8 311.1 389.5 SG11 -2.1 140.8 316.2 452.7 584.5 713.3 SG12 14.1 153.3 228.5 343.8 454.6 552.1 SG13 26.3 82.1 156.7 231.7 319.5 396.2
B-65

Table B-39. CP4, Load Condition C, Run 2 (Continued)
% Load 0 20 40 60 80 100 Pressure 0.00 0.68 1.36 2.04 2.73 3.40
SG14 25.7 73.2 157.7 235.4 323.9 400.2 SG15 -10.9 139.7 324.3 460.9 588.7 718.6 SG16 12.6 136.1 220.3 339.9 448.9 553.0 SG17 355.9 397.8 476.4 536.2 635.8 714.5 SG18 36.9 89.1 177.9 256.7 357.3 442.4 SG19 -21.5 130.8 357.7 506.9 639.1 782.7 SG20 11.6 161.2 282.3 442.8 587.8 727.3 SG21 48.5 81.6 163.7 212.4 325.8 415.8 SG22 35.9 67.8 149.5 203.5 308.1 393.0 SG23 -6.8 177.2 365.3 521.9 646.4 777.2 SG24 -16.3 109.3 188.7 327.8 437.2 548.6 SG25 113.9 359.3 650.7 974.9 1340.3 1661.7 SG26 62.1 183.3 342.0 509.5 701.0 866.5 SG27 51.7 136.6 259.3 380.3 528.4 653.5 SG28 53.3 171.6 344.2 486.7 663.1 810.4 SG29 62.3 231.8 473.8 668.5 901.9 1106.9 SG30 131.7 556.6 1150.1 1624.3 2171.2 2647.7 SG31 53.3 123.3 247.1 372.1 514.6 632.0 SG32 60.7 168.0 326.2 496.1 684.3 844.9 SG33 115.0 375.9 696.0 1060.8 1454.2 1801.7 SG34 -2.1 101.7 201.2 291.3 383.7 460.3 SG35 -2.9 147.1 141.4 209.3 281.2 334.7 SG36 15.4 178.9 326.0 454.4 585.1 703.0 SG37 32.1 414.2 464.9 656.6 860.8 1020.7 SG38 3.0 60.4 129.5 194.7 274.1 357.4 SG39 43.0 97.9 176.0 246.1 326.2 413.3 SG40 -27.9 2.2 73.6 122.4 190.9 261.4
Table B-40. CP4, Load Condition C, Run 3
% Load 0 20 40 60 80 100 Pressure -0.03 0.67 1.35 2.05 2.71 3.40
Hoop-1 20.2 800.4 1580.6 2413.9 3259.1 4034.8 Hoop-2 -59.4 762.8 1584.9 2367.5 3226.0 4043.4 Hoop-3 1.8 857.5 1621.0 2430.6 3213.5 4007.7 Hoop-4 3.9 823.1 1550.1 2406.8 3202.4 4018.6 Hoop-5 80.8 824.8 1601.6 2425.4 3233.8 4000.7 Hoop-6 -13.1 816.7 1608.0 2417.7 3224.4 4019.5 Hoop-7 7.6 814.2 1617.2 2434.3 3234.2 4030.7 Hoop-8 -5.1 822.5 1573.7 2477.8 3270.7 4042.3 Hoop-9 -4.7 789.1 1563.0 2381.6 3254.8 4000.2 Hoop-10 5.4 864.6 1612.6 2400.4 3276.1 4027.0 Hoop-11 -34.7 919.8 1588.7 2403.0 3240.9 4010.8 Hoop-12 7.0 608.3 1678.2 2565.1 3231.9 3965.5 Hoop-13 -5.6 826.7 1659.0 2412.0 3257.5 4076.2
B-66

Table B-40. CP4, Load Condition C, Run 3 (Continued)
% Load 0 20 40 60 80 100 Pressure -0.03 0.67 1.35 2.05 2.71 3.40
Hoop-14 -13.8 807.1 1614.1 2421.0 3234.9 4027.4 Long-1 3.8 750.9 1835.1 2357.6 3206.6 4060.7 Long-2 383.1 692.8 1830.8 2793.8 3257.2 3996.7 Long-3 4.5 1010.6 1454.8 2371.2 3534.6 4397.2 Long-4 -5.0 946.4 1677.2 2699.5 3532.0 4299.2 Long-5 569.2 932.2 1719.0 2453.3 3177.7 4181.0 Long-6 -5.2 609.4 1494.5 2676.6 3430.3 4386.8 Long-7 -13.9 768.2 1684.4 2513.4 3591.3 4203.4 Long-8 21.5 1051.5 1488.5 2775.2 3813.1 4451.4 Radial-1R -26.4 -26.9 -26.9 -26.2 -27.2 -10.1 Radial-2R 249.4 174.8 272.0 289.1 260.2 388.5 Radial-3R -77.5 -76.5 -71.3 -65.5 -47.0 -42.7 Radial-4R 195.7 39.9 51.2 212.4 -26.9 87.4 Radial-5R -37.6 -34.7 -32.0 -32.3 -31.6 -30.5 Radial-6R -236.1 -222.2 -202.2 -198.7 -182.5 -173.5 Radial-7R -83.1 -85.9 -73.8 -64.8 -61.1 -48.0 Radial-8R -34.1 -32.2 -28.6 -25.2 -16.3 -12.0 Radial-9R -17.4 -15.9 -16.0 -14.0 -10.5 -8.7 Radial-10R -49.6 -46.9 -33.3 -25.9 -19.1 -17.6 SG01 -57.1 50.4 164.5 299.6 409.1 496.5 SG02 -23.4 53.5 147.0 268.6 368.4 449.4 SG03 -98.8 114.6 272.8 403.6 558.1 682.7 SG04 80.3 140.9 204.8 284.0 342.6 448.6 SG05 -102.3 12.3 147.0 276.3 385.5 482.3 SG06 -56.6 23.7 129.1 237.1 330.2 417.0 SG07 -208.9 51.7 274.1 453.7 673.5 811.3 SG08 233.1 259.7 251.1 292.3 285.7 374.8 SG09 -32.8 48.7 147.6 249.1 333.2 429.7 SG10 -8.2 54.4 139.8 233.4 309.5 399.5 SG11 -104.0 89.7 266.6 423.6 595.6 721.6 SG12 97.2 201.6 262.8 344.8 408.1 499.4 SG13 -33.8 54.1 149.6 243.9 320.7 406.8 SG14 -19.7 58.8 147.3 242.0 320.6 404.4 SG15 -121.0 81.4 265.8 426.0 605.1 734.9 SG16 105.8 191.4 251.9 337.1 402.4 501.5 SG17 315.5 409.8 511.7 607.5 695.8 773.6 SG18 -15.1 72.1 168.3 267.4 353.9 441.8 SG19 -153.6 50.3 291.6 452.5 639.1 785.6 SG20 100.3 218.6 316.9 442.6 539.5 676.0 SG21 -27.6 69.0 144.1 241.4 325.6 412.5 SG22 -11.6 64.1 131.0 222.4 307.2 391.3 SG23 -114.2 109.3 309.4 477.4 661.8 797.2 SG24 98.3 165.0 250.9 333.7 377.5 480.3 SG25 32.5 360.6 687.2 1034.4 1316.9 1644.3 SG26 15.0 193.1 372.7 556.8 710.8 880.7
B-67

Table B-40. CP4, Load Condition C, Run 3 (Continued)
% Load 0 20 40 60 80 100 Pressure -0.03 0.67 1.35 2.05 2.71 3.40
SG27 -22.6 115.1 257.6 403.2 555.2 662.1 SG28 -146.2 93.0 311.1 505.7 681.0 835.0 SG29 -202.4 124.9 420.6 684.7 929.0 1144.9 SG30 -485.3 300.0 1013.5 1645.4 2251.4 2747.5 SG31 -37.5 97.3 237.1 386.2 515.2 638.0 SG32 -24.3 150.4 327.0 519.5 682.1 846.2 SG33 22.7 377.0 730.3 1119.4 1443.3 1793.3 SG34 -110.4 46.6 168.9 264.3 401.7 477.3 SG35 51.3 157.8 176.7 203.9 253.7 301.0 SG36 -74.2 131.2 293.6 437.9 602.4 717.7 SG37 190.1 459.3 538.7 665.8 769.9 917.7 SG38 50.7 79.5 134.1 208.9 261.3 353.0 SG39 66.6 103.4 171.4 252.3 313.3 406.5 SG40 37.7 34.2 75.0 131.6 162.5 236.9
Table B-41. CP5, Load Condition A, Run 1
% Load 0 20 40 60 80 100 Pressure -0.03 0.70 1.39 2.04 2.74 3.41
Hoop-1 53.2 732.6 1681.1 2954.5 3981.4 4863.9 Hoop-2 -24.9 860.7 1542.0 2436.2 3277.5 4024.6 Hoop-3 628.4 831.7 1689.3 2436.2 3197.0 4039.4 Hoop-4 6.2 794.1 1660.9 2428.3 3212.5 4025.9 Hoop-5 10.1 792.4 1702.8 2401.7 3233.9 4035.0 Hoop-6 54.2 869.3 1703.5 2396.9 3361.3 4797.7 Hoop-7 22.5 913.6 1588.7 2435.5 3225.4 4034.6 Hoop-8 39.2 800.5 1710.9 2415.2 3219.7 4022.9 Hoop-9 -12.2 881.1 1575.5 2416.2 3223.5 4032.4 Hoop-10 729.7 814.4 1622.0 2430.9 3225.7 4032.7 Hoop-11 220.6 801.5 1647.2 2415.1 3223.8 4032.5 Hoop-12 56.8 863.1 1661.2 2381.4 3209.8 4004.6 Hoop-13 -2.9 820.5 1587.2 2442.0 3215.7 4025.8 Hoop-14 -15.8 816.3 1680.2 2432.2 3224.8 4048.1 Long-1 91.2 98.2 108.6 4.5 104.0 26.5 Long-2 -31.3 39.3 75.2 26.1 28.5 58.4 Long-3 57.8 134.0 123.0 107.5 113.0 115.2 Long-4 379.9 317.8 309.7 285.2 294.4 318.8 Long-5 633.0 644.8 614.9 411.3 393.1 380.3 Long-6 390.4 137.9 196.5 165.3 217.3 253.8 Long-7 -61.8 -8.7 30.9 126.0 180.3 179.0 Long-8 182.4 147.6 195.6 267.7 350.5 379.3 Radial-1R -11.8 -11.3 -11.4 -10.5 -16.8 -9.6 Radial-2R -498.5 -240.9 -534.4 -577.1 -613.6 -871.4 Radial-3R 3.4 17.3 16.8 44.9 45.9 43.0 Radial-4R -153.5 -348.6 -522.8 -259.7 -359.4 -418.7
B-68

Table B-41. CP5, Load Condition A, Run 1 (Continued)
% Load 0 20 40 60 80 100 Pressure -0.03 0.70 1.39 2.04 2.74 3.41
Radial-5R -22.8 -14.2 -19.2 -7.1 10.4 17.4 Radial-6R 74.7 81.9 80.4 81.3 76.9 53.3 Radial-7R 83.4 86.6 88.2 86.3 84.0 90.0 Radial-8R 12.3 13.3 12.2 13.0 13.7 9.4 Radial-9R -27.2 -28.4 -28.2 -28.4 -28.5 -27.4 Radial-10R -71.9 -71.5 -70.7 -68.5 -69.3 -73.5 SG01 -74.0 -143.3 -263.9 -389.0 -519.0 -673.6 SG02 -50.8 -96.2 -179.4 -268.4 -356.8 -463.2 SG03 -284.7 -40.4 213.9 447.7 662.4 878.3 SG04 269.8 352.4 528.5 708.7 908.2 1139.4 SG05 -47.9 -121.5 -247.7 -366.5 -492.9 -647.3 SG06 497.4 538.2 690.7 810.9 947.3 1145.8 SG07 -787.2 -382.5 -66.6 243.6 552.6 826.6 SG08 -71.9 -108.5 -186.3 -263.4 -339.6 -439.8 SG09 14.6 -113.6 -270.8 -427.5 -582.6 -771.2 SG10 -7.6 -93.5 -209.3 -331.0 -441.1 -572.4 SG11 -371.8 -32.2 260.3 532.3 810.5 1088.7 SG12 281.1 393.4 582.8 740.0 913.7 1145.1 SG13 46.7 -6.7 -103.5 -193.2 -283.9 -389.1 SG14 -44.3 -123.9 -256.1 -369.3 -474.6 -599.0 SG15 -383.5 -70.7 194.0 423.1 665.3 904.6 SG16 221.2 339.3 562.2 738.1 930.9 1175.2 SG17 -25145.8 -25160.8 -25371.4 -25512.9 -25666.9 -25862.1 SG18 56.9 -15.6 -115.2 -269.7 -430.3 -603.5 SG19 -8.9 291.3 659.4 906.7 1190.0 1485.5 SG20 86.5 126.1 246.6 462.0 702.1 969.1 SG21 10.8 -61.1 -202.4 -349.4 -491.1 -631.4 SG22 -70.9 -124.3 -243.8 -364.0 -478.6 -596.6 SG23 -357.9 -45.0 270.2 503.5 772.6 1028.9 SG24 287.3 333.8 503.3 711.2 898.4 1094.1 SG25 952.9 1225.7 1767.1 2305.8 2855.1 3516.7 SG26 731.1 862.9 1185.2 1509.4 1839.7 2235.4 SG27 597.9 696.7 981.3 1267.4 1557.8 1910.0 SG28 -892.4 -351.5 67.8 466.5 874.8 1250.0 SG29 -1069.7 -388.5 140.2 641.0 1160.0 1629.5 SG30 -1948.3 -616.5 402.5 1360.8 2325.4 3214.8 SG31 754.1 865.3 1157.5 1413.7 1687.4 2042.8 SG32 645.7 767.3 1053.0 1306.1 1577.7 1930.8 SG33 1041.8 1322.7 1852.5 2329.0 2835.5 3475.9 SG34 -321.2 -59.3 149.9 383.3 605.1 822.2 SG35 110.4 224.5 371.8 498.8 643.9 829.5 SG36 -262.0 40.0 287.8 536.6 784.0 1035.7 SG37 456.5 631.4 884.9 1113.1 1362.4 1715.6 SG38 43.2 -57.2 -142.0 -225.4 -308.4 -410.6 SG39 57.9 -9.0 -86.8 -202.4 -283.4 -359.9
B-69

Table B-41. CP5, Load Condition A, Run 1 (Continued)
% Load 0 20 40 60 80 100 Pressure -0.03 0.70 1.39 2.04 2.74 3.41
SG40 46.9 -24.6 -83.2 -149.1 -204.1 -249.5 SG42 -157.2 -147.6 -202.3 -254.2 -324.6 -407.0 SG43 -335.2 -149.6 43.6 218.7 382.0 548.6 SG44 -128.4 -234.3 -375.9 -532.2 -669.9 -832.9 SG45 -438.8 -41.1 281.3 588.4 888.0 1197.6
Table B-42. CP5, Load Condition A, Run 2
% Load 0 20 40 60 80 100 Pressure -0.02 0.62 1.36 2.03 2.74 3.40
Hoop-1 216.4 761.5 1644.1 2919.5 3871.4 4552.6 Hoop-2 29.8 820.4 1607.8 2407.1 3216.4 4066.0 Hoop-3 468.2 787.3 1575.8 2421.2 3187.1 4009.4 Hoop-4 1.7 786.9 1539.2 2415.4 3281.9 4029.1 Hoop-5 8.2 846.4 1652.4 2421.9 3266.5 4024.7 Hoop-6 158.4 607.1 1577.8 2562.5 3891.3 5163.5 Hoop-7 33.5 884.9 1623.4 2433.0 3257.8 4034.1 Hoop-8 4.8 773.3 1541.8 2424.0 3327.6 4032.4 Hoop-9 -34.4 761.0 1613.5 2424.4 3292.3 4025.6 Hoop-10 333.7 742.9 1575.1 2415.0 3280.7 4033.7 Hoop-11 262.7 733.3 1546.7 2427.5 3259.6 4029.3 Hoop-12 153.2 819.8 1642.5 2427.2 3281.9 4072.6 Hoop-13 -11.8 780.3 1578.8 2389.5 3357.6 4062.1 Hoop-14 -1.0 871.2 1615.4 2431.4 3487.6 4016.1 Long-1 17.1 155.8 262.1 227.4 249.4 104.9 Long-2 26.1 121.7 181.5 143.3 195.9 173.2 Long-3 204.4 165.7 211.0 187.8 202.2 191.1 Long-4 406.0 380.6 414.2 368.4 361.2 345.9 Long-5 278.3 323.0 366.7 314.5 347.5 303.8 Long-6 308.4 329.3 329.3 369.6 459.3 485.4 Long-7 -22.8 0.7 79.7 173.5 177.2 114.2 Long-8 520.6 481.0 511.0 547.0 541.0 442.6 Radial-1R 10.7 -14.2 -1.6 -14.2 -15.0 -15.0 Radial-2R -254.3 -297.3 -93.8 -189.6 217.9 -272.7 Radial-3R 47.5 12.1 35.4 30.5 12.5 10.2 Radial-4R -489.7 -128.1 -259.6 -208.4 -72.6 -308.2 Radial-5R 53.2 -18.1 -0.3 3.6 -11.0 -5.9 Radial-6R -28.2 -49.4 -40.8 -40.5 -39.2 -37.4 Radial-7R 119.5 82.8 82.4 83.6 82.4 83.8 Radial-8R 41.6 6.0 7.8 9.4 8.2 7.6 Radial-9R ####### ####### ####### ####### ####### ####### Radial-10R 306.8 306.7 306.8 304.6 304.6 304.6 SG01 4.2 -77.6 -215.1 -348.7 -497.2 -647.2 SG02 7.8 -44.5 -137.6 -230.8 -334.4 -439.7 SG03 21.1 44.5 289.7 480.8 663.7 842.8
B-70

Table B-42. CP5, Load Condition A, Run 2 (Continued)
% Load 0 20 40 60 80 100 Pressure -0.02 0.62 1.36 2.03 2.74 3.40
SG04 -6.6 271.5 471.4 713.5 977.6 1217.0 SG05 -12.2 -95.3 -222.4 -348.6 -493.5 -637.3 SG06 -45.5 400.9 576.8 811.1 1078.7 1303.4 SG07 79.6 -160.3 113.6 297.2 464.4 655.0 SG08 7.2 -69.2 -150.2 -237.9 -337.2 -436.1 SG09 1.8 -93.5 -248.8 -403.5 -581.2 -754.3 SG10 11.9 -73.4 -185.7 -305.8 -433.7 -558.7 SG11 39.3 83.8 353.6 580.5 816.8 1046.7 SG12 -40.6 302.0 503.0 734.8 1008.3 1245.6 SG13 -1.7 -13.8 -95.5 -183.5 -273.9 -364.6 SG14 1.6 -119.3 -232.7 -352.6 -477.6 -598.0 SG15 30.0 47.4 283.2 471.5 666.0 857.6 SG16 -17.8 289.7 501.0 739.3 1012.4 1249.6 SG17 54.4 -277.0 -439.3 -667.6 -903.4 -1111.2 SG18 -6.9 18.5 -101.3 -256.8 -408.6 -559.4 SG19 29.7 330.7 641.8 934.1 1235.4 1517.2 SG20 -5.4 32.7 191.2 445.6 712.8 946.5 SG21 12.5 -56.0 -186.5 -323.5 -459.5 -603.8 SG22 3.7 -93.9 -204.1 -329.4 -453.2 -577.2 SG23 25.2 83.7 344.4 560.8 781.2 1001.2 SG24 8.8 275.0 454.4 700.4 940.2 1146.1 SG25 17.1 936.1 1537.9 2270.9 3042.8 3719.6 SG26 21.3 609.2 967.2 1422.6 1901.2 2311.6 SG27 -6.8 534.4 849.6 1258.6 1689.3 2056.0 SG28 88.9 -133.4 243.9 505.9 756.7 1033.9 SG29 116.5 -128.2 350.2 686.5 1017.4 1366.8 SG30 236.1 -141.4 777.4 1439.9 2069.7 2739.1 SG31 -23.1 642.8 970.4 1382.5 1834.9 2219.0 SG32 -28.8 578.2 893.9 1286.3 1724.2 2101.0 SG33 -14.2 1004.0 1590.9 2289.3 3059.3 3731.9 SG34 37.4 61.4 271.9 455.0 627.2 799.5 SG35 -109.4 106.3 283.0 456.5 654.7 847.8 SG36 50.3 112.9 359.0 570.5 782.2 991.8 SG37 -111.2 438.7 755.2 1103.5 1516.4 1894.6 SG38 21.8 -26.4 -114.2 -189.2 -283.4 -383.4 SG39 18.8 -9.7 -92.6 -180.6 -247.9 -315.5 SG40 9.3 0.2 -51.6 -104.8 -145.3 -195.4 SG42 -61.0 -68.1 -126.7 -192.6 -270.9 -357.1 SG43 -38.0 -30.0 158.3 302.4 441.5 576.4 SG44 -20.1 -158.6 -290.2 -465.0 -624.9 -801.8 SG45 19.3 96.4 406.2 679.4 947.8 1222.5
B-71

Table B-43. CP5, Load Condition B, Run 1
% Load 0 20 40 60 80 100 Pressure -0.05 0.01 0.00 0.03 -0.02 0.01
Hoop-1 89.5 171.2 204.0 274.8 274.8 363.8 Hoop-2 -65.3 21.2 -1.9 -14.8 11.1 -6.2 Hoop-3 538.3 625.7 576.0 648.5 623.0 652.6 Hoop-4 -23.7 -10.1 -3.3 -33.1 -7.4 -14.2 Hoop-5 2.1 -65.1 26.1 26.1 26.1 35.7 Hoop-6 11.4 1.1 20.0 -7.4 -29.7 -16.0 Hoop-7 9.2 42.3 4.8 -8.4 0.4 -17.2 Hoop-8 -10.6 25.0 39.2 -17.7 3.7 -10.6 Hoop-9 0.5 21.8 19.0 -30.7 4.8 19.0 Hoop-10 788.9 703.9 561.3 693.3 683.8 721.4 Hoop-11 -16.6 0.9 -4.1 16.0 9.7 3.4 Hoop-12 11.1 15.2 3.1 77.0 -10.4 -15.7 Hoop-13 -46.9 9.7 28.5 9.7 9.7 78.8 Hoop-14 -63.8 -7.8 120.2 -7.8 -23.8 -7.8 Long-1 153.7 706.4 1531.5 2364.5 3486.0 4051.0 Long-2 59.6 1125.5 1808.1 2341.0 3347.0 4024.9 Long-3 32.4 910.6 1524.3 2671.3 3479.8 4497.8 Long-4 308.7 880.5 1698.4 2429.7 3245.1 4311.8 Long-5 333.5 994.6 1749.0 2469.2 3425.7 4283.6 Long-6 331.9 912.5 1821.8 2440.6 3202.1 4249.5 Long-7 134.6 702.7 1444.5 2463.8 3353.1 4318.4 Long-8 259.3 743.1 1401.8 2584.7 3828.5 4253.1 Radial-1R -10.9 -12.6 -11.1 -12.9 -10.6 -10.6 Radial-2R -419.5 -581.8 -728.3 -620.7 -543.2 -482.3 Radial-3R 4.9 9.9 12.7 17.5 13.1 16.5 Radial-4R -484.0 -207.4 -410.1 -251.0 -375.0 -390.1 Radial-5R -21.7 -13.5 -11.1 -4.6 2.1 8.0 Radial-6R 60.7 60.8 62.6 65.0 69.9 69.6 Radial-7R 82.1 86.0 88.9 90.4 86.3 77.9 Radial-8R 8.8 9.6 9.5 11.0 11.9 17.9 Radial-9R -27.8 -28.0 -28.2 -27.6 -27.4 -28.0 Radial-10R -72.0 -71.2 -71.6 -73.6 -70.0 -71.7 SG01 -55.8 78.2 230.8 395.4 577.7 729.7 SG02 -32.8 83.9 221.4 374.6 543.0 686.4 SG03 -283.5 -309.3 -365.0 -403.9 -473.2 -504.8 SG04 240.0 165.8 88.7 2.5 -81.8 -169.3 SG05 -33.9 118.5 279.6 439.5 619.8 798.2 SG06 477.2 346.7 252.9 134.8 39.5 -107.7 SG07 -788.0 -740.7 -773.6 -756.3 -811.1 -782.9 SG08 -61.0 78.0 227.0 381.1 551.6 725.9 SG09 13.0 162.1 328.1 486.1 676.8 878.0 SG10 -8.0 125.8 278.5 426.9 603.7 792.6 SG11 -385.0 -393.1 -450.0 -483.9 -562.6 -605.7 SG12 277.6 156.9 68.2 -34.4 -131.9 -270.7 SG13 48.6 173.4 315.6 450.0 614.3 781.6
B-72

Table B-43. CP5, Load Condition B, Run 1 (Continued)
% Load 0 20 40 60 80 100 Pressure -0.05 0.01 0.00 0.03 -0.02 0.01
SG14 -36.8 96.6 240.2 384.7 552.9 731.8 SG15 -396.4 -399.2 -449.0 -476.1 -546.5 -579.9 SG16 214.2 90.7 -13.4 -129.8 -248.0 -400.2 SG17 -25106.9 -24909.4 -24721.1 -24522.0 -24300.2 -24046.8 SG18 63.8 189.8 341.3 488.6 674.6 855.1 SG19 -37.6 -87.0 -164.8 -238.5 -339.3 -430.7 SG20 85.1 16.2 -55.9 -132.9 -222.4 -320.4 SG21 31.7 203.5 380.4 572.7 791.3 1022.3 SG22 -52.5 93.2 241.3 405.7 588.5 785.5 SG23 -384.2 -405.4 -470.1 -517.0 -605.6 -663.3 SG24 276.7 188.9 107.8 8.2 -83.0 -212.8 SG25 911.3 748.6 636.3 491.4 370.8 178.4 SG26 701.3 569.4 468.2 345.5 233.8 77.2 SG27 566.8 427.4 319.0 187.7 67.1 -98.8 SG28 -895.9 -811.7 -820.9 -771.0 -803.5 -740.4 SG29 -1074.4 -954.3 -949.0 -871.7 -893.9 -799.3 SG30 -1954.7 -1696.2 -1644.9 -1463.2 -1458.7 -1239.2 SG31 721.2 562.6 452.2 310.4 195.6 16.1 SG32 613.1 464.5 363.6 228.8 119.3 -45.7 SG33 990.7 790.4 666.7 491.3 356.8 138.9 SG34 -330.0 -368.3 -441.7 -473.5 -552.5 -614.6 SG35 131.3 14.6 -103.8 -204.7 -317.4 -466.0 SG36 -275.0 -306.1 -368.3 -401.9 -480.3 -534.8 SG37 461.2 188.7 -10.7 -214.7 -425.2 -711.4 SG38 19.3 117.7 249.4 371.6 530.2 701.1 SG39 42.9 132.6 257.8 368.8 514.1 665.0 SG40 8.8 75.4 179.8 272.6 398.3 530.3 SG42 -137.7 -13.1 126.1 265.8 432.4 570.7 SG43 -342.1 -369.2 -419.0 -453.2 -510.9 -543.5 SG44 -103.1 73.0 252.3 448.8 697.5 898.5 SG45 -455.9 -512.6 -603.4 -676.9 -806.6 -883.3
Table B-44. CP5, Load Condition B, Run 2
% Load 0 20 40 60 80 100 Pressure 0.02 0.21 -0.03 -0.01 0.01 -0.01
Hoop-1 312.7 198.3 221.9 298.2 281.8 269.1 Hoop-2 26.9 3.9 34.1 41.3 54.3 45.6 Hoop-3 625.7 540.9 518.0 566.5 456.0 559.7 Hoop-4 -11.9 4.4 -18.7 -1.1 -7.8 -2.4 Hoop-5 30.6 29.0 -9.4 6.6 1.8 6.6 Hoop-6 387.9 119.1 48.9 115.7 -0.8 95.1 Hoop-7 24.7 57.8 68.8 82.0 117.3 95.2 Hoop-8 12.0 -16.5 4.8 -2.3 -9.4 4.8 Hoop-9 3.9 -10.3 -23.0 -1.7 8.2 -31.6
B-73

Table B-44. CP5, Load Condition B, Run 2 (Continued)
% Load 0 20 40 60 80 100 Pressure 0.02 0.21 -0.03 -0.01 0.01 -0.01
Hoop-10 361.9 356.6 339.0 345.8 301.4 343.1 Hoop-11 506.1 228.8 99.5 442.1 90.7 210.0 Hoop-12 143.8 86.0 103.5 107.5 94.1 125.0 Hoop-13 25.9 0.8 13.3 13.3 101.4 69.9 Hoop-14 15.0 31.0 7.0 -17.0 15.0 -33.0 Long-1 61.0 674.6 1648.9 2572.1 3222.3 4099.7 Long-2 45.2 851.1 1548.2 2448.4 3558.7 4385.2 Long-3 229.8 959.5 1491.7 2647.4 3479.4 3932.3 Long-4 367.3 935.7 1687.6 2406.6 3521.7 4261.5 Long-5 202.6 1020.0 1632.9 2424.5 3598.5 4272.3 Long-6 326.7 804.1 1744.8 2617.5 3585.0 4074.5 Long-7 10.5 714.1 1496.8 2331.0 3131.7 4442.8 Long-8 493.0 845.7 1550.2 2881.9 3509.0 4121.3 Radial-1R 3.6 -8.0 -14.0 2.4 -15.6 -5.2 Radial-2R -88.0 -230.8 -277.0 -142.4 246.5 2.8 Radial-3R 36.8 29.9 16.0 54.9 24.2 45.4 Radial-4R 187.7 -293.6 -361.5 -45.1 97.2 -136.7 Radial-5R 46.5 37.5 -11.0 51.1 -2.1 19.6 Radial-6R -43.2 -55.6 -55.0 -44.7 -50.4 -45.1 Radial-7R 107.4 93.2 79.7 121.4 76.8 102.9 Radial-8R 20.6 6.5 5.9 31.0 5.9 24.1 Radial-9R ####### ####### ####### ####### ####### ####### Radial-10R 313.2 306.8 306.7 313.2 306.8 317.5 SG01 -2.2 94.6 257.2 443.5 578.5 757.5 SG02 3.3 94.8 238.9 414.1 542.9 704.1 SG03 -1.8 -51.2 -227.8 -126.2 -323.7 -324.2 SG04 46.4 -12.6 7.7 -182.5 -168.8 -269.6 SG05 -19.2 90.5 258.9 456.9 601.9 799.3 SG06 37.8 -15.1 98.6 -265.1 -140.3 -303.8 SG07 -4.5 -81.7 -439.6 -44.7 -470.7 -371.0 SG08 -4.0 99.2 232.3 441.6 565.9 749.5 SG09 -18.2 128.4 305.1 478.8 689.8 863.5 SG10 -3.1 126.8 274.2 452.1 637.5 798.1 SG11 11.3 -71.5 -281.1 -128.5 -403.5 -392.1 SG12 26.9 -47.0 -10.3 -266.7 -249.3 -366.8 SG13 -5.5 117.9 279.1 433.8 613.3 769.3 SG14 -16.2 105.6 231.0 419.2 577.7 732.9 SG15 5.2 -76.8 -273.6 -126.2 -388.3 -368.4 SG16 43.9 -46.8 -55.7 -298.3 -326.1 -451.6 SG17 12.7 130.2 200.0 573.1 641.4 896.1 SG18 1.5 139.9 329.3 469.4 705.8 851.4 SG19 30.8 -45.3 -165.9 -177.4 -351.4 -397.9 SG20 9.4 -54.8 -113.3 -219.2 -293.8 -370.7 SG21 12.9 172.2 358.2 568.9 809.6 980.2 SG22 -4.3 125.5 255.8 458.8 636.6 784.7
B-74

Table B-44. CP5, Load Condition B, Run 2 (Continued)
% Load 0 20 40 60 80 100 Pressure 0.02 0.21 -0.03 -0.01 0.01 -0.01
SG23 -5.0 -93.1 -289.8 -183.0 -450.5 -443.4 SG24 63.7 -0.3 26.4 -187.3 -185.8 -282.6 SG25 187.0 101.5 308.1 -179.2 11.9 -172.9 SG26 130.6 61.8 185.3 -197.4 -67.8 -237.8 SG27 96.7 25.9 131.1 -256.5 -140.5 -322.5 SG28 0.8 -84.9 -468.3 29.1 -458.0 -290.9 SG29 13.1 -84.1 -533.2 94.1 -488.8 -261.6 SG30 54.1 -96.8 -873.5 328.3 -704.2 -230.1 SG31 101.9 34.3 200.4 -260.5 -85.0 -279.9 SG32 81.8 18.8 158.0 -249.6 -105.4 -278.2 SG33 168.1 80.1 322.7 -245.2 -17.3 -225.6 SG34 9.8 -80.2 -280.6 -166.2 -421.1 -423.1 SG35 -38.3 -151.9 -177.3 -374.3 -466.4 -526.3 SG36 23.8 -58.7 -243.7 -119.6 -376.1 -370.7 SG37 5.2 -166.5 -136.8 -590.4 -650.0 -845.3 SG38 -15.0 133.4 255.3 363.5 593.1 684.2 SG39 8.0 138.7 265.6 359.7 583.6 668.8 SG40 -22.2 102.9 198.5 240.7 471.2 508.4 SG42 -63.9 30.2 181.0 349.7 471.8 637.3 SG43 -49.9 -96.8 -241.8 -171.0 -338.9 -344.2 SG44 -29.8 122.3 284.1 585.0 726.7 949.7 SG45 3.6 -106.6 -331.9 -283.3 -556.5 -580.5
Table B-45. CP5, Load Condition C, Run 1
% Load 0 20 40 60 80 100 Pressure 0.00 0.68 1.32 2.03 2.72 3.39
Hoop-1 122.3 838.0 1840.9 2443.6 3362.9 4088.2 Hoop-2 18.6 738.6 1661.7 2449.0 3185.2 4043.6 Hoop-3 677.5 850.9 1521.3 2371.6 3195.8 4042.5 Hoop-4 7.2 777.4 1568.1 2397.6 3202.2 4001.1 Hoop-5 26.7 808.9 1503.3 2430.6 3251.5 4024.5 Hoop-6 323.8 828.8 1751.9 2434.7 3241.3 4022.6 Hoop-7 25.4 803.9 1681.9 3240.6 4376.7 5431.5 Hoop-8 9.9 763.8 1603.2 2385.8 3232.4 4050.0 Hoop-9 39.4 752.2 1608.5 2422.4 3222.0 4031.1 Hoop-10 66.1 763.3 1623.3 2396.1 3184.9 3998.8 Hoop-11 586.5 676.8 1583.9 2426.0 3344.5 4002.9 Hoop-12 64.0 751.9 1627.9 2368.4 3235.1 4027.5 Hoop-13 252.6 805.6 1616.3 2427.2 3200.3 3998.1 Hoop-14 35.1 811.0 1682.9 2467.1 3195.0 3994.6 Long-1 54.3 753.4 1545.0 2680.4 3254.9 4087.2 Long-2 14.9 923.6 1423.3 2466.6 3102.8 4015.4 Long-3 983.4 1033.0 1662.3 2474.3 3471.2 4258.7 Long-4 366.9 1034.1 1646.3 2466.8 3348.0 4316.1
B-75

Table B-45. CP5, Load Condition C, Run 1 (Continued)
% Load 0 20 40 60 80 100 Pressure 0.00 0.68 1.32 2.03 2.72 3.39
Long-5 853.3 1004.6 1665.3 2603.6 3215.5 4217.6 Long-6 -16.9 1108.3 1764.0 2373.6 3510.7 4142.0 Long-7 -31.1 732.9 1411.7 2404.8 3345.5 4260.4 Long-8 383.7 752.1 1635.2 2391.8 3663.7 4496.8 Radial-1R -23.5 -11.0 -20.8 -21.8 -23.0 -24.5 Radial-2R -401.7 64.8 -324.9 -339.4 -62.8 -476.2 Radial-3R -21.4 -9.0 -0.8 -3.1 -12.8 -38.6 Radial-4R -456.6 -153.5 -499.6 -780.8 -388.7 -414.9 Radial-5R -7.6 17.2 5.0 -0.1 -2.0 -21.3 Radial-6R -21.1 2.3 -26.3 -22.3 -21.8 -24.1 Radial-7R 1.1 6.2 12.8 1.5 2.8 3.1 Radial-8R -6.1 -4.6 -5.2 -6.1 -6.4 -7.9 Radial-9R 1.6 1.5 1.3 1.6 1.5 1.5 Radial-10R -6.9 -1.2 -7.7 -6.9 -6.1 -7.8 SG01 5.9 27.6 35.9 66.9 125.8 137.3 SG02 18.5 61.0 100.8 161.1 240.0 282.5 SG03 -5.9 177.5 277.2 403.9 503.2 545.0 SG04 55.7 113.0 338.1 501.5 678.0 920.6 SG05 3.9 50.4 63.7 116.4 182.3 212.5 SG06 99.2 87.1 352.3 496.1 668.5 963.5 SG07 -93.6 190.4 203.8 336.4 425.8 328.9 SG08 11.8 86.5 119.8 197.1 280.7 326.5 SG09 25.5 52.1 38.6 82.5 125.5 169.0 SG10 26.8 74.5 81.4 144.6 205.0 258.7 SG11 -33.1 183.4 311.9 459.0 590.5 621.7 SG12 50.4 92.9 314.7 460.3 623.2 843.7 SG13 38.4 96.7 142.6 227.2 303.8 389.6 SG14 18.1 59.0 47.6 96.0 137.9 173.9 SG15 -43.0 156.7 262.8 386.9 496.4 504.7 SG16 91.9 126.8 317.8 443.2 585.8 768.6 SG17 34603.4 30973.9 49220.1 47792.5 46577.8 48809.6 SG18 87.2 131.8 141.3 178.9 215.2 277.2 SG19 22.7 234.8 446.7 631.1 819.8 977.2 SG20 -30.5 -13.8 137.1 284.1 434.3 579.7 SG21 76.5 139.6 144.2 214.1 292.3 355.0 SG22 -258.3 -206.1 -218.4 -166.0 -112.9 -79.0 SG23 -25.2 172.1 305.5 451.2 574.5 612.9 SG24 -3633.0 -3620.7 -3419.5 -3287.9 -3145.3 -2933.9 SG25 198.8 434.1 1216.2 1794.2 2427.2 3227.8 SG26 192.9 285.0 752.1 1072.7 1431.2 1915.5 SG27 232.8 287.0 699.4 965.3 1269.6 1696.0 SG28 -87.9 320.5 419.6 664.1 859.7 817.3 SG29 -108.5 419.4 578.6 919.0 1191.4 1168.4 SG30 -174.4 862.0 1246.7 1949.4 2542.1 2603.8 SG31 536.6 595.4 1060.2 1357.8 1692.8 2178.8
B-76

Table B-45. CP5, Load Condition C, Run 1 (Continued)
% Load 0 20 40 60 80 100 Pressure 0.00 0.68 1.32 2.03 2.72 3.39
SG32 146.1 210.7 639.1 922.6 1241.0 1700.6 SG33 257.7 469.4 1256.3 1823.6 2440.4 3252.7 SG34 -18.4 93.2 168.3 271.2 338.6 326.3 SG35 -19.4 10.3 166.7 277.0 371.0 496.4 SG36 -19.4 164.0 290.4 428.5 550.7 581.8 SG37 23.2 68.3 406.6 609.2 828.8 1142.5 SG38 47.9 81.3 96.2 171.9 229.3 309.2 SG39 39.5 72.8 97.4 166.9 231.6 338.3 SG40 59.6 85.9 119.7 189.4 245.0 337.5 SG42 -8.2 81.7 144.4 230.8 328.0 394.6 SG43 -11.7 118.2 194.3 283.4 354.4 363.4 SG44 -0.7 60.8 74.6 158.1 203.6 228.7 SG45 -60.6 157.8 296.2 447.2 602.7 658.4
Table B-46. CP5, Load Condition C, Run 2
% Load 0 20 40 60 80 100 Pressure 0.00 0.70 1.40 2.07 2.74 3.43
Hoop-1 145.8 665.5 1479.6 2729.8 3240.4 4038.1 Hoop-2 -14.8 891.1 1664.6 2494.3 3272.1 4026.8 Hoop-3 364.6 768.5 1572.3 2405.7 3212.2 4024.0 Hoop-4 -1.9 836.2 1620.3 2369.1 3226.4 4026.7 Hoop-5 -5.9 731.7 1549.4 2517.4 3210.2 4013.4 Hoop-6 -2.3 775.2 1835.5 2298.0 3313.7 4384.2 Hoop-7 4.8 869.5 1683.7 2502.1 3161.8 4042.0 Hoop-8 10.8 907.4 1540.2 2529.2 3212.9 4052.5 Hoop-9 3.4 757.7 1523.0 2385.2 3215.3 4027.9 Hoop-10 578.8 771.5 1457.8 2505.2 3165.5 4033.9 Hoop-11 34.8 839.4 1703.6 2434.1 3161.3 4033.7 Hoop-12 11.1 747.7 1666.6 2462.3 3161.7 4043.4 Hoop-13 9.7 871.0 1769.5 2410.8 3190.8 4001.9 Hoop-14 -23.8 728.4 1576.2 2424.4 3161.1 4017.3 Long-1 -61.4 800.0 1790.8 2593.4 3306.5 4290.4 Long-2 -8.6 943.6 1457.9 2508.4 3288.1 3980.7 Long-3 1302.6 1271.6 1832.7 2926.4 3669.4 4339.8 Long-4 177.2 774.4 1737.5 2435.8 3334.4 4350.5 Long-5 948.6 1321.8 1758.9 2517.2 3552.2 4216.5 Long-6 212.1 1075.1 1897.6 2729.6 3262.9 4272.9 Long-7 37.0 576.7 1453.5 2379.9 3355.2 4243.1 Long-8 237.6 777.8 1747.8 3016.9 3636.1 4379.1 Radial-1R -8.0 -4.5 6.1 -7.5 -11.0 -8.8 Radial-2R -331.3 -162.8 -213.8 -328.1 -363.0 -310.0 Radial-3R 49.3 50.3 65.1 68.4 39.1 22.3 Radial-4R -223.6 -268.9 38.5 -226.8 -165.4 -9.5 Radial-5R 16.6 6.5 52.4 57.8 31.4 13.5
B-77

Table B-46. CP5, Load Condition C, Run 2 (Continued)
% Load 0 20 40 60 80 100 Pressure 0.00 0.70 1.40 2.07 2.74 3.43
Radial-6R 131.1 148.4 151.8 140.2 133.4 128.4 Radial-7R 85.0 95.8 87.8 82.3 81.5 83.9 Radial-8R 13.4 12.7 14.1 13.1 14.2 14.0 Radial-9R -28.4 -28.3 -28.0 -28.4 -28.1 -28.3 Radial-10R -70.5 -70.6 -70.9 -72.2 -72.2 -73.3 SG01 -33.9 1.2 28.9 66.4 83.3 100.4 SG02 -7.2 47.9 102.6 168.6 211.2 255.8 SG03 -19.7 145.5 328.9 437.9 503.5 588.1 SG04 18.8 110.3 226.4 404.1 603.8 823.8 SG05 -5.8 25.9 53.9 101.7 136.8 169.4 SG06 -0.8 89.5 153.8 309.8 535.4 765.9 SG07 -40.9 178.7 450.3 551.8 538.8 558.9 SG08 14.4 74.9 137.7 209.7 262.2 317.6 SG09 24.4 28.3 11.8 44.6 79.0 99.3 SG10 41.4 70.4 88.6 137.2 186.6 228.9 SG11 -37.4 164.6 397.2 532.7 606.8 710.4 SG12 -34.9 90.5 201.0 338.9 521.8 724.2 SG13 21.7 71.1 108.9 174.4 243.3 318.8 SG14 33.0 39.9 53.2 93.1 124.1 155.8 SG15 -42.3 146.2 344.1 452.3 508.4 582.4 SG16 -26.6 90.7 206.9 334.3 498.1 669.7 SG17 -24536.2 -24544.4 -24559.7 -24577.2 -24653.2 -24714.7 SG18 66.6 104.6 89.5 125.8 162.9 205.8 SG19 -40.9 235.8 472.8 643.7 818.4 1015.6 SG20 -49.5 -26.0 136.4 288.2 437.3 589.9 SG21 70.6 74.7 91.3 167.3 219.6 288.0 SG22 51.8 54.4 71.2 124.6 154.9 196.3 SG23 -75.6 148.1 368.7 480.2 561.4 655.7 SG24 -7.5 75.5 187.0 347.3 520.8 696.0 SG25 73.3 499.1 994.1 1601.5 2280.2 2996.0 SG26 105.7 324.4 589.6 941.0 1348.6 1767.4 SG27 21.9 196.4 415.4 713.1 1069.0 1431.9 SG28 -38.7 303.5 694.9 887.0 946.1 1050.9 SG29 -36.2 417.3 926.0 1197.4 1299.6 1456.8 SG30 -48.8 870.9 1879.6 2445.5 2709.5 3082.3 SG31 45.8 253.7 458.8 771.4 1167.7 1574.8 SG32 25.5 229.9 432.0 722.8 1099.8 1492.1 SG33 65.3 505.8 945.5 1507.1 2190.3 2909.4 SG34 -60.3 64.8 240.1 325.0 351.6 387.1 SG35 -95.8 1.5 61.3 120.0 222.6 331.4 SG36 -11.2 169.2 376.3 497.3 558.1 647.0 SG37 -124.5 66.0 181.1 329.2 556.9 829.3 SG38 38.6 67.3 83.9 144.8 216.5 274.2 SG39 49.7 84.8 101.7 144.8 234.3 309.4 SG40 22.8 48.9 82.8 146.6 236.2 309.5
B-78

Table B-46. CP5, Load Condition C, Run 2 (Continued)
% Load 0 20 40 60 80 100 Pressure 0.00 0.70 1.40 2.07 2.74 3.43
SG42 -96.0 -7.4 66.8 149.9 214.4 284.2 SG43 -105.7 11.8 150.6 227.4 266.5 318.9 SG44 -7.3 10.2 33.2 120.2 134.4 192.1 SG45 -131.9 100.5 330.7 454.9 565.6 672.2
Table B-47. CP5, Load Condition C, Run 3
% Load 0 20 40 60 80 100 Pressure 0.00 0.71 1.36 2.06 2.75 3.39
Hoop-1 11.4 798.1 1541.2 2313.6 3180.1 4017.3 Hoop-2 50.0 850.7 1699.0 2377.6 3322.2 3981.4 Hoop-3 625.8 760.4 1620.6 2450.1 3211.9 4035.3 Hoop-4 -0.6 814.5 1620.2 2411.1 3239.6 4017.7 Hoop-5 -4.3 816.5 1530.0 2362.2 3227.5 4033.4 Hoop-6 18.3 814.6 1585.3 2486.4 3306.5 4463.8 Hoop-7 13.7 807.8 1557.8 2473.5 3172.5 4010.3 Hoop-8 10.8 835.9 1654.0 2521.9 3226.4 4002.3 Hoop-9 -0.9 817.1 1635.1 2366.5 3230.3 4037.4 Hoop-10 494.0 837.1 1545.2 2471.3 3207.9 4042.9 Hoop-11 250.6 682.2 1598.2 2438.9 3202.1 4039.5 Hoop-12 29.9 880.4 1542.9 2359.9 3230.9 4037.6 Hoop-13 3.4 845.5 1593.5 2410.5 3209.1 4045.5 Hoop-14 0.2 776.1 1696.2 2432.2 3248.5 4040.9 Long-1 113.2 830.0 1567.6 2588.5 3258.8 4227.9 Long-2 16.5 1130.2 1668.5 2670.9 3455.2 4080.0 Long-3 1345.4 1336.8 1773.1 2417.0 3231.7 4110.1 Long-4 312.7 779.5 1602.9 2647.5 3468.6 4126.3 Long-5 1108.3 1526.5 1783.4 2668.4 3403.7 4144.0 Long-6 757.3 1037.3 1593.1 2532.8 3198.8 4155.8 Long-7 39.5 657.0 1709.1 2631.5 3457.3 4318.4 Long-8 393.6 873.9 1490.9 2200.3 3197.6 3942.2 Radial-1R -12.5 -13.0 -12.1 -10.5 -11.8 -9.1 Radial-2R -542.4 -520.2 -510.1 -404.5 -374.9 -457.4 Radial-3R 5.3 14.5 31.2 43.8 47.2 40.8 Radial-4R -389.1 -269.4 -355.7 -468.4 -373.5 -443.0 Radial-5R -22.7 -21.3 -10.0 -0.5 21.5 22.5 Radial-6R 105.5 109.8 107.1 103.5 86.1 74.9 Radial-7R 85.0 92.5 86.3 85.6 85.5 83.9 Radial-8R 11.8 11.8 11.4 12.5 12.5 13.7 Radial-9R -27.7 -27.7 -28.0 -27.7 -28.0 -27.4 Radial-10R -72.0 -71.5 -72.7 -71.9 -71.4 -72.6 SG01 -17.5 8.5 10.6 47.9 72.8 94.3 SG02 2.7 48.3 78.3 142.0 192.6 245.4 SG03 -290.9 -76.7 123.9 288.5 450.8 587.0 SG04 219.7 260.6 382.7 512.6 639.8 808.6
B-79

Table B-47. CP5, Load Condition C, Run 3 (Continued)
% Load 0 20 40 60 80 100 Pressure 0.00 0.71 1.36 2.06 2.75 3.39
SG05 17.7 41.5 40.4 95.7 135.4 175.2 SG06 422.7 407.2 494.6 559.0 612.6 739.2 SG07 -745.8 -369.5 -106.6 134.3 398.9 569.6 SG08 -7.9 50.7 86.3 174.9 245.2 315.6 SG09 83.3 64.7 30.3 65.1 79.3 94.5 SG10 62.8 78.5 69.7 134.6 175.2 220.9 SG11 -371.7 -87.0 147.0 339.6 547.2 721.4 SG12 214.0 275.0 392.6 488.1 579.5 720.1 SG13 105.0 138.2 149.7 223.3 272.5 335.7 SG14 33.0 42.6 13.7 66.4 105.1 143.7 SG15 -381.4 -114.6 92.2 263.2 442.5 589.3 SG16 146.5 204.3 349.2 444.0 539.7 666.1 SG17 -25030.3 -24927.6 -24998.2 -24934.5 -24895.2 -24883.6 SG18 111.2 131.4 148.3 202.0 199.8 214.0 SG19 -16.4 214.9 497.5 678.2 850.7 1039.5 SG20 60.9 61.9 112.0 215.3 402.1 564.0 SG21 94.8 140.8 113.5 188.2 235.1 296.9 SG22 12.0 52.1 33.1 98.1 141.0 187.9 SG23 -348.4 -94.5 140.1 315.3 499.7 655.9 SG24 205.5 219.9 363.0 455.1 571.4 691.5 SG25 833.6 1043.1 1519.5 1964.9 2415.4 2958.5 SG26 637.6 714.0 977.7 1206.9 1450.5 1753.0 SG27 504.8 542.5 761.1 944.5 1140.2 1392.7 SG28 -827.9 -312.0 59.2 422.6 800.5 1082.0 SG29 -984.2 -326.6 153.4 629.7 1126.0 1498.4 SG30 -1775.6 -464.0 494.3 1453.9 2416.8 3174.6 SG31 652.2 698.5 920.1 1107.4 1283.1 1550.5 SG32 551.3 612.3 828.4 1017.8 1194.3 1460.8 SG33 908.2 1113.7 1555.9 1971.9 2356.2 2882.9 SG34 -355.7 -151.0 32.1 155.6 308.8 406.7 SG35 24.7 95.7 168.5 213.4 266.8 351.4 SG36 -281.7 -30.2 174.5 339.9 520.8 669.1 SG37 303.2 386.4 499.9 589.1 668.8 841.4 SG38 100.6 92.7 92.6 160.0 201.3 242.4 SG39 125.4 134.5 124.7 189.6 225.5 279.7 SG40 88.8 84.6 91.3 164.1 214.8 267.6 SG42 -103.0 -7.3 45.2 134.9 206.1 277.0 SG43 -337.3 -184.5 -39.4 82.2 200.8 296.6 SG44 -54.6 -11.7 3.4 93.6 146.0 214.2 SG45 -440.4 -138.2 83.5 277.3 485.7 654.2
B-80

Table B-48. CP6, Load Condition A, Run 1
% Load 0 20 40 60 80 100 Pressure -0.08 0.54 1.09 1.62 2.15 2.75
Hoop-1 693.7 503.6 1348.5 1879.6 2650.5 3181.7 Hoop-2 -29.7 509.9 1098.2 1936.5 2362.9 3256.8 Hoop-3 -52.9 586.4 1224.0 1966.1 2584.8 3390.9 Hoop-4 -34.7 556.6 1894.8 1904.8 2549.7 3147.8 Hoop-5 -43.5 637.2 1224.1 1914.1 2672.0 3228.5 Hoop-6 4.8 836.3 1214.7 1878.4 2690.8 3145.8 Hoop-7 16.0 574.6 1258.6 1934.3 2617.9 3231.8 Hoop-8 2.1 624.4 1289.0 1904.6 2562.1 3233.6 Hoop-9 30.2 625.0 1201.2 1879.0 2557.9 3271.8 Hoop-10 79.9 559.0 1293.4 1915.6 2560.8 3167.3 Hoop-11 21.2 693.7 1406.7 1938.9 2562.0 3100.4 Hoop-12 92.0 629.2 1456.1 2007.3 2576.9 3263.0 Hoop-13 55.4 716.5 1242.2 2024.3 2571.4 3125.4 Hoop-14 12.3 496.8 1299.3 1922.4 2586.5 3174.4 Long-1 -56.2 23.4 -9.6 8.6 14.3 40.5 Long-2 123.1 138.3 198.7 301.1 403.4 455.7 Long-3 39.6 61.3 52.8 82.9 84.1 114.2 Long-4 90.4 -8.9 16.8 43.7 43.7 53.0 Long-5 22.2 37.4 141.2 198.4 263.7 304.5 Long-6 -9.5 44.9 -6.0 4.4 18.3 -1.4 Long-7 7.0 -3.7 -0.1 3.4 5.8 10.6 Long-8 -34.7 49.7 -108.8 112.2 -31.3 -92.6 Radial-1R -38.9 38.2 15.4 25.5 29.5 74.0 Radial-2R 375.9 574.1 251.2 165.4 -11.0 86.0 Radial-3R -52.0 -41.0 -77.6 -64.3 -71.3 -40.0 Radial-4R 258.3 -92.4 135.0 -5.1 147.3 59.0 Radial-5R -26.5 -45.7 -62.7 -72.0 -84.1 -17.1 Radial-6R -69.8 -67.3 -64.5 -58.5 -67.0 -26.1 Radial-7R -58.0 -52.6 -71.4 -69.1 -78.8 -54.7 Radial-8R -41.7 87.9 50.1 67.9 66.0 109.1 Radial-9R -1771.0 -2054.1 -1604.6 -1434.3 -1636.0 -1777.3 Radial-10R -52.0 -32.7 -47.5 -42.7 -51.2 -33.2 SG01 17.5 -125.7 -297.9 -396.6 -558.5 -702.5 SG02 -33.0 -115.7 -224.8 -284.8 -383.9 -473.5 SG03 -5.4 195.7 379.6 539.5 712.5 948.1 SG04 -12.7 163.0 414.8 592.5 815.5 955.3 SG05 12.9 -101.7 -193.9 -260.6 -367.8 -436.2 SG06 -23.8 -118.0 -207.4 -269.7 -362.4 -433.7 SG07 -46.6 161.3 296.5 443.7 587.6 836.4 SG08 19.5 164.4 389.8 534.5 728.4 776.2 SG09 22.1 -76.3 -136.6 -202.8 -290.4 -357.2 SG10 1.2 -59.8 -118.5 -162.2 -227.0 -295.1 SG11 -33.8 168.8 321.7 480.5 641.7 849.0 SG12 -12.2 180.2 379.8 542.1 740.1 845.8 SG13 39.5 -84.4 -203.0 -265.5 -375.2 -471.1
B-81

Table B-48. CP6, Load Condition A, Run 1 (Continued)
% Load 0 20 40 60 80 100 Pressure -0.08 0.54 1.09 1.62 2.15 2.75
SG14 23.6 -81.8 -148.3 -200.6 -275.7 -352.3 SG15 -45.2 182.6 363.4 529.6 707.1 936.3 SG16 19.1 180.1 400.9 543.6 734.9 864.4 SG17 -114.4 -188.6 -295.7 -315.8 -377.4 -446.2 SG18 2.3 -76.8 -194.2 -234.5 -312.2 -400.6 SG19 -38.4 174.9 363.4 500.8 663.2 867.5 SG20 17.2 154.0 396.2 520.5 707.3 838.3 SG21 46.9 -68.5 -166.1 -264.2 -345.4 -479.9 SG22 497.4 370.1 287.5 207.7 138.4 28.1 SG23 -70.4 172.5 321.8 485.9 631.5 844.9 SG24 41.9 88.1 316.0 467.5 628.4 786.6 SG25 271.4 203.6 588.9 859.2 1142.4 1251.8 SG26 249.6 241.4 450.1 579.4 720.3 773.4 SG27 77.4 38.3 148.5 219.5 294.8 304.5 SG28H -120.2 346.5 671.3 986.1 1301.7 1792.9 SG28L 68.8 -176.5 -414.4 -529.4 -735.7 -918.9 SG28N -29.8 75.9 134.8 238.1 291.1 466.1 SG29H -127.0 370.8 714.7 1059.3 1393.7 1937.3 SG29L 97.5 -250.9 -571.2 -729.7 -1016.7 -1261.5 SG29N -33.1 37.8 46.6 149.3 164.3 343.9 SG30H -191.3 644.1 1232.6 1825.4 2388.4 3315.9 SG30L -5.2 -326.6 -637.4 -703.1 -965.6 -1057.4 SG30N -212.5 18.3 117.5 402.2 522.4 969.5 SG31H 65.6 278.3 722.8 986.3 1333.1 1563.3 SG31L 61.5 -140.2 -292.2 -365.8 -499.9 -655.6 SG31N 133.6 113.6 399.3 572.8 772.7 869.1 SG32H 69.4 331.3 865.5 1180.4 1599.5 1899.7 SG32L 60.9 -209.7 -428.7 -544.2 -736.8 -950.2 SG32N 111.6 87.5 324.4 464.8 622.7 694.3 SG33H 93.1 432.1 1103.4 1508.7 2043.0 2439.5 SG33L 67.5 -273.6 -565.3 -719.8 -976.8 -1237.0 SG33N 124.7 98.7 376.9 546.6 733.0 824.0 SG36 -18.9 179.6 324.9 489.6 648.8 841.3 SG37 -3.9 203.8 383.9 553.6 741.6 825.9 SG38 26.8 -15.7 -38.2 -97.8 -147.7 -203.4 SG39 -18.7 -54.5 -105.6 -150.9 -192.5 -265.4
Table B-49. CP6, Load Condition A, Run 2
% Load 0 20 40 60 80 100 Pressure -0.06 0.60 1.11 1.64 2.17 2.70
Hoop-1 3.2 700.9 1325.3 1847.0 2662.8 3029.2 Hoop-2 -10.7 430.1 1315.2 1788.6 2305.5 3400.9 Hoop-3 4.3 1183.6 1528.7 2179.4 2397.8 2882.8 Hoop-4 142.2 571.4 1444.5 1938.8 2647.7 3105.2
B-82

Table B-49. CP6, Load Condition A, Run 2 (Continued)
% Load 0 20 40 60 80 100 Pressure -0.06 0.60 1.11 1.64 2.17 2.70
Hoop-5 39.5 736.5 1179.1 1792.7 2453.3 3257.3 Hoop-6 54.0 583.4 1326.8 1823.7 2549.7 3161.1 Hoop-7 -15.0 672.5 1147.0 1860.0 2530.0 3199.1 Hoop-8 9.1 645.7 1281.9 1854.7 2568.9 3156.4 Hoop-9 364.4 592.8 1233.4 1943.0 2523.9 3385.9 Hoop-10 -7.5 616.2 1268.1 2004.3 2548.8 3157.8 Hoop-11 14.4 702.2 1252.5 1789.4 2632.9 3283.9 Hoop-12 4.5 764.8 1277.7 1862.8 2583.5 3181.3 Hoop-13 -15.6 1022.1 1256.4 1981.3 2677.7 3289.5 Hoop-14 -63.8 711.3 1292.4 1915.1 2544.8 3188.9 Long-1 -5.0 116.6 23.4 62.1 96.2 75.7 Long-2 209.2 238.3 209.2 290.5 385.9 491.8 Long-3 86.5 96.1 56.4 93.7 110.6 139.4 Long-4 69.4 -5.4 39.0 44.8 64.7 54.2 Long-5 -76.9 54.9 175.0 231.0 291.7 323.2 Long-6 151.5 31.0 3.2 54.2 -0.2 25.3 Long-7 50.2 23.8 37.0 26.2 49.0 32.2 Long-8 -54.4 148.1 76.3 -23.2 -79.8 -34.7 Radial-1R -0.8 16.5 11.8 54.9 49.8 50.7 Radial-2R 316.8 679.2 302.0 268.4 215.8 210.4 Radial-3R -54.4 -49.6 -59.3 -37.6 -42.6 -51.5 Radial-4R 160.8 -61.7 -17.0 -230.9 202.3 470.7 Radial-5R -47.3 -40.8 -63.5 -33.2 -49.6 -72.5 Radial-6R -97.3 -65.4 -67.6 -37.9 -42.8 -59.0 Radial-7R -64.5 -60.3 -74.9 -57.3 -64.4 -81.3 Radial-8R 11.3 10.5 23.0 80.3 77.9 82.6 Radial-9R -1711.8 -1554.7 -1689.9 -1382.7 -1778.4 -1495.8 Radial-10R -49.8 -47.7 -51.0 -35.7 -46.0 -55.5 SG01 -40.9 -117.8 -251.7 -419.7 -547.6 -702.5 SG02 -52.7 -113.8 -195.2 -296.2 -380.7 -475.6 SG03 -2.1 209.9 382.9 595.6 758.6 921.2 SG04 42.0 179.7 384.5 547.6 753.3 995.0 SG05 -43.4 -90.2 -160.7 -252.7 -342.9 -446.8 SG06 -49.5 -106.3 -176.4 -261.8 -345.9 -436.8 SG07 -21.2 177.1 312.5 528.2 668.8 796.9 SG08 36.7 167.5 334.8 429.4 617.6 828.6 SG09 -9.5 -61.3 -115.1 -190.1 -274.4 -359.9 SG10 -17.2 -50.8 -95.8 -158.9 -221.7 -288.9 SG11 -15.9 173.5 316.8 511.6 672.3 825.0 SG12 14.7 188.0 347.6 483.0 680.9 881.6 SG13 -8.5 -80.5 -156.7 -260.0 -364.9 -471.7 SG14 -7.2 -67.7 -120.3 -204.4 -281.5 -353.2 SG15 -21.9 191.2 351.8 568.0 745.8 910.6 SG16 44.4 211.9 373.0 506.9 689.4 879.7 SG17 -68.8 -135.4 -182.6 -230.6 -269.5 -351.1
B-83

Table B-49. CP6, Load Condition A, Run 2 (Continued)
% Load 0 20 40 60 80 100 Pressure -0.06 0.60 1.11 1.64 2.17 2.70
SG18 -23.1 -99.2 -167.2 -241.1 -312.7 -391.6 SG19 -12.9 193.7 341.6 534.8 693.2 839.7 SG20 30.0 202.5 357.2 486.1 656.4 838.1 SG21 26.5 -96.6 -181.8 -275.2 -338.7 -453.6 SG22 457.1 347.8 277.2 188.5 131.3 37.1 SG23 -36.6 176.1 330.3 521.6 662.2 815.8 SG24 -25.8 145.0 314.4 427.0 583.5 774.8 SG25 126.2 253.5 597.1 659.4 963.4 1337.8 SG26 256.3 324.4 491.9 530.2 685.1 864.6 SG27 33.6 45.0 145.1 146.6 229.9 337.1 SG28H -69.1 358.2 668.4 1113.4 1421.3 1714.4 SG28L -30.8 -199.3 -333.5 -535.6 -713.0 -907.4 SG28N -28.9 68.7 184.0 304.8 355.5 426.8 SG29H -68.5 381.3 725.5 1203.6 1526.8 1847.8 SG29L -26.5 -281.1 -451.5 -735.1 -987.3 -1244.8 SG29N -53.1 22.9 136.1 235.5 251.9 295.1 SG30H -56.4 656.7 1277.1 2075.3 2600.2 3164.1 SG30L -159.6 -364.8 -430.2 -640.9 -872.3 -1079.1 SG30N -246.9 -6.1 297.0 580.6 699.5 869.7 SG31H 55.8 346.5 661.1 881.6 1211.2 1585.3 SG31L -1.1 -144.7 -227.1 -395.4 -513.5 -629.0 SG31N 72.8 187.1 410.4 457.2 650.9 909.1 SG32H 65.1 409.5 786.5 1068.7 1465.6 1918.3 SG32L -17.5 -221.6 -352.1 -577.3 -749.0 -921.4 SG32N 52.3 144.5 330.1 364.5 520.5 728.0 SG33H 83.2 528.9 1004.5 1375.2 1881.7 2458.1 SG33L -27.4 -293.6 -461.9 -745.4 -976.4 -1206.6 SG33N 45.6 162.5 385.2 432.3 616.4 858.4 SG36 -14.9 189.1 330.2 513.0 674.7 827.8 SG37 11.4 193.6 357.5 486.7 676.2 871.1 SG38 23.6 -9.3 -55.2 -94.5 -144.0 -201.1 SG39 4.5 -47.9 -104.6 -143.8 -192.9 -250.3
Table B-50. CP6, Load Condition B, Run 1
% Load 0 20 40 60 80 100 Pressure 0.00 -0.08 0.04 -0.03 0.02 -0.03
Hoop-1 5.0 35.4 51.6 42.6 12.1 28.3 Hoop-2 10.2 50.1 117.7 74.4 98.6 90.0 Hoop-3 -14.2 51.4 88.4 68.2 81.7 85.1 Hoop-4 219.2 445.2 621.9 561.4 640.0 656.5 Hoop-5 -5.6 14.2 16.0 12.4 -25.5 -0.2 Hoop-6 37.0 101.5 130.3 125.2 62.5 81.1 Hoop-7 76.1 -45.9 -51.0 -32.1 2.2 -1.2 Hoop-8 -12.1 9.1 23.3 9.1 30.3 9.1
B-84

Table B-50. CP6, Load Condition B, Run 1 (Continued)
% Load 0 20 40 60 80 100 Pressure 0.00 -0.08 0.04 -0.03 0.02 -0.03
Hoop-9 344.4 468.6 450.2 442.6 275.4 382.8 Hoop-10 -9.2 6.0 -2.4 7.6 -7.5 -2.4 Hoop-11 -36.4 0.9 44.9 31.4 85.5 90.6 Hoop-12 -7.5 -5.8 13.1 -9.2 25.1 -4.1 Hoop-13 -8.5 5.7 5.7 -8.5 5.7 19.9 Hoop-14 -8.4 81.5 109.2 60.8 60.7 26.2 Long-1 47.3 586.2 1079.9 1669.9 2155.8 2943.8 Long-2 118.5 435.9 1043.1 1826.9 2463.2 2812.2 Long-3 39.6 446.0 1087.0 1629.2 2253.5 2878.8 Long-4 33.2 745.5 1029.5 1577.1 2315.4 2790.9 Long-5 1.2 716.2 1248.4 1819.8 2359.0 2647.3 Long-6 78.5 319.5 1128.3 1631.1 2285.9 2909.3 Long-7 15.4 760.4 1159.5 1658.9 2351.5 2944.5 Long-8 72.9 357.5 959.3 1832.8 2122.3 2890.6 Radial-1R 8.7 -15.2 14.0 2.6 18.8 11.4 Radial-2R 243.1 142.4 363.3 182.8 391.9 309.8 Radial-3R -43.8 -74.9 -44.2 -48.6 -27.6 -32.6 Radial-4R -102.7 179.1 66.5 -107.5 -52.0 -61.2 Radial-5R -22.9 -63.2 -33.9 -46.5 -25.7 -36.2 Radial-6R -77.3 -115.0 -91.5 -96.5 -72.1 -78.6 Radial-7R -48.3 -80.0 -64.2 -69.6 -45.9 -49.4 Radial-8R 32.7 -39.7 -9.1 -12.9 -1.0 -10.3 Radial-9R -1727.6 -1958.9 -1783.4 -1586.4 -2062.3 -1301.9 Radial-10R -40.4 -58.0 -42.5 -44.2 -31.6 -34.7 SG01 -44.0 127.9 339.0 553.8 788.7 983.4 SG02 -55.6 57.2 188.0 328.3 471.9 600.2 SG03 35.9 -72.3 -78.3 -162.5 -199.1 -275.7 SG04 9.3 30.0 -104.1 -177.2 -316.1 -381.1 SG05 -39.3 81.7 238.8 375.0 561.4 682.5 SG06 -44.5 55.2 184.8 305.9 459.9 572.5 SG07 35.6 -120.0 -81.7 -159.6 -166.9 -237.9 SG08 -22.6 68.7 -91.2 -137.0 -289.3 -331.8 SG09 -5.8 112.6 241.9 361.2 523.6 630.8 SG10 -16.2 112.4 241.4 371.5 532.0 647.0 SG11 9.9 -90.7 -91.6 -160.8 -200.2 -262.4 SG12 -7.3 5.8 -108.1 -163.8 -282.6 -331.5 SG13 -8.2 122.5 263.5 411.3 593.2 718.2 SG14 -14.4 120.3 242.2 379.6 537.9 662.0 SG15 10.2 -94.8 -94.5 -171.2 -211.0 -279.0 SG16 24.9 39.2 -48.8 -106.5 -211.3 -254.6 SG17 -69.5 223.3 412.0 528.9 661.4 784.1 SG18 -24.0 65.5 179.9 305.6 448.6 554.1 SG19 12.7 -58.0 -54.2 -127.3 -158.2 -214.0 SG20 -0.2 32.2 -63.4 -127.4 -229.8 -276.3 SG21 13.4 129.3 247.2 399.1 566.2 690.2
B-85

Table B-50. CP6, Load Condition B, Run 1 (Continued)
% Load 0 20 40 60 80 100 Pressure 0.00 -0.08 0.04 -0.03 0.02 -0.03
SG22 433.0 563.4 673.3 825.2 990.4 1120.2 SG23 2.8 -90.8 -74.5 -140.9 -174.9 -232.2 SG24 -43.7 -34.3 -122.7 -189.7 -290.7 -342.3 SG25 17.7 484.5 523.6 821.3 966.0 1251.6 SG26 220.4 424.7 402.2 516.0 544.4 650.5 SG27 -4.2 147.2 154.1 257.8 300.0 398.6 SG28H 22.4 -222.2 -167.8 -317.2 -347.1 -486.9 SG28L -31.0 190.6 445.1 714.7 1029.3 1252.9 SG28N 8.7 7.6 158.6 217.7 348.0 394.0 SG29H 31.7 -219.9 -135.7 -279.8 -289.9 -424.3 SG29L -35.7 283.6 631.9 1006.7 1431.2 1744.8 SG29N -9.7 44.7 306.8 450.4 695.9 818.1 SG30H 111.0 -295.7 -126.4 -345.2 -344.7 -532.1 SG30L -130.8 267.3 861.3 1395.2 2062.3 2520.1 SG30N -143.1 -60.6 468.1 740.6 1225.3 1467.6 SG31H -5.8 56.7 -159.6 -266.4 -480.2 -557.5 SG31L -17.9 222.7 427.1 689.1 956.7 1188.9 SG31N 10.4 254.6 209.3 319.9 330.3 446.0 SG32H 2.2 32.2 -250.5 -418.7 -709.6 -839.6 SG32L -35.2 246.1 492.1 805.9 1128.5 1405.0 SG32N -3.2 219.6 182.2 280.4 290.7 393.8 SG33H 12.0 40.0 -309.9 -527.6 -890.6 -1063.9 SG33L -39.6 297.4 620.7 1015.1 1430.4 1778.9 SG33N -18.8 247.2 220.1 343.6 371.5 499.3 SG36 9.3 -89.1 -110.9 -182.8 -236.9 -305.8 SG37 -9.2 15.2 -103.0 -150.2 -264.6 -309.9 SG38 28.8 119.4 209.1 302.7 411.5 490.0 SG39 0.3 114.1 215.1 332.4 459.3 560.6
Table B-51. CP6, Load Condition C, Run 1
% Load 0 20 40 60 80 100 Pressure 0.02 0.40 0.81 1.21 1.65 2.05
Hoop-1 -21.9 270.4 810.4 1569.1 2024.7 2481.9 Hoop-2 -12.4 240.9 1339.4 1374.1 1882.5 2026.3 Hoop-3 774.7 683.9 1296.3 1245.9 1880.1 2559.5 Hoop-4 -26.5 700.7 627.0 1354.3 2011.1 2300.7 Hoop-5 -41.7 523.4 911.7 1357.7 2011.4 2453.5 Hoop-6 -71.6 413.7 888.9 1409.9 2047.9 2135.9 Hoop-7 7.4 426.7 914.9 1423.6 1829.3 2315.4 Hoop-8 -5.0 454.7 956.8 1437.8 1918.5 2342.9 Hoop-9 -44.9 392.0 925.4 1402.3 1934.0 2332.5 Hoop-10 58.1 518.7 980.8 1391.1 1965.8 2317.1 Hoop-11 33.1 510.8 966.4 1395.1 1981.0 2595.9 Hoop-12 11.3 524.5 939.7 1473.6 1904.2 2206.2
B-86
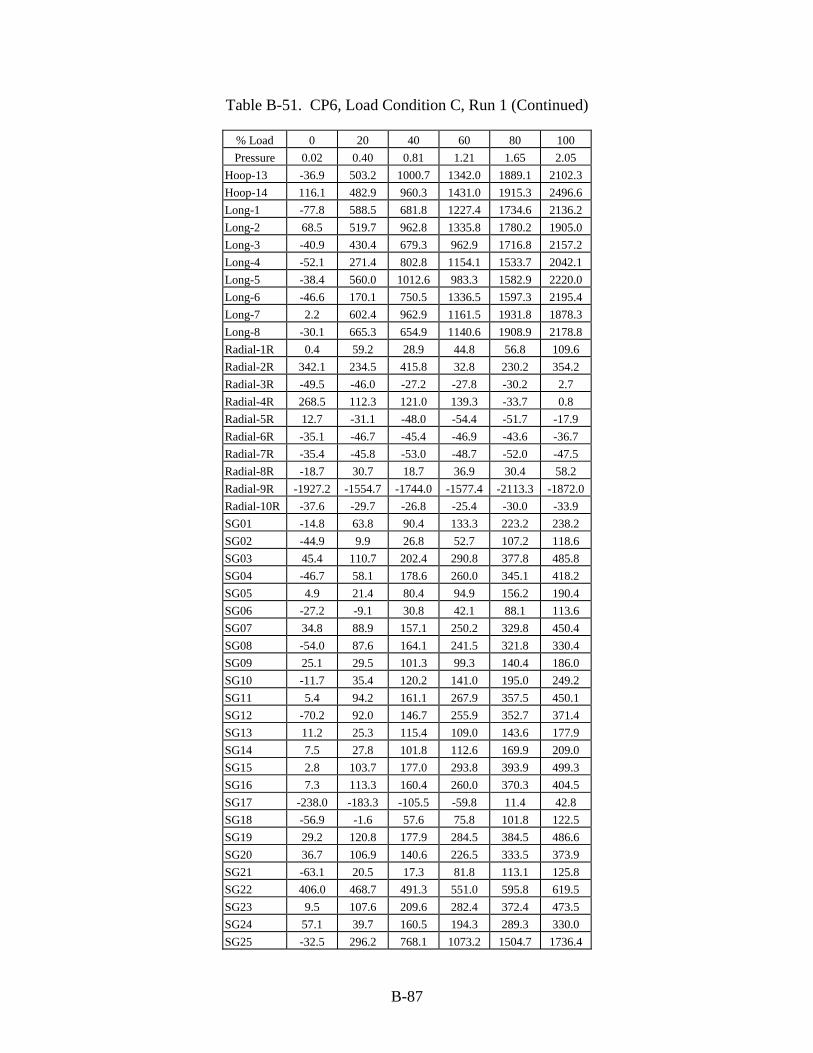
Table B-51. CP6, Load Condition C, Run 1 (Continued)
% Load 0 20 40 60 80 100 Pressure 0.02 0.40 0.81 1.21 1.65 2.05
Hoop-13 -36.9 503.2 1000.7 1342.0 1889.1 2102.3 Hoop-14 116.1 482.9 960.3 1431.0 1915.3 2496.6 Long-1 -77.8 588.5 681.8 1227.4 1734.6 2136.2 Long-2 68.5 519.7 962.8 1335.8 1780.2 1905.0 Long-3 -40.9 430.4 679.3 962.9 1716.8 2157.2 Long-4 -52.1 271.4 802.8 1154.1 1533.7 2042.1 Long-5 -38.4 560.0 1012.6 983.3 1582.9 2220.0 Long-6 -46.6 170.1 750.5 1336.5 1597.3 2195.4 Long-7 2.2 602.4 962.9 1161.5 1931.8 1878.3 Long-8 -30.1 665.3 654.9 1140.6 1908.9 2178.8 Radial-1R 0.4 59.2 28.9 44.8 56.8 109.6 Radial-2R 342.1 234.5 415.8 32.8 230.2 354.2 Radial-3R -49.5 -46.0 -27.2 -27.8 -30.2 2.7 Radial-4R 268.5 112.3 121.0 139.3 -33.7 0.8 Radial-5R 12.7 -31.1 -48.0 -54.4 -51.7 -17.9 Radial-6R -35.1 -46.7 -45.4 -46.9 -43.6 -36.7 Radial-7R -35.4 -45.8 -53.0 -48.7 -52.0 -47.5 Radial-8R -18.7 30.7 18.7 36.9 30.4 58.2 Radial-9R -1927.2 -1554.7 -1744.0 -1577.4 -2113.3 -1872.0 Radial-10R -37.6 -29.7 -26.8 -25.4 -30.0 -33.9 SG01 -14.8 63.8 90.4 133.3 223.2 238.2 SG02 -44.9 9.9 26.8 52.7 107.2 118.6 SG03 45.4 110.7 202.4 290.8 377.8 485.8 SG04 -46.7 58.1 178.6 260.0 345.1 418.2 SG05 4.9 21.4 80.4 94.9 156.2 190.4 SG06 -27.2 -9.1 30.8 42.1 88.1 113.6 SG07 34.8 88.9 157.1 250.2 329.8 450.4 SG08 -54.0 87.6 164.1 241.5 321.8 330.4 SG09 25.1 29.5 101.3 99.3 140.4 186.0 SG10 -11.7 35.4 120.2 141.0 195.0 249.2 SG11 5.4 94.2 161.1 267.9 357.5 450.1 SG12 -70.2 92.0 146.7 255.9 352.7 371.4 SG13 11.2 25.3 115.4 109.0 143.6 177.9 SG14 7.5 27.8 101.8 112.6 169.9 209.0 SG15 2.8 103.7 177.0 293.8 393.9 499.3 SG16 7.3 113.3 160.4 260.0 370.3 404.5 SG17 -238.0 -183.3 -105.5 -59.8 11.4 42.8 SG18 -56.9 -1.6 57.6 75.8 101.8 122.5 SG19 29.2 120.8 177.9 284.5 384.5 486.6 SG20 36.7 106.9 140.6 226.5 333.5 373.9 SG21 -63.1 20.5 17.3 81.8 113.1 125.8 SG22 406.0 468.7 491.3 551.0 595.8 619.5 SG23 9.5 107.6 209.6 282.4 372.4 473.5 SG24 57.1 39.7 160.5 194.3 289.3 330.0 SG25 -32.5 296.2 768.1 1073.2 1504.7 1736.4
B-87

Table B-51. CP6, Load Condition C, Run 1 (Continued)
% Load 0 20 40 60 80 100 Pressure 0.02 0.40 0.81 1.21 1.65 2.05
SG26 79.0 222.7 428.4 563.8 753.9 865.3 SG27 -28.3 77.6 221.1 313.7 446.9 511.2 SG28H 40.8 206.4 364.8 560.0 750.0 993.6 SG28L -50.0 9.1 138.6 163.1 215.0 261.4 SG28N 21.7 108.6 271.0 358.6 491.0 655.6 SG29H 56.3 233.9 426.7 638.6 858.9 1142.0 SG29L -57.8 12.9 200.8 226.4 305.9 381.1 SG29N 3.8 126.2 363.2 484.7 668.1 893.7 SG30H 121.5 413.7 790.9 1136.5 1534.4 2055.6 SG30L -174.4 13.3 434.2 585.2 849.0 1153.2 SG30N -148.1 154.2 680.6 977.2 1389.6 1883.1 SG31H 34.6 166.3 309.0 443.9 637.6 705.2 SG31L -58.1 36.2 179.1 232.3 328.9 383.3 SG31N 26.0 158.9 401.5 544.0 809.7 914.3 SG32H 60.6 170.6 313.9 454.9 660.4 734.6 SG32L -78.3 7.1 151.9 195.5 284.3 332.7 SG32N 13.2 127.2 336.8 456.0 668.9 758.3 SG33H 87.4 224.6 406.4 587.1 846.1 949.0 SG33L -96.5 -1.5 173.9 220.0 322.2 387.8 SG33N 9.1 150.3 406.2 554.7 811.0 925.4 SG36 17.3 97.1 169.5 267.4 343.7 423.8 SG37 -60.8 111.5 202.1 301.1 384.9 389.7 SG38 38.7 66.6 84.3 94.2 119.8 165.4 SG39 -26.4 31.7 74.0 96.0 134.7 182.1
Table B-52. CP6, Load Condition C, Run 2
% Load 0 20 40 60 80 100 Pressure 0.04 0.45 0.81 1.24 1.66 2.06
Hoop-1 3.2 770.9 1115.2 1576.3 1889.8 2270.5 Hoop-2 15.4 273.9 830.9 1325.5 1694.8 2387.5 Hoop-3 85.1 519.1 912.7 1626.1 2241.4 2435.3 Hoop-4 371.5 379.7 776.0 1372.3 1616.0 2659.7 Hoop-5 57.6 751.0 1373.8 1323.4 2000.2 2361.7 Hoop-6 40.4 468.0 921.0 1408.2 2000.0 2358.5 Hoop-7 26.3 505.8 966.4 1483.8 1815.2 2410.2 Hoop-8 2.1 461.7 963.8 1430.4 1967.8 2406.5 Hoop-9 143.7 533.0 995.9 1544.5 1915.4 2358.6 Hoop-10 -4.1 542.1 994.3 1503.4 1958.9 2443.2 Hoop-11 21.2 544.6 968.1 1352.5 1858.9 2575.6 Hoop-12 -4.1 509.0 893.4 1416.7 1883.4 2274.9 Hoop-13 27.0 574.3 958.0 1505.1 1960.0 2365.3 Hoop-14 102.3 510.5 988.0 1465.4 2205.7 2448.1 Long-1 -3.9 468.0 806.9 1296.8 1695.9 2002.0 Long-2 158.0 384.8 1020.9 1179.0 1509.2 2292.0
B-88

Table B-52. CP6, Load Condition C, Run 2 (Continued)
% Load 0 20 40 60 80 100 Pressure 0.04 0.45 0.81 1.24 1.66 2.06
Long-3 145.4 456.8 711.8 1452.3 1930.8 2386.7 Long-4 39.0 424.4 761.9 1286.2 1648.2 1967.2 Long-5 32.7 275.3 723.3 1242.3 1715.8 1905.0 Long-6 24.1 451.6 889.6 1422.4 1769.9 2193.0 Long-7 119.6 428.6 1027.6 1065.8 1643.1 2087.7 Long-8 -3.5 421.1 897.9 1300.4 1454.3 1853.6 Radial-1R 25.4 19.4 24.7 31.8 80.2 80.9 Radial-2R 114.4 -71.1 115.2 372.8 46.1 285.6 Radial-3R -36.9 -27.9 -43.5 -37.9 -5.5 -12.1 Radial-4R 328.4 -185.1 -108.0 99.9 167.8 205.6 Radial-5R -20.8 -42.5 -71.8 -58.1 -26.5 -26.5 Radial-6R -77.9 -66.8 -71.7 -52.0 -15.6 -18.3 Radial-7R -58.7 -56.8 -72.6 -66.1 -26.8 -32.0 Radial-8R 4.0 29.7 15.6 25.4 56.8 74.8 Radial-9R -1610.7 -1273.8 -1253.3 -1549.0 -1716.3 -1771.5 Radial-10R -42.9 -40.1 -38.9 -28.8 -9.7 -15.5 SG01 7.0 39.4 106.9 133.6 184.6 220.7 SG02 -28.6 -8.1 37.3 55.4 87.8 109.1 SG03 23.7 125.6 189.2 297.0 430.1 517.1 SG04 -16.3 83.4 186.8 277.3 297.9 406.4 SG05 1.2 10.6 59.0 112.6 169.8 198.0 SG06 -24.9 -15.2 21.8 57.6 99.3 118.5 SG07 3.9 104.9 140.4 248.5 407.5 485.0 SG08 -4.3 82.6 202.5 236.1 213.2 301.3 SG09 17.2 18.3 62.1 127.1 161.1 191.6 SG10 4.1 37.0 101.1 170.3 218.9 256.1 SG11 -0.2 107.3 168.4 253.1 383.6 464.6 SG12 -10.9 104.4 215.2 245.2 293.5 377.7 SG13 17.7 31.1 72.1 137.0 168.9 182.7 SG14 8.6 22.8 76.5 144.3 179.1 214.0 SG15 -2.8 112.1 185.1 281.4 426.7 519.1 SG16 32.0 108.2 211.0 264.1 323.2 417.4 SG17 -95.7 -23.1 21.8 52.6 93.0 147.7 SG18 -17.5 21.2 54.1 86.6 116.9 123.3 SG19 13.4 104.3 184.7 280.8 414.5 506.9 SG20 37.3 78.2 173.7 232.8 294.6 385.9 SG21 20.1 57.0 77.0 100.0 117.6 143.9 SG22 457.7 492.5 521.1 559.9 594.3 628.0 SG23 -16.2 99.5 179.6 278.8 402.2 482.1 SG24 -6.9 30.7 114.2 198.7 219.3 316.0 SG25 58.4 384.5 790.6 1159.5 1289.2 1685.1 SG26 204.7 349.8 536.1 694.0 735.1 909.5 SG27 -4.9 102.6 226.9 339.5 363.2 489.4 SG28H -11.3 209.0 332.7 551.1 863.0 1047.2 SG28L 14.5 54.2 120.0 194.2 232.4 248.2
B-89

Table B-52. CP6, Load Condition C, Run 2 (Continued)
% Load 0 20 40 60 80 100 Pressure 0.04 0.45 0.81 1.24 1.66 2.06
SG28N 13.5 123.2 219.1 387.1 541.7 665.8 SG29H 0.1 238.4 381.2 638.6 983.8 1197.9 SG29L 30.8 74.9 167.8 282.0 321.8 358.2 SG29N 15.1 160.1 297.8 531.5 743.2 906.0 SG30H 33.6 435.4 696.1 1171.4 1742.0 2137.9 SG30L -51.8 127.3 359.7 694.0 936.3 1135.5 SG30N -113.6 242.3 558.5 1070.5 1549.8 1915.0 SG31H 17.4 145.4 331.3 458.4 514.6 696.7 SG31L 4.5 71.2 176.4 271.9 315.5 374.3 SG31N 30.5 169.2 403.7 608.6 669.4 896.5 SG32H 23.9 144.3 332.3 466.7 520.7 723.2 SG32L -7.5 46.8 144.1 235.9 268.4 315.7 SG32N 21.2 137.5 336.4 503.2 549.3 735.6 SG33H 42.7 195.4 427.9 600.1 681.3 936.2 SG33L -11.6 50.3 158.6 272.3 310.3 365.6 SG33N 22.0 165.2 403.4 608.5 676.0 897.9 SG36 5.1 115.2 169.2 253.4 359.7 436.8 SG37 -8.6 125.6 248.4 276.7 311.0 392.0 SG38 30.4 31.1 60.5 125.7 133.7 173.2 SG39 1.1 21.8 72.8 137.6 166.5 198.5
Table B-53. CP6, Load Condition C, Run 3
% Load 0 20 40 60 80 100 Pressure 0.01 0.43 0.83 1.22 1.59 2.02
Hoop-1 -18.9 372.1 958.4 1548.6 1892.9 2373.5 Hoop-2 537.8 416.4 895.1 1467.8 1894.6 2442.8 Hoop-3 -18.1 1090.2 947.2 1455.3 1896.0 2218.9 Hoop-4 59.0 231.0 1016.8 1205.3 1898.0 2445.0 Hoop-5 85.3 258.6 962.5 1466.4 1901.5 2407.0 Hoop-6 -40.8 437.6 951.5 1452.2 1883.1 2419.3 Hoop-7 105.2 478.1 962.5 1454.2 1916.4 2402.7 Hoop-8 33.8 465.2 946.2 1434.3 1872.5 2410.2 Hoop-9 115.9 410.2 954.5 1442.0 1921.5 2400.0 Hoop-10 26.3 692.0 962.7 1520.9 1924.0 2399.9 Hoop-11 762.0 733.3 1329.7 1636.4 2079.8 2518.8 Hoop-12 62.9 421.6 950.3 1485.8 1940.3 2386.7 Hoop-13 35.2 419.0 1016.1 1336.0 2003.8 2402.1 Hoop-14 48.7 484.7 1003.9 1516.1 1924.0 2394.8 Long-1 121.2 403.2 802.4 1289.4 1808.8 1986.6 Long-2 -38.6 275.4 768.5 1085.1 1488.5 2041.3 Long-3 20.6 312.8 911.7 1352.1 1526.2 2062.9 Long-4 26.2 600.9 883.5 1355.7 1785.2 2069.5 Long-5 75.4 523.4 1102.0 1569.0 2027.2 2513.0 Long-6 23.4 21.1 127.7 226.2 286.4 343.3
B-90

Table B-53. CP6, Load Condition C, Run 3 (Continued)
% Load 0 20 40 60 80 100 Pressure 0.01 0.43 0.83 1.22 1.59 2.02
Long-7 10.6 299.3 739.0 1177.7 1611.1 2123.0 Long-8 -21.9 268.5 740.6 1247.7 1799.4 2007.0 Radial-1R -7.5 47.6 25.6 1.3 -5.9 -3.3 Radial-2R 2500.0 -1.5 393.7 218.4 48.8 43.9 Radial-3R -70.6 -16.3 -48.6 -54.6 -72.9 -70.9 Radial-4R 1027.0 -534.7 -362.8 -135.5 -404.3 -465.2 Radial-5R 202.3 260.6 194.0 170.9 160.7 171.7 Radial-6R -101.2 -47.5 -65.4 -74.4 -83.0 -71.6 Radial-7R -63.4 -21.2 -44.2 -53.5 -58.2 -52.0 Radial-8R 288.0 305.7 277.2 263.2 266.0 281.7 Radial-9R -2313.0 -1476.9 -1623.9 -1934.4 -1615.5 -1887.3 Radial-10R -65.8 -24.8 -40.5 -47.3 -50.8 -47.3 SG01 -57.9 -61.0 -10.0 39.7 73.2 79.1 SG02 -57.8 -73.6 -40.7 -11.3 10.8 19.4 SG03 39.8 206.3 259.9 329.6 402.8 508.4 SG04 67.2 17.5 162.3 270.3 370.0 465.3 SG05 -43.5 -32.9 -13.7 23.0 41.3 55.3 SG06 -45.1 -53.9 -41.8 -18.9 -6.4 7.2 SG07 -12.6 224.2 230.3 277.6 333.3 431.0 SG08 113.9 -63.3 138.0 254.0 363.7 432.1 SG09 -4.4 3.1 21.8 45.6 61.1 80.1 SG10 -10.3 10.5 51.0 96.1 126.0 161.5 SG11 8.9 156.4 220.9 292.9 367.0 462.6 SG12 51.7 -27.9 164.4 276.4 384.7 471.8 SG13 -22.0 3.3 20.1 63.4 67.7 83.7 SG14 -15.0 0.7 36.5 87.4 116.8 150.8 SG15 9.8 171.2 241.4 315.5 398.2 505.1 SG16 -45897.3 -38633.8 -46459.2 -43233.3 -35521.7 -49155.2 SG17 87.2 199.6 233.3 309.0 300.7 343.3 SG18 -34.9 -25.9 16.7 59.3 61.4 85.5 SG19 21.0 153.9 223.8 286.2 372.5 470.1 SG20 65.9 33.3 155.4 238.1 353.5 438.1 SG21 -32.8 -25.1 56.0 88.4 96.6 124.6 SG22 -29.3 -40.4 38.2 84.8 104.7 146.6 SG23 16.2 166.8 211.0 279.8 350.8 434.8 SG24 71.0 5.1 90.3 195.8 294.9 375.6 SG25 214.4 103.7 646.6 1136.9 1505.1 1853.1 SG26 82.9 39.5 282.0 499.0 665.7 819.8 SG27 65.3 8.8 178.7 332.2 443.8 547.6 SG28H -27.2 390.2 448.7 568.3 710.4 911.6 SG28L -109.8 -100.7 -33.4 43.0 42.5 66.6 SG28N -53.4 168.9 200.7 299.1 375.6 489.8 SG29H -29.3 448.0 507.9 647.8 808.9 1038.7 SG29L -139.8 -118.3 -34.5 76.5 77.8 113.5 SG29N -97.5 202.5 259.8 404.5 504.7 663.2
B-91

B-92
Table B-53. CP6, Load Condition C, Run 3 (Continued)
% Load 0 20 40 60 80 100 Pressure 0.01 0.43 0.83 1.22 1.59 2.02
SG30H -36.0 818.1 901.2 1153.5 1443.0 1845.5 SG30L -232.8 86.2 249.9 510.8 625.4 826.2 SG30N -160.0 527.9 693.0 1026.6 1272.0 1639.1 SG31H 167.3 44.1 292.3 493.4 702.8 863.4 SG31L -52.3 -212.6 -92.6 20.1 69.3 130.7 SG31N 121.0 9.7 295.5 567.2 803.0 996.7 SG32H 197.9 57.9 313.0 524.7 754.2 929.0 SG32L -69.5 -115.6 -1.5 107.1 141.5 191.5 SG32N 107.1 -9.1 241.6 470.1 659.9 820.1 SG33H 246.2 92.9 407.7 671.4 958.5 1183.2 SG33L -100.3 -123.8 -6.5 116.3 147.4 203.2 SG33N 108.6 -15.9 283.8 559.3 785.7 980.6 SG36 26.4 173.0 222.6 303.1 374.3 459.5 SG37 74.1 10.3 183.6 302.7 406.6 486.0 SG38 16.5 2.7 64.3 86.2 108.2 130.1 SG39 9.0 36.8 63.3 103.6 136.0 172.5

B.2 REDUCED STRAIN GAGE DATA.
Raw strain data from the strain surveys was reduced to discount any prestrain due to the installation of the panel into the fixture and any nonlinear effects due to any initial slack in the load application mechanisms. In the strain gage reduction, the first three data points were removed, and a linear regression using least squares was used to curve-fit the remaining data to a first-order polynomial.
B-1

SG01 CP1 Load Condition A Load Condition B Load Condition C
% Load Run 01 Run 02 Run 03 Run 01 Run 02 Run 03 Run 01 Run 02 Run 03 0 -100.8 -66.0 -71.5 -47.5 128.1 123.0 30.9 74.8 -78.110 -137.8 -145.1 -99.0 144.1 256.5 242.4 205.1 180.8 154.620 -214.0 -202.1 -160.7 332.4 398.4 395.7 386.6 384.3 375.130 -280.7 -261.1 -264.3 526.3 553.5 564.6 549.1 608.3 545.240 -354.6 -346.9 -338.7 735.2 749.8 723.2 712.7 772.1 700.850 -426.7 -462.4 -422.7 916.0 915.0 932.7 899.9 958.3 871.160 -532.5 -542.6 -495.3 1092.3 1108.4 1115.3 1126.8 1133.5 1060.370 -637.6 -648.6 -588.8 1258.6 1290.5 1301.2 1301.6 1307.4 1256.280 -728.7 -727.5 -672.5 1427.3 1500.1 1495.7 1482.5 1478.9 1436.790 -833.1 -815.7 -757.0 1597.8 1675.8 1682.4 1653.8 1612.5
100 -932.1 -917.1 -845.3 1782.8 1887.5 1882.8 1836.5 1814.5 1790.4
SG02 CP1 Load Condition A Load Condition B Load Condition C
% Load Run 01 Run 02 Run 03 Run 01 Run 02 Run 03 Run 01 Run 02 Run 03 0 10 20 30 40 50 60 70 80 90
100
SG03 CP1 Load Condition A Load Condition B Load Condition C
% Load Run 01 Run 02 Run 03 Run 01 Run 02 Run 03 Run 01 Run 02 Run 03 0 -36.8 30.2 23.9 -16.0 -16.0 -12.2 -96.9 -75.1 -134.610 196.7 236.9 226.3 -78.0 -76.6 -74.3 234.9 265.6 224.920 422.0 451.1 435.3 -128.2 -128.3 -132.6 523.4 551.8 515.730 626.4 637.6 641.2 -194.1 -189.7 -185.0 766.0 867.1 773.440 830.8 830.0 849.3 -257.6 -244.1 -264.2 1029.6 1164.7 1030.850 1028.8 1047.9 1063.5 -322.7 -325.5 -306.7 1290.7 1424.0 1313.260 1225.2 1246.0 1271.0 -383.3 -367.1 -368.0 1557.8 1680.6 1578.070 1423.3 1475.5 1467.9 -442.4 -435.2 -435.2 1824.4 1921.3 1841.780 1642.8 1681.3 1702.2 -514.8 -501.9 -500.3 2089.7 2174.4 2094.390 1873.9 1894.8 1911.9 -578.4 -563.7 -562.4 2338.3 2342.7
100 2079.8 2144.8 2145.8 -644.3 -632.6 -643.1 2565.5 2647.4 2584.5
SG04 CP1 Load Condition A Load Condition B Load Condition C
% Load Run 01 Run 02 Run 03 Run 01 Run 02 Run 03 Run 01 Run 02 Run 03 0 10 20 30 40 50 60 70 80 90
100
B-2

SG05 CP1 Load Condition A Load Condition B Load Condition C
% Load Run 01 Run 02 Run 03 Run 01 Run 02 Run 03 Run 01 Run 02 Run 03 0 -132.8 -64.3 -73.2 -98.8 120.3 116.3 10.7 68.4 -140.810 -153.0 -145.4 -74.8 129.6 298.8 280.3 219.9 197.2 162.120 -237.9 -214.7 -161.1 366.9 463.8 462.4 433.4 424.0 420.430 -313.8 -296.3 -298.0 585.7 638.6 645.2 621.8 665.8 610.740 -408.3 -403.1 -388.7 828.2 854.9 831.8 797.3 846.7 784.250 -506.8 -546.8 -482.7 1043.3 1045.1 1065.8 996.8 1048.3 963.460 -633.8 -636.5 -565.3 1228.4 1274.3 1278.6 1247.7 1241.8 1186.070 -737.5 -761.3 -672.5 1415.1 1478.3 1491.0 1442.9 1433.0 1397.980 -827.5 -820.1 -762.6 1595.3 1729.2 1717.3 1648.2 1626.9 1603.090 -956.8 -943.0 -853.0 1791.7 1930.9 1932.9 1854.1 1801.7
100 -1069.5 -1040.4 -931.3 2001.6 2166.1 2167.9 2054.7 1988.1 2000.0
SG06 CP1 Load Condition A Load Condition B Load Condition C
% Load Run 01 Run 02 Run 03 Run 01 Run 02 Run 03 Run 01 Run 02 Run 03 0 10 20 30 40 50 60 70 80 90
100
SG07 CP1 Load Condition A Load Condition B Load Condition C
% Load Run 01 Run 02 Run 03 Run 01 Run 02 Run 03 Run 01 Run 02 Run 03 0 -24.7 31.0 24.1 -3.2 -31.0 -29.8 -75.0 -42.2 -102.010 194.9 228.5 215.0 -69.5 -92.0 -89.1 238.2 276.8 233.120 406.6 430.4 409.9 -121.8 -137.4 -142.9 511.0 545.8 500.830 601.4 609.5 611.7 -187.5 -194.7 -191.3 735.3 851.7 738.040 794.7 797.5 812.3 -257.4 -251.1 -268.0 979.7 1133.5 972.350 985.7 1004.3 1017.8 -323.0 -329.8 -313.7 1226.0 1394.9 1240.360 1174.6 1196.8 1215.5 -377.9 -380.4 -379.2 1487.5 1654.3 1489.670 1366.5 1415.8 1403.7 -435.4 -445.8 -447.6 1740.4 1892.3 1739.780 1574.2 1609.7 1625.4 -505.3 -519.5 -517.1 2000.5 2138.8 1983.390 1798.0 1814.1 1821.7 -566.4 -582.0 -581.4 2242.1 2226.7
100 1995.8 2055.0 2044.6 -631.9 -654.8 -666.7 2458.9 2592.5 2463.4
SG08 CP1 Load Condition A Load Condition B Load Condition C
% Load Run 01 Run 02 Run 03 Run 01 Run 02 Run 03 Run 01 Run 02 Run 03 0 10 20 30 40 50 60 70 80 90
100
B-3

SG09 CP1 Load Condition A Load Condition B Load Condition C
% Load Run 01 Run 02 Run 03 Run 01 Run 02 Run 03 Run 01 Run 02 Run 03 0 -109.0 -71.2 -74.5 -59.8 94.1 87.8 23.4 89.1 -43.210 -136.6 -135.3 -89.5 144.3 260.2 241.0 197.9 192.7 167.820 -223.9 -207.0 -173.0 333.5 390.4 391.3 353.0 355.2 347.530 -297.0 -285.3 -285.6 515.3 539.4 542.2 511.2 532.6 497.240 -388.0 -387.4 -373.6 711.1 723.1 702.2 650.4 682.5 650.950 -485.1 -505.4 -466.1 889.8 886.7 894.8 805.5 838.0 790.960 -596.7 -598.8 -551.2 1046.1 1078.2 1075.8 1005.2 992.0 985.270 -705.1 -712.0 -657.1 1217.8 1253.4 1256.1 1168.0 1150.0 1153.980 -798.4 -788.0 -739.2 1383.7 1464.2 1447.7 1336.8 1312.8 1316.190 -907.6 -885.9 -829.1 1560.7 1635.7 1631.7 1500.4 1482.7
100 -1008.7 -994.8 -923.3 1742.5 1827.9 1823.8 1680.2 1615.0 1650.3
SG10 CP1 Load Condition A Load Condition B Load Condition C
% Load Run 01 Run 02 Run 03 Run 01 Run 02 Run 03 Run 01 Run 02 Run 03 0 -58.7 -41.8 -48.7 -30.5 82.7 80.0 55.3 107.7 19.410 -106.0 -109.4 -81.6 144.3 233.4 217.2 200.2 213.9 182.520 -179.8 -171.5 -149.1 306.4 353.1 355.2 341.3 363.8 339.130 -244.0 -238.5 -238.6 468.9 489.0 491.7 490.8 518.4 480.940 -321.0 -318.5 -310.0 640.6 652.2 639.6 626.1 667.1 625.150 -398.0 -411.8 -385.8 806.1 802.7 812.3 778.0 828.2 763.860 -485.1 -484.0 -455.5 948.5 977.9 977.8 953.7 981.8 946.470 -571.2 -576.0 -539.9 1106.5 1138.7 1142.0 1114.3 1138.3 1107.580 -648.7 -644.9 -616.0 1261.1 1324.0 1313.5 1280.8 1299.0 1268.690 -740.4 -726.4 -692.0 1417.8 1480.2 1481.8 1442.0 1432.1
100 -826.7 -821.6 -773.1 1580.7 1654.2 1657.6 1617.8 1599.6 1595.6
SG11 CP1 Load Condition A Load Condition B Load Condition C
% Load Run 01 Run 02 Run 03 Run 01 Run 02 Run 03 Run 01 Run 02 Run 03 0 -55.0 9.6 11.9 -13.5 -18.9 -18.0 -131.6 -89.1 -181.310 183.8 223.6 220.7 -71.0 -77.4 -75.3 218.0 243.6 204.220 406.0 435.7 420.2 -121.4 -121.4 -126.4 528.1 553.7 518.830 609.6 622.4 626.3 -177.6 -173.9 -170.8 772.3 892.8 781.840 808.7 814.5 833.3 -233.9 -225.1 -242.9 1041.9 1184.1 1037.450 1003.4 1021.7 1046.8 -290.8 -296.7 -280.9 1313.8 1449.9 1329.660 1194.1 1220.1 1251.1 -345.6 -342.0 -343.1 1603.5 1713.1 1600.270 1387.0 1442.7 1444.9 -401.6 -400.2 -404.2 1863.7 1958.2 1865.180 1597.0 1640.2 1671.0 -471.2 -468.9 -465.9 2127.3 2211.4 2116.390 1821.6 1848.4 1870.1 -528.8 -522.2 -522.5 2373.1 2365.6
100 2020.2 2091.8 2096.9 -589.7 -582.8 -596.0 2597.8 2694.6 2608.5
SG12 CP1 Load Condition A Load Condition B Load Condition C
% Load Run 01 Run 02 Run 03 Run 01 Run 02 Run 03 Run 01 Run 02 Run 03 0 69.9 59.7 58.3 44.1 -73.0 -63.2 -79.9 -17.0 -31.210 210.5 214.9 170.2 -59.4 -150.7 -139.8 136.0 255.5 155.520 385.9 384.3 351.3 -160.0 -209.2 -208.6 329.5 461.7 332.830 551.0 551.4 556.1 -250.4 -276.9 -277.6 513.0 575.2 532.740 724.3 730.6 731.9 -363.1 -365.8 -362.0 722.8 790.4 731.750 899.8 937.5 911.8 -465.8 -455.5 -455.6 933.0 973.9 961.060 1088.9 1114.6 1088.7 -531.8 -551.8 -552.4 1045.8 1158.6 1104.070 1279.1 1319.0 1265.6 -611.2 -638.1 -644.8 1233.7 1337.4 1273.980 1462.3 1486.9 1457.3 -690.1 -758.2 -744.2 1415.9 1520.4 1451.490 1660.7 1663.0 1628.8 -782.9 -845.3 -836.7 1589.6 1627.7
100 1836.7 1871.1 1821.4 -874.8 -941.7 -948.1 1748.0 1904.4 1799.7
B-4

SG13 CP1 Load Condition A Load Condition B Load Condition C
% Load Run 01 Run 02 Run 03 Run 01 Run 02 Run 03 Run 01 Run 02 Run 03 0 -99.0 -57.5 -74.5 -42.2 87.1 80.9 60.9 97.8 -37.510 -146.9 -147.0 -105.7 141.7 238.1 220.6 183.0 175.1 148.320 -228.8 -220.2 -184.3 322.1 371.7 369.0 318.4 311.3 306.430 -305.1 -293.6 -291.3 493.3 514.2 521.8 449.8 463.4 431.540 -393.1 -389.0 -380.3 680.7 693.9 673.0 564.4 596.8 554.650 -485.3 -504.4 -470.4 855.9 844.7 869.7 686.2 733.2 671.360 -593.5 -601.0 -557.4 1007.3 1030.6 1044.1 851.1 860.9 818.970 -705.0 -711.8 -661.1 1172.4 1198.0 1213.2 1005.0 1001.3 973.280 -802.2 -798.1 -754.8 1330.6 1399.1 1393.6 1156.4 1145.9 1121.690 -916.1 -898.2 -846.5 1498.8 1563.2 1567.8 1306.0 1269.9
100 -1026.4 -1020.5 -948.2 1673.6 1743.7 1750.0 1469.0 1411.7 1421.1
SG14 CP1 Load Condition A Load Condition B Load Condition C
% Load Run 01 Run 02 Run 03 Run 01 Run 02 Run 03 Run 01 Run 02 Run 03 0 -69.1 -42.1 -53.8 -30.8 74.4 72.7 45.9 81.3 -14.610 -120.5 -121.1 -91.3 141.0 222.3 209.2 180.3 187.9 160.420 -190.6 -183.2 -156.1 309.5 350.2 350.5 325.2 336.7 322.330 -254.9 -246.3 -245.7 470.4 486.8 494.3 468.4 491.0 459.840 -329.9 -326.4 -319.1 643.3 653.8 639.7 602.0 635.5 595.750 -407.2 -420.0 -395.2 806.7 797.9 820.2 740.8 781.7 729.160 -498.1 -498.2 -467.3 952.0 972.0 984.7 905.2 921.6 892.870 -589.9 -591.0 -554.1 1112.6 1133.0 1146.1 1066.3 1071.1 1053.780 -670.5 -664.7 -632.2 1265.8 1319.2 1317.2 1222.0 1221.8 1209.890 -767.7 -749.6 -713.6 1423.5 1474.6 1483.9 1377.7 1364.0
100 -858.9 -852.6 -798.0 1588.1 1646.9 1659.1 1544.0 1508.2 1518.7
SG15 CP1 Load Condition A Load Condition B Load Condition C
% Load Run 01 Run 02 Run 03 Run 01 Run 02 Run 03 Run 01 Run 02 Run 03 0 -58.6 7.3 11.3 -14.3 -9.3 -8.9 -125.0 -70.3 -170.610 192.9 233.3 232.1 -68.3 -65.2 -65.1 248.1 276.9 233.720 419.7 452.4 436.1 -115.2 -111.0 -116.0 569.4 600.7 562.430 629.6 642.3 645.3 -168.3 -161.8 -161.1 828.3 955.9 838.940 833.0 839.0 859.9 -220.7 -211.8 -230.7 1110.7 1264.4 1110.050 1033.3 1050.1 1078.9 -272.9 -280.1 -268.7 1400.9 1551.0 1416.960 1228.5 1256.2 1289.5 -326.6 -321.1 -327.2 1711.8 1835.8 1710.970 1428.4 1484.4 1489.1 -379.9 -375.5 -384.4 1988.2 2099.4 1993.180 1644.9 1690.9 1723.7 -447.1 -438.2 -441.3 2273.5 2372.7 2266.190 1878.2 1905.7 1930.5 -499.8 -488.2 -492.9 2537.4 2535.6
100 2084.1 2159.3 2164.9 -556.4 -543.4 -561.8 2782.3 2891.4 2799.2
SG16 CP1 Load Condition A Load Condition B Load Condition C
% Load Run 01 Run 02 Run 03 Run 01 Run 02 Run 03 Run 01 Run 02 Run 03 0 76.6 59.0 60.9 44.3 -60.7 -51.3 -52.0 12.9 19.010 208.7 212.3 165.1 -42.4 -124.4 -116.3 166.5 290.1 189.920 372.0 371.1 335.8 -134.6 -180.4 -176.9 357.0 495.7 366.430 526.5 522.4 529.0 -212.6 -238.4 -242.2 547.2 608.8 568.340 686.7 691.1 696.2 -313.8 -318.5 -313.9 763.2 831.8 776.750 850.5 889.9 862.9 -406.0 -392.9 -402.2 983.2 1031.7 1011.160 1033.0 1059.2 1029.7 -459.0 -475.3 -485.2 1107.8 1230.2 1179.770 1217.5 1251.8 1198.8 -525.1 -550.4 -563.0 1306.8 1419.4 1360.580 1392.2 1415.6 1382.6 -588.2 -656.0 -648.2 1502.3 1614.6 1551.790 1581.3 1582.5 1548.1 -670.8 -730.1 -726.8 1687.9 1739.9
100 1750.2 1779.7 1731.7 -752.5 -813.3 -823.3 1861.2 2020.5 1923.3
B-5

SG17 CP1 Load Condition A Load Condition B Load Condition C
% Load Run 01 Run 02 Run 03 Run 01 Run 02 Run 03 Run 01 Run 02 Run 03 0 -101.7 -52.8 -73.6 -45.3 76.1 87.1 10 -148.8 -144.6 -102.9 132.6 207.8 184.1 20 -213.8 -208.8 -169.9 312.8 355.0 339.7 30 -284.6 -267.1 -263.9 479.8 510.7 509.2 40 -360.8 -352.1 -346.7 664.3 657.9 655.6 50 -440.0 -461.1 -425.1 833.3 855.8 804.1 60 -542.7 -548.6 -502.8 984.2 1024.0 943.1 70 -648.9 -647.0 -595.3 1146.5 1187.4 1099.9 80 -741.5 -730.5 -681.9 1298.7 1361.8 1259.0 90 -843.3 -823.9 -772.6 1460.7 1531.4
100 -947.4 -938.1 -861.6 1628.5 1708.1 1545.5
SG18 CP1 Load Condition A Load Condition B Load Condition C
% Load Run 01 Run 02 Run 03 Run 01 Run 02 Run 03 Run 01 Run 02 Run 03 0 10 20 30 40 50 60 70 80 90
100
SG19 CP1 Load Condition A Load Condition B Load Condition C
% Load Run 01 Run 02 Run 03 Run 01 Run 02 Run 03 Run 01 Run 02 Run 03 0 -88.7 -22.7 -17.3 -11.3 -9.4 0.2 -165.1 -110.3 -188.710 163.0 201.7 205.9 -67.4 -58.2 -63.8 213.5 231.7 219.220 383.8 418.1 403.8 -106.7 -82.9 -106.0 529.1 552.0 533.730 585.2 582.5 588.5 -155.6 -122.9 -146.0 775.8 872.7 793.340 774.9 781.2 797.9 -200.0 -188.5 -190.5 1040.3 1182.0 1047.350 939.5 973.3 1007.7 -225.6 -250.6 -222.0 1314.9 1434.9 1352.260 1134.2 1161.1 1198.9 -270.3 -285.0 -268.0 1613.9 1709.5 1625.370 1296.4 1369.7 1380.5 -339.9 -306.3 -316.9 1875.5 1946.2 1906.280 1515.6 1545.1 1577.6 -401.2 -384.4 -369.3 2140.9 2192.9 2162.190 1731.0 1758.8 1791.8 -446.3 -399.8 -414.2 2378.0 2409.3
100 1920.7 1995.1 2004.7 -492.3 -449.6 -493.5 2600.7 2666.9 2647.1
SG20 CP1 Load Condition A Load Condition B Load Condition C
% Load Run 01 Run 02 Run 03 Run 01 Run 02 Run 03 Run 01 Run 02 Run 03 0 10 20 30 40 50 60 70 80 90
100
B-6

SG21 CP1 Load Condition A Load Condition B Load Condition C
% Load Run 01 Run 02 Run 03 Run 01 Run 02 Run 03 Run 01 Run 02 Run 03 0 -83.9 -66.5 -79.4 -10.8 104.2 104.7 64.5 109.2 -24.410 -169.1 -183.6 -176.6 183.0 265.9 257.2 204.7 213.6 161.220 -253.4 -255.3 -211.5 398.4 419.4 417.2 342.7 367.9 346.330 -325.7 -312.8 -336.1 581.0 583.3 597.5 503.2 531.3 493.140 -419.0 -405.3 -415.9 797.1 801.6 765.7 624.4 658.1 610.350 -499.1 -527.7 -510.0 998.5 975.7 996.5 755.2 822.1 741.460 -603.2 -620.5 -604.8 1190.7 1180.7 1193.3 867.1 950.4 869.870 -733.3 -721.6 -707.0 1389.1 1369.5 1383.0 1049.3 1127.1 1036.780 -840.1 -834.4 -811.5 1578.6 1600.0 1591.1 1242.4 1307.4 1226.590 -972.4 -953.2 -947.6 1779.2 1785.7 1781.1 1420.5 1408.5
100 -1093.7 -1105.4 -1063.5 1982.1 1995.2 1999.4 1609.5 1603.6 1589.4
SG22 CP1 Load Condition A Load Condition B Load Condition C
% Load Run 01 Run 02 Run 03 Run 01 Run 02 Run 03 Run 01 Run 02 Run 03 0 10 20 30 40 50 60 70 80 90
100
SG23 CP1 Load Condition A Load Condition B Load Condition C
% Load Run 01 Run 02 Run 03 Run 01 Run 02 Run 03 Run 01 Run 02 Run 03 0 -50.0 22.1 30.7 -25.8 -30.8 -28.0 -160.2 -128.1 -203.510 218.5 262.3 271.9 -96.7 -99.5 -99.0 232.7 244.5 222.920 464.6 504.1 493.5 -170.1 -161.7 -165.6 563.5 581.2 559.230 692.8 708.5 711.2 -241.9 -229.8 -227.6 835.2 953.2 846.640 916.5 924.6 945.3 -318.1 -304.4 -313.6 1124.0 1274.5 1140.550 1135.4 1153.7 1190.2 -392.2 -388.8 -371.0 1432.0 1562.7 1462.960 1350.3 1378.7 1425.9 -470.0 -460.2 -457.0 1771.4 1846.1 1770.270 1570.0 1629.7 1645.1 -550.0 -532.8 -534.6 2044.7 2097.3 2065.180 1808.9 1861.5 1905.5 -644.0 -629.4 -613.9 2320.3 2366.6 2328.990 2068.9 2101.1 2140.4 -726.3 -702.4 -686.4 2570.3 2586.9
100 2295.0 2385.3 2398.9 -803.4 -769.7 -784.3 2807.9 2876.1 2843.5
SG24 CP1 Load Condition A Load Condition B Load Condition C
% Load Run 01 Run 02 Run 03 Run 01 Run 02 Run 03 Run 01 Run 02 Run 03 0 10 20 30 40 50 60 70 80 90
100
B-7

SG25 CP1 Load Condition A Load Condition B Load Condition C
% Load Run 01 Run 02 Run 03 Run 01 Run 02 Run 03 Run 01 Run 02 Run 03 0 -173.7 -92.5 -72.3 -96.4 93.0 83.5 -15.0 48.6 -166.510 -188.7 -150.7 -75.5 96.0 242.8 216.6 149.2 124.0 87.220 -230.5 -206.0 -148.5 352.7 391.9 393.3 331.3 303.0 319.330 -308.9 -288.2 -259.7 521.2 540.2 559.4 465.0 515.7 452.840 -395.5 -376.2 -335.8 739.7 742.9 701.6 603.0 663.5 585.750 -465.1 -487.7 -415.0 924.8 879.7 925.8 764.1 813.4 696.560 -593.3 -583.9 -483.0 1106.6 1084.9 1079.4 962.2 948.6 844.770 -715.9 -681.2 -545.7 1284.2 1270.8 1284.2 1069.0 1109.0 1011.080 -819.8 -774.1 -637.4 1439.4 1494.0 1473.7 1241.4 1252.8 1175.590 -905.2 -860.4 -741.7 1625.9 1630.5 1645.8 1437.1 1325.7
100 -1024.7 -986.1 -823.0 1807.2 1845.4 1859.0 1545.2 1506.0 1484.4
SG26 CP1 Load Condition A Load Condition B Load Condition C
% Load Run 01 Run 02 Run 03 Run 01 Run 02 Run 03 Run 01 Run 02 Run 03 0 -13.4 10 242.1 20 415.7 30 490.4 40 671.6 50 832.4 60 980.9 70 1127.3 80 1289.9 90
100 1666.8
SG27 CP1 Load Condition A Load Condition B Load Condition C
% Load Run 01 Run 02 Run 03 Run 01 Run 02 Run 03 Run 01 Run 02 Run 03 0 -41.2 24.9 27.2 -12.4 -19.7 -20.1 -72.7 -41.0 -86.210 192.0 223.1 225.6 -80.4 -65.4 -73.3 255.4 293.3 234.020 409.6 428.0 418.5 -123.3 -112.0 -121.3 545.9 585.6 531.830 590.5 610.4 615.9 -178.1 -165.3 -154.6 774.8 908.4 785.640 790.8 811.4 818.5 -235.0 -215.3 -224.7 1051.7 1206.5 1036.850 978.7 992.4 1024.2 -289.0 -284.9 -268.7 1308.1 1489.1 1318.960 1171.8 1184.2 1240.3 -346.7 -321.2 -328.7 1588.5 1767.0 1591.070 1351.6 1401.4 1410.7 -402.2 -377.6 -381.8 1854.1 2018.4 1855.380 1559.6 1600.2 1640.3 -472.4 -443.6 -437.3 2132.7 2281.8 2112.990 1786.8 1807.4 1838.5 -531.7 -495.1 -496.5 2388.5 2357.3
100 1986.3 2060.2 2071.3 -591.7 -551.4 -554.9 2621.4 2769.7 2631.0
SG28 CP1 Load Condition A Load Condition B Load Condition C
% Load Run 01 Run 02 Run 03 Run 01 Run 02 Run 03 Run 01 Run 02 Run 03 0 10 20 30 40 50 60 70 80 90
100
B-8

SG29 CP1 Load Condition A Load Condition B Load Condition C
% Load Run 01 Run 02 Run 03 Run 01 Run 02 Run 03 Run 01 Run 02 Run 03 0 -102.5 -49.3 -45.0 -35.4 61.5 77.9 -39.2 -134.610 25.9 41.8 80.5 36.5 112.5 114.5 245.9 192.920 98.3 133.6 141.0 131.4 166.3 165.4 502.5 480.3 472.830 187.9 191.1 201.5 190.6 200.0 220.8 681.0 789.3 703.140 227.4 242.6 269.5 289.3 289.1 270.1 906.1 1014.1 894.350 283.5 292.7 325.5 347.0 325.0 369.6 1145.7 1227.2 1108.960 349.1 353.2 406.2 427.1 413.2 438.4 1391.3 1459.3 1374.670 380.5 408.4 445.0 503.4 481.3 504.2 1611.7 1685.5 1619.280 454.4 482.3 518.9 558.7 568.9 582.1 1872.8 1911.2 1843.590 516.2 546.5 607.6 625.3 643.6 663.6 2100.0 2052.4
100 564.9 629.4 680.8 671.8 709.4 742.9 2319.0 2330.0 2292.3
SG01 CP1B Load Condition A Load Condition B Load Condition C
% Load Run 01 Run 02 Run 03 Run 01 Run 02 Run 03 Run 01 Run 02 Run 03 0 -39.7 -8.5 -23.6 20.3 63.2 90.0 65.9 2.3 3.210 -142.8 -139.5 -150.4 155.6 206.5 186.9 75.0 73.1 6.520 -219.6 -199.3 -225.0 344.4 338.3 359.3 137.4 119.8 130.630 -286.9 -260.9 -271.5 477.3 483.9 491.7 231.0 195.1 198.940 -359.5 -306.5 -323.9 654.6 662.7 648.2 258.3 256.9 246.450 -437.9 -369.7 -385.8 813.0 797.8 795.8 318.5 337.5 357.860 -529.8 -446.3 -461.5 978.7 958.6 993.1 411.8 390.0 404.570 -614.7 -547.7 -546.5 1126.4 1114.9 1152.0 463.2 459.9 462.080 -700.5 -613.8 -644.6 1282.6 1290.4 1285.1 524.4 502.9 541.290 -807.3 -700.8 -726.8 1466.4 1459.2 1470.3 608.5 590.4 602.0
100 -916.0 -791.8 -827.1 1617.4 1616.3 1624.6 695.5 658.7 659.4
SG02 CP1B Load Condition A Load Condition B Load Condition C
% Load Run 01 Run 02 Run 03 Run 01 Run 02 Run 03 Run 01 Run 02 Run 03 0 -30.5 -4.3 -18.0 36.6 56.2 78.3 57.2 6.5 16.210 -115.3 -111.4 -121.3 143.2 174.3 159.7 67.4 63.8 15.020 -184.6 -171.3 -189.8 292.7 283.4 303.6 116.1 94.6 109.830 -250.4 -233.4 -239.8 400.4 404.2 411.9 188.8 150.8 157.940 -319.9 -281.4 -295.8 546.5 552.9 543.1 218.5 196.9 189.550 -392.2 -344.4 -356.3 676.4 666.5 664.9 278.2 257.7 278.060 -472.3 -414.2 -427.1 816.7 800.0 829.8 358.8 296.1 313.270 -546.0 -506.2 -503.5 939.1 930.4 963.0 400.6 351.2 359.480 -622.0 -566.2 -590.4 1070.2 1075.6 1075.0 451.5 385.0 422.990 -715.5 -642.4 -662.8 1224.8 1218.9 1230.4 517.9 452.5 469.7
100 -811.9 -723.9 -749.1 1350.8 1349.5 1359.4 587.4 504.7 513.0
SG03 CP1B Load Condition A Load Condition B Load Condition C
% Load Run 01 Run 02 Run 03 Run 01 Run 02 Run 03 Run 01 Run 02 Run 03 0 25.8 -0.4 10.8 -34.0 -24.4 -28.5 44.6 35.7 -40.410 209.8 192.6 202.5 -83.5 -82.3 -62.1 178.1 148.6 127.520 376.6 377.2 395.2 -149.2 -132.2 -129.6 273.7 263.1 208.830 562.8 570.9 578.5 -197.0 -187.9 -184.0 353.9 371.8 349.240 761.4 747.1 759.0 -260.2 -256.3 -239.2 488.2 495.3 499.850 958.9 930.8 949.5 -312.0 -309.2 -288.5 606.8 619.8 605.460 1154.1 1124.6 1144.1 -388.5 -371.0 -355.4 719.1 761.3 748.670 1340.4 1330.1 1329.6 -449.5 -433.3 -415.3 849.9 882.7 867.080 1521.7 1502.3 1529.9 -509.5 -498.7 -465.1 971.9 1012.0 976.790 1705.1 1691.7 1715.3 -585.2 -564.8 -537.9 1085.4 1118.3 1092.0
100 1908.6 1877.7 1908.0 -643.5 -627.0 -598.0 1200.3 1242.1 1216.9
B-9

SG04 CP1B Load Condition A Load Condition B Load Condition C
% Load Run 01 Run 02 Run 03 Run 01 Run 02 Run 03 Run 01 Run 02 Run 03 0 1.5 -42.0 -45.7 23.0 -72.2 -68.6 -62.5 -9.7 19.110 205.3 184.7 185.0 -57.6 -134.3 -117.3 80.4 93.0 156.420 383.8 338.6 363.7 -179.4 -205.1 -203.2 189.1 194.5 214.430 533.3 496.3 510.1 -260.5 -281.3 -276.2 287.7 284.2 304.040 686.5 641.1 646.2 -362.8 -378.9 -362.0 411.6 399.4 403.250 843.8 780.0 801.1 -461.2 -457.3 -462.4 549.0 495.3 461.860 1010.4 953.5 954.0 -548.9 -551.2 -586.3 643.7 593.0 566.070 1186.8 1124.7 1111.3 -623.1 -635.5 -671.9 750.3 677.2 680.480 1356.9 1269.0 1291.2 -712.8 -745.5 -743.4 850.9 799.0 757.090 1545.9 1447.6 1450.3 -811.9 -842.9 -839.6 939.7 877.4 873.2
100 1725.7 1605.8 1643.6 -902.0 -926.5 -925.6 1025.4 978.4 986.7
SG05 CP1B Load Condition A Load Condition B Load Condition C
% Load Run 01 Run 02 Run 03 Run 01 Run 02 Run 03 Run 01 Run 02 Run 03 0 -14.5 -24.1 -29.9 57.4 67.6 93.1 99.0 33.2 12.510 -134.5 -155.4 -157.6 190.6 216.6 200.6 110.6 114.0 20.520 -217.4 -221.6 -238.4 365.1 363.5 379.7 173.2 160.7 147.130 -304.7 -281.3 -278.2 501.6 511.8 520.0 268.5 222.2 229.840 -392.5 -318.2 -344.4 673.4 684.3 687.4 302.6 300.9 286.050 -475.3 -404.1 -401.7 852.0 832.7 831.1 371.2 403.2 407.660 -574.0 -467.0 -496.3 1021.1 993.7 1025.4 470.0 453.6 461.070 -645.9 -598.7 -586.8 1176.0 1161.0 1202.8 532.8 541.9 531.580 -749.9 -665.0 -688.7 1338.2 1348.9 1353.1 618.0 598.2 618.090 -877.3 -742.2 -767.0 1530.2 1522.9 1544.8 711.0 685.7 686.3
100 -985.4 -845.1 -861.3 1684.5 1684.6 1705.4 802.8 768.1 762.7
SG06 CP1B Load Condition A Load Condition B Load Condition C
% Load Run 01 Run 02 Run 03 Run 01 Run 02 Run 03 Run 01 Run 02 Run 03 0 -7.9 -11.6 -19.0 50.4 63.9 91.8 86.0 29.5 21.410 -110.0 -125.0 -128.6 198.1 227.3 206.2 104.8 108.1 30.720 -188.2 -190.9 -203.9 388.4 387.4 400.3 164.8 148.8 144.030 -271.4 -252.6 -248.8 537.3 547.7 553.3 251.5 205.5 216.240 -355.2 -292.1 -314.8 721.8 734.1 732.3 300.2 277.0 266.850 -432.1 -372.7 -370.4 915.7 894.2 884.5 386.1 367.8 379.360 -521.0 -432.0 -457.2 1096.4 1067.4 1092.1 484.0 414.5 430.870 -586.7 -549.2 -539.8 1264.1 1247.1 1281.9 543.9 494.9 498.580 -678.1 -608.9 -630.6 1436.8 1448.6 1440.5 621.9 548.7 580.390 -790.8 -679.4 -700.9 1641.8 1633.9 1644.7 707.8 630.9 642.3
100 -889.5 -771.6 -783.4 1806.9 1806.1 1815.8 794.5 704.7 712.2
SG07 CP1B Load Condition A Load Condition B Load Condition C
% Load Run 01 Run 02 Run 03 Run 01 Run 02 Run 03 Run 01 Run 02 Run 03 0 33.3 19.1 35.8 -63.0 2.0 -3.5 104.0 56.5 -53.710 200.2 188.6 202.0 -96.9 -51.5 -33.2 216.8 161.7 111.820 357.6 381.7 395.6 -132.6 -93.3 -89.9 301.0 277.5 199.830 556.9 587.0 591.1 -167.0 -138.7 -133.3 370.4 389.9 352.940 769.9 773.0 789.5 -212.1 -191.9 -176.9 497.8 513.2 519.750 978.6 974.8 989.8 -240.7 -233.9 -196.1 612.8 642.3 643.760 1179.8 1171.9 1202.5 -314.4 -280.2 -232.2 733.3 797.1 797.270 1360.8 1393.0 1397.1 -368.5 -329.9 -276.8 866.2 927.5 917.580 1543.8 1568.6 1600.0 -415.4 -370.1 -316.4 987.6 1055.6 1032.490 1722.8 1754.0 1787.3 -477.6 -422.2 -377.3 1108.5 1168.2 1143.6
100 1924.4 1947.0 1972.9 -522.0 -471.4 -424.5 1233.9 1292.2 1262.6
B-10

SG08 CP1B Load Condition A Load Condition B Load Condition C
% Load Run 01 Run 02 Run 03 Run 01 Run 02 Run 03 Run 01 Run 02 Run 03 0 -47.8 -51.9 -72.6 7.1 -91.6 -93.6 -169.1 -83.7 -11.310 139.3 140.6 130.6 -83.2 -169.9 -158.0 -41.0 -8.0 91.820 297.2 268.2 276.6 -215.9 -264.7 -260.7 60.9 76.5 133.730 423.6 380.4 383.7 -311.0 -351.9 -351.1 147.3 161.6 181.340 547.2 483.5 492.2 -420.9 -454.3 -459.1 255.0 230.0 232.150 660.3 594.8 601.0 -561.6 -554.1 -577.3 359.8 271.9 244.560 787.3 714.7 720.6 -653.9 -658.6 -717.1 418.2 337.4 301.470 915.2 858.9 838.7 -741.5 -766.3 -839.7 481.9 367.8 363.180 1058.4 964.1 975.5 -847.7 -912.2 -940.3 529.7 441.1 407.990 1224.5 1097.1 1093.5 -967.7 -1023.6 -1055.0 575.7 494.9 492.3
100 1361.0 1220.3 1241.5 -1072.1 -1125.6 -1159.9 617.5 555.6 558.3
SG09 CP1B Load Condition A Load Condition B Load Condition C
% Load Run 01 Run 02 Run 03 Run 01 Run 02 Run 03 Run 01 Run 02 Run 03 0 0.3 -30.4 -37.1 79.7 44.9 70.4 50.7 33.0 27.410 -88.6 -125.7 -120.5 201.4 187.8 175.3 70.4 104.7 34.320 -168.7 -201.9 -205.6 337.9 336.6 341.6 121.4 132.6 123.130 -275.4 -272.8 -250.6 466.5 470.3 474.8 196.2 161.8 177.240 -378.3 -310.8 -339.5 615.8 616.4 626.7 217.4 221.3 210.150 -465.4 -421.1 -398.6 788.2 761.3 740.8 272.7 305.6 296.460 -561.2 -470.7 -507.2 939.5 901.5 906.6 338.7 326.4 335.770 -612.0 -615.2 -595.0 1090.0 1058.5 1075.1 383.9 394.6 392.780 -716.2 -678.8 -686.5 1238.0 1229.8 1219.6 452.2 444.3 452.790 -838.5 -738.4 -752.3 1413.0 1383.7 1392.3 515.1 500.6 505.0
100 -935.6 -839.5 -824.7 1552.8 1535.1 1539.1 583.1 567.5 569.7
SG10 CP1B Load Condition A Load Condition B Load Condition C
% Load Run 01 Run 02 Run 03 Run 01 Run 02 Run 03 Run 01 Run 02 Run 03 0 6.0 -19.0 -24.1 79.0 47.0 73.4 51.7 34.3 30.210 -77.8 -111.2 -106.0 203.0 190.5 181.1 81.0 110.4 43.320 -154.9 -185.3 -188.8 340.7 340.1 349.0 138.2 144.4 134.130 -256.8 -253.8 -229.9 471.7 475.7 483.5 217.4 179.2 195.240 -352.5 -284.7 -315.0 621.1 622.7 638.2 258.4 243.7 235.750 -432.8 -389.7 -368.0 795.9 769.9 756.6 330.2 331.5 328.660 -521.0 -432.4 -468.1 948.8 914.0 927.3 406.4 360.2 375.870 -563.7 -569.0 -550.2 1101.4 1072.0 1098.2 459.3 433.8 439.880 -662.4 -627.5 -635.5 1250.5 1244.4 1246.2 532.7 490.1 505.490 -779.9 -680.5 -695.0 1427.5 1399.7 1420.3 604.6 550.4 562.5
100 -871.9 -775.9 -760.4 1567.9 1552.6 1568.9 681.2 622.9 632.8
SG11 CP1B Load Condition A Load Condition B Load Condition C
% Load Run 01 Run 02 Run 03 Run 01 Run 02 Run 03 Run 01 Run 02 Run 03 0 7.4 -10.2 0.3 -58.9 -21.2 -25.9 45.9 14.1 -48.710 172.1 172.7 173.4 -98.1 -69.4 -60.8 168.5 126.9 106.720 345.2 360.4 368.7 -136.7 -122.5 -118.8 270.5 249.3 207.830 542.5 554.2 549.5 -180.1 -170.0 -167.6 365.3 377.6 353.140 747.3 724.9 739.7 -230.3 -222.2 -219.4 501.7 504.7 507.050 941.5 917.4 921.7 -284.9 -275.5 -250.4 623.2 627.0 624.360 1130.4 1095.5 1122.5 -349.9 -324.8 -304.0 747.6 777.9 764.470 1298.7 1310.7 1302.1 -405.7 -382.3 -361.9 877.8 898.6 883.380 1482.1 1474.4 1492.1 -462.3 -441.1 -413.7 995.6 1023.6 997.390 1668.3 1648.4 1665.0 -527.7 -498.2 -478.4 1118.5 1141.5 1117.0
100 1860.8 1830.5 1841.7 -581.0 -556.0 -534.2 1239.5 1261.5 1236.6
B-11

SG12 CP1B Load Condition A Load Condition B Load Condition C
% Load Run 01 Run 02 Run 03 Run 01 Run 02 Run 03 Run 01 Run 02 Run 03 0 -36.7 -18.9 -31.4 -21.9 -53.3 -59.3 -102.0 -72.6 -53.110 142.1 158.1 147.0 -99.8 -132.6 -118.1 35.7 19.5 75.420 311.3 319.6 319.5 -191.4 -223.5 -212.0 147.5 124.8 146.830 481.0 464.9 451.7 -276.6 -297.3 -293.2 237.9 239.6 236.840 648.4 590.9 608.1 -361.1 -375.7 -383.4 352.0 330.8 333.050 798.8 755.0 744.9 -480.5 -468.0 -466.7 456.9 397.4 386.060 956.3 888.3 909.2 -562.0 -553.5 -573.5 549.6 505.7 470.270 1090.3 1080.3 1056.1 -649.4 -647.7 -680.1 643.5 562.1 547.080 1261.6 1212.5 1216.2 -738.5 -765.8 -768.9 713.6 648.1 623.090 1446.3 1355.1 1354.4 -841.5 -854.8 -866.5 793.1 735.3 715.7
100 1606.5 1508.2 1506.4 -926.3 -947.0 -954.1 863.1 811.3 799.8
SG13 CP1B Load Condition A Load Condition B Load Condition C
% Load Run 01 Run 02 Run 03 Run 01 Run 02 Run 03 Run 01 Run 02 Run 03 0 -30.1 -40.3 -42.3 63.6 34.7 66.0 23.0 11.3 5.710 -124.7 -145.4 -148.6 181.8 167.6 168.7 35.6 62.3 2.220 -229.8 -240.6 -250.7 317.5 306.3 323.7 68.7 75.6 69.630 -343.7 -330.3 -320.5 444.3 440.0 447.9 120.8 93.4 98.440 -457.6 -397.8 -424.8 588.5 583.7 600.5 119.2 122.6 107.350 -563.3 -512.6 -505.2 748.4 723.4 708.6 155.2 175.3 166.660 -676.3 -594.7 -624.7 895.8 857.0 869.7 196.4 183.4 182.970 -760.6 -744.7 -734.1 1036.1 1003.4 1024.4 221.2 220.9 206.580 -882.0 -827.0 -845.6 1182.3 1160.0 1162.3 258.9 242.6 247.790 -1019.1 -921.6 -939.8 1343.5 1307.0 1326.7 295.3 282.1 274.2
100 -1142.9 -1038.6 -1046.9 1480.3 1452.4 1468.4 341.4 324.9 308.5
SG14 CP1B Load Condition A Load Condition B Load Condition C
% Load Run 01 Run 02 Run 03 Run 01 Run 02 Run 03 Run 01 Run 02 Run 03 0 -5.6 -20.6 -22.5 52.1 34.2 58.3 36.9 13.2 18.010 -99.4 -119.8 -121.6 165.6 161.2 156.2 42.7 65.3 9.120 -195.2 -210.3 -213.4 299.0 290.3 302.4 73.7 77.0 74.930 -303.6 -294.9 -285.0 416.2 415.6 421.8 124.5 95.4 103.840 -410.2 -357.6 -380.9 551.9 551.6 563.6 145.9 126.2 114.650 -506.0 -464.3 -456.4 698.1 679.0 672.2 193.5 178.6 175.760 -608.4 -537.7 -563.9 837.6 807.5 823.3 240.3 188.8 196.970 -681.6 -672.9 -661.8 969.6 944.1 968.4 267.2 228.4 224.080 -789.2 -746.2 -762.2 1105.0 1094.4 1097.2 308.1 251.9 266.190 -910.3 -829.5 -845.8 1258.8 1232.0 1252.8 347.9 291.9 293.3
100 -1021.6 -934.0 -937.1 1384.6 1368.9 1384.5 393.7 330.3 325.8
SG15 CP1B Load Condition A Load Condition B Load Condition C
% Load Run 01 Run 02 Run 03 Run 01 Run 02 Run 03 Run 01 Run 02 Run 03 0 18.1 -3.1 6.1 -45.5 -12.1 -14.9 70.5 37.3 -28.010 193.0 184.7 190.3 -86.0 -58.3 -51.1 197.2 158.5 134.820 376.0 384.1 396.6 -127.9 -109.0 -105.7 305.3 287.2 243.930 580.5 591.0 591.7 -171.4 -157.7 -153.7 407.4 420.0 401.740 793.9 776.1 791.6 -219.3 -209.3 -204.7 556.2 560.8 567.250 999.8 975.3 986.2 -267.3 -260.1 -234.6 686.8 698.2 698.860 1201.2 1171.2 1196.1 -332.7 -307.4 -283.5 823.2 857.4 855.470 1386.2 1392.1 1389.5 -385.7 -361.2 -335.0 965.1 995.7 992.880 1579.8 1567.8 1592.9 -439.7 -414.0 -383.7 1098.8 1136.4 1121.090 1774.9 1759.6 1781.3 -500.1 -468.3 -444.4 1237.0 1265.0 1254.2
100 1981.2 1953.8 1975.1 -551.1 -522.1 -496.4 1373.7 1402.4 1390.9
B-12

SG16 CP1B Load Condition A Load Condition B Load Condition C
% Load Run 01 Run 02 Run 03 Run 01 Run 02 Run 03 Run 01 Run 02 Run 03 0 -8.4 -5.4 -18.8 -14.3 -34.9 -45.1 -77.3 -49.9 -36.510 180.2 189.8 183.1 -89.1 -108.8 -101.1 72.5 63.4 113.120 374.3 375.4 379.8 -176.4 -195.5 -192.9 202.2 190.8 203.030 565.1 549.7 538.7 -260.3 -272.2 -270.1 319.4 322.7 324.040 756.9 702.8 717.9 -342.5 -350.5 -361.2 463.1 445.1 448.750 934.6 889.1 884.2 -451.4 -438.3 -432.8 592.0 543.8 532.960 1116.9 1052.9 1071.9 -530.7 -517.1 -532.3 711.5 674.8 647.970 1282.0 1267.4 1244.9 -613.3 -606.0 -624.0 828.3 764.1 755.480 1482.8 1432.2 1438.1 -695.0 -706.1 -709.6 928.8 879.0 858.890 1689.1 1604.8 1603.7 -792.2 -793.1 -803.7 1037.5 990.2 978.7
100 1881.2 1784.2 1786.9 -875.4 -882.1 -889.2 1136.8 1095.9 1091.5
SG17 CP1B Load Condition A Load Condition B Load Condition C
% Load Run 01 Run 02 Run 03 Run 01 Run 02 Run 03 Run 01 Run 02 Run 03 0 -492.6 -49.0 -42.4 43.5 23.5 59.5 -279.6 29.2 48.710 -571.8 -93.5 -105.0 158.5 150.6 163.5 -217.8 85.9 45.720 -662.0 -134.7 -142.9 296.6 279.1 308.3 -147.0 142.8 95.830 -746.6 -167.5 -167.7 420.4 414.7 426.3 -46.0 209.1 141.040 -813.9 -188.4 -213.5 559.0 554.4 578.6 -236.0 280.1 170.850 -911.1 -243.5 -246.1 711.8 685.1 690.0 4.8 368.4 249.960 -1009.5 -277.0 -304.1 849.3 818.3 844.9 186.7 427.1 283.070 -1091.8 -356.7 -364.3 983.8 955.2 987.9 240.7 497.4 318.480 -1202.7 -392.0 -419.3 1123.8 1098.0 1123.6 -161.0 558.9 368.590 -1321.0 -441.7 -467.7 1273.9 1238.7 1279.6 -167.2 636.1 412.3
100 -2450.9 -505.0 -529.0 1404.8 1377.5 1414.5 -94.7 715.2 469.6
SG18 CP1B Load Condition A Load Condition B Load Condition C
% Load Run 01 Run 02 Run 03 Run 01 Run 02 Run 03 Run 01 Run 02 Run 03 0 -20.4 -37.0 -32.9 46.1 22.7 47.4 25.0 5.5 -10.510 -82.8 -91.6 -101.5 156.4 140.3 149.8 73.6 83.4 20.820 -147.8 -151.1 -156.5 281.9 264.1 285.9 131.5 124.0 106.130 -217.3 -203.9 -198.0 402.9 391.6 400.0 203.9 175.6 169.240 -279.1 -235.7 -259.3 531.0 519.7 538.4 258.3 231.0 218.850 -339.3 -305.3 -303.3 676.1 645.9 644.0 339.9 308.0 300.060 -408.0 -354.2 -370.5 809.0 770.7 785.2 417.2 358.8 349.470 -456.5 -445.1 -443.7 939.6 901.1 919.5 475.4 414.2 393.280 -533.7 -491.0 -510.5 1071.2 1034.4 1048.7 537.2 464.2 457.690 -623.7 -551.8 -569.5 1213.9 1167.1 1194.2 600.2 530.6 510.8
100 -702.4 -627.4 -636.6 1338.3 1296.4 1319.6 676.4 597.5 572.7
SG19 CP1B Load Condition A Load Condition B Load Condition C
% Load Run 01 Run 02 Run 03 Run 01 Run 02 Run 03 Run 01 Run 02 Run 03 0 176.1 -11.8 43.1 -29.6 39.8 -16.6 253.4 11.4 -56.810 313.6 -40.4 189.2 -64.0 5.4 -48.1 345.0 -68.8 63.520 451.1 102.8 338.1 -278.8 -40.4 -96.8 422.4 197.6 143.830 600.1 435.1 487.1 -144.1 -86.2 -128.3 316.4 295.0 246.840 749.0 569.8 633.2 -175.6 -126.4 -182.7 425.2 398.1 361.550 729.1 710.0 770.6 -215.8 -172.2 -208.5 706.0 492.7 450.460 869.3 858.7 925.0 -273.1 -375.5 -254.3 789.0 604.4 559.370 1187.2 1016.4 1065.4 -316.0 -427.0 -288.7 894.9 699.0 656.680 1333.2 1145.4 1045.6 -358.9 -292.5 -340.4 989.7 805.0 753.990 1482.5 1291.6 1363.3 -404.8 -338.3 -386.1 1086.9 893.7 673.8
100 1788.5 1431.6 1663.1 -453.4 -384.1 -434.8 1181.6 988.2 954.4
B-13

SG20 CP1B Load Condition A Load Condition B Load Condition C
% Load Run 01 Run 02 Run 03 Run 01 Run 02 Run 03 Run 01 Run 02 Run 03 0 12.4 7.8 -11.8 -25.3 -32.5 -50.8 -50.6 -29.7 -13.410 179.0 177.1 175.4 -93.3 -100.2 -106.8 69.5 68.6 114.120 355.0 344.1 349.8 -169.6 -176.1 -192.4 179.5 177.1 190.830 520.4 502.2 492.3 -247.9 -255.5 -263.5 284.5 285.4 290.740 684.4 635.5 648.5 -320.5 -329.6 -356.1 412.7 394.1 394.950 843.9 800.7 802.0 -421.3 -412.2 -422.1 530.8 486.5 470.760 1009.2 954.2 965.5 -494.5 -488.5 -516.2 640.1 596.9 572.070 1164.7 1145.1 1127.2 -573.2 -571.0 -608.9 742.9 682.2 672.480 1341.6 1289.9 1296.6 -657.0 -661.9 -696.5 837.8 784.3 763.490 1532.8 1453.8 1451.1 -742.0 -746.0 -784.9 930.8 880.7 869.4
100 1711.5 1619.4 1624.1 -821.8 -830.4 -868.8 1012.6 970.4 965.7
SG21 CP1B Load Condition A Load Condition B Load Condition C
% Load Run 01 Run 02 Run 03 Run 01 Run 02 Run 03 Run 01 Run 02 Run 03 0 -28.0 -25.3 -21.0 43.6 18.0 45.9 21.2 -21.6 -26.210 -110.8 -108.7 -123.4 180.1 160.0 179.3 57.0 80.6 -0.820 -221.9 -213.3 -195.4 342.3 310.4 337.5 96.8 103.4 72.230 -321.8 -302.8 -304.0 487.3 476.8 486.3 153.8 138.0 125.440 -416.3 -372.3 -389.6 647.6 642.7 653.6 186.9 180.0 171.450 -507.8 -465.6 -480.4 813.5 787.9 798.3 246.7 252.9 242.360 -613.6 -565.6 -560.7 980.3 944.6 963.4 305.9 294.2 284.070 -711.2 -680.0 -674.0 1139.1 1100.6 1123.3 354.8 323.7 306.380 -810.9 -750.3 -773.9 1301.3 1268.7 1285.3 396.7 366.1 362.990 -930.5 -858.7 -869.7 1468.5 1426.5 1458.3 433.4 428.6 400.7
100 -1047.6 -960.9 -980.4 1621.2 1589.6 1614.5 501.7 474.9 446.7
SG22 CP1B Load Condition A Load Condition B Load Condition C
% Load Run 01 Run 02 Run 03 Run 01 Run 02 Run 03 Run 01 Run 02 Run 03 0 -27.9 -9.4 -19.5 46.9 20.8 49.5 30.6 3.2 -16.610 -89.2 -91.9 -96.2 157.1 152.9 172.8 64.2 107.6 17.020 -186.3 -170.1 -152.4 302.3 303.2 305.6 109.5 130.2 84.930 -255.6 -238.6 -239.3 422.7 424.3 419.5 159.8 153.6 133.740 -351.9 -307.3 -319.6 567.9 567.5 593.1 208.7 209.0 176.850 -420.7 -389.6 -403.4 729.3 685.7 714.3 283.9 268.2 249.960 -523.5 -471.2 -482.8 855.0 833.1 856.7 360.5 309.8 300.370 -608.1 -575.7 -544.2 991.9 964.4 999.7 398.5 348.5 327.280 -679.6 -629.0 -637.7 1135.6 1106.1 1143.7 455.5 393.8 388.590 -773.3 -697.0 -717.1 1290.5 1256.5 1302.6 489.7 464.5 422.9
100 -864.9 -788.1 -803.1 1424.6 1404.4 1429.6 551.2 529.4 462.9
SG23 CP1B Load Condition A Load Condition B Load Condition C
% Load Run 01 Run 02 Run 03 Run 01 Run 02 Run 03 Run 01 Run 02 Run 03 0 9.4 -13.8 -6.1 -40.6 -10.8 -12.1 64.6 46.9 -26.610 200.6 181.8 193.6 -96.9 -70.3 -70.7 194.6 152.4 138.520 404.3 402.4 402.0 -164.6 -136.1 -137.0 308.5 286.2 250.330 615.9 622.7 629.5 -223.7 -208.7 -206.4 408.7 417.2 403.440 836.5 823.0 835.0 -288.6 -281.3 -275.6 550.1 558.6 561.850 1051.1 1027.8 1050.9 -351.8 -344.7 -335.4 677.5 692.6 691.360 1263.3 1245.8 1258.5 -436.3 -413.3 -400.1 812.4 845.7 842.170 1469.2 1468.3 1467.9 -507.9 -482.5 -465.0 949.3 991.7 986.880 1668.1 1651.2 1681.1 -579.6 -553.9 -535.1 1086.9 1130.6 1110.490 1871.4 1863.8 1884.3 -654.6 -623.7 -612.2 1230.5 1252.7 1245.3
100 2090.4 2065.1 2096.1 -723.4 -696.4 -681.4 1360.6 1393.5 1381.6
B-14

SG24 CP1B Load Condition A Load Condition B Load Condition C
% Load Run 01 Run 02 Run 03 Run 01 Run 02 Run 03 Run 01 Run 02 Run 03 0 3.3 -9.7 -31.0 -16.4 -34.8 -54.3 -42.4 -3.8 -2.510 185.5 174.6 172.1 -95.9 -107.9 -118.0 82.8 87.8 132.820 380.4 363.5 357.0 -186.6 -186.6 -204.4 209.5 212.2 230.830 559.5 544.0 539.0 -277.5 -280.1 -286.4 333.2 333.1 336.840 730.2 695.2 701.3 -365.9 -370.2 -383.3 473.7 452.9 447.550 899.8 868.6 882.5 -472.3 -452.6 -468.7 608.2 558.9 535.160 1079.4 1050.0 1045.7 -563.3 -544.4 -568.1 730.6 680.3 647.070 1258.9 1252.5 1226.6 -651.2 -632.4 -667.5 844.1 791.2 765.880 1440.2 1403.6 1410.1 -745.1 -733.1 -763.5 958.9 905.5 864.490 1640.8 1589.6 1580.0 -838.4 -826.1 -857.7 1071.4 1010.2 991.4
100 1830.1 1762.2 1772.8 -927.8 -919.8 -947.6 1167.6 1121.5 1103.7
SG25-45 CP1B Load Condition A Load Condition B Load Condition C
% Load Run 01 Run 02 Run 03 Run 01 Run 02 Run 03 Run 01 Run 02 Run 03 0 -47.1 -115.0 -77.7 -5.5 65.7 74.8 109.6 6.6 -271.010 253.9 214.3 237.7 67.5 103.8 121.0 502.5 393.5 192.920 646.1 675.1 653.0 114.0 179.2 200.8 866.5 801.4 596.330 1095.0 1153.8 1197.9 196.7 238.5 258.1 1202.0 1193.7 1113.440 1575.8 1660.2 1641.2 253.5 280.4 328.7 1599.6 1621.9 1624.550 2023.1 2060.7 2109.9 398.8 369.8 395.6 1984.6 2069.9 2056.260 2434.1 2518.4 2536.4 422.6 433.3 506.4 2412.4 2514.6 2472.570 2847.0 2916.6 2927.3 492.9 512.0 602.7 2815.0 2918.9 2854.880 3197.1 3280.6 3327.0 551.3 600.7 689.1 3202.8 3312.0 3211.290 3506.5 3691.0 3725.8 623.7 675.6 752.2 3600.2 3667.2 3581.9
100 3903.6 4045.1 4110.6 695.8 733.0 820.8 3996.4 4074.9 3989.8
SG25-H CP1B Load Condition A Load Condition B Load Condition C
% Load Run 01 Run 02 Run 03 Run 01 Run 02 Run 03 Run 01 Run 02 Run 03 0 166.7 74.7 143.6 -45.4 74.8 95.9 455.5 252.3 -232.510 800.3 719.4 773.4 -13.3 62.2 108.7 1108.6 885.9 564.520 1525.4 1569.9 1590.2 5.6 89.3 130.1 1711.6 1578.6 1229.330 2408.9 2507.7 2562.3 44.5 98.1 136.4 2278.4 2279.1 2140.740 3354.6 3433.8 3452.5 64.0 93.7 172.1 3023.0 3051.3 3066.350 4274.3 4285.6 4376.6 133.9 233.6 3734.4 3865.1 3863.060 5138.4 5198.0 5281.6 119.5 153.1 319.6 4512.0 4704.5 4682.070 5975.0 6080.6 6112.4 125.7 177.8 377.0 5275.8 5475.8 5409.380 6753.4 6858.8 6976.7 136.4 230.9 421.0 6017.9 6221.5 6106.490 7483.1 7709.8 7815.9 146.7 253.8 427.9 6776.9 6915.2 6801.5
100 8377.8 8514.2 8649.8 168.3 262.6 451.1 7547.7 7672.5 7550.3
SG25-L CP1B Load Condition A Load Condition B Load Condition C
% Load Run 01 Run 02 Run 03 Run 01 Run 02 Run 03 Run 01 Run 02 Run 03 0 -8.3 -57.1 -27.8 1.9 60.6 103.5 250.2 96.7 -155.210 216.8 162.7 172.4 134.9 193.1 216.2 568.1 475.0 245.920 448.7 485.4 491.5 308.3 344.1 386.7 865.0 803.4 632.830 761.4 843.1 852.9 448.9 491.3 515.3 1173.3 1154.2 1089.040 1089.3 1183.3 1172.4 612.6 653.6 691.9 1527.4 1545.1 1530.650 1416.6 1488.7 1517.2 818.2 805.3 854.2 1901.2 1976.2 1967.260 1704.9 1811.7 1833.4 936.9 959.1 1067.7 2313.4 2388.7 2371.070 1989.8 2087.9 2108.5 1072.3 1112.7 1241.9 2692.8 2784.7 2726.880 2233.0 2374.1 2399.4 1233.3 1299.8 1392.0 3075.3 3144.3 3100.990 2441.0 2655.2 2679.8 1401.2 1464.2 1569.8 3455.3 3514.5 3447.7
100 2717.7 2917.9 2935.5 1552.0 1617.8 1722.5 3852.1 3899.8 3807.9
B-15

SG26-45 CP1B Load Condition A Load Condition B Load Condition C
% Load Run 01 Run 02 Run 03 Run 01 Run 02 Run 03 Run 01 Run 02 Run 03 0 -85.0 -144.4 -193.2 92.6 -73.1 -94.7 -339.1 -151.3 -90.310 269.5 276.0 250.9 56.9 -103.2 -123.2 112.7 198.7 288.820 731.5 662.2 621.5 -77.3 -145.7 -162.8 547.0 585.7 623.630 1078.9 999.7 1039.1 -113.5 -195.8 -210.3 960.0 941.8 962.340 1432.6 1387.9 1346.8 -189.9 -282.7 -294.6 1311.2 1306.5 1304.050 1756.5 1670.8 1705.0 -249.5 -314.1 -415.1 1676.9 1631.3 1570.760 2090.8 2049.4 2013.7 -272.4 -379.4 -520.8 2018.9 1961.7 1855.970 2475.0 2389.7 2331.1 -277.2 -419.4 -588.6 2343.0 2238.6 2187.680 2823.9 2685.2 2679.0 -353.8 -528.6 -634.2 2656.2 2588.5 2461.690 3184.9 3077.8 3027.4 -400.3 -589.1 -702.5 2975.5 2888.4 2839.2
100 3562.3 3380.2 3431.4 -450.3 -655.8 -769.7 3279.3 3237.8 3222.0
SG26-H CP1B Load Condition A Load Condition B Load Condition C
% Load Run 01 Run 02 Run 03 Run 01 Run 02 Run 03 Run 01 Run 02 Run 03 0 4.2 -61.7 -158.0 33.9 -258.0 -266.6 -374.9 -124.3 91.010 817.0 794.1 741.4 -150.5 -370.8 -397.0 348.0 464.0 723.120 1639.7 1500.6 1525.7 -429.0 -577.8 -598.6 1069.8 1107.2 1285.230 2325.1 2165.0 2173.2 -649.4 -757.9 -788.7 1776.7 1752.0 1827.640 3001.4 2802.9 2808.3 -856.7 -948.6 -1006.5 2426.5 2387.9 2389.150 3661.0 3439.7 3478.7 -1177.6 -1168.7 -1270.8 3118.9 2946.6 2865.960 4355.2 4154.7 4163.5 -1337.9 -1377.8 -1578.2 3711.8 3557.0 3449.970 5090.8 4932.3 4828.0 -1498.1 -1589.7 -1843.1 4309.1 4072.1 4064.980 5857.3 5563.9 5576.1 -1739.0 -1911.4 -2077.3 4894.6 4704.9 4609.490 6697.9 6332.5 6276.6 -1985.0 -2156.5 -2326.1 5494.3 5299.2 5294.7
100 7526.5 7026.2 7104.0 -2227.1 -2383.7 -2568.7 6080.4 5914.9 5942.7
SG26-L CP1B Load Condition A Load Condition B Load Condition C
% Load Run 01 Run 02 Run 03 Run 01 Run 02 Run 03 Run 01 Run 02 Run 03 0 -59.1 -83.9 -112.5 61.0 -22.1 -13.8 -115.1 -55.6 -32.010 90.1 87.7 66.6 126.2 54.4 37.9 149.4 191.0 192.920 285.8 255.7 233.8 163.0 116.5 118.9 413.3 421.2 438.730 428.9 404.8 421.9 231.9 182.5 174.3 679.3 650.6 665.040 573.5 583.2 548.6 294.8 241.0 232.8 893.7 888.8 882.550 707.9 699.2 711.8 363.1 308.4 250.8 1141.1 1124.3 1098.660 838.9 863.1 837.5 446.3 366.9 306.2 1381.6 1341.8 1295.170 1005.9 985.5 960.5 536.9 439.5 364.7 1598.9 1538.9 1512.380 1144.6 1118.9 1100.9 594.5 483.8 424.0 1815.9 1765.3 1719.890 1276.8 1284.0 1245.3 677.8 550.6 496.6 2040.5 1983.3 1965.1
100 1423.2 1400.6 1410.0 743.6 610.4 549.1 2267.2 2223.7 2214.3
SG31 CP1B Load Condition A Load Condition B Load Condition C
% Load Run 01 Run 02 Run 03 Run 01 Run 02 Run 03 Run 01 Run 02 Run 03 0 -37.0 -54.9 -49.5 42.0 41.0 66.3 91.1 28.3 -56.310 -35.4 -54.8 -60.9 145.5 153.3 156.6 185.0 165.9 58.020 -27.0 -12.4 -22.9 274.4 275.6 297.1 281.8 263.7 208.330 2.4 37.0 37.5 386.1 397.3 406.2 395.3 374.9 353.940 31.1 91.7 71.0 514.1 529.2 542.2 495.6 500.5 486.550 61.5 126.2 128.4 662.5 651.1 655.3 620.2 650.3 642.560 72.9 160.7 150.6 781.5 775.6 811.7 764.7 774.3 760.470 102.7 152.0 159.5 900.5 903.4 947.5 883.9 903.0 869.080 97.9 183.5 171.5 1031.5 1047.7 1067.4 1010.1 1012.7 997.290 72.1 199.1 187.8 1173.1 1182.9 1216.3 1134.8 1141.9 1110.7
100 71.5 203.2 186.7 1297.0 1310.9 1341.4 1272.3 1273.3 1228.6
B-16

SG32 CP1B Load Condition A Load Condition B Load Condition C
% Load Run 01 Run 02 Run 03 Run 01 Run 02 Run 03 Run 01 Run 02 Run 03 0 -33.7 -43.9 -49.0 28.8 14.3 32.7 8.6 -1.1 -19.910 -27.1 -32.4 -41.4 132.1 121.7 114.5 118.3 133.6 76.720 -4.9 -6.0 -15.8 246.5 228.0 238.4 236.2 233.9 222.030 7.0 18.5 27.5 354.9 335.8 333.9 369.0 344.6 342.140 18.5 57.9 37.0 473.9 449.9 446.7 465.0 464.5 452.150 32.5 63.1 68.3 597.8 556.5 533.0 590.3 598.4 588.360 34.5 88.8 78.1 717.4 663.9 656.4 723.7 707.7 690.270 55.5 74.3 80.4 833.0 777.0 768.1 833.6 820.0 796.480 53.9 95.7 87.0 946.6 891.0 870.0 952.5 928.2 914.290 41.0 112.7 100.1 1076.2 1006.3 994.9 1069.0 1050.4 1031.1
100 45.4 111.0 109.8 1186.3 1116.5 1097.6 1197.5 1173.4 1150.2
SG33 CP1B Load Condition A Load Condition B Load Condition C
% Load Run 01 Run 02 Run 03 Run 01 Run 02 Run 03 Run 01 Run 02 Run 03 0 42.2 -4.3 31.9 -79.9 16.6 26.5 218.8 97.7 -119.510 379.7 325.6 354.3 -91.1 -9.1 17.8 494.7 388.0 255.220 692.1 714.5 748.4 -81.2 -23.8 -4.9 725.6 668.3 521.130 1083.1 1132.7 1142.6 -94.2 -45.7 -29.8 943.9 957.7 899.040 1499.3 1510.4 1539.2 -99.6 -60.9 -33.9 1261.0 1276.3 1283.750 1909.9 1902.3 1937.9 -85.2 -78.8 -8.7 1561.0 1613.5 1617.060 2299.8 2296.1 2349.1 -146.4 -93.3 4.6 1878.4 1974.0 1979.070 2664.3 2706.4 2724.7 -181.8 -116.0 -2.9 2200.0 2302.9 2284.880 3017.5 3053.9 3116.4 -196.3 -116.1 -18.5 2511.7 2612.2 2582.290 3359.1 3421.4 3482.1 -225.2 -136.3 -43.3 2824.2 2901.5 2864.9
100 3746.1 3787.3 3842.6 -245.9 -158.5 -62.9 3140.1 3210.0 3159.1
SG34 CP1B Load Condition A Load Condition B Load Condition C
% Load Run 01 Run 02 Run 03 Run 01 Run 02 Run 03 Run 01 Run 02 Run 03 0 -20.2 -31.5 -73.5 0.2 -108.3 -118.6 -198.7 -75.9 37.710 284.5 286.0 267.5 -94.5 -183.2 -195.0 50.8 105.9 244.120 585.6 533.7 544.7 -234.3 -297.1 -313.2 289.0 314.1 403.030 825.5 759.5 760.4 -343.4 -400.8 -418.6 517.7 520.2 557.640 1060.6 970.9 978.4 -456.1 -514.3 -545.2 725.4 715.1 719.750 1286.1 1192.8 1203.2 -621.1 -635.3 -685.3 941.5 870.5 842.360 1530.1 1436.0 1439.7 -712.8 -751.6 -852.1 1113.5 1055.1 1015.870 1787.6 1717.8 1675.1 -804.7 -872.0 -995.6 1294.1 1199.5 1205.780 2063.7 1932.0 1937.7 -930.2 -1036.8 -1118.6 1466.1 1397.1 1365.390 2372.7 2201.1 2179.7 -1058.0 -1165.4 -1253.0 1642.3 1572.4 1583.8
100 2651.5 2443.8 2472.4 -1176.1 -1283.3 -1379.3 1806.0 1759.0 1782.9
SG35 CP1B Load Condition A Load Condition B Load Condition C
% Load Run 01 Run 02 Run 03 Run 01 Run 02 Run 03 Run 01 Run 02 Run 03 0 -41.0 -51.7 -50.7 45.8 46.3 85.7 121.2 46.0 -35.310 -84.4 -101.0 -113.7 188.0 199.5 204.6 196.4 184.6 58.520 -127.3 -105.3 -117.6 367.7 362.5 390.1 283.2 266.8 215.230 -147.3 -99.9 -105.4 517.4 523.6 535.2 397.3 369.9 351.140 -171.8 -90.1 -117.2 693.4 702.8 715.3 484.2 489.0 468.450 -188.2 -107.5 -110.8 884.2 861.9 865.3 606.6 640.3 631.860 -226.3 -118.8 -136.5 1050.2 1027.2 1069.4 751.6 755.1 741.370 -251.8 -183.3 -175.4 1208.6 1195.4 1247.7 865.6 883.4 844.580 -304.3 -186.9 -210.9 1384.8 1386.5 1404.5 993.2 985.4 977.890 -380.3 -216.9 -238.9 1574.9 1564.7 1603.4 1116.4 1120.0 1087.6
100 -429.5 -256.8 -289.6 1739.7 1735.5 1769.8 1257.4 1251.7 1200.3
B-17

SG36 CP1B Load Condition A Load Condition B Load Condition C
% Load Run 01 Run 02 Run 03 Run 01 Run 02 Run 03 Run 01 Run 02 Run 03 0 -31.9 -46.2 -54.7 32.5 24.6 51.4 26.4 -1.4 -32.310 -41.3 -53.2 -67.8 167.2 164.3 158.3 145.0 157.3 77.120 -36.0 -36.9 -51.6 322.1 304.5 322.0 276.3 269.5 249.230 -37.2 -19.5 -15.3 464.0 447.3 449.2 428.0 396.2 391.540 -38.3 15.1 -13.9 621.8 599.3 600.9 536.4 534.8 518.450 -36.3 7.9 10.6 788.1 740.6 719.8 680.3 692.8 681.960 -48.2 25.5 3.5 944.1 882.9 887.1 836.1 817.2 798.370 -38.0 -8.9 -9.9 1092.6 1032.3 1038.0 962.5 948.2 920.080 -53.8 5.3 -16.8 1243.2 1186.9 1173.5 1099.5 1070.0 1056.890 -86.8 11.9 -14.5 1413.3 1339.9 1340.7 1235.2 1211.7 1187.8
100 -97.1 -3.4 -18.3 1557.3 1486.1 1479.0 1383.9 1353.2 1322.4
SG37 CP1B Load Condition A Load Condition B Load Condition C
% Load Run 01 Run 02 Run 03 Run 01 Run 02 Run 03 Run 01 Run 02 Run 03 0 37.6 3.3 33.1 -67.7 15.7 19.7 170.5 77.4 -92.210 288.2 249.0 272.2 -80.4 -13.1 7.1 368.2 284.7 184.020 524.6 542.8 566.6 -80.2 -30.9 -17.5 532.4 489.2 372.730 820.0 857.7 865.6 -92.9 -56.7 -44.8 683.7 696.4 651.140 1137.4 1143.9 1165.4 -105.3 -78.1 -58.5 916.9 927.2 935.950 1446.7 1441.8 1467.8 -97.1 -97.2 -44.8 1132.1 1169.5 1176.060 1744.5 1736.8 1779.1 -153.3 -116.2 -43.7 1359.1 1434.9 1440.170 2023.9 2051.9 2064.2 -186.2 -139.2 -56.2 1592.8 1673.3 1664.780 2288.5 2312.9 2360.6 -204.0 -148.0 -73.9 1817.5 1899.8 1878.990 2546.3 2592.7 2636.7 -234.4 -172.2 -103.5 2048.7 2105.7 2081.6
100 2839.1 2867.2 2910.6 -257.2 -196.1 -125.6 2277.8 2331.9 2297.7
SG38 CP1B Load Condition A Load Condition B Load Condition C
% Load Run 01 Run 02 Run 03 Run 01 Run 02 Run 03 Run 01 Run 02 Run 03 0 -87.3 -98.2 -182.0 4.4 -239.9 -261.6 -458.8 -186.2 74.810 512.7 525.6 490.4 -231.6 -431.6 -447.4 -3.6 115.6 432.320 1095.7 988.3 1012.2 -571.2 -704.5 -737.0 422.8 481.2 680.230 1546.8 1401.5 1403.2 -834.5 -957.6 -989.0 823.2 835.3 918.840 1984.5 1784.5 1804.3 -1113.1 -1236.0 -1294.6 1181.1 1159.9 1173.650 2397.0 2192.0 2212.1 -1499.2 -1524.5 -1623.2 1550.9 1397.3 1341.660 2854.7 2637.1 2647.4 -1726.7 -1806.5 -2018.7 1821.8 1700.4 1623.670 3332.2 3167.9 3083.4 -1956.6 -2096.4 -2355.6 2119.7 1919.7 1942.080 3853.3 3554.2 3567.8 -2259.0 -2483.7 -2644.9 2393.2 2252.5 2190.990 4441.2 4049.5 4012.0 -2569.6 -2794.6 -2968.6 2676.8 2532.5 2565.3
100 4952.6 4497.4 4556.9 -2854.0 -3079.2 -3267.9 2926.7 2833.4 2896.5
SG39 CP1B Load Condition A Load Condition B Load Condition C
% Load Run 01 Run 02 Run 03 Run 01 Run 02 Run 03 Run 01 Run 02 Run 03 0 -55.8 -61.5 -65.1 53.6 41.0 73.8 55.0 9.8 -32.910 -146.0 -153.6 -166.7 186.3 182.6 181.2 87.8 92.8 -0.720 -220.5 -208.3 -229.1 342.3 332.1 352.9 140.3 133.5 106.530 -292.4 -261.9 -262.9 479.9 479.8 486.4 216.4 187.1 177.740 -370.2 -296.6 -328.4 637.7 639.7 646.2 248.2 249.5 231.150 -444.2 -372.2 -378.1 811.0 788.3 773.0 314.3 337.1 327.560 -535.9 -435.7 -462.6 968.5 939.0 953.7 399.4 386.1 369.170 -607.8 -556.7 -552.5 1118.5 1095.3 1117.2 453.8 451.4 417.380 -707.7 -613.9 -643.7 1276.4 1267.1 1261.7 520.9 497.8 488.590 -830.1 -691.4 -721.0 1452.7 1430.2 1442.7 586.0 572.3 545.9
100 -929.5 -785.2 -817.2 1603.3 1585.7 1594.3 664.3 646.2 607.2
B-18

SG40 CP1B Load Condition A Load Condition B Load Condition C
% Load Run 01 Run 02 Run 03 Run 01 Run 02 Run 03 Run 01 Run 02 Run 03 0 -26.5 -35.2 -40.4 19.2 27.6 49.7 41.2 9.7 -21.010 -56.3 -65.5 -76.5 140.0 148.6 142.6 118.9 126.2 51.520 -74.9 -71.1 -83.6 281.7 271.4 284.7 208.5 201.9 180.830 -94.6 -74.7 -72.4 406.8 394.8 396.2 316.8 290.9 285.340 -114.1 -64.1 -87.4 546.8 529.8 529.5 390.0 390.3 376.550 -130.0 -86.1 -85.3 693.4 652.8 637.8 492.5 508.7 502.160 -158.9 -91.2 -109.1 828.6 778.4 786.9 607.7 597.4 586.670 -170.8 -140.9 -138.2 957.8 909.0 919.6 698.7 695.9 673.280 -204.6 -145.9 -164.6 1091.2 1047.8 1038.0 800.1 781.9 776.090 -255.2 -161.7 -182.0 1241.1 1182.9 1185.0 899.9 887.2 869.1
100 -286.5 -193.4 -208.4 1368.2 1311.0 1306.7 1011.9 992.0 965.4
SG41 CP1B Load Condition A Load Condition B Load Condition C
% Load Run 01 Run 02 Run 03 Run 01 Run 02 Run 03 Run 01 Run 02 Run 03 0 38.3 10.5 37.4 -61.5 10.9 14.7 148.3 76.2 -63.210 241.9 212.2 232.9 -74.3 -19.7 -1.3 304.2 237.2 156.520 433.9 450.4 471.6 -79.2 -40.5 -31.0 431.6 399.2 301.530 675.1 706.2 714.3 -95.3 -67.6 -60.7 549.6 562.1 523.040 933.5 940.3 958.9 -112.6 -92.1 -79.3 732.9 745.2 750.950 1187.6 1182.5 1204.3 -111.7 -115.0 -75.4 904.6 939.4 941.260 1431.6 1425.8 1460.0 -164.2 -135.9 -83.8 1087.4 1152.2 1154.370 1659.1 1683.3 1695.6 -197.4 -162.5 -100.7 1275.1 1344.5 1333.780 1878.6 1898.3 1939.1 -217.8 -177.8 -123.7 1456.3 1526.9 1505.590 2091.2 2128.3 2168.6 -249.5 -204.5 -156.2 1640.1 1693.9 1669.6
100 2332.3 2357.6 2394.4 -276.1 -230.2 -181.4 1823.7 1876.1 1842.6
SG42 CP1B Load Condition A Load Condition B Load Condition C
% Load Run 01 Run 02 Run 03 Run 01 Run 02 Run 03 Run 01 Run 02 Run 03 0 -34.9 -40.3 -74.4 -6.0 -91.8 -101.2 -192.1 -79.7 22.710 194.4 200.4 185.5 -91.8 -166.9 -173.5 -15.7 34.2 159.920 418.0 377.5 384.7 -220.6 -272.0 -285.1 148.7 173.4 251.730 589.0 532.5 533.6 -318.0 -369.0 -383.0 301.1 307.3 339.840 754.7 678.3 684.5 -423.9 -477.5 -501.9 436.6 429.4 434.250 910.4 831.1 837.3 -571.2 -587.8 -629.7 576.0 516.5 492.760 1082.8 1000.4 1001.7 -658.2 -696.8 -783.0 676.5 629.0 595.970 1264.3 1201.5 1166.9 -745.2 -808.5 -913.7 785.9 707.0 714.080 1463.0 1348.1 1352.0 -860.6 -958.9 -1025.3 886.4 831.4 804.590 1689.4 1537.6 1520.3 -979.0 -1077.9 -1150.7 989.5 935.0 945.3
100 1882.3 1707.6 1729.0 -1087.3 -1187.7 -1266.9 1080.4 1046.8 1069.5
SG43-45 CP1B Load Condition A Load Condition B Load Condition C
% Load Run 01 Run 02 Run 03 Run 01 Run 02 Run 03 Run 01 Run 02 Run 03 0 20.3 -1.1 -62.3 -79.0 2.3 -225.6 -109.7 -0.7 141.010 540.6 525.9 486.1 -154.1 -109.9 -302.7 317.9 391.6 535.420 1013.9 944.9 995.3 -218.1 -178.3 -402.5 754.6 780.1 909.630 1433.3 1358.9 1333.1 -335.1 -343.3 -513.6 1216.0 1198.5 1254.640 1831.7 1711.1 1735.7 -385.0 -468.7 -630.3 1637.2 1612.3 1614.550 2241.2 2135.9 2141.6 -594.1 -429.4 -766.3 2109.5 1988.8 1966.860 2669.8 2557.5 2583.4 -613.4 -604.5 -916.0 2502.4 2401.4 2380.070 3104.4 3055.4 2995.7 -766.1 -660.8 -1100.7 2909.8 2769.1 2794.480 3581.2 3457.5 3461.9 -857.4 -800.4 -1260.5 3317.0 3180.0 3189.590 4110.8 3911.7 3879.7 -1003.2 -941.2 -1430.4 3723.1 3602.5 3638.1
100 4611.3 4350.8 4369.3 -1052.8 -1064.8 -1600.4 4120.1 4003.9 4045.1
B-19

SG43-H CP1B Load Condition A Load Condition B Load Condition C
% Load Run 01 Run 02 Run 03 Run 01 Run 02 Run 03 Run 01 Run 02 Run 03 0 -41.9 -60.8 -170.3 14.2 -215.5 -251.1 -381.4 -143.4 85.010 749.5 749.3 701.7 -201.7 -354.8 -408.3 272.8 390.9 673.520 1513.6 1409.8 1454.0 -475.2 -602.3 -647.3 912.4 964.2 1164.930 2160.0 2035.0 2014.9 -733.5 -819.0 -863.4 1546.0 1548.6 1636.040 2784.7 2591.9 2615.2 -959.9 -1034.1 -1114.0 2131.5 2114.3 2121.250 3403.6 3208.9 3231.3 -1327.6 -1296.6 -1389.4 2752.6 2596.5 2546.160 4056.9 3861.6 3876.8 -1519.9 -1516.2 -1724.8 3263.5 3144.1 3080.970 4731.2 4610.9 4508.0 -1722.4 -1768.7 -2018.9 3797.1 3609.2 3632.480 5457.9 5201.9 5208.0 -1981.9 -2100.1 -2283.8 4319.5 4164.9 4127.790 6257.4 5897.8 5846.2 -2248.4 -2364.8 -2551.9 4837.5 4690.0 4735.6
100 6969.1 6548.6 6590.7 -2502.9 -2604.4 -2818.2 5319.3 5221.6 5279.5
SG43-L CP1B Load Condition A Load Condition B Load Condition C
% Load Run 01 Run 02 Run 03 Run 01 Run 02 Run 03 Run 01 Run 02 Run 03 0 -24.2 -45.4 -69.5 -153.7 -349.3 -27.1 -43.5 -3.7 17.510 185.6 181.3 154.5 19.4 -287.9 56.8 227.3 264.3 265.820 388.2 367.7 375.9 114.8 -245.7 125.5 493.0 499.2 528.930 564.0 552.2 548.9 183.7 -186.7 175.7 776.0 755.2 768.440 736.4 726.9 714.1 260.6 -113.5 218.2 1025.4 1017.1 1009.050 911.1 896.5 903.7 294.7 -88.8 238.7 1312.7 1282.8 1255.960 1080.5 1083.4 1080.5 357.4 -118.8 291.9 1583.4 1537.6 1503.370 1269.0 1269.5 1243.0 423.1 66.8 339.9 1832.0 1764.9 1749.380 1457.4 1448.8 1434.4 488.4 -105.5 400.2 2087.2 2020.2 1999.690 1649.3 1639.2 1611.0 559.1 -357.3 474.4 2341.0 2287.5 2270.6
100 1846.4 1813.4 1815.6 611.6 -312.7 533.4 2596.7 2548.6 2534.3
SG46 CP1B Load Condition A Load Condition B Load Condition C
% Load Run 01 Run 02 Run 03 Run 01 Run 02 Run 03 Run 01 Run 02 Run 03 0 463.1 94.9 67.5 228.6 112.9 122.910 264.4 185.9 138.4 324.7 242.2 211.320 325.7 290.0 244.0 416.9 319.7 338.730 281.4 407.0 337.7 526.3 415.2 447.540 375.6 533.0 464.4 613.8 519.1 551.150 416.2 661.8 553.1 730.0 648.3 680.960 522.3 962.0 678.2 917.5 797.2 782.270 600.1 1048.6 787.8 1085.8 954.8 945.980 693.5 1153.7 896.4 1115.5 982.2 1025.190 806.1 1269.4 1026.8 1411.5 1149.6 1120.5
100 905.6 1365.7 1128.6 1617.5 1378.9 1496.8
SG47 CP1B Load Condition A Load Condition B Load Condition C
% Load Run 01 Run 02 Run 03 Run 01 Run 02 Run 03 Run 01 Run 02 Run 03 0 6.4 -20.8 -6663.4 -380.5 -537.0 -2505.3 -97.6 20.410 274.1 266.0 -6102.9 -1431.1 -732.3 -1380.9 49.9 195.920 552.4 482.3 511.2 -4266.1 -791.6 -1099.0 -922.8 237.8 332.030 768.0 685.3 704.1 -3116.4 -1343.2 -1026.4 -1018.6 415.6 457.740 974.0 874.5 904.6 -2696.7 -390.5 -451.5 -1259.7 580.8 583.650 1171.6 1139.5 1164.9 -2468.7 -2647.8 -1005.3 -1123.2 703.4 679.960 1390.9 1357.0 1392.6 -2526.5 -5351.2 -1307.3 -7160.8 850.1 820.570 1688.7 1609.8 1607.7 -1509.2 -4655.0 -1037.2 -1495.5 970.1 980.680 1935.5 1796.6 1845.4 -4268.9 -4024.2 -1529.4 -1415.2 1127.9 1108.790 2206.9 2034.2 2064.2 -5935.7 -4087.3 -1899.6 -1310.5 1269.5 1288.0
100 2250.0 2324.5 -6986.2 -4425.6 -2224.9 -6601.5 1417.2 1448.0
B-20

SG48 CP1B Load Condition A Load Condition B Load Condition C
% Load Run 01 Run 02 Run 03 Run 01 Run 02 Run 03 Run 01 Run 02 Run 03 0 -6.9 -7.0 -10.5 13.4 10.0 37.2 66.7 34.5 7.410 -8.0 -12.2 -29.2 117.9 120.6 128.3 147.9 156.2 88.020 -30.4 -22.1 -17.4 248.1 230.2 252.3 228.9 224.7 205.230 -41.0 -19.0 -24.9 358.2 349.0 351.9 329.1 313.6 304.140 -50.7 -18.6 -32.3 484.8 476.8 479.0 410.9 410.9 398.850 -53.2 -21.0 -26.3 609.7 584.4 583.5 522.3 529.4 523.960 -67.1 -24.0 -27.2 729.7 698.3 714.6 637.2 631.6 622.470 -74.0 -44.3 -44.6 842.2 813.2 829.0 739.0 730.8 711.080 -86.8 -33.0 -50.3 964.3 935.0 936.5 843.7 824.0 823.290 -110.2 -43.3 -57.6 1092.9 1054.8 1069.3 942.7 940.2 920.6
100 -122.9 -52.4 -71.2 1207.1 1173.8 1180.4 1063.5 1047.7 1018.9
SG49 CP1B Load Condition A Load Condition B Load Condition C
% Load Run 01 Run 02 Run 03 Run 01 Run 02 Run 03 Run 01 Run 02 Run 03 0 -56.1 -77.3 -119.8 25.9 34.5 -266.4 -262.3 -128.2 -12.910 176.6 187.6 172.9 -102.2 -105.1 -302.4 -66.2 -9.8 139.020 461.0 408.4 397.6 -303.0 -256.9 -381.9 135.4 163.4 254.030 664.9 596.3 601.1 -501.8 -414.3 -473.9 318.2 316.0 356.040 857.5 783.1 777.8 -718.8 -588.2 -746.0 468.7 454.5 459.650 1034.8 955.1 966.1 -936.9 158.6 -927.9 615.0 547.9 515.560 1231.9 1158.7 1143.4 -1080.4 45.0 -1113.5 723.7 661.8 614.570 1446.1 1383.5 1333.6 -1209.2 -165.2 -1313.2 839.4 745.2 744.680 1665.2 1543.9 1537.6 -1407.8 -417.9 -1476.3 946.6 876.2 832.890 1913.8 1764.0 1729.9 -1595.0 -593.5 -1630.0 1060.8 981.3 986.3
100 2136.9 1949.9 1970.4 -1787.5 -766.2 -1756.8 1149.4 1098.1 1125.6
SG50 CP1B Load Condition A Load Condition B Load Condition C
% Load Run 01 Run 02 Run 03 Run 01 Run 02 Run 03 Run 01 Run 02 Run 03 0 14.7 26.8 53.4 10 142.8 149.2 159.4 20 293.0 278.6 303.5 30 422.6 415.1 421.4 40 569.2 561.0 569.1 50 724.3 690.9 696.8 60 862.9 824.5 855.3 70 993.3 959.9 993.1 80 1138.9 1106.6 1122.3 90 1290.1 1247.8 1277.2
100 1425.3 1386.9 1408.3
SG51 CP1B Load Condition A Load Condition B Load Condition C
% Load Run 01 Run 02 Run 03 Run 01 Run 02 Run 03 Run 01 Run 02 Run 03 0 -59.8 -86.9 -133.7 12.0 -87.8 -118.3 -248.7 -123.4 12.710 173.8 191.9 173.2 -75.9 -167.8 -199.0 -39.9 18.7 170.220 459.5 414.7 405.8 -224.9 -279.8 -313.8 178.8 205.5 310.730 666.8 598.9 598.4 -336.3 -388.4 -414.1 383.6 378.1 426.940 863.0 788.0 783.1 -458.5 -511.7 -548.7 549.8 539.1 545.750 1042.6 960.6 968.5 -618.4 -628.2 -696.8 721.7 652.2 623.060 1236.5 1160.9 1142.4 -706.3 -745.5 -865.0 851.5 783.4 741.370 1447.6 1385.1 1331.1 -794.4 -859.7 -1003.8 986.5 888.3 891.580 1670.8 1551.0 1536.9 -925.0 -1018.3 -1125.0 1116.4 1037.9 1003.490 1922.3 1772.3 1730.7 -1049.8 -1145.7 -1259.8 1249.7 1169.6 1184.2
100 2149.0 1959.0 1973.6 -1167.5 -1266.8 -1387.7 1361.5 1306.3 1347.1
B-21

SG01 CP2 Load Condition A Load Condition B Load Condition C
% Load Run 01 Run 02 Run 03 Run 01 Run 02 Run 03 Run 01 Run 02 Run 03 0 30.6 38.4 40.8 10 -64.3 210.9 121.5 20 -203.7 381.3 172.9 30 -282.0 566.7 264.4 40 -403.5 742.9 322.6 50 -505.3 937.4 426.9 60 -601.2 1133.5 500.3 70 -690.8 1308.4 590.1 80 -787.7 1503.0 671.8 90 -894.1 1699.2 779.6
100 -986.4 1868.4 833.0
SG02 CP2 Load Condition A Load Condition B Load Condition C
% Load Run 01 Run 02 Run 03 Run 01 Run 02 Run 03 Run 01 Run 02 Run 03 0 32.9 39.5 42.7 10 -61.7 199.5 107.5 20 -183.8 353.1 157.7 30 -259.5 524.0 242.8 40 -365.3 686.2 299.9 50 -459.6 862.9 396.7 60 -545.4 1044.5 465.0 70 -628.2 1208.1 547.6 80 -718.5 1385.1 622.5 90 -812.7 1567.9 722.1
100 -899.1 1724.8 771.4
SG03 CP2 Load Condition A Load Condition B Load Condition C
% Load Run 01 Run 02 Run 03 Run 01 Run 02 Run 03 Run 01 Run 02 Run 03 0 -80.1 -66.5 -78.6 10 190.4 -122.9 123.6 20 391.2 -158.0 265.4 30 614.3 -240.4 385.3 40 815.4 -312.0 505.5 50 1007.6 -393.3 621.5 60 1205.6 -473.0 754.6 70 1403.2 -555.4 883.9 80 1620.0 -614.8 1022.0 90 1825.1 -728.6 1129.8
100 2030.5 -782.2 1264.7
SG04 CP2 Load Condition A Load Condition B Load Condition C
% Load Run 01 Run 02 Run 03 Run 01 Run 02 Run 03 Run 01 Run 02 Run 03 0 22.1 2.2 -4.6 10 155.2 -98.4 59.7 20 395.4 -223.5 180.5 30 550.8 -297.2 287.0 40 761.1 -406.3 403.3 50 963.0 -506.6 504.3 60 1162.8 -617.0 612.2 70 1343.9 -698.7 714.9 80 1528.8 -807.6 808.1 90 1715.0 -906.5 881.1
100 1889.0 -1011.1 1004.3
B-22

SG05 CP2 Load Condition A Load Condition B Load Condition C
% Load Run 01 Run 02 Run 03 Run 01 Run 02 Run 03 Run 01 Run 02 Run 03 0 48.0 70.9 62.9 10 -74.6 265.4 135.7 20 -239.9 457.8 177.7 30 -344.7 645.9 264.6 40 -486.6 820.9 301.7 50 -610.1 1037.2 405.4 60 -733.5 1257.1 479.3 70 -839.9 1429.9 572.4 80 -963.4 1683.1 652.8 90 -1081.4 1888.8 748.8
100 -1197.1 2084.9 801.1
SG06 CP2 Load Condition A Load Condition B Load Condition C
% Load Run 01 Run 02 Run 03 Run 01 Run 02 Run 03 Run 01 Run 02 Run 03 0 -668.7 10.6 41.8 10 -757.0 176.3 121.4 20 -872.1 344.1 176.0 30 -943.8 513.8 268.4 40 -1041.4 685.0 317.8 50 -1127.3 878.1 422.4 60 -1212.1 1070.1 501.2 70 -1285.1 1212.9 595.7 80 -3982.7 1386.1 677.6 90 -2633.5 1568.3 772.4
100 -1812.0 1732.5 833.5
SG07 CP2 Load Condition A Load Condition B Load Condition C
% Load Run 01 Run 02 Run 03 Run 01 Run 02 Run 03 Run 01 Run 02 Run 03 0 -130.7 -115.9 -125.5 10 214.9 -148.5 150.6 20 394.0 -147.3 307.6 30 657.2 -219.2 440.2 40 855.3 -268.8 570.5 50 1048.5 -342.5 698.7 60 1252.6 -399.1 849.0 70 1461.9 -477.2 993.2 80 1696.7 -536.4 1153.5 90 1912.5 -651.5 1283.5
100 2138.1 -675.3 1426.5
SG08 CP2 Load Condition A Load Condition B Load Condition C
% Load Run 01 Run 02 Run 03 Run 01 Run 02 Run 03 Run 01 Run 02 Run 03 0 -14106.6 6002.5 16.9 10 -14045.9 -695.3 5.0 20 -14209.8 -919.7 84.9 30 -14113.2 -992.2 147.9 40 -13706.2 -890.0 246.6 50 -15373.9 -1299.6 308.4 60 -13306.3 -1926.9 369.0 70 -13497.9 -2397.7 423.9 80 -30042.5 -1776.7 469.5 90 -31310.8 -2721.2 514.1
100 -33197.2 -2837.6 587.6
B-23

SG09 CP2 Load Condition A Load Condition B Load Condition C
% Load Run 01 Run 02 Run 03 Run 01 Run 02 Run 03 Run 01 Run 02 Run 03 0 49.9 59.6 39.1 10 -76.0 231.2 114.4 20 -213.7 402.2 154.5 30 -314.2 562.6 237.6 40 -432.2 703.0 264.3 50 -535.3 901.3 361.2 60 -649.1 1098.4 432.7 70 -740.8 1255.2 519.7 80 -861.1 1448.2 587.8 90 -961.0 1632.8 660.1
100 -1067.0 1814.6 718.1
SG10 CP2 Load Condition A Load Condition B Load Condition C
% Load Run 01 Run 02 Run 03 Run 01 Run 02 Run 03 Run 01 Run 02 Run 03 0 45.6 58.7 37.0 10 -60.3 210.5 103.7 20 -167.9 355.8 151.9 30 -247.8 502.3 238.3 40 -341.5 627.6 274.4 50 -423.4 805.5 371.8 60 -513.5 983.7 445.3 70 -586.6 1125.8 531.5 80 -679.1 1295.4 599.9 90 -758.5 1462.6 674.8
100 -844.1 1619.2 735.6
SG11 CP2 Load Condition A Load Condition B Load Condition C
% Load Run 01 Run 02 Run 03 Run 01 Run 02 Run 03 Run 01 Run 02 Run 03 0 -106.9 -75.9 -104.6 10 186.7 -123.5 112.4 20 385.7 -162.6 273.3 30 616.9 -216.2 397.8 40 815.7 -270.4 533.3 50 1003.8 -349.3 654.5 60 1207.5 -416.3 790.2 70 1403.6 -491.9 921.0 80 1624.6 -543.4 1065.6 90 1822.7 -646.2 1189.8
100 2033.0 -690.0 1319.8
SG12 CP2 Load Condition A Load Condition B Load Condition C
% Load Run 01 Run 02 Run 03 Run 01 Run 02 Run 03 Run 01 Run 02 Run 03 0 3.8 6.0 -7.6 10 146.3 -99.5 49.6 20 365.9 -220.2 157.6 30 523.9 -291.0 247.2 40 719.5 -379.2 373.1 50 902.4 -476.0 459.3 60 1097.2 -596.1 546.9 70 1265.1 -666.0 630.5 80 1448.8 -768.0 719.0 90 1612.7 -861.9 803.4
100 1786.9 -966.0 895.4
B-24

SG13 CP2 Load Condition A Load Condition B Load Condition C
% Load Run 01 Run 02 Run 03 Run 01 Run 02 Run 03 Run 01 Run 02 Run 03 0 42.6 68.1 42.6 10 -81.2 244.6 110.6 20 -233.9 411.4 128.7 30 -346.3 567.0 204.3 40 -476.6 730.7 232.5 50 -592.3 937.8 317.4 60 -712.1 1133.5 377.1 70 -818.9 1302.6 449.3 80 -947.3 1492.1 508.9 90 -1056.8 1683.9 578.4
100 -1178.8 1866.1 624.6
SG14 CP2 Load Condition A Load Condition B Load Condition C
% Load Run 01 Run 02 Run 03 Run 01 Run 02 Run 03 Run 01 Run 02 Run 03 0 36.0 58.8 23.5 10 -54.9 218.4 107.7 20 -163.8 368.8 156.3 30 -241.7 517.4 249.3 40 -333.4 663.4 298.5 50 -414.3 855.3 400.2 60 -497.2 1035.4 477.8 70 -570.9 1188.7 566.4 80 -661.8 1363.1 641.0 90 -738.3 1535.9 722.5
100 -824.0 1698.8 786.4
SG15 CP2 Load Condition A Load Condition B Load Condition C
% Load Run 01 Run 02 Run 03 Run 01 Run 02 Run 03 Run 01 Run 02 Run 03 0 -99.7 -77.2 -96.1 10 200.2 -136.3 122.6 20 409.5 -180.3 284.2 30 655.6 -244.2 410.6 40 864.5 -315.3 542.1 50 1065.2 -408.0 665.4 60 1275.9 -484.1 805.4 70 1485.1 -571.2 941.4 80 1719.8 -629.5 1089.4 90 1932.0 -744.5 1213.8
100 2156.8 -798.5 1349.0
SG16 CP2 Load Condition A Load Condition B Load Condition C
% Load Run 01 Run 02 Run 03 Run 01 Run 02 Run 03 Run 01 Run 02 Run 03 0 3.2 -23.7 -20.8 10 178.4 -145.0 56.7 20 441.2 -274.7 200.9 30 636.1 -343.9 314.3 40 868.5 -456.6 460.5 50 1088.3 -569.3 571.6 60 1316.8 -699.0 684.0 70 1520.2 -793.0 790.7 80 1740.5 -908.9 902.6 90 1949.3 -1025.9 1003.4
100 2158.2 -1150.6 1118.5
B-25

SG17 CP2 Load Condition A Load Condition B Load Condition C
% Load Run 01 Run 02 Run 03 Run 01 Run 02 Run 03 Run 01 Run 02 Run 03 0 8.9 61.5 8.1 10 -38.6 244.5 128.7 20 -162.8 403.9 179.3 30 -230.3 551.6 282.5 40 -327.7 726.7 342.3 50 -414.5 940.0 450.0 60 -495.6 1134.2 538.8 70 -568.7 1297.7 636.2 80 -654.8 1491.9 724.7 90 -724.2 1667.4 818.4
100 -808.5 1848.5 891.9
SG18 CP2 Load Condition A Load Condition B Load Condition C
% Load Run 01 Run 02 Run 03 Run 01 Run 02 Run 03 Run 01 Run 02 Run 03 0 -0.6 71.4 43.4 10 -72.4 217.2 109.3 20 -193.6 345.2 135.4 30 -272.9 472.3 199.0 40 -373.9 618.9 230.4 50 -468.9 797.7 304.4 60 -560.2 963.5 366.7 70 -652.3 1102.7 433.2 80 -750.7 1267.7 494.4 90 -833.7 1419.2 559.5
100 -927.4 1575.7 611.2
SG19 CP2 Load Condition A Load Condition B Load Condition C
% Load Run 01 Run 02 Run 03 Run 01 Run 02 Run 03 Run 01 Run 02 Run 03 0 -101.3 -56.2 -97.3 10 141.6 -114.5 89.5 20 327.0 -150.4 232.3 30 528.7 -203.4 340.7 40 706.7 -278.1 451.3 50 874.8 -360.4 557.3 60 1048.4 -431.2 671.9 70 1222.2 -500.0 786.9 80 1406.3 -555.6 908.6 90 1575.8 -643.6 1010.3
100 1760.7 -695.3 1124.8
SG20 CP2 Load Condition A Load Condition B Load Condition C
% Load Run 01 Run 02 Run 03 Run 01 Run 02 Run 03 Run 01 Run 02 Run 03 0 30.9 -28.0 -32.4 10 181.7 -114.8 75.8 20 442.2 -195.3 249.2 30 634.5 -235.1 394.1 40 863.8 -333.1 564.0 50 1087.8 -411.1 713.4 60 1315.8 -500.5 852.3 70 1522.8 -561.1 988.9 80 1742.0 -648.4 1125.1 90 1943.3 -725.4 1250.7
100 2152.6 -822.2 1386.4
B-26

SG21 CP2 Load Condition A Load Condition B Load Condition C
% Load Run 01 Run 02 Run 03 Run 01 Run 02 Run 03 Run 01 Run 02 Run 03 0 28.1 77.6 44.1 10 -89.8 260.2 99.0 20 -240.5 403.4 132.2 30 -338.5 572.8 196.9 40 -459.5 743.9 236.5 50 -577.1 975.0 320.6 60 -688.4 1175.1 379.9 70 -800.6 1342.3 443.8 80 -920.9 1538.3 503.1 90 -1034.2 1723.7 568.3
100 -1139.7 1911.2 629.1
SG22 CP2 Load Condition A Load Condition B Load Condition C
% Load Run 01 Run 02 Run 03 Run 01 Run 02 Run 03 Run 01 Run 02 Run 03 0 23.2 72.3 42.4 10 -65.1 234.3 110.4 20 -181.6 367.1 158.9 30 -254.4 521.0 235.2 40 -347.6 675.9 285.6 50 -436.3 883.5 381.5 60 -520.0 1066.7 453.9 70 -604.7 1219.9 531.2 80 -695.7 1397.6 603.2 90 -779.9 1565.1 680.2
100 -860.5 1735.7 752.7
SG23 CP2 Load Condition A Load Condition B Load Condition C
% Load Run 01 Run 02 Run 03 Run 01 Run 02 Run 03 Run 01 Run 02 Run 03 0 -84.8 -66.7 -96.6 10 206.9 -131.1 127.1 20 416.4 -167.7 281.9 30 651.8 -235.8 416.9 40 860.2 -306.4 547.2 50 1063.2 -404.9 673.2 60 1272.3 -483.8 814.6 70 1484.2 -563.0 956.5 80 1715.5 -619.7 1105.3 90 1928.8 -727.2 1232.0
100 2145.1 -783.7 1362.7
SG24 CP2 Load Condition A Load Condition B Load Condition C
% Load Run 01 Run 02 Run 03 Run 01 Run 02 Run 03 Run 01 Run 02 Run 03 0 43.2 -47.5 10.8 10 188.7 -162.5 74.9 20 450.2 -268.9 197.2 30 627.3 -357.3 310.9 40 843.2 -490.4 447.2 50 1065.1 -632.7 558.2 60 1286.5 -767.8 668.4 70 1492.0 -864.7 777.2 80 1708.4 -991.5 883.7 90 1912.9 -1105.5 985.0
100 2106.3 -1238.3 1092.5
B-27

SG25 CP2 Load Condition A Load Condition B Load Condition C
% Load Run 01 Run 02 Run 03 Run 01 Run 02 Run 03 Run 01 Run 02 Run 03 0 -45.4 70.1 -71.7 10 -9.3 456.2 314.2 20 -228.3 827.2 491.6 30 -265.2 1122.7 746.1 40 -406.4 1482.6 907.0 50 -532.3 1908.9 1171.5 60 -632.0 2301.3 1404.1 70 -717.4 2624.2 1659.7 80 -819.4 3040.3 1907.5 90 -897.5 3375.6 2149.8
100 -994.0 3768.1 2342.0
SG26 CP2 Load Condition A Load Condition B Load Condition C
% Load Run 01 Run 02 Run 03 Run 01 Run 02 Run 03 Run 01 Run 02 Run 03 0 -62.3 50.0 -84.3 10 20.9 389.3 301.6 20 -145.9 719.9 485.7 30 -140.3 976.1 734.9 40 -237.7 1290.2 896.4 50 -319.4 1661.3 1152.8 60 -378.0 2003.2 1386.5 70 -423.7 2280.1 1636.9 80 -479.1 2648.7 1883.3 90 -519.6 2933.1 2118.3
100 -572.5 3279.7 2310.0
SG27 CP2 Load Condition A Load Condition B Load Condition C
% Load Run 01 Run 02 Run 03 Run 01 Run 02 Run 03 Run 01 Run 02 Run 03 0 28.5 94.4 98.1 10 -147.8 279.9 109.0 20 -348.2 451.6 98.7 30 -513.8 615.0 135.1 40 -690.5 801.0 140.9 50 -859.3 1031.3 196.9 60 -1022.0 1242.2 227.6 70 -1184.7 1425.7 272.8 80 -1374.7 1637.1 311.4 90 -1538.0 1843.6 365.2
100 -1718.4 2038.6 390.1
SG28 CP2 Load Condition A Load Condition B Load Condition C
% Load Run 01 Run 02 Run 03 Run 01 Run 02 Run 03 Run 01 Run 02 Run 03 0 35.7 91.0 94.6 10 -129.9 279.8 119.9 20 -321.1 453.5 121.3 30 -475.8 621.9 171.9 40 -643.6 809.8 190.5 50 -802.2 1042.9 260.0 60 -954.5 1257.2 303.3 70 -1107.4 1442.5 361.1 80 -1278.6 1656.7 412.6 90 -1431.4 1863.8 477.9
100 -1601.3 2061.8 514.1
B-28

SG29 CP2 Load Condition A Load Condition B Load Condition C
% Load Run 01 Run 02 Run 03 Run 01 Run 02 Run 03 Run 01 Run 02 Run 03 0 -272.5 -125.1 -320.7 10 422.4 -36.5 378.4 20 675.7 123.0 748.8 30 1176.4 100.6 1101.1 40 1499.9 146.7 1395.5 50 1820.2 165.3 1736.2 60 2167.9 222.9 2108.0 70 2542.5 189.1 2478.0 80 2964.4 337.2 2867.0 90 3352.7 253.5 3197.2
100 3759.1 366.7 3524.5
SG30 CP2 Load Condition A Load Condition B Load Condition C
% Load Run 01 Run 02 Run 03 Run 01 Run 02 Run 03 Run 01 Run 02 Run 03 0 -282.4 -209.4 -314.6 10 462.3 -136.3 416.5 20 752.1 12.0 813.2 30 1295.8 -25.1 1187.3 40 1656.4 5.2 1506.3 50 2011.6 4.6 1870.3 60 2396.2 45.9 2269.9 70 2807.7 -5.6 2667.9 80 3271.9 47.1 3088.2 90 3702.4 -71.9 3445.1
100 4148.6 24.9 3801.1
SG31 CP2 Load Condition A Load Condition B Load Condition C
% Load Run 01 Run 02 Run 03 Run 01 Run 02 Run 03 Run 01 Run 02 Run 03 0 61.3 -10.6 23.7 10 184.1 -174.6 45.7 20 507.9 -371.4 188.8 30 684.9 -451.5 306.0 40 946.4 -613.9 461.9 50 1199.5 -769.8 576.6 60 1448.3 -945.7 691.7 70 1671.5 -1054.3 797.1 80 1904.6 -1236.8 898.7 90 2129.8 -1363.3 992.5
100 2352.6 -1541.3 1123.4
SG32 CP2 Load Condition A Load Condition B Load Condition C
% Load Run 01 Run 02 Run 03 Run 01 Run 02 Run 03 Run 01 Run 02 Run 03 0 54.8 -28.0 21.3 10 185.8 -195.6 49.8 20 515.5 -394.8 197.6 30 696.7 -476.8 317.4 40 962.6 -642.3 474.4 50 1220.2 -801.0 590.9 60 1472.0 -979.5 710.4 70 1700.0 -1090.5 819.3 80 1938.0 -1295.4 924.5 90 2166.2 -1428.2 1021.0
100 2392.5 -1608.1 1156.5
B-29

SG33 CP2 Load Condition A Load Condition B Load Condition C
% Load Run 01 Run 02 Run 03 Run 01 Run 02 Run 03 Run 01 Run 02 Run 03 0 77.1 104.3 112.2 10 -96.9 287.3 136.5 20 -266.9 460.4 168.1 30 -409.9 641.4 243.5 40 -558.9 832.8 287.2 50 -699.8 1077.0 381.8 60 -830.0 1299.0 447.9 70 -963.3 1498.8 530.2 80 -1118.3 1702.5 607.9 90 -1243.7 1922.2 696.8
100 -1386.4 2128.9 753.5
SG34 CP2 Load Condition A Load Condition B Load Condition C
% Load Run 01 Run 02 Run 03 Run 01 Run 02 Run 03 Run 01 Run 02 Run 03 0 -351.2 822.1 430.7 10 382.2 398.4 664.8 20 1203.6 28.7 734.5 30 1443.9 72.9 932.1 40 1444.9 -109.7 1273.3 50 1296.5 21.3 806.1 60 1294.2 348.9 1652.8 70 1416.7 524.8 2058.0 80 2054.1 426.2 2240.5 90 3031.9 160.4 2528.3
100 3553.4 19.0 2619.3
SG35 CP2 Load Condition A Load Condition B Load Condition C
% Load Run 01 Run 02 Run 03 Run 01 Run 02 Run 03 Run 01 Run 02 Run 03 0 -111.7 -82.9 -133.0 10 191.9 122.8 311.9 20 208.6 353.1 531.3 30 416.8 462.5 788.6 40 501.8 622.7 991.5 50 593.0 787.5 1256.1 60 710.9 978.7 1512.3 70 840.6 1084.8 1777.8 80 988.3 1297.0 2053.4 90 1132.4 1381.3 2303.8
100 1267.1 1577.7 2518.1
SG36 CP2 Load Condition A Load Condition B Load Condition C
% Load Run 01 Run 02 Run 03 Run 01 Run 02 Run 03 Run 01 Run 02 Run 03 0 -113.9 -94.1 -141.1 10 227.7 151.6 369.0 20 235.5 428.3 618.0 30 469.7 559.1 914.0 40 560.9 752.7 1145.3 50 659.7 952.0 1451.5 60 791.2 1182.3 1745.6 70 934.5 1310.8 2052.9 80 1100.8 1566.1 2372.2 90 1265.9 1670.3 2664.0
100 1418.5 1906.7 2911.5
B-30

SG37 CP2 Load Condition A Load Condition B Load Condition C
% Load Run 01 Run 02 Run 03 Run 01 Run 02 Run 03 Run 01 Run 02 Run 03 0 252.5 -269.4 199.0 10 132.0 128.9 205.2 20 157.9 357.4 267.1 30 157.1 216.6 352.2 40 208.2 454.8 451.7 50 249.1 510.7 555.9 60 303.7 414.2 833.0 70 345.2 668.8 857.6 80 386.7 495.1 927.8 90 454.2 1131.7 1038.7
100 522.7 782.0 1206.2
SG38 CP2 Load Condition A Load Condition B Load Condition C
% Load Run 01 Run 02 Run 03 Run 01 Run 02 Run 03 Run 01 Run 02 Run 03 0 101.7 21.0 106.3 10 53.0 56.0 110.6 20 98.8 64.4 168.0 30 108.8 120.8 249.6 40 147.2 141.2 345.5 50 187.5 187.4 446.4 60 237.8 229.8 524.7 70 269.1 275.7 606.2 80 302.3 306.4 691.2 90 343.4 353.1 782.8
100 368.4 369.7 860.7
SG39 CP2 Load Condition A Load Condition B Load Condition C
% Load Run 01 Run 02 Run 03 Run 01 Run 02 Run 03 Run 01 Run 02 Run 03 0 -124.7 -75.3 -145.5 10 182.0 -131.4 96.9 20 385.9 -188.3 256.2 30 617.4 -252.6 372.9 40 817.2 -305.7 510.9 50 1007.1 -399.2 623.7 60 1213.0 -482.1 749.4 70 1407.1 -555.5 870.5 80 1627.7 -627.4 1008.3 90 1824.6 -733.5 1130.9
100 2039.7 -797.2 1252.2
SG40 CP2 Load Condition A Load Condition B Load Condition C
% Load Run 01 Run 02 Run 03 Run 01 Run 02 Run 03 Run 01 Run 02 Run 03 0 -26.3 29.1 -45.2 10 138.6 -96.0 37.6 20 387.3 -262.6 142.5 30 558.1 -363.4 232.7 40 774.0 -455.6 373.6 50 971.4 -578.4 454.7 60 1186.0 -735.8 534.3 70 1363.9 -805.1 613.2 80 1561.6 -941.4 698.1 90 1733.6 -1043.4 788.8
100 1917.2 -1188.3 875.4
B-31

SG41 CP2 Load Condition A Load Condition B Load Condition C
% Load Run 01 Run 02 Run 03 Run 01 Run 02 Run 03 Run 01 Run 02 Run 03 0 -133.0 -62.1 -112.9 10 153.2 -116.7 84.4 20 329.1 -172.3 206.7 30 548.7 -243.1 292.8 40 719.3 -281.9 406.6 50 878.2 -383.6 494.0 60 1056.4 -461.6 584.8 70 1223.4 -531.7 674.1 80 1428.3 -601.3 786.7 90 1605.3 -701.3 898.3
100 1791.0 -753.6 985.7
SG42 CP2 Load Condition A Load Condition B Load Condition C
% Load Run 01 Run 02 Run 03 Run 01 Run 02 Run 03 Run 01 Run 02 Run 03 0 -48.6 38.5 1.1 10 116.6 -71.5 57.3 20 320.8 -226.3 121.7 30 488.8 -332.8 185.9 40 672.8 -402.2 299.7 50 837.7 -522.2 361.4 60 1018.5 -666.5 419.8 70 1168.7 -728.8 477.9 80 1350.6 -841.9 548.3 90 1503.2 -950.4 634.6
100 1662.7 -1067.3 694.1
SG43 CP2 Load Condition A Load Condition B Load Condition C
% Load Run 01 Run 02 Run 03 Run 01 Run 02 Run 03 Run 01 Run 02 Run 03 0 62.4 41.1 13.3 10 -53.7 153.9 56.2 20 -110.8 273.4 104.9 30 -180.8 394.9 177.3 40 -235.2 464.6 214.3 50 -285.1 599.3 301.0 60 -348.4 728.1 362.5 70 -399.0 839.7 431.1 80 -470.1 961.5 474.9 90 -525.7 1098.9 521.7
100 -586.1 1228.1 580.3
SG45 CP2 Load Condition A Load Condition B Load Condition C
% Load Run 01 Run 02 Run 03 Run 01 Run 02 Run 03 Run 01 Run 02 Run 03 0 92.5 -8.4 42.3 10 -31.9 79.6 41.0 20 -66.5 177.5 76.7 30 -123.5 277.7 136.0 40 -159.1 302.2 163.3 50 -194.1 386.1 231.9 60 -241.6 476.1 280.7 70 -276.5 554.5 333.2 80 -324.8 633.8 361.7 90 -359.8 735.4 395.6
100 -398.7 815.9 449.7
B-32

SG01 CP3 Load Condition A Load Condition B Load Condition C
% Load Run 01 Run 02 Run 03 Run 01 Run 02 Run 03 Run 01 Run 02 Run 03 0 30.8 -1.6 -10.7 6.6 6.3 27.0 -26.0 57.020 -97.5 -103.0 -113.9 204.3 206.3 82.0 74.0 196.540 -205.9 -219.7 -211.7 411.3 394.7 193.2 144.6 393.160 -327.0 -316.8 -325.7 615.2 602.6 244.2 198.8 555.280 -409.0 -427.1 -435.0 820.3 786.7 365.5 289.5 769.4
100 -513.7 -532.2 -546.7 1025.1 1010.6 436.3 355.9 969.6
SG02 CP3 Load Condition A Load Condition B Load Condition C
% Load Run 01 Run 02 Run 03 Run 01 Run 02 Run 03 Run 01 Run 02 Run 03 0 26.9 -0.6 -9.3 5.0 6.0 23.8 -24.1 52.020 -88.7 -94.2 -103.4 188.3 190.5 80.8 71.5 184.040 -188.7 -199.6 -194.0 381.5 367.6 184.5 145.3 367.360 -297.3 -288.9 -296.2 570.9 558.9 239.2 197.2 520.380 -373.9 -389.5 -397.4 759.5 731.7 351.7 282.8 719.8
100 -468.5 -485.0 -498.1 949.1 937.0 423.9 352.5 907.4
SG03 CP3 Load Condition A Load Condition B Load Condition C
% Load Run 01 Run 02 Run 03 Run 01 Run 02 Run 03 Run 01 Run 02 Run 03 0 59.7 21.2 13.5 -27.7 -13.6 -2.8 19.8 -12.620 211.3 209.9 219.5 -70.7 -65.0 145.9 146.7 -67.040 397.2 422.8 422.9 -148.9 -147.8 267.1 297.4 -144.960 618.7 626.7 633.8 -227.3 -199.0 426.1 451.7 -205.780 813.1 839.3 852.0 -294.4 -272.7 542.3 612.9 -274.3
100 1025.2 1051.7 1071.5 -367.5 -346.0 703.3 737.9 -349.4
SG04 CP3 Load Condition A Load Condition B Load Condition C
% Load Run 01 Run 02 Run 03 Run 01 Run 02 Run 03 Run 01 Run 02 Run 03 0 -138.2 -39.9 -13.7 13.1 1.6 -42.3 -21.9 -54.020 233.3 238.1 251.2 -124.0 -127.7 124.0 131.6 -117.740 493.5 493.3 478.3 -236.8 -229.7 254.9 280.8 -229.860 751.3 733.8 738.3 -366.4 -370.7 401.9 416.4 -329.480 980.6 978.3 986.7 -490.5 -477.0 488.1 520.3 -468.1
100 1213.9 1215.2 1222.7 -604.5 -608.6 645.7 692.3 -570.3
SG05 CP3 Load Condition A Load Condition B Load Condition C
% Load Run 01 Run 02 Run 03 Run 01 Run 02 Run 03 Run 01 Run 02 Run 03 0 34.0 8.8 -10.1 -5.0 19.7 34.0 -13.7 70.220 -120.7 -127.1 -140.7 238.3 243.4 92.1 79.9 231.040 -258.7 -269.9 -261.7 475.6 463.1 188.1 170.2 450.960 -401.0 -381.4 -394.0 694.8 716.2 261.7 224.4 655.980 -513.3 -520.1 -533.0 942.3 932.4 378.2 334.5 891.6
100 -636.9 -652.2 -672.4 1182.8 1190.6 455.7 401.1 1130.7
SG06 CP3 Load Condition A Load Condition B Load Condition C
% Load Run 01 Run 02 Run 03 Run 01 Run 02 Run 03 Run 01 Run 02 Run 03 0 18.0 1.0 -10.3 -1.8 18.5 25.6 -13.2 57.720 -99.9 -105.9 -116.5 209.1 212.5 87.9 78.0 202.740 -213.1 -223.3 -218.3 418.8 408.8 180.7 164.3 396.860 -329.7 -318.0 -326.8 611.0 626.1 253.3 219.5 576.980 -422.4 -432.8 -442.5 827.9 818.4 360.3 318.5 783.1
100 -525.4 -541.7 -558.6 1040.2 1044.5 438.2 391.5 994.2
B-33

SG07 CP3 Load Condition A Load Condition B Load Condition C
% Load Run 01 Run 02 Run 03 Run 01 Run 02 Run 03 Run 01 Run 02 Run 03 0 197.6 84.8 46.6 -65.5 -43.7 15.3 52.5 0.620 222.7 217.5 221.6 -61.9 -56.7 151.1 146.0 -67.740 379.1 421.3 429.1 -142.9 -152.4 268.4 289.6 -151.160 600.9 627.9 625.8 -215.4 -175.2 419.2 447.0 -221.980 799.5 844.1 847.7 -268.5 -257.9 547.4 629.4 -277.0
100 1019.9 1064.6 1080.5 -343.0 -327.1 710.5 720.2 -366.1
SG08 CP3 Load Condition A Load Condition B Load Condition C
% Load Run 01 Run 02 Run 03 Run 01 Run 02 Run 03 Run 01 Run 02 Run 03 0 -250.6 -97.2 -48.8 56.0 13.7 -64.7 -63.3 -75.520 244.6 258.4 271.6 -165.4 -167.8 109.8 128.5 -148.240 561.2 536.7 514.2 -304.8 -289.1 272.7 252.6 -274.160 832.6 793.5 793.4 -445.8 -493.9 397.1 389.8 -414.880 1090.9 1066.7 1066.4 -628.3 -622.9 488.9 460.8 -571.1
100 1334.3 1317.8 1316.1 -777.6 -788.1 636.8 652.5 -703.6
SG09 CP3 Load Condition A Load Condition B Load Condition C
% Load Run 01 Run 02 Run 03 Run 01 Run 02 Run 03 Run 01 Run 02 Run 03 0 7.8 12.4 -6.7 -15.2 22.4 13.2 -4.8 57.920 -109.6 -113.8 -124.2 202.3 209.1 74.5 71.9 203.640 -231.1 -241.1 -240.1 412.4 412.5 149.7 156.1 394.960 -354.2 -335.1 -350.3 586.1 628.1 220.2 207.0 586.880 -458.2 -460.4 -475.7 800.5 819.5 302.9 301.1 780.7
100 -570.6 -581.4 -604.6 1013.1 1043.1 370.6 367.2 999.0
SG10 CP3 Load Condition A Load Condition B Load Condition C
% Load Run 01 Run 02 Run 03 Run 01 Run 02 Run 03 Run 01 Run 02 Run 03 0 6.2 5.9 -5.4 -14.6 21.1 11.1 -2.2 49.820 -82.8 -88.8 -96.9 181.5 187.0 83.7 81.9 183.040 -176.6 -185.0 -184.4 370.0 369.7 169.3 170.6 356.360 -270.1 -258.6 -269.3 525.8 563.0 248.4 232.8 528.380 -348.2 -355.9 -366.8 718.8 735.8 339.0 332.3 703.6
100 -434.2 -449.1 -467.2 908.6 933.7 418.5 410.4 899.6
SG11 CP3 Load Condition A Load Condition B Load Condition C
% Load Run 01 Run 02 Run 03 Run 01 Run 02 Run 03 Run 01 Run 02 Run 03 0 93.0 31.8 24.7 -27.9 -30.5 2.8 18.4 -10.320 221.2 217.3 226.1 -65.7 -67.1 150.8 147.7 -71.040 408.9 433.8 441.2 -144.8 -156.0 292.1 295.2 -148.360 634.1 633.8 648.3 -211.7 -207.0 441.0 452.3 -224.680 840.9 855.6 877.0 -274.6 -289.4 576.8 618.0 -282.8
100 1060.4 1079.9 1108.5 -349.6 -360.5 743.1 736.0 -368.9
SG12 CP3 Load Condition A Load Condition B Load Condition C
% Load Run 01 Run 02 Run 03 Run 01 Run 02 Run 03 Run 01 Run 02 Run 03 0 -130.9 -67.9 -33.5 44.6 5.2 -29.2 -37.4 -49.020 231.5 240.5 252.5 -116.8 -116.7 131.5 144.5 -111.040 495.8 491.4 481.0 -226.7 -219.9 294.1 265.9 -206.060 740.7 712.6 726.7 -316.6 -363.4 430.6 420.3 -323.280 977.2 969.2 981.8 -449.1 -458.9 555.7 523.7 -424.2
100 1208.7 1209.3 1224.0 -563.0 -575.2 707.0 700.7 -535.0
B-34

SG13 CP3 Load Condition A Load Condition B Load Condition C
% Load Run 01 Run 02 Run 03 Run 01 Run 02 Run 03 Run 01 Run 02 Run 03 0 -2.4 6.3 -20.0 -12.3 25.0 1.3 -13.6 49.120 -88.4 -86.1 -100.8 190.5 196.7 81.8 75.3 187.440 -181.0 -196.1 -192.4 384.6 384.0 167.6 175.6 368.260 -282.7 -256.0 -282.3 551.5 591.8 236.1 227.1 540.480 -361.8 -358.2 -383.3 749.9 772.4 326.0 324.5 729.7
100 -453.9 -455.9 -487.5 950.0 976.2 409.6 402.6 922.9
SG14 CP3 Load Condition A Load Condition B Load Condition C
% Load Run 01 Run 02 Run 03 Run 01 Run 02 Run 03 Run 01 Run 02 Run 03 0 9.0 5.9 -12.6 -17.6 26.1 4.9 -6.2 57.220 -110.2 -111.5 -124.6 216.4 222.3 82.4 78.0 212.240 -231.1 -243.9 -239.7 437.6 438.0 170.3 175.8 417.260 -355.8 -335.6 -353.5 626.2 671.2 238.3 230.4 614.480 -458.2 -460.9 -478.5 854.4 877.4 331.6 330.8 826.0
100 -572.7 -580.5 -606.0 1079.2 1108.3 413.9 408.1 1046.5
SG15 CP3 Load Condition A Load Condition B Load Condition C
% Load Run 01 Run 02 Run 03 Run 01 Run 02 Run 03 Run 01 Run 02 Run 03 0 113.6 40.5 30.5 -84.3 -30.5 13.3 28.6 -6.920 213.0 199.0 208.1 -62.3 -63.4 153.1 138.7 -65.240 367.2 400.3 406.1 -172.7 -150.7 243.1 271.2 -140.460 566.8 584.8 598.1 -215.2 -197.8 399.5 418.8 -208.080 779.3 787.9 807.6 -306.5 -278.3 481.8 576.8 -265.7
100 973.5 993.8 1021.0 -371.5 -344.6 689.3 681.6 -343.4
SG16 CP3 Load Condition A Load Condition B Load Condition C
% Load Run 01 Run 02 Run 03 Run 01 Run 02 Run 03 Run 01 Run 02 Run 03 0 -132.8 -70.1 -25.8 65.3 0.2 -56.1 -10.3 -53.320 254.1 227.3 251.7 -139.9 -164.1 129.2 148.3 -147.940 543.8 559.3 566.5 -316.2 -307.4 296.7 232.1 -282.560 829.8 779.8 815.8 -382.8 -495.8 420.9 439.7 -434.080 1081.3 1035.5 1093.4 -570.7 -643.9 576.8 522.8 -573.5
100 1332.6 1284.8 1346.1 -723.8 -799.4 695.5 675.9 -722.5
SG17 CP3 Load Condition A Load Condition B Load Condition C
% Load Run 01 Run 02 Run 03 Run 01 Run 02 Run 03 Run 01 Run 02 Run 03 0 -13.6 -17.4 -34.5 -14.2 31.5 -3.4 -21.8 51.520 -108.5 -112.4 -126.5 213.1 213.8 78.1 64.9 204.040 -226.6 -244.6 -240.1 419.4 418.6 165.5 163.6 415.460 -348.4 -338.0 -352.9 605.5 651.5 220.1 186.7 606.180 -446.4 -465.1 -480.7 826.9 852.2 309.7 278.6 819.8
100 -562.9 -583.2 -609.3 1046.4 1063.6 395.7 357.9 1025.4
SG18 CP3 Load Condition A Load Condition B Load Condition C
% Load Run 01 Run 02 Run 03 Run 01 Run 02 Run 03 Run 01 Run 02 Run 03 0 -6.1 -16.0 -24.2 -9.6 28.2 1.2 -5.0 52.820 -87.5 -93.5 -103.2 199.0 200.0 90.7 85.2 196.740 -187.9 -203.0 -198.5 395.4 394.1 184.0 188.1 387.860 -287.4 -283.9 -290.7 566.0 606.7 254.5 251.5 570.980 -367.9 -388.0 -396.2 775.4 796.8 353.1 355.4 773.0
100 -461.6 -485.6 -500.9 981.4 996.9 450.4 442.4 970.3
B-35

SG19 CP3 Load Condition A Load Condition B Load Condition C
% Load Run 01 Run 02 Run 03 Run 01 Run 02 Run 03 Run 01 Run 02 Run 03 0 22.6 46.0 37.7 -68.0 67.4 6.8 27.7 -1.420 116.8 203.1 209.1 -99.4 44.6 146.8 147.7 -55.840 291.1 394.4 409.0 72.0 -49.7 278.2 284.8 -118.460 496.7 583.0 606.1 20.6 -89.8 429.6 441.9 -181.480 688.1 785.8 814.5 -30.9 -158.2 563.8 601.8 -230.0
100 673.7 994.3 1028.9 -90.9 21.6 715.2 721.9 -292.7
SG20 CP3 Load Condition A Load Condition B Load Condition C
% Load Run 01 Run 02 Run 03 Run 01 Run 02 Run 03 Run 01 Run 02 Run 03 0 -111.2 -49.2 -22.0 23.0 0.1 -40.1 -42.1 -40.920 222.7 228.2 239.6 -92.4 -90.8 136.9 151.5 -88.040 475.2 475.2 465.5 -166.9 -162.6 318.7 288.5 -167.160 716.0 688.5 698.0 -236.1 -273.0 474.6 444.8 -262.780 938.6 932.2 944.8 -337.3 -348.5 606.6 567.2 -347.5
100 1162.8 1161.7 1173.9 -427.2 -434.3 757.7 744.2 -429.4
SG21 CP3 Load Condition A Load Condition B Load Condition C
% Load Run 01 Run 02 Run 03 Run 01 Run 02 Run 03 Run 01 Run 02 Run 03 0 8.0 -23.3 -18.1 -14.5 39.5 -4.1 21.8 65.620 -98.1 -110.9 -114.5 217.4 216.3 83.6 99.8 208.240 -226.3 -229.4 -224.7 424.8 441.9 178.0 182.8 408.060 -332.6 -343.2 -327.4 595.2 678.0 228.7 275.2 620.280 -428.8 -459.2 -446.7 837.0 890.4 325.6 377.1 821.9
100 -538.1 -565.4 -561.9 1054.1 1101.3 422.7 471.4 1031.1
SG22 CP3 Load Condition A Load Condition B Load Condition C
% Load Run 01 Run 02 Run 03 Run 01 Run 02 Run 03 Run 01 Run 02 Run 03 0 8.3 -18.1 -12.9 -15.9 34.9 1.4 24.6 62.320 -91.5 -103.8 -107.1 203.2 204.8 84.3 95.3 199.340 -208.1 -213.1 -209.6 401.6 417.7 176.3 181.8 390.260 -307.4 -318.8 -306.4 562.2 640.0 231.8 267.7 591.980 -397.3 -426.7 -417.3 786.9 842.5 327.9 367.6 784.9
100 -497.5 -526.7 -525.0 992.7 1041.1 422.9 459.9 986.0
SG23 CP3 Load Condition A Load Condition B Load Condition C
% Load Run 01 Run 02 Run 03 Run 01 Run 02 Run 03 Run 01 Run 02 Run 03 0 121.0 58.2 40.9 -23.7 -33.2 28.8 27.0 -18.020 217.7 218.2 224.5 -77.8 -76.0 147.5 139.1 -76.840 409.8 428.9 434.0 -163.4 -183.6 268.4 278.5 -160.660 628.9 641.0 641.7 -233.8 -251.2 423.7 422.2 -249.180 835.7 861.3 868.8 -315.1 -347.8 548.8 581.8 -314.3
100 1053.2 1077.7 1095.2 -397.9 -420.2 705.1 691.9 -400.4
SG24 CP3 Load Condition A Load Condition B Load Condition C
% Load Run 01 Run 02 Run 03 Run 01 Run 02 Run 03 Run 01 Run 02 Run 03 0 -210.8 -63.3 -54.9 39.0 -4.5 -77.9 -112.5 -59.020 243.7 261.5 268.3 -134.3 -134.3 133.1 127.5 -121.240 554.7 552.9 537.0 -239.0 -239.1 332.2 303.3 -230.160 820.6 829.4 804.2 -335.1 -406.9 498.3 422.1 -363.780 1069.6 1094.6 1082.9 -487.6 -521.2 630.2 532.3 -478.9
100 1323.5 1355.2 1339.2 -612.9 -640.7 773.0 712.1 -592.1
B-36

SG25 CP3 Load Condition A Load Condition B Load Condition C
% Load Run 01 Run 02 Run 03 Run 01 Run 02 Run 03 Run 01 Run 02 Run 03 0 -186.7 -104.0 -119.2 29.2 79.5 -26.3 -116.2 116.820 -107.8 -115.1 -148.5 619.3 637.9 439.2 428.8 604.940 -216.2 -277.7 -275.5 1257.2 1262.1 934.8 910.6 1207.160 -345.0 -359.2 -387.5 1845.2 1914.3 1311.7 1266.1 1739.280 -423.8 -499.4 -538.0 2466.8 2528.8 1772.9 1729.0 2380.4
100 -552.4 -632.2 -700.7 3116.1 3178.3 2259.5 2196.6 2993.2
SG26 CP3 Load Condition A Load Condition B Load Condition C
% Load Run 01 Run 02 Run 03 Run 01 Run 02 Run 03 Run 01 Run 02 Run 03 0 -42.5 -33.3 -49.1 8.2 37.0 9.1 -35.1 73.120 -111.2 -115.5 -132.8 326.6 332.9 175.8 168.2 317.540 -233.9 -258.2 -253.9 658.5 652.8 368.7 361.0 626.960 -358.7 -358.4 -372.0 964.1 995.2 507.7 493.3 904.980 -457.3 -487.7 -505.7 1294.5 1311.0 698.2 686.9 1242.7
100 -579.9 -611.0 -642.6 1634.7 1651.5 891.8 862.6 1560.4
SG27 CP3 Load Condition A Load Condition B Load Condition C
% Load Run 01 Run 02 Run 03 Run 01 Run 02 Run 03 Run 01 Run 02 Run 03 0 -38.3 -29.4 -42.7 9.6 30.4 2.8 -34.3 63.120 -101.2 -106.9 -124.0 296.9 301.5 157.4 150.2 285.840 -214.2 -239.6 -234.7 594.9 587.7 330.7 317.6 566.660 -327.8 -333.5 -344.2 876.7 898.7 458.5 434.9 815.380 -417.8 -452.6 -469.8 1174.2 1184.5 627.7 608.8 1121.2
100 -529.6 -566.8 -596.0 1482.3 1490.9 800.4 762.6 1407.1
SG28 CP3 Load Condition A Load Condition B Load Condition C
% Load Run 01 Run 02 Run 03 Run 01 Run 02 Run 03 Run 01 Run 02 Run 03 0 18.6 -7.1 -39.9 -24.0 25.0 3.0 -18.9 76.320 -117.7 -123.2 -143.7 313.3 317.2 150.0 140.9 299.540 -267.4 -282.8 -271.0 617.6 612.8 307.4 310.9 591.460 -406.3 -383.7 -399.7 896.4 959.3 419.9 420.6 861.080 -513.4 -526.9 -544.9 1221.3 1247.7 584.6 599.7 1181.1
100 -644.4 -660.1 -689.7 1541.6 1568.2 747.9 730.8 1473.5
SG29 CP3 Load Condition A Load Condition B Load Condition C
% Load Run 01 Run 02 Run 03 Run 01 Run 02 Run 03 Run 01 Run 02 Run 03 0 49.2 -3.7 -42.5 -25.4 37.9 15.1 -10.6 95.520 -120.2 -128.4 -153.1 400.8 405.8 215.7 203.9 374.640 -287.2 -305.0 -288.9 782.6 773.0 434.7 441.2 739.760 -435.6 -407.4 -426.9 1135.0 1216.2 603.1 607.6 1069.680 -544.0 -561.8 -583.5 1554.7 1583.6 833.8 865.2 1474.6
100 -681.2 -701.4 -735.0 1958.6 1990.0 1067.9 1046.9 1840.0
SG30 CP3 Load Condition A Load Condition B Load Condition C
% Load Run 01 Run 02 Run 03 Run 01 Run 02 Run 03 Run 01 Run 02 Run 03 0 176.1 37.4 -54.1 -70.0 46.9 34.1 -9.7 189.520 -134.0 -151.3 -195.7 730.3 738.5 465.7 441.9 679.340 -384.5 -397.3 -364.3 1414.7 1389.2 924.1 940.2 1324.160 -569.9 -510.4 -540.8 2053.5 2208.0 1299.6 1315.9 1922.480 -692.7 -706.9 -740.1 2807.6 2853.9 1784.8 1870.8 2658.3
100 -860.5 -877.8 -932.1 3553.9 3604.0 2290.1 2249.2 3310.5
B-37

SG31 CP3 Load Condition A Load Condition B Load Condition C
% Load Run 01 Run 02 Run 03 Run 01 Run 02 Run 03 Run 01 Run 02 Run 03 0 -24.4 -23.3 -33.5 1.3 35.9 -0.5 -17.0 60.620 -96.1 -100.9 -113.4 243.3 246.2 115.5 111.6 234.740 -202.7 -220.9 -216.3 483.1 481.8 241.2 238.9 462.460 -311.4 -307.1 -316.4 699.7 738.1 330.3 323.9 673.680 -397.9 -419.9 -431.1 950.5 970.5 457.5 453.5 918.1
100 -501.9 -526.5 -547.7 1202.8 1221.1 583.4 570.4 1154.7
SG32 CP3 Load Condition A Load Condition B Load Condition C
% Load Run 01 Run 02 Run 03 Run 01 Run 02 Run 03 Run 01 Run 02 Run 03 0 -48.9 -40.8 -48.4 6.1 238.1 -4.9 -87.5 71.720 -100.6 -100.8 -117.8 306.6 501.1 165.9 99.5 295.940 -210.5 -226.7 -222.3 610.5 801.6 349.8 615.0 585.160 -325.4 -310.9 -321.8 887.0 1122.5 483.0 748.0 850.080 -412.7 -424.9 -440.5 1201.0 1474.7 662.6 933.3 1158.8
100 -523.8 -534.2 -564.2 1519.5 2196.9 844.9 1108.4 1458.5
SG33 CP3 Load Condition A Load Condition B Load Condition C
% Load Run 01 Run 02 Run 03 Run 01 Run 02 Run 03 Run 01 Run 02 Run 03 0 -124.3 -78.8 -91.5 17.5 78.4 -21.1 -70.0 111.620 -113.8 -120.0 -145.3 500.7 506.7 321.3 313.1 480.940 -233.5 -274.7 -271.2 1002.9 1001.9 686.2 667.8 953.960 -367.0 -364.8 -387.5 1457.6 1521.9 954.8 923.5 1382.380 -457.4 -506.3 -532.9 1967.5 2006.4 1297.7 1264.2 1886.7
100 -588.6 -639.1 -690.1 2492.0 2525.0 1653.3 1606.6 2373.8
SG34 CP3 Load Condition A Load Condition B Load Condition C
% Load Run 01 Run 02 Run 03 Run 01 Run 02 Run 03 Run 01 Run 02 Run 03 0 65.0 36.8 11.7 -3.5 -8.7 2.2 19.8 12.120 152.9 156.3 164.1 -83.6 -87.5 67.3 54.8 -87.540 286.4 309.5 313.2 -182.6 -196.3 129.7 113.6 -193.660 445.4 459.1 451.8 -251.3 -286.3 176.6 179.6 -301.680 587.7 614.3 619.4 -339.7 -376.8 252.1 239.5 -371.4
100 739.6 775.4 790.8 -436.2 -469.4 322.0 281.6 -474.8
SG35 CP3 Load Condition A Load Condition B Load Condition C
% Load Run 01 Run 02 Run 03 Run 01 Run 02 Run 03 Run 01 Run 02 Run 03 0 -109.8 -34.7 -36.9 62.3 31.8 0.0 -10.9 -24.020 189.3 209.9 215.7 -137.9 -132.5 72.7 68.7 -132.140 406.3 414.0 398.2 -295.6 -278.8 144.0 134.6 -271.360 606.1 630.4 604.6 -405.4 -451.2 199.7 217.7 -427.880 800.1 843.1 818.8 -569.4 -560.1 272.2 253.7 -546.7
100 989.5 1041.7 1026.6 -705.7 -699.1 357.2 351.0 -680.6
SG36 CP3 Load Condition A Load Condition B Load Condition C
% Load Run 01 Run 02 Run 03 Run 01 Run 02 Run 03 Run 01 Run 02 Run 03 0 73.9 42.8 22.7 -30.1 -32.4 -3.1 14.8 -15.520 224.1 226.1 232.5 -91.7 -91.4 135.4 127.1 -94.140 423.6 445.2 449.1 -190.1 -202.3 259.4 261.7 -193.060 652.6 665.3 663.7 -271.5 -277.8 383.9 396.6 -295.080 866.4 892.1 897.2 -365.1 -381.4 510.5 541.6 -371.6
100 1087.4 1118.4 1134.0 -465.5 -479.3 659.3 644.2 -484.0
B-38

SG37 CP3 Load Condition A Load Condition B Load Condition C
% Load Run 01 Run 02 Run 03 Run 01 Run 02 Run 03 Run 01 Run 02 Run 03 0 -303.3 -111.1 -68.3 84.1 4.8 -55.2 -82.2 -108.520 447.1 480.1 494.0 -271.2 -261.3 230.0 243.9 -251.840 966.7 958.6 928.5 -526.0 -498.2 502.6 467.9 -462.460 1430.9 1438.0 1425.8 -715.8 -817.9 730.7 730.2 -729.080 1900.5 1937.8 1917.5 -1038.5 -1033.3 952.3 892.7 -953.3
100 2342.9 2392.9 2382.2 -1298.2 -1295.9 1215.4 1214.7 -1207.9
SG38 CP3 Load Condition A Load Condition B Load Condition C
% Load Run 01 Run 02 Run 03 Run 01 Run 02 Run 03 Run 01 Run 02 Run 03 0 16.5 26.3 8.8 -19.3 17.6 0.4 12.1 44.220 -74.9 -72.9 -75.5 140.2 151.8 60.6 71.7 149.840 -156.2 -159.9 -163.2 299.4 311.8 119.8 134.7 284.460 -236.7 -225.7 -231.5 413.7 463.2 180.8 197.9 434.780 -311.7 -304.1 -312.4 566.2 610.0 242.9 278.5 566.2
100 -385.5 -382.4 -392.7 719.9 772.5 300.7 341.1 730.8
SG39 CP3 Load Condition A Load Condition B Load Condition C
% Load Run 01 Run 02 Run 03 Run 01 Run 02 Run 03 Run 01 Run 02 Run 03 0 11.6 3.8 -0.8 -21.2 23.0 -5.4 17.7 40.620 -59.9 -69.7 -72.0 149.1 156.6 82.7 94.8 160.740 -127.0 -140.2 -144.6 314.3 321.6 163.5 174.4 311.660 -189.0 -198.7 -203.5 433.5 484.5 246.9 256.1 473.080 -245.9 -273.1 -281.1 594.5 639.5 327.0 354.9 618.4
100 -311.5 -345.8 -356.3 759.3 797.5 411.5 447.0 792.8
SG40 CP3 Load Condition A Load Condition B Load Condition C
% Load Run 01 Run 02 Run 03 Run 01 Run 02 Run 03 Run 01 Run 02 Run 03 0 8.3 11.0 12.8 -15.6 24.2 -6.4 26.5 42.420 -38.4 -38.5 -39.1 117.4 133.1 78.9 97.7 132.240 -75.0 -82.9 -80.4 255.1 279.3 160.8 173.7 249.060 -109.1 -124.5 -116.9 343.5 407.8 242.7 269.1 387.780 -149.5 -162.6 -158.9 474.9 543.5 321.4 365.2 500.7
100 -187.6 -202.1 -197.5 606.7 683.3 399.8 455.8 644.3
SG01 CP4 Load Condition A Load Condition B Load Condition C
% Load Run 01 Run 02 Run 03 Run 01 Run 02 Run 03 Run 01 Run 02 Run 03 0 0.9 -39.0 -45.8 -22.2 45.8 31.5 19.4 51.6 -0.120 -106.5 -114.0 -111.4 206.0 209.5 237.9 110.7 88.4 107.440 -217.2 -208.6 -209.1 406.0 462.5 421.1 152.8 208.3 221.560 -332.0 -295.2 -296.9 622.3 656.2 619.5 288.5 330.2 356.780 -433.3 -426.9 -425.0 794.7 874.1 848.6 375.0 433.2 466.2
100 -542.3 -529.6 -526.4 1031.9 1106.7 1099.7 463.0 494.0 553.6
SG02 CP4 Load Condition A Load Condition B Load Condition C
% Load Run 01 Run 02 Run 03 Run 01 Run 02 Run 03 Run 01 Run 02 Run 03 0 1.7 -21.4 -22.6 -13.5 41.1 30.5 21.0 54.9 23.220 -103.9 -110.9 -107.1 194.8 198.6 218.7 101.9 84.8 100.140 -210.6 -207.3 -210.3 385.5 426.9 403.9 141.8 190.5 193.660 -319.8 -296.3 -300.6 589.5 611.5 574.0 266.9 303.9 315.180 -422.0 -424.9 -424.0 753.8 819.7 798.2 350.0 399.6 414.9
100 -525.4 -523.0 -521.4 977.7 1031.6 1029.7 427.0 459.7 495.9
B-39

SG03 CP4 Load Condition A Load Condition B Load Condition C
% Load Run 01 Run 02 Run 03 Run 01 Run 02 Run 03 Run 01 Run 02 Run 03 0 9.5 -26.4 -44.2 -22.3 -10.4 -31.4 3.5 -46.9 -78.820 199.0 231.9 221.4 -65.2 -80.5 -75.2 123.2 115.7 134.740 409.9 456.7 465.3 -159.5 -141.0 -176.7 271.7 264.7 292.960 618.9 671.6 675.6 -226.9 -221.1 -212.1 383.0 375.8 423.680 810.8 933.4 931.1 -286.7 -310.2 -329.4 506.3 495.0 578.2
100 1017.0 1137.0 1129.4 -371.6 -370.3 -395.0 651.0 626.5 702.7
SG04 CP4 Load Condition A Load Condition B Load Condition C
% Load Run 01 Run 02 Run 03 Run 01 Run 02 Run 03 Run 01 Run 02 Run 03 0 -49.3 3.5 29.4 43.3 -36.2 -7.5 -56.0 -22.0 22.120 210.3 183.6 189.7 -124.7 -117.0 -135.4 90.0 120.3 82.740 435.6 383.1 377.0 -219.8 -274.4 -221.0 231.9 185.4 146.560 637.7 571.6 566.1 -352.9 -384.9 -354.7 302.7 284.7 225.880 857.2 739.3 757.4 -455.2 -506.4 -460.9 404.1 386.6 284.3
100 1069.6 947.1 944.3 -586.8 -642.9 -609.2 520.3 518.0 390.4
SG05 CP4 Load Condition A Load Condition B Load Condition C
% Load Run 01 Run 02 Run 03 Run 01 Run 02 Run 03 Run 01 Run 02 Run 03 0 13.9 -41.8 -63.9 3.3 69.4 27.6 37.3 45.5 -9.520 -113.6 -112.0 -112.7 222.0 229.1 252.7 110.0 83.5 105.240 -233.0 -204.7 -199.7 437.6 495.2 421.8 161.3 208.6 239.860 -354.8 -289.6 -289.1 674.4 682.6 655.7 294.9 315.0 369.180 -464.8 -416.1 -412.8 865.0 915.0 873.6 373.2 409.6 478.4
100 -579.7 -520.6 -516.4 1111.8 1189.7 1142.2 475.8 483.0 575.1
SG06 CP4 Load Condition A Load Condition B Load Condition C
% Load Run 01 Run 02 Run 03 Run 01 Run 02 Run 03 Run 01 Run 02 Run 03 0 7.6 -27.2 -40.7 9.4 59.8 30.3 34.3 39.7 12.320 -103.2 -102.4 -102.0 200.1 205.6 221.0 95.9 75.7 92.640 -210.4 -188.9 -187.4 390.3 430.0 380.5 144.1 180.7 198.060 -320.9 -269.5 -272.7 602.7 595.4 575.7 257.9 271.6 306.080 -425.1 -385.9 -384.9 773.6 806.0 777.3 330.4 355.0 399.1
100 -523.6 -479.2 -478.4 996.0 1045.0 1011.2 418.3 424.3 485.9
SG07 CP4 Load Condition A Load Condition B Load Condition C
% Load Run 01 Run 02 Run 03 Run 01 Run 02 Run 03 Run 01 Run 02 Run 03 0 51.0 -6.7 -45.2 -63.6 6.0 -36.4 38.5 -46.5 -86.120 216.9 285.0 265.0 -45.8 -78.6 -60.2 147.7 121.3 174.440 440.4 547.0 563.1 -162.6 -110.1 -180.2 305.7 335.0 396.860 681.4 801.8 808.9 -208.0 -179.6 -177.4 440.1 465.5 576.480 879.6 1147.0 1129.2 -262.4 -274.0 -315.5 585.4 603.1 796.3
100 1105.0 1367.7 1356.0 -333.3 -316.2 -355.5 751.1 743.4 934.0
SG08 CP4 Load Condition A Load Condition B Load Condition C
% Load Run 01 Run 02 Run 03 Run 01 Run 02 Run 03 Run 01 Run 02 Run 03 0 -110.6 -27.2 33.8 54.0 -84.2 -4.2 -109.8 -24.8 19.820 214.4 140.8 159.6 -175.8 -157.3 -183.0 70.4 125.6 46.440 455.0 322.6 305.6 -276.2 -360.4 -243.2 202.1 120.4 37.960 645.1 486.3 481.7 -465.8 -489.6 -466.6 270.2 226.0 79.080 886.8 577.3 616.9 -603.7 -635.2 -563.9 359.5 325.3 72.4
100 1098.3 783.7 787.9 -778.8 -851.0 -762.3 438.8 433.4 161.5
B-40

SG09 CP4 Load Condition A Load Condition B Load Condition C
% Load Run 01 Run 02 Run 03 Run 01 Run 02 Run 03 Run 01 Run 02 Run 03 0 6.9 -24.0 -37.3 29.2 65.7 33.6 29.0 23.2 9.820 -90.5 -93.6 -90.3 195.1 202.6 207.3 91.7 80.5 91.340 -186.2 -166.2 -163.1 378.8 407.7 366.8 160.4 172.1 190.260 -286.7 -237.2 -237.7 589.3 556.6 550.1 267.1 252.7 291.780 -374.6 -348.8 -337.9 758.1 756.9 736.7 333.9 336.4 375.8
100 -463.4 -426.3 -418.9 968.8 1004.0 964.0 433.9 418.4 472.3
SG10 CP4 Load Condition A Load Condition B Load Condition C
% Load Run 01 Run 02 Run 03 Run 01 Run 02 Run 03 Run 01 Run 02 Run 03 0 5.0 -17.9 -27.1 30.6 62.0 34.3 30.5 30.2 22.420 -92.5 -97.3 -93.5 188.5 196.3 198.1 86.1 77.2 85.040 -189.3 -175.7 -175.7 367.8 393.7 363.8 147.6 164.1 170.460 -291.6 -251.9 -255.5 570.0 541.8 534.7 246.6 240.8 264.180 -381.4 -366.4 -360.4 733.1 738.6 722.3 313.5 321.2 340.1
100 -472.2 -448.6 -444.2 938.6 971.0 937.7 401.6 399.5 430.1
SG11 CP4 Load Condition A Load Condition B Load Condition C
% Load Run 01 Run 02 Run 03 Run 01 Run 02 Run 03 Run 01 Run 02 Run 03 0 12.0 -8.4 -24.4 -38.1 -10.0 -27.3 6.7 -19.7 -45.620 197.8 232.1 220.3 -61.1 -79.2 -65.9 136.9 123.3 148.140 406.8 451.4 461.2 -151.8 -124.5 -158.7 278.4 298.7 325.060 618.8 667.0 672.9 -213.7 -186.1 -187.0 408.1 435.2 482.080 811.7 932.2 926.7 -276.0 -271.4 -290.3 544.9 567.0 654.0
100 1010.6 1128.9 1121.8 -349.7 -339.3 -351.0 689.6 695.8 780.0
SG12 CP4 Load Condition A Load Condition B Load Condition C
% Load Run 01 Run 02 Run 03 Run 01 Run 02 Run 03 Run 01 Run 02 Run 03 0 -58.6 -25.6 5.1 5.6 -71.9 -29.0 -61.7 -25.3 -23.820 201.4 174.5 179.0 -131.9 -131.2 -137.2 93.1 114.0 80.640 423.3 361.8 352.6 -226.8 -266.7 -218.7 212.4 189.1 141.760 616.7 540.6 539.8 -368.8 -370.2 -373.5 306.6 304.4 223.780 827.3 702.5 715.1 -475.5 -487.4 -470.0 414.7 415.2 287.1
100 1033.4 895.8 889.9 -612.9 -658.9 -616.9 501.3 512.8 378.3
SG13 CP4 Load Condition A Load Condition B Load Condition C
% Load Run 01 Run 02 Run 03 Run 01 Run 02 Run 03 Run 01 Run 02 Run 03 0 -11.5 -36.1 -54.8 19.2 63.4 33.5 19.7 26.3 -5.920 -109.1 -116.5 -112.2 203.0 209.1 218.0 88.6 82.1 82.040 -221.9 -194.8 -195.8 402.2 430.5 389.4 154.4 156.8 177.560 -349.9 -280.7 -284.2 622.3 593.5 587.4 256.4 231.7 271.880 -452.5 -418.0 -411.2 797.1 802.9 775.2 327.9 319.6 348.6
100 -557.5 -512.3 -508.5 1020.5 1052.3 1022.6 416.4 396.2 434.7
SG14 CP4 Load Condition A Load Condition B Load Condition C
% Load Run 01 Run 02 Run 03 Run 01 Run 02 Run 03 Run 01 Run 02 Run 03 0 1.2 -23.5 -37.2 16.1 56.9 28.2 20.8 33.7 5.020 -89.9 -94.6 -91.2 181.4 186.7 192.0 87.1 81.2 83.540 -184.2 -164.4 -164.4 360.5 387.2 355.1 149.9 165.7 172.060 -286.3 -235.0 -239.7 553.8 536.9 523.6 248.8 243.4 266.780 -371.5 -345.8 -342.5 711.2 725.2 699.3 322.8 331.9 345.3
100 -460.3 -425.7 -422.2 912.4 944.4 914.9 405.3 408.2 429.1
B-41

SG15 CP4 Load Condition A Load Condition B Load Condition C
% Load Run 01 Run 02 Run 03 Run 01 Run 02 Run 03 Run 01 Run 02 Run 03 0 17.7 -8.0 -21.5 -37.2 -7.9 -29.1 11.2 -30.8 -49.820 209.5 249.5 236.7 -67.6 -85.3 -72.2 136.9 119.9 152.740 432.1 480.7 493.3 -174.8 -139.4 -174.8 280.1 304.5 337.160 662.0 709.5 718.8 -242.4 -207.4 -207.6 408.4 441.1 497.280 863.3 996.1 993.3 -311.3 -302.6 -318.3 540.7 568.9 676.4
100 1074.3 1205.6 1201.0 -397.1 -372.9 -387.0 693.0 698.7 806.2
SG16 CP4 Load Condition A Load Condition B Load Condition C
% Load Run 01 Run 02 Run 03 Run 01 Run 02 Run 03 Run 01 Run 02 Run 03 0 -34.3 -7.0 26.6 12.2 -60.0 -21.1 -39.4 -8.3 0.120 203.7 181.1 184.6 -125.6 -123.3 -136.2 99.7 115.2 85.740 421.7 356.4 348.5 -215.5 -257.4 -206.6 214.8 199.4 146.360 624.7 534.1 531.9 -352.3 -356.2 -362.2 315.0 319.0 231.480 830.6 703.2 714.2 -453.8 -470.0 -448.0 422.8 428.0 296.7
100 1039.1 898.9 892.3 -583.2 -628.9 -599.7 519.7 532.1 395.8
SG17 CP4 Load Condition A Load Condition B Load Condition C
% Load Run 01 Run 02 Run 03 Run 01 Run 02 Run 03 Run 01 Run 02 Run 03 0 -23.1 -48.8 -62.9 5.2 52.0 31.3 -7.7 41.6 -10.620 -129.4 -116.9 -107.9 190.8 199.5 222.2 75.4 83.5 83.740 -250.7 -191.7 -191.0 397.4 437.6 394.4 124.8 162.1 185.560 -389.9 -274.8 -277.1 602.5 600.0 600.9 183.2 221.9 281.480 -520.9 -403.6 -386.4 760.4 805.2 786.8 264.8 321.5 369.6
100 -637.0 -509.9 -496.4 989.5 1044.7 1041.2 332.2 400.2 447.5
SG18 CP4 Load Condition A Load Condition B Load Condition C
% Load Run 01 Run 02 Run 03 Run 01 Run 02 Run 03 Run 01 Run 02 Run 03 0 -14.4 -26.6 -46.6 19.3 53.7 25.6 15.7 38.1 1.820 -89.9 -91.8 -89.6 185.6 185.7 194.2 94.3 90.2 88.940 -178.7 -153.4 -155.0 367.6 391.3 354.6 167.3 179.0 185.260 -283.0 -219.9 -226.7 564.5 540.1 532.3 269.2 257.8 284.280 -369.0 -324.4 -326.7 724.6 731.4 701.5 356.7 358.4 370.8
100 -452.5 -404.2 -404.5 931.8 947.8 922.5 443.1 443.5 458.6
SG19 CP4 Load Condition A Load Condition B Load Condition C
% Load Run 01 Run 02 Run 03 Run 01 Run 02 Run 03 Run 01 Run 02 Run 03 0 16.4 -36.7 -37.9 -38.5 -0.9 -28.7 76.9 -29.3 -52.020 191.5 227.5 223.5 -41.4 -55.4 -46.0 154.4 122.9 151.940 398.3 448.7 470.4 -127.5 -81.3 -117.8 358.4 349.8 393.260 599.3 666.9 694.4 -170.6 -127.2 -132.1 484.7 499.1 554.080 786.0 925.3 947.2 -213.7 -193.3 -221.2 668.5 631.2 740.7
100 984.2 1118.0 1145.4 -273.9 -227.8 -249.9 832.0 774.9 887.2
SG20 CP4 Load Condition A Load Condition B Load Condition C
% Load Run 01 Run 02 Run 03 Run 01 Run 02 Run 03 Run 01 Run 02 Run 03 0 -17.3 -6.4 26.0 11.3 -48.0 -14.3 -35.8 2.7 2.820 220.0 195.4 198.8 -100.3 -93.0 -107.9 139.2 152.2 121.140 447.0 382.4 372.2 -153.3 -197.1 -151.4 287.2 273.3 219.460 664.7 576.4 567.9 -264.8 -272.7 -286.4 432.1 433.8 345.180 889.2 756.2 763.4 -341.9 -359.6 -341.4 573.1 578.8 442.0
100 1108.8 968.0 955.9 -439.0 -478.8 -462.8 710.2 718.4 578.5
B-42

CP4 SG21 Load Condition A Load Condition B Load Condition C
% Load Run 01 Run 02 Run 03 Run 01 Run 02 Run 03 Run 01 Run 02 Run 03 0 -12.7 -25.4 -51.8 16.0 66.1 13.2 15.1 57.8 -5.520 -118.2 -117.5 -115.9 215.6 206.8 211.4 92.5 90.9 91.040 -236.4 -205.5 -197.2 416.7 438.3 404.7 166.3 172.9 166.260 -363.9 -295.4 -300.0 638.0 615.9 591.9 250.7 221.7 263.580 -477.2 -426.7 -419.8 822.3 826.0 778.5 343.9 335.1 347.7
100 -594.5 -532.9 -523.4 1065.6 1062.9 1030.0 432.1 425.1 434.5
SG22 CP4 Load Condition A Load Condition B Load Condition C
% Load Run 01 Run 02 Run 03 Run 01 Run 02 Run 03 Run 01 Run 02 Run 03 0 -6.7 -12.5 -32.3 16.8 59.2 16.8 18.4 54.2 14.420 -100.3 -100.5 -98.3 194.8 186.2 187.8 88.5 86.1 90.140 -201.5 -180.5 -176.6 370.1 388.9 365.3 157.7 167.8 157.060 -308.7 -259.3 -266.7 572.8 547.5 526.3 239.0 221.8 248.480 -406.0 -372.3 -370.9 738.1 738.7 702.2 328.8 326.5 333.2
100 -505.2 -463.2 -458.0 954.1 947.5 919.8 411.3 411.3 417.3
SG23 CP4 Load Condition A Load Condition B Load Condition C
% Load Run 01 Run 02 Run 03 Run 01 Run 02 Run 03 Run 01 Run 02 Run 03 0 10.3 -26.3 -35.9 -33.8 -12.3 -22.4 8.3 -60.1 -66.820 222.2 257.9 246.2 -74.0 -86.6 -70.3 139.5 124.0 156.840 457.5 508.2 518.6 -190.2 -147.0 -183.5 289.7 312.0 356.860 693.4 749.5 761.2 -259.4 -223.1 -215.7 432.8 468.6 524.880 910.4 1040.5 1041.8 -334.4 -321.2 -327.7 562.1 593.1 709.2
100 1135.5 1265.6 1260.8 -431.8 -388.1 -396.0 717.0 723.9 844.7
SG24 CP4 Load Condition A Load Condition B Load Condition C
% Load Run 01 Run 02 Run 03 Run 01 Run 02 Run 03 Run 01 Run 02 Run 03 0 -16.3 -1.5 41.2 10.7 -58.5 -0.7 -50.0 -0.5 3.920 222.8 198.9 203.5 -155.2 -127.1 -144.0 106.3 125.1 70.740 457.3 388.1 370.6 -214.3 -276.6 -225.4 220.7 204.6 156.560 675.2 582.8 571.9 -384.8 -386.1 -379.8 338.8 343.7 239.480 905.0 767.1 767.0 -499.2 -506.2 -474.5 444.0 453.0 283.2
100 1128.7 982.6 964.5 -645.7 -666.4 -641.0 546.8 564.4 386.0
SG25 CP4 Load Condition A Load Condition B Load Condition C
% Load Run 01 Run 02 Run 03 Run 01 Run 02 Run 03 Run 01 Run 02 Run 03 0 -71.9 -116.3 -143.8 59.8 105.1 62.8 0.6 104.8 -17.120 -112.4 -154.2 -145.5 455.5 460.4 480.3 354.5 350.2 311.140 -219.5 -209.3 -218.0 935.5 957.3 893.8 644.5 641.6 637.660 -375.7 -276.2 -302.6 1413.1 1339.5 1306.3 1025.9 965.8 984.880 -472.2 -495.0 -486.0 1809.1 1811.1 1749.6 1350.5 1331.2 1267.3
100 -569.0 -584.5 -593.2 2334.7 2334.4 2293.5 1689.9 1652.6 1594.7
SG26 CP4 Load Condition A Load Condition B Load Condition C
% Load Run 01 Run 02 Run 03 Run 01 Run 02 Run 03 Run 01 Run 02 Run 03 0 -35.4 -68.5 -88.1 23.6 65.5 35.1 9.8 59.3 -13.820 -101.2 -120.1 -115.8 283.2 284.0 300.0 186.4 180.5 164.340 -200.0 -180.0 -186.1 574.2 600.5 552.2 333.8 339.1 343.960 -326.4 -247.3 -266.9 875.6 839.9 817.7 534.4 506.6 528.080 -420.7 -399.2 -403.8 1119.6 1131.0 1088.8 704.2 698.2 682.1
100 -510.5 -489.0 -496.6 1441.9 1455.7 1426.8 881.3 863.6 851.9
B-43

SG27 CP4 Load Condition A Load Condition B Load Condition C
% Load Run 01 Run 02 Run 03 Run 01 Run 02 Run 03 Run 01 Run 02 Run 03 0 -27.3 -54.8 -79.3 26.2 66.8 32.6 13.3 51.0 -3.820 -114.2 -125.3 -122.3 257.3 256.7 270.2 141.7 135.8 133.940 -228.0 -201.2 -201.9 512.4 537.8 489.6 251.6 258.6 276.460 -362.8 -283.6 -294.4 785.2 749.2 734.7 406.8 379.6 422.080 -470.7 -434.9 -433.0 1006.0 1010.6 970.7 533.8 527.7 574.0
100 -577.2 -535.2 -535.8 1296.1 1307.7 1277.2 667.7 652.7 680.8
SG28 CP4 Load Condition A Load Condition B Load Condition C
% Load Run 01 Run 02 Run 03 Run 01 Run 02 Run 03 Run 01 Run 02 Run 03 0 -23.6 -84.4 -141.5 2.6 83.0 23.0 17.5 37.0 -75.120 -123.9 -115.1 -119.5 306.0 301.0 334.5 171.5 155.3 164.040 -245.3 -166.5 -159.6 590.7 660.0 558.6 306.2 327.9 382.160 -390.0 -232.9 -239.3 919.9 908.5 895.6 494.9 470.4 576.780 -509.5 -362.5 -363.8 1176.0 1206.5 1142.3 642.8 646.8 752.1
100 -622.0 -464.3 -467.3 1516.4 1579.7 1529.5 812.4 794.1 906.1
SG29 CP4 Load Condition A Load Condition B Load Condition C
% Load Run 01 Run 02 Run 03 Run 01 Run 02 Run 03 Run 01 Run 02 Run 03 0 -21.5 -104.1 -175.9 -1.9 105.5 26.3 27.5 39.2 -98.720 -113.2 -94.8 -102.4 364.6 355.4 398.0 232.6 208.8 228.640 -223.8 -116.4 -106.1 689.1 783.3 651.3 418.8 450.7 524.360 -359.0 -156.3 -163.0 1087.8 1073.9 1056.0 668.9 645.4 788.480 -468.9 -261.2 -264.6 1387.0 1427.4 1335.8 868.2 878.8 1032.6
100 -568.3 -347.9 -352.9 1787.7 1870.0 1804.2 1106.1 1083.9 1248.5
SG30 CP4 Load Condition A Load Condition B Load Condition C
% Load Run 01 Run 02 Run 03 Run 01 Run 02 Run 03 Run 01 Run 02 Run 03 0 -24.2 -221.0 -378.6 -10.0 225.9 40.8 73.4 62.7 -236.920 -150.1 -91.2 -113.6 764.5 717.9 814.5 551.8 487.6 548.340 -296.1 -36.1 -7.1 1403.1 1609.9 1310.2 1007.8 1081.1 1261.860 -487.2 -20.4 -32.9 2213.1 2204.8 2165.9 1593.7 1555.3 1893.780 -635.1 -114.2 -124.8 2837.3 2903.8 2714.6 2081.4 2102.2 2499.7
100 -755.2 -209.1 -221.2 3680.1 3824.5 3671.0 2639.8 2578.7 2995.8
SG31 CP4 Load Condition A Load Condition B Load Condition C
% Load Run 01 Run 02 Run 03 Run 01 Run 02 Run 03 Run 01 Run 02 Run 03 0 -17.5 -49.3 -73.2 12.4 58.3 26.3 16.3 60.9 -4.420 -123.1 -133.1 -131.7 264.6 261.1 278.4 141.7 130.9 130.440 -250.9 -225.2 -224.3 520.5 553.0 509.0 237.6 254.8 270.260 -388.7 -317.9 -329.7 801.5 781.9 755.2 393.9 379.7 419.280 -510.8 -477.1 -476.4 1025.2 1045.9 1007.7 517.0 522.3 548.3
100 -626.4 -587.4 -589.5 1324.4 1342.9 1318.8 648.0 639.7 671.0
SG32 CP4 Load Condition A Load Condition B Load Condition C
% Load Run 01 Run 02 Run 03 Run 01 Run 02 Run 03 Run 01 Run 02 Run 03 0 -26.6 -60.5 -82.6 17.4 63.5 31.4 9.8 70.4 -5.320 -109.4 -127.2 -123.7 292.4 290.9 309.1 185.8 177.6 169.440 -221.5 -202.8 -204.4 583.8 613.6 571.0 321.6 335.9 346.060 -349.3 -281.3 -296.5 891.7 869.3 838.8 523.4 505.8 538.480 -455.4 -442.7 -439.6 1140.9 1164.0 1123.9 689.1 694.0 701.1
100 -556.4 -537.8 -541.4 1475.2 1492.4 1470.4 863.0 854.5 865.1
B-44

SG33 CP4 Load Condition A Load Condition B Load Condition C
% Load Run 01 Run 02 Run 03 Run 01 Run 02 Run 03 Run 01 Run 02 Run 03 0 -69.1 -114.0 -139.9 42.3 100.5 58.8 -5.1 120.2 -6.320 -109.0 -155.0 -145.9 483.6 486.9 513.6 388.2 381.1 348.040 -216.0 -211.6 -219.3 987.6 1018.3 964.5 695.6 701.2 701.360 -365.3 -275.7 -305.4 1493.6 1443.3 1395.5 1111.6 1066.0 1090.480 -460.9 -501.6 -489.2 1910.2 1939.4 1883.5 1465.1 1459.4 1414.3
100 -555.5 -587.0 -596.2 2470.9 2483.4 2459.6 1835.5 1806.9 1764.3
SG34 CP4 Load Condition A Load Condition B Load Condition C
% Load Run 01 Run 02 Run 03 Run 01 Run 02 Run 03 Run 01 Run 02 Run 03 0 5.9 -13.3 -26.3 -51.6 4.9 -18.8 -14.8 -19.8 -53.920 179.4 206.4 197.0 -88.0 -101.3 -91.4 90.0 84.0 103.140 364.2 408.4 412.2 -198.9 -172.1 -189.3 181.1 183.5 225.460 553.1 599.3 598.9 -300.8 -238.9 -256.2 266.8 273.6 320.880 727.1 838.3 827.0 -373.6 -344.0 -385.6 358.1 366.0 458.2
100 908.7 1013.4 1002.0 -481.6 -451.2 -451.1 450.1 442.6 533.8
SG35 CP4 Load Condition A Load Condition B Load Condition C
% Load Run 01 Run 02 Run 03 Run 01 Run 02 Run 03 Run 01 Run 02 Run 03 0 -88.5 -40.7 -19.6 0.6 -64.1 -29.9 -93.0 -71.1 -58.320 154.6 129.8 136.4 -114.6 -112.9 -120.6 44.8 78.9 48.240 339.5 299.2 286.0 -210.0 -254.6 -203.3 135.7 73.2 67.160 478.7 440.3 443.0 -344.8 -343.1 -351.7 187.5 141.1 94.380 648.5 556.2 574.4 -423.6 -445.9 -454.5 240.2 213.0 144.1
100 810.8 714.6 708.2 -558.1 -604.1 -557.5 292.8 266.5 191.4
SG36 CP4 Load Condition A Load Condition B Load Condition C
% Load Run 01 Run 02 Run 03 Run 01 Run 02 Run 03 Run 01 Run 02 Run 03 0 4.3 -27.1 -36.2 -157.9 -24.0 -29.9 7.4 -41.9 -66.220 189.6 229.0 222.0 -68.9 -99.0 -82.3 135.8 121.6 139.240 470.6 468.5 473.4 -148.9 -163.8 -184.7 354.9 268.8 301.660 774.8 689.9 693.0 -200.9 -236.7 -237.6 385.8 397.2 445.980 1168.9 946.8 944.9 -323.1 -339.8 -358.1 610.6 527.9 610.4
100 1062.6 1151.8 1146.1 -343.6 -436.2 -424.8 755.5 645.8 725.7
SG37 CP4 Load Condition A Load Condition B Load Condition C
% Load Run 01 Run 02 Run 03 Run 01 Run 02 Run 03 Run 01 Run 02 Run 03 0 -223.5 -115.7 -49.8 3.0 -193.4 -78.0 -200.6 -168.6 -135.820 390.1 302.9 324.7 -283.1 -281.0 -283.0 150.6 213.4 133.440 845.1 719.3 690.5 -495.9 -595.0 -472.2 402.9 264.2 212.860 1187.2 1065.8 1069.2 -806.7 -819.9 -818.0 552.6 455.8 339.980 1620.8 1318.8 1374.1 -1031.0 -1069.9 -1037.5 752.6 660.1 444.0
100 2025.0 1708.0 1703.7 -1331.6 -1448.2 -1305.8 893.0 820.0 591.8
SG38 CP4 Load Condition A Load Condition B Load Condition C
% Load Run 01 Run 02 Run 03 Run 01 Run 02 Run 03 Run 01 Run 02 Run 03 0 4.3 -3.0 5.6 35.3 65.6 46.6 15.7 21.3 45.620 -62.3 -71.1 -61.8 143.3 155.8 139.4 70.1 78.7 74.440 -129.1 -125.2 -124.4 286.3 292.8 306.0 151.7 147.9 129.060 -199.5 -183.6 -182.7 447.3 404.2 405.4 235.9 213.1 203.880 -260.1 -272.1 -252.9 572.9 560.9 564.5 297.4 292.5 256.2
100 -320.7 -322.6 -307.2 724.9 739.4 722.8 373.5 375.7 347.8
B-45

SG39 CP4 Load Condition A Load Condition B Load Condition C
% Load Run 01 Run 02 Run 03 Run 01 Run 02 Run 03 Run 01 Run 02 Run 03 0 -8.0 -3.8 3.2 60.2 64.6 43.4 35.4 25.4 41.720 -66.4 -71.3 -63.2 162.6 165.4 151.1 77.7 80.3 78.540 -128.7 -124.5 -124.4 301.7 316.0 327.4 156.4 158.4 146.460 -201.4 -184.4 -184.6 476.9 438.8 449.3 243.9 228.5 227.480 -264.4 -266.6 -253.5 617.5 604.9 612.6 317.0 308.6 288.4
100 -328.4 -323.7 -310.7 786.3 794.0 782.9 393.6 395.7 381.6
SG40 CP4 Load Condition A Load Condition B Load Condition C
% Load Run 01 Run 02 Run 03 Run 01 Run 02 Run 03 Run 01 Run 02 Run 03 0 9.7 14.5 27.0 56.5 61.1 47.9 20.7 32.7 57.620 -55.6 -53.6 -46.5 116.4 124.1 101.2 52.7 62.8 54.040 -104.4 -101.1 -99.6 228.7 230.3 263.0 121.9 134.2 94.860 -165.7 -151.4 -150.1 361.9 319.2 331.2 187.9 183.0 151.580 -219.4 -211.1 -197.6 463.8 448.2 467.5 241.2 251.5 182.3
100 -269.6 -256.6 -243.0 583.6 583.6 580.0 291.5 322.0 256.8
SG01 CP5 Load Condition A Load Condition B Load Condition C
% Load Run 01 Run 02 Run 03 Run 01 Run 02 Run 03 Run 01 Run 02 Run 03 0 -71.0 -65.1 36.9 65.7 20.0 -14.1 5.820 -140.3 -146.9 170.8 162.5 41.7 21.0 31.840 -260.8 -284.3 323.4 325.1 50.0 48.7 33.960 -385.9 -417.9 488.1 511.4 81.0 86.2 71.280 -516.0 -566.5 670.3 646.4 139.9 103.0 96.1
100 -670.5 -716.4 822.3 825.5 151.4 120.2 117.6
SG02 CP5 Load Condition A Load Condition B Load Condition C
% Load Run 01 Run 02 Run 03 Run 01 Run 02 Run 03 Run 01 Run 02 Run 03 0 -51.5 -50.9 43.2 61.1 24.0 -7.1 13.920 -96.8 -103.2 160.0 152.6 66.6 48.0 59.540 -180.0 -196.4 297.5 296.7 106.4 102.7 89.660 -269.0 -289.6 450.6 472.0 166.6 168.8 153.280 -357.5 -393.2 619.1 600.8 245.5 211.4 203.8
100 -463.8 -498.5 762.5 761.9 288.0 256.0 256.6
SG03 CP5 Load Condition A Load Condition B Load Condition C
% Load Run 01 Run 02 Run 03 Run 01 Run 02 Run 03 Run 01 Run 02 Run 03 0 -31.3 147.9 -22.0 16.3 -99.0 -102.5 -69.320 213.0 171.4 -47.8 -33.1 84.4 62.7 144.940 467.3 416.6 -103.5 -209.7 184.2 246.0 345.560 701.1 607.7 -142.4 -108.2 310.8 355.0 510.180 915.7 790.6 -211.7 -305.7 410.1 420.7 672.4
100 1131.7 969.7 -243.3 -306.1 452.0 505.3 808.6
SG04 CP5 Load Condition A Load Condition B Load Condition C
% Load Run 01 Run 02 Run 03 Run 01 Run 02 Run 03 Run 01 Run 02 Run 03 0 128.5 -17.7 -13.4 -35.6 131.9 126.6 104.820 211.1 260.5 -87.6 -94.6 189.3 218.0 145.740 387.2 460.3 -164.7 -74.3 414.4 334.1 267.760 567.4 702.4 -250.9 -264.5 577.8 511.8 397.680 766.8 966.6 -335.2 -250.8 754.3 711.5 524.9
100 998.1 1205.9 -422.7 -351.6 996.9 931.5 693.7
B-46

SG05 CP5 Load Condition A Load Condition B Load Condition C
% Load Run 01 Run 02 Run 03 Run 01 Run 02 Run 03 Run 01 Run 02 Run 03 0 -61.8 -59.2 24.8 67.5 11.7 7.6 28.820 -135.4 -142.4 177.3 177.2 58.2 39.3 52.640 -261.6 -269.5 338.3 345.5 71.5 67.3 51.460 -380.4 -395.6 498.3 543.6 124.2 115.2 106.780 -506.8 -540.6 678.6 688.6 190.1 150.2 146.4
100 -661.2 -684.4 856.9 886.0 220.3 182.8 186.2
SG06 CP5 Load Condition A Load Condition B Load Condition C
% Load Run 01 Run 02 Run 03 Run 01 Run 02 Run 03 Run 01 Run 02 Run 03 0 112.4 -187.6 7.2 -81.9 206.4 148.7 94.820 153.2 258.8 -123.2 -134.9 194.3 238.9 79.240 305.7 434.7 -217.0 -21.1 459.5 303.3 166.760 425.9 669.0 -335.1 -384.8 603.4 459.2 231.180 562.3 936.6 -430.4 -260.1 775.7 684.8 284.7
100 760.8 1161.3 -577.6 -423.6 1070.7 915.4 411.3
SG07 CP5 Load Condition A Load Condition B Load Condition C
% Load Run 01 Run 02 Run 03 Run 01 Run 02 Run 03 Run 01 Run 02 Run 03 0 -110.7 400.1 -51.6 94.1 -241.1 -242.0 -156.120 294.0 160.1 -4.3 16.9 43.0 -22.4 220.340 609.8 434.1 -37.2 -341.0 56.4 249.2 483.160 920.0 617.6 -20.0 53.9 189.0 350.8 724.080 1229.1 784.8 -74.7 -372.1 278.4 337.7 988.6
100 1503.0 975.4 -46.5 -272.4 181.5 357.8 1159.4
SG08 CP5 Load Condition A Load Condition B Load Condition C
% Load Run 01 Run 02 Run 03 Run 01 Run 02 Run 03 Run 01 Run 02 Run 03 0 -49.2 -23.0 32.4 68.5 2.0 -3.0 24.120 -85.8 -99.3 171.4 171.7 76.7 57.4 82.740 -163.6 -180.3 320.4 304.9 109.9 120.3 118.460 -240.7 -268.1 474.4 514.2 187.2 192.3 206.980 -316.9 -367.4 645.0 638.4 270.9 244.8 277.2
100 -417.1 -466.3 819.3 822.0 316.7 300.2 347.6
SG09 CP5 Load Condition A Load Condition B Load Condition C
% Load Run 01 Run 02 Run 03 Run 01 Run 02 Run 03 Run 01 Run 02 Run 03 0 -40.3 -78.1 40.9 45.2 28.2 34.5 49.020 -168.5 -173.4 190.0 191.7 54.8 38.5 30.540 -325.8 -328.8 356.0 368.5 41.3 22.0 -3.960 -482.5 -483.5 514.0 542.1 85.2 54.7 30.880 -637.6 -661.1 704.8 753.1 128.2 89.1 45.1
100 -826.2 -834.2 905.9 926.8 171.7 109.5 60.2
SG10 CP5 Load Condition A Load Condition B Load Condition C
% Load Run 01 Run 02 Run 03 Run 01 Run 02 Run 03 Run 01 Run 02 Run 03 0 -35.0 -42.2 44.2 51.0 21.6 23.6 44.120 -120.9 -127.5 178.0 180.9 69.3 52.6 59.840 -236.7 -239.8 330.6 328.2 76.2 70.7 51.060 -358.4 -359.9 479.1 506.2 139.4 119.4 115.980 -468.5 -487.8 655.8 691.6 199.8 168.8 156.6
100 -599.8 -612.8 844.8 852.2 253.4 211.1 202.2
B-47

SG11 CP5 Load Condition A Load Condition B Load Condition C
% Load Run 01 Run 02 Run 03 Run 01 Run 02 Run 03 Run 01 Run 02 Run 03 0 -66.1 179.8 -47.2 37.6 -119.8 -129.4 -100.220 273.5 224.2 -55.3 -45.2 96.7 72.6 184.440 566.0 494.0 -112.3 -254.8 225.2 305.2 418.460 837.9 720.9 -146.2 -102.2 372.3 440.8 611.080 1116.1 957.2 -224.9 -377.2 503.8 514.9 818.6
100 1394.4 1187.1 -268.0 -365.8 535.0 618.5 992.8
SG12 CP5 Load Condition A Load Condition B Load Condition C
% Load Run 01 Run 02 Run 03 Run 01 Run 02 Run 03 Run 01 Run 02 Run 03 0 76.3 -81.6 3.5 -48.6 126.5 66.3 46.020 188.7 261.0 -117.3 -122.5 169.0 191.7 107.140 378.1 461.9 -206.0 -85.8 390.7 302.2 224.660 535.3 693.8 -308.6 -342.2 536.4 440.1 320.180 708.9 967.2 -406.1 -324.8 699.3 623.0 411.5
100 940.4 1204.5 -544.9 -442.3 919.8 825.4 552.1
SG13 CP5 Load Condition A Load Condition B Load Condition C
% Load Run 01 Run 02 Run 03 Run 01 Run 02 Run 03 Run 01 Run 02 Run 03 0 -41.5 -79.4 36.2 42.9 30.5 27.4 36.420 -95.0 -91.6 160.9 166.3 88.8 76.7 69.740 -191.8 -173.2 303.2 327.6 134.7 114.6 81.160 -281.4 -261.2 437.6 482.3 219.3 180.0 154.780 -372.2 -351.7 601.9 661.8 295.9 249.0 203.9
100 -477.4 -442.3 769.1 817.8 381.8 324.5 267.2
SG14 CP5 Load Condition A Load Condition B Load Condition C
% Load Run 01 Run 02 Run 03 Run 01 Run 02 Run 03 Run 01 Run 02 Run 03 0 -30.4 -3.0 36.9 50.9 11.3 30.6 46.820 -109.9 -123.9 170.3 172.7 52.2 37.5 56.440 -242.2 -237.4 314.0 298.2 40.7 50.8 27.560 -355.3 -357.3 458.4 486.3 89.2 90.7 80.280 -460.7 -482.3 626.7 644.8 131.0 121.6 119.0
100 -585.1 -602.6 805.6 800.0 167.1 153.4 157.6
SG15 CP5 Load Condition A Load Condition B Load Condition C
% Load Run 01 Run 02 Run 03 Run 01 Run 02 Run 03 Run 01 Run 02 Run 03 0 -80.2 165.8 -43.9 42.5 -125.6 -138.0 -108.520 232.6 183.2 -46.7 -39.5 74.1 50.6 158.340 497.3 419.0 -96.5 -236.3 180.2 248.4 365.160 726.4 607.3 -123.6 -88.9 304.3 356.6 536.180 968.6 801.9 -193.9 -351.0 413.8 412.8 715.4
100 1207.8 993.4 -227.3 -331.0 422.0 486.7 862.2
SG16 CP5 Load Condition A Load Condition B Load Condition C
% Load Run 01 Run 02 Run 03 Run 01 Run 02 Run 03 Run 01 Run 02 Run 03 0 84.3 -46.9 -10.6 -44.5 108.9 48.2 40.120 202.3 260.6 -134.1 -135.1 143.8 165.5 97.940 425.3 472.0 -238.2 -144.0 334.9 281.8 242.860 601.1 710.3 -354.6 -386.7 460.2 409.2 337.680 793.9 983.3 -472.8 -414.4 602.8 573.0 433.3
100 1038.2 1220.6 -625.0 -539.9 785.7 744.6 559.7
B-48

SG17 CP5 Load Condition A Load Condition B Load Condition C
% Load Run 01 Run 02 Run 03 Run 01 Run 02 Run 03 Run 01 Run 02 Run 03 0 -140.5 94.3 36.9 116.4 -162.6 -56.6 -45.220 -155.4 -237.1 234.3 234.0 -3792.1 -64.8 57.540 -366.0 -399.4 422.6 303.7 14454.1 -80.1 -13.160 -507.6 -627.7 621.7 676.9 13026.5 -97.6 50.680 -661.6 -863.5 843.6 745.1 11811.8 -173.6 89.9
100 -856.8 -1071.3 1096.9 999.9 14043.6 -235.0 101.5
SG18 CP5 Load Condition A Load Condition B Load Condition C
% Load Run 01 Run 02 Run 03 Run 01 Run 02 Run 03 Run 01 Run 02 Run 03 0 -103.5 -184.4 53.1 42.2 7.7 11.6 -2.920 -176.0 -158.9 179.1 180.6 52.3 49.6 17.340 -275.6 -278.7 330.6 370.0 61.8 34.5 34.260 -430.1 -434.2 477.8 510.1 99.5 70.8 87.980 -590.7 -586.1 663.9 746.6 135.8 107.9 85.7
100 -763.9 -736.8 844.4 892.1 197.7 150.8 99.9
SG19 CP5 Load Condition A Load Condition B Load Condition C
% Load Run 01 Run 02 Run 03 Run 01 Run 02 Run 03 Run 01 Run 02 Run 03 0 -39.8 -12.2 -44.0 -8.8 -41.8 -106.6 -71.820 260.4 288.8 -93.5 -84.9 170.2 170.1 159.540 628.5 599.9 -171.3 -205.6 382.2 407.0 442.160 875.8 892.2 -245.0 -217.0 566.6 578.0 622.780 1159.2 1193.5 -345.7 -391.1 755.3 752.7 795.2
100 1454.6 1475.3 -437.2 -437.5 912.6 949.9 984.1
SG20 CP5 Load Condition A Load Condition B Load Condition C
% Load Run 01 Run 02 Run 03 Run 01 Run 02 Run 03 Run 01 Run 02 Run 03 0 227.7 233.6 -23.8 -23.9 130.4 125.1 178.120 267.4 271.7 -92.6 -88.1 147.2 148.7 179.140 387.8 430.2 -164.8 -146.6 298.0 311.0 229.360 603.3 684.6 -241.8 -252.4 445.1 462.8 332.580 843.3 951.8 -331.3 -327.0 595.3 611.9 519.3
100 1110.3 1185.5 -429.3 -403.9 740.7 764.5 681.2
SG21 CP5 Load Condition A Load Condition B Load Condition C
% Load Run 01 Run 02 Run 03 Run 01 Run 02 Run 03 Run 01 Run 02 Run 03 0 -70.9 -72.2 52.2 55.3 21.1 68.9 30.120 -142.8 -140.7 224.0 214.6 84.2 73.0 76.040 -284.1 -271.2 400.9 400.5 88.8 89.6 48.860 -431.1 -408.2 593.2 611.2 158.7 165.6 123.580 -572.9 -544.3 811.7 851.9 236.9 218.0 170.4
100 -713.1 -688.5 1042.8 1022.5 299.6 286.3 232.2
SG22 CP5 Load Condition A Load Condition B Load Condition C
% Load Run 01 Run 02 Run 03 Run 01 Run 02 Run 03 Run 01 Run 02 Run 03 0 -63.2 -29.4 44.2 53.2 6.1 41.8 23.420 -116.6 -127.1 189.9 183.0 58.3 44.4 63.540 -236.1 -237.2 338.0 313.3 46.0 61.2 44.560 -356.3 -362.6 502.4 516.3 98.4 114.6 109.580 -470.9 -486.3 685.1 694.1 151.5 144.9 152.5
100 -588.8 -610.4 882.2 842.2 185.4 186.4 199.3
B-49

SG23 CP5 Load Condition A Load Condition B Load Condition C
% Load Run 01 Run 02 Run 03 Run 01 Run 02 Run 03 Run 01 Run 02 Run 03 0 -68.8 152.5 -47.3 28.6 -103.3 -156.0 -93.720 244.0 210.9 -68.5 -59.5 94.0 67.7 160.340 559.2 471.7 -133.2 -256.2 227.5 288.3 394.960 792.6 688.1 -180.1 -149.4 373.2 399.8 570.080 1061.6 908.4 -268.7 -417.0 496.5 481.0 754.4
100 1318.0 1128.4 -326.4 -409.8 534.9 575.4 910.6
SG24 CP5 Load Condition A Load Condition B Load Condition C
% Load Run 01 Run 02 Run 03 Run 01 Run 02 Run 03 Run 01 Run 02 Run 03 0 153.9 -26.0 -23.4 -43.4 142.7 99.7 90.820 200.3 240.2 -111.2 -107.4 155.1 182.6 105.240 369.9 419.6 -192.3 -80.7 356.3 294.2 248.360 577.8 665.6 -291.9 -294.4 487.8 454.5 340.480 764.9 905.4 -383.0 -292.9 630.5 627.9 456.7
100 960.7 1111.3 -512.9 -389.7 841.8 803.2 576.8
SG25 CP5 Load Condition A Load Condition B Load Condition C
% Load Run 01 Run 02 Run 03 Run 01 Run 02 Run 03 Run 01 Run 02 Run 03 0 319.8 -162.8 4.5 -80.4 418.4 283.1 271.320 592.6 756.2 -158.2 -165.9 653.7 708.9 480.840 1134.0 1358.0 -270.6 40.7 1435.8 1203.9 957.260 1672.7 2091.0 -415.5 -446.6 2013.8 1811.3 1402.680 2222.0 2862.9 -536.1 -255.5 2646.8 2490.0 1853.0
100 2883.6 3539.8 -728.4 -440.3 3447.4 3205.8 2396.2
SG26 CP5 Load Condition A Load Condition B Load Condition C
% Load Run 01 Run 02 Run 03 Run 01 Run 02 Run 03 Run 01 Run 02 Run 03 0 224.5 -119.4 -3.1 -73.9 283.6 205.0 182.520 356.2 468.5 -135.1 -142.7 375.8 423.7 258.840 678.5 826.5 -236.2 -19.2 842.8 688.9 522.560 1002.7 1281.9 -359.0 -401.9 1163.4 1040.2 751.780 1333.1 1760.4 -470.7 -272.3 1521.9 1447.9 995.3
100 1728.8 2170.9 -627.2 -442.3 2006.3 1866.7 1297.8
SG27 CP5 Load Condition A Load Condition B Load Condition C
% Load Run 01 Run 02 Run 03 Run 01 Run 02 Run 03 Run 01 Run 02 Run 03 0 216.2 -119.5 -4.9 -81.3 265.9 194.1 172.520 315.0 421.7 -144.3 -152.1 320.0 368.6 210.240 599.6 736.9 -252.8 -46.9 732.4 587.7 428.860 885.7 1145.9 -384.1 -434.5 998.4 885.3 612.180 1176.1 1576.5 -504.6 -318.5 1302.7 1241.2 807.9
100 1528.3 1943.3 -670.5 -500.5 1729.0 1604.2 1060.4
SG28 CP5 Load Condition A Load Condition B Load Condition C
% Load Run 01 Run 02 Run 03 Run 01 Run 02 Run 03 Run 01 Run 02 Run 03 0 -150.9 461.7 -58.4 134.9 -274.0 -291.3 -179.620 390.0 239.4 25.8 49.2 134.4 50.9 336.340 809.2 616.7 16.6 -334.2 233.5 442.2 707.660 1207.9 878.7 66.6 163.2 478.0 634.3 1071.080 1616.2 1129.5 34.1 -323.8 673.6 693.5 1448.9
100 1991.5 1406.7 97.2 -156.8 631.2 798.3 1730.4
B-50

SG29 CP5 Load Condition A Load Condition B Load Condition C
% Load Run 01 Run 02 Run 03 Run 01 Run 02 Run 03 Run 01 Run 02 Run 03 0 -189.3 555.1 -71.2 174.7 -330.5 -359.8 -213.620 491.8 310.4 48.9 77.5 197.3 93.7 444.040 1020.5 788.8 54.2 -371.6 356.5 602.4 924.060 1521.3 1125.1 131.5 255.7 696.9 873.8 1400.380 2040.4 1456.1 109.3 -327.2 969.3 976.0 1896.6
100 2509.9 1805.4 203.9 -100.0 946.3 1133.2 2269.0
SG30 CP5 Load Condition A Load Condition B Load Condition C
% Load Run 01 Run 02 Run 03 Run 01 Run 02 Run 03 Run 01 Run 02 Run 03 0 -410.0 975.1 -124.2 340.2 -581.5 -670.5 -430.820 921.7 597.6 134.3 189.3 454.9 249.1 880.840 1940.7 1516.4 185.6 -587.4 839.6 1257.9 1839.160 2899.1 2178.9 367.4 614.3 1542.4 1823.8 2798.780 3863.7 2808.7 371.9 -418.2 2135.1 2087.8 3761.6
100 4753.0 3478.1 591.3 55.9 2196.7 2460.5 4519.3
SG31 CP5 Load Condition A Load Condition B Load Condition C
% Load Run 01 Run 02 Run 03 Run 01 Run 02 Run 03 Run 01 Run 02 Run 03 0 186.3 -228.0 8.9 -94.1 299.4 205.8 160.420 297.4 438.0 -149.7 -161.7 358.2 413.7 206.740 589.6 765.5 -260.0 4.4 823.1 618.8 428.260 845.8 1177.7 -401.9 -456.5 1120.6 931.4 615.680 1119.5 1630.0 -516.7 -281.0 1455.7 1327.7 791.3
100 1474.9 2014.2 -696.2 -475.9 1941.6 1734.8 1058.7
SG32 CP5 Load Condition A Load Condition B Load Condition C
% Load Run 01 Run 02 Run 03 Run 01 Run 02 Run 03 Run 01 Run 02 Run 03 0 174.2 -182.7 7.5 -84.1 277.7 187.8 147.520 295.8 424.2 -141.0 -147.2 342.4 392.3 208.540 581.5 739.9 -242.0 -7.9 770.8 594.3 424.660 834.5 1132.3 -376.7 -415.5 1054.3 885.1 614.080 1106.2 1570.2 -486.3 -271.3 1372.7 1262.1 790.5
100 1459.3 1947.0 -651.2 -444.1 1832.3 1654.4 1057.1
SG33 CP5 Load Condition A Load Condition B Load Condition C
% Load Run 01 Run 02 Run 03 Run 01 Run 02 Run 03 Run 01 Run 02 Run 03 0 265.5 -272.1 18.0 -100.3 434.4 269.3 233.720 546.4 746.1 -182.3 -188.3 646.1 709.8 439.240 1076.2 1333.1 -306.0 54.3 1433.0 1149.5 881.460 1552.7 2031.5 -481.4 -513.6 2000.3 1711.1 1297.380 2059.2 2801.5 -615.9 -285.7 2617.1 2394.3 1681.7
100 2699.6 3474.0 -833.8 -494.0 3429.4 3113.4 2208.4
SG34 CP5 Load Condition A Load Condition B Load Condition C
% Load Run 01 Run 02 Run 03 Run 01 Run 02 Run 03 Run 01 Run 02 Run 03 0 -36.0 143.9 -20.9 36.1 -67.0 -107.2 -88.420 225.9 167.8 -59.2 -53.8 44.6 17.9 116.240 435.2 378.4 -132.5 -254.3 119.7 193.2 299.360 668.5 561.5 -164.3 -139.9 222.6 278.1 422.880 890.4 733.7 -243.4 -394.7 290.0 304.7 576.0
100 1107.4 905.9 -305.4 -396.7 277.7 340.3 674.0
B-51

SG35 CP5 Load Condition A Load Condition B Load Condition C
% Load Run 01 Run 02 Run 03 Run 01 Run 02 Run 03 Run 01 Run 02 Run 03 0 41.4 -22.6 -5.7 -10.5 69.3 3.1 -11.620 155.4 193.1 -122.4 -124.0 99.0 100.5 59.440 302.7 369.8 -240.8 -149.5 255.4 160.3 132.260 429.8 543.3 -341.8 -346.4 365.7 219.0 177.280 574.9 741.5 -454.4 -438.6 459.7 321.6 230.5
100 760.5 934.6 -603.1 -498.5 585.2 430.4 315.1
SG36 CP5 Load Condition A Load Condition B Load Condition C
% Load Run 01 Run 02 Run 03 Run 01 Run 02 Run 03 Run 01 Run 02 Run 03 0 -52.4 141.3 -27.5 30.7 -93.7 -119.6 -93.120 249.5 204.0 -58.6 -51.8 89.6 60.9 158.540 497.3 450.0 -120.9 -236.9 216.1 267.9 363.160 746.1 661.5 -154.5 -112.8 354.1 388.9 528.580 993.5 873.2 -232.8 -369.3 476.3 449.7 709.4
100 1245.3 1082.9 -287.4 -363.8 507.4 538.7 857.7
SG37 CP5 Load Condition A Load Condition B Load Condition C
% Load Run 01 Run 02 Run 03 Run 01 Run 02 Run 03 Run 01 Run 02 Run 03 0 108.8 -151.0 31.4 -78.2 183.3 53.7 29.720 283.7 398.9 -241.1 -249.9 228.4 244.2 113.040 537.2 715.4 -440.4 -220.3 566.7 359.4 226.560 765.4 1063.7 -644.4 -673.9 769.3 507.4 315.680 1014.7 1476.5 -854.9 -733.4 988.9 735.1 395.3
100 1367.9 1854.8 -1141.1 -928.7 1302.6 1007.6 568.0
SG38 CP5 Load Condition A Load Condition B Load Condition C
% Load Run 01 Run 02 Run 03 Run 01 Run 02 Run 03 Run 01 Run 02 Run 03 0 10.0 -43.8 59.6 10.9 47.0 45.2 65.220 -90.4 -92.0 158.0 159.3 80.4 73.9 57.340 -175.3 -179.9 289.6 281.2 95.3 90.5 57.360 -258.6 -254.8 411.9 389.4 171.0 151.4 124.680 -341.7 -349.0 570.4 619.0 228.4 223.1 165.9
100 -443.8 -449.0 741.3 710.1 308.3 280.8 207.0
SG39 CP5 Load Condition A Load Condition B Load Condition C
% Load Run 01 Run 02 Run 03 Run 01 Run 02 Run 03 Run 01 Run 02 Run 03 0 -23.4 -42.0 51.6 18.1 57.7 49.3 52.020 -90.2 -70.5 141.3 148.9 90.9 84.4 61.140 -168.0 -153.4 266.5 275.8 115.6 101.3 51.360 -283.6 -241.4 377.5 369.9 185.1 144.4 116.280 -364.6 -308.7 522.9 593.7 249.8 233.9 152.0
100 -441.1 -376.3 673.7 678.9 356.5 309.0 206.3
SG40 CP5 Load Condition A Load Condition B Load Condition C
% Load Run 01 Run 02 Run 03 Run 01 Run 02 Run 03 Run 01 Run 02 Run 03 0 17.7 -36.8 56.0 -1.3 52.6 60.4 71.220 -53.7 -45.9 122.6 123.7 78.9 86.5 67.040 -112.3 -97.7 227.1 219.3 112.8 120.3 73.660 -178.2 -150.9 319.8 261.5 182.4 184.2 146.480 -233.3 -191.4 445.5 492.0 238.1 273.8 197.1
100 -278.7 -241.5 577.6 529.3 330.5 347.1 250.0
B-52

SG42 CP5 Load Condition A Load Condition B Load Condition C
% Load Run 01 Run 02 Run 03 Run 01 Run 02 Run 03 Run 01 Run 02 Run 03 0 -82.3 -74.5 28.2 53.6 -1.2 -18.4 -15.520 -72.8 -81.7 152.7 147.7 88.6 70.2 80.340 -127.5 -140.2 291.9 298.5 151.3 144.5 132.860 -179.4 -206.2 431.6 467.2 237.7 227.6 222.580 -249.8 -284.4 598.2 589.3 334.9 292.0 293.7
100 -332.1 -370.6 736.5 754.8 401.5 361.9 364.5
SG43 CP5 Load Condition A Load Condition B Load Condition C
% Load Run 01 Run 02 Run 03 Run 01 Run 02 Run 03 Run 01 Run 02 Run 03 0 -23.4 121.1 -15.1 11.1 -79.2 -81.7 -47.720 162.2 129.1 -42.2 -35.8 50.6 35.8 105.140 355.4 317.4 -92.0 -180.8 126.7 174.6 250.160 530.5 461.5 -126.2 -110.0 215.9 251.3 371.780 693.8 600.6 -183.9 -277.9 286.8 290.5 490.4
100 860.4 735.5 -216.5 -283.2 295.9 342.9 586.2
SG44 CP5 Load Condition A Load Condition B Load Condition C
% Load Run 01 Run 02 Run 03 Run 01 Run 02 Run 03 Run 01 Run 02 Run 03 0 -46.7 -38.4 51.8 65.9 -6.4 34.1 34.620 -152.6 -176.8 227.8 218.0 55.1 51.7 77.540 -294.2 -308.5 407.1 379.7 68.9 74.7 92.660 -450.5 -483.3 603.6 680.6 152.4 161.6 182.880 -588.2 -643.2 852.3 822.4 197.9 175.8 235.2
100 -751.2 -820.1 1053.3 1045.3 223.0 233.5 303.4
SG45 CP5 Load Condition A Load Condition B Load Condition C
% Load Run 01 Run 02 Run 03 Run 01 Run 02 Run 03 Run 01 Run 02 Run 03 0 -96.4 187.0 -42.7 23.6 -100.8 -143.2 -116.820 301.3 264.1 -99.4 -86.5 117.7 89.2 185.440 623.7 573.9 -190.3 -311.8 256.0 319.4 407.160 930.8 847.1 -263.7 -263.3 407.0 443.7 600.980 1230.5 1115.5 -393.4 -536.5 562.6 554.3 809.3
100 1540.0 1390.2 -470.2 -560.4 618.2 661.0 977.9
SG01 CP6 Load Condition A Load Condition B Load Condition C
% Load Run 01 Run 02 Run 03 Run 01 Run 02 Run 03 Run 01 Run 02 Run 03 0 9.5 -72.7 45.6 -20.1 2.1 26.920 -133.7 -149.6 217.5 58.5 34.4 23.840 -305.9 -283.4 428.6 85.2 102.0 74.960 -404.6 -451.5 643.5 128.0 128.6 124.580 -566.5 -579.4 878.3 217.9 179.7 158.0
100 -710.5 -734.3 1073.0 233.0 215.7 163.9
SG02 CP6 Load Condition A Load Condition B Load Condition C
% Load Run 01 Run 02 Run 03 Run 01 Run 02 Run 03 Run 01 Run 02 Run 03 0 1.2 -33.1 26.2 -18.6 0.6 32.620 -81.5 -94.2 139.0 36.2 21.1 16.740 -190.7 -175.6 269.8 53.1 66.5 49.760 -250.6 -276.7 410.1 79.0 84.6 79.180 -349.7 -361.2 553.7 133.5 117.0 101.1
100 -439.3 -456.0 682.0 144.9 138.3 109.8
B-53

SG03 CP6 Load Condition A Load Condition B Load Condition C
% Load Run 01 Run 02 Run 03 Run 01 Run 02 Run 03 Run 01 Run 02 Run 03 0 -9.2 -36.3 35.2 29.6 19.1 -77.520 191.9 175.7 -73.0 94.8 121.0 89.040 375.8 348.7 -79.0 186.6 184.5 142.660 535.7 561.4 -163.1 275.0 292.4 212.380 708.7 724.4 -199.7 362.0 425.4 285.5
100 944.3 887.0 -276.3 470.0 512.4 391.1
SG04 CP6 Load Condition A Load Condition B Load Condition C
% Load Run 01 Run 02 Run 03 Run 01 Run 02 Run 03 Run 01 Run 02 Run 03 0 -5.3 69.9 -111.3 -32.6 -39.5 141.220 170.4 207.5 -90.6 72.1 60.2 91.440 422.2 412.4 -224.6 192.6 163.6 236.260 599.9 575.4 -297.7 274.0 254.0 344.380 822.9 781.1 -436.6 359.2 274.6 443.9
100 962.7 1022.9 -501.6 432.2 383.2 539.3
SG05 CP6 Load Condition A Load Condition B Load Condition C
% Load Run 01 Run 02 Run 03 Run 01 Run 02 Run 03 Run 01 Run 02 Run 03 0 32.1 -53.4 30.1 20.4 36.8 11.420 -82.5 -100.1 151.1 36.9 46.3 21.940 -174.7 -170.6 308.1 95.9 94.7 41.260 -241.5 -262.7 444.4 110.4 148.2 77.980 -348.6 -352.8 630.8 171.6 205.4 96.1
100 -417.1 -456.7 751.9 205.9 233.6 110.2
SG06 CP6 Load Condition A Load Condition B Load Condition C
% Load Run 01 Run 02 Run 03 Run 01 Run 02 Run 03 Run 01 Run 02 Run 03 0 18.5 -33.2 32.8 10.6 22.2 24.920 -75.7 -90.0 132.4 28.6 31.9 16.140 -165.1 -160.1 262.1 68.5 68.9 28.260 -227.4 -245.5 383.2 79.9 104.7 51.280 -320.2 -329.6 537.2 125.9 146.4 63.6
100 -391.4 -420.4 649.8 151.4 165.6 77.2
SG07 CP6 Load Condition A Load Condition B Load Condition C
% Load Run 01 Run 02 Run 03 Run 01 Run 02 Run 03 Run 01 Run 02 Run 03 0 -19.3 -39.0 92.4 48.2 34.9 -156.920 188.6 159.2 -63.1 102.3 135.8 79.940 323.8 294.6 -24.8 170.5 171.3 86.060 471.1 510.3 -102.7 263.6 279.5 133.480 615.0 650.9 -110.1 343.2 438.4 189.0
100 863.8 779.0 -181.1 463.8 516.0 286.7
SG08 CP6 Load Condition A Load Condition B Load Condition C
% Load Run 01 Run 02 Run 03 Run 01 Run 02 Run 03 Run 01 Run 02 Run 03 0 -30.5 42.6 -166.2 -90.1 -77.1 253.920 114.4 173.4 -74.9 51.5 9.9 76.740 339.8 340.7 -234.8 128.0 129.7 278.160 484.5 435.4 -280.6 205.4 163.4 394.180 678.5 623.6 -432.9 285.7 140.4 503.7
100 726.3 834.5 -475.4 294.3 228.5 572.1
B-54

SG09 CP6 Load Condition A Load Condition B Load Condition C
% Load Run 01 Run 02 Run 03 Run 01 Run 02 Run 03 Run 01 Run 02 Run 03 0 20.0 -36.3 15.7 19.3 38.9 11.320 -78.3 -88.1 134.0 23.8 40.0 18.840 -138.7 -141.9 263.4 95.6 83.7 37.560 -204.8 -216.9 382.7 93.6 148.8 61.280 -292.4 -301.2 545.1 134.7 182.8 76.7
100 -359.3 -386.6 652.3 180.3 213.3 95.8
SG10 CP6 Load Condition A Load Condition B Load Condition C
% Load Run 01 Run 02 Run 03 Run 01 Run 02 Run 03 Run 01 Run 02 Run 03 0 -0.1 -34.6 10.9 -9.2 14.2 13.820 -61.0 -68.2 139.5 37.9 47.1 34.540 -119.7 -113.2 268.5 122.8 111.2 75.160 -163.4 -176.3 398.6 143.5 180.4 120.280 -228.3 -239.1 559.2 197.6 229.0 150.1
100 -296.4 -306.3 674.2 251.8 266.2 185.6
SG11 CP6 Load Condition A Load Condition B Load Condition C
% Load Run 01 Run 02 Run 03 Run 01 Run 02 Run 03 Run 01 Run 02 Run 03 0 -22.1 -18.2 35.4 11.7 3.3 -63.520 180.6 171.2 -65.2 100.5 110.8 84.040 333.5 314.5 -66.1 167.4 171.9 148.560 492.3 509.3 -135.3 274.2 256.6 220.580 653.4 670.0 -174.7 363.7 387.1 294.6
100 860.7 822.8 -236.9 456.4 468.1 390.1
SG12 CP6 Load Condition A Load Condition B Load Condition C
% Load Run 01 Run 02 Run 03 Run 01 Run 02 Run 03 Run 01 Run 02 Run 03 0 -42.3 14.6 -86.0 -84.5 -70.7 163.820 150.1 187.9 -72.9 77.7 44.7 84.140 349.7 347.5 -186.8 132.4 155.4 276.560 512.0 483.0 -242.5 241.6 185.5 388.580 710.0 680.8 -361.3 338.5 233.8 496.8
100 815.8 881.5 -410.2 357.2 317.9 583.9
SG13 CP6 Load Condition A Load Condition B Load Condition C
% Load Run 01 Run 02 Run 03 Run 01 Run 02 Run 03 Run 01 Run 02 Run 03 0 35.7 -38.9 26.4 -3.0 19.3 -7.120 -88.2 -110.9 157.1 11.1 32.8 18.240 -206.8 -187.1 298.1 101.2 73.7 35.060 -269.3 -290.3 445.9 94.8 138.7 78.380 -379.0 -395.3 627.8 129.3 170.6 82.5
100 -474.9 -502.1 752.8 163.7 184.4 98.6
SG14 CP6 Load Condition A Load Condition B Load Condition C
% Load Run 01 Run 02 Run 03 Run 01 Run 02 Run 03 Run 01 Run 02 Run 03 0 34.8 -21.4 10.9 12.4 26.7 20.720 -70.6 -82.0 145.7 32.7 41.0 36.440 -137.1 -134.5 267.5 106.7 94.6 72.260 -189.4 -218.6 405.0 117.5 162.5 123.180 -264.6 -295.7 563.2 174.8 197.3 152.5
100 -341.1 -367.4 687.4 213.9 232.2 186.5
B-55

SG15 CP6 Load Condition A Load Condition B Load Condition C
% Load Run 01 Run 02 Run 03 Run 01 Run 02 Run 03 Run 01 Run 02 Run 03 0 -33.7 -25.6 34.9 11.6 9.0 -69.120 194.1 187.5 -70.2 112.6 123.9 92.340 374.9 348.1 -69.9 185.9 196.9 162.560 541.1 564.3 -146.5 302.7 293.2 236.680 718.6 742.1 -186.3 402.7 438.5 319.4
100 947.8 906.9 -254.4 508.1 530.9 426.3
SG16 CP6 Load Condition A Load Condition B Load Condition C
% Load Run 01 Run 02 Run 03 Run 01 Run 02 Run 03 Run 01 Run 02 Run 03 0 -14.9 7.8 -83.7 -16.7 -13.5 20 146.1 175.3 -69.5 89.3 62.6 40 366.9 336.4 -157.4 136.4 165.4 60 509.6 470.4 -215.1 236.0 218.6 80 700.9 652.8 -319.9 346.2 277.7
100 830.4 843.1 -363.3 380.4 371.8
SG17 CP6 Load Condition A Load Condition B Load Condition C
% Load Run 01 Run 02 Run 03 Run 01 Run 02 Run 03 Run 01 Run 02 Run 03 0 31.2 9.6 -180.2 -8.4 -30.3 -83.520 -42.9 -57.1 112.6 46.3 42.3 28.940 -150.0 -104.2 301.4 124.2 87.2 62.660 -170.2 -152.2 418.2 169.8 118.0 138.380 -231.7 -191.1 550.7 241.0 158.4 129.9
100 -300.6 -272.8 673.4 272.4 213.1 172.6
SG18 CP6 Load Condition A Load Condition B Load Condition C
% Load Run 01 Run 02 Run 03 Run 01 Run 02 Run 03 Run 01 Run 02 Run 03 0 16.3 0.2 39.0 -40.5 -17.8 6.020 -62.8 -75.9 128.5 14.9 20.9 14.940 -180.2 -143.9 242.9 74.1 53.8 57.660 -220.5 -217.8 368.6 92.3 86.3 100.280 -298.2 -289.4 511.6 118.3 116.6 102.2
100 -386.6 -368.3 617.1 139.0 122.9 126.3
SG19 CP6 Load Condition A Load Condition B Load Condition C
% Load Run 01 Run 02 Run 03 Run 01 Run 02 Run 03 Run 01 Run 02 Run 03 0 -46.9 -40.4 10.2 19.7 25.7 -46.020 166.4 166.2 -60.4 111.4 116.6 86.940 355.0 314.1 -56.7 168.5 196.9 156.860 492.3 507.3 -129.8 275.1 293.1 219.280 654.8 665.7 -160.7 375.0 426.8 305.5
100 859.0 812.2 -216.5 477.2 519.2 403.1
SG20 CP6 Load Condition A Load Condition B Load Condition C
% Load Run 01 Run 02 Run 03 Run 01 Run 02 Run 03 Run 01 Run 02 Run 03 0 -2.1 -7.0 -102.2 18.5 25.1 124.520 134.7 165.5 -69.8 88.7 66.1 91.940 376.8 320.2 -165.5 122.4 161.5 214.060 501.1 449.1 -229.5 208.3 220.7 296.780 688.0 619.4 -331.8 315.4 282.4 412.1
100 818.9 801.1 -378.3 355.8 373.8 496.7
B-56

SG21 CP6 Load Condition A Load Condition B Load Condition C
% Load Run 01 Run 02 Run 03 Run 01 Run 02 Run 03 Run 01 Run 02 Run 03 0 11.1 34.4 39.2 -42.9 -14.6 1.120 -104.3 -88.7 155.2 40.7 22.2 8.840 -201.9 -173.9 273.0 37.5 42.2 90.060 -300.0 -267.3 424.9 102.0 65.3 122.380 -381.2 -330.8 592.1 133.3 82.8 130.5
100 -515.7 -445.7 716.1 146.0 109.2 158.6
SG22 CP6 Load Condition A Load Condition B Load Condition C
% Load Run 01 Run 02 Run 03 Run 01 Run 02 Run 03 Run 01 Run 02 Run 03 0 41.1 30.5 27.7 -17.5 1.8 36.020 -86.2 -78.8 158.1 45.3 36.6 24.940 -168.7 -149.4 268.0 67.9 65.2 103.660 -248.5 -238.0 419.9 127.6 104.0 150.280 -317.9 -295.3 585.1 172.4 138.4 170.0
100 -428.1 -389.5 714.9 196.1 172.2 211.9
SG23 CP6 Load Condition A Load Condition B Load Condition C
% Load Run 01 Run 02 Run 03 Run 01 Run 02 Run 03 Run 01 Run 02 Run 03 0 -65.3 -54.4 30.5 -11.2 -8.3 -69.720 177.5 158.3 -63.1 86.9 107.4 80.940 326.8 312.6 -46.8 188.9 187.5 125.160 491.0 503.8 -113.2 261.6 286.7 193.980 636.6 644.4 -147.1 351.7 410.1 264.9
100 849.9 798.0 -204.5 452.7 490.0 348.9
SG24 CP6 Load Condition A Load Condition B Load Condition C
% Load Run 01 Run 02 Run 03 Run 01 Run 02 Run 03 Run 01 Run 02 Run 03 0 97.4 -16.2 -82.9 67.2 20.1 162.320 143.6 154.6 -73.5 49.7 57.6 96.440 371.5 324.1 -161.9 170.6 141.2 181.760 523.0 436.6 -229.0 204.4 225.6 287.280 683.9 593.1 -330.0 299.4 246.3 386.2
100 842.1 784.4 -381.5 340.1 343.0 466.9
SG25 CP6 Load Condition A Load Condition B Load Condition C
% Load Run 01 Run 02 Run 03 Run 01 Run 02 Run 03 Run 01 Run 02 Run 03 0 257.2 124.4 -198.7 -23.1 -73.5 472.520 189.4 251.8 268.1 305.6 252.7 361.940 574.7 595.3 307.2 777.5 658.8 904.760 844.9 657.7 604.9 1082.6 1027.7 1395.080 1128.2 961.6 749.6 1514.1 1157.4 1763.3
100 1237.6 1336.1 1035.2 1745.9 1553.3 2111.3
SG26 CP6 Load Condition A Load Condition B Load Condition C
% Load Run 01 Run 02 Run 03 Run 01 Run 02 Run 03 Run 01 Run 02 Run 03 0 97.0 59.1 -109.0 -4.6 -44.7 205.020 88.7 127.2 95.3 139.1 100.4 161.640 297.5 294.7 72.8 344.8 286.7 404.160 426.8 333.0 186.6 480.2 444.6 621.180 567.7 487.9 215.0 670.3 485.7 787.8
100 620.7 667.4 321.1 781.7 660.1 941.9
B-57

SG27 CP6 Load Condition A Load Condition B Load Condition C
% Load Run 01 Run 02 Run 03 Run 01 Run 02 Run 03 Run 01 Run 02 Run 03 0 79.9 53.5 -61.1 -14.5 -36.3 165.920 40.8 65.0 90.3 91.4 71.3 109.440 151.0 165.0 97.2 234.9 195.5 279.360 222.0 166.6 200.9 327.5 308.1 432.780 297.3 249.8 243.1 460.7 331.9 544.3
100 307.0 357.0 341.6 525.1 458.0 648.1
SG28H CP6 Load Condition A Load Condition B Load Condition C
% Load Run 01 Run 02 Run 03 Run 01 Run 02 Run 03 Run 01 Run 02 Run 03 0 -83.0 -84.6 118.1 53.8 50.1 -241.620 383.8 342.6 -126.6 219.3 270.4 175.740 708.5 652.8 -72.1 377.8 394.1 234.260 1023.3 1097.9 -221.5 572.9 612.4 353.880 1338.9 1405.8 -251.4 763.0 924.3 495.9
100 1830.1 1698.8 -391.2 1006.6 1108.5 697.2
SG28L CP6 Load Condition A Load Condition B Load Condition C
% Load Run 01 Run 02 Run 03 Run 01 Run 02 Run 03 Run 01 Run 02 Run 03 0 81.9 -31.8 55.0 -33.1 -5.1 9.720 -163.4 -200.2 276.7 26.0 34.5 18.940 -401.3 -334.5 531.2 155.4 100.3 86.160 -516.3 -536.5 800.7 180.0 174.5 162.580 -722.6 -713.9 1115.3 231.9 212.7 162.1
100 -905.8 -908.3 1338.9 278.2 228.5 186.2
SG28N CP6 Load Condition A Load Condition B Load Condition C
% Load Run 01 Run 02 Run 03 Run 01 Run 02 Run 03 Run 01 Run 02 Run 03 0 10.0 -30.6 72.2 38.9 48.5 -115.320 115.7 67.0 71.1 125.8 158.1 107.140 174.6 182.3 222.1 288.2 254.1 138.960 277.9 303.1 281.1 375.9 422.1 237.380 331.0 353.8 411.4 508.2 576.7 313.8
100 505.9 425.1 457.5 672.8 700.7 428.0
SG29H CP6 Load Condition A Load Condition B Load Condition C
% Load Run 01 Run 02 Run 03 Run 01 Run 02 Run 03 Run 01 Run 02 Run 03 0 -78.6 -85.2 132.7 70.8 68.6 -274.920 419.3 364.6 -118.9 248.4 306.9 202.540 763.1 708.8 -34.7 441.2 449.7 262.460 1107.7 1186.9 -178.7 653.1 707.1 402.380 1442.1 1510.1 -188.9 873.4 1052.3 563.3
100 1985.8 1831.1 -323.3 1156.5 1266.4 793.2
SG29L CP6 Load Condition A Load Condition B Load Condition C
% Load Run 01 Run 02 Run 03 Run 01 Run 02 Run 03 Run 01 Run 02 Run 03 0 123.5 -25.5 61.2 -30.8 6.0 9.920 -224.9 -280.1 380.5 39.9 50.1 31.540 -545.2 -450.5 728.8 227.8 143.1 115.260 -703.7 -734.1 1103.6 253.5 257.2 226.280 -990.7 -986.3 1528.1 333.0 297.1 227.6
100 -1235.4 -1243.8 1841.7 408.1 333.4 263.3
B-58

SG29N CP6 Load Condition A Load Condition B Load Condition C
% Load Run 01 Run 02 Run 03 Run 01 Run 02 Run 03 Run 01 Run 02 Run 03 0 37.5 -43.4 107.9 48.6 68.5 -154.620 108.4 32.7 162.3 171.0 213.5 145.540 117.2 145.9 424.4 408.0 351.2 202.860 219.8 245.2 567.9 529.5 584.8 347.480 234.9 261.7 813.5 712.9 796.6 447.6
100 414.5 304.8 935.6 938.5 959.4 606.2
SG30H CP6 Load Condition A Load Condition B Load Condition C
% Load Run 01 Run 02 Run 03 Run 01 Run 02 Run 03 Run 01 Run 02 Run 03 0 -122.7 -109.8 232.6 143.5 132.3 -489.420 712.7 603.4 -174.2 435.7 534.1 364.840 1301.2 1223.8 -4.9 812.8 794.8 447.960 1894.0 2021.9 -223.7 1158.4 1270.1 700.280 2456.9 2546.9 -223.2 1556.3 1840.7 989.7
100 3384.5 3110.8 -410.5 2077.5 2236.6 1392.1
SG30L CP6 Load Condition A Load Condition B Load Condition C
% Load Run 01 Run 02 Run 03 Run 01 Run 02 Run 03 Run 01 Run 02 Run 03 0 195.8 -43.5 160.0 27.0 75.5 -135.920 -125.5 -248.6 558.0 214.7 254.6 183.240 -436.4 -314.0 1152.1 635.6 487.1 346.860 -502.1 -524.7 1686.0 786.6 821.4 607.780 -764.6 -756.1 2353.1 1050.4 1063.6 722.3
100 -856.4 -963.0 2810.9 1354.6 1262.9 923.1
SG30N CP6 Load Condition A Load Condition B Load Condition C
% Load Run 01 Run 02 Run 03 Run 01 Run 02 Run 03 Run 01 Run 02 Run 03 0 73.7 -88.8 232.8 85.0 120.2 -351.320 304.6 152.0 315.3 387.3 476.1 336.640 403.7 455.1 844.0 913.7 792.2 501.760 688.4 738.7 1116.5 1210.4 1304.3 835.380 808.7 857.7 1601.2 1622.8 1783.6 1080.7
100 1255.8 1027.8 1843.5 2116.3 2148.8 1447.8
SG31H CP6 Load Condition A Load Condition B Load Condition C
% Load Run 01 Run 02 Run 03 Run 01 Run 02 Run 03 Run 01 Run 02 Run 03 0 42.9 27.0 -189.1 4.2 -26.0 302.920 255.6 317.7 -126.6 135.8 101.9 179.640 700.1 632.3 -342.9 278.5 287.8 427.860 963.6 852.8 -449.7 413.5 414.9 628.980 1310.4 1182.3 -663.5 607.1 471.1 838.3
100 1540.6 1556.5 -740.9 674.8 653.2 998.9
SG31L CP6 Load Condition A Load Condition B Load Condition C
% Load Run 01 Run 02 Run 03 Run 01 Run 02 Run 03 Run 01 Run 02 Run 03 0 80.7 4.4 23.8 -36.9 -13.8 219.320 -121.0 -139.2 264.4 57.4 52.9 59.040 -273.0 -221.7 468.8 200.3 158.1 179.060 -346.6 -390.0 730.8 253.5 253.7 291.780 -480.7 -508.1 998.4 350.1 297.2 340.9
100 -636.5 -623.5 1230.6 404.5 356.0 402.3
B-59

B-60
SG31N CP6 Load Condition A Load Condition B Load Condition C
% Load Run 01 Run 02 Run 03 Run 01 Run 02 Run 03 Run 01 Run 02 Run 03 0 153.5 55.2 -150.5 36.1 -2.9 331.020 133.4 169.5 93.7 168.9 135.8 219.740 419.1 392.8 48.4 411.5 370.3 505.560 592.6 439.7 159.0 554.0 575.2 777.280 792.5 633.4 169.4 819.7 636.0 1013.0
100 888.9 891.6 285.1 924.3 863.1 1206.6
SG32H CP6 Load Condition A Load Condition B Load Condition C
% Load Run 01 Run 02 Run 03 Run 01 Run 02 Run 03 Run 01 Run 02 Run 03 0 55.3 44.4 -221.4 36.2 -9.7 337.120 317.3 388.8 -191.4 146.1 110.8 197.240 851.4 765.7 -474.1 289.4 298.7 452.260 1166.4 1048.0 -642.3 430.4 433.2 663.980 1585.4 1444.8 -933.2 636.0 487.1 893.5
100 1885.6 1897.5 -1063.2 710.1 689.7 1068.2
SG32L CP6 Load Condition A Load Condition B Load Condition C
% Load Run 01 Run 02 Run 03 Run 01 Run 02 Run 03 Run 01 Run 02 Run 03 0 98.1 7.8 35.5 -37.5 -11.0 93.120 -172.5 -196.2 316.8 47.9 43.2 47.040 -391.5 -326.8 562.9 192.7 140.6 161.160 -507.0 -552.0 876.6 236.3 232.3 269.680 -699.5 -723.6 1199.2 325.0 264.9 304.0
100 -912.9 -896.1 1475.7 373.5 312.1 354.1
SG32N CP6 Load Condition A Load Condition B Load Condition C
% Load Run 01 Run 02 Run 03 Run 01 Run 02 Run 03 Run 01 Run 02 Run 03 0 126.5 42.0 -139.4 22.0 -8.5 293.620 102.4 134.2 83.3 136.0 107.8 177.440 339.2 319.8 46.0 345.7 306.7 428.160 479.7 354.2 144.2 464.8 473.6 656.680 637.6 510.2 154.4 677.8 519.7 846.3
100 709.2 717.7 257.5 767.1 706.0 1006.6
SG33H CP6 Load Condition A Load Condition B Load Condition C
% Load Run 01 Run 02 Run 03 Run 01 Run 02 Run 03 Run 01 Run 02 Run 03 0 74.2 54.2 -274.1 51.3 -5.0 402.920 413.1 499.9 -246.1 188.5 147.7 249.640 1084.5 975.5 -596.0 370.3 380.3 564.460 1489.7 1346.2 -813.7 551.0 552.4 828.180 2024.0 1852.7 -1176.7 810.0 633.6 1115.3
100 2420.5 2429.1 -1350.0 912.9 888.5 1339.9
SG33L CP6 Load Condition A Load Condition B Load Condition C
% Load Run 01 Run 02 Run 03 Run 01 Run 02 Run 03 Run 01 Run 02 Run 03 0 120.5 7.3 63.6 -38.9 -8.3 74.720 -220.6 -259.0 400.7 56.1 53.6 51.340 -512.3 -427.3 723.9 231.5 161.9 168.560 -666.8 -710.7 1118.4 277.6 275.6 291.380 -923.8 -941.8 1533.7 379.8 313.6 322.5
100 -1184.0 -1171.9 1882.1 445.4 368.8 378.3

SG33N CP6 Load Condition A Load Condition B Load Condition C
% Load Run 01 Run 02 Run 03 Run 01 Run 02 Run 03 Run 01 Run 02 Run 03 0 150.8 41.5 -158.5 26.1 -6.9 338.420 124.9 158.5 107.5 167.3 136.4 213.940 403.1 381.2 80.4 423.2 374.6 513.560 572.8 428.2 203.9 571.7 579.6 789.180 759.2 612.3 231.8 828.0 647.2 1015.5
100 850.1 854.3 359.6 942.4 869.0 1210.3
SG36 CP6 Load Condition A Load Condition B Load Condition C
% Load Run 01 Run 02 Run 03 Run 01 Run 02 Run 03 Run 01 Run 02 Run 03 0 -21.5 -35.3 26.7 5.3 -11.6 -62.720 177.0 168.7 -71.8 85.1 98.4 83.940 322.2 309.8 -93.6 157.5 152.5 133.560 487.0 492.6 -165.5 255.4 236.6 214.080 646.2 654.3 -219.6 331.7 343.0 285.3
100 838.6 807.4 -288.5 411.8 420.0 370.4
SG37 CP6 Load Condition A Load Condition B Load Condition C
% Load Run 01 Run 02 Run 03 Run 01 Run 02 Run 03 Run 01 Run 02 Run 03 0 -65.0 -3.5 -90.2 -116.9 -100.8 148.620 142.6 178.7 -65.8 55.4 33.5 84.840 322.7 342.6 -184.0 146.0 156.3 258.060 492.5 471.8 -231.2 245.0 184.6 377.180 680.4 661.3 -345.6 328.8 218.8 481.0
100 764.8 856.2 -390.9 333.5 299.9 560.4
SG38 CP6 Load Condition A Load Condition B Load Condition C
% Load Run 01 Run 02 Run 03 Run 01 Run 02 Run 03 Run 01 Run 02 Run 03 0 -18.1 -17.3 5.3 2.6 32.7 27.820 -60.6 -50.2 95.9 30.5 33.5 14.040 -83.1 -96.1 185.6 48.2 62.8 75.660 -142.7 -135.4 279.3 58.1 128.1 97.480 -192.7 -184.8 388.1 83.6 136.0 119.4
100 -248.3 -241.9 466.5 129.2 175.6 141.3
SG39 CP6 Load Condition A Load Condition B Load Condition C
% Load Run 01 Run 02 Run 03 Run 01 Run 02 Run 03 Run 01 Run 02 Run 03 0 -17.5 4.5 5.1 -21.6 15.8 9.820 -53.3 -47.9 119.0 36.4 36.5 37.640 -104.4 -104.6 220.0 78.8 87.4 64.060 -149.7 -143.7 337.3 100.7 152.3 104.480 -191.3 -192.9 464.2 139.4 181.2 136.8
100 -264.2 -250.2 565.5 186.8 213.2 173.2
B-153/B-154

APPENDIX C—RESIDUAL STRENGTH TEST DATA
C.1 APPLIED LOADS.
Table C-1. Loading Conditions for Residual Strength Tests
Maximum Predicted Load
Panel Pressure
(psi) Hoop
(lb/in.) Longitude
(lb/in.) CP1B 23.6 1750 0 CP2 23.6 1750 0 CP3 8.0 592 1400 CP4 1.0 74 1400 CP5 15.0 1110 100 CP6 20.3 1500 1500
‐100
100
300
500
700
900
1100
1300
1500
1700
0 50 100 150 200 250 300 350 400
Time (sec.)
CP1B RST Applied LoadsLongitudinal
Hoop
Load
(lb)
Figure C-1. CP1B RST Applied Loads
Loads were applied in ten equal steps toward maximum planned loads of 23.625-psi pressure, 1750-lb/in. hoop load, and 1750-lb/in. longitudinal load. Ultimate failure of the panel occurred at approximately 14.0-psi pressure,
1037-lb/in. hoop load, and 1037-lb/in. longitudinal load.
C-1

‐100
100
300
500
700
900
1100
1300
1500
1700
0 200 400 600 800 1000 1200 1400 160
Load(b/in)
Time (sec.)
CP3 RST Applied LoadsLongitudinal
Hoop
Figure C-2. CP3 RST Applied Loads
Pressure and hoop load were initially applied in five equal steps up to 8.0 psi and 592 lb/in. and held. The panel was then loaded in ten equal steps to a maximum planned load of 1400-lb/in. longitudinal load. Ultimate failure was not observed at this load level. One additional step was applied to 1540-lb/in. longitudinal load. Ultimate failure was
observed at 1510-lb/in. longitudinal load.
‐100
100
300
500
700
900
1100
1300
1500
1700
0 500 1000 1500 2000 2500 3000
Load (lb/in)
Time (sec.)
CP4 RST Applied LoadsLongitudinal
Hoop
Load
(lb)
Load
(lb)
Figure C-3. CP4 RST Applied Loads Pressure and hoop load were initially applied in five equal steps up to 1.0 psi and 74 lb/in. and held. The panel was then loaded in ten equal steps to a maximum planned load of 1400-lb/in. longitudinal load. Ultimate failure was not observed at this load level. One additional step was applied to 1540-lb/in. longitudinal load. Ultimate failure was
not observed at this load level and the test was stopped.
C-2

‐100
100
300
500
700
900
1100
1300
1500
1700
0 500 1000 1500 2000 2500 3000 3500 4000
Load (lb/in)
Time (sec.)
CP5 RST Applied LoadsLongitudinal
Hoop
Load
(lb)
Figure C-4. CP5 RST Applied Loads
Longitudinal loads were initially applied in two equal steps up to 100 lb/in. and held. The panel was then loaded in ten equal steps toward a maximum planned load of 15.0-psi pressure and 1110-lb/in. hoop load. Ultimate failure
was observed at 13.5-psi pressure and 1000-lb/in. hoop load.
‐100
100
300
500
700
900
1100
1300
1500
1700
0 500 1000 1500 2000 2500 3000 3500 4000
Load (lb/in)
Time (sec.)
CP6 RST Applied Loads
Hoop and Longitudinal
Load
(lb)
Figure C-5. CP5 RST Applied Loads Loads were applied in fifteen equal steps toward maximum planned loads of 20.27-psi pressure, 1500-lb/in. hoop
load, and 1500-lb/in. longitudinal load. Ultimate failure of the panel occurred at approximately 18.78-psi pressure, 1390-lb/in. hoop load, and 1390-lb/in. longitudinal load.
C-3

C.2 NEAR-FIELD STRAIN GAGE DATA VS. TIME OF TEST.
‐2500
2500
7500
12500
17500
22500
0 50 100 150 200 250 300 350
Strain (µe)
Time (sec.)
SG25‐H
SG33
SG37
SG41
SG7
Strain (μ
ε)
Figure C-6. CP1B RST Near-Field Strain Gage Data (Strain gages 25-H, 33, 37, 41, and 7 are located on the convex surface, 0.125, 1.125, 2.125, 3.125, and 19 inches away from the notch tip, respectively.)
‐2500
2500
7500
12500
17500
22500
0 50 100 150 200 250 300 350
Strain (µe)
Time (sec.)
SG26‐H
SG34
SG38
SG42
SG8
Strain (μ
ε)
Figure C-7. CP1B RST Near-Field Strain Gage Data (Strain gages 26-H, 34, 38, 42, and 8 are located on the concave surface, 0.125, 1.125, 2.125, 3.125, and 19 inches away from the notch tip, respectively.)
C-4

‐2500
2500
7500
12500
17500
22500
0 50 100 150 200 250 300 350
SG43‐H
SG47
SG49
SG51
Strain (µe)
Time (sec.) Figure C-8. CP1B RST Near-Field Strain Gage Data (Strain gages 43-H, 47, 49, and 51 are located on the concave
surface, 0.125, 1.125, 2.125, and 3.125 inches away from the notch tip, respectively.)
‐2500
2500
7500
12500
17500
22500
0 200 400 600 800 1000 1200 1400 1600
Strain (µe)
Time (sec.)
SG30
SG29
SG28
SG17
Strain (μ
ε)
Strain (μ
ε)
Figure C-9. CP3 RST Near-Field Strain Gage Data (Strain gages 30, 29, 28, and 17 are located on the convex surface, 0.25, 0.75, 1.25, and 7 inches away from the notch tip, respectively.)
C-5

‐2500
2500
7500
12500
17500
22500
0 200 400 600 800 1000 1200 1400 1600
Strain (µe)
Time (sec.)
SG33
SG32
SG31
SG18
Strain (μ
ε)
Figure C-10. CP3 RST Near-Field Strain Gage Data (Strain gages 33, 32, 31, and 18 are located on the concave surface, 0.25, 0.75, 1.25, and 7 inches away from the notch tip, respectively.)
‐2500
2500
7500
12500
17500
22500
0 200 400 600 800 1000 1200 1400 1600
Strain (µe)
Time (sec.)
SG25
SG26
SG27
Strain (μ
ε)
Figure C-11. CP3 RST Near-Field Strain Gage Data (Strain gages 25, 26, and 27 are located on the concave surface, 0.25, 0.75, and 1.25 inches away from the notch tip, respectively.)
C-6

‐2500
2500
7500
12500
17500
22500
0 500 1000 1500 2000 2500 3000
Time (sec.)
SG30
SG29
SG28
SG17
Strain (μ
ε)
Figure C-12. CP4 RST Near-Field Strain Gage Data (Strain gages 30, 29, 28, and 17 are located on the convex surface, 0.25, 0.75, 1.25, and 7 inches away from the notch tip, respectively.)
‐2500
2500
7500
12500
17500
22500
0 500 1000 1500 2000 2500 3000
Time (sec.)
SG33
SG32
SG31
SG18
Strain (μ
ε)
Figure C-13. CP4 RST Near-Field Strain Gage Data (Strain gages 33, 32, 31, and 18 are located on the concave surface, 0.25, 0.75, 1.25, and 7 inches away from the notch tip, respectively.)
C-7

‐2500
2500
7500
12500
17500
22500
0 500 1000 1500 2000 2500 3000
Time (sec.)
SG25
SG26
SG27
Strain (μ
ε)
Figure C-14. CP4 RST Near-Field Strain Gage Data (Strain gages 25, 26, and 27 are located on the concave surface, 0.25, 0.75, and 1.25 inches away from the notch tip, respectively.)
‐2500
2500
7500
12500
17500
22500
0 500 1000 1500 2000 2500 3000 3500 4000
Time (sec.)
SG30
SG29
SG28
SG7
Strain (μ
ε)
Figure C-15. CP5 RST Near-Field Strain Gage Data (Strain gages 30, 29, 28, and 17 are located on the convex surface, 0.25, 0.75, 1.25, and 19 inches away from the notch tip, respectively.)
C-8

‐2500
2500
7500
12500
17500
22500
0 500 1000 1500 2000 2500 3000 3500 4000
Time (sec.)
SG33
SG32
SG31
SG6
Strain (μ
ε)
Figure C-16. CP5 RST Near-Field Strain Gage Data (Strain gages 33, 32, 31, and 6 are located on the concave surface, 0.25, 0.75, 1.25, and 19 inches away from the notch tip, respectively.)
‐2500
2500
7500
12500
17500
22500
0 500 1000 1500 2000 2500 3000 3500 4000
Time (sec.)
SG25
SG26
SG27
Strain (μ
ε)
Figure C-17. CP5 RST Near-Field Strain Gage Data (Strain gages 25, 26, and 27 are located on the concave surface, 0.25, 0.75, and 1.25 inches away from the notch tip, respectively.)
C-9

‐2500
2500
7500
12500
17500
22500
0 500 1000 1500 2000 2500 3000 3500 4000
Time (sec.)
SG30N
SG29N
SG28N
Figure C-18. CP6 RST Near-Field Strain Gage Data (Strain gages 30N, 29N, and 28N are located on the convex
surface, 0.25, 0.75, and 1.25 inches away from the notch tip, respectively.)
‐2500
2500
7500
12500
17500
22500
0 500 1000 1500 2000 2500 3000 3500 4000
Time (sec.)
SG33N
SG32N
SG31N
Strain (μ
ε)
Strain (μ
ε)
Figure C-19. CP6 RST Near-Field Strain Gage Data (Strain gages 33N, 32N, and 31N are located on the concave surface, 0.25, 0.75, and 1.25 inches away from the notch tip, respectively.)
C-10

‐2500
2500
7500
12500
17500
22500
0 500 1000 1500 2000 2500 3000 3500 4000
Time (sec.)
SG25
SG26
SG27
Strain (μ
ε)
Figure C-20. CP6 RST Near-Field Strain Gage Data (Strain gages 25, 26, and 27 are located on the concave surface, 0.25, 0.75, and 1.25 inches away from the notch tip, respectively.)
C-11

C.3 FULL-FIELD STRAIN PHOTOGRAMMETRY DATA.
Figure C-21. CP1B RST Longitudinal Strain—0 psi, 0-lb/in. Hoop Load, 0-lb/in. Longitudinal Load
Figure C-22. CP1B RST Longitudinal Strain—2.4 psi, 175-lb/in. Hoop Load, 0-lb/in. Longitudinal Load
Figure C-23. CP1B RST Longitudinal Strain—4.7 psi, 350-lb/in. Hoop Load, 0-lb/in. Longitudinal Load
C-12

Figure C-24. CP1B RST Longitudinal Strain—7.1 psi, 525-lb/in. Hoop Load, 0-lb/in. Longitudinal Load
Figure C-25. CP1B RST Longitudinal Strain—9.5 psi, 700-lb/in. Hoop Load, 0-lb/in. Longitudinal Load
Figure C-26. CP1B RST Longitudinal Strain—11.8 psi, 875-lb/in. Hoop Load, 0-lb/in. Longitudinal Load
C-13

Figure C-27. CP1B RST Hoop Strain—0 psi, 0-lb/in. Hoop Load, 0-lb/in. Longitudinal Load
Figure C-28. CP1B RST Hoop Strain—2.4 psi, 175-lb/in. Hoop Load, 0-lb/in. Longitudinal Load
Figure C-29. CP1B RST Hoop Strain—4.7 psi, 350-lb/in. Hoop Load, 0-lb/in. Longitudinal Load
C-14

Figure C-30. CP1B RST Hoop Strain—7.1 psi, 525-lb/in. Hoop Load, 0-lb/in. Longitudinal Load
Figure C-31. CP1B RST Hoop Strain—9.5 psi, 700-lb/in. Hoop Load, 0-lb/in. Longitudinal Load
Figure C-32. CP1B RST Hoop Strain—11.8 psi, 875-lb/in. Hoop Load, 0-lb/in. Longitudinal Load
C-15

Figure C-33. CP3 RST Longitudinal Strain—0 psi, 0-lb/in. Hoop Load, 0-lb/in. Longitudinal Load
Figure C-34. CP3 RST Longitudinal Strain—8.0 psi, 592-lb/in. Hoop Load, 0-lb/in. Longitudinal Load
Figure C-35. CP3 RST Longitudinal Strain—8.0 psi, 592-lb/in. Hoop Load, 140-lb/in. Longitudinal Load
C-16

Figure C-36. CP3 RST Longitudinal Strain—8.0 psi, 592-lb/in. Hoop Load, 280-lb/in. Longitudinal Load
Figure C-37. CP3 RST Longitudinal Strain—8.0 psi, 592-lb/in. Hoop Load, 420-lb/in. Longitudinal Load
Figure C-38. CP3 RST Longitudinal Strain—8.0 psi, 592-lb/in. Hoop Load, 560-lb/in. Longitudinal Load
C-17

Figure C-39. CP3 RST Longitudinal Strain—8.0 psi, 592-lb/in. Hoop Load, 700-lb/in. Longitudinal Load
Figure C-40. CP3 RST Longitudinal Strain—8.0 psi, 592-lb/in. Hoop Load, 840-lb/in. Longitudinal Load
Figure C-41. CP3 RST Longitudinal Strain—8.0 psi, 592-lb/in. Hoop Load, 980-lb/in. Longitudinal Load
C-18

Figure C-42. CP3 RST Longitudinal Strain—8.0 psi, 592-lb/in. Hoop Load, 1120-lb/in. Longitudinal Load
Figure C-43. CP3 RST Longitudinal Strain—8.0 psi, 592-lb/in. Hoop Load, 1260-lb/in. Longitudinal Load
Figure C-44. CP3 RST Longitudinal Strain—8.0 psi, 592-lb/in. Hoop Load, 1400-lb/in. Longitudinal Load
C-19

Figure C-45. CP3 RST Longitudinal Strain—8.0 psi, 592-lb/in. Hoop Load, 1540-lb/in. Longitudinal Load
Figure C-46. CP3 RST Hoop Strain—0 psi, 0-lb/in. Hoop Load, 0-lb/in. Longitudinal Load
Figure C-47. CP3 RST Hoop Strain—8.0 psi, 592-lb/in. Hoop Load, 0-lb/in. Longitudinal Load
C-20

Figure C-48. CP3 RST Hoop Strain—8.0 psi, 592-lb/in. Hoop Load, 140-lb/in. Longitudinal Load
Figure C-49. CP3 RST Hoop Strain—8.0 psi, 592-lb/in. Hoop Load, 280-lb/in. Longitudinal Load
Figure C-50. CP3 RST Hoop Strain—8.0 psi, 592-lb/in. Hoop Load, 420-lb/in. Longitudinal Load
C-21

Figure C-51. CP3 RST Hoop Strain—8.0 psi, 592-lb/in. Hoop Load, 560-lb/in. Longitudinal Load
Figure C-52. CP3 RST Hoop Strain—8.0 psi, 592-lb/in. Hoop Load, 700-lb/in. Longitudinal Load
Figure C-53. CP3 RST Hoop Strain—8.0 psi, 592-lb/in. Hoop Load, 840-lb/in. Longitudinal Load
C-22

Figure C-54. CP3 RST Hoop Strain—8.0 psi, 592-lb/in. Hoop Load, 980-lb/in. Longitudinal Load
Figure C-55. CP3 RST Hoop Strain—8.0 psi, 592-lb/in. Hoop Load, 1120-lb/in. Longitudinal Load
Figure C-56. CP3 RST Hoop Strain—8.0 psi, 592-lb/in. Hoop Load, 1260-lb/in. Longitudinal Load
C-23

Figure C-57. CP3 RST Hoop Strain—8.0 psi, 592-lb/in. Hoop Load, 1400-lb/in. Longitudinal Load
Figure C-58. CP3 RST Hoop Strain—8.0 psi, 592-lb/in. Hoop Load, 1540-lb/in. Longitudinal Load
Figure C-59. CP4 RST Longitudinal Strain—0 psi, 0-lb/in. Hoop Load, 0-lb/in. Longitudinal Load
C-24

Figure C-60. CP4 RST Longitudinal Strain—0 psi, 0-lb/in. Hoop Load, 0-lb/in. Longitudinal Load
Figure C-61. CP4 RST Longitudinal Strain—0 psi, 0-lb/in. Hoop Load, 0-lb/in. Longitudinal Load
Figure C-62. CP4 RST Longitudinal Strain—0 psi, 0-lb/in. Hoop Load, 0-lb/in. Longitudinal Load
C-25

Figure C-63. CP4 RST Longitudinal Strain—0 psi, 0-lb/in. Hoop Load, 0-lb/in. Longitudinal Load
Figure C-64. CP4 RST Longitudinal Strain—0 psi, 0-lb/in. Hoop Load, 0-lb/in. Longitudinal Load
Figure C-65. CP4 RST Longitudinal Strain—0 psi, 0-lb/in. Hoop Load, 0-lb/in. Longitudinal Load
C-26

Figure C-66. CP4 RST Longitudinal Strain—0 psi, 0-lb/in. Hoop Load, 0-lb/in. Longitudinal Load
Figure C-67. CP4 RST Longitudinal Strain—0 psi, 0-lb/in. Hoop Load, 0-lb/in. Longitudinal Load
Figure C-68. CP4 RST Longitudinal Strain—0 psi, 0-lb/in. Hoop Load, 0-lb/in. Longitudinal Load
C-27

Figure C-69. CP4 RST Longitudinal Strain—0 psi, 0-lb/in. Hoop Load, 0-lb/in. Longitudinal Load
Figure C-70. CP4 RST Longitudinal Strain—0 psi, 0-lb/in. Hoop Load, 0-lb/in. Longitudinal Load
Figure C-71. CP4 RST Longitudinal Strain—0 psi, 0-lb/in. Hoop Load, 0-lb/in. Longitudinal Load
C-28

Figure C-72. CP4 RST Hoop Strain—0 psi, 0-lb/in. Hoop Load, 0-lb/in. Longitudinal Load
Figure C-73. CP4 RST Hoop Strain—0 psi, 0-lb/in. Hoop Load, 0-lb/in. Longitudinal Load
Figure C-74. CP4 RST Hoop Strain—0 psi, 0-lb/in. Hoop Load, 0-lb/in. Longitudinal Load
C-29

Figure C-75. CP4 RST Hoop Strain—0 psi, 0-lb/in. Hoop Load, 0-lb/in. Longitudinal Load
Figure C-76. CP4 RST Hoop Strain—0 psi, 0-lb/in. Hoop Load, 0-lb/in. Longitudinal Load
Figure C-77. CP4 RST Hoop Strain—0 psi, 0-lb/in. Hoop Load, 0-lb/in. Longitudinal Load
C-30

Figure C-78. CP4 RST Hoop Strain—0 psi, 0-lb/in. Hoop Load, 0-lb/in. Longitudinal Load
Figure C-79. CP4 RST Hoop Strain—0 psi, 0-lb/in. Hoop Load, 0-lb/in. Longitudinal Load
Figure C-80. CP4 RST Hoop Strain—0 psi, 0-lb/in. Hoop Load, 0-lb/in. Longitudinal Load
C-31

Figure C-81. CP4 RST Hoop Strain—0 psi, 0-lb/in. Hoop Load, 0-lb/in. Longitudinal Load
Figure C-82. CP4 RST Hoop Strain—0 psi, 0-lb/in. Hoop Load, 0-lb/in. Longitudinal Load
Figure C-83. CP4 RST Hoop Strain—0 psi, 0-lb/in. Hoop Load, 0-lb/in. Longitudinal Load
C-32

Figure C-84. CP4 RST Hoop Strain—0 psi, 0-lb/in. Hoop Load, 0-lb/in. Longitudinal Load
Figure C-85. CP5 RST Longitudinal Strain—0 psi, 0-lb/in. Hoop Load, 0-lb/in. Longitudinal Load
Figure C-86. CP5 RST Longitudinal Strain—0 psi, 0-lb/in. Hoop Load, 100-lb/in. Longitudinal Load
C-33

Figure C-87. CP5 RST Longitudinal Strain—1.4 psi, 100-lb/in. Hoop Load, 100-lb/in. Longitudinal Load
Figure C-88. CP5 RST Longitudinal Strain—1.7 psi, 200-lb/in. Hoop Load, 100-lb/in. Longitudinal Load
Figure C-89. CP5 RST Longitudinal Strain— 4.1 psi, 300-lb/in. Hoop Load, 100-lb/in. Longitudinal Load
C-34

Figure C-90. CP5 RST Longitudinal Strain—5.4 psi, 400-lb/in. Hoop Load, 100-lb/in. Longitudinal Load
Figure C-91. CP5 RST Longitudinal Strain—6.8 psi, 500-lb/in. Hoop Load, 100-lb/in. Longitudinal Load
Figure C-92. CP5 RST Longitudinal Strain—8.1 psi, 600-lb/in. Hoop Load, 100-lb/in. Longitudinal Load
C-35

Figure C-93. CP5 RST Longitudinal Strain—9.5 psi, 700-lb/in. Hoop Load, 100-lb/in. Longitudinal Load
Figure C-94. CP5 RST Longitudinal Strain—10.8 psi, 800-lb/in. Hoop Load, 100-lb/in. Longitudinal Load
Figure C-95. CP5 RST Longitudinal Strain—10.8 psi, 800-lb/in. Hoop Load, 100-lb/in. Longitudinal Load
C-36

Figure C-96. CP5 RST Longitudinal Strain—12.2 psi, 900-lb/in. Hoop Load, 100-lb/in. Longitudinal Load
Figure C-97. CP5 RST Longitudinal Strain—12.2 psi, 900-lb/in. Hoop Load, 100-lb/in. Longitudinal Load
Figure C-98. CP5 RST Longitudinal Strain—12.2 psi, 900-lb/in. Hoop Load, 100-lb/in. Longitudinal Load
C-37

Figure C-99. CP5 RST Hoop Strain—0 psi, 0-lb/in. Hoop Load, 0-lb/in. Longitudinal Load
Figure C-100. CP5 RST Hoop Strain—0 psi, 0-lb/in. Hoop Load, 100-lb/in. Longitudinal Load
Figure C-101. CP5 RST Hoop Strain—1.4 psi, 100-lb/in. Hoop Load, 100-lb/in. Longitudinal Load
C-38

Figure C-102. CP5 RST Hoop Strain—2.7 psi, 200-lb/in. Hoop Load, 100-lb/in. Longitudinal Load
Figure C-103. CP5 RST Hoop Strain—4.1 psi, 300-lb/in. Hoop Load, 100-lb/in. Longitudinal Load
Figure C-104. CP5 RST Hoop Strain—5.4 psi, 400-lb/in. Hoop Load, 100-lb/in. Longitudinal Load
C-39

Figure C-105. CP5 RST Hoop Strain—6.8 psi, 500-lb/in. Hoop Load, 100-lb/in. Longitudinal Load
Figure C-106. CP5 RST Hoop Strain—8.1 psi, 600-lb/in. Hoop Load, 100-lb/in. Longitudinal Load
Figure C-107. CP5 RST Hoop Strain—9.5 psi, 700-lb/in. Hoop Load, 100-lb/in. Longitudinal Load
C-40

Figure C-108. CP5 RST Hoop Strain—10.8 psi, 800-lb/in. Hoop Load, 100-lb/in. Longitudinal Load
Figure C-109. CP5 RST Hoop Strain—10.8 psi, 800-lb/in. Hoop Load, 100-lb/in. Longitudinal Load
Figure C-110. CP5 RST Hoop Strain—12.1 psi, 900-lb/in. Hoop Load, 100-lb/in. Longitudinal Load
C-41

Figure C-111. CP5 RST Hoop Strain—12.1 psi, 900-lb/in. Hoop Load, 100-lb/in. Longitudinal Load
Figure C-112. CP5 RST Hoop Strain—12.1 psi, 900-lb/in. Hoop Load, 100-lb/in. Longitudinal Load
Figure C-113. CP6 RST Longitudinal Strain—0 psi, 0-lb/in. Hoop Load, 0-lb/in. Longitudinal Load
C-42

Figure C-114. CP6 RST Longitudinal Strain—1.4 psi, 100-lb/in. Hoop Load, 100-lb/in. Longitudinal Load
Figure C-115. CP6 RST Longitudinal Strain—2.7 psi, 200-lb/in. Hoop Load, 200-lb/in. Longitudinal Load
Figure C-116. CP6 RST Longitudinal Strain—4.1 psi, 300-lb/in. Hoop Load, 300-lb/in. Longitudinal Load
C-43

Figure C-117. CP6 RST Longitudinal Strain—5.4 psi, 400-lb/in. Hoop Load, 400-lb/in. Longitudinal Load
Figure C-118. CP6 RST Longitudinal Strain—6.8 psi, 500-lb/in. Hoop Load, 500-lb/in. Longitudinal Load
Figure C-119. CP6 RST Longitudinal Strain—8.1 psi, 600-lb/in. Hoop Load, 600-lb/in. Longitudinal Load
C-44

Figure C-120. CP6 RST Longitudinal Strain—9.5 psi, 700-lb/in. Hoop Load, 700-lb/in. Longitudinal Load
Figure C-121. CP6 RST Longitudinal Strain—10.8 psi, 800-lb/in. Hoop Load, 800-lb/in. Longitudinal Load
Figure C-122. CP6 RST Longitudinal Strain—12.2 psi, 900-lb/in. Hoop Load, 900-lb/in. Longitudinal Load
C-45

Figure C-123. CP6 RST Longitudinal Strain—13.5 psi, 1000-lb/in. Hoop Load, 1000-lb/in. Longitudinal Load
Figure C-124. CP6 RST Longitudinal Strain—13.5 psi, 1000-lb/in. Hoop Load, 1000-lb/in. Longitudinal Load
Figure C-125. CP6 RST Longitudinal Strain—14.9 psi, 1100-lb/in. Hoop Load, 1100-lb/in. Longitudinal Load
C-46

Figure C-126. CP6 RST Longitudinal Strain—14.9 psi, 1100-lb/in. Hoop Load, 1100-lb/in. Longitudinal Load
Figure C-127. CP6 RST Longitudinal Strain—14.9 psi, 1100-lb/in. Hoop Load, 1100-lb/in. Longitudinal Load
Figure C-128. CP6 RST Longitudinal Strain—16.2 psi, 1200-lb/in. Hoop Load, 1200-lb/in. Longitudinal Load
C-47

Figure C-129. CP6 RST Longitudinal Strain—17.6 psi, 1300-lb/in. Hoop Load, 1300-lb/in. Longitudinal Load
Figure C-130. CP6 RST Longitudinal Strain—17.6 psi, 1300-lb/in. Hoop Load, 1300-lb/in. Longitudinal Load
Figure C-131. CP6 RST Hoop Strain—0 psi, 0-lb/in. Hoop Load, 0-lb/in. Longitudinal Load
C-48

Figure C-132. CP6 RST Hoop Strain—1.4 psi, 100-lb/in. Hoop Load, 100-lb/in. Longitudinal Load
Figure C-133. CP6 RST Hoop Strain—2.7 psi, 200-lb/in. Hoop Load, 200-lb/in. Longitudinal Load
Figure C-134. CP6 RST Hoop Strain—4.1 psi, 300-lb/in. Hoop Load, 300-lb/in. Longitudinal Load
C-49

Figure C-135. CP6 RST Hoop Strain—5.4 psi, 400-lb/in. Hoop Load, 400-lb/in. Longitudinal Load
Figure C-136. CP6 RST Hoop Strain—6.8 psi, 500-lb/in. Hoop Load, 500-lb/in. Longitudinal Load
Figure C-137. CP6 RST Hoop Strain—8.1 psi, 600-lb/in. Hoop Load, 600-lb/in. Longitudinal Load
C-50

Figure C-138. CP6 RST Hoop Strain—9.5 psi, 700-lb/in. Hoop Load, 700-lb/in. Longitudinal Load
Figure C-139. CP6 RST Hoop Strain—10.8 psi, 800-lb/in. Hoop Load, 800-lb/in. Longitudinal Load
Figure C-140. CP6 RST Hoop Strain—12.2 psi, 900-lb/in. Hoop Load, 900-lb/in. Longitudinal Load
C-51

Figure C-141. CP6 RST Hoop Strain—12.2 psi, 900-lb/in. Hoop Load, 900-lb/in. Longitudinal Load
Figure C-142. CP6 RST Hoop Strain—13.5 psi, 1000-lb/in. Hoop Load, 1000-lb/in. Longitudinal Load
Figure C-143. CP6 RST Hoop Strain—13.5 psi, 1000-lb/in. Hoop Load, 1000-lb/in. Longitudinal Load
C-52

Figure C-144. CP6 RST Hoop Strain—14.9 psi, 1100-lb/in. Hoop Load, 1100-lb/in. Longitudinal Load
Figure C-145. CP6 RST Hoop Strain—14.9 psi, 1100-lb/in. Hoop Load, 1100-lb/in. Longitudinal Load
Figure C-146. CP6 RST Hoop Strain—14.9 psi, 1100-lb/in. Hoop Load, 1100-lb/in. Longitudinal Load
C-53

Figure C-147. CP6 RST Hoop Strain—17.6 psi, 1300-lb/in. Hoop Load, 1300-lb/in. Longitudinal Load
Figure C-148. CP6 RST Hoop Strain—17.6 psi, 1300-lb/in. Hoop Load, 1300-lb/in. Longitudinal Load
C-54

APPENDIX D—ANALYSIS COMPARISONS
0.00E+00
5.00E+03
1.00E+04
1.50E+04
2.00E+04
2.50E+04
0 1 2 3 4 5 6
p
FEA ‐ 10%
ARAMIS ‐ 10%
SG ‐ 10%
FEA ‐ 20%
ARAMIS ‐ 20%
SG ‐ 20%
FEA ‐ 30%
ARAMIS ‐ 30%
SG ‐ 30%
FEA ‐ 40%
7
Sanµe
Distance (in.)
ARAMIS ‐ 40%
SG ‐ 40%
Strain (μ
ε)
Figure D-1. CP1B RST Experimental Data and Analysis Comparison
5.00E+03
0.00E+00
5.00E+03
1.00E+04
1.50E+04
2.00E+04
2.50E+04
0 1 2 3 4 5 6 7
Distance (in.)
FEA ‐ 0%
ARAMIS ‐ 0%
SG ‐ 0%
FEA ‐ 20%
ARAMIS ‐ 20%
SG ‐ 20%
FEA ‐ 40%
ARAMIS ‐ 40%
SG ‐ 40%
FEA ‐ 60%
ARAMIS ‐ 60%
SG ‐ 60%
FEA ‐ 80%
ARAMIS ‐ 80%
SG ‐ 80%
Strain (μ
ε)
Figure D-2. CP3 RST Experimental Data and Analysis Comparison
D-1

5.00E+03
0.00E+00
5.00E+03
1.00E+04
1.50E+04
2.00E+04
2.50E+04
0 1 2 3 4 5 6
Distance (in.)
7
FEA ‐ 0%
ARAMIS ‐ 0%
SG ‐ 0%
FEA ‐ 20%
ARAMIS ‐ 20%
SG ‐ 20%
FEA ‐ 40%
SG ‐ 40%
ARAMIS ‐ 40%
FEA ‐ 60%
ARAMIS ‐ 60%
SG ‐ 60%
Strain (μ
ε)
Figure D-3. CP4 RST Experimental Data and Analysis Comparison
‐5.00E+03
0.00E+00
5.00E+03
1.00E+04
1.50E+04
2.00E+04
2.50E+04
0 1 2 3 4 5 6
Distance (in.)
7
FEA ‐ 0%
ARAMIS ‐ 0%
SG ‐ 0%
FEA ‐ 20%
ARAMIS ‐ 20%
SG ‐ 20%FEA ‐ 40%
ARAMIS ‐ 40%
SG ‐ 40%
FEA ‐ 60%
ARAMIS ‐ 60%
SG ‐ 60%
Strain (μ
ε)
Figure D-4. CP5 RST Experimental Data and Analysis Comparison
D-2

0.00E+00
5.00E+03
1.00E+04
1.50E+04
2.00E+04
2.50E+04
0 0.5 1 1.5 2 2.5 3 3.5 4 4.5 5
Distance (in.)
FEA ‐ 20%
ARAMIS ‐ 20%SG ‐ 20%FEA ‐ 40%
ARAMIS ‐ 40%SG ‐ 40%
FEA ‐ 60%ARAMIS ‐ 60%
SG ‐ 60%FEA ‐ 80%
ARAMIS ‐ 80%SG ‐ 80%
Strain (μ
ε)
Figure D-5. CP6 RST Experimental Data and Analysis Comparison
D-3/D-4
Related Documents