Structural Technical Report #3 By Robert Whitaker Executive summary This report covers a more extensive check of the main lateral force resisting components for Parkview at Bloomfield Station, a six story residential apartment in Bloomfield, New Jersey. Lateral load calculations, including seismic and wind from three directions, are used to compute the loads for the shear walls in the building. The two braced frames at the drive aisles are also analyzed to check their capacity. Finally, a building drift limit is established and compared to code values. Structural Overview The structural system for Parkview at Bloomfield Station is a light gage roof composed of trusses spaced 2’ on center (oc) spanning front to back, panelized bearing light gage walls 4” and 6” wide continuously capped with a steel tube for load distribution purposes. These walls not only hold the 16” deep D500 Hambro ® floor system but also act as the main lateral force resisting system for the building. Thin cross bracing straps attached to the light gage bearing walls give these walls the lateral capacity required. There are a total of 38 shear walls in the building: 17 in the North-South direction, 17 in the East-West direction, and 4 concrete masonry unit (cmu) stair towers that resist load mainly in the East-West direction. The precast garage is structurally separate, and only the 4” building separation will be considered for story drift in the lateral review. Calculation Overview All spot checks performed on structural components in the building were calculated using ETABS, a finite element based analysis program, and hand calculations using the shear wall analysis method and the area method. The lowest level of the building was used to check the shear wall assemblies, and the two braced frames. All spot checks showed that the members were adequately sized for the calculated loads. The light gage shear wall straps, the structural columns and bracing in the drive aisles, and the cmu stair towers were all determined to be adequately sized for the Load and Resistance Factor Design (LRFD) loadings. It was also determined that seismic design controlled over wind in the lateral analysis. The computer output yielded loadings that made the current sizes inadequate, so a more in depth analysis of these lateral loadings will need to be determined. A check of the input and reasonability of loads will be performed to check accuracy of the computer generated data. • Robert Whitaker • Structural ~ Parfitt • Parkview at Bloomfield Station • Bloomfield, NJ • 11-21-05

Welcome message from author
This document is posted to help you gain knowledge. Please leave a comment to let me know what you think about it! Share it to your friends and learn new things together.
Transcript

Structural Technical Report #3 By Robert Whitaker
Executive summary
This report covers a more extensive check of the main lateral force resisting components for Parkview at Bloomfield Station, a six story residential apartment in Bloomfield, New Jersey. Lateral load calculations, including seismic and wind from three directions, are used to compute the loads for the shear walls in the building. The two braced frames at the drive aisles are also analyzed to check their capacity. Finally, a building drift limit is established and compared to code values.
Structural Overview
The structural system for Parkview at Bloomfield Station is a light gage roof composed of trusses spaced 2’ on center (oc) spanning front to back, panelized bearing light gage walls 4” and 6” wide continuously capped with a steel tube for load distribution purposes. These walls not only hold the 16” deep D500 Hambro® floor system but also act as the main lateral force resisting system for the building. Thin cross bracing straps attached to the light gage bearing walls give these walls the lateral capacity required. There are a total of 38 shear walls in the building: 17 in the North-South direction, 17 in the East-West direction, and 4 concrete masonry unit (cmu) stair towers that resist load mainly in the East-West direction. The precast garage is structurally separate, and only the 4” building separation will be considered for story drift in the lateral review.
Calculation Overview
All spot checks performed on structural components in the building were calculated using ETABS, a finite element based analysis program, and hand calculations using the shear wall analysis method and the area method. The lowest level of the building was used to check the shear wall assemblies, and the two braced frames.
All spot checks showed that the members were adequately sized for the calculated
loads. The light gage shear wall straps, the structural columns and bracing in the drive aisles, and the cmu stair towers were all determined to be adequately sized for the Load and Resistance Factor Design (LRFD) loadings. It was also determined that seismic design controlled over wind in the lateral analysis. The computer output yielded loadings that made the current sizes inadequate, so a more in depth analysis of these lateral loadings will need to be determined. A check of the input and reasonability of loads will be performed to check accuracy of the computer generated data.
• Robert Whitaker • Structural ~ Parfitt • Parkview at Bloomfield Station • Bloomfield, NJ • 11-21-05
1
Structural Technical Report #3 By Robert Whitaker
Structural Overview The structural system for Parkview at Bloomfield Station, from the top down, is a
roof composed of light gage roof trusses spaced 2’ on center (oc) spanning front to back with some hip conditions incorporated, bearing on exterior and corridor walls, and girder trusses at hip roof conditions. The bearing walls are panelized bearing light gage steel stud walls 4” and 6” wide continuously capped with a steel tube, HSS 4x4x5/16” and HSS 6x4x5/16” respectively, for load distribution purposes. Beams and transfer beams provide bearing points for the floor system, columns, and roof trusses. A 16” deep Hambro® D500™ floor system makes up the composite rigid floor diaphragm and consists of joists spaced at 4’ oc connected to a 3” concrete floor (3000psi). The 16” joists span the short direction of the living units (typically 30’) and Hambro RTC joists (top cord only joists) span the corridor (typically 6’).
Along with the bearing light gage walls,
there are two braced frame systems at the drive aisles that pass under the building. The upper floors in these sections are supported by a series of one or two story columns that are part of this W18 braced frame system. All 6 floors of the building have mainly the same floor plans with the exception of 4 locations: an entry/lobby unit, a 2 story drive aisle, a 1 story drive aisle, and a
• Robert Whitaker • Structural ~ Parfitt • Parkview at Bloomfield Station • Bloomfield, NJ • 11-21-05
Precast Garage (not included)
2 Story Drive Aisle
Driv
eA
isle

2
1st floor exit route. In these areas, transfer beams are utilized creating much larger beam sizes. A two story braced frame system is utilized in the 2 story drive aisle, consisting of 19 W18 columns placed along bearing lines. There is a similar system at the one story drive aisle consisting of 12 columns. While these braced frames act as the lateral force resisting system in these two unique areas, the main lateral force resisting system for the building is a shear wall system provided by thin steel cross bracing straps attached to the light gage shear walls.
There are a total of 38 shear walls in the building, consisting of 17 in the North-
South direction, 17 in the East-West direction, and 4 concrete masonry unit (cmu) stair towers that resist load mainly in the East-West direction. Due to the fact that the shear walls are fairly evenly spaced and similar in thickness and length, a fairly even load distribution is present throughout the entire building.
Finally, continuous 2’-6” wide footings make up most of the building bearing
wall support under the 4” slab-on-grade foundation. However, larger spread footings (typically 4’x4’) are utilized below leaning column point loads. The spread footings at the drive aisle’s braced frames merge together and resemble larger single spread footings. The precast garage's footings are separate from that of the main building and encompass a deep foundation system rather than the buildings shallow footing system.
The precast garage located at the center of the building, consists of precast
double-T planks bearing on load bearing elements. The vertical elements in the garage transfer their load to pile caps encompassing 100 ton H piles drilled to bedrock (ranging from 42-53 ft below the slab-on-grade surface). The precast garage is structurally separated from the main building by a 4” air gap and by 4” expansion joints at building connection points. Because of this, the garage will not be considered in this building analysis. Furthermore, due to the overall rigidity of this parking structure, which has an assumed deflection of 1”, the main building is allowed to have a building drift of up to 3” in the direction of the garage.
Lateral Check Overview
This report takes a closer look at the loads and load cases used in the design and check of Parkview at Bloomfield Station. A reasonable method of distributing these loads to the shear walls throughout the building is checked using a computer program utilizing finite element analysis and the shear wall analysis method. Finally, story drift and overturning of the building are considered. Load Design Theory
The design theory used in the analysis of Parkview at Bloomfield Station was Allowable Stress Design (ASD). The beam calculations were designed using the American Institute of Steel Construction (AISC) 9th Edition ~ ASD and designed using

3
the Enercalc® program (ASD based). The tube steel leaning columns were also designed based on the column tables in chapter 3 of the AISC 9th Edition ~ ASD.
The lateral spot check of the building using the ETABS program is based on Load
and Resistance Factor Design (LRFD), ACI 318-99, and loads from ASCE-7. The LRFD design will yield a change in the overall loads calculated as compared to the ASD design calculations. However, LRFD should yield equal sized or slightly smaller members than those designed due to the effect of the phi factors as compared to ASD factors of safety. Lateral Code References
The design of the structure was in accordance with the International Building
Code (IBC) 2000 with New Jersey (NJ) amendments, the NJ Uniform Construction Code, and local county and township requirements. IBC 2000 used design loads specified in ASCE 7 for both gravity and lateral loadings. Furthermore, the NJ amendments to IBC 2000 did not create any changes to the structural code requirements of IBC 2000, but focused more on non-structural issues throughout the code. In addition, no changes to the structural design requirements were added by the NJ Uniform Construction Code or any of the local requirements.
Since Bloomfield, NJ is located at the center of an east coast seismic epicenter, seismic has a much larger effect on the lateral analysis. Similarly, Bloomfield is located near the coast line, so it also experiences greater wind speeds (basic wind speed of 110 mph). It was determined that the effects of seismic loading, while close to the loading incurred by wind, created larger forces to be resisted in the shear walls.
Original Wind and Lateral Load Overview

4
Prec
ast G
arag
e
Drive Aisle
Driv
e A
isle
Shea
r W
all P
lan
5
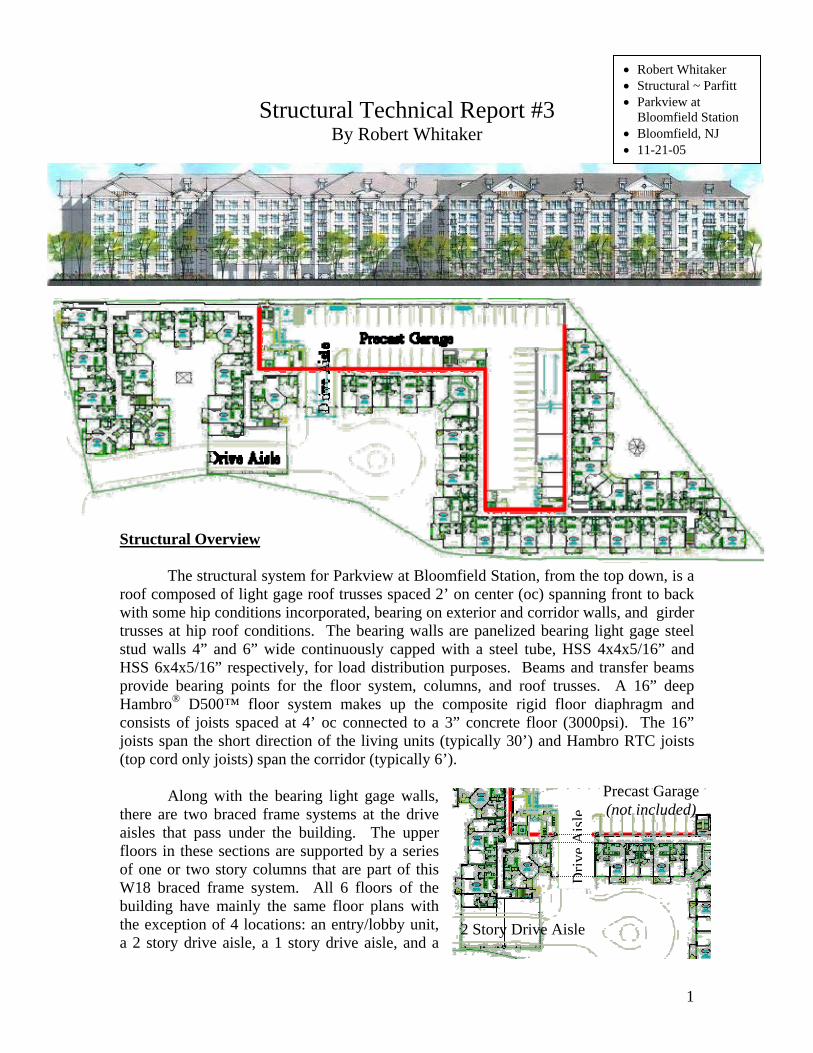
Original Wind Analysis Building information N-S direction: Shear walls E-W direction: Shear walls Locations: Bloomfield, NJ Exposure: B Building use: Residential 24.7’ 6’ Corridor 30’ Unit Unit 6 stories @ 10’-8” = 64’-0”
2 units @ 38’ = 76’
Section @ Shear Wall A-A Plan at Shear Wall
(Same results on the E-W shear wall)1
The loading on the diagram (right) represents the loading on a single shear wall in the building. These loads are compared with those calculated in the following seismic section, and the overall larger of the 2 loading sets will be used in the design of the shear wall system. This was initially how the design of the system was carried out. The design specified exposure class D which is conservative, does not correspond with the recommendations of the Geo-tech report for exposure B. This makes the design values more conservative and is the only area of difference.
1 I have not yet learned all the aspects of this code; see Tech 3 for a more complete analysis of the building’s wind and dynamic seismic loading.
Shea
rWal
lA-A
Shea
rWal
l
Shea
rWal
l
RF 5
4
3
2
1
48.5 k
4.9 k 9.5 k
9.2 k
8.8 k
8.2 k
7.8 k
Section @ Shear Wall A-A
Windward Leeward
Precast Garage
Drive Aisle

6
Computer Wind Analysis Building information N-S direction: Shear walls E-W direction: Shear walls Locations: Bloomfield, NJ Exposure: B Building use: Residential
4
The loading on the diagram represents the loading on shear wall number four (see
above). This is the shear wall that is required to resist the largest wind load in the building. The loads on this wall are nearly ¼ times larger than the load that was originally calculated. The load in this wall appears to be greater than those around it because it is the only wall in the vicinity that is oriented in the North-South direction, making it solely responsible for resisting the forces in that direction. Additionally, it is located away from the center of rigidity of the system, requiring it to contribute greatly towards resisting torsion in the building.
Of the four wind load approaches utilized in this report, this analysis yielded the
largest base shear. This is due to the ability of the finite element analysis program to distribute the forces more accurately to each member in the system. Another possibility for the increased force as compared to all the other results could be a computer input error, which after reviewing the seismic loadings, is a distinct possibility. While this loading of the shear wall (60.4k) is the largest created from the four wind loading approaches, the seismic loading still controls the overall design based on the building location.
RF 5
4
3
2
1
60.4 k
6.7 k 11.1 k 11.7 k 12.5 k 9.6 k 8.8 k
Section @ Shear Wall 4
Windward Leeward
7
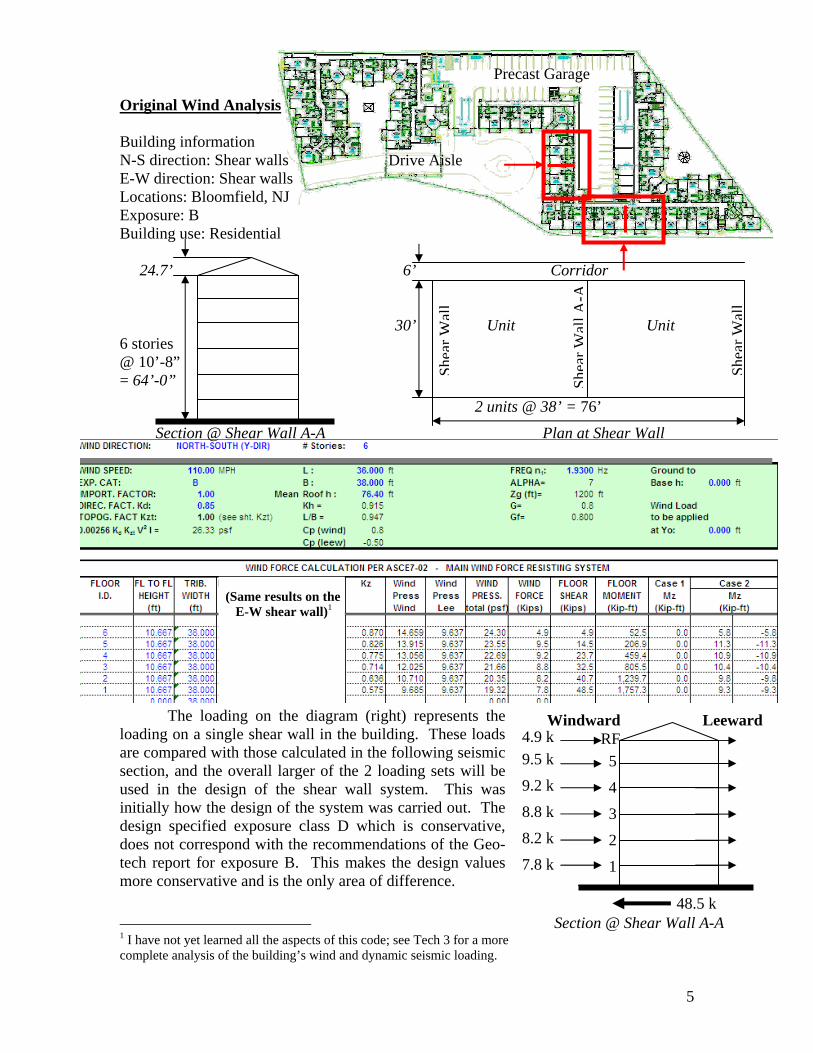
Shear Wall Analysis Method Building information N-S direction: Shear walls E-W direction: Shear walls Locations: Bloomfield, NJ Exposure: B Building use: Residential
36
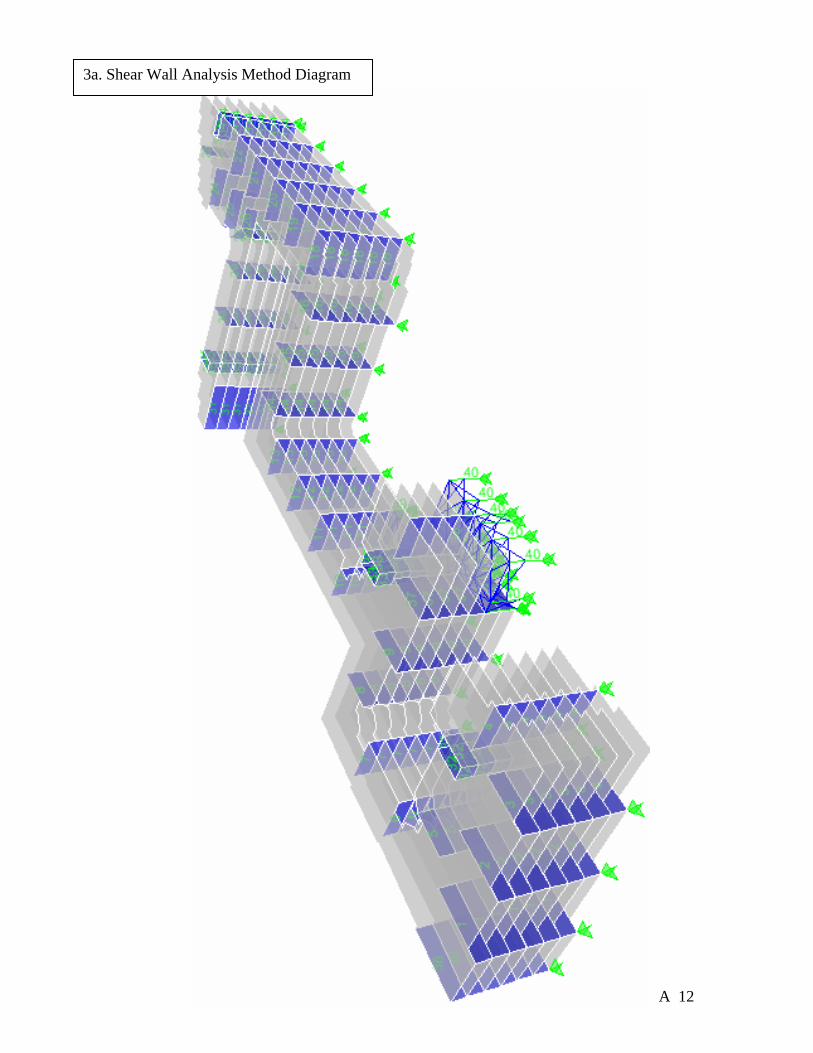
(For all results of shear walls on this floor see page A 14)
The Shear wall analysis method is based off of the combination of direct shear
and torsional shear effects on individual shear walls. With this in mind, it is evident why shear wall number 36 has the largest load. This wall is located the furthest away from the center of rigidity (CR) and is located so that the torsional effects are purely additive with the direct shear. Since it is located away from the CR it will be responsible for a larger portion of the torsion in the building.
Even with the additional torsion load acting on the wall, this shear wall has the
least amount of load as compared to the other three wind loaded shear walls being compared. This lack of load is attributed to the procedure of the shear wall analysis method. In this method, walls oriented perpendicular to the direct load still carry portions of the torsional shear. This creates less loading in the parallel oriented walls, and helps to make the system work together. When a wind load is applied in both the x and y direction at the same time, the loading will increase, unlike what happens in the area method analysis.
RF 5
4
3
2
1
39.1 k
4.9 k 7.6 k 7.3 k 6.9 k 6.4 k 6.0 k
Section @ Shear Wall 36
Windward Leeward

8
Area Method Wind Analysis Building information N-S direction: Shear walls E-W direction: Shear walls Locations: Bloomfield, NJ Exposure: B Building use: Residential
(Results shown are higher than those on the E-W shear walls)
The loading on the diagram (right) represents the
loading on a single shear wall in the building. These loads were calculated differently than the original loadings from Tech #1 in that they are based off of the tributary area of the entire building. The wind force loads in the table above were divided by the number of shear walls oriented in the East-West direction (18) in order to obtain the force on any one of the shear walls. This approach yielded a base shear that was 17% lower than the area method of a single bay. This approach is quick to analyze but does not appear to have the sophistication or real life effects that are taken into account in either the computer analysis or the shear wall analysis method. It does not take into account any out-of-plane loadings, or any effects from out-of-plane shear walls.
The computer model and the shear wall analysis method appear to be the most accurate of the wind loading analysis. Therefore, the larger of the computer model and shear wall analysis (60.4k) will be compared with the results of the seismic analysis. All tabulated values for the wind loading section can be found in the appendix.
RF 5
4
3
2
1
41.3 k
4.2 k 8.1 k
7.8 k
7.5 k
7.0 k
6.7 k
Section @ Shear Wall A-A
Windward Leeward
Precast Garage
Drive Aisle
9
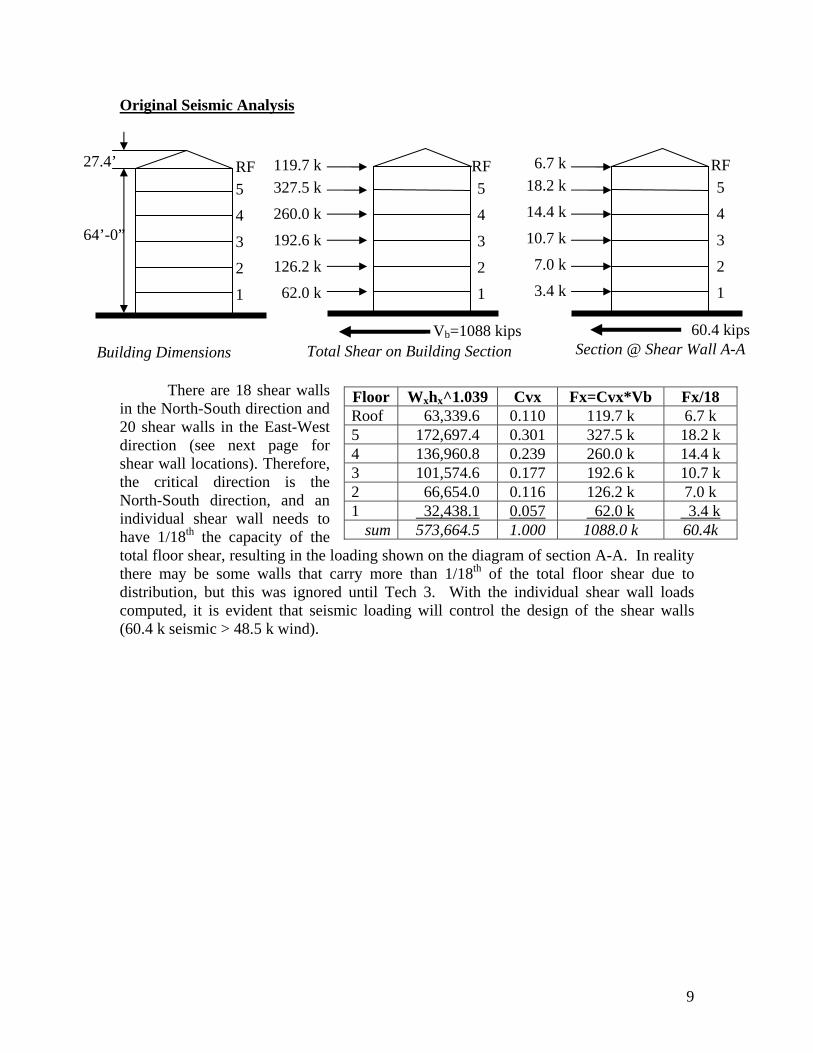
Original Seismic Analysis
There are 18 shear walls in the North-South direction and 20 shear walls in the East-West direction (see next page for shear wall locations). Therefore, the critical direction is the North-South direction, and an individual shear wall needs to have 1/18th the capacity of the total floor shear, resulting in the loading shown on the diagram of section A-A. In reality there may be some walls that carry more than 1/18th of the total floor shear due to distribution, but this was ignored until Tech 3. With the individual shear wall loads computed, it is evident that seismic loading will control the design of the shear walls (60.4 k seismic > 48.5 k wind).
RF 5
4
3
2
1
60.4 kips
6.7 k 18.2 k
14.4 k
10.7 k
7.0 k
3.4 k
Section @ Shear Wall A-A
Floor Wxhx^1.039 Cvx Fx=Cvx*Vb Fx/18 Roof 63,339.6 0.110 119.7 k 6.7 k 5 172,697.4 0.301 327.5 k 18.2 k 4 136,960.8 0.239 260.0 k 14.4 k 3 101,574.6 0.177 192.6 k 10.7 k 2 66,654.0 0.116 126.2 k 7.0 k 1 32,438.1 0.057 62.0 k 3.4 k
sum 573,664.5 1.000 1088.0 k 60.4k
RF 5
4
3
2
1
27.4’ 64’-0”
Building Dimensions
RF 5
4
3
2
1 Vb=1088 kips
119.7 k 327.5 k
260.0 k
192.6 k
126.2 k
62.0 k
Total Shear on Building Section

10
Computer Seismic Analysis
4
Based on the computer analysis using a six mode seismic analysis, it is
determined that shear wall number four controls not only wind but also the seismic design. This is the shear wall that is required to resist the largest seismic load in the building. The loads on this wall are nearly seven times larger than the load that was originally calculated.
This extreme change in loading on the wall means that either the modal analysis,
as compared to the simplified seismic approach, made this much of a difference or there is a problem with the computer input. While the load in this wall appears to be greater than those around it because it is the only wall in the vicinity, it does not account for the extreme jump in values. Furthermore, the finite element modal seismic analysis will create some increases in loading and distribution to certain members, but the value obtained appears to be in error. A more extensive search into the cause of this situation will need to be carried out at a later point. To be overly conservative, the shear walls will be designed based on these seismic loadings, to account for the possibility of the values being correct.
RF 5
4
3
2
1
411.2kips
89.8 k 101.4 k
90.6 k
84.1 k
32.3 k
13 k
Section @ Shear Wall 4

11
Computer Analysis Load Combo LL+DL+ELx
16
The live, dead and seismic loading combination creates a large load on shear wall
number 16. The interesting thing about this load combination is that it created a negative force on the lowest level, caused by the oscillation of the upper floors during an earthquake. This causes the base shear to be less than the purely seismic loading.
The maximum loading (415k) actually occurs at the interface at the 2nd floor, and
is greater than the seismic case just evaluated. This leads to the need to brace the lowest level to the same amount as the 2nd floor. This can be determined from the following page, and will require the lower two floors to be braced with (8) DTN5 12” 12 gage straps.
This wall also appears to be overly loaded which further confirms the assumption
that there is an error somewhere in the computer analysis. However, the reverse in loading is correct because of the location of the wall at a building corner intersection. This could be accounted for by the motion of the right half of the building with respect to the left. The design of the shear walls will be determined using shear wall number four and the seismic loading on the previous page.
RF 5
4
3
2
1
375.1kips
139.6 k 100.8 k
85.8 k
58.0 k
30.8 k
-39.9 k
Section @ Shear Wall 16

12
Floor Strap Size P Allow Pcomp. RF (2) DTN5 12” 12 gage 116.6 k 89.8 k 5 (4) DTN5 12” 12 gage 233.2 k 191.2 k 4 (5) DTN5 12” 12 gage 291.5 k 281.8 k 3 (7) DTN5 12” 12 gage 408.1 k 365.9 k 2 (7) DTN5 12” 12 gage 408.1 k 398.2 k 1 (8) DTN5 12” 12 gage 466.4 k 411.2 k
Shear Wall Design2
A converted tensile capacity based on the allowable axial tension of a 12 Gage 12” wide shear cross bracing strap raised at a 17º angle from the floor is used to check the shear straps at the lowest level. The strap allows a tensile load of Pallow = As*Fy*cos θ = (12”*0.1017”)*50ksi*cos 17º = 58.3 k < 411.2 k and is therefore not acceptable for the lowest floor. An additional 7 straps will need to be added at the lowest floor making Pallow = 7*[(12”)*0.1017”]*50ksi*cos 17º = 466.4 k > 411.2 k which is now acceptable.
Using the same approach, the shear cross bracing strap sizes for the other floors is
determined and is listed on the chart below. These sizes are larger than the original design sizes for the shear walls, and require more straps. The difference may be accounted for in the fact that a modal seismic analysis was used in the computer program rather than the simplified procedure that was originally used. 2 I have not ruled out a computer error for this unusually large scale loading of this particular shear wall. If an error is found, the results will be updated.
Floor Strap Size P Allow P Actual RF DTN5 4” 12 gage 9.8 k 6.7 k 5 DTN5 6” 12 gage 29.2 k 24.9 k 4 DTN5 10” 12 gage 48.6 k 39.3 k 3 DTN5 12” 12 gage 50.8 k 50.0 k 2 DTN5 12” 12 gage 58.3 k 57.0 k 1 DTN5 12” 12 gage
DTN5 4” 12 gage 68.1 k 60.4 k
www.dietrichmetalframing.com
30’-0” + 1’-0”
9’-6
”

13
Story and Building Drift (Deflection at the base floor):
h/L=9.5’/30’= 0.316
K = (Et)/[4(h/L)^3+2.78(h/L)] = 129890 k/in
I = t*L^3/12 = [4.5” * (30’*12)^3]/12 = 17496000 in^4
Δ = Ph3 + 2.78Ph = 60.4k * (9.5’*12) 3+ 2.78 * 60.4k*9.5’*12 . = 0.00046” 3EI AwE 3*29000ksi*I 4.5”*30’*12*29000ksi
H/400 = 9.5’*12/400 = 0.285” > 0.00046” therefore ok
Total Building H/400 = 64’*12/400 = 1.92”
Computer Drift Analysis The calculated maximum drift from the computer method (in feet) was nearly 2.5 times the value produced by hand, and may be due to the higher seismic loads that were calculated during the computer analysis. The deflection is still well below the allowable H/400 = 0.285 > 0.013178”*12=0.15814” and also below the total building limit of 1.92”> .059008*12 = 0.158136”. This also shows that the 4” air gap between the garage and main building is an adequate separation.

14
Building Overturning Moment
The overturning moment for the building is found to be 2567.2 ft-kips. In order to resist overturning, the moment created by the dead load of the structure about the edge of the building must be greater than the overturning moment. Since the resistive moment is found to be 308,543.4 ft-kips >> 2,567.2 ft-kips there will be no building overturning. See page A 16 for complete calculations. Spot Check Overview
By utilizing the hand calculations of the wind and seismic analysis it is shown that all of the spot checks of the members are adequate. Furthermore, the initial investigation from Tech #1 into the effects of lateral loading appears to be approximately accurate. The maximum loading was confirmed to be seismic loading and adequate bracing was selected at the time of the design. The W18x60 braced frames were shown to be correct in the computer model and are adequately braced to be capable of carrying both the lateral and gravity loadings. However, assuming that the computer calculations are in fact correct, then the shear wall bracing is under sized and needs to be increased.
There appears to be load errors from part of the computer model, and a more
extensive look into ETABS will be required. To accommodate for this conflict in values, the most conservative values should be used, or further consultations with design professionals should be utilized to determine the best approach and typical sizes used in practice. Summaries of the load calculations are included in the following appendix.
Precast Garage
Drive Aisle
Driv
eA
isle
Appendix Tech Report 3
Table of Contents:
1. Design Overviews: a. Shear Wall Plans p. A 1 b. Frame and Existing Load Cases p. A 2 c. Parkview at Bloomfield Seismic Location p. A 3 2. Computer Analysis: a. Max Shear Wall Load Table p. A 4
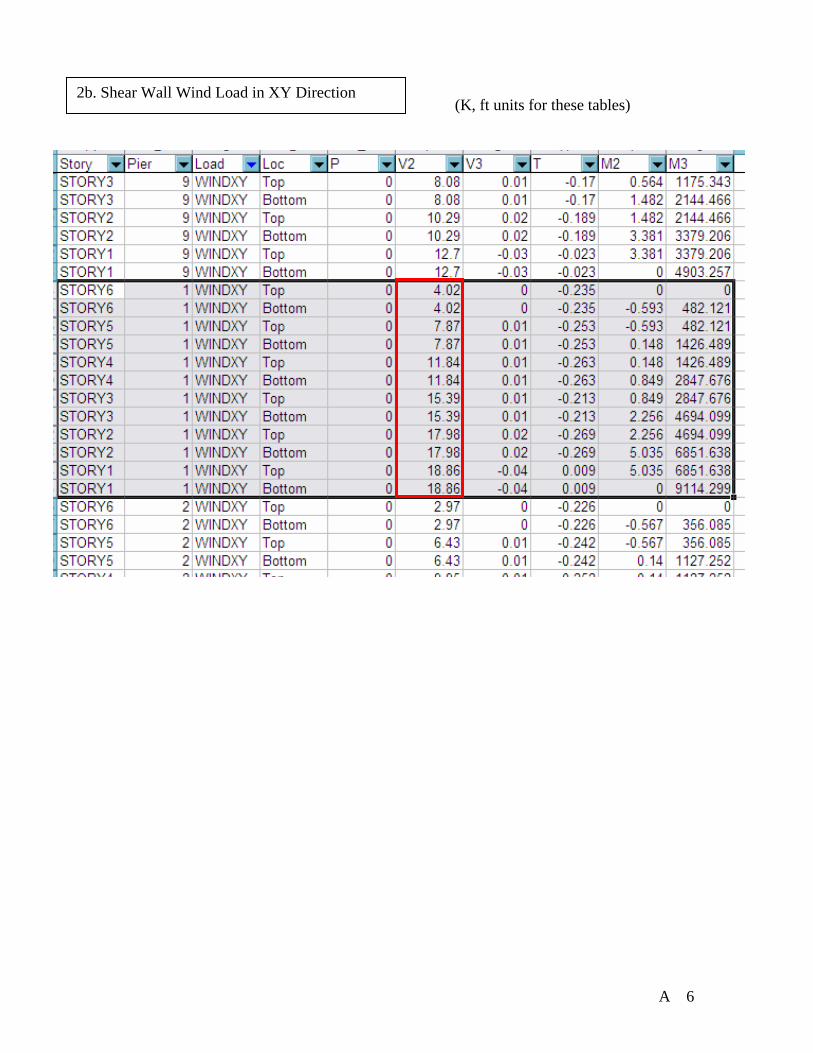
b. Wind Load 1. Shear Wall Wind Load in X & Y Direction p. A 5
2. Shear Wall Wind Load in XY Direction p. A 6 3. Deflected Shape due to Wind in XY Direction p. A 7
c. Seismic Load 1. Shear Wall Seismic Load p. A 8
d. Max Shear Wall Load p. A 9 e. Story Shear and Drift p. A 10
f. Brace and Column Loads p. A 11 Center of Mass
3. Shear Wall Hand Calculation: a. Shear Wall Analysis Method Diagram p. A 12 b. Shear Wall Analysis Method Overview p. A 13 c. Shear Wall Analysis Method p. A 14
4. Building Wind Load Calculation: a. Area Method ASCE-7 Calculation p. A 15 b. Overturning Hand Calculation p. A 16
5. Original Wind Load Calculations: a. Hand Calculation ~ Wind Coefficients p. A 17 b. Excel Spreadsheet p. A 18
6. Original Seismic Load Calculations: a. Hand Calculation ~ Seismic Coefficients p. A 19 b. Hand Calculation ~Seismic (cont.) & Story Drift p. A 20
A 1
Pr
ecas
t Gar
age
Drive Aisle
Driv
e A
isle
Shea
r W
all P
lan
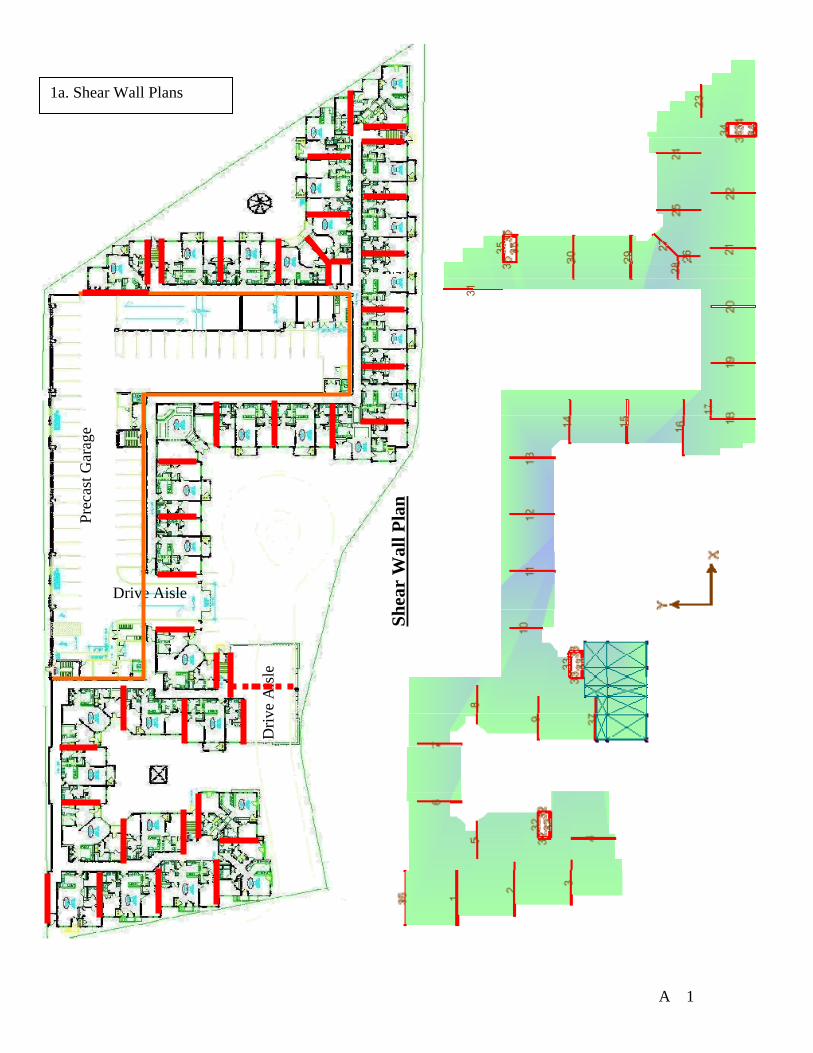
1a. Shear Wall Plans

A 2
Gravity loads IBC 2000 NJ ~ ASCE 7
Location Live Load
Dead Load
Total Load Wall Type Live
Load Dead Load
Wall Height
Total Load
Roof 40psf 17psf 57psf Single Light Gage Wall - 11psf 9’-6” 105plf Unit/Balcony 40psf 57psf 97psf Double Light Gage Wall - 15psf 9’-6” 143plf
Corridor 100psf 57psf 157psf 8” CMU Wall - 60psf 9’-6” 570plf Storage 125psf 57psf 182psf
1b. Frame and Existing Load Cases
Snow and lateral load overview

A 3
1c. Parkview at Bloomfield Seismic Location

A 4
2a. Max Shear Wall Load Table

A 5
(K, ft units for these tables)2b. Shear Wall Wind Load in X & Y Direction
A 6
(K, ft units for these tables)
2b. Shear Wall Wind Load in XY Direction

A 7
2b. Deflected Shape due to Wind in XY Direction

A 8
(K, ft units for these tables)
2c. Shear Wall Seismic Load

A 9
(K, ft units for these tables)
2d. Max Shear Wall Loads

A 10
(K, ft units for these tables) 2e. Story Shear and Drift

A 11
(K, ft units for these tables)
2f. Brace and Column Loads Center of Mass
A 12
3a. Shear Wall Analysis Method Diagram

A 13
3b. Shear Wall Analysis Method Overview

A 14
3c. Shear Wall Analysis Method

A 15
4a. Area Method ASCE-7 Calculation

A 16
4b. Overturning Hand Calculation
A 17
5a. Hand Calculation ~ Wind Coefficients

A 18
5b. Excel Spreadsheet

A 19
6a. Hand Calculation ~ Seismic Coefficients

A 20
6b. Hand Calculation ~ Seismic (cont.) & Story Drift
Related Documents