Steel Innovations Conference 2013, Christchurch, New Zealand, 21-22 February 2013 1 Structural Reliability Analysis Dr Steph en Hicks & Prof. Br ian Uy

Welcome message from author
This document is posted to help you gain knowledge. Please leave a comment to let me know what you think about it! Share it to your friends and learn new things together.
Transcript
7/30/2019 Structural Reliability Analysis of the bending strength of steel beams
http://slidepdf.com/reader/full/structural-reliability-analysis-of-the-bending-strength-of-steel-beams 1/14
Steel Innovations Conference 2013, Christchurch, New Zealand, 21-22 February 2013 1
Structural Reliability Analysis
Dr Stephen Hicks & Prof. Br ian Uy

7/30/2019 Structural Reliability Analysis of the bending strength of steel beams
http://slidepdf.com/reader/full/structural-reliability-analysis-of-the-bending-strength-of-steel-beams 2/14
Steel Innovations Conference 2013, Christchurch, New Zealand, 21-22 February 2013 2
Structural Reliability according to AS 5104 (ISO 2394
identical, which is referenced in AS/NZS 1170)
• Design life = reference period(normally taken as 50 years)
• Probability of failure for resistance at ULS over a 50-year reference period (lowrelative costs for safety
measures and moderateconsequences of failure)p f = 7.2×10⁻⁵ ≡ =3.8
• E and R are vectors of thelimit state function, whichaccording to AS 5104 (ISO
2394) may be taken as -0.7and 0.8, respectively for FORM when 0.16 < E / R < 7.6
p f 10-6 10-5 10-4 10-3 10-2 10-1
4.75 4.27 3.72 3.09 2.32 1.28
ULS SLS
Probability of failure vs. reliability index
Design point and reliability index according
to the first order reliability method (FORM)

7/30/2019 Structural Reliability Analysis of the bending strength of steel beams
http://slidepdf.com/reader/full/structural-reliability-analysis-of-the-bending-strength-of-steel-beams 3/14
Steel Innovations Conference 2013, Christchurch, New Zealand, 21-22 February 2013 3
Basis of Load and Strength capacity reduction
factors
• Normal distribution usuallytaken
• Characteristic value• Mean value if variability small• Upper value (normally 95%
fractile) if variability is not small
• Log-normal distribution usuallytaken (resistance doesn’t havenegative values)
• Characteristic (or nominal) valuefor resistance For large sampleof data and a normal distribution
• 5% fractile = 1.64 σR • Design value = 0.8x3.8σR = 3.04σR
(≡ 1 in 845 = 0.12% probability of
observing lower value)
Loads Material and product properties
S S k S d
S β σS
RR d R k
- R β σR
=1 / RS
R k / R d =R = 1/
7/30/2019 Structural Reliability Analysis of the bending strength of steel beams
http://slidepdf.com/reader/full/structural-reliability-analysis-of-the-bending-strength-of-steel-beams 4/14
Steel Innovations Conference 2013, Christchurch, New Zealand, 21-22 February 2013 4
For the design fractile factor k d,n as n , k d, = R = 3,04
For the characteristic fractile factor k n
as n , k n, = 1,64
If log-normal distribution is taken (which is desirable as it falls to zero at
the origin, so there are no negative resistances)
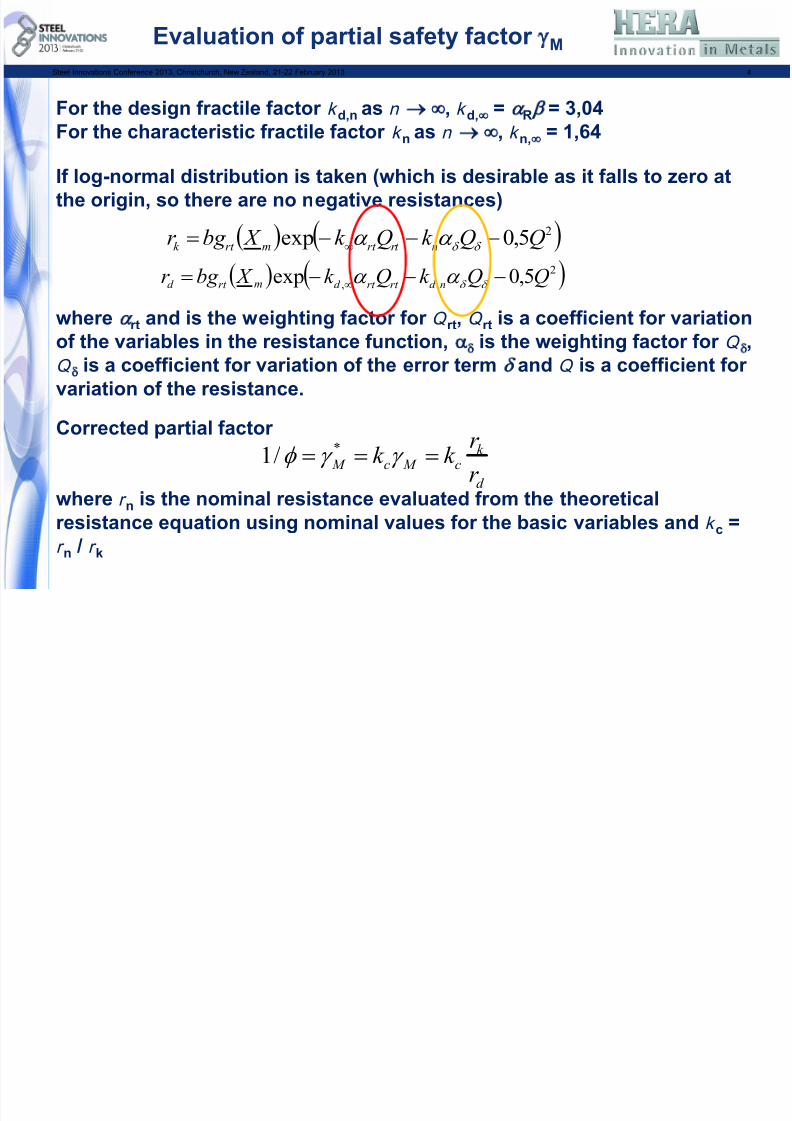
where rt and is the weighting factor for Q rt, Q rt is a coefficient for variation
of the variables in the resistance function, is the weighting factor for Q ,
Q is a coefficient for variation of the error term and Q is a coefficient for
variation of the resistance.
Corrected partial factor
where r n is the nominal resistance evaluated from the theoretical
resistance equation using nominal values for the basic variables and k c =
r n / r k
25,0exp QQk Qk X bg r nrt rt mrt k
2
,, 5,0exp QQk Qk X bg r nd rt rt d mrt d
Evaluation of partial safety factor M
d
k c M c M r
r k k */1

7/30/2019 Structural Reliability Analysis of the bending strength of steel beams
http://slidepdf.com/reader/full/structural-reliability-analysis-of-the-bending-strength-of-steel-beams 5/14
Steel Innovations Conference 2013, Christchurch, New Zealand, 21-22 February 2013 5
Design model for beams in bending
• Design section moment capacity• M s = f y Z e• where is the strength reduction factor, f y is
the yield strength used in design (i.e. the
nominal value) and Z e is the effective section
modulus, which is dependant on whether the
section is compact, non-compact or slender
• Design model which contains the
basic variables
• r t = g rt (X m ) = f y,m Z e,m
• where f y,m and Z e,m are the mean measured
basic variables that are included in a report
from a laboratory test
• Correction factor • bi = r ei/r ti• where r ei is the experimental resistance for
specimen i and r ti is the theoretical resistance
on specimen i • For beams in bending, typically b =
1.14 and 1.19 for partially laterally
restrained and fully laterally
restrained, respectively
Failure deemed to occur at endrotation of 6 degrees

7/30/2019 Structural Reliability Analysis of the bending strength of steel beams
http://slidepdf.com/reader/full/structural-reliability-analysis-of-the-bending-strength-of-steel-beams 6/14
Steel Innovations Conference 2013, Christchurch, New Zealand, 21-22 February 2013 6
Negative cross-sectional tolerances for beams supplied to
different product standards
Parameter EN10034: 1993 JIS G 3192AS 5100.6
AS/NZS 1365
Depth (h) (mm)
h≤180
180<h≤400
400<h≤700
h>700
-2
-2
-3
-5
h<400
400≤h≤600
h≥600
-2
-3
-4
-h/50
Width (b) (mm)
b ≤110110<b≤210
210<b≤325
b>325
-1-2
-4
-5
b<100
100≤b<200
b≥200
-2
-2.5
-3
-b/100
Web thickness
(tw) (mm)
tw<7
7≤ tw<10
10≤ tw<20
20≤ tw<40
40≤ tw<60
tw>60
-0.7
-1
-1.5
-2
-2.5
-3
tw<16
16≤ tw<25
25≤ tw<40
tw≥40
-0.7
-1.0
-1.5
-2.0
4.5 < t ≤ 6
6 < t ≤ 10
-0.85
-0.9
Flange thickness
(tf ) (mm)
tf <6.5
6.5≤ tf <10
10≤ tf <20
20≤ tf <30
30≤ tf <40
40≤ tf <60
tf >60
-0.5
-1
-1.5
-2
-2.5
-3
-4
tf <16
16≤ tf <25
25≤ tf <40
tf ≥40
-1.0
-1.5
-1.7
-2.0
Mass (%) -4 tf < 10tf ≥ 10 -5-4 -4

7/30/2019 Structural Reliability Analysis of the bending strength of steel beams
http://slidepdf.com/reader/full/structural-reliability-analysis-of-the-bending-strength-of-steel-beams 7/14
Steel Innovations Conference 2013, Christchurch, New Zealand, 21-22 February 2013 7
Frequency of tensile tests
• According to AS/NZS 3679.1,
for tensile tests, samples
representative of the batch
shall be taken as follows:• One sample for a batch not
exceeding 50 t.
• One additional sample for thebalance of the batch.
• Mill tests are invariably
conducted at a higher
strain rate than
laboratory testingtypically mean mill f y /
mean specified f y = 1.21
(CoV = 7%)

7/30/2019 Structural Reliability Analysis of the bending strength of steel beams
http://slidepdf.com/reader/full/structural-reliability-analysis-of-the-bending-strength-of-steel-beams 8/14
Steel Innovations Conference 2013, Christchurch, New Zealand, 21-22 February 2013 8
Stress-strain curves for steel and definition of yield
stress
With the exception of NZ only appendix for steel in seismic and fracture critical
applications given in AS/NZS 3678 and 3679.1, all product standards such asEN 10025 define f y = R eH

7/30/2019 Structural Reliability Analysis of the bending strength of steel beams
http://slidepdf.com/reader/full/structural-reliability-analysis-of-the-bending-strength-of-steel-beams 9/14
Steel Innovations Conference 2013, Christchurch, New Zealand, 21-22 February 2013 9
Full distribution of tensile test results
Lower End Upper End Frequency
265 0
265 270 1
270 275 1
275 280 2
280 285 2
285 290 3
290 295 6
295 300 14
300 305 23305 310 28
310 315 25
315 320 19
320 325 15
325 330 6
330 335 4
335 340 3
340 345 1345 350 1
350 1
Mean 310
SD 13.2
0
5
10
15
20
25
30
270 280 290 300 310 320 330 340 350
Yield Strength, fy (Mpa)

7/30/2019 Structural Reliability Analysis of the bending strength of steel beams
http://slidepdf.com/reader/full/structural-reliability-analysis-of-the-bending-strength-of-steel-beams 10/14
Steel Innovations Conference 2013, Christchurch, New Zealand, 21-22 February 2013 10
Full distribution of results
Lower End Upper End Frequency
265 0
265 270 1
270 275 1
275 280 2
280 285 2
285 290 3
290 295 6
295 300 14
300 305 23
305 310 28
310 315 25
315 320 19
320 325 15
325 330 6
330 335 4
335 340 3
340 345 1
345 350 1
350 1
Mean 310
SD 13.2
0
5
10
15
20
25
30
270 280 290 300 310 320 330 340 350
Yield Strength, fy (Mpa)
250 grade steel
Real test results a 250 Grade Steel
7/30/2019 Structural Reliability Analysis of the bending strength of steel beams
http://slidepdf.com/reader/full/structural-reliability-analysis-of-the-bending-strength-of-steel-beams 11/14
Steel Innovations Conference 2013, Christchurch, New Zealand, 21-22 February 2013 11
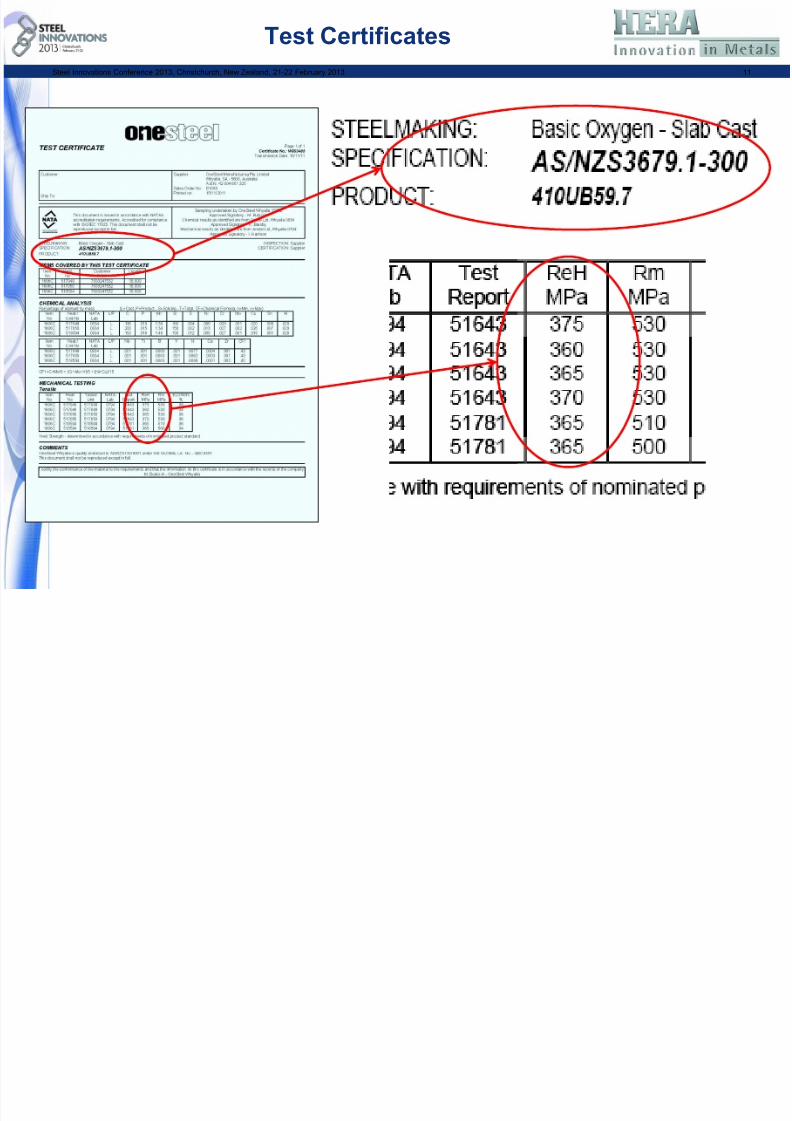
Test Certificates

7/30/2019 Structural Reliability Analysis of the bending strength of steel beams
http://slidepdf.com/reader/full/structural-reliability-analysis-of-the-bending-strength-of-steel-beams 12/14
Steel Innovations Conference 2013, Christchurch, New Zealand, 21-22 February 2013 12
Strength Reduction Factor
n 1 2 3 4 5 6 8 10 20 30
k n 2.31 2.01 1.89 1.83 1.80 1.77 1.74 1.72 1.68 1.67 1.64
k d,n 4.36 3.77 3.56 3.44 3.37 3.33 3.27 3.23 3.16 3.13 3.04
2.6 2.8 3 3.2 3.4 3.6 3.8 4 4.20.4
0.5
0.6
0.7
0.8
0.9
1
1.1
Reliability index ()
C a p
a c i t y f a c t o r
Steel ()
25,0exp QQk Qk X bg r nrt rt mrt k
2
,,
5,0exp QQk Qk X bg r nd rt rt d mrt d
Compact sections manufactured to EN 10034
manufacturing tolerances ϕ=0.94 at β = 3.04
ck
d
k r
r 1
7/30/2019 Structural Reliability Analysis of the bending strength of steel beams
http://slidepdf.com/reader/full/structural-reliability-analysis-of-the-bending-strength-of-steel-beams 13/14
Steel Innovations Conference 2013, Christchurch, New Zealand, 21-22 February 2013 13
Conclusions
• For beams in bending, reliability analyses show 0.9 is appropriate when conservatively assuming
that all negative geometrical tolerances occur and
no mass tolerance is used, f y = R eH and CoV = 7%.
• Yield strengths on mill certificates are given for conformity assessment purposes.
• It is dangerous to use yield strengths from mill
certificates as the results represent a small fraction
of the steel used in design and allowances for theactual yield strength being larger than the nominal
yield strength have been allowed for in the
evaluation of

7/30/2019 Structural Reliability Analysis of the bending strength of steel beams
http://slidepdf.com/reader/full/structural-reliability-analysis-of-the-bending-strength-of-steel-beams 14/14
Steel Innovations Conference 2013, Christchurch, New Zealand, 21-22 February 2013 14
Where can I get further information?
http://www.hera.org.nz/
Related Documents