Structural mechanics of skeletal muscle contractions: Mechanistic findings using a finite element model by Hadi Rahemi B.Sc., Sharif University of Technology, 2009 M.Sc., Sharif University of Technology, 2005 Dissertation Submitted in Partial Fulfillment of the Requirements for the Degree of Doctor of Philosophy in the Department of Biomedical Physiology and Kinesiology Faculty of Science Hadi Rahemi 2015 SIMON FRASER UNIVERSITY Spring 2015

Welcome message from author
This document is posted to help you gain knowledge. Please leave a comment to let me know what you think about it! Share it to your friends and learn new things together.
Transcript
Structural mechanics of skeletal muscle contractions: Mechanistic findings using a finite element model
by Hadi Rahemi
B.Sc., Sharif University of Technology, 2009 M.Sc., Sharif University of Technology, 2005
Dissertation Submitted in Partial Fulfillment of the Requirements for the Degree of
Doctor of Philosophy
in the
Department of Biomedical Physiology and Kinesiology
Faculty of Science
Hadi Rahemi 2015
SIMON FRASER UNIVERSITY Spring 2015

APPROVAL
Name: Hadi Rahemi
Degree: Doctor of Philosophy
Title of Thesis: Structural mechanics of skeletal muscle contractions:
Mechanistic findings using a finite element model
Examining Committee: Dr. Thomas Claydon, Associate Professor
Chair
Dr. James M. Wakeling, Professor, Biomedical
Physiology and Kinesiology, Simon Fraser University
Senior Supervisor
Dr. Nilima Nigam, Professor, Mathematics
Simon Fraser University
Co-Supervisor
Dr. Steve Ruuth, Professor, Mathematics
Simon Fraser University
Internal Examiner
Dr. Ian Stavness, Assistant Professor, Computing
Science
University of Saskatchewan
External Examiner
Date Approved: April 21, 2015
ii

Partial Copyright Licence
iii
Abstract
This thesis examines relations between skeletal muscle structure, function and
mechanical output. Specifically, this thesis considers the effect of regionalization of
muscle activity, changes in connective tissue properties and the inclusion of intramuscular
fat on the mechanical output from the muscle. These phenomena are typically hard to
measure experimentally, and so in order to study these effects a modelling framework
was developed to allow manipulations of the structural and functional parameters of the in
silica muscles and observe the predicted outcome of the simulations. The tissues within
the muscle-tendon unit were modelled as transversely isotropic and nearly incompressible
biomaterials. The material properties of the tissues were based on those of previously
measured for the human gastrocnemius muscle. The model was tested mathematically
and physiologically. Muscle fibre curvatures, along – and cross-fibre strains and muscle
belly force-length predictions were validated against published experimental values.
The validated model of human gastrocnemius was used to predict muscle forces for
different muscle properties, architectures and contraction conditions. A change in the
activity levels between different regions of the muscle resulted in substantial differences in
the magnitude and direction of the force vector from the muscle. The stiffness of the
aponeuroses highly influenced the magnitude of the force transferred to the tendon at the
muscle-tendon junction. The higher the stiffness, the greater the force. This indicates the
importance of understanding the differences in the structure and material properties
between aponeurosis and tendon with regard to their functions. The increase in adipose
tissue (fat) in the skeletal muscles (characteristic of elderly and obese muscle) was
simulated by describing the fat distribution in six different ways. The results showed that
fatty muscles generate lower force and stress, and the distribution of the fat also impacts
the muscle force.
iv

To my parents,
for all their love and support.
v

Acknowledgments
I would like to express my deepest gratitude to my senior supervisor Professor James
Wakeling for his unconditional support during my Ph.D. studies. Specifically for believing
in me and understanding the nature of the project. His encouragements and patience
towards my questions gave me confidence and knowledge and made this project a
complete learning experience. I want to thank him for introducing and exposing me to
learning opportunities outside of the project where I learned significantly from those
experiences.
I will be always grateful for the chance of working with Professor Nilima Nigam. Her
guidance and assurance in the hardest times made this journey possible. She was and will
be a mentor for me both scientificly and socially.
I would like to thank my labmates in neuromuscular mechanics lab who helped my a lot
during our scientific discussions and were patient with me from time to time.
Finally I would like to thank my family and friends who always helped me with their best
and highest power. In particular, my lovely wife Parisa who has inspired and supported me
towards my goal.
vi
Contents
Approval ii
Partial Copyright License iii
Abstract iv
Dedication v
Acknowledgments vi
Contents vii
List of Tables xi
List of Figures xiii
1 Introduction 1
1.1 Muscle structure . . . . . . . . . . . . . . . . . . . . . . . . . . . . . . . . . 1
1.2 Functional characteristics of skeletal muscles . . . . . . . . . . . . . . . . . 5
1.3 Connective tissues and skeletal muscles . . . . . . . . . . . . . . . . . . . . 7
1.4 Biomechanical modelling of skeletal muscles . . . . . . . . . . . . . . . . . 8
1.5 Outline of this thesis . . . . . . . . . . . . . . . . . . . . . . . . . . . . . . . 13
2 Mathematical model: Development and implementation 14
2.1 Introduction . . . . . . . . . . . . . . . . . . . . . . . . . . . . . . . . . . . . 14
2.2 Mechanics and Hyperelastic Materials: background . . . . . . . . . . . . . 17
2.2.1 Kinematics of an elastic object . . . . . . . . . . . . . . . . . . . . . 17
2.2.2 Kinetics of an elastic object . . . . . . . . . . . . . . . . . . . . . . . 18
vii
2.2.3 Hyperelastic material continuum response . . . . . . . . . . . . . . . 19
2.2.4 Potential energy minimization and the three-field formulation . . . . 20
2.3 Strain-energy function . . . . . . . . . . . . . . . . . . . . . . . . . . . . . . 21
2.4 Choice of materials, constants estimation, strain energies . . . . . . . . . . 24
2.5 Tendon . . . . . . . . . . . . . . . . . . . . . . . . . . . . . . . . . . . . . . 24
2.5.1 Tendon: Along-fibre properties . . . . . . . . . . . . . . . . . . . . . 24
2.5.2 Tendon: Base isotropic properties . . . . . . . . . . . . . . . . . . . 26
2.6 Aponeurosis . . . . . . . . . . . . . . . . . . . . . . . . . . . . . . . . . . . 28
2.6.1 Aponeurosis:Along-fibre properties . . . . . . . . . . . . . . . . . . . 28
2.6.2 Base isotropic properties . . . . . . . . . . . . . . . . . . . . . . . . 30
2.6.3 Different stiffness levels for aponeurosis . . . . . . . . . . . . . . . . 32
2.7 Muscle . . . . . . . . . . . . . . . . . . . . . . . . . . . . . . . . . . . . . . . 32
2.7.1 Muscle:Passive properties . . . . . . . . . . . . . . . . . . . . . . . . 33
2.7.2 Selection of an appropriate ratio . . . . . . . . . . . . . . . . . . . . 36
2.7.3 Muscle fibre: Active properties . . . . . . . . . . . . . . . . . . . . . 39
2.7.4 Muscle fibre: Activation function . . . . . . . . . . . . . . . . . . . . 40
2.7.5 Muscle fibres: Normalized isometric stress-stretch . . . . . . . . . . 40
2.7.6 Adipose tissue (fat) . . . . . . . . . . . . . . . . . . . . . . . . . . . . 43
2.7.7 History Dependent Properties . . . . . . . . . . . . . . . . . . . . . . 43
2.8 Discrete formulation and code. . . . . . . . . . . . . . . . . . . . . . . . . . 43
2.8.1 Discrete form of equations . . . . . . . . . . . . . . . . . . . . . . . . 44
2.8.2 Mesh generation . . . . . . . . . . . . . . . . . . . . . . . . . . . . . 45
2.8.3 Assignment of material properties at the discrete level . . . . . . . . 46
2.9 Model Validations . . . . . . . . . . . . . . . . . . . . . . . . . . . . . . . . . 48
2.9.1 Computational validation . . . . . . . . . . . . . . . . . . . . . . . . 48
2.9.2 Physiological . . . . . . . . . . . . . . . . . . . . . . . . . . . . . . . 51
2.10 Summary . . . . . . . . . . . . . . . . . . . . . . . . . . . . . . . . . . . . . 52
3 Muscle model: Physiological validation and numerical experiments 53
3.1 Introduction . . . . . . . . . . . . . . . . . . . . . . . . . . . . . . . . . . . . 53
3.2 Methods . . . . . . . . . . . . . . . . . . . . . . . . . . . . . . . . . . . . . . 54
3.2.1 Simulation vs. Experiments - Validation of a muscle model . . . . . 56
viii
3.2.2 The effect of tendon and aponeurosis properties on structural
changes of the muscle tendon unit . . . . . . . . . . . . . . . . . . . 57
3.3 Results . . . . . . . . . . . . . . . . . . . . . . . . . . . . . . . . . . . . . . 58
3.4 Discussion . . . . . . . . . . . . . . . . . . . . . . . . . . . . . . . . . . . . 61
4 Regionalizing muscle activity causes changes to the magnitude and direction
of the force from whole muscles 68
4.1 Introduction . . . . . . . . . . . . . . . . . . . . . . . . . . . . . . . . . . . . 68
4.2 Material & Methods . . . . . . . . . . . . . . . . . . . . . . . . . . . . . . . . 70
4.2.1 Geometry, mesh, boundary and fibre architecture . . . . . . . . . . . 70
4.2.2 Numerical simulations . . . . . . . . . . . . . . . . . . . . . . . . . . 70
4.3 Results . . . . . . . . . . . . . . . . . . . . . . . . . . . . . . . . . . . . . . 71
4.4 Discussion . . . . . . . . . . . . . . . . . . . . . . . . . . . . . . . . . . . . 76
5 The effect of intramuscular fat on skeletal muscle mechanics: implications for
the elderly and obese 79
5.1 Introduction . . . . . . . . . . . . . . . . . . . . . . . . . . . . . . . . . . . . 79
5.2 Methods . . . . . . . . . . . . . . . . . . . . . . . . . . . . . . . . . . . . . . 80
5.2.1 Geometries, boundary conditions and muscle activations . . . . . . 80
5.2.2 Material properties . . . . . . . . . . . . . . . . . . . . . . . . . . . . 82
5.2.3 Distributions (model variants) and intensities of intramuscular fat
accumulation . . . . . . . . . . . . . . . . . . . . . . . . . . . . . . . 82
5.2.4 Calculated parameters and analysis method . . . . . . . . . . . . . 84
5.2.5 Data Analyses . . . . . . . . . . . . . . . . . . . . . . . . . . . . . . 84
5.2.6 Fat clump simulation . . . . . . . . . . . . . . . . . . . . . . . . . . . 86
5.3 Results . . . . . . . . . . . . . . . . . . . . . . . . . . . . . . . . . . . . . . 86
5.4 Discussion . . . . . . . . . . . . . . . . . . . . . . . . . . . . . . . . . . . . 88
6 Conclusion and future work 93
6.1 Summary of the thesis . . . . . . . . . . . . . . . . . . . . . . . . . . . . . . 93
6.2 Discussion on research contributions . . . . . . . . . . . . . . . . . . . . . . 96
6.3 Perspectives . . . . . . . . . . . . . . . . . . . . . . . . . . . . . . . . . . . 99
Appendix A Supplementary electronic document 101
ix

Appendix B Illustrating Lists 102
B.1 List of Programs . . . . . . . . . . . . . . . . . . . . . . . . . . . . . . . . . 102
B.2 Formatting of Lists . . . . . . . . . . . . . . . . . . . . . . . . . . . . . . . . 103
Bibliography 104
x

List of Tables
2.1 Material constants and R-square values of fit for Neo-Hookean and Yeoh
models of tendon base material . . . . . . . . . . . . . . . . . . . . . . . . . 28
2.2 Material constants and R-square values of fit for four material models of
aponeurosis base material . . . . . . . . . . . . . . . . . . . . . . . . . . . . 31
2.3 Material constants and R-square values of fit for for Neo-Hookean and Yeoh
models of passive skeletal base material with modulus ratio of ∼ 100. . . . 35
2.4 Material constants and R-square values of fit for four material models of
passive skeletal base material with modulus ratio of ∼ 10. . . . . . . . . . . 36
2.5 Material constants and R-square values of fit for four material models of
passive skeletal base material with modulus ratio of ∼ 1. . . . . . . . . . . . 36
2.6 Constants for slow and fast normalized stress-strain rate fibres from [107]
(ml/s is muscle lengths per second) . . . . . . . . . . . . . . . . . . . . . . 42
2.7 Displacement of the pulled end of the 8× 1× 1 mm3 cube with
Neo-Hookean material (Lame constants µ = 80 × 106 and ν = 0.49) in
z-direction for 10 MPa of extensive load. . . . . . . . . . . . . . . . . . . . . 49
2.8 Displacement of the pulled end of the 8× 1× 1 mm3 cube with passive
muscle material in the z-direction (along-fibre) for 10 KPa of extensive load. 49
2.9 Displacement of the free end of the 8× 1× 1 mm3 cube with activated
muscle material in the z-direction (along-fibre). . . . . . . . . . . . . . . . . 50
2.10 Displacement of the free end of the 8× 1× 1 mm3 cube with half the muscle
activated in the z-direction (along-fibre) by different transition functions from
passive to active regions. . . . . . . . . . . . . . . . . . . . . . . . . . . . . 51
xi

3.1 Along-fascicle and transverse strains for fascicles in the middle of the
muscle belly for 40% activity (Fig.3.2). The Poisson’s ratio in the
mid-longitudinal plane is calculated as the magnitude of the ratio of the
transverse (cross-fascicle) to the along-fascicle strain. The last row shows
the measured Poisson’s ratio from 2D ultrasound images in the
mid-longitudinal plane of the MG during dynamic contractions [119]. . . . . 61
4.1 Activity level (αmax) and regionalization of activation in different simulations.
For heterogeneous patterns, the light gray region was activated to the
prescribed maximum level (last row), while the dark gray region(s) were
inactive. Note that for the medial-lateral activity pattern, the region of
activity was not symmetric about the mid-plane (x=27.5 mm) but instead
was offset to one side, to be symmetrical about the plane x=32.1 mm. . . . 71
4.2 x and y components of the centre of force (COF) on the z=0 plane. . . . . . 74
5.1 The model variants for X% fat infiltration in the muscle. Fatty variants (M3-
M6)represent possible intramyocellular (IMC) and extramyocellular (EMC)
fat distributions. . . . . . . . . . . . . . . . . . . . . . . . . . . . . . . . . . . 83
B.1 First meaningless table in Appendix B . . . . . . . . . . . . . . . . . . . . . 103
B.2 Second meaningless table in Appendix B . . . . . . . . . . . . . . . . . . . 103
xii

List of Figures
1.1 Muscle anatomy: from the whole MTU structure of calf muscles to molecular
details of a sarcomere. Reconstructed from several sources with permission. 3
1.2 A typical force-length curve for active isometric contractions and passive
extension of a sarcomere. The ascending limb is the result of sarcomeres
contracting at lengths shorter than the optimal (with maximum force in
isometric contractions). The descending limb is the result of sarcomeres
contracting at lengths longer than the optimal length. . . . . . . . . . . . . . 4
1.3 A typical force-velocity curve for concentric contractions of a muscle. Note
that V0 is the maximum intrinsic speed or maximum unloaded shortening
velocity. . . . . . . . . . . . . . . . . . . . . . . . . . . . . . . . . . . . . . . 5
2.1 along-fibre stress-stretch curve for tendon tissue based on the Magnusson
et al. 2003 [54] (see equation 2.19). . . . . . . . . . . . . . . . . . . . . . . 25
2.2 along-fibre stress-stretch curve for aponeurosis tissue based on the
Magnusson et al. 2003 [54] (see equation 2.31). . . . . . . . . . . . . . . . 31
2.3 Plots of stress vs the first invariant of the Cauchy-Green tensor. Comparison
of fitted Yeoh’s models (dashed black) for longitudinal to transverse ratio of
∼ 1 (A), ∼ 10 (B) and ∼ 100 (C) with fitted Yeoh’s models to experimental
data on compressive response of the muscle tissue (gray). Gray curves
represent the Yeoh’s models for the data from Bosboom et al. (dotted gray;
[103]), Zheng et al. (dashed gray; [104]), Van Loocke et al. (solid gray;
[105]) and Grieve and Armstrong (dash-dotted gray; [106]). . . . . . . . . . 37
2.4 Passive along-fibre stress-stretch curve used by the model (normalized) for
the muscle tissue (see equation 2.43). . . . . . . . . . . . . . . . . . . . . . 39
xiii

2.5 Active along-fibre stress-stretch curve used by the model (normalized) for
the muscle tissue (see equation 2.48). . . . . . . . . . . . . . . . . . . . . . 41
2.6 Normalized stress-strain rate of fast (blue) and slow (red) muscle fibres
(normalized) (see equations 2.49 and Table 2.6). . . . . . . . . . . . . . . . 42
2.7 Mesh created for a simplistic human gastrocnemius geometry, with two
layers of constant-thickness aponeurosis at the top and bottom of the belly
holding the gastrocnemius belly together. The longer edges of the
elements are oriented along the fibre direction for both the aponeurosis and
muscle tissues. . . . . . . . . . . . . . . . . . . . . . . . . . . . . . . . . . . 46
3.1 Simplified geometry of human gastrocnemius muscle. The aponeurosis
tissue is in dark gray and the muscle tissue is in light gray. The origin of the
muscle coordinate system was set to the bottom right corner of the deep
aponeurosis, and the axes were aligned with x:width, y: thickness and
z:belly length. . . . . . . . . . . . . . . . . . . . . . . . . . . . . . . . . . . . 56
3.2 Geometry of the muscle fascicles within the muscle belly (A), shown for their
mid-transverse (B) and mid-longitudinal (C) planes. The frames with black
fascicle lines are in a relaxed state and the frames with red fascicle lines
belong to muscle fascicles at a 40% activity level. The active fascicles show
a decrease in thickness and an increase in width in the longitudinal and
transverse sections, respectively. Note that the fascicles in the longitudinal
section (fascicle plane) are mostly curved to S-shapes in the active state. . 58
3.3 Intensity map showing the magnitude of the fascicle curvature for 30 and
60% activity. Mid-longitudinal plane fascicle curvature map after contraction
has been simulated (A). Curvature map for a similar fascicle plane
experimentally measured in human MG [114] (B). . . . . . . . . . . . . . . . 59
xiv
3.4 3D paths of three fascicles crossing the mid-transverse plane. Each
fascicle is plotted for 0 (green), 30 (blue) and 60% (red) activity levels. The
arrows show the normals to a medial/lateral fascicle at 30% activity and are
coloured by their azimuthal angle where the azimuthal angle is the angle
between the projection of the fascicle path in the xy-plane with the x-axis.
The change in azimuthal angle from 80 (yellow) to 99 degrees (red) shows
that the fascicle sheets curve away from the centre of the muscle belly. . . . 60
3.5 Displacement of whole muscle-tendon unit when activated without deep or
superficial constraints. . . . . . . . . . . . . . . . . . . . . . . . . . . . . . . 61
3.6 Measured (gray) and modelled (black) force-length properties of human
calf muscles. The simulations reached a 30% activation, and the forces
have been normalize to achieve a maximum active force of 1. The black
lines without symbols show the active (solid line) and passive (dashed line)
force-length properties that were input for the fascicles (see Chapter 2).
The black lines with symbols show normalized active (inverted triangles),
passive (squares) and total (circles) forces for the whole muscle belly. The
normalized active (diamonds) human gastrocnemius force was measured
from twitch contractions [120]. Normalized passive (stars) forces from
gastrocnemius are a combination of experimental values upto 1.1 stretch
and beyond that are extrapolated numerical values. The active human
soleus (triangles) forces were measured from tetanic contractions [121]. . . 65
3.7 The change in root-mean-square curvatures of the fascicles in
mid-longitudinal plane increased with activation for both simulation (black)
and experimental (gray solid line; [114]) results. The dashed gray lines
show the range of deviation from mean change in RMS curvature (±S.D.)
from the experimental study. . . . . . . . . . . . . . . . . . . . . . . . . . . . 66
3.8 Total strain in the muscle tendon unit tissue at a 10% activity level for two
material conditions: equal material properties for aponeurosis and tendon
(A), tissue specific properties (Chapter 2) for aponeurosis and tendon (B). . 67
xv
4.1 Deformed (active) and undeformed (relaxed) geometries for (A) the uniform
activation pattern and (B) the proximal-distal activation pattern. These
geometries are shown with pale areas and blue lines for the undeformed
states, and darker areas and gray lines for the deformed states. Note that
in the deformed states the pennation angle for the proximal-distal activation
pattern (18.37) is larger than for the Uniform activation pattern. Transverse
sections through the muscles are shown for the (C) Midline activation
pattern, and (D) Medial-lateral activation pattern. In these panels the
undeformed shape is shown by the rectangular and dark red area. The
coloured elements show the magnitude of the strain in the model tissues in
their deformed state, ranging from low strains (blue) in the aponeurosis to
greatest strains (red) in the muscle belly. Note how the muscle belly
thickness between the aponeuroses is least over the active region of fibres,
and the width of the muscles has increased beyond the undeformed state.
Also note that in the Medial-lateral activation pattern the maximum strains
have moved laterally (to the left) within the muscle. . . . . . . . . . . . . . . 72
4.2 Simulation results for the uniform activation condition with compliant
aponeurosis and 10% activation. (A) Magnitude of strain. (B) ”xz” and ”yz”
shear and ”zz” tensile stress contours on the plane connecting the
aponeurosis and tendon (z=0). (C) The direction cosines (dark gray) and
force magnitude for the resultant force (light gray) acting on the z=0 plane. . 73
4.3 Stress contours and force magnitudes and directions for the 12 test
conditions. The scales are shown in Figs. 4.2 (B) and (C). . . . . . . . . . . 75
5.1 Sample geometries of simplified human lateral gastrocnemius (LG) muscle
with initial pennation of 10 (A) and 20 (B). Note that the change in cross
sectional area is only due to initial pennation because the fibre length and
belly length are constant. Muscle tissue is shown in light gray and
aponeuroses in dark gray. The belly and aponeuroses extended out of
plane to a width of 55 mm. . . . . . . . . . . . . . . . . . . . . . . . . . . . . 81
xvi

5.2 A muscle belly geometry with 15 pennation angle and 20% sparse fat
distribution (M5 variant). The dots show the positions of the integration
points with aponeuroses (gray), muscle (red) and fat (yellow) properties. . . 83
5.3 The clump fat simulation. The integration points for a 15 muscle geometry
(A) with cutting planes corresponding to transverse (B) and longitudinal (C)
sections of the muscle. The muscle points are shown in red, fat points are
in yellow and aponeurosis points are shown in gray. The deformed shape of
the muscle belly at 20% activity (D) is coloured with a contour showing the
magnitude of the displacement of the integration points. Comparison of the
muscle belly force for simulations with the same the same initial geometry
and connective tissue properties, and X=10 between the clumped-fat
simulation, the lean variants M1-M2 and variant M5 that had a sparse
distribution of extracellular fat (E). . . . . . . . . . . . . . . . . . . . . . . . . 85
5.4 Force-activation plots for the different variants M1-M6. Lines show variant
M1 (black circles), M2 (red diamonds), M3 (blue squares), M4 (green
triangles), M5 (purple inverted triangles) and M6 (orange stars) at 2% (A),
10% (B) and 20% (C) fat levels. . . . . . . . . . . . . . . . . . . . . . . . . . 87
5.5 Main effects of the fat level, model variant, pennation and aponeurosis
stiffness on the final pennation, muscle fibre length, stress and force.
Points show the least-squares means, with their standard errors. . . . . . . 90
xvii

Chapter 1
Introduction
Skeletal muscles provide the force needed for everyday activity such as locomotion [1]
and maintaining balance (e.g. [2]). The body is also provided with heat through
contractions of the muscles [3]. Along with subcutaneous tissue, skeletal muscles work as
a protective layer against mechanical impacts the body endures. The versatile roles of
skeletal muscle are co-dependent on muscle structure and functional properties, that
change with age [4], injury [5], disease [6] and physical activity [7]. The complexity of
muscle function has made skeletal muscle the focus of many scientific studies for
centuries. In this chapter we will review some of the factors that are known to contribute to
muscle performance and some of the challenges that still remain to better understand
their role. We will also review modelling approaches that have helped people to study
skeletal muscles and are sometimes the only tool to look into aforementioned challenges.
1.1 Muscle structure
The way a muscle functions is highly dependent on its anatomical position in an
animal body (e.g. its position relative to a joint) as well as its architecture and geometrical
shape. Muscle architectural design can be characterized by muscle volume, physiological
cross-sectional area (PCSA), muscle pennation angle, muscle fibre planes and tissue
distribution (i.e. with respect to physiological properties of the tissue). Tissue distribution
can be described in terms of the relative spatial location of tendons, aponeurosis and
muscle tissue. At the level of the muscle belly, specifically, it can also be described by the
distribution of different fibre types.
1

CHAPTER 1. INTRODUCTION 2
PCSA, pennation angle and fibre length are the three main parameters that can be
used to describe a muscle’s mechanical structure [7, 8]. Changes in these three variables
may alter muscle mechanics (i.e. force, power output and deformation) substantially. PCSA
is defined as the total cross-sectional area of the fibres in a muscle acting in parallel. It
is a measure of muscle force generation capacity (strength). In other words, muscles
with larger PCSAs can produce larger forces. This is mainly because the maximum force
over cross-sectional area of fibres (stress) is almost constant (approximately 200 KPa).
Therefore, the force output of a muscle is scaled by its PCSA.
The second structural parameter of skeletal muscles is the fibre pennation angle. It is
calculated as the angle between the muscle fibre and the line of action of a muscle. In
resting human muscles, pennation angles have been measured to have a range between
0 to 30 [7, 9], but it can change dramatically to approximately 45 or greater during
muscle contraction [10, 11]. Fibre rotation (change in pennation angle), may contribute
to changes in the thickness and width (Figure 1.1) of a muscle which may change the
structure of a muscle. Many researchers have measured fibre rotation for active muscles
[12, 13, 14, 15]. Fibre rotation deviates fibre force trajectory from the line of action of a
muscle. However, it is believed that rotating fibres of pennate muscles contract with a
lower velocity than the muscle belly and are able to produce higher levels of force [16].
Despite the evidence that some fibres run through the whole length of human muscles
[17], the majority of fibres hardly get longer than 60% of the muscle length [7] and terminate
intrafascicularly. Conceptually, it is usually assumed that fibres run from one aponeurosis
to another and the multiplication of fibre length and PCSA gives the muscle volume.
The length of fibre at different passive and active states of a muscle modulates the
force a fibre can produce [18]. This relation between the force and the length of a fibre is
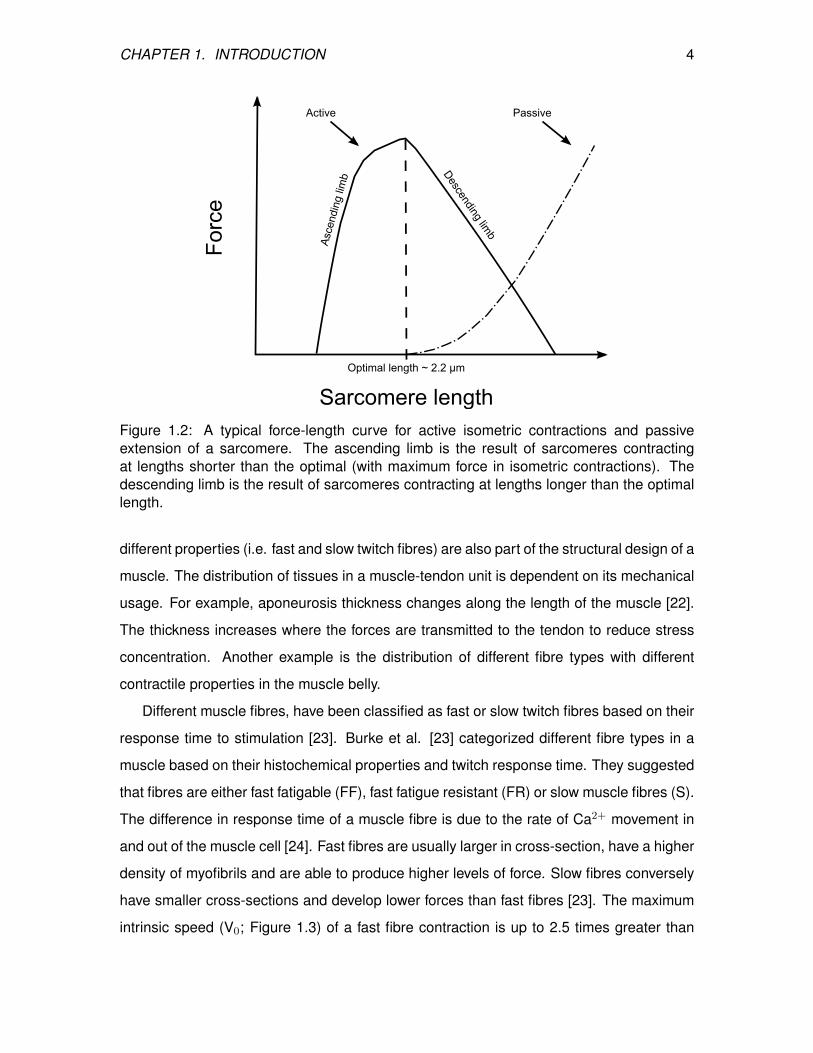
called the force-length property of a fibre. While the active forces length curve (Figure 1.2)
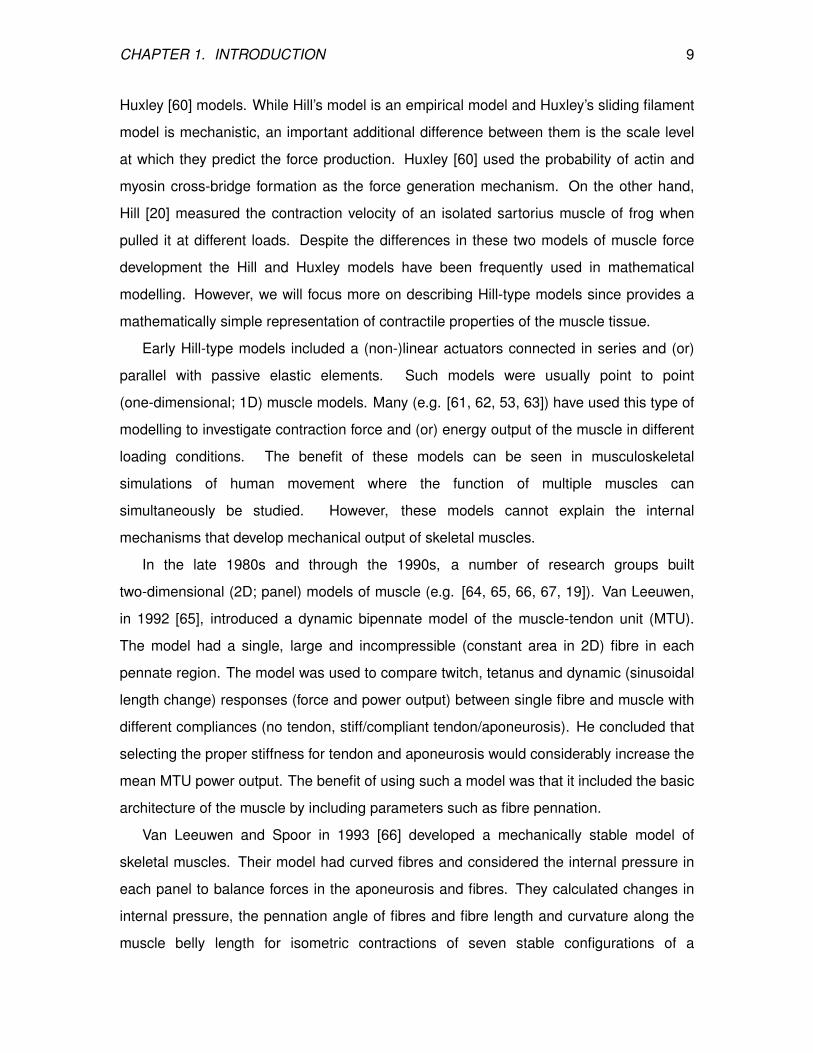
depends on the average overlap of actin and myosin filaments of fibre sarcomeres (Figure
1.1; [18]), the passive force-length curve (Figure 1.2) is mostly related to elastic elements
in the myofilaments within sarcomeres [19] . Additionally, fibre force depends on the rate of
change in fibre length or fibre contraction velocity. This relation is named the force velocity
property of a fibre (Figure 1.3; [20, 21]).
From an engineering perspective, in addition to PCSA, fibre pennation and fibre length,
the distribution of different tissues (i.e. muscle and tendon) as well as similar tissues with

CHAPTER 1. INTRODUCTION 3
Muscle width
Muscle thickness
Tendon
Gastrocnemius
Soleus
Achilles tendon
Muscle BellyEpimysium
Fascicle
Endomysium
Perimysium
Fibre
Sarcolemma
Nucleus
Sarcoplasm
MyofibrilMyofilaments(actin & myosin)
Calf muscles
Figure 1.1: Muscle anatomy: from the whole MTU structure of calf muscles to moleculardetails of a sarcomere. Reconstructed from several sources with permission.
CHAPTER 1. INTRODUCTION 4
Asc
endi
ng li
mb
Descending lim
b
Optimal length ~ 2.2 μm
For
ce
Sarcomere length
Active Passive
Figure 1.2: A typical force-length curve for active isometric contractions and passiveextension of a sarcomere. The ascending limb is the result of sarcomeres contractingat lengths shorter than the optimal (with maximum force in isometric contractions). Thedescending limb is the result of sarcomeres contracting at lengths longer than the optimallength.
different properties (i.e. fast and slow twitch fibres) are also part of the structural design of a
muscle. The distribution of tissues in a muscle-tendon unit is dependent on its mechanical
usage. For example, aponeurosis thickness changes along the length of the muscle [22].
The thickness increases where the forces are transmitted to the tendon to reduce stress
concentration. Another example is the distribution of different fibre types with different
contractile properties in the muscle belly.
Different muscle fibres, have been classified as fast or slow twitch fibres based on their
response time to stimulation [23]. Burke et al. [23] categorized different fibre types in a
muscle based on their histochemical properties and twitch response time. They suggested
that fibres are either fast fatigable (FF), fast fatigue resistant (FR) or slow muscle fibres (S).
The difference in response time of a muscle fibre is due to the rate of Ca2+ movement in
and out of the muscle cell [24]. Fast fibres are usually larger in cross-section, have a higher
density of myofibrils and are able to produce higher levels of force. Slow fibres conversely
have smaller cross-sections and develop lower forces than fast fibres [23]. The maximum
intrinsic speed (V0; Figure 1.3) of a fast fibre contraction is up to 2.5 times greater than
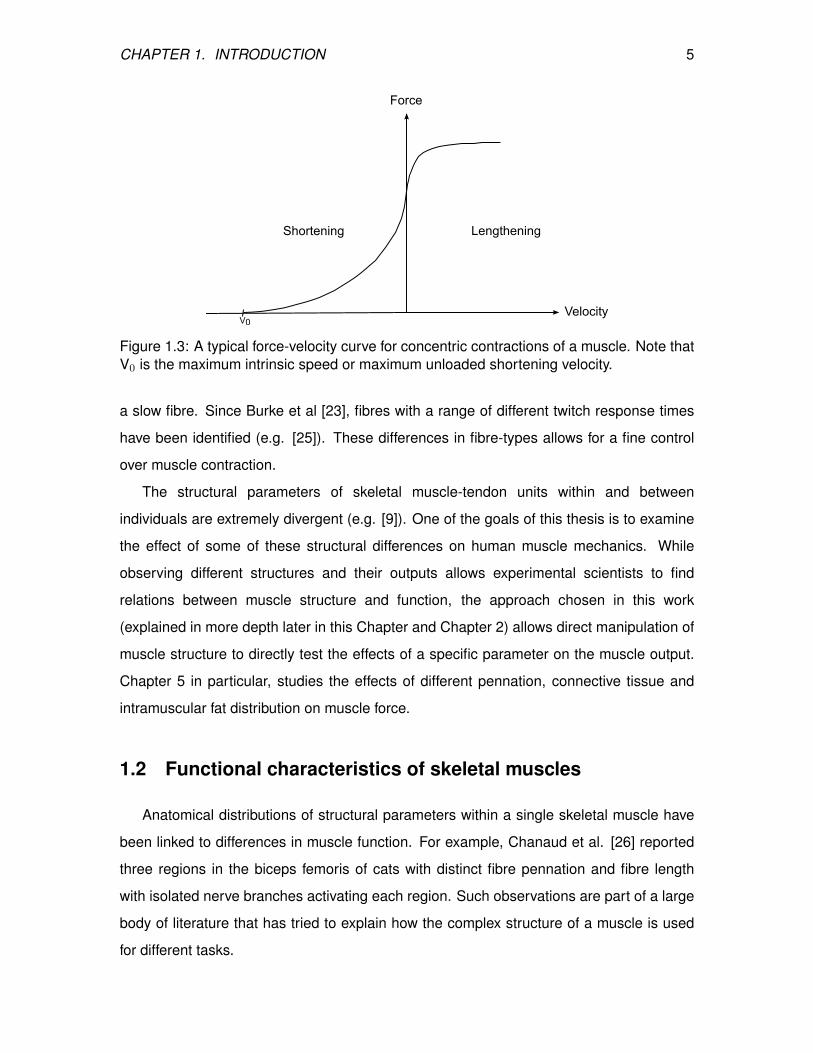
CHAPTER 1. INTRODUCTION 5
Force
VelocityV0
Shortening Lengthening
Figure 1.3: A typical force-velocity curve for concentric contractions of a muscle. Note thatV0 is the maximum intrinsic speed or maximum unloaded shortening velocity.
a slow fibre. Since Burke et al [23], fibres with a range of different twitch response times
have been identified (e.g. [25]). These differences in fibre-types allows for a fine control
over muscle contraction.
The structural parameters of skeletal muscle-tendon units within and between
individuals are extremely divergent (e.g. [9]). One of the goals of this thesis is to examine
the effect of some of these structural differences on human muscle mechanics. While
observing different structures and their outputs allows experimental scientists to find
relations between muscle structure and function, the approach chosen in this work
(explained in more depth later in this Chapter and Chapter 2) allows direct manipulation of
muscle structure to directly test the effects of a specific parameter on the muscle output.
Chapter 5 in particular, studies the effects of different pennation, connective tissue and
intramuscular fat distribution on muscle force.
1.2 Functional characteristics of skeletal muscles
Anatomical distributions of structural parameters within a single skeletal muscle have
been linked to differences in muscle function. For example, Chanaud et al. [26] reported
three regions in the biceps femoris of cats with distinct fibre pennation and fibre length
with isolated nerve branches activating each region. Such observations are part of a large
body of literature that has tried to explain how the complex structure of a muscle is used
for different tasks.
CHAPTER 1. INTRODUCTION 6
The control over muscle function starts from a fibre level. Each muscle fibre is
individually innervated by an axon branch of an alpha motor neuron. The smallest
independently activated sub-unit of a muscle, is called a motor unit [27]. A motor unit is a
group of muscle fibres innervated by axons of a single motor neuron. Fibres of each
motor unit are distributed across the muscle, but there is evidence that different regions of
muscles contain a higher density of similar motor units (e.g. [28]). Therefore a muscle can
be activated in a regionalized fashion.
The firing rate of an alpha motor neuron is modulated via feedback from muscle
spindles, Golgi tendon organs, pressure and joint proprioceptive receptors, as well as
supraspinal commands [29]. The excitation in alpha motor neurons leads to excitation of
muscle fibres. This excitation is usually measured using electromyography (EMG). The
signal intensity of the collected EMG is used to estimate muscle activity [30] that is the
concentration of calcium ions in the sarcoplasm [31, 32].
In many daily activities muscles are not maximally activated and therefore, besides
the fact that a muscle can be activated at different regions, it can also be activated in
different levels. Each possible combination of activation regions and levels can be called
an activation pattern. Such activation patterns have been reported for a variety of activities
in humans and animals (e.g. [33, 34, 35]). Different muscle activation patterns may lead to
changes in the tension of different regions of the muscle-tendon unit (MTU) and the muscle
belly structure. These may change the line of action of a muscle [36]. The change in the
line of action of the muscle is important in animal locomotion as it changes moment arms
about a joint.
The importance of the existence of different types of fibre in the muscle is shown in
animals, where different activation or recruitment patterns are chosen for a specific
movement (e.g. [37, 38]). In 1957, Henneman [39] observed that motoneuron recruitment
follows an orderly pattern with change in stimulation level. He reported that motoneurons
are recruited in order of their size. Small motoneurons were recruited first, and larger
motoneurons are recruited upon an increase in stimulation. This order of motoneuron
recruitment was named ”the size principal” [40, 41]. Therefore, smaller motor units, which
mostly have slow fibres [42] and a lower nerve action potential conduction velocity, are
recruited before and derecruited after faster (larger) motor units. This allows faster (higher
force level) units to be used when the task is more demanding [43]. Many studies (e.g.
CHAPTER 1. INTRODUCTION 7
[44, 45]) provided data that support the size principal (orderly recruitment); however, other
studies (e.g. [46, 47]) have suggested that, depending on task or environmental variables,
alternate (task-dependent) patterns may be used. Thus, different task-dependent
recruitment would conceptually change mechanical behaviour of the muscle.
The complexity of the functional characteristics of skeletal muscles has inspired many
for a lifetime of research and will continue to do so. This thesis focuses on quantifying the
effect of activity in different regions of a muscle on the force output of that muscle. Chapter
4 brings evidence of substantial differences in force and line of action of a muscle with
changes in activation pattern.
1.3 Connective tissues and skeletal muscles
The force developed by a muscle has to be transmitted to the skeleton to initiate
movement or to control posture. Connective tissues are used for this purpose. The force
is transferred to the aponeuroses and then to the tendons and eventually to the bones.
Just as the structural and functional characteristics of the muscle tissue have been
frequently investigated so has the role of connective tissues on the mechanical
performance of the muscle-tendon unit (e.g. [48, 49, 50]).
Besides the force transference properties, tendons may also act as an energy storage
unit to help with the energy demands of highly dynamic activities [50]. The mechanical
properties of tendons can be described by a stress-strain (or force-length) relation (e.g.
[51, 52]). The stress-strain curve for tendon has a nonlinear toe region following a linear
section as the strain increases. The toe region of a tendon stress-strain curve is extended
up to a 2% strain. Though, this also depends on the anatomical and functional role of
the tendon. The linear part of the stress-strain curve introduces a constant modulus of
elasticity (or stiffness) which will hold until failure of the tissue [53]. This relationship is
both history and strain-rate (viscoelastic behavior) dependent [53].
Similar to tendons, aponeuroses are used to transfer muscle force. However the stress
in the aponeuroses is more likely to have a nonlinear distribution (e.g. [54]). This can
partly be due to differences in aponeurosis thickness along its length and also different
activation patterns of the muscle tissue that may create different force distributions on the
aponeuroses.

CHAPTER 1. INTRODUCTION 8
The experimental data describing the mechanical properties of connective tissues will
be reviewed in more detail in chapter 2. In this thesis we have investigated the effect of
differences in mechanical properties of tendon and aponeurosis (Chapter 3) as well as
the effect of aponeurosis stiffness on muscle force output when activity is regionalized
(Chapter 4), or the tissue properties are altered within the muscle belly (Chapter 5).
1.4 Biomechanical modelling of skeletal muscles
Modelling or simulation of physiological phenomena is commonly carried out to allow
physiologists to explore ideas that are hard to test in experiments. Limitations in
experiments include ethical restrictions for in-vivo testing on human and animal tissue,
hard or expensive processes of using a human cadaver or an animal corpse and lack of
technology and equipment to measure desired data. Another reason for developing
models to study muscle biology is that some physiological conditions are difficult to
produce in experiments. An example of this is to recreate a predefined activation (or
recruitment) pattern using a model.
Three different types of models have been used in biomechanics; conceptual, physical
and mathematical [55]. Conceptual models are useful for understanding a phenomenon
without any experiment and computation. An example would be modelling of the changes
in the potential energy of the centre of gravity of humans during walking, by comparing
them to a rolling egg [56]. Physical models are used for different purposes. They may be
used to show that a proposed idea actually works (e.g. [57]), or to look at biological facts
that are difficult to study in animals (e.g. [58]). For instance, Haas and Wootton [57]
developed paper models of insect wings to explain folding mechanisms in beetles and
some other insects. Mathematical modelling is the most often used method in
computational biomechanics. Simple models are used to illustrate principals (e.g. [20]).
Whereas more sophisticated (realistic) models are usually developed to predict a greater
variety of results accounting for structural and functional complexities of the
biomechanical systems such as skeletal muscles (e.g. [59]).
Predicting force production in the muscle fibres is key to the development of a
mathematical model of muscle contraction. There are two important experimental
theories that are usually utilized and are named after their developers: Hill [20] and
CHAPTER 1. INTRODUCTION 9
Huxley [60] models. While Hill’s model is an empirical model and Huxley’s sliding filament
model is mechanistic, an important additional difference between them is the scale level
at which they predict the force production. Huxley [60] used the probability of actin and
myosin cross-bridge formation as the force generation mechanism. On the other hand,
Hill [20] measured the contraction velocity of an isolated sartorius muscle of frog when
pulled it at different loads. Despite the differences in these two models of muscle force
development the Hill and Huxley models have been frequently used in mathematical
modelling. However, we will focus more on describing Hill-type models since provides a
mathematically simple representation of contractile properties of the muscle tissue.
Early Hill-type models included a (non-)linear actuators connected in series and (or)
parallel with passive elastic elements. Such models were usually point to point
(one-dimensional; 1D) muscle models. Many (e.g. [61, 62, 53, 63]) have used this type of
modelling to investigate contraction force and (or) energy output of the muscle in different
loading conditions. The benefit of these models can be seen in musculoskeletal
simulations of human movement where the function of multiple muscles can
simultaneously be studied. However, these models cannot explain the internal
mechanisms that develop mechanical output of skeletal muscles.
In the late 1980s and through the 1990s, a number of research groups built
two-dimensional (2D; panel) models of muscle (e.g. [64, 65, 66, 67, 19]). Van Leeuwen,
in 1992 [65], introduced a dynamic bipennate model of the muscle-tendon unit (MTU).
The model had a single, large and incompressible (constant area in 2D) fibre in each
pennate region. The model was used to compare twitch, tetanus and dynamic (sinusoidal
length change) responses (force and power output) between single fibre and muscle with
different compliances (no tendon, stiff/compliant tendon/aponeurosis). He concluded that
selecting the proper stiffness for tendon and aponeurosis would considerably increase the
mean MTU power output. The benefit of using such a model was that it included the basic
architecture of the muscle by including parameters such as fibre pennation.
Van Leeuwen and Spoor in 1993 [66] developed a mechanically stable model of
skeletal muscles. Their model had curved fibres and considered the internal pressure in
each panel to balance forces in the aponeurosis and fibres. They calculated changes in
internal pressure, the pennation angle of fibres and fibre length and curvature along the
muscle belly length for isometric contractions of seven stable configurations of a

CHAPTER 1. INTRODUCTION 10
bi-pennate muscle. Epstein and Herzog [19] published another model with a similar
architecture later in 1998. They used the principal of virtual work to deal with the
instability of their panel model. Their model predicted the total length change in a muscle
under different static and dynamic loads.
Despite a large leap towards connecting the muscle structure and function, in 2D
panel models (e.g [65, 66, 67]), fibres are considered a 1D contractile element separating
2D incompressible mediums. This assumption is not realistic enough and ignores the
transverse properties of the muscle tissue. In addition, changes in depth due to bulging
are usually not investigated by these models. However, even when depth change is
allowed, the fact that bulging is a three-dimensional (3D) phenomenon and depends on
3D architecture of the skeletal muscle, illustrates that 2D muscles are unable to predict
structural changes and therefore mechanical functions accurately.
As the level of detail (dimension and architecture) in modelling increases, modelling
becomes so complex that in most cases an explicit analytical solution cannot be found and
numerical techniques have to be used. The finite element method (FEM), an effective,
powerful and complementary tool, is one of these numerical methods. It has been used to
develop muscle models subjected to various internal and external loadings (e.g. [59, 68,
69, 70]). Depending on their complexity, (including geometry, mathematical formulation,
architecture, activation pattern) models need different numbers of input parameters as well
as different mechanical modelling approaches. Here, we focus on the models which used
FEM as their analytical approach to address the nonlinear nature of muscle structure and
function by reviewing simpler one or two-dimensional and up to complex three-dimensional
structures.
One of the earliest FEM spring-damper models was introduced by Chen and Zeltzer in
1992 [71]. They considered each node to be connected to a spring like element, which
defined the stiffness of that element at the node with respect to adjacent node(s). These
elements considered passive, active and dynamic properties of the connected tissue.
They used their model to check tension-length properties of the whole muscle-tendon unit
by contracting the muscle isometrically in different lengths. A quick release experiment
from an isometric active condition was also carried out to show muscle response to
sudden unloading conditions. They also used their model to simulate isometric
contractions in the human gastrocnemius and biceps brachii. However, this model didn’t

CHAPTER 1. INTRODUCTION 11
include the nearly incompressible behaviour of the muscle. Otten and Hulliger [68] also
modelled skeletal muscles using finite elements in 1995. Their elements were
incompressible planar rectangles having 1D contractile elements on the edges that were
considered to be in the fibre direction. They included both the tendonious sheet and fibre
properties in the model. Different physiological states of the muscle were simulated. This
included partial activation of muscle fibres by either fully activating half of the muscle or by
fully activating every other fibre in the muscle. They found that output force was about
57% to 59% of a fully activated muscle. This was above the predicted 50% because (as
they argued) sarcomeres in a submaximally contracted muscle have longer lengths and
are on the ascending limb of the force length curve (Figure 1.2), muscle produces higher
forces. They also modelled a bipennate muscle with twice the area of a unipennate
muscle. The output force for an isometric contraction of a bipennate muscle was 3.2 times
that of the force of the unipennate geometry. The difference in the developed force when
compared to the predictable amount of twice the unipennate muscle force, was explained
by arguing that in the bipennate muscles the length of an average sarcomere is 1.57
times the length of the sarcomere in the unipennate muscle. They also measured
changes in the muscle pressure and external curvature when the muscle geometry was
supported by an external tissue. This model was one of the most advanced muscle
models at the time, but it still had many of the described limitations of 2D muscle models.
In order to produce more realistic models of muscles, continuum mechanics models
were introduced. In this approach mechanics of the muscle tissue is modelled as a whole
compared to previous approaches with individual contractile elements, series and parallel
elastic elements, as well as separate incompressible medium. This is usually done by
using finite elasticity theory (e.g. [72]) where the change in tissue shape (strains) is
associated with an energy function. This function is usually called the strain-energy
function of a tissue. All active, passive and incompressibility behaviours of a biological
soft tissue are described using this function and tissue properties are passed to the
mathematical formulation and numerically solved to compute the strains and stresses in
the tissue.
Many have used this approach to describe elastic behaviour of the muscle (e.g. [73,
74, 69, 59, 75, 70]). The differences in these models were mostly in how they predicted
fibre force. Some, like Oomens [69], used the Huxley model for predicting the number of
CHAPTER 1. INTRODUCTION 12
attached cross-bridges and therefore the output force in fibre level. Others ([74, 59, 70]),
used a Hill-based model for forces in the contractile fibres. Although these models are
the most realistic models for replicating the muscle tissue behaviour so far, the developers
usually have not investigated detailed muscle physiology such as the effects of differential
muscle activation on its performance. Bol and Reese [70] used a unique definition of strain-
energy. Their model was somewhat similar in the form of the element type to Otten and
Hulliger’s [68] work, as their tetrahedral elements with elastic beam elements on the edges
and an isotropic incompressible volume in the middle, just defined a particular form of a
3D panel model. The edge elements, which were aligned with fibre directions, had fibre
contraction properties. Other edge elements had connective tissue (collagen) properties.
Their method developed a simpler mathematical system and allowed them to simulate
muscle with different fibre types and at different activation rates.
Another continuum-mechanics model of skeletal muscles was developed by Blemker
et al. in 2005 [59]. A composite design for the material was considered by developing
an elasticity formulation for a transversely isotropic material. Muscle properties along and
transverse to the fibre direction were put into the model and tissue strains were compared
to those of experimentally measured [76] for validation. The same model was used to
investigate the effects of aponeurosis geometry (structure) on injuries of the biceps femoris
long-head in athletes [77]. This clinical study found that muscles with a thicker (higher
stiffness) aponeurosis are less likely to be injured.
A large number of continuum models have been developed over the last fifteen years
(e.g. [73, 74, 69, 59, 75]) but none of them have precisely investigated the architectural
design and the effect of recruitment physiology in depth. We believe that these parameters
play a significant role in muscle performance and need further investigation.
The purpose of this thesis is to develop a modelling framework to be used in applied and
conceptual studies of human muscle function and to use this framework to investigate the
effect of change in some of the architectural and functional parameters of skeletal muscles
(e.g. activity distribution) on the mechanical performance of human muscles. In other
words, the goal of this thesis is to find mechanistic links between changes in mechanics at
the tissue level and the overall output of a skeletal muscle.

CHAPTER 1. INTRODUCTION 13
1.5 Outline of this thesis
The modelling approach, including mathematical formulation, analytical method and
choice of material properties for the purpose of this thesis is brought in Chapter 2. The
implementation, validation and basic physiological simulations using the developed
framework are brought in chapter 3. Chapter 4, studies the concept of regionalized
activity in the muscle and how this factor changes muscle output in presence of different
aponeuroses stiffness. Chapter 5 studies the effect of fat accumulation in the skeletal
muscle tissue. This chapter investigates the effects of different fat distributions, the
percentage of fat content, different geometries and connective tissue properties on the
force output of the elderly and the obese gastrocnemius muscles. Finally, Chapter 6 has
been devoted to review the current work and explain the limitations and possible
extensions in the future.
A concise version of Chapter 2 is being prepared to be submitted for publication. The
contents of Chapter 3 have been submitted as a research article and is currently under
review. Chapter 4 is based on a research article published by Rahemi et al. (2014; [78]).
Chapter 5 is based on another research article currently under review for a journal
publication.

Chapter 2
Mathematical model: Development
and implementation
2.1 Introduction
The deformation of the muscle-tendon unit (MTU) in response to loading depends on
many parameters including architectural design, mechanical properties of tissues and
activation patterns. In order to properly simulate the nearly incompressible, highly
nonlinear and anisotropic behaviour of the MTU, these parameters need to be carefully
specified. The over-arching goal of this thesis is to create a mathematical model capable
of reproducing some of the mechanical properties of an MTU, and which is able to predict
muscle behaviour based on its functional properties (i.e. activation level). Achieving this
goal needs a good choice of modelling approach as well as quantified data on muscle
architecture and its functional properties. Since the resultant mathematical model is
complex and nonlinear, exact analytical solutions are not available except in the simplest
situations. It is for this reason that careful numerical simulations are vital in the study of
MTU.
The novel contributions of this thesis are:
• the design of a mathematical model of the full MTU unit;
• the fitting of parameters from experimental data;
• the development of a C++ 3-D finite element software architecture capable of
14
CHAPTER 2. MATHEMATICAL MODEL: DEVELOPMENT AND IMPLEMENTATION 15
simulating MTU behaviour, and
• the use of these mathematical and computational tools to answer basic scientific
questions about muscle.
In this chapter we shall focus on the development of the mathematical model of MTU
behaviour, based on a three-field formulation. We recall the foundations of such a theory in
2.2. The specific form of the model in turn relies on modelling the strain energy associated
with the muscle, tendon and aponeurosis, the effect of muscle and collagen fibres, passive
and active behaviour and muscle geometry. The strain-energy functions are discussed 2.3,
and we discuss the choices of parameters in the model based on available experimental
data. The resultant mathematical model is discretized using a Discontinuous Galerkin finite
element method (DG-FEM) and solved using a nonlinear algorithm in a manner described
in section 2.8.
Some mathematical models (e.g [53, 62]) consider MTU as a scaled up fibre or
contractile element (CE) in combination with parallel (PEE) and series (SEE) elastic
elements. The benefit in such simplified models is their ability to predict rough muscle
force and length with a low computational cost. These models usually assume that the
muscle has a constant depth that provides a direct relationship between pennation angle
and muscle fibre length, and allows for a straightforward calculation of muscle length and
pennation angle change. The constant depth assumption for a model with a certain
muscle fibre length, besides ignoring the physiological phenomenon of bulging, also
results in a single and fixed initial pennation. Therefore, another technique was introduced
in muscle modelling where individual 1D contractile elements were located inside a 2D
(e.g. [65, 68, 19]) or a 3D (e.g. [70]) isometric incompressible medium. This approach
created a class of muscle models often called panel models. The assumption of fibre
distribution in these panel models, regardless of the computational technique applied to
solve for the outputs, does not quite represent the muscle tissue composition and ignores
connection of fascicles by connective tissue and eventually the mechanical properties of
muscle tissue in its continuum form. On the other hand, panel models are more detailed
in terms of architectural ( e.g. [66]) and functional properties (e.g. [68]).
A more complete representation of muscle architecture needs a 3D continuum based
model of the soft tissues of the MTU. This method can provide the tools for describing

CHAPTER 2. MATHEMATICAL MODEL: DEVELOPMENT AND IMPLEMENTATION 16
mechanical properties MTU tissue with its 3D structure, and a larger capacity to create
physiologically relevant functionality inside the muscle. Also, it does not have some of
major issues of the other methods. The problem with this technique is usually the
computational cost. Continuum modelling is based on the finite elasticity theory and
provides tools to simulate more realistic structure and function of the MTU. To simulate
the muscle response under different loading we need to solve for the elasticity equation
(see the next section). In continuum mechanics, soft tissues are often modelled as
hyperelastic materials with transversely isotropic mechanical properties. The behaviour of
a hyperelastic material is described using strain-energy functions. Different strain-energy
functions (which can be interpreted as constitutive equations) were used in previous
continuum models (e.g. [59, 79, 73, 74, 69, 75]). The main difference was due to force
and deformation predicting factors. For example, Oomens et al. [69] used the sliding
filament theory of Huxley (1954; [60]) for predicting the number of attached cross-bridges
and therefore the output force in fibre level, but Blemker et al [59], used a Hill (1938; [20])
theory based model for estimating forces in fibre level. While Huxley based models have
many disadvantage in estimating force in high-speed contractions ([80]), Hill type models
can be used in both slow and fast contractions. The benefit of Huxley models is mostly in
sub-macroscopic studies of muscle contraction.
Despite the availability of different commercial and free platforms such as FEBio,
Ansys and Artisynth that allow for modelling of soft-tissue including the muscle tissue, the
questions of this work and the approach towards implementing the details of architecture
and function of skeletal muscles in the mathematical formulation was not always possible
to achieve when working within the framework of such platforms. As mathematical
education was part of the program that was needed to develop the necessary
mathematical framework, the only way to use very established aforementioned modelling
platforms was to work with closely with developers so that we could access and change
the mathematical system their software use. These reasons led us to use a very
well-documented freeware named deal.II [111] were a mathamatical formulation can be
built up from the basic mathematical operaters such as gradient, divergence and entities
such as vectors and tensors.
In this thesis we will try to harvest continuum mechanics capabilities in order to
simulate the function of muscles while acting in different loading and constraints
CHAPTER 2. MATHEMATICAL MODEL: DEVELOPMENT AND IMPLEMENTATION 17
conditions. This chapter is a review of fundamentals of the mathematics and continuum
mechanics modelling as well as computational techniques that were used or developed to
build the model. For a more complete description of these fundamentals most of the
continuum mechanics books (e.g. [81, 82]) are good resources.
2.2 Mechanics and Hyperelastic Materials: background
The soft tissues in this project can be mathematically described as a fibre-reinforced
composite biomaterial [83]. Specifically, they are described as nearly incompressible (e.g.,
for muscle Baskin and Paolini, 1967; [84]), transversely isotropic hyperelastic materials. In
order to fix notation and define frequently-used terms, we will now recall well-established
fundamental concepts in continuum-mechanics that are used to describe the mechanics
(kinematics and kinetics) of an elastic object when loaded.
The constitutive properties of a material can be described in a variety of ways. For
example, in linear elasticity the stress and strains are linearly related; specification of the
constitutive properties can be done by using Lame constants. In this thesis, we choose a
description of the constitutive properties of hyper elastic materials by linking the response
to physical loading to the strain energy.
2.2.1 Kinematics of an elastic object
In the kinematics, we wish to track the position vector of an object (particle’s) position.
Let us denote the current state position vector (x); this can usually be found as a function
of the original state position vector (X) and time (T ),
x = x(X, T ).
The displacement vector u that will be used very often in this text is calculated by:
x = X + u.
The deformation gradient F is a second order tensor defined as:
F =
[∂xi∂Xj
]= I +∇u.
where I is the second-order identity tensor, operator ∇ is the (vectorial) gradient and i and
j indexes represent the component of vector. The determinant of F is called the dilation J

CHAPTER 2. MATHEMATICAL MODEL: DEVELOPMENT AND IMPLEMENTATION 18
and represents the connection between the object volume in its current (dv) and original
state (dV ),
dv = J dV, J := det(F ).
The deformation gradient is used to calculate the right (C) and left (B) Cauchy-Green
tensors as:
C := FTF = [FkiFkj ] =
[∂xk∂Xi
∂xk∂Xj
], (2.1)
B := FFT = [FikFjk] =
[∂xi∂Xk
∂xj∂Xk
], . (2.2)
The strain tensor (E) becomes
E :=1
2(C − I). (2.3)
Here again indexes i, j, and k are used to identify the components of the vectors and
tensors.
2.2.2 Kinetics of an elastic object
As described above, the constitutive properties of a material can be characterized by its
strain energy. The strain-energy functional W will play an important role in the modelling
process, and we will need to specify the strain energies for different types of tissue in
the MTU. We remark that if the material under consideration were behaving in a linear,
isotropic and homogenously elastic manner, then the strain energy can be written as
W =1
2λ[tr(E)]2 + µtr(E2) (2.4)
where λ and µ are Lame constants.
The Cauchy stress () developed inside a continuum material is calculated by
differentiating the strain-energy function W with respect to the strain tensor components,
:=
[δW
δEij
]=
1
det(F )FTF . (2.5)
where is the Kirchoff stress and can be calculated as:
= 2
[δW (C)
δCij
]= 2
[Bij
δW (B)
δBij
]= JF−T . (2.6)
The second Piola-Kirchoff stress is defined as:
S := F−1F−T . (2.7)
CHAPTER 2. MATHEMATICAL MODEL: DEVELOPMENT AND IMPLEMENTATION 19
Frequently, knowledge of the externally-applied Cauchy stress is useful for calculating
tractions. These are the natural boundary conditions for the elasticity equations,
analogous to the Neumann conditions for the Laplacian. Tractions are applied to the
boundary sections with a Neumann boundary and are given by
t = n.
Here n is the normal vector to the surface where the traction is being applied.
2.2.3 Hyperelastic material continuum response
The assumption of a nearly incompressible fibre-reinforced composite biomaterial
creates two distinct parts in the strain-energy formulation; a volume changing (volumetric)
part that represents the incompressibility characteristics of material and a
volume-preserving (isochoric) part representing the composite response. In order to
mathematically account for both volume changing and volume-preserving responses in
stretch or shear loadings we multiplicatively decompose the deformation gradient and left
Cauchy-Green tensors,
F = (J13 I)F , B = (J
23 I)F F T = (J
23 I)B.
Here F and B are the isochoric parts of the deformation gradient and left Cauchy-green
tensor respectively.The strain energy function can be similarly decomposed into volumetric
( subscripts ’vol ’) and isochoric (subscripts ’iso’) parts as:
W (B) = Wvol(J) +Wiso(B). (2.8)
Likewise, the Kirchoff stress from equation (2.6) can also be decomposed,
= 2BδW (B)
δB= vol + i so
where
vol = 2BδWdev(B)
δB= pJI,
and
iso = 2BδWiso(B)
δB= (I − 1
3I ⊗ I) : .
CHAPTER 2. MATHEMATICAL MODEL: DEVELOPMENT AND IMPLEMENTATION 20
Here ⊗ is tensor inner product operator, I is the fourth-order identity tensor. The variable
p is the hydrostatic pressure, and is the fictitious Kirchoff stress and is defined by
:= 2BδWiso(B)
δB.
The elasticity tensor C is a rank four tensor which is defined in the material description
as:
C := 2δ (C)
δC= 4
δ2W (C)
δC2
and in spatial coordinates as:
c := 4J−1Bδ2W (B)
δB2B (2.9)
The elasticity tensor can also be decomposed into deviatory and isochoric components the
same way as the spatial Kirchoff stress.
2.2.4 Potential energy minimization and the three-field formulation
The total potential energy of a physical system U can be defined as the sum of
internal Uint and external Uext potential energies. The actual state of the physical system
is obtained by minimizing the potential energy. The potential energy of the described
system can be written as:
U(u, J , p) = Uint+Uext =
∫ΩWvol+p(J(u)−J) dv+
∫ΩWisoB(u) dv−
∫Ωfb·u dv−
∫∂Ω
ft·u da
(2.10)
where J is the dilation constraint enforced by a Lagrange multiplier to the system p that
represents systems internal pressure (i.e. intramuscular pressure), and Ω, ∂Ω, v and a are
the system’s domain, boundary, volume and boundary area respectively. Finally fb and ft
are body and traction forces acting on the domain and boundary of the system respectively.
Using a variational argument, the Euler-Lagrange equations for the stationarity of the
potential can be written in terms of the deformation u, dilation J and pressure p
div (( (C(u))) + fb = ρ∂2
∂t2u (2.11a)
J(u) = J (2.11b)
p =δWvol(J)
δJ(2.11c)
CHAPTER 2. MATHEMATICAL MODEL: DEVELOPMENT AND IMPLEMENTATION 21
In our computational process we try to find the equilibrium of the system described by a
three-field formulation (equations 2.11 a to c) by minimizing its potential energy. Details on
the computational strategy will be provided in section 2.8.
2.3 Strain-energy function
The use of strain-energy functions W to describe the constitutive behaviour of soft
tissues (including muscle) is well-established. There are broadly two different ways in
which the strain-energy is described.
In the first approach (e.g. [85]), the strain-energy is based on physically-based
invariants of the stress tensor. This allows a faster and more direct way to extract material
constants from experimentally measured material properties. Unfortunately, if we use
such invariants the underlying mathematical formulation becomes highly nonlinear,
leading to computational challenges. Another, deeper issue is that there are few
experimental studies that provide the necessary measurements for estimating the
material constants. Even in presence of enough data for a specific tissue, variations in the
literature are high and in some cases contradictory. (e.g. for the muscle tissue see [86]
vs. [87]).
In the second, more classical approach (e.g. [88]), the strain energy is based on the
invariants of the Cauchy-Green deformation tensor. Compared to the first approach, the
use of the Cauchy-Green invariants leads to a mathematically simpler formulation. In this
thesis we use this classical approach that allows for a full flexibility in all input parameters,
i.e. the fibre orientation, the activation level and the material parameters can vary
throughout the tissue geometry both spatially and in time.
We recall the description of the classical strain energy for a hyperelastic material that
will be subsequently modified to represent the mechanical response of a muscle-tendon
unit. As mentioned, the (classical strain) energy function is defined in terms of the
invariants of the Cauchy-Green deformation tensors (Equation 2.1, Equation 2.2) (e.g.
see Spencer 1984; [83]) and has a general form of:
W = W (X,B,a0) = W (I1, I2, I3, I4, I5) (2.12)
where a0 is the direction of fibres in the undeformed state of the material. The invariants

CHAPTER 2. MATHEMATICAL MODEL: DEVELOPMENT AND IMPLEMENTATION 22
of B, I1 to I5, are calculated as:
I1 = tr(B), I2 =1
2
[(tr(B))2 − tr(B2)
], I3 = det(B) = J2, (2.13a)
I4 = a0 ·B · a0, I5 = a0 ·B2 · a0. (2.13b)
As a result the elasticity tensor in the spatial description Equation 2.9 can be written in
terms of derivatives of the strain-energy function with respect to the invariants, for example
(Weiss et al 1996):
c = 4
(W11 + 2W12I1 +W2 +
W22
I−21
)B ⊗B − (W12 +W22I1)(B ⊗B
2 + B ⊗B)
+ W22(B2 ⊗B
2)−W2I(W14 +W24I1)I4(a0 ⊗ a0 ⊗B + B ⊗ a0 ⊗ a0) +W5φ∗δ2I5δC2
+ (W15 +W25I1)
(B ⊗ [φ∗
δI5δC
] + [φ∗δI5δC
]⊗ a0 ⊗ a0)
)−W24I4
(a0 ⊗ a0 ⊗B
2 + B ⊗ a0 ⊗ a0
)− W25
(B
2 ⊗ [φ∗δI5δC
] + [φ∗δI5δC
]⊗B2
)+W44I
24 (a0 ⊗ a0 ⊗ a0 ⊗ a0)
+ W45I4
(a0 ⊗ a0 ⊗ [φ∗
δI5δC
] + [φ∗δI5δC
]⊗ a0 ⊗ a0
)+W55
(⊗[φ∗
δI5δC
] + [φ∗δI5δC
]
)(2.14)
where [φ∗δI5δC ] := I4(a0 ⊗ B · a0 + a0 · B ⊗ a0) and Wij = ∂2W
∂Ii∂Ij. To account for
incompressibility, an additional Lagrange multiplier term (pI) could be added to the
elasticity tensor.
We work with a modification of this classical strain energy function that is based on the
decomposable into volumetric and isochoric parts Equation 2.8. Following (see Holzapfel
2000; [89]), we can write
Wvol(J) :=κ
4(J2 − 1− 2 log(J)), (2.15)
and from the above definition of the invariants J =√I3. Using these invariants we can also
describe the along-fibre isochoric strain energy (Wtissue) and the base material isochoric
energy (Wbase):
Wiso = Wtissue +Wbase. (2.16)
The contribution of the base material to the strain energy, Wbase, encapsulates the
elastic properties of the connective tissue within muscle, tendon and the aponeurosis (i.e.
the extracellular connective tissue in the muscle belly). Many different models of Wbase
can be considered for modelling a soft tissue. These range in complexity from assuming
the tissue is simply a Neo-Hookean material model to more sophisticated,

CHAPTER 2. MATHEMATICAL MODEL: DEVELOPMENT AND IMPLEMENTATION 23
physically-measurable model based on physical invariants, Criscione et al. (2001; [85]). In
this thesis, such contributions are mathematically modelled by fitting material models
based on only the first invariant (I1) of the Cauchy-Green tensor to experimental data.
The details of how we model the base muscle, tendon and aponeurosis tissues in this
thesis will be discussed in section 2.4.
The isochoric strain energy contributions Wtissue arise from the stretching of fibres
along their length. If we denote the Cauchy stress in the fibre caused by a stretch of λ as
σtissue(λ), then the isochoric strain energy for the tissues modelled in this work becomes
λ∂Wtissue(λ)
∂λ= σtissue(λ). (2.17)
The along-fibre stretch λ for any of the four tissues and is described by ([83]):
λ =√I4 (2.18)
where I4 is the fourth invariant of the isochoric part of the left Cauchy tensor.
Soft tissues are distinguished by the specific form of their Cauchy stress-stretch
functions, σtissue(λ) used in (equation 2.17). For this thesis, we constructed stress-stretch
relationships from experimental data (see section 2.4), using the curve-fitting functions in
MATLAB (2014; [90]).
Any material in this thesis will be described in terms of two components for the
isochoric part Wiso of the strain-energy functions (equation 2.16). The first component,
Wtissue describes how fibres affect the mechanical response of the tissue along their
length. The second, Wbase represents the base isotropic properties. In most of the
following sections, modelling decisions had to be made to balance the accuracy of the
model, and its simplicity. Often, the experimental data could be fitted by curves with
different characteristics; we describe how we pick a fitted curve among available options.
These choices were made based on many factors including: the data source, goodness of
fit, the shape of the fitted curve, values and slopes at the extreme stretches, and
computational cost. The source data was important in terms of whether the data were
from animal or human experiments and which muscle, tendon and aponeurosis material
properties were measured.
CHAPTER 2. MATHEMATICAL MODEL: DEVELOPMENT AND IMPLEMENTATION 24
2.4 Choice of materials, constants estimation, strain energies
In what follows, we describe the development of mathematical models for the strain
energy in tendon, aponeurosis and muscle tissue. We present our modelling ideas within
the context of the human triceps-surae, and take care to discuss how the availability of
specific experimental data affects various modelling choices. In principle, a similar
methodology can be used with other muscles, leading to other constitutive laws.
2.5 Tendon
There are numerous studies (e.g.[91], [92], [93], [94],[52] and [51]) on the
measurement of tendon material properties along their line of action (a good assumption
for along-fibre tensile response). Many of these studies have been done in vitro (e.g. [91]
and [51]) and some have measured these mechanical properties in vivo (e.g. [95] and
[54]).
Since the focus in this thesis was on the muscles from human triceps-surae, the
measured data from human triceps-surae tendon (Achilles) were of higher interest.
Among the studies which were found in the literature, only Magnusson et al. [54] has data
on both the Achilles tendon and triceps-surae aponeurosis, which made it a more
complete set of information for our modelling goals. In this thesis, therefore, the modelling
of the material properties of both the tendon and aponeurosis tissues was based on the
results of Magnusson et al. [54].
2.5.1 Tendon: Along-fibre properties
The along-fibre stress-stretch curve of human free Achilles tendon is shown in Figure
2.1. The curve is calculated from the force-stretch curve and cross sectional area data
from Magnusson et al [54].
In most of the studies on longitudinal tensile response of tendons, whether modelling
(e.g. [59] and [88]) or experimental (e.g. [92] and [91]), the stress-stretch curve is divided
into a non-linear toe region and a linear region. The tendon material properties defined
for this work also had a toe region which was represented using a power function and a
linear section continuously extending the toe region. However, the toe region is extended

CHAPTER 2. MATHEMATICAL MODEL: DEVELOPMENT AND IMPLEMENTATION 25
0.95 1. 1.05 1.1 1.15
0
50
100
150
200
Stretch
Stress(MPa)
Figure 2.1: along-fibre stress-stretch curve for tendon tissue based on the Magnusson etal. 2003 [54] (see equation 2.19).
to higher stretch values compared to experimental data. This choice was solely made to
use a single well-fitted function for the most of the range of action of the tendon. The
fitting of functions was done in the MATLAB Curve Fitting Toolbox. It is possible to fit
many kinds of functions- polynomial, exponential, and others - and we use fitted curves
based on a higher coefficient of determination (R-Squared) value of the fit, as well as the
simplicity of the final expression. These functions are described below,
σtendon(λ) =
0.3504× 10⁶(λ68.8 − 1) 1 ≤ λ ≤ 1.07,
0.3504× 10⁶(68.8× 1.0767.8(λ− 1.07) + (1.0768.8 − 1)) 1.07 < λ.
(2.19)
Here, as before, σ is the Cauchy stress and λ is the along-fibre stretch. Using equation
2.17 the strain energy function for along-fibre tensile properties of tendon is represented
by ,
λ∂Wtendon
∂λ= σtendon(λ). (2.20)
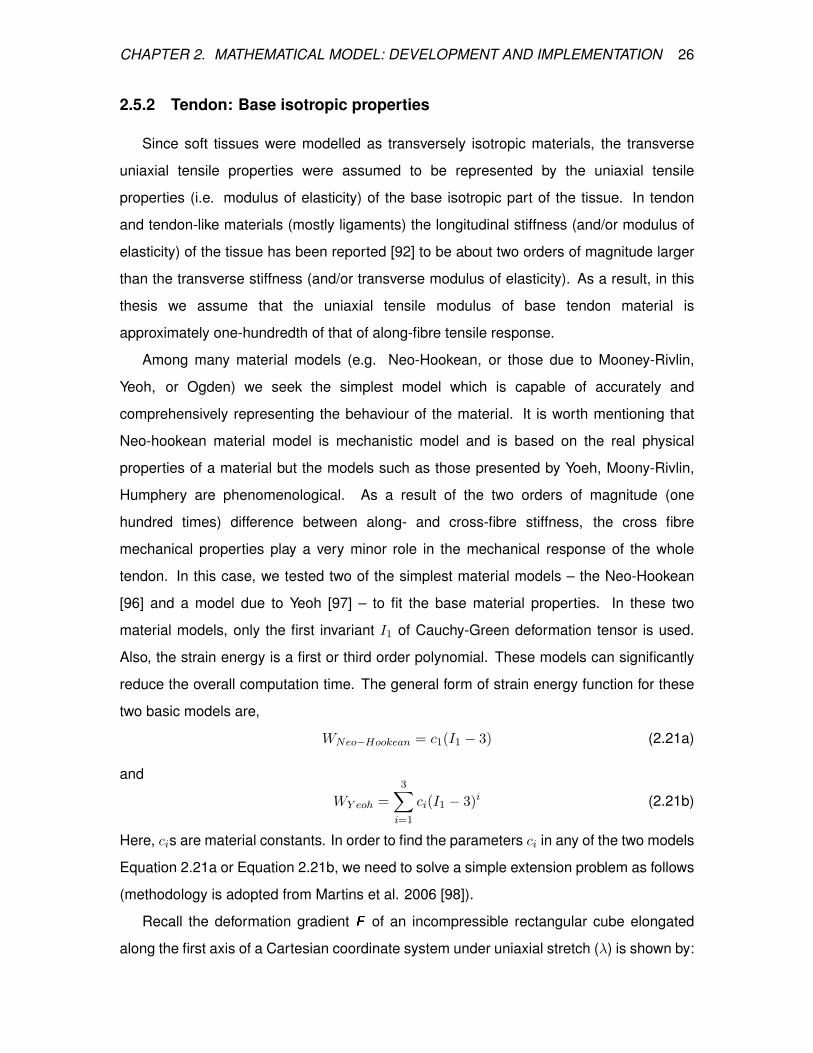
CHAPTER 2. MATHEMATICAL MODEL: DEVELOPMENT AND IMPLEMENTATION 26
2.5.2 Tendon: Base isotropic properties
Since soft tissues were modelled as transversely isotropic materials, the transverse
uniaxial tensile properties were assumed to be represented by the uniaxial tensile
properties (i.e. modulus of elasticity) of the base isotropic part of the tissue. In tendon
and tendon-like materials (mostly ligaments) the longitudinal stiffness (and/or modulus of
elasticity) of the tissue has been reported [92] to be about two orders of magnitude larger
than the transverse stiffness (and/or transverse modulus of elasticity). As a result, in this
thesis we assume that the uniaxial tensile modulus of base tendon material is
approximately one-hundredth of that of along-fibre tensile response.
Among many material models (e.g. Neo-Hookean, or those due to Mooney-Rivlin,
Yeoh, or Ogden) we seek the simplest model which is capable of accurately and
comprehensively representing the behaviour of the material. It is worth mentioning that
Neo-hookean material model is mechanistic model and is based on the real physical
properties of a material but the models such as those presented by Yoeh, Moony-Rivlin,
Humphery are phenomenological. As a result of the two orders of magnitude (one
hundred times) difference between along- and cross-fibre stiffness, the cross fibre
mechanical properties play a very minor role in the mechanical response of the whole
tendon. In this case, we tested two of the simplest material models – the Neo-Hookean
[96] and a model due to Yeoh [97] – to fit the base material properties. In these two
material models, only the first invariant I1 of Cauchy-Green deformation tensor is used.
Also, the strain energy is a first or third order polynomial. These models can significantly
reduce the overall computation time. The general form of strain energy function for these
two basic models are,
WNeo−Hookean = c1(I1 − 3) (2.21a)
and
WY eoh =
3∑i=1
ci(I1 − 3)i (2.21b)
Here, cis are material constants. In order to find the parameters ci in any of the two models
Equation 2.21a or Equation 2.21b, we need to solve a simple extension problem as follows
(methodology is adopted from Martins et al. 2006 [98]).
Recall the deformation gradient F of an incompressible rectangular cube elongated
along the first axis of a Cartesian coordinate system under uniaxial stretch (λ) is shown by:

CHAPTER 2. MATHEMATICAL MODEL: DEVELOPMENT AND IMPLEMENTATION 27
[F
]=
λ 0 0
0 1√λ
0
0 0 1√λ
(2.22)
where the stretches in the direction of the other two axes of the coordinate system are
λ2 = λ3 = 1√λ
. These are derived based on considerations of symmetry and the
incompressibility of the continuum with J = detF = 1. Then the right Cauchy-Green
tensor (C) is calculated as,
[C
]=[F T] [F
]=
λ2 0 0
0 λ−1 0
0 0 λ−1
(2.23)
The next step is to calculate the invariants of C (similar to Equation 2.13) under the further
assumption of isotropy:
I1 = trC = λ2 +2
λ, I2 =
1
2((tr(C))2 − tr(C2)) = 2λ+
1
λ2, (2.24a)
I3 = detC = 1 (2.24b)
To calculate the stress-stretch function for any material model under such a loading and
boundary condition (no second and third principal stresses, σ2 = σ3 = 0), we start with the
general form for principal Cauchy stresses,
σi = J−1λi∂W
∂λi, i = 1, 2, 3. (2.25)
Applying boundary conditions to equation 2.25, the first principal stresses will look like:
σ1 = λ1∂W
∂λ1− λ2
∂W
∂λ2or σ1 = λ1
∂W
∂λ1− λ3
∂W
∂λ3. (2.26)
Holzapfel [89] describes the Cauchy stress during uniaxial stretch (σ1) in such a material
in terms of the invariants of C as:
σ1 = 2(λ2 − 1
λ)(∂W
∂I1+
1
λ
∂W
∂I2) (2.27)
Using equations 2.21a and 2.21b, we obtain that the stress-stretch functions for the two
discussed material models are:
σNeo−Hookean = 2c1(λ2 − 1
λ) (2.28)

CHAPTER 2. MATHEMATICAL MODEL: DEVELOPMENT AND IMPLEMENTATION 28
and
σY eoh = 2(λ2− 1
λ)(c1+2c2(I1−3)+3c3(I1−3)2) = 2(λ2− 1
λ)(c1+2c2(λ
2+2
λ−3)+3c3(λ
2+2
λ−3)2).
(2.29)
Assuming that uniaxial modulus of base materials are approximately one-hundredth of
its along-fibre modulus (slope of the curve in Figure 2.1) and using equations 2.28 and
2.29, material constants for the Neo-Hookean and Yeoh’s models were estimated. This
was done using the MATLAB Curve Fitting Toolbox. The results are shown in the Table
2.1,
Constants (Pa) Neo-Hookean Yeohc1 0.5256× 10⁶ 0.2083× 10⁶
c2 - −4.63× 10⁶
c3 - 1367× 106
R-squared 0.667 0.9955
Table 2.1: Material constants and R-square values of fit for Neo-Hookean and Yeoh modelsof tendon base material
Despite a higher R-squared value for the Yeoh’s model, since the ratio of base to
along-fibre tensile response (i.e. were very small, any choice of the material models
Equation 2.21a and Equation 2.21b for the base material would be acceptable. A
Neo-Hookean model was selected for the simplicity of the overall MTU model. A bulk
modulus value of κ = 1 × 10⁸ Pa was chosen for the tendon tissue to reflect the
incompressible nature of the tendon and minimize the change in its volume. Eventually,
the tendon base material properties can be written as:
Wbase,tendon := c1(I1 − 3)− 1, c1 = 52.56× 10⁴ Pa. (2.30)
2.6 Aponeurosis
2.6.1 Aponeurosis:Along-fibre properties
The challenge with developing mathematical models of aponeurosis and similarly thin
tissues (epimysium) is that it is not easy to experimentally determine the stress developed
in them during loading. This is mainly because the cross-sectional area (CSA) changes
along its length. Therefore, there are very few experimental studies of aponeurosis (e.g.

CHAPTER 2. MATHEMATICAL MODEL: DEVELOPMENT AND IMPLEMENTATION 29
[99]) that have reported stress-stretch properties. We estimated the stress-stretch curve for
aponeurosis by assuming an estimated average CSA for aponeurosis. This way, the ratio
of the tendon force and the estimated aponeurosis CSA will provide us with along-fibre
stress. This is consistent with assumptions made by other modelling groups.
Along with estimating the aponeurosis area by a single CSA, based on the few
experimental studies of aponeurosis mechanical properties available, many modelling
groups (e.g. [59], [70]) have opted to select the same material properties for both tendon
and aponeurosis. This assumption, although a simple way of representing muscle-tendon
unit (MTU) structure, ignores the effects of different fibres in these tissues. Specifically,
collagen fibre directions and the base material stiffness may be different between the
aponeurosis and tendon in the same muscle. In order to shed light on the effects of
architectural and structural details in studying muscle mechanics, one has to build the
structures as carefully as possible; and if possible, not to compromise the accuracy. In
this thesis, we include aponeurosis material properties independently.
As explained in previously, the focus in this thesis will be on the human triceps-surae
muscle group. Therefore, data on any of the human triceps-surae muscles
(gastrocnemius or soleus) aponeurosis is preferred. Magnusson et al [54] reports data on
both free Achilles tendon and triceps-surae aponeurosis. The only problem as described
above is that aponeurosis data is in force-stretch form. In this thesis, the average CSA for
aponeurosis was estimated as half of the free tendon CSA and equal to 36.5 mm2. We
assumed that tendon CSA linearly decreases to almost zero as the aponeurosis extends
from the muscle-tendon junction towards the centre of the muscle belly. This along-fibre
stress-stretch function is formulated (equation 2.31) as a piecewise function similar to the
tendon.
It is worth repeating that the reported along-fibre stretch modulus are the sum of fibre
and base material contributions. Since there are limited studies that present the difference
between these contributions, we have chosen to follow the only study of the longitudinal
and transverse tensile response of aponeurosis by Azizi et al. [99] to give us the guidelines.
In their study, the gastrocnemius aponeurosis of bipedal wild turkeys was investigated. This
is a similar structure as intended to be studied in this thesis. Based on their result the along-
fibre stiffness (or modulus of elasticity) was seven times larger than cross fibre stiffness (or
modulus of elasticity). This means that the fibres in aponeurosis provide six-seventh of

CHAPTER 2. MATHEMATICAL MODEL: DEVELOPMENT AND IMPLEMENTATION 30
the contribution to the along-fibre tensile response of the tissue and the rest is due to
base material mechanical properties. Note that in theory, a similar calculations should
have been done for the tendon but the ratio of the mechanical properties (i.e. moduli) was
about one hundred to nighty nine, and this is close to unity. In this case, the accuracy of
proposed base material properties for the tendon tissue would not be affected much by
choosing a simpler material model and the slight difference was ignored. This difference
cannot be ignored for the aponeurosis tissue. The stress-stretch equation in this section
and the tensile response of the base material in the following section have been based on
the contribution ratio from the Azizi et al. [99] study, and the actual human gastrocnemius
aponeurosis tensile response from Magnusson et al. [54].
σapo(λ) =
3.053× 10⁶(λ124.6 − 1) 1 ≤ λ ≤ 1.025
3.053× 10⁶(124.6× 1.025123.6(λ− 1.025) + (1.025124.6 − 1)) 1.025 < λ
(2.31)
Here, as before, σ is the Cauchy stress and λ is along-fibre stretch. Using equation 2.17
the strain energy function for along-fibre tensile response of aponeurosis is represented
by:
λ∂Wapo
∂λ= σapo(λ) (2.32)
2.6.2 Base isotropic properties
We used the same technique as the previous section to retrieve material constants
for the base isotropic aponeurosis material. As mentioned in the previous section, we will
assume that the cross-fibre contribution for the tensile response is about one-seventh of the
total the along-fibre tensile response of the aponeurosis. The material constants of base
aponeurosis for various but simple models can be seen in Table 2.2. We additionally looked
at two extra strain energy functions for more nonlinear Mooney-Rivlin [96] and Humphrey
[100] material models since the base material properties play a larger role in aponeurosis
mechanical behaviour when compared to tendon,
WMooney−Rivlin = c1(I1 − 3) + c2(I2 − 3), (2.33)
and
WHumphrey = c1(ec2(I1−3) − 1). (2.34)
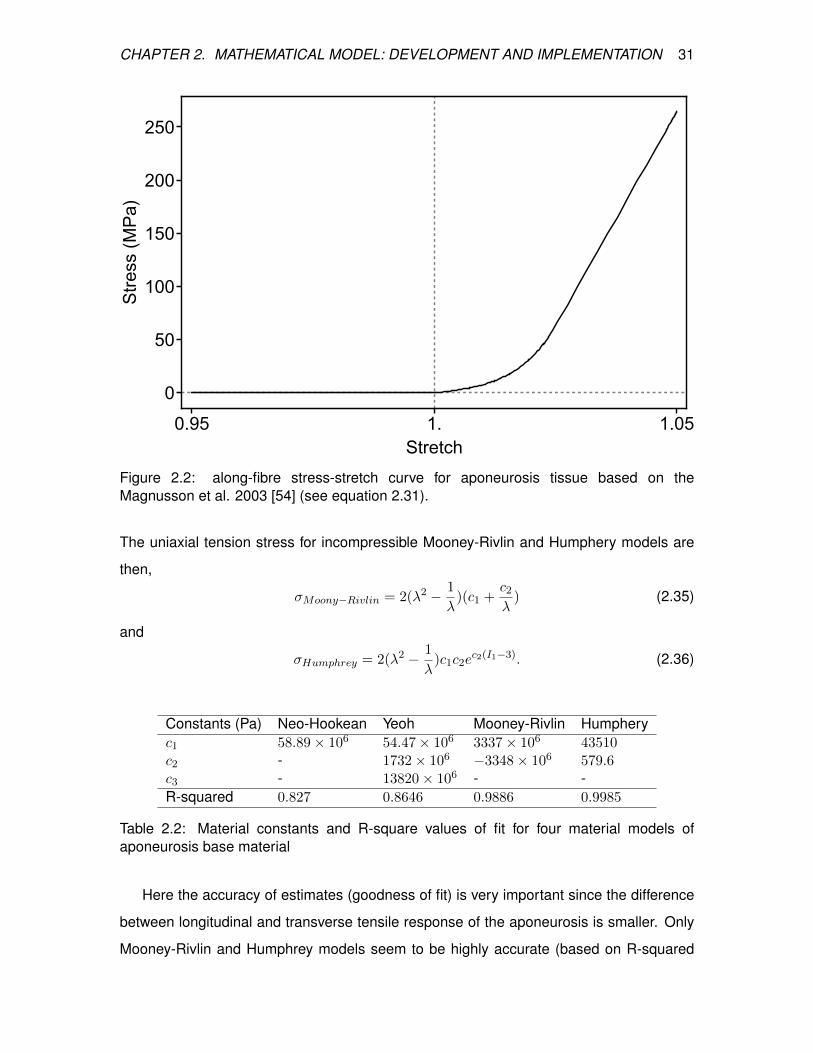
CHAPTER 2. MATHEMATICAL MODEL: DEVELOPMENT AND IMPLEMENTATION 31
0.95 1. 1.05
0
50
100
150
200
250
Stretch
Stress(MPa)
Figure 2.2: along-fibre stress-stretch curve for aponeurosis tissue based on theMagnusson et al. 2003 [54] (see equation 2.31).
The uniaxial tension stress for incompressible Mooney-Rivlin and Humphery models are
then,
σMoony−Rivlin = 2(λ2 − 1
λ)(c1 +
c2λ
) (2.35)
and
σHumphrey = 2(λ2 − 1
λ)c1c2e
c2(I1−3). (2.36)
Constants (Pa) Neo-Hookean Yeoh Mooney-Rivlin Humpheryc1 58.89× 10⁶ 54.47× 10⁶ 3337× 106 43510c2 - 1732× 106 −3348× 106 579.6c3 - 13820× 106 - -R-squared 0.827 0.8646 0.9886 0.9985
Table 2.2: Material constants and R-square values of fit for four material models ofaponeurosis base material
Here the accuracy of estimates (goodness of fit) is very important since the difference
between longitudinal and transverse tensile response of the aponeurosis is smaller. Only
Mooney-Rivlin and Humphrey models seem to be highly accurate (based on R-squared
CHAPTER 2. MATHEMATICAL MODEL: DEVELOPMENT AND IMPLEMENTATION 32
value of the fit). The Humphrey model has the advantage of a slightly better R-square
and only using the first invariant of Cauchy-Green tensor to reduce computational cost.
This model was implemented for the strain energy of aponeurosis base material. The bulk
modulus value of κ = 1 × 10⁸ was also chosen for this material to keep the the tissue
nearly incompressible under convergence criteria. Finally, the strain energy function for
the aponeurosis base material looks like:
Wbase,apo := c1(ec2(I1−3) − 1), c1 = 4.351× 10⁴ Pa, c2 = 5.796× 10² Pa. (2.37)
2.6.3 Different stiffness levels for aponeurosis
Chapters 3 to 5 presents simulations for muscles with different aponeurosis stiffness
properties. The three levels of stiffness used in this thesis were named as compliant,
normal and stiff aponeurosis tensile properties and would develop maximum strains of 10,
5 and 2% when the muscle was developing maximum isometric force. The compliant
aponeurosis tensile properties were those of the Achilles tendon as described before
(equation 2.19 and Table 2.1). For normal aponeurosis, the material properties described
in this section (equation 2.31 and Table 2.2) were used in the simulations. For the stiff
aponeurosis, the base and along-fibre material properties of the normal aponeurosis was
scaled so that the 2% strain level at maximum isometric force of the muscle is reached.
The following describe the along-fibre stress-stretch curve and base material strain
energy for stiff aponeurosis used throughout this thesis:
σSapo(λ) =
2.442× 10⁷(λ124.6 − 1) 1 ≤ λ ≤ 1.01,
2.442× 10⁷(124.6× 1.01123.6(λ− 1.01) + (1.01124.6 − 1)) 1.01 < λ.
(2.38)
Wbase,Sapo := c1(ec2(I1−3) − 1), c1 = 3.481× 10⁵ Pa, c2 = 4.637× 10³ Pa. (2.39)
2.7 Muscle
Unlike tendon and aponeurosis, muscle tissue can be loaded actively as well as in
passive condition. Therefore separate sections are devoted to passive and active

CHAPTER 2. MATHEMATICAL MODEL: DEVELOPMENT AND IMPLEMENTATION 33
properties of the muscle tissue as follows. Based on this, muscle mechanical properties
are decomposed into passive and active components. While active properties are
modelled here as along-fibre tensile properties only, passive properties of skeletal
muscles were divided into the along-fibre and base material properties similar to other
passive tissues. The base materials are considered to hold the fibres in active or passive
conditions; therefore, there is no need to remodel them when discussing active properties
of the muscle tissue. Passive along-fibre stress-stretch function (σPassive(λ)) was added
to active along-fibre tensile properties (σActive(λ)) to form the along-fibre material
properties of the muscle tissue. Here the active and passive along-fibre stresses were
normalized by the maximum isometric stress σ0 = 200 KPa at the optimal length of the
fibre and given a ”∧” superscript:
σMuscle(λ) = σ0(σActive(λ) + σPassive(λ)), (2.40)
and the along-fibre strain energy for the muscle tissue will look like:
λ∂WMuscle
∂λ= σMuscle(λ). (2.41)
2.7.1 Muscle:Passive properties
Among the experimental studies on skeletal muscle material properties, there are few
(e.g.[86], [101] and [87]) which report both longitudinal (along-fibre) and transverse (cross
fibre) measurements. The results are occasionally contradictory. Morrow et al. [86] in
2010 measured longitudinal and transverse tensile as well as longitudinal shear
properties of rabbit extensor digitorum longus muscle and reported that longitudinal
module of elasticity is twenty time higher then transverse module. Takaza et al. [87] in
2013 measured the longitudinal and transverse elastic modulus of pig longissimus dorsi
muscle. Although their result were very similar but there was a significant difference in the
ratio of longitudinal to transverse modulus in their work compared to Morrow et al. [86].
Their results show that transverse modulus is slightly larger than longitudinal modulus of
the tissue. Structurally, the passive properties can be thought of a combination of titin
filaments, intracellular and extracellular connective tissue passive properties. A review by
Gillies and Lieber [102] in 2011 narrated the ratio between bundle of fibre (fibre plus
extracellular) modulus to fibre modulus from many experimental studies. This ratio was
CHAPTER 2. MATHEMATICAL MODEL: DEVELOPMENT AND IMPLEMENTATION 34
between 1.6-2.7 for most of the human muscles studied. These results [102] stand
somewhere between the two reported group of results mentioned before [86, 87] and
adds to the confusion. In modelling studies there has been a tendency to have large
ratios of longitudinal to transverse modulus. For example, in the Blemker et al. [59], the
muscle tissue longitudinal modulus is approximately two orders of magnitude higher than
the transverse modulus. We considered that along-fibre tensile response [i.e. modulus
(E)] of the muscle tissue are a combination of fibre and base isotropic materials. Also, the
mechanical properties of the base material is what we consider the transverse tensile
properties of a transversely isotropic material. Therefore, the ratio of longitudinal to
transverse tensile properties (i.e. ELET
) represent the ratio between fibre tensile properties
plus base material tensile properties to base material tensile properties (i.e. Efibre+EbaseEbase
).
Based on the uncertainty of the ratio of the longitudinal to transverse modulus, this thesis
tested different ratios to find an appropriate representation for both passive along-fibre
and base passive muscle materials. The passive properties of skeletal muscle tissue
were adopted from the classic Zajac 1989 [53] study.
1. Longitudinal to transverse modulus ratio ∼ 100
It was assumed that 99% of stresses in the passive curve presented by Zajac [53]
are results of the fibres and only 1% is due to base material. However the curve for
along-fibre tensile response was fitted to original data rather than 99% of data. It
was assumed the difference in the model output would be insignificant based on this
difference. The passive stress-stretch properties when present λ > 1 can be shown
by an exponential function. This function can be shown as:
σPassive(λ) =
0 λ ≤ 1.0
(42.76× 10⁻⁵)e5.339λ − 8825× 10−5 1.0 < λ
(2.42)
For transverse tensile properties again the effort was mostly dedicated to fit a
simple and computationally cost efficient model to one-hundredth of along-fibre
stress-stretch properties. Therefore, similar to the tendon base material property
(section 2.5.2), we only fitted the base muscle tissue to Neo-Hookean and Yeoh’s
models. The summary of different material constants for the passive base material
for this modulus ratio is shown in Table 2.3. Because of the high ratio of longitudinal
to transverse modulus in this part, only the constants for simplest models are
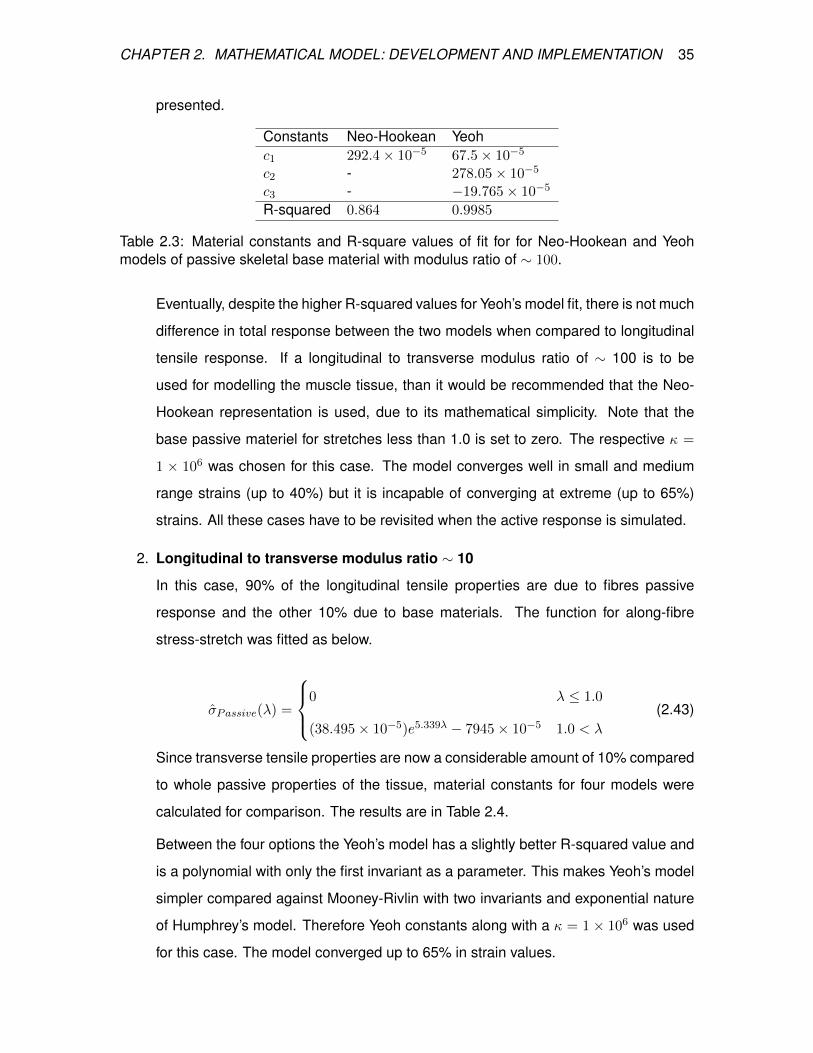
CHAPTER 2. MATHEMATICAL MODEL: DEVELOPMENT AND IMPLEMENTATION 35
presented.
Constants Neo-Hookean Yeohc1 292.4× 10⁻⁵ 67.5× 10⁻⁵
c2 - 278.05× 10⁻⁵
c3 - −19.765× 10⁻⁵
R-squared 0.864 0.9985
Table 2.3: Material constants and R-square values of fit for for Neo-Hookean and Yeohmodels of passive skeletal base material with modulus ratio of ∼ 100.
Eventually, despite the higher R-squared values for Yeoh’s model fit, there is not much
difference in total response between the two models when compared to longitudinal
tensile response. If a longitudinal to transverse modulus ratio of ∼ 100 is to be
used for modelling the muscle tissue, than it would be recommended that the Neo-
Hookean representation is used, due to its mathematical simplicity. Note that the
base passive materiel for stretches less than 1.0 is set to zero. The respective κ =
1 × 10⁶ was chosen for this case. The model converges well in small and medium
range strains (up to 40%) but it is incapable of converging at extreme (up to 65%)
strains. All these cases have to be revisited when the active response is simulated.
2. Longitudinal to transverse modulus ratio ∼ 10
In this case, 90% of the longitudinal tensile properties are due to fibres passive
response and the other 10% due to base materials. The function for along-fibre
stress-stretch was fitted as below.
σPassive(λ) =
0 λ ≤ 1.0
(38.495× 10⁻⁵)e5.339λ − 7945× 10−5 1.0 < λ
(2.43)
Since transverse tensile properties are now a considerable amount of 10% compared
to whole passive properties of the tissue, material constants for four models were
calculated for comparison. The results are in Table 2.4.
Between the four options the Yeoh’s model has a slightly better R-squared value and
is a polynomial with only the first invariant as a parameter. This makes Yeoh’s model
simpler compared against Mooney-Rivlin with two invariants and exponential nature
of Humphrey’s model. Therefore Yeoh constants along with a κ = 1 × 10⁶ was used
for this case. The model converged up to 65% in strain values.

CHAPTER 2. MATHEMATICAL MODEL: DEVELOPMENT AND IMPLEMENTATION 36
Constants Neo-Hookean Yeoh Mooney-Rivlin Humpheryc1 0.02924 675× 10−5 0.13255 634× 10−5
c2 - 0.0278 −0.14525 1.943c3 - −197.45× 10⁻⁵ - -R-squared 0.864 0.9985 0.9928 0.9959
Table 2.4: Material constants and R-square values of fit for four material models of passiveskeletal base material with modulus ratio of ∼ 10.
3. Longitudinal to transverse modulus ratio ∼ 1
In the third case an equal portion of passive tensile properties was assumed to
represent the along-fibre and base responses. The stress-stretch function for
along-fibre in this case is:
σPassive(λ) =
0 λ ≤ 1.0
(21.39× 10⁻⁵)e5.339λ − 4413× 10−5 1.0 < λ
(2.44)
Similar to other cases the material constants for base materials can be seen in Table
2.5.
Neo-Hookean Yeoh Mooney-Rivlin Humpheryc1 0.1462 3375.5× 10−5 0.6625 3171.5× 10−5
c2 - 0.139 −0.726 1.943c3 - −0.9875× 10⁻² - -R-squared 0.864 0.9985 0.9928 0.9959
Table 2.5: Material constants and R-square values of fit for four material models of passiveskeletal base material with modulus ratio of ∼ 1.
Here again, Yeoh’s model was selected because it is one of the simplest and at the
same time a very well fitted model. The value of κ in this case was also selected to
be 1×10⁶ for convergence up to 65% strain. There might be room to change the ratio
of longitudinal to transverse modulus to less than 1.0. However, the stiffer the base
material properties the lower the amount of the muscle bulge and fibre force transfer
to aponeurosis and tendon.
2.7.2 Selection of an appropriate ratio
As mentioned before, the muscle tissue is modelled as a transversely isotropic
material. The assumption of transverse isotropy means the base materials are

CHAPTER 2. MATHEMATICAL MODEL: DEVELOPMENT AND IMPLEMENTATION 37
3. 3.5 4
0
3000
6000
9000
12 000
15 000
18 000
3. 3.5 4.
0
3000
6000
9000
12 000
15 000
18 000
Str
ess
3. 3.5 4
0
3000
6000
9000
12 000
15 000
18 000
I1
A
B
C
Ratio ~1
Ratio ~10
Ratio ~100
Figure 2.3: Plots of stress vs the first invariant of the Cauchy-Green tensor. Comparisonof fitted Yeoh’s models (dashed black) for longitudinal to transverse ratio of ∼ 1 (A), ∼ 10(B) and ∼ 100 (C) with fitted Yeoh’s models to experimental data on compressive responseof the muscle tissue (gray). Gray curves represent the Yeoh’s models for the data fromBosboom et al. (dotted gray; [103]), Zheng et al. (dashed gray; [104]), Van Loocke et al.(solid gray; [105]) and Grieve and Armstrong (dash-dotted gray; [106]).

CHAPTER 2. MATHEMATICAL MODEL: DEVELOPMENT AND IMPLEMENTATION 38
isotropic and have to show similar responses in both in compression and extension.
In contrast, the fibres will show little to no resistance under compression, while in
extension, the majority of the whole tissue’s response is due to the mechanical
response of the fibres. As a result, the experimental data on the compression tests
on muscle tissue can be used to estimate the transverse (base) material properties
of the muscle tissue. On this basis, we compared the fitted Yeoh’s models for the
three longitudinal to transverse modulus ratios of 1, 10 and 100 (as described
above), to Yoeh’s models that we fitted to experimental data collected from muscle
tissue under compression (Figure 2.3; [103, 105, 106, 104]) to find the better ratio
out of the three ratios of longitudinal to transverse tensile response. Yoeh’s model
was chosen for the comparison since it had a good fit for all the three ratios. In other
words, we have assumed that the compressive response of the muscle tissue is a
good estimate of passive base material in the muscle tissue. Yeoh’s model for the
longitudinal to transverse ratio of 10, showed closer similarity to many of the
previously measured experimental data [105, 106, 104] than the 100 and 1 ratios
when plotted for I1 values between 3 and 4 that represent a range of 0.54 to 1.68 for
along-fibre stretch. In one case, the data from Bosboom et al. [103] on rat tibialis
stood out by showing higher stiffness in compression than most of the other studies.
(Figure 2.3)
For this thesis, we chose the material properties reflecting a ratio of 10 for the
longitudinal to transverse tensile properties as the passive base material properties
for the skeletal muscle tissue. This was mainly because most of the experimental
data were similar to this selection. Based on this, the base material strain energy
function we used in this thesis can be presented as:
Wbase,muscle :=
3∑i=1
ci(I1−3)i, c1 = 6.75×10⁻³ Pa, c2 = 2.78×10⁻² Pa, c3 = −1.9745×10⁻³ Pa.
(2.45)
It should be remembered that this strain-energy is normalized (in a similar way to
equation 2.40) and will be adjusted by multiplying σ0 when combined with the other
normalized components of the muscle tissue strain energy function. Also equation 2.43
represents the functional form of passive along-fibre stress-stretch curve (Figure 2.4) in

CHAPTER 2. MATHEMATICAL MODEL: DEVELOPMENT AND IMPLEMENTATION 39
0. 0.5 1. 1.5
0.
0.5
1.
1.5
Stretch
NormalizedStress
Figure 2.4: Passive along-fibre stress-stretch curve used by the model (normalized) for themuscle tissue (see equation 2.43).
this thesis.
2.7.3 Muscle fibre: Active properties
Muscle tissue differs from other soft tissues in that it can produce elevated forces when
activated. The production of this force in skeletal muscles is initiated when myo-filaments
(actin and myosin) attach by forming cross-bridges. The developed force is transferred
via intracellular and extracellular connective tissues to whole fibres, bundles of fibres and
finally to the aponeurosis and tendon of a muscle. Eventually, the tendon pulls on the
skeleton and possibly moves the limbs. The total force is dependent on the extent of
myo-filaments overlapping at the onset of activation (force-length property), how fast they
can slide past each other (force-velocity property) and finally how many cross-bridges are
attached based on calcium concentration inside the cell (activation level). These properties
of skeletal muscle fibres has frequently been measured and reported in literature and are
the three parameters needed for developing a Hill-type [20] model. The normalized stress-
stretch function for active along-fibre mechanical properties of skeletal muscle as describe

CHAPTER 2. MATHEMATICAL MODEL: DEVELOPMENT AND IMPLEMENTATION 40
in equation 2.40 is defined as:
σActive = α(T )σλσλ (2.46)
where α(t) is the activation function in time and has a value between 0 and 1, σλ in the
normalized isometric stress-stretch function and σλ is the the normalized stress-stretch
rate function.
If different activation levels in different regions of the muscle were needed, we modified
equation 2.46 to make the dependence on location explicit:
σActive = α(X, T )σλσλ (2.47)
The three functions describing along-fibre active stress-stretch are defined in the next few
sections.
2.7.4 Muscle fibre: Activation function
In this thesis we used a ramp function for activation. Therefore the only parameters
for the activation function are the onset of activation, activation slope, maximum level of
activity αmax and the region of activity. In the simplest instance, we can set α(X, t) = 0 for
inactive regions, and linearly increasing over the simulation time from zero to a selected
maximum level of activity in the remaining. However, this may result in abrupt transitions
in activity within the muscle, which may not be physiologically accurate. Instead, we used
combinations of arctan(X) functions to vary activity smoothly between regions which were
active and those which were not.
2.7.5 Muscle fibres: Normalized isometric stress-stretch
The normalized isometric stress-stretch in active muscle fibres is commonly known as
the force-length property. It is usually described in terms of the tetanic isometric force
of a fibre measured in different fixed lengths (stretches) after the passive force has been
subtracted. The active force-length property of a muscle fibre is usually described with
either a single quadratic [19] or a piecewise quadratic [59] function. The quadratic nature
of many of the proposed functions for this property is in contrast to its asymmetric nature
or predicts unusual amount of strain for the eccentric (descending limb) section of the

CHAPTER 2. MATHEMATICAL MODEL: DEVELOPMENT AND IMPLEMENTATION 41
0.5 0.75 1. 1.25 1.5 1.75
0.
0.25
0.5
0.75
1.
Stretch
NormalizedStress
Figure 2.5: Active along-fibre stress-stretch curve used by the model (normalized) for themuscle tissue (see equation 2.48).
curve. Here, the stress-stretch relation has been approximated (from Gordon et al. [18]
1966 data) fitting a continuous function based on the five first terms of a Fourier series
(Figure 2.5). The functional representation of the normalized active stress-stretch property
of fibres muscle for 0.55 ≤ λ ≤ 1.75 is:
λ = 0.534 + 0.229 cos(ωλ)− 0.095 cos(2ωλ) + 0.024 cos(3ωλ)
−0.021 cos(4ωλ) + 0.013 cos(5ωλ)− 0.421 sin(ωλ) + 0.079 sin(2ωλ)
−0.029 sin(3ωλ) + 0.013 sin(4ωλ) + 0.002 sin(5ωλ) (2.48)
with ω = 4.957. The value of this function the of stretch values λ ≤ 0.55 and 1.75 ≤ λ was
set to be zero.
• Normalized stress-stretch rate
A piecewise hyperbolic function was used to describe the normalized stress-stretch
property of muscle fibres. Since λ = ε + 1, strain rate (ε) is equal to stretch rate (λ). In
this thesis normalized stress-strain rate relations were adopted from Wakeling et al. (2012;
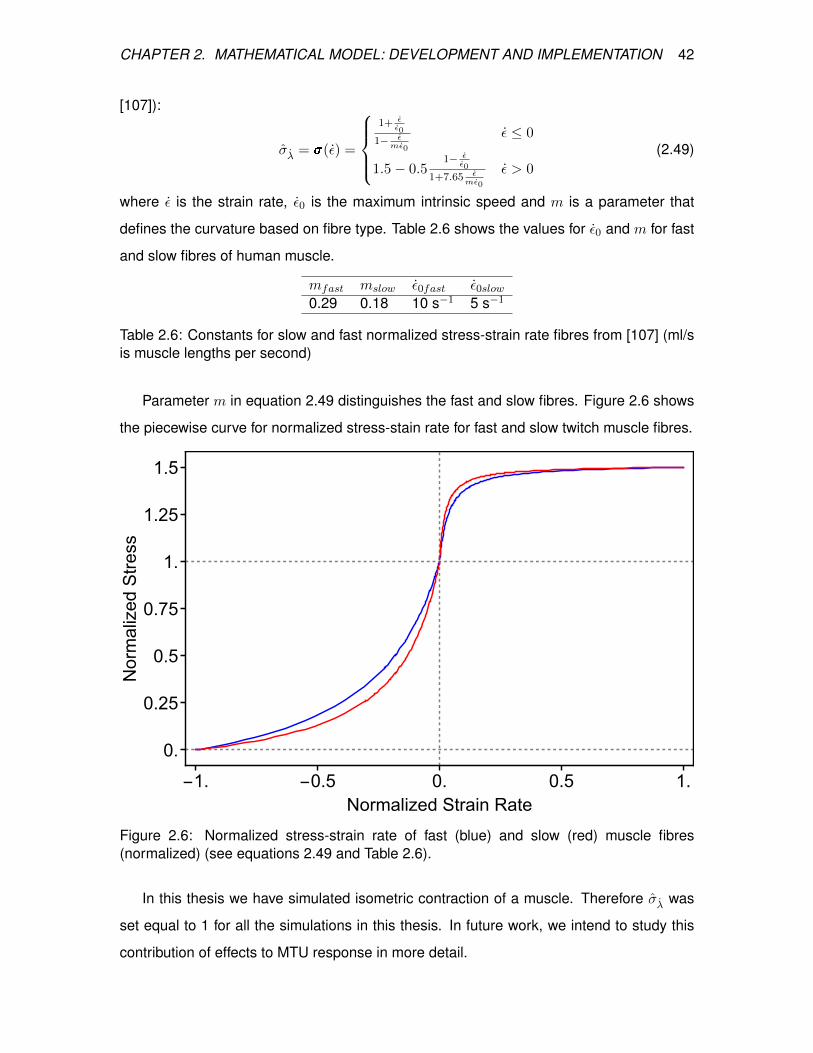
CHAPTER 2. MATHEMATICAL MODEL: DEVELOPMENT AND IMPLEMENTATION 42
[107]):
σλ = (ε) =
1+ ε
ε0
1− εmε0
ε ≤ 0
1.5− 0.51− ε
ε0
1+7.65 εmε0
ε > 0
(2.49)
where ε is the strain rate, ε0 is the maximum intrinsic speed and m is a parameter that
defines the curvature based on fibre type. Table 2.6 shows the values for ε0 and m for fast
and slow fibres of human muscle.
mfast mslow ε0fast ε0slow0.29 0.18 10 s−1 5 s−1
Table 2.6: Constants for slow and fast normalized stress-strain rate fibres from [107] (ml/sis muscle lengths per second)
Parameter m in equation 2.49 distinguishes the fast and slow fibres. Figure 2.6 shows
the piecewise curve for normalized stress-stain rate for fast and slow twitch muscle fibres.
-1. -0.5 0. 0.5 1.
0.
0.25
0.5
0.75
1.
1.25
1.5
Normalized Strain Rate
NormalizedStress
Figure 2.6: Normalized stress-strain rate of fast (blue) and slow (red) muscle fibres(normalized) (see equations 2.49 and Table 2.6).
In this thesis we have simulated isometric contraction of a muscle. Therefore σλ was
set equal to 1 for all the simulations in this thesis. In future work, we intend to study this
contribution of effects to MTU response in more detail.

CHAPTER 2. MATHEMATICAL MODEL: DEVELOPMENT AND IMPLEMENTATION 43
2.7.6 Adipose tissue (fat)
Fat was assumed to be a nonlinear isotropic material. The neo-Hookean strain energy
for fat (Wfat) was adopted based on modelling work on human breast tissue [108] and is
defined as:
Wfat = 0.13× 10⁶(I1 − 3) Pa, (2.50)
The adipose tissue (fat) had a larger stiffness than the isotropic muscle base material for
the lean muscle (equation 2.43).
The incompressibility constant, κ, for the volumetric part of the strain energy Wvol
(equation 2.15) was chosen to be κfat = 0.25 × 10⁶ for fat. This was based on the fat
compressibility properties used in modelling the human heel pad [109]. κfat had a smaller
value than the muscle tissue (κmuscle = 1.0× 10⁶) indicating that it is more compressible.
In Chapter 5, we will see in detail some models of fatty tissue, and numerical studies
based on these. For reasons described later, it is important for our code to be capable of
simulating regions with blended tissue-fat material properties. This functionality is built into
our code.
2.7.7 History Dependent Properties
The history dependent material properties are usually used to model physiological
changes that are dependent on the duration of activation, stimulation rate history and the
history of length changes. An example of history dependent material properties of the
skeletal muscle is force enhancement after muscle stretch [110]. The effect of these
properties in single tetanic contractions of a muscle are considered negligible. In this
thesis we have not included such effects, and leave this for future studies.
2.8 Discrete formulation and code.
We recall the three-field elasticity formulation derived in Section 2.2.4

CHAPTER 2. MATHEMATICAL MODEL: DEVELOPMENT AND IMPLEMENTATION 44
div (( (C(u))) + fb = ρ∂2
∂t2u (2.51a)
J(u) = J (2.51b)
p =δWvol(J)
δJ(2.51c)
The first of the three equations is the elasticity or equilibrium equation where ρ is body
mass density and t in ∂t2 represents time. In this study the applied body force fb ≡ 0. Also
we will solve for quasi-static contractions of the muscle and therefore ∂2
∂t2u ≡ 0. Since the
partial differential equation is not time-dependent (fb ≡ 0), we didn’t use a time-stepping
scheme.
We meshed the MTU using hexahedral elements in 3D. We used a discontinuous
Galerkin method for u, p and J . The finite element system consisted of three continuous
displacement degrees of freedom (DOFs) where elements had a polynomial degree of 1
(Q1), and discontinuous pressure and dilation DOFs where elements had a degree of 0
(DGQ0). The resultant non-linear system was solved using Newton-Raphson iterations,
and the linear solves within each Newton step were performed using a conjugate gradient
method.
2.8.1 Discrete form of equations
The residual for the set of unknown fields Ξ := u, J , p is equal to the differential of
the total potential energy (equation 2.10) and has the following form:
R(Ξ; δΞ) = DδΞU(Ξ) =∂U(Ξ)
∂uδu +
∂U(Ξ)
∂JδJ +
∂U(Ξ)
∂pδp (2.52)
We have to solve for the residual equation iteratively (Newton-Raphson method).
Therefore we assume that the system is known in an ith iteration and we want to find dΞ
so that
R(Ξi+1) = R(Ξi) +D2dΞ,δΞU(Ξi)dΞ = 0 (2.53)
Then by setting Ξi+1 = Ξi + dΞ the slope of the residual will have the form of
R(Ξi+1)−R(Ξi)
dΞ= DdΞR(Ξ; δΞ) = D2
dΞ,δΞU(Ξi) := K(Ξ; δΞ, δΞ) (2.54)
where K(Ξ; δΞ, δΞ) is the tangent matrix of the linearized problem and can be written as:
K(Ξ; δΞ, δΞ) = DduR(Ξ; δΞ)du +DdJR(Ξ; δΞ)dJ +DdpR(Ξ; δΞ)dp (2.55)
CHAPTER 2. MATHEMATICAL MODEL: DEVELOPMENT AND IMPLEMENTATION 45
Therefore, for the ith iteration, the linearized equation will be:
K(Ξi)dΞ = F(Ξi) (2.56)
The explicit forms of DduR(Ξ; δΞ)du, DdJR(Ξ; δΞ)dJ , DdpR(Ξ; δΞ)dp, K(Ξi) and
F (Ξi) can be found in (http://www.dealii.org/developer/doxygen/deal.II/step 44.html).
Since there are no gradient (derivative) of J and p in the DdΞR(Ξ; δΞ) these two fields
can be condensed out and will make it easier to solve for the displacements.
The discretization and solution was performed within the deal.II finite element library
[111]. Our code is based on a modification of a code
(http://www.dealii.org/developer/doxygen/deal.II/step 44.html) by Pelteret and McBride.
This code was developed to compute the material response of a constant-parameter
neo-Hookean material. The complexity of MTU of course far exceeds that of a simple
block of neo-Hookean material. The code developed as part of this thesis includes, as
discussed, tissues of different constitutive properties, capable of supporting activated
fibres, and varying material properties; the code is available as a supplementary
electronic document to the thesis (see appendix A).
2.8.2 Mesh generation
For this thesis, we meshed the ”STL” geometry surfaces generated by a mechanical
design software. For example, designed simplistic geometry for human gastrocnemius
muscle was meshed in IA-FEMesh (3D meshing software developed in the university of
Iowa). We could also use STL files that have been measured and reconstructed from real
tissue scanning by a coordinate-measuring machine. However, due to the nature of the
questions that were studied we only used the simplistic geometries in this thesis. Mesh-
generation can also be performed within the deal.ii environment if desired.
The meshed geometry (Figure 2.7) was exported as an ABAQUS input file. The file was
then changed with a deal.II script to a grid file that is importable into the main code.
Upon importing the grid in the main script, there are tools in deal.II C++ libraries where
it is possible to further refine or change the mesh.
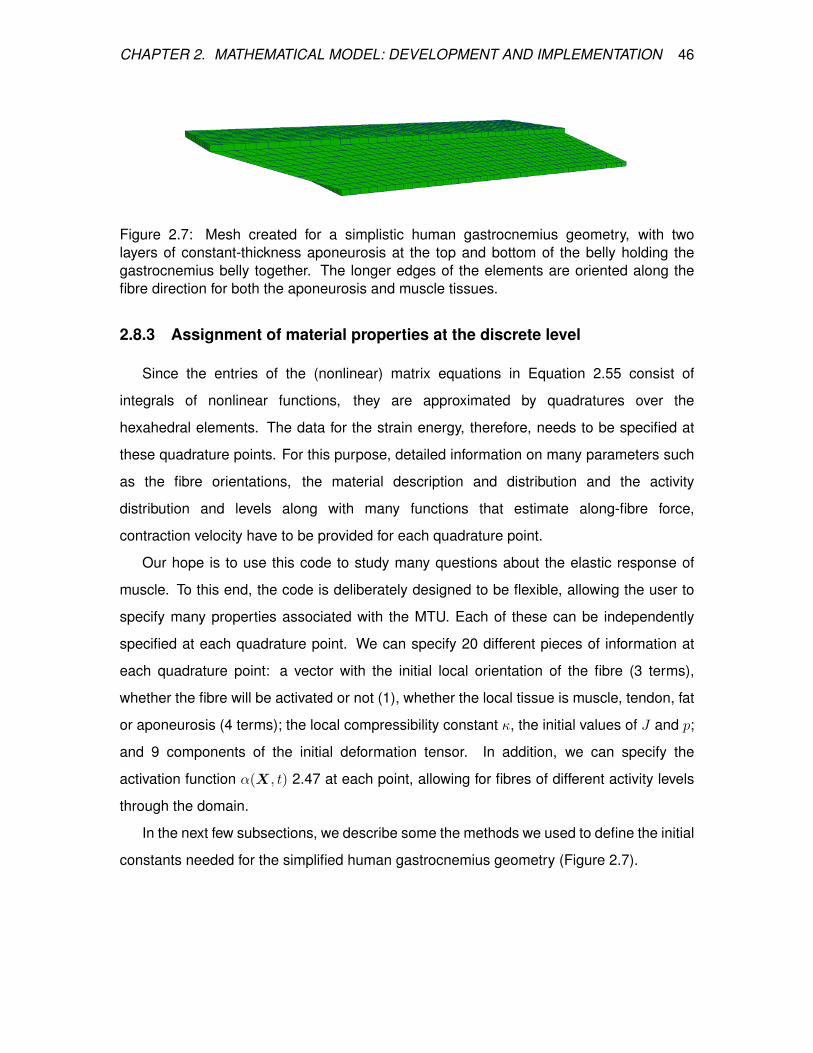
CHAPTER 2. MATHEMATICAL MODEL: DEVELOPMENT AND IMPLEMENTATION 46
Figure 2.7: Mesh created for a simplistic human gastrocnemius geometry, with twolayers of constant-thickness aponeurosis at the top and bottom of the belly holding thegastrocnemius belly together. The longer edges of the elements are oriented along thefibre direction for both the aponeurosis and muscle tissues.
2.8.3 Assignment of material properties at the discrete level
Since the entries of the (nonlinear) matrix equations in Equation 2.55 consist of
integrals of nonlinear functions, they are approximated by quadratures over the
hexahedral elements. The data for the strain energy, therefore, needs to be specified at
these quadrature points. For this purpose, detailed information on many parameters such
as the fibre orientations, the material description and distribution and the activity
distribution and levels along with many functions that estimate along-fibre force,
contraction velocity have to be provided for each quadrature point.
Our hope is to use this code to study many questions about the elastic response of
muscle. To this end, the code is deliberately designed to be flexible, allowing the user to
specify many properties associated with the MTU. Each of these can be independently
specified at each quadrature point. We can specify 20 different pieces of information at
each quadrature point: a vector with the initial local orientation of the fibre (3 terms),
whether the fibre will be activated or not (1), whether the local tissue is muscle, tendon, fat
or aponeurosis (4 terms); the local compressibility constant κ, the initial values of J and p;
and 9 components of the initial deformation tensor. In addition, we can specify the
activation function α(X, t) 2.47 at each point, allowing for fibres of different activity levels
through the domain.
In the next few subsections, we describe some the methods we used to define the initial
constants needed for the simplified human gastrocnemius geometry (Figure 2.7).

CHAPTER 2. MATHEMATICAL MODEL: DEVELOPMENT AND IMPLEMENTATION 47
Fibre orientation
The direction of muscle fibres in the muscle belly or collagen fibres in tendon and
aponeurosis was accounted for in the strain energy function by having (a0) in the
formulation (e.g. see equation 2.13). As desceibed above, the C++ code developed in this
thesis allows the user to input the direction of fibres as unit vectors for each quadrature
point. For the problems studied in this thesis we have mostly used simple fibre
orientations (see Chapters 3-5 for more details). However, fibre orientations have been
measured and reconstructed from ultrasonography (e.g [14, 13, 112]) or DT-MRI
images(e.g [113]). In future work, these fibre orientation maps can be used to specify the
local orientations within our simulation code. For this purpose we generated a MATLAB
script that imports the orientations from the image processing done on ultrasonography
images, fits a 3D vectors field to the data and finally estimates fibre orientation in every
quadrature point of a grid developed from a realistic geometry. The specific questions of
this thesis didn’t require the use of this script but it can be used in future works.
Material constants
In order to select stress-stretch properties representing each tissue at the quadrature
points we introduced a constant coefficient for each material property function in the code.
These constants can have values between 0 or 1 based on the percentile of the property
each part of the geometry inherits from the individual soft tissues modelled in this thesis.
For example, for the tendon tissue these constants will have a values of 1 for functions
describing tendon material properties and 0 for the rest of material functions defied in the
code. If a blended material were to be chosen for a specific region (e.g. muscle-tendon
junction) these constants may hold values between 0 and 1. For example a part of the
material which has 85% muscle fibre and 15% fat mechanical properties (if physiologically
relevant) will hold constant values of 0.80 for muscle material functions and 0.2 for fat (see
Chapter 5) while the rest are kept equal to 0. These values are assigned to each integration
point in the geometry.

CHAPTER 2. MATHEMATICAL MODEL: DEVELOPMENT AND IMPLEMENTATION 48
Activation constants
Similar to importing fibre orientation and material constants, activation constants are
imported for every integration point. Import of the activation parameters allows for
calculating the activity level using the built-in activation function in each muscle integration
point. This allows for the activity level in the muscle tissue to be a function of both time
and space (region(s) of the muscle belly). In this thesis we used a constant parameter
that is a number between 0 and 1 for a ramped activation function through time. For future
purposes, however, it is easy within the code to use functions with varying onset times of
activation or non-constant and time-dependent changes in activation level.
2.9 Model Validations
2.9.1 Computational validation
In order to validate the mathematical framework and the solver accuracy, we tested
our code by calculating the result for the same physical condition under four consecutive
element refinements. For this purpose we built a rectangular cube with 8× 1× 1 mm3
dimensions as the test geometry. Four sets of simulations with four levels of refinement
(8, 64, 512 and 4096 elements) were performed. In each set, a combination of specific
material, loading and boundary conditions was considered. The displacement along the
length of the cube was used to compare simulation results of the four grid sizes in each
set. The following describes each set of simulations and the results are brought in tabular
form.
1. Nonlinear elastic and nearly incompressible isotropic material: The geometry
was fixed at one end (z-direction normal; Dirichlet boundary with u = 0) and was
pulled with a force ramping up through time (Neumann boundary) at the other end.
The displacement along the z-direction was compared after 1 second of simulation
(Table 2.7) including 10 time-steps for each of the four levels of mesh refinement. of
a nonlinear neo-Hookean material as the material filling the geometry. In this case,
the difference between the responses were also quite small as the linear elasticity
simulation set.

CHAPTER 2. MATHEMATICAL MODEL: DEVELOPMENT AND IMPLEMENTATION 49
Grid size z-Displacement (mm) error (|z − z∗|) p in O(hp)
8 0.33569 0.01369 2.0635764 0.34640 0.02880 2.81323512 0.34352 0.00031 3.885154096 0.34321 - -
Table 2.7: Displacement of the pulled end of the 8× 1× 1 mm3 cube with Neo-Hookeanmaterial (Lame constants µ = 80× 106 and ν = 0.49) in z-direction for 10 MPa of extensiveload.
2. Transversely isotropic passive muscle tissue material: The second set was also
similar to the first set in boundary and loading conditions. However, this set was
performed with a passive skeletal muscle material properties for the rectangular
block. The z-direction displacements were compared again to evaluate the system
performance with passive and transversely isotropic tissue (Table 2.8).
Grid size z-Displacement (mm) error (|z − z∗|) p in O(hp)
8 0.70589 0.00193 1.8964364 0.71814 0.00713 2.37729512 0.72307 0.00220 2.941454096 0.72527 -
Table 2.8: Displacement of the pulled end of the 8× 1× 1 mm3 cube with passive musclematerial in the z-direction (along-fibre) for 10 KPa of extensive load.
The difference in z-displacements are once again small. This confirms the
mathematical validity of the system for solving problems with transversely isotropic
material in passive state.
3. Transversely isotropic active muscle tissue material: In this set of simulations
the rectangular cube of muscle used in the previous set was activated by ramping up
the activity level in the muscle tissue. The difference here was that beside the fixed
end of the cube, the other end was left free of traction so the cube could contract
and shorten upon activation. The z-displacemet was used to compare the results
of the simulations as before (Table 2.9). Additionally, we ran the four simulations
with a time-step of half of the original simulations in this set. This was performed
to show that muscle contraction is stable when activated with different time-stepping
(Table 2.9). The difference within each group of simulations with the same time-step
and between same grid sizes of different time-stepping groups were still small. This

CHAPTER 2. MATHEMATICAL MODEL: DEVELOPMENT AND IMPLEMENTATION 50
Time-step (s) Grid size z-Displacement(mm)
error(|z − z∗|)
p in O(hp)
0.018 -2.07581 0.5883 0.2551264 -2.19712 0.06248 1.33348512 -2.14112 0.00648 2.423264096 -2.13464 - -
0.0058 -2.07581 0.5883 0.2551264 -2.19712 0.06248 1.33348512 -2.14112 0.00648 2.423264096 -2.13464 - -
Table 2.9: Displacement of the free end of the 8× 1× 1 mm3 cube with activated musclematerial in the z-direction (along-fibre).
verifies the robustness of the system for modelling active muscle tissue.
4. Active muscle tissue material with two regions of activity: As described in
section 2.7 in case of different levels of activity at different regions we used
combinations of arctan(X) functions to vary activity smoothly between regions that
were active and those which were not. This was mainly because in presence of two
adjacent regions where one could active and the other was completely inactive at all
times, upon activation of the activable region, an impulse is created at the boundary
of the two regions. This leads to mathematical difficulties. Also, in real tissues
activation regions do not vary over infinitesimal length scales. Therefore, to avoid
potentially unphysiological behaviour, we chose the arctan(X) functions for
prescribing a smooth transition between the two regions.
In this next set of simulations we tested four different activity transition functions
on the rectangular block of 512 elements. Like the previous set of simulations, the
block of muscle was fixed at one end but the activity changed half way through the
muscle. This means the activity in the half of the cube closer to the fixed end was
scaled by the portion of arctan(X) ∼ 1 and the activity in the other half (free end)
was scaled by arctan(X) ∼ 0. The transition period (0.05 ≤ arctan(X) ≤ 0.95) could
span different number of elements. The effect of this transition span on the output
of muscle contraction was tested for an approximately 1, 2, 4 and 16 elements span
sizes (Table 2.10).
The results show that when the span size is relatively small compared to the
geometry, there is a small difference in converged solution while it allows the model
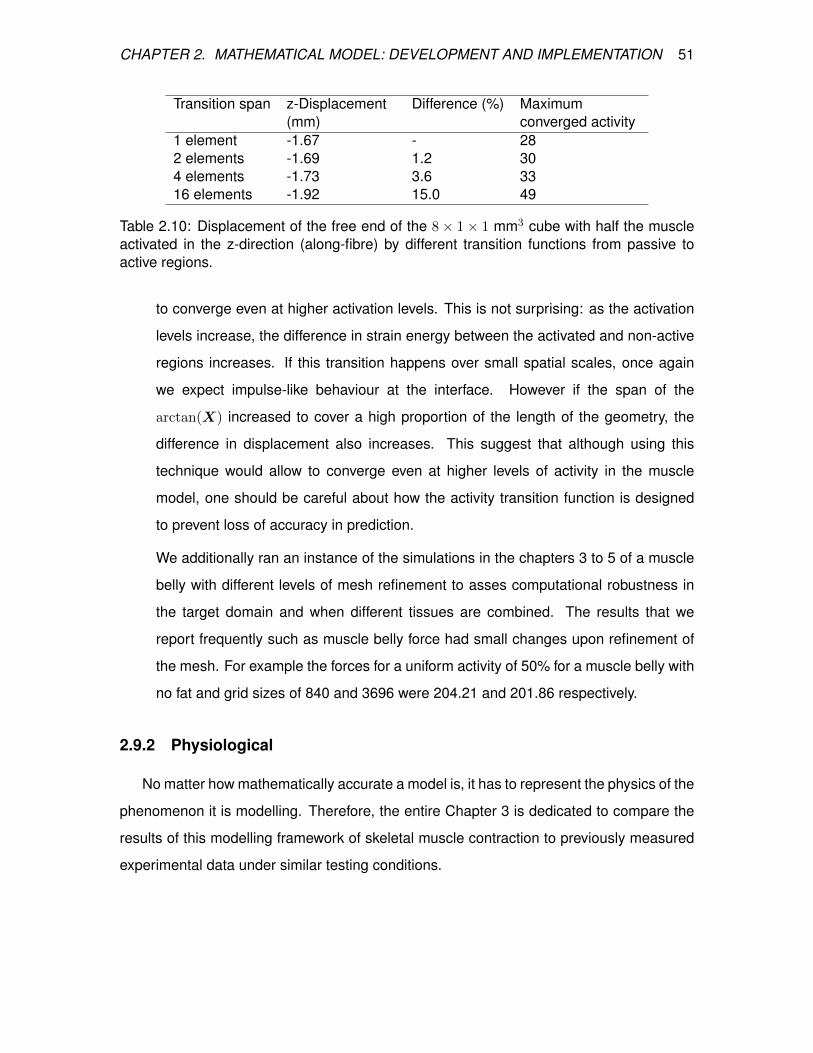
CHAPTER 2. MATHEMATICAL MODEL: DEVELOPMENT AND IMPLEMENTATION 51
Transition span z-Displacement(mm)
Difference (%) Maximumconverged activity
1 element -1.67 - 282 elements -1.69 1.2 304 elements -1.73 3.6 3316 elements -1.92 15.0 49
Table 2.10: Displacement of the free end of the 8× 1× 1 mm3 cube with half the muscleactivated in the z-direction (along-fibre) by different transition functions from passive toactive regions.
to converge even at higher activation levels. This is not surprising: as the activation
levels increase, the difference in strain energy between the activated and non-active
regions increases. If this transition happens over small spatial scales, once again
we expect impulse-like behaviour at the interface. However if the span of the
arctan(X) increased to cover a high proportion of the length of the geometry, the
difference in displacement also increases. This suggest that although using this
technique would allow to converge even at higher levels of activity in the muscle
model, one should be careful about how the activity transition function is designed
to prevent loss of accuracy in prediction.
We additionally ran an instance of the simulations in the chapters 3 to 5 of a muscle
belly with different levels of mesh refinement to asses computational robustness in
the target domain and when different tissues are combined. The results that we
report frequently such as muscle belly force had small changes upon refinement of
the mesh. For example the forces for a uniform activity of 50% for a muscle belly with
no fat and grid sizes of 840 and 3696 were 204.21 and 201.86 respectively.
2.9.2 Physiological
No matter how mathematically accurate a model is, it has to represent the physics of the
phenomenon it is modelling. Therefore, the entire Chapter 3 is dedicated to compare the
results of this modelling framework of skeletal muscle contraction to previously measured
experimental data under similar testing conditions.
CHAPTER 2. MATHEMATICAL MODEL: DEVELOPMENT AND IMPLEMENTATION 52
2.10 Summary
In this Chapter a we described the mathematical formulation for simulating the
behaviour of the tissues in a muscle-tendon unit. The choice material properties for
different tissues were described and formulated to be used in the next Chpaters. In
addition, the techniques developed to assign the material constant to the each part of the
geometry was introduced. Finally, four set of simulations were performed on a simple
geometry to assess the mathematical robustness and accuracy of the proposed system.

Chapter 3
Muscle model: Physiological
validation and numerical
experiments
3.1 Introduction
Forces developed by contracting skeletal muscle depend on the structure and
geometry of the contracting fascicles, and their interaction with the surrounding
connective tissues. Recent studies have highlighted the complexity of the internal
structure of the muscles in 3D, and the changes to this structure during contraction (e.g.,
[112]). However, relatively little is known about the mechanisms that relate the structure to
function. It is likely that regional variations in muscle structure, tissue properties and
activation patterns all contribute to the force output from the muscle. In order to
understand such effects it is necessary to use a muscle model that can incorporate these
complexities. An efficient way, in terms of both time and cost, to test these effects would
be with a 3D finite element simulation platform based on a realistic mathematical model of
muscle.
Muscle models and their related simulations have evolved over the last decade to
incorporate 3D structural and architectural parameters such as fascicle orientations and
connective tissue properties (e.g., [69, 59, 70]). Features such as fascicle activation
patterns, structural changes (for instance changes in fascicle curvature and orientation)
53

CHAPTER 3. MUSCLE MODEL: PHYSIOLOGICAL VALIDATION AND ... 54
under isometric and dynamic contractions and their effects on the force and power
generated by the whole muscle have been investigated in a number of previous works
(e.g., see Chapter 4 and [36]). While recent developments in imaging and signal
processing techniques are enhancing our ability to measure detailed structure [114, 112]
and activation profiles (e.g., [115, 116, 117]) in a muscle, all the intended parameters may
be hard or impossible to collect in a single experiment. Therefore, there is a need to use
mathematical models to get insight into muscle function where large number of
parameters can be manipulated or measured during a simulation of muscle contraction.
Here we present the results of 3D finite element simulations of a skeletal muscle
model that has been developed specifically to investigate the relation between the
muscle’s internal structure and activation patterns and its force output. The model has the
ability to include detailed 3D architecture and regionalized submaximal activity in different
groups of fascicles. It integrates the effects of different tendon and aponeurosis properties
on the force transfer within the muscle-tendon unit from its origin to insertion.
Furthermore, we have previously shown that this mathematical modelling framework can
predict the deformations of the internal structure within the muscle, and the force vector
developed by the whole muscle, while the activity patterns within the muscle can be
varied and regionalized (see Chapter 4).
The main purpose of this chapter is to present the validity of this modelling framework
using different sets of experimental data. A validated computational model of muscle can
be used to test mechanisms and investigate the effect of parameters that are difficult or
impossible to measure. The second purpose of this chapter is to demonstrate some of the
effects of the tendon and aponeurosis properties on the structural properties of the muscle
during contraction.
3.2 Methods
The mathematical framework for this work was described in Chapter 2. The
computational model was validated by comparing the force-length properties of the whole
muscle to experimental measures, and also by comparing the shape, orientation and
curvature of the modelled muscle fascicles to similar measures that have recently been
made available through ultrasound imaging studies. The comparisons will be done on the
CHAPTER 3. MUSCLE MODEL: PHYSIOLOGICAL VALIDATION AND ... 55
data from human gastrocnemius muscle, one of the muscles in the calf that acts to flex
the knee and extend the ankle joint in humans. Gastrocnemius muscle has two heads:
medial (MG) and lateral (LG). Each head can be considered a unipennate muscle that
insert onto common Achilles tendon.
A unipennate muscle belly geometry of human gastrocnemius (Figure 3.1) was created
for the numerical experiments (Dimensions mostly from Randhawa et al., 2013 [118]). The
model geometry had a regularized shape to help constrain model variants and results
to the conceptual questions which are the focus of this thesis, rather than allowing the
model to respond to idiosyncrasies of individual geometries. The dimensions, as well as
the structural and material properties of the model were styled to be consistent with those
of the gastrocnemius (lateral or medial head) in humans. The soft tissues were treated
as transversely isotropic hyperelastic materials. The muscle-aponeuroses complex was
meshed by a grid of hexahedral elements. The model coordinate system had the z-axis
running proximal-distal the line of action of the muscle, the y-axis ran from the deep to the
superficial direction and the x-axis ran across the medial-lateral width of the muscle. This
model had the same constitutive law that we described in Chapter 2. For this Chapter,
specific activation patterns and structural parameters along with mathematical boundary
and initial conditions were used. The end planes of the aponeuroses were defined as the
transverse planes where the aponeuroses would join onto the external tendons, and mark
the proximal and distal ends of the muscle belly. Some simulations were run for isometric
contractions of the muscle belly where the end planes of the aponeuroses were fixed.
Other simulations were run for the whole muscle-tendon unit with the external tendons
included: for these, the proximal and distal ends of the muscle-tendon unit were fixed
during contraction.
Simulations in this study were done using a set of C++ libraries for finite element
modelling (DEAL.II; [111]). Each simulation was run with an increasing and uniform level
of activation across all fascicles. The simulations were terminated when the nonlinear
iterations did not converge and specified tolerances within given number of steps; this
point depended on the initial state and boundary conditions for each simulation. Where
groups of simulations are compared together, they were compared up to the highest
activation level that was commonly achieved across the set. Each simulation took
approximately 10 minutes to run [on a standalone 8-core (16 thread) computer], and this
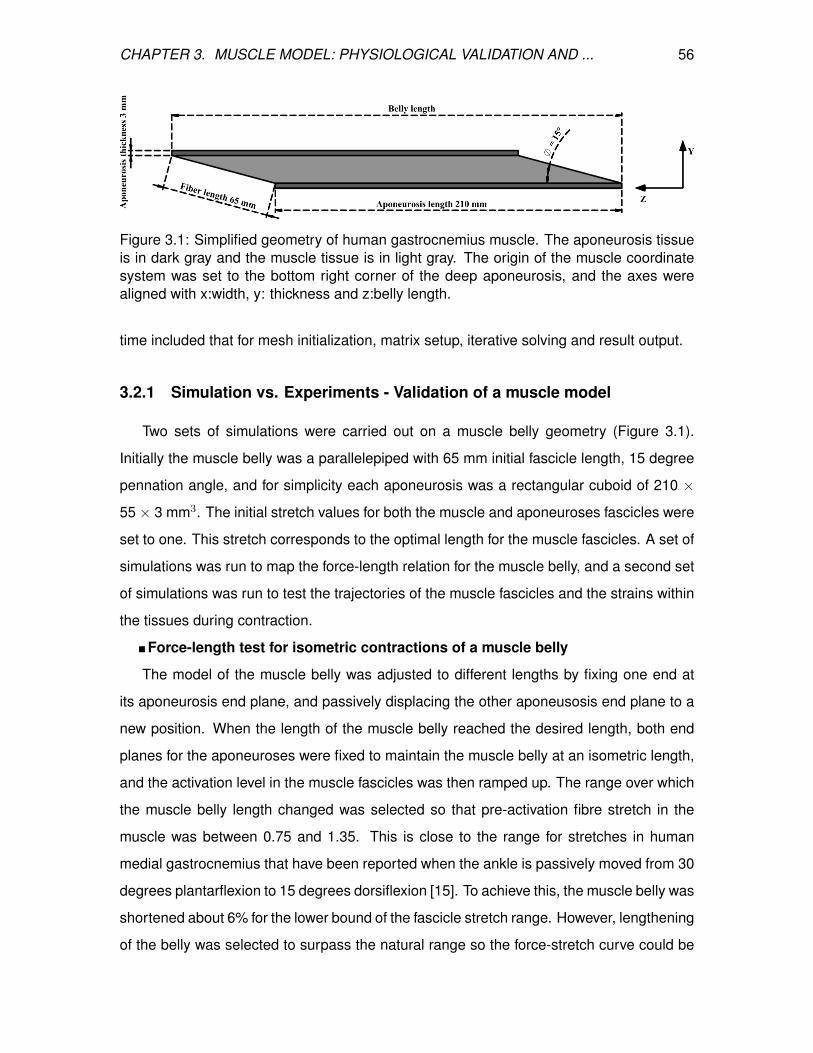
CHAPTER 3. MUSCLE MODEL: PHYSIOLOGICAL VALIDATION AND ... 56
Figure 3.1: Simplified geometry of human gastrocnemius muscle. The aponeurosis tissueis in dark gray and the muscle tissue is in light gray. The origin of the muscle coordinatesystem was set to the bottom right corner of the deep aponeurosis, and the axes werealigned with x:width, y: thickness and z:belly length.
time included that for mesh initialization, matrix setup, iterative solving and result output.
3.2.1 Simulation vs. Experiments - Validation of a muscle model
Two sets of simulations were carried out on a muscle belly geometry (Figure 3.1).
Initially the muscle belly was a parallelepiped with 65 mm initial fascicle length, 15 degree
pennation angle, and for simplicity each aponeurosis was a rectangular cuboid of 210 ×
55 × 3 mm3. The initial stretch values for both the muscle and aponeuroses fascicles were
set to one. This stretch corresponds to the optimal length for the muscle fascicles. A set of
simulations was run to map the force-length relation for the muscle belly, and a second set
of simulations was run to test the trajectories of the muscle fascicles and the strains within
the tissues during contraction.
Force-length test for isometric contractions of a muscle belly
The model of the muscle belly was adjusted to different lengths by fixing one end at
its aponeurosis end plane, and passively displacing the other aponeusosis end plane to a
new position. When the length of the muscle belly reached the desired length, both end
planes for the aponeuroses were fixed to maintain the muscle belly at an isometric length,
and the activation level in the muscle fascicles was then ramped up. The range over which
the muscle belly length changed was selected so that pre-activation fibre stretch in the
muscle was between 0.75 and 1.35. This is close to the range for stretches in human
medial gastrocnemius that have been reported when the ankle is passively moved from 30
degrees plantarflexion to 15 degrees dorsiflexion [15]. To achieve this, the muscle belly was
shortened about 6% for the lower bound of the fascicle stretch range. However, lengthening
of the belly was selected to surpass the natural range so the force-stretch curve could be
CHAPTER 3. MUSCLE MODEL: PHYSIOLOGICAL VALIDATION AND ... 57
plotted for a longer range. The simulations at different lengths reached a common activity
level of 30%. The magnitude of the passive and total belly forces were computed along
with the muscle fascicle lengths at which those forces were developed. The active muscle
force was taken as the difference between the total force and the passive force for a set of
common muscle fascicle lengths.
Internal structural changes during isometric contractions of the muscle belly
Both end planes of the aponeuroses for the initial geometry were fixed and the
activation was uniformly ramped up. Geometrical properties of fascicles both in 2D
(fascicle curvature) mid-longitudinal and transverse planes (Figures 3.2, 3.3) and 3D
(fascicle path, along-fascicle and transverse strains) were measured at different activity
levels (Figure 3.4 and Table 3.1). Undeformed fascicles (Figures 3.2, 3.4) were chosen as
groups of points that fit along lines that connect the two aponeuroses and have 15
degrees inclination (pennation) in the initial geometry. These fascicles were then tracked
throughout all simulations to measure the structural deformations at the fascicle level. The
mean pennation and curvature of the fascicles along with the along-fascicle (longitudinal)
and transverse strains were extracted from the deformed fascicle data after the
contractions had been simulated. The extent of fascicle curvature across the whole
muscle belly in its mid-longitudinal plane was quantified by its root-mean-square (RMS)
value for each activity level (% MVC). Fascicle sheets were defined as the 3D faces that
run longitudinally through muscle and contain fascicles that were originally in the same
YZ-plane of the undeformed geometry. Figure 3.2B shows the intersection of these
sheets with the mid-transverse plane.
3.2.2 The effect of tendon and aponeurosis properties on structural
changes of the muscle tendon unit
Proximal and distal tendons were attached to the geometry of the muscle belly, where
the distal tendon mimics the Achilles tendon. Both tendons had the same thickness and
width as aponeuroses, but had lengths of 20 and 160 mm for the proximal and distal
tendons, respectively. Initial tests showed considerable rotations of the muscle belly during
contraction as the aponeuroses end planes aligned along the line-of-action of the whole
muscle tendon unit (Figure 3.5). To minimize this rotation, the deep aponeurosis (that was
attached to the distal tendon) was constrained to not move any more in a deep direction

CHAPTER 3. MUSCLE MODEL: PHYSIOLOGICAL VALIDATION AND ... 58
Figure 3.2: Geometry of the muscle fascicles within the muscle belly (A), shown for theirmid-transverse (B) and mid-longitudinal (C) planes. The frames with black fascicle linesare in a relaxed state and the frames with red fascicle lines belong to muscle fascicles ata 40% activity level. The active fascicles show a decrease in thickness and an increasein width in the longitudinal and transverse sections, respectively. Note that the fascicles inthe longitudinal section (fascicle plane) are mostly curved to S-shapes in the active state.
during contraction. The free end of proximal tendon was fixed and the free end of the distal
tendon was pulled about 0.2% of the total muscle-tendon unit length as an initialization step
to settle the system into a initially stable structure. It was then fixed to keep the muscle-
tendon unit isometric. Two situations were investigated: (1) the tendon and aponeurosis
had the same material properties that were equal to the tendon properties, and (2) the
tendon and aponeurosis had distinctive material properties as seen in Chapter 2. These
simulations achieved a common activation level of 10%, and the patterns of aponeurosis
and tendon strains were compared for the two material formulations.
3.3 Results
The force-length properties for the contracting muscle belly are shown in Figure 3.6
along with selected data from experimental studies on human muscle. As the muscle was
activated, the stretch in the connective tissues allowed the fascicles to shorten, and so
the fascicle lengths were different between the active and passive states. Plots shown in
Figure 3.6 are all for equivalent fascicle lengths, and so the active force was calculated by
subtracting the passive force at a slightly longer belly length away from the total force for

CHAPTER 3. MUSCLE MODEL: PHYSIOLOGICAL VALIDATION AND ... 59
a contracting muscle. The total and active muscle belly force showed a peak for fascicle
stretch of 1, however, the overall shapes of the active and passive plots for the muscle
belly were different from the plots for purely muscle fascicles due to the effects from the
aponeurosis, muscle structure and pennation.
Figure 3.3: Intensity map showing the magnitude of the fascicle curvature for 30 and 60%activity. Mid-longitudinal plane fascicle curvature map after contraction has been simulated(A). Curvature map for a similar fascicle plane experimentally measured in human MG [114](B).
This modelling shows that the belly force and fascicle pennation becomes larger when
the activation state of the muscle belly increases. In the current study the pennation also
increased when the belly was passively shortened, and decreased when the belly was
passively lengthened. The range of pennation for passive and 30% active belly were 11.6-
19.3 degrees and 13.4-21.2 degrees, respectively, as the belly length was reduced.
The muscle fascicles in the gastrocnemius belly, changed from their initially straight
configuration to a curved state during contraction. The fascicles showed an S-shaped
profile in the mid-longitudinal plane (Figure 3.2) with the fascicles intersecting with the
aponeurosis at a lower angle than their mean orientation would predict. These curvatures
profiles match those that have previously been reported from experimental studies using
ultrasound-based imaging [114], and both are shown in Figure 3.3). The magnitude of
the fascicle curvatures increased as the contraction level increased, and the increases in
curvature matched the increases experimentally observed in contracting MG [114] (Figures
3.3, 3.7).
Strain measures for muscle tissue in the centre of the muscle belly are shown for an
isometric contraction at 40% in Table 3.1 along with experimentally measured values [119].

CHAPTER 3. MUSCLE MODEL: PHYSIOLOGICAL VALIDATION AND ... 60
Figure 3.4: 3D paths of three fascicles crossing the mid-transverse plane. Each fascicle isplotted for 0 (green), 30 (blue) and 60% (red) activity levels. The arrows show the normalsto a medial/lateral fascicle at 30% activity and are coloured by their azimuthal angle wherethe azimuthal angle is the angle between the projection of the fascicle path in the xy-planewith the x-axis. The change in azimuthal angle from 80 (yellow) to 99 degrees (red) showsthat the fascicle sheets curve away from the centre of the muscle belly.
The transverse strains in the fascicle (mid-longitudinal:yz) plane were much smaller than
the strains normal to this plane. The Poisson’s ratio in the fascicle plane was calculated
as the magnitude of the ratio between transverse and along-fascicle strains in the mid-
longitudinal plane and was 0.089.
The fascicle sheets bulged in both medial and lateral directions when the muscle belly
contracted (Figures 3.2, 3.4), and the bulge increased as the activity level rose. The path
of the fascicles in 3D showed them running along the fascicle sheets as they bulged, and
thus formed a part of a helix (demonstrated by their varying azimuthal angle along their
length (Figure 3.4).
When the whole muscle-tendon unit was simulated (with the external tendons
included), the muscle belly showed substantial rotations as the aponeurosis end planes
aligned to be closer to the line-of-action of the muscle (Figure 3.5). Subsequent
simulations of the MTU constrained the deep aponeurosis to not displace any deeper, and
this forced the bulging of the muscle belly to be in the superficial direction. This was to

CHAPTER 3. MUSCLE MODEL: PHYSIOLOGICAL VALIDATION AND ... 61
Figure 3.5: Displacement of whole muscle-tendon unit when activated without deep orsuperficial constraints.
emulate a simplified set of constraints that occur on the MG within the intact leg. The final
simulations (Figure 3.8) showed that when a stiffer aponeurosis was used instead of
adopting tendon properties, the strains in aponeurosis were smaller. Also the strains in
the muscle tissue were more uniform when a stiffer material for the aponeurosis was
used.
3.4 Discussion
Validating a mathematical framework and numerical implementation of it for human
muscle is a challenge, due in part to the fact that muscle forces cannot be directly
measured in vivo. In this study we have compared the force output from a computational
Parameter Values
Along-fascicle (longitudinal) strain (%) - simulation -8.22Transverse (cross-fascicle) strain (%) - simulation 0.74Out of plane (width) strain (%)- simulation 7.83Mid-longitudinal plane Poisson’s ratio - simulation 0.089Poisson’s ratio - in-vivo [119] 0.09±0.01
Table 3.1: Along-fascicle and transverse strains for fascicles in the middle of the musclebelly for 40% activity (Fig.3.2). The Poisson’s ratio in the mid-longitudinal plane iscalculated as the magnitude of the ratio of the transverse (cross-fascicle) to the along-fascicle strain. The last row shows the measured Poisson’s ratio from 2D ultrasoundimages in the mid-longitudinal plane of the MG during dynamic contractions [119].
CHAPTER 3. MUSCLE MODEL: PHYSIOLOGICAL VALIDATION AND ... 62
3D FEM model with the forces estimated from studies of ankle joint flexion-extension
experiments. The general pattern of the force-length relationship generated by the model
matches those from the experimental studies. Experimental measures can identify the
overall shape of the muscle with MRI [122] and even the internal trajectories of the muscle
fascicles using diffusion-tensor MRI [123, 124, 125]. While this information is very
important, the relatively long scan times of MR imaging preclude such measurements for
active contractions [13]. However, the aim of the presented muscle model is to
understand the mechanisms occurring during muscle contractions. It is therefore
important to validate the muscle model in its contracted state. For this study we have
used ultrasound-based measures from the literature [114, 112] of the internal structure
during contraction (fascicle orientations, curvatures, and strains) to validate the model.
The simulations in this thesis had a simplistic initial geometries that had the overall
dimensions and mean fascicle pennation of the MG in man, but without the details of the
geometry or internal structure. Furthermore, all the muscle fascicles within the model had
the same material properties and thus represented the same fibre-types. Additionally, the
activation was uniform across all fascicles: again these are gross simplifications
compared to the physiological complexities and variations that occur within muscles
in-vivo. Nonetheless, the emergent features from the model showed a remarkable
similarity to the experimental measures that are available for comparison. This gives
confidence that the model can identify general features and consequences of the muscle
structure that were not a result of idiosyncrasies or muscle-specific details of geometry,
structure or activation.
Intramuscular pressure develops within muscles during contraction [126, 127, 128],
and the fascicles curve around the regions of higher pressure. Previous modelling studies
[65, 129] have shown how the curvatures in both the muscle fascicles and aponeurosis
must balance the intramuscular pressure, and indeed our current model shows curvatures
developing in both of these structures. However, in the previous studies the curvatures of
the muscle fascicles were constrained to be constant along their lengths, whereas this
was not a constraint in the current model. The muscle fascicles in the current model
started straight in their initial configuration, but developed S-shaped profiles when
quantified in the mid-longitudinal plane. Both the S-shaped profiles and the magnitude of
the increases in curvature that occurred with increasing activity and muscle force mirror
CHAPTER 3. MUSCLE MODEL: PHYSIOLOGICAL VALIDATION AND ... 63
those that we have previously been imaged for the MG using B-mode ultrasound
[114, 112]. A consequence of the S-shaped trajectories is that the angle at which the
fascicles insert onto the aponeurosis can be reduced, allowing for a greater component of
traction in the line of action of the whole muscle along the direction of the aponeuroses.
When tracked in 3D, the muscle fascicles followed curved paths on their fascicle sheets
indicating that change in architecture is not simply due to a bulge of the sheets. The
active configuration of these fascicles indicate that S-shaped fascicles in 2D curvature
maps (Figure 3.3) are not only the result of projecting the fascicles on a 2D plane (e.g
[130]) but comes from curling of the fascicles in a helical path. These 3D helical paths are
curved around the centre of the muscle (Figure 3.4) where the intramuscular pressure is
higher.
It is generally assumed that muscle fascicles are isovolumetric [84], and isovolumetric
assumptions dictate the relation between longitudinal and transverse strains. Poisson’s
ratio is the absolute value of ratio of the transverse to the longitudinal strain, and should
be 0.5 for small strains in an incompressible and elastic material. The simulations in this
study showed that as the activation increased, the transverse strain (in the mid-longitudinal
plane) was lower than expected, resulting in a Poisson’s ratio of 0.089, however this was
compensated for by greater transverse strains in the orthogonal direction (Table 3.1). The
muscle fascicles were represented as transversely isotropic materials in this model, and
so the asymmetry in their transverse bulging must reflect asymmetries in the transverse
stresses acting on the fascicles. Being a unipennate model, there would have been a larger
compressive force in the mid-longitudinal plane that was bounded by the aponeuroses
that were being squeezed together by the pennate fascicles, than in the medial-lateral
direction where there was no aponeurosis bounding the muscle. Indeed, the model showed
muscle belly bulging to its sides, but decreasing in its thickness between the aponeuroses
during contraction, in a similar manner to the decreases in thickness observed for the
MG in vivo [118]. Recently the transverse bulging of the muscle fascicles in the MG has
been quantified from B-mode ultrasound images [119], showing a Poisson’s ratio of 0.09;
this matches the simulated results and provides confidence that emergent features of the
model explain realistic features of muscle contraction.
When the model was evaluated with external tendons, there was a need to constrain
displacements of the geometry since the unconstrained simulation (Figure 3.5) showed a
CHAPTER 3. MUSCLE MODEL: PHYSIOLOGICAL VALIDATION AND ... 64
large displacement of the muscle in the y-direction. This illustrates that a range of
additional boundary constraints may need to be applied to finite element models of
muscle-tendon units in order to result in more realistic deformation.
In the case that the aponeurosis and tendon were given the same material properties
a pattern of non-uniform strains resulted in the aponeurosis. This non-uniformity in strain
is similar to that observed in previous experiments [131, 132], but our modelling study
shows this can be an emergent feature of the muscle, and not necessarily due to
differences between active and inactive motor units in submaximally activated muscle, as
has been previously suggested [131]. The aponeurosis strains were smaller than the
tendon strains for both formulations of material property (Figure 3.8). Although there is an
obvious jump in strain between the tendon and aponeurosis when a stiffer material is
used for the aponeurosis, the difference in strains was less than 2%. A benefit of using a
stiffer aponeurosis material compared to tendon, would be that a more uniform
distribution of strains occurs in the fascicles, and this would allow the fascicles to have
more uniform sarcomere length.
The simulated results from this finite element model match the general patterns from
experimental and imaging results. Whole muscle force is partly shaped by the internal
geometry of the muscle fascicles, and their interactions with the aponeuroses, and so
cannot be explained entirely by modelling a muscle as a scaled-up muscle fibre [133].
As the fascicles shorten, they must increase in cross-sectional area in order to maintain
their volume, but asymmetric bulging occurs due to asymmetries in the compressive stress
acting on the fascicles during contraction. The fascicles curve and adopt S-shaped profiles
that align their traction to be closer to the aponeurosis direction, and they curl across
fascicle sheets that in turn bulge around the intramuscular pressure that develops during
contraction. Material properties of the aponeuroses affect the strains in the fascicles and
thus their force generating potential. The muscle model that we have validated in this
Chapter will provide a useful tool for understanding the mechanisms that relate muscle
structure to its contractile function.

CHAPTER 3. MUSCLE MODEL: PHYSIOLOGICAL VALIDATION AND ... 65
Figure 3.6: Measured (gray) and modelled (black) force-length properties of human calfmuscles. The simulations reached a 30% activation, and the forces have been normalizeto achieve a maximum active force of 1. The black lines without symbols show theactive (solid line) and passive (dashed line) force-length properties that were input forthe fascicles (see Chapter 2). The black lines with symbols show normalized active(inverted triangles), passive (squares) and total (circles) forces for the whole musclebelly. The normalized active (diamonds) human gastrocnemius force was measured fromtwitch contractions [120]. Normalized passive (stars) forces from gastrocnemius are acombination of experimental values upto 1.1 stretch and beyond that are extrapolatednumerical values. The active human soleus (triangles) forces were measured from tetaniccontractions [121].
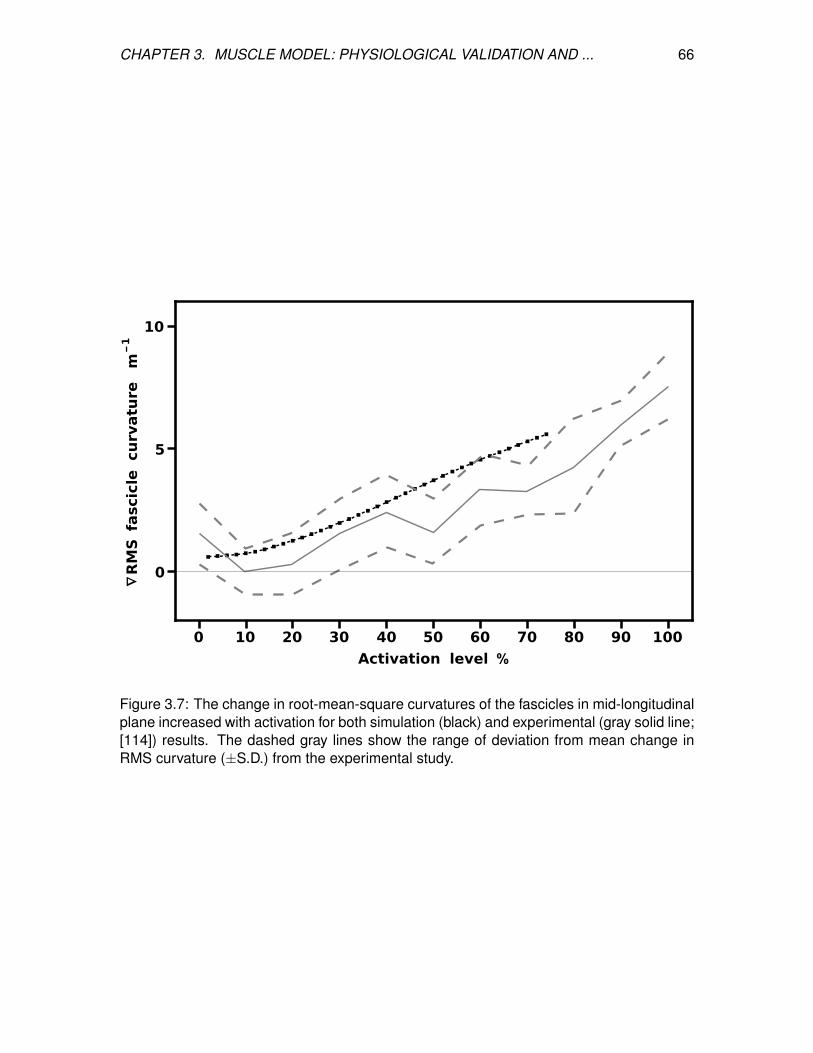
CHAPTER 3. MUSCLE MODEL: PHYSIOLOGICAL VALIDATION AND ... 66
0 10 20 30 40 50 60 70 80 90 100
0
5
10
Activation level %
∇RMS
fascicle
curvature
m-1
Figure 3.7: The change in root-mean-square curvatures of the fascicles in mid-longitudinalplane increased with activation for both simulation (black) and experimental (gray solid line;[114]) results. The dashed gray lines show the range of deviation from mean change inRMS curvature (±S.D.) from the experimental study.
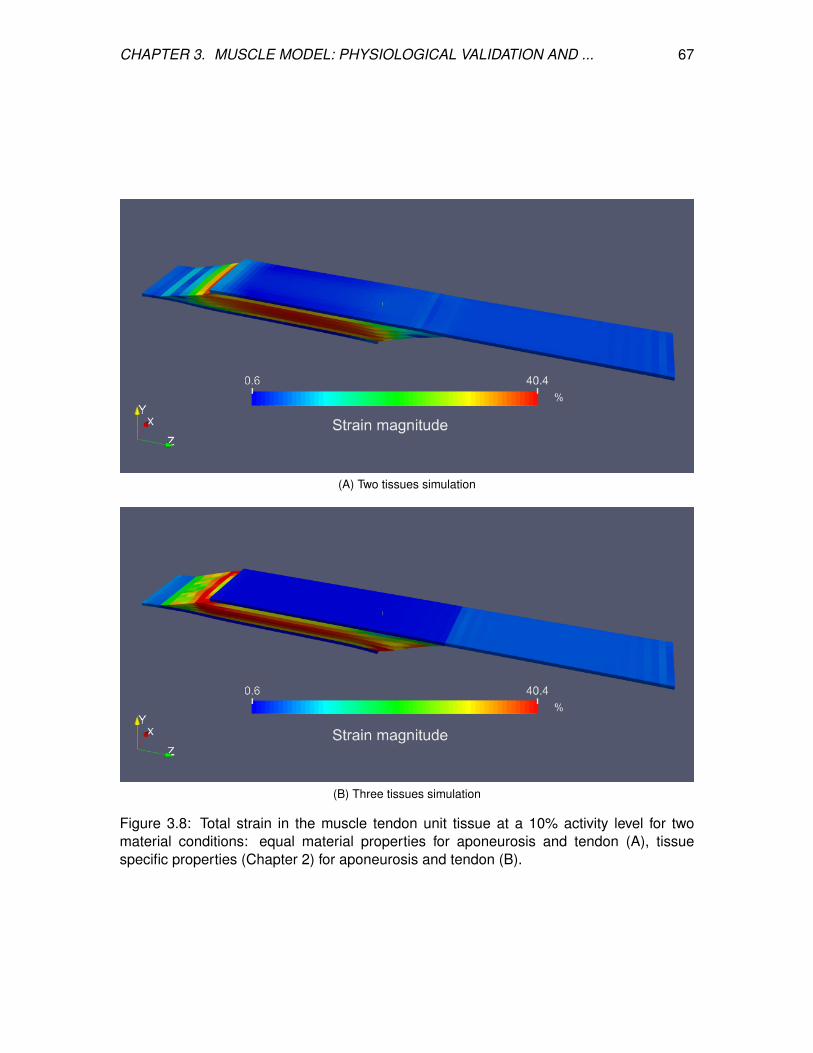
CHAPTER 3. MUSCLE MODEL: PHYSIOLOGICAL VALIDATION AND ... 67
(A) Two tissues simulation
(B) Three tissues simulation
Figure 3.8: Total strain in the muscle tendon unit tissue at a 10% activity level for twomaterial conditions: equal material properties for aponeurosis and tendon (A), tissuespecific properties (Chapter 2) for aponeurosis and tendon (B).

Chapter 4
Regionalizing muscle activity
causes changes to the magnitude
and direction of the force from
whole muscles
4.1 Introduction
Skeletal muscles can contain subunits called neuromuscular compartments that are
spatially distinct regions that contain specific motor units and motor drive from the
nervous system [28]. In muscles with broad attachments, a relationship between
anatomical compartments and function may appear logical, and this has shown to be the
case for both the biceps femoris in the cat [33, 26] and the masseter muscle in the pig
[134, 135]. However, functional regionalization in muscles with long tendons has also
been reported [36], leading to the suggestion that activation of motor units in different
compartments may result in differences to both the direction and the magnitude of force
applied at the tendon [28]. It is likely that asymmetry in the fascicle architecture combines
with the location of the neuromuscular compartments to result in varied force vectors from
a contracting muscle.
A unipennate muscle is asymmetrical in its architecture, and muscle fibres in different
locations have different moment arms and may exert different torques about a joint. The
68

CHAPTER 4. REGIONALIZING MUSCLE ACTIVITY CAUSES CHANGES ... 69
way in which forces are transmitted from the contractile fibres to the tendon can involve
myofascial pathways [136], that in turn may modify the resultant force vector from the
individual fibres. It has been shown that activity can differ between the neuromuscular
compartments and spatial regions in the gastrocnemii in the cat during walking [137], and
in man during both cycling and postural tasks [138, 139]. Changes in activity between
the neuromuscular compartments in the cat lateral gastrocnemius led to changes in the
direction of the force vector along the tendon, altering the moments of yaw, pitch or roll
about the ankle [36]. However little has been reported about the mechanisms that link
the varied forces developed by individual fibres to the net mechanical output of the whole
muscle.
The different stiffnesses of connective tissues such as aponeurosis and tendon add to
the complexity of muscle-tendon unit (MTU) behaviour. In-vitro measurements of
mechanical properties of tendon and aponeurosis [99, 91, 51], and ultrasound-based in
vivo measurements of these properties [95, 54] suggest that tendon and aponeurosis may
have different tensile elastic moduli which can be alterd with age [140], training [141] and
injury [142]. The elastic properties of the aponeurosis can affect the extent to which
muscle fibres rotate as they contract [118], and can thus affect the magnitude and
direction of the forces developed by the whole muscle. However, it is beyond current
experimental techniques to measure the effect of aponeurosis stiffness on the force
outputs from muscle.
Some of the limitations in experimental studies can be addressed using in silica
models of muscles. These models need to contain a realistic architecture and
physiologically relevant connective tissue properties. Further, they should be able to
support different activation levels in different regions. Implementing fundamental
physiological concepts and material properties within sophisticated mathematical
frameworks has moved muscle simulations from one-dimensional models [53, 61] to more
architecturally and functionally detailed two- [68, 65] and three-dimensional models
[69, 59, 70]. Despite the level of architectural details that current models include, such
models rarely include other heterogeneities within the muscle such as material
distribution (e.g. fiber-type or connective tissue properties) or differential patterns of
activation. In this chapter we investigate how uneven patterns of activation across a
unipennate muscle affect the magnitude and direction of the force developed by the whole

CHAPTER 4. REGIONALIZING MUSCLE ACTIVITY CAUSES CHANGES ... 70
muscle, using a conceptual in silica muscle model. The in silica model has a simple
geometry but is asymmetric in architecture, and regionalized in activity. This model was
also used to investigate how the aponeurosis properties affect the force development in
the fibres and its transmission to the external tendon.
4.2 Material & Methods
4.2.1 Geometry, mesh, boundary and fibre architecture
A unipennate muscle belly model was created in silica to test the effects of the
activation being regionalized on the direction and magnitude of the force developed by the
whole muscle. This model had the same constitutive law (Chapter 2) and geometry
(Chapter 3) that we have previously used. However, for this chapter the activation
patterns and structural parameters along with mathematical boundary and initial condition
were altered. The muscle-aponeuroses complex was meshed by a grid of hexahedral
elements. Displacements, stresses and forces were calculated using a three-field finite
element formulation. The activation levels of the different muscle regions within the model
could be independently varied.
4.2.2 Numerical simulations
A set of simulations were designed to investigate the effect of regionalized activation,
as well as different aponeurosis stiffnesses, on the magnitude and the direction of force
developed by an isometrically activated muscle. The average activation of the whole
muscle tissue was set to be 10% but the distribution of activation was changed between
the simulations. For initial undeformed (relaxed) state, the muscle fibres were considered
to be at optimal length and the along-fibre strain in aponeurosis was set to zero.
The different distributions of activation are shown in Table 4.1. All activation
distribution scenarios were repeated for three different elasticity moduli of aponeurosis.
The aponeurosis was considered with maximum strains of 2, 5 and 10 % when the
muscle was developing maximum isometric force, where the 5 % case is given in
equation 2.31.
The model was run on an eight-core computer with multi-threading over the cores (16
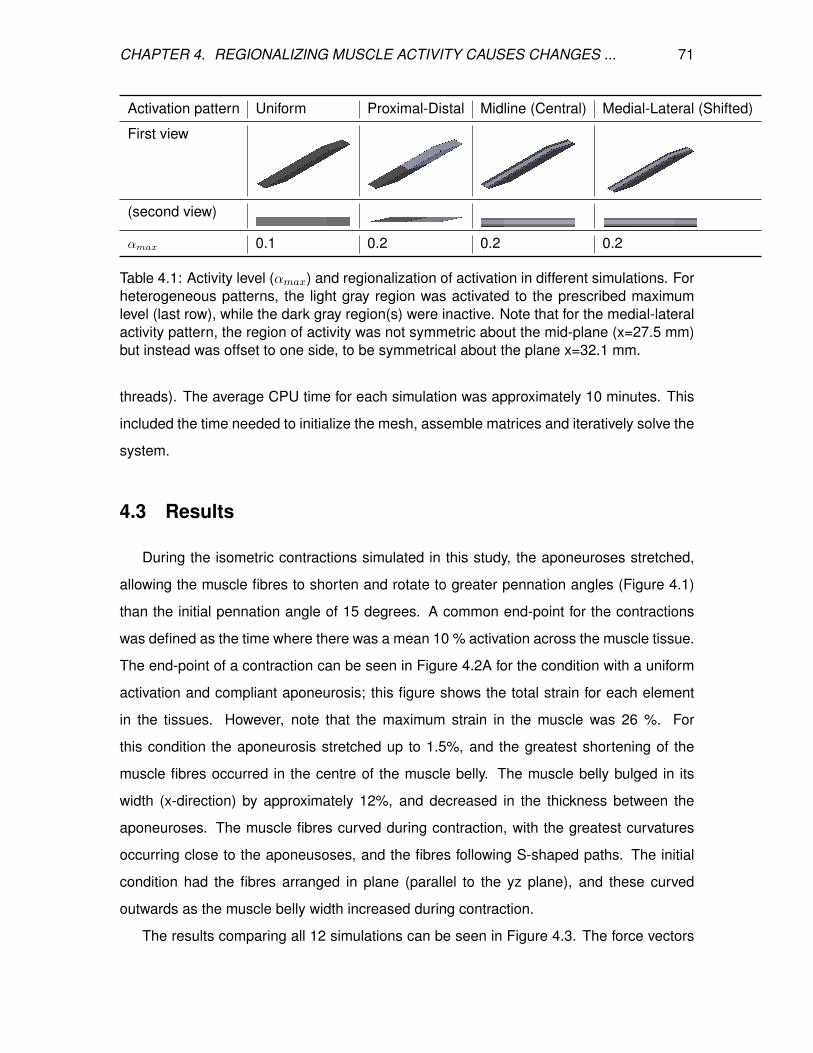
CHAPTER 4. REGIONALIZING MUSCLE ACTIVITY CAUSES CHANGES ... 71
Activation pattern Uniform Proximal-Distal Midline (Central) Medial-Lateral (Shifted)
First view
(second view)
αmax 0.1 0.2 0.2 0.2
Table 4.1: Activity level (αmax) and regionalization of activation in different simulations. Forheterogeneous patterns, the light gray region was activated to the prescribed maximumlevel (last row), while the dark gray region(s) were inactive. Note that for the medial-lateralactivity pattern, the region of activity was not symmetric about the mid-plane (x=27.5 mm)but instead was offset to one side, to be symmetrical about the plane x=32.1 mm.
threads). The average CPU time for each simulation was approximately 10 minutes. This
included the time needed to initialize the mesh, assemble matrices and iteratively solve the
system.
4.3 Results
During the isometric contractions simulated in this study, the aponeuroses stretched,
allowing the muscle fibres to shorten and rotate to greater pennation angles (Figure 4.1)
than the initial pennation angle of 15 degrees. A common end-point for the contractions
was defined as the time where there was a mean 10 % activation across the muscle tissue.
The end-point of a contraction can be seen in Figure 4.2A for the condition with a uniform
activation and compliant aponeurosis; this figure shows the total strain for each element
in the tissues. However, note that the maximum strain in the muscle was 26 %. For
this condition the aponeurosis stretched up to 1.5%, and the greatest shortening of the
muscle fibres occurred in the centre of the muscle belly. The muscle belly bulged in its
width (x-direction) by approximately 12%, and decreased in the thickness between the
aponeuroses. The muscle fibres curved during contraction, with the greatest curvatures
occurring close to the aponeusoses, and the fibres following S-shaped paths. The initial
condition had the fibres arranged in plane (parallel to the yz plane), and these curved
outwards as the muscle belly width increased during contraction.
The results comparing all 12 simulations can be seen in Figure 4.3. The force vectors

CHAPTER 4. REGIONALIZING MUSCLE ACTIVITY CAUSES CHANGES ... 72
Figure 4.1: Deformed (active) and undeformed (relaxed) geometries for (A) the uniformactivation pattern and (B) the proximal-distal activation pattern. These geometries areshown with pale areas and blue lines for the undeformed states, and darker areas andgray lines for the deformed states. Note that in the deformed states the pennation anglefor the proximal-distal activation pattern (18.37) is larger than for the Uniform activationpattern. Transverse sections through the muscles are shown for the (C) Midline activationpattern, and (D) Medial-lateral activation pattern. In these panels the undeformed shape isshown by the rectangular and dark red area. The coloured elements show the magnitudeof the strain in the model tissues in their deformed state, ranging from low strains (blue)in the aponeurosis to greatest strains (red) in the muscle belly. Note how the muscle bellythickness between the aponeuroses is least over the active region of fibres, and the widthof the muscles has increased beyond the undeformed state. Also note that in the Medial-lateral activation pattern the maximum strains have moved laterally (to the left) within themuscle.
for the whole muscle were calculated from the shear and tensile stresses developed across
the transverse plane bounding the deep aponeurosis (z=0, for contour details see Figure
4.2B). The force vectors were described by the x-, y- and z- direction cosines of the force
vector (δx, δy and δz, respectively), and the resultant force magnitude (for details see
Figure 4.2C).
In general, an increase in aponeurosis stiffness caused an increase in the magnitude
of force and a change to its direction (see δy in Figure 4.3). The stretch in the
aponeurosis was reduced for increased aponeurosis stiffness, and this led to a reduction
in the shortening of the muscle fibres and a reduction in their rotation to higher pennation
angles. Additionally, as the aponeurosis stiffness increased, the changes in muscle belly
thickness and width became smaller. For the example of the uniformly activated muscle
with a stiff aponeurosis, the width increased by only 7% during contraction.
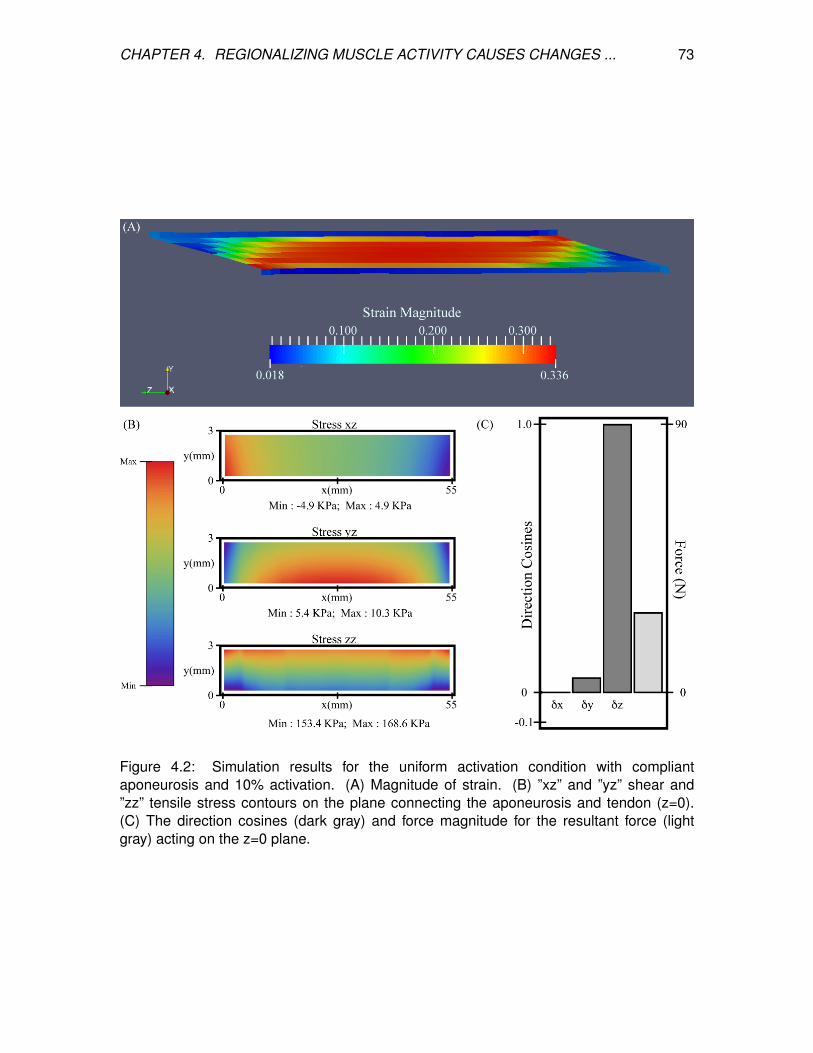
CHAPTER 4. REGIONALIZING MUSCLE ACTIVITY CAUSES CHANGES ... 73
Figure 4.2: Simulation results for the uniform activation condition with compliantaponeurosis and 10% activation. (A) Magnitude of strain. (B) ”xz” and ”yz” shear and”zz” tensile stress contours on the plane connecting the aponeurosis and tendon (z=0).(C) The direction cosines (dark gray) and force magnitude for the resultant force (lightgray) acting on the z=0 plane.

CHAPTER 4. REGIONALIZING MUSCLE ACTIVITY CAUSES CHANGES ... 74
COFx (mm) COFy (mm)
Compliant Aponeurosis
Uniform 27.5 1.56Proximal-Distal 27.5 1.52Midline 27.5 1.54Medial-Lateral 31.6 1.54
Normal Aponeurosis
Uniform 27.5 1.26Proximal-Distal 27.5 1.30Midline 27.5 1.26Medial-Lateral 30.9 1.26
Stiff Aponeurosis
Uniform 27.5 1.06Proximal-Distal 27.5 1.10Midline 27.5 1.07Medial-Lateral 31.4 1.07
Table 4.2: x and y components of the centre of force (COF) on the z=0 plane.
The conditions with uniform activation had each muscle fibre activated to 10%. For the
other three conditions with regionalization of the activity, the mean activity level across the
muscle was kept at 10%, but this was concentrated in half the fibres each being activated
to 20%. The magnitude of the muscle force was similar for the simulations with uniform,
midline and medial-lateral distributions of activity, however the proximal-distal activation
pattern resulted in greater muscle force. The active fibres in the conditions with
heterogeneous activation patterns (proximal-distal, midline and medial-lateral) contracted
to a shorter length and rotated to a greater pennation angle than the uniform pattern.
Additionally, in the conditions with proximal-distal activation patterns the thickness of the
belly changed non-uniformly along the length of the muscle with a greater reduction in
thickness in the active region.
For the conditions with compliant aponeurosis, the y-component of the centre of force
moved from a position midway down the aponeurosis to a level closer to the deep surface
for the stiff aponeurosis condition (Table 4.2). Conditions with the uniform, proximal-distal
and midline activation patterns are all symmetrical about the midplane of the muscle
(x=27.5 mm). For these conditions there was a negligible x-component to the
whole-muscle force, with δx < -10−6. The medial-lateral condition had the region of
activity displaced to one side (Table 4.2), with the activity centred about the plane x=32.1
mm. The x-component for the whole-muscle force was increased for this condition (δx ∼=
-3×10⁻³): this value was still small, however, there was a more substantial increase in the
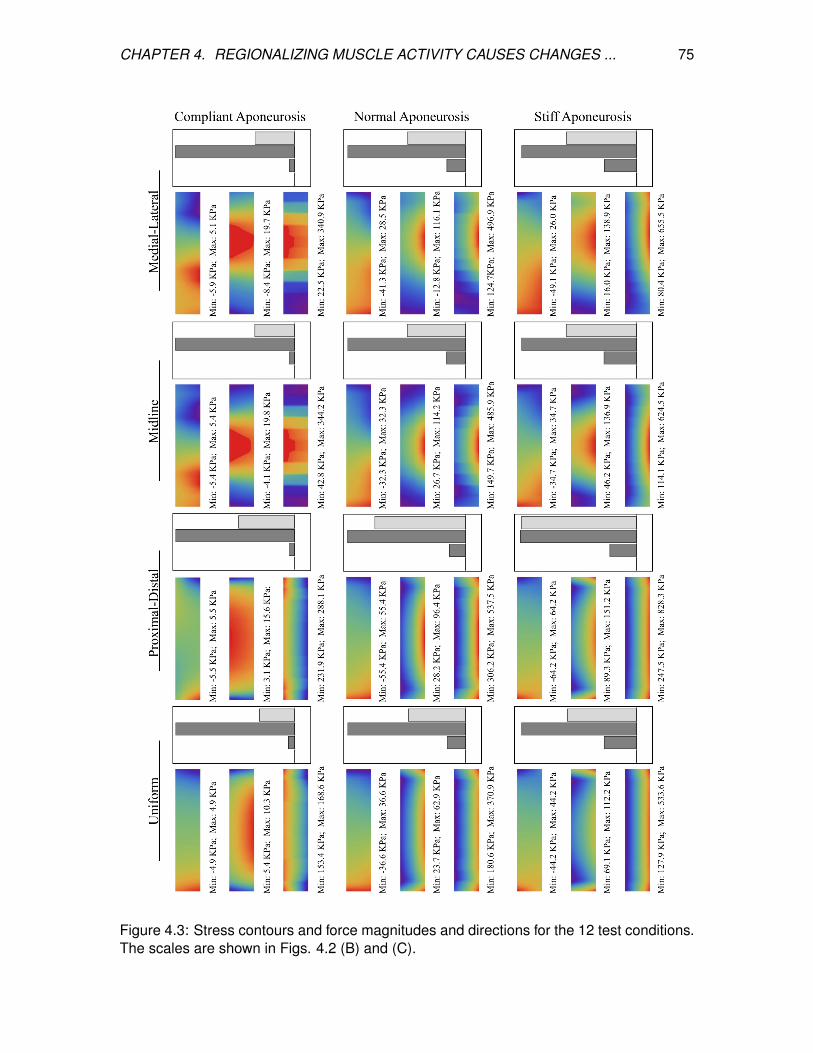
CHAPTER 4. REGIONALIZING MUSCLE ACTIVITY CAUSES CHANGES ... 75
Figure 4.3: Stress contours and force magnitudes and directions for the 12 test conditions.The scales are shown in Figs. 4.2 (B) and (C).

CHAPTER 4. REGIONALIZING MUSCLE ACTIVITY CAUSES CHANGES ... 76
x-component of the centre of force (Table 4.2) acting at the end of the aponeurosis (to
x=31.3 mm).
4.4 Discussion
The in silica isometric contractions of human gastrocnemius in this study show
decreases in muscle fibre length and increases in pennation (Figure 4.2 A-B) in a similar
manner to in vivo reports [15]. In addition, the in silica muscle belly thickness decreased
during contraction in a manner more representative of in vivo measurements from the
medial gastrocnemius [15]. The simulated muscle belly thickness decreased because a
component of the contractile force of the muscle fibres acts to compress the muscle
between the aponeuroses, and this was balanced by increases in the width of the muscle
belly (Figure 4.2 C-D) to maintain the nearly incompressible behaviour of the muscle
tissue. Compressing the muscle belly would cause increases in intramuscular pressure,
and this in turn drives increases in the curvature of the muscle fibres (Chapter 3 and [65]).
Indeed, in our simulations the initial configurations of the fibres were straight, and this
changed to curved S-shapes during contraction. The width of the simulated muscle belly
increased at its mid-point during contractions more than the width of the aponeuroses
(Figure 4.2 C-D), and so the belly bulged outwards to the sides. A consequence of this
bulging was that the planes across which the fibres were initially aligned (parallel to the yz
plane) transformed to curved sheets during contraction. Sejerested and co-workers [127]
observed curved fascicle sheets in the vastus lateralis of human cadavers and have
suggested the arrangement of fascicle sheets in an onion-like arrangement, and recent
3D reconstructions of fibre curvatures have also demonstrated that the fibre trajectories in
both the medial and lateral gastrocnemius curve around concentric sheets during
contraction [112]. Despite the simplistic initial geometry (Figure 3.1) of the muscle in
these simulations with straight fibres and rectangular aponeuroses, an emergent feature
from the simulations for the fibres was to develop curved trajectories in 3D, and this has
been suggested to be an important property to maintain mechanical stability within the
muscle [65].
All the in silica conditions in this study had an equivalent level of muscle activity with an
average of 10% activity across the muscle fibres (see Table 4.1) in the contracting state.

CHAPTER 4. REGIONALIZING MUSCLE ACTIVITY CAUSES CHANGES ... 77
However, both the magnitude and direction of the force (Figure 4.3) varied with the different
regionalizations of the muscle activity. All conditions with regionalized activity resulted in
greater muscle forces than for the condition with uniform activity across all fibres, and they
also showed localized decreases in thickness, fascicle length and larger pennations around
their active regions. These results are consistent with findings by [68] that compared the
level of force in a uniformly fully active muscle with muscles where half the fibres were fully
active: they activated the fibres in one end of the muscle and noted that the muscle force
was 14% greater than expected from the average activity level. There was a pronounced
increase in the muscle force for the non-uniform pattern of activation in the proximal-distal
model (Figure 4.3); this could be due to specific changes in the shape of the muscle belly
compared to other activity patterns, where the active region decreased in thickness more
than the inactive region, and the muscle bent around the region where the activity levels
transitioned. Here, we additionally show that changing the regionalization of the activity
results to changes in the direction of the force vector from the whole muscle (Table 4.2),
and this would result in different directions of the muscle torque in the joints that it spans,
explaining experimental observations for the lateral gastrocnemius in the cat [36].
The increases in aponeurosis stiffness in these in silica contractions resulted in
decreased aponeurosis stretch and muscle fibre strain, and smaller increases in
pennation of the fibres. These changes resulted to increases in the magnitude of the
force (Figure 4.3) developed by the whole muscle. These results are consistent with
previous finite element models of the biceps femoris in which aponeurosis dimensions
were changed with conditions that had stiffer aponeuroses, resulting in reduced fibre
strains [77]. In another study, a finite element model of the medial gastrocnemius from the
cat demonstrated that increased aponeurosis stiffness resulted in greater muscle forces
for isometric contractions [143], again consistent with our results. The combined findings
from these three modelling studies show that the interactions between the muscle fibres
and the connective tissue are important for shaping the mechanical output from the whole
muscle. Our simulations additionally demonstrate how the direction of the muscle force is
affected by the stiffness of the aponeurosis (Figure 4.3), presumably due to the changes
in the shape of the muscle belly and force transmission that are caused by the different
aponeurosis properties.
In our simulations the aponeurosis was included in an unrealistically thick (3 mm) state
CHAPTER 4. REGIONALIZING MUSCLE ACTIVITY CAUSES CHANGES ... 78
for computational simplicity, however the material properties of the aponeurosis was
scaled so that its overall stiffness matched that expected for the in vivo condition. The
thickness in the aponeurosis in our simulations allowed us to observe gradients of stress
in the thickness direction (y-direction) that change with the aponeurosis stiffness. The
simulations showed a reduced muscle fibre strain near the ends of the muscle where the
fibres are structurally close to the fixed-end boundary condition and pull against the stiff
aponeurosis. It is possible that removing the fixed boundary constraints, for instance by
including the external tendon, would reduce this effect in future studies. Our in silica
results show that the stress in the aponeurosis increased for the stiffest conditions, with
the highest stress being more concentrated towards the outer layers of the aponeurosis
(Figure 4.3), and it is possible that this indicates increases in the risk of injury initiation at
areas closer to the outer surface of the aponeurotic sheets.
The results from this study highlight that the mechanical output of a whole muscle
should not simply be considered to be a scaled-up muscle fibre that matches the size
of the whole muscle [133], or a simple sum of actions of all the individual muscle fibres
[144], but instead depends on the complex interactions between the muscle fibres and
connective tissues that is brought about by the 3D structure of the muscle. In particular we
show how the effect of regionalizing the muscle activity to a particular volume of muscle
fibres causes changes to both the magnitude and direction of the whole muscle force, even
when the mean level of muscle activity remains unchanged.
In summary, our simulations indicate that muscles with stiffer aponeuroses would result
in smaller aponeurosis stretches and muscle fibre shortening. This effect would place the
muscle fibres at a longer length on the ascending limb of their force-length curves, allowing
them to develop greater stress and force. Additionally, as the stretch in the aponeurosis
is reduced, the muscle fibres did not increase in their pennation angle as much during
contraction. The simulations of regionalized and non-uniform activation patterns caused
local differences in the shape of the muscle belly, strains and orientations of the muscle
fibres. These factors affect both the magnitude and direction of the resultant muscle force.
Chapter 5
The effect of intramuscular fat on
skeletal muscle mechanics:
implications for the elderly and
obese
5.1 Introduction
Skeletal muscle provides the forces that are necessary for the maintenance of body
posture and for driving body movements for our activities of daily living. Muscle forces
depend partly on the structural features [7] of the muscle that include fibre length, the
pennation angle of the fibres relative to the line of action, the number of fibres and their
physiological cross-sectional area [121]. Muscles forces additionally depend on the base
material properties of the muscle tissue, but much less is know about this. The structural
and material properties of muscle vary between muscles and individuals [9, 145] but can
also change through our lifespan [4] and can be affected by disease (e.g., [6]). The purpose
of this study was to investigate how the inclusion of fat within a muscle belly can affect its
force output.
Intramuscular fat accumulates both in (intramyocellular) and out (extramyocellular) of
the muscle fibres. Healthy muscle contains about 1.5 % of intramyocellular fat and this
can increase to over 5 % in the obese [146]. The total intramuscular fat additionally
79

CHAPTER 5. THE EFFECT OF INTRAMUSCULAR FAT ON ... 80
contains extramyocellular components, and so the total intramuscular fat may exceed
these values. Additionally in the obese, the muscles may remodel by hypertrophy to a
larger size [147], and experience a transition to faster fibre-types [146]. It has previously
been shown that obesity can result in reductions in joint specific-torque (relative to lean or
total body mass [148, 149]), but we do not know the effect of intramuscular fat and its
distribution on individual muscle mechanics, or the mechanisms that may cause
deterioration of such performance.
Intramuscular fat can also increase as we age, and can reach about 11 % in the
elderly [150]. Ageing also results in progressive muscle wasting called sarcopenia [151]
that results in reductions in size, strength and a transition to slower fibre-types [4].
Additionally, the lower levels of physical activity that accompany obesity in the elderly
have been shown to accelerate muscle atrophy [152]. Also, connective tissue (tendon and
aponeurosis) properties change as well. Despite earlier experimental studies suggesting
no effect [153] or an increase [154] in tendon stiffness with ageing, recent studies have
reported a decrease in stiffness [155, 140, 156] of human tendons in the elderly.
However, less is known about age-related changes to the aponeurosis stiffness.
Experimental measures of intramuscular fat have been achieved with a variety of
imaging [150, 157, 158] and biochemical techniques [146, 159]. However, in order to
understand the mechanisms that may affect the fat-dependent loss of contractile
performance, it is helpful to model the mechanical effect of fat inclusions within a muscle.
Here, we test the effect of fat on skeletal muscle performance within a 3D finite-element
model that is based on the physics of continuum mechanics and represents the muscle as
a composite biomaterial. A range of model variants were tested that represent the
inclusion of intra- and extracellular fat. We additionally report on the influence of muscle
structure and connective tissue properties on the deterioration of performance.
5.2 Methods
5.2.1 Geometries, boundary conditions and muscle activations
The effect of fat inclusions was studied for the gastrocnemii. These ankle plantarflexor
muscles were chosen because the plantarflexors have been shown to have greater loss of
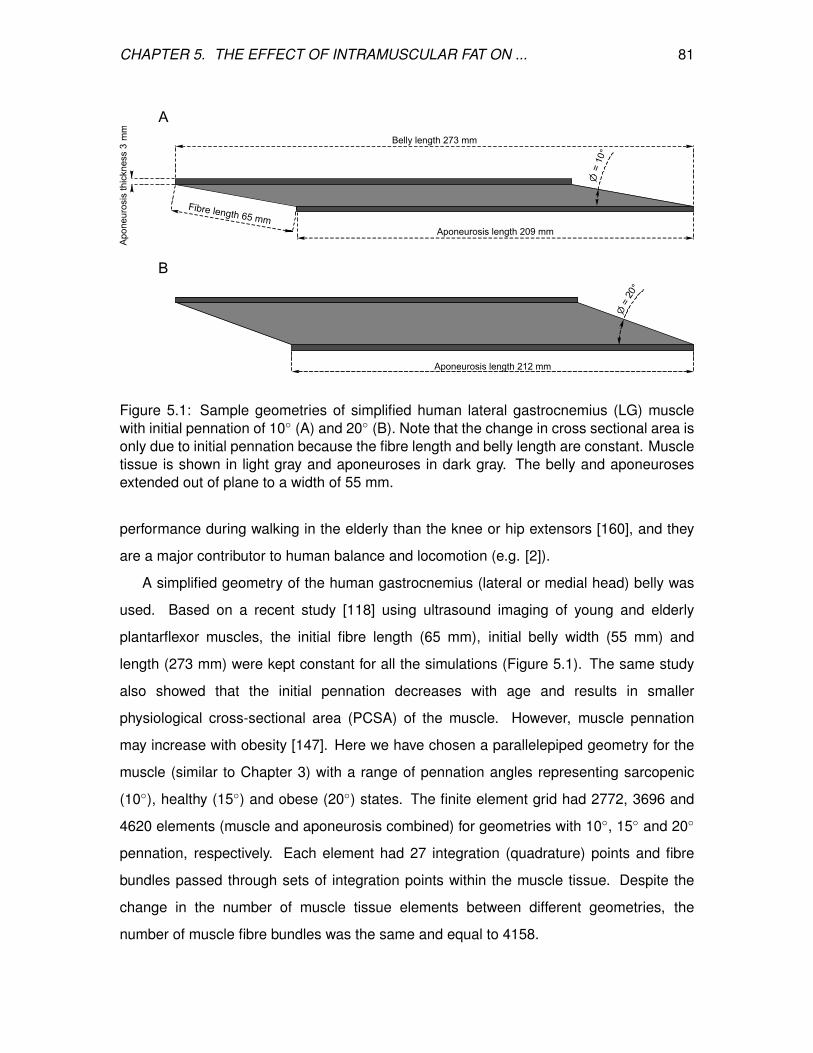
CHAPTER 5. THE EFFECT OF INTRAMUSCULAR FAT ON ... 81
=
Aponeurosis length 212 mm
20
mm
Apo
neur
osis
thic
knes
s3
Aponeurosis length 209 mm
Belly length 273 mm
10=
Fibre length 65 mm
A
B
Figure 5.1: Sample geometries of simplified human lateral gastrocnemius (LG) musclewith initial pennation of 10 (A) and 20 (B). Note that the change in cross sectional area isonly due to initial pennation because the fibre length and belly length are constant. Muscletissue is shown in light gray and aponeuroses in dark gray. The belly and aponeurosesextended out of plane to a width of 55 mm.
performance during walking in the elderly than the knee or hip extensors [160], and they
are a major contributor to human balance and locomotion (e.g. [2]).
A simplified geometry of the human gastrocnemius (lateral or medial head) belly was
used. Based on a recent study [118] using ultrasound imaging of young and elderly
plantarflexor muscles, the initial fibre length (65 mm), initial belly width (55 mm) and
length (273 mm) were kept constant for all the simulations (Figure 5.1). The same study
also showed that the initial pennation decreases with age and results in smaller
physiological cross-sectional area (PCSA) of the muscle. However, muscle pennation
may increase with obesity [147]. Here we have chosen a parallelepiped geometry for the
muscle (similar to Chapter 3) with a range of pennation angles representing sarcopenic
(10), healthy (15) and obese (20) states. The finite element grid had 2772, 3696 and
4620 elements (muscle and aponeurosis combined) for geometries with 10, 15 and 20
pennation, respectively. Each element had 27 integration (quadrature) points and fibre
bundles passed through sets of integration points within the muscle tissue. Despite the
change in the number of muscle tissue elements between different geometries, the
number of muscle fibre bundles was the same and equal to 4158.

CHAPTER 5. THE EFFECT OF INTRAMUSCULAR FAT ON ... 82
The muscle belly was fixed at the muscle-tendon junctions before uniformly activating
the muscle fibres. The activation was ramped up from zero towards a fully active muscle.
5.2.2 Material properties
The base– and along-fibre properties of the fibre reinforced composite muscle and
aponeuroses and nonlinear isotropic properties of fat tissue are previously described in
Chapter 2.
For the case of X% intracellular fat infiltration the isochoric (volume perserving)
component of the strain energy Wiso (equation 2.16) for fatty muscle can be written as:
Wiso,fatty muscle = Wmuscle + (1− X
100)×Wbase,muscle +
X
100×Wfat. (5.1)
Here Wmuscle is the muscle along-fibre strain-energy and Wbase,muscle is the base muscle
strain-energy. Also, whenever assuming an X% loss of contractile elements of the fibres,
the Wmuscle component of isochoric strain energy was reduced by a factor of 1− X100 .
The incompressibility constant, κ, for the volumetric part of the strain energy Wvol
(equation 2.15) was chosen to be κfat = 0.25 × 10⁶ for fat. This was based on the fat
compressibility properties used in modelling the human heel pad [109]. κfat had a smaller
value than the muscle tissue (κmuscle = 1.0 × 10⁶) indicating that it is more compressible.
In this study, the volumetric part of the strain energy for X% intracellular fat accumulation
had the form of:
Wvol,fatty muscle = [(1− X
100)× κmuscle +
X
100× κfat][J2 − 1− 2 log(J)], (5.2)
where J is the determinant of the deformation gradient tensor and represents dilation
(see Chapter 2). The implementation of combined tissue (e.g. fatty muscle) in the
modelling framework is explained in section 2.8.3. The deep and superficial aponeuroses
were assumed to have the same material properties in these simulations and had a
stiffness level that was either compliant, normal or stiff (Chapters 2 and 4).
5.2.3 Distributions (model variants) and intensities of intramuscular fat
accumulation
The properties of the transversely isotropic muscle tissue were changed in six model
variants. Lean muscle (M1-M2) had no fat in the muscle base material or between the

CHAPTER 5. THE EFFECT OF INTRAMUSCULAR FAT ON ... 83
Figure 5.2: A muscle belly geometry with 15 pennation angle and 20% sparse fatdistribution (M5 variant). The dots show the positions of the integration points withaponeuroses (gray), muscle (red) and fat (yellow) properties.
fibres. For the other four model variants an X% accumulation was introduced into muscle,
where the effects of fat were simulated differently. Variations of the model are: (M1) Lean
muscle (no fat) with 100% along-fibre properties (AFPs) in muscle fibres; (M2) lean muscle
with X% reduction in AFPs; (M3) muscle with X% fat in the base muscle material and
100% AFPs; (M4) muscle with X% of fat in the base muscle material and X% reduction in
AFPs; (M5) muscle with a random and sparse distribution of X% pure fat (Wiso = Wfat,
κ = κfat) at the integration points dispersed within the lean muscle tissue; and (M6) muscle
with a random and sparse distribution of X /2% pure fat points, X /2% of fat in the base
muscle material and an X /2% reduction in AFPs. M1 represented a control condition
for lean muscle. M2 was a lean muscle with a loss of AFPs, M3 and M4 were models
with intracellular fat, M5 represented extracellular fat and; M6 contained a combination of
intracellular and extracellular fat. The different variations of the model are summarized in
Table 5.1. The sparse distributions of fat in the M5 and M6 models were chosen such
that fat was not contained in adjacent integration points, and we assumed that the sparse
distribution had a negligible effect on the fibre orientations in the belly.
Model Base Muscle Properties (%) Fat properties (%) Contractile Elements (%) Fat DistributionM1 100 - 100 -M2 100 - 100-X -M3 100-X X 100 IMCM4 100-X X 100-X IMCM5 100 (muscle points) 100 (for X fatty points) 100 (muscle points) EMCM6 100-X /2 (muscle points) 100 (for X /2 fatty points) 100-X /2 (muscle points) IMC & EMC
Table 5.1: The model variants for X% fat infiltration in the muscle. Fatty variants (M3-M6)represent possible intramyocellular (IMC) and extramyocellular (EMC) fat distributions.
Three levels of fat were used for the models M3-M6, having 2, 10 or 20%. The 2% fat
represents a healthy condition, with higher levels reflecting the incereased intramuscular
fat in the elderly and obese. As an example, Figure 5.2 shows a muscle with 15 pennation
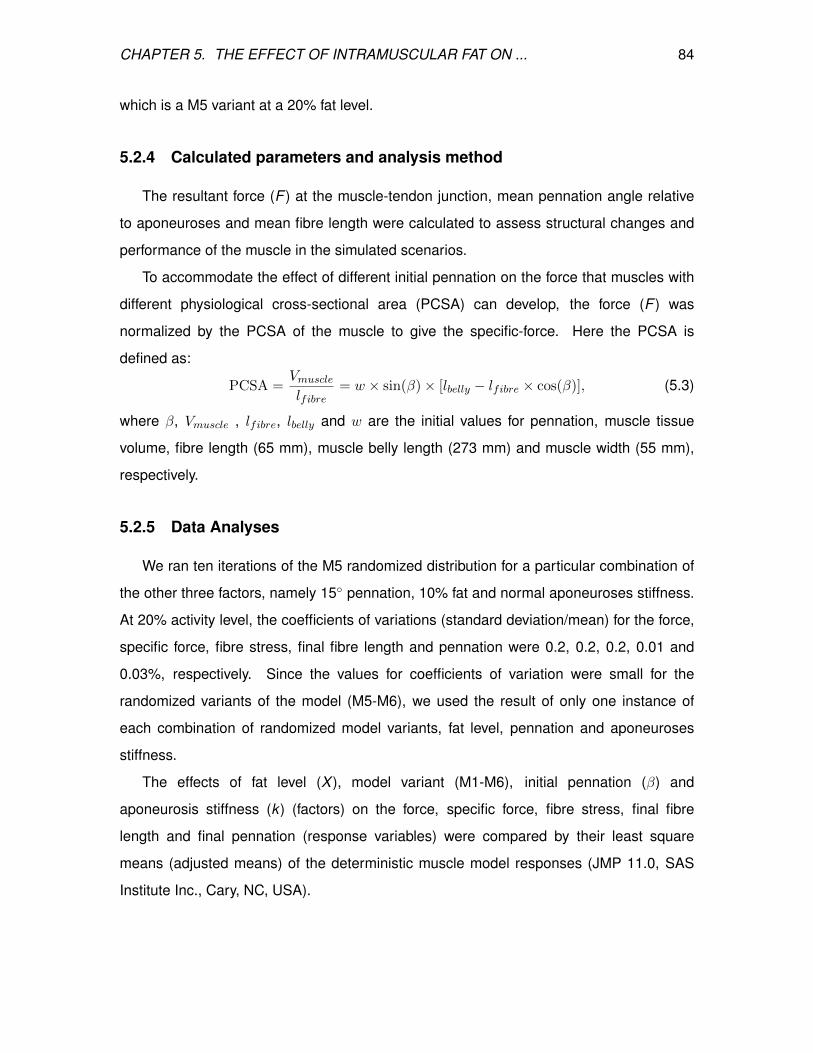
CHAPTER 5. THE EFFECT OF INTRAMUSCULAR FAT ON ... 84
which is a M5 variant at a 20% fat level.
5.2.4 Calculated parameters and analysis method
The resultant force (F ) at the muscle-tendon junction, mean pennation angle relative
to aponeuroses and mean fibre length were calculated to assess structural changes and
performance of the muscle in the simulated scenarios.
To accommodate the effect of different initial pennation on the force that muscles with
different physiological cross-sectional area (PCSA) can develop, the force (F ) was
normalized by the PCSA of the muscle to give the specific-force. Here the PCSA is
defined as:
PCSA =Vmusclelfibre
= w × sin(β)× [lbelly − lfibre × cos(β)], (5.3)
where β, Vmuscle , lfibre, lbelly and w are the initial values for pennation, muscle tissue
volume, fibre length (65 mm), muscle belly length (273 mm) and muscle width (55 mm),
respectively.
5.2.5 Data Analyses
We ran ten iterations of the M5 randomized distribution for a particular combination of
the other three factors, namely 15 pennation, 10% fat and normal aponeuroses stiffness.
At 20% activity level, the coefficients of variations (standard deviation/mean) for the force,
specific force, fibre stress, final fibre length and pennation were 0.2, 0.2, 0.2, 0.01 and
0.03%, respectively. Since the values for coefficients of variation were small for the
randomized variants of the model (M5-M6), we used the result of only one instance of
each combination of randomized model variants, fat level, pennation and aponeuroses
stiffness.
The effects of fat level (X ), model variant (M1-M6), initial pennation (β) and
aponeurosis stiffness (k ) (factors) on the force, specific force, fibre stress, final fibre
length and final pennation (response variables) were compared by their least square
means (adjusted means) of the deterministic muscle model responses (JMP 11.0, SAS
Institute Inc., Cary, NC, USA).
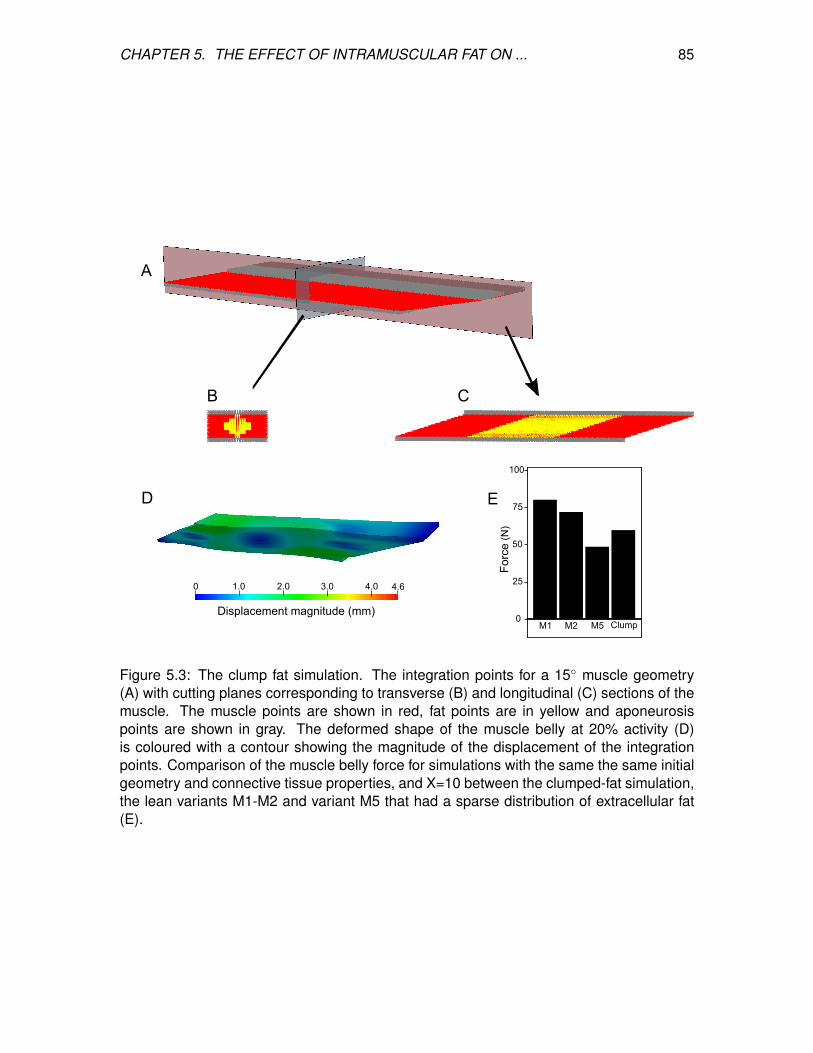
CHAPTER 5. THE EFFECT OF INTRAMUSCULAR FAT ON ... 85
B C
A
100
75
50
25
0M1 M5 ClumpM2
Force
(N)
E
1.0 2.0 3.0 4.0
Displacement magnitude (mm)
0 4.6
D
Figure 5.3: The clump fat simulation. The integration points for a 15 muscle geometry(A) with cutting planes corresponding to transverse (B) and longitudinal (C) sections of themuscle. The muscle points are shown in red, fat points are in yellow and aponeurosispoints are shown in gray. The deformed shape of the muscle belly at 20% activity (D)is coloured with a contour showing the magnitude of the displacement of the integrationpoints. Comparison of the muscle belly force for simulations with the same the same initialgeometry and connective tissue properties, and X=10 between the clumped-fat simulation,the lean variants M1-M2 and variant M5 that had a sparse distribution of extracellular fat(E).

CHAPTER 5. THE EFFECT OF INTRAMUSCULAR FAT ON ... 86
5.2.6 Fat clump simulation
A further model was simulated that included 10% fat as a concentrated clump inside
the muscle belly. The clump of fat in the muscle belly was a tube extending for 16
elements along the length of the belly and had a symmetric and polygonal cross-sectional
area (Figure 5.3A-C). Fibre orientations at integration points up to two elements from the
fatty clump were changed so that the fibres curved smoothly around the fatty clump. This
simulation was run with a 15 pennation muscle belly and normal aponeuroses stiffness.
It was similar to M5 apart from the fat being clumped into the centre of the muscle belly
and the minor deviations to the neighbouring muscle fibre directions.
5.3 Results
The simulations were for an isometrically contracting muscle belly. As the activation
level increased the fibres shortened and expanded in their transverse direction, rotating to
greater pennation angles and causing the aponeuroses to stretch as they became loaded.
The maximum activation level that could be simulated varied between conditions (Figure
5.4), and so the data analyses were performed at a 20% activation that was common to
all simulations (Figure 5.5). The fibre stresses at 20% activation reached up to 17% of the
maximum isometric stress of 200 KPa, but were reduced in cases of low initial pennation,
reduced aponeurosis stiffness and increased fat accumulation.
The increased initial pennation of the muscle was a major factor for greater muscle
force. The geometries with higher pennation angle, and therefore larger PCSA, developed
higher forces at each level of activity. For instance, the mean force for 10 pennated muscle
geometry was 41% less than the 15 pennated geometry. When the effect of increased
PCSA was removed, by calculating the specific-force (force/PSCA) of the whole muscle
and the stress of the muscle fibres, it was seen that changes in specific-force and fibre
stress showed similar patterns to the changes in muscle force (Figure 5.5). Therefore,
despite normalizing the force by the PCSA, the effects of pennation change still persisted
on the specific force and fibre stress. The extent of fibre rotation and shortening as well
as the muscle belly force depended on the aponeurosis stiffness. A stiffer aponeurosis
resulted in smaller rotation and shortening of the fibres and an increase in the force and
stress (Figure 5.5).
CHAPTER 5. THE EFFECT OF INTRAMUSCULAR FAT ON ... 87
A
B
C
* * * * * * * * * * * *
0
75
150
225
300
* * * * * * * * * * * *
0
75
150
225
300
Force
(N)
* * * * * * * * * * * *
0 20 40 600
75
150
225
300
% Activation Level
Figure 5.4: Force-activation plots for the different variants M1-M6. Lines show variant M1(black circles), M2 (red diamonds), M3 (blue squares), M4 (green triangles), M5 (purpleinverted triangles) and M6 (orange stars) at 2% (A), 10% (B) and 20% (C) fat levels.
CHAPTER 5. THE EFFECT OF INTRAMUSCULAR FAT ON ... 88
There was an effect of the model variant (fat and muscle distribution) used in the
simulations on the muscle force and stress of the muscle fibres. However, there was no
effect of the model variants on the final pennation angle of the muscle fibres. A reduction
in the along fibres properties showed a decrease in the belly force: for example the M2
variant with 15 pennation muscle, normal aponeurosis stiffness and a 10% reduction in
AFPs (X=10%) showed an 11.3% decline in force compared to the lean M1 variant
(Figure 5.3E) at 20% activity. The longer fibre lengths for the fatty models would
predispose them to greater forces due to their force-length properties (see Chapter 2),
however, the force and stress were reduced due to the intramuscular fat despite this effect
(Figures 5.4-5.5). For example, a 15 pennation muscle with normal aponeuroses
stiffness showed an average of 25% and 45% decrease in force for 10% and 20% of fat
accumulation, respectively. Despite the substantial effect of fat on muscle force,
specific-force, fibre stress and final fibre length, there was no effect of the percentage of
fat on the final fibre pennation.
The simulation with 10% fat clumped in the centre of the muscle belly showed a lower
force (60.1 N) compared to the lean variants M1-M2 (80.4 N and 72.2 N, respectively),
however the force from the clumped fat simulation was greater than for the M5 variant
(48.8 N) that had 10% of extracellular fat distributed across the muscle belly (Figure 5.3D).
5.4 Discussion
Fat accumulation in skeletal muscles is a common phenomenon in ageing and obese
populations. Studying the effect of fat infiltration on the mechanical performance of human
skeletal muscles is an experimental challenge since muscle forces cannot be measured
directly. In addition, it is impossible to experimentally manipulate factors such as
connective tissue stiffness, fibre pennation and the percentage and distribution of fat that
affect muscle performance in the elderly and obese populations. In this work we used a
model to uncouple the effect of such factors on muscle belly force output. This study
focused on the human plantarflexor gastrocnemii muscle group as a major contributor to
human balance and locomotion.
Skeletal muscle models have previously used to study the effects of ageing and
obesity on human locomotion. Thelen in 2003 [161] introduced a framework for

CHAPTER 5. THE EFFECT OF INTRAMUSCULAR FAT ON ... 89
comparing young and elderly dorsi- and plantarflexor muscles performance during
isometric and isokinetic contractions. He showed that elderly muscle with 30% decrease
in maximum isometric strength, 20% decline in maximum contraction velocity and an
increased deactivation rate of 20% compared to young models had about 40% or more
decline in ankle torque and power. In another study [162], a decline in maximum
contraction velocity and maximum isometric force, an increase in muscle stiffness and
altered shape of force-length curve were predicted when mechanical properties of the
elderly muscle were estimated using an inverse dynamics optimization technique. In case
of the obese population, a recent modelling study [163] estimated that an increase in
gastrocnemii force and a decrease in vasti muscle group force would occur with altered
gait patterns of obese people. Despite the similarities of our results such as increase
muscle tissue stiffness due to fat accumulation and increase in gastrocnemii muscle force
in obese muscle with larger PCSA, the previous modelling studies addressing muscle
performance in ageing and obesity used point to point muscle models that had no
base-material representation, and this limits the study of muscle structural parameters
and the effect of fat accumulation. In previous three-dimensional finite element modelling
frameworks for active skeletal muscle (e.g. [59, 70, 69]), the heterogenetic effects of fat
accumulation have not been considered. However, Hodgson et al. [164] used a finite
elements model to show that increases to the stiffness of the base material resulted in
decreased muscle force. This model was essentially 2D and unable to account for the
transverse bulging of the fibres that is known to occur [119], and the base material was
not modelled using known fat properties; however they parallel our modelling results.
In this study, the simulations tested three different muscle geometries that varied by
their pennation. The geometries with higher initial pennation had more muscle fibres acting
in parallel, and thus they had greater physiological cross-sectional areas. It is known that
muscle force increases with PCSA [7, 165], and indeed the models with higher PCSA
generated greater force (Figure 5.5). The force was normalized by the PCSA to result in
the specific-force, and this is similar to the term ”muscle quality” that is the force a muscle
can produce per unit of its size [166, 167]. The specific-force showed changes to the
simulation parameters that mirrored the changes in absolute force (Figure 5.5), although
at a lower magnitude, and indeed these patterns were also reflected at the level of the
fibre stress. Thus, the inclusion of intramuscular fat and changes to aponeurosis stiffness
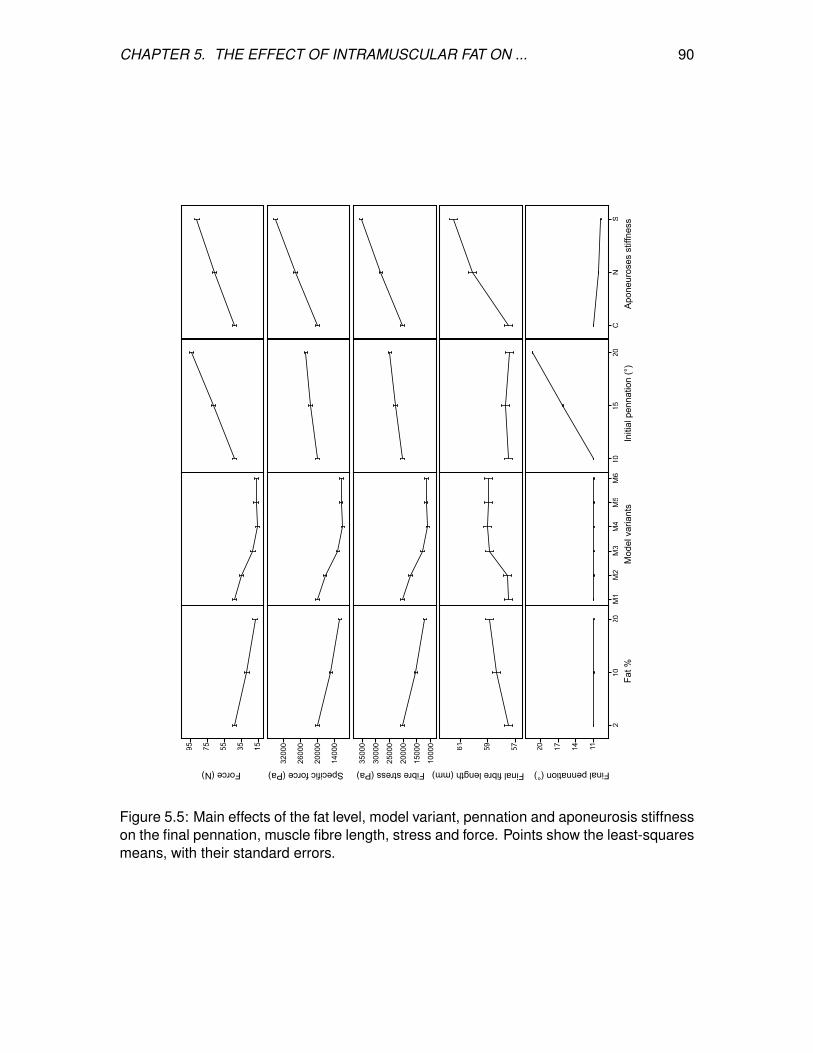
CHAPTER 5. THE EFFECT OF INTRAMUSCULAR FAT ON ... 90
Fat
%M
odel
var
iant
sIn
itial
pen
natio
n (°
)A
pone
uros
es s
tiffn
ess
\Specific force (Pa)
575961
Final fibre length (mm)
210
20
11141720
M1
M2
M3
M4
M5
M6
1015
20C
NS
Final pennation (°)
1535557595
Force (N) Fibre stress (Pa)32
000
2600
0
2000
0
1400
0
3500
0
3000
0
2500
0
1500
0
1000
0
2000
0
Figure 5.5: Main effects of the fat level, model variant, pennation and aponeurosis stiffnesson the final pennation, muscle fibre length, stress and force. Points show the least-squaresmeans, with their standard errors.
CHAPTER 5. THE EFFECT OF INTRAMUSCULAR FAT ON ... 91
changed the muscle quality independent of the effect of the muscle size or PCSA. Thus,
intramuscular fat and aponeurosis stiffness are important factors that affect the contractile
performance of muscle. The fatty models (M3-M6) generated specific-forces that were
lower than for the lean models (M1-M2). However, the fatty models generated these forces
at longer fibre lengths (Figure 5.5). The fibre lengths for the fatty models were closer to
their optimum length of 65 mm (Figure 5.1). Due to the force-length properties of the
contractile elements (see Chapters 1-2 and also [18]), these longer fibre lengths would
predispose the fatty models to generate higher forces, but this was not the case. Thus, the
fatty models generated lower specific-forces despite, and not because of, their longer fibre
lengths.
A reduction in the number of contractile components within the muscle caused a
decrease in the muscle force, and this can be seen in the change from M1 to M2 (Figure
5.5). However, not only does the muscle force depend on the contractile components but
also on the nature of the interaction between the contractile components and the base
material within the muscle. Fat has stiffer material properties than muscle [108, 109], and
thus the introduction of fat into the muscle resulted in a stiffer base material, and this
increase in stiffness would act to resist the muscle fibre shortening and transverse
bulging. The fatty models all showed lower specific force than the lean models, even for
equivalent along-fibre properties (Figure 5.5), and this is due to the increase in stiffness of
the base material due to the inclusion of fat. These results support experimental findings
that report a loss of muscle quality in both the elderly [166, 167] and obese [168], and
show that one of the causes for such a loss in contractile performance is the increase in
muscle belly tissue stiffness as the concentration of intramuscular fat increases.
The simulation with a single clump of fat (Figure 5.3) within the muscle belly showed
a reduced force compared to the lean muscle, but the reduction was not as pronounced
as when the same amount of fat was dispersed throughout the muscle, as in model M5.
The clump of fat acted to separate the medial and lateral aspects of the muscle within the
middle of the muscle belly: if the muscle were totally divided into two halves, then it would
be expected that the force form each half would be half the value for the lean muscle, and
that the two halves combined would then be the same as for the lean condition, but this
was not the case. This results shows that the distribution of fat through the muscle will
alter the muscle force. The actual distribution of fat would likely be somewhere between

CHAPTER 5. THE EFFECT OF INTRAMUSCULAR FAT ON ... 92
the extremes that we have tested here: between a fine but uniform distribution to a single
clump containing the entire amount of intramuscular fat. There are currently little data to
inform the exact nature of fat distribution within skeletal muscle, and for this reason we did
not focus on testing a range of possible intermediate fat distributions. It will be important to
experimentally quantify fat distributions in different populations if we are to fully understand
the impact of intramuscular fat on the contractile mechanics of muscle.
The simulations show that muscles with more compliant aponeuroses generate lower
forces (Figure 5.5) and this is consistent with the simulations reported in Chapter 4. For
the more compliant aponeuroses, the aponeurosis would stretch more allowing the fibres
to rotate to greater pennation angles and shorten to shorter lengths. These simulations all
started with the muscle fibres at their optimal length, and so the reduction in fibre length
would result in lower fibre stress as seen in Figure 5.5. The whole muscle force would be
further reduced by the greater pennation for the fibres in their active state, although this
effect is relatively minor. It is not totally clear if there are general changes to the
aponeurosis stiffness as we age, although the consensus would suggest that the
aponeurosis stiffness is reduced in the elderly [155, 140, 156]. Thus, this effect of
increased aponeurosis compliance causing reductions in muscle force may be a
contributing factor to the reduction in muscle forces that occur in the elderly.
In conclusion, a mathematical modelling framework was used to simulate the effect of
intramuscular fat on muscle force, to predict its effect for the elderly and obese. Both the
concentration of intramuscular fat, and the stiffness of the aponeusoses were shown to
have an important effect on the muscle fibre stress and the whole muscle force. The
effect is partly due to the increased stiffness of the base material properties that affect the
extent of fibre shortening, lateral expansion of the fibres and thus their interaction with the
aponeuroses. The simulations in this study (M1-M6) were for muscle with uniform
distributions of activity and intramuscular fat. It should be remembered that muscle force
additionally depends on regional variations in muscle activity (Chapter 4 and [36]), fat
distribution (Figure 5.3) and fibre-type composition [23, 169], and that the muscle
contribution to joint torque also depends on its moment arm that can vary with ageing and
obesity [170, 171]. Nonetheless, the results from this study show that the inclusion of
intramuscular fat and the base material properties of the muscle tissue have an important
effect on muscle force.
Chapter 6
Conclusion and future work
The purpose of this thesis was to study some aspects of the structural and functional
mechanisms that affect the mechanical behaviour of muscle-tendon units. Phenomena
such as regionalization of muscle activity, changes in connective tissue stiffness and
changes in muscle architecture and tissue compositions were studied in this work. These
studies were performed by utilizing a three-dimensional (3D) finite element modelling
framework, specifically developed for this thesis. This chapter summarizes the work
presented in the previous chapters, discusses the similarities and differences of this work
with previous studies, the novel methods and approaches used and current difficulties in
studying skeletal muscle using similar frameworks. Finally, suggestions will be presented
for possible future studies based on the experience gained in this work.
6.1 Summary of the thesis
The physiological and biomechanical properties of muscle contractions such as force
development, muscle activation, and the intrinsic properties of muscle, tendon and
aponeurosis tissues were discussed in Chapter 1. This chapter also included a review of
some of the structural parameters that are known to influence muscle function. The
relationships between the structural and functional characteristics of skeletal muscles and
their mechanical output were briefly explained and supported with experimental evidence
from literature. A separate section in Chapter 1 was used to summarize existing
biomechanical modelling approaches for studying skeletal muscle function. The versatility
in the skeletal muscle modelling approaches, achievements and deficits in simulating
93

CHAPTER 6. CONCLUSION AND FUTURE WORK 94
muscle function, some specific questions in muscle physiology that have been studied
using previous models and finally the reasons we have chosen to develop a model using
the mathematical framework presented in the second chapter of this thesis concluded
Chapter 1.
Starting from a continuum description of a nearly-incompressible fibre-reinforced
biomaterial in Chapter 2, we presented constitutive laws that encapsulate many of the
commonly known properties of the muscle-tendon unit. The tissue stress tensors were
defined based on strain-energy functions that possess the transverse symmetry
associated with muscle, tendon and aponeurosis. We explicitly included the fibre
orientation into the strain energy functions using the invariants of the Cauchy-Green
deformation tensor. These invariants also provided other contributions to the strain
energy functions that encode information on the local tissue properties. Eventually, we
used the principle of stationary strain energy to introduce a discrete form of the three field
formulation (equation 2.11) with displacement, pressure and dilation as the independent
fields. This resultant nonlinear equations were iteratively solved at each time-step using a
Newton-Raphson scheme. The introduced computational framework was then used to
study the physiological problems of interest in this thesis in Chapters 3 to 5.
The purpose of Chapter 3 was to validate the represented biomechanics of the
muscle-tendon unit (MTU) using the 3D finite element modelling framework introduced in
Chapter 2. We simulated contractions for an idealized medial/lateral gastrocnemius
muscle in human. Simulations were performed to test the force-length relation of the
whole muscle, to evaluate the changes in internal fascicle geometry during contractions,
and to assess the importance of material formulations for the aponeurosis and tendon.
The simulation results were compared to previously published experimental values. The
force-length curve for the whole muscle showed a realistic profile. As the muscle
contracted, the fascicles curved into S-shaped trajectories and curled around 3D paths,
both of which matched previous experimental findings. As the fascicles shortened they
increased in their cross-sectional area, but this increase was asymmetric with the smaller
increase occurring within the fascicle-plane: the Poisson’s ratio in this plane matched that
previously shown from ultrasound imaging. The distribution of strains in the aponeurosis
and tendon were shown to be a function of their material properties. This chapter
demonstrated that the model could replicate realistic patterns of whole muscle-force, and
CHAPTER 6. CONCLUSION AND FUTURE WORK 95
changes to the internal muscle geometry, and so will be useful for testing mechanisms
that affect the structural changes within contracting muscle.
Skeletal muscle can contain neuromuscular compartments that are spatially distinct
regions that can receive relatively independent levels of activation. The study in Chapter 4
tested how the magnitude and direction of the force developed by a whole muscle would
change when the muscle activity was regionalized within the muscle. The 3D finite
element framework introduced in Chapter 2 was used to develop a model of a human
gastrocnemius muscle with its bounding aponeuroses, and isometric contractions were
simulated for a series of conditions with either a uniform activation pattern, or regionally
distinct activation patterns. In all cases, the mean activation from all fibres within the
muscle reached 10%. The models showed emergent features of the fibre geometry that
matched physiological characteristics: fibres shortening, rotating to greater pennation,
adopting curved trajectories in 3D and changes in the thickness and width of the muscle
belly. Simulations were repeated for muscles with compliant, normal and stiff
aponeurosis. The aponeurosis stiffness affected how the fibre geometry changed, as well
as the resultant muscle force. Changing the regionalization of the activity resulted in
changes in the magnitude, direction and centre of the force vector from the whole muscle.
Regionalizing the muscle activity resulted in greater muscle forces than when uniform
activity was simulated across the muscle belly. The chapter shows how the force from a
muscle depends on the complex interactions between the muscle fibres and connective
tissues and the region of muscle that is active.
Skeletal muscle accumulates intramuscular fat through age and obesity. Muscle quality
is a measure of muscle strength per unit size and decreases in these conditions. It is
not clear how fat influences this loss in performance. Changes to structural parameters
(e.g. fibre pennation and connective tissue properties) affect the muscle quality. The study
presented in Chapter 5 investigated the mechanisms that lead to deterioration in muscle
performance due to changes in intramuscular fat pennation and aponeurosis stiffness. A
finite element model of the human gastrocnemius was used for the purpose of this study.
The base-material properties were modified to include intramuscular fat in five different
ways. All the model variants with fat generated lower fibre stress and muscle quality than
their lean counterparts. This effect is due to the higher stiffness of the muscle tissue in the
fatty models. The fibre deformations influence their interactions with the aponeuroses, and

CHAPTER 6. CONCLUSION AND FUTURE WORK 96
these change with fatty inclusions. Muscles with more compliant aponeuroses generated
lower forces. The muscle quality was further reduced for muscles with lower pennation.
This study shows that whole muscle force is dependent on its base-material properties
and changes to the base-material due to fatty inclusions result in reductions to force and
muscle quality.
6.2 Discussion on research contributions
We reviewed some of the state-of-the-art continuum models of skeletal muscle in
Chapters 1 and 2. We will now discuss the key differences in the physiological and
mathematical aspects of the work presented in this thesis in comparison to those models.
In addition, we will compare our findings in the area of muscle mechanics with previous
experimental studies.
In this thesis we used a three-field formulation for the nonlinear elastic response of a
quasi-incompressible material, based on the work of Simo et al. [172]. Their method has
been in use in last twenty years as the basis of some of the continuum mechanics models
of soft tissue (e.g. [59, 88]). While different models use modified or completely different
approaches to solve the problem, the difference between the outcomes of the many
models [59, 70, 69, 164] are mostly due to their definitions of strain-energy functions for
the transversely isotropic material. As described in Chapter 2, the strain-energy functions
represent the along-fibre, base and nearly incompressible properties of the soft tissue.
The differences arise in the representation of these functions. The first major difference is
whether they are presented as functions of the invariants of the Cauchy-Green
deformation tensor (e.g. Chapter 2, [59]) or not (e.g. [70]). The second difference is
based on the choice and use of invariants in representing the strain energy: the
physically-motivated invariants used by Criscione et al. [85], [59]) or the classical
invariants (e.g. [96, 97]).
Here, we chose simple models based on the classical invariants (e.g. the
Neo-Hookean, Yeoh and Humphery models) for the base properties. Indeed, we allowed
for different tissure to have different models. This approach is unique to this thesis.
Additionally, we derived the derivatives of the along-fibre strain-energy using
stress-stretch curves fitted to experimental data (similar to [59, 88]). We used the
CHAPTER 6. CONCLUSION AND FUTURE WORK 97
simplicity of the base material models to our advantage when we selected the fitting
curves for along-fibre properties of the modelled biomaterials. The curves were fitted to
the experimental data that were collected from the specific muscle-tendon unit (human
gastrocnemius) under study in this thesis. Extra care was taken to have accurate and
continuous fits of the data. While we recognize the importance of the physically based
invariants [85] in connecting the experimental data directly to the mathematical
description of the tissue properties, we also believe there are insufficient data for
specifically muscles along- and cross-fibre stretch as well as along-fibre shear to fully
implement them.
While our model was shown to mathematically predict the deformations of a nonlinear
quasi-incompressible material accurately, we also needed to show that the chosen
material properties are able to predict the changes in structure and function of skeletal
muscles when activated similar to experimental studies. A comparison between the
simulation results with experimental results is presented in Chapter 3. Similar steps have
been done for other modelling frameworks (e.g. [59]). This is a crucial validation step in
mathematical modelling of skeletal muscles and must be repeated when models are
developed for different muscle-tendon units in the body. In other words, while any
validated model would most probably be mathematically valid when used for a different
muscle-tendon unit, the simulation results for biomechanical response of the new specific
MTU need to be reevaluated; and if necessary, adjustments should be made to material
properties describing the tissues.
We introduced an activation transition function between the active and inactive regions
of the muscle tissue in Chapter 2. This novel approach allowed the use of a simple grid
and enabled simulations of submaximal activity in different regions in a skeletal muscle
model (Chapter 4). In addition to a previous experimental study that showed regionalized
activities would change muscle function by producing different torques around a joint [36],
our simulation results showed that substantial differences can arise in the magnitude of
force of a single muscle, when the activity is regionalized. While a previous modelling
study had shown the differences in force for the regionalized activation patterns [68], our
work additionally benefits from a three-dimensional and architecturally detailed framework.
We suspect that the greater difference in force levels across activation patterns, compared
to the previous modelling study [68], was due to the differences in modelling techniques
CHAPTER 6. CONCLUSION AND FUTURE WORK 98
between the two works.
To demonstrate the capacity of the current framework to encompass mixed material
properties (fat and muscle) and to investigate the effect of fat accumulation on the skeletal
muscle function, we developed lean and fatty variants of the human gastrocnemius muscle
(Chapter 5). The results show not only that the fatty muscles in the elderly and obese
humans have smaller output force than the lean muscles but the distribution of fat also
plays a role in the amount of this force deficit. The fat accumulation added an intrinsic
stiffness to the muscle tissue that interfered with force transmission to the aponeurosis
and eventually the tendon. This finding explains one of the reasons that measured human
plantarflexor muscle torques in the elderly and obese are reported to be lower than in
healthy young adults.
The preparation, development and results of this thesis has brought insight into the
role of modelling in biology and physiology of skeletal muscle. The modelling not only
answers questions that are hard to measure in experiments such as regionalizing activity
in skeletal muscles (see Chapter 4), it can also point out the beneficial effects of different
tissues possessing different material properties. For example, we showed that the
difference in aponeurosis and tendon stiffness is a possible mechanism for the
transmission of a higher force from the muscle belly to the tendon (see Chapters 3 to 5).
The lack of established experimental data to develop more realistic models is a major
constraint for current modelling frameworks. This was the case for this study as well,
where parameters related to some of the mechanical behaviours of different tissues were
chosen based on experimental data where available, and physiologically-based
assumptions otherwise.
A major outstanding challenge is the incorporation of dynamic contraction effects, and
this will be addressed in future work. The challenges in incorporating the fast and slow fibre
properties include the common problem of lack of information on the distribution fibre types
in the muscle belly, the need for accurately calculating the along-fibre contraction velocity
by differentiation of the displacement field and the large difference in the force of fast and
slow fibres when the belly is contracting at a certain velocity. The velocity calculations
depend on the ability to solve the more complex nonlinear system which arises for small
time-steps.
This thesis brought novel contributions such as:

CHAPTER 6. CONCLUSION AND FUTURE WORK 99
• Development of a fully flexible computational modelling platform (C++ code) that
allows manipulations of detailed structural and functional parameters of a muscle at
each (quadrature) point in that muscle
• Implementing a novel combination of material models uniquely developed for this
platform that represents an accurate mechanical properties for the human
gastrocnemius muscle.
• Validating the physiology represented by the gastrocnemius muscle model by
comparing the curvature and strain ratios of the simulated fibres (in a fascicle plane)
with those recently reported from experimental studies.
• Creating activation transition functions that allowed modelling of different distributions
of activity in a muscle belly and predicted the force distributions associated with those
activities for the first time in a 3D muscle model.
• Using a combined material description to model fatty muscle tissue for the muscle of
the elderly and obese people
6.3 Perspectives
Modelling skeletal muscles based on continuum mechanics knowledge is at its
beginning. This is in part due to the structural and functional complexities of skeletal
muscles that are yet to be incorporated in these modelling schemes. The capacity to
include different fibre-types in a single muscle model and to recruit those fibres in any
acceptable pattern is one of the many physiological characteristics that need to be
incorporated in the future models. Such physiological details not only allow for a more
accurate study of muscle-tendon units in order to answer conceptual or clinical questions,
but will also be useful when studying the function of muscle groups in musculoskeletal
simulations. Other physiological concepts such as muscle fatigue, history dependent
properties and spasticity in skeletal muscle can also be the focus of the future studies.
While there is lack of experimental information (both structural and functional) to
develop more physiologically detailed muscle models, it is possible to predict some of this
information using inverse methods. For example, it has been common to predict the
CHAPTER 6. CONCLUSION AND FUTURE WORK 100
activity (force) in the individual muscles of the lower extremities during human locomotion
using inverse dynamics and optimization techniques (e.g. [63]). Developing a similar
approach for architecturally detailed continuum models can help in understanding muscle
function by predicting their regionalized activity when the kinematics of the muscle
geometry is used as the input. This is particularly useful when dealing with limitations in
experimental studies such as difficulties in accurate measures of individual muscle
excitation in human neck during swallowing [173].
Whether we choose to run future muscle models in forward or inverse simulations for
their specific purpose, it is clear that the mathematics describing the models should also
be revisited. This could be due to additional physiological details a model must posses to
answer the specific questions it was designed for, or the fact that in larger scale
simulations or multiscale models, the computational cost has to be highly reduced. In
addition, development of more advanced software (codes) that not only handle the
parameters more efficiently but also can be used in parallel processing schemes, will
reduce the time-frame of the future simulations.
In conclusion, modelling and experimental studies complement each other to allow
for the further understanding of any physiological phenomenon. The role of modelling is
to build on the data provided from experiments to predict the possibly hard to measure
parameters. Also, models can simulate cases that have not been measured before or to
test the generality of mechanisms that may even be impossible to elicit physiologically, to
challenge experimentalists and inspire scientific innovations.

Appendix A
Supplementary electronic document
The code developed as part of this thesis is available as a supplementary electronic
document to the thesis.
101
Filename: muscle-model.txt

Bibliography
[1] David A Winter. Biomechanics and motor control of human movement. John Wiley& Sons, 2009. 1
[2] David A Winter, Aftab E Patla, Milad Ishac, and William H Gage. Motor mechanismsof balance during quiet standing. Journal of Electromyography and Kinesiology,13(1):49–56, 2003. 1, 81
[3] Brian R MacIntosh, Phillip F Gardiner, and Alan J McComas. Skeletal muscle: formand function. Human kinetics, 2006. 1
[4] Michelle M Porter, Anthony A Vandervoort, and Jan Lexell. Aging of human muscle:structure, function and adaptability. Scandinavian Journal of Medicine & Science inSports, 5(3):129–142, 1995. 1, 79, 80
[5] Peter M Tiidus. Skeletal muscle damage and repair. Human Kinetics, 2008. 1
[6] Jared RH Foran, Suzanne Steinman, Ilona Barash, Henry G Chambers, andRichard L Lieber. Structural and mechanical alterations in spastic skeletal muscle.Developmental Medicine & Child Neurology, 47(10):713–717, 2005. 1, 79
[7] R. L. Lieber and J. Friden. Functional and clinical significance of skeletal musclearchitecture. Muscle Nerve, 23(11):1647–66, 2000. 1, 2, 79, 89
[8] B. J. van der Linden, H. F. Koopman, H. J. Grootenboer, and P. A. Huijing. Modellingfunctional effects of muscle geometry. J Electromyogr Kinesiol, 8(2):101–9, 1998. 2
[9] Thomas L Wickiewicz, Roland R Roy, Perry L Powell, and V Reggie Edgerton.Muscle architecture of the human lower limb. Clinical Orthopaedics and RelatedResearch, 179:275–283, 1983. 2, 5, 79
[10] T. Fukunaga, Y. Ichinose, M. Ito, Y. Kawakami, and S. Fukashiro. Determinationof fascicle length and pennation in a contracting human muscle in vivo. Journal ofApplied Physiology, 82(1):354–358, 1997. 2
[11] Y. Kawakami, Y. Ichinose, and T. Fukunaga. Architectural and functional featuresof human triceps surae muscles during contraction. Journal of Applied Physiology,85(2):398–404, 1998. 2
[12] C. J. Zuurbier and P. A. Huijing. Influence of muscle geometry on shortening speedof fiber, aponeurosis and muscle. Journal of Biomechanics, 25(9):1017–1026, 1992.2
102

BIBLIOGRAPHY 103
[13] Manku Rana and James M Wakeling. In-vivo determination of 3d musclearchitecture of human muscle using free hand ultrasound. Journal of Biomechanics,44(11):2129–2135, 2011. 2, 47, 62
[14] M. Rana, G. Hamarneh, and J. M. Wakeling. Automated tracking of muscle fascicleorientation in b-mode ultrasound images. J Biomech, 42(13):2068–73, 2009. 2, 47
[15] C. N. Maganaris, V. Baltzopoulos, and A. J. Sargeant. In vivo measurements ofthe triceps surae complex architecture in man: implications for muscle function. JPhysiol, 512 ( Pt 2):603–14, 1998. 2, 56, 76
[16] E. Azizi, E. L. Brainerd, and T. J. Roberts. Variable gearing in pennate muscles.Proceedings of the National Academy of Sciences of the United States of America,105(5):1745–1750, 2008. 261KQ Times Cited:22 Cited References Count:29. 2
[17] A John Harris, Marilyn J Duxson, Jane E Butler, Paul W Hodges, Janet L Taylor,and Simon C Gandevia. Muscle fiber and motor unit behavior in the longest humanskeletal muscle. The Journal of Neuroscience, 25(37):8528–8533, 2005. 2
[18] AM Gordon, Andrew F Huxley, and FJ Julian. The variation in isometric tensionwith sarcomere length in vertebrate muscle fibres. The Journal of Physiology,184(1):170–192, 1966. 2, 41, 91
[19] M. Epstein and W. Herzog. Theoretical models of skeletal muscle. Wiley, Chichester;New York, 1998. 2, 9, 10, 15, 40
[20] A. V. Hill. The heat of shortening and the dynamic constants of muscle. Proceedingsof the Royal Society of London Series B-Biological Sciences, 126(843):136–195,1938. 2, 8, 9, 16, 39
[21] X AUBERT. Relation between strength and speed of extension and contraction ofstriated muscle]. Archives Internationales de Physiologie et de Biochimie, 64(1):121,1956. 2
[22] S. H. Scott and G. E. Loeb. Mechanical properties of aponeurosis and tendonof the cat soleus muscle during whole-muscle isometric contractions. J Morphol,224(1):73–86, 1995. 4
[23] R. E. Burke, D. N. Levine, P. Tsairis, and F. E. III Zajac. Physiological types andhistochemical profiles in motor units of the cat gastrocnemius. J Physiol, 234(3):723–48, 1973. 4, 5, 92
[24] E. F. Hodson-Tole and J. M. Wakeling. Motor unit recruitment for dynamic tasks:current understanding and future directions. Journal of Comparative Physiology B-Biochemical Systemic and Environmental Physiology, 179(1):57–66, 2009. 4
[25] Robert S Staron and Dirk Pette. The continuum of pure and hybrid myosin heavychain-based fibre types in rat skeletal muscle. Histochemistry, 100(2):149–153,1993. 5
[26] CM Chanaud, CA Pratt, and GE Loeb. Functionally complex muscles of the cathindlimb. II. mechanical and architectural heterogenity within the biceps femoris.
BIBLIOGRAPHY 104
Experimental Brain Research. Experimentelle Hirnforschung. ExperimentationCerebrale, 85(2):257–270, 1990. 5, 68
[27] R. E. Burke and P. Tsairis. Correlation of physiological properties with histochemicalcharacteristics in single muscle units. Annals of the New York Academy of Sciences,228(Mar22):145–159, 1974. 6
[28] A. W. English, S. L. Wolf, and R. L. Segal. Compartmentalization of muscles andtheir motor nuclei: the partitioning hypothesis. Physical Therapy, 73(12):857–67,1993. 6, 68
[29] Keir Pearson and James Gordon. Spinal reflexes. Principles of Neural Science,4:726–730, 2000. 6
[30] OCJ Lippold. The relation between integrated action potentials in a human muscleand its isometric tension. The Journal of Physiology, 117(4):492, 1952. 6
[31] LV Heilbrunn and Floyd J Wiercinski. The action of various cations on muscleprotoplasm. Journal of Cellular and Comparative Physiology, 29(1):15–32, 1947.6
[32] H Portzehl, PCj Caldwell, et al. The dependence of contraction and relaxationof muscle fibres from the crab Maia squinado on the internal concentration offree calcium ions. Biochimica et Biophysica Acta (BBA)-Specialized Section onBiophysical Subjects, 79(3):581–591, 1964. 6
[33] A. W. English and O. I. Weeks. An anatomical and functional analysis of cat bicepsfemoris and semitendinosus muscles. Journal of Morphology, 191(2):161–75, 1987.6, 68
[34] E. A. Keshner, D. Campbell, R. T. Katz, and B. W. Peterson. Neck muscleactivation patterns in humans during isometric head stabilization. Experimental BrainResearch, 75(2):335–344, 1989. 6
[35] Yuri Ivanenko, Richard Poppele, and Francesco Lacquaniti. Motor control programsand walking. The Neuroscientist, 12(4):339–348, 2006. 6
[36] Dario I Carrasco, John Lawrence, and Arthur W English. Neuromuscularcompartments of cat lateral gastrocnemius produce different torques about the anklejoint. Motor Control, 3(4):436–446, 1999. 6, 54, 68, 69, 77, 92, 97
[37] J. M. Wakeling, M. Kaya, G. K. Temple, I. A. Johnston, and W. Herzog. Determiningpatterns of motor recruitment during locomotion. J Exp Biol, 205(Pt 3):359–69, 2002.6
[38] EF Hodson-Tole and JM Wakeling. Variations in motor unit recruitment patternsoccur within and between muscles in the running rat (rattus norvegicus). Journal ofExperimental Biology, 210(13):2333–2345, 2007. 6
[39] E. Henneman. Relation between size of neurons and their susceptibility to discharge.Science, 126(3287):1345–7, 1957. 6
BIBLIOGRAPHY 105
[40] E. Henneman, G. Somjen, and Carpente.Do. Excitability and inhibitibility ofmotoneurons of different sizes. Journal of Neurophysiology, 28(3):599–&, 1965.6
[41] E. Henneman, G. Somjen, and Carpente.Do. Functional significance of cell size inspinal motoneurons. Journal of Neurophysiology, 28(3):560–&, 1965. 6
[42] A. M. McPhedran, R. B. Wuerker, and E. Henneman. Properties of motor units in aheterogeneous pale muscle (m. gastrocnemius) of the cat. J Neurophysiol, 28:85–99, 1965. 6
[43] E. Henneman and C. B. Olson. Relations between structure and function in thedesign of skeletal muscles. Journal of Neurophysiology, 28:581–98, 1965. 6
[44] J. A. Hoffer, G. E. Loeb, W. B. Marks, M. J. Odonovan, C. A. Pratt, and N. Sugano.Cat hindlimb motoneurons during locomotion .1. destination, axonal conduction-velocity, and recruitment threshold. Journal of Neurophysiology, 57(2):510–529,1987. 7
[45] J-Y Hogrel. Use of surface emg for studying motor unit recruitment during isometriclinear force ramp. Journal of Electromyography and Kinesiology, 13(5):417–423,2003. 7
[46] G. E. Loeb. Motoneurone task groups: coping with kinematic heterogeneity. J ExpBiol, 115:137–46, 1985. Loeb, G E England The Journal of experimental biology JExp Biol. 1985 Mar;115:137-46. 7
[47] J. M. Wakeling. Motor units are recruited in a task-dependent fashion duringlocomotion. J Exp Biol, 207(Pt 22):3883–90, 2004. 7
[48] RI Griffiths. Shortening of muscle fibres during stretch of the active cat medialgastrocnemius muscle: the role of tendon compliance. The Journal of Physiology,436(1):219–236, 1991. 7
[49] T. J. Roberts, R. L. Marsh, P. G. Weyand, and C. R. Taylor. Muscular force in runningturkeys: the economy of minimizing work. Science, 275(5303):1113–5, 1997. 7
[50] Michael H Dickinson, Claire T Farley, Robert J Full, MAR Koehl, Rodger Kram, andSteven Lehman. How animals move: an integrative view. Science, 288(5463):100–106, 2000. 7
[51] T. A. Wren, S. A. Yerby, G. S. Beaupre, and D. R. Carter. Mechanical propertiesof the human achilles tendon. Clinical Biomechanics (Bristol, Avon), 16(3):245–51,2001. 7, 24, 69
[52] S. P. Magnusson, P. Aagaard, P. Dyhre-Poulsen, and M. Kjaer. Load-displacementproperties of the human triceps surae aponeurosis in vivo. J Physiol, 531(Pt 1):277–88, 2001. 7, 24
[53] F. E. Zajac. Muscle and tendon - properties, models, scaling, and applicationto biomechanics and motor control. Critical Reviews in Biomedical Engineering,17(4):359–411, 1989. 7, 9, 15, 34, 69
BIBLIOGRAPHY 106
[54] S. P. Magnusson, P. Hansen, P. Aagaard, J. Brnd, P. Dyhre-Poulsen, J. Bojsen-Moller, and M. Kjaer. Differential strain patterns of the human gastrocnemiusaponeurosis and free tendon, in vivo. Acta Physiologica Scandinavica, 177(2):185–195, 2003. xiii, 7, 24, 25, 29, 30, 31, 69
[55] R. McNeill Alexander. Mechanics of animal locomotion. Springer-Verlag, Berlin; NewYork, 1992. 8
[56] Rodolfo Margaria. Biomechanics and energetics of muscular exercise. ClarendonPress, Oxford [Eng.], 1976. 8
[57] F. Haas and R. J. Wootton. Two basic mechanisms in insect wing folding.Proceedings of the Royal Society of London Series B-Biological Sciences,263(1377):1651–1658, 1996. 8
[58] C. P. Ellington, C. vandenBerg, A. P. Willmott, and A. L. R. Thomas. Leading-edgevortices in insect flight. Nature, 384(6610):626–630, 1996. 8
[59] S. S. Blemker, P. M. Pinsky, and S. L. Delp. A 3d model of muscle reveals the causesof nonuniform strains in the biceps brachii. Journal of Biomechanics, 38(4):657–65,2005. 8, 10, 11, 12, 16, 24, 29, 34, 40, 53, 69, 89, 96, 97
[60] Hugh Huxley and Jean Hanson. Changes in the cross-striations of muscle duringcontraction and stretch and their structural interpretation. Nature, 173(4412):973–976, 1954. 9, 16
[61] S. L. Delp, J. P. Loan, M. G. Hoy, F. E. Zajac, E. L. Topp, and J. M. Rosen. Aninteractive graphics-based model of the lower extremity to study orthopaedic surgicalprocedures. IEEE Transactions on Bio-medical Engineering, 37(8):757–67, 1990. 9,69
[62] S. L. Delp and J. P. Loan. A graphics-based software system to develop and analyzemodels of musculoskeletal structures. Comput Biol Med, 25(1):21–34, 1995. 9, 15
[63] M. G. Pandy, F. E. Zajac, E. Sim, and W. S. Levine. An optimal control model formaximum-height human jumping. J Biomech, 23(12):1185–98, 1990. 9, 100
[64] E. Otten. Concepts and models of functional architecture in skeletal muscle. ExercSport Sci Rev, 16:89–137, 1988. 9
[65] J. L. Van Leeuwen and C. W. Spoor. Modelling mechanically stable musclearchitectures. Philosophical transactions of the Royal Society of London. SeriesB, Biological sciences, 336(1277):275–92, 1992. 9, 10, 15, 62, 69, 76
[66] J. L. Van Leeuwen and C. W. Spoor. Modelling the pressure and force equilibriumin unipennate muscles with in-line tendons. Philosophical Transactions: BiologicalSciences, 342(1302):321–333, 1993. 9, 10, 15
[67] J. L. Van Leeuwen and C. W. Spoor. A two dimensional model for the prediction ofmuscle shape and intramuscular pressure. Eur J Morphol, 34(1):25–30, 1996. 9, 10
[68] E. Otten and M. Hulliger. A finite-elements approach to the study of functionalarchitecture in skeletal-muscle. Zoology-Analysis of Complex Systems, 98(4):233–242, 1994. 10, 11, 12, 15, 69, 77, 97
BIBLIOGRAPHY 107
[69] C. W. Oomens, M. Maenhout, C. H. van Oijen, M. R. Drost, and F. P. Baaijens. Finiteelement modelling of contracting skeletal muscle. Philosophical Transactions of theRoyal Society of London. Series B, Biological Sciences, 358(1437):1453–60, 2003.10, 11, 12, 16, 53, 69, 89, 96
[70] M. Bol and S. Reese. Micromechanical modelling of skeletal muscles based onthe finite element method. Computer Methods in Biomechanics and BiomedicalEngineering, 11(5):489–504, 2008. 10, 11, 12, 15, 29, 53, 69, 89, 96
[71] David T Chen and David Zeltzer. Pump it up: Computer animation of abiomechanically based model of muscle using the finite element method, volume 26.ACM, 1992. 10
[72] Michael Hayes and Giuseppe Saccomandi. Topics in Finite Elasticity. Number 424.Springer, 2001. 11
[73] T. Johansson, P. Meier, and R. Blickhan. A finite-element model for the mechanicalanalysis of skeletal muscles. J Theor Biol, 206(1):131–49, 2000. 11, 12, 16
[74] C. A. Yucesoy, B. H. Koopman, P. A. Huijing, and H. J. Grootenboer. Three-dimensional finite element modeling of skeletal muscle using a two-domainapproach: linked fiber-matrix mesh model. Journal of Biomechanics, 35(9):1253–1262, 2002. 11, 12, 16
[75] O. Rohrle and A. J. Pullan. Three-dimensional finite element modelling of muscleforces during mastication. Journal of Biomechanics, 40(15):3363–3372, 2007. 11,12, 16
[76] G. P. Pappas, D. S. Asakawa, S. L. Delp, F. E. Zajac, and J. E. Drace. Nonuniformshortening in the biceps brachii during elbow flexion. J Appl Physiol, 92(6):2381–9,2002. 12
[77] M. R. Rehorn and S. S. Blemker. The effects of aponeurosis geometry on straininjury susceptibility explored with a 3d muscle model. Journal of Biomechanics,43(13):2574–81, 2010. 12, 77
[78] Hadi Rahemi, Nilima Nigam, and James M Wakeling. Regionalizing muscle activitycauses changes to the magnitude and direction of the force from whole musclesamodeling study. Frontiers in Physiology, 5, 2014. 13
[79] M. Kojic, S. Mijailovic, and N. Zdravkovic. Modelling of muscle behaviour by thefinite element method using hill’s three-element model. International Journal forNumerical Methods in Engineering, 43(5):941–+, 1998. 129WA Times Cited:12Cited References Count:12. 16
[80] Walter Herzog. Skeletal muscle mechanics: from mechanisms to function. JohnWiley & Sons, 2000. 16
[81] W Michael Lai, David H Rubin, David Rubin, and Erhard Krempl. Introduction tocontinuum mechanics. Butterworth-Heinemann, 2009. 17
[82] AJM Spencer. Continuum Mechanics. Longman Mathematical Texts, Longman, NewYork, 1980. 17
BIBLIOGRAPHY 108
[83] Anthony James Merrill Spencer. Continuum theory of the mechanics of fibre-reinforced composites. Springer-Verlag, Wien; New York, 1984. 17, 21, 23
[84] R. J. Baskin and P. J. Paolini. Volume change and pressure development in muscleduring contraction. American Journal of Physiology, 213(4):1025–&, 1967. A0613Times Cited:29 Cited References Count:10. 17, 63
[85] J. C. Criscione, A. S. Douglas, and W. C. Hunter. Physically based strain invariant setfor materials exhibiting transversely isotropic behavior. Journal of the Mechanics andPhysics of Solids, 49(4):871–897, 2001. 414PU Times Cited:33 Cited ReferencesCount:12. 21, 23, 96, 97
[86] D. A. Morrow, T. L. Haut Donahue, G. M. Odegard, and K. R. Kaufman. Transverselyisotropic tensile material properties of skeletal muscle tissue. J Mech Behav BiomedMater, 3(1):124–9, 2010. 21, 33, 34
[87] Michael Takaza, Kevin M Moerman, Juliette Gindre, Garry Lyons, and Ciaran KSimms. The anisotropic mechanical behaviour of passive skeletal muscle tissuesubjected to large tensile strain. Journal of the mechanical behavior of biomedicalmaterials, 2012. 21, 33, 34
[88] J. A. Weiss, B. N. Maker, and S. Govindjee. Finite element implementation ofincompressible, transversely isotropic hyperelasticity. Computer Methods in AppliedMechanics and Engineering, 135(1-2):107–128, 1996. Vh435 Times Cited:189 CitedReferences Count:34. 21, 24, 96
[89] Gerhard A Holzapfel. Nonlinear solid mechanics: a continuum approach forengineering. 2000. 22, 27
[90] MATLAB. version 8.3.0 (R2014a). The MathWorks Inc., Natick, Massachusetts,2014. 23
[91] Spencer P Lake, Kristin S Miller, Dawn M Elliott, and Louis J Soslowsky. Tensileproperties and fiber alignment of human supraspinatus tendon in the transversedirection demonstrate inhomogeneity, nonlinearity, and regional isotropy. Journalof Biomechanics, 43(4):727–732, 2010. 24, 69
[92] Heather Anne Lynch, Wade Johannessen, Jeffrey P Wu, Andrew Jawa, and Dawn MElliott. Effect of fiber orientation and strain rate on the nonlinear uniaxial tensilematerial properties of tendon. Journal of biomechanical engineering, 125(5):726–731, 2003. 24, 26
[93] Dawn M Elliott and Lori A Setton. Anisotropic and inhomogeneous tensile behaviorof the human anulus fibrosus: experimental measurement and material modelpredictions. Journal of biomechanical engineering, 123(3):256–263, 2001. 24
[94] KM Quapp and JA Weiss. Material characterization of human medial collateralligament. Journal of biomechanical engineering, 120(6):757–763, 1998. 24
[95] C. N. Maganaris and J. P. Paul. In vivo human tendinous tissue stretch uponmaximum muscle force generation. J Biomech, 33(11):1453–9, 2000. 24, 69

BIBLIOGRAPHY 109
[96] RS Rivlin. Large elastic deformations of isotropic materials. iv. further developmentsof the general theory. Philosophical Transactions of the Royal Society of London.Series A, Mathematical and Physical Sciences, 241(835):379–397, 1948. 26, 30, 96
[97] OH Yeoh. Some forms of the strain energy function for rubber. Rubber Chemistryand technology, 66(5):754–771, 1993. 26, 96
[98] P. A. L. S. Martins, R. M. Natal Jorge, and A. J. M. Ferreira. A comparative studyof several material models for prediction of hyperelastic properties: Application tosilicone-rubber and soft tissues. Strain, 42(3):135–147, 2006. 26
[99] E. Azizi, G. M. Halenda, and T. J. Roberts. Mechanical properties of thegastrocnemius aponeurosis in wild turkeys. Integrative and Comparative Biology,49(1):51–58, 2009. 465QO Times Cited:2 Cited References Count:30. 29, 30, 69
[100] JD Humphrey and FCP Yin. On constitutive relations and finite deformations ofpassive cardiac tissue: I. a pseudostrain-energy function. Journal of BiomechanicalEngineering, 109(4):298–304, 1987. 30
[101] Xu Nie, Jen-I Cheng, Weinong W Chen, and Tusit Weerasooriya. Dynamic tensileresponse of porcine muscle. Journal of applied mechanics, 78(2), 2011. 33
[102] Allison R Gillies and Richard L Lieber. Structure and function of the skeletal muscleextracellular matrix. Muscle & nerve, 44(3):318–331, 2011. 33, 34
[103] EMH Bosboom, MKC Hesselink, CWJ Oomens, CVC Bouten, MR Drost, and FPTBaaijens. Passive transverse mechanical properties of skeletal muscle under in vivocompression. Journal of Biomechanics, 34(10):1365–1368, 2001. xiii, 37, 38
[104] Yong-Ping Zheng, Arthur FT Mak, and Bokong Lue. Objective assessment oflimb tissue elasticity: development of a manual indentation procedure. Journal ofRehabilitation Research and Development, 1999. xiii, 37, 38
[105] M Van Loocke, CG Lyons, and CK Simms. A validated model of passive muscle incompression. Journal of Biomechanics, 39(16):2999–3009, 2006. xiii, 37, 38
[106] AP Grieve and CG Armstrong. Compressive properties of soft tissue. In G De Groot,AP Hollander, PA Huijing, and GJ van Ingen Schenau, editors, Biomechanics XI-A,International Series on Biomechanics, pages 531–536. Free University Press, 1988.xiii, 37, 38
[107] James M Wakeling, Sabrina SM Lee, Allison S Arnold, Maria de Boef Miara, andAndrew A Biewener. A muscles force depends on the recruitment patterns of itsfibers. Annals of biomedical engineering, 40(8):1708–1720, 2012. xi, 42
[108] Christine Tanner, Julia A Schnabel, Derek LG Hill, David J Hawkes, Martin O Leach,and D Rodney Hose. Factors influencing the accuracy of biomechanical breastmodels. Medical Physics, 33(6):1758–1769, 2006. 43, 91
[109] AN Natali, CG Fontanella, and EL Carniel. A numerical model for investigatingthe mechanics of calcaneal fat pad region. Journal of the Mechanical Behavior ofBiomedical Materials, 5(1):216–223, 2012. 43, 82, 91

BIBLIOGRAPHY 110
[110] R. K. Josephson. Dissecting muscle power output. J Exp Biol, 202(Pt 23):3369–75,1999. Josephson, R K Research Support, U.S. Gov’t, Non-P.H.S. Review EnglandThe Journal of experimental biology J Exp Biol. 1999 Dec;202(Pt 23):3369-75. 43
[111] W. Bangerth, T. Heister, L. Heltai, G. Kanschat, M. Kronbichler, M. Maier, B. Turcksin,and T. D. Young. The deal.ii library, version 8.1. arXiv preprint http: // arxiv.org/ abs/ 1312. 2266v4 , 2013. 16, 45, 55
[112] Manku Rana, Ghassan Hamarneh, and James M Wakeling. 3d fascicle orientationsin triceps surae. Journal of Applied Physiology, 115(1):116–125, 2013. 47, 53, 54,62, 63, 76
[113] Drew A Lansdown, Zhaohua Ding, Megan Wadington, Jennifer L Hornberger, andBruce M Damon. Quantitative diffusion tensor mri-based fiber tracking of humanskeletal muscle. Journal of Applied Physiology, 103(2):673–681, 2007. 47
[114] Ana IL Namburete, Manku Rana, and James M Wakeling. Computational methodsfor quantifying in vivo muscle fascicle curvature from ultrasound images. Journal ofBiomechanics, 44(14):2538–2543, 2011. xiv, xv, 54, 59, 62, 63, 66
[115] Emma F Hodson-Tole, Ian D Loram, and Taian MM Vieira. Myoelectric activityalong human gastrocnemius medialis: Different spatial distributions of postural andelectrically elicited surface potentials. Journal of Electromyography and Kinesiology,23(1):43–50, 2013. 54
[116] Ryuta Kinugasa, Yasuo Kawakami, Shantanu Sinha, and Tetsuo Fukunaga. Uniquespatial distribution of in vivo human muscle activation. Experimental Physiology,96(9):938–948, 2011. 54
[117] D Staudenmann, I Kingma, A Daffertshofer, DF Stegeman, and JH Van Dieen.Heterogeneity of muscle activation in relation to force direction: A multi-channelsurface electromyography study on the triceps surae muscle. Journal ofElectromyography and Kinesiology, 19(5):882–895, 2009. 54
[118] Avleen Randhawa, Meghan E Jackman, and James M Wakeling. Muscle gearingduring isotonic and isokinetic movements in the ankle plantarflexors. EuropeanJournal of Applied Physiology, 113(2):437–447, 2013. 55, 63, 69, 81
[119] James M Wakeling and Avleen Randhawa. Transverse strains in muscle fasciclesduring voluntary contraction: a 2d frequency decomposition of b-mode ultrasoundimages. International Journal of Biomedical Imaging, 2014, 2014. xii, 59, 61, 63, 89
[120] Ben W Hoffman, Glen A Lichtwark, Timothy John Carroll, and Andrew G Cresswell.A comparison of two hill-type skeletal muscle models on the construction ofmedial gastrocnemius length-tension curves in humans in vivo. Journal of AppliedPhysiology, 113(1):90–96, 2012. xv, 65
[121] Constantinos N Maganaris, Vasilios Baltzopoulos, Derek Ball, and Anthony JSargeant. In vivo specific tension of human skeletal muscle. Journal of AppliedPhysiology, 90(3):865–872, 2001. xv, 65, 79
BIBLIOGRAPHY 111
[122] Benjamin Gilles, Laurent Moccozet, and Nadia Magnenat-Thalmann. Anatomicalmodelling of the musculoskeletal system from mri. In Medical Image Computing andComputer-Assisted Intervention–MICCAI 2006, pages 289–296. Springer, 2006. 62
[123] Anneriet M Heemskerk, Tuhin K Sinha, Kevin J Wilson, Zhaohua Ding, and Bruce MDamon. Quantitative assessment of dti-based muscle fiber tracking and optimaltracking parameters. Magnetic Resonance in Medicine, 61(2):467–472, 2009. 62
[124] AM Heemskerk, Z Ding, TK Sinha, KJ Wilson, and BM Damon. In vivo musclefiber curvature measurements using dt-mri. In International Society for MagneticResonance in Medicine 19th Annual Meeting. Montreal, QC, Canada, pages 7–13,2011. 62
[125] Benjamin W Infantolino, Thomas Neuberger, and John H Challis. The arrangementof fascicles in whole muscle. The Anatomical Record, 295(7):1174–1180, 2012. 62
[126] G. Sjogaard, B. Kiens, K. Jorgensen, and B. Saltin. Intramuscular pressure, emgand blood flow during low-level prolonged static contraction in man. Acta PhysiolScand, 128(3):475–84, 1986. 62
[127] OM Sejersted, ALAN R Hargens, KIRSTIN R Kardel, P Blom, Oy Jensen, and LARSHermansen. Intramuscular fluid pressure during isometric contraction of humanskeletal muscle. Journal of Applied Physiology, 56(2):287–295, 1984. 62, 76
[128] B. Maton, G. Thiney, A. Ouchene, P. Flaud, and P. Barthelemy. Intramuscularpressure and surface emg in voluntary ankle dorsal flexion: Influence of elasticcompressive stockings. J Electromyogr Kinesiol, 16(3):291–302, 2006. 62
[129] JL Van Leeuwen and CW Spoor. A two dimensional model for the predictionof muscle shape and intramuscular pressure. European Journal of Morphology,34(1):25–30, 1995. 62
[130] Manku Rana, Ghassan Hamarneh, and James Michael Wakeling. 3d curvature ofmuscle fascicles in triceps surae. Journal of Applied Physiology, 2014. 63
[131] Taija Finni, John A Hodgson, Alex M Lai, V Reggie Edgerton, and Shantanu Sinha.Nonuniform strain of human soleus aponeurosis-tendon complex during submaximalvoluntary contractions in vivo. Journal of applied physiology, 95(2):829–837, 2003.64
[132] Tadashi Muramatsu, Tetsuro Muraoka, Daisuke Takeshita, Yasuo Kawakami, YuichiHirano, and Tetsuo Fukunaga. Mechanical properties of tendon and aponeurosis ofhuman gastrocnemius muscle in vivo. Journal of Applied Physiology, 90(5):1671–1678, 2001. 64
[133] James M Wakeling and Sabrina SM Lee. Modelling muscle forces: from scaledfibres to physiological task-groups. Procedia IUTAM, 2:317–326, 2011. 64, 78
[134] Susan W Herring, Fred C Anapol, and Lawrence E Wineski. Neural organization ofthe masseter muscle in the pig. Journal of Comparative Neurology, 280(4):563–576,1989. 68
BIBLIOGRAPHY 112
[135] SW Herring, FC Anapol, and LE Wineski. Motor-unit territories in the massetermuscle of infant pigs. Archives of Oral Biology, 36(12):867–873, 1991. 68
[136] Peter A Huijing. Muscular force transmission necessitates a multilevel integrativeapproach to the analysis of function of skeletal muscle. Exercise and Sport SciencesReviews, 31(4):167–175, 2003. 69
[137] ARTHUR W English. An electromyographic analysis of compartments in cat lateralgastrocnemius muscle during unrestrained locomotion. Journal of Neurophysiology,52(1):114–125, 1984. 69
[138] James M Wakeling. Patterns of motor recruitment can be determined using surfaceemg. Journal of Electromyography and Kinesiology, 19(2):199–207, 2009. 69
[139] Emma F Hodson-Tole, Ian D Loram, and Taian MM Vieira. Myoelectric activityalong human gastrocnemius medialis: Different spatial distributions of postural andelectrically elicited surface potentials. Journal of Electromyography and Kinesiology,23(1):43–50, 2013. 69
[140] Gladys L Onambele, Marco V Narici, and Constantinos N Maganaris. Calf muscle-tendon properties and postural balance in old age. Journal of Applied Physiology,100(6):2048–2056, 2006. 69, 80, 92
[141] Keitaro Kubo, Hiroaki Kanehisa, and Tetsuo Fukunaga. Effects of resistance andstretching training programmes on the viscoelastic properties of human tendonstructures in vivo. The Journal of Physiology, 538(1):219–226, 2002. 69
[142] Adamantios Arampatzis, Kiros Karamanidis, Gaspar Morey-Klapsing, GianpieroDe Monte, and Savvas Stafilidis. Mechanical properties of the triceps surae tendonand aponeurosis in relation to intensity of sport activity. Journal of Biomechanics,40(9):1946–1952, 2007. 69
[143] Robson R Lemos, Marcelo Epstein, and Walter Herzog. Modeling of skeletalmuscle: the influence of tendon and aponeuroses compliance on the force–lengthrelationship. Medical & Biological Engineering & Computing, 46(1):23–32, 2008. 77
[144] Archibald Vivian Hill. First and last experiments in muscle mechanics. UniversityPress Cambridge, 1970. 78
[145] M. A. Johnson, J. Polgar, D. Weightman, and D. Appleton. Data on the distribution offibre types in thirty-six human muscles. an autopsy study. J Neurol Sci, 18(1):111–29, 1973. 79
[146] P Malenfant, DR Joanisse, R Theriault, BH Goodpaster, DE Kelley, andJA Simoneau. Fat content in individual muscle fibers of lean and obese subjects.International Journal of Obesity and Related Metabolic Disorders: Journal of theInternational Association for the Study of Obesity, 25(9):1316–1321, 2001. 79, 80
[147] D. J. Tomlinson, R. M. Erskine, K. Winwood, C. I. Morse, and G. L. Onambele. Theimpact of obesity on skeletal muscle architecture in untrained young vs. old women.Journal of Anatomy, 225(6):675–684, 2014. 80, 81
BIBLIOGRAPHY 113
[148] Nicola A Maffiuletti, Marc Jubeau, Urs Munzinger, Mario Bizzini, Fiorenza Agosti,Alessandra De Col, Claudio L Lafortuna, and Alessandro Sartorio. Differences inquadriceps muscle strength and fatigue between lean and obese subjects. EuropeanJournal of Applied Physiology, 101(1):51–59, 2007. 80
[149] D.J. Tomlinson, R.M. Erskine, C.I. Morse, K. Winwood, and G.L. Onambele-Pearson.Combined effects of body composition and ageing on joint torque, muscle activationand co-contraction in sedentary women. AGE, 36(3), 2014. 80
[150] Nina F Schwenzer, Petros Martirosian, Jurgen Machann, Christina Schraml, GunterSteidle, Claus D Claussen, and Fritz Schick. Aging effects on human calf muscleproperties assessed by MRI at 3 Tesla. Journal of Magnetic Resonance Imaging,29(6):1346–1354, 2009. 80
[151] Irwin H Rosenberg. Sarcopenia: origins and clinical relevance. The Journal ofNutrition, 127(5):990S–991S, 1997. 80
[152] William J Evans. Skeletal muscle loss: cachexia, sarcopenia, and inactivity. TheAmerican Journal of Clinical Nutrition, 91(4):1123S–1127S, 2010. 80
[153] RP Hubbard and RW Soutas-Little. Mechanical properties of human tendon and theirage dependence. Journal of Biomechanical Engineering, 106(2):144–150, 1984. 80
[154] ROBERT E Shadwick. Elastic energy storage in tendons: mechanical differencesrelated to function and age. J Appl Physiol, 68(3):1033–1040, 1990. 80
[155] Lauri Stenroth, Jussi Peltonen, Neil J Cronin, Sarianna Sipila, and Taija Finni.Age-related differences in achilles tendon properties and triceps surae musclearchitecture in vivo. Journal of Applied Physiology, 113(10):1537–1544, 2012. 80,92
[156] Robert Csapo, Vadim Malis, J Hodgson, and Shantanu Sinha. Age-related greaterachilles tendon compliance is not associated with larger plantar flexor musclefascicle strains in senior women. Journal of Applied Physiology, 116(8):961–969,2014. 80, 92
[157] Bret H Goodpaster, V Andrew Stenger, Fernando Boada, Therese McKolanis,Denise Davis, Robert Ross, and David E Kelley. Skeletal muscle lipid concentrationquantified by magnetic resonance imaging. The American Journal of ClinicalNutrition, 79(5):748–754, 2004. 80
[158] Robert Csapo, Vadim Malis, Usha Sinha, Jiang Du, and Shantanu Sinha. Age-associated differences in triceps surae muscle composition and strength-an mri-based cross-sectional comparison of contractile, adipose and connective tissue.BMC Musculoskeletal Disorders, 15(1):209, 2014. 80
[159] Bret H Goodpaster, Remy Theriault, Simon C Watkins, and David E Kelley.Intramuscular lipid content is increased in obesity and decreased by weight loss.Metabolism, 49(4):467–472, 2000. 80
[160] Juha-Pekka Kulmala, Marko T Korhonen, Sami Kuitunen, Harri Suominen, AriHeinonen, Aki Mikkola, and Janne Avela. Which muscles compromise human

BIBLIOGRAPHY 114
locomotor performance with age? Journal of The Royal Society Interface,11(100):20140858, 2014. 81
[161] Darryl G Thelen. Adjustment of muscle mechanics model parameters to simulatedynamic contractions in older adults. Journal of Biomechanical Engineering,125(1):70–77, 2003. 88
[162] Christopher J Hasson and Graham E Caldwell. Effects of age on mechanicalproperties of dorsiflexor and plantarflexor muscles. Annals of BiomedicalEngineering, 40(5):1088–1101, 2012. 89
[163] Zachary F Lerner, Wayne J Board, and Raymond C Browning. Effects of obesityon lower extremity muscle function during walking at two speeds. Gait & posture,39(3):978–984, 2014. 89
[164] John A Hodgson, Sheng-Wei Chi, Judy P Yang, Jiun-Shyan Chen, Victor REdgerton, and Shantanu Sinha. Finite element modeling of passive materialinfluence on the deformation and force output of skeletal muscle. Journal of theMechanical Behavior of Biomedical Materials, 9:163–183, 2012. 89, 96
[165] MV Narici, L Landoni, and AE Minetti. Assessment of human knee extensor musclesstress from in vivo physiological cross-sectional area and strength measurements.European Journal of Applied Physiology and Occupational Physiology, 65(5):438–444, 1992. 89
[166] NA Lynch, EJ Metter, RS Lindle, JL Fozard, JD Tobin, TA Roy, JL Fleg, andBF Hurley. Muscle quality. i. age-associated differences between arm and leg musclegroups. Journal of Applied Physiology, 86(1):188–194, 1999. 89, 91
[167] E Jeffrey Metter, Nicole Lynch, Robin Conwit, Rosemary Lindle, Jordan Tobin, andBen Hurley. Muscle quality and age: cross-sectional and longitudinal comparisons.The Journals of Gerontology Series A: Biological Sciences and Medical Sciences,54(5):B207–B218, 1999. 89, 91
[168] David E Kelley. Skeletal muscle triglycerides. Annals of the New York Academy ofSciences, 967(1):135–145, 2002. 91
[169] DG Sale, JD MacDougall, SE Alway, and JR Sutton. Voluntary strength and musclecharacteristics in untrained men and women and male bodybuilders. Journal ofApplied Physiology, 62(5):1786–1793, 1987. 92
[170] Constantinos N Maganaris, Vasilios Baltzopoulos, and Anthony J Sargeant.Changes in achilles tendon moment arm from rest to maximum isometricplantarflexion: in vivo observations in man. The Journal of Physiology, 510(3):977–985, 1998. 92
[171] S Fukashiro, PV Komi, M Jarvinen, and M Miyashita. Comparison between thedirectly measured achilles tendon force and the tendon force calculated from theankle joint moment during vertical jumps. Clinical Biomechanics, 8(1):25–30, 1993.92

BIBLIOGRAPHY 115
[172] JC Simo, RL Taylor, and KS Pister. Variational and projection methods for the volumeconstraint in finite deformation elasto-plasticity. Computer Methods in AppliedMechanics and Engineering, 51(1):177–208, 1985. 96
[173] Christy L Ludlow, Frederick Van Pelt, James Yeh, Karen Rhew, Leonardo G Cohen,and Mark Hallett. Limitations of electromyography and magnetic stimulation forassessing laryngeal muscle control. Annals of Otology, Rhinology & Laryngology,103(1):16–27, 1994. 100
Related Documents