REVIEW Structural Magnetic Resonance Imaging in Eating Disorders: A Systematic Review of Voxel-Based Morphometry Studies Frederique Van den Eynde 1 * ,† , Masashi Suda 1† , Hannah Broadbent 1† , Sébastien Guillaume 1,2 , Magali Van den Eynde 1 , Howard Steiger 3 , Mimi Israel 3 , Marcelo Berlim 4 , Vincent Giampietro 5 , Andrew Simmons 5,6 , Janet Treasure 1 , Iain Campbell 1 & Ulrike Schmidt 1 1 King’s College London, Institute of Psychiatry, Department of Psychological Medicine, Section of Eating Disorders, London, UK 2 Universite Montpellier, INSERM U1061, CHU de Montpellier, Montpellier, France 3 Douglas University Institute, Psychiatry Department, McGill University, Eating Disorders Program, Montreal, Quebec, Canada 4 Douglas University Institute, Psychiatry Department, McGill University, Depressive Disorders Program, Montreal, Quebec, Canada 5 King’s College London, Institute of Psychiatry, Department of Neuroimaging, London, UK 6 NIHR Biomedical Research Centre for Mental Health at South London and Maudsley NHS Foundation Trust and Institute of Psychiatry, King’s College London Abstract This systematic review summarises and critically appraises the literature on structural magnetic resonance imaging in people with a current or past eating disorder. Studies using voxel-based morphometry image analysis were included. Ten studies reported on a total of 236 people with a current or past eating disorder and 257 healthy controls. Sample heterogeneity prohibited a meta-analytic approach. The findings do not unequivocally indicate grey or white matter volume abnormalities in people with an eating disorder. Nevertheless, these preliminary data suggest that, compared with healthy controls, people with anorexia nervosa have decreased grey matter in a range of brain regions and that those with bulimia nervosa have increased grey matter volumes in frontal and ventral striatal areas. Research in the recovery phase and longitudinal studies suggest that potential brain tissue abnormalities may recover with clinical improvement. Overall, as the available data are inconclusive, further efforts in this field are warranted. Copyright © 2011 John Wiley & Sons, Ltd and Eating Disorders Association. Keywords neuroimaging; voxel-based morphometry; anorexia nervosa; bulimia nervosa; systematic review *Correspondence Frederique Van den Eynde, Department of Psychological Medicine, Section of Eating Disorders, King’s College London, Institute of Psychiatry, De Crespigny Park, London, SE5 8AF, UK. Tel: 00442078480160; Fax: 00442078480182. E-mail: [email protected] † FVDE, MS and HB have equally contributed to the manuscript. Published online in Wiley Online Library (wileyonlinelibrary.com) DOI: 10.1002/erv.1163 Introduction Multidisciplinary translational and clinical research has increased insight into the neurocircuitry of eating disorder pathology (Kaye, Wagner, Fudge & Paulus, 2010; Steiger, Bruce & Groleau, 2011); however, more neurobiological research is required to improve our understanding of the pathophysiology in eating disorders (Klump, Bulik, Kaye, Treasure & Tyson, 2009; Treasure, Claudino & Zucker, 2010). Much of the current evidence stems from differ- ent lines of neurobiological research, including animal (Avena, Rada & Hoebel, 2009; Kas & Adan, 2011), brain modulation (Israel, Steiger, Kolivakis, McGregor & Sadikot, 2010; Van den Eynde, Guillaume, Broadbent, Campbell & Schmidt, 2011; Van den Eynde et al., 2010) and neuroimaging research (Pietrini et al., 2010; Van den Eynde & Treasure, 2009; van Kuyck et al., 2009). Neuroimaging allows for the in vivo investigation of psychopath- ological characteristics of mental disorders and is likely to impact on the future nosology of psychiatric disorders and to assist in diagnosis and clinical management (Malhi & Lagopoulos, 2008). It encompasses a range of techniques, each with its own advantages and limitations (Bandettini, 2009). This review focuses on structural brain imaging studies that have used magnetic resonance imaging (MRI). Functional brain imaging research in eating disorders has been summarised previously (Pietrini al., 2010; Van den Eynde & Treasure, 2009; van Kuyck et al., 2009); however, there is no system- atic review of structural brain MRI research across all eating disor- ders [anorexia nervosa (AN), bulimia nervosa (BN), eating disorder not otherwise specified (EDNOS) and binge eating disorder (BED)]. Magnetic resonance imaging has the potential to detect struc- tural brain changes, for example, cell loss manifested as loss of brain tissue or atrophy (Whitwell, 2009). In essence, MRI studies seek to investigate the presence of global or local brain structure abnormalities; however, in the case of eating disorders, they also aim to examine whether these brain abnormalities are a cause or a consequence of the illness, whether they are reversible and whether they are associated with the severity of illness. These are important issues to address in eating disorders because it is possi- ble that starvation or irregular energy intake may result in the loss of brain tissue. Furthermore, the onset of eating disorders is often during adolescence (Currin, Schmidt, Treasure & Jick, 2005; Eur. Eat. Disorders Rev. (2011) © 2011 John Wiley & Sons, Ltd and Eating Disorders Association.

Welcome message from author
This document is posted to help you gain knowledge. Please leave a comment to let me know what you think about it! Share it to your friends and learn new things together.
Transcript

REVIEW
Structural Magnetic Resonance Imaging in Eating Disorders: ASystematic Review of Voxel-Based Morphometry StudiesFrederique Van den Eynde1*,†, Masashi Suda1†, Hannah Broadbent1†, Sébastien Guillaume1,2,Magali Van den Eynde1, Howard Steiger3, Mimi Israel3, Marcelo Berlim4, Vincent Giampietro5,Andrew Simmons5,6, Janet Treasure1, Iain Campbell1 & Ulrike Schmidt1
1King’s College London, Institute of Psychiatry, Department of Psychological Medicine, Section of Eating Disorders, London, UK2Universite Montpellier, INSERM U1061, CHU de Montpellier, Montpellier, France3Douglas University Institute, Psychiatry Department, McGill University, Eating Disorders Program, Montreal, Quebec, Canada4Douglas University Institute, Psychiatry Department, McGill University, Depressive Disorders Program, Montreal, Quebec, Canada5King’s College London, Institute of Psychiatry, Department of Neuroimaging, London, UK6NIHR Biomedical Research Centre for Mental Health at South London and Maudsley NHS Foundation Trust and Institute of Psychiatry, King’s College London
Abstract
This systematic review summarises and critically appraises the literature on structural magnetic resonance imaging in people with a current orpast eating disorder. Studies using voxel-basedmorphometry image analysis were included. Ten studies reported on a total of 236 people witha current or past eating disorder and 257 healthy controls. Sample heterogeneity prohibited a meta-analytic approach. The findings do notunequivocally indicate grey or white matter volume abnormalities in people with an eating disorder. Nevertheless, these preliminary datasuggest that, compared with healthy controls, people with anorexia nervosa have decreased grey matter in a range of brain regions and thatthose with bulimia nervosa have increased grey matter volumes in frontal and ventral striatal areas. Research in the recovery phase andlongitudinal studies suggest that potential brain tissue abnormalities may recover with clinical improvement. Overall, as the available dataare inconclusive, further efforts in this field are warranted. Copyright © 2011 John Wiley & Sons, Ltd and Eating Disorders Association.
Keywords
neuroimaging; voxel-based morphometry; anorexia nervosa; bulimia nervosa; systematic review
*Correspondence
Frederique Van den Eynde, Department of Psychological Medicine, Section of Eating Disorders, King’s College London, Institute of Psychiatry, De Crespigny Park,
London, SE5 8AF, UK. Tel: 00442078480160; Fax: 00442078480182.
E-mail: [email protected]†FVDE, MS and HB have equally contributed to the manuscript.
Published online in Wiley Online Library (wileyonlinelibrary.com) DOI: 10.1002/erv.1163
Introduction
Multidisciplinary translational and clinical research has increasedinsight into the neurocircuitry of eating disorder pathology (Kaye,Wagner, Fudge & Paulus, 2010; Steiger, Bruce & Groleau, 2011);however, more neurobiological research is required to improveour understanding of the pathophysiology in eating disorders(Klump, Bulik, Kaye, Treasure & Tyson, 2009; Treasure, Claudino& Zucker, 2010). Much of the current evidence stems from differ-ent lines of neurobiological research, including animal (Avena,Rada & Hoebel, 2009; Kas & Adan, 2011), brain modulation (Israel,Steiger, Kolivakis, McGregor & Sadikot, 2010; Van den Eynde,Guillaume, Broadbent, Campbell & Schmidt, 2011; Van den Eyndeet al., 2010) and neuroimaging research (Pietrini et al., 2010; Vanden Eynde & Treasure, 2009; van Kuyck et al., 2009).
Neuroimaging allows for the in vivo investigation of psychopath-ological characteristics of mental disorders and is likely to impacton the future nosology of psychiatric disorders and to assist indiagnosis and clinical management (Malhi & Lagopoulos, 2008).It encompasses a range of techniques, each with its own advantages
Eur. Eat. Disorders Rev. (2011) © 2011 John Wiley & Sons, Ltd and Eating Disorders Association.
and limitations (Bandettini, 2009). This review focuses on structuralbrain imaging studies that have used magnetic resonance imaging(MRI). Functional brain imaging research in eating disorders hasbeen summarised previously (Pietrini al., 2010; Van den Eynde &Treasure, 2009; van Kuyck et al., 2009); however, there is no system-atic review of structural brain MRI research across all eating disor-ders [anorexia nervosa (AN), bulimia nervosa (BN), eating disordernot otherwise specified (EDNOS) and binge eating disorder (BED)].
Magnetic resonance imaging has the potential to detect struc-tural brain changes, for example, cell loss manifested as loss ofbrain tissue or atrophy (Whitwell, 2009). In essence, MRI studiesseek to investigate the presence of global or local brain structureabnormalities; however, in the case of eating disorders, they alsoaim to examine whether these brain abnormalities are a cause ora consequence of the illness, whether they are reversible andwhether they are associated with the severity of illness. These areimportant issues to address in eating disorders because it is possi-ble that starvation or irregular energy intake may result in the lossof brain tissue. Furthermore, the onset of eating disorders is oftenduring adolescence (Currin, Schmidt, Treasure & Jick, 2005;
Structural Brain Imaging in Eating Disorders F. Van den Eynde et al.
Favaro, Caregaro, Tenconi, Bosello & Santonastaso, 2009) at atime when brain maturation is incomplete (Raznahan et al.,2011) and hence may be particularly vulnerable to insult resultingin structural alterations. In this respect, it is noted that structuralbrain abnormalities that are induced during adolescence can beprogressive, as demonstrated in other mental disorders (e.g.schizophrenia) (Andreasen et al., 2011). It is also important tobe aware of pubertal hormonal effects on brain development inadolescence (Blakemore, Burnett & Dahl, 2010) and of the com-plex relationship between oestrogens and (pathological) eatingbehaviours (Keating, 2011; Klump, Keel, Sisk & Burt, 2010). Inaddition, as comorbidity is the norm in eating disorders, brain ab-normalities may arise because common co-occurring mental pro-blems, such as mood (Bora, Fornito, Pantelis & Yucel, 2011),anxiety (Radua, van den Heuvel, Surguladze & Mataix-Cols,2010), substance misuse (Tanabe et al., 2009) and stress (Papagniet al., 2011) disorders, are associated with brain tissue alterations.Lastly, the contribution of obstetric complications to the develop-ment of eating disorders (Favaro, Tenconi & Santonastaso, 2006)and/or in utero effects on neural development (Campbell, Mill,Uher & Schmidt, 2011) provides scenarios that could lead tolong-term changes in the brain.
Early MRI studies in people with an eating disorder indicated thatAN may be associated with (partially reversible) structural brainchanges, for example increased cerebrospinal fluid (CSF) volumesand reduced white matter (WM) and grey matter (GM) volumes(Chui et al., 2008; Golden et al., 1996; Inui et al., 2002; Katzman,Christensen, Young & Zipursky, 2001; Katzman, Zipursky, Lambe& Mikulis, 1997; Katzman et al., 1996; Kerem & Katzman, 2003;Kingston, Szmukler, Andrewes, Tress & Desmond, 1996; Kohnet al., 1997; Lambe, Katzman, Mikulis, Kennedy & Zipursky, 1997;Swayze et al., 2003). Other studies examined specific brain regionsand showed GM abnormalities in people with AN in, for examplethe hippocampus (Connan et al., 2006), the hippocampus–amygdalaformation (Giordano et al., 2001) and the anterior cingulate cortex(ACC) (McCormick et al., 2008).
Magnetic resonance imaging data can be analysed in variousways. In contrast to more traditional methods such as visualassessment and manual or semi-automated measurements ofstructures of interest (used in early MRI studies in eating disor-ders), the development of automated techniques has allowed forassessments across large groups of people without the need fortime-consuming manual measurements or subjective visualassessments (Whitwell, 2009). Voxel-based morphometry(VBM) (Ashburner & Friston, 2000; Wright et al., 1995) is onesuch automated technique that is used to study brain changepatterns in development or disease and neuroanatomical corre-lates of person characteristics (Ridgway et al., 2008). In essence,VBM involves voxel-wise statistical analysis of preprocessed struc-tural MR images (Ridgway et al., 2008). VBM can overcome someof the limitations associated with region-of-interest (ROI)approaches, which focus on selected regions and hence precludethe exploration of other brain regions that may be involved inthe pathophysiology of the disorder under investigation (Via,Radua, Cardoner, Happé & Mataix-Cols, 2011). However, someVBM studies have also used ‘a small volume correction’ to reducethe number of comparisons being performed and to increase thechance of identifying significant results in ‘regions of interest’.
Eur. E
This method typically involves only performing analysis overthese regions; this approach should be hypothesis driven and,ideally, on the basis of previous work (Whitwell, 2009).
The aim of this report is to comprehensively review findingsfrom MRI studies across eating disorder diagnoses that have usedVBM data analysis and to critically appraise the literature in lightof its contribution to the understanding of the neurobiology ofthe eating syndromes.
Methods
This review follows the preferred reporting items for systematicreviews and meta-analysis (PRISMA) statement (Liberati et al.,2009). The aim of the PRISMA statement is to help authorsimprove the reporting of systematic reviews and meta-analyses.Although PRISMA focuses on randomised trials, it can also beused as a basis for reporting systematic reviews of other types ofresearch (http://www.prisma-statement.org/). The statementconsists of a checklist of recommended items to be reported anda four-step flow diagram (Figure 1). The search for relevantmanuscripts reporting on structural MRI studies in people withan eating disorder was conducted using two electronic databases:PubMed and Scopus. Search terms included ‘neuroimaging’,‘brain imaging’, ‘magnetic resonance imaging’, ‘MRI’, ‘voxelbased morphometry’ and ‘VBM’ in combination with ‘eatingdisorder’, ‘anorexia nervosa’, ‘bulimia nervosa’, ‘binge eating dis-order’, ‘EDNOS’ and ‘eating disorder not otherwise specified’.The latter was removed from the final search because its inclusionresulted in an unmanageable number of hits (more than 25 000).In addition, it is conceivable that the use of the term ‘eating disor-der’ will cover the category ‘eating disorder not otherwise speci-fied’. The search terms were used in ‘free text’ and ‘all fields’.The reference list of full-text papers and previous eating disorderbrain imaging reviews were scrutinised for additional relevantreports. The search was independently completed by threeresearchers (FVDE, MS and MVDE). The outcome of the searchprocess and paper selection is shown in Figure 1 (PRISMAflowchart). We identified 5016 potentially relevant manuscripts,of which 4980 were excluded during the screening phase. The fulltext of the 36 remaining papers was examined; 10 papers met theeligibility criteria for this systematic review.
Criteria for studies to be included in this review were (1) report-ing on cross-sectional structural MRI research in people with aneating disorder [diagnosis according to the Diagnostic and Statisti-cal Manual of Mental Disorders (DSM-IV or DSM-IV-TR) or In-ternational Classification of Diseases (ICD-10)] and healthy(normal weight) controls (HCs), or reporting on longitudinalstructural MRI research in people with an (DSM or ICD) eatingdisorder; (2) published between 01 January 2000 [year of publica-tion of seminal paper describing VBMmethodology by (Ashburner& Friston, 2000)] and 22 June 2011 in a peer-reviewed journal; and(3) the use of an image analysis package (e.g. VBM) for global mea-sures of WM, GM and CSF volume; similarly, where a ROI ap-proach was employed, the use of VBM image analysis or anautomated segmentation procedure was required for inclusion inthis review. Case reports were not included (e.g. Suda et al., 2010).
To report the findings, we adhere to a categorical approach toeating disorders based on the DSM classification. In addition,
at. Disorders Rev. (2011) © 2011 John Wiley & Sons, Ltd and Eating Disorders Association.

Records identified through database searching
(n = 5248)
Scr
een
ing
Incl
ud
edE
ligib
ility
Iden
tifi
cati
on
Additional records identified through other sources
(n = 12)
Records after duplicates removed(n = 5016)
Records screened(n = 5016)
Records excluded(n = 4980)
Full-text articles assessed for eligibility
(n = 36)
Full-text articles excluded,with reasons
(n = 26)
- no use of VBM orautomated
segmentation(n=13)
- not report of(structural) brainimaging (n= 10)
- reporting on otherneuropsychiatricdisorders (n=3)
Studies included inqualitative synthesis
(n = 10)
Figure 1. Preferred reporting items for systematic reviews and meta-analysis flowchart illustrating the search process. VBM, voxel-based morphometry
F. Van den Eynde et al. Structural Brain Imaging in Eating Disorders
we report findings for adults and adolescents separately. TheWorld Health Organisation (WHO) defines ‘adolescents’ as indi-viduals between 10 and 19 years (http://www.searo.who.int/en/Section13/Section1245_4980.htm). Nevertheless, because mentalhealth research generally considers ‘adults’ to be 18 years or older,we defined adolescents as younger than 18 years. We acknowledgethat this distinction is arbitrary and that brain maturation con-tinues beyond this age (Raznahan et al., 2011).
This review focuses on between-group differences and longitu-dinal changes in global or regional brain tissue volumes and alsosummarises the correlation between brain tissue volume measuresand body mass index (BMI). We ignored other correlationalanalyses (e.g. involving clinical variables) because it was oftenunclear to what extent these were planned a priori.
Results
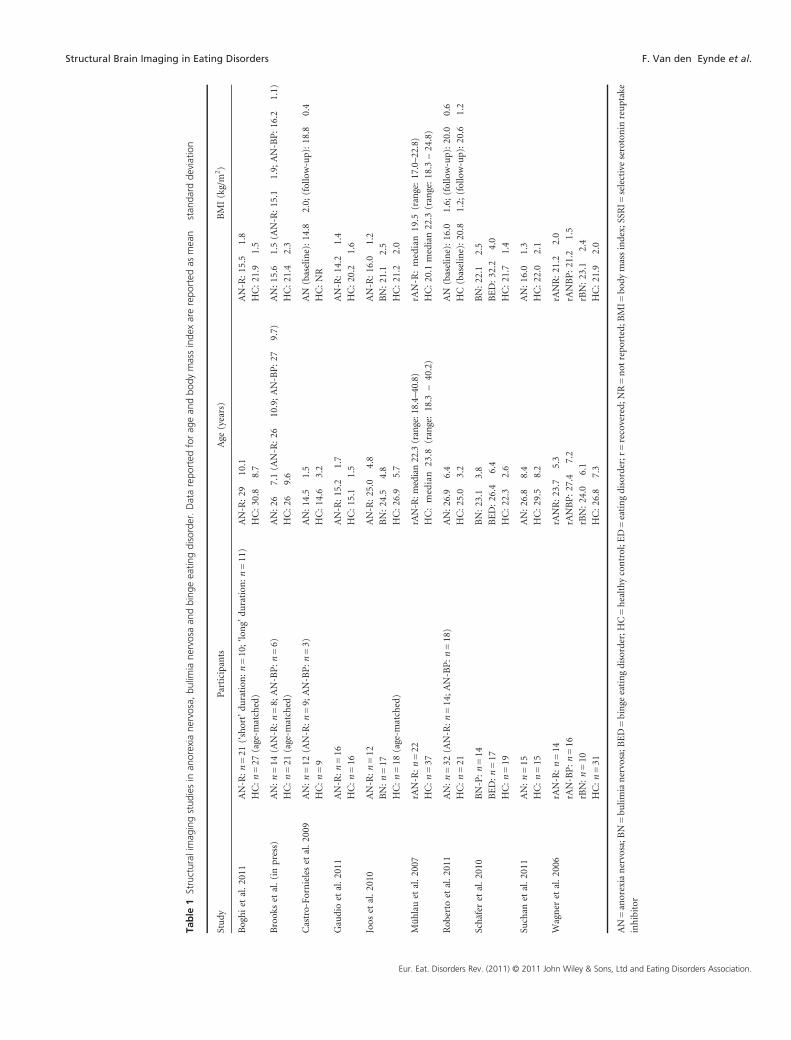
This review addresses a total of 10 reports on structural brainimaging using VBM (Table 1). Four studies reported on adultswith current AN (ntotal = 62; HCs: ntotal = 81) (Boghi et al., 2011;Brooks et al., in press; Joos et al., 2010; Suchan et al., 2011) andtwo on adults who had recovered from AN (ntotal = 52; HCs:ntotal = 68) (Mühlau et al., 2007; Wagner et al., 2006). One reportstudied people with AN over time (before and after weight resto-ration) (ntotal = 32; HCs: ntotal = 21) (Roberto et al., 2011). Twostudies included adolescents with AN (ntotal = 28; HCs: ntotal = 25)(Castro-Fornieles et al., 2009; Gaudio et al., 2011), one of which
Eur. Eat. Disorders Rev. (2011) © 2011 John Wiley & Sons, Ltd and Eating Disorders Association.
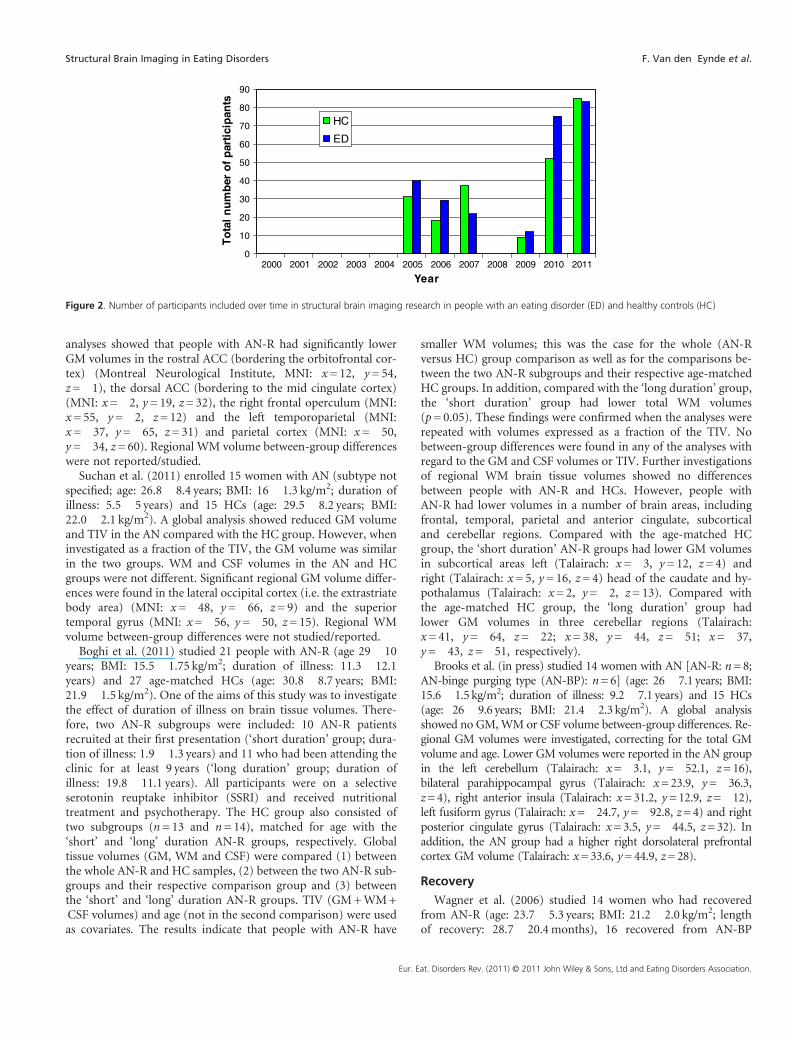
had a longitudinal design (Castro-Fornieles et al., 2009). For BN,only adults were studied; two reports focused on the acute phaseof the illness (BN: ntotal = 31; HCs: ntotal = 37) (Joos et al., 2010;Schäfer, Vaitl & Schienle, 2010) and one on the recovery phase(BN: ntotal = 10; HCs: ntotal = 31) (Wagner et al., 2006). Further-more, we included one study in people with acute BED (BED: ntotal =17; HCs: ntotal = 18) (Schäfer et al., 2010). Except for reports ontwo participants (one with AN and one HC) (Castro-Fornieleset al., 2009), all participants were female. Diagnoses were based oneither DSM-IV or DSM-IV-TR. Overall, this review comprises re-search on 236 people with a current or past eating disorder and257 HCs. Most of these studies have been completed since 2005with a surge in the last 2 years (Figure 2).
Anorexia nervosa—adults
Acute phase of the illness
Joos et al. (2010) studied 12 women with AN-restrictive type(AN-R; age: 25.0� 4.8 years; BMI: 16.0� 0.3 kg/m2) with aminimum duration of illness of 1 year and 18 age-matched HCs(age: 26.9� 5.7 years; BMI: 21.2� 2.0 kg/m2). Participants wereasked to refrain from eating for 3 hours prior to the MRI. Thefraction of each brain tissue segment (GM, WM and CSF) wasanalysed relative to the total intracranial volume (TIV). A globalanalysis showed significantly lower GM and greater CSF volumein the AN-R compared with the HC group. The WM volumedid not differ between the two groups. Additional regional
0
10
20
30
40
50
60
70
80
90
2000 2001 2002 2003 2004 2005 2006 2007 2008 2009 2010 2011
Year
To
tal
nu
mb
er o
f p
arti
cip
ants
HC
ED
Figure 2. Number of participants included over time in structural brain imaging research in people with an eating disorder (ED) and healthy controls (HC)
Structural Brain Imaging in Eating Disorders F. Van den Eynde et al.
analyses showed that people with AN-R had significantly lowerGM volumes in the rostral ACC (bordering the orbitofrontal cor-tex) (Montreal Neurological Institute, MNI: x= 12, y= 54,z=�1), the dorsal ACC (bordering to the mid cingulate cortex)(MNI: x=�2, y= 19, z= 32), the right frontal operculum (MNI:x= 55, y=�2, z= 12) and the left temporoparietal (MNI:x=�37, y=�65, z= 31) and parietal cortex (MNI: x=�50,y=�34, z= 60). Regional WM volume between-group differenceswere not reported/studied.
Suchan et al. (2011) enrolled 15 women with AN (subtype notspecified; age: 26.8� 8.4 years; BMI: 16� 1.3 kg/m2; duration ofillness: 5.5� 5 years) and 15 HCs (age: 29.5� 8.2 years; BMI:22.0� 2.1 kg/m2). A global analysis showed reduced GM volumeand TIV in the AN compared with the HC group. However, wheninvestigated as a fraction of the TIV, the GM volume was similarin the two groups. WM and CSF volumes in the AN and HCgroups were not different. Significant regional GM volume differ-ences were found in the lateral occipital cortex (i.e. the extrastriatebody area) (MNI: x=�48, y=�66, z= 9) and the superiortemporal gyrus (MNI: x=�56, y=�50, z= 15). Regional WMvolume between-group differences were not studied/reported.
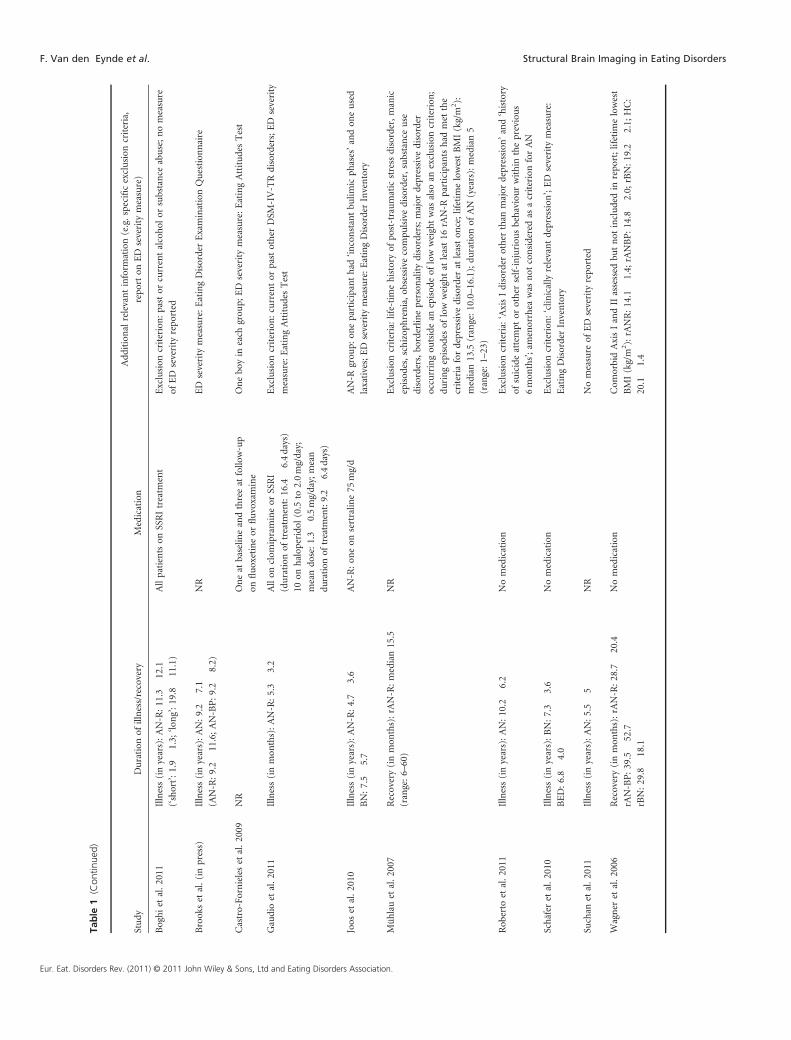
Boghi et al. (2011) studied 21 people with AN-R (age 29� 10years; BMI: 15.5� 1.75 kg/m2; duration of illness: 11.3� 12.1years) and 27 age-matched HCs (age: 30.8� 8.7 years; BMI:21.9� 1.5 kg/m2). One of the aims of this study was to investigatethe effect of duration of illness on brain tissue volumes. There-fore, two AN-R subgroups were included: 10 AN-R patientsrecruited at their first presentation (‘short duration’ group; dura-tion of illness: 1.9� 1.3 years) and 11 who had been attending theclinic for at least 9 years (‘long duration’ group; duration ofillness: 19.8� 11.1 years). All participants were on a selectiveserotonin reuptake inhibitor (SSRI) and received nutritionaltreatment and psychotherapy. The HC group also consisted oftwo subgroups (n= 13 and n= 14), matched for age with the‘short’ and ‘long’ duration AN-R groups, respectively. Globaltissue volumes (GM, WM and CSF) were compared (1) betweenthe whole AN-R and HC samples, (2) between the two AN-R sub-groups and their respective comparison group and (3) betweenthe ‘short’ and ‘long’ duration AN-R groups. TIV (GM+WM+CSF volumes) and age (not in the second comparison) were usedas covariates. The results indicate that people with AN-R have
Eur. E
smaller WM volumes; this was the case for the whole (AN-Rversus HC) group comparison as well as for the comparisons be-tween the two AN-R subgroups and their respective age-matchedHC groups. In addition, compared with the ‘long duration’ group,the ‘short duration’ group had lower total WM volumes(p= 0.05). These findings were confirmed when the analyses wererepeated with volumes expressed as a fraction of the TIV. Nobetween-group differences were found in any of the analyses withregard to the GM and CSF volumes or TIV. Further investigationsof regional WM brain tissue volumes showed no differencesbetween people with AN-R and HCs. However, people withAN-R had lower volumes in a number of brain areas, includingfrontal, temporal, parietal and anterior cingulate, subcorticaland cerebellar regions. Compared with the age-matched HCgroup, the ‘short duration’ AN-R groups had lower GM volumesin subcortical areas left (Talairach: x=�3, y= 12, z= 4) andright (Talairach: x= 5, y= 16, z= 4) head of the caudate and hy-pothalamus (Talairach: x= 2, y=�2, z= 13). Compared withthe age-matched HC group, the ‘long duration’ group hadlower GM volumes in three cerebellar regions (Talairach:x= 41, y=�64, z=�22; x= 38, y=�44, z=�51; x=�37,y=�43, z=�51, respectively).
Brooks et al. (in press) studied 14 women with AN [AN-R: n=8;AN-binge purging type (AN-BP): n=6] (age: 26� 7.1 years; BMI:15.6� 1.5 kg/m2; duration of illness: 9.2� 7.1 years) and 15 HCs(age: 26� 9.6 years; BMI: 21.4� 2.3 kg/m2). A global analysisshowed no GM,WM or CSF volume between-group differences. Re-gional GM volumes were investigated, correcting for the total GMvolume and age. Lower GM volumes were reported in the AN groupin the left cerebellum (Talairach: x=�3.1, y=�52.1, z=16),bilateral parahippocampal gyrus (Talairach: x=23.9, y=�36.3,z=4), right anterior insula (Talairach: x=31.2, y=12.9, z=�12),left fusiform gyrus (Talairach: x=�24.7, y=�92.8, z=4) and rightposterior cingulate gyrus (Talairach: x=3.5, y=�44.5, z=32). Inaddition, the AN group had a higher right dorsolateral prefrontalcortex GM volume (Talairach: x=33.6, y=44.9, z=28).
Recovery
Wagner et al. (2006) studied 14 women who had recoveredfrom AN-R (age: 23.7� 5.3 years; BMI: 21.2� 2.0 kg/m2; lengthof recovery: 28.7� 20.4months), 16 recovered from AN-BP
at. Disorders Rev. (2011) © 2011 John Wiley & Sons, Ltd and Eating Disorders Association.

F. Van den Eynde et al. Structural Brain Imaging in Eating Disorders
(age: 27.4� 7.2 yrs; BMI: 21.2� 1.5 kg/m2; length of recovery:39.5� 52.7months) and 31 female HCs (age: 26.8� 7.3 yrs;BMI: 21.9� 2.0 kg/m2). Recovery was defined as a minimum1 year of (1) maintenance of weight above 85% of average bodyweight; (2) regular menstrual cycles; (3) abstinence from binge-ing, purging, restricted food intake or excessive exercise; and (4)no use of psychotropic medication. Global and regional GM,WM and CSF volumes were studied between the different groups.However, no differences were observed. Similar findings werereported even after controlling for TIV, age, BMI and length ofrecovery.
Mühlau et al. (2007) investigated 22 women who had recoveredfrom AN-R [(rAN-R) median (range) age: 22.3 (18.4–40.8) years;median (range) BMI: 19.5 (17.0–22.8) kg/m2; length of recovery:15.5 (6–60)months] and 37 HCs [median (range) age: 23.8(18.3–40.2) years; BMI: 20.1 (18.3–24.8) kg/m2]. AN-R refers tothe eating disorder in the first year of the person’s illness trajec-tory. Ten patients also showed bingeing and/or purging behaviourprior to recovery. Recovery was defined by a BMI above 17.0 kg/m2 and regular menstrual cycles for at least 6months. GlobalGM, WM and CSF volumes were assessed as fractions of theTIV. For investigation of regional GM volume between-groupdifferences, two analyses of covariance (ANCOVAs) were per-formed. In the first, only age was added as a nuisance variable;in the second, global volume of GM was also included. Theauthors refer to the first ANCOVA as the ‘analysis for the regionaldistribution of GM changes’ and to the second as the ‘analysis forregion-specific GM changes’. The most significant regions of GMfound in the second ANCOVA were further used for local analy-ses. In contrast to global WM and CSF volumes, which werefound to be similar between the two groups, global GM was sig-nificantly lower in the rAN-R group compared with the HC group(1.3%, 95%CI: 0.2–2.6%). The ‘analysis for the regional distribu-tion of GM changes’ showed that GM volume decrease in therAN-R group (compared with the HC group) was widely spreadacross frontal, temporal, parietal, occipital and subcortical areas.The ‘analysis for region-specific GM changes’ showed that theGM volume in the rAN-R group was specifically lower (5.4%,95%CI: 3.2–7.1%) in a cluster in the dorsal ACC that bilaterallyextended to the rostral ACC (MNI: x=�11, y= 24, z= 23).
Longitudinal investigations
In a longitudinal study, Roberto et al. (2011) studied 32 womenwith AN (AN-R: n= 14; AN-BP: n= 18; age: 26.9� 6.4 years;BMI: 16.0� 1.6 kg/m2; duration of illness: 10.2� 6.2 years) and21 HCs (age: 25.0� 3.2 years; BMI: 20.8� 1.2 kg/m2). All partici-pants were scanned twice; the time between the scans in the ANand HC group was 50.3� 19.1 and 51.7� 37.7 days, respectively.For clinical participants, the baseline scan was carried out in thefirst 2 weeks of hospitalisation, in a medically stable conditionand before the start of the weight-gain treatment phase. The sec-ond scan was completed after reaching 90% of ideal body weight(1959 Metropolitan Life Insurance Tables). Two patients did notreach this before discharge; however, because their BMI washigher than 18 kg/m2, they were ultimately included. Theseresearchers used an ‘optimised VBM’ procedure to derive braintissue (GM, WM, CSF) volumes. Statistical analyses were thenperformed with the Statistical Package for Social Sciences (SPSS;
Eur. Eat. Disorders Rev. (2011) © 2011 John Wiley & Sons, Ltd and Eating Disorders Association.
IBM, Armonk, NY, USA); TIV was included as covariate. Peoplewith AN had lower GM volumes at baseline, which increased overtime, but remained lower than controls after weight restoration.WM volume increased over time in the AN, but not the HCgroup; no between-group difference were reported. CSF volumeswere also similar in people with and without AN.
Summary
Findings on global GM volume in people with ongoing AN areinconsistent. Two studies indicated global GM loss (Joos et al.,2010; Suchan et al., 2011); however, when studied as a fractionof the TIV, this finding did not hold up (Suchan et al., 2011). Athird study did not find global GM loss, but rather suggests thatpeople with AN have lowerWM volumes (most prominent in peo-ple with a ‘short’ duration of illness) (Boghi et al., 2011). The latterwas not reported in the two other studies (Joos et al., 2010; Suchanet al., 2011). A fourth study found neither GM nor WM loss inpeople with AN (Brooks et al., in press). With regard to regionalGM volume abnormalities, a wide range of brain regions arereported across studies. However, two observations are of note.First, Boghi et al. (2011) illustrated that duration of illness is a fac-tor that may impact on GM volume distribution. Second, the GMvolume abnormality reported in the ACC in the acute phase (Jooset al., 2010) was also present in people who had recovered fromAN (Mühlau et al., 2007). However, this was not confirmed inthe study by Wagner et al. (2006), where stricter criteria for recov-ery were applied. The findings from the sole longitudinal investiga-tion in adults with AN suggest that weight recovery may beassociated with GM volume recovery (Roberto et al., 2011).
Anorexia nervosa—adolescents
Acute phase of the illness
Gaudio et al. (2011) studied 16 adolescents with AN-R withinthe first year of illness (age: 15.2� 1.7 years; BMI: 14.2� 1.4 kg/m2; duration of illness: 5.3� 3.2months) and 16 female adoles-cents HCs (age: 15.1� 1.5 years; BMI: 20.2� 1.6 kg/m2). Allpatients were on an antidepressant (clomipramine or an SSRI;mean duration of treatment: 16.4� 6.4 days). Ten patients werealso prescribed a low dose of haloperidol (0.5–2.0mg/day; meandose: 1.3� 0.5mg/day; mean duration of treatment: 9.2� 6.4days). The focus of the study was on GM volume and TIV; WMvolume was not studied. For investigation of between-groupdifferences, two ANCOVAs were performed. In the first, onlyage was added as a nuisance variable; in the second, global GMvolume was also included. This approach is similar to the oneused by Mühlau et al. (2007). The first is referred to as the ‘anal-ysis for the regional distribution of GM changes’ and the secondas the ‘analysis for region-specific GM changes’. The most signif-icant regions of GM volume changes found in the secondANCOVA were further used for local analyses. Whereas the TIVin the AN-R group did not differ from the HC group, the globalGM volume was significantly lower (7.4%) in the AN-R group.The analysis for regional distribution of GM changes revealedseveral regions with lower GM volume in the AN-R comparedwith the HC group, including frontal, temporal, parietal, occipitaland cerebellar areas. The analysis for region-specific GM changesyielded three clusters of lower GM volume in the AN-R group:

Structural Brain Imaging in Eating Disorders F. Van den Eynde et al.
Cluster 1 left and right middle cingulate cortex, left and rightprecuneus (Talairach: x=�7, y=�41, z= 31); Cluster 2 left infe-rior and superior parietal lobules (Talairach: x= 0, y=�54,z= 40); and Cluster 3 right inferior and superior parietal lobules(Talairach: x=�38, y=�48, z= 43). Additional calculationsrevealed that in the AN-R group, compared with the HCs, theGM volume in the mid cingulate cortex was 9.3% lower than inthe comparison group, 14.3% in the precuneus and 15.5% inthe areas defined in Clusters 2 and 3. Comparison of the patientgroup on haloperidol with those patients not on haloperidol, aswell as comparisons of these groups separately with the HCgroup, did not reveal GM volume or TIV differences. Thissuggests that administration of haloperidol did not affect GMvolumes.
Longitudinal investigations
In a longitudinal study, Castro-Fornieles et al. (2009) studied12 adolescents with AN (AN-R: n= 9; AN-BP: n= 3; age:14.5� 1.5 years; BMI: 14.8� 2.0 kg/m2) and 9 adolescent HCs(age: 14.6� 3.2 years; BMI: not reported). In both groups, oneboy was enrolled. At baseline, the AN group had significantlyhigher GM and lower CSF volumes compared with the controlgroup; the global WM volume was similar in both groups.Regional analysis showed lower GM volumes in the AN groupin 3 large clusters: Cluster 1 included the right superior andmedial temporal gyrus and the supramarginal gyrus (MNI:x= 68, y=�32, z= 3); Cluster 2 included mainly the left andright precuneus, right postcentral gyrus, left and right superiorparietal gyrus, right supplementary motor area, left and rightparacentral lobule, mid cingulum, right superior motor areaand the right inferior parietal cortex (MNI: x=�32, y=�50,z= 69); and Cluster 3—in the left hemisphere—included theinferior and superior parietal, postcentral and supramarginalcortex (MNI: x=�45, y=�48, z= 61). No regional WM vol-ume differences were observed.
Following 6months of treatment—on the basis of a multidisci-plinary approach combining ‘biological management’ and nutri-tional rehabilitation—the clinical group showed a significantincrease in BMI (18.8� 0.4 kg/m2). The follow-up assessmentshowed that changes in brain tissue volumes over time differedbetween the clinical and the HC group. The AN group had ahigher increase in GM volume and a lower decrease in CSF vol-ume than the HC group. No such differences were observed forthe WM volume. Regional analyses showed that GM volumeincreases took place specifically in two large clusters in the parietaland temporal lobes: Cluster 1 consisted primarily of the left post-central and left superior parietal gyri (MNI: x=�51, y=�19,z= 28); Cluster 2 mainly consisted of the right rolandic opercu-lum and the superior temporal gyrus (MNI: x= 62, y=�26,z=�12). A cross-sectional analysis of the global brain tissuevolumes showed no between-group differences. Still, regionalanalyses illustrated that lower GM volumes remained present inthe AN group in a large cluster comprising the bilateral supple-mentary motor area, the mid cingulum and the left paracentrallobule (MNI: x=�62, y=�26, z=�12). It is of note that in thecontrol group, the global GM volume was lower at follow-upcompared with baseline.
Eur. E
Summary
The cross-sectional data from the two studies suggest that awide range of brain areas has low GM volumes in adolescents withAN; however, there is no clear overlap between these regions inboth studies. WM volume was only investigated in one study,and there is no indication of abnormalities in this regard inadolescents with AN. The preliminary longitudinal data show thatsuccessful treatment is associated with a recovery of the GMvolumes; however, GM abnormalities remain even after 6monthsof treatment. It cannot be ruled out that longer follow-up couldreveal full GM recovery.
Bulimia nervosa
Acute phase of the illness
Joos et al. (2010) studied 17 women with BN (age 24.5� 4.8years; BMI: 21.1� 2.5 kg/m2) and 18 age-matched female HCs(age 26.9� 5.7 years; BMI: 21.2� 2.0 kg/m2). Participants wereasked to refrain from eating for 3 hours prior to the MRI. A globalanalysis approach was applied; GM, WM and CSF volumes didnot differ between the BN and HC groups. Similarly, analyses ofregional GM volumes showed no between-group differences.Regional WM volume between-group differences were notstudied/reported.
Schäfer et al. (2010) studied 14 women with BN (age 23.1� 3.8years; BMI: 22.1� 2.5 kg/m2) and 19 HCs (age 22.3� 2.6 years;BMI: 21.7� 1.4 kg/m2). All participants were medication-free. Aglobal analysis approach was applied to detect between-groupdifferences in GM, WM and CSF volumes. For GM volumes,additional ROI analyses were conducted for the following areas:the insula, the medial/lateral orbitofrontal cortex (medOFC,latOFC, orbital parts of all frontal gyri), the ventral/dorsalstriatum and the ACC. Compared with HCs, people with BNhad increased GM volume in the left (MNI: x=�11, y= 19,z=�16) and right (MNI: x= 11, y= 22, z=�12) medial OFCand the left (MNI: x=�11, y= 17, z=�11) and right (MNI:x= 11, y= 21, z=�9) ventral striatum. Global GM volume orglobal and regional WM and CSF volume differences were notobserved.
Recovered state
Wagner et al. (2006) studied 10 women who had recoveredfrom BN (rBN; age 24.0� 6.1 years; BMI: 23.1� 2.4 kg/m2) and31 female HCs (age 26.8� 7.3 years; BMI: 21.9� 2.0 kg/m2).Recovery was defined as (1) maintaining a weight above 85% ofaverage body weight; (2) having regular menstrual cycles; (3)having not binged, purged, restricted food intake or exercisedexcessively; and (4) not using psychotropic medication. Theseconditions needed be fulfilled for at least 1 year prior to theMRI. Global and regional GM, WM and CSF volumes werestudied. However, no between-group differences were observed.Similar findings were reported after controlling for TIV, BMIand length of recovery. However, when age (although not signif-icantly different between the groups) was added to the analysisas a nuisance variable, the rBN group had a larger GM volumein the insula compared with the HCs (no coordinates reported).
at. Disorders Rev. (2011) © 2011 John Wiley & Sons, Ltd and Eating Disorders Association.

F. Van den Eynde et al. Structural Brain Imaging in Eating Disorders
Summary
In contrast to the findings on GM, the data on (global andregional) WM volumes are consistent and suggest that peoplewith current or past BN do not differ from HCs in this respect.In acute BN, regional GM abnormalities were found in theOFC and ventral striatum when a ROI was applied (Schäferet al., 2010). Interestingly, GM volumes in the clinical groupwere larger than in the comparison group. The study in the re-covered patients only found a relevant GM volume increasecompared with HC when age was added to the analysis asnuisance variable.
Binge eating disorder
Acute phase of the illness
Schäfer et al. (2010) investigated 17 women with BED (age:26.4� 6.4 years; BMI: 32.2� 4.0 kg/m2) and 18 female HCs(age: 22.3� 2.6 years; BMI: 21.7� 1.4 kg/m2). Global brainanalyses were used to detect between-group differences in GM,WM and CSF volumes. For GM volumes, additional ROI analyseswere conducted for the following areas: the insula, the medial/lateral orbitofrontal cortex (medOFC, latOFC, orbital parts of allfrontal gyri), the ventral/dorsal striatum and the ACC. Comparedwith HCs, people with BED showed increased GM volume of theACC (MNI: x=�2, y=16, z=30; x=1, y=17, z=28) bilaterallyand of the medOFC (MNI: x=29, y=63, z=�3). Global GMvolume or global or regional WM and CSF volume differenceswere not observed.
Summary
Similar to the BN data, the observed GM volume differencebetween the clinical and control groups consists of larger volumesin the clinical group.
Comparisons among different eating disordertypes and categories
Schäfer et al. (2010) compared brain tissue volumes between theBN (n= 14) and BED (n= 17) groups. A global analysis was usedto detect between-group differences in GM, WM and CSFvolumes. For GM volumes, additional ROI analyses were con-ducted for the following areas: the insula, the medial/lateralorbitofrontal cortex (medOFC, latOFC, orbital parts of all frontalgyri), ventral/dorsal striatum and the ACC. Only GM volumedifferences were observed; WM and CSF volumes were similarin the two groups. Compared with the BED group, the BN grouphad greater GM volumes in the left lateral (MNI: x=�33, y= 43,z=�4) and medial (MNI: x=�17, y=�30, z=�15) OFC, theleft ventral (MNI: x=�26, y= 6, z= 0) and dorsal (MNI:x=�25, y= 9, z= 3) striatum, and the right ventral (MNI:x= 24, y= 5, z= 0) and dorsal (MNI: x= 19, y= 12, z= 15)striatum.
As reported previously, Wagner et al. (2006) studied womenwho had recovered from AN-R (n= 14), AN-BP (n= 16) andBN (n= 10). Similar to the comparison of these groups with the
Eur. Eat. Disorders Rev. (2011) © 2011 John Wiley & Sons, Ltd and Eating Disorders Association.
HC group in the study, no brain tissue (GM, WM or CSF volume)differences were observed between these groups.
Brooks et al. (in press) studied eight women with AN-R (age:26� 10.9 years; BMI: 15.1� 1.9 kg/m2; duration of illness:9.2� 11.6 years) and six with AN-BP (age: 27� 9.7 years;BMI: 16.2� 1.1 kg/m2; duration of illness: 9.2� 8.2 years). Aglobal analysis showed no between-group differences in GM,WM or CSF volume. Regional GM volumes were investigated,correcting for total GMvolume, age, BMI, years of education and traitanxiety. Higher GM volumes were reported in the AN-BP group inthe left cerebellum (Talairach: x=�8.7, y=�54.1, z=�16), bilateralparahippocampal region (Talairach: x=�24.0, y=�10.4, z=�12),the right anterior insula (Talairach: x=39.5, y=�3.0, z=4) and leftorbitofrontal cortex (Talairach: x=�34.9, y=40.8, z=�8).
Summary
Direct group comparisons between different eating disordersare scarce. The results from the one study in acutely ill patientssuggest that BED and BN may differ with regard to GM braintissue volumes (Schäfer et al., 2010). In the recovered state, braintissue volumes in people with a history of AN and those with ahistory of BN appear not to differ. One study compared twosubtypes of AN (Brooks et al., in press); despite the small groupsizes, the data suggest that there may be regional (but no overall)GM volume differences.
Correlations between brain tissue volumesand BMI
In eight reports, associations between BMI and one or morebrain tissue volume measures were investigated. In acutely illadults with AN, Boghi et al. (2011) found no correlation be-tween BMI and the global WM and GM volumes. However,when restricting the analyses to those regions (n= 16) whereGM volume was found to be significantly lower in AN patientscompared with HCs, a significant correlation between BMI andthe hypothalamus GM volume was found in the AN group (thenature of the correlation—positive or negative—was not speci-fied). In contrast, Joos et al. (2010) and Roberto et al. (2011)found no correlation between the BMI and global and localGM, WM or CSF volumes. Brooks et al. (in press) reported anegative correlation between age and right dorsolateral prefron-tal cortex GM volume in HCs, but not in people with AN; noother BMI–brain volume correlations were found. In adoles-cents with AN, BMI did not correlate with the TIV (Gaudioet al., 2011), or global or local GM volumes (Castro-Fornieleset al., 2009; Gaudio et al., 2011). In addition, the longitudinalassessment showed that the change in global GM volume didnot correlate with the change in BMI (Castro-Fornieles et al.,2009). In people who had recovered from AN, Mühlau et al.(2007) reported a positive correlation between GM volume inthe ACC and lifetime lowest BMI, but not with the BMI atscanning.
In their study on BED and BN, Schäfer et al. (2010) found thatBMI correlated negatively with the left ventral and dorsal striatumand the right ventral striatum GM volumes.
Table
1Structural
imag
ingstud
iesin
anorexia
nervosa,
bulim
iane
rvosaan
dbing
eeatin
gdisorder.Datarepo
rted
forag
ean
dbo
dymassinde
xarerepo
rted
asmean�stan
dard
deviation
Study
Participants
Age
(years)
BMI(kg/m
2)
Boghiet
al.2011
AN-R:n=21
(‘short’du
ration
:n=10;‘lo
ng’du
ration
:n=11)
AN-R:29
�10.1
AN-R:15.5�1.8
HC:30.8�8.7
HC:21.9�1.5
HC:n=27
(age-m
atched)
Brookset
al.(inpress)
AN:n=14
(AN-R:n=8;
AN-BP:n=6)
AN:26
�7.1(AN-R:26
�10.9;AN-BP:27
�9.7)
AN:15.6�1.5(AN-R:15.1�1.9;
AN-BP:16.2�1.1)
HC:n=21
(age-m
atched)
HC:26
�9.6
HC:21.4�2.3
Castro-Fo
rnieleset
al.2009
AN:n=12
(AN-R:n=9;
AN-BP:n=3)
AN:14.5�1.5
AN
(baseline):14.8�2.0;
(follow-up):18.8�0.4
HC:14.6�3.2
HC:n=9
HC:NR
Gaudioet
al.2011
AN-R:n=16
AN-R:15.2�1.7
AN-R:14.2�1.4
HC:n=16
HC:15.1�1.5
HC:20.2�1.6
Joos
etal.2010
AN-R:n=12
AN-R:25.0�4.8
AN-R:16.0�1.2
BN:n=17
BN:24.5�4.8
BN:21.1�2.5
HC:n=18
(age-m
atched)
HC:26.9�5.7
HC:21.2�2.0
Mühlauet
al.2007
rAN-R:n=22
rAN-R:m
edian22.3(range:18.4–40.8)
rAN-R
:median19
.5(range:17.0–22.8)
HC:n=37
HC:median
23.8
(range:18.3
–40.2)
HC:20.1
median22.3
(range:18.3
–24.8)
Rob
erto
etal.2011
AN:n=32
(AN-R:n=14;AN-BP:n=18)
AN:26.9�6.4
AN
(baseline):16.0�1.6;
(follow-up):20.0�0.6
HC:25.0�3.2
HC:n=21
HC(baseline):20.8�1.2;
(follow-up):20.6�1.2
Schäfer
etal.2010
BN-P:n=14
BN:23.1�3.8
BN:22.1�2.5
BED:n=17
BED:26.4�6.4
BED:32.2�4.0
HC:n=19
HC:22.3�2.6
HC:21.7�1.4
Suchan
etal.2011
AN:n=15
AN:26.8�8.4
AN:16.0�1.3
HC:n=15
HC:29.5�8.2
HC:22.0�2.1
Wagner
etal.2006
rAN-R:n=14
rANR:23.7�5.3
rANR:21.2�2.0
rAN-BP:n=16
rANBP:27.4�7.2
rANBP:21.2�1.5
rBN:n=10
rBN:24.0�6.1
rBN:23.1�2.4
HC:n=31
HC:26.8�7.3
HC:21.9�2.0
AN=anorexianervosa;B
N=bu
limianervosa;B
ED=binge
eatingdisorder;H
C=healthycontrol;E
D=eatingdisorder;r
=recovered;
NR=not
repo
rted;B
MI=
body
massindex;SSRI=
selectiveserotonin
reuptake
inhibitor
Structural Brain Imaging in Eating Disorders F. Van den Eynde et al.
Eur. Eat. Disorders Rev. (2011) © 2011 John Wiley & Sons, Ltd and Eating Disorders Association.
Table
1(Con
tinue
d)
Study
Duration
ofillness/recovery
Medication
Add
itionalrelevantinform
ation(e.g.specificexclusion
criteria,
repo
rton
ED
severity
measure)
Boghiet
al.2011
Illness(inyears):AN-R:11.3�12.1
(‘short’:1.9�1.3;
‘long’:19.8�11.1)
Allpatientson
SSRItreatm
ent
Exclusion
criterion:pastor
currentalcohol
orsubstance
abuse;nomeasure
ofED
severity
repo
rted
Brookset
al.(inpress)
Illness(inyears):AN:9.2�7.1
(AN-R:9.2�11.6;AN-BP:9.2�8.2)
NR
ED
severity
measure:EatingDisorderExaminationQuestion
naire
Castro-Fo
rnieleset
al.2009
NR
Oneat
baselin
eandthreeat
follo
w-up
onfluoxetineor
fluvoxamine
Onebo
yin
each
grou
p;ED
severity
measure:EatingAttitudesTest
Gaudioet
al.2011
Illness(inmon
ths):AN-R:5.3�3.2
Allon
clom
ipramineor
SSRI
(duration
oftreatm
ent:16.4�6.4days)
10on
halop
eridol
(0.5
to2.0mg/day;
meando
se:1.3�0.5mg/day;mean
duration
oftreatm
ent:9.2�6.4days)
Exclusion
criterion:currentor
pastother
DSM
-IV-TRdisorders;ED
severity
measure:EatingAttitudesTest
Joos
etal.2010
Illness(inyears):AN-R:4.7�3.6
AN-R:on
eon
sertralin
e75
mg/d
AN-R
grou
p:on
eparticipanthad
‘inconstantbu
limicph
ases’andon
eused
laxatives;ED
severity
measure:EatingDisorderInventory
BN:7.5�5.7
Mühlauet
al.2007
Recovery(inmon
ths):rAN-R:median15.5
(range:6–60)
NR
Exclusion
criteria:life-timehistory
ofpo
st-traumaticstress
disorder,manic
episod
es,schizop
hrenia,ob
sessivecompu
lsivedisorder,substance
use
disorders,bo
rderlin
eperson
alitydisorders;major
depressive
disorder
occurringou
tsidean
episod
eof
lowweightwas
also
anexclusion
criterion;
duringepisod
esof
lowweightat
least16
rAN-R
participantshad
met
the
criteriafordepressive
disorder
atleaston
ce;lifetim
elowestBMI(kg/m
2):
median13.5
(range:10.0–16.1);du
ration
ofAN
(years):median5
(range:1–23)
Rob
erto
etal.2011
Illness(inyears):AN:10.2�6.2
Nomedication
Exclusion
criteria:‘AxisIdisorder
other
than
major
depression
’and‘history
ofsuicideattempt
orother
self-injuriou
sbehaviourwithin
theprevious
6mon
ths’;am
enorrhea
was
not
consideredas
acriterionforAN
Schäfer
etal.2010
Illness(inyears):BN:7.3�3.6
Nomedication
Exclusion
criterion:‘clin
icallyrelevantdepression
’;ED
severity
measure:
EatingDisorderInventory
BED:6.8�4.0
Suchan
etal.2011
Illness(inyears):AN:5.5�5
NR
Nomeasure
ofED
severity
repo
rted
Wagner
etal.2006
Recovery(inmon
ths):rAN-R:28.7�20.4
Nomedication
Com
orbidAxisIandIIassessed
butnot
includedin
repo
rt;lifetim
elowest
BMI(kg/m
2):rANR:14.1�1.4;
rANBP:14.8�2.0;
rBN:19.2�2.1;
HC:
20.1�1.4
rAN-BP:39.5�52.7
rBN:29.8�18.1
F. Van den Eynde et al. Structural Brain Imaging in Eating Disorders
Eur. Eat. Disorders Rev. (2011) © 2011 John Wiley & Sons, Ltd and Eating Disorders Association.
Structural Brain Imaging in Eating Disorders F. Van den Eynde et al.
Summary
These data do not show a consistent pattern of an associationbetween BMI and brain tissue volumes. However, if all partici-pants are within a narrow (low) BMI range, it is plausible thatcorrelations with other variables such as brain volumes cannotbe found (Bland & Altman, 2011).
Discussion
Little is known about brain tissue differences in people with aneating disorder in relation to HCs. In this review on structuralbrain MRI studies that used VBM analysis methodology fromStatistical Parametric Mapping (SPM), we included 10 studieswith a total of 235 women and 1 male participant with a cur-rent or past eating disorder diagnosis and 257 HCs. Only twostudies with a longitudinal design were found, one in adoles-cents (Castro-Fornieles et al., 2009) and one in adults (Robertoet al., 2011). Overall, the findings are inconclusive; three plau-sible reasons are (1) sample heterogeneity, (2) inadequate sam-ple size and (3) the variation in VBM-SPM methodology wherethere have been a series of methodological changes/improve-ments (http://www.fil.ion.ucl.ac.uk/spm/doc/manual.pdf). Also,Brooks et al. (in press) used Brain Activation and Morphologi-cal Mapping (Brain Mapping Unit, Department of Psychiatry,University of Cambridge and the Institute of Psychiatry, King’sCollege London) for their statistical analyses. Roberto et al.(2011) used SPSS software to conduct the between-group inves-tigations. The sample heterogeneity impairs comparison offindings across studies or meta-analysis. A cautious interpreta-tion of the reviewed literature is to conclude that it is prema-ture to assume that people with an eating disorder havestructural brain tissue abnormalities. Nonetheless, preliminaryfindings hint at GM reductions in people with AN, whereasthe opposite (GM increase) may occur in people with BN orBED. There is no clear relationship between BMI and brain tis-sue volumes. The majority of studies in people with ANcorrected for the TIV; therefore, differences in global brain sizedo not explain this.
Various clinical factors may further confound the interpreta-tion of the findings. One of these, duration of illness, was inves-tigated by Boghi et al. (2011) in people with AN; however, the‘short’ and ‘long’ duration groups did not differ with regard tostructural brain tissue volumes. It is possible that the smallsample sizes (n = 10 and n= 11) may have been associated withinsufficient power to detect between-group differences. To facil-itate the interpretation of structural imaging studies and to al-low for meta-analysis in the future, it is advisable for reportsto include data on standard global analyses and a range ofparticipant characteristics (e.g. age, BMI, duration of illness,life-time history of eating disorders, psychiatric and medicalcomorbidity, handedness, a measure of eating disorder severityand medication use).
This review did not include reports on structural brain MRIanalyses in people with an eating disorder that did not use VBMor an automated segmentation paradigm for ROIs. The resultsfrom a comparison of the two methods in the assessment ofGM volumes in people with schizophrenia lead the authors to
Eur. E
conclude that—despite its advantages (e.g. rapid and fully auto-mated)—VBM cannot be considered as a replacement for manualROI-based analyses (Giuliani, Calhoun, Pearlson, Francis &Buchanan, 2005). Both methods can provide different informa-tion and this may also be relevant to eating disorders. For exam-ple, ROI analyses of the hippocampus (Connan et al., 2006), thehippocampus–amygdala formation (Giordano et al., 2001) andthe ACC (McCormick et al., 2008) have demonstrated GM ab-normalities in these regions in people with AN. These findingshave not been systematically replicated in the VBM studies, butare still valuable. A direct comparison of the two methods in eat-ing disorders would be informative. Also, in this review only theresults of correlational analyses between brain tissue volumesand BMI were considered. Lastly, the heterogeneity of the datadoes not allow for a systematic investigation of a publicationor outcome bias.
The immediate implications of the results from this revieware predominantly research related. For example, despite thelack of reports on increased brain tissue volumes in people withAN compared with HCs, the use of one-sided statistical testscannot be justified. This is supported by the preliminary find-ings of larger GM volumes in people with BN and BED com-pared with HCs. The need for more studies with largersample sizes is obvious as smaller individual studies may lackthe power to detect significant differences. In light of this,collaborative multicentre efforts across the diagnostic eating dis-order spectrum are likely to be most informative and suchstudies would allow for the investigation of the potential roleof clinical and participant characteristics. Other areas of interestare the study of men with an eating disorder and people withEDNOS, as well as the investigation of longitudinal changes.Structural brain MRI studies in people recovered from an eatingdisorder remain valuable; however, the field may be strugglingwith the lack of a consensus definition of recovery (Darcyet al., 2010; Noordenbos, 2011). With regard to the methodol-ogy, standardised reporting of VBM studies is crucial for properinterpretation of findings and for replication studies (Ridgwayet al., 2008). Finally, combining knowledge from structural brainMRI data and findings from new techniques, such as diffusiontensor imaging (DTI), will improve our insight into brain struc-ture abnormalities in people with an eating disorder. The firstDTI study in people with AN suggests that WM integrity isreduced in the WM association tracts (fimbria-fornix, fronto-occipital and cingulum) (Kazlouski et al., 2011).
Acknowledgements
This work is supported by the Department of Health via the Na-tional Institute for Health Research Biomedical Research Centrefor Mental Health at South London and Maudsley NHS Founda-tion Trust and Institute of Psychiatry, King’s College London andvia the National Institute for Health Research (NIHR) under itsProgramme Grants for Applied Research Scheme (RP-PG-0606-1043). The views expressed herein are not necessarily those ofthe NHS, the NIHR or Department of Health.
FVDE is holder of the Belgian Chair at the University ofLondon 2010–2011. MVDE has been awarded a Samuel SebbaMSc Scholarship for Palliative Care.
at. Disorders Rev. (2011) © 2011 John Wiley & Sons, Ltd and Eating Disorders Association.

F. Van den Eynde et al. Structural Brain Imaging in Eating Disorders
REFERENCES
Andreasen, N. C., Nopoulos, P., Magnotta, V., Pierson, R., Ziebell,
S., & Ho, B. C. (2011). Progressive brain change in schizophre-
nia: A prospective longitudinal study of first-episode schizophre-
nia. Biological Psychiatry, 50, 639–643.
Ashburner, J., & Friston, K. J. (2000). Voxel-based morphometry—
the methods. NeuroImage, 11(6 Pt 1), 805–821.
Avena, N. M., Rada, P., & Hoebel, B. G. (2009). Sugar and fat
bingeing have notable differences in addictive-like behavior.
Journal of Nutrition, 139(3), 623–628.
Bandettini, P. A. (2009). What’s new in neuroimaging methods? An-
nals of the New York Academy of Sciences, 1156, 260–293.
Blakemore, S. J., Burnett, S., & Dahl, R. E. (2010). The role of pu-
berty in the developing adolescent brain. Human Brain Mapping,
31(6), 926–933.
Bland, J. M., & Altman, D. G. (2011). Correlation in restricted ranges
of data. BMJ, 342, d556.
Boghi, A., Sterpone, S., Sales, S., D’Agata, F., Bradac, G. B., Zullo, G.,
et al. (2011). In vivo evidence of global and focal brain alterations
in anorexia nervosa. Psychiatry Research, 192(3), 154–159.
Bora, E., Fornito, A., Pantelis, C., & Yucel, M. (2011). Gray matter
abnormalities in Major Depressive Disorder: A meta-analysis of
voxel based morphometry studies. Journal of Affective Disorders,
dx.doi.org/10.1016/j.jad.2011.03.049
Brooks, S., Barker, G. J., O’Daly, O., Brammer, M., Williams, S.,
Benedict, C., et al. (in press). A voxel-based morphometric study
of regional brain volumes in anorexia nervosa and its subtypes.
BMC Psychiatry.
Campbell, I. C., Mill, J., Uher, R., & Schmidt, U. (2011). Eating dis-
orders, gene–environment interactions and epigenetics. Neurosci-
ence & Biobehavioral Reviews, 35(3), 784–793.
Castro-Fornieles, J., Bargallo, N., Lazaro, L., Andres, S., Falcon, C.,
Plana, M. T., et al. (2009). A cross-sectional and follow-up
voxel-based morphometric MRI study in adolescent anorexia
nervosa. Journal of Psychiatric Research, 43(3), 331–340.
Chui, H. T., Christensen, B. K., Zipursky, R. B., Richards, B. A.,
Hanratty, M. K., Kabani, N. J., et al. (2008). Cognitive function
and brain structure in females with a history of adolescent-onset
anorexia nervosa. Pediatrics, 122(2), e426-e437.
Connan, F., Murphy, F., Connor, S. E., Rich, P., Murphy, T.,
Bara-Carill, N., et al. (2006). Hippocampal volume and cognitive
function in anorexia nervosa. Psychiatry Research, 146(2), 117–125.
Currin, L., Schmidt, U., Treasure, J., & Jick, H. (2005). Time trends
in eating disorder incidence. The British Journal of Psychiatry,
186, 132–135.
Darcy, A. M., Katz, S., Fitzpatrick, K. K., Forsberg, S., Utzinger, L., &
Lock, J. (2010). All better? How former anorexia nervosa patients
define recovery and engaged in treatment. European Eating Disor-
ders Review, 18(4), 260–270.
Favaro, A., Caregaro, L., Tenconi, E., Bosello, R., & Santonastaso, P.
(2009). Time trends in age at onset of anorexia nervosa and
bulimia nervosa. The Journal of Clinical Psychiatry, 70(12),
1715–1721.
Favaro, A., Tenconi, E., & Santonastaso, P. (2006). Perinatal factors
and the risk of developing anorexia nervosa and bulimia nervosa.
Archives of General Psychiatry, 63(1), 82–88.
Gaudio, S., Nocchi, F., Franchin, T., Genovese, E., Cannata, V.,
Longo, D., et al. (2011). Gray matter decrease distribution in
the early stages of Anorexia Nervosa restrictive type in adoles-
cents. Psychiatry Research, 191(1), 24–30.
Giordano, G. D., Renzetti, P., Parodi, R. C., Foppiani, L., Zandrino,
F., Giordano, G., et al. (2001). Volume measurement with
Eur. Eat. Disorders Rev. (2011) © 2011 John Wiley & Sons, Ltd
magnetic resonance imaging of hippocampus-amygdala forma-
tion in patients with anorexia nervosa. Journal of Endocrinological
Investigation, 24(7), 510–514.
Giuliani, N. R., Calhoun, V. D., Pearlson, G. D., Francis, A., &
Buchanan, R. W. (2005). Voxel-based morphometry versus region
of interest: A comparison of two methods for analyzing gray
matter differences in schizophrenia. Schizophrenia Research,
74(2–3), 135–147.
Golden, N. H., Ashtari, M., Kohn, M. R., Patel, M., Jacobson, M. S.,
Fletcher, A., et al. (1996). Reversibility of cerebral ventricular
enlargement in anorexia nervosa, demonstrated by quantita-
tive magnetic resonance imaging. Journal of Pediatrics, 128(2),
296–301.
Inui, A., Asakawa, A., Kasuga, M., Kamikawa, S., Uemoto, M., &
Watanabe, T. (2002). Paracentral cortical atrophy in patients
with eating disorders. American Journal of Medicine, 112(8),
681–683.
Israel, M., Steiger, H., Kolivakis, T., McGregor, L., & Sadikot, A. F.
(2010). Deep brain stimulation in the subgenual cingulate cortex
for an intractable eating disorder. Biological Psychiatry, 67(9),
e53–e54.
Joos, A. A., Perlov, E., Buchert, M., Hartmann, A., Saum, B.,
Glauche, V., et al. (2010). Magnetic resonance spectroscopy of
the anterior cingulate cortex in eating disorders. Psychiatry Re-
search, 191(3), 196–200.
Kas, M. J., & Adan, R. A. (2011). Animal models of eating dis-
order traits. Current Topics in Behavioral Neurosciences, 6,
209–227.
Katzman, D. K., Christensen, B., Young, A. R., & Zipursky, R. B.
(2001). Starving the brain: Structural abnormalities and cognitive
impairment in adolescents with anorexia nervosa. Seminars in
Clinical Neuropsychiatry, 6(2), 146–152.
Katzman, D. K., Lambe, E. K., Mikulis, D. J., Ridgley, J. N.,
Goldbloom, D. S., & Zipursky, R. B. (1996). Cerebral
gray matter and white matter volume deficits in adolescent
girls with anorexia nervosa. Journal of Pediatrics, 129(6),
794–803.
Katzman, D. K., Zipursky, R. B., Lambe, E. K., & Mikulis, D. J.
(1997). A longitudinal magnetic resonance imaging study of
brain changes in adolescents with anorexia nervosa. Archives of
Pediatrics & Adolescent Medicine, 151(8), 793–797.
Kaye, W. H., Wagner, A., Fudge, J. L., & Paulus, M. (2010). Neuro-
circuity of eating disorders. Current Topics in Behavioral Neuros-
ciences, 6, 37–57.
Kazlouski, D., Rollin, M. D., Tregellas, J., Shott, M. E., Jappe, L. M.,
Hagman, J. O., et al. (2011). Altered fimbria-fornix white matter
integrity in anorexia nervosa predicts harm avoidance. Psychiatry
Research, 192(2), 109–116.
Keating, C. (2011). Sex differences precipitating anorexia nervosa in
females: The estrogen paradox and a novel framework for target-
ing sex-specific neurocircuits and behavior. Current Topics in Be-
havioral Neurosciences, 8, 189–207.
Kerem, N. C., & Katzman, D. K. (2003). Brain structure and func-
tion in adolescents with anorexia nervosa. Adolescent Medicine,
14(1), 109–118.
Kingston, K., Szmukler, G., Andrewes, D., Tress, B., & Desmond, P.
(1996). Neuropsychological and structural brain changes in an-
orexia nervosa before and after refeeding. Psychological Medicine,
26(1), 15–28.
Klump, K. L., Bulik, C. M., Kaye, W. H., Treasure, J., & Tyson, E.
(2009). Academy for eating disorders position paper: Eating dis-
orders are serious mental illnesses. International Journal of Eating
Disorders, 42(2), 97–103.
and Eating Disorders Association.
Klump, K. L., Keel, P. K., Sisk, C., & Burt, S. A. (2010). Preliminary
evidence that estradiol moderates genetic influences on disor-
dered eating attitudes and behaviors during puberty. Psychologi-
cal Medicine, 40(10), 1745–1753.
Kohn, M. R., Ashtari, M., Golden, N. H., Schebendach, J., Patel, M.,
Jacobson, M. S., et al. (1997). Structural brain changes and mal-
nutrition in anorexia nervosa. Annals of the New York Academy of
Sciences, 817, 398–399.
van Kuyck, K., Gerard, N., Van Laere, K., Casteels, C., Pieters, G.,
Gabriels, L., et al. (2009). Towards a neurocircuitry in anorexia
nervosa: Evidence from functional neuroimaging studies. Journal
of Psychiatric Research, 43(14), 1133–1145.
Lambe, E. K., Katzman, D. K., Mikulis, D. J., Kennedy, S. H., &
Zipursky, R. B. (1997). Cerebral gray matter volume deficits after
weight recovery from anorexia nervosa. Archives of General Psy-
chiatry, 54(6), 537–542.
Liberati, A., Altman, D. G., Tetzlaff, J., Mulrow, C., Gotzsche, P. C.,
Ioannidis, J. P., et al. (2009). The PRISMA statement for report-
ing systematic reviews and meta-analyses of studies that evaluate
healthcare interventions: Explanation and elaboration. BMJ, 339,
b2700.
Malhi, G. S., & Lagopoulos, J. (2008). Making sense of neuroimaging
in psychiatry. Acta Psychiatrica Scandinavica, 117(2), 100–117.
McCormick, L. M., Keel, P. K., Brumm, M. C., Bowers, W., Swayze,
V., Andersen, A., et al. (2008). Implications of starvation-in-
duced change in right dorsal anterior cingulate volume in an-
orexia nervosa. International Journal of Eating Disorders, 41(7),
602–610.
Mühlau, M., Gaser, C., Ilg, R., Conrad, B., Leibl, C., Cebulla, M. H.,
et al. (2007). Gray matter decrease of the anterior cingulate
cortex in anorexia nervosa. The American Journal of Psychiatry,
164(12), 1850–1857.
Noordenbos, G. (2011). When have eating disordered patients recov-
ered and what do the DSM-IV criteria tell about recovery? Eating
Disorders, 19(3), 234–245.
Papagni, S. A., Benetti, S., Arulanantham, S., McCrory, E., McGuire,
P., & Mechelli, A. (2011). Effects of stressful life events on human
brain structure: A longitudinal voxel-based morphometry study.
Stress, 14(2), 227–232.
Pietrini, F., Castellini, G., Ricca, V., Polito, C., Pupi, A., & Faravelli,
C. (2010). Functional neuroimaging in anorexia nervosa: A clin-
ical approach. European Psychiatry, 26(3), 176–182.
Radua, J., van den Heuvel, O. A., Surguladze, S., & Mataix-Cols, D.
(2010). Meta-analytical comparison of voxel-based morphome-
try studies in obsessive-compulsive disorder vs other anxiety dis-
orders. Archives of General Psychiatry, 67(7), 701–711.
Raznahan, A., Shaw, P., Lalonde, F., Stockman, M., Wallace, G. L.,
Greenstein, D., et al. (2011). How does your cortex grow? Journal
of Neuroscience, 31(19), 7174–7177.
Ridgway, G. R., Henley, S. M., Rohrer, J. D., Scahill, R. I., Warren, J.
D., & Fox, N. C. (2008). Ten simple rules for reporting voxel-
based morphometry studies. NeuroImage, 40(4), 1429–1435.
Roberto, C. A., Mayer, L. E., Brickman, A. M., Barnes, A., Muraskin,
J., Yeung, L. K., et al. (2011). Brain tissue volume changes follow-
ing weight gain in adults with anorexia nervosa. International
Journal of Eating Disorders, 44(5), 406–411.
Schäfer, A., Vaitl, D., & Schienle, A. (2010). Regional grey matter
volume abnormalities in bulimia nervosa and binge-eating disor-
der. Neuroimage, 50, 639–643.
Steiger, H., Bruce, K. R., & Groleau, P. (2011). Neural circuits, neu-
rotransmitters, and behavior: Serotonin and temperament in bu-
limic syndromes. Current Topics in Behavioral Neurosciences, 6,
125–138.
Structural Brain Imaging in Eating Disorders F. Van den Eynde et al.
Suchan, B., Busch, M., Schulte, D., Gronemeyer, D., Herpertz, S., &
Vocks, S. (2011). Reduction of gray matter density in the extra-
striate body area in women with anorexia nervosa. Behavioural
Brain Research, 206(1), 63–67.
Suda, M., Narita, K., Takei, Y., Aoyama, Y., Takahashi, K.,
Yuki, N., et al. (2010). Changes in gray matter volume with
rapid body weight changes in anorexia nervosa: A voxel-
based morphometric study. Biological Psychiatry, 70(8),
e35–e36.
Swayze, V. W., 2nd, Andersen, A. E., Andreasen, N. C., Arndt,
S., Sato, Y., & Ziebell, S. (2003). Brain tissue volume seg-
mentation in patients with anorexia nervosa before and after
weight normalization. International Journal of Eating Disor-
ders, 33(1), 33–44.
Tanabe, J., Tregellas, J. R., Dalwani, M., Thompson, L., Owens, E.,
Crowley, T., et al. (2009). Medial orbitofrontal cortex gray matter
is reduced in abstinent substance-dependent individuals. Biolog-
ical Psychiatry, 65(2), 160–164.
Treasure, J., Claudino, A. M., & Zucker, N. (2010). Eating disorders.
Lancet, 375(9714), 583–593.
Van den Eynde, F., & Treasure, J. (2009). Neuroimaging in eat-
ing disorders and obesity: Implications for research. Child
and Adolescent Psychiatric Clinics of North America, 18(1),
95–115.
Van den Eynde, F., Claudino, A. M., Mogg, A., Horrell, L., Stahl, D.,
Ribeiro, W., et al. (2010). Repetitive transcranial magnetic stim-
ulation reduces cue-induced food craving in bulimic disorders.
Biological Psychiatry, 67(8), 793–795.
Van den Eynde, F., Guillaume, S., Broadbent, H., Campbell, I. C., &
Schmidt, U. (2011). Repetitive transcranial magnetic stimulation
in anorexia nervosa: A pilot study. European Psychiatry. DOI:
10.1016/j.eurpsy.2011.06.002
Eur. Eat. Disorders Rev. (2011) © 20
Via, E., Radua, J., Cardoner, N., Happé, F., & Mataix-Cols, D.
(2011). Meta-analysis of gray matter abnormalities in autism
spectrum disorder: Should Asperger disorder be subsumed under
a broader umbrella of autistic spectrum disorder? Archives of
General Psychiatry, 68(4), 409–418.
Wagner, A., Greer, P., Bailer, U. F., Frank, G. K., Henry, S. E.,
Putnam, K., et al. (2006). Normal brain tissue volumes after
long-term recovery in anorexia and bulimia nervosa. Biological
Psychiatry, 59(3), 291–293.
Whitwell, J. L. (2009). Voxel-based morphometry: An automated
technique for assessing structural changes in the brain. Journal
of Neuroscience, 29(31), 9661–9664.
Wright, I. C., McGuire, P. K., Poline, J. B., Travere, J. M., Murray,
R. M., Frith, C. D., et al. (1995). A voxel-based method for the
statistical analysis of gray and white matter density applied to
schizophrenia. NeuroImage, 2(4), 244–252.
11 John Wiley & Sons, Ltd and Eating Disorders Association.
Related Documents