Structural Integrity Associates, Inc. File No.: 0900530.306 CALCULATION PACKAGE Project No.: 0900530 Quality Program: Z Nuclear 0 Commercial PROJECT NAME: Pilgrim Top Head Flaw and N9 Weld Overlay CONTRACT NO.: 10235773-01 CLIENT: PLANT: Entergy Nuclear Pilgrim Nuclear Power Station CALCULATION TITLE: ASME Code, Section III Evaluation of N9A Jet Pump Instrument Nozzle with Weld Overlay Repair Document Affected Project Manager Preparer(s) & Revision Pages Revision Description Approval Checker(s) Signature & Date Signatures & Date 0 1 - 25 Initial Issue A- - A-3 B-I - B-2 C-1 -C40 Minghao Qin Hal L. Gustin MQ 08/10/09 HLG 08/10/09 Karen K. Fujikawa KKF 08/10/09 Jennifer E. Smith JES 08/10/09 Page 1 of 25 F0306-01 RO

Welcome message from author
This document is posted to help you gain knowledge. Please leave a comment to let me know what you think about it! Share it to your friends and learn new things together.
Transcript
Structural Integrity Associates, Inc. File No.: 0900530.306
CALCULATION PACKAGE Project No.: 0900530Quality Program: Z Nuclear 0 Commercial
PROJECT NAME:Pilgrim Top Head Flaw and N9 Weld Overlay
CONTRACT NO.:
10235773-01
CLIENT: PLANT:Entergy Nuclear Pilgrim Nuclear Power Station
CALCULATION TITLE:ASME Code, Section III Evaluation of N9A Jet Pump Instrument Nozzle with Weld Overlay Repair
Document Affected Project Manager Preparer(s) &Revision Pages Revision Description Approval Checker(s)
Signature & Date Signatures & Date
0 1 - 25 Initial IssueA- - A-3B-I - B-2C-1 -C40 Minghao Qin
Hal L. Gustin MQ 08/10/09HLG 08/10/09
Karen K. FujikawaKKF 08/10/09
Jennifer E. SmithJES 08/10/09
Page 1 of 25F0306-01 RO
Structural Integrity Associates, Inc.
Table of Contents
1.0 O B JE C T IV E .................................................................................................................. 4
2.0 DESIGN CRITERIA .............................................. 4
3.0 BOUNDARY CONDITIONS, STRESS PATH DEFINITIONS, AND UNITPRESSURE ................................ .................................................. 4
3.1 Boundary Conditions ................................................................................... 4
3.2 Stress Path D efinitions ................................................................................. 4
3.3 U nit Pressure L oad ............................................................................................. 54 .0 L O A D S .......................................................................................................................... 5
5.0 LOAD COM BIN ATION S ....................................................................................... 56.0 ASME CODE STRESS LIMITS EVALUATION ................................................ ý.6
6.1 Design Load Combination ..................................... 76.2 Service Level A/B Load Combination ............................... '-! ....................... 7
6.3 Pure Shear Stress Evaluation for Path 2 ........................... 87.0 FA TIG U E EV A LUA TION ............................................... I ........................................... 8
7.1 V ESLFA T Program .................................................................................... 8
7.1.1 Cyclic D ata (*. C YC) .......................................................................................... 97.1.2 Fatigue Data Input File (*.FDT) ................................................................. 9
7.1.3. Stress D ata Input File (*.STR) ...................................................................... 97.1.4 Fatigue Usage (*.FA T) .............................................................................. I l
8.0 C O N C LU SIO N S .................................................................................................... 119.0 REFER EN C E S ...................................................................................................... 12
Appendix A CALCULATION OF THE HEAT TRANSFER COEFFICIENTS ................ A-IAppendix B SUPPORTING FILES ................................................................................. B-1
Appendix C EXAMPLE VESLFAT FILES ...................................................................... C-1
File No.: 0900530.306 Page 2 of 25Revision: 0
F0306-01.
Structural Integrity Associates, Inc.
List of Tables
Table 1: Bounding Transients to be Analyzed ................................................................... 13
Table 2: Load Com binations ............................................................................................ 14
Table 3: Allowable Stress Intensity Ranges ..................................................................... 14
Table 4: Materials at Each Path Inside and Outside Locations ........................................ 15
T able 5: M aterial Properties (1) ............................................................................................... 16
Table 6: Design Load Combination, Stress Intensity Evaluation ....................................... 17
Table 7: Service Level A/B Load Combination, P+Q Stress Intensity Evaluation ............ 18
Table 8: Load Sets as Input to VESLFAT ....................................................................... 19
Table 9: Carbon/Low Alloy Steel and Stainless Steel Fatigue Curves ............................. 21Table 10: Fatigue Usage Results .......................................... ............................................. 22
List of Figures,
Figure 1: Boundary Conditions ......................................................................................... 23
Figure 2: Thermal Region Definitions .............................................................................. 23Figure 3: Stress Path Definitions for ASME Code Evaluation ......................................... 24
Figure 4: Unit Internal Pressure ......................................................................................... 24Figure 5: Stress Intensity under Unit Pressure ................................................................ 25
File No.: 0900530.306Revision: 0
Page 3 of 25
F0306-01
Structural Integrity Associates, Inc.
1.0 OBJECTIVE
The objective of this calculation is to show that the ASME Code, Section III [1] design requirements aresatisfied for a weld overlay repair of the jet pump instrument nozzle, N9A, at Pilgrim Nuclear PowerStation (PNPS). An as-built weld overlay repair is provided in Reference [6].
A finite element model has been built [2] to support the ASME Code evaluations. These analyses,together with the design requirements of the ASME Code [1], will be used to determine the adequacy ofthe repairs.
2.0 DESIGN CRITERIA
In accordance with the requirements of Code Case N-504-3, it is necessary to demonstrate that theprimary stress requirements of the design Code continue to be met following repair. For the jet pumpinstrument nozzle, the requirements of the ASME Code, Section III for Class I components apply. Assuch, the rules of Article NB-3000 of Section III of the ASME Code, 2001 Edition with Addendathrough 2003 [1], are used, and results will be reconciled with the original stress report.
The weld overlay repair region affects the instrument nozzle and safe end. As a result, the instrumentnozzle and safe end of the repair will be evaluated using the rules of Subarticle NB-3200.
3.0 BOUNDARY CONDITIONS, STRESS PATH DEFINITIONS, AND UNIT PRESSURE
3.1 Boundary Conditions
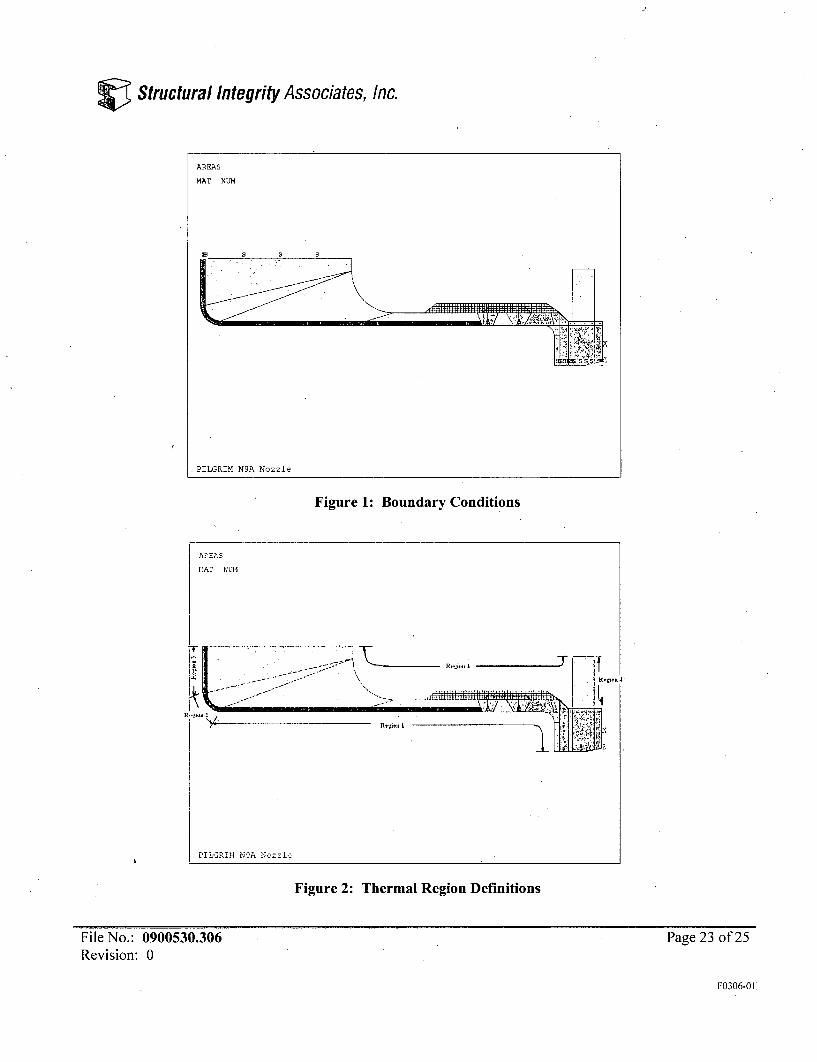
The jet pump instrument nozzle finite element model was built in Reference [2] with ANSYSprogram Release 8.1 [12] which is also used for this calculation. Two symmetric boundaryconditions are applied at the two cross sections at the nozzle and penetration seal. To avoid rigidbody movement, an axial direction restraint is applied at the inside corner of the nozzle cross sectionon the vessel side. Figure 1 shows the mechanical boundary condition.
The heat transfer coefficients (HTC) and temperatures are applied to four regions. The nozzle HTCand temperature are applied to Region I and the vessel HTC and temperature are applied to Region3. The HTC and temperature of Region 2 (nozzle inner blend radius) is linearly transitioned fromthe HTC value used in Region I to the HTC value used in Region 3. The Region 4 HTC andtemperature are assumed to be 0.2 BTU/hr-ft2-°F and I 00°F. Figure 2 shows the region definitions.
3.2 Stress Path Definitions
Four stress paths are defined and shown in Figure 3. These paths are used for the ASME CodeSection III analysis.
File No.: 0900530.306 Page 4 of 25Revision: 0
F0306-01I
Structural Integrity Associates,- Inc.
3.3 Unit Pressure Load
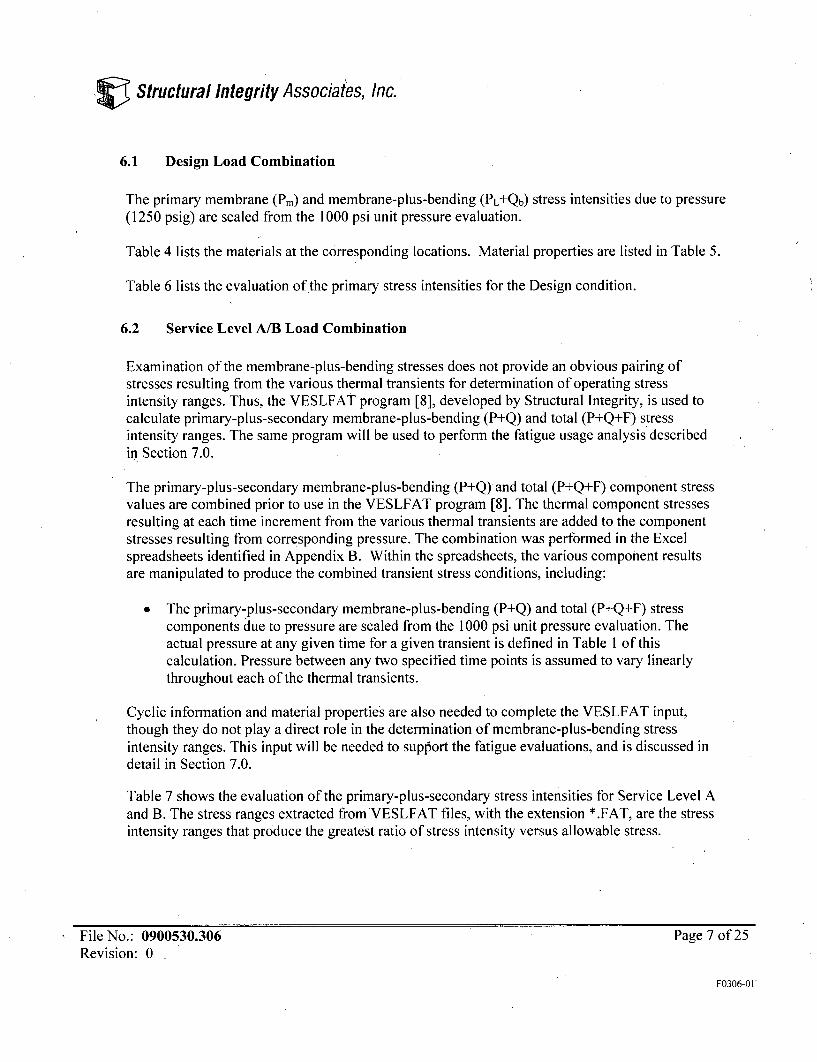
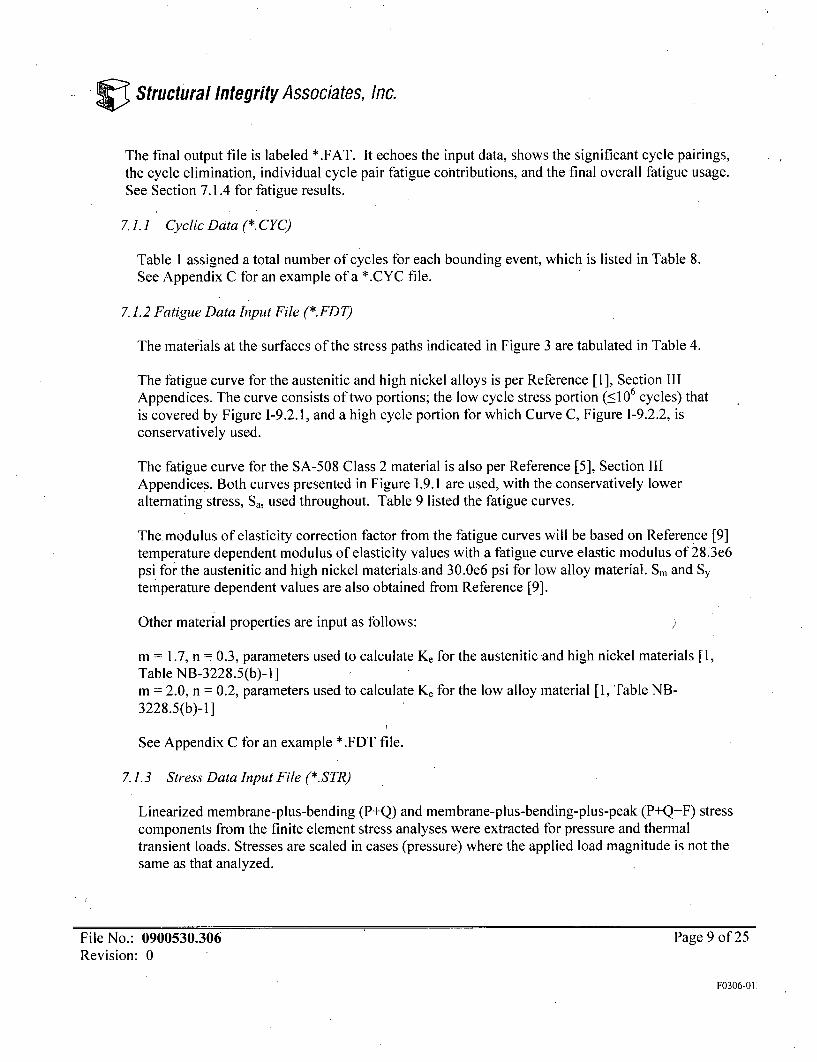
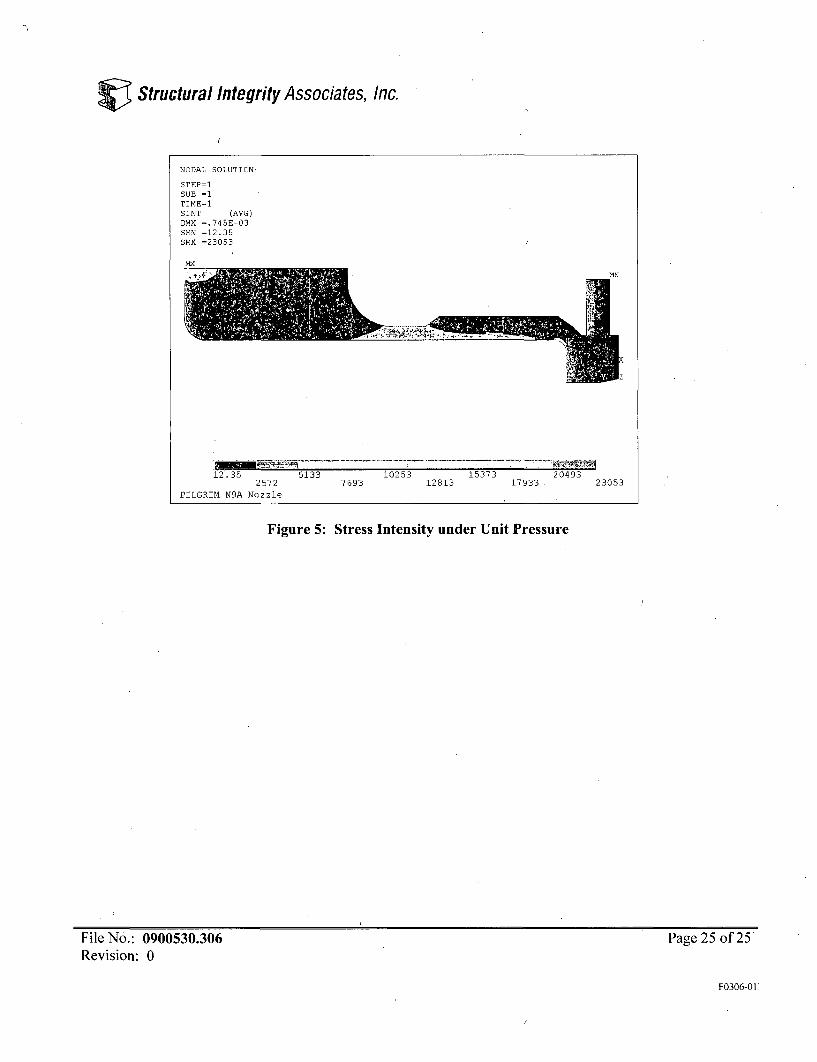
A uniform pressure of 1,000 psi was applied along the inside surface of the nozzle and thepenetration seal. Figure 4 shows the applied pressure and Figure 5 shows the stress intensitydistribution.
4.0 LOADS
This evaluation only considers Design Loadings, Normal (Service Level A) and Upset (Service Level B)operating conditions in regards to meeting ASME Code, Section III Design and Service Level A/Ballowables and fatigue. As such, thermal stresses resulting from Emergency (Service Level C) andFaulted (Service Level D) thermal transients are not considered [1, NB-3224.1, NB-3224.4 andAppendix F- 1310].
Primary stresses (such as mechanical loads due to deadweight, seismic effects and pressure) resultingfrom Design, Service Level A, B, C and D operating conditions are discussed in Section 5.0.
Pressure
Per References [3] and [4], the design pressure is 1250 psig at 5750F and the operating pressure loadsrange from 0 psig to 1410 psig throughout the various thermal transients, whose temperatures rangefrom 70'F to 556°F. The hydrostatic test (Transient 24) pressure ranges from 0 psig to 1565 psig. Thepressure variations for the various transients are summarized in Table 1.
Thermal Transients
Reference [5] defines eight thermal transients which are shown in Table 1. Details of the thermaltransients are provided in References [3] and [4].
Mechanical Pipin2 Loads
The jet pump instrument nozzle is not subjected to mechanical piping loads per Reference [5].
5.0 LOAD COMBINATIONS
The load combinations used in the repair design are:
I. Design Load Combination2. Level A Load Combination3. Level B Load Combination4. Level C Load Combination5. Level D Load Combination6. Test Load Combination
File No.: 0900530.306 Page 5 of 25Revision: 0
F0306-01I

Structural Integrity Associates, Inc.
The weld overlay sizing evaluation [6] considered general primary membrane, Pm, and primarymembrane-plus-bending, Pm + Pb, stress intensities resulting from design/normal/upset (Design andLevels A & B) operating conditions and emergency/faulted (Levels C and D) conditions. Localprimary membrane, PL, stress intensities were not specifically evaluated, because acceptability of thePm and Pb stress intensities results in acceptable PL stress intensities.
The primary, Pm and primary membrane-plus-bending, Pm + Pb stress intensities (and as previouslyindicated, local primary membrane, PL, stress intensities) under design condition have to meet ASMECode Section II1, NB-3221. The specific load combinations are shown in Table 2. The allowablestress intensities for these load combinations are presented in Table 3 [1].
The sizing calculation did not specifically evaluate loads resulting from the Test Load Combination(Hydrostatic). However, the Test Load Combination considers only primary stresses, which resultfrom pressure and mechanical loads. The added thickness of the weld overlay will only serve toreduce the general primary, Pm, and primary membrane-plus-bending, Pm + Pb stress intensities (andas previously indicated, local primary membrane, PL, stress intensities) when compared to the originalconfiguration. Therefore, the only load combinations which will be considered herein are ServiceLevels A and B. The specific load combinations are shown in Table 2. The allowable stressintensities for these load combinations are presented in Table 3 [1]. Also, as indicated in Table 3,requirements for peak stresses and cyclic operation must also be met for Service Levels A and B.
Per ASME Code Section III NB-3227.2, the average primary shear stress (including Design, ServiceLevels A, B and C) shall be limited to 0.6 Sm and the maximum primary shear stress (includingDesign, Service Levels A, B and C) shall be limited to 0.8 Smn. This requirement is only applied to thelimiting Path 2 in Figure 3.
It should be noted that in using the ASME Code, Section 1II, Class .1 rules in NB-3200, ServiceLevels A and B are combined together using bounding load combinations.
Thus, this calculation, together with Reference [6], contains the ASME Code qualification for the weldoverlay repair for PNPS.
6.0 ASME CODE STRESS LIMITS EVALUATION
Stress intensities are calculated for the various load combinations shown in Table 2 and stressintensity ranges are compared to the allowable limits shown in Table 3. Linearized stresses wereevaluated through four paths (see Figure 3) throughout the transient time histories and the pressureanalyses. These calculated stress intensities are then evaluated in accordance' with ASME Code,Section II, Subarticle NB-3200 [1].
File No.: 0900530.306 Page 6. of 25Revision: 0
F0306-01
Structural Integrity Associates, Inc.
6.1 Design Load Combination
The primary membrane (Pm) and membrane-plus-bending (PL+Qb) stress intensities due to pressure(1250 psig) are scaled from the 1000 psi unit pressure evaluation.
Table 4 lists the materials at the corresponding locations. Material properties are listed in Table 5.
Table 6 lists the evaluation of the primary stress intensities for the Design condition.
6.2 Service Level A/B Load Combination
Examination of the membrane-plus-bending stresses does not provide an obvious pairing ofstresses resulting from the various thermal transients for determination of operating stressintensity ranges. Thus, the VESLFAT program [8], developed by Structural Integrity, is used tocalculate primary-plus-secondary membrane-plus-bending (P+Q) and total (P+Q+F) stressintensity ranges. The same program will be used to perform the fatigue usage analysis describedin Section 7.0.
The primary-plus-secondary membrane-plus-bending (P+Q) and total (P+Q+F) component stressvalues are combined prior to use in the VESLFAT program [8]. The thermal component stressesresulting at each time increment from the various thermal transients are added to the componentstresses resulting from corresponding pressure. The combination was performed in the Excelspreadsheets identified in Appendix B. Within the spreadsheets, the various component resultsare manipulated to produce the combined transient stress conditions, including:
The primary-plus-secondary membrane-plus-bending (P+Q) and total (P+Q+F) stresscomponents due to pressure are scaled from the 1000 psi unit pressure evaluation. Theactual pressure at any given time for a given transient is defined in Table I of thiscalculation. Pressure between any two specified time points is assumed to vary linearlythroughout each of the thermal transients.
Cyclic information and material properties are also needed to complete the VESLFAT input,though they do not play a direct role in the determination of membrane-plus-bending stressintensity ranges. This input will be needed to support the fatigue evaluations, and is discussed indetail in Section 7.0.
Table 7 shows the evaluation of the primary-plus-secondary stress intensities for Service Level Aand B. The stress ranges extracted from VESLFAT files, with the extension *.FAT, are the stressintensity ranges that produce the greatest ratio of stress intensity versus allowable stress.
File No.: 0900530.306 Page 7 of 25Revision: 0
F0306-01!

Structural Integrity Associates, Inc.
Examination of the maximum primary-plus-secondary (P+Q) range load pairs and fatigue causingload pairs (in the *.FAT files), identified the controlling thermal transients. The results are shown inTable 7.
6.3 Pure Shear Stress Evaluation for Path 2
The maximum primary stress occurs due to the test load (1565 psig), the shear stress can be scaledbased on the 1000 psig results. Therefore, the maximum shear stress is 1.050 ksi which is below theallowable 0.6 Sm = 0.6 * 15.8 = 9.48 ksi, where Sm with 15.8 ksi is taken from Reference [5, page17].
7.0 FATIGUE EVALUATION
The fatigue evaluations are performed for Paths 1 through 4 of the weld overlay repair as shown inFigure 3. Both the inside and outside surfaces of the indicated paths will be evaluated. Theevaluations are performed in accordance with ASME Code, Section III, Subparagraph NB-3222.4(e)[1] for Paths I through 4, and use of the VESLFAT program [8].
7.1 VESLFAT Program
The VESLFAT program requires three input files. The first is the *.CYC file, which includes thenumber of cycles for each load combination. The input used in the *.CYC file is discussed in detailin Section 7.1.1. The second file is the *.FDT file, which includes the fatigue curve data,appropriate temperature dependent material properties, and simplified elastic-plastic limits andfactors. These values are discussed in Section 7.1.2. The final input file is the *.STR file, whichcontains the component membrane-plus-bending and membrane-plus-bending-plus-peak, e.g. total,stress components for the various load conditions to be evaluated. Additional details are provided inSection 7.1.3. As several load conditions occur within each load case, these load conditions will beidentified by a number, which matches the load condition to the load case. This number is definedin the *.CYC file. Each of these three files must be identically named, with the exception of the fileextension.
A number of intermediate files are generated which can be used to check the final results. The
*.STI file is an echo output of the *.STR file but includes transformations to output the results in
terms of psi. The *.ALL file reflects all of the stress range pairs that are calculated. The *.PR file isa shortened version of the *.ALL file and lists only the significant (i.e., fatigue causing) pairs. The*.ORD file re-sequences the *.PR file such that the ordered pairs are arrayed in order of reducingalternating stress.
File No.: 0900530.306 Page 8 of 25Revision: 0
F0306-01I
Structural Integrity Associates, Inc.
The final output file is labeled *.FAT. It echoes the input data, shows the significant cycle pairings,the cycle elimination, individual cycle pair fatigue contributions, and the final overall fatigue usage.See Section 7.1.4 for fatigue results.
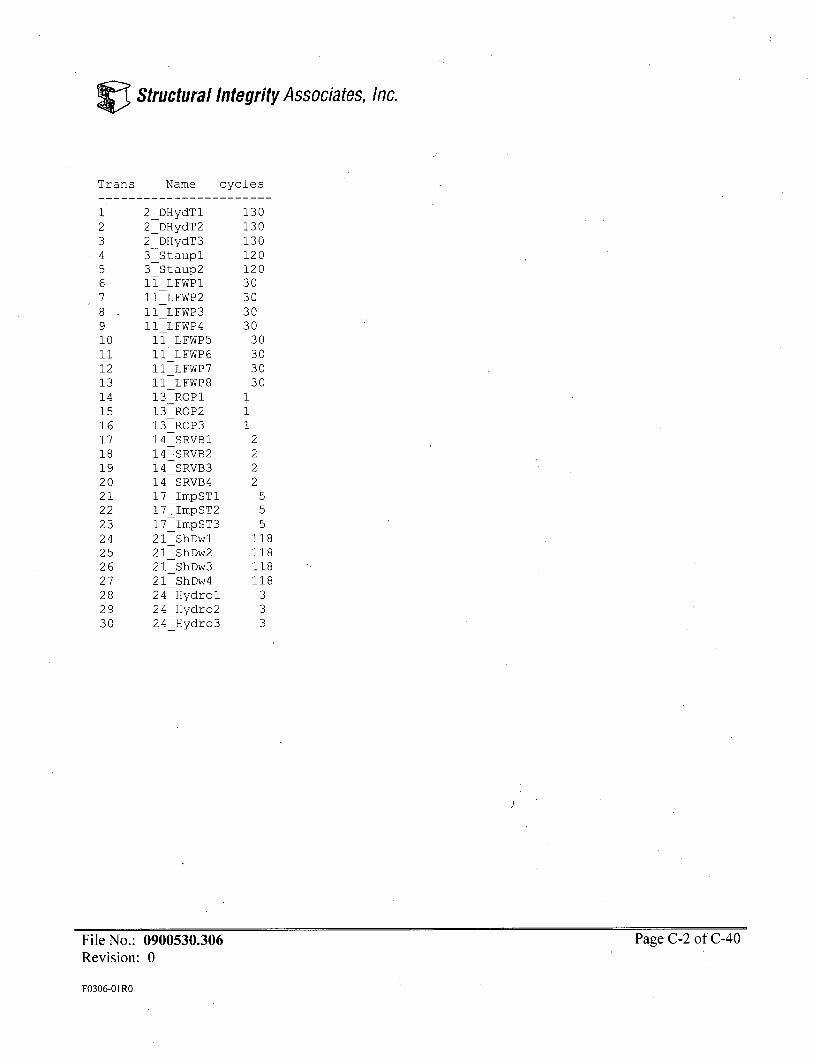
7.1.1 Cyclic Data (*. CYC)
Table I assigned a total number of cycles for each bounding event, which is listed in Table 8.See Appendix C for an example of a *.CYC file.
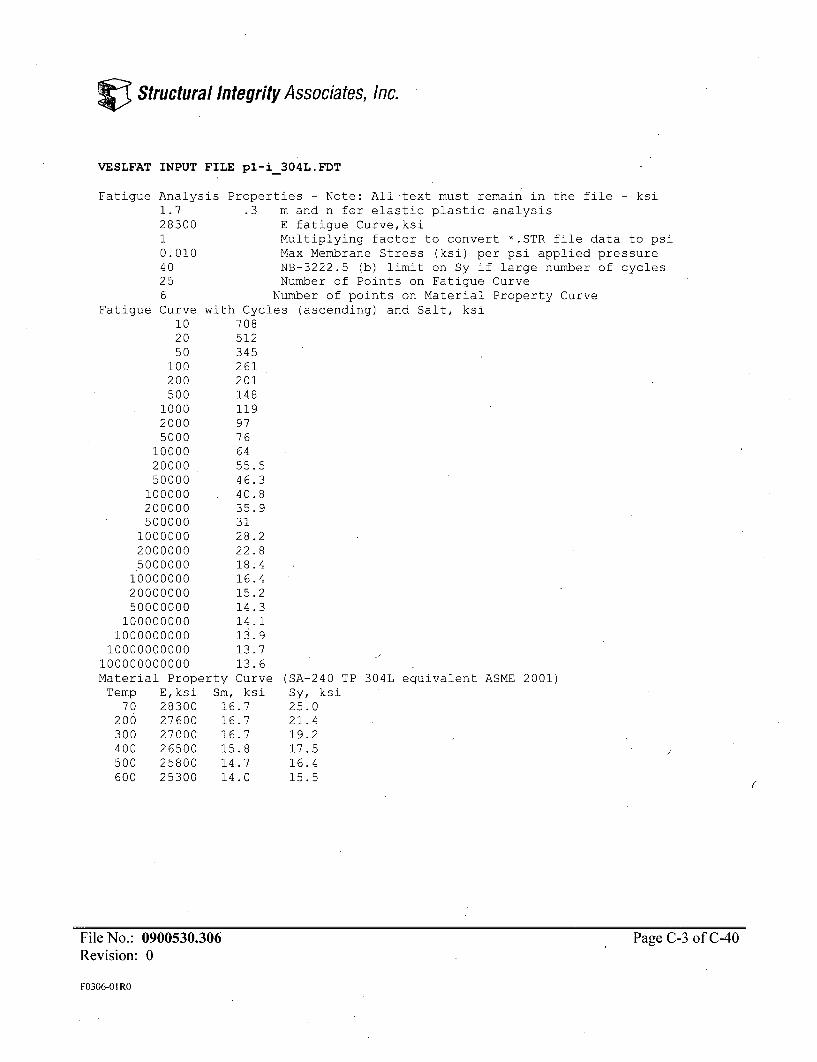
7.1.2 Fatigue Data Input File (*.FDT)
The materials at the surfaces of the stress paths indicated in Figure 3 are tabulated in Table 4.
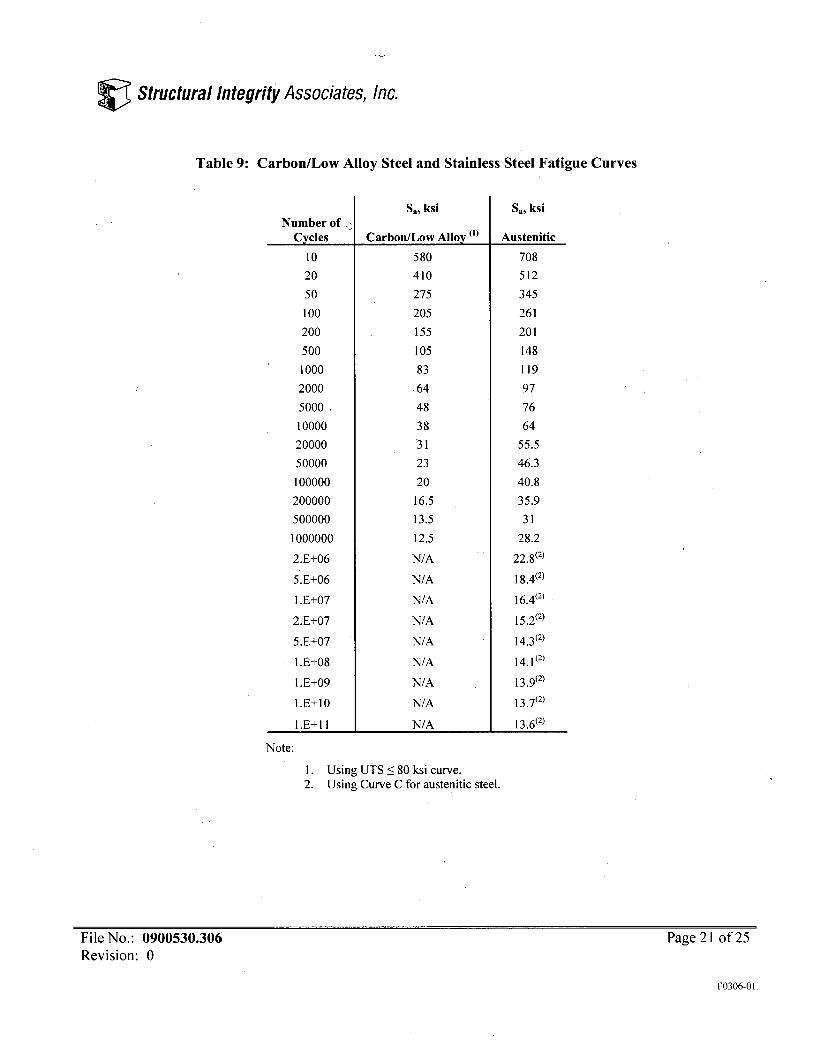
The fatigue curve for the austenitic and high nickel alloys is per Reference [1], Section IIIAppendices. The curve consists of two portions; the low cycle stress portion (<106 cycles) thatis covered by Figure 1-9.2.1, and a high cycle portion for which Curve C, Figure 1-9.2.2, isconservatively used.
The fatigue curve for the SA-508 Class 2 material is also per Reference [5], Section IIIAppendices. Both curves presented in Figure 1.9.1 are used, with the conservatively loweralternating stress, Sa, used throughout. Table 9 listed the fatigue curves.
The modulus of elasticity correction factor from the fatigue curves will be based on Reference [9]temperature dependent modulus of elasticity values with a fatigue curve elastic modulus of 28.3e6psi for the austenitic and high nickel materialsand 30.0e6 psi for low alloy material. Sm and Sytemperature dependent values are also obtained from Reference [9].
Other material properties are input as follows:
m = 1.7, n = 0.3, parameters used to calculate Ke for the austenitic and high nickel materials [1,Table NB-3228.5(b)-l]m = 2.0, n = 0.2, parameters used to calculate Ke for the low alloy material [1, Table NB-3228.5(b)-i]
See Appendix C for an example *.FDT file.
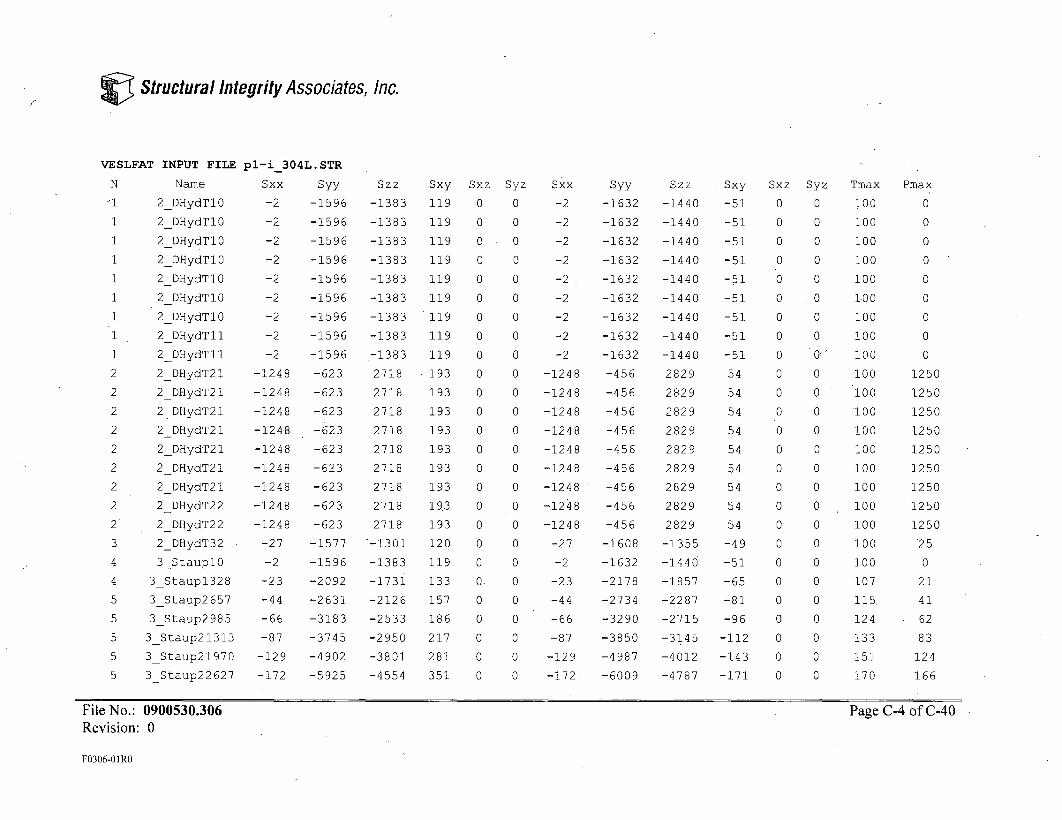
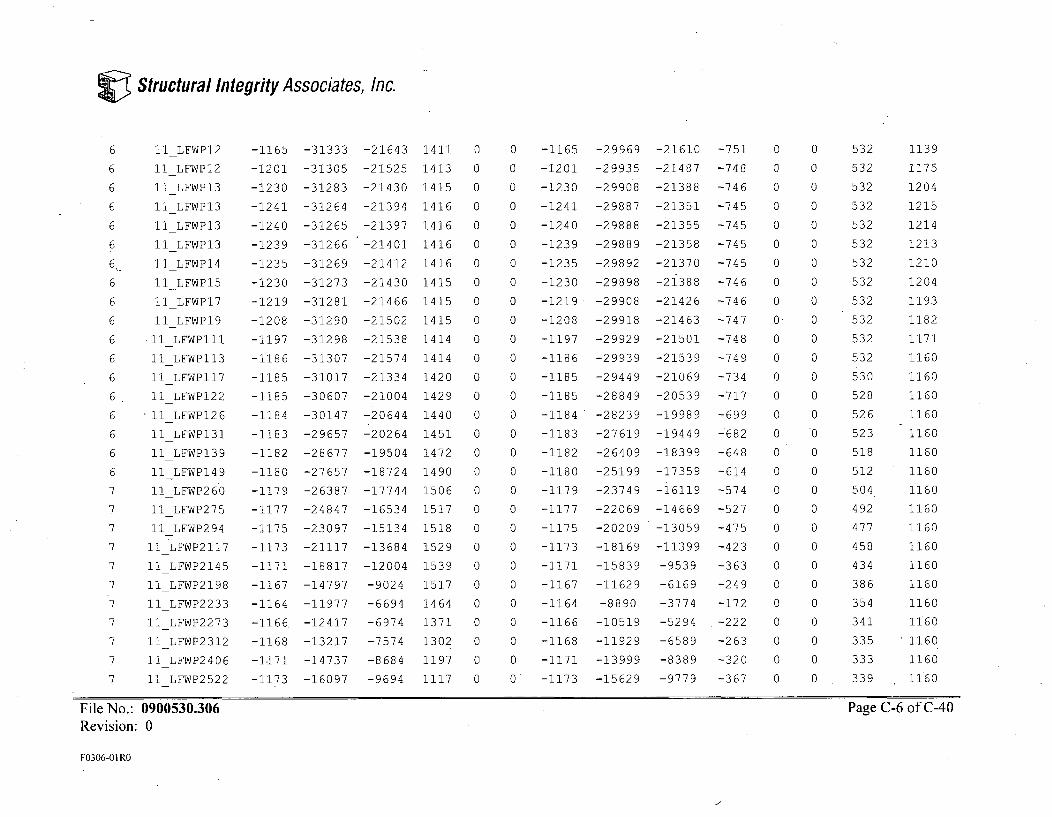
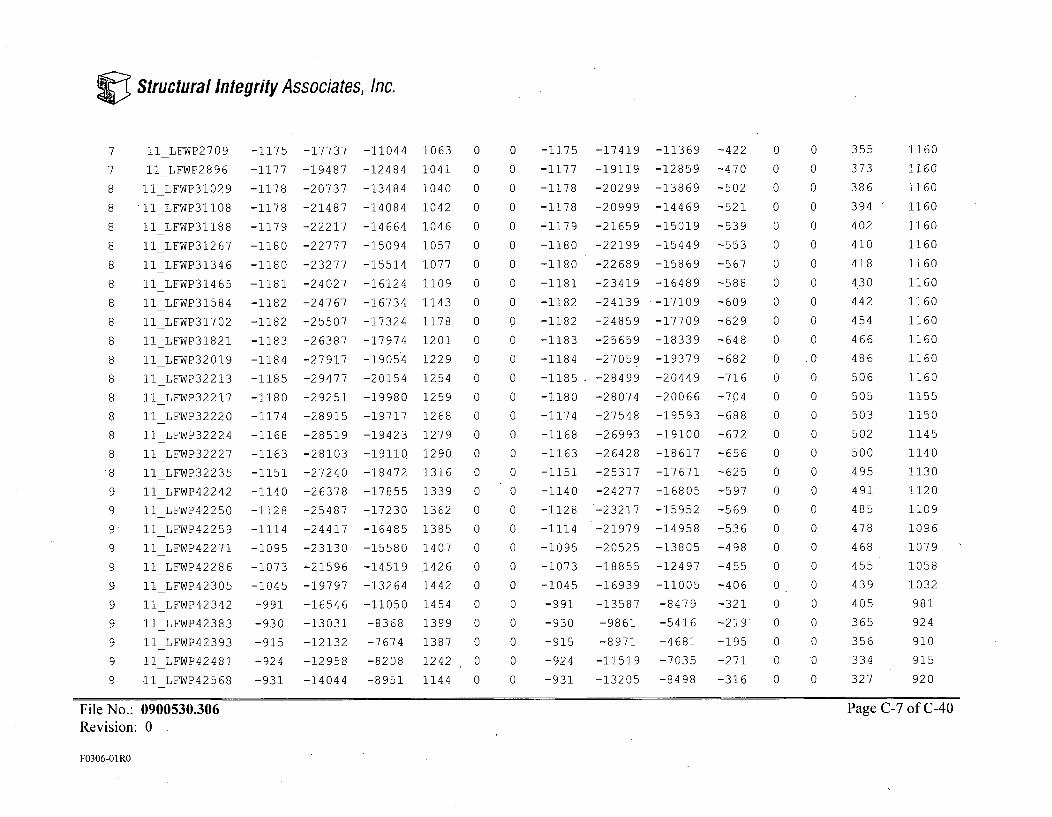
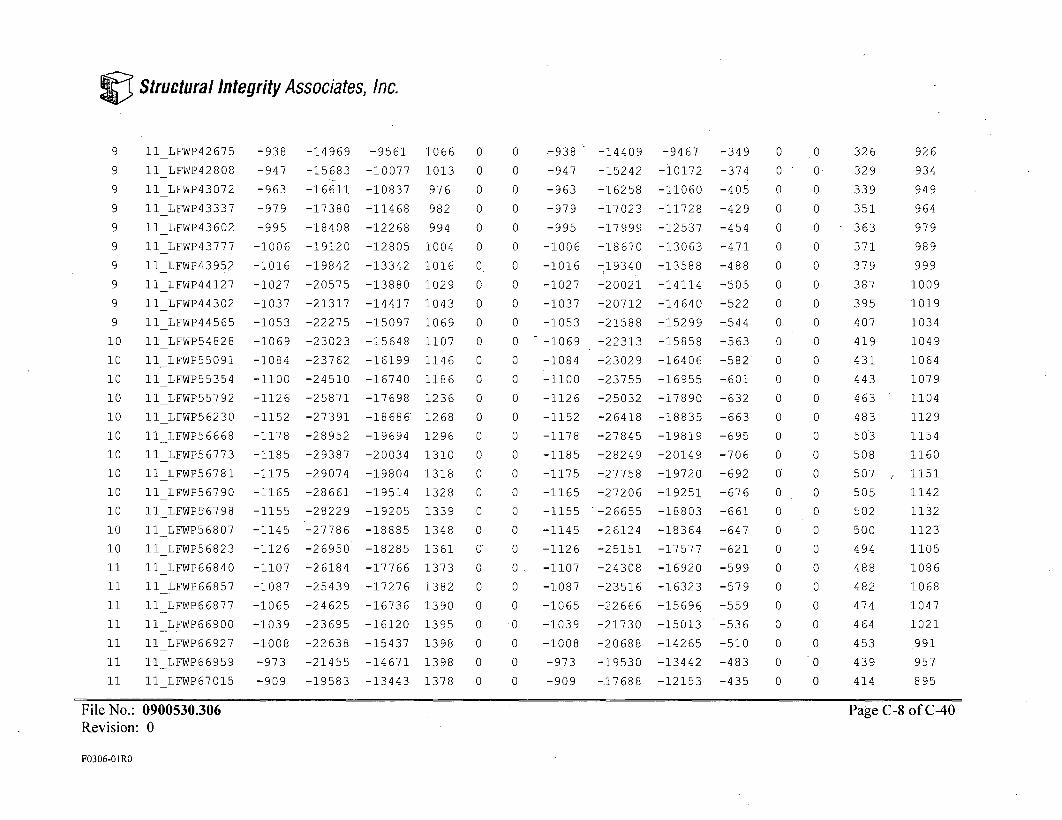
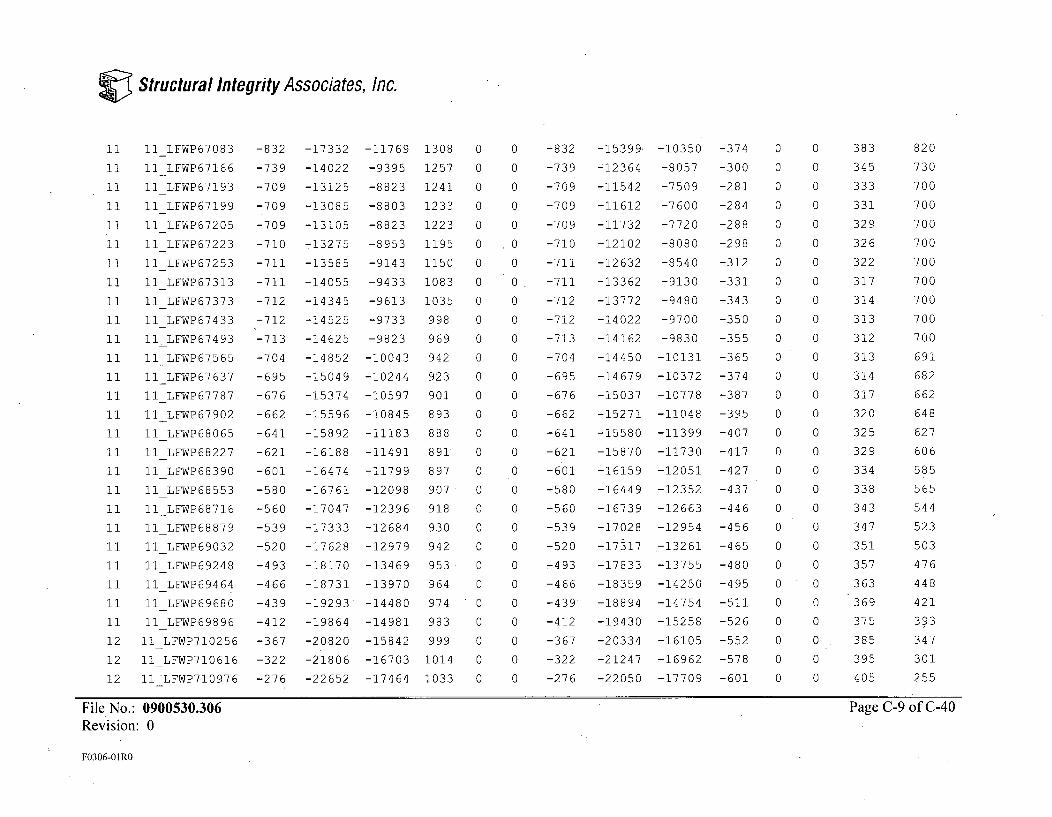
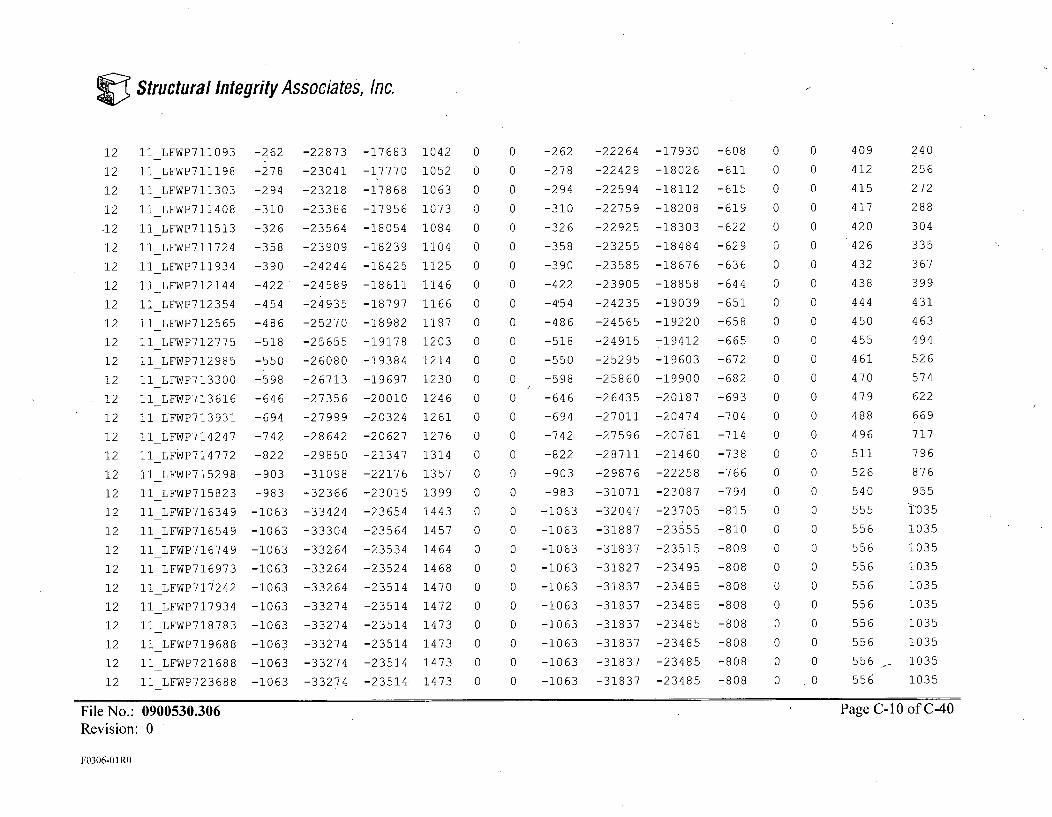
7.1.3 Stress Data Input File (*.STR)
Linearized membrane-plus-bending (P+Q) and membrane-plus-bending-plus-peak (P+Q+F) stresscomponents from the finite element stress analyses were extracted for pressure and thermaltransient loads. Stresses are scaled in cases (pressure) where the applied load magnitude is not thesame as that analyzed.
File No.: 0900530.306 Page 9 of 25Revision: 0
F0306-01O

Structural Integrity Associates, Inc.
The resulting stress components are then added together to create the load combination for eachthermal transient throughout the length of the event. Thus, thermal stresses are added to the scaledpressure stresses to create each membrane-plus-bending and membrane-plus-bending-plus-peakstress components entry.
Paths I and 4 terminate on the outside at geometric discontinuities. For these locations, fatiguestrength reduction factors have to be calculated based on Reference [11, pages 91 through 94].All of inside surfaces, as well as the outside surfaces of paths 2 and 3 do not have any geometricdiscontinuity and hence the fatigue strength reduction factor is unity.
The equation for calculating the fatigue strength reduction factor is based on Reference [11, pages91 through 94]. The equation is as following:
where:
S = angle of contour= 36.50 for Path 1 outside [2]
450 for Path 4 outside [2]
r radius of curvature at contour interface= 0.25 inches (assumed)
h = height difference between contours= 0.438 inches for Path I outside [2]= 0.41 inches for Path 4 outside [2]
t = half thickness of thinner contour= 0.608 inches for Path I outside [2]= 0.880 inches for Path 4 outside (measured from inside node to outside node)
r/t = 0.411 for Path I outside= 0.284 for Path 4 outside
Ko = 1.95 for Path I outside, per page 92 of Reference [11]= 2.20 for Path 4 outside per page 92 of Reference [11]
Therefore
K = 1.87 for Path I outside= 2.04 for Path 2 outside
File No.: 0900530.306 Page 10 of 25Revision: 0
F0306-01.
Structural Integrity Associates, Inc.
In addition, for those locations with fatigue strength reduction factors, the peak thermal stresscomponents are added back into the total stress to capture the peak stress due to nonlinear radialtemperature gradient, as follows:
P+Q+F = (ANSYS membrane plus bending)FSRF + ANSYS peak
For those paths that do not occur at'a geometric discontinuity, no fatigue strength reduction factoris used. Instead, the membrane-plus-bending-plus-peak (P+Q+F) component stresses from thefinite element stress analyses will be used directly.
The *.STR file includes the temperature of the location as it varies throughout the events and thepressure. The pressures vary as indicated in Section 3.0 and Table 1. The temperature at thelocation is the calculated metal temperature of the material rather than the fluid temperature.These metal temperatures were extracted via the linearized stress results files, which include thetemperature data in the last field under "Total" stress.
The load combinations and the development of the *.STR file entries were performed in the Excelspreadsheets identified in Appendix B. An example of the *.STR file is shown in Appendix C.
7.1.4 Fatigue Usage (*.FAT)
The fatigue evaluation automatically selects the load pairs that create the greatest alternatingstress, performs a Ke calculation, corrects for the modulus of elasticity, and performs the fatigueevaluation. It repeats this process selecting the next highest stress range until the available cyclesare used up or the remaining stress ranges fall below the endurance limit. An example *.FAT fileis included in Appendix C. The intermediate solution files *.STI, *.ALL, *.PR, and *.ORD areincluded with computer files.
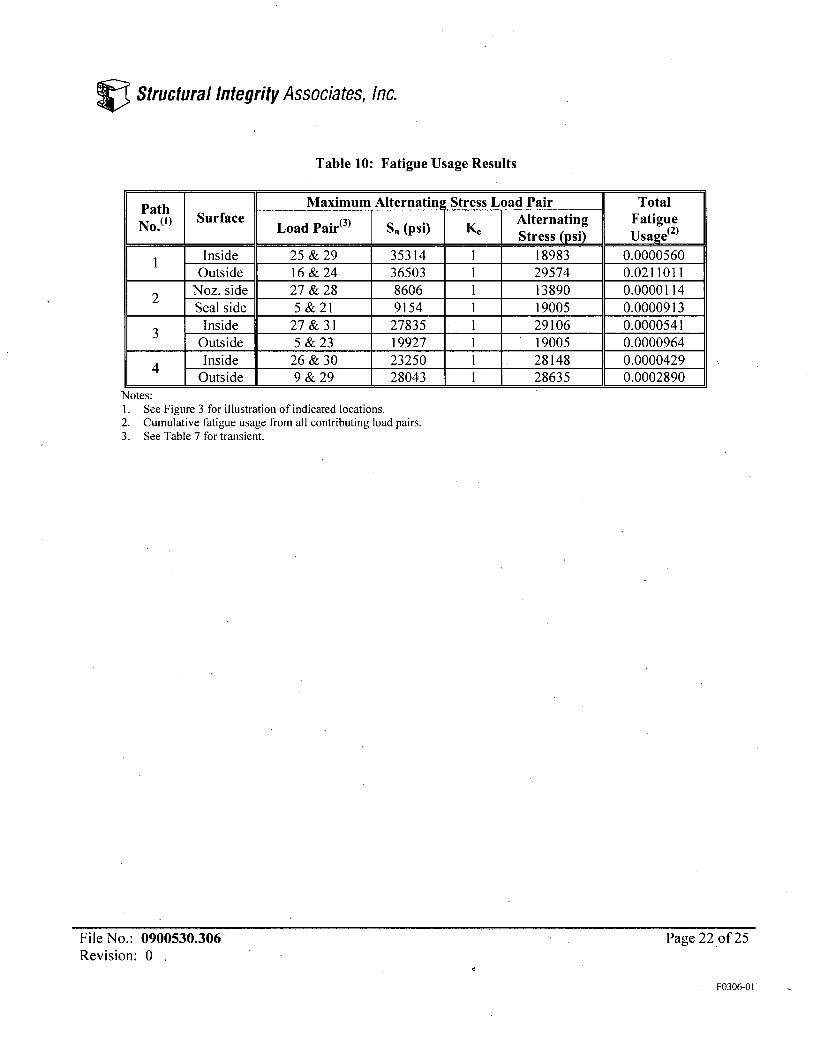
Table 10 tabulates the total fatigue usage for each location. In addition, the table includesinformation on the load pairing that produces the greatest alternating stress for each location,including the corresponding membrane-plus-bending stress intensity range, the calculated Keelastic-plastic factor, and the alternating stress, Sa, for the specific load pair.
8.0 CONCLUSIONS
An evaluation of the jet pump instrument nozzle weld overlay repair for PNPS has been performed inaccordance with the requirements of the ASME Boiler and Pressure Vessel Code, Section III, forClass 1 components [ 1 ]. Stress intensities were conservatively determined for pressure and boundingthermal transients, and compared against ASME Code allowables for primary-plus-secondary stresseffects. In all cases, the reported values of stress intensity range are less than their correspondingallowable Values.
File No.: 0900530.306 Page 11 of 25Revision: 0
F0306-01
Structural Integrity Associates, Inc.
A detailed fatigue analysis was also performed. For the given number of expected cyclescorresponding to a design period (see Table 1), the total usage at all locations evaluated is below theallowable value of I (see Table 10).
In conclusion, the jet pump instrument nozzle weld overlay repair for PNPS, provided in Reference [7],satisfies the requirements of ASME Code Section 111.
9.0 REFERENCES
1. ASME Boiler and Pressure Vessel Code, Section III, Rules for Construction of NuclearFacility Components, 2001 Edition with Addenda through 2003.
2. SI Calculation No. 0900530.305, "Weld Overlay Finite Element Model (FEM) and MaterialProperties for Nozzle N9A," (for revision refer to SI Project Revision Log, latest revision).
3. Boston Edison Company Drawing No. MIA12-2, Revision E0, (GE Drawing No. 730E491)"Reactor Thermal Cycles," SI File No. PNPS-20Q-205.
4. Entergy Condition Report No. CR-PNP-2001-08015, 11/09/2001, SI File No. PNPS-IOQ-214.
5. Combustion Engineering, Inc., "Analytical Report for Pilgrim Reactor Vessel," Report No.CENC- 1139, Approved 3/9/71, SI File No. PNPS-1OQ-21 I.
6. SI Calculation No. 0900530.301, Revision 1, "Weld Overlay Design for Jet Pump.Instrumentation Nozzle N9A," April 30, 2009.
7. Welding Services, Inc. Drawing. "Construction Drawing Pilgrim, N9A." (2 sheets), DrawingNo. 409506, May 1, 2009, SI File No. 0900530.202.
8. VESLFAT, Version 1.42, Structural Integrity Associates, Inc., February 6, 2007.
9. ASME Boiler and Pressure Vessel Code, Section II, Part D, 2001 Edition with Addendathrough 2003.
10. J. P. Holman, "Heat Transfer," 5th Edition, McGraw-Hill, Inc., 1981.
11. Office of Technical Services, United States Department of Commerce, "Tentative StructuralDesign Basis for Reactor Pressure Vessels and Directly Associated Components (PressurizedWater Cooled Systems)," December 1, 1958 with Addendum No. 1, 27 February, 1959.
12. ANSYS/Mechanical, Release 8.1 (w/Service Pack 1), ANSYS Inc., June 2004.
File No.: 0900530.306 Page 12 of 25Revision: 0
F0306-011
Structural Integrity Associates, Inc.
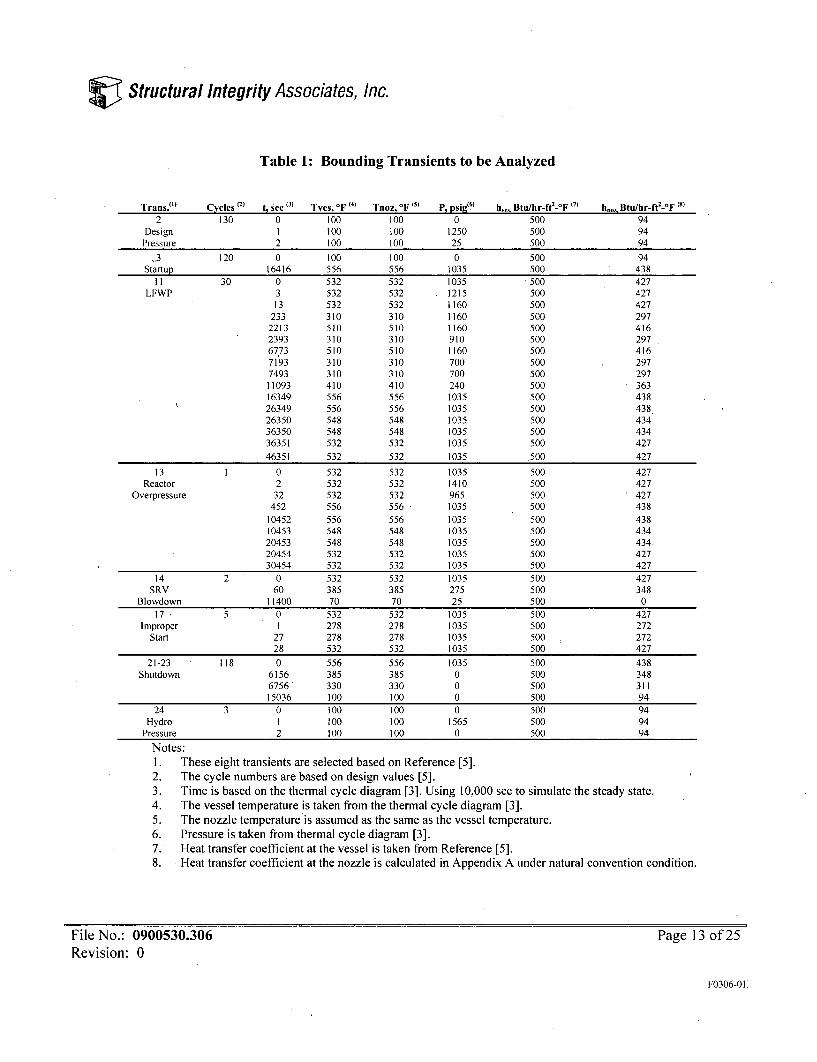
Table 1: Bounding Transients to be Analyzed
Trans.01) Cycles (1) t sec (3) Tves, IF (4) Tnoz, 'F ( P, psig(ý hv Btu/hr-ft'ZýF ( h., Btu/hr-ft-°F (8)
2 130 0 100 100 0 500 94Design I 100 100 1250 500 94
Pressure 2 100 100 25 500 94
,3 120 0 100 100 0 500 94Startup 16416 556 556 1035 500 438
11 30 0 532 532 1035 500 427,LFWP 3 532 532 1215 500 427
13 532 532 1160 500 427233 310 310 1160 500 297
2213 510 510 1160 500 4162393 310 310 910 500 29767,73 510 510 1160 500 4167193 310 310 700 500 2977493 310 310 700 500 29711093 410 410 240 500 36316349 556 556 1035 500 43826349 556 556 1035 500 43826350 548 548 1035 500 43436350 548 548 1035 500 43436351 532 532 1035 500 427
46351 532 532 1035 .500 427
13 1 0 532 532 1035 500 427Reactor 2 532 532 1410 500 427
Overpressure 32 532 532 965 500 427452 556 556 1035 500 438
10452 556 556 1035 500 43810453 548 548 1035 500 43420453 548 548 1035 500 434.20454 532 532 1035 500 42730454 532 532 1035 500 427
14 2 0 532 532 1035 500 427SRV 60 385 385 275 500 348
Blowdown 11400 70 70 25 500 0
17 5 0 532 532 1035 500 427Improper 1 278 278 1035 500 272Start 27 278 278 1035 500 272
28 532 532 1035 500 427
21-23 118 0 556 556 1035 500 438Shutdown 6156 385 385 0 500 348
6756 330 330 0 500 31115036 100 100 0 500 94
24 3 0 100 100 0 500 94Hydro 1 100 100 1565 500 94Pressure 2 100 100 0 500 94
Notes:1.2.3.4.5.6.7.8.
These eight transients are selected based on Reference [5].The cycle numbers are based on design values [5].Time is based on the thermal cycle diagram [3]. Using 10,000 sec to simulate the steady state.The vessel temperature is taken from the thermal cycle diagram [3].The nozzle temperature is assumed as the same as the vessel temperature.Pressure is taken from thermal cycle diagram [3].Heat transfer coefficient at the vessel is taken from Reference [5].Heat transfer coefficient at the nozzle is calculated in Appendix A under natural convention condition.
File No.: 0900530.306Revision: 0
Page 13 of 25
F0306-01:
Structural Integrity Associates, Inc.
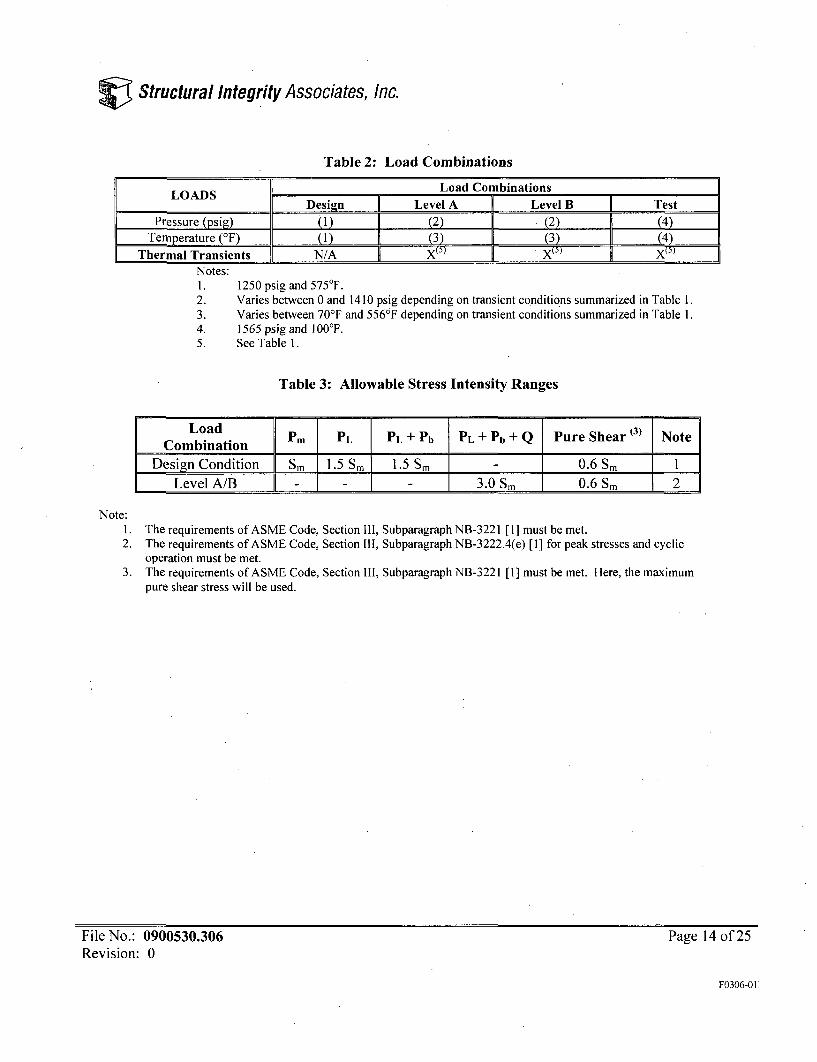
Table 2: Load Combinations
LOADS Load CombinationsDesign Level A Level B Test
Pressure (psig) (1) (2) (2) (4)Temperature (OF) (1) (3) I (3) ]] (4)
Thermal Transients N/A X X(5)X
Notes:1.2.3.4.5.
1250 psig and 575TF.Varies between 0 and 1410 psig depending on transient conditions summarized in Table 1.Varies between 70'F and 556'F depending on transient conditions summarized in Table 1.1565 psig and I 00°F.See Table 1.
Table 3: Allowable Stress Intensity Ranges
LoadLCombination Pm PL PL + Pb PL + Pb + Q Pure Shear (3) Note
Design Condition Sm 1.5 Sm I 1.5 Sm - 0.6 Sm ILevel A/B - - 3.O Sm 0.6 Sm 2
Note:1. The requirements of ASME Code, Section Ill, Subparagraph NB-3221 [1] must be met.2. The requirements of ASME Code, Section Il, Subparagraph NB-3222.4(e) [1] for peak stresses and cyclic
operation must be met.3. The requirements of ASME Code, Section 111, Subparagraph NB-3221 [1] must be met. Here, the maximum
pure shear stress will be used.
File No.: 0900530.306Revision: 0
Page 14 of 25
F0306-01
Structural Integrity Associates, Inc.
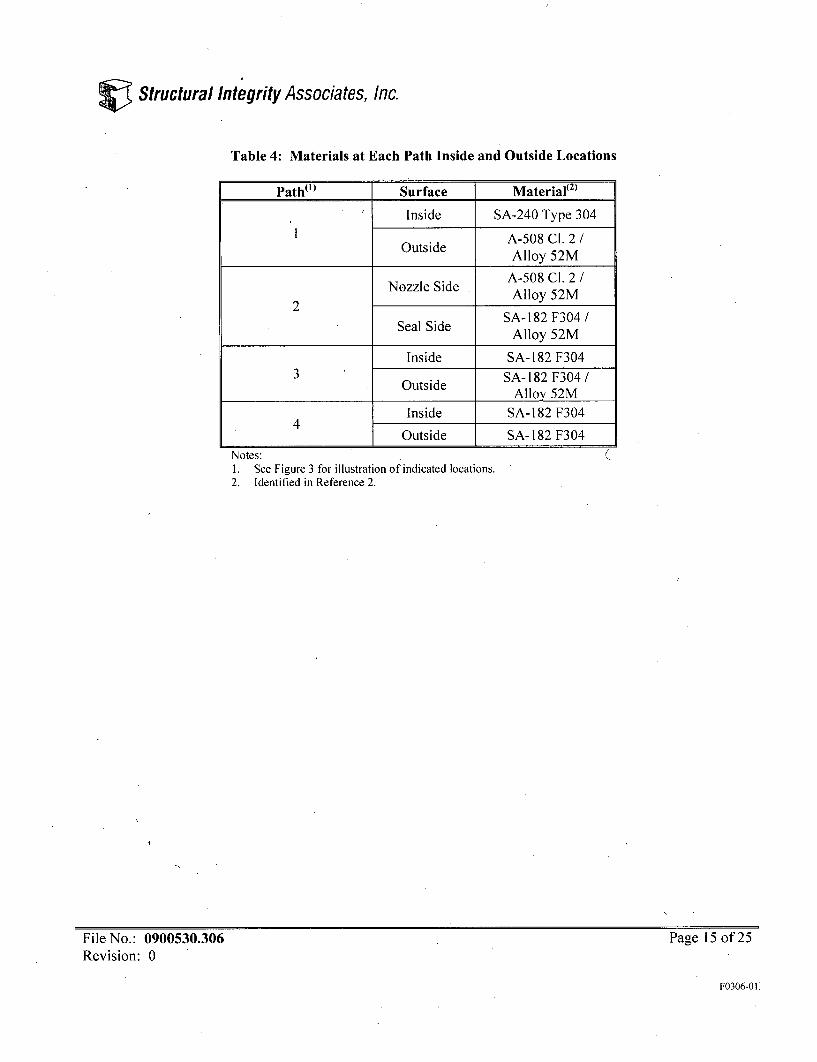
Table 4: Materials at Each Path Inside and Outside Locations
Path"'I J Surface Material(2)
Inside SA-240 Type 304
1 OtA-508 C1.2 /Alloy 52M
A-508 C1. 2 /Nozzle Side A ll 2
2 Alloy 52M2
SA-182 F304 /Seal Side Alloy 52M
Inside SA-182 F3043 s SA- 182 F304/
Alloy 52MInside SA-182 F304
4Outside SA- 182 F304
Notes:1. See Figure 3 for illustration of indicated locations.2. Identified in Reference 2.
(
File No.: 0900530.306Revision: 0
Page 15 of 25
F0306-01O
Structural Integrity Associates, Inc.
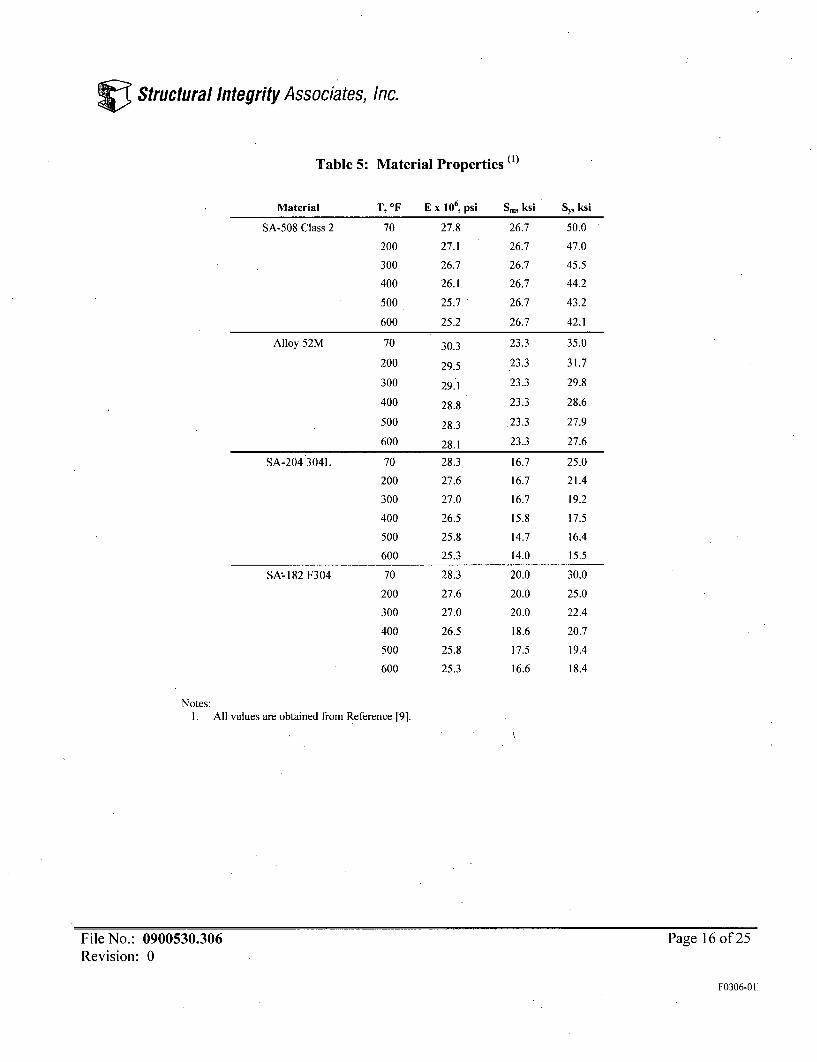
Table 5: Material Properties(I)
Material T, -F E x 106, psi Sm,
SA-508 Class 2 70 27.8 26.
ksi
7
Alloy 52M
200
300
400
500
600
70
200
300
400
500
600
70
200
300
400
500
600
70
200
300
400
500
600
27.1
26.7
26.1
25.7
25.2
SA-204 304L
30.3
29.5
29.1
28.8
28.3
28.1
28.3
27.6
27.0
26.5
25.8
25.3
28.3
27.6
27.0
26.5
25.8
25.3
26.7
26.7
26.7
26.7
26.7
23.3
23.3
23.3
23.3
23.3
23.3
16.7
16.7
16.7
15.8
14.7
14.0
20.0
20.0
20.0
18.6
17.5
16.6
SY, ksi
50.0
47.0
45.5
44.2
43.2
42.1
35.0
31.7
29.8
28.6
27.9
27.6
25.0
21.4
19.2
17.5
16.4
15.5
30.0
25.0
22.4
20.7
19.4
18.4
SA!-182 F304
Notes:1. All values are obtained from Reference [9].
File No.: 0900530.306Revision: 0
Page 16 of 25
F0306-01I

Structural Integrity Associates, Inc.
Table 6: Design Load Combination, Stress Intensity Evaluation
Path ( S Allowable P.L + Pb AllowableNumber(S) Surface I ( Sm (ksi) (ksi) 1.5 Sm (ksi)
Inside (1) 14.0 5.350 21.0 YesOutside (2) 4.203 26.7 40.1 YesOutside (3) 23.3 35.0 Yes
Noz. side (1) 14.0 21.0 YesNoz. side (3) 23.3 35.0 Yes'2 Sasie() 2.159 2. _____
Seal side (4) 16.6 24.9 YesSeal side (3) 23.3 35.0 Yes
Inside (4) 16.6 3.404 24.9 Yes3 Outside (4) 1.579 16.6 24.9 Yes
Outside (3) 23.3 0.355 35.0 Yes
4Inside (4) 16.6 2.908 24.9 YesOutsidet 4 ) 16.6 1.151 24.9 Yes
Notes:1.2.3.4.5.
Material at location is SA-204 304L equivalent [2].Material at location is A-508 CL. 2 [2].Material at location is Alloy 52M [2].Material at location is SA-182 F304 [2].See Figure 3 for illustration of indicated locations.
File No.: 0900530.306Revision: 0
Page 17 of 25
F0306-01O

Structural Integrity Associates, Inc.
Table 7: Service Level A/B Load Combination, P+Q Stress Intensity Evaluation
Path Maximum Stress AllowableNumber(7) Surface Intensity Range AcceptNubr(S,,) (ksi) (5) 3Sin (ksi)(6)
Inside (1) 35.314 42.924 YesI Outside (2) 34.612 80.100 Yes
Outside (3) 34.612 69.900 YesNoz. side (1) 11.141 80.100 YesNoz. side (3) 11.141 69.900 Yes
2 Seal side (4) 11.937 51.285 Yes
Seal side (3) 12.138 69.900 YesInside (4) 24.849 51.015 Yes
3 Outside (4) 30.901 51.258 YesOutside (3) 31.087 69.900 YesInside (4) 23.264 51.015 Yes
4 Outside(4) 28.055 52.041 YesNotes:I.2.3.4.
Material at location is SA-204 304L equivalent [2].Material at location is A-508 CL. 2 [2].Material at location is Alloy 52M [2].Material at location is SA-182 F304 [2].
5. Sn values shown are based on the maximum S,/3Sm ratio from VESLFAT output files ending in *.FAT (seeAppendix C for example).
6. All material stress allowable values shown [1, 9] are based on the maximum SnI3Sm ratio from VESLFAToutput files ending in *.FAT (see Appendix C for example).
7. See Figure 3 for illustration of indicated locations.
File No.: 0900530.306Revision: 0
Page 18 of 25
F0306-01.

V Structural Integrity Associates, Inc.
Table 8: Load Sets as Input to VESLFAT
Path 1 Inside Path 2 Nozzle Side Path 3 Inside Path 4 Inside
Trans Name cycles Trans Name cycles Trans Name cycles Trans Name cycles
1 2_DHydT1 130
2 2_DHydT2 130
3 2_DHydT3 130
4 3_Staupl 120
5 3_Staup2 120
6 11_LFWP1 30
7 11_LFWP2 30
8 11_LFWP3 30
9 11_LFWP4 30
10 11_LFWP5 30
11 11_LFWP6 30
12 11_LFWP7 30
13 11_LFWP8 30
14 13_ROP1 1
15 13_ROP2 1
16 13_ROP3 1
17 14_SRVB1 2
18 14_SRVB2 2
19 14_SRVB3 2
20 14_SRVB4 2
21 17_lmpST1 5
22 17_lmpST2 5
23 17_lmpST3 5
24 21_ShDwl 118
25 21_ShDw2 118
26 21_ShDw3 118
27 21_ShDw4 118
28 24_Hydrol 3
29 24_Hydro2 3
30 24 Hydro3 3
1 2_DHydT1
2 2_DHydT2
3 2_DHydT3
4 3_Staupl
5 3_Staup2
6 11_LFWP1
7 11_LFWP2
8 11_LFWP3
9 11_LFWP4
10 11_LFWP5
11 11_LFWP6
12 11_LFWP7
13 11_LFWP8
14 11_LFWP9
15 13_ROP1
16 13_ROP2
17 13_ROP3
18 13_ROP4
19 13_ROPS
20 13_ROP6
21 13_ROP7
22 14_SRVB1
23 14_SRVB2
24 14_SRVB3
25 14_SRVB4
26 17_lmpST1
27 17_lmpST2
28 17_lmpST3
29 17_lmpST4
30 21_ShDwl
31 21_ShDw2
32 21_ShDw3
33 24_Hydrol
34 24_Hydro2
35 24_Hydro3
130
130
130
120
120
30
30
30
30
30
30
30
30
30
1
1
1
1
1
1
1
2
2
2
2
5
5
5
5
118
118
118
3
3
3
2_DHydTl
2_DHydT2
2_DHydT3
3_Staupl
3_Staup2
3_Staup3
11_LFWP1
11_LFWP2
11_LFWP3
11_LFWP4
11_LFWP5
11_LFWP6
11_LFWP7
11_LFWP8
11_LFWP9
11_LFWP1O
13_ROPI
13_ROP2
13_ROP3
13_ROP4
13_ROP5
13_ROP6
14_SRVB1
14_SRVB2
14_SRVB3
17_lmpST1
17_lmpST2
17_lmpST3
17_lmpST4
21_ShDwl
21_ShDw2
21_ShDw3
21_ShDw4
21_ShDw5
24_Hydrol
24_Hydro2
24_Hydro3
130
130
130
120
120
120
30
30
30
30
30
30
30
30
30
30
1
1
1
1
1
1
2
2
2
5
5
5
5
118
118
118
118
118
3
3
3
2_DHydT1
2_DHydT2
2_DHydT3
3_Staupl
3_Staup2
3_Staup3
11_LFWP1
11_LFWP2
11_LFWP3
11_LFWP4
11_LFWP5
11_LFWP6
11_LFWP7
11_LFWP8
11_LFWP9
11_LFWP1O
13_ROP1
13_ROP2
13_ROP3
13_ROP4
13_ROP5
14_SRVB1
14_SRVB2
14_SRVB3
17_lmpST1
17_lmpST2
17_lmpST3
17_lmpST4
21_ShDwl
21_ShDw2
21_ShDw3
21_ShDw4
21_ShDw5
21_ShDw6
24_Hydrol
24_Hydro2
24_Hydro3
130
130
130
120
120
120
30
30
30
30
30
30
30
30
30
30
1
1
1
1
1
2
2
2
5
5
5
S
118
118
118
118
118
118
3
3
3
File No.: 0900530.306Revision: 0
Page 19 of 25
F0306-01I
V Structural Integrity Associates, Inc.
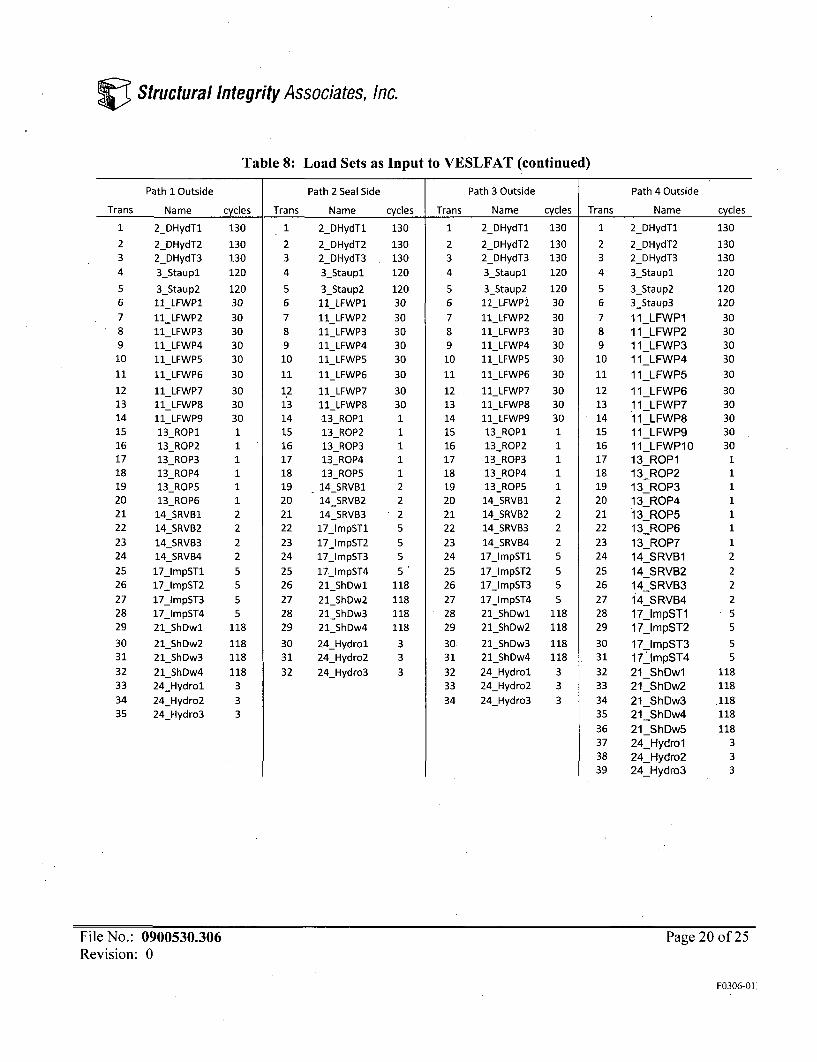
Table 8: Load Sets as Input to VESLFAT (continued)
Path 1 Outside Path 2 Seal Side Path 3 Outside Path 4 Outside
Trans Name cycles Trans Name cycles Trans Name cycles Trans Name cycles
1
234
567891011
12131415161718192021222324
2526
272829
303132333435
2_DHydT1
2_DHydT22_DHydT33_Staupl
3_Staup211 LFWP1
11_LFWP211_LFWP311_LFWP411_LFWP5
11_LFWP6
11 LFWP711_LFWP811 LFWP913_ROP113_ROP213_ROP313_ROP413_ROP513_ROP6
14_SRVB114_SRVB214_SRVB314_SRVB4
17_lmpST117_lmpST2
17_lmpST317_lmpST421_ShDwl
21_ShDw221_ShDw321_ShDw424_Hydrol24_Hydro224_Hydro3
130
130130120
120303030303030
3030301111112222
5555
118
118118
118333
1
234567891011
121314151617181920212223242526272829
3031
32
2_DHydT1
2_DHydT22_DHydT33_Staupl
3_Staup211_LFWP111_LFWP211_LFWP311_LFWP411_LFWP5
11_LFWP6
11_LFWP711_LFWP813_ROP113_ROP213_ROP313_ROP413_ROPS14_SRVB114_SRVB214_SRVB3
17_lmpST117_lmpST217_lmpST3
17_lmpST421_ShDwl21_ShDw221_ShDw321_ShDw4
24_Hydrol24_Hydro2
24_Hydro3
130
130130120
12030
30303030
30
3030111112225555
118118118118
333
2_DHydT1 130
2_DHydT2 1302_DHydT3 1303_Staupl 120
3_Staup2 12011_LFWP2 30
11_LFWP2 3011_LFWP3 3011_LFWP4 3011_LFWP5 30
11_LFWP6 30
11_LFWP7 3011_LFWP8 3011_LFWP9 3013_ROP1 113 ROP2 113_ROP3 113_ROP4 113_ROP5 1
14_SRVB1 214_SRVB2 214_SRVB3 214_SRVB4 217_lmpST1 517_lmpST2 517_lmpST3 517_lmpST4 521_ShDwi 11821_ShDw2 118
21_ShDw3 11821_ShDw4 118
24_Hydrol 324_Hydro2 324_Hydro3 3
1 2_DHydT1
2 2_DHydT23 2_DHydT34 3_Staupl
5 3_Staup26 3 Staup3
7 11 LFWP18 11 LFWP29 11 LFWP3
10 11_LFWP4
11 11 LFWP5
12 11 LFWP613 11 LFWP714 11 LFWP815 11_LFWP916 11 LFWP1017 13 ROP118 13_ROP219 13 ROP320 13_ROP421 13_ROP522 13_ROP623 13_ROP724 14_SRVB125 14 SRVB226 14_SRVB327 14 SRVB428 17_lmpST129 17_lmpST230 17_lmpST331 17_lmpST432 21 ShDwl33 21_ShDw234 21 ShDw335 21_ShDw436 21 ShDw537 24_Hydrol38 24_Hydro239 24_Hydro3
130
130130120
12012030303030303030303030
111111122225555
118118
,118
118
118
333
File No.: 0900530.306Revision: 0
Page 20 of 25
F0306-01.
Structural Integrity Associates, Inc.
Table 9: Carbon/Low Alloy Steel and Stainless Steel Fatigue Curves
Number ofCycles
S., ksi
Carbon/Low Alloy ~
Sa, ksi
Austenitic
10
20
50
100
200
500
1000
2000
5000
10000
20000
50000
100000
200000
500000
1000000
2.E+06
5.E+06
L.E+07
2.E+07
5.E+07
I.E+08
1.E+09
1.E+10
I.E+lI1
580
410
275
205
155
105
83
,64
48
38
31
23
20
16.5
13.5
12.5
N/A
N/A
N/A
N/A
N/A
N/A
N/A
N/A
N/A
708
512
345
261
201
148
119
97
76
64
55.5
46.3
40.8
35.9
31
28.2
22.8(2)
18.4(2)
16.4(2)
15.2(2)
14.3(2)
14.1(2)
13.9(2)
13.7(2)
13.6(2)
Note:
1. Using UTS < 80 ksi curve.2. Using Curve C for austenitic steel.
File No.: 0900530.306Revision: 0
Page 21 of 25
F0306-01
Structural Integrity Associates, Inc.
Table 10: Fatigue Usage Results
Path Maximum Alternating Stress Load Pair Total
Surface Load Pair ( K" Alternating FatigueN o .__ _ _ _ _ L o a d_ P a i rS . ( p s i)_K_ S t r e s s ( p s i) U s a g e (2 )
Inside 25 & 29 35314 1 18983 0.0000560Outside 16 & 24 36503 1 29574 0.0211011
Noz. side 27 & 28 8606 1 13890 0.0000114Seal side 5 & 21 9154 1 19005 0.0000913
Inside 27 & 31 27835 1 29106 0.0000541_Outside 5 & 23 19927 1 19005 0.0000964
Inside 26 & 30 23250 1 28148 0.00004291 Outside 9 & 29 28043 1 28635 0.0002890
Notes:1. See Figure 3 for illustration of indicated locations.2. Cumulative fatigue usage from all contributing load pairs.3. See Table 7 for transient.
File No.: 0900530.306Revision: 0
Page 22 of 25
F0306-01I
Structuiral Integrity Associates, Inc.
AREAS
MAT NUM
PILGRIM N9A Nozzle
Figure 1: Boundary Conditions
PEA n1--
rahr HUML~
[PILIM NgA N::oi.:
Figure 2: Thermal Region Definitions
File No.: 0900530.306Revision: 0
Page 23 of 25
F0306-01:

V Structural Integrity Associates, Inc.
Figure 3: Stress Path Definitions for ASME Code Evaluation
AREAS
MAT NUM
P000 N
PILGRIM N9A Nozzle
Figure 4: Unit Internal Pressure
File No.: 0900530.306Revision: 0
Page 24 of 25
F0306-01I
V Structural Integrity Associates, Inc.
NODAL SOLUTION-
STEP=1SUB =1TIME=1SINT (AVG)DMX =.745E-03SMN =12.35SMX =23053
12.35 10253 15373 20493
2572
23053I 2.35 2572
PILGRIM N9A Nozzle
5133 10253 15373 20493 230537693 12813 17933
Figure 5: Stress Intensity under Unit Pressure
File No.: 0900530.306Revision: 0
Page 25 of 25
F0306-01:
Structural Integrity Associates, Inc.
Appendix A
CALCULATION OF THE HEAT TRANSFER COEFFICIENTS
File No.: 0900530.306Revision: 0
Page A- I of A-3
F0306-01 RO

Structural Integrity Associates, Inc.
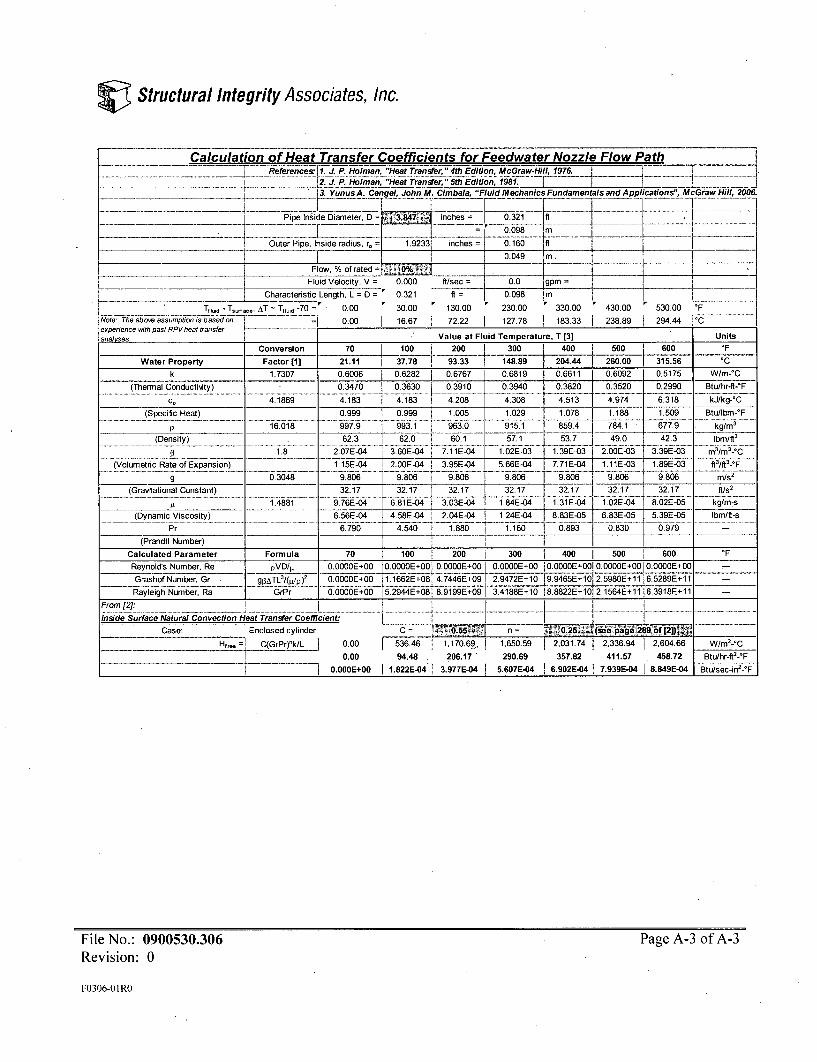
An expression for the natural convection heat transfer coefficient can be developed by combiningEquations 5-42 and 7-56 of Reference [10], as follows:
Nufree C. (Gr . Pr)n (l)
hfree = C. (Gr. Pr)" .k (2)x
At 0.75 < x/D < 2.0Where:
hfree = Natural-convection heat transfer coefficient, h = Nu * k / xC = Linear coefficient representing the pipe geometryGr = Grashof number for the flown = Polynomial coefficient representing the pipe geometryx = Characteristic length (the pipe diameter for tube flow and difference of radius for
annular flow), ftD = Pipe diameter, ft
As shown in the accompanying text for Equation 7-56 of Reference [10], values of C = 0.55 and n0.25 are reasonable for the pipe geometry under consideration. The Grashof number is adimensionless quantity representing the free convection state of a system, and it is calculated with thefollowing equation [ 10, Equation 7-21 ]:
Gr _ g'f.(6. - T.)x3 (3)
Where:g = Acceleration due to gravity, 32.173 ft/sec 2
P3 = Volumetric rate of expansion of the fluid, ft'3/ft3'-FT, = Temperature of the pipe wall (surface), 'FT.o = Temperature of the fluid, 'Fx = Characteristic length (the pipe diameter for tube flow and difference of radius for
annular flow), ft
File No.: 0900530.306 Page A-2 of A-3Revision: 0
F0306-01 RO
r Structural Integrity Associates, Inc.
Calculation of Heat Transfer Coefficients for Feedwater Nozzle Flow Path tI- --- j____References" 1. P. Holman, "Heat Transfer '4th Edition, McGraw-Hill 1 9 7 6
_______________________. i2JPHolmnan, "Heat Transfer, "'5th Edition, 1981. ___I
__-43. Vunus A. Cengel, John M. Cinrbala, "Fluid Mechanics Fundamentals and Applications", McGraw Hill-, 2006.. . . . .. . .. . . . . . . . .. . --. --. -- ...... - - . . . . ...... ..-- - ...... . ...Pipe Inside Diameter, D = 3847 inches 0.321 ft -
Outer Pipe, Inside radius, r. 1.9233! inches = 0160 tit
,t i o0.049 'm, T_Flow, % of rated 0T..... ___0_/__
I Fluid Velocity, V 0.000 ft/sec = 0.0 gpm =
- Characteristic Length, L = D 0.321 ft = 0.098 im
Tfti - Tuf., AT = Tfid -70-- 0.00 30.00 - 130.00 - 230.00 330.00 ' 430.00 * 530.00 *FThe above assumption is based on 000 16.67 72.22 127.78 183.33 238.89 C
experience wth past RP-V heat transferianalyses. T Value at Fluid Temperature, T [3] Units
Conversion 70 100 T 200 1 300 1 400 500 600 'FWater Property Factor [1] 21.11 37.78 93.33 148.89 1204.44 260.00 315.56 'C
k 1.7307 0.6006 0.6282 0.6767 0.6819 1 0.6611 06092 0.5175 W/m-*C
(Thermal Conductivity) - 0.3470 0.3630 o0.3910 03940 0.3820 0.3520 0.2990 Btu/hr-ft-*F
CP4.1869 4.183 4.183 4.208 4.308 4.513 4.974 6.318 kJ/kg-'C(Specific Heat) 0.999 0.999 1.005 1.029 1.078 1.188 1.509 Btu/-bm-*F
P 16.018 997.9 993.1 963.0 915.1 859.4 I 784.1 677.9 kg/in3
(Desit) 6.3 2 60.11 57.1 53.7 f 49.0 42.3 Ib/f 3(Dniy U. 23
1.8 2.07E-04 3.60E-04 i 7.11E-04 1.02E-03 1.39E-03 2.OOE-03 3.39E-03 m3/m/-*C
(Volumetric Rate of Expansion) 1. 1S-0 2.OOE-04T 3.95E-04 5.66E-04 7.71 E-04 I1.1IE-03 1.89E-03 ft5/ft'-*F....... .... .......... ..... _v , e ,c r o ..E p ! n .. ...... ........... ...... ............ ...... ... ....... L . E.. 0 ........I.. ... ....... 2 .O E• _. _..9..... -. ........ ... 5 6 E ...... I : .5 _ .. .2 y_ .j : :.. ................. ... .. .. ....... ..- g . 03048 9.806 9.806 9806 9806 98806 9806 9806 m/s
2
(Gravitational Constant) 32.17 32.17 T 32.17 32.17 32.17 I 32.17 32.17 ft/st
1t.4881 .... E... ....04, 303-0iz- 4--04 1.84E-04 I .3E-0G-4_1 1 -02--E---0-4-- -8-0E-0 kgrs(Dynamic Viscosity) .. 6.56E-04 4.58E.04 2.04E-04 1 .24E- . 883E-05 6.83E-05.5.39E-05 Ibm/ft-s
Pr 6.790 4.540 1.880 1.160 ) 0.893 0.830 0.979 -
(Prandtl Number) _ ICalculated Parameter Formula 70 100 200 300 400 500 [ 600 °FReynold's Number, Re pVD/p 0.OOOOE+00 0.0000E+00 0.OOOOE+00 I 0.OOOOE+00 I.OOOOE+00I 0.OOOOE+00 0.OOOOE+00 -
Grashof Number, Gr gPAfl3 /TLl(p)2 0.000E+00 1.1662E+08 4 7446E+09 2.9472E+10 9.9465E+ +11 6.5289E+11 -
Rayleigh Number, Ra GrPr 0.OOOOE+00 5.2944E+08; 8.9199E+09 3.4188E+10 EE11 7E.3918E11 -
From [2•) ... I ....... .. . . ............................Inside urfacevtion Heat Transfer Coefficient: .,_ --
Case: Enclosed cylinder C = ....... n I., 02) .- . .
H,_ C(GrPr)rk/L 0.00 536.46 1, 170.69', 1,650.59 2,031.74 2,336.94 2,604.66 W/m2-*C
0.00 94.48 206.17 290.69 357.82 411.57 458.72 Btu/hr-ft2-*F0.O00E+00 1.822E-04 3.977E-04 5.607E-04 6.902E-04 7.939E-04 8.849E-04 Btu/sec-in
2-°F
File No.: 0900530.306Revision: 0
Page A-3 of A-3
F0306-01 RO

Structural Integrity Associates, Inc.
Appendix B
SUPPORTING FILES
File No.: 0900530.306Revision: 0
Page B- 1 of B-2
F0306-01 RO

V Structural Integrity Associates, Inc.
File Name Description
N9 Loads.xls Excel Spreadsheet to Create HTCs.PNPS-N9.INP N9A Nozzle ANSYS Geometry Input File from Reference [2].
MPropLinear. PNPS.INP N9A Nozzle ANSYS Material Input File from Reference [2].PNPS-N9-PRESS.INP N9A Nozzle ANSYS Pressure Load Input File.
PNPS-N9-PRESS S3 P*.OUT ANSYS Pressure Linearized Stress Output Files.PNPS-N9-#-THM.INP N9A Nozzle ANSYS Thermal Load Input File.
PNPS-N9-#-THM mntr.inp N9A Nozzle ANSYS Thermal Load mntr File Created from ANSYS Thermal Run.PNPS-N9-#-STR.inp N9A Nozzle ANSYS Thermal Load Stress Input File.
PNPS-N9-#-STR S3 P*.OUT ANSYS Thermal Analysis Linearized Stress Output Files.StressResults.xis Excel Spreadsheet to Summary Linearized Stress. Each Path Has One File at corresponded
Directory.VFAT-*&.xls Excel Spreadsheet to Create .str File.
VFAT-*o III.xls Excel Spreadsheet to Create .str File for Maximum Intensity Range only.p*-& @.CYC Cycle Input File for VESLFAT Program.
p*-o Ill @.CYC Cycle Input File for Maximum Intensity Range only at Outside Surface Locations for-__ -_VESLFAT Program.
p*-& @.FDT Material Input File for VESLFAT Program.
p*-oiIII .FDT Material Input File for Maximum Intensity Range only at Outside Surface Locations forVESLFAT Program.
p*-& @aý.str Stress Input File for VESLFAT Program Created by the spreadsheets.p**[email protected] Stress Input File for Maximum Intensity Range only at Outside Surface Locations for
VESLFAT Program Created by the spreadsheets.
p*-&[email protected], p*-&[email protected],p*-&_ .PR, p*-& @ RD.ST Intermediate Result File Created by VESLFAT Program where * = Paths I through 9.
p**- o_IlI @.ALL p** o III [email protected], Intermediate Result File for Maximum Intensity Range only at Outside Surface Locations**- o [email protected], p**- o III @.ST Created by VESLFAT Program.
p*-& @.fat Fatigue Result File Created by VESLFAT Program
p**- [email protected] Fatigue Result File for Maximum Intensity Range only at Outside Surface LocationsCreated by VESLFAT Program.
Pressure Summary.xls Summary of Pressure Results for Design Load and Pure Shear Evaluation
Where:• = Paths I through 4,•* = Paths 1 and 4,#= Thermal transients 2, 3, 11, 13, 14, 17, 21, 24 (transient 24 has the same time history as transient 2),& = i or o for inside surface (Nozzle side for path 2) or outside surface (seal side for Path 2), respectively,
= 508, M52, F304, or 304L for material at locations, see Table 4 for corresponded materials.
File No.: 0900530.306Revision: 0
Page B-2 of B-2
F0306-OI RO
Structural Integrity Associates, Inc.
Appendix C
EXAMPLE VESLFAT FILES
VESLFAT INPUT FILE pl-i_304L.CYC
File No.: 0900530.306Revision: 0
Page C-I of C-40
F0306-01 RO
Structural Integrity Associates, Inc.
Trans Name cycles
1 2_DHydT1 1302 2_DHydT2 1303 2_DHydT3 1304 3_Staupl 1205 3_Staup2 120
6 11 LFWP1 307 11 LFWP2 308 11LFWP3 309 11 LFWP4 3010 I1 LFWP5 3011 I--LFWP6 3012 II-LFWP7 3013 1I-LFWP8 3014 13 ROPI 115 13ROP2 116 13_ROP3 117 14 SRVB1 218 14_SRVB2 219 14-SRVB3 220 14 SRVB4 221 17_ImpSTl 522 17.ImpST2 523 17_ImpST3 524 21lShDwl 11825 21-ShDw2 11826 21-ShDw3 11827 21 ShDw4 11828 24_Hydrol 329 24_Hydro2 330 24_Hydro3 3
File No.: 0900530.306 Page C-2 of C-40Revision: 0
F0306-01 RO
Structural Integrity Associates, Inc.
VESLFAT INPUT FILE pl-i_304L.FDT
Fatigue Analysis Properties - Note: All text must remain in the file - ksi1.7 .3 m and n for elastic plastic analysis28300 E fatigue Curve,ksi1 Multiplying factor to convert *.STR file data to psi0.010 Max Membrane Stress (ksi) per psi applied pressure40 NB-3222.5 (b) limit on Sy if large number of cycles25 Number of Points on Fatigue Curve6 Number of points on Material Property Curve
Fatigue Curve with Cycles (ascending) and Salt, ksi10 70820 51250 345100 261200 201500 148
1000 1192000 975000 76
10000 6420000 55.550000 46.3
100000 40.8200000 35.9500000 31
1000000 28.22000000 22.85000000 18.4
10000000 16.420000000 15.250000000 14.3
100000000 14.11000000000 1J.9
10000000000 13.7100000000000 13.6Material Property Curve (SA-240 TP 304L equivalent ASME 2001)
Temp E,ksi Sm, ksi Sy, ksi70 28300 16.7 25.0
200 27600 16.7 21.4300 27000 16.7 19.2400 26500 15.8 17.5500 25800 14.7 16.4600 25300 14.0 15.5
File No.: 0900530.306 Page C-3 of C-40Revision: 0
F0306-01 RO
C Structural Integrity Associates, Inc.
VESLFAT INPUT FILE pl-i_304L.STR
Name
2_DHydT10
2_DHydT10
2DHydTIO
2DHydT10
2_DHydTI0
2DHydT10
2DHydTI0
2DHydTII
2DHydTI1
2DHydT21
2DHydT21
2DHydT21
2DHydT21
2_DHydT21
2DHydT21
2_DHydT21
2DHydT22
2DHydT22
2_DHydT32
3_StauplO
3_Staupl328
3_Staup2657
3_Staup2985
3_Staup21313
3_Staup21970
3_Staup22627
Sxx Syy Szz Sxy Sxz Syz Sxx Syy Szz Sxy Sxz Syz Tmax Pmax
-2
-2
-2
-2
-2
-2
-2
-2
-2
-1248
-1248
-1248
-1248
-1248
-1248
-1248
-1248
-1248
-27
-2
-23
-44
-66
-87
-129
-172
-1596 -1383 119 0 0
-1596 -1383 119 0 0
-1596 -1383 119 0 0
-1596 -1383 119 0 0
-1596 -1383 119 0 0
-1596 -1383 119 0 0
-1596 -1383 119 0 0
-1596 -1383 119 0 0
-1596 -1383 119 0 0
-623 2718 193 0 0
-623 2718 193 0 0
-623 2718 193 0 0
-623 2718 193 0 0
-623 2718 193 0 0
-623 2718 193 0 0
-623 2718 193 0 0
-623 2718 19.3 0 0
-623 2718 193 0 0
-1577 -1301 120 0 0
-1596 -1383 119 0 0
-2092 -1731 133 0. 0
-2631 -2126 157 0 0
-3183 -2533 186 0 0
-3745 -2950 217 0 0
-4902 -3801 281 0 0
-5925 -4554 351 0 0
-2
-2
-2
-2
-2
-2
-2
-2
-2
-1248
-1248
-1248
-1248
-1248
-1248
-1248
-1248
-1248
-27
-2
-23
-44
-66
-87
-129
-172
-1632 -1440
-1632 -1440
-1632 -1440
-1632 -1440
-1632 -1440
-1632 -1440
-1632 -1440
-1632 -1440
-1632 -1440
-456 2829
-456 2829
-456 2829
-456 2829
-456 2829
-456 2829
-456 2829
-456 2829
-456 2829
-1608 -1355
-1632 -144b
-2178 -1857
-2734 -2287
-3290 -2715
-3850 -3145
-4987 -4012
-6009 -4787
-51
-51
-51
-51
-51
-51
-51
-51
-51
54
54
54
54
54
54
54
54
54
-49
-51
-65
-81
-96
-112
-143
-171
0 0 100
0 0
0 0
0 0
0 0
0 0
0 0
0 0
0 ~0'0 0
0 0
0 0
0 0
0 0
0 0
0 0
0 0
0 0
0 0
0 0
0 0
0 0
0 0
0 0
0 0
0 0
100
100
100
100
1-00
100
100
100
100
100
100
100
100
100
100
100
100
100
100
107
115.
124
133
151
170
0
0
0
0
0
0
0
0
0
1250
1250
1250
1250
1250
1250
1250
1250
1250
25
0
21
41
62
83
124
166
File No.: 0900530.306Revision: 0
Page C-4 of C-40
F0306-O1 RO

CStructural Integrity Associates, Inc.
3_Staup23283 -214 -6937 -5297 423 0
3_Staup23940 -257 -8026 -6094 491 0
3_Staup24597 -299 -9325 -7031 550 0
3 Staup25253 -342 -10682 -8007 605 0
3 Staup25910 -384 -11960 -8897 660 0
3 Staup26895 -448 -13782 -10134 740 0
3_Staup27880 -511 -15523 -11320 826 0
3_Staup28865 -575 -17155 -12456 922 0
3_Staup29850 -639 -19377 -14012 991 0
3Staup211491 -745 -23076 -16543 1100 0
3Staup213133 -851 -26015 -18513 1236 0
3_Staup214774 -957 -29575 -20774 1316 0
3Staup216416 -1063 -33424 -23654 1443 0
3Staup216452 -1063 -33374 -23624 1448 0
3Staup216488 -1063 -33334 -23594 1452 0
3Staup216596 -1063 -33284 -23554 1458 0
3Staup216784 -1063 -33264 -23534 1464 0
3Staup217289 -1063 -33264 -23514 1470 0
3Staup217973 -1063 -33274 -23514 1472 0
3Staup218693 -1063 -33274 -23514 1473 0
3Staup219413 -1063 -33274 -23514 1473 0
3Staup220016 -1063 -33274 -23514 1473 0
3Staup220026 -1063 -33274 -23514 1473 0
11 LFWP10 -1061 -31414 -21984 1405 0
11_LFWP10 -1065 -31412 -21972 1405 0
11_LFWP10 -1069 -31409 -21961 1405 0
11_LFWP10 -1076 -31403 -21935 1406 0
11_LFWP11 -1093 -31389 -21879 1407 0
11 LFWP11 -1129 -31361 -21761 1409 0
-214 -7020 -5552 -199
-257 -8097 -6369 -228
-299 -9347 -7308 -261
-342 -10649 -8281 -294
-384 -11850 -9158 -324
-448 -13581 -10386 -366
-511 -15253 -11573 -408
-575 -16844 -12731 -449
-639 -18926 -14259 -500
-745 *-22369 -16736 -582
-851 -25161 -18692 -650
-957 -28424 -20859 -723
-1063 -32047 -23705 -815
-1063 -31977 -23645 -813
-1063 -31927 -23595 -812
-1063 -31857 -23535 -810
-1063 -31837 -23505 -809
-1063 -31837 -23485 -808
-1063 -31837 -23485 -808
-1063 -31837 -23485 -808
-1063 -31837 -23485 -808
-1063 -31837 -23485 -808
-1063 -31837 -23485 -808
-1061 -30067 -21965 -760
-1065 -30063 -21953 -760
-1069 -30060 -21941 -759
-1076 -30052 -21914 -759
-1093 -30036 -21856 -757
-1129 -30003 -21733 -754
0
0
0
0
0
0
0
0
0
0
0
0
0
0
0
0
0
0
0
0
0
0
0
0
0
0
-0
0
0
0
0
0
0
0
0
0
0
0
0
0
0
0
0
0
0
0
0
0
0
0
0
0
0
0
0
0
0
0*
188
207
225
244
262
290
317
345
372
4i8
463
509
555
555
555
556
556
556
556
556
556
556
556
532
532
532
532
532
532
207
248
290
331
373
435
497
559
621
724
828
931
1035
1035
1035
1035
1035
1035
1035
1035
1035
1035
1035
1035
1039
1042
1050
1067
1103
File No.: 0900530.306Revision: 0
Page C-5 of C-40
F0306-01 RO
C Structural Integrity Associates, Inc.
11 LFWP12
11 LFWP12
11_LFWP13
11_LFWP13
11 LFWP13
11 LFWP13
11 LFWP14
11 LFWP15
11 LFWP17
11 LFWP19
11_LFWP111
11 LFWP113
11 LFWP117
11_LFWP122
11_ LFWP126
11 LFWP131
11 LFWP139
11 LFWP149
11 LFWP260
11 LFWP275
11 LFWP294
11_LFWP2117
11_LFWP2145
11 LFWP2198
11_LFWP2233
11_LFWP2273
11_LFWP2312
11_LFWP2406
11 LFWP2522
-1165 -31333 -21643 1411 0
-1201 -31305 -21525 1413 0
-1230 -31283 -21430 1415 0
-1241 -31264 -21394 1416 0
-1240 -31265 -21397 1416 0
-1239 -31266 -21401 1416 0
-1235 -31269 -21412 1416 0
-1230 -31273 -21430 1415 0
-1219 -31281 -21466 1415 0
-1208 -31290 -21502 1415 0
-1197 -31298 -21538 1414 0
-1186 -31307 -21574 1414 0
-1185 -31017 -21334 1420 0
-1185 -30607 -21004 1429 0
-1184 -30147 -20644 1440 0
-1183 -29657 -20264 1451 0
-1182 -28677 -19504 1472 0
-1180 -27657 -18724 1490 0
-1179 -26387 -17744 1506 0
-1177 -24847 -16534 1517 0
-1175 -23097 -15134 1518 0
-1173 -21117 -13684 1529 0
-1171 -18817 -12004 1539 0
-1167 -14797 -9024 1517 0
-1164 -11977 -6694 1464 0
-1166, -12417 -6974 1371 0
-1168 -13217 -7574 1302 0
-1171 -14737 -8684 1197 0
-1173 -16097 -9694 1117 0
0 -1165 -29969 -21610 -751 0
0 -1201 -29935 -21487 -748 0
0 -1230 -29908 -21388 -746 0
0 -1241 -29887 -21351 -745 0
0 -1240 -29888 -21355 -745 0
0 -1239 -29889 -21358 -745 0
0 -1235 -29892 -21370 -745 0
0 -1230 -29898 -21388 -746 0
0 -1219 -29908 -21426 -746 0
0 -1208 -29918 -21463 -747 0
0 -1197 -29929 -21501 -748 0
0 -1186 -29939 -21539 -749 0
0 -1185 -29449 -21069 -734 0
0 -1185 -28849 -20539 -717 0
0 -1184 -28239 -19989 -699 0
0 -1183 -27619 -19449 -682 0
0 -1182 -26409 -18399 -648 0
0 -1180 -25199 -17359 -614 0
0 -1179 -23749 -16119 -574 0
0 -1177 -22069 -14669 -527 0
0 -1175 -20209 -13059 -475 0
0 -1173 -18169 -11399 -423 0
0 -1171 -15839 -9539 -363 0
0 -1167 -11629 -6169 -249 0
0 -1164 -8890 -3774 -172 0
0 -1166 -10519 -5294 -222 0
0 -1168 -11929 -6589 -263 0
0 -1171 -13999 -8389 -320 0
0 -1173 -15629 -9779 -367 0
532
532
532
532
532
532
532
532
532
532
532
532
530
528
526
523
518
512
504
492
477
458
434
386
354
341
335
333
339
1139
1175
1204
1215
1214
1213
1210
1204
1193
1182
1171
1160
1160
1160
1160
1160
1160
1160
1160
1160
1160
1160
1160
1160
1160
1160
1160
1160
1160
File No.: 0900530.306Revision: 0
Page C-6 of C-40
F0306-OIRO
Structural Integrity Associates, Inc.
11_LFWP2709 -1175 -17737 -11044 1063 0
l1_LFWP2896 -1177 -19487 -12484 1041 0
llLFWP31029 -1178 -20737 -13484 1040 0
11_LFWP31108 -1178 -21487 -14084 1042 0
11_LFWP31188 -1179 -22217 -14664 1046 0
11 LFWP31267 -1180 -22777 -15094 1057 0
11_LFWP31346 -1180 -23277 -15514 1077 0
11_LFWP31465 -1181 -24027 -16124 1109 0
11_LFWP31584 -1182 -24767 -16734 1143 0
llLFWP31702 -1182 -25507 -17324 1178 0
11_LFWP31821 -1183 -26387 -17974 1201 0
11 LFWP32019 -1184 -27917 -19054 1229 0
11_LFWP32213 -1185 -29477 -20154 1254 0
11_LFWP32217 -1180 -29251 -19980 1259 0
11_LFWP32220 -1174 -28915 -19717 1268 0
11_LFWP32224 -1168 -28519 -19423 1279 0
11_LFWP32227 -1163 -28103 -19110 1290 0
11 LFWP32235 -1151 -27240 -18472 1316 0
11_LFWP42242 -1140 -26378 -17855 1339 0
11_LFWP42250 -1128 -25487 -17230 1362 0
11_LFWP42259 -1114 -24417 -16485 1385 0
11_LFWP42271 -1095 -23130 -15580 1407 0
11_LFWP42286 -1073 -21596 -14519 1426 0
11 LFWP42305 -1045 -19797 -13264 1442 0
11_LFWP42342 -991 -16546 -11050 1454 0
11_LFWP42383 -930 -13031 -8368 1399 0
11_LFWP42393 -915 -12132 -7674 1387 0
11_LFWP42481 -924 -12958 -8208 1242 0
-11 LFWP42568 -931 -14044 -8951 1144 0
0 -1175 -17419 -11369 -422
0 -1177 -19119 -12859 -470
0 -1178 -20299 -13869 -502
0 -1178 -20999 -14469 -521
0 -1179 -21659 -15019 -539
0 -1180 -22199 -15449 -553
0 -1180 -22689 -15869 -567
0 -1181 -23419 -16489 -588
0 -1182 -24139 -17109 -609
0 -1182 -24859 -17709 -629
0 -1183 -25659 -18339 -648
0 -1184 -27059 -19379 -682
0 -1185 -28499 -20449 -716
0 -1180 -28074 -20066 -704
0 -1174 -27548 -19593 -688
0 -1168 -26993 -19100 -672
0 -1163 -26428 -18617 -656
0 -1151 -25317 -17671 . 625
0 -1140 -24277 -16805 -597
0 -1128 -23217 -15952 -569
0 -1114 -21979 -14958 -536
0 -1095 -20525 -13805 -498
0 -1073 -18855 -12497 -455
0 -1045 -16939 -11005 -406
0 -991 -13587 -8479 -321
0 -930 -9861 -5416 -219
0 -915 -8971 -4681 -195
0 -924 -11519 -7035 -271
0 -931 -13205 -8498 -316
355
373
386
394
402
410
418
4ý3 0
442
454
466
486
506
505
503
502
500
495
491
485
478
468
455
439
405
365
356
334
327
1160
1160
1160
1160
1160
1160
1160
1160
1160
1160
1160
1160
1160
1155
1150
1145
1140
1130
1120
1109
1096
1079
1058
1032
981
924
910
915
920
File No.: 0900530.306 Page C-7 of C-40Revision: 0
F0306-O1 RO
C Structural Integrity Associates, Inc.
9 11_LFWP42675 -938 -14969 -9561 1066 0
9 llLFWP42808 -947 -15683 -10077 1013 0
9 11_LFWP43072 -963 -16611 -10837 976 0
9 11_LFWP43337 -979 -17380 -11468 982 0
9 11_LFWP43602 -995 -18408 -12268 994 0
9 11 LFWP43777 -1006 -19120 -12805 1004 0
9 11_LFWP43952 -1016 -19842 -13342 1016 0
9 11_LFWP44127 -1027 -20575 -13880 1029 0
9 l1_LFWP44302 -1037 -21317 -14417 1043 0
9 11 LFWP44565 -1053 -22275 -15097 1069 0
10 11_LFWP54828 -1069 -23023 -15648 1107 0
10 11 LFWP55091 -1084 -23762 -16199 1146 0
10 11_LFWP55354 -1100 -24510 -16740 1186 0
10 11_LFWP55792 -1126 -25871 -17698 1236 0
10 11_LFWP56230 -1152 -27391 -18686 1268 0
10 11_LFWP56668 -1178 -28952 -19694 1296 0
10 11 LFWP56773 -1185 -29387 -20034 1310 0
10 11_LFWP56781 -1175 -29074 -19804 1318 0
10 11_LFWP56790 -1165 -28661 -19514 1328 0
10 11_LFWP56798 -1155 -28229 -19205 1339 0
10 11_LFWP56807 -1145 -27786 -18885 1348 0
10 11_LFWP56823 -1126 -26950 -18285 1361 0
11 11 LFWP66840 -1107 -26184 -17766 1373 0
11 11_LFWP66857 -1087 -25439 -17276 1382 0
11 11_LFWP66877 -1065 -24625 -16736 1390 0
11 11_LFWP66900 -1039 -23695 -16120 1395 0
11 11_LFWP66927 -1008 -22638 -15437 1398 0
11 11_LFWP66959 -973 -21455 -14671 1398 0
11 11 LFWP67015 -909 -19583 -13443 1378 0
0 -938 -14409 -9467 -349
0 -947 -15242 -10172 -374
0 -963 -16258 -11060 -405
0 -979 -17023 -11728 -429
0 -995 -17999 -12537 -454
0 -1006 -18670 -13063 -471
0 -1016 -19340 -13588 -488
0 -1027 -20021 -14114 -505
0 -1037 -20712 -14640 -522
0 -1053 -21588 -15299 -544
0 -1069 -22313 -15858 -563
0 -1084 -23029 -16406 -582
0 -1100 -23755 -16955 -601
0 -1126 -25032 -17890 -632
0 -1152 -26418 -18835 -663
0 -1178 -27845 -19819 -695
0 -1185 -28249 -20149 -706
0 -1175 -27758 -19720 -692
0 -1165 -27206 -19251 -676
0 -1155 -26655 -18803 -661
0 -1145 -26124 -18364 -647
0 -1126 -25151 -17577 -621
0 -1107 -24308 -16920 -599
0 -1087 -23516 -16323 -579
0 -1065 -22666 -15696 -559
0 -1039 -21730 -15013 -536
0 -1008 -20688 -14265 -510
0 -973 -19530 -13442 -483
0 -909 -17688 -12153 -435
0 0 326
329
339
351
363
371
379
387
395
407
419
431
443
463
483
503
508
507
505
502
5oo
494
488
482
474
464
453
439
414
926
934
949
964
979
989
999
1009
1019
1034
1049
1064
1079
1104
1129
1154
1160
1151
1142
1132
1123
1105
1086
1068
1047
1021
991
957
895
File No.: 0900530.306Revision: 0
Page C-8 of C-40
F0306-OIRO
C Structural Integrity Associates, Inc.
11 llLFWP67083 -832 -17332 -11769 1308 0
11 llLFWP67166 -739 -14022 -9395 1257 0
11 11 LFWP67193 -709 -13125 -8823 1241 0
11 llLFWP67199 -709 -13085 -8803 1233 0
11 11_LFWP67205 -709 -13105 -8823 1223 0
11 11 LFWP67223 -710 -13275 -8953 1195 0
11 11_LFWP67253 -711 -13585 -9143 1150 0
11 11_LFWP67313 -711 -14055 -9433 1083 0
11 l1_LFWP67373 -712 -14345 -9613 1035 0
11 llLFWP67433 -712 -14525 -9733 998 0
11 11iLFWP67493 -713 -14625 -9823 969 0
11 11 LFWP67565 -704 -14852 -10043 942 0
11 11_LFWP67637 -695 -15049 -10244 923 0
11 11_LFWP67787 -676 -15374 -10597 901 0
11 11_LFWP67902 -662 -15596 -10845 893 0
11 11_LFWP68065 -641 -15892 -11183 888 0
11 11_LFWP68227 -621 -16188 -11491 891 0
11 11 LFWP68390 -601 -16474 -11799 897 0
11 11_LFWP68553 -580 -16761 -12098 907 0
11 11_LFWP68716 -560 -17047 -12396 918 0
11 11_LFWP68879 -539 -17333 -12684 930 0
11 11_LFWP69032 -520 -17628 -12979 942 0
11 11_LFWP69248 -493 -18170 -13469 953 0
11 11 LFWP69464 -466 -18731 -13970 964 0
11 11_LFWP69680 -439 -19293 -14480 974 0
11 11_LFWP69896 -412 -19864 -14981 983 0
12 11_LFWP710256 -367 -20820 -15842 999 0
12 11_LFWP710616 -322 -21806 -16703 1014 0
12 11 LFWP710976 -276 -22652 -17464 1033 0
File No.: 0900530.306Revision: 0
-832 -15399, -10350 -374 0
-739 -12364 -8057 -300 0
-709 -11542 -7509 -281 0
-709 -11612 -7600 -284 0
-709 -11732 -7720 -288 0
-710 -12102 -8080 -298 0
-711 -12632 -8540 -312 0
-711 -13362 -9130 -331 0
-712 -13772 -9480 -343 0
-712 -14022 -9700 -350 0
-713 -14162 -9830 -355 0
-704 -14450 -10131 -365 0
-695 -14679 -10372 -374 0
-676 -15037 -10778 -387 0
-662 -15271 -11048 -395 0
-641 -15580 -11399 -407 0
-621 -15870 -11730 -417 0
-601 -16159 -12051 -427 0
-580 -16449 -12352 -437 0
-560 -16739 -12663 -446 0
-539 -17028 -12954 -456 0
-520 -17317 .- 13261 -465 0
-493 -17833 -13755 -480 0
-466 -18359 -14250 -495 0
-439 -18894 -14754 -511 0
-412 -19430 -15258 -526 0
-367 -20334 -16105 -552 0
-322 -21247 -16962 -578 0
-276 .- 22050 -17709 -601 0
383 820
345 730
333 700
331 700
329 700
326 700
322 700
317 700
314 700
313 700
312 700
313 691
314 682
317 662
320 648
325 627
329 606
334 585
338 565
343 544
347 523
351 503
357 476
363 448
369 421
375 393
385 347
395 301
405 255
Page C-9 of C-40
F0306-O1 RO
C Structural Integrity Associates, Inc.
12 l1_LFWP711093 -262 -22873 -17683 1042 0
12 llLFWP711198 -278 -23041 -17770 1052 0
12 l1_LFWP711303 -294 -23218 -17868 1063 0
12 11_LFWP711408 -310 -23386 -17956 1073 0
412 11_LFWP711513 -326 -23564 -18054 1084 0
12 11 LFWP711724 -358 -23909 -18239 1104 0
12 11_LFWP711934 -390 -24244 -18425 1125 0
12 11_LFWP712144 -422 -24589 -18611 1146 0
12 11_LFWP712354 -454 -24935 -18797 1166 0
12 11_LFWP712565 -486 -25270 -18982 1187 0
12 11_LFWP712775 -518 -25655 -19178 1203 0
12 11 LFWP712985 -550 -26080 -19384 1214 0
12 11_LFWP713300 -598 -26713 -19697 1230 0
12 11_LFWP713616 -646 -27356 -20010 1246 0
12 11 LFWP713931 -694 -27999 -20324 1261 0
12 11_LFWP714247 -742 -28642 -20627 1276 0
12 11 LFWP714772 -822 -29850 -21347 1314 0
12 l1_LFWP715298 -903 -31098 -22176 1357 0
12 l1_LFWP715823 -983 -32366 -23015 1399 0
12 11_LFWP716349 -1063 -33424 -23654 1443 0
12 11_LFWP716549 -1063 -33304 -23564 1457 0
12 11_LFWP716749 -1063 -33264 -23534 1464 0
12 11 LFWP716973 -1063 -33264 -23524 1468 0
12 11_LFWP717242 -1063 -33264 -23514 1470 0
12 11_LFWP717934 -1063 -33274 -23514 1472 0
12 11_LFWP718783 -1063 -33274 -23514 1473 0
12 11_LFWP719688 -1063 -33274 -23514 1473 0
12 11_LFWP721688 -1063 -33274 -23514 1473 0
12 11 LFWP723688 -1063 -33274 -23514 1473 0
-262 -22264 -17930 -608
-278 -22429 -18026 -611
-294 -22594 -18112 -615
-310 -22759 -18208 -619
-326 -22925 -18303 -622
-358 -23255 -18484 -629
-390 -23585 -18676 -636
-422 -23905 -18858 -644
-454 -24235 -19039 -651
-486 -24565 -19220 -658
-518 -24915 -19412 -665
-550 -25295 -19603 -672
-598 -25860 -19900 -682
-646 -26435 -20187 -693
-694 -27011 -20474 -704
-742 -27596 -20761 -714
-822 -28711 -21460 -738
-903 -29876 -22258 -766
-983 -31071 -23087 -794
-1063 -32047 -23705 -815
-1063 -31887 -23555 -810
-1063 -31837 -23515 -809
-1063 -31827 -23495 -808
-1063 -31837 -23485 -808
-1063 -31837 -23485 -808
-1063 -31837 -23485 -808
-1063 -31837 -23485 -808
-1063 -31837 -23485 -808
-1063 -31837 -23485 -808
409
412
415
417
420
426
432
438
444
450
455
461
470
479
488
496
511
526
540
555
556
556
556
556
556
556
556
556
556
240
256
272
288
304
335
367
399
431
463
494
526
574
622
669
717
796
876
955
io35
1035
1035
1035
1035
1035
1035
1035
1035
1035
File No.: 0900530.306 Page C-10 of C-40Revision: 0
F0306-01 RO

Structural Integrity Associates, Inc.
12 11 LFWP725688 -1063 -33274 -23514 1473 0 0 -1063 -31837 -23485 -808 0 0 556 1035
12 11_LFWP726349 -1063 -33274 -23514 1473 0
12 11_LFWP726349 -1063 -33274 -23514 1473 0
12 11_LFWP726349 -1063 -33274 -23514 1473 0
12 11_LFWP726349 -1063 -33274 -23514 1473 0
12 11_LFWP726349 -1063 -33274 -23504 P473 0
12 l1 LFWP726349 -1063 -33254 -23494 1473 0
12 l1_LFWP726350 -1063 -33224 -23464 1473 0
12 11_LFWP726350 -1063 -33194 -23434 1474 0
12 11_LFWP726350 -1062 -33154 -23404 1474 0
12 11_LFWP726350 -1062 -33144 -23394 1474 0
12 11_LFWP726550 -1063 -32804 -23154 1467 0
12 11 LFWP726750 -1063 -32844 -23174 1457 0O
12 11_LFWP726950 -1063 -32864 -23184 1453 0
12 11_LFWP727150 -1063 -32864 -23194 1451 0
12 l1_LFWP727564 -1063 -32864 -23194 1449 0
12 11_LFWP728094 -1063 -32864 -23194 1448 0
12 11_LFWP729429 -1063 -32864 -23194 1448 0
12 11 LFWP731429 -1063 -32864 -23194 1448 0
12 11_LFWP733429 -1063 -32864 -23194 1448 0
12 11_LFWP735429 -1063 -32864 -23194 1448 0
12 l1_LFWP736350 -1063 -32864 -23194 1448 0
12 11_LFWP736350 -1063 -32864 -23194 1448 0
12 11_LFWP736350 -1063 -32864 -23194 1448 0
12 11_LFWP736350 -1063 -32864 -23194 1448 0
12 11_LFWP736350 -1063 -32854 -23184 1448 0
12 11_LFWP736350 -1062 -32814 -23144 1449 0
12 11_LFWP736351 -1062 -32754 -23094 1449 0
12 11 LFWP736351 -1061 -32674 -23024 1451 0
-1063 -31837 -23485 -808
-1063 -31837 -23485 -808
-1063 -31837 -23476 -808
-1063 -31827 -23476 -808
-1063 -31807 -23446 -807
-1063 -31727 -23366 -804
-1063 -31627 -23275 -801
-1063 -31517 -23165 -798
-1062 -31427 -23075 -795
-1062 -31387 -23035 -794
-1063 -31297 -23035 -793
-1063 -31407 -23125 -796
-1063 -31437 -23155 -797
-1063 -31447 -23155 -797
-1063 -31447 -23165 -798
-1063 -31447 -23165 -798
-1063 -31447 -23165 -798
-1063 -31447 -23165 -798
- 1 0 6 3 -31447 -23165 -798
-1063 -31447 -23165 -798
-1063 -31447 -23165 -798
-1063 -31437 -23165 -798
-1063 -31437 -23165 -797
-1063 -31417 -23145 -797
-1063 -31357 -23085 -795
-1062 -31197 -22925 -790
-1062 -30987 -22715 -783
-1061 -30747 -22485 -776
556
556
556
556
556
555
555
555555
554
549
548
548
548
548
548
548
548
548
548
548
548
548
548
548
547
547
546
1035
1035
1035
1035
1035
1035
1035
1035
1035
1035
1035
1035
1035
1035
1035
1035
1035
1035
1035
1035
1035
1035
1035
1035
1035
1035
1035
1035
File No.: 0900530.306Revision: 0
Page C-1I of C-40
F0306-01RO
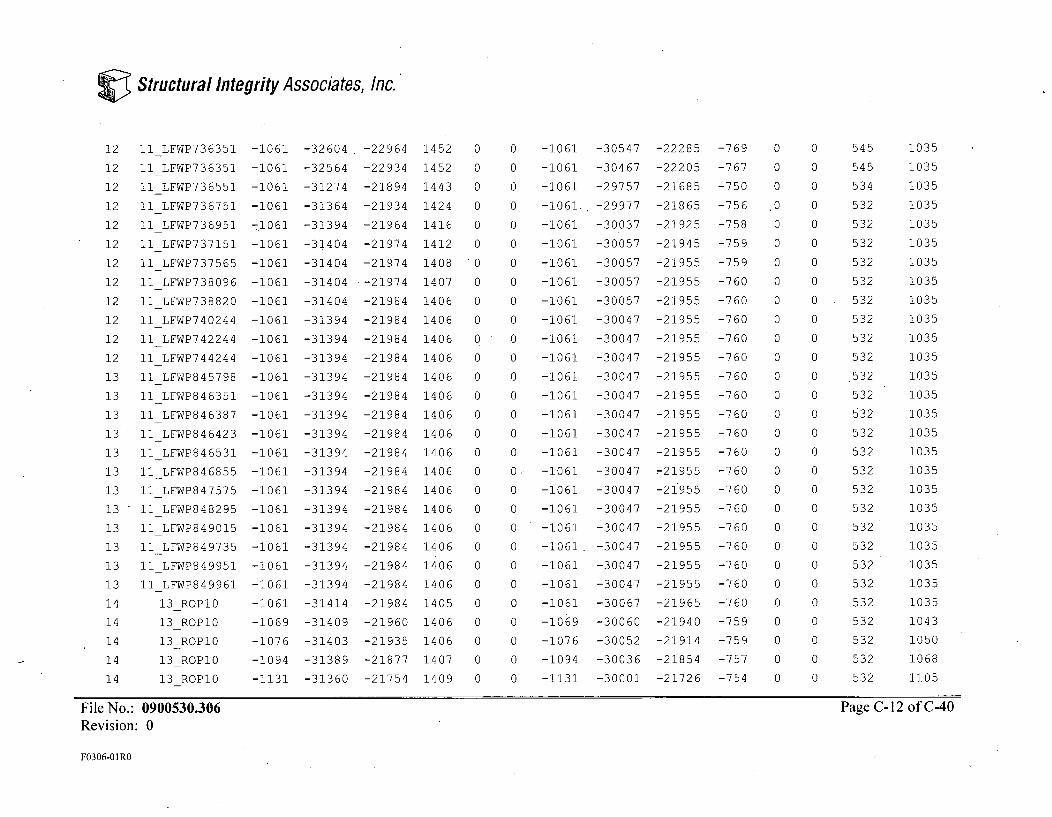
C Structural Integrity Associates, Inc.
12
12
12
12
12
12
12
12
12
12
12
12
13
13
13
13
13
13
13
13
13
13
13
13
14
14
14
14
14
11_LFWP736351 -1061 -32604 -22964 1452 0
11_LFWP736351 -1061 -32564 -22934 1452 0
11_LFWP736551 -1061 -31274 -21894 1443 0
11_LFWP736751 -1061 -31364 -21934 1424 0
11_LFWP736951 71061 -31394 -21964 1416 0
11_LFWP737151 -1061 -31404 -21974 1412 0
11_LFWP737565 -1061 -31404 -21974 1408 0
11_LFWP738096 -1061 -31404 -- 21974 1407 0
11_LFWP738820 -1061. -31404 -21984 1406 0
11_LFWP740244 -1061 -31394 -21984 1406 0
11_LFWP742244 -1061 -31394 -21984 1406 0
11 LFWP744244 -1061 -31394 -21984 1406 0
11_LFWP845798 -1061 -31394 -21984 1406 0
11_LFWP846351 -1061 -31394 -21984 1406 0
11_LFWP846387 -1061 -31394 -21984 1406 0
11_LFWP846423 -1061 -31394 -21984 1406 0
11_LFWP846531 -1061 -31394 -21984 1406 0
11 LFWP846855 -1061 -31394 -21984 1406 0
11_LFWP847575 -1061 -31394 -21984 1406 0
11_LFWP848295 -1061 -31394 -21984 1406 0
11_LFWP849015 -1061 -31394 -21984 1406 0
11_LFWP849735 -1061 -31394 -21984 1406 0
11_LFWP849951 -1061 -31394 -21984 1406 0
11 LFWP849961 -1061 -31394 -21984 1406 0
13 ROPl0 -1061 -31414 -21984 1405 0
13 ROP10 -1069 -31409 -21960 1406 0
13 ROPl0 -1076 -31403 -21935 1406 0
13 ROPl0 -1094 -31389 -21877 1407 0
13 ROP10 -1131 -31360 -21754 1409 0
-1061 -30547 -22285 -769
-1061 -30467 -22205 -767
-1061 -29757 -21685 -750
-1061. -29977 -21865 -756
-1061 -30037 -21925 -758
-1061 -30057 -21945 -759
-1061 -30057 -21955 -759
-1061 -30057 -21955 -760
-1061 -30057 -21955 -760
-1061 -30047 -21955 -760
-1061 -30047 -21955 -760
-1061 -30047 -21955 -760
-1061 -30047 -21955 -760
-1061 -30047 -21955 -760
-1061 -30047 -21955 -760
-1061 -30047 -21955 -760
-1061 -30047 -21955 -760
-1061 -30047 -21955 -760
-1061 -30047 -21955 -760
-1061 -30047 -21955 -760
-1061 -30047 -21955 -760
-1061 -30047 -21955 -760
-1061 -30047 -21955 -760
-1061 -30047 -21955 -760
-1061 -30067 -21965 -760
-1069 -30060 -21940 -759
-1076 -30052 -21914 -759
-1094 -30036 -21854 -757
-1131 -30001 -21726 -754
545 1035
545 1035
534 1035
532 1035
532 1035
532 1035
532 1035
532 1035
532 1035
532 1035
532 1035
532 1035
532 1035
532 1035
532 1035
532 1035
532 1035
532 1035
532 1035
532 1035
532 1035
532 1035
532 1035
532 1035
532 1035
532 1043
532 1050
532 1068
532 1105
Page C-12 of C-40File No.: 0900530.306Revision: 0
F0306-OIRO
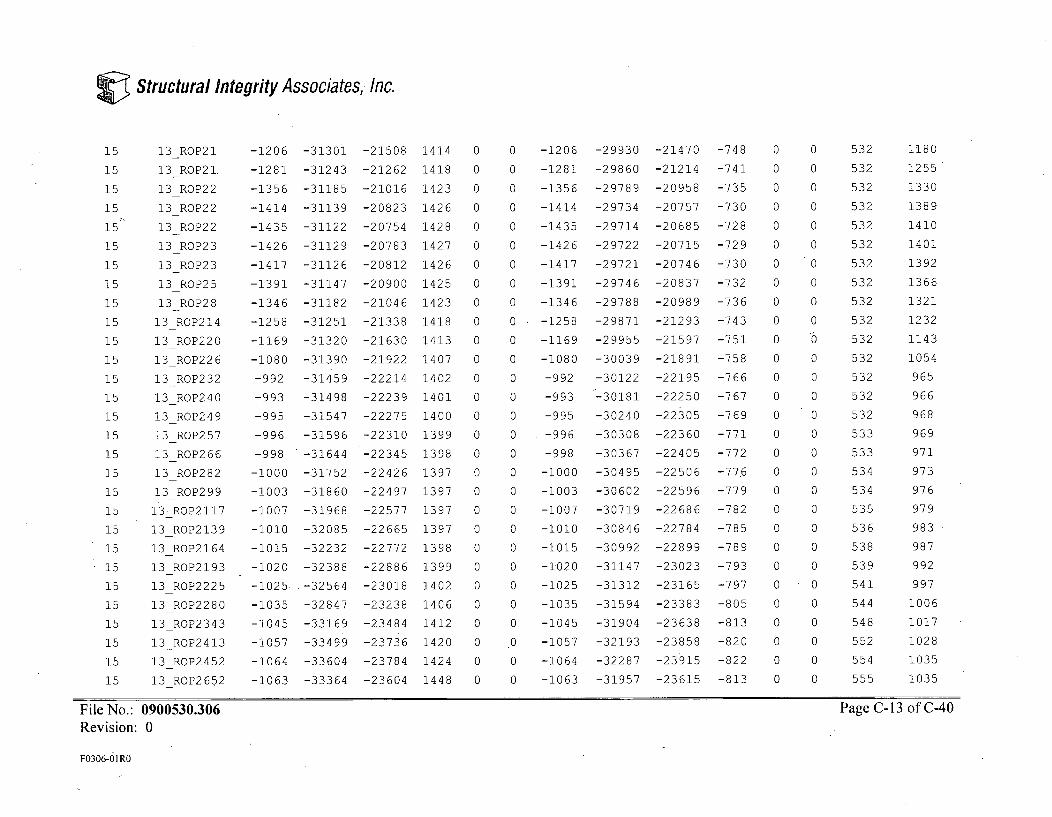
C Structural Integrity Associates, Inc.
15
15
15
15
15
15
15
15
15
15
15
15
15
15
15
15
15
15
15
15
15
15
15
15
15
15
15
15
15
13_ROP21
13_ROP21.
13 ROP22
13 ROP22
13 ROP22
13 ROP23
13 ROP23
13 ROP25
13 ROP28
13 ROP214
13 ROP220
13_ROP226
13 ROP232
13 ROP240
13 ROP249
13 ROP257
13 ROP266
13 ROP282
13 ROP299
13 ROP2117
13 ROP2139
13 ROP2164
13 ROP2193
13 ROP2225
13 ROP2280
13 ROP2343
13 ROP2413
13 ROP2452
13 ROP2652
-1206 -31301 -21508 1414 0
-1281 -31243 -21262 1418 0
-1356 -31185 -21016 1423 0
-1414 -31139 -20823 1426 0
-1435 -31122 -20754 1428 0
-1426 -31129 -20783 1427 0
-1417 -31126 -20812 1426 0
-1391 -31147 -20900 1425 0
-1346 -31182 -21046 1423 0
-1258 -31251 -21338 1418 0
-1169 -31320 -21630 1413 0
-1080 -31390 -21922 1407 0
-992 -31459 -22214 1402 0
-993 -31498 -22239 1401 0
-995 -31547 -22275 1400 0
-996 -31596 -22310 1399 0
-998 -31644 -22345 1398 0
-1000 -31752 -22426 1397 0
-1003 -31860 -22497 1397 0
-1007 -31968 -22577 1397 0
-1010 -32085 -22665 1397 0
-1015 -32232 -22772 1398 0
-1020 -32388 -22886 1399 0
-1025 -32564 -23018 1402 0
-1035 -32847 -23238 1406 0
-1045 -33169 -23484 1412 0
-1057 -33499 -23736 1420 0
-1064 -33604 -23784 1424 0
-1063 -33364 -23604 1448 0
-1206 -29930 -21470 -748
-1281 -29860 -21214 -741
-1356 -29789 -20958 -735
-1414 -29734 -20757 -730
-1435 -29714 -20685 -728
-1426 -29722 -20715 -729
-1417 -29721 -20746 -730
-1391 -29746 -20837 -732
-1346 -29788 -20989 -736
-1258 -29871 -21293 -743
-1169 -29955 -21597 -751
-1080 -30039 -21891 -758
-992 -30122 -22195 -766
-993 -30181 -22250 -767
-995 -30240 -22305 -769
-996 -30308 -22360 -771
-998 -30367 -22405 -772
-1000 -30495 -22506 -77.6
-1003 -30602 -22596 -779
-1007 -30719 -22686 -782
-1010 -30846 -22784 -785
-1015 -30992 -22899 -789
-1020 -31147 -23023 -793
-1025 -31312 -23165 -797
-1035 -31594 -23383 -805
-1045 -31904 -23638 -813
-1057 -32193 -23858 -820
-1064 -32287 -23915 -822
-1063 -31957 -23615 -813
532
532
532
532
532
532
532
532
532
532
532
532
532
532
532
533
533
534
534
535
536
538
539
541
544
548
552
554
555
1180
1255
1330
1389
1410
1401
1392
1366
1321
1232
1143
1054
965
966
968
969
971
973
976
979
983
987
992
997
1006
1017
1028
1035
1035
File No.: 0900530.306 Page C-13 of C-40Revision: 0
F0306-O1RO
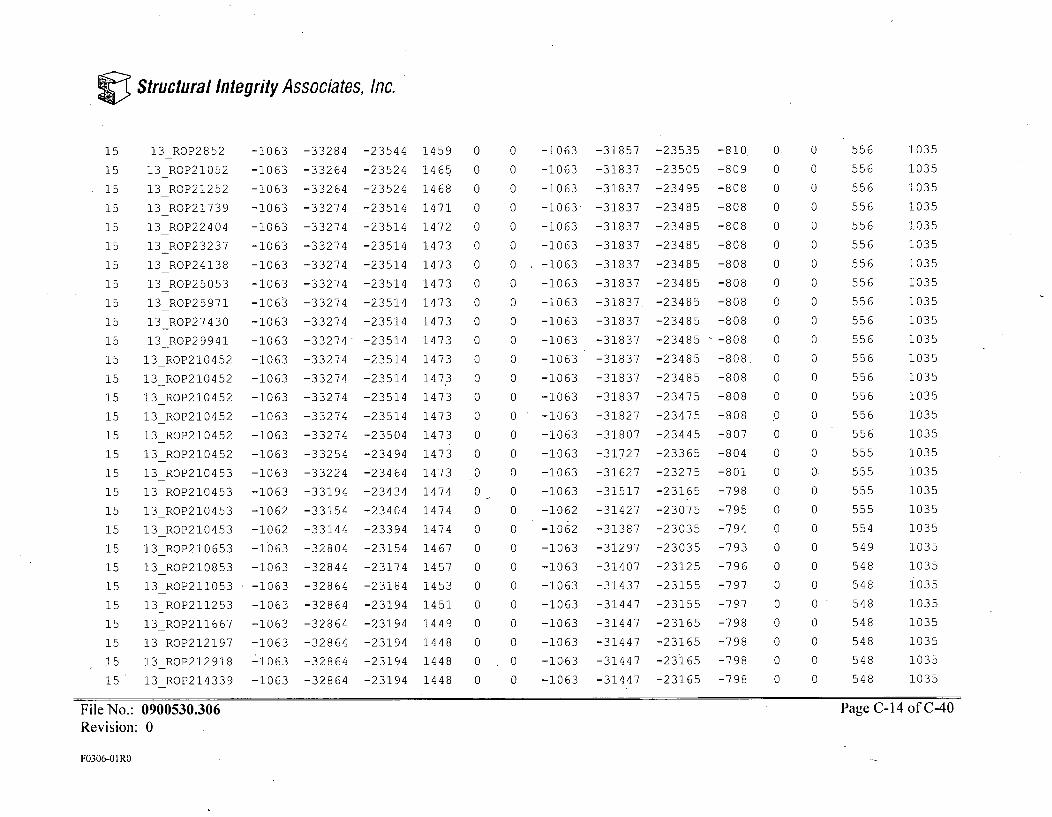
C Structural Integrity Associates, Inc.
15
15
15
15
15
15
15
15
15
15
15
15
15
15
15
15
15
15
15
15
15
15
15
15
15
15
15
15
15
13_ROP2852 -1063 -33284 -23544 1459 0
13_ROP21052 -1063 -33264 -23524 1465 0
13_ROP21252 -1063 -33264 -23524 1468 0
13_ROP21739 -1063 -33274 -23514 1471 0
13_ROP22404 -1063 -33274 -23514 1472 0
13 ROP23237 -1063 -33274 -23514 1473 0
13_ROP24138 -1063 -33274 -23514 1473 0
13_ROP25053 -1063 -33274 -23514 1473 0
13_ROP25971 -1063 -33274 -23514 1473 0
13_ROP27430 -1063 -33274 -23514 1473 0
13_ROP29941 -1063 -33274 -23514 1473 0
13 ROP210452 -1063 -33274 -23514 1473 0
13_ROP210452 -1063 -33274 -23514 1473 0
13_ROP210452 -1063 -33274 -23514 1473 0
13_ROP210452 -1063 -33274 -23514 1473 0
13_ROP210452 -1063 -33274 -23504 1473 0
13_ROP210452 -1063 -33254 -23494 1473 0
13_ROP210453 -1063 -33224 -23464 1473 0
13_ROP210453 -1063 -33194 -23434 1474 0
13_ROP210453 -1062 -33154 -23404 1474 0
13_ROP210453 -1062 -33144 -23394 1474 0
13_ROP210653 -1063 -32804 -23154 1467 0
13 ROP210853 -1063 -32844 -23174 1457 0
13_ROP211053 -1063 -32864 -23184 1453 0
13_ROP211253 -1063 -32864 -23194 1451 0
13_ROP211667 -1063 -32864 -23194 1449 0
13_ROP212197 -1063 -32864 -23194 1448 0
13_ROP212918 -1063 -32864 -23194 1448 0
13 ROP214339 -1063 -32864 -23194 1448 0
-1063 -31857 -23535 -810.
-1063 -31837 -23505 -809
-1063 -31837 .- 23495 -808
-1063 -31837 -23485 -808
-1063 -31837 -23485 -808
-1063 -31837 -23485 -808
-1063 -31837 -23485 -808
-1063 -31837 -23485 -808
-1063 -31837. -23485 -808
-1063 -31837 -23485 -808
-1063 -31837 -23485 -808
-1063 -31837 -23485 -808.
-1063 -31837 -23485 -808
-1063 -31837 -23475 -808
-1063 -31827 -23475 -808
-1063 -31807 -23445 -807
-1063 -31727 -23365 -804
-1063 -31627 -23275 -801
-1063 -31517 -23165 -798
-1062 -31427 -23075 -795
-1062 -31387 -23035 -794
-1063 -31297 -23035 -793
-1063 -31407 -23125 -796
-1063 -31437 -23155 -797
-1063 -31447 -23155 -797
-1063 -31447 -23165 -798
-1063 -31447 -23165 -798
-1063 -31447 -23165 -798
-1063 -31447 -23165 -798
556
556
556
556
556
556
556
556
556
556
556
556
556
556
556
556
555
555
555
555
554
549
548
548
548
548
548
548
548
1035
1035
1035
1035
1035
1035
1035
1035
1035
1035
1035
1035
1035
1035
1035
1035
1035
1035
1035
1035
1035
1035
1035
1035
1035
1035
1035
1035
1035
File No.: 0900530.306 Page C-14 of C-40Revision: 0
F0306-O1 RO
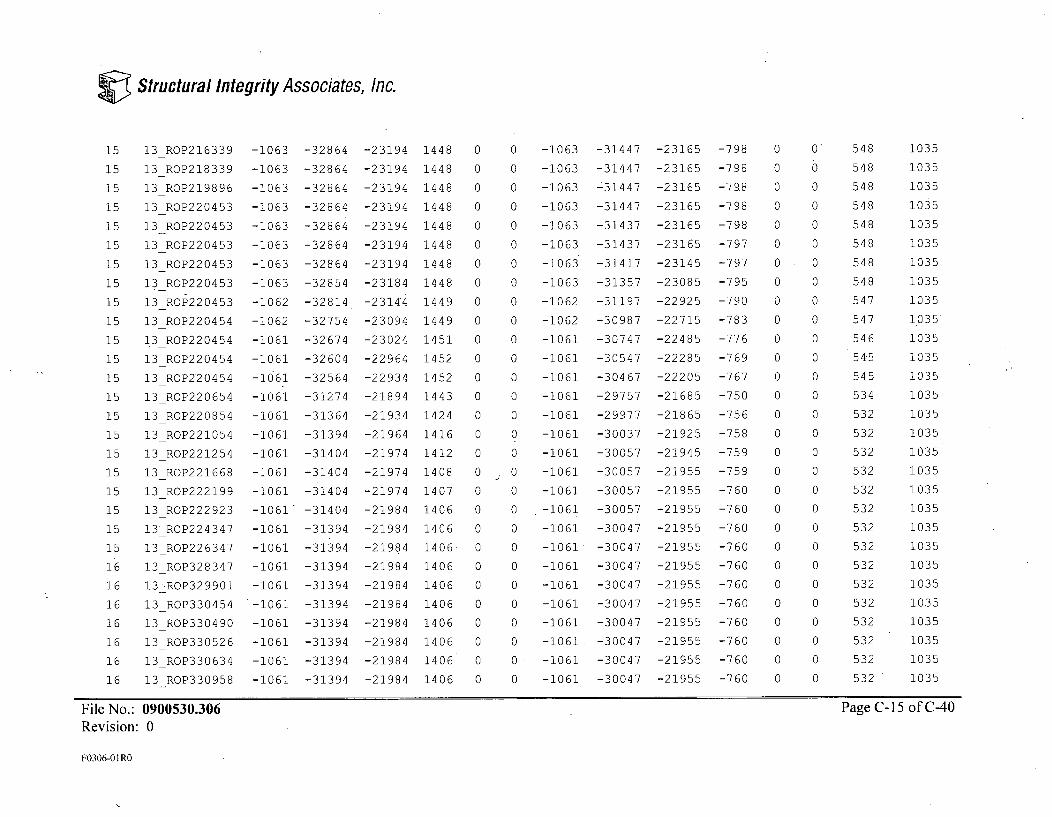
Structural Integrity Associates, Inc.
15 13_ROP216339 -1063 -32864 -23194 1448 0
15 13_ROP218339 -1063 -32864 -23194 1448 0
15 13_ROP219896 -1063 -32864 -23194 1448 0
15 13_ROP220453 -1063 -32864 -23194 1448 0
15 13_ROP220453 -1063 -32864 -23194 1448 0
15 13 ROP220453 -1063 -32864 -23194 1448 0
15 13_ROP220453 -1063 -32864 -23194 1448. 0
15 13_ROP220453 -1063 -32854 -23184 1448 0
15 13_ROP220453 -1062 -32814 -23144 1449 0
15 13_ROP220454 -1062 -32754 -23094 1449 0
15 13_ROP220454 -1061 -32674 -23024 1451 0
15 13 ROP220454 -1061 -32604 -22964 1452 0
15 13_ROP220454 -1061 -32564 -22934 1452 0
15 13_ROP220654 -1061 -31274 -21894 1443 0
15 13_ROP220854 -1061 -31364 -21934 1424 0
15 13_ROP221054 -1061 -31394 -21964 1416 0
15 13_ROP221254 -1061 -31404 -21974 1412 0
15 13 ROP221668 -1061 -31404 -21974 1408 0
15 13_ROP222199 -1061 -31404 -21974 1407 0
15 13_ROP222923 -1061 -31404 -21984 1406 0
15 13-_ROP224347 -1061 -31394 -21984 1406 0
15 13_ROP226347 -1061 -31394 -21984 1406 0
16 13_ROP328347 -1061 -31394 -21984 1406 0
16 13-ROP329901 -1061 -31394 -21984 1406 0
16 13_ROP330454 -1061 -31394 -21984 1406 0
16 13_ROP330490 -1061 -31394 -21984 1406 0
16 13_ROP330526 -1061 -31394 -21984 1406 0
16 13_ROP330634 -1061 -31394 -21984 1406 0
16 13 ROP330958 -1061 -31394 -21984 1406 0
0 -1063 -31447 -23165 -798
0 -1063 -31447 -23165 -798
0 -1063 -31447 -23165 -798
0 -1063 -31447 -23165 -798
0 -1063 -31437 -23165 -798
0 -1063 -31437 -23165 -797
0 -1063 -31417 -23145 -797
0 -1063 -31357 -23085 -795
0 -1062 -31197 -22925 -790
0 -1062 -30987 -22715 -783
0 -1061 -30747 -22485 -776
0 -1061 -30547 -22285 -769
0 -1061 -30467 -22205 -767
0 -1061 -29757 -21685 -750
0 -1061 -29977 -21865 -756
0 -1061 -30037 -21925 -758
0 -1061 -30057 -21945 -759
0 -1061 -30057 -21955 -759
0 -1061 -30057 -21955 -760
0 -1061 -30057 -21955 -760
0 -1061 -30047 -21955 -760
0 -1061 -30047 -21955 -760
0 -1061 -30047 -21955 -760
0 -1061 -30047 -21955 -760
0 -1061 -30047 -21955 -760
0 -1061 -30047 -21955 -760
0 -1061 -30047 -21955 -760
0 -1061 -30047 -21955 -760
0 -1061 -30047 -21955 -760
0 0 548 1035
548
548
548
548
548
548
548
547
547
54654-5
545
534
532
532
532
532
532
532
532
532
532
532
532
532
532
532
532
1035
1035
1035
1035
1035
1035
1035
1035
1035
1035
1035
1035
1035
1035
1035
1035
1035
1035
1035
1035
1035
1035
1035
1035
1035
1035
1035
1035
File No.: 0900530.306Revision: 0
Page C-1 5 of C-40
F0306-01 RO
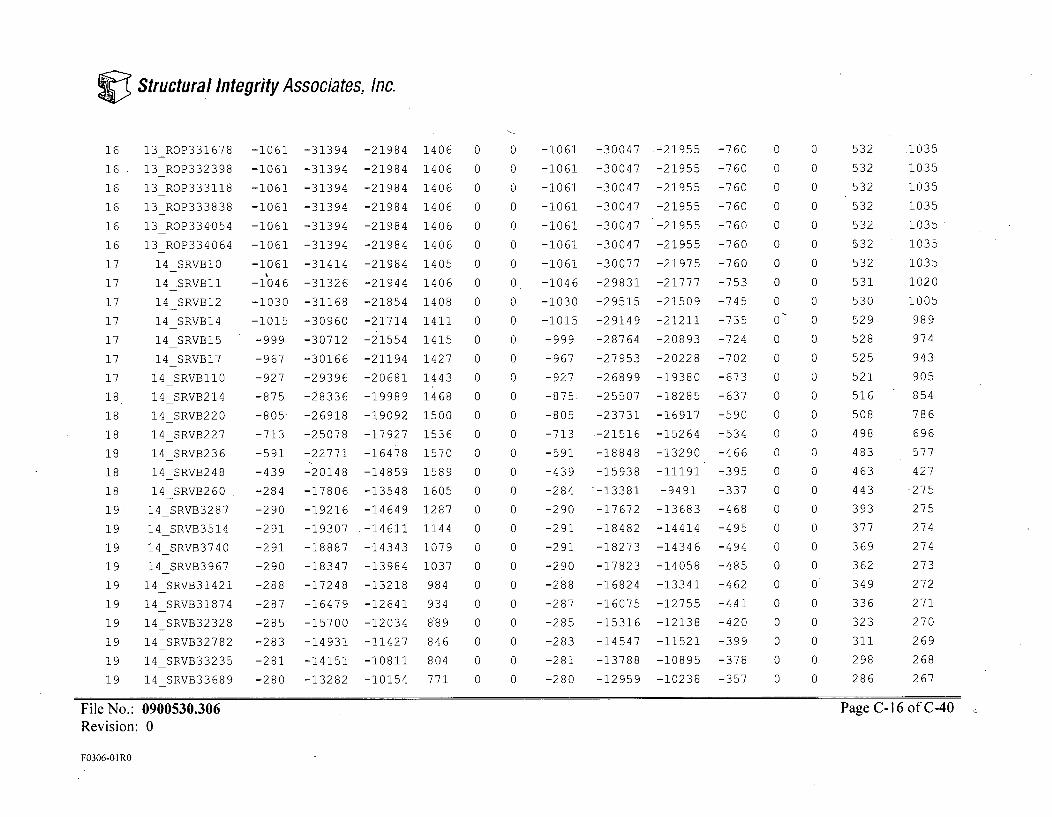
C Structural Integrity Associates, Inc.
16
16
16
16
16
16
17
17
17
17
17
17
17
18
18
18
18
18
18
19
19
19
19
19
19
19
19
19
19
13_ROP331678
13_ROP332398
13_ROP333118
13_ROP333838
13_ROP334054
13 ROP334064
14 SRVB10
14 SRVB11
14 SRVB12
14 SRVB14
14 SRVB15
14 SRVB17
14 SRVB1I0
14 SRVB214
14 SRVB220
14 SRVB227
14 SRVB236
14 SRVB248
14 SRVB260
14_SRVB3287
14_SRVB3514
14_SRVB3740
14 SRVB3967
14 SRVB31421
14_SRVB31874
14 SRVB32328
14_SRVB32782
14_SRVB33235
14 SRVB33689
-1061 -31394 -21984 1406 0
-1061 -31394 -21984 1406 0
-1061 -31394 -21984 1406 0
-1061 -31394 -21984 1406 0
-1061 -31394 -21984 1406 0
-1061 -31394 -21984 1406 0
-1061 -31414 -21984 1405 0
-1046 -31326 -21944 1406 0
-1030 -31168 -21854 1408 0
-1015 -30960 -21714 1411 0
-999 -30712 -21554 1415 0
-967 -30166 -21194 1427 0
-927 -29396 -20681 1443 0
-875 -28336 -19989 1468 0
-805 -26918 -19092 1500 0
-713 -25078 -17927 1536 0
-591 -22771 -16478 1570 0
-439 -20148 -14859 1589 0
-284 -17806 -13548 1605 0
-290 -19216 -14649 1287 0
-291 -19307 -14611 1144 0
-291 -18887 -14343 1079 0
-290 -18347 -13984 1037 0
-288 -17248 -13218 984 0
-287 -16479 -12641 934 0
-285 -15700 -12034 8'89 0
-283 -14931 -11427 846 0
-281 -14151 -10811 804 0
-280 -13282 -10154 771 0
-1061 -30047 -21955 -760 0
-1061 -30047 -21955 -760 0
-1061 -30047 -21955 -760 0
-1061 -30047 -21955 -760 0
-1061 -30047 -21955 -760 0
-1061 -30047 -21955 -760 0
-1061 -30077 -21975 -760 0
-1046 -29831 -21777 -753 0
-1030 -29515 -21509 -745 0
-1015 -29149 -21211 -735 0
-999 -28764 -20893 -724 0
-967 -27953 -20228 -702 0
-927 -26899 -19380 -673 0
-875. -25507 -18285 -637 0
-805 -23731 -16917 -590 0
-713 -21516 -15264 -534 0
-591 -18848 -13290 -466 0
-439 -15938 -11191 -395 0
-284 "-13381 -9491 -337 0
-290 -17672 -13683 -468 0
-291 -18482 -14414 -495 0
-291 -18273 -14346 -494 0
-290 -17823 -14058 -485 0
-288 -16824 -13341 -462 0
-287 -16075 -12755 -441 0
-285 -15316 -12138 -420 0
-283 -14547 -11521 -399 0
-281 -13788 -10895 -378 0
-280 -12959 -10238 -357 0
532
532
532
532
532
532
532
531
530
529
528
525
521
516
508
498
483
463
443
393
377
369
362
349
336
323
311
298
286
.1035
1035
1035
1035
1035
1035
1035
1020
1005
989
974
943
905
854
786
696
577
427
-275
275
274
274
273
272
271
270
269
268
267
File No.: 0900530.306Revision: 0
Page C-16 of C40
F0306-01 RO
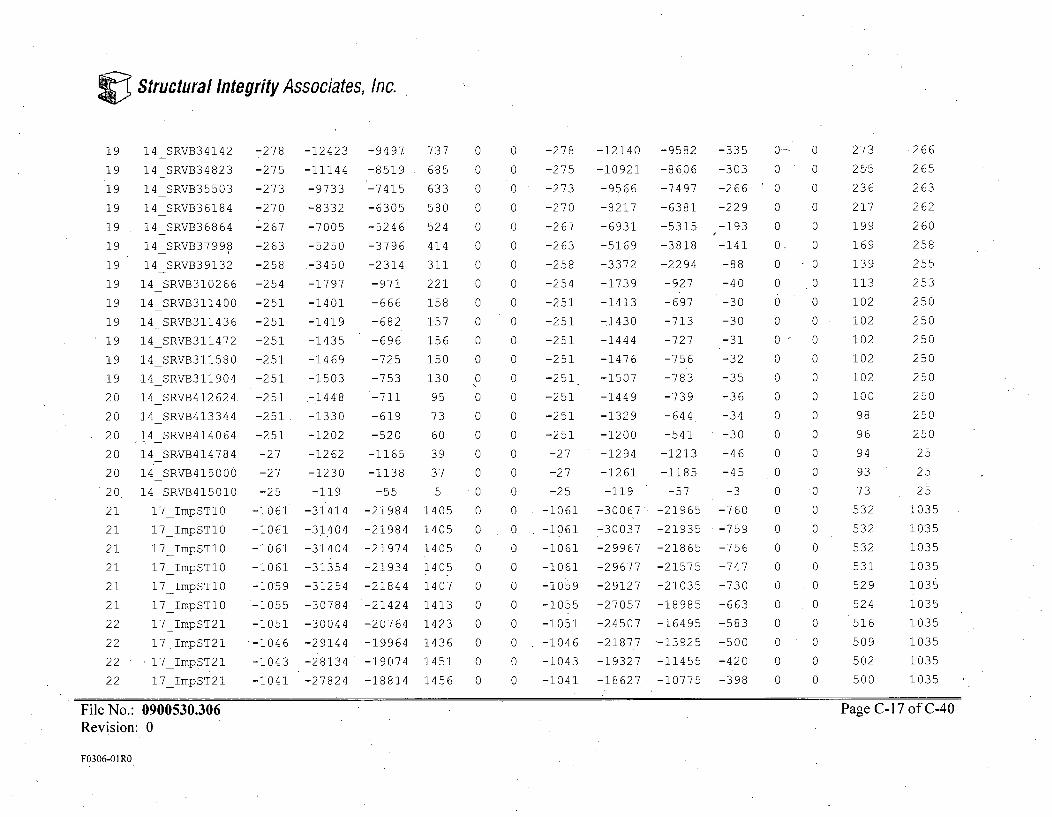
C Structural Integrity Associates, Inc.
19
19
19
19
19
19
19
19
19
19
19
19
19
20
20
20
20
20
20
21
21
21
21
21
21
22
22
22
14_SRVB34142
14 SRVB34823
14_SRVB35503
14_SRVB36184
14 SRVB36864
14 SRVB37998
14 SRVB39132
14_SRVB310266
14_SRVB311400
14 SRVB311436
14 SRVB311472
14 SRVB311580
14_SRVB311904
14_SRVB412624.
14_SRVB413344
14 SRVB414064
14 SRVB414784
14_SRVB415000
14_SRVB415010
17_ImpSTl0
17_ImpSTl0
17 ImpSTI0
17_ImpSTl0
17_ImpSTl0
17_ImpSTl0
17_ImpST21
17 ImpST21
.17 ImpST21
-278 -12423 -9497 737
-275 -11144 -8519 685
-273 -9733 -7415 633
-270 -8332 -6305 580
-267 -7005 -5246 524
-263 -5250 -3796 414
-258 -3450 -2314 311
-254 -1797 -971 221
-251 -1401 -666 158
-251 -1419 -682 157
-251 -1435 -696 156
-251 -1469 -725 150
-251 -1503 -753 130
-251 -1448 -711 95
-251 -1330 -619 73
-251 -1202 -520 60
-27 -1262 -1165 39
-27 -1230 -1138 37
-25 -119 -55 5
-1061 -31414 -21984 1405
-1061 -31404 -21984 1405
-1061 -31404 -21974 1405
-1061 -31354 -21934 1405
-1059 -31254 -21844 1407
-1055 -30784 -21424 1413
-1051 -30044 -20764 1423
-1046 -29144 -19964 1436
-1043 -28134 -19074 1451
-1041 -27824 -18814 1456
0 -278 -12140 -9582 -335
0 -275 -10921 -86.06 -303
0 -273 -9566 -7497 -266
0 -270 -8217 -6381 -229
0 -267 -6931 -5315 -193
0 -263 -5169 -3818 -141
0 -258 -3372 -2294 -88
0 -254 -1739 -927 -40
0 -251 -1413 -697 -30
0 -251 -1430 -713 -30
0 -251 -1444 -727 -31
0 -251 -1476 -756 -32
0 -251 -1507 -783 -35
0 -251 -1449 -739 -36
0 -251 -1329 -644 -34
0 -251 -1200 -541 -30
0 -27 -1294 -1213 -46
0 -27 -1261 -1185 -45
0 -25 -119 -57 -3
0 -1061 -30067 -21965 -760
0 ,-1061 -30037 -21935 -759
0 -1061 -29967 -21865 -756
0 -1061 -29677 -21575 -747
0 -1059 -29127 -21035 -730
0 -1055 -27057 -18985 -663
0 -1051 -24507 -16495 -583
0 -1046 -21877 -13925 -500
0 -1043 -19327 -11455 -420
273
255
236
217
199
169
139
113
102
102
102
102
102
100
98
96
94
93
73
532
532
532
531
529
524
516
509
502
266
265
263
262
260
258
255
.253
250
250
250
250
250
250
250
250
25
25
25
1035
1035
1035
1035
1035
1035
1035
1035
1035
22 17 ImpST21 0 0 -1041 -18627 -10775 -398 0 0 500 1035
File No.: 0900530.306Revision: 0
Page C- 17 of C-40
F0306-O1RO

C Structural Integrity Associates, Inc.
22 17_ImpST22 -1037 -25504 -16824 1494 -0
22 17_ImpST22 -1035 -23514 -15134 1530 0
22 17_ImpST24 -1031 -19514 -11894 1621 0
22 17 ImpST26 -1029 -15344 -8734 1745 0
22 17_ImpST211 -1027 -11074 -5836 1894 0
22 17_ImpST217 -1028 -9294 -4852 1951 0
22 17_ImpST222 -1028 -8550 -4572 1955 0
22 17 ImpST226 -1029 -8270 -4492 1935 0
22 17 ImpST227 -1025 -8204 -4475 1926 0
22 17_ImpST227 -1025 -8205 -4477 1925 0
22 17_ImpST227 -1025 -8209 -4480 1925 0
22 17_ImpST227 -1030 -8239 -4510 1925 0
22 17_ImpST227 -1031 -8346 -4609 1923 0
22 17 ImpST227 -1035 -8742 -4968 1916 0
23 17_ImpST328 -1039 -9404 -5565 1906 0
23 17 ImpST328 -1045 -10364 -6421 1892 0
23 17 ImpST328 -1052 -11644 -7554 1872 0
23 17 ImpST364 -1065 -30494 -21424 1271 0
23 17 ImpST3100 -1064 -32044 -22244 1257 0
23 17_ImpST3136 -1063 -32064 -22284 1308 0
23 17_ImpST3172 -1063 -31914 -22224 1342 0
23 17_ImpST3247 -1062 -31664 -22114 1372 0
23 17_ImpST3351 -1062 -31504 -22044 1386 0
23 17_ImpST3520 -1061 -31414 -22004 1396 0
23 17ImpST31004 -1061 -31394 -21984 1403 0
23 17_ImpST31724 -1061 -31394 -21984 1406 0
23 17_ImpST32444 -1061 -31394 -21984 1406 0
23 17_ImpST33164 -1061 ,-31394 -21984 1406 0
23 17 ImpST33628 -1061 -31394 -21984 1406 0
0 -1037 -15077 -7425
0 -1035 -12607 -5138
0 -1031 -8570 -1593
0 -1029 -4980 1281
0 -1027 -1907 3302
0 -1028 -1128 3438
0 -1028 -1124 3052
0 -1029 -1330 2676
0 -1025 -1411 2552
0 -1025 -1431 2533
0 -1025 -1467 2496
0 -1030 -1688 2274
0 -1031 -2278 1690
0 -1035 -4061 -69
0 -1039 -6594 -2560
0 -1045 -9847 -5751
0 -1052 -13807 -9615
0 -1065 -31797 -24005
0 -1064 -32017 -23635
0 -1063 -31447 -23075
0 -1063 -30997 -22695
-291
-219
-107
-15
54
63
52
40
35
34
33
27
8
-49
-129
-232
-356
-826
-816
-797
-784
489
481
467
451
431
418
407
400
398
398
398
398
400
404
411
420
431
502
517
523
526
530
531
532
532
532
532
532
532
1035
1035
1035
1035
1035
1035
1035
1035
1035
1035
1035
1035
1035
1035
1035
1035
1035
1035
1035
1035
1035
1035
1035
1035
1035
1035
1035
1035
1035
0 -1062 -30477 -22285 -771
0 -1062 -30207 -22085 -764
0 -1061 -30077 -21995 -761
0 -1061 -30047 -21965 -760
0 -1061 -30047 -21955 -760
0 -1061 -30047 -21955 -760
0 -1061 -30047 -21955 -760
0 -1061 -30047 -21955 -760
File No.: 0900530.306Revision: 0
Page C-18 of C-40
F0306-01 RO
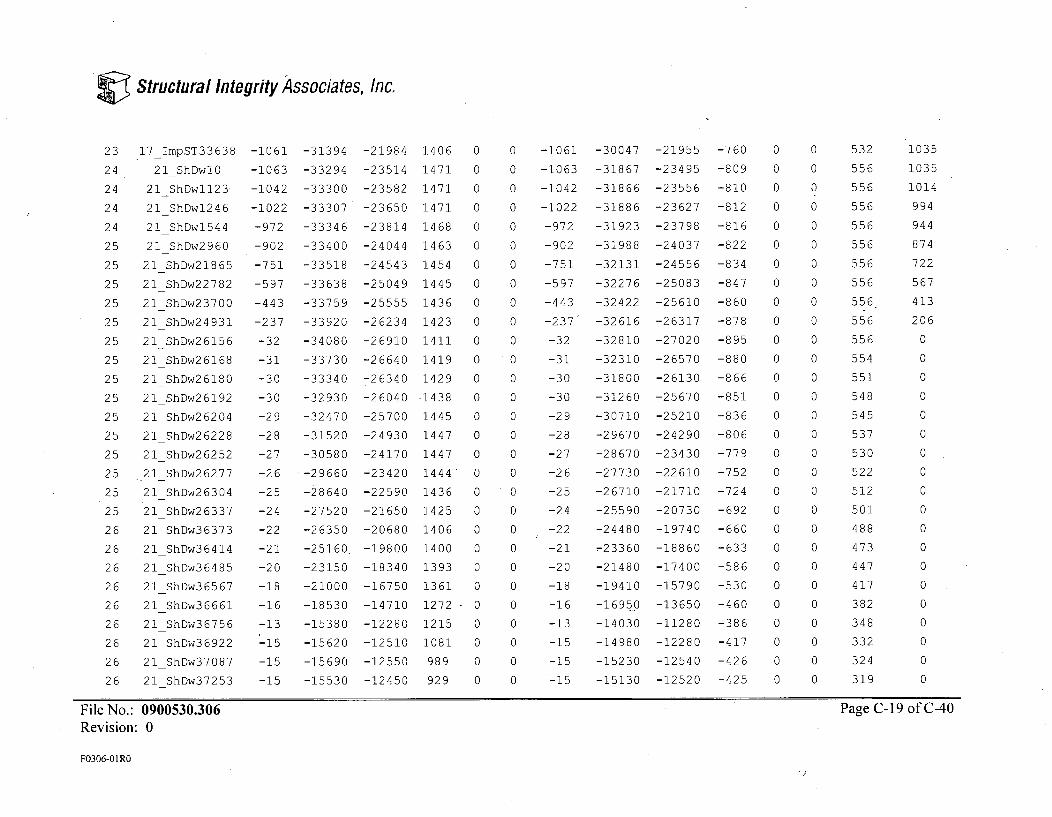
C Structural Integrity Associates, Inc.
23 17_ImpST33638 -1061 -31394 -21984 1406 0
24 21_ShDwlO -1063 -33294 -23514 1471 0
24 21_ShDwl123 -1042 -33300 -23582 1471 0
24 21_ShDw1246 -1022 -33307 -23650 1471 0
24 21_ShDw1544 -972 -33346 -23814 1468 0
25 21 ShDw2960 -902 -33400 -24044 1463 0
25 21_ShDw21865 -751 -33518 -24543 1454 0
25 21_ShDw22782 -597 -33638 -25049 1445 0
25 21_ShDw23700 -443 -33759 -25555 1436 0
25 21_ShDw24931 -237 -33920 -26234 1423 0
25 21_ShDw26156 -32 -34080 -26910 1411 0
25 21_ShDw26168 -31 -33730 -26640 1419 0
25 21 ShDw26180 -30 -33340 -26340 1429 0
25 21_ShDw26192 -30 -32930 -26040 -1438 0
25 21_ShDw26204 -29 -32470 -25700 1445 0
25 21_ShDw26228 -28 -31520 -24930 1447 0
25 21_ShDw26252 -27 -30580 -24170 1447 0
25 21 ShDw26277 -26 -29660 -23420 1444 0
25 21_ShDw26304 -25 -28640 -22590 1436 0
25 21_ShDw26337 -24 -27520 -21650 1425 0
26 21_ShDw36373 -22 -26350 -20680 1406 0
26 21_ShDw36414 -21 -25160. -19800 1400 0
26 21 ShDw36485 -20 -23150 -18340 1393 0
26 21_ShDw36567 -18 -21000 -16750 1361 0
26 21_ShDw36661 -16 -18530 -14710 1272 0
26 21_ShDw36756 -13 -15380 -12280 1215 0
26 21_ShDw36922 -15 -15620 -12510 1081 0
26 21_ShDw37087 -15 -15690 -12550 989 0
26 21 ShDw37253 -15 -15530 -12450 929 0
0 -1061 -30047 -21955 -760 0
0 -1063 -31867 -23495 -809 0
0 -1042 -31866 -23556 -810 0
0 -1022 -31886 -23627 -812 0
0 -972 -31923 -23798 -816 0
0 -902 -31988 -24037 -822 0
0 -751 -32131 -24556 -834 0
0 -597 -32276 -25083 -847 0
0 -443 -32422 -25610 -860 0
0 -237 -32616 -26317 -878 0
0 -32 -32810 -27020 -895 0
0 -31 -32310 -26570 -880 0
0 -30 -31800 -26130 -866 0
0 -30 -31260 -25670 -851 0
0 -29 -30710 -25210 -836 0
0 -28 -29670 -24290 -806 0
0 -27 -28670 -23430 -779 0
0 -26 -27730 -22610 -752 0
0 -25 -26710 -21710 -724 0
0 -24 -25590 -20730 -692 0
0 -22 -24480 -19740 -660 0
0 -21 -23360 -18860 -633 0
0 -20 -21480 -17400 -586 0
0 -18 -19410 -15790 -530 0
0 -16 -16950 -13650 -460 0
0 -13 -14030 -11280 -386 0
0 -15 -14980 -12280 -417 0
0 -15 -15230 -12540 -426 0
0 -15 -15130 -12520 -425 0
532
556
556
556
556
556
556
556
556
556
556
554
551
548
545
537
530
522
512
501
488
473
447
417
382
348
332
324
319
1035
1035
1014
994
944
874
722
567
413
206
0
0
0
0
0
0
0
0
0
0
0
0
0
0
0
0
0
0
0
File No.: 0900530.306 Page C-19 of C-40Revision: 0
F0306-01 RO
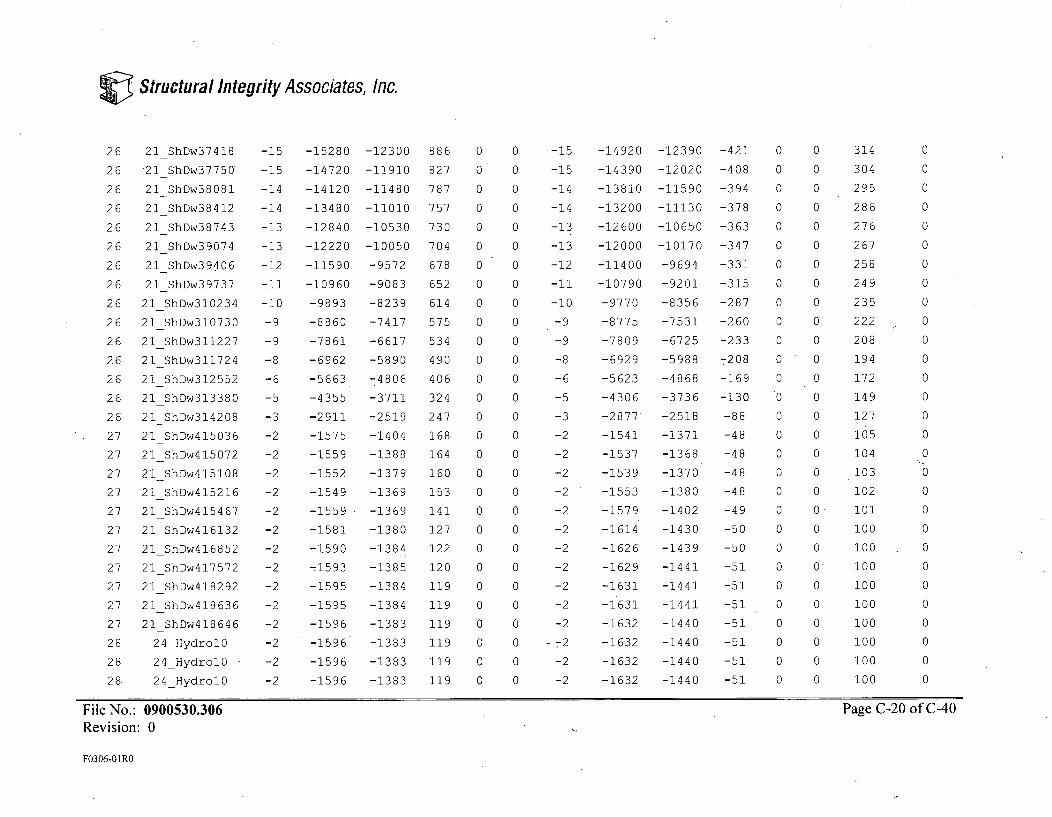
C Structural Integrity Associates, Inc.
26 21_ShDw37418 -15
26 '21_ShDw37750 -15
26 21_ShDw38081 -14
26 21_ShDw38412 -14
26 21_ShDw38743 -13
26 21 ShDw39074 -13
26 21_ShDw39406 -12
26 21_ShDw39737 -11
26 21_ShDw310234 -10
26 21_ShDw310730 -9
26 21 ShDw311227 -9
26 21_ShDw311724 -8
26 21_ShDw312552 -6
26 21_ShDw313380 -5
26 21_ShDw314208 -3
27 21_ShDw415036 -2
27 21 ShDw415072 -2
27 21_ShDw415108 -2
27 21_ShDw415216 -2
27 21_ShDw415467 -2
27 21_ShDw416132 -2
27 21_ShDw416852 -2
27 21 ShDw417572 -2
27 21_ShDw418292 -2
27 21_ShDw418636 -2
27 21_ShDw418646 -2
28 24 HydrolO -2
28 24 HydrolO -2
28 24_Hydrol0 -2
-15280 -12300 886 0 0
-14720 -11910 827 0 0
-14120 -11480 787 0 0
-13480 -11010 757 0 0
-12840 -10530 730 0 0
-12220 -10050 704 0 0
-11590 -9572 678 0 0
-10960 -9083 652 0 0
-9893 -8239 614 0 0
-8860 -7417 575 0 0
-7861 -6617 534 0 0
-6962 -5890 490 0 0
-5663 -4806 406 0 0
-4355 -3711 324 0 0
-2911 -2519 247 0 0
-1575 -1404 168 0 0
-1559 -1388 164 0 0
-1552 -1379 160 0 0
-1549 -1369 153 0 0
-1559 -1369 141 0 0
-1581 -1380 127 0 0
-1590 -1384 122 0 0
.1593 -1385 120 0 0
-1595 -1384 119 0 0
-1595 -1384 119 0 0
-1596 -1383 119 0 0
-1596 -1383 119 0 0
-1596 -1383 119 0 0
-1596 -1383 119 0 0
-15
-15
-14
-14
-13
-13
-12
-11
-10
-9
-9
-8
-6
-5
-3
-2
-2
-2
-2
-2
-2
-2
-2
-2
-2
-2
-2
-2
-2
-14920 -12390 -421
-14390 -12020 -408
-13810 -11590 -394
-13200 -11130 -378
-12600 -10650 -363
-12000 -10170 -347
-11400 -9694 -331
-10790 -9201 -315
-9770 -8356 -287
-8775 -7531 -260
-7809 -6725 -233
-6929 -5988 - 2 0 8
-5623 -4868 -169
-4306 -3736 -130
-2877 -2518 -88
-1541 -1371 -48
-1537 -1368 -48
-1539 -1370 -48
-1553 -1380 -48
-1579 -1402 -49
-1614 -1430 -50
-1626 -1439 -50
-1629 -1441 -51
-1631 -1441 -51
-1631 -1441 -51
-1632 -1440 -51
-1632 -1440 -51
-1632 -1440 -51
-1632 -1440 -51
314
304
295
286
276
267
258
249
235
222
208
194
172
149
127
105
104
103
102
101
100
100
100
100
100
100
100
100
100
File No.: 0900530.306 Page C-20 of C-40Revision: 0
F0306-O1RO
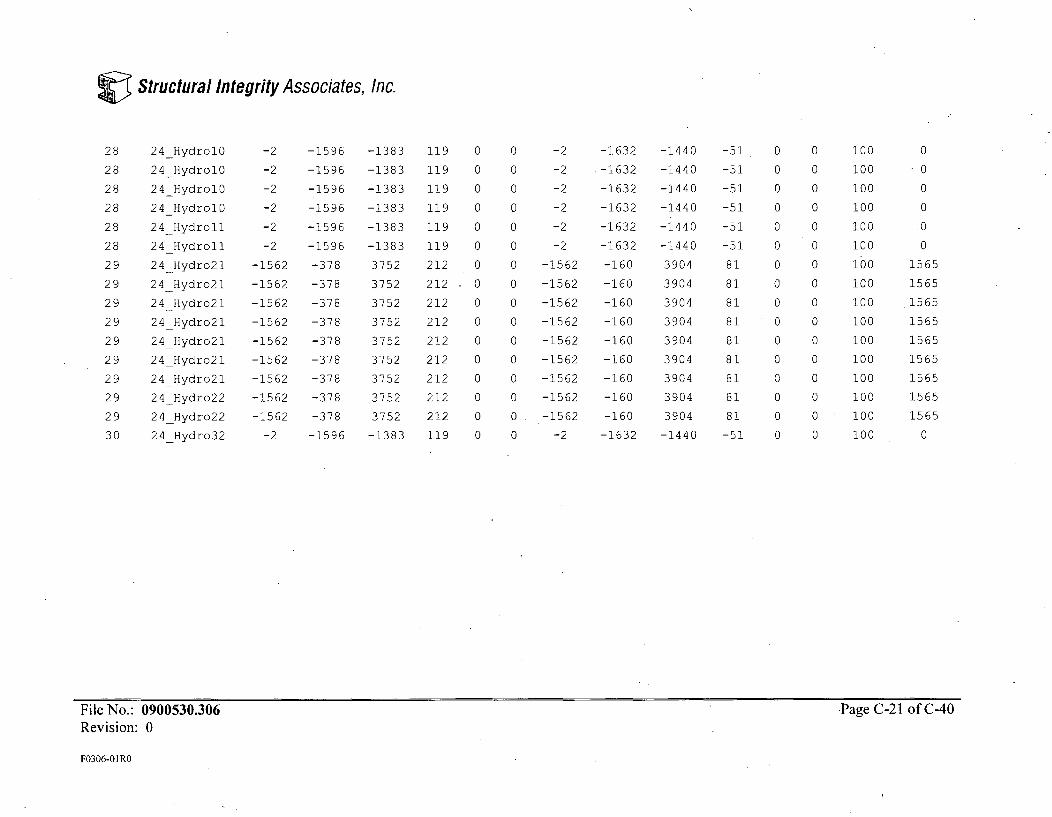
Structural Integrity Associates, Inc.
28 24_HydrolO -2 -1596 -1383 119 0 0 -2 -1632 -1440 -51 0 0 100 0
28 24 -HydrolO -2 -1596 -1383 119 0 0 -2 -1632 -1440 -51 0 0 100 0
28 24-HydrolO -2 -1596 -1383 119 0 0 -2 -1632 -1440 -51 0 0 100 0
28 24_HydrolO -2 -1596 -1383 119 0 0 -2 -1632 -1440 -51 0 0 100 0
28 24_Hydroll -2 -1596 -1383 119 0 0 -2 -1632 -1440 -51 0 0 100 .0
28 24 Hydroll -2 -1596 -1383 119 0 0 -2 -1632 -1440 -51 0 0 100 0
29 24 _Hydro2l -1562 -378 3752 212 0 0 -1562 -160 3904 81 0 0 I00 1565
29 24 Hydro2l -1562 -378 3752 212 0 0 -1562 -160 3904 81 0 0 100 1565
29 24 Hydro2l -1562 -378 3752 212 0 0 -1562 -160 3904 81 0 0 100 1565
29 24_Hydro2l -1562 -378 3752 212 0 0 -1562 -160 3904 81 0 0 100 1565
29 24_Hydro2l -1562 -378 3752 212 0 0 -1562 -160 3904 81 0 0 100 1565
29 24_Hydro2l -1562 -378 3752 212 0 0 -1562 -160 3904 81 0 0 100 1565
29 24 Hydro2l -1562 -378 3752 212 0 0 -1562 -160 3904 81 0 0 100 1565
29 24_Hydro22 -1562 -378 3752 212 0 0 -1562 -160 3904 81 0 0 100 1565
29 24_Hydro22 -1562 -378 3752 212 0 0 -1562 -160 3904 81 0 0 100 1565
30 24_Hydro32 -2 -1596 -1383 119 0 0 -2 -1632 -1440 -51 0 0 100 0
File No.: 0900530.306 Page C-21 of C-40Revision: 0
F0306-O1 RO
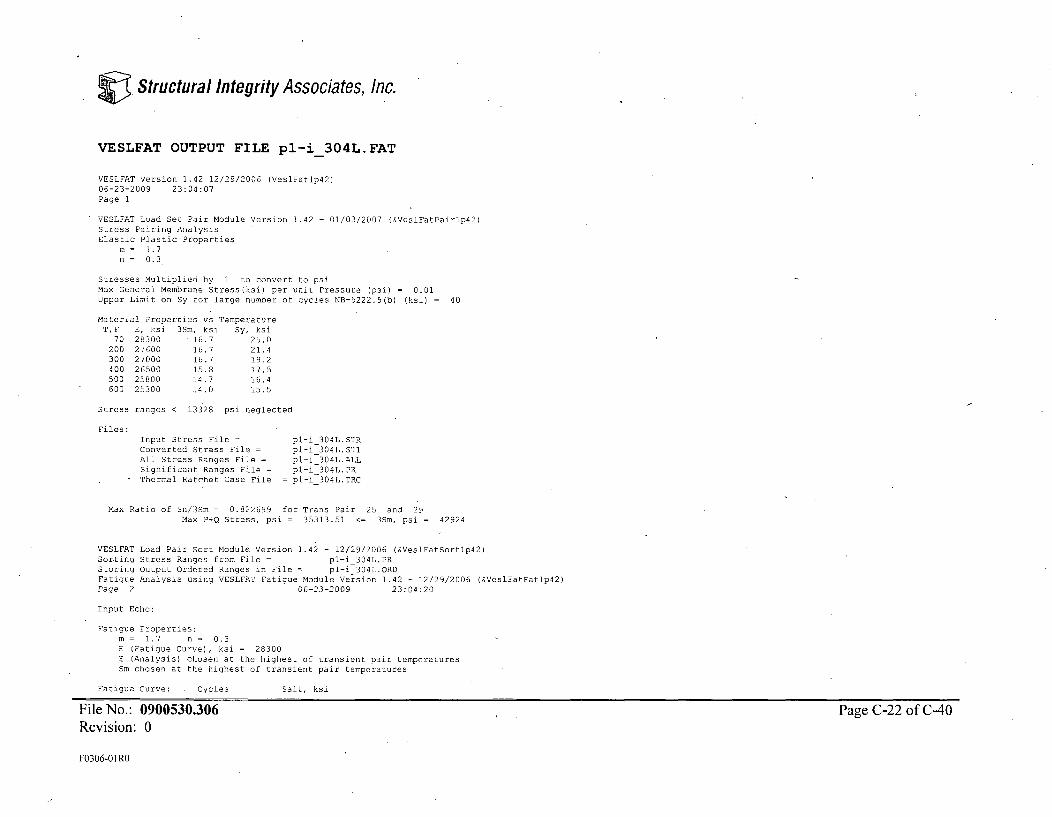
Structural Integrity Associates, Inc.
VESLFAT OUTPUT FILE pl-i_304L.FAT
VESLFAT Version 1.42 12/29/2006 (VeslFatlp42)06-23-2009 23:04:07Page 1
VESLFAT Load Set Pair Module Version 1.42 - 01/03/2007 (&VeslFatPairlp42)Stress Pairing AnalysisElastic Plastic Properties
m= 1.7n= 0.3
Stresses Multiplied by 1 to convert to psiMax General Membrane Stress(ksi) per unit Pressure (psi) = 0.01Upper Limit on Sy for large number of cycles NB-5222.5(b) (ksi) 40
Material Properties vs TemperatureT,F E, ksi 3Sm, ksi Sy, ksi
70 28300 16.7 25.0200 27600 16.7 21.4300 27000 16.7 19.2400 26500 15.8 17.5500 25800 14.7 16.4600 25300 14.0 15.5
Stress ranges < 13328 psi neglected
Files:Input Stress File = pl-i 304L.STRConverted Stress File = pl-i 304L.STIAll Stress Ranges File pl-i 304L.ALLSignificant Ranges File = pl-i_304L.PRThermal Ratchet Case File = pl-i 304L.TRC
Max Ratio of Sn/3Sm = 0.822699 for Trans Pair 25 and 29Max P+Q Stress, psi = 35313.51 <= 3Sm, psi = 42924
VESLPAT Load Pair Sort Module Version 1.42 - 12/29/2006 (&VeslFatSortlp42)Sorting Stress Ranges from File = pl-i_304L.PRStoring Output Ordered Ranges in File = pl-i 304L.ORDFatigue Analysis using VESLFAT Fatigue Module Version 1.42 - 12/29/2006 (&VeslFatFatlp42)Page 2 06-23-2009 23:04:20
Input Echo:
Fatigue Properties:m= 1.7 n= 0.3E (Fatigue Curve), ksi = 28300E (Analysis) chosen at the highest of transient pair temperaturesSm chosen at the highest of transient pair temperatures
Fatigue Curve: Cycles Salt, ksi
File No.: 0900530.306 Page C-22 of C-40Revision: 0
F0306-01 RO
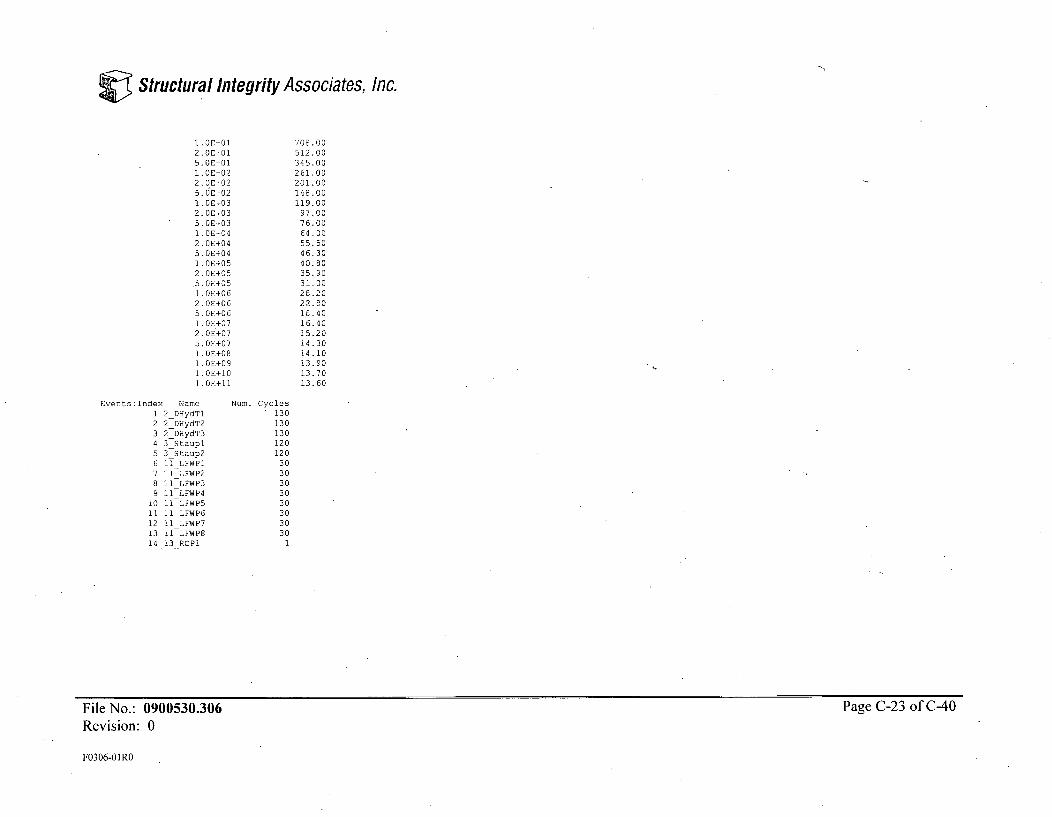
Structural Integrity Associates, Inc.
1.0E+012. OE+015. 0E+011. OE+022. 0E+025. OE+021. OE+032. OE+035. 0E+031. OE+042. OE+045. 0E+041. 0E+052. OE+05.5. 0E+051. 0E+062. 0E+065. 0E+061. 0E+072. 0E+075. OE+071. OE+081. OE+091. 0E+101. OE-+
Name Num.DHydTl
_DHydT2_DHydT3StauplStaup2
1LFWP1I--LFWP21 LFWP31 LFWP4I LFWP51 LFWP61_LFWP71_LFWP83 ROPI
708.00512.00345.00261.00201.00148.00119.0097.0076.0064 . 0055.5046.3040.8035.9031.0028.2022.8018.4016.4015.2014.3014.1013.9013.7013.60
I
Events: Index1 22 23 24 35 36 i17 18 19 1
10 111 I112 113 1I14 1:
1I1I11113
Cycles130130130120120
3030303030303030
1
File No.: 0900530.306 Page C-23 of C-40Revision: 0
F0306-OIRO
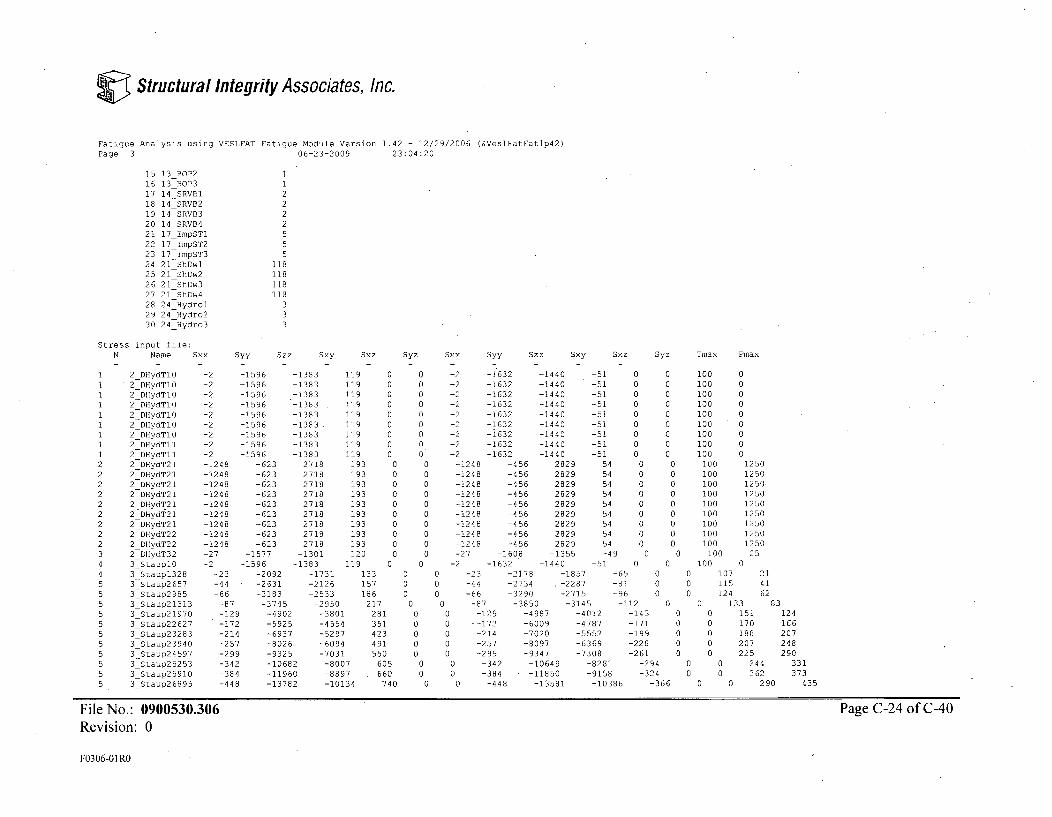
Structural Integrity Associates, Inc.
Fatigue Analysis using VESLFAT Fatigue Module Version 1.42 - 12/29/2006 (&VeslFatFatlp42)Page 3 06-23-2009 23:04:20
15 13_ROP2 116 13_ROP3 117 14 _SRVB 218 14 _SRVB2 219 14-SRVB3 220 140SRVB4 221 17_lImpSTl 522 17_ImpST2 523 17ImpST3 524 21_ShDwl 1082521 ShDw2 11826 21_ShDw3 11827 21_ShDw4 11828 24NHydrol 329 24 Hydro2 330 24Hydro3 3
Stress input file:N Name Sxx Syy Szz Sxy Sxz Syz Sxx Syy Szz Sxy Sxz Syz Tmax Pmax
1 2_DHydTlO -2 -1596 -1383 119 0 0 -2 -1632 -1440 -51 0 0 100 01 2_DHydT1O -2 -1596 -1383 119 0 0 -2 -1632 -1440 -51 0 0 100 01 2DHydTlO -2 -1596 .- 1383 119 0 0 -2 -1632 -1440 -51 0 0 100 01 2_DHydTlO -2 -1596 -1383 119 0 0 -2 -1632 -1440 -51 0 0 100 01 2DHydTIO -2 -1596 -1383 119 0 0 -2 -1632 -1440 -51 0 0 100 01 2_DHydTlO -2 -1596 -1383 119 0 0 -2 -1632 -1440 -51 0 0 100 01 2_DHydTlO -2 -1596 -1383 119 0 0 -2 -1632 -1440 -51 0 0 100 01 2_DHydTll -2 -1596 -1383 119 0 0. -2 -1632 -1440 -51 0 0 100 01 2_DHydTIl -2 -1596 -1383 119 0 0 -2 -1632 -1440 -51 0 0 100 02 2_DHydT21 -1248 -623 2718 193 0 0 -1248 -456 2829 54 0 0 100 12502 2_DHydT21 -1248 -623 2718 193 0 0 -1248 -456 2829 54 0 0 100 12502 2_DHydT21 -1248 -623 2718 193 0 0 -1248 -456 2829 54 0 0 100 12502 2DHydT21 -1248 -623 2718 193 0 0 -1248 -456 2829 54 0 0 100 12502 2 DHydT21 -1248 -623 2718 193 0 0 -1248 -456 2829 54 0 0 100 12502 2 DHydT21 -1248 -623 2718 193 0 0 -1248 -456 2829 54 0 0 100 12502 2DHydT21 -1248 -623 2718 193 0 0 -1248 -456 2829 54 0 0 100 12502 2DHydT22 -1248 -623 2718 193 0 0 -1248 -456 2829 54 0 0 100 12502 2DHydT22 -1248 -623 2718 193 0 0 -1248 -456 2829 54 0 0 100 12503 2 DHydT32 -27 -1577 -1301 120 0 0 -27 -1608 -1355 -49 0 0 100 254 3StauplO -2 -1596 -1383 119 0 0 -2 -1632 -1440 -51 0 0 100 04 3_Staup1328 -23 -2092 -1731 133 0 0 -23 -2178 -1857 -65 0 0 107 215 35Staup2657 -44 -2631 -2126 157 0 0 -44 -2734 ,-2287 -81 0 0 115 415 35Staup2985 -66 -3183 -2533 186 0 0 -66 -3290 -2715 -96 0 0 124 625 3Staup21313 -87 -3745 -2950 217 0 0 -87 -3850 -3145 -112 0 0 133 835 39Staup21970 -129 -4902 -3801 281 0 0 -129 -4987 -4012 -143 0 0 151 1245 3_Staup22627 -172 -5925 -4554 351 0 0 -- 172 -6009 -4787 -171 0 0 170 1665 3_Staup23283 -214 -6937 -5297 423 0 0 -214 -7020 -5552 -199 0 0 188 2075 3_Staup23940 -257 -8026 -6094 491 0 0 -257 -8097 -6369 -228 0 0 207 2485 3_Staup24597 -299 -9325 -7031 550 0 0 -299 -9347 -7308 -261 0 0 225 2905 3_Staup25253 -342 -10682 -8007 605 0 0 -342 -10649 -8281 -294 0 0 244 3315 3_Staup25910 -384 -11960 -8897 660 0 0 -384 -11850 -9158 -324 0 0 262 3735 3Staup26895 -448 -13782 -10134 740 0 0 -448 -13581 -10386 -366 0 0 290 435
File No.: 0900530.306 Page C-24 of C-40Revision: 0
F0306-O1RO
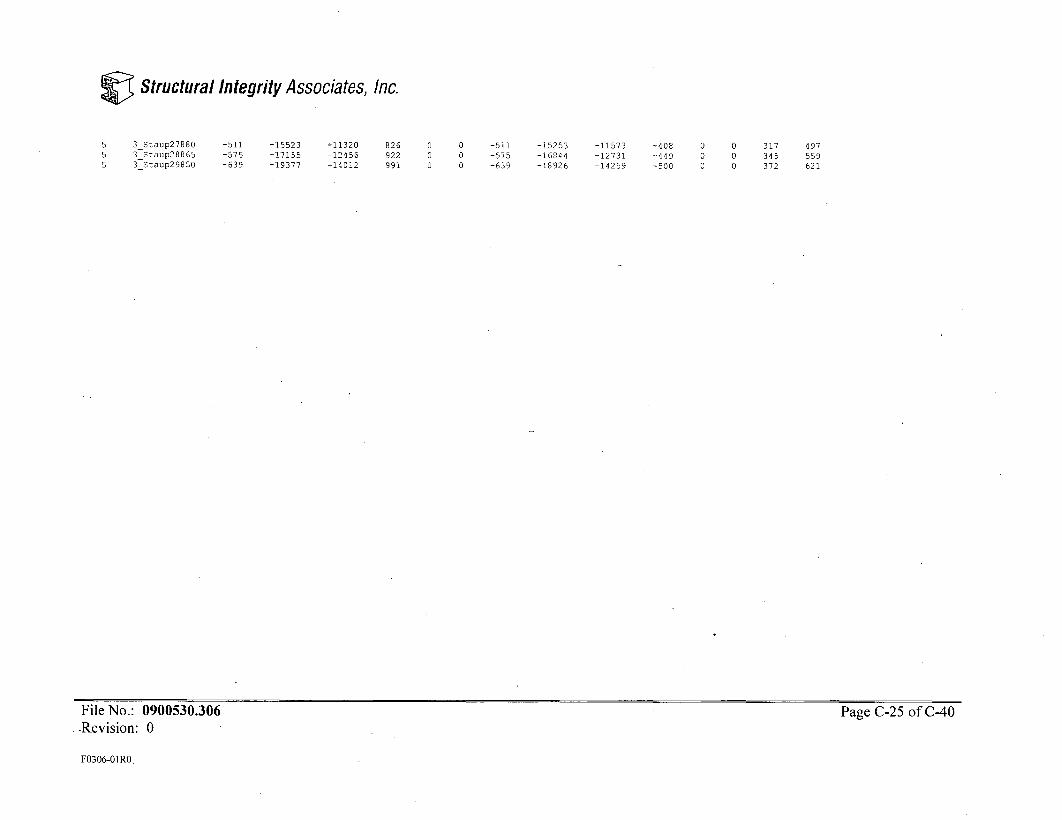
Structural Integrity Associates, Inc.
5 3Staup27880 -511 -15523 -11320 826 0 0 -511 -15253 -11573 -408 0 0 317 4975 3_Staup28865 -575 -17155 -12456 922 0 0 -575 -16844 -12731 -449 0 0 345 5595 3Staup29850 -639 -19377 -14012 991 0 0 -639 -18926 -14259 -500 0 0 372 621
File No.: 0900530.306-Revision: 0
Page C-25 of C-40
F0306-01 RO
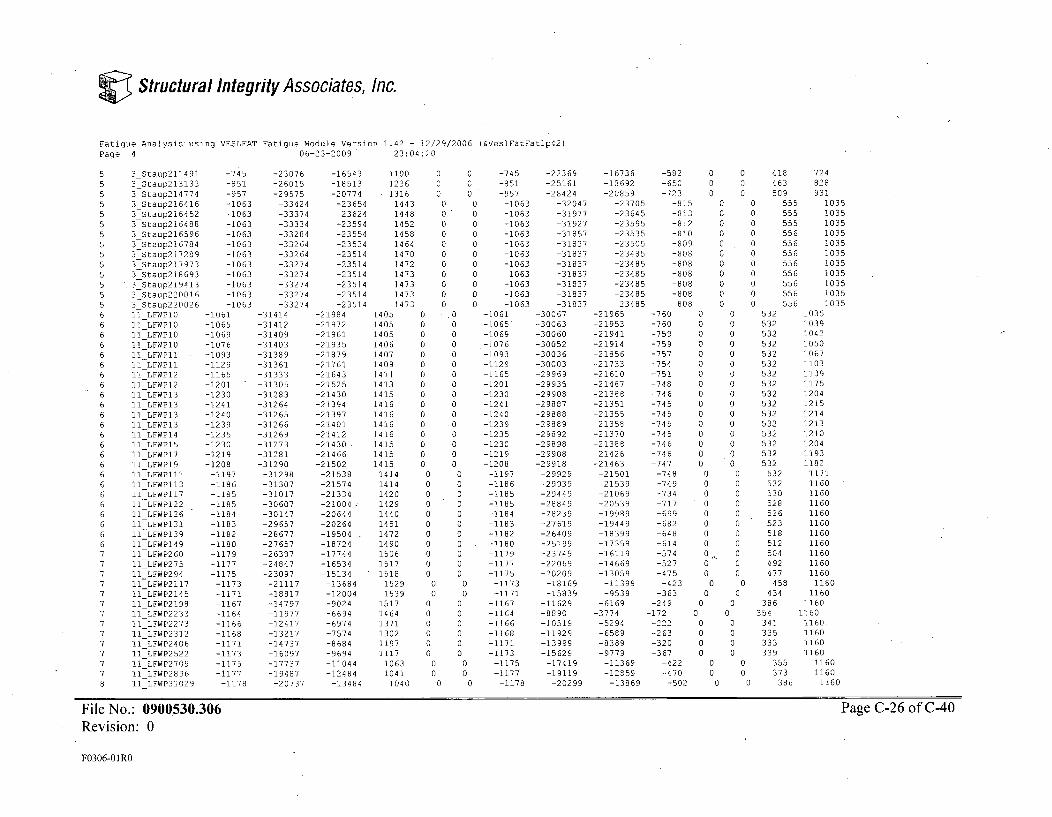
Structural Integrity Associates, Inc.
Fatigue Analysis using VESLFAT Fatigue Module Version 1.42 - 12/29/2006 (&VeslFatFatlp42)Page 4 06-23-2009 23:04:20
5 3_Staup2114915 3_Staup2131335 3_Staup2147745 3_Staup2164165 3Staup2164525 3Staup2164885 38taup2165965 3_Staup2167845 3Staup2172895 3Staup2179735 3_Staup2186935 3_Staup2194135 3Staup2200165 3_Staup2200266 I LFWPIO6 11 LFWPIO6 11 LFWP106 11 LFWPIO6 11 LFWP1I6 11 LFWPlI6 11-LFWP126 11 LFWP126 11 LFWP1I36 1i LFWPI36 11 LFWP136 11 LFWPI36 11 LFWP146 T1-LFWP156 11 LFWPO76 11 LFWPl96 11 LFWP1116 T1-LFWP1I36 11LFWP1176 11 LFWP1226 11-LFWP1266 11 LFWP1316 11 LFWPI396 11 LFWP1497 11-LFWP2607 11 LFWP2757 11 LFWP2947 11 LFWP21177 11 LFWP21457 11 LFWP21987 11L-LFWP22337 11 LFWP22737 11 LFWP23127 11 LFWP24067 11 LFWP25227 11LLFWP27097 11 LFWP28968 1lOLFWP31029
-745 -23076 -16543 1100 0 0 -745 -22369 -16736 -582 0 0 418 724-851 -26015 -18513 0236 0 0 -851 -25161 -18692 -650 0 0 463 828
-957 -29575 -20774 1316 0 0 -957 -28424 -20859 -723 0 0 509 931-1063 -33424 -23654 1443 0 0 -1063 -32047 -23705 -815 0 0 555 1035
-1063 -33374 -23624 1448 0 0 -1063 -31977 -23645 -813 0 0 555 1035
-1063 -33334 -23594 1452 0 0 -1063 -31927 -23595 -812 0 0 555 1035-1063 -33284 -23554 1458 0 0 -1063 -31857 -23535 -810 0 0 556 1035
-1063 -33264 -23534 1464 0 0 -1063 -31837 -23505 -809 0 0 556 1035-1063 -33264 -23514 1470 0 0 -1063 -31837 -23485 -808 0 0 556 1035-1063 -33274 -23514 1472 0 0 -1063 -31837 -23485 -808 0 0 556 1035
-1063 -33274 -23514 1473 0 0 -1063 -31837 -23485 -808 0 0 556 1035
-1063 -33274 -23514 1473 0 0 -1063 -31837 -23485 -808 0 0 556 1035
-1063 -33274 -23514 1473 0 0 -1063 -31837 -23485 -808 0 0 556 1035-1063 -33274 -23514 1473 0 0 -1063 -31837 -23485 -808 0 0 556 1035
-1061-1065-1069-1076-1093-1129-1165-1201-1230-1241-1240-1239-1235-1230-1219-1208
-1197-1186-1185-1185-1184-1183-1182-1180-1179-1177-1175-1173-1171-1167-1164-1166-1168-1171-1173-1175-1177
-1178
-31414-31412-31409-31403-31389-31361-31333-31305-31283-31264-31265-31266-31269-31273-31281-31290
-31298-31307-31017-30607-30147-29657-28677-27657-26387-24847-23097
-21117-18817-14797-11977-12417-13217-14737-16097-17737-19487
-20737
-21984 1405-21972 1405-21961 1405-21935 1406-21879 1407-21761 1409-21643 1411-21525 1413-21430 1415-21394 1416-21397 1416-21401 1416-21412 1416-21430 1415-21466 1415-21502 1415
-21538 1414-21574 1414-21334 1420-21004 1429-20644 1440-20264 1451-19504 . 1472-18724 1490-17744 1506-16534 1517-15134 1518
-13684 1529-12004 1539-9024 1517-6694 1464-6974 1371-7574 1302-8684 1197-9694 1117-11044 1063-12484 1041
-13484 1040
00000000000000000000000000000
000000
0
0000000000000000
00000000000
00
000000
0
-1061-1065*-1069-1076
-1093-1129-1165-1201-1230-1241-1240-1239-1235-1230-1219-1208
-1197-1186-1185-1185-1184-1183-1182-1180-1179-1177-1175
-1173-1171
-1167-1164-1166-1168-1171-1173
-1175-1177
-1178
-30067-30063-30060-30052-30036-30003-29969-29935-29908-29887-29888-29889-29892-29898-29908-29918
-29929-29939-29449-28849-28239-27619-26409-25199-23749-22069-20209
-18169-15839
-11629
-21965-21953-21941-21914-21856-21733-21610-21487-21388-21351-21355-21358-21370-21388-21426-21463
-21501-21539-21069-20539-19989-19449-18399-17359-16119-14669-13059
-11399-9539
-6169
-760-760-759-759-757-754-751-748-746-745-745-745-745-746-746-747
-748-749-734.-717-699-682-648-614-574-527-475
-423-363
-249
0000000000000000
000
'00000O000
00
0
0 5320 5320 5320 5320 5320 5320 5320 5320 5320 5320 5320 5320 5320 5320 5320 532
0 5320 5320 5300 5280 5260 5230 5180 5120 5040 4920 477
0 4580 434
0 386
1035103910421050106711031139117512041215121412131210120411931182
11711160116011601160116011601160116011601160
11601160
1160
-8890 -3774 -172 0 0 354 1160-10519 -5294 -222 0 0 341 1160.-11929 -6589 -263 0 0 335 1160-13999 -8369 -320 0 0 333 1160-15629 -9779 -367 0 0 339 1160
-17419 -11369 -422 0 0 355 1160-19119 -12859 -470 0 0 373 1160
-20299 -13869 -502 0 0 386 11600 0
0 0
File No.: 0900530.306Revision: 0
Page C-26 of C-40
F0306-OIRO

Structural Integrity Associates, Inc.
Fatigue Analysis using VESLFAT Fatigue Module Version 1.42 - 12/29/2006 (&VeslFatFatlp42)Page 5 06-23-2009 23:04:20
11 LFWP311081I-LFWP3118811 LFWP3126711 LFWP31346IILFWP3146511-LFWP3158411 LFWP3170211 LFWP3182111 LFWP3201911 LFWP3221311 LFWP3221711 LFWP3222011 LFWP3222411 LFWP3222711 LFWP3223511 LFWP4224211LFWP4225011 LFWP4225911 LFWP4227111 LFWP4 228611 LFWP4230511 LFWP4234211 LFWP4238311LFWP4239311 LFWP4248111 LFWP4256811-LFWP4267511LFWP4280811_LFWP4307211 LFWP4333711 LFWP4360211 LFWP4377711 LFWP4395211 LFWP4412711LFWP4430211 LFWP4456511 LFWP5482811 LFWP5509111 LFWP5535411 LFWP5579211 LFWP5623011 LFWP5666811 LFWP5677311 LFWP5678111 LFWP5679011 LFWP5679811 LFWP5680711 LFWP5682311 LFWP6684011 LFWP6685711 LFWP6687711 LFWP66900
-1178-1179-1180-1180-1181-1182-1182-1183-1184-1185-1180-1174-1168-1163-1151-1140-1128-1114-1095-1073-1045-991-930-915-924-931-938-947-963-979-995-1006-1016-1027-1037-1053
-1069-1084-1100-1126-1152-1178-1185-1175-1165-1155-1145-1126-1107-1087-1065-1039
-21487-22217-22777-23277-24027-24767-25507-26387-27917-29477-29251-28915-28519-28303
* -27240-26378-25487-24417-23130-21596-19797
-16546-13031-12132-12958-14044-14969-15683-16611-17380-18408-19120-19842-20575-21317-22275
-23023-23762-24510-25871-27391-28952-29387-29074-28661-28229-27786-26950-26184-25439-24625-23695
-14084-14664-15094-15514-16124-16734-17324-17974-19054-20154-19980-19717-19423-19110-18472-17855-17230-16485-15580-14519-13264
-11050-8368-7674-8208-8951-9561-10077-10837-11468-12268
-12805-13342-13880-14417-15097
-15648-16199-16740-17696-18686-19694-20034-19804-19514-19205-18885-18285-17766-17276-16736-16120
104210461057107711091143117812011229125412591268127912901316133913621385140714261442
145413991387124211441066
1013976982994
10041016102910431069
1107114611861236126812961310131813281339134813611373138213901395
000000000000000000000
0O00000
000O0
00000
0000000000000000
00000000000
00000000000
000000000000
000000000000000000
-1178-1179-1180-1180-1181-1182-1182-1183-1184-1185-1180-1174-1168-1163-1151-1140-1128-1114-1095-1073-1045
-991-930-915-924-931-938
-947-963-979-995
-1006-1016-1027-1037-1053
-1069-1084-1100-1126-1152-1178-1185-1175-1165-1155-1145-1126-1107-1087-1065-1039
-20999-21659-22199-22689-23419-24139-24859-25659-27059-28499-28074-27548-26993-26428-25317-24277-23217-21979-20525-18855-16939
-13587-9861-8971-11519-13205-14409
-15242-16258-17023-17999
-18670-19340-20021-20712-21588
-22313-23029-23755-25032-26418-27845-28249-27758-27206-26655-26124-25151-24308-23516-22666-21730
-14469 -521 0 0 394 1160-15019 -539 0 0 402 1160-15449 -553 0 0 410 1160-15869 -567 0 0 418 1160-16489 -588 0 0 430 1160-17109 -609 0 0 442 1160-17709 -629 0 0 454 1160-18339 -648 0 0 466 1160-19379 -682 0 0 486 1160-20449 -716 0 0 506 1160-20066 -704 0 0 505 1155-19593 -688 0 0 503 1150-19100 -672 0 0 502 1145-18617 -656 0 0 500 1140-17671 -625 0 0 495 1130-16805 -597 0 0 491 1120-15952 -569 0 0 485 1109-14958 -536 0 0 478 1096-13805 -498 0 0 468 1079-12497 -455 0 0 455 1058-11005 -406 0 0 439 1032
-8479 -321 0 0 405 981-5416 -219 0 0 365 924-4681 -195 0 0 356 910
-7035 -271 0 0 334 915-8498 -316 0 0 327 920-9467 -349 0 0 326 926
-10172 -374 0 0 329 934-11060 -405 0 0 339 949-11728 -429 0 0 351 964-12537 -454 0 0 363 979
-13063 -471 0 0 371 989-13588 -488 0 0 379 999-14114 -505 0 0 387 1009-14640 -522 0 0 395 1019-15299 -544 0 0 407 1034
-15858 -563 0 0 419 1049-16406 -582 0 0 431 1064-16955 -601 0 0 443 1079-17890 -632 0 0 463 1104-18835 -663 0 0 483 1129-19819 -695 0 0 503 1154-20149 -706 0 0 508 1160-19720 -692 0 0 507 1151-19251 -676 0 0 505 1142-18803 -661 0 0 502 1132-18364 -647 0 0 500 1123-17577 -621 0 0 494 1105-16920 -599 0 0 488 1086-16323 -579 0 0 482 1068-15696 -559 0 0 474 1047-15013 -536 0 0 464 1021
File No.: 0900530.306 Page C-27 of C-40Revision: 0
F0306-01RO

Structural Integrity Associates, Inc.
Fatigue Analysis using VESLFAT Fatigue Module Version 1.42.- 12/29/2006 (&VeslFatFatlp42)Page 6 06-23-2009 23:04:20
11_LFWP6692711_LFWP6695911LFWP6701511 -LFWP6708311 LFWP6716611 LFWP6719311 LFWP6719911 LFWP6720511 LFWP6722311 LFWP6725311 LFWP6731311 LFWP6717311 LFWP6743311 LFWP6749311 LFWP6756511 LFWP6763711 -LFWP6778711 LFWP6790211 -LFWP6806511 LFWP6822711 LFWP6839011-LFWP6855311 LFWP6871611 LFWP6887911 LFWP6903211 LFWP6924811 LFWP6946411-LFWP6968011-LFWP6989611--LFWP71025611 LFWP71061611 LFWP71097611-LFWP71109311 LFWP71119811 LFWP71130311 LFWP71140611 LFWP'71151311 LFWP71172411 LFWP71193411 LFWP71214411 LFWP71235411 LFWP71256511 LFWP71277511-LFWP71298511 LFWP71330011 LFWP71361611 LFWP71393111 LFWP71424711 LFWP71477211 LFWP71529811 LFWP71582311 LFWP736349
-1008,-973-909-832-739-709-709-709-710-711-711-712-712-713-704-695-676-662-641-621-601-580-560-539-520-493-466-439-412
-367-322-276-262-278-294-310-326-358-390-422-454-486-518-550-598-646-694-742-822-903-983
-22638-21455-19583-17332-14022-13125-13085-13105-13275-13585-14055-14345-14525-14625-14852-15049-15374-15596-15892-16188-16474-16761-17047-17333-17628-18170-18731-19293-19864
-20820-21806-22652-22873-23041-23218-23386-23564-23909-24244-24589-24935-25210-25655-26080-26713-27356-27999-28642-29850-31098-32366
-15437-14671-13443-11769-9395-8823-8803-8823-8953-9143-9433-9613-9733-9823-10043-10244-10597-10845-11183-11491-11799-12098-12396-12684-12979-13469-13970-14480-14981
-15842-16703-17464-17683-17770-17868-17956-18054-18239-18425-18611-18797-18982-19178-19384-19697-20010-20324-20627-21347-22176-23015
1398139813781308
12571241123312231195115010831035998969
942923901893888891897907918930942953964974983999101410331042105210631073108411041125114611661187120312141230124612611276131413571399
0 00 00 00 0
0 00 00 00 00 00 00 00 0
0 00 0
0 00 00 00 00 00 00 00 00 00 00 00O 00 00 00 0
0 00 00 00 00 00 00 00 00 00 00 00 00 00 00 00 00 00 a0 a0 0
0 00 0
-1008 -20688-973 -19530-909 -17688-832 -15399
-739 -12364-709 -11542-709 -11612-109 -11732-710 -12102-711 -12632-711 -13362-712 -13772
-712 -14022-713 -14162
-704 -14450-695 -14679-676 -15037-662 -15271-641 -15580-621 -15870-601 -16159-580 -16449-560 -16739-539 -17028-520 -17317-493 -17833-466 -18359-439 -18894-412 -19430
-367 -20334-322 -21247-276 -22050-262 -22264-278 -22429-294 -22594-310 -22759-326 -22925-358 -23255-190 -23585-422 -23905-454 -24235-486 -24565-518 -24915-550 -25295-598 -25860-646 -26435-694 -27011-742 -27596-822 -28711-903 -29876-983 -31071
-14265 -510 0 0 453 991-13442 -483 0 0 439 957-12153 -435 0 0 414 895-10350 -374 0 0 383 820
-8057 -300 0 0 345 730-7509 -281 0 0 333 700-7600 -284 0 0 331 700-7720 -288 0 0 329 700-8080 -298 0 0 326 700-8540 -312 0 0 322 700-9130 -331 0 0 317 700-9480 -343 0 0 314 700
-9700 -350 0 0 313 700-9830 -355 0 0 312 700
-10131 -365 0 0 313 691-10372 -374 0 0 314 682-10778 -387 0 .0 317 662-11048 -395 0 0 320 648-11399 -407 0 0 325 627-11730 -417 0 0 329 606-12051 -427 0 0 334 585-12352 -437 0 0 338 565-12663 -446 0 0 343 544-12954 -456 0 0 347 523-13261 -465 0 0 351 503-13755 -480 0 0 357 476-14250 -495 0 0 363 448-14754 -511 0 0 369 421-15258 -526 0 0 375 393
-16105 -552 0 0 385 347-16962 -578 0 0 395 301-17709 -601 0 0 405 255-17930 -608 0 0 409 240-18026 -611 0 0 412 256-18112 -615 0 0 415 272-18208 -619 0 0 417 288-18303 -622 0 0 420 304-18484 -629 0 0 426 335-18676 -636 0 0 432 367-18858 -644 0 0 438 399-19039 -651 0 0 444 431-19220 -658 0 0 450 463-19412 -665 0 0 455 494-19603 -672 0 0 461 526-19900 -682 0 0 470 574-20187 -693 0 0 479 622-20474 -704 0 0 488 669-20761 -714 0 0 496 717-21460 -738 0 0 511 796-22258 -766 0 0 526 876-23087 -794 0 0 540 955
-1063 -33424 -23654 1443 0 0 -1063 -32047 -23705 -815 0 0 555 1035
File No.: 0900530.306Revision: 0
Page C-28 of C-40
F0306-0IRO
Structural Integrity Associates, Inc.
Fatigue Analysis using VESLFAT Fatigue Module Version 1.42 - 12/29/2006 (&VeslFatFatlp42)Page 7 06-23-2009 23:04:20
11 LFWP7165491I-LFWP7T674911_LFWP71697311 LFWP71724211LFWP71793411 LFWP71878311 LFWP71968811 LFWP72168811 LFWP72368811 LFWP72568811 LFWP72634911 LFWP72634911 LFWP72634911 LFWP72634911LFWP72634911-LFWP72634911 LFWP72635011 LFWP72635011 LFW P726350,11 LFWP72635011 LFWP72655011-LFWP72675011 LFWP72695011 LFWP72715011 LFWP72756411 LFWP72809411 LFWP72942911 LFWP73142911 LFWP73342911 LFWP73542911 LFWP73635011 LFWP73635011-LFWP73635011 LFWP73635011 LFWP73635011 LFW273635011 LFWP73635111 LFWP73635111 LFWP73635111 LFWP73635111 LFWP736551.11 LFWP73675111 LFWP736951I1 LFWP73715111 LFWP73756531 LFWP73809611 LFWP73882011 LFWP74024411-LFWP74224411 LFWP74424411 LFWP84579811 LFWP846351
-1063 -33304 -23564-1063 -33264 -23534-1063 -33264 -23524-1063 -33264 -23534-1063 -33274 -23514-1063 -33274 -23514-1063 -33274 -23514-1063 -33274 -23514-1063 -33274 -23514-1063 -33274 -23514-1063 -33274 -23514-1063 -33274 -23514-1063 -33274 -23504-1063 -33274 -23514-1063 -33274 -23504-1063 -33254 -23494-1063 -33224 -23464-1063 -33194 -23434-1062 -33154 -23404-1062 -33144 -23394-1063 -32804 -23154-1063 -32844 -23174-1063 -32864 -23184-1063 -32864 -23194-1063 -32864 -23194-1063 -32864 -23194-1063 -32864 -23094-1063 -32864 -23194-1063 -32864 -23194-1063 -32864 -23194-1063 -32864 -23194-1063 -32864 -23194-1063 -32864 -23194-1063- -32864 -23194-1063 -32854 -23184-1062 -32814 -23144-1062 -32754 -23094-1061 -32674 -23024-3063 -32604 -22964-1061 -32564 -22934-1061 -31274 -21894-1061 -31364 -21934-1061 -31394 -21964-1061 -31404 -23974-1061 -31404 -21974-1061 -31404 -21974-1061 -31404 -21984-1061 -31394 -21984-1061 -31394 -21984-1061 -31394 -21984-1061 -31394 -21984-1061 -31394 -21984
1457 0 0 -1063 -31887 -23555 -810 0 0 556 10351464 0 0 -1063 -31837 -23515 -809 0 0 556 1035
1468 0 0 -1063 -31827 -23495 -808 0 0 556 10351470 0 0 -1063 -31837 -23485 -808 0 0 556 1035
1472 0 0 -1063 -31837 -23485 -808 0 0 556 10351473 0 0 -1063 -31837 -23485 -808 0 0 556 10351473 0 0 -1063 -31837 -23485 -808 0 0 556 10351473 0 0 -1063 -31837 -23485 -903 0 0 556 1035
1473 0 0 -1063 -31837 -23485 -808 0 0 556 10351473 0 0 -1063 -31837 -23485 -808 0 0 556 1035
1473 0 0 -1063 -31837 -23485 -808 0 0 556 10351473 0 0 -1063 -31837 -23485 -808 0 0 556 10351473 0 0 -1063 -31837 -23476 -808 0 0 556 10351473 0 0 -1063 -31827 -23476 -808 0 0 556 10351473 0 0 -1063 -31807 -23446 -807 0 0 556 1035
1473 0 0 -1063 -31727 -23366 -804 0 0 555 10351473 0 0 -1063 -31627 -23275 -801 0 0 555 1035
1474 0 0 -1063 -31517 -23165 -798 0 0 555 10351474 0 0 -1062 -31427 -23075 -795 0 0 555 10351474 0 0 -1062 -31387 -23035 -794 0 0 554 10351467 0 0 -1063 -31297 -23035 -793 0 0 549 10351457 0 0 -1063 -31407 -23125 -796 0 0 548 10351453 0 0 -1063 -31437 -23155 -797 0 0 548 10351451 0 0 -1063 -31447 -23155 -797 0 0 548 10351449 0 0 -1063 -31447 -23165 -798 0 0 548 10351448 0 0 -1063 -31447 -23165 -798 0 0 548 10351448 0 0 - -1063 -31447 -23165 -798 0 0 548 1035
1448 0 0 -1063 -31447 -23165 -798 0 0 548 10351448 0 0 -1063 -31447 -23165 -798 0 0 548 10351448 0 0 -1063 -31447 -23165 -798 0 0 548 1035
1448 0 0 -1063 -31447 -23165 -798 0 0 548 10351448 0 0 -1063 -31437 -23165 -798 0 0 548 10351448 0 0 -1063 -31437 -23165 -797 0 0 548 - 1035
1448 0 0 -1063 -31417 -23145 -797 0 0 548 1035"1448 0 0 -1063 -31357 -23085 -795 0 0 548 10351449 0 0 -1062 -31197 -22925 -790 0 0 547 10351449 0 0 -1062 -30987 -22715 -783 0 0 547 10351451 0 0 -1061 -30747 -22485 -776 0 0 546 10351452 0 0 -1061 -30547 -22285 -769 0 0 545 1035
1452 0 0 -1061 -30467 -22205 -767 0 0 545 10351443 0 0 -1061 -29757 -21685 -750 0 0 534 10351424 0 0 -1061 -29977 -21865 -756 0 0 532 10351416 0 0 -1061 -30037 -21925 -758 0 0 532 10351412 0 0 -1061 -30057 -21945 1759 0 0 532 10351408 0 0 -1061 -30057 -21955 -759 0 0 532 10351407 0 0 -1061 -30057 -21955 -760 0 0 532 10351406 0 0 -1061 -30057 -21955 -760 0 0 532 10351406 0 0 -1061 -30047 -21955 -760 0 0 532 10351406 0 0 -1061 -30047 -21955 -760 0 0 532 10351406 0 0 -1061 -30047 -21955 -760 0 0 532 10351406 0 0 -1061 -30047 -21955 -760 0 0 532 10351406 0 0 -1061 -30047 -21955 -760 0 0 532 1035
File No.: 0900530.306Revision: 0
Page C-29 of C-40
F0306-01 R0
Structural Integrity Associates, Inc.
Fatigue Analysis using VESLFAT Fatigue Module Version 1.42 - 12/29/2006 (&VeslFatFatlp42)Page 8 06-23-2009 23:04:20
13 11 LFWP846387 -1061 -31394 -21984 1406. 0 0 -1061 -30047 -21955 -760 0 0 532 103513 11_LFWP846423 -1061 -31394 -21984 1406 0 0 -1061 -30047 -21955 -760 0 0 532 103513 11 _LFWP846531 -1061 -31394 -21984 1406 0 0 -1061 -30047 -21955 -760 0 0 532 1035
13 11LFWP846855 -1061 -31394 -21984 1406 0 0 -1061 -30047 -21955 -760 0 0 532 103513 11 LFWP847575 -1061 -31394 -21984 1406 0 0 -1061 -30047 -21955 -760 0 0 532 103513 11-LFWP848295 -1061 -31394 -21984 1406 0 0 -1061 -30047 -21955 -760 0 0 532 1035
13 11 LFWP849015 -1061 -31394 -21984 1406 0 0 -1061 -30047 -21955 -760 0 0 532 103513 11 LFWP849735 -1061 -31394 -21984 1406 0 0 -1061 -30047 -21955 -760 0 0 532 103513 11 LFW2849951 -1061 -31394 -21984 1406 0 0 -1061 -30047 -21955 -760 0 0 532 103513 11 LFWP849961 -1061 -31394 -21984 1406 0 0 -1061 -30047 -21955 -760 0 0 532 103514 13 ROPl014 13 ROPIO14 13 ROPIO14 13-ROPIO14 13-ROPIO15 13 ROP2115 13 ROP2115 13 ROP2215 13 ROP2215 13-ROP2215 13-ROP2315 13 ROP2315 13 ROP2515 13 ROP2815 13 ROP21415 13-ROP22015 13 ROP226
15 13 ROP23215 13 ROP24015 13-ROP24915 13 ROP25715 13 ROP26615 13-ROP28215 13 ROP29915 13 ROP211715 13 ROP213915 13 ROP216415 13 ROP219315 13 ROP222515 13 ROP228015 13 ROP234315 13 ROP241315 13 ROP245215 13 ROP265215 13 ROP285215 13 ROP2105215 13 ROP2125215 13 ROP2173915 13 ROP2240415 13 ROP2323715 13 ROP2413815 13 ROP25053
-1061-1069-1076-1094-1131-1206-1281-1356-1414-1435-1426-1417-1391-1346
-1258-1169-1080-992-993-995-996-998-1000-1003
-1007-1010-1015-1020-1025-1035-1045-1057-1064-1063-1063
-1063-1063-1063-1063-1063-1063-1063
-31414 -21984-31409 -21960-31403 -21935-31389 -21877-31360 -21754-31301 -21508-31243 -21262-31185 -21016-31139 -20823-31122 -20754-31129 -20783-31126 -20812-31147 -20900-31182 -21046
-31251 -21338-31320 -21630-31390 . -21922
-31459 -22214-31498 -22239-31547 -22275-31596 -22310-31644 -22345
-31752 -22426-31860 -22497
-31968 -22577-32095 -22665-32232 -22772-32388 -22886-32564 -23018-32847 -23238-33169 -23484-33499 -23736-33604 -23784-33364 -23604-33284 -23544
-33264 -23524-33264 -23524-33274 -23514-33274 -23514-33274 -23514-33274 -23514-33274 -23514
14051406140614071409141414181423142614281427142614251423141814131,407
140214011400139913981397139713971397139813991402140614121420142414481459
1465146814711472147314731473
00000000000000
000
00000
00
00000000
00
000000
S 0
00000000000000000
00000
00
000000000
00
0000000
-1061 -30067 -21965 -760 0 0 532 1035-1069 -30060 -21940 -759 0 0 532 1043-1076 -30052 -21914 -759 0 0 532 1050-1094 -30036 -21854 -757 0 0 532 1068-1131 -30001 -21726 -754 0 0 532 1105-1206 -29930 -21470 -748 0 0 532 1180-1281 -29860 -21214 -741 0 0 532 1255-1356 -29789 -20958 -735 0 0 532 1330-1414 -29734 -20757 -730 0 0 532 1389-1435 -29714 -20685 -728 0 0 532 1410-1426 -29722 -20715 -729 0 0 532 1401-1417 -29721 -20746 -730 0 0 532 1392-1391 -29746 -- -20837 -732 0 0 532 1366-1346 -29788 -20989 -736 0 0 532 1321
-1258 -29871 -21293 -743 0 0 532 1232-1169 -29955 -21597 -751 0 0 532 1143-1080 -30039 -21891 -758 0 0 532 1054
-992 -30122 -22195 -766 0 0 532 965-993 -30181 -22250 -767 0 0 532 966-995 -30240 -22305 -769 0 0 532 968-996 -30308 -22360 -771 0 0 533 969-998 -30367 -22405 -772 0 0 533 971
-1000 -30495 -22506 -776 0 0 534 973-1003 -30602 -22596 -779 0 0 534 976
-1007 -30719 -22686 -782 0 0 535 979-1010 -30846 -22784 -785 0 0 536 983-1015 -30992 -22899 -789 0 0 538 987-1020 -31147 -23023 -793 0 0 539 992-1025 -31312 -23165 -797 0 0 541 997-1035 -31594 -23383 -805 0 0 544 1006-1045 -31904 -23638 -813 0 0 548 1017-1057 -32193 -23858 -820 0 0 552 1028-1064 -32287 -23915 -822 0 0 554 1035-1063 -31957 -23615 -813 0 0 555 1035-1063 -31857 -23535 -810 0 0 .556 1035
-1063 -31837 -23505 -809 0 0 556 1035-1063 -31837 -23495 -808 0 0 556 1035-1063 -31837 -23485 -808 0 0 556 1035-1063 -31837 -23485 -808 0 0 556 1035-1063 -31837 -23485 -808 0 0 556 1035-1063 -31837 -23485 -808 0 0 556 1035-1063 -31837 -23485 -808 0 0 556 1035
File No.: 0900530.306Revision: 0
Page C-30 of C-40
F0306-OIRO
Structural lntegrity Associates, Inc.
Fatigue Analysis using VESLFAT Fatigue Module Version 1.42 - 12/29/2006 (&VeslFatFatlp42)Page 9 06-23-2009
15 13 ROP25971 -1063 -33274 -2351415 139ROP27430 -1063 -33274 -2351415 13 ROP29941 -1063 -33274 -2351415 13 ROP210452 -1063 -33274 -2351415 13 ROP210452 -1063 -33274 -2351415 130RP210452 -1063 -33274 -2351415 13 ROP210452 -1063 -33274 -2351415 13 ROP210452 -1063 -33274 -2350415 13 ROP210452 -1063 -33254 -2349415 13 ROP210453 -1063 -33224 -2346415 13 ROP210453 -1063 -33194 -2343415 13 ROP210453 -1062 -33354 -2340415 13 ROP210453 -1062 -33144 -2339415 13 ROP210653 -1063 -32804 -2315415 13 ROP210853 -1063 -32844 -2317415 13 RO9211053 -1063 -32864 -2318415 13 ROP211253 -1063 -32864 -2319415 13 ROP211667 -1063 -32664 -2319415 13 ROP212197 -1063 -32864 -2319415 13 ROP212918 -1063 -32864 -2319415 13 ROP214339 -1063 -32864 -2319415 13 ROP216339 -1063 -32864 -2319415 13 ROP218339 -1063 -32864 -2319435 13-ROP219896 -1063 -32864 -2319415 13 ROP220453 -1063 -32864 -2319415 13 ROP220453 -1063 -32864 -23194
15 13 ROP220453 -1063 -32864 -2319415 13 ROP220453 -1063 -32864 -2319415 13 ROP220453 -1063 -32854 -2318415 13-ROP220453 -1062 -32814 -2314415 13 ROP220454 -1062 -32754 -2309415 13 ROP220454 -1061 -32674 -2302415 13 ROP220454 -1061 -32604 -2296415 13 ROP220454 -1061 -32564 -2293415 13 ROP220654 -1061 -31274 -2189415 13 R0P220854 -1061 -31364 -2193415 13 ROP221054 -1061 -31394 -2196415 13 ROP221254 -1061 -31404 -2197415 13 ROP221668 -1061 -31404 -2197415 13 ROP222199 -1061 -31404 -2197415 13 ROP222923 -1061 -31404 -2198415 13 ROP224347 -1061 -31394 -2198415 13 ROP226347 -1061 -31394 -2198416 13 ROP328347 -1061 -31394 -2198416 13 ROP329901 -1061 -31394 -2198416 13 ROP330454 -1061 -31394 -2198416 13 ROP330490 -1061 -31394 -2198416 13 ROP330526 -1061 -31394 -2198416 13 ROP330634 -1061 -31394 -2198416 13 ROP330958 -1061 -31394 -2198416 13 ROP331678 -1061 -31394 -2198416 13 ROP332398 -1061 -31394 -21984
File No.: 0900530.306Revision: 0
23:04:20
1473 0 0 -1063 -318371473 0 0 -1063 -318371473 0 0 -1063 -31837
1473 0 0 -1063 -318371473 0 0 -1063 -318371473 0 0 -1063 -318371473 0 0 -1063 -318271473 0 0 -1063 -318071473 0 0 -1063 -317271473 0 0 -1063 -316271474 0 0 -1063 -315171474 0 0 -1062 -314271474 0 0 -1062 -313871467 0 0 -1063 -312971457 0 0 -1063 -314071453 0 0 -1063 -314371451 0 0 -1063 -314471449 0 0 -1063 -314471448 0 0 -1063 -314471448 0 0 -1063 -314471448 0 0 -1063 -314471448 0 0 -1063 -314471448 0 0 -1063 -314471448 0 0 -1063 -314471448 0 0 -1063 -314471448 0 0 -1063 -314371448 0 0 -1063 -314371448 0, 0 -1063 -314171448 - 0 0 -1063 -313571449 0 0 -1062 -311971449 0 0 -1062 -309871451 0 0 -1061 -307471452 0 0 -1061 -305471452 0 0 -1061 -304671443 0 0 -1061 -297571424 0 0 -1061 -299771416 0 0 -1061 -300371412 0 0 -1061 -300571408 0 0 -1061 -300571407 0 0 -1061 -300571406 0 0 -1061 -300571406 0 0 -1061 -300471406 0 0 -1061 -300471406 0 0 -1061 -300471406 0 0 -1061 -300471406 0 0 -1061 -300471406 0 0 -1061 -300471406 0 0 -1061 -300471406 0 0 -1061 -300471406 0 0 -1061 -300471406 0 0 -1061 -300471406 0 0 -1061 -30047
-23485 -808 0 0-23485 -806 0 0-23485 -608 0 0
-23485 -808 0 0-23485 -808 0 0-23475 -808 0 0-23475 -808 0 0-23445 -807 0 0-23365 -804 0 0-23275 -801 0 0-23165 -798 0 0-23075 -795 0 0-23035 -794 0 0-23035 -793 0 0-23125 -796 0 0-23155 -797 0 0-23155 -797 0 0-23165 -798 0 0-23165 -798 0 0-23165 -798 0 0-23165 -798 0 0-23165 -798 0 0-23165 -798 0 0-23165 -798 0 0-23165 -798 0 0-23165 -798 0 0-23165 -797 0 0-23145 -797 0 0
-23085 -795 0 0-22925 -790 0 0-22715 -783 0 0-22485 -776 0 0-22285 -769 0 0-22205 -767 0 0-21685 -750 0 0-21865 -756 0 0-21925 -758 0 0-21945 -759 0 0-21955 -759 0 0-21955 -760 0 0-21955 -760 0 0-21955 -760 0 0-21955 -760 0 0-21955 -760 0 0-21955 -760 0 0-21955 -760 0 0-21955 -760 0 0-21955 -760 0 0-21955 -760 0 0-21955 -760 0 0721955 -760 0 0-21955 -760 0 0
556 1035556 1035556 1035
556 1035556 1035556 1035556 1035556 1035555 1035555 1035555 1035555 1035554 1035549 1035548 1035548 1035548 1035548 1035548 1035548 1035548 1035548 1035548 1035548 1035548 1035548 1035548 1035548 1035548 1035547 1035547 1035546 1035545 1035545 1035534 1035532 1035532 1035532 1035532 1035532 1035532 1035532 1035532 1035532 1035532 1035532 1035532 1035532 1035532 1035532 1035532 1035532 1035
Page C-31 of C-40
F0306-01RO
Structural Integrity Associates, Inc.
Fatigue Analysis using VESLFAT Fatigue Module Version 1.42 - 12/29/2006 (&VeslFatFatlp42)Page 10 06-23-2009 23:04:20
16 13 ROP333118 -1061 -31394 -21984 1406 0 0 -1061 -30047 -21955 -760 0 0 532 1035
16 13 ROP333838 -1061 -31394 -21984 1406 0 0 -1063 -30047 -21955 -760 0 0 532 1035
16 13 ROP334054 -1061 -31394 -21984 1406 0 0 -1063 -30047 -21955 -760 0 0 532 1035
16 13 ROP334064 -1061 -31394 -21984 1406 0 0 -1061 -30047 -21955 -760 0 0 532 1035
17 14 SRVB10 -1061 -31414 -21984 3405 0 0 -1061 -30077 -21975 -760 0 0 532 1035
17 14 SRVB11 -1046 -31326 -21944 1406 0 0 -1046 -29831 -21777 -753 0 0 531 1020
17 14 -SRVB12 -1030 -31168 -21854 1408 0 0 -1030 -29515 -21509 -745 0 0 530 1005
17 14 SRVB14 -1015 -30960 -21714 1411 0 0 -1015 -29149 -21211 -735 0 0 529 989
17 14 SRV915 -999 -30712 -21554 1415 0 0 -999 -28764 -20893 -724 0 0 528 974
17 14 SRVB17 -967 -30166 -21194 1427 0 0 -967 -27953 -20228 -702 0 0 525 943
17 14--SRVB110 -927 -29396 -20681 1443 0 0 -927 -26899 -19380 -673 0 - 0 521 905
18 14 -SRVB214 -875 -28336 -19989 1468 0 0 -875 -25507 -18285 -637 0 0. 516 854
18 14 SRVB220 -805 -26918 -19092 1500 0 0 -805 -23731 -16917 -590 0 0 508 786
18 14 SRVB227 -713 -25078 -17927 1536 0 0 -713 -21516 -15264 -534 0 0 498 696
18 14-SRVB236 -591 -22771 -16478 1570 0 0 -591 -18848 -13290 -466 0 0 483 577
18 14 SRVB248 -439 -20148 -14859 1589 0 0 -439 -15938 -11191 -395 - 0 0 463 427
18 14 SRVB260 -284 -17806 -13548 1605 0 0 -284 -13381 -9491 -337 0 0 443 275
19 14-SRVB3287 -290 -19216 -14649 1287 0 0 -290 -17672 -13683 -468 0 0 393 27519 14 SRVB3514 -291 -19307 -14611 1144 0 0 -291 -18482 -14414 -495 0 0 377 274
19 14-SRVB3740 -291 -18887 -14343 1079 0 0 -291 -18273 -14346 -494 0 0 369 274
19 14-SRVB3967 -290 -18347 . -13984 1037 0 0 -290 -17823 -14058 -485 0 0 362 273
19 14 -SRVB31421 -288 -17248 -13218 984 0 0 -288 -16824 -13341 -462 0 0 349 272
19 14 SRVB31874 -287 -16479 -12641 934 0 0 -287 "-16075 -12755 -441 0 0 336 27119 14 SRVB32328 -285 -15700 -12034 889 0 0 -285 -15316 -12138 -420 0 0 323 270
19 14-SRVB32782 -283 -14931 -11427 846 0 0 -283 -14547 -11521 -399 0 0 311 269
19 14 SRVB33235 -281 -14151 -10811 804 0 0 -281 -13788 -10895 -378 0 0 298 26819 14-SRVB33689 -280 -13282 -10154 771 0 0 -280 -12959 -10238 -357 0 0 286 267
19 14-SRVB34142 -278 -12423 -9497 737 0 0 -278 -12140 -9582 -335 0 0 273 266
19 14 SRVB34823 -275 -11144 -8519 685 0 0 -275 -10921 -8606 -303 0 0 255 265
19 14 SRVB35503 -273 -9733 -7415 633 0 0 -273 -9566 -7497 -266 0 0 236 26319 14 SRVB36184 -270 -8332 -6305 580 0 0 -270 -8217 -6381 -229 0 0 217 26219 14 SRVB36864 -267 -7005 -5246 524 0 0 -267 -6931 -5315 -193 0 0 199 26019 14-SRVB37998 -263 -5250 -3796 414 0 0 -263 -5169 -3818 -141 0 0 169 258
19 14 SRVB39132 -258 -3450 -2314 311 0 0 -258 -3372 -2294 -88 0 0 139 25519 14-SRVB310266 -254 -1797 -971 221 0 0 -254 -1739 -927 -40 0 0 113 253
19 14 SRVB311400 -251 -1401 -666 158 0 0 -251 -1413 -697 -30 0 0 102 25019 14 SRVB311436 -251 -1419 -682 157 0 0 -251 -1430 -713 -30 0 0 102 25019 14 SRVB311472 -251 -1435 -696 156 0 0 -251 -1444 -727 :31 0 0 102 250
19 14 SRVB311580 -251 -1469 -725 150 0 0 -251 -1476 -756 -32 0 0 102 250
19 14 SRVB311904 -251 -1503 -753 130 0 0 -251 -1507 -783 -35 0 0 102 250
20 14-SRV9412624 -251 -1448 -711 95 0 0 -251 -1449 -739 -36 0 0 100 250
20 14 SRVB413344 -251 -1330 -619 73 0 0 -251 -1329 -644 -34 0 0 98 250
20 14 SRVB414064 -251 -1202 -520 60 0 0 -251 -1200 -541 -30 0 0 96 250
20 14 SRVB414784 -27 -1262 -1165 39 0 0 -27 -1294 -1213 -46 0 0 94 25
20 14 SRVB415000 -27 -1230 -1138 37 0 0 -27 -1261 -1185 -45 0 0 93 25
20 14 SRVB415010 -25 -119 -55 5 0 0 -25 -119 -57 -3 0 0 73 2521 17IImpSTlO -1061 -31414 -21984 1405 0 0 -1061 -30067 -21965 -760 0 0 532 1035
21 17ImpSTlO -1061 -31404 -21984 1405 0 0 -1061 -30037 -21935 -759 0 0 532 1035
21 17IImpSTlO -1061 -31404 -21974 1405 0 0 -1061 -29967 -21865 -756 0 0 532 1035
21 17 ImpSTlO -1061 -31354 -21934 1405 0 0 -1061 -29677 -21575 -747 0 0 531 103521 17 ImpSTlO -1059 -31254 -21844 1407 0 0 -1059 -29127 -21035 -730 0 0 529 1035
21 17OImpSTlO -1055 -30784 -21424 1413 0 0 -1055 -27057 -18985 -663 0 0 524 1035
File No.: 0900530.306 Page C-32 of C-40Revision: 0
F0306-OIRO
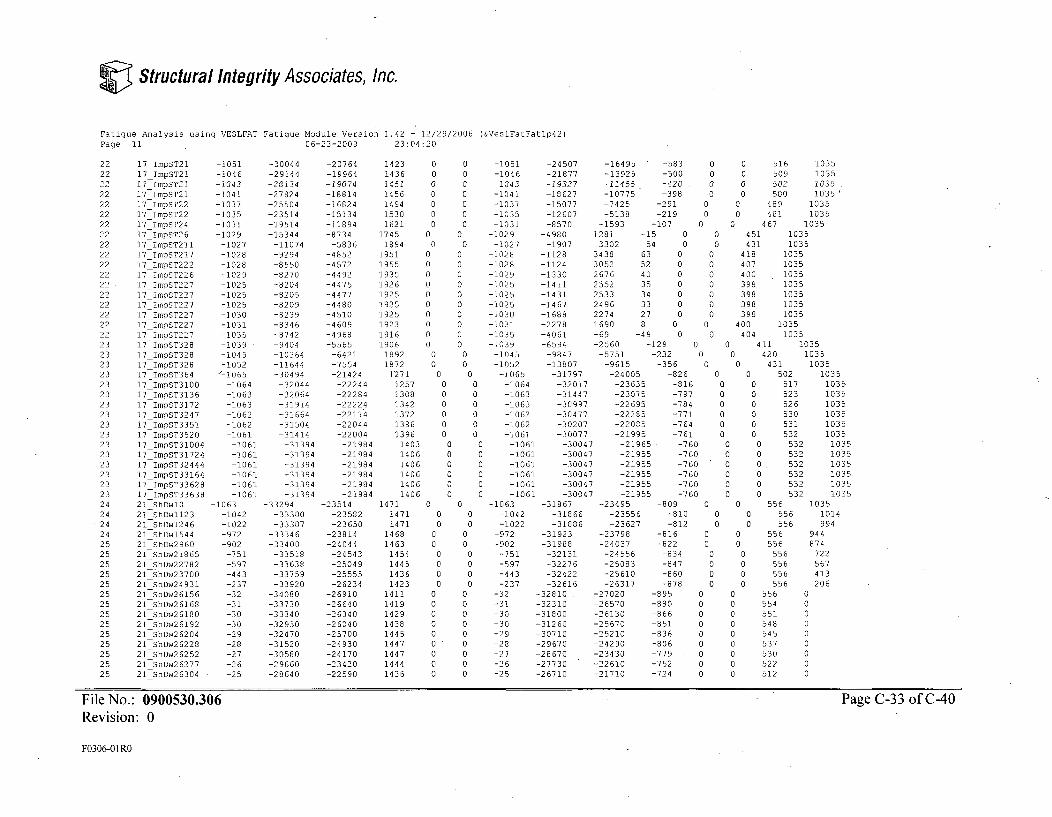
Structural Integrity Associates, Inc.
Fatigue Analysis using VESLFAT Fatigue Module Version 1.42 - 12/29/2006 (&VeslFatFatlp42)Page 11 06-23-2009 23:04:20
22 17_ImpST21 -1051 -30044 -20764 1423 022 17_ImpST21 -1046 -29144 -19964 1436 022 17_1mpST26 -1043 -29134 -19074 1451 022 17ImpST2l -1041 -27824 -18814 1456 022 17 ImpST22 -1037 -25504 -16824 1494 022 17_ImpST22 -1035 -23514 -15134 0530 022 17IImpST24 -1031 -19514 -11894 1621 022 171ImpST26 -1029 -15344 -8734 1745 022 17ImpST211 -1027 -11074 -5836 1894 022 17_ImpST217 -1028 -9294 -4852 1951 022 17_ImpST222 -1028 -8550 -4572 1955 022 17 ImpST226 -1029 -8270 -4492 1935 022 171ImpST227 -1025 -8204 -4475 1926 022 17ImpST227 -1025 -8205 -4477 1925 022 17_ImpST227 -1025 -8209 -4480 1925 022 170ImpST227 -1030 -8239 -4510 1925 022 171ImpST227 -1031 -8346 -4609 1923 022 17ImpST227 -1035 -8742 -4968 1916 023 17ImpST328 -1039 -9404 -5565 1906 023 17_ImpST328 -1045 -10364 -6421 1892 023 17_ImpST328 -1052 -11644 -7554 1872 023 17ImpST364 <-1065 -30494 -21424 1271 023 17ImpST3100 -1064 -32044 -22244 125723 17_ImpST3136 -1063 -32064 -22284 130823 17ImpST3172 -1063 -31914 -22224 134223 171ImpST3247 -1062 -31664 -22114 137223 17_ImpST3351 -1062 -31504 -22044 138623 17 ImpST3520 -1061 -31414 -22004 139623 17_ImpST31004 -1061 -31394 -21984 140323 17_ImpST31724 -1061 -31394 -21984 140623 171ImpST32444 -1061 -31394 -21984 140623 17ImpST33164 -1061 -31394 -21984 140623 17ImpST33628 -1061 -31394 -21984 140623 17 ImpST33638 -1061 -31394 -21984 140624 21 ShDwlO -1063 -33294 -23514 1471 024 21--ShDw123 -1042 -33300 -23582 1471 024 21 ShDw1246 -1022 -33307 -23650 1471 024 21 ShDw1544 -972 -33346 -23814 1468 025 21 ShDw2960 -902 -33400 -24044 1463 025 21 ShDw21865 -751 -33518 -24543 1454 025 21-ShDw22782 -597 -33638 -25049 1445 025 21--hDw23700 -443 -33759 -25555 1436 025 21 ShDw24931 -237 -33920 -26234 1423 025 21-ShDw26156 -32 -34080 -26910 1411 025 21 ShDw26168 -31 -33730 -26640 1419 025 21 ShDw26180 -30 -33340 -26340 1429 025 21 ShDw26192 -30 -32930 -26040 1438 025 21 ShDw26204 -29 -32470 -25700 1445 025 21 ShDw26228 -28 -31520 -24930 1447 025 21 ShDw26252 -27 -30580 -24170 1447 025 21 ShDw26277 -26 -29660 -23420 1444 025 21 ShDw26304 -25 -28640 -22590 1436 0
0
00000
0 -1051 -24507 -16495 - -583 0 0 516 10350 -1046 -21877 -13925 -500 0 0 509 10350 -1043 -19327 -11455 -420 0 0 502 10350 -1041 -18627 -10775 -398 0 0 500 1035'0 -1031 -15077 -7425 -291 0 0 489 10350 -1035 -12607 -5138 -219 0 0 481 10350 -1031 -8570 -1593 -107 0 0 467 1035
0 -1029 -4980 1281 -15 0 0 451 10350 -1027 -1907 3302 54 0 0 431 1035
0 -1028 -1128 3438 63 0 0 418 10350 -1028 -1124 3052 52 0 0 407 10350 -1029 -1330 2676 40 0 0 400 10350 -1025 -1411 2552 35 0 0 398 10350 -1025 -1431 2533 34 0 0 398 10350 -1025 -1467 2496 33 0 0 398 10350 -1030 -1688 2274 27 0 0 398 10350 -1031 -2278 1690 8 0 0 400 10350 -1035 -4061 -69 -49 0 0 404 10350 -1039 -6594 -2560 -129 0 0 411 1035
0 -1045 -9847 -5751 -232 0 0 420 10350 -1052 -13807 -9615 -356 0 0 431 1035
0 -1065 -31797 -24005 -826 0 0 502 10350 -1064 -32017 -23635 -816 0 0 517 10350 -1063 -31447 -23075 -797 0 0 523 10350 -1063 -30997 -22695 -784 0 0 526 10350 -1062 -30477 -22285 -771 0 0 530 10350 -1062 -30207 -22085 -764 0 0 531 10350 -1061 -30077 -21995 -761 0 0 532 1035
0 -1061 -30047 -21965 -760 0 0 532 10350 -1061 -30047 -21955 -760 0 0 532 10350 -1061 -30047 -21955 -760 0 0 532 10350 -1061 -30047 -21955 -760 0 0 532 10350 -1061 -30047 -21955 -760 0 0 532 10350 -1061 -30047 -21955 -760 0 0 532 1035
0 -1063 -31867 -23495 -809 0 0 556 10350 -1042 -31866 -23556 -810 0 0 556 10140 -1022 -31886 -23627 -812 0 0 556 994
0 -972 -31923 -23798 -816 0 0 556 9440 -902 -31988 -24037 -822 0 0 556 874
0 -751 -32131 -24556 -834 0 0 556 7220 -597 -32276 -25083 -847 0 0 556 5670 -443 -32422 -25610 -860 0 0 556 4130 -237 -32616 -26317 -878 0 0 556 206
0 -32 -32810 -27020 -895 0 0 556 00 -31 -32310 -26570 -880 0 0 554 00 -30 -31800 -26130 -866 0 0 551 00 -30 -31260 -25670 -851 0 0 548 00 -29 -30710 -25210 -836 0 0 545 00 -28 -29670 -24290 -806 0 0 537 00 -27 -28670 -23430 -779 0 0 530 00 -26 -27730 -22610 -752 0 0 522 00 -25 -26710 -21710 -724 0 0 512 0
File No.: 0900530.306 Page C-33 of C-40Revision: 0
F0306-01 R0
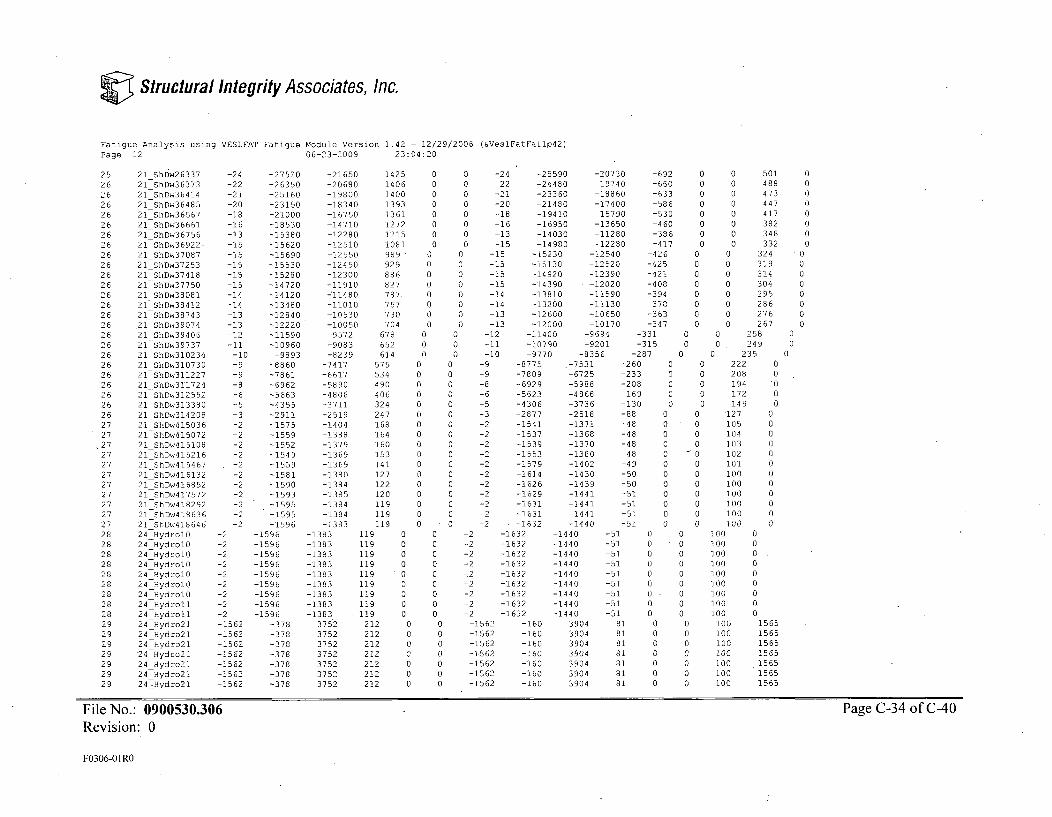
Structural Integrity Associates, Inc.
Fatigue Analysis using VESLFAT Fatigue Module Version 1.42 - 12/29/2006 (&VeslFatFatlp42)Page 12 06-23-2009 23:04:20
25 21_ShDw2633726 21_ShDw3637326 21 ShDw3641426 21 ShDw3648526 21-ShDw3656726 21 ShDw3666126 21 ShDw3675626 21 ShDw36922-26 21 ShDw3708726 21 ShDw3
7253
26 21 ShDw3741826 21 ShDw3775026 21 ShDw3808126 21-ShDw3841226 21 ShDw3874326 21 ShDw3907426 21 ShDw3940626 21 ShDw3973726 21 ShDw31023426 21 ShDw31073026 216ShDw31l22726 21 ShDw3l172426 21 ShDw31255226 21 ShDw31338026 21 ShDw31420827 21 ShDw41503627 21-ShDw415072
.27 21-ShDw4l510827 21-ShDw41521627 21 ShDw41546727 21 ShDw41613227 21-ShDw41685227 21-ShDw41757227 21 ShDw41829227 21 ShDw41863627 21 ShDw41864628 24HydrolO28 24_HydrolO28 24HydrolO28 24HydrolO26 24_HydrolO28 24_HydrolO28 24_Hydrol028 24Hydroll28 24 Hydroll29 24_Hydro2l29 24Hydro2l29 24_Hydro2l29 24Hydro2l29 24 Hydro2129 24Hydro2l29 24 Hydro2l
-24-22-21-20-18-16-13-15-15-15-15-15-14-14-13-13-12-11
-10-9-9-8-6-5-3-2-2-2-2-2-2-2-2-2-2-2
-27520-26350-25160-23150-21000-18530-15380-15620-15690-15530-15280-14720-14120-13480-12840-12220-11590-10960
-9893-8860-7861-6962-5663-4355-2911-1575-1559-1552-1549-1559-1581-1590-1593-1595-1595-1596
-21650-20680-19800-18340-16750-14710-12280-12510-12550-12450-12300-11910-'11480
-11010-10530-10050-9572-9083-8239
-7417-6617-5890-4806-3711-2519-1404-1388-1379-1369-1369-1380-1384-1385-1384-1384-1383
14251406140013931361127212151081989929886827787757730704
678652614
575534490406324247168164160153141127122120119119119
00000000
00000000
000
00000000000000000
000000000
0
00
000000000000000
00
0 -24 -25590 -20730 -692 0 0 501 00 -22 -24480 -19740 -660 0 0 488 00 -21 -23360 -18860 -633 0 0 473 0
0 -20 -21480 -17400 -586 0 0 447 00 -18 -19410 -15790 -530 0 0 417 00 -16 -16950 -13650 -460 0 0 382 00 -13 -14030 -11280 -386 0 0 348 00 -15 -14980 -12280 -417 0 0 332 0
0 -15 -15230 -12540 -426 0 0 324 0-15 -15130 -12520 -425 0 0 319 0
0 -15 -14920 -12390 -421 0 0 314 00 -15 -14390 -12020 -408 0 0 304 00 -14 -13810 -11590 -394 0 0 295 00 -14 -13200 -11130 -378 0 0 286 00 -13 -12600 -10650 -363 0 0 276 00 -13 -12000 -10170 -347 0 0 267 0
-12 -11400 -9694 -331 0 0 258 0-11 -10790 -9201 -315 0 0 249 0-10 -9770 -8356 -287 0 0 235 0
-9 -8775 -7531 -260 0 0 222 0-9 -7809 -6725 -233 0 0 208 0-8 -6929 -5988 -208 0 0 194 .0-6 -5623 -4868 -169 0 0 172 0-5 -4306 -3736 -130 0 0 149 0-3 -2877 -2516 -88 0 0 -127 0-2 -1541 -1371 -48 0 0 105 0-2 -1537 -1368 -48 0 0 104 0-2 -1539 -1370 -48 0 0 103 0-2 -1553 -1380 -48 0 - 0 102 0-2 -1579 -1402 -49 0 0 101 0-2 -1614 -1430 -50 0 0 100 0-2 -1626 -1439 -50 0 0 100 0-2 -1629 -1441 -51 0 0 100 0-2 -1631 -1441 -51 0 0 100 0-2 -1631 -1441 -51 0 0 100 0-2 -1632 -1440 -51 0 0 100 0
-2 -1632 -1440 -51 0 0 100 0-2 -1632 -1440 -51 0 0 100 0-2 -1632 -1440 -51 0 0 100 0-2 -1632 -1440 -51 0 0 100 0ý2 -1632 -1440 -51 0 0 100 0
-2 -1632 -1440 -51 0 0 100 0-2 -1632 -1440 -51 0 - 0 100 0-2 -1632 -1440 -51 0 0 100 0-2 -1632 -1440 -51 0 0 100 0
-1562 -160 3904 81 0 0 100 1565-1562 -160 3904 81 0 0 100 1565-1562 -160 3904 81 0 0 100 1565-1562 -160 3904 61 0 0 100 1565-1562 -160 3904 81 0 0 100 1565-1562 -160 3904 81 0 0 100 1565-1562 -160 3904 81 0 0 100 1565
-2 -1596 -1383-2 -1596 -1383-2 -1596 -1383-2 -1596 -1383-2 -1596 -1383-2 -1596 -1383-2 -1596 -1383-2 -1596 -1383-2 -1596 -1383-1562 -378 3752-1562 -378 3752-1562 -378 3752-1562 -378 3752-1562 -378 3752-1562 -378 3752-1562 -378 3752
119119119119119119119119119212212212212212212212
000000000
0000000
0000000
File No.: 0900530.306 Page C-34 of C-40Revision: 0
F0306-OIRO
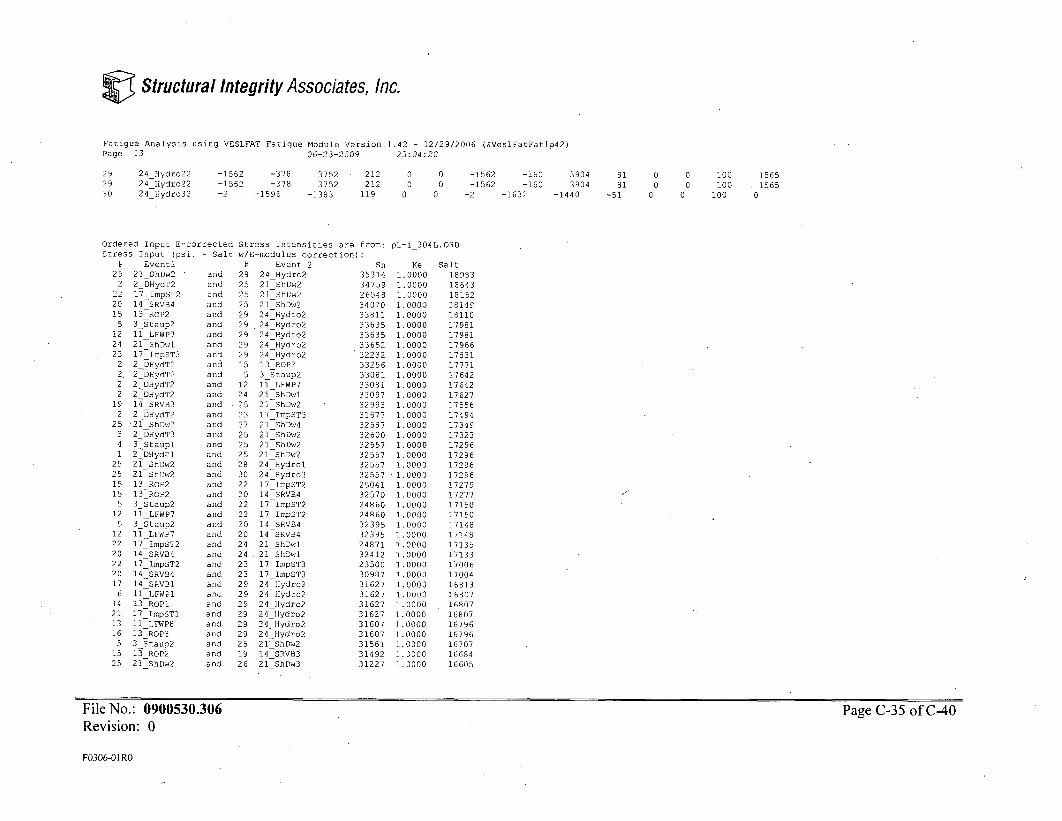
Structural Integrity Associates, Inc.
Fatigue Analysis using VESLFAT Fatigue Module Version 1.42 - 12/29/2006 (&VeslFatFatlp42)Page 13 06-23-2009 23:04:20
292930
24_Hydro22 -1562 -378
24Hydro22 -1562 -37824Hydro32 -2 -1596
37523752
-1383
212212
119
0 00 0
0 0
-1562 -160-1562 -160
-2 -1632
39043904
-1440
8181
-51
0 0 100
0 0 1000 0 100
15651565
0
Ordered Input E-corrected Stress Intensities are from:Stress Input (psi. - Salt w/E-modulus correction):
# Eventl # Event 2 Sn25 21 ShDw2 and 29 24Hydro2 35314
2 2DHydT2 and 25 21 _ShDw2 34759
22 17ImpST2 and 25 21 ShDw2 2654820 14 _SRVB4 and 25 21 ShDw2 3407015 13-ROP2 and 29 24lHydro2 33811
5 3
Staup2 and 29 2414ydro2 3363512 11 LFWP7 and 29 241Hydro2 33635
24 21 -ShDwI and 29 24 Hydro2 3365223 17ImpST3 and 29 24IHydro2 32232
2 201HydT2 and 15 13 ROP2 332562. 2DHydT2 and 5 3_Staup2 330812 2DHydT2 and 12 11_LFWP7 330812 2DHydT2 and 24 21_ShDwl 33097
19 14 SRVB3 and 25 21 ShDw2 329932 2DHydT2 and 23 17iImpST3 31677
25 21 ShDw2 and 27 21_ShDw4 325873 2-lDHydT3 and 25 21_ShDw2 32600
4 3
Staupl and 25 21_ShDw2 325571 2DHydTl and 25 21_ShDw2 32557
25 21 ShDw2 and 28 24Hydrol 3255725 21_ShDw2 and 30 241Hydro3 3255715 13 ROP2 and 22 17ImpST2 2504115 135ROP2 and 20 14 _SRVB4 32570
5 3Staup2 and 22 17_ImpST2 2486012 I LFWP7 and 22 17ImpST2 24860
5 3
Staup2 and 20 14_SRVB4 3239512 1Y LFWP7 and 20 14 SRVB4 3239522 17ImpST2 and 24 21_ShDwl 2487120 14 SRV34 and 24 21_ShDwl 3241222 17ImpST2 and 23 17_ImpST3 2350020 14 _SRV4 and 23 17ImpST3 3098717 14 SRVBI and 29 24 Hydro2 31627
6 11 -LFWP1 and 29 24lHydro2 3162714 135ROP1 and 29 24lHydro2 3162721 17iImpSTI and 29 24_Hydro2 3162713 11 LFWP8 and 29 24 Hydro2 31607
16 13 ROP3 and 29 24_Hydro2 31607
5 3_Staup2 and 25 21_ShDw2 3156115 13 ROP2 and 19 145SRVB3 3149225 21 ShDw2 and 26 21 ShDw3 31227
pl-i_304L.ORD
Ke1.00001.00001.00001.00001.00001.00001.00001.00001.00001.00001.00001.00001.00001.00001.00001.00001.00001.00001.00001.00001.00001.00001.00001.00001.00001.00001.00001.00001.00001.00001.00001.00001.00001.00001.00001.00001.00001.00001.00001.0000
Salt18983186431815218149181101798117981179661783117771176421764217627175561749417349173231729617296172961729617279172771715017150171481714817135171331700617004168131680716807168071679616796167071668416605
A
File No.: 0900530.306Revision: 0
Page C-35 of C-40
F0306-01 R0

Structural Integrity Associates, Inc.
Fatigue Analysis using VESLFAT Fatigue Module Version 1.42 - 12129/2006 (&VesIFatFatlp42IPage 14 06-23-2009 23:04:20
Stress Input (psi.8 Eventl5 3Staup2
12 11_LFWP719 14 SRVB315 13-ROP2
2 2DHydT22 2DHydT22 2DHydT22 2DHydT22 2DHydT22 2DHydT23 2_DHydT34 3Staupl
15 13 ROP215 13ROP2
1 2DHydTl19 14 SRVB3
5 3Staup212 11 LFWP724 21 ShDwl
3 2DHydT33 2DHydT33 2DHydT34 3Staupl5 3Staup25 3Staup2
12 11 LFWP712 11-LFWP7
1 2DHydTl4 3StauplI 2DHydTl4 3_Staupl1 2DHydTI
24 21 ShDwl24 21-ShDwl23 17 ImpST3
3 2DHydT34 3Staupl1 2DHydTl
23 17 ImpST323 17ImpST317 14 SRVB117 14 SRVBl
6 11-LFWPI14 13 ROPI21 17IImpSTl14 13 ROP1
6 11 LFWPI20 14 SRVB413 11 LFWP8
- Salt
andandandandandandandandandandandandandandandandandandandandandandandandandandandandandandandandandandandandandandandandandandandandandandandandand
w/E-modulus correction):# Event 2
19 14 _SRVB3 319 14 _SRVB3 324 21_ShDwl 327 21 ShDw4 317 14 _SRVBI 321 17 ImpSTl 3
6 11 LFWPI 314 13 POI 316 13 ROP3 313 11 LFWP8 315 13 ROP2 315 13 ROP2 328 24Hydrol 330 24Hydro3 315 13 ROP2 323 17IImpST3 227 21 ShDw4 327 21 ShDw4 327 21 ShDw4 312 11 LFWP7 3
5 3_Staup2 324 21 ShDwl 3
5 3_Staup2 328 24lHydrol 330 24_Hydro3 328 24Hydrol 330 24Hydro3 312 ii1LFWP7 312 11_LFWP7 3
5 3_Staup2 '324 21 ShDwl 324 21_ShDwi 328 24 Hydrol 330 24 Hydro3 327 21 ShDw4 223 17IImpST3 223 17_ImpST3 223 17ImpST3 228 24IHydrol 230 24Hydro3 222 17ImpST2 220 14 _SRVB4 322 17_2mpST2 222 17ImpST2 222 17ImpST2 220 14 SRV54 320 14 SRVB4 321 17OmpSTl 322 17_ImpST2 2
Sn131713171334108510731073107310731053105311001056105610561056991109100910092709240924094208810881088108810881088108810881089808980898089895049518947494749-4749474285803882858285828580388038803882837
Ke1.0000i.0ooo1.00001.00001. 00001.00001.00001.00001.00001.00001.00001.00001.00001.00001.00001.00001.00001.00001.00001.00001.00001.00001.00001.00001.00001.00001.00001.00001.00001.0000
1.00001.00001.00001.00001.00001.00001.00001.00001.0000
1.00001.00001.00001.00001.00001.00001.00001.00001.00001.0000
Salt16555165551654016477164751646916469164691645816458164511642416424164241642416416163471634716332163221632216307162951629516295162951629516295162951629516280162801628016280162101618416157161571615716157159851598315980159801598015978159781597815969
File No.: 0900530.306Revision: 0
Page C-36 of C-40
F0306-01 RO
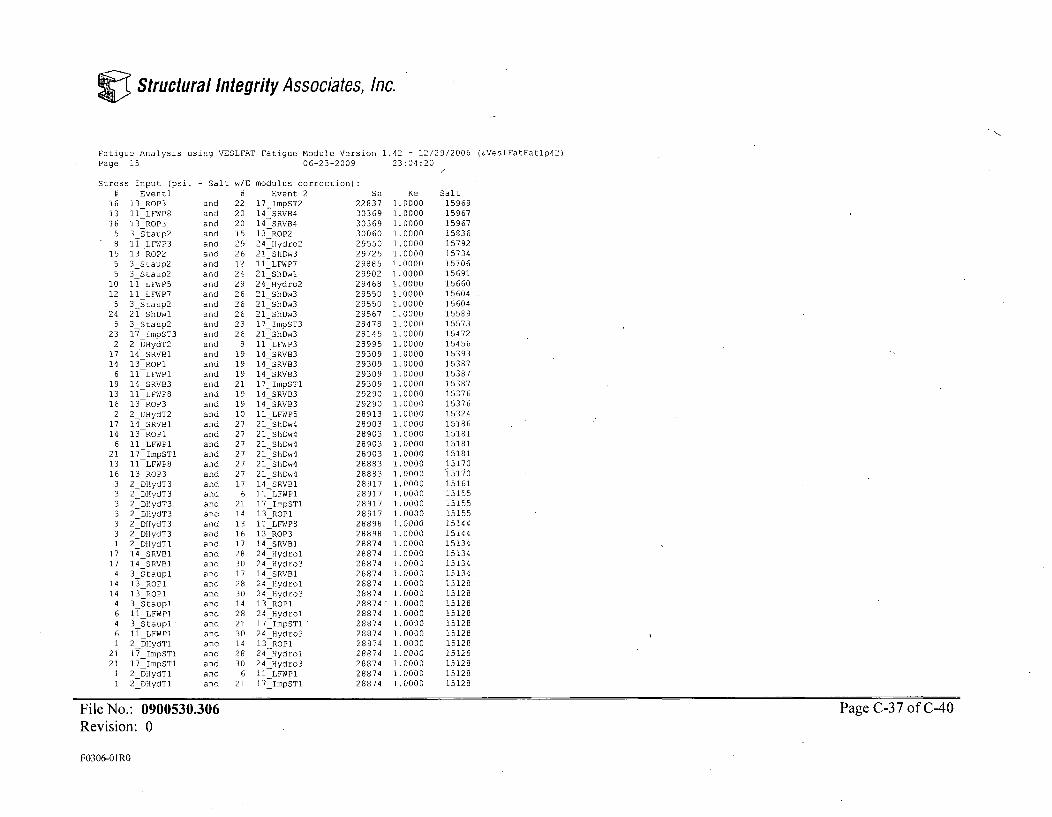
Structural Integrity Associates, Inc.
Fatigue Analysis using VESLFAT Fatigue Module Version 1.42 - 12/29/2006 (&VeslFatFatlp42)Page 15 06-23-2009 23:04:20
Stress Input (psi. - Salt# Eventl
16 13 ROP3 and13 II-LFWP8 and16 13-ROP3 and
5 3 Staup2 and8 1i LFWP3 and
15 13 ROP2 and5 3lStaup2 and5 3Staup2 and
10 11 LFWP5 and12 11 LFWP7 and
5 3_Staup2 and24 21 ShDwl and
5 3_Staup2 and23 17_ImpST3 and
2 2_HydT2 and17 14 SRVB1 and14 13-ROPI and
6 11 LFWPI and19 14 SRVB3 and13 T11LFWP8 and16 13-ROP3 and
2 2DHydT2 and17 14 SRVBI and14 13 ROPI and
6 11 LFWPI and21 17tImpSTl and13 11 LFWP8 and16 13_ROP3 and
3 2DHydT3 and3 2DHydT3 and3 2DHydT3 and3 2DHydT3 and3 2DHydT3 and3 2DHydT3 and1 2DHydTl and
17 14 SRVBI and17 14 SRVB1 and4 3Staupl and
14 13 ROPI and14 13_ROPI and4 3Staupl and6 31 LFWPI and4 3Staupl and6 11 LFWP1 and1 2DHydT1 and
21 17_ImpSTl and21 17 ImpSTI and
1 2_DHydTl and1 2DHydTl and
File No.: 0900530.306Revision: 0
w/E-
2220201529261224292626262326
81919-1921191910
27272727272717
62114131617283017283014282130142830
621
modulus correction):Event 2
17ImpST214_SRVB414 SRVB413-ROP224_Hydro221 ShDw311LFWP721ShDwl24Hydro221 ShDw321-ShDw321_ShDw3170ImpST321 ShDw311 LFWP314-SRVB314-SRVB314 SRVB317ImpSTI14 SRVB314-SRVB311 LFWP521 ShDw421_ShDw421_ShDw421 ShDw421 ShDw421_ShDw414 SRVBI11_LFWPI17ImpSTl13 ROPI11 LFWPS13 ROP314 SRVBI24Hydrol24Hydro314_SRVBI24Hydrol24Hydro313_ROPI24Hydrol17ImpSTl"24Hydro313_ROPI24jydrol24Hydro311 LFWP117 ImpSTl
Sn22837303693036930060295502972529885299022946829550295502956728478281452899529309293092930929309292902929028913289032890328903289032888328883289172891728917289172898828898288742887428874288742887428874288742887428874288742887428874288742887428874
Ke1.00001.00001.00001.00001.00201.00001.00001.00001.00001.00001.00001.00001.00001.00001.00001.00001.00001.00001.00001.00001.00001.00001.00001.00001.00001.00001.00001.00001.00001.00001.00001.00001.00001.00001.00001.00001.00001.00001.00001.00001.00001.00001.00001.00001.00001.00001.00001.0000i.0000
Salt15969159671596715836157921573415706156911566015604156041558915573154721545615393153871538715387153761537615324151861518115181151811517015170151611515515155151551514415144151341513415134151341512815128151281512815128151281512815128151281512815128
Page C-37 of C-40
F0306-OIRO
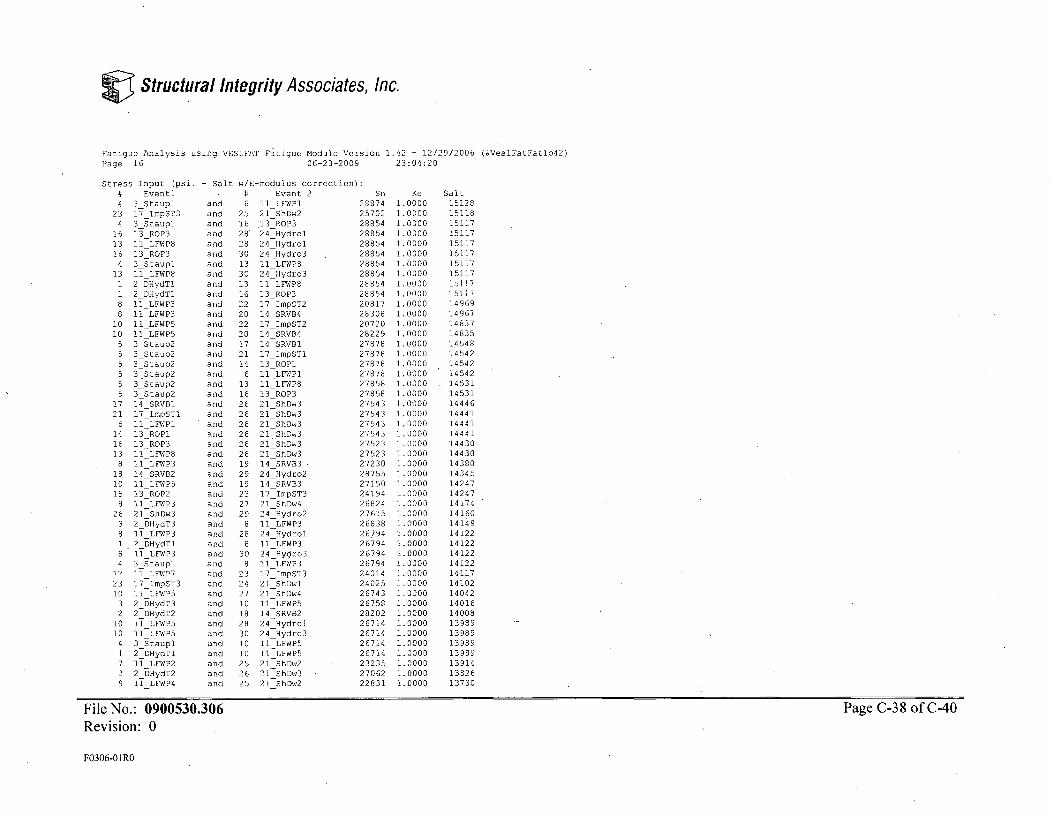
Structural Integrity Associates, Inc.
Fatigue Analysis using VESLFAT Fatigue Module Version 1.42 - 12/29/2006 (&VeslFatFatlp42)Page 16 06-23-2009 23:04:20
Stress Input (psi. - Salt w/E-modulus correction):# Eventi # Event 2 Sn Ke Salt4 3Staupl and 6 11LFWP1 28874 1.0000 15128
23 17_ImpST3 and 25 21 ShDw2 25702 1.0000 151184 3_Staupl and 16 13_ROP3 28854 1.0000 15117
16 13ROP3 and 28 24Hydrol 28854 1.0000 1511713 11 LFWP8 and 28 24 Hydrol 28854 1.0000 1511716 13-ROP3 and 30 24Hydro3 28854 1.0000 15117
4 3Staupl and 13 11 LFWP8 28854 1.0000 1511713 11 LFWP8 and 30 24fHydro3 28854 1.0000 15117
1 2DHydTl and 13 11 LFWP8 28854 1.0000 151171 2 DHydTI and 16 13_ROP3 28854 1.0000 151178 11 _LFWP3 and 22 17ImpST2 20817 1.0000 149698 11 LFWP3 and 20 14 SRVB4 28308 1.0000 14967
10 11-LFWP5 and 22 17 ImpST2 20720 1.0000 1483710 11 LFWP5 and 20 14 SRVB4 28229 1.0000 14835
5 3Staup2 and 17 14 -SRVBI 27878 1.0000 145485 3 Staup2 and 21 170ImpSTl 27878 1.0000 145425 3 Staup2 and 14 13 ROPI 27878 1.0000 145425 3Staup2 and 6 11_LFWP1 27878 1.0000 145425 3Staup2 and 13 11 LFWP8 27858 1.0000 145315 3Staup2 and 16 13-ROP3 27858 1.0000 14531
17 14 SRVBI and 26 21-ShDw3 27543 1.0000 1444621 17_ImpSTl and 26 21 ShDw3 27543 1.0000 14441
6 11 LFWPl and 26 21-ShDw3 27543 1.0000 1444114 13 ROP1 and 26 21 ShDw3 27543 1.0000 1444116 13 ROP3 and 26 21 ShDw3 27523 1.0000 1443013 11-LFWP8 and 26 21 -ShDw3 27523 1.0000 14430
8 11-LFWP3 and 19 14 -SRVB3 27230 1.0000 1438018 14 SRVB2 and 29 24 Hydro2 28755 1.0000 1434510 11-LFWP5 and 19 14 SRVB3 27150 1.0000 1424715 13 ROP2 and 23 17IImpST3 24194 1.0000 14247
8 11 LFWP3 and 27 21 ShDw4 26824 1.0000 1417426 21 ShDw3 and 29 24_Hydro2 27615 1.0000 14160
3 2DHydT3 and 8 11_LFWP3 26838 1.0000 141498 I1 LFWP3 and 28 24EHydrol 26794 1.0000 141221 2DHydTl and 8 11_LFWP3 26794 1.0000 141228 I1 LFWP3 and 30 24_Hydro3 26794 1.0000 141224 3Staupl and 8 11_LFWP3 26794 1.0000 14122
12 I _LFWP7 and 23 17ImspST3 24014 1.0000 1411723 17 ImpST3 and 24 21_ShDwl 24025 1.0000 1410210 11 LFWP5 and 27 21 ShDw4 26743 1.0000 14042
3 20DHydT3 and 10 I1_LFWP5 26758 1.0000 140162 2DHydT2 and 18 14_SRVB2 28202 1.0000 14008
10 11 _LFWP5 and 28 24 Hydrol 26714 1.0000 1398910 11 LFWP5 and 30 241Hydro3 26714 1.0000 13989
4 3Staupl and 10 11 LFWP5 26714 1.0000 139891 2ODHydTl and 10 11TLFWP5 26714 1.0000 139897 I1 LFWP2 and 25 21 ShDw2 23235 1.0000 139142 2_DHydT2 and 26 21 ShDw3 27062 1.0000 138269 11 LFWP4 and 25 215ShDw2 22831 1.0000 13730
File No.: 0900530.306 Page C-38 of C-40Revision: 0
F0306-OIR0
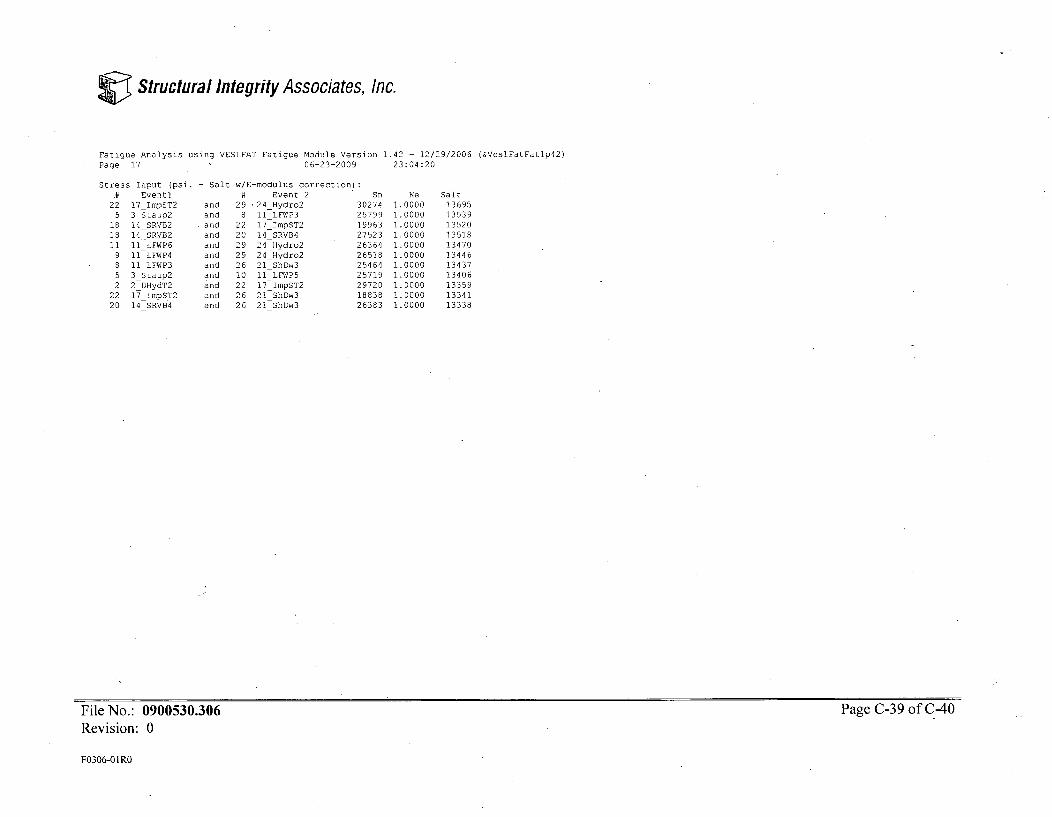
C Structural Integrity Associates, Inc.
Fatigue Analysis using VESLFAT Fatigue Module Version 1.42 - 12/29/2006 (&VeslFatFatlp42)Page 17 06-23-2009 23:04:20
Stress Input (psi..A Eventi
22 17 ImpST25 3 Staup2
18 14 _SRVB218 14_SRVB211 11 LFWP6
9 31 LFWP48 11 LFWP35 3_Staup22 2_DHydT2
22 17_ImpST220 14 SRVB4
- Salt
andandandandandandandandandandand
w/E-modulus correction):# Event 2 Sn
29 .24_Hydro2 302748 11_LFWP3 25799
22 17_1mpST2 1996320 14 _SRVB4 2752329 24 Hydro2 2636429 24_Hydro2 2651826 21 ShDw3 2546410 11 LFWP5 2571922 17 ImpST2 2972026 21 ShDw3 1883826 21 ShDw3 26383
Ke1.00001.00001.00001.00001.00001.00001.00001.00001.00001.00001.0000
Salt1369513539135201351813470134461343713406133591334113338
File No.: 0900530.306 Page C-39 of C-40Revision: 0
F0306-OIRO

C Structural Integrity Associates, Inc.
Fatigue Analysis usingPage 18
I Load Sets1 25 21 ShDw2
29 241Hydro22 2 2_DHydT2
25 21 ShDw23 2 20DHydT2
15 13 ROP24 2 2_OHydT2
5 3lStaup25 5 3 Staup2
22 17 ImpST26 5 3 Staup2
20 14 SRV947 5 3 Staup2
19 14 SRVB38 5 3 Staup2
27 21 ShDw49 12 31--LFWP7
27 21 ShDw410 3 2_DHydT3
12 11 LFWP711 3 2DHydT3
24 21 ShDwl12 3 2 DHydT3
23 07ImpST313 4 3_Staupl
23 07IImpST314 1 2 DHydT3
17 14 SRVBI15 14 13-OPI
28 24Hydrol16 6 11_LFWP1
28 241Hydrol17 4 3Staupl
21 17_ImpSTl18 6 11iLFWP1
30 24Hydro319 1 2_DHydTl
6 13 LFWPI20 4 3_Staupl
16 13 ROP321 4 3Staupl
13 ii LFWP822 1 2_OHydTT
8 11 LFWP323 4 3_Staupl
10 11 LFWP5
VESLFAT Fatigue Module Version 1.42 - 12/29/2006 (&VeslFatFatlp42)06-23-2009 23:04:20
Cycles118
3
130315
151
14
120106
5101
299
297
1183021
1309
121118
35
120'2
130213
302
1185
283
12825
1131
11230
103308230
Sn35314
34759
33256
33081
24860
32395
31317
30910
30910
309 24
30942
29518
29474
28874
28874
28874
28874
28874
28874
28854
28854
26794
26714
Ke Salt1.000 18983
1.000 18643
1.000 17771
1.000 17642
1.000 17150
1.000 17148
1.000 16555
1.000 16347
1.000 16347
1.000 16322
1.000 16307
1.000 16184
1.000 16157
1.000 15134
1.000 15128
1.000 15128
1.000 15128
1.000 15128
1.000 15128
1.000 15117
1.000 15117
1.000 14122
1.000 13989
Nallowed4.3764E+06
4.7272E+06
6.1657E+06
6.4429E+06
7.6387E+06
7.6446E+06
9. 4491E+06
1.0297E+07
1.0297E+07
1.0445E+07
1.0533E+07
1. 1284E+07
1. 1457E+07
2.1354E+07
2.1471E+07
2. 1471E+07
2.1471E+07
2. 1471E+07
2.1471E+07
2 1707E+07
2.1707E+07
9.2711E+07
3.5582E+08
Usage.0000007
.0000243
.0000002
.0000022
.0000007
.0000003
.0000002
.0000094
.0000020
.0000009
.0000112
.0000003
.0000002
.0000001
.0000000
.0000001
.0000002
.0000001
.0000012
.0000000
.0000014
.00o0003
.0000001
Total Usage = 0.0000560
File No.: 0900530.306Revision: 0
Page C-40 of C-40
F0306-01 RO

ATTACHMENT 3To Enterciy Letter No. 2.09.050
Structural Integrity Associates, Inc. File No. 0900530.307,"Residual Stress Analysis of Jet Pump Instrument Nozzle (N9A) with Weld Overlay
Repair", dated August 10, 2009
(32 pages)
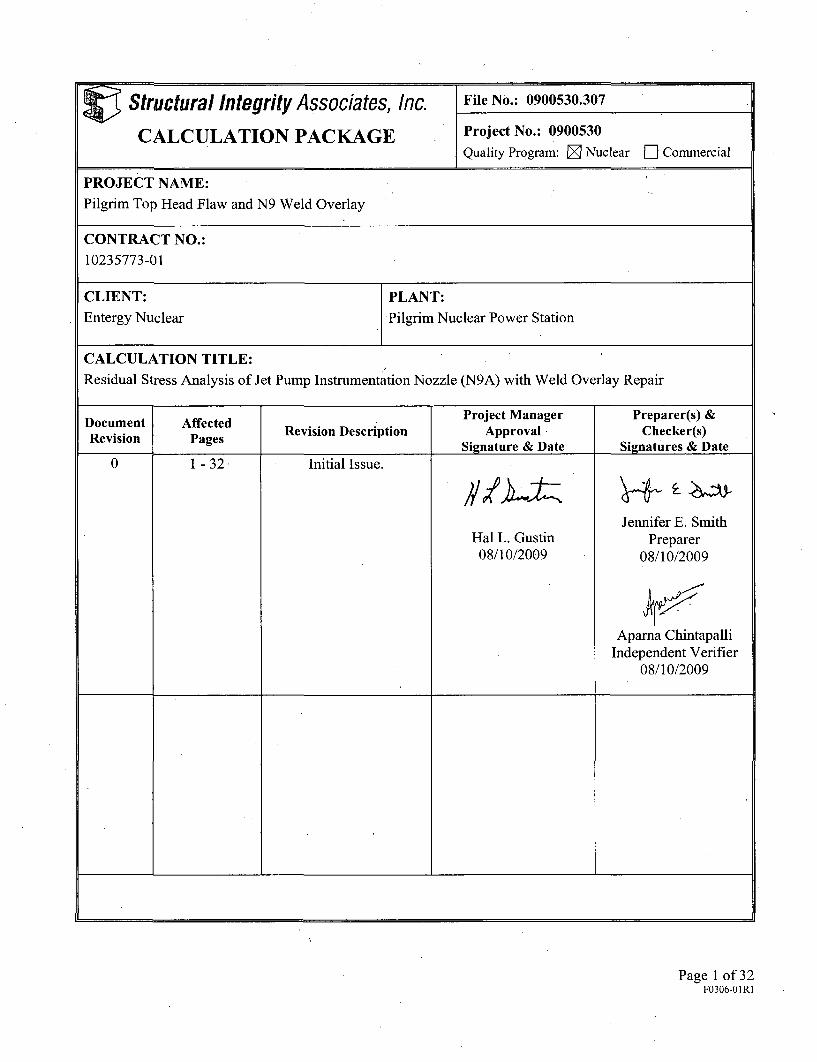
Structural Integrity Associates, Inc. File No.: 0900530.307
CALCULATION PACKAGE Project No.: 0900530
Quality Program: 0 Nuclear 0 Commercial
PROJECT NAME:
Pilgrim Top Head Flaw and N9 Weld Overlay
CONTRACT NO.:
10235773-01
CLIENT: PLANT:
Entergy Nuclear Pilgrim Nuclear Power Station
CALCULATION TITLE:
Residual Stress Analysis of Jet Pump Instrumentation Nozzle (N9A) with Weld Overlay Repair
Project Manager Preparer(s) &Document Affected Revision Description Approval Checker(s)Revision Pages Signature & Date Signatures & Date
0 1 - 32 Initial Issue.
Jennifer E. SmithHal L. Gustin Preparer08/10/2009 08/10/2009
Aparna ChintapalliIndependent Verifier
08/10/2009
Page 1 of 32F0306-OIRI
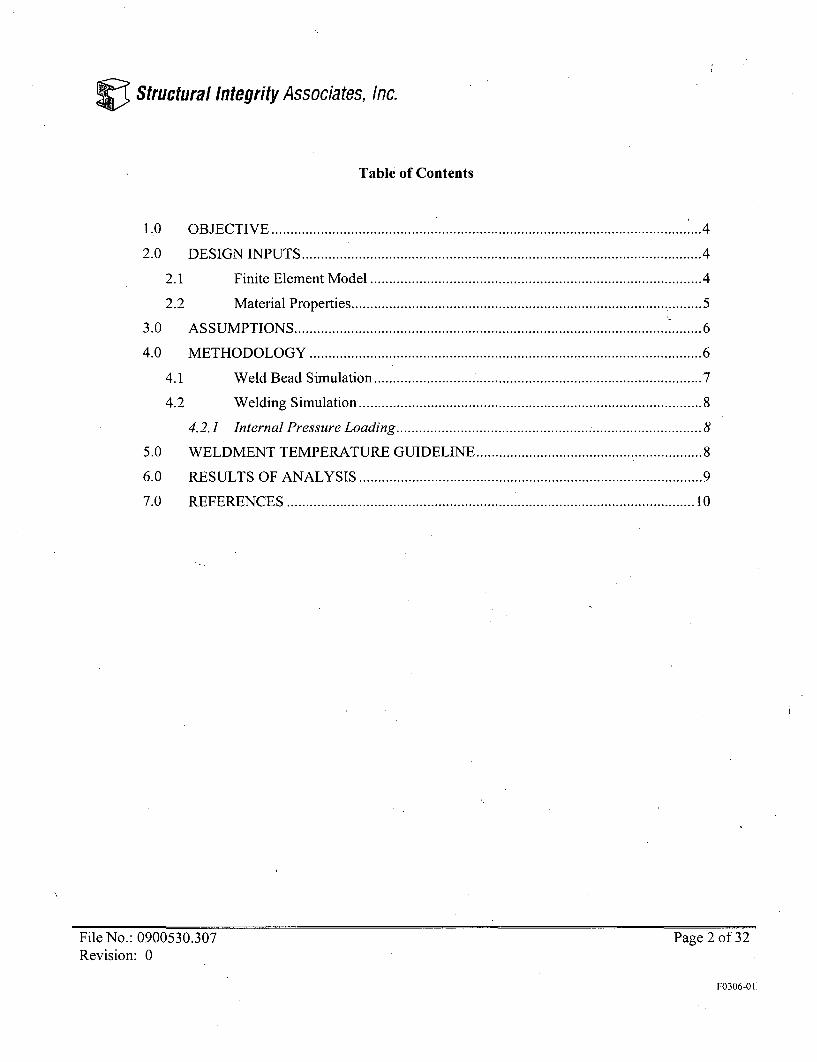
Structural Integrity Associates, Inc.
Table of Contents
1.0 O BJECTIV E ......................................................................................................... 4
2.0 D ESIGN IN PU TS .................................................................................................... 4
2.1 Finite Elem ent M odel .................................................................................. 4
2.2 M aterial Properties ........................................................................................ 5
3.0 A SSUM PTION S .................................................................................................. .6
4.0 M ETH O D O LO G Y .................................................................................................. 6
4.1 W eld Bead Sim ulation ................................................................................... 7
4.2 W elding Sim ulation .................................................................................... 8
4.2.1 Internal Pressure Loading ............................................................................ 8
5.0 WELDMENT TEMPERATURE GUIDELINE ...................................................... 8
6.0 RESULTS O F A N A LY SIS .................................................................................... 9
7.0 REFEREN CES ............................................................................................................ 10
I
File No.: 0900530.307Revision: 0
Page 2 of 32
F0306-0l

Structural Integrity Associates, Inc.
List of Figures
Figure 1: Applied Boundary Conditions to the Finite Element Model ............................. 12
Figure 2: As-M odeled Com ponents ................................................................................... 13
Figure 3: As-Modeled Nuggets for ID Weld Repair 1 (2), ID Weld Repair 2 (2), Old WOL (24),and N ew W O L (66) ......................................................................................... 14
Figure 4: Internal Pressure Loading ........................................ 15
Figure 5: Predicted Fusion Boundary for ID Weld Repair 1 ....................... 16
Figure 6: Predicted Fusion Boundary for ID Weld Repair 2 ............................................. 17
Figure 7: Predicted Fusion Boundary for Weld Overlay 1 ........................ 18
Figure 8: Predicted Fusion Boundary for Weld Overlay 2 ........................ 19
Figure 9: Post-ID Weld Repair 1 Axial Stress at 70'F ...................................................... 20
Figure 10: Post-ID Weld Repair 1 Hoop Stress at 70'F .................................................... 21
Figure 11: Post-ID Weld Repair 2 Axial Stress at 70'F .................................................... 22
Figure 12: Post-ID Weld Repair 2 Hoop Stress at 70'F .................................................... 23
Figure 13: Post Weld Overlay 1 Axial Stress at 70'F ..................................................... 24
Figure 14: Post Weld Overlay 1 Hoop Stress at 70'F ...................................................... 25
Figure 15: Post Weld Overlay 2 Axial Stress at 70'F ..................................................... 26
Figure 16: Post Weld Overlay 2 Hoop Stress at 70'F ..................................................... 27
Figure 17: Post Weld Overlay Axial Stress at 550'F and 1035 psia ...................................... 28
Figure 18: Post Weld Overlay Hoop Stress at 550'F and 1035 psia ................................ 29
Figure 19: ID Surface Axial Residual Stress ..................................................................... 30
Figure 20: ID Surface Hoop Residual Stress ..................................................................... 31
Figure 21: Path D efinitions ................................................................................................. 32
List of Tables
Table 1: AN SY S Input and Output Files ............................................................................ 11
File No.: 0900530.307 Page 3 of 32Revision: 0
F0306-01E

Structural Integrity Associates, Inc.
1.0 OBJECTIVE
The Pilgrim jel pump instrument nozzle N9A had a previous weld overlay repair applied in 1984. Itwas determined that the previous repair did not sufficiently cover all potentially IGSCC-susceptibleweld locations at the nozzle to safe end joint. In addition, the overlay was too short to allow aqualified ultrasonic examination of the underlying material. The Reference [1] calculation designedan upgrade and extension to the repair to bring the entire repair up to current standards, and to allowultrasonic examination of the weld overlay and underlying welds. This updated repair has beeninstalled on the N9A nozzle.
The objective Of this evaluation is to perform a weld residual stress analysis using ANSYS finiteelement software [2] on the jet pump instrumentation nozzle due to the new weld overlay (WOL)repair. The new WOL was applied in order to enlarge the original WOL in order for it to cover boththe nozzle-to-safe end weld and the safe end-to-penetration seal welds and allow for inspection. Thisanalysis includes performing two weld repairs from the inner diameter (ID) surface for postulatedflaws within the original nozzle-to-safe end weld and the safe end-to-penetration seal weld. The twoID weld repairs are simulated to provide an unfavorable stress condition (prior to applying the weldoverlay) due to the original fabrication of these welds. The nozzle-to-safe end and safe end-to-penetration seal welds are not considered in this analysis. The original WOL from 1984 is modeledand is performed in this analysis followed by the new WOL.
The results will be evaluated to demonstrate that the weld overlay repair has indeed generated afavorable stress condition for the jet pump instrumentation nozzle, safe end, and penetration seal byinducing a compressive stress condition on the ID surface. The favorable stress condition minimizesand/or arrests crack initiation/propagation caused by Inter Granular Stress Corrosion Cracking(IGSCC) in the susceptible DMW material.
2.0 DESIGN INPUTS
2.1 Finite Element Model
The finite element model of the jet pump instrumentation nozzle, including material properties, isobtained from Reference [3]. The ID weld -epairs on the nozzle-to-safe end weld and the safe end-to-penetration seal weld are included in this analysis to show that the significant tensile stresses generatedby these weld repairs are mitigated by the weld overlay repair.
Section 4.2 of MRP-169 states that, to adequately demonstrate the favorable residual stress effects of aweld overlay, one must start with a highly unfavorable, pre overlay residual stress condition such as thatwhich would result from an ID surface weld repair during construction. If the nozzle specific weldoverlay design is shown to produce favorable residual stresses in this severe case, one can be assuredthat it will effectively mitigate against future Intergranular Stress Corrosion Cracking (IGSCC) in the
File No.: 0900530.307 Page 4 of 32Revision: 0
F0306-011

Structural Integrity Associates, Inc.
DMW. While MRP-169 applies to PWR's, the same methodology is used here in order to insure theWOL will produce favorable residual stresses.
Figure 1 shows the applied structural boundary conditions on the axisymmetric finite element model,while Figure 2 shows the different components in the finite element model. The weld overlay nuggetlayout used for the residual stress evaluation is shown in Figure 3. The progression of the overlaywelding is from the nozzle end to the piping end. The welding direction was chosen based oncommunications with the client.
Axisynmmetric PLANE55 elements are used in the thermal analysis, while axisymmetric PLANE182elements are used in the stress analysis. The weld bead depositions are simulated using the element"birth and death" feature in ANSYS. A node on the vessel ID was fixed in all directions for the stressrun in order to constrain the model against infinite motion in the y-direction.
The element "birth and death" feature in ANSYS allows for the deactivation (death) and reactivation(birth) of the elements' stiffness contribution when necessary. It is used such that elements that have nocontribution to a particular phase of the weld simulation process are deactivated (via EKILL command)because they have not been deposited. The deactivated elements have near-zero conductivity andstiffness contribution to the structure. When those elements are required in a later phase, they are thenreactivated (via EALIVE command).
The analyses consist of a thermal pass to determine the temperature distribution due to the weldingprocess, and an elastic-plastic stress pass to calculate the residual stresses through the thermal history.Appropriate weld heat efficiency along with sufficient cooling time are utilized in the thermal pass toensure that the temperature between weld layer nuggets meets the required interpass temperature as wellas obtain acceptable overall temperature distribution within the FEM (i.e., peak temperature, sufficientresolution of results, etc.). In the stress pass, symmetric boundary conditions are applied on the end ofthe penetration seal as well; as the vessel. A node on the vessel ID was also fixed in the y direction toprevent the entire model from moving due to the loading.
2.2 Material Properties
The materials of the various components of the model are listed below per Reference [3].
* Nozzle Body: A-508 Cl. 2* Old Safe End SA-182-F304* Penetration Seal SA-182-F304* Nozzle to Old Safe-End Weld Inc. 182* Old Safe-End to Penetration Seal Weld Inc. 182* Weld Butters Inc. 182* Old Weld Overlay Inc. 182* Cladding SA-240 Type 304
File No.: 0900530.307 Page 5 of 32Revision: 0
F0306-01f
Structural Integrity Associates, Inc.
* New Weld Overlay Alloy 52M* Vertical Pipe 304 Stainless Steel* ID Weld Repairs Inc. 182
The temperature dependent nonlinear material property values are obtained from Reference [3] (inputfile MPropMISO_NLinearPNPS.INP). This analysis applies the multi-linear isotropic hardeningmaterial behavior available within the ANSYS finite element program.
3.0 ASSUMPTIONS
The following assumptions are used in the residual stress evaluation:
1. Assumptions from Reference [3] are applicable in this calculation.
2. A convection heat transfer coefficient boundary condition of 5.0 Btuihr-ft2 -°F at 70'F bulkambient temperature is applied to simulate the air condition at the inside surface of the nozzleduring the application of the ID weld repair I and ID weld repair 2.
3. The outside surface of the nozzle has a heat transfer coefficient of 5.0 Btu/hr-ftZ-°F at 70'F bulktemperature during the application of the ID weld repair 1 and ID weld repair 2.
4. During both weld overlay processes, the nozzle is assumed to be filled with water. Therefore, theapplied heat transfer boundary condition of 20.0 Btu/hr-ft2-°F at 70'F bulk temperature was usedon the inside surface of the nozzle to simulate water.
5. The outside surface of the nozzle had a heat transfer coefficient of 5.0 Btu/hr-fte-°F at 70'F bulktemperature during both WOL processes. This represents, an air environment.
6. A maximum interpass temperature of 350'F between the depositions of weld nuggets is assumedfor all welding processes [4]. This is confirmed by the welding procedure in Reference [12].
7. Additional assumptions including details on the heat source and heat efficiency values can beobtained from Reference [5].
4.0 METHODOLOGY
The residual stresses due to welding are controlled by various welding parameters, thermal transientsdue to application of the welding process, temperature dependent material properties, and elastic-plasticstress reversals. The analytical technique uses finite element analysis to simulate the multi-pass weldrepair and weld overlay processes.
A residual stress evaluation process was previously developed in an internal SI project. Details of theprocess and its comparison to actual test data are provided in Reference [5]. The same process will beused herein. The finite element model of the jet pump instrumentation nozzle was developed in
File No.: 0900530.307 Page 6 of 32Revision- 0
F0306-01:

V Structural Integrity Associates, Inc.
Reference [3]. The model includes the instrumentation nozzle, the original nozzle to safe end dissimilarmetal weld (DMW), the left over piece of the original safe end, the DMW that attaches the old safe endto the penetration seal, a portion of the penetration seal, the original weld overlay repair (WOL), the newWOL, a postulated weld repair at each of the DMWs, and a portion of the attached piping.
4.1 Weld Bead Simulation
In order to reduce computational time, individual weld beads or passes are lumped together into weldnuggets. This methodology is based on the approach presented in References 6, 7, 8, and 9.The number of equivalent bead passes is estimated by dividing each nugget area by the area of anindividual bead. The resulting number of equivalent bead passes per nugget is used as a multiplier to theheat generation rate. The progression of the overlay welding is from the nozzle end to the piping end.The welding direction was chosen based on communications with the client. A summary of nuggets forthe welds is summarized as follows (see Figure 3):
" The ID weld repair 1 (nozzle-to-safe end weld) is performed in two layers, with onenugget for each layer. A total of 2 nuggets are defined for the ID weld repair 1.
* The ID weld repair 2 (safe end-to-penetration seal) is performed in 2 layers, with onenugget for each layer. A total of 2 nuggets are defined for ID weld repair 2.
* The old weld overlay is performed in three layers. A total of twenty four nuggets aredefined for this weld overlay.
o Layer one is comprised of nine nuggetso Layer two is comprised of eight nuggetso Layer three is comprised of seven nuggets
* The new weld overlay is performed in four layers, which are applied in 3 pieces. Thefirst piece has three layers and is on the nozzle side of the old WOL. The second piececonsists of three layers and is on the piping side of the old WOL. The third and finalpiece is one layer and covers the previous two pieces as well as the old WOL. Thenecessity of a three piece weld overlay can be seen in Reference [11]. A total of sixty sixnuggets are defined for the new weld overlay:
o Piece 1, Layer one is comprised of ten nuggetso Piece 1, Layer two is comprised of ten nuggetso Piece 1, Layer three is comprised of ten nuggetso Piece 2, Layer one is comprised of five nuggetso Piece 2, Layer two is comprised of five nuggetso Piece 2, Layer three is comprised of five nuggetso Piece 3, Layer one is comprised of twenty one nuggets
File No.: 0900530.307 Page 7 of 32Revision: 0
F0306-01O
Structural Integrity Associates, Inc.
4.2 Welding Simulation
ID weld repair 1, on the nozzle-to-safe end weld, is applied first. After ID weld repair 1 is completed,the model is cooled down to a uniform ambient temperature of 70'F. Next, ID weld repair 2, on the safeend-to-penetration seal weld, is applied. After ID repair 2 is completed, the model is again cooled to auniform ambient temperature of 70'F. This is followed by the application of the old WOL, cooling it toan ambient temperature of 70'F and finally followed by the new weld overlay simulation.
After the weld overlay is completed, the model is cooled to a uniform ambient temperature of 70'F toobtain the combined residual thermal stresses at room temperature. Then it is heated to a uniformoperating temperature of 550'F [10] and operating pressure of 1035 psia [10] in order to obtain thecombined residual thermal stresses at operating temperature and pressure.
4.2.1 Internal Pressure Loading
The internal operating pressure of 1035 psia[10] is applied to the model. Due to the closed piping endof the model, this pressure is applied on the inside surfaces of the Nozzle, DMW welds, Old Safe End,ID Repairs, and Penetration Seal. See Figure 4 for applied pressure loadings. The same boundaryconditions are used for the pressure loading as were applied for the stress runs and described in section2.1.
The ANSYS input and output files for the analysis are listed in Table 1.
5.0 WELDMENT TEMPERATURE GUIDELINE
The analytical procedure described in Section 4.0 has provided reasonable results as seen in previous"similar analyses when compared to results from test data. This can be demonstrated by observing thefusion boundary prediction of the welds. Figures 5 through 8 show the predicted fusion boundaries forall the welding processes as generated by ANSYS for this specific overlay. The fusion boundariesrepresent the predicted maximum temperature contour mapping that the weld nugget elements will reachduring each welding process. Note that the figures are composites showing the maximum temperatureamong all nuggets of each weld. This is made possible by an ANSYS macro (MapTemp.MAC) thatreads in the maximum predicted temperatures across the different weld nugget elements during thewelding process and displays it as a temperature contour plot.
The figures show that all weld elements have reached temperatures between 2,024°F and 3,0000 F. Italso shows that the heat penetration depth, where temperatures are above 1,300'F, is similar in size tothe heat affected zone (HAZ) of roughly between 1/8" and 1/4".
File No.: 0900530.307 Page 8 of 32Revision: 0
F0306-011
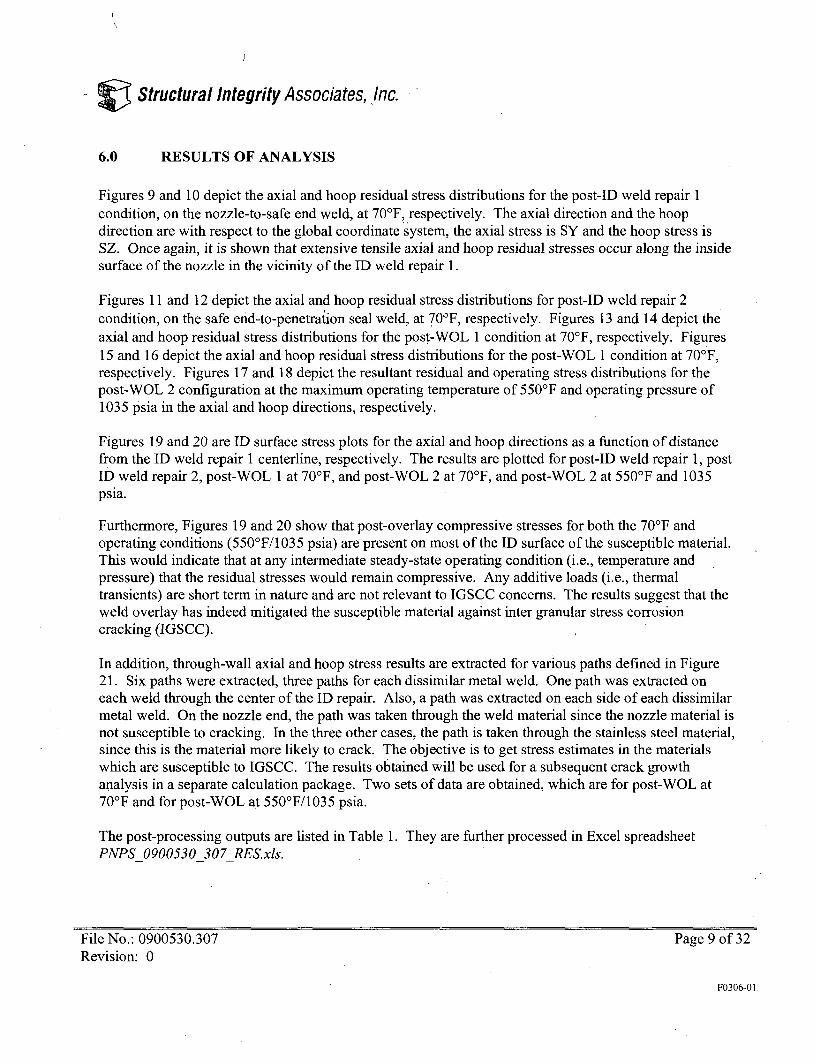
J
VStructural Integrity Associates, Inc.
6.0 RESULTS OF ANALYSIS
Figures 9 and 10 depict the axial and hoop residual stress distributions for the post-ID weld repair 1condition, on the nozzle-to-safe end weld, at 70'F, respectively. The axial direction and the hoopdirection are with respect to the global coordinate system, the axial stress is SY and the hoop stress isSZ. Once again, it is shown that extensive tensile axial and hoop residual stresses occur along the insidesurface of the nozzle in the vicinity of the ID weld repair 1.
Figures 11 and 12 depict the axial and hoop residual stress distributions for post-ID weld repair 2condition, on the safe end-to-penetration seal weld, at 70'F, respectively. Figures 13 and 14 depict theaxial and hoop residual stress distributions for the post-WOL 1 condition at 70'F, respectively. Figures15 and 16 depict the axial and hoop residual stress distributions for the post-WOL 1 condition at 70°F,respectively. Figures 17 and 18 depict the resultant residual and operating stress distributions for thepost-WOL 2 configuration at the maximum operating temperature of 550'F and operating pressure of1035 psia in the axial and hoop directions, respectively.
Figures 19 and 20 are ID surface stress plots for the axial and hoop directions as a function of distancefrom the ID weld repair 1 centerline, respectively. The results are plotted for post-ID weld repair 1, postID weld repair 2, post-WOL 1 at 70'F, and post-WOL 2 at 70'F, and post-WOL 2 at 550'F and 1035psia.
Furthermore, Figures 19 and 20 show that post-overlay compressive stresses for both the 70'F andoperating conditions (550'F/1035 psia) are present on most of the ID surface of the susceptible material.This would indicate that at any intermediate steady-state operating condition (i.e., temperature andpressure) that the residual stresses would remain compressive. Any additive loads (i.e., thermaltransients) are short term in nature and are not relevant to IGSCC concerns. The results suggest that theweld overlay has indeed mitigated the susceptible material against inter granular stress corrosioncracking (IGSCC).
In addition, through-wall axial and hoop stress results are extracted for various paths defined in Figure21. Six paths were extracted, three paths for each dissimilar metal weld. One path was extracted oneach weld through the center of the ID repair. Also, a path was extracted on each side of each dissimilarmetal weld. On the nozzle end, the path was taken through the weld material since the nozzle material isnot susceptible to cracking. In the three other cases, the path is taken through the stainless steel material,since this is the material more likely to crack. The objective is to get stress estimates in the materialswhich are susceptible to IGSCC. The results obtained will be used for a subsequent crack growthanalysis in a separate calculation package. Two sets of data are obtained, which are for post-WOL at70'F and for post-WOL at 550'F/1035 psia.
The post-processing outputs are listed in Table 1. They are further processed in Excel spreadsheetPNPS_0900530_307_RES.xls.
File No.: 0900530.307 Page 9 of 32Revision: 0
F0306-01
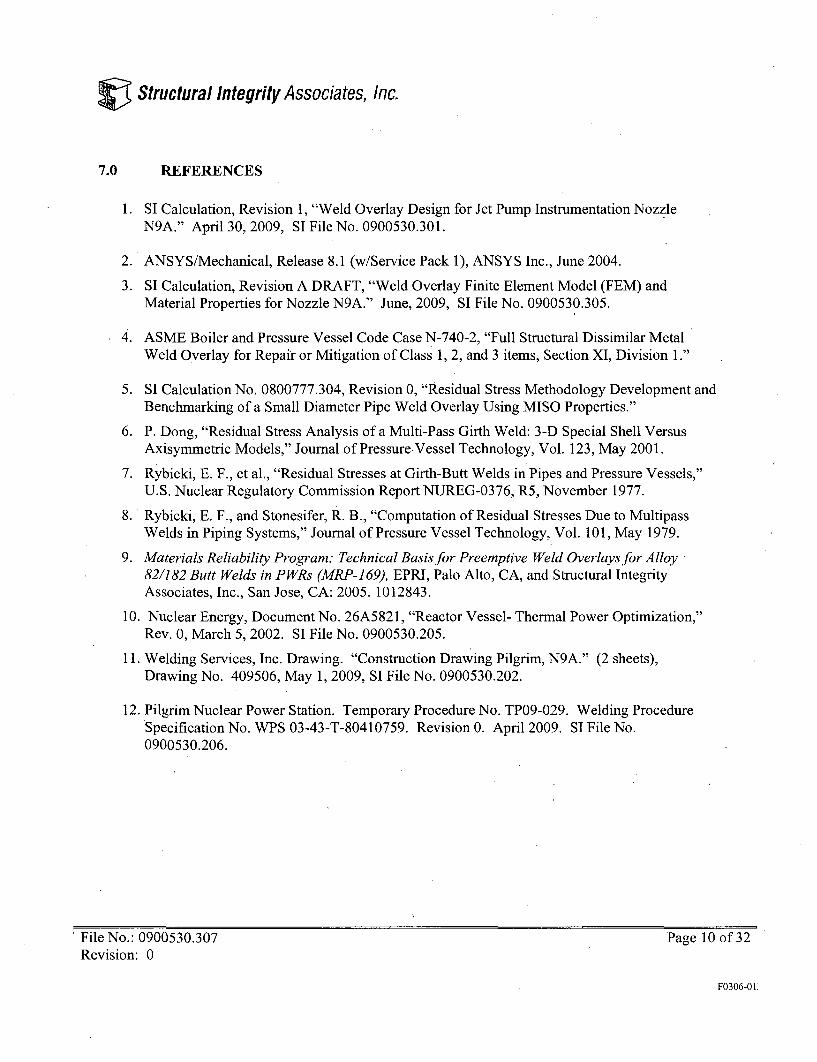
Structural Integrity Associates, Inc.
7.0 REFERENCES
1. SI Calculation, Revision 1, "Weld Overlay Design for Jet Pump Instrumentation NozzleN9A." April 30, 2009, SI File No. 0900530.301.
2. ANSYS/Mechanical, Release 8.1 (w/Service Pack 1), ANSYS Inc., June 2004.
3. SI Calculation, Revision A DRAFT, "Weld Overlay Finite Element Model (FEM) andMaterial Properties for Nozzle N9A." June, 2009, SI File No. 0900530.305.
4. ASME Boiler and Pressure Vessel Code Case N-740-2, "Full Structural Dissimilar MetalWeld Overlay for Repair or Mitigation of Class 1, 2, and 3 items, Section XI, Division 1."
5. SI Calculation No. 0800777.304, Revision 0, "Residual Stress Methodology Development andBenchmarking of a Small Diameter Pipe Weld Overlay Using MISO Properties."
6. P. Dong, "Residual Stress Analysis of a Multi-Pass Girth Weld: 3-D Special Shell Versus
Axisymmetric Models," Journal of Pressure-Vessel Technology, Vol. 123, May 2001.
7. Rybicki, E. F., et al., "Residual Stresses at Girth-Butt Welds in Pipes and Pressure Vessels,"U.S. Nuclear Regulatory Commission Report NUREG-0376, R5, November 1977.
8. Rybicki, E. F., and Stonesifer, R. B., "Computation of Residual Stresses Due to MultipassWelds in Piping Systems," Journal of Pressure Vessel Technology, Vol. 101, May 1979.
9. Materials Reliability Program: Technical Basis for Preemptive Weld Overlays for Alloy82/182 Butt Welds in PWRs (MRP-169), EPRI, Palo Alto, CA, and Structural IntegrityAssociates, Inc., San Jose, CA: 2005. 1012843.
10. Nuclear Energy, Document No. 26A5821, "Reactor Vessel- Thermal Power Optimization,"Rev. 0, March 5, 2002. SI File No. 0900530.205.
11. Welding Services, Inc. Drawing. "Construction Drawing Pilgrim, N9A." (2 sheets),Drawing No. 409506, May 1, 2009, SI File No. 0900530.202.
12. Pilgrim Nuclear Power Station. Temporary Procedure No. TP09-029. Welding ProcedureSpecification No. WPS 03-43-T-80410759. Revision 0. April 2009. SI File No.0900530.206.
File No.: 0900530.307 Page 10 of 32Revision: 0
F0306-01

Structural Integrity Associates, Inc.
Table 1: ANSYS Input and Output Files
- IputFie -. >y*>'~.<- De'scrip'fioifCornmente',"
PNPS-N9.INP Structural geometry for 2D axisymmetric geometry [3]
MProp MISO NLinear PNPS.INP Material Property data of E, alpha, conductivity, specific heat, and stress strain curves [3]
BCNUGGET2D.INP Weld nuggets definition and boundary conditions file
PICK2D.[NP Writes boundary conditions and nugget definitions into BCNUGGET2D.INP file
THERMAL2D.INP Thermal pass for simulating weld processes
STRESS2D.INP Stress pass for simulating weld processes
WELD1 mntr.INP Contains LDREAD commands for ID weld repair 1 portion of the stress pass
WELD2 mntr.INP Contains LDREAD commands for ID weld repair 2 portion of the stress pass
WELD3 mntr.INP Contains LDREAD commands for WOL 1 portion of the stress pass
WELD4 mntr.INP Contains LDREAD commands for'WOL 2 portion of the stress pass
POST2D PATH.INP Post-processing file to extract path stresses
POST2D ID.INP Post-processing file to extract ID surface stresses
File -, . Descrlptloii/omment
PATH T70.OUT Path stress outputs for post-WOL 2 at 70TF
PATH T550 P1035.OUT Path stress outputs for post-WOL 2 at 550TF and 1035 psia
ID NLIST.OUT ID surface nodal coordinate outputs
ID WELD1.OUT ID surface stress outputs for post-ID weld repair 1 at 70TF
ID WELD2.OUT ID surface stress outputs for post-ID weld repair 2 at 70TF
ID WELD3.OUT ID surface stress outputs for post-WOL 1 at 70TF
ID T70.OUT ID surface stress outputs for post-WOL 2 at 70°F
ID T550 P1035.OUT ID surface stress outputs for post-WOL 2 at 550TF and 1035 psia
PNPS 0900530 307 RES.xls Excel spreadsheet containing all output data
File No.: 0900530.307Revision: 0
Page 11 of 32
F0306-01E
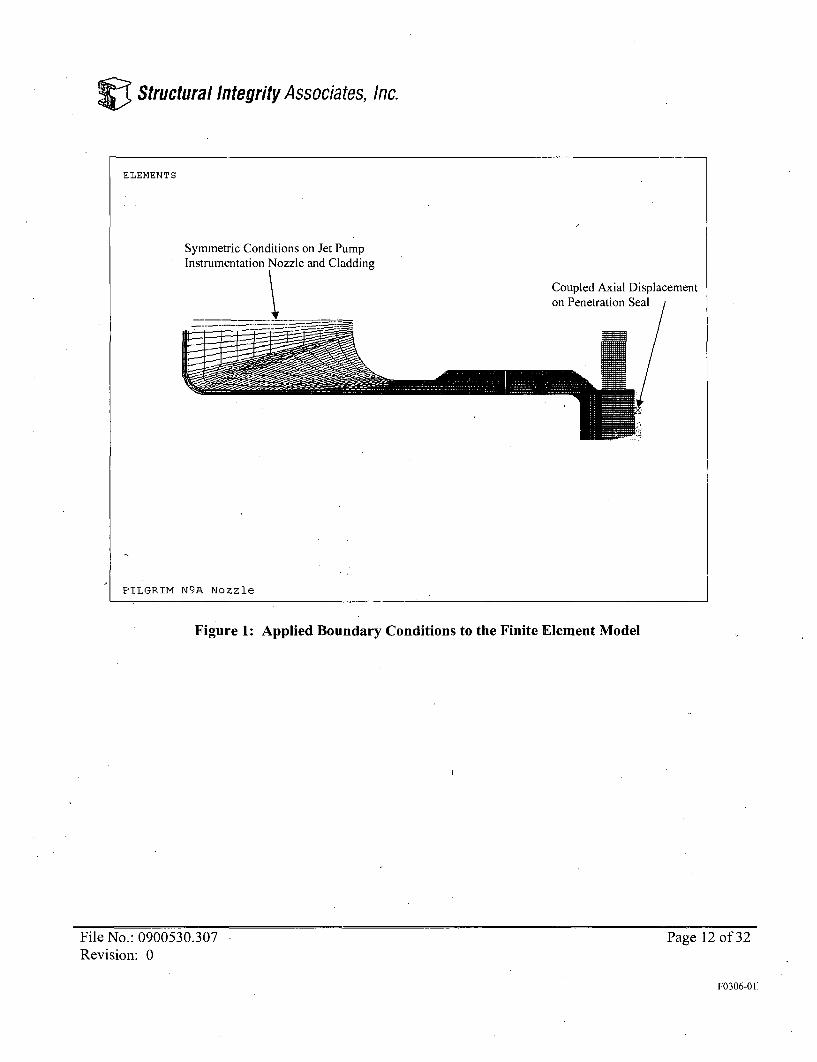
V Structural Integrity Associates, Inc.
Figure 1: Applied Boundary Conditions to the Finite Element Model
File No.: 0900530.307Revision: 0
Page 12 of 32
F0306-01f
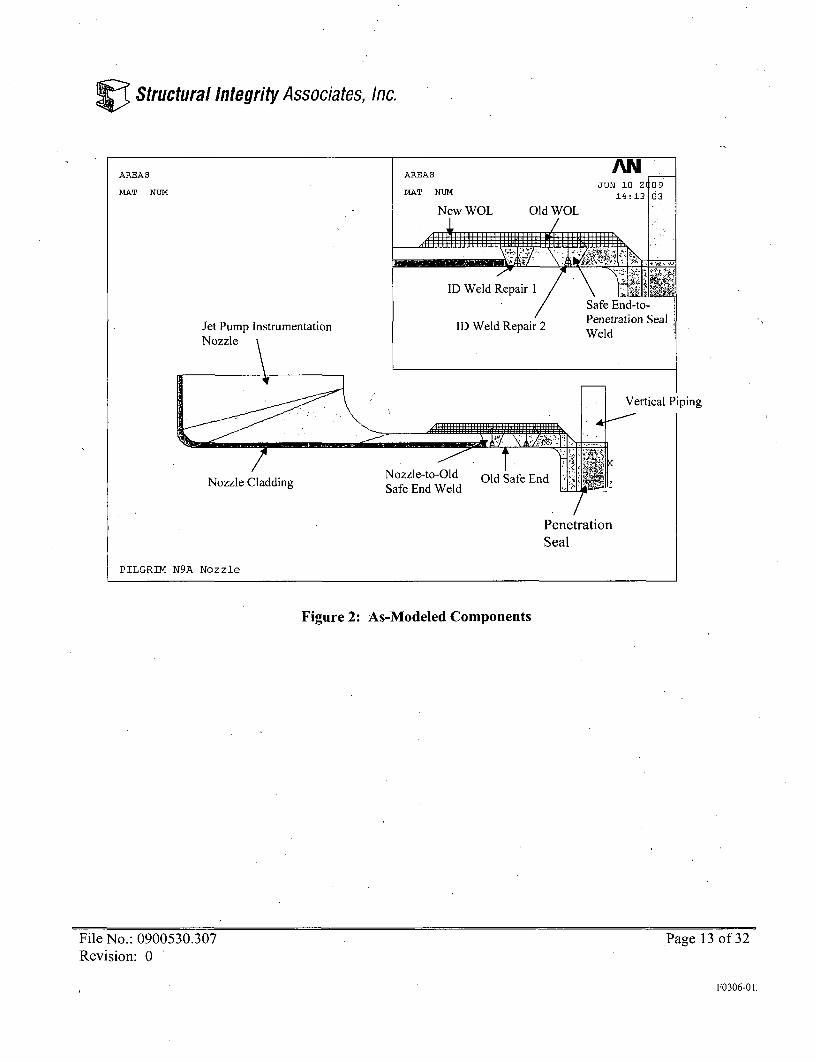
V Structural Integrity Associates, Inc.
AREAS
MAT NUM
AREAS' jW --
MAT NUM 14 :13 b
New WOL Old WOL
ID Weld Repair 1/Safe End-to-Penetration Seal
ID Weld Repair 2 WeldWeldJet Pump Instrumentation
Nozzle \
Piping
Nozzle CladdingNozzle-to-Old Old ýafe EndSafe End Weld
Seal
PILGRIM NYA Nozzle
Figure 2: As-Modeled Components
File No.: 0900530.307Revision: 0
Page 13 of 32
F0306-01
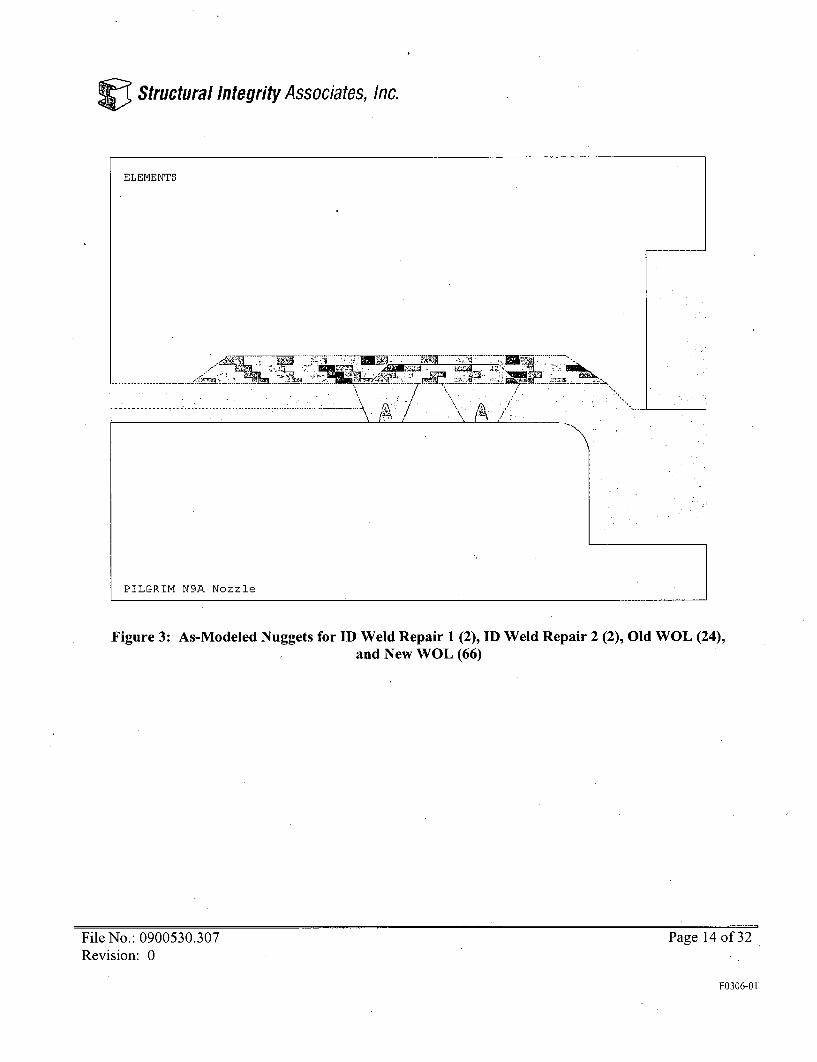
V Structural Integrity Associates, Inc.
ELEMENTS
------- ------. . . .. . ----------- ........ : --...
.... .... .... .... .... .<--i ...- .% .L."... • ,..... ...........-.... •
PILGRIM N9A Nozzle
Figure 3: As-Modeled Nuggets for ID Weld Repair 1 (2), ID Weld Repair 2 (2), Old WOL (24),and New WOL (66)
File No.: 0900530.307Revision: 0
Page 14 of 32
F0306-01O
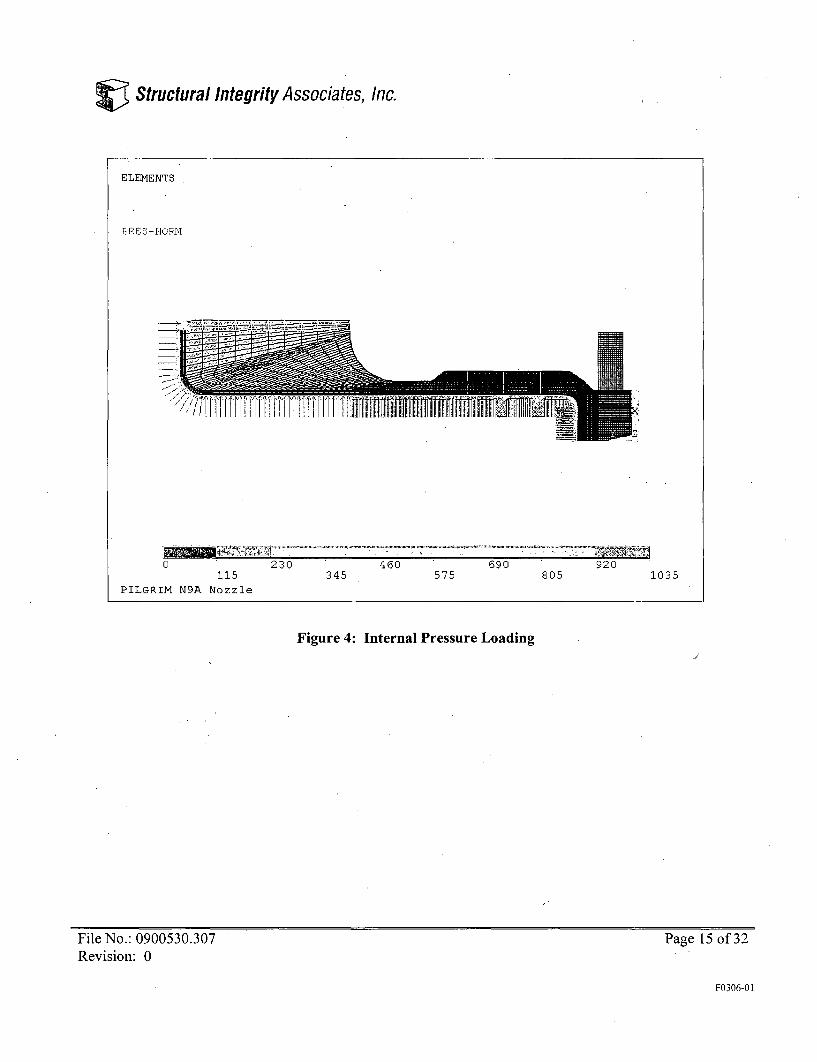
Structurai Integrity Associates, Inc.
ELEMENTS
_____ A-
0 230 460 690 920115 345 575 805 1035
PILGRIM N9A Nozzle
Figure 4: Internal Pressure Loading
File No.: 0900530.307Revision: 0
Page 15 of 32
F0306-01
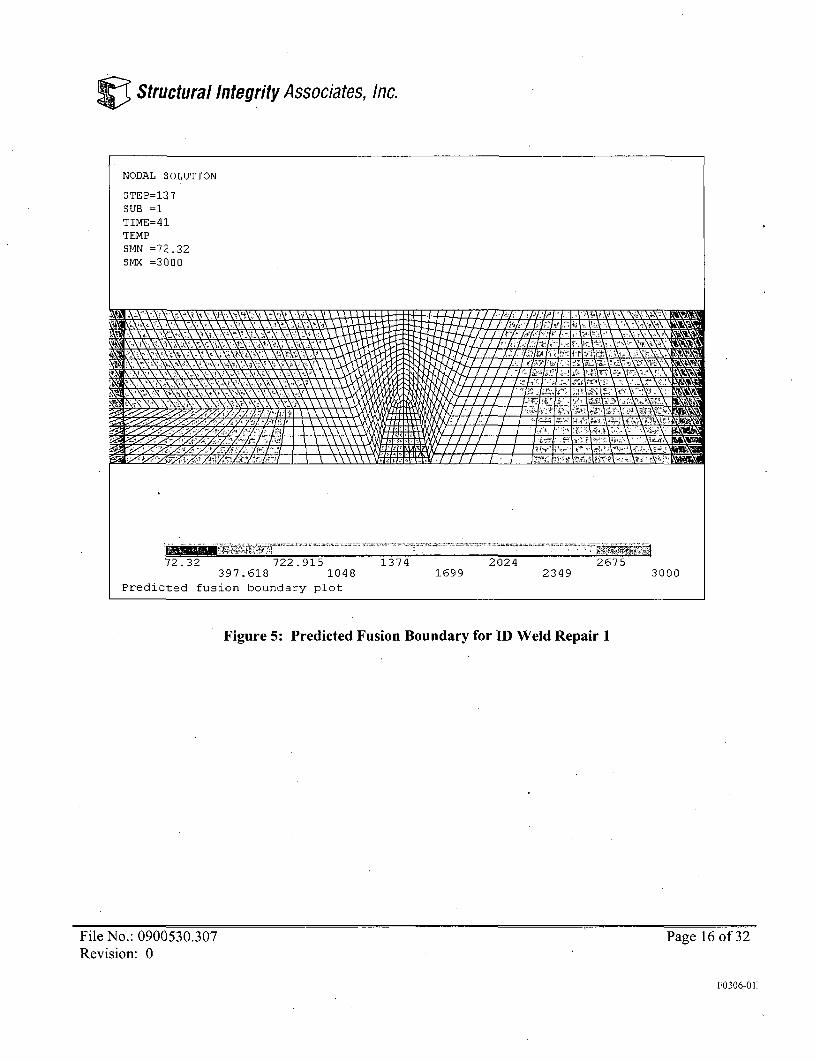
Structural Integrity Associates, Inc.
NODAL SOLUTION
STEP=137SUB =1TIME=41TEMPSMN =72.32SMX =3000
. .. . . i"h ... ......r -,, ,172 32 722.915 1374 2024 2675397 618 1048 1699 2349 3000
Predicted fusion boundary plot
Figure 5: Predicted Fusion Boundary for ID Weld Repair 1
File No.: 0900530.307Revision: 0
Page 16 of 32
F0306-01:
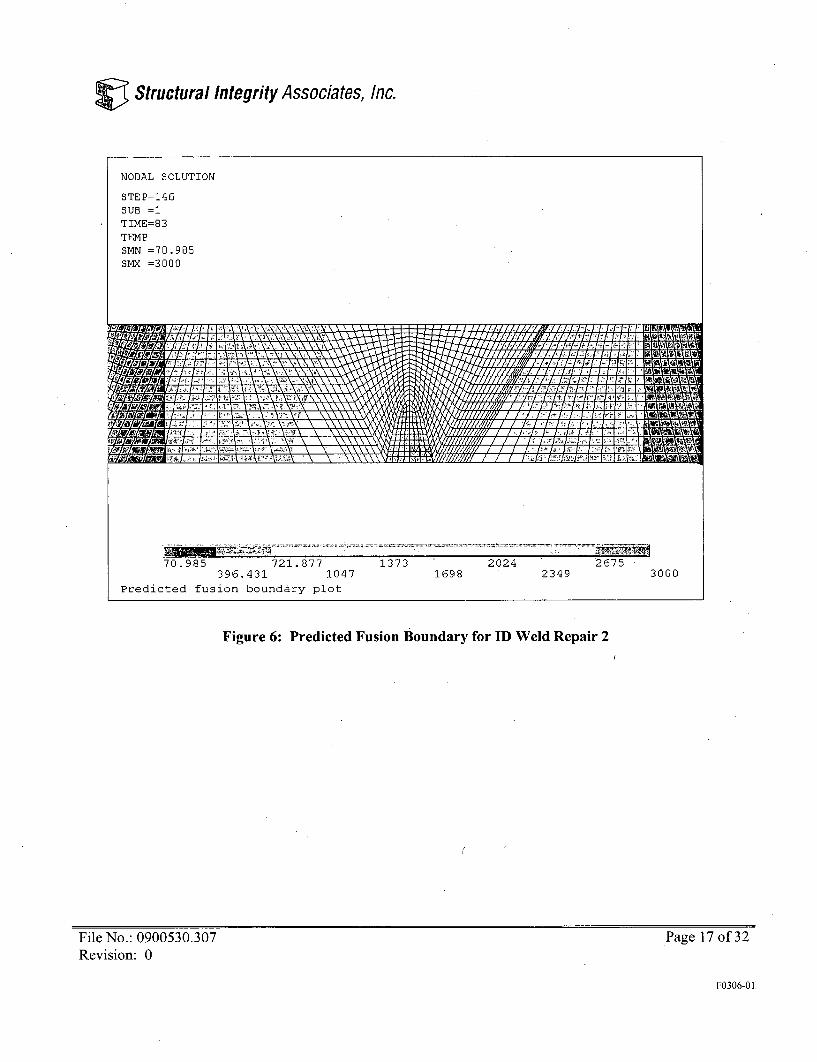
V Structural Integrity Associates, Inc.
NODAL SOLUTION
STEP=146SUB =1TIME=83TEMPSMN =70.985SMX =3000
70.985 721.877 1373 2024 2675396.431 1047 1698 2349 3000
Predicted fusion boundary plot
Figure 6: Predicted Fusion Boundary for ID Weld Repair 2
File No.: 0900530.307Revision: 0
Page 17 of 32
F0306-01

r Structural Integrity Associates, Inc.
NODAL SOLUTION
STE2=1204SUB =1TIME=178TEMPSMN =74.312SMX =3000
-HE HI4r~ I;iI ,11611 E ,1 , -,1 1'1 ;11E
F FH9 Fi F F 1 'i
74.312 724.465 1375 2025 2675399.389 1050 1700 2350 3000
Predicted fusion boundary plot
Figure 7: Predicted Fusion Boundary for Weld Overlay 1
File No.: 0900530.307Revision: 0
Page 18 of 32
F0306-01
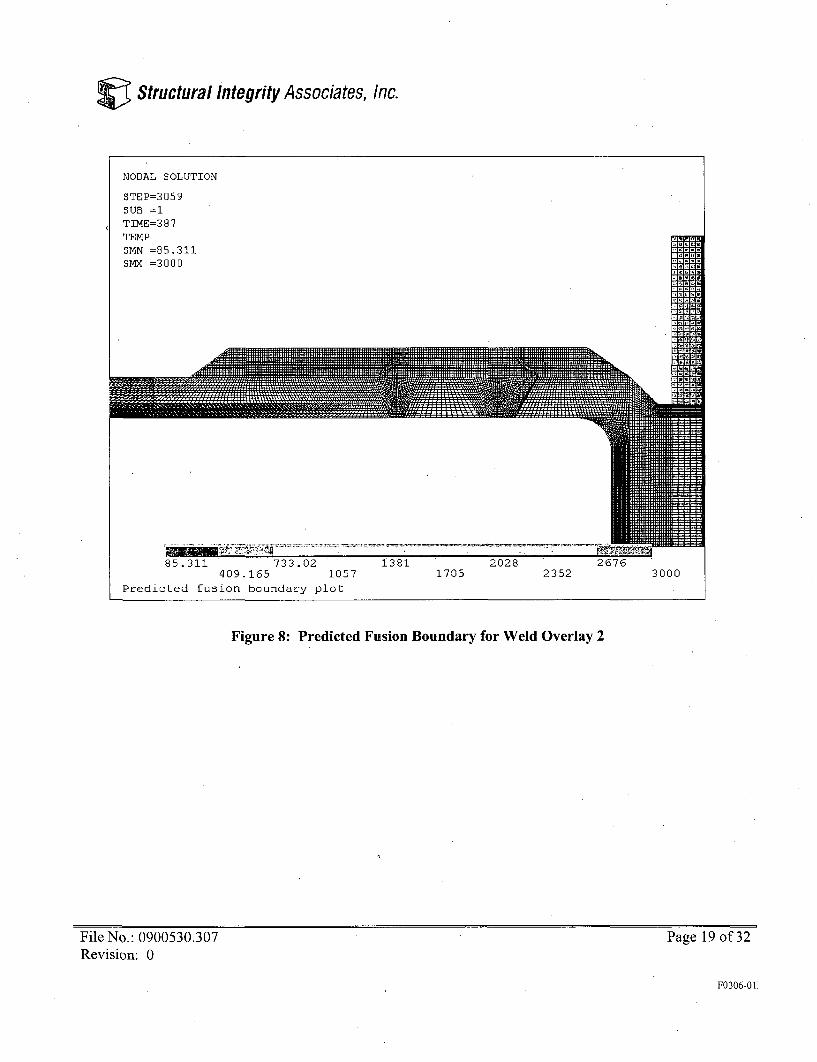
V Structural Integrity Associates, Inc.
Figure 8: Predicted Fusion Boundary for Weld Overlay 2
File No.: 0900530.307Revision: 0
Page 19 of 32
F0306-01.
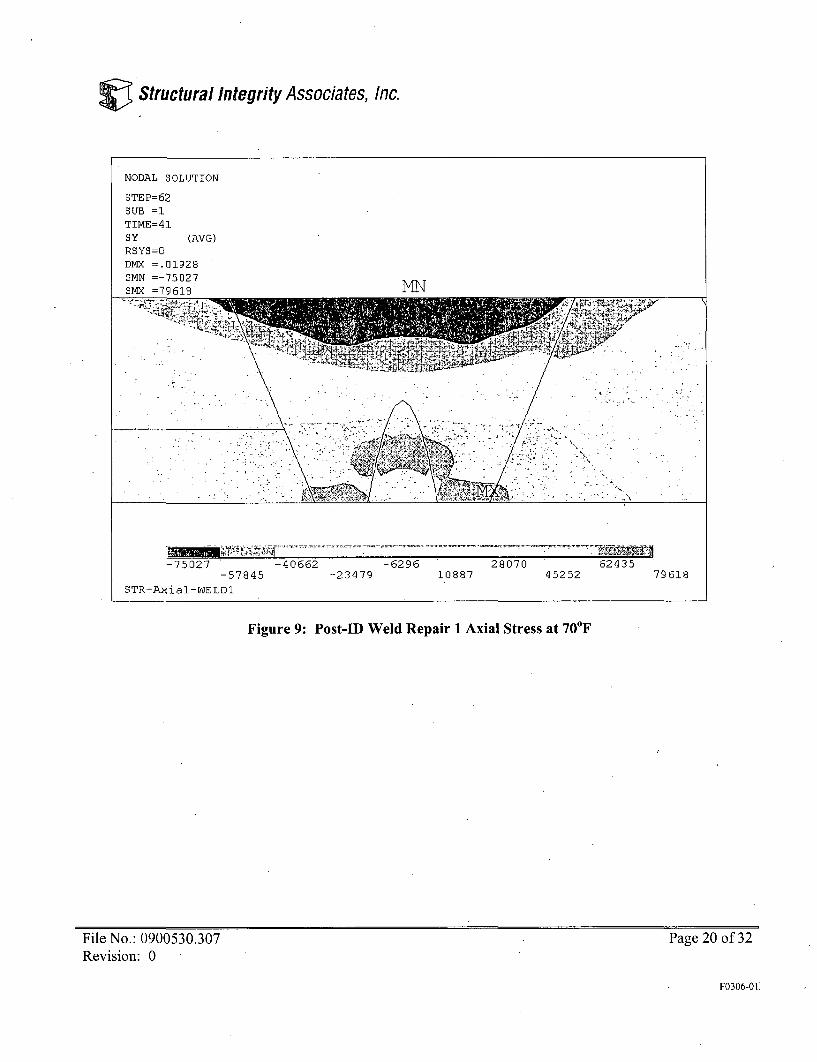
V Structural Integrity Associates, Inc.
Figure 9: Post-ID Weld Repair 1 Axial Stress at 70'F
File No.: 0900530.307Revision: 0
Page 20 of 32
F0306-01I
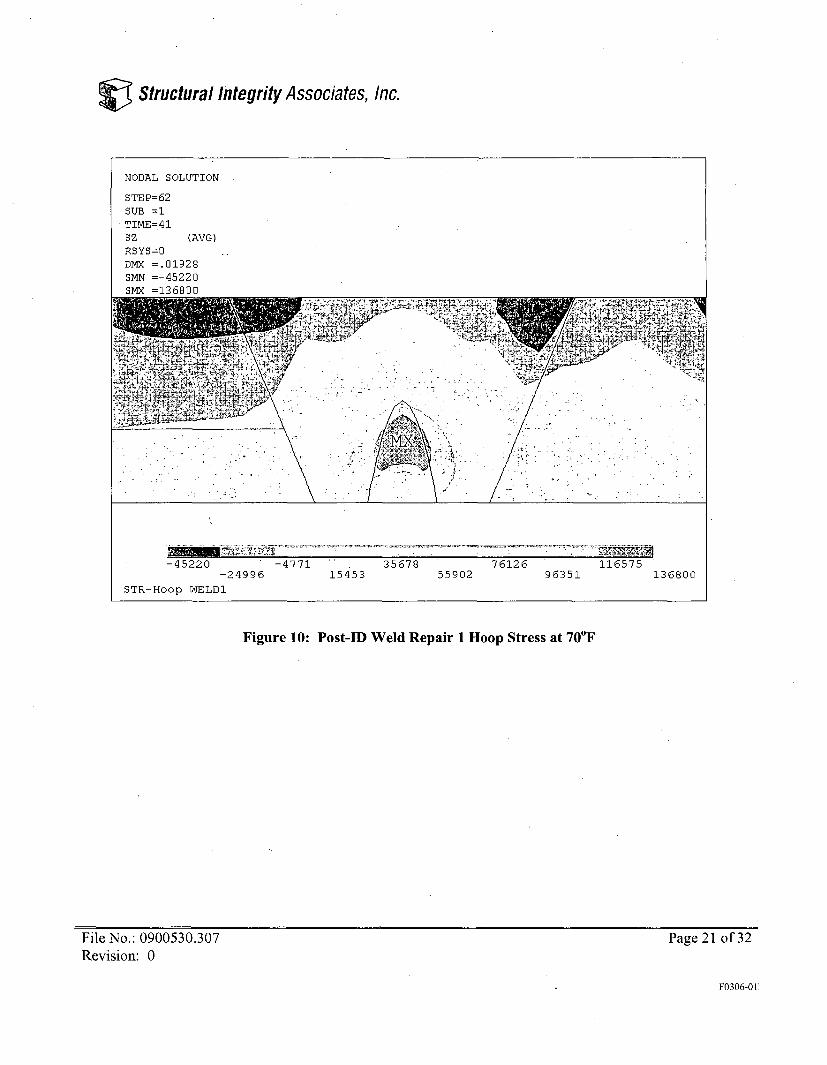
V Structural Integrity Associates, Inc.
NODAL SOLUTION
STEP=62SUB =1TIME=41Sz (AVG)RSYS=0DMX =.01928SMN =-45220SMX =136800
Figure 10: Post-ID Weld Repair 1 Hoop Stress at 70°F
File No.: 0900530.307Revision: 0
Page 21 of 32
F0306-01

r Structural Integrity Associates, Inc.
Figure 11: Post-ID Weld Repair 2 Axial Stress at 70°F
File No.: 0900530.307Revision: 0
Page 22 of 32
F0306-011
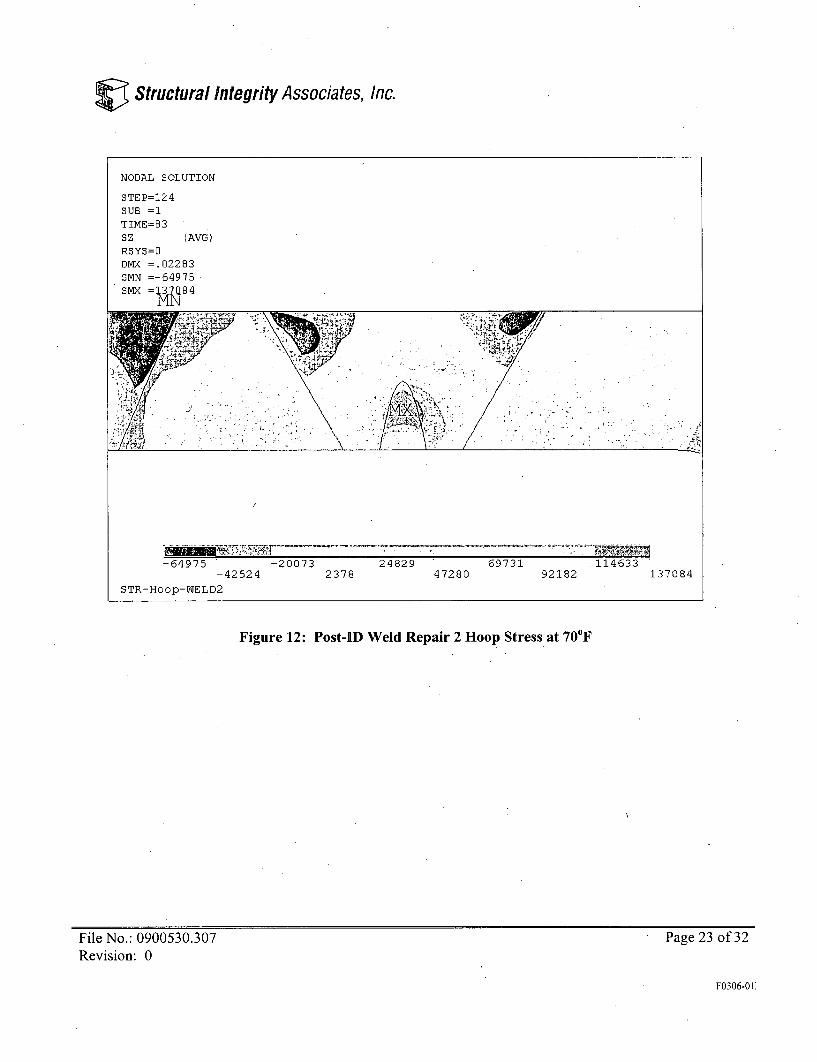
V Structural Integrity Associates, Inc.
Figure 12: Post-ID Weld Repair 2 Hoop Stress at 70'F
File No.: 0900530.307Revision: 0
Page 23 of 32
F0306-01I
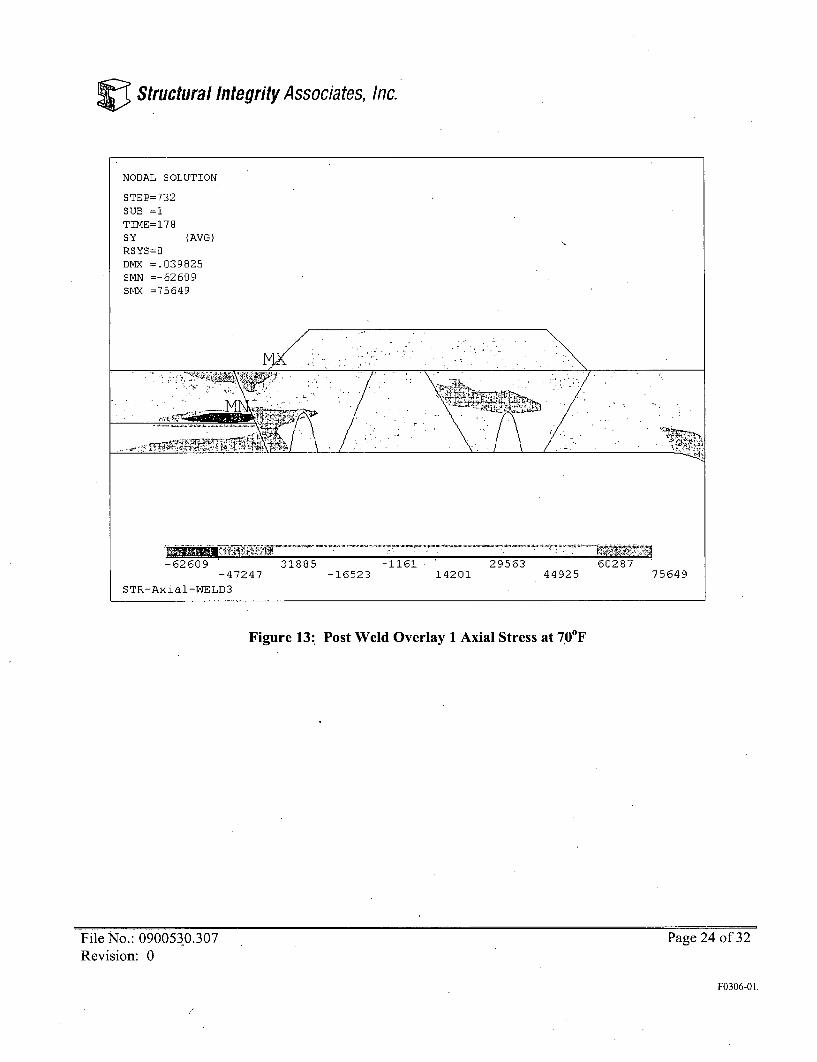
V Structural Integrity Associates, Inc.
Figure 13: Post Weld Overlay 1 Axial Stress at 70°F
File No.: 0900530.307Revision: 0
Page 24 of 32
F0306-01.

Structural Integrity Associates, Inc.
Figure 14: Post Weld Overlay 1 Hoop Stress at 70'F
File No.: 0900530.307Revision: 0
Page 25 of 32
F0306-01:
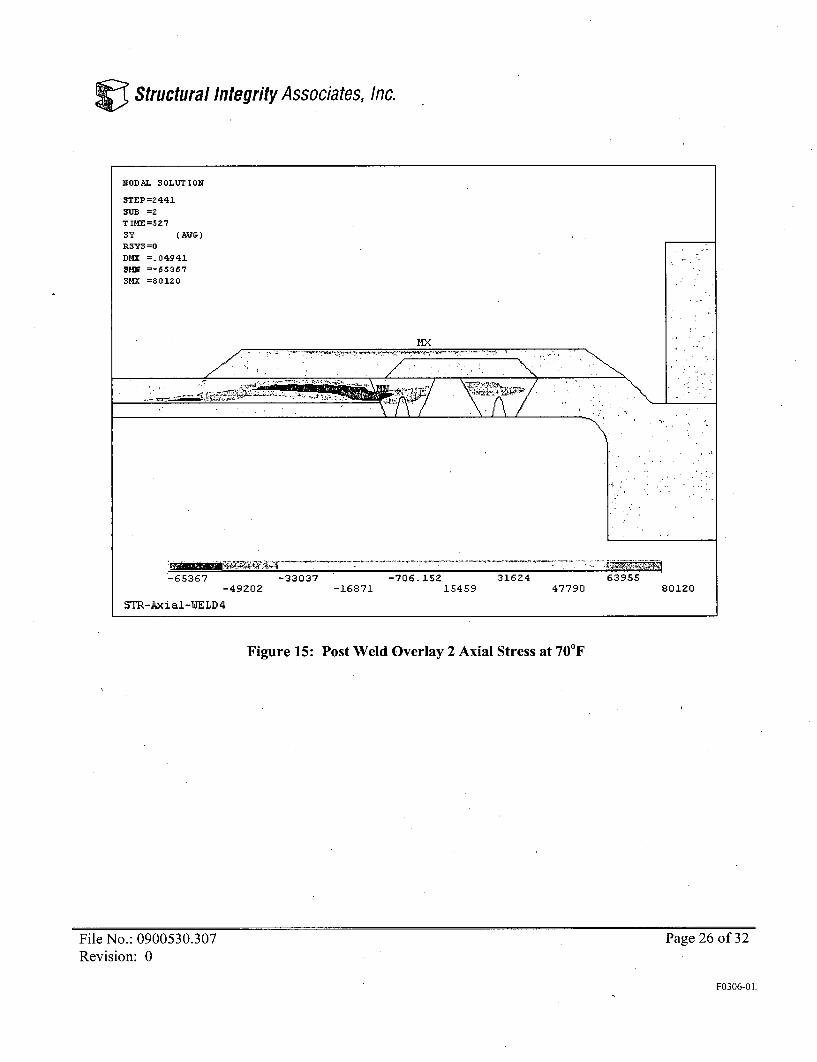
Structural Integrity Associates, Inc.
Figure 15: Post Weld Overlay 2 Axial Stress at 70'F
File No.: 0900530.307Revision: 0
Page 26 of 32
F0306-01

V Structural Integrity Associates, Inc.
Figure 16: Post Weld Overlay 2 Hoop Stress at 70°F
File No.: 0900530.307Revision: 0
Page 27 of 32
F0306-0L
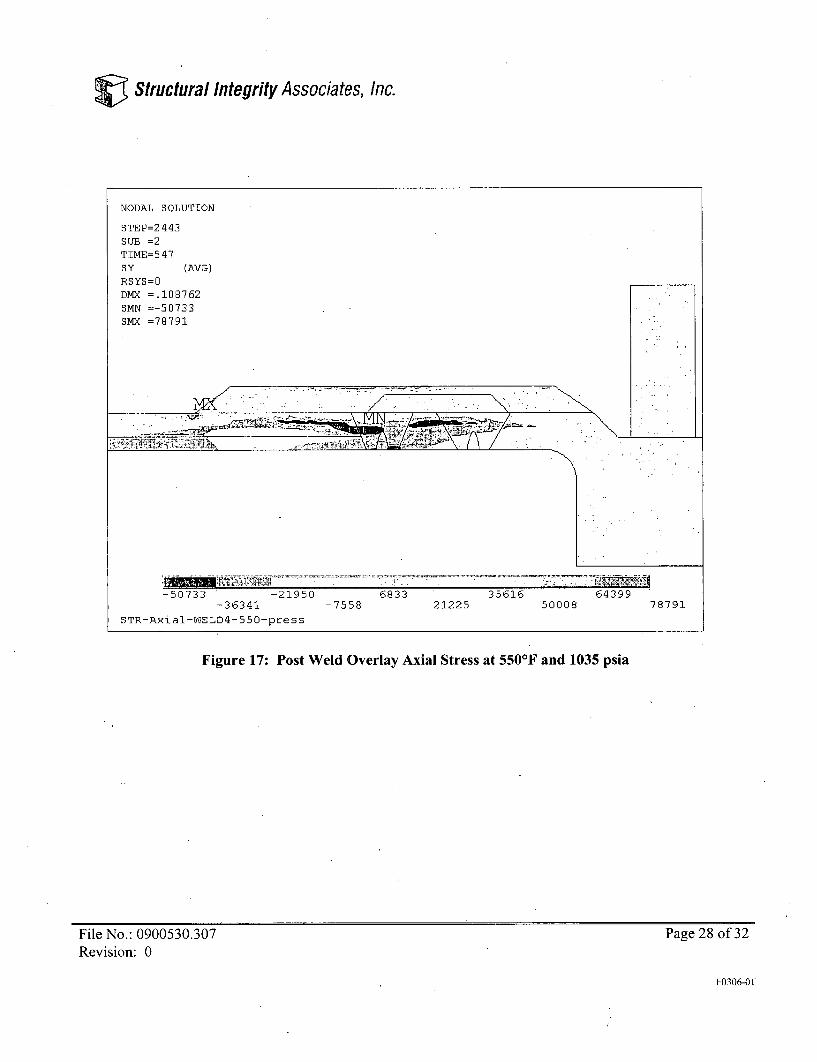
V Structural Integrity Associates, Inc.
Figure 17: Post Weld Overlay Axial Stress at 5501F and 1035 psia
File No.: 0900530.307Revision: 0
Page 28 of 32
F0306-O1
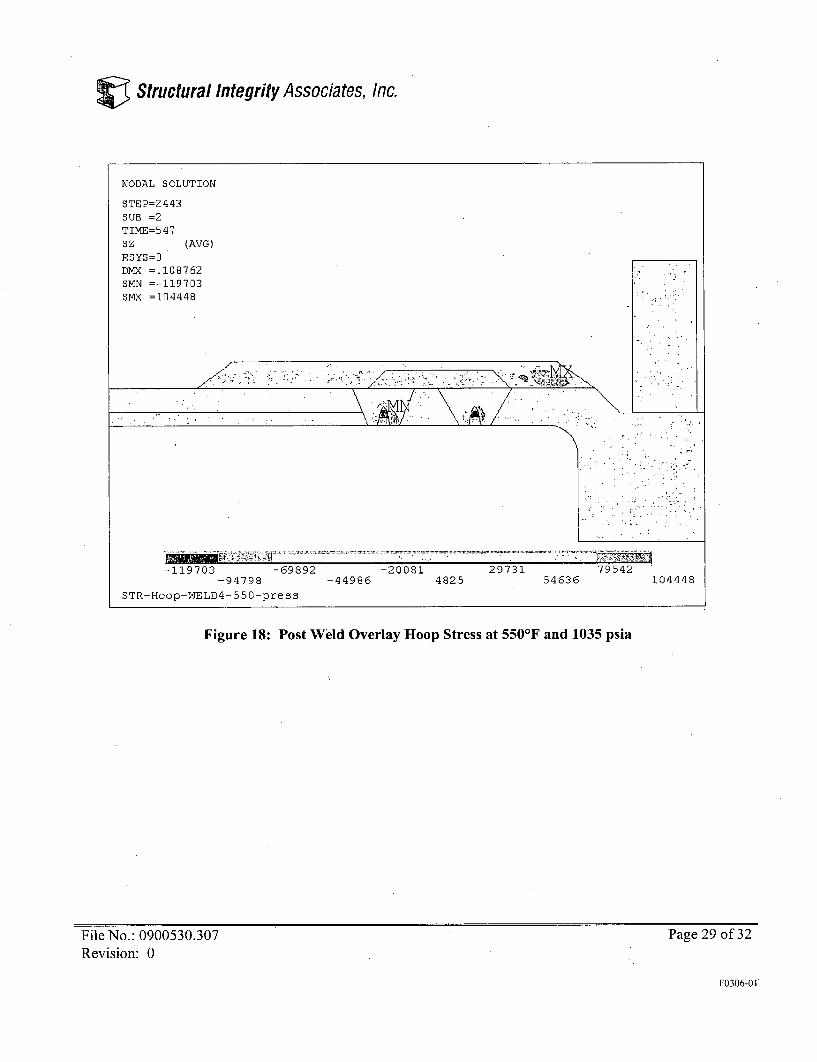
V Structural Integrity Associates, Inc.
Figure 18: Post Weld Overlay Hoop Stress at 550'F and 1035 psia
File No.: 0900530.307Revision: 0
Page 29 of 32
F0306-01:

V Structural Integrity Associates, Inc.
ID Surface Axial Residual Stresse Post ID weld repair 1 70OF --3-Post. ID w
-A•- Post weld ov erl ay 2 70°F Post weld
• Postweld overlay 1 70°F H-- Hea tA ff e
140-- Nozzle - :afe End120.
100
80 g ,,
260W 8 . ..
44A
(0 0 /ýt'R ½.~
-20 -1_ __ _ __ _ _
-60
-80
eld repair 2 70°F
overlay 550'F/1035 psia
•cted Zo nes
Distance from ID Weld Repair Centerline (in)
Figure 19: ID Surface Axial Residual Stress
File No.: 0900530.307Revision: 0
Page 30 of 32
F0306-01l
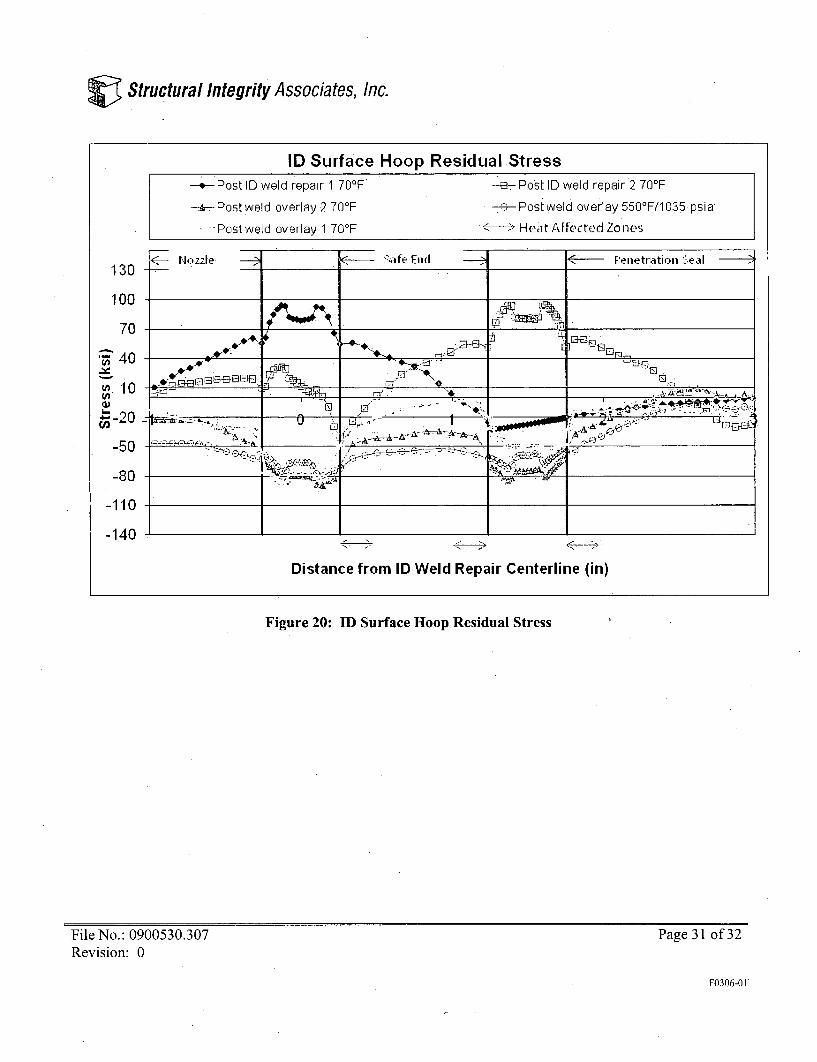
Structural Integrity Associates, Inc.
Figure 20: ID Surface Hoop Residual Stress
File No.: 0900530.307Revision: 0
Page 31 of 32
F0306-01.
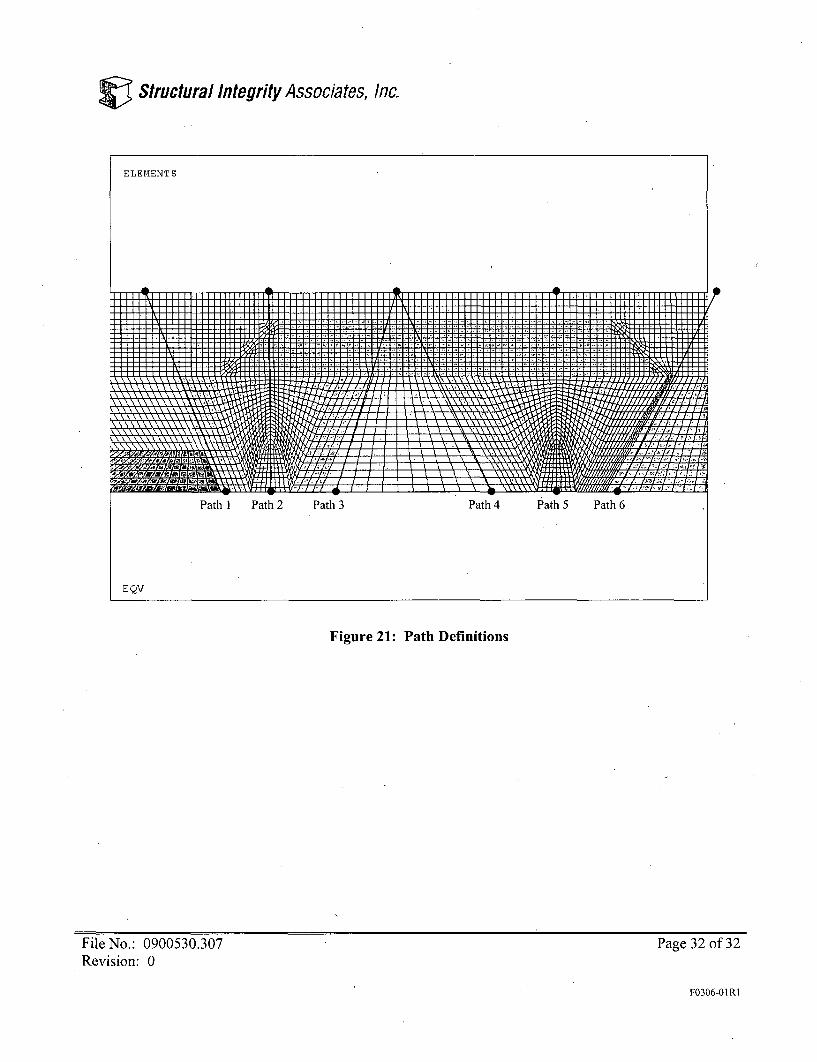
V Structural Integrity Associates, Inc.
Figure 21: Path Definitions
File No.: 0900530.307Revision: 0
Page 32 of 32
F0306-OIRI

ATTACHMENT 4To Entergy Letter No. 2.09.050
Structural Intelrity Associates, Inc. File No. 0900530.308, "Crack Growth Analysis for
Jet Pump Instrument Nozzle (N9A)". dated August 10, 2009
(55 pages)
V Structural Integrity Associates, Inc. File No.: 0900530.308
CALCULATION PACKAGE Project No.: 0900530Quality Program: Z Nuclear 0 Commercial
PROJECT NAME:Pilgrim Top Head Flaw and N9 Weld Overlay
CONTRACT NO.:
10235773-01
CLIENT: PLANT:Entergy Nuclear Operations, Inc. Pilgrim Nuclear Power Station
CALCULATION TITLE:Crack Growth Analysis for Jet Pump Instrumentation Nozzle (N9A)
Document Affected Project Manager Preparer(s) &Revision Pages Revision Description Approval Checker(s)Signature & Date Signatures & Date
0 1 - 4' Initial IssueA- I- A-20B1- - B-21 H. L. Gustin Charlotte J. Herhold
08/10/09 Preparer08/10/09
H. L. GustinPreparer08/10/09
Terry J. HerrmannIndependent Verifier
08/10/09
Page 1 of 14F0306-01 RO
Structural Integrity Associates, Inc.
Table of Contents
1.0 INTRODUCTION/OBJECTIVE ............................................................................... 3
2.0 M ETH O D O LO G Y .................................................................................................. 3
3.0 DESIGN INPUTS ................................................ 4
3.1 M aterials and G eom etry .............................................................................. 4
3.2 Loading ....................................................................................................... 4
4.0 A SSU M PTION S ................................................................................................... 7
5.0 CRACK GROWTH CALCULATIONS .................. ................................................. 8
5.1 Fatigue Crack Growth (FCG) ....................................................................... 8
5.2 Intergranular Stress Corrosion Cracking (IGSCC) .................... 8
6.0 RESULTS AND CONCLUSIONS ....................................................................... 10
7.0 REFEREN C ES .................................................................................................... II
APPENDIX A IGSCC CASE PC-CRACK OUTPUT FILES ........................................ A-1
APPENDIX B FCG CASE PC-CRACK OUTPUT FILES ............................................. B-1
List of Tables
Table 1: Results Sum m ary ................................................................................................ 12
List of Figures
Figure 1. Path D efinitions [4] ........................................................................................... 13
Figure 2. Fracture Mechanics Results, K-vs-a Curve (from pc-CRACK) ......................... 14
File No.: 0900530.308 Page 2 of 14Revision: 0
F0306-01O
Structural Integrity Associates, Inc.
1.0 INTRODUCTION/OBJECTIVE
A weld overlay was applied to the N9A Jet Pump Instrumentation nozzle at Pilgrim Nuclear PowerStation during the Spring 2009 refueling outage [6]. This weld overlay was applied over apreexisting 1984 weld overlay that was applied to mitigate a flaw found in the original Type 304safe end between the nozzle and penetration seal [1]. The original 1984 weld overlay did notsufficiently cover all potentially IGSCC-susceptible weld locations at the nozzle to safe end joint,thus necessitating the application of the 2009 weld overlay. The station has made commitments toperform analyses, including finite element stress analyses, of the 2009 weld overlay followingstartup.
The purpose of this calculation package is to apply linear elastic fracture mechanics (LEFM) tocalculate crack growth in the nozzle-to-safe end dissimilar metal weld (DMW) for the reactorpressure Vessel (RPV) jet pump instrumentation nozzle N9A at Pilgrim Nuclear Power Station.Loads considered are internal pressure and weld overlay (WOL) repair residual stresses. Bothfatigue crack growth (FCG) and Intergranular Stress Corrosion Cracking (IGSCC) are considered.
2.0 METHODOLOGY
The allowable end-of-evaluation period flaw depth to thickness ratio (a/t) was taken from TableIWB-3641-3, which is derived by the methodology of Appendix C of ASME Code, Section XI [2].The geometry and design pressure for the N9A nozzle is documented in a separate design inputcalculation [3]. The post-weld overlay (WOL) repair residual stresses are documented in a separatestress analysis calculation [4].
Crack growth is computed using linear elastic fracture mechanics (LEFM) techniques. IGSCCgrowth is determined by computing the stress intensity factor versus flaw depth curve (K-vs.-a) atsteady state normal operating conditions. Crack growth laws for Alloy 600 weld metals (Alloy82/Alloy 182) are used at the susceptible DMW material region [2, 10]. The time for the observedflaw to grow to 75% of the weld thickness is determined, with and without the benefit of WOLresidual stresses.
*The crack growth analysis was performed using the LEFM analysis option in pc-CRACK forWindowsTM software [5]. This software includes options for the evaluation of FCG and IGSCC, andallows for defining load cases, material properties, crack models, and the selection of the applicablecrack growth law. Appendix A contains pc-CRACK output of the IGSCC growth analysis andAppendix B contains pc-CRACK output of the FCG growth analysis.
File No.: 0900530.308 Page 3 of 14Revision: 0
F0306-01O
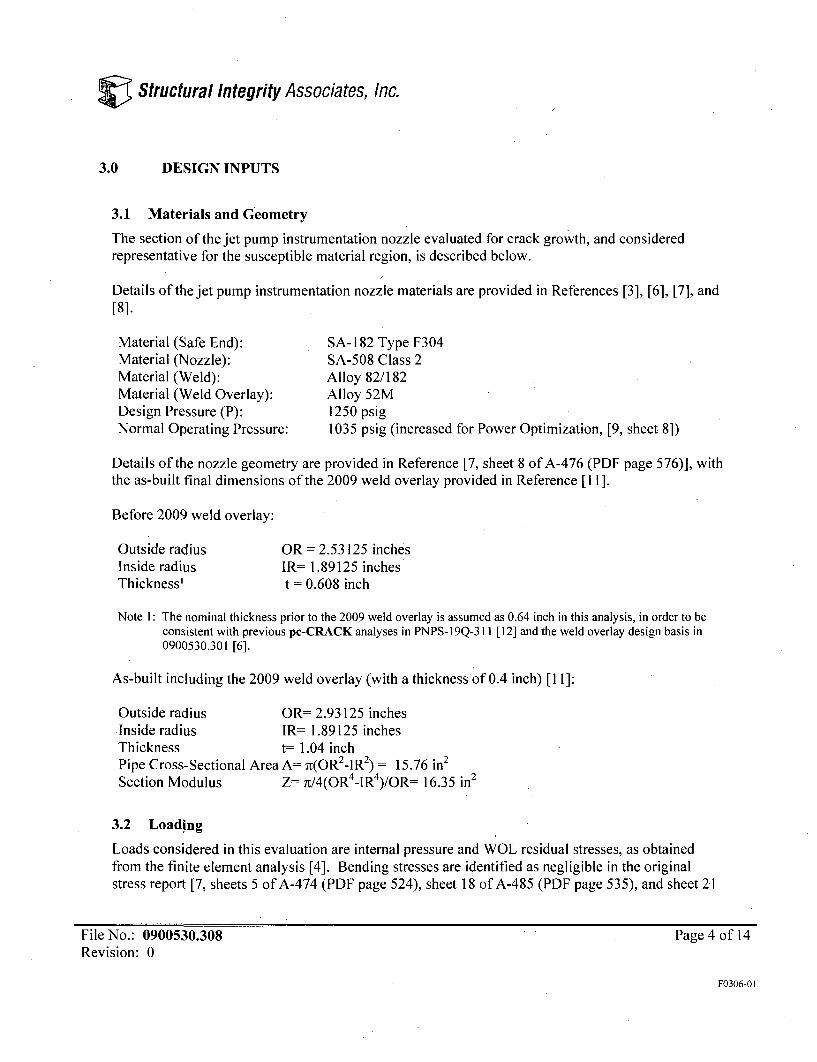
Structural Integrity Associates, Inc.
3.0 DESIGN INPUTS
3.1 Materials and Geometry
The section of the jet pump instrumentation nozzle evaluated for crack growth, and consideredrepresentative for the susceptible material region, is described below.
Details of the jet pump instrumentation nozzle materials are provided in References [3], [6], [7], and[8].
Material (Safe End):Material (Nozzle):Material (Weld):Material (Weld Overlay):Design Pressure (P):Normal Operating Pressure:
SA-182 Type F304SA-508 Class 2Alloy 82/182Alloy 52M1250 psig1035 psig (increased for Power Optimization, [9, sheet 8])
Details of the nozzle geometry are provided in Reference [7, sheet 8 of A-476 (PDF page 576)], withthe as-built final dimensions of the 2009 weld overlay provided in Reference [I I].
Before 2009 weld overlay:
Outside radiusInside radiusThickness'
OR = 2.53125 inchesIR= 1.89125 inchest = 0.608 inch
Note 1: The nominal thickness prior to the 2009 weld overlay is assumed as 0.64 inch in this analysis, in order to beconsistent with previous pc-CRACK analyses in PNPS-19Q-311 [12] and the weld overlay design basis in0900530.301 [6].
As-built including the 2009 weld overlay (with a thickness of 0.4 inch) [11]:
Outside radius OR= 2.93125 inches.Inside radius IR=I1.89125 inchesThickness t= 1.04 inchPipe Cross-Sectional Area A= 7r(OR 2-IR 2) = 15.76 in2
Section Modulus Z= 7t/4(OR 4-IR4)/OR= 16.35 in2
3.2 Loading
Loads considered in this evaluation are internal pressure and WOL residual stresses, as obtainedfrom the finite element analysis [4]. Bending stresses are identified as negligible in the originalstress report [7, sheets 5 of A-474 (PDF page 524), sheet 18 of A-485 (PDF page 535), and sheet 21
File No.: 0900530.308Revision: 0
Page 4 of 14
F0306-01O
Structural Integrity Associates, Inc.
of A-488 (PDF page 538)], and are therefore not included in this analysis. The flaw is assumed tobe a circumferential flaw, and thus is unaffected by hoop stresses. Therefore, axial stresses due tointernal pressure are the only stresses that could contribute to crack growth of a circumferentialflaw. The axial pressure stresses will be treated as a membrane stress, which is constant across theentire thickness of the pipe.
The through-wall residual stress distributions are curve fit with a third order polynomial in formshown below:
C(X) C 0 + ClX + C 2 x2
+C 3x3 (1)
where:cy = axial stressx = distance from inside surface
Residual stress results were obtained for through-wall paths in the susceptible material regions. Thepaths used are as defined in Figure 1. Six paths were extracted, three paths for each dissimilarmetal weld. One path was extracted on each weld through the center of the repair. Also, a pathwas extracted on each side of each dissimilar metal weld. On the nozzle end, the path (Path 1) wastaken through the weld material since the nozzle material is not susceptible to cracking. In the threeother cases, the path is taken through the stainless steel material, since this is the material morelikely to crack. Two sets of data are obtained, which are for post-WOL at 707F and for post-WOLat 550'F/1 035 psig. The intent for this approach is to characterize the residual stresses for each ofthe different loading conditions for six different locations associated with the DMW. Residualstresses have a strong effect on IGSCC growth. They have a much less significant effect on fatigue •crack growth, since they are steady state secondary stresses, and contribute to FCG only through amean stress effect.
Internal Pressure
The pressure stress is evaluated at the normal operating pressure, 1035 psig, and as-builtdimensions of the nozzle, which is appropriate for crack growth calculations. The primary axialstress (PAxial) is a combination of the stress of the end cap (Gendcap) and the pressure stress (Gpressure).
P(Q * IR2 )endcap= r(OR2 -I R 2)
1035(Qr * 1.891252)
aendcap= Zr(2.93125 2 - 1.891252)
Gendcap- 738 psi
P*ORapressure= 22t
File No.: 0900530.308 Page 5 of 14Revision: 0
F0306-01,

-Structural Integrity Associates, Inc.
1035 * 2.93125G7pressure 2 * 0.64
Cypressure= 2370 psi
PAxial = Gendcap + apressure= 738 psi + 2370 psi = 3108 psi
Using the outside radius of the pipe to calculate the pressure stress is conservative, and accounts foreffects due to pressure on the crack face. This pressure is treated as a membrane stress and is assumedto be constant through the thickness of the pipe.
Note that the original design report reported a design primary membrane stress intensity of 9.6 ksi [7,sheet 18 of A-485], which was based on a hoop stress direction (as opposed to the present axial stressused for crack growth). The design report was also based on design pressure (1250 psi) designthickness. The present calculation is based on operating pressure and as-measured wall thickness.
WOL Residual Stresses
The residual stresses which result from implementing a weld repair are developed from the ANSYSmodel described in Reference [4]. The values of the stresses are given for 70'F and 550'F in [4].These stresses vary across the thickness and are represented by the curve fit Equation 1. Thesestresses are obtained using the ANSYS output files "PATHT70.OUT" and"PATHT550_PI035.OUT", and they are digitized using pc-CRACK to perform the curve fit. Sixpaths were investigated and these residual stresses are used for the crack growth analysis.
File No.: 0900530.308Revision: 0
Page 6 of 14
F0306-011
Structural integrity Associates, Inc.
4.0 ASSUMPTIONS
Basic assumptions for the analysis are listed below:
* A circumferential flaw is assumed for the purpose of analyzing crack growth over time due tofatigue and stress corrosion cracking.
* The nominal pipe thickness prior to the 2009 weld overlay is assumed as 0.64 inch in thisanalysis, in order to be consistent with previous pc-CRACK analyses in PNPS-19Q-311 [12]and the weld overlay design basis in 0900530.301 [6].
* The nozzle itself is not attached to a piping system, and therefore there are no piping-inducedloads that need to be considered. Also, bending stresses are identified as negligible in theoriginal stress report [7, sheets 5 of A-474, sheet 18 of A-485, and sheet 21 of A-488].H loop stresses are oriented parallel to the assumed flaw, and therefore do not affect thecircumferential assumed flaw or flaw growth.
* Residual stress is considered in addition to the axial stress that was calculated above. Thethrough-wall residual stress distribution is sufficiently represented with a third orderpolynomial curve fit.
• Residual stresses are steady state secondary stresses and therefore only act as a mean stress inregards to fatigue crack growth.
* The axial stresses due to pressure are assumed to be membrane stresses and are constantthroughout the thickness of the pipe.
" The primary membrane stress intensity is assumed to be 3.1 ksi, based on the operatingpressure and the as-measured wall thickness.
* The nozzle has no internal flow, and therefore it does not experience thermal transients otherthan startup and shutdown. The total number of startup and shutdown cycles that the plantwill likely experience is estimated to be about 400 cycles, per [13, page 4.3-5 (PDF page819)].
" Also, because the nozzle does not experience flow, credit cannot be taken for Hydrogen WaterChemistry. The Normal Water Chemistry case will be evaluated instead.
File No.: 0900530.308 Page 7 of 14Revision: 0
F0306-01'
Structural Integrity Associates, Inc.
5.0 CRACK GROWTH CALCULATIONS
5.1 Fatigue Crack Growth (FCG)
FCG is calculated using the loading described in Section 3.2 of this calculation. The minimum stressintensity Kmin is taken as the weld repair residual axial stress distribution at 70'F, which is presentwhen the plant is shutdown. The maximum stress intensity Kmax is the combination of the pressureaxial stress and the residual axial stress at 550'F. This stress intensity range represents the range seenfrom shutdown to startup. The FCG after 800 applied cycles is calculated using pc-CRACKsoftware using the crack growth law for austenitic material in air, as described by Figure C-3210-1 inSection XI Appendix C of the ASME Code [2]. 800 cycles was chosen as a conservative estimatethat nearly doubles the total number of startup and shutdown cycles the plant will likely experienceover its lifetime [13, page 4.3-5 (PDF page 819)]. Appendix B contains output files for FCG withand without WOL residual stresses.
The stress intensity components of Kmax and Kmin for the weld overlay case are shown below.
Kmax Kmin
Kresidual 550 Kresidual 70
Kpressure
5.2 Intergranular Stress Corrosion Cracking (IGSCC)
For IGSCC, the applied K (Kmax above) is the crack driving force. The growth of the crack after100,000 hours of service, or 11.4 years, is calculated. PVP2008-61299 [10] provides stresscorrosion crack growth laws for nickel-base austenitic alloys. The N9A nozzle-to-safe end weldlocation does not experience any internal flow, so Hydrogen Water Chemistry cannot be assured.Therefore, the normal water chemistry (NWC) case is evaluated. Specifically, the NWC belowEPRI Guidelines Action Level I case is used.
The SCC growth law is, taken from Reference [II], equations 2 and 3:daC f indt - CoK , in/hr for KI < 25 ks1iin (2)dt
da =C in/hr for K, > 25 ksiin (3)dt
File No.: 0900530.308 Page 8 of 14Revision: 0
F0306-01
V Structural Integrity Associates, Inc.
where,
Water Chemistry Co C1 n
Normal 1.6E-08 5.OE-05 2.5
K, = stress intensity factor at flaw tip (ksiVin) IThe K-dependent crack growth rates are calculated with pc-CRACK using the coefficients shownabove and the K values developed within the software. For this evaluation the'K-independent crackgrowth rates were not used since the combined stress intensity factor was never greater than +25ksWin, as seen in Figure 2.
Appendix A contains pc-CRACK output files for the following cases:" IGSCC case without residual stresses.* IGSCC case with WOL residual stresses.
Appendix B contains pc-CRACK output files for the following cases:* FCG case without residual stresses.* FCG case with WOL residual stresses.
File No.: 0900530.308Revision: 0
Page 9 of 14
F0306-011

Structural Integrity Associates, Inc.
The pc-CRACK and ANSYS computer files used in this evaluation are listed below.
File Name, DescriptionPATH T70.OUT ANSYS Residual Stress Output at 70'F
PATH T550 P1035.OUT ANSYS Residual Stress Output at 550'FJPINSCC.OUT pc-CRACK Output File for IGSCC with Weld Overlay, Normal
Water Chemistry, and without Residual StressesJPINSCCR.OUT pc-CRACK Output File for IGSCC with Weld Overlay, Normal
Water Chemistry, and considering Residual StressesJPINFCG.OUT pc-CRACK Output File for Fatigue Crack Growth with Weld
Overlay and without Residual StressesJPINFCGR.OUT pc-CRACK Output File for Fatigue Crack Growth with Weld
Overlay and considering Residual Stresses
6.0 RESULTS AND CONCLUSIONS
Although no known indication is present in the N9-A nozzle at Pilgrim Nuclear Power Station, for thepurpose of this analysis, a starting flaw was assumed to extend entirely through the original wall, andcompletely around the circumference. Results show that such an indication would not grow by aFatigue Crack Growth mechanism even without the beneficial effects of residual stress. Themaximum allowed crack size is exceeded due to lntergranular Stress Corrosion Cracking atapproximately 33,000 hours (3.8 years) when the beneficial effects of residual stresses are ignored;this is overly conservative. However, there is also no crack growth due to an Intergranular StressCorrosion Cracking mechanism into the 2009 Inconel weld overlay when residual stresses areconsidered. Therefore, the structural integrity of the 2009 weld overlay repair will not degrade withtime due to ongoing crack growth. Results are presented in Table 1.
File No.: 0900530.308Revision: 0
Page 10 of 14
F0306-01I
Structural Integrity Associates, Inc.
7.0 REFERENCES
1. General Electric Document No. HKI-336, "Field Deviation Disposition Request and RepairPlan", Revision 1, October 11, 1984, SI File No. 0900530.203.
2. ASME Boiler & Pressure Vessel Code, Section XI, 1998 Edition, with Addenda through2000.
3. Structural Integrity Associates, Inc., "Design Input for Jet Pump Instrumentation NozzleFinite Element Analyses", Revision A, July 23, 2009, SI File No. 0900530.304.
4. Structural Integrity Associates, Inc., "Residual Stress Analysis of Jet Pump InstrumentationNozzle (N9A) with Weld Overlay Repair", Revision A, July 23, 2009, SI File No.0900530.307.
5. pc-CRACK for Windows, Version 3.1-98348, Structural Integrity Associates, 1998.
6. Structural Integrity Associates, Inc., "Weld Overlay Design for Jet Pump InstrumentationNozzle N9A", Revision 1, April 30, 2009, SI File No. 0900530.301.
7. Combustion Engineering Inc., Pilgrim Document 1979-308-1, Stress Report 1139,"Analytical Report for Pilgrim Reactor Vessel", March 9, 1971, SI File No. PNPS-1OQ-21 1.
8. General Electric Document No. 488 925-1687, "Pilgrim Jet Pump Instrumentation NozzleWeld Overlay Design", Revision 1, October 3, 1984, Received from George Mileris, SI FileNo. 0900530.203.
9. GE Nuclear Energy, Document No. 26A582 1, "Reactor Vessel- Thermal PowerOptimization", Revision 0, March 5, 2002, SI File No. 0900530.205.
10. ASME Paper PVP2008-61299, "Nickel Alloy Crack Growth Correlations in BWREnvironment and Application to Core Support Structure Welds Evaluation", July 2008, SIFile No. BWRVIP-01-259P.
11. Entergy Nuclear Operations, Inc., Document No. ECO000014631, "SKM-N9A-I N9A WeldOverlay Design", Received from George Mileris, SI File No. 0900530.207.
12. Structural Integrity Associates, Inc,, "Weld Overlay Design for Jet Pump InstrumentationNozzles N9A, B", January 31, 2005, SI File No. PNPS-19Q-311.
13. Entergy Nuclear Operations, Inc., "License Renewal Application: Pilgrim Nuclear PowerStation", taken from the Nuclear Regulatory Commission's website, <www.nrc.gov>.
File No.: 0900530.308 Page 11 of 14Revision: 0
F0306-01.
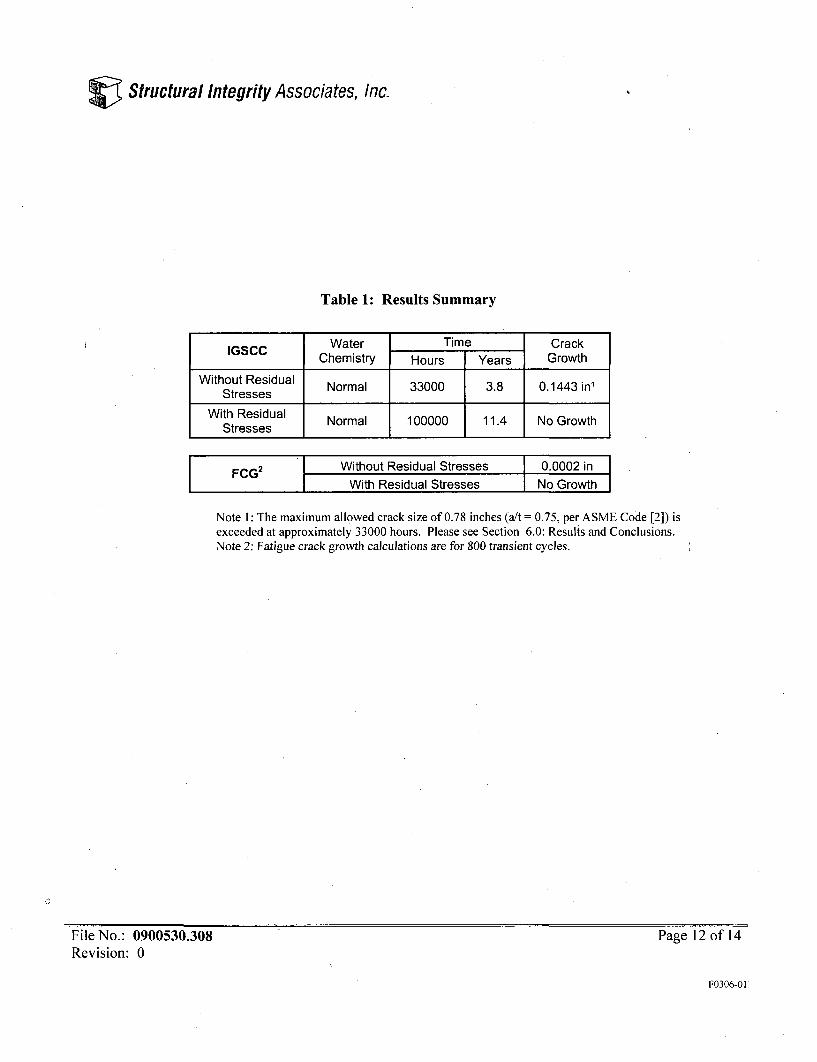
Structural Integrity Associates, Inc.
Table 1: Results Summary
IGSCC Water Time CrackChemistry Hours Years Growth
Without Residual Normal 33000 3.8 0.1443 in1
Stresses
With Residual Normal 100000 11.4 No GrowthStresses
FCG2 Without Residual Stresses 0.0002 in
With Residual Stresses No Growth
Note 1: The maximum allowed crack size of 0.78 inches (a/t = 0.75, per ASME Code [2]) isexceeded at approximately 33000 hours. Please see Section 6.0: Results and Conclusions.Note 2: Fatigue crack growth calculations are for 800 transient cycles.
File No.: 0900530.308Revision: 0
Page 12 of 14
F0306-01
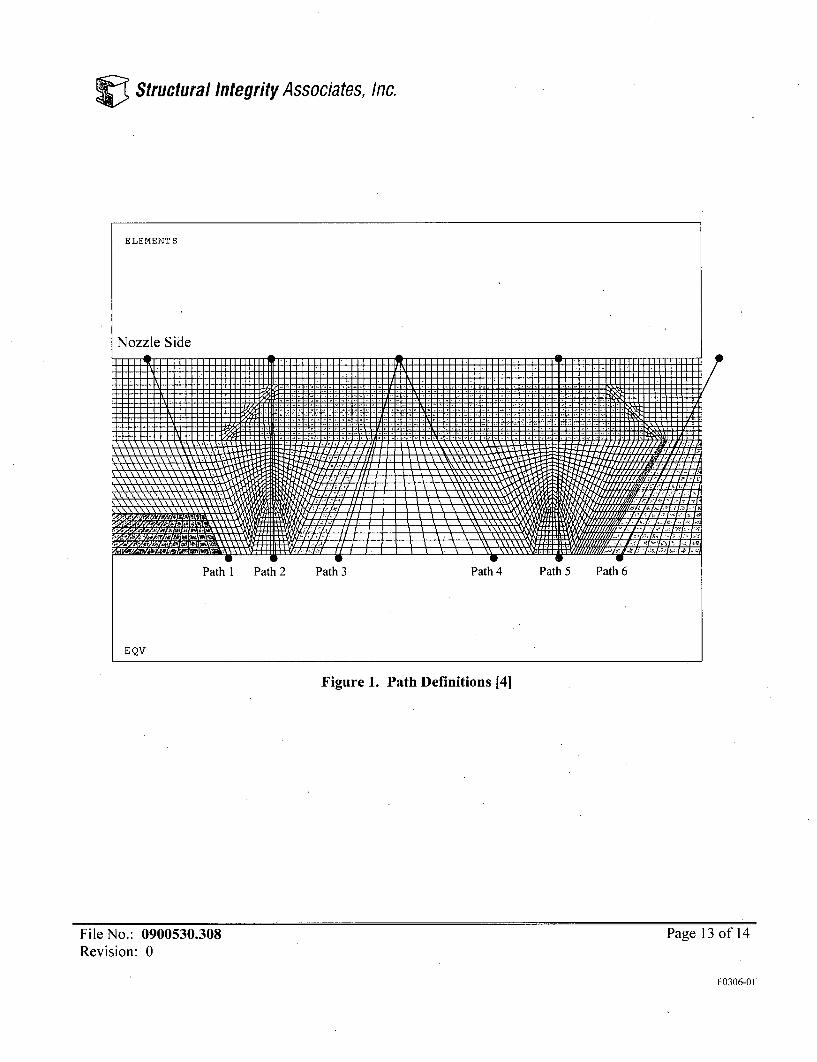
V Structural Integrity Associates, Inc.
Figure 1. Path Definitions [41
File No.: 0900530.308Revision: 0
Page 13 of 14
F0306-01:
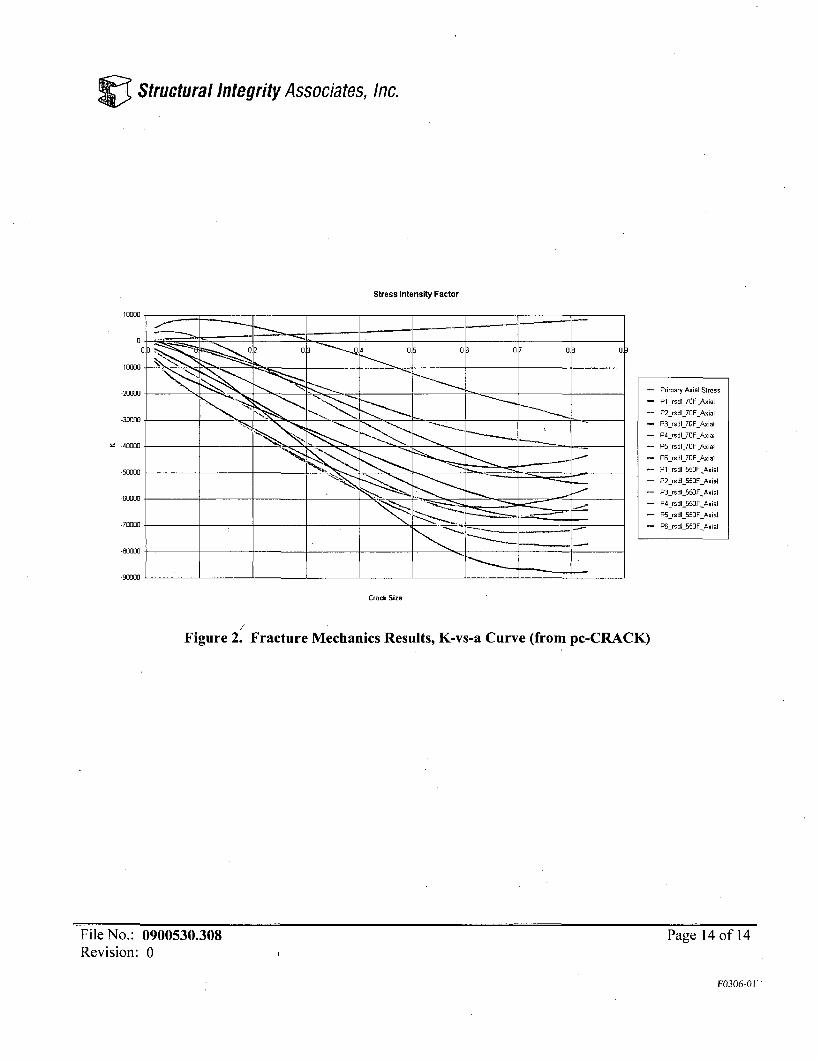
Structural Integrity Associates, Inc.
Stress Intensity Factor
-20000
S-4mm0
-500m
- Primary Axial Stress
- P l_rsdi_70F Axial
- P2_rsdl_70F_Axial
- P3_rsdl_70F_Axial
- P4_rsdl7SF AMia
- P5_rsdl_70FAxial
- PB_rsdl_70F_Axial
P1_rsdl_550FAxial
- P2_rsdl_50F Axial
- P3_rsdl50F Axial
- P4_rsdl.5SOFAxial
-P5rsdl_55OF Axial
- P6-rsdl_550FAxial-70000
-80000
Crack Size
/Figure 2. Fracture Mechanics Results, K-vs-a Curve (from pc-CRACK)
File No.: 0900530.308Revision: 0
Page 14 of 14
F0306-01
Structural Integrity Associates, Inc.
APPENDIX A
IGSCC CASE PC-CRACK OUTPUT FILES
File No.: 0900530.308Revision: 0
F0306-01 RO
Page A-I of A-20
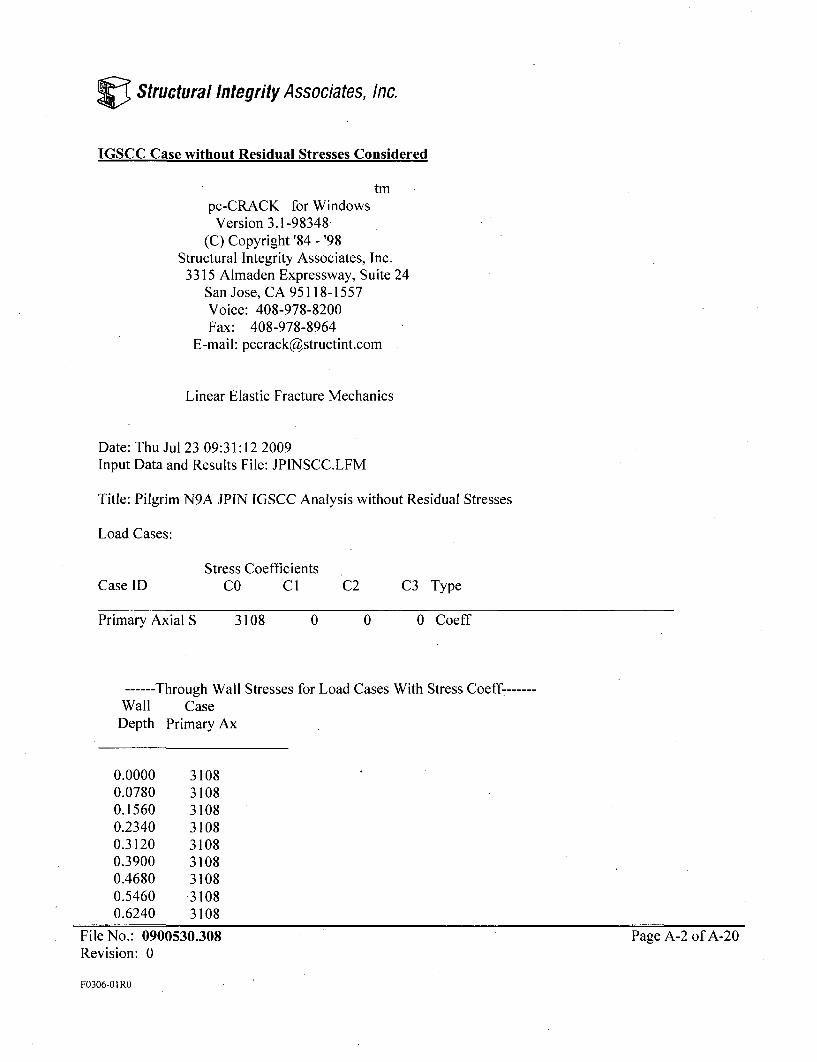
Structural Integrity Associates, Inc.
IGSCC Case without Residual Stresses Considered
tmpc-CRACK for WindowsVersion 3.1-98348
(C) Copyright '84 -'98Structural Integrity Associates, Inc.
3315 Almaden Expressway, Suite 24San Jose, CA 95118-1557Voice: 408-978-8200Fax: 408-978-8964
E-mail: [email protected]
Linear Elastic Fracture Mechanics
Date: Thu Jul 23 09:31:12 2009Input Data and Results File: JPINSCC.LFM
Title: Pilgrim N9A JPIN IGSCC Analysis without Residual Stresses
Load Cases:
Stress CoefficientsCO C1Case ID C2 C3 Type
Primary Axial S 3108 0 0 0 Coeff
------ Through Wall Stresses for Load Cases With Stress Coeff.Wall Case
Depth Primary Ax
0.00000.07800.15600.23400.31200.39000.46800.54600.6240
3108310831083108310831083108-31083108
File No.: 0900530.308Revision: 0
Page A-2 of A-20
F0306-01 RO

Structural Integrity Associates, Inc.
0.70200.7800
31083108
Crack Model: Circumferential Crack in Cylinder (t/R=0.2)
Crack Parameters:Wall thickness: 1.0400Max. crack size: 0.7800
--------- Stress Intensity Factor ........Crack CaseSize Primary.Ax
0.0156 759.9480.0312 1079.110.0468 1326.990.0624 1538.470.0780 1726.990.0936 1899.410.1092 2063.430.1248 2226.330.1404 2383.050.1560 2534.80.1716 2682.480.1872 2826.790.2028 2968.260.2184 3120.220.2340 3277.70.2496 3434.730.2652 3591.50.2808 3748.170.2964 3904.870.3120 4061.690.3276 4232.940.3432 4405.170.3588 4578.420.3744 4752.730.3900 4928.140.4056 5104.670.4212 5285.930.4368 5475.770.4524 5667.180.4680 5860.16
File No.:'0900530.308Revision: 0
Page A-3 of A-20
F0306-01 RO
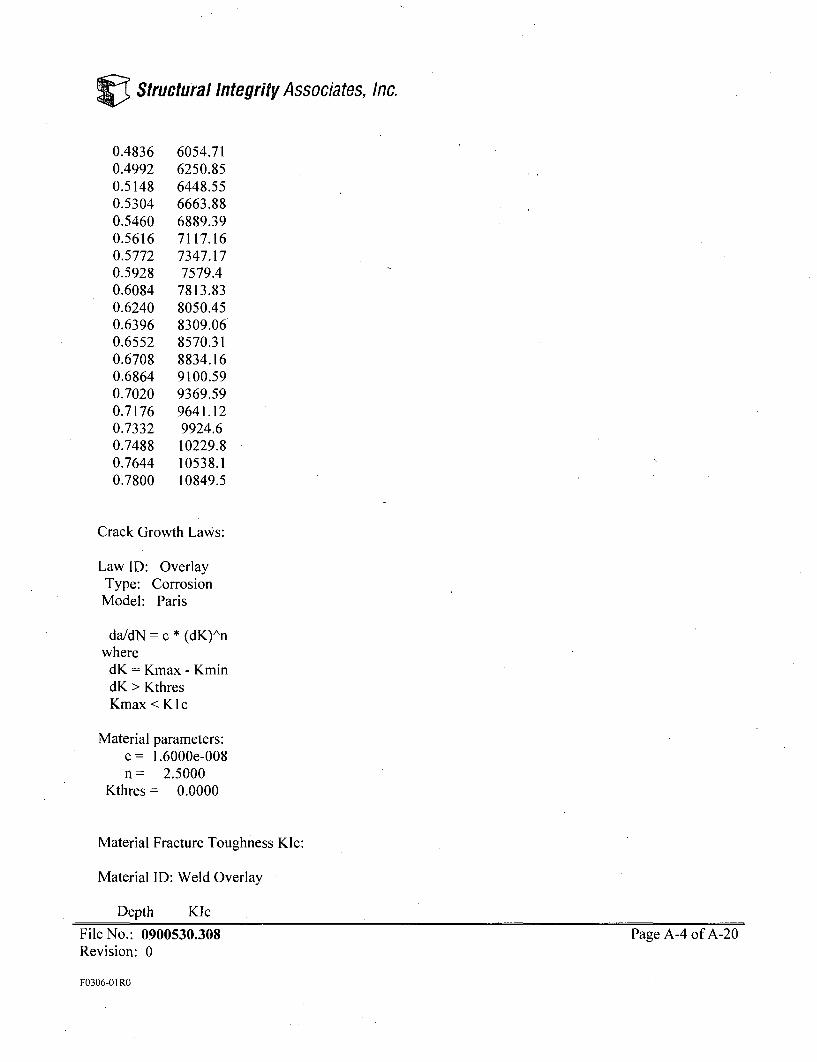
V Structural Integrity Associates, Inc.
0.48360.49920.51480.53040.54600.56160.57720.59280.60840.62400.63960.65520.67080.68640.70200.71760.73320.74880.76440.7800
6054.716250.856448.556663.886889.397117.167347.177579.4
7813.838050.458309.068570.318834.169100.599369.599641.129924.610229.810538.110849.5
Crack Growth Laws:
Law ID: OverlayType: CorrosionModel: Paris
da/dN = c * (dK)^nwheredK = Kmax - KmindK > KthresKmax < KIc
Material parameters:c = 1.6000e-008n = 2.5000
Kthres = 0.0000
Material Fracture Toughness KIc:
Material ID: Weld Overlay
Depth KIc
File No.: 0900530.308Revision: 0
Page A-4 of A-20
F0306-01 RO

Structural Integrity Associates, Inc.
0.25001.00002.0000
200.0000200.0000200.0000
Initial crack size=Max. crack size=
0.64000.7800
Number of blocks= 1Print increment of block= I
Cycles CaIc. Print Crk. Grw.Subblock /Time incre. incre. Law
Mat.KIc
Overlay 100000 1000 1000 Overlay Weld Overlay
Kmax KminSubblock Case ID Scale Factor Case ID Scale Factor
Overlay Primary Axial Stress 0.0010
Crack growth results:
Total SubblockCycles Cycles/Time /Time
DaDnKmax Kmin DeltaK R /DaDt Da a a/thk
Block:10002000300040005000600070008000900010000110001200013000
I1000 8.32e+000 0.00e+000 8.32e+000 0.00 3.19e-006 3.19e-003 0.6432 0.622000 8.37e+000 0.00e+0003000 8.42e+000 0.00e+0004000 8.48e+000 0.00e+0005000 8.53e+000 0.00e+0006000 8.59e+000 0.00e+0007000 8.65e+000 0.00e+0008000 8.71e+000 0.00e+000
8.37e+000 0.00 3.24e-006 3.24e-003 0.6464 0.628.42e+000 0.00 3.29e-006 3.29e-003 0.6497 0.628.48e+000 0.00 3.35e-006 3.35e-003 0.6531 0.638.53e+000 0.00 3.40e-006 3.40e-003 0.6565 0.638.59e+000 0.00 3.46e-006 3.46e-003 0.6599 0.638.65e+000 0.00 3.52e-006 3.52e-003 0.6635 0.648.71e+000 0.00 3.58e-006 3.58e-003 0.667 0.64
9000 8.77e+000 0.00e+000 8.77e+000 0.00 3.65e-006 3.65e-003 0.6707 0.6410000 8.83e+000 0.00e+000 8.83e+000 0.00 3.7le-006 3.7le-003 0.6744 0.6511000 8.90e+000 0.00e+000 8.90e+000 0.00 3.78e-006 3.78e-003 0.6782 0.6512000 8.96e+000 0.00e+000 8.96e+000 0.00 3.85e-006 3.85e-003 0.682 0.6613000 9.03e+000 0.00e+000 9.03e+000 0.00 3.92e-006 3.92e-003 0.6859 0.66
File No.: 0900530.308Revision: 0
Page A-5 of A-20
F0306-01 RO
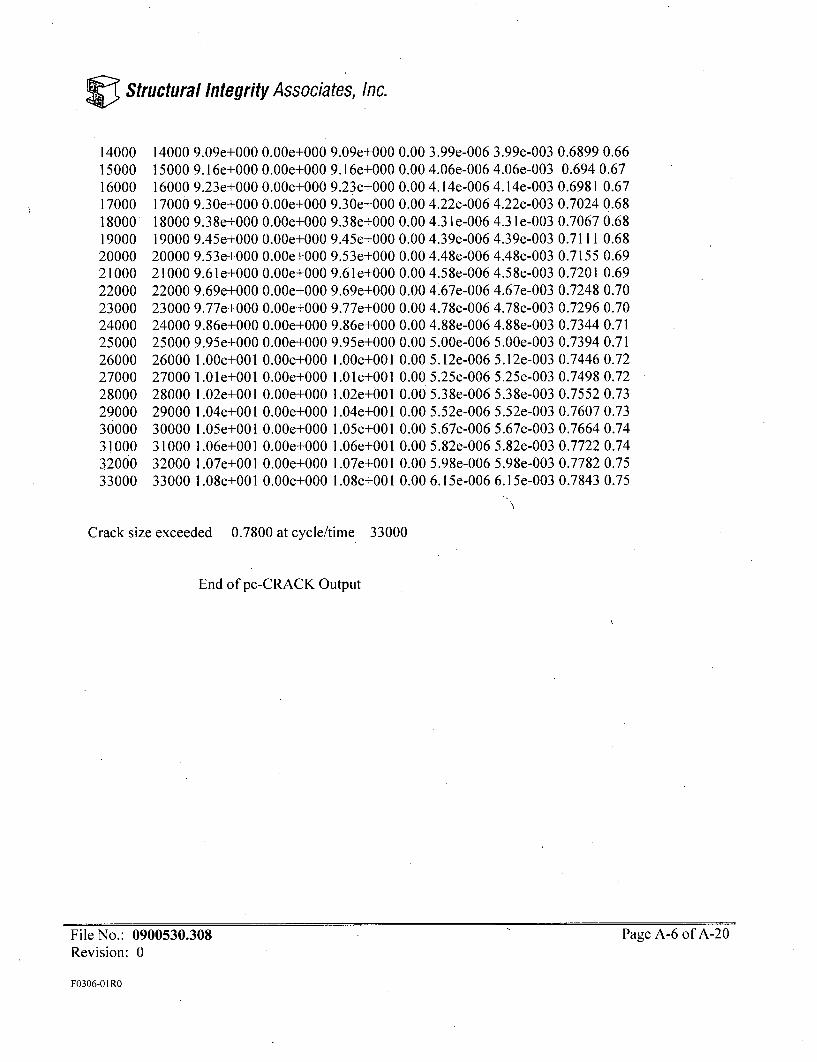
C Structural Integrity Associates, Inc.
1400015000160001700018000190002000021000220002300024000250002600027000280002900030000310003200033000
14000 9.09e+000 0.00e+000 9.09e+000 0.00 3.99e-006 3.99e-003 0.6899 0.6615000 9.16e+000 0.00e+000 9.16e+000 0.00 4.06e-006 4.06e-003 0.694 0.6716000 9.23e+000 0.00e+000 9.23e+000 0.00 4.14e-006 4.14e-003 0.6981 0.6717000 9.30e+000 0.00e+000 9.30e+000 0.00 4.22e-006 4.22e-003 0.7024 0.6818000 9.38e+000 0.00e+000 9.38e+000 0.00 4.3 le-006 4.3 le-003 0.7067 0.6819000 9.45e+000 0.00e+000 9.45e+000 0.00 4.39e-006 4.39e-003 0.7111 0.6820000 9.53e+000 0.0Oe+000 9.53e+000 0.00 4.48e-006 4.48e-003 0.7155 0.6921000 9.61e+000 0.00e+000 9.61e+000 0.00 4.58e-006 4.58e-003 0.7201 0.6922000 9.69e+000 0.00e+000 9.69e+000 0.00 4.67e-006 4.67e-003 0.7248 0.7023000 9.77e+000 0.00e+000 9.77e+000 0.00 4.78e-006 4.78e-003 0.7296 0.7024000 9.86e+000 0.00e+000 9.86e+000 0.00 4.88e-006 4.88e-003 0.7344 0.7125000 9.95e+000 0.00e+000 9.95e+000 0.00 5.00e-006 5.00e-003 0.7394 0.7126000 1.00e+00127000 1.01e+00128000 1.02e+00129000 1.04e+00130000 1.05e+00131000 1.06e+00132000 1.07e+00133000 1.08e+001
0.00e+0000.00e+0000.00e+0000.00e+0000.00e+0000.00e+0000.00e+0000.00e+000
1.00e+001 0.00 5.12e-006 5.12e-003 0.7446 0.721.01e+001 0.00 5.25e-006 5.25e-003 0.7498 0.721.02e+001 0.00 5.38e-006 5.38e-003 0.7552 0.731.04e+001 0.00 5.52e-006 5.52e-003 0.7607 0.731.05e+001 0.00 5.67e-006 5.67e-003 0.7664 0.741.06e+001 0.00 5.82e-006 5.82e-003 0.7722 0.741.07e+001 0.00 5.98e-006 5.98e-003 0.7782 0.751.08e+001 0.00 6.15e-006 6.15e-003 0.7843 0.75
Crack size exceeded 0.7800 at cycle/time 33000
End of pc-CRACK Output
File No.: 0900530.308Revision: 0
Page A-6 of A-20
F0306-01 RO
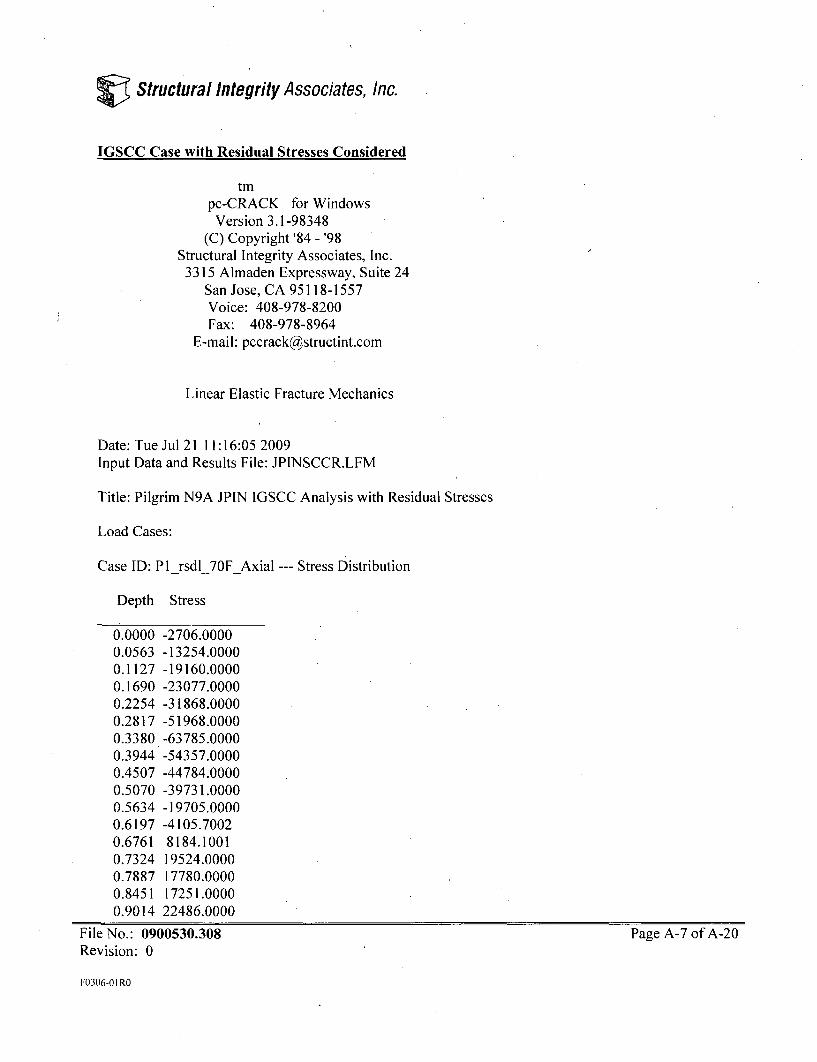
Structural Integrity Associates, Inc.
]GSCC Case with Residual Stresses Considered
tmpc-CRACK for WindowsVersion 3.1-98348
(C) Copyright '84 -'98Structural Integrity Associates, Inc.3315 Almaden Expressway, Suite 24
San Jose, CA 95118-1557Voice: 408-978-8200Fax: 408-978-8964
E-mail: [email protected]
Linear Elastic Fracture Mechanics
Date: Tue Jul 21 11:16:05 2009Input Data and Results File: JPINSCCR.LFM
Title: Pilgrim N9A JPIN IGSCC Analysis with Residual Stresses
Load Cases:
Case ID: P1_rsdl_70FAxial --- Stress Distribution
Depth Stress
0.0000 -2706.00000.0563 -13254.00000.1127 -19160.00000.1690 -23077.00000.2254 -31868.00000.2817 -51968.00000.3380 -63785.00000.3944 -54357.00000.4507 -44784.00000.5070 -39731.00000.5634 -19705.00000.6197 -4105.70020.6761 8184.10010.7324 19524.00000.7887 17780.00000.8451 17251.00000.9014 22486.0000
File No.: 0900530.308 Page A-7 of A-20Revision: 0
F0306-O1 RO

Structural Integrity Associates, Inc.
0.9577 36904.00001.0141 47132.00001.0704 66681.00001.1268 76587.0000
Case ID: P2_rsdl_70FAxial --- Stress Distribution
Depth Stress
0.0000 -15358.00000.0523 -19223.00000.1046 -25101.00000.1569 -29725.00000.2092 -32260.00000.2615 -36466.00000.3138 -42170.00000.3661 -43463.00000.4184 -38617.00000.4707 -25977.00000.5230 -10235.00000.5753 10778.00000.6276 8643.09960.6799 2881.70000.7322 -1006.40000.7845 20303.00000.8368 24785.00000.8891 32769.00000.9414 44502.00000.9938 63483.00001.0460 76944.0000
Case ID: P3_rsdl_70FAxial --- Stress Distribution
Depth Stress
0.0000 -28088.00000.0547 -25470.00000.1093 -24553.00000.1640 -23860.00000.2187 -23108.00000.2733 -23068.00000.3280 -25974.00000.3826 -30169.00000.4373 -31442.00000.4920 -26786.0000
File No.: 0900530.308 Page A-8 of A-20Revision: 0
F0306-01 RO
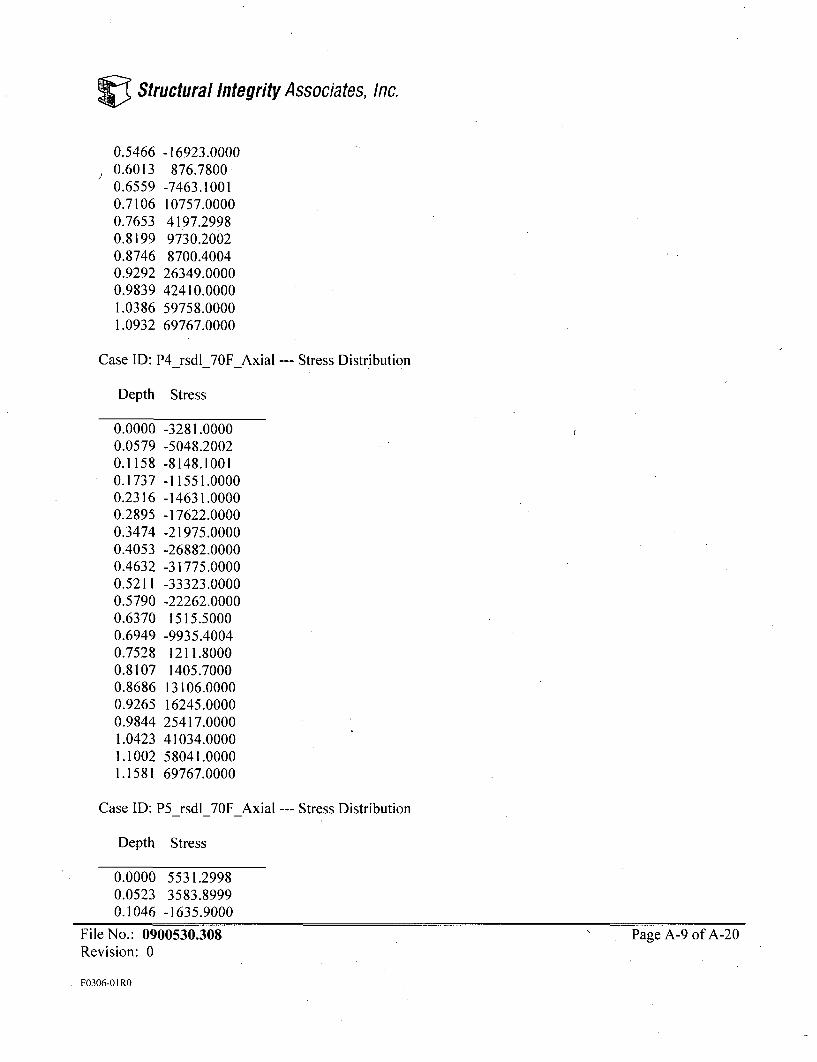
Structural Integrity Associates, Inc.
0.5466 -16923.00000.6013 876.78000.6559 -7463.10010.7106 10757.00000.7653 4197.29980.8199 9730.20020.8746 8700.40040.9292 26349.00000.9839 42410.00001.0386 59758.00001.0932 69767.0000
Case ID: P4_rsdl_70FAxial --- Stress Distribution
Depth Stress
0.0000 -3281.00000.0579 -5048.20020.1158 -8148.10010.1737 -11551.00000.2316 -14631.00000.2895 -17622.00000.3474 -21975.00000.4053 -26882.00000.4632 -31775.00000.5211 -33323.00000.5790 -22262.00000.6370 1515.50000.6949 -9935.40040.7528 1211.80000.8107 1405.70000.8686 13106.00000.9265 16245.00000.9844 25417.00001.0423 41034.00001.1002 58041.00001.1581 69767.0000
Case ID: P5 rsdl_70FAxial --- Stress Distribution
Depth Stress
0.0000 5531.29980.0523 3583.89990.1046 -1635.9000
File No.: 0900530.308 Page A-9 of A-20Revision: 0
F0306-01 RO

Structural Integrity Associates, Inc.
0.1569 -5833.70020.2092 -13755.00000.2615 -21502.00000.3138 -31547.00000.3661 -35499.00000.4184 -43808.00000.4707 -43321.00000.5230 -29471.00000.5753 -12445.00000.6276 -7875.00000.6799 14412.00000.7322 14364.00000.7845 7326.50000.8368 15584.00000.8891 26384.00000.9414 36435.00000.9937 53063.00001.0460 66263.0000
Case ID: P6_rsdl_70FAxial --- Stress Distribution
Depth Stress
0.0000 15237.00000.0578 13824.00000.1156 9049.59960.1734 3724.60010.2311 -1101.80000.2889 -6785.20020.3467 -14316.00000.4045 -20867.00000.4623 -22738.00000.5201 -17319.00000.5778 -16816.00000.6356 -15223.00000.6934 -24384.00000.7512 -18228.00000.8090 7268.00000.8668 -291.49000.9245 6025.00000.9823 9106.29981.0401 3584.80001.0979 8781.29981.1557 21056.0000
File No.: 0900530.308 Page A-10 of A'20Revision: 0
F0306-01 RO

Structural Integrity Associates, Inc.
Case ID: P1 rsdl_550FAxial --- Stress Distribution
Depth Stress
0.0000 -37423.00000.0563 -30666.00000.1127 -30371.00000.1690 -29966.00000.2254 -30253.00000.2817 -39782.00000.3380 -49528.00000.3944 -40497.00000.4507 -31440.00000.5070 -26593.00000.5634 -7998.70020.6197 5466.50000.6761 8603.59960.7324 17911.00000.7887 16327.00000.8451 15865.00000.9014 20738.00000.9577 34114.00001.0141 43571.00001.0704 61619.00001.1268 70638.0000
Case ID: P2_rsdl_550FAxial --- Stress Distribution
Depth Stress
0.0000 -28342.00000.0523 -33121.00000.1046 -35067.00000.1569 -34809.00000.2092 -33286.00000.2615 -34479.00000.3138 -37713.00000.3661 -37277.00000.4184 -31583.00000.4707 -18984.00000.5230 -3771.50000.5753 16109.00000.6276 14282.00000.6799 8925.09960.7322 5161.7998
File No.: 0900530.308 Page A-1I1 of A-20Revision: 0
F0306-01 RO
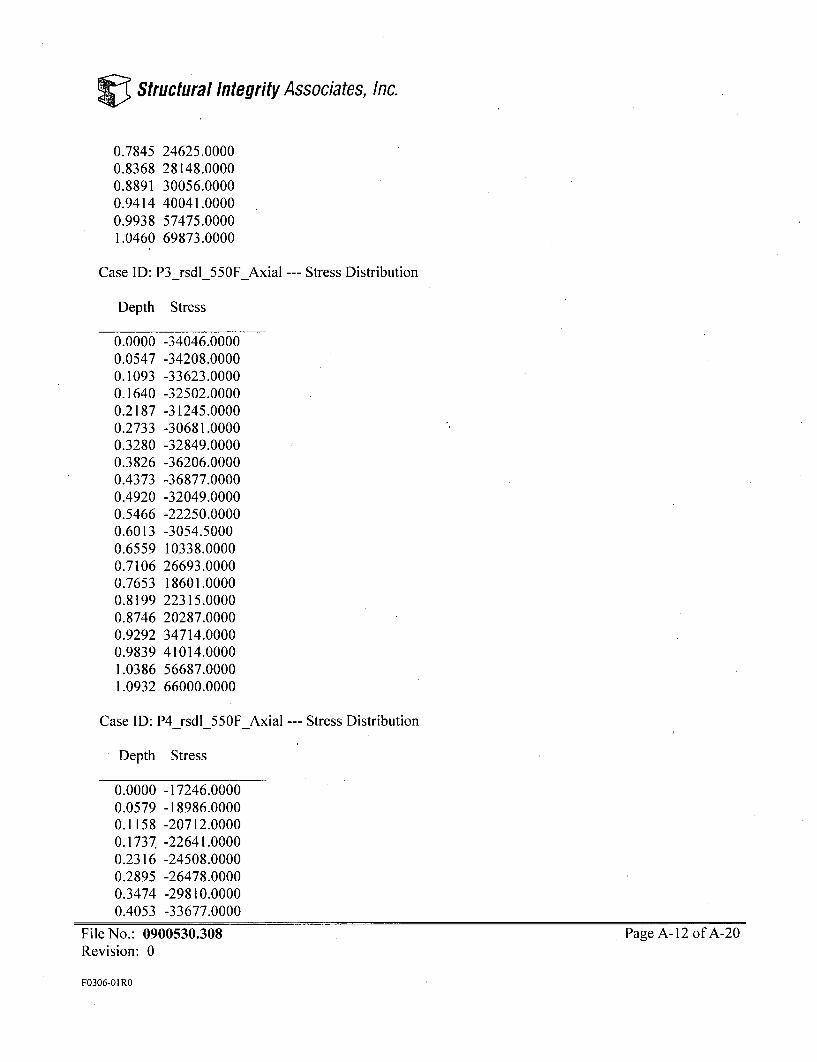
Structural Integrity Associates, Inc.
0.7845 24625.00000.8368 28148.00000.8891 30056.00000.9414 40041.00000.9938 57475.00001.0460 69873.0000
Case ID: P3_rsdl_550FAxial -- Stress Distribution
Depth Stress
0.0000 -34046.00000.0547 -34208.00000.1093 -33623.00000.1640 -32502.00000.2187 -31245.00000.2733 -30681.00000.3280 -32849.00000.3826 -36206.00000.4373 -36877.00000.4920 -32049.00000.5466 -22250.00000.6013 -3054.50000.6559 10338.00000.7106 26693.00000.7653 18601.00000.8199 22315.00000.8746 20287.00000.9292 34714.00000.9839 41014.00001.0386 56687.00001.0932 66000.0000
Case ID: P4_rsdl_550FAxial --- Stress Distribution
Depth Stress
0.0000 -17246.00000.0579 -18986.00000.1158 -20712.00000.1737 -22641.00000.2316 -24508.00000.2895 -26478.00000.3474 -29810.00000.4053 -33677.0000
File No.: 0900530.308 Page A-12 of A-20Revision: 0
F0306-01 RO
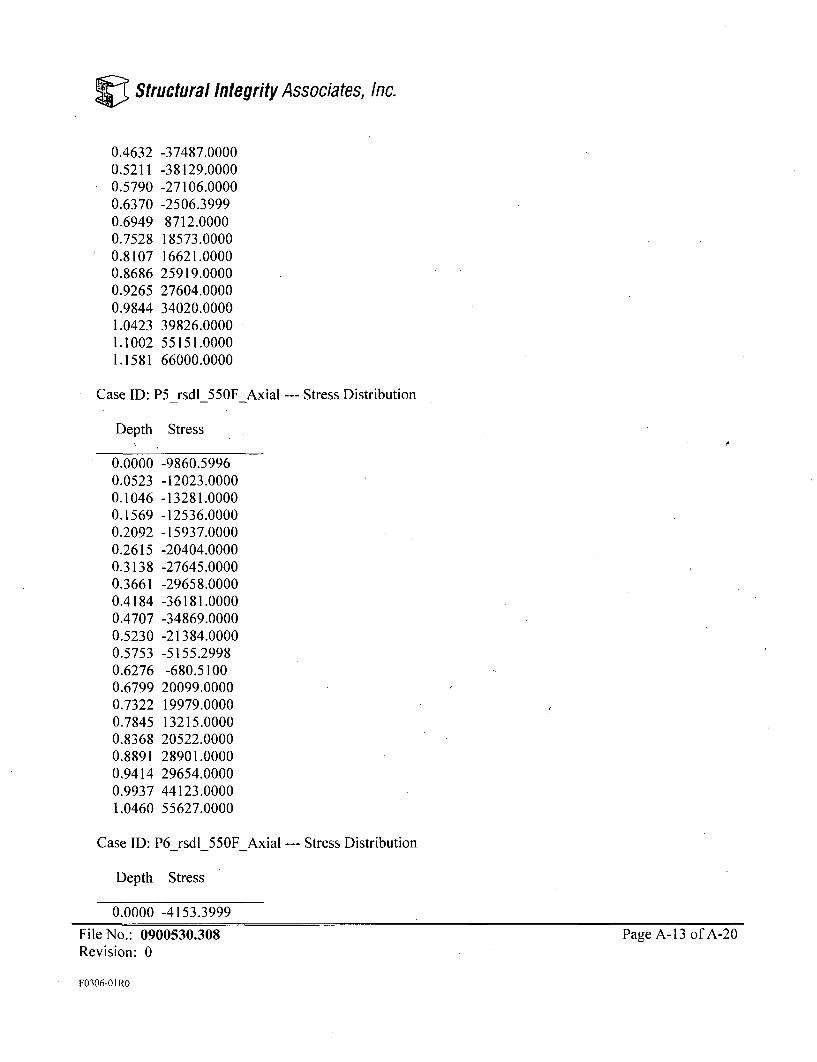
Structural Integrity Associates, Inc.
0.4632 -37487.00000.5211 -38129.00000.5790 -27106.00000.6370 -2506.39990.6949 8712.00000.7528 18573.00000.8107 16621.00000.8686 25919.00000.9265 27604.00000.9844 34020.00001.0423 39826.00001.1002 55151.00001.1581 66000.0000
Case ID: P5_rsdl_550FAxial --- Stress Distribution
Depth Stress
0.0000 -9860.59960.0523 -12023.00000.1046 -13281.00000.1569 -12536.00000.2092 -15937.00000.2615 -20404.00000.3138 -27645.00000.3661 -29658.00000.4184 -36181.00000.4707 -34869.00000.5230 -21384.00000.5753 -5155.29980.6276 -680.51000.6799 20099.00000.7322 19979.00000.7845 13215.00000.8368 20522.00000.8891 28901.00000.9414 29654.00000.9937 44123.00001.0460 55627.0000
Case ID: P6_rsdl_550FAxial --- Stress Distribution
Depth Stress
0,0000 -4153.3999
File No.: 0900530.308 Page A-13 of A-20Revision: 0
F0306-O1 RO
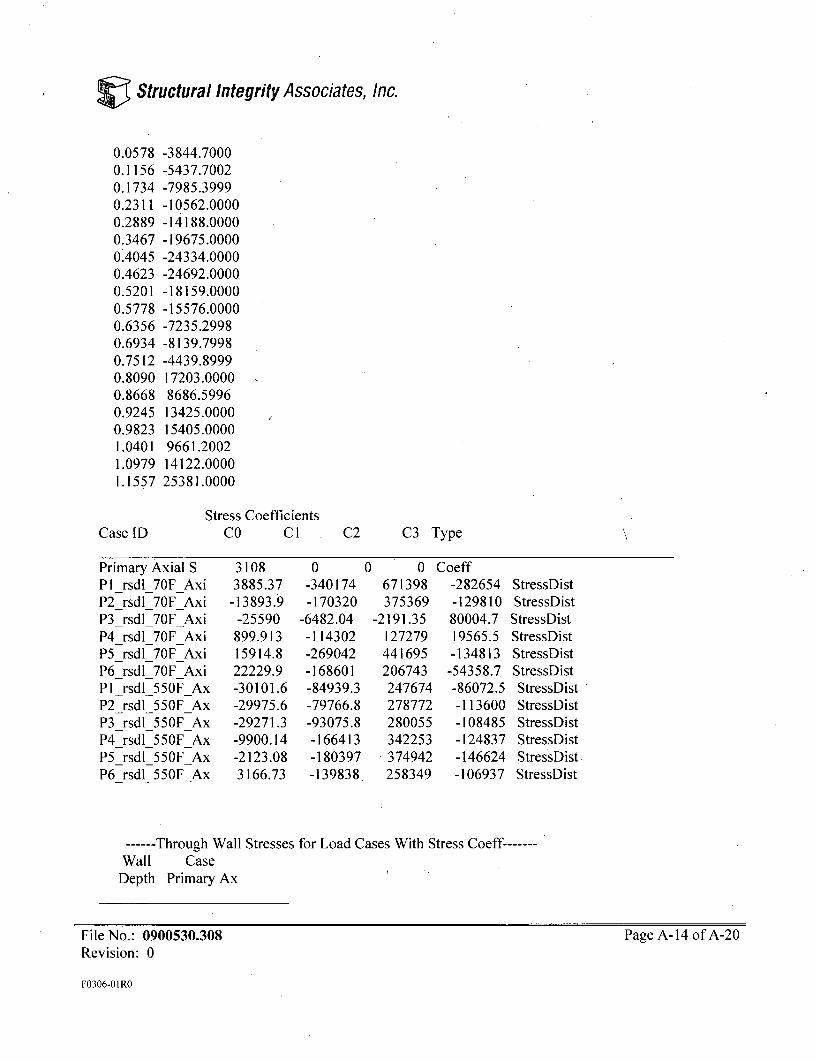
Structural Integrity Associates, Inc.
0.0578 -3844.70000.1156 -5437.70020.1734 -7985.39990.2311 -10562.00000.2889 -14188.00000.3467 -19675.00000.4045 -24334.00000.4623 -24692.00000.5201 -18159.00000.5778 -15576.00000.6356 -7235.29980.6934 -8139.79980.7512 -4439.89990.8090 17203.00000.8668 8686.59960.9245 13425.00000.9823 15405.00001.0401 9661.20021.0979 14122.00001.1557 25381.0000
Stress CoefficientsCase ID CO Cl C2 C3 Type
Primary Axial SP1 rsdl 70F AxiP2 rsdl 70F AxiP3 rsdl 70F AxiP4 rsdl 70F AxiP5 rsdl 70F AxiP6 rsdl 70F AxiPI rsdl 550F AxP2 rsdl 550F AxP3 rsdl 550F AxP4 rsdl 550F AxP5 rsdl 550F AxP6_rsdl_550FAx
31083885.37
-13893.9-25590
899.91315914.822229.9-30101.6-29975.6-29271.3-9900.14-2123.083166.73
0 0 0 Coeff-340174-170320
-6482.04-114302-269042-168601-84939.3-79766.8-93075.8-166413-180397-139838
671398375369
-2191.35127279441695206743247674278772280055342253374942258349
-282654-12981080004.719565.5-134813
-54358.7-86072.5-113600-108485-124837-146624-106937
StressDistStressDist
StressDistStressDistStressDistStressDistStressDistStressDistStressDistStressDistStressDistStressDist
------ Through Wall Stresses for Load Cases With Stress Coeff-------Wall CaseDepth Primary Ax
File No.: 0900530.308Revision: 0
Page A-14 of A-20
F0306-01 RO
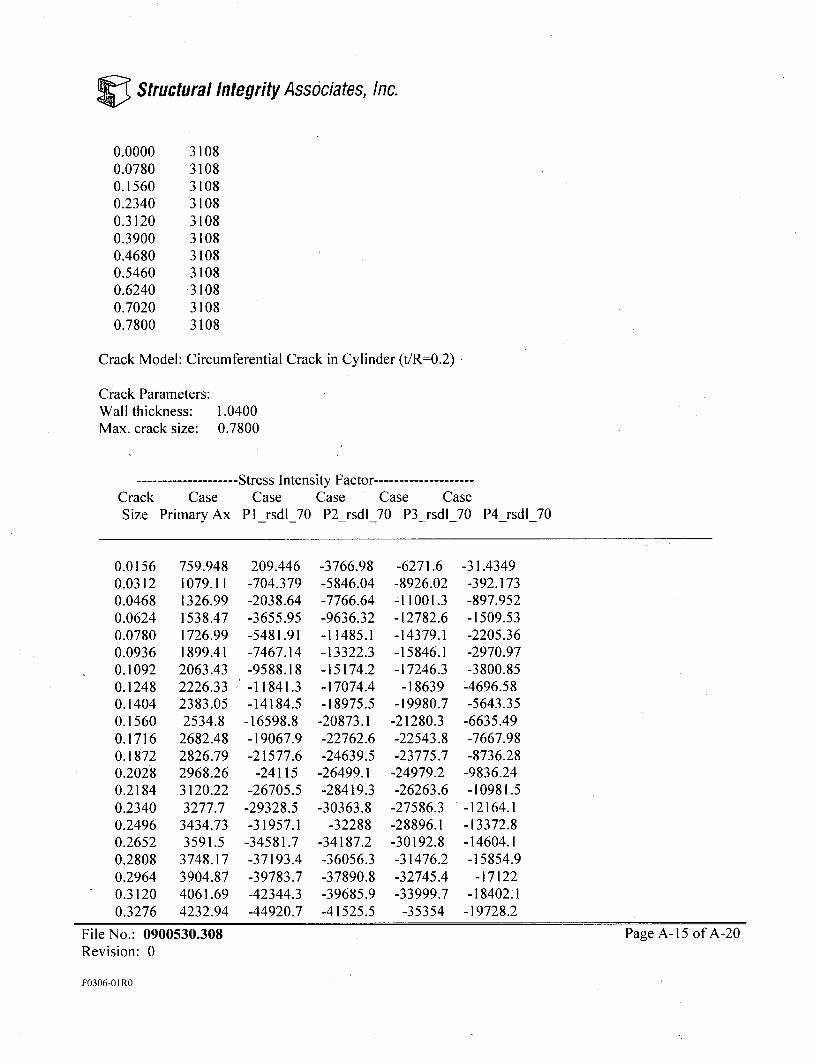
U Structural Integrity Associates, Inc.
0.00000.07800.15600.23400.31200.39000.46800.54600.62400.70200.7800
31083108310831083108310831083108310831083108
Crack Model: Circumferential Crack in Cylinder (t/R=0.2)
Crack Parameters:Wall thickness:Max. crack size:
1.04000.7800
-Stress Intensity Factor --------------------Crack CaseSize Primary Ax
Case Case Case CaseP1_rsdl_70 P2_rsdl_70 P3_rsdl_70 P4_rsdl_70
0.01560.03120.04680.06240.07800.09360.10920.12480.14040.15600.17160.18720.20280.21840.23400.24960.26520.28080.29640.31200.3276
759.9481079.111326.991538.471726.991899.412063.432226.332383.052534.8
2682.482826.792968.263120.223277.7
3434.733591.5
3748.173904.874061.694232.94
209.446-704.379-2038.64-3655.95-5481.91-7467.14-9588.18-11841.3-14184.5
-16598.8-19067.9-21577.6-24115
-26705.5-29328.5-31957.1
-34581.7-37193.4-39783.7-42344.3-44920.7
-3766.98-5846.04-7766.64-9636.32-11485.1-13322.3-15174.2-17074.4-18975.5
-20873.1-22762.6-24639.5
-26499.1-28419.3
-30363.8-32288
-34187.2-36056.3-37890.8-39685.9-41525.5
-6271.6-8926.02-11001.3
-12782.6-14379.1-15846.1-17246.3
-18639-19980.7
-21280.3-22543.8-23775.7
-24979.2-26263.6
-27586.3-28896.1-30192.8-31476.2-32745.4-33999.7
-35354
-31.4349-392.173-897.952-1509.53-2205.36-2970.97-3800.85
-4696.58
-5643.35-6635.49-7667.98-8736.28
-9836.24-10981.5
-12164.1-13372.8-14604.1-15854.9
-17122-18402.1
-19728.2
File No.: 0900530.308 Page A-15 of A-20Revision: 0
F0306-01 RO

C Structural Integrity Associates, Inc.
0.34320.35880.37440.39000.40560.42120.43680.45240.46800.48360.49920.51480.53040.54600.56160.57720.59280.60840.62400.63960.65520.67080.68640.70200.71760.73320.74880.76440.7800
4405.174578.424752.734928.145104.675285.935475.775667.185860.166054.716250.856448.556663.886889.397117.167347.177579.4
7813.838050.458309.068570.318834.169100.599369.599641.129924.610229.810538.110849.5
-47449.1-49920.4-52326.1-54657.4-56906.2-59180.2-61619.1-64001.3-66322.2-68577.3-70762.6-72874.3-74819.8
-76604-78257.4-79773
-81143.7-82362.8-83424
-84434.6-85268.6-85919.4-86380.4-86645.4-86708.5
-86848.7-87383.4-87759.2-87973.1
-43315.8-45051.1-46725.7
-48334-49870.3-51404.8-53024.5-54582.1-56073.6-57494.9-58842.5-60112.3-61316.8
-62425.2-63420.1-64295.6-65045.8-65664.9-66147.2-66605.4-66909.8-67054
-67031.8-66837.1-66463.8
-66085.6-65894.9-65536.5-65005.5
-36695.4-38021.9-39331.4
-40621.8-41890.8-43162.9-44462.8-45733.4-46971.3-48172.8-49334.2-50451.7-51660.1
-52891.6-54073.4-55200.8-56269.3-57273.9-58209.7-59210.2-60129.8
-60962.4-61701.7-62341.5-62874.9
-63359.9-63852.4
-64214-64436.6
-21063.4-22404.
-23746.5-25087.2-26422.4-27781.5-29201.2-30615.1-32019.4-33410.5-34784.5-36137.5-37491.2
-38826.7-40125.8
-41383.6-42595.1-43755.2
-44858.7-45972.3-47017.6-47988.4-48878.3-49681.1-50390.1-51086.5-51859.8
-52531.5-53094.3
-Stress Intensity Factor --------------------Crack CaseSize P5 rsdl_70
CaseP6_rsdl_70
Case CaseP1_rsdl_55 P2
Casersdl_55 P3_rsdl_55
0.01560.03120.04680.06240.07800.09360.10920.12480.14040.1560
3303.263888.263834.233391.632673.181745.01656.096
-562.451-1898.45-3332.65
5065.066681.527606.678132.888382.158421.628310.768095.837763.817330.44
-7543-10951.8-13741.8-16224.6-18513.9-20664.5-22745.3-24825.7-26843.6-28804.9
-7499.82-10870.6-13614.8-16042.9-18268.1-20344.8-22341.1-24325.1-26235.3-28077.3
-7357.26-10710.2-13469.1-15933.5-18212.1-20356.3-22432.5-24508.1-26520.9
-28476
File No.: 0900530.308 Page A-16 of A-20Revision: 0
F0306-01 RO

V Structural Integrity Associates, Inc.
0.17160.18720.20280.21840.23400.24960.26520.28080.29640.31200.32760.34320.35880.37440.39000.40560.42120.43680.45240.46800.48360.49920.51480.53040.54600.56160.57720.59280.60840.62400.63960.65520.67080.68640.70200.71760.73320.74880.76440.7800
-4848.98-6433.68-8074.7
-9740.51-11435.2-13161.1-14910.1-16674.4-18447
-20220.8-21988.4-23742.1-25474.6-27178.7-28847.2-30473.2-32121.9-33879.6-35607.6-37300.9-38954.7-40564.2-42124.9
-43544-44839.1-46043.3-47149.4-48150.6-49039.9-49810.4-50499.2
-51051-51458.2-51713.2-51808.6-51736.9-51672.6-51815.7-51809.1-51646.4
6808.336207.885537.94867.134172.783429.942643.511817.96
957.44865.8688-811.731-1712.82-2633.71-3570.85-4520.73-5479.93-6474.51-7541.95-8626.6
-9726.13-10838.3-11960.8-13091.5
-14147.8-15158.9
-16160-17148.1-18119.8-19072.1-20001.7-20901.4-21772.4
-22611-23413.7-24177.1-24897.6
-25655-26544.4-27403.7-28229.7
-30713-32569.9
-34376.6-36268
-38188.3-40070.8-41913.6-43714.5
-45471.3-47181.5-48979.3-50727
-52421.1-54058
-55633.8-57145.1-58653.6-60232.3
-61752.5-63211.3-64605.8
-65933.4-67191.3
-68471.4-69712.6-70861
-71912.4-72862.5-73706.9-74441.6-75226.8-75889.9-76426.2-76831.3-77100.4-77229.3
-77366.4-77671.7-77840.9-77870
-29854.6-31568.8
-33220.7-34942.5-36678.7-38363.8-39995.6-41571.9-43090.4-44548.5-46070.7
-47527.3-48914.6
-50228.7-51466
-52622.8-53760.8-54952.9
-56071.5-57113.8-58077.4-58959.6-59758.3
-60543.7-61262.2
-61870.7-62365
-62741.3-62995.5-63123.9-63263.2
-63263.5-63120.6-62830.4
-62389-61792.5
-61185.1-60722.2-60110.8-59348.2
-30376.1-32222.7
-34016.1-35888.1-37783.7-39637.1-41446.1-43208.1-44920.6-46581.1-48318.5
-49999.1-51619.1
-53174.7-54661.9
-56077-57484.5
-58961-60373.1-61717.7-62992.4-64194.3-65321.1
-66450.1-67524.9
-68498.8-69367.5-70126.8-70772.6-71300.8-71863.1
-72295.2-72592.7-72751.3
-72766.6-72634.7
-72509.6-72558.2
-72467-72232.7
--------- Stress Intensity Factor --------------------Crack Case Case CaseSize P4 rsdl_55 P5 rsdl_55 P6_rsdl_55
File No.: 0900530.308Revision: 0
Page A-17 of A-20
F0306-01 RO
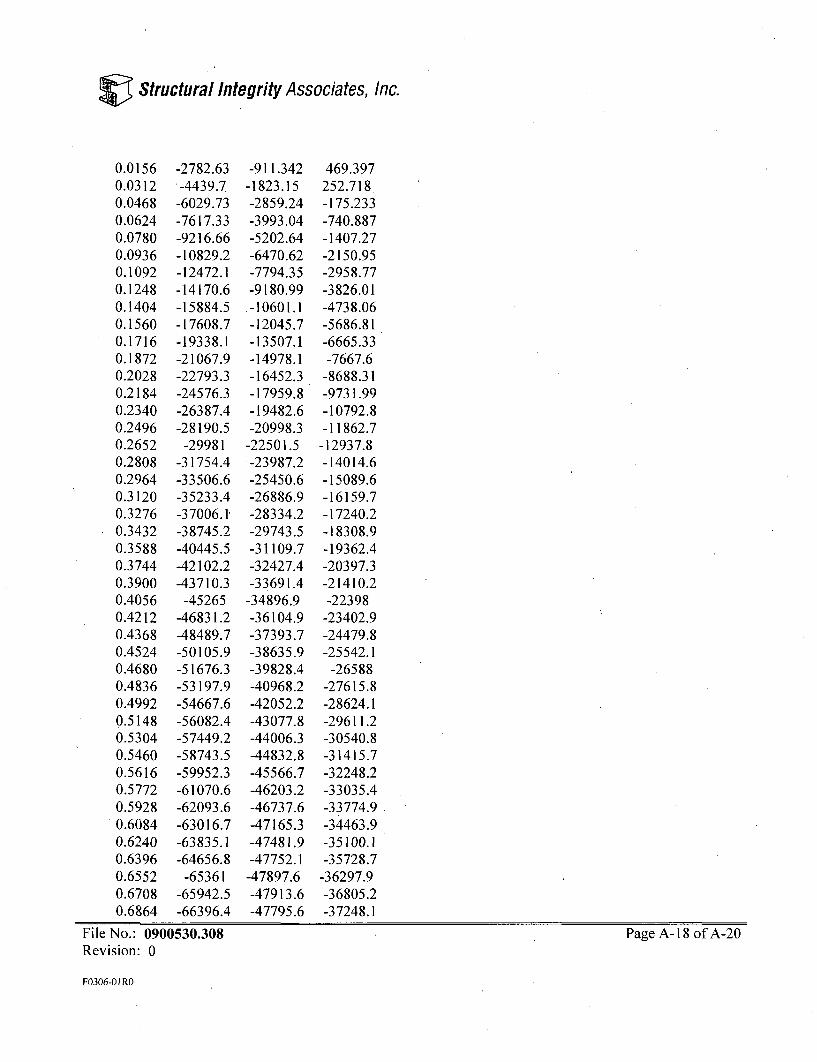
V Structural Integrity Associates, Inc.
0.01560.03120.04680.06240.07800.09360.10920.12480. 14040.15600.17160.18720.20280.21840.23400.24960.26520.28080.29640.31200.32760.34320.35880.37440.39000.40560.42120.43680.45240.46800.48360.49920.51480.53040.54600.56160.57720.59280.60840.62400.63960.65520.67080.6864
-2782.63.-4439.7
-6029.73-7617.33-9216.66-10829.2-12472.1-14170.6-15884.5-17608.7-19338.1-21067.9-22793.3-24576.3-26387.4-28190.5-29981
-31754.4-33506.6-35233.4-37006.1-38745.2-40445.5-42102.2-43710.3-45265
-46831.2-48489.7-50105.9-51676.3-53197.9-54667.6-56082.4-57449.2-58743.5-59952.3-61070.6-62093.6-63016.7-63835.1-64656.8
-65361-65942.5-66396.4
-911.342-1823.15-2859.24-3993.04-5202.64-6470.62-7794.35-9180.99-10601.1-12045.7-13507.1-14978.1-16452.3-17959.8-19482.6-20998.3
-22501.5-23987.2-25450.6-26886.9-28334.2-29743.5-31109.7-32427.4-33691.4
-34896.9-36104.9-37393.7-38635.9-39828.4-40968.2-42052.2-43077.8-44006.3-44832.8-45566.7-46203.2-46737.6-47165.3-47481.9-47752.1
-47897.6-47913.6-47795.6
469.397252.718-175.233-740.887-1407.27-2150.95-2958.77-3826.01-4738.06-5686.81-6665.33-7667.6
-8688.31-9731.99-10792.8-11862.7
-12937.8-14014.6-15089.6-16159.7-17240.2-18308.9-19362.4-20397.3-21410.2-22398
-23402.9-24479.8-25542.1
-26588-27615.8-28624.1-29611.2-30540.8-31415.7-32248.2-33035.4-33774.9-34463.9-35100.1-35728.7
-36297.9-36805.2-37248.1
File No.: 0900530.308Revision: 0
Page A-18 of A-20
F0306-01 RD
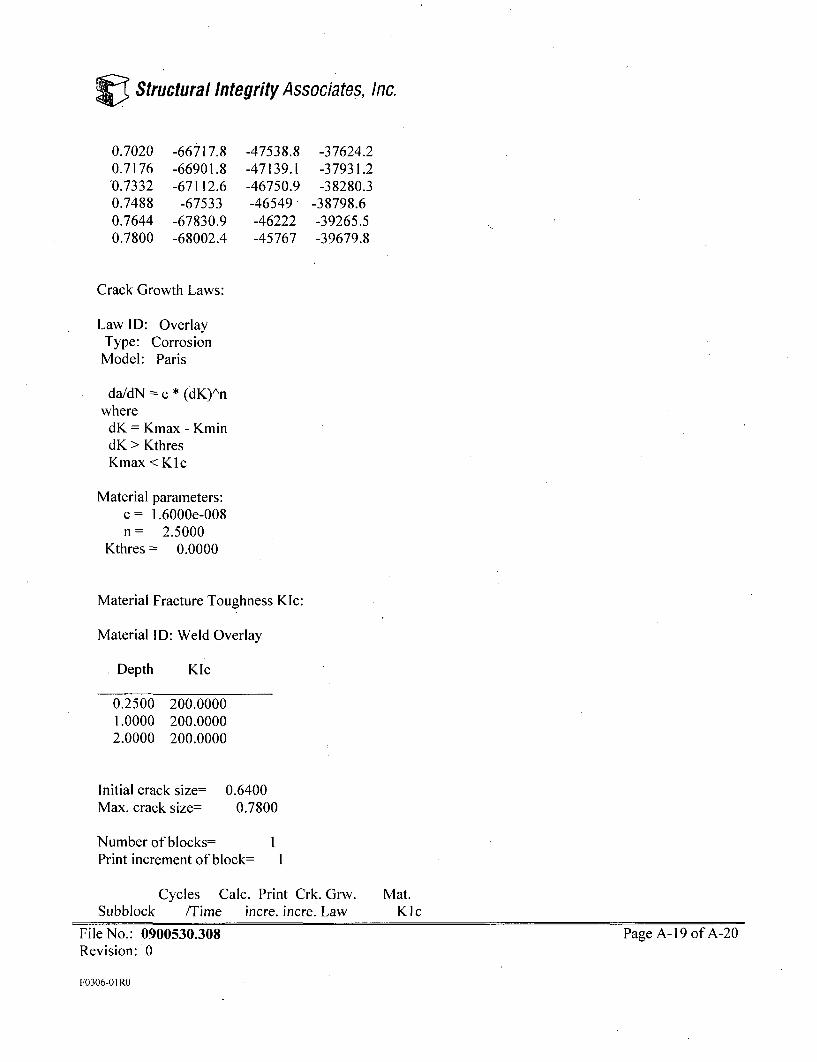
Structural Integrity Associates, Inc.
0.70200.7176'0.73320.74880.76440.7800
-66717.8-66901.8-67112.6
-67533-67830.9-68002.4
-47538.8-47139.1-46750.9-46549-46222-45767
-37624.2-37931.2-38280.3
-38798.6-39265.5-39679.8
Crack Growth Laws:
Law ID: OverlayType: Corrosion
Model: Paris
da/dN - c * (dK)Anwhere
dK = Kmax - KmindK > KthresKmax < KIc
Material parameters:c = 1.6000e-008n = 2.5000
Kthres 0.0000
Material Fracture Toughness KIc:
Material ID: Weld Overlay
Depth Kic
0.25001.00002.0000
200.0000200.0000200.0000
Initial crack size=Max. crack size=
0.64000.7800
Number of blocks= IPrint increment of block= I
Cycles Calc. Print Crk. Grw.Subblock /Time incre. incre. Law
Mat.KIc
File No.: 0900530.308Revision: 0
Page A-19 of A-20
F0306-01 RO
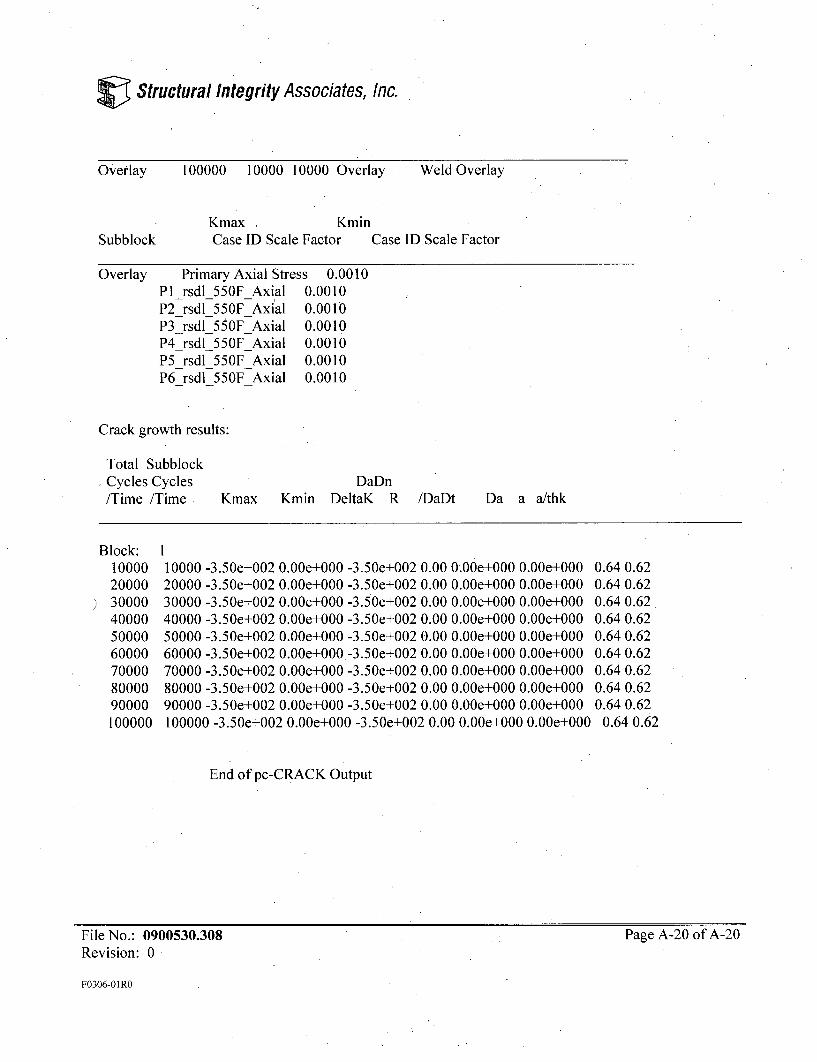
V Structural Integrity Associates, Inc.
Overlay 100000 10000 10000 Overlay Weld Overlay
Kmax KminSubblock Case ID Scale Factor Case ID Scale Factor
Overlay Primary Axial Stress 0.0010Plrsdl_550FAxial 0.0010P2_rsdl_550FAxial 0.0010P3_rsdl_5501FAxial 0.0010P4_rsdl_550FAxial 0.0010P5 rsdl_550FAxial 0.0010P6_rsdl_550FAxial 0.0010
Crack growth results:
Total SubblockCycles Cycles/Time /Time
DaDnKmax Kmin DeltaK R /DaDt Da a a/thk
Block: 110000 10000 -3.50e+002 0.00e+000 -3.50e+002 0.00 0.00e+000 0.00e+000 0.64 0.6220000 20000 -3.50e+002 0.00e+000 -3.50e+002 0.00 0.00e+000 0.00e+000 0.64 0.6230000 30000 -3.50e+002 0.00e+000 -3.50e+002 0.00 0.00e+000 0.00e+000 0.64 0.6240000 40000 -3.50e+002 0.00e+000 -3.50e+002 0.00 0.00e+000 0.00e+000 0.64 0.6250000 50000 -3.50e+002 0.00e+000 -3.50e+002 0.00 0.00e+000 0.00e+000 0.64 0.6260000 60000 -3.50e+002 0.00e+000 -3.50e+002 0.00 0.00e+000 0.00e+000 0.64 0.6270000 70000 -3.50e+002 0.00e+000 -3.50e+002 0.00 0.00e+000 0.00e+000 0.64 0.6280000 80000 -3.50e+002 0.00e+000 -3.50e+002 0.00 0.00e+000 0.00e+000 0.64 0.6290000 90000 -3.50e+002 0.00e+000 -3.50e+002 0.00 0.00e+000 0.00e+000 0.64 0.62100000 100000 -3.50e+002 0.00e+000 -3.50e+002 0.00 0.00e+000 0.00e+000 0.64 0.62
End of pc-CRACK Output
File No.: 0900530.308Revision: 0
Page A-20 of A-20
F0306-01RO
Structural Integrity Associates, Inc.
APPENDIX B
FCG CASE PC-CRACK OUTPUT FILES
File No.: 0900530.308Revision: 0
F0306-01 RO
Page B- I of B-21

Structural Integrity Associates, Inc.
FCG Case without Residual Stresses Considered
tmpc-CRACK for WindowsVersion 3.1-98348
(C) Copyright '84 -'98Structural Integrity Associates, Inc.
3315 Almaden Expressway, Suite 24San Jose, CA 95118-1557Voice: 408-978-8200Fax: 408-978-8964
E-mail: [email protected]
Linear Elastic Fracture Mechanics
Date: Thu Jul 23 09:32:54 2009InputData and Results File: JPINFCG.LFM
Title: Pilgrim N9A JPIN FCG Analysis without Residual Stresses
Load Cases:
Stress CoefficientsCO CICase ID C2 C3 Type
Primary Axial S 3108 0 0 0 Coeff
------ Through Wall Stresses for Load Cases With Stress Coeff-------Wall CaseDepth Primary Ax
0.0000 31080.0780 31080.1560 31080.2340 31080.3120 31080.3900 31080.4680 31080.5460 31080.6240 3108
File No.: 0900530.308Revision: 0
Page B-2 of B-21
F0306-01 RO
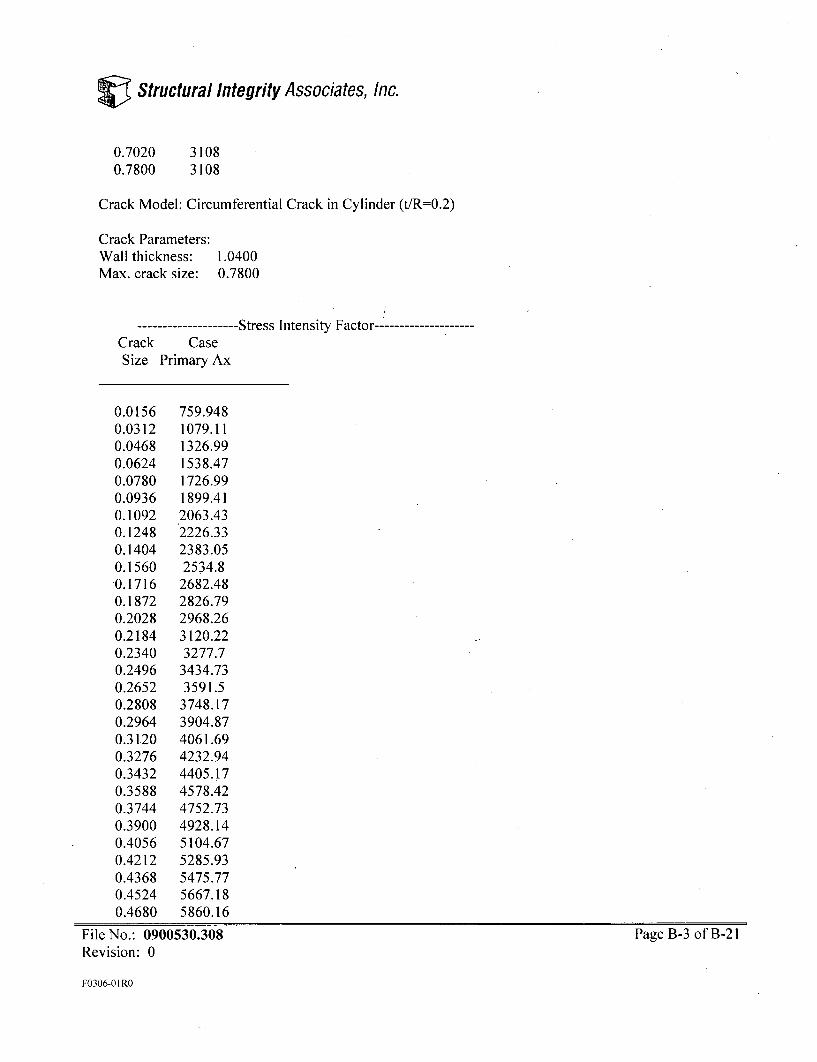
V Structural Integrity Associates, Inc.
0.70200.7800
31083108
Crack Model: Circumferential Crack in Cylinder (t/R=0.2)
Crack Parameters:Wall thickness:Max. crack size:
1.04000.7800
- Stress Intensity Factor--------------------Crack CaseSize Primary Ax
0.0156 759.9480.0312 1079.110.0468 1326.990.0624 1538.470.0780 1726.990.0936 1899.410.1092 2063.430.1248 2226.330.1404 2383.050.1560 2534.80.1716 2682.480.1872 2826.790.2028 2968.260.2184 3120.220.2340 3277.70.2496 3434.730.2652 3591.50.2808 3748.170.2964 3904.870.3120 4061.690.3276 4232.940.3432 4405.170.3588 4578.420.3744 4752.730.3900 4928.140.4056 5104.670.4212 5285.930.4368 5475.770.4524 5667.180.4680 5860.16
File No.: 0900530.308Revision: 0
Page B-3 ofB-21
F0306-01 RO
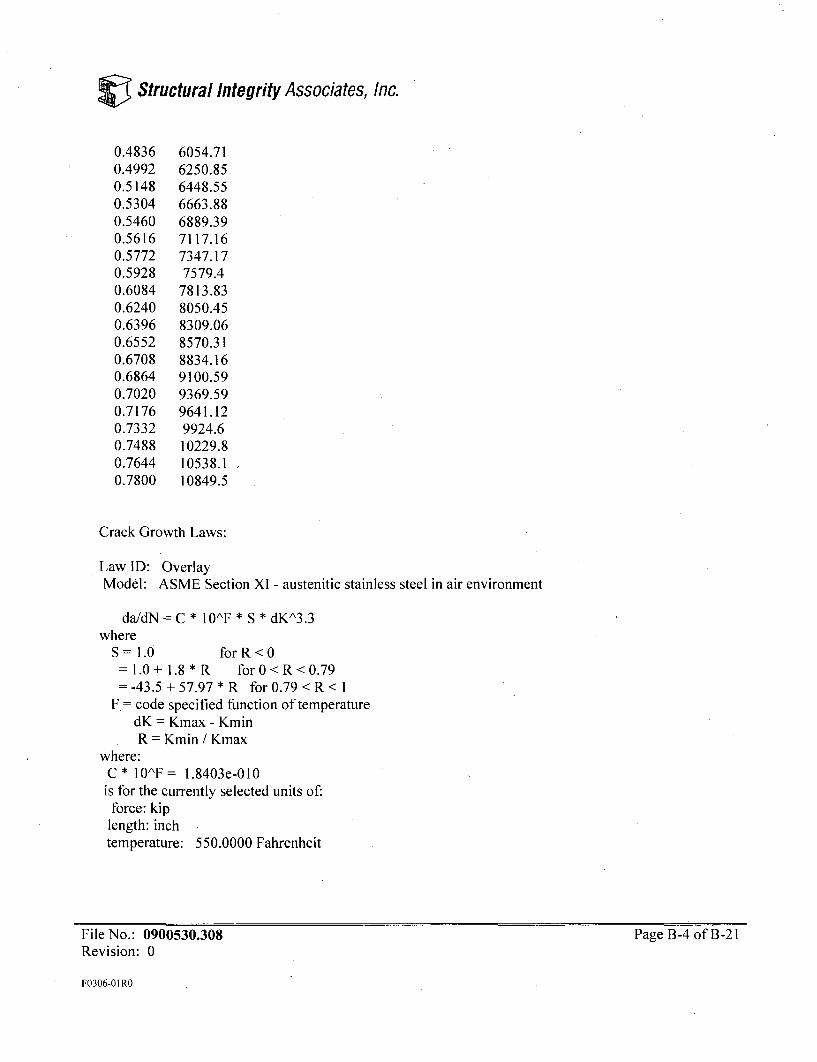
V Structural Integrity Associates, Inc.
0.48360.49920.51480.53040.54600.56160.57720.59280.60840.62400.63960.65520.67080.68640.70200.71760.73320.74880.76440.7800
6054.716250.856448.556663.886889.397117.167347.177579.4
7813.838050.458309.068570.318834.169100.599369.599641.129924.610229.810538.110849.5
Crack Growth Laws:
Law ID: OverlayModel: ASME Section XI - austenitic stainless steel in air environment
da/dN - C * 10/F * S * dKA3.3where
S= 1.0 for R < 0=1.0+1.8*R for 0 < R < 0.79
-43.5 + 57.97 * R for 0.79 < R < IF.= code specified function of temperature
dK Kmax -KminR = Kmin / Kmax
where:C * 10AF= 1.8403e-010
is for the currently selected units of:force: kip
length: inchtemperature: 550.0000 Fahrenheit
File No.: 0900530.308Revision: 0
Page B-4 of B-21
F0306-01 RO

Structural Integrity Associates, Inc.
Material Fracture Toughness KIc:
Material ID: Overlay
Depth KIc
0.2500 200.00001.0000 200.00002.0000 200.0000
Initial crack size=Max. crack size=
0.64000.7800
Number of blocks= IPrint increment of block= I
Cycles Caic. Print Crk. Grw.Subblock /Time incre. incre. Law
Mat.Klc
Overlay 800 20 20 Overlay Overlay
Kmax. KminSubblock Case ID Scale Factor Case ID Scale Factor
Overlay Primary Axial Stress 0.0010
Crack growth results:
Total SubblockCycles Cycles/Time /Time
DaDnDeltaK R /DaDtKmax Kmin Da a a/thk
Block:20406080100120140160
I 20 8.32e+000 0.00e+00010 8.32e+000 0.00e+00050 8.32e+000 0.00e+00080 8.32e+000 0.00e+000
8.32e+000 0.00 2.00e-007 4.00e-0068.32e+000 0.00 2.00e-007 4.00e-0068.32e+000 0.00 2.00e-007 4.00e-0068.32e+000 0.00 2.00e-007 4.00e-006
0.64 0.620.64 0.620.64 0.620.64 0.620.64 0.620.64 0.620.64 0.620.64 0.62
100 8.32e+000 0.00e+000 8.32e+000 0.00 2.00e-007 4.00e-006120 8.32e+000 0.00e+000 8.32e+000 0.00 2.00e-007 4.00e-006140 8.32e+000 0.00e+000 8.32e+000 0.00 2.00e-007 4.00e-006160 8.32e+000 0.00e+000 8.32e+000 0.00 2.00e-007 4.00e-006
File No.: 0900530.308Revision: 0
Page B-5 of B-21
F0306-01 RO
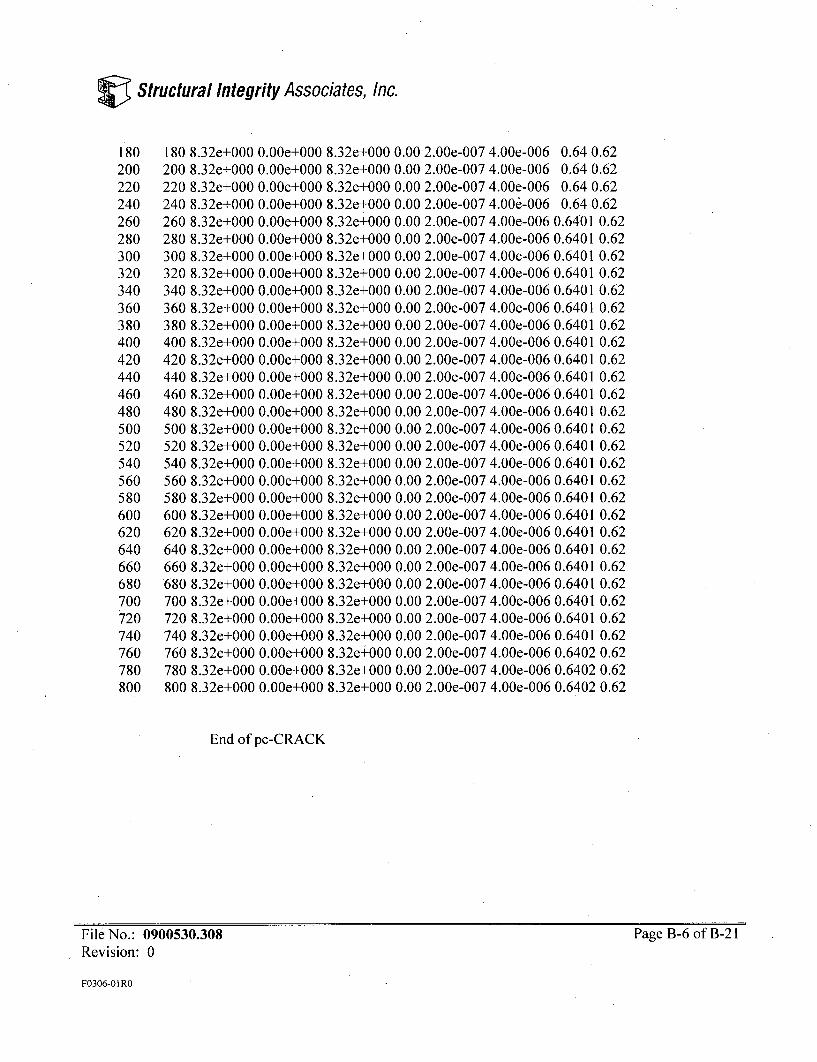
Structural Integrity Associates, Inc.
180 180 8.32e+000 0.00e+000 8.32e+000 0.00-2.00e-007 4.00e-006 0.64 0.62200 200 8.32e+000 0.00e+000 8.32e+000 0.00 2.00e-007 4.00e-006 0.64 0.62220 220 8.32e+000 0.00e+000 8.32e+000 0.00 2.00e-007 4.00e-006 0.64 0.62240 240 8.32e+000 0.00e+000 8.32e+000 0.00 2.00e-007 4.00e-006 0.64 0.62260 260 8.32e+000 0.00e+000 8.32e+000 0.00 2.00e-007 4.00e-006 0.6401 0.62280 280 8.32e+000 0.00e+000 8.32e+000 0.00 2.00e-007 4.00e-006 0.6401 0.62300 300 8.32e+000 0.00e+000 8.32e+000 0.00 2.00e-007 4.00e-006 0.6401 0.62320 320 8.32e+000 0.00e+000 8.32e+000 0.00 2.00e-007 4.00e-006 0.6401 0.62340 340 8.32e+000 0.00e+000 8.32e+000 0.00 2.00e-007 4.00e-006 0.6401 0.62360 360 8.32e+000 0.00e+000 8.32e+000 0.00 2.00e-007 4.00e-006 0.6401 0.62380 380 8.32e+000 0.00e+000 8.32e+000 0.00 2.00e-007 4.00e-006 0.6401 0.62400 400 8.32e+000 0.00e+000 8.32e+000 0.00 2.00e-007 4.00e-006 0.6401 0.62420 420 8.32e+000 0.00e+000 8.32e+000 0.00 2.00e-007 4.00e-006 0.6401 0.62440 440 8.32e+000 0.00e+000 8.32e+000 0.00 2.00e-007 4.00e-006 0.6401 0.62460 460 8.32e+000 0.00e+000 8.32e+000 0.00 2.00e-007 4.00e-006 0.6401 0.62480 480 8.32e+000 0.00e+000 8.32e+000 0.00 2.00e-007 4.00e-006 0.6401 0.62500 500 8.32e+000 0.00e+000 8.32e+000 0.00 2.00e-007 4.00e-006 0.6401 0.62520 520 8.32e+000 0.00e+000 8.32e+000 0.00 2.00e-007 4.00e-006 0.6401 0.62540 540 8.32e+000 0.00e+000 8.32e+000 0.00 2.00e-007 4.00e-006 0.6401 0.62560 560 8.32e+000 0.00e+000 8.32e+000 0.00 2.00e-007 4.00e-006 0.6401 0.62580 580 8.32e+000 0.00e+000 8.32e+000 0.00 2.00e-007 4.00e-006 0.6401 0.62600 600 8.32e+000 0.00e+000 8.32e+000 0.00 2.00e-007 4.00e-006 0.6401 0.62620 620 8.32e+000 0.00e+000 8.32e+000 0.00 2.00e-007 4.00e-006 0.6401 0.62640 640 8.32e+000 0.00e+000 8.32e+000 0.00 2.00e-007 4.00e-006 0.6401 0.62660 660 8.32e+000 0.00e+000 8.32e+000 0.00 2.00e-007 4.00e-006 0.6401 0.62680 680 8.32e+000 0.00e+000 8.32e+000 0.00 2.00e-007 4.00e-006 0.6401 0.62700 700 8.32e+000 0.00e+000 8.32e+000 0.00 2.00e-007 4.00e-006 0.6401 0.62720 720 8.32e+000 0.00e+000 8.32e+000 0.00 2.00e-007 4.00e-006 0.6401 0.62740 740 8.32e+000 0.00e+000 8.32e+000 0.00 2.00e-007 4.00e-006 0.6401 0.62760 760 8.32e+000 0.00e+000 8.32e-+000 0.00 2.00e-007 4.00e-006 0.6402 0.62780 780 8.32e+000 0.00e+000 8.32e+000 0.00 2.00e-007 4.00e-006 0.6402 0.62800 800 8.32e+000 0.00e+000 8.32e+000 0.00 2.00e-007 4.00e-006 0.6402 0.62
End of pc-CRACK
File No.: 0900530.308 Page B-6 of B-21Revision: 0
F0306-OiRO

Structural Integrity Associates, Inc.
FCG Case with Residual Stresses Considered
tmpc-CRACK for Windows
Version 3.1-98348(C) Copyright '84 -'98
Structural Integrity Associates, Inc.3315 Almaden Expressway, Suite 24
San Jose, CA 95118-1557Voice: 408-978-8200Fax: 408-978-8964
E-mail: [email protected]
Linear Elastic Fracture Mechanics
Date: Thu Jul 23 09:40:18 2009Input Data and Results File: JP1NFCGR.LFM
Title: Pilgrim N9A JPIN FCG Analysis with Residual Stresses
Load Cases:
Case ID: P1_rsdl_70FAxial --- Stress Distribution
Depth Stress
0.0000 -2706.00000.0563 -13254.00000.1127 -19160.00000.1690 -23077.00000.2254 -31868.00000.28 17 -51968.00000.3380 -63785.00000.3944 -54357.00000.4507 -44784.00000.5070 -39731.00000.5634 -19705.00000.6197 -4105.70020.6761 8184.10010.7324 19524.00000.7887 17780.00000.8451 17251.00000.9014 22486.0000
File No.: 0900530.308 Page B-7 of B-21Revision: 0
F0306-01 RO
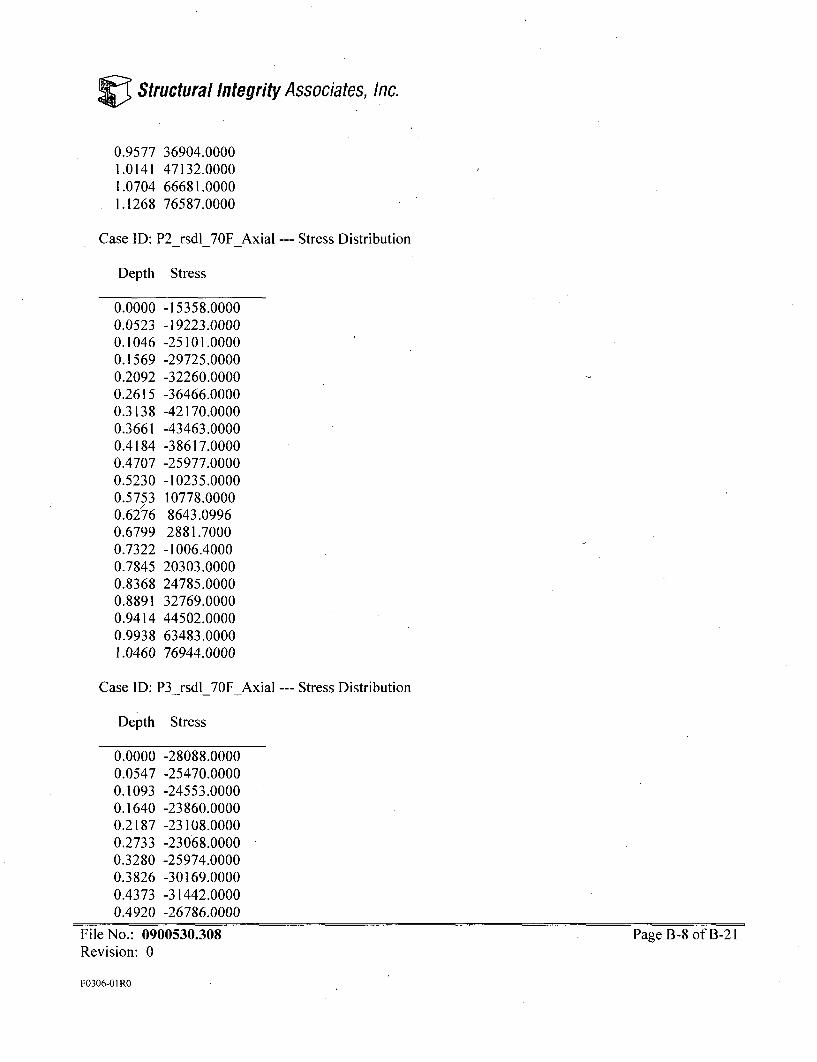
Structural Integrity Associates, Inc.
0.9577 36904.00001.0141 47132.00001.0704 66681.00001.1268 76587.0000
Case ID: P2_rsdl_70FAxial --- Stress Distribution
Depth Stress
0.0000 -15358.00000.0523 -19223.00000.1046 -25101.00000.1569 -29725.00000.2092 -32260.00000.2615 -36466.00000.3138 -42170.00000.3661 -43463.00000.4184 -38617.00000.4707 -25977.00000.5230 -10235.00000.5753 10778.00000.62ý76 8643.09960.6799 2881.70000.7322 -1006.40000.7845 20303.00000.8368 24785.00000.8891 32769.00000.9414 44502.00000.9938 63483.00001.0460 76944.0000
Case ID: P3_rsdl_70FAxial --- Stress Distribution
Depth Stress
0.0000 -28088.00000.0547 -25470.00000.1093 -24553.00000.1640 -23860.00000.2187 -23108.00000.2733 -23068.00000.3280 -25974.00000.3826 -30169.00000.4373 -31442.00000.4920 -26786.0000
File No.: 0900530.308 Page B-8 of B-21Revision: 0
F0306-01 RO

V Structural Integrity Associates, Inc.
0.5466 -16923.00000.6013 876.78000.6559 -7463.10010.7106 10757.00000.7653 4197.29980.8199 9730.20020.8746 8700.40040.9292 26349.00000.9839 42410.00001.0386 59758.00001.0932 69767.0000
Case ID: P4_rsdl_70FAxial --- Stress Distribution
Depth Stress
0.0000 -3281.00000U0579 -5048.20020,1158 -8148.10010.1737 -11551.00000,2316 -14631.00000U2895 -17622.00000,3474 -21975.00000,4053 -26882.00000,4632 -31775.00000.5211 -33323.00000.5790 -22262.00000.6370 1515.50000,6949 -9935.40040.7528 1211.80000.8107 1405.70000.8686 13106.00000.9265 16245.00000.9844 25417.00001.0423 41034.00001.1002 58041.00001.1581 69767.0000
Case ID: P5 rsdl_70FAxial --- Stress Distribution
Depth Stress
0.0000 5531.29980.0523 3583.89990.1046 -1635.9000
File No.: 0900530.308 Page B-9 of B-21Revision: 0
F0306-01 RO
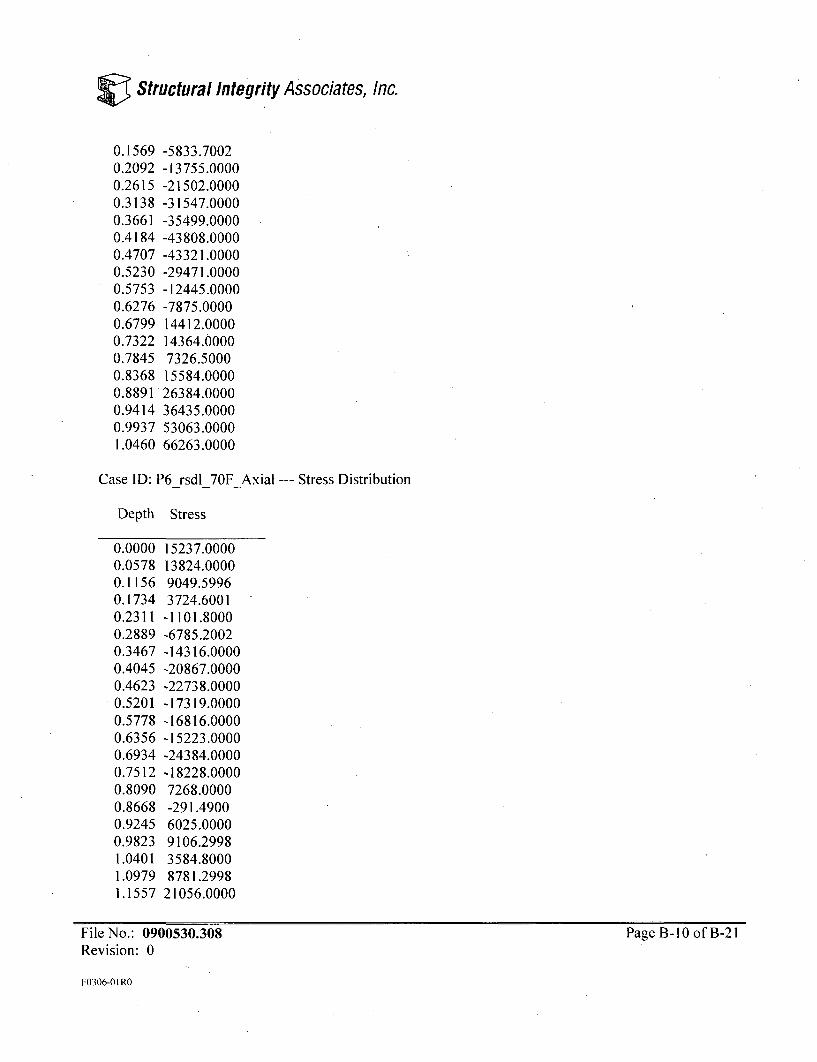
Structural Integrity Associates, Inc.
0.1569 -5833.70020.2092 -13755.00000.2615 -21502.00000.3138 -31547.00000.3661 -35499.00000.4184 -43808.00000.4707 -43321.00000.5230 -29471.00000.5753 -12445.00000.6276 -7875.00000.6799 14412.00000.7322 14364.00000.7845 7326.50000.8368 15584.00000.8891 26384.00000.9414 36435.00000.9937 53063.00001.0460 66263.0000
Case ID: P6_rsdl_70FAxial --- Stress Distribution
Depth Stress
0.0000 15237.00000.0578 13824.00000.1156 9049.59960.1734 3724.60010.2311 -1101.80000.2889 -6785.20020.3467 -14316.00000.4045 -20867.00000.4623 -22738.00000.5201 -17319.00000.5778 -16816.00000.6356 -15223.00000.6934 -24384.00000.7512 -18228.00000.8090 7268.00000.8668 -291.49000.9245 6025.00000.9823 9106.29981.0401 3584.80001.0979 8781.29981.1557 21056.0000
File No.: 0900530.308 Page B-10 of B-21Revision: 0
F0306-01 RO
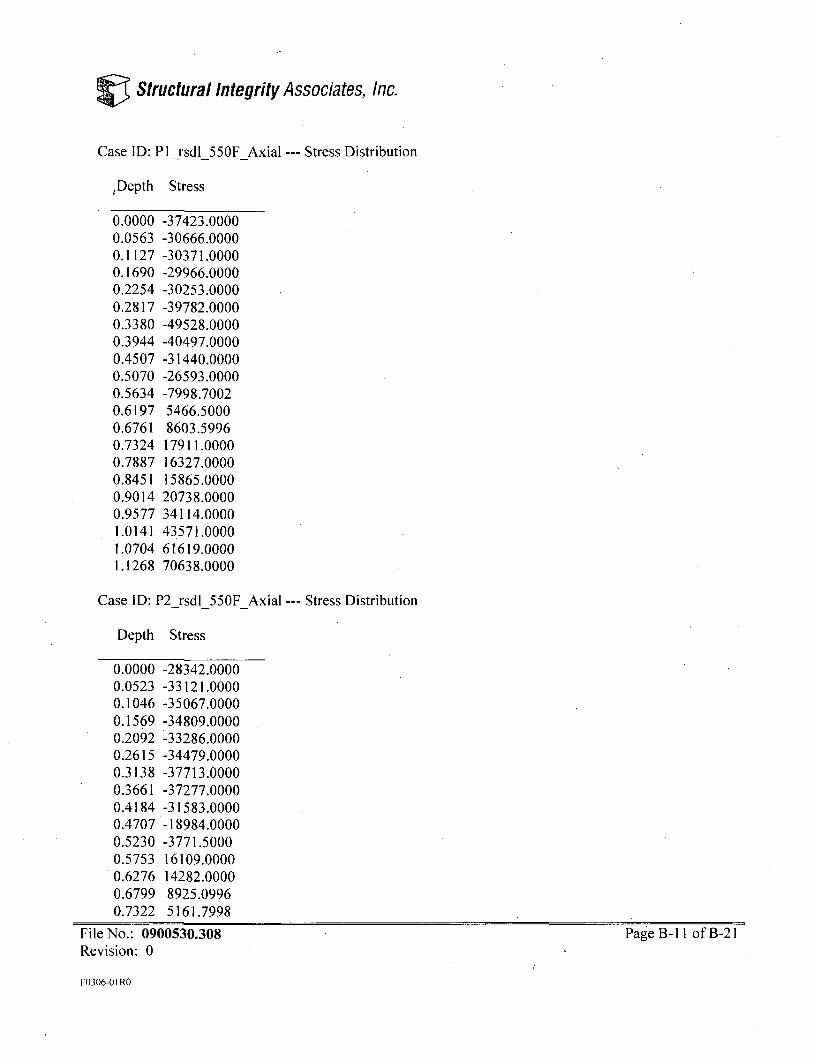
Structural Integrity Associates, Inc.
Case ID: Plrsdl_550FAxial --- Stress Distribution
Depth Stress
0.0000 -37423.00000.0563 -30666.00000.1127 -30371.00000.1690 -29966.00000.2254 -30253.00000.2817 -39782.00000.3380 -49528.00000.3944 -40497.00000.4507 -31440.00000.5070 -26593.00000.5634 -7998.70020.6197 5466.50000.6761 8603.59960.7324 17911.00000.7887 16327.00000.8451 15865.00000.9014 20738.00000.9577 34114.00001.0141 43571.00001.0704 61619.00001.1268 70638.0000
Case ID: P2_rsdl_550FAxial --- Stress Distribution
Depth Stress
0.0000 -28342.00000.0523 -33121.00000.1046 -35067.00000.1569 -34809.00000.2092 -33286.00000.2615 -34479.00000.3138 -37713.00000.3661 -37277.00000.4184 -31583.00000.4707 -18984.00000.5230 -3771.50000.5753 16109.00000.6276 14282.00000.6799 8925.09960.7322 5161.7998
File No.: 0900530.308 Page B-11 of B-21Revision: 0
F0306-01 RO
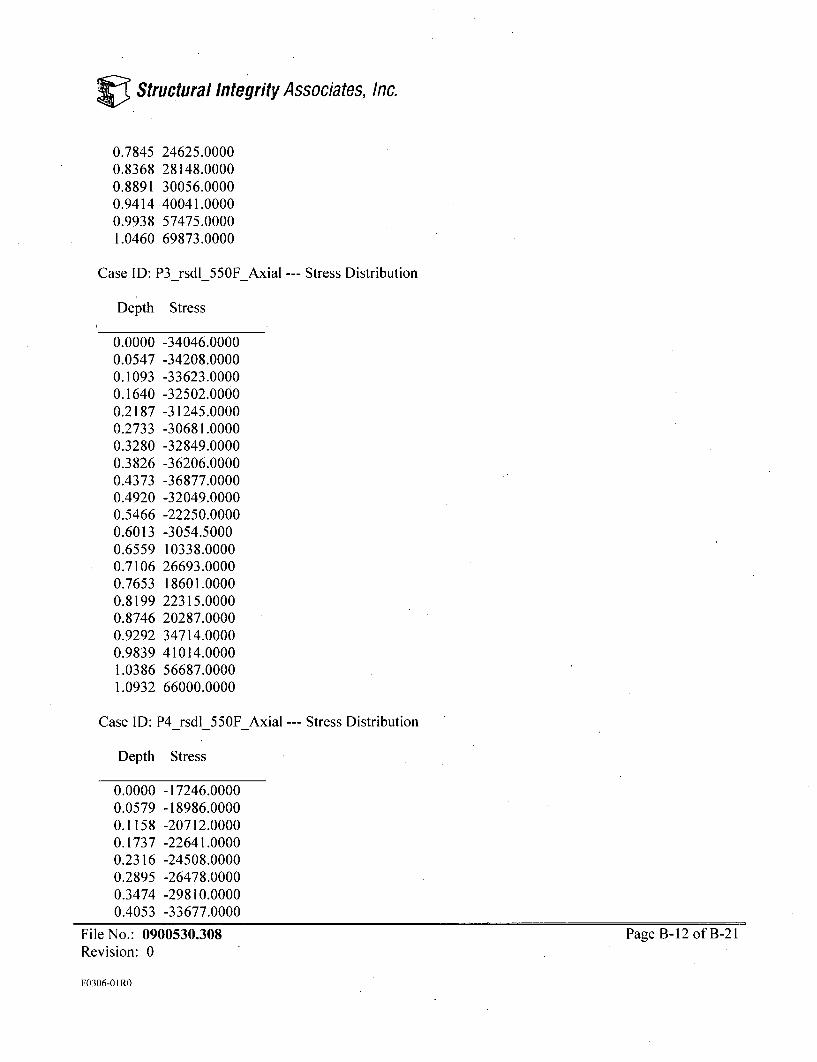
Structural Integrity Associates, Inc.
0.7845 24625.00000.8368 28148.00000.8891 30056.00000.9414 40041.00000.9938 57475.00001.0460 69873.0000
Case ID: P3_rsdl_550FAxial --- Stress Distribution
Depth Stress
0.0000 -34046.00000.0547 -34208.00000.1093 -33623.00000.1640 -32502.00000.2187 -31245.00000.2733 -30681.00000.3280 -32849.00000.3826 -36206.00000.4373 -36877.00000.4920 -32049.00000.5466 -22250.00000.6013 -3054.50000.6559 10338.00000.7106 26693.00000.7653 18601.00000.8199 22315.00000.8746 20287.00000.9292 34714.00000.9839 41014.00001.0386 56687.00001.0932 66000.0000
Case ID: P4_rsdl_550FAxial --- Stress Distribution
Depth Stress
0.0000 -17246.00000.0579 -18986.00000.1158 -20712.00000.1737 -22641.00000.2316 -24508.00000.2895 -26478.00000.3474 -29810.00000.4053 -33677.0000
File No.: 0900530.308 Page B-12 of B-21Revision: 0
F0306-01 RO
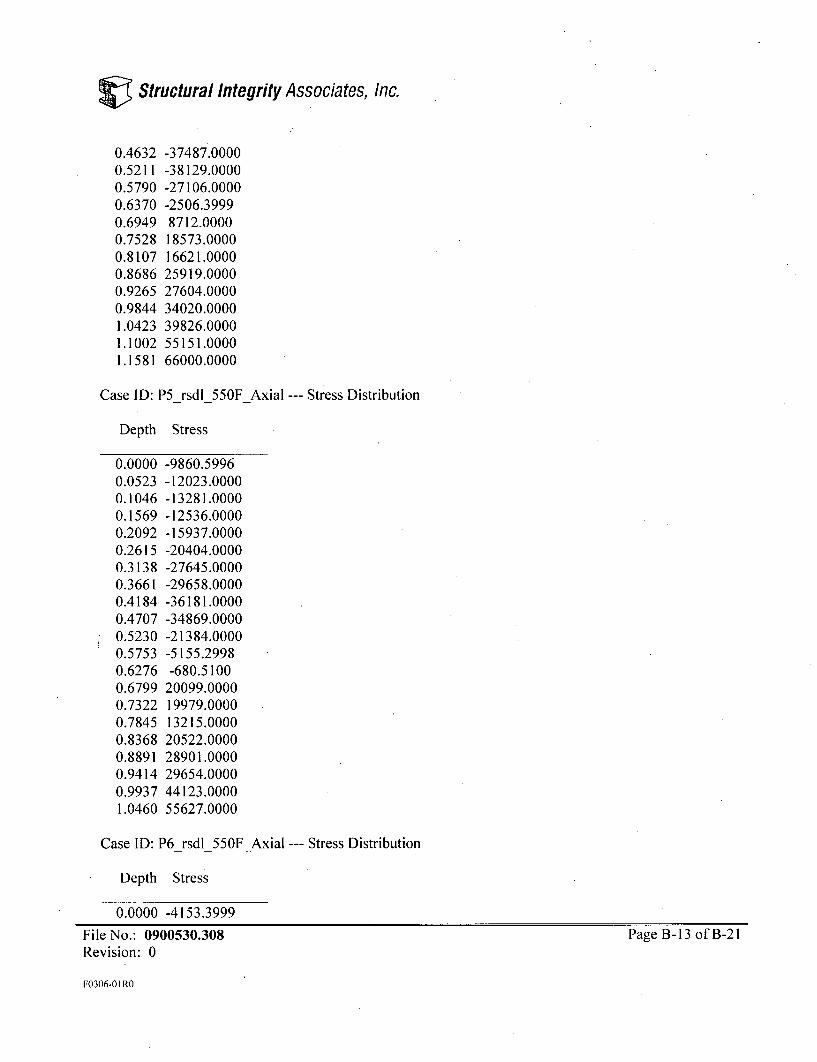
Structural Integrity Associates, Inc.
0.4632 -37487.00000.5211 -38129.00000.5790 -27106.00000.6370 -2506.39990.6949 8712.00000.7528 18573.00000.8107 16621.00000.8686 25919.00000.9265 27604.00000.9844 34020.00001.0423 39826.00001.1002 55151.00001.1581 66000.0000
Case ID: P5_rsdi550FAxial --- Stress Distribution
Depth Stress
0.0000 -9860.59960.0523 -12023.00000.1046 -13281.00000.1569 -12536.00000.2092 -15937.00000.2615 -20404.00000.3138 -27645.00000.3661 -29658.00000.4184 -36181.00000.4707 -34869.00000.5230 -21384.00000.5753 -5155.29980.6276 -680.51000.6799 20099.00000.7322 19979.00000.7845 13215.00000.8368 20522.00000.8891 28901.00000.9414 29654.00000.9937 44123.00001.0460 55627.0000
Case ID: P6_rsdl_55OFAxial --- Stress Distribution
Depth Stress
0.0000 -4153.3999
File No.: 0900530.308 Page B-13 of B-21Revision: 0
F0306-01 RO

V Structural Integrity Associates, Inc.
0.0578 -3844.70000.1156 -5437.70020.1734 -7985.39990.2311 -10562.00000.2889 -14188.00000.3467 -19675.00000.4045 -24334.00000.4623 -24692.00000.5201 -18159.00000.5778 -15576.00000.6356 -7235.29980.6934 -8139.79980.7512 -4439.89990.8090 17203.00000.8668 8686.59960.9245 13425.00000.9823 15405.00001.0401 9661.20021.0979 14122.00001.1557 25381.0000
Stress CoefficientsCase ID CO Cl C2 C3 Type
Primary Axial SPI rsdl 70F AxiP2 rsdl 70F AxiP3 rsdl 70F AxiP4 rsdl 70F AxiP5 rsdl 70F AxiP6 rsdl 70F AxiP1 rsdl 550F AxP2 rsdl 550F AxP3 rsdl 550F AxP4 rsdl 550F AxP5 rsdl 550F AxP6_rsdl_550FAx
31083885.37
-13893.9-25590
899.91315914.822229.9-30101.6-29975.6-29271.3-9900.14-2123.083166.73
0-340174-170320
-6482.04-114302-269042-168601-84939.3-79766.8-93075.8-166413-180397-139838
0 0671398375369
-2191.35127279441695206743247674278772280055342253374942258349
Coeff-282654-12981080004.719565.5-134813
-54358.7-86072.5-113600-108485-124837-146624-106937
StressDistStressDist
StressDistStressDistStressDistStressDistStressDistStressDistStressDistStressDistStressDistStressDist
-----Through Wall Stresses for Load Cases With Stress Coeff-------Wall Case
Depth Primary Ax
File No.: 0900530.308Revision: 0
Page B-14 of B-21
F0306-01 RO
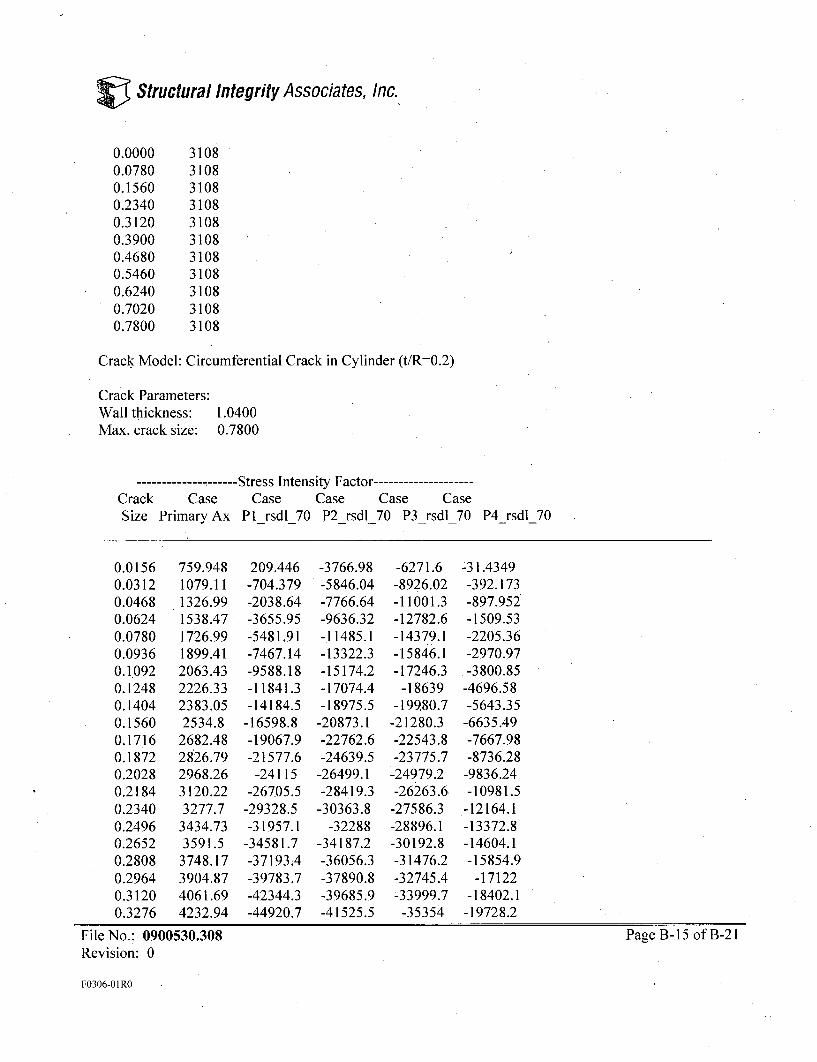
Structural Integrity Associates, Inc.
0.00000.07800.15600.23400.31200.39000.46800.54600.62400.70200.7800
31083108310831083108310831083108310831083108
Crack Model: Circumferential Crack in Cylinder (t/R=0.2)
Crack Parameters:Wall thickness: 1.0400Max. crack size: 0.7800
-Stress Intensity Factor --------------------Crack CaseSize Primary Ax
Case Case Case CasePlrsdl_70 P2_rsdl_70 P3_rsdl_70 P4_rsdl_70
0.01560.03120.04680.06240.07800.09360.10920.12480.14040.15600.17160.18720.20280.21840.23400.24960.26520.28080.29640.31200.3276
759.9481079.111326.991538.471726.991899.412063.432226.332383.052534.8
2682.482826.792968.263120.223277.7
3434.733591.5
3748 173904.874061.694232.94
209.446-704.379-2038.64-3655.95-5481.91-7467.14-9588.18-11841.3-14184.5
-16598.8-19067.9-21577.6
-24115-26705.5
-29328.5-31957.1-34581.7-37193.4-39783.7-42344.3-44920.7
-3766.98-5846.04-7766.64-9636.32-11485.1
-13322.3-15174.2-17074.4-18975.5-20873.1-22762.6-24639.5-26499.1-28419.3-30363.8
-32288-34187.2-36056.3-37890.8-39685.9-41525.5
-6271.6-8926.02-11001.3-12782.6-14379.1-15846.1-17246.3
-18639-19980.7-21280.3-22543.8-23775.7-24979.2-26263.6
-27586.3-28896.1-30192.8-31476.2-32745.4.33999.7-35354
-31.4349-392.173-897.952-1509.53-2205.36-2970.97-3800.85
-4696.58-5643.35
-6635.49-7667.98-8736.28
-9836.24-10981.5
-12164.1-13372.8-14604.1-15854.9-17122
-18402.1-19728.2
File No.: 0900530.308Revision: 0
Page B- 15 of B-21
F0306-01 RO
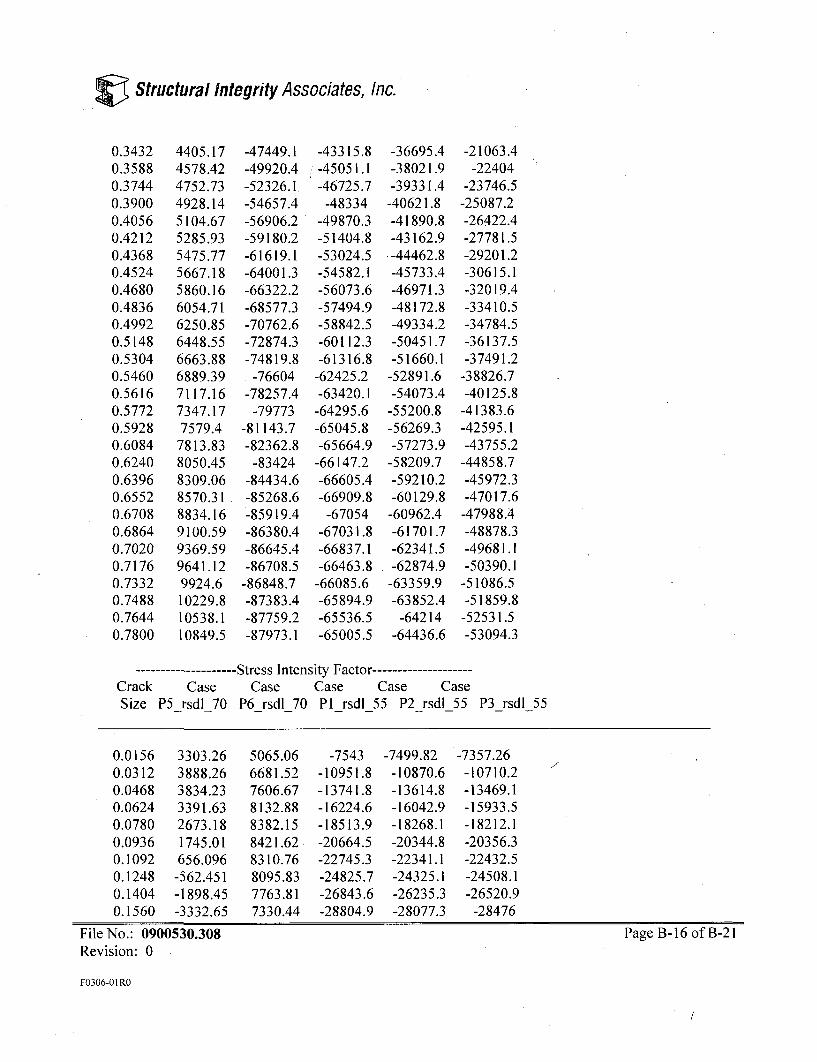
V Structural Integrity Associates, Inc.
0.34320.35880.37440.39000.40560.42120.43680.45240.46800.48360.49920.51480.53040.54600.56160.57720.59280.60840.62400.63960.65520.67080.68640.70200.71760.73320.74880.76440.7800
4405.174578.424752.734928.145104.675285.935475.775667.185860.166054.716250.856448.556663.886889.397117.167347.177579.4
7813.838050.458309.068570.318834.169100.599369.599641.129924.610229.810538.110849.5
-47449.1-49920.4-52326.1.-54657.4-56906.2-59180.2-61619.1-64001.3-66322.2-68577.3-70762.6-72874.3-74819.8-76604
-78257.4-79773
-81143.7-82362.8-83424
-84434.6-85268.6-85919.4-86380.4-86645.4-86708.5
-86848.7-87383.4-87759.2-87973.1
-43315.8-45051.1-46725.7
-48334-49870.3-51404.8-53024.5-54582.1-56073.6-57494.9-58842.5-60112.3-61316.8
-62425.2-63420.1
-64295.6-65045.8-65664.9
-66147.2-66605.4-66909.8
-67054-67031.8-66837.1-66463.8
-66085.6-65894.9-65536.5-65005.5
-36695.4-38021.9-39331.4
-40621.8-41890.8-43162.9-44462.8-45733.4-46971.3-48172.8-49334.2-50451.7-51660.1
-52891.6-54073.4
-55200.8-56269.3-57273.9
-58209.7-59210.2-60129.8
-60962.4-61701.7-62341.5-62874.9
-63359.9-63852.4
-64214-64436.6
-21063.4-22404
-23746.5-25087.2-26422.4-27781.5-29201.2-30615.1-32019.4-33410.5-34784.5-36137.5-37491.2
-38826.7-40125.8-41383.6-42595.1-43755.2
-44858.7-45972.3-47017.6
-47988.4-48878.3-49681.1-50390.1
-51086.5-51859.8
-52531.5-53094.3
---------- Stress Intensity Factor ------------Crack Case Case Case Case CaseSize P5 rsdl_70 P6_rsdl_70 P1_rsdl_55 P2_rsdl_55 P3_rsdl_55
0.01560.03120.04680.06240.07800.09360.10920.12480.14040.1560
3303.263888.263834.233391.632673.181745.01656.096
-562.451-1898.45-3332.65
5065.066681.527606.678132.888382.158421.628310.768095.837763.817330.44
-7543-10951.8-13741.8-16224.6-18513.9-20664.5-22745.3-24825.7-26843.6-28804.9
-7499.82-10870.6-13614.8-16042.9-18268.1-20344.8-22341.1-24325.1-26235.3-28077.3
-7357.26-10710.2-13469.1-15933.5-18212.1-20356.3-22432.5-24508.1-26520.9
-28476
File No.: 0900530.308Revision: 0
Page B-16 of B-21
F0306-01 R0
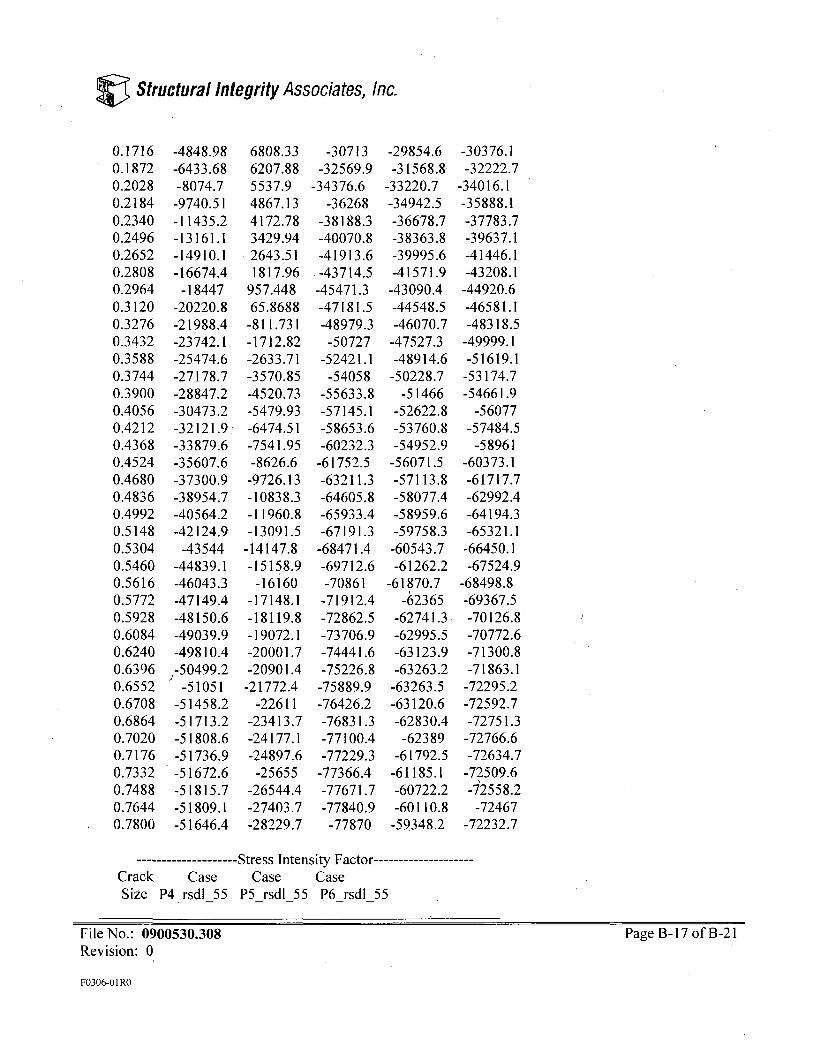
r Structural Integrity Associates, Inc.
0.17160.18720.20280.21840.23400.24960.26520.28080.29640.31200.32760.34320.35880.37440.39000.40560.42120.43680.45240.46800.48360.49920.51480.53040.54600.56160.57720.59280.60840.62400.63960.65520.67080.68640.70200.71760.73320.74880.76440.7800
-4848.98-6433.68-8074.7-9740.51-11435.2-13161.1-14910.1-16674.4-18447
-20220.8-21988.4-23742.1-25474.6-27178.7-28847.2-30473.2-32121.9,-33879.6-35607.6-37300.9-38954.7-40564.2-42124.9
-43544-44839.1-46043.3-47149.4-48150.6-49039.9-49810.4-50499.2
-51051-51458.2-51713.2-51808.6-51736.9-51672.6-51815.7-51809.1-51646.4
6808.336207.885537.94867.134172.783429.942643.511817.96
957.44865.8688
-811.731-1712.82-2633.71-3570.85-4520.73-5479.93-6474.51-7541.95-8626.6
-9726.13-10838.3-11960.8-13091.5
-14147.8-15158.9
-16i60-17148.1-18119.8-19072.1-20001.7-20901.4
-21772.4-22611
-23413.7-24177.1-24897.6-25655
-26544.4-27403.7-28229.7
-30713-32569.9
-34376.6-36268
-38188.3-40070.8-41913.6
.- 43714.5-45471.3-47181.5-48979.3
-50727-52421.1
-54058-55633.8-57145.1-58653.6-60232.3
-61752.5-63211.3-64605.8-65933.4-67191.3-68471.4-69712.6-70861
-71912.4-72862.5-73706.9-74441.6-75226.8
-75889.9-76426.2-76831.3-77100.4-77229.3
-77366.4-77671.7-77840.9-77870
-29854.6-31568.8
-33220.7-34942.5-36678.7-38363.8-39995.6-41571.9-43090.4-44548.5-46070.7
-47527.3-48914.6-50228.7
-51466-52622.8-53760.8-54952.9
-56071.5-57113.8-58077.4-58959.6-59758.3-60543.7-61262.2
-61870.7-62365
-62741.3-62995.5-63123.9-63263.2
-63263.5-63120.6-62830.4-62389
-61792.5-61185.1-60722.2-60110.8
-59348.2
-30376.1-32222.7
-34016.1-35888.1-37783.7-39637.1-41446.1-43208.1
-44920.6-46581.1-48318.5
-49999.1-51619.1
-53174.7-54661.9
-56077-57484.5
-58961-60373.1-61717.7-62992.4-64194.3-65321.1
-66450.1-67524.9
-68498.8-69367.5-70126.8-70772.6-71300.8-71863.1
-72295.2-72592.7-72751.3
-72766.6-72634.7
-72509.6-72558.2
-72467-72232.7
--------- Stress Intensity Factor ....Crack Case Case CaseSize P4_rsdl_55 P5_rsdl_55 P6_rsdl_55
File No.: 0900530.308Revision: 0
Page B-17 of B-21
F0306-01 RO

V Structural Integrity Associates, Inc.
0.01560.03120.04680.06240.07800.09360.10920.12480.14040.15600.17160.18720.20280.21840.23400.24960.26520.28080.29640.31200.32760.34320.35880.37440.39000.40560.42120.43680.45240.46800.48360.49920.51480.53040.54600.56160.57720.59280.60840.62400.63960.65520.67080.6864
-2782.63-4439.7
-6029.73-7617.33-9216.66-10829.2-12472.1-14170.6-15884.5-17608.7-19338.1-21067.9-22793.3-24576.3-26387.4-28190.5
-29981-31754.4-33506.6-35233.4-37006.1-38745.2-40445.5-42102.2-43710.3
-45265-46831.2-48489.7-50105.9-51676.3-53197.9-54667.6-56082.4-57449.2-58743.5-59952.3-61070.6-62093.6-63016.7-63835.1-64656.8
-65361-65942.5-66396.4
-911.342-1823.15-2859.24-3993.04-5202.64-6470.62-7794.35-9180.99-10601.1-12045.7-13507.1-14978.1-16452.3-17959.8-19482.6-20998.3
-22501.5-23987.2-25450.6-26886.9-28334.2-29743.5-31109.7-32427.4-33691.4
-34896.9-36104.9-37393.7-38635.9-39828.4-40968.2-42052.2-43077.8-44006.3-44832.8-45566.7-46203.2-46737.6-47165.3-47481.9-47752.1-47897.6-47913.6-47795.6
469.397252.718-175.233-740.887
-1407.27-2150.95-2958.77-3826.01-4738.06-5686.81-6665.33-7667.6
-8688.31-9731.99-10792.8-11862.7
-12937.8-14014.6-15089.6-16159.7-17240.2-18308.9-19362.4-20397.3-21410.2-22398-23402.9-24479.8-25542.1-26588
-27615.8-28624.1-29611.2-30540.8•31415.7-32248.2-33035.4-33774.9-34463.9-35100.1-35728.7
-36297.9-36805.2-37248.1
File No.: 0900530.308Revision: 0
Page B-18 of B-21
F0306-01 R0

V Structural Integrity Associates, Inc.
0.70200.71760.73320.74880.76440.7800
-66717.8-66901.8-67112.6-67533
-67830.9-68002.4
-47538.8-47139.1-46750.9-46549-46222-45767
-37624.2-37931.2-38280.3
-38798.6-39265.5-39679.8
Crack Growth Laws:
Law ID: OverlayModel: ASME Section XI - austenitic stainless steel in air environment
da/dN r C * 10AF * S * dKA3.3where
S= 1.0 for R< 0=1.0+l.8*R for 0 < R < 0.79=-43.5+57.97* R for 0.79<R<I
F code specified function of temperaturedK = Kmax - KminR = Kmin / Kmax
where:C * 10AF= 1.8403e-010is for the currently selected units of:
force: kiplength: inchtemperature: 550.0000 Fahrenheit
Material Fracture Toughness Kic:
Material ID: Overlay
Depth Kic
0.25001.00002.0000
200.0000200.0000200.0000
Initial crack size=Max. crack size=
0.64000.7800
File No.: 0900530.308Revision: 0
Page 13-19 of B-21
F0306-01 RO
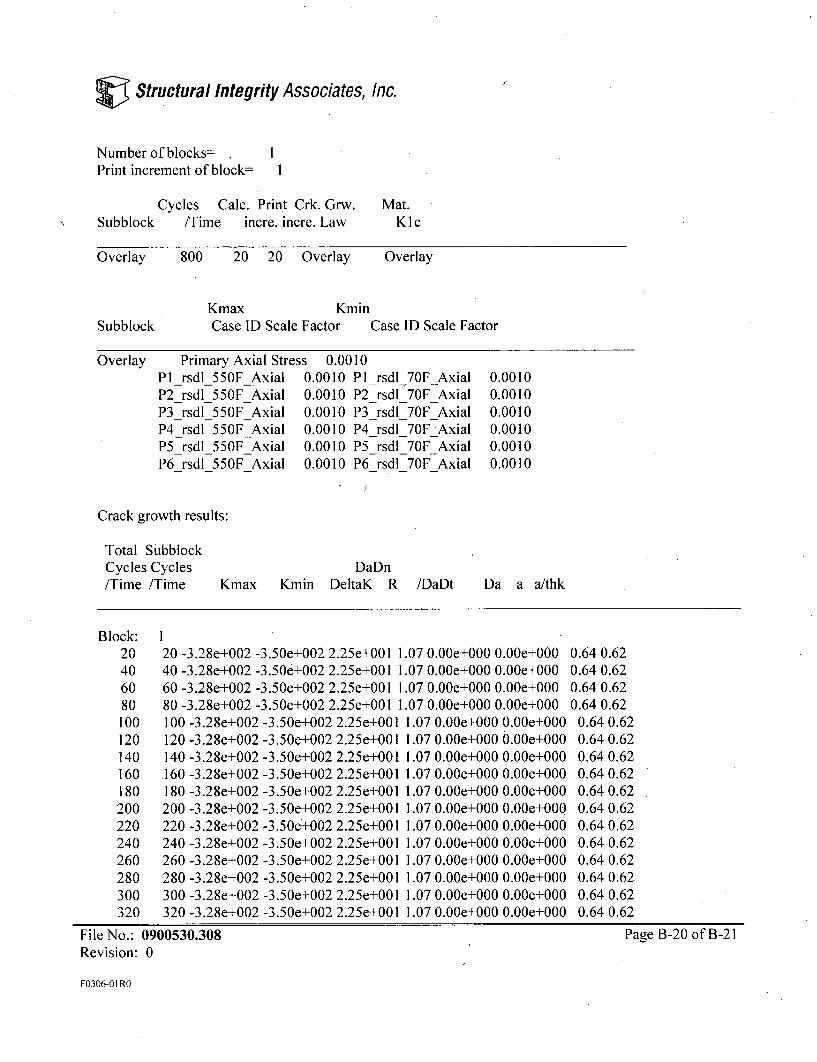
Structural Integrity Associates, Inc.
Number of blocks=Print increment of block= 1
Cycles Calc. Print Crk. Grw. Mat.Subblock /Time incre. incre. Law KIc
Overlay 800 20 20 Overlay Overlay
Kmax KminSubblock Case ID Scale Factor Case ID Scale Factor
Overlay Primary Axial Stress 0.0010PI rsdi 550F Axial 0.0010 P1_rsdl_70FAxialP2 rsdl 550F Axial 0.0010 P2 rsdl 70F AxialP3 rsdl 550F Axial 0.0010 P3 rsdl 70F AxialP4 rsdl 550F Axial 0.0010 P4_rsdl_70FAxialP5 rsdl 550F Axial 0.0010 P5 rsdl 70F AxialP6_rsdl_550FAxial 0.0010 P6_rsdl_70FAxial
0.00100.00100.00100.00100.00100.0010
Crack growth results:
Total SubblockCycles Cycles/Time /Time
DaDnKmax Kmin DeltaK R /DaDt Da a a/thk
Block:20406080
120 -3.28e+002 -3.50e+002 2.25e+00140 -3.28e+002 -3.50e+002 2.25e+00160 -3.28e+002 -3.50e+002 2.25e+00180 -3.28e+002 -3.50e+002 2.25e+001
100 100 -3.28e+002 -3.50e+002 2.25e+001120 120 -3.28e+002 -3.50e+002 2.25e+001140 140 -3.28e+002 -3.50e+002 2.25e+001160 160 -3.28e+002 -3.50e+002 2.25e+001180 180 -3.28e+002 -3.50e+002 2.25e+001200 200 -3.28e+002 -3.50e+002 2.25e+001220 220 -3.28e+002 -3.50e+002 2.25e+001240 240 -3.28e+002 -3.50e+002 2.25e+001260 260 -3.28e+002 -3.50e+002 2.25e+001280 280 -3.28e+002 -3.50e+002 2.25e+001300 300 -3.28e+002 -3.50e+002 2.25e+001320 320 -3.28e+002 -3.50e+002 2.25e+001
File No.: 0900530.308Revision: 0
1.07 0.00e+000 0.00e+000[.07 0.00e+000 0.00e+0001.07 0.00e+000 0.00e+000[.07 0.00e+000 0.00e+000
1.07 0.00e+000 0.00e+0001.07 0.00e+000 0.00e+0001.07 0.00e+000 0.00e+0001.07 0.00e+000 0.00e+0001.07 0.00e+000 0.00e+0001.07.0.00e+000 0.00e+0001.07 0.00e+000 0.00e+0001.07 0.00e+000 0.00e+0001.07 0.00e+000 0.00e+0001.07 0.00e+000 0.00e+0001.07 0.00e+000 0.00e+0001.07 0.00e+000 0.00e+000
0.64 0.620.64 0.620.64 0.620.64 0.62
0.64 0.620.64 0.620.64 0.620.64 0.620.64 0.620.64 0.620.64 0.620.64 0.620.64 0.620.64 0.620.64 0.620.64 0.62
Page B-20 of B-21
F0306-01 RO
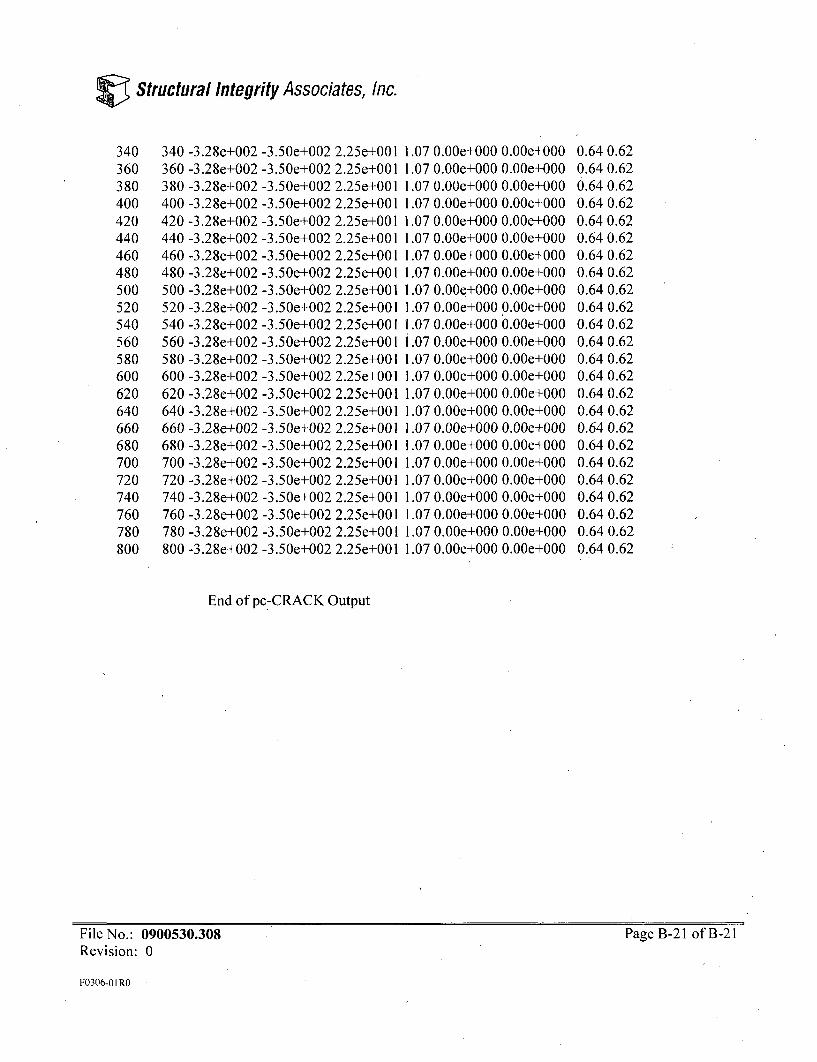
V Structural Integrity Associates, Inc.
340360380400420440460480500520540560580600620640660680700720740760780800
340 -3.28e+002 -3.50e+002 2.25e+001360 -3.28e+002 -3.50e+002 2.25e+001380 -3.28e+002 -3.50e+002 2.25e+001400 -3.28e+002 -3.50e+002 2.25e+001420 -3.28e+002 -3.50e+002 2.25e+001440 -3.28e+002 -3.50e+002 2.25e+001460 -3.28e+002 -3.50e+002 2.25e+001480 -3.28e+002 -3.50e+002 2.25e+001500 -3.28e+002 -3.50e+002 2.25e+001520 -3.28e+002 -3.50e+002 2.25e+001540 -3.28e+002 -3.50e+002 2.25e+001560 -3.28e+002 -3.50e+002 2.25e+001580 -3.28e+002 -3.50e+002 2.25e+001600 -3.28e+002 -3.50e+002 2.25e+001620 -3.28e+002 -3.50e+002 2.25e+00l640 -3.28e+002 -3.50e+002 2.25e+001660 -3.28e+002 -3.50e+002 2.25e+001680 -3.28e+002 -3.50e+002 2.25e+001700 -3.28e+002 -3.50e+002 2.25e+001720 -3.28e+002 -3.50e+002 2.25e+001740 -3.28e+002 -3.50e+002 2.25e+001760 -3.28e+002 -3.50e+002 2.25e+001780 -3.28e+002 -3.50e+002 2.25e+001800 -3.28e+002 -3.50e+002 2.25e+001
1.07 0.00e+000 0.00e+0001.07 0.00e+000 0.00e+0001.07 0.00e+000 0.00e+0001.07 0.00e+000 0.00e+0001.07 0.00e+000 0.00e+0001.07 0.00e+000 0.00e+0001.07 0.00e+000 0.00e+0001.07 0.00e+000 0.00e+0001.07 0.00e+000 0.00e+0001.07 0.00e+000 0.00e+0001.07 0.00e+000 0.00e+0001.07 0.00e+000 0.00e+0001.07 0.00e+000 0.00e+0001.07 0.00e+000 0.00e+0001.07 0.00e+000 0.00e+0001.07 0.00e+000 0.00e+0001.07 0.OOe+000 0.OOe+0001.07 0.OOe+000 0.OOe+0001.07 0.OOe+000 0.OOe+0001.07 0.OOe+000 0.OOe+0001.07 0.OOe+000 0.OOe+0001.07 0.OOe+000 0.OOe+0001.07 0.OOe+000 0.OOe+0001.07 0.OOe+000 0.OOe+000
0.64 0.620.64 0.620.64 0.620.64 0.620.64 0.620.64 0.620.64 0.620.64 0.620.64 0.620.64 0.620.64 0.620.64 0.620.64 0.620.64 0.620.64 0.620.64 0.620.64 0.620.64 0.620.64 0.620.64 0.620.64 0.620.64 0.620.64 0.620.64 0.62
End of pc-CRACK Output
File No.: 0900530.308Revision: 0
Page B-21 of B-21
F0306-01 RO
Related Documents