Smart Structures and Systems, Vol. 6, No. 5-6 (2010) 461-480 461 Structural health monitoring of a cable-stayed bridge using wireless smart sensor technology: data analyses Soojin Cho 1 , Hongki Jo 2 , Shinae Jang 2 , Jongwoong Park 1 , Hyung-Jo Jung 1 * , Chung-Bang Yun 1 , Billie F. Spencer, Jr. 2 and Ju-Won Seo 3 Department of Civil and Environmental Engineering, KAIST, 373-1 Guseong-dong, Yuseong-gu, Daejeon 305-701, South Korea Department of Civil and Environmental Engineering, University of Illinois at Urbana-Champaign, 205 North Mathews Avenue, Urbana, IL 61801, USA Long Span Bridge Research Team, Hyundai Instititue of Construction Technology, 102-4 Mabook-dong, Giheung-gu, Yongin, Gyounggi-do 449-716, South Korea (Received November 13, 2009, Accepted March 4, 2010) Abstract. This paper analyses the data collected from the 2 nd Jindo Bridge, a cable-stayed bridge in Korea that is a structural health monitoring (SHM) international test bed for advanced wireless smart sensors network (WSSN) technology. The SHM system consists of a total of 70 wireless smart sensor nodes deployed underneath of the deck, on the pylons, and on the cables to capture the vibration of the bridge excited by traffic and environmental loadings. Analysis of the data is performed in both the time and frequency domains. Modal properties of the bridge are identified using the frequency domain decomposition and the stochastic subspace identification methods based on the output-only measurements, and the results are compared with those obtained from a detailed finite element model. Tension forces for the 10 instrumented stay cables are also estimated from the ambient acceleration data and compared both with those from the initial design and with those obtained during two previous regular inspections. The results of the data analyses demonstrate that the WSSN-based SHM system performs effectively for this cable-stayed bridge, giving direct access to the physical status of the bridge. Keywords: wireless smart sensor network; cable-stayed bridge; structural health monitoring; modal identifica- tion; cable tension estimation. 1. Introduction Jang et al. (2010) describes field deployment of structural health monitoring (SHM) system using wireless smart sensor technology on a cable-stayed bridge in Korea (the 2 nd Jindo Bridge). A total of 70 wireless smart sensor nodes are installed with high spatial density on the bridge, facilitating measurements of 3-axis acceleration underneath of the deck, on two pylons, and on the cables. Using two base stations, measurement has been carried out during the past 4 months using an autonomous monitoring system based on the SHM framework proposed by Rice et al. (2010). Overall performance of the system has been evaluated in terms of hardware durability, software stability, power consumption and harvesting (Jang et al. 2010). *Corresponding Author, Associate Professor, E-mail: [email protected]

Welcome message from author
This document is posted to help you gain knowledge. Please leave a comment to let me know what you think about it! Share it to your friends and learn new things together.
Transcript

Smart Structures and Systems, Vol. 6, No. 5-6 (2010) 461-480 461
Structural health monitoring of a cable-stayed bridge using wireless smart sensor technology: data analyses
Soojin Cho1, Hongki Jo2, Shinae Jang2, Jongwoong Park1, Hyung-Jo Jung1*,Chung-Bang Yun1, Billie F. Spencer, Jr.2 and Ju-Won Seo3
1Department of Civil and Environmental Engineering, KAIST, 373-1 Guseong-dong, Yuseong-gu,
Daejeon 305-701, South Korea2Department of Civil and Environmental Engineering, University of Illinois at Urbana-Champaign,
205 North Mathews Avenue, Urbana, IL 61801, USA3Long Span Bridge Research Team, Hyundai Instititue of Construction Technology, 102-4 Mabook-dong,
Giheung-gu, Yongin, Gyounggi-do 449-716, South Korea
(Received November 13, 2009, Accepted March 4, 2010)
Abstract. This paper analyses the data collected from the 2nd Jindo Bridge, a cable-stayed bridge in Koreathat is a structural health monitoring (SHM) international test bed for advanced wireless smart sensors network(WSSN) technology. The SHM system consists of a total of 70 wireless smart sensor nodes deployed underneathof the deck, on the pylons, and on the cables to capture the vibration of the bridge excited by traffic andenvironmental loadings. Analysis of the data is performed in both the time and frequency domains. Modalproperties of the bridge are identified using the frequency domain decomposition and the stochastic subspaceidentification methods based on the output-only measurements, and the results are compared with thoseobtained from a detailed finite element model. Tension forces for the 10 instrumented stay cables are alsoestimated from the ambient acceleration data and compared both with those from the initial design and withthose obtained during two previous regular inspections. The results of the data analyses demonstrate that theWSSN-based SHM system performs effectively for this cable-stayed bridge, giving direct access to the physicalstatus of the bridge.
Keywords: wireless smart sensor network; cable-stayed bridge; structural health monitoring; modal identifica-tion; cable tension estimation.
1. Introduction
Jang et al. (2010) describes field deployment of structural health monitoring (SHM) system using
wireless smart sensor technology on a cable-stayed bridge in Korea (the 2nd Jindo Bridge). A total
of 70 wireless smart sensor nodes are installed with high spatial density on the bridge, facilitating
measurements of 3-axis acceleration underneath of the deck, on two pylons, and on the cables.
Using two base stations, measurement has been carried out during the past 4 months using an
autonomous monitoring system based on the SHM framework proposed by Rice et al. (2010).
Overall performance of the system has been evaluated in terms of hardware durability, software
stability, power consumption and harvesting (Jang et al. 2010).
*Corresponding Author, Associate Professor, E-mail: [email protected]

462 Soojin Cho et al.
The next generation of SHM systems must move from the nice-to-have to the need-to-have
paradigm that is essential and beneficial for structure operation and maintenance (Fujino et al.
2009). To date, wireless smart sensing technology has been studied in depth by many researchers
for monitoring large civil infrastructures; however, only a few full-scale deployments have been
realized, most of which were for demonstration purposes only. For example, Weng et al. (2008)
reported a monitoring campaign to determine the modal properties of the Gi-Lu cable-stayed Bridge
in Taiwan using 12 wireless sensing units interfaced to velocity meters. Various sensor configurations
(i.e., on the deck only or both on the deck and cables) were considered to identify the modal
properties of the global structure, as well as cable tension forces. Pakzad et al. (2008) instrumented
a total of 64 wireless sensor nodes on the deck, one of the towers, and several cables of the Golden
Gate Bridge. A pipeline multi-hop communication protocol was successful to collect the measured
data, which was utilized to evaluate the performance of the wireless sensor network, as well as to identify
modal properties of the bridge. Both of these efforts were short-term demonstration projects.
This paper assesses the performance of the wireless SHM system installed at the 2nd Jindo Bridge
by analyzing the measured acceleration data. This cable-stayed bridge in Korea is a structural
health monitoring (SHM) international test bed for advanced wireless smart sensors network
(WSSN) technology. First, a finite element (FE) model is constructed based on an in-depth study
of the detailed drawings and design documents, and validated using the acceleration data from the
existing wired monitoring system on the bridge. The acceleration data collected from the current
wireless smart sensor network (WSSN) at two base stations (Haenam-side and Jindo-side) are
subsequently analyzed. Two output-only modal identification (ID) methods are used to extract the
modal properties of the bridge from the ambient acceleration data of the deck and the pylons.
The extracted modal properties from both modal ID methods are validated by comparing with
each other and with those from the FE analysis. Tension forces are estimated on 10 of the
bridge’s stay cables using data collected from the sensor nodes mounted on the cables. The
estimated tension forces are compared both with those used in the initial design and with those
obtained during the regular inspections in 2007 and 2008. Finally, a discussion is provided
regarding the efficacy of the monitoring strategy utilizing the WSSN for comprehensive SHM of
the cable-stayed bridge.
2. Finite element model of Jindo Bridge
2.1 Construction of finite element model
Prior to the sensor deployment, a finite element (FE) model of the 2nd Jindo Bridge is constructed
for validation of the analysis results of the measured data based on detailed drawings and design
documents. A commercial structural analysis software, MIDAS/CIVIL (MidasIT 2009), is used. The
bridge’s main box girder is modeled by 128 frame elements with 6 different sectional properties.
Additional masses are appended to the girder to represent the pavement, guard rails, water supply
pipes, curbs and diaphragms. Each of two pylons is modeled by 110 frame elements with 7 different
sectional properties. The spread footings of the pylons are on the stiff rock and thus modeled as
fixed boundary conditions. The cables are modeled by truss elements with Ernst equivalent elastic
moduli to consider the nonlinear effect caused by self-weight of cables with resulting tension forces
and sag (Ernst 1965). Fig. 1 shows the resulting FE model of the 2nd Jindo Bridge.

Structural health monitoring of a cable-stayed bridge using smart sensor technology: data analyses 463
2.2 Validation of the finite element model
A preliminary validation of the FE model is achieved by comparing the computed modal
properties with those extracted from acceleration responses measured in 2007 using the existing
Fig. 1 FE model of the 2nd Jindo Bridge constructed using MIDAS/CIVIL
Fig. 2 Mode shapes and natural frequencies of the 2nd Jindo Bridge from the FE analysis

464 Soojin Cho et al.
wired monitoring system. Fig. 2 shows the first six mode shapes evaluated from the FE model,
including longitudinal, lateral, vertical and torsional modes. The first 10 natural frequencies of the
vertical modes are obtained as 0.442, 0.647, 1.001, 1.247, 1.349, 1.460, 1.586, 2.115, 2.139 and
2.561 Hz. Fig. 3 shows the power spectral density (PSD) of a vertical acceleration record, which
contains vertical and torsional mode information, measured at a quarter span of the deck in 2007.
The first 3 peak frequencies (i.e., 0.440, 0.659 and 1.050 Hz) are in very good agreements with the
FE analysis results, while the higher modal frequencies are larger than the FE results. The
differences in these higher modes are within 16%, which shows the general validity of the FE model;
however, updating of the FE model may increase the efficacy of the model for comprehensive SHM
of the bridge.
3. Wireless smart sensor network and measured data
3.1 Wireless smart sensor network
The 2nd Jindo Bridge at the southern tip of the Korean peninsula has been established as an
international SHM test bed for advanced wireless smart sensor network (WSSN) technology (see Fig.
4). This trilateral collaborative research effort between Korea (KAIST), the USA (University of
Illinois at Urbana-Champaign), and Japan (University of Tokyo) constitutes the largest deployment
of wireless smart sensors to date for monitoring civil infrastructure. A detailed description of this
test bed can be found in Rice et al. (2010) and Jang et al. (2010); for completeness, a brief synopsis
is provided here.
A total of 70 wireless smart sensor nodes (leaf nodes) are installed on the 2nd Jindo Bridge. To
facilitate efficient data collection, the 70 nodes are divided into two sub-networks: 37 nodes on the
Haenam-side and 33 nodes on the Jindo-side, as shown in Fig. 5. 49 nodes are installed under the
deck, with additional six nodes on the two pylons and 15 nodes on the stay cables. Each leaf node
is comprised of an Imote2, a multi-scale sensor board including a tri-axial accelerometer, and a
battery board with three D-cell batteries; the components are all housed in environmentally
hardened plastic enclosures. Two base stations are located at the tops of two pylon bases of the 1st
Jindo Bridge adjacent to the 2nd Jindo Bridge to secure the line-of-sight wireless transmission path
between leaf nodes and gateway nodes of base stations. Each base station is composed of an
Fig. 3 PSD of a vertical acceleration record collected in 2007 using the existing wired monitoring system

Structural health monitoring of a cable-stayed bridge using smart sensor technology: data analyses 465
industrial-purpose PC, a gateway node, and an ADSL modem to connect the PC to the internet. The
gateway node broadcasts commands to the leaf nodes in its sub-network, collects measured data,
and stores it on the PC. For efficient management of the battery power, ordinary leaf nodes are
normally in a deep-sleep state, periodically waking to listen for network alerts. Such alerts are
provided by the Sentry nodes, which are programmed to wake up and measure the data at
predefined times; when the measured wind velocity and acceleration responses exceed prescribed
threshold levels the network is alerted and network-wide data collection is initiated. The wind speed
threshold is set at 3 m/s, whereas the acceleration threshold is set at 10 mg during normal operation.
For each network-wide measurement instance, 500 seconds of data is taken using a 10-Hz sampling rate
(i.e., 5000 samples); anti-aliasing filters are employed with a 4-Hz cutoff frequency (Rice et al. 2010).
3.2 Measured acceleration data
The coordinate system of the global structure and cables is priorly determined in Fig. 6 to help
readers for direction of the measured data. Fig. 7 shows examples of the ambient acceleration data
Fig. 4 1st (right) and 2nd (left) Jindo Bridges (Jang et al. 2010)
Fig. 5 Sensor locations (Jang et al. 2010)

466 Soojin Cho et al.
measured on the deck and the pylons in the three global coordinate directions. The amplitudes of
the acceleration due to automobile traffic on the bridge are found to be large enough for mode
extraction, especially for the vertical modes (Z-axis). Fig. 8 shows examples of the ambient acceleration
data measured on 2 cables. Similar to the deck vibration, the cable vibration in Zc-axis (usually
Fig. 6 Coordinate system for global structure and cables
Fig. 7 Examples of measured acceleration data on the deck and a pylon (Jindo-side, on 9/11/2009)

Structural health monitoring of a cable-stayed bridge using smart sensor technology: data analyses 467
referred as “vertical” or “in-plane” vibration in many literatures) is much larger than the other vibration
components in Xc- and Yc-axis. The cable-vibration amplitudes are also found to be sufficiently large
for mode extraction, which will be used for estimation of the cable tension forces as described in a
subsequent section.
4. Output-only modal identification
Modal properties such as natural frequencies, mode shapes and modal damping ratios play key
roles for SHM of bridges. For example, they are used for evaluating the structural integrity (Koo et
al. 2008), assessing aerodynamic stability (Jain et al. 1998), calibrating the baseline finite element model
(Yun 2001), and vibration control of deck and cables (Koshimura et al. 1994, Li et al. 2007). To
analyze the ambient (or operational) acceleration data excited by ambient sources, such as wind and
traffic, output-only modal identification methods are required. The output-only modal identification
methods are based on the assumption that input is broadband Gaussian random process. In this
study, two output-only modal identification methods are employed using the ambient vibration data.
They are the frequency domain decomposition (FDD) and stochastic subspace identification (SSI)
methods. For completeness, a brief outline of the methods is included in this section.
4.1 Theory of output-only modal identification methods
4.1.1 Frequency domain decomposition method
The FDD method (Brinker et al. 2001) starts by constructing and decomposing the PSD matrix
for the measured data via the singular value decomposition (SVD)
(1)
where y is the measurement vector; is the PSD matrix; Σ is the diagonal matrix containing the
singular values (σi(ω)) in descending order; and U and V are unitary matrices containing the left and
right singular vectors. Due to the symmetry of , U is equal to V. The magnitudes of the singular
Syy
ω( ) U ω( )Σ ω( )VTω( )=
Syy ω( )
Syy ω( )
Fig. 8 Examples of measured acceleration data on cables (Jindo-side, on 9/11/2009)
468 Soojin Cho et al.
values indicate the relative level of vibration at the corresponding frequencies. The peaks in the plot of
the 1st singular value versus frequency can be interpreted as natural frequencies of the structure, while
the corresponding 1st singular vectors at these frequencies can be interpreted as the associated mode
shapes. Thus, the natural frequencies can be estimated by the conventional peak picking method using
the 1st singular value function.
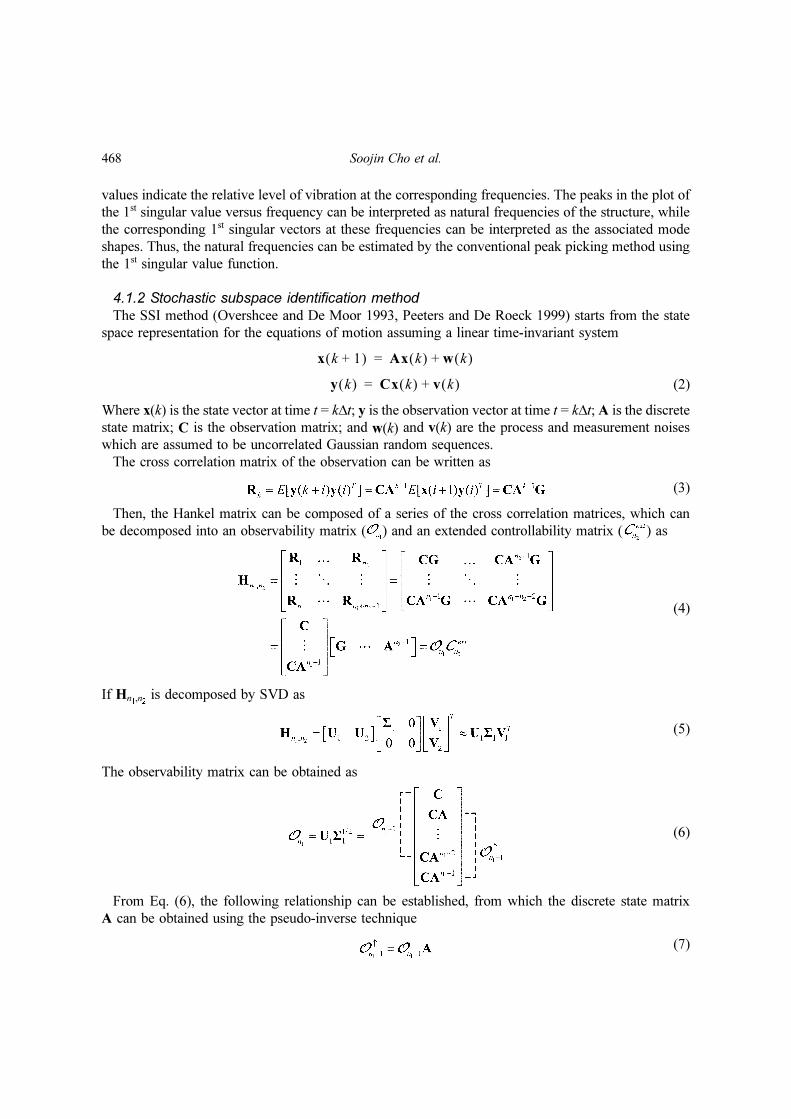
4.1.2 Stochastic subspace identification method
The SSI method (Overshcee and De Moor 1993, Peeters and De Roeck 1999) starts from the state
space representation for the equations of motion assuming a linear time-invariant system
(2)
Where x(k) is the state vector at time t = k∆t; y is the observation vector at time t = k∆t; A is the discrete
state matrix; C is the observation matrix; and w(k) and v(k) are the process and measurement noises
which are assumed to be uncorrelated Gaussian random sequences.
The cross correlation matrix of the observation can be written as
(3)
Then, the Hankel matrix can be composed of a series of the cross correlation matrices, which can
be decomposed into an observability matrix ( ) and an extended controllability matrix ( ) as
(4)
If Hn1,n2 is decomposed by SVD as
(5)
The observability matrix can be obtained as
(6)
From Eq. (6), the following relationship can be established, from which the discrete state matrix
A can be obtained using the pseudo-inverse technique
(7)
x k 1+( ) Ax k( ) w k( )+=
y k( ) Cx k( ) v k( )+=

Structural health monitoring of a cable-stayed bridge using smart sensor technology: data analyses 469
From the discrete state matrix A the eigenvalue (λi) and eigenvector (ψi) can be obtained, from
which the natural frequencies (ωi) and mode shapes (φi) can be obtained from the following
relationships
(8)
where is the ith eigenvalue of continuous system; ∆t is the sampling time; ξi is the modal
damping ratio; and asterisk (*) denotes complex conjugate.
SSI requires the system order n to be determined a priori. In this study, a stabilization chart is
used to find a suitable system order with the criterions provided by Yi and Yun (2004). The stabilization
chart shows the stable modes as a function of increasing system order p. To construct the stabilization
chart, noise modes are identified and discarded for each system order p. To the end, the natural
frequencies, modal damping ratios, and modal assurance criterion (MAC) values of the modes for
the system of order p with those from the system of order p-1 (adjacent system orders) is estimated.
First, mode for which the modal damping ratio is determined to be larger than 0.5 is classified as a
noise mode and discarded. Among the non-noise modes, stable modes are classified when the
normalized differences of natural frequencies, and modal damping ratios with the system at the
system order p-1 are less than 0.01 and 0.2, respectively, and when MAC value is larger than 0.95.
4.2 Results of modal analysis
4.2.1 Identified modal properties from individual WSSN
Modal analyses are carried out on the two sets of data obtained from Haenam- and Jindo-side
WSSNs using the two previously described output-only modal identification methods. Because the
WSSNs are not synchronized to each other during the measurement, the data from each WSSN are
analyzed independently, and then combined subsequently. To obtain the PSD matrix for the FDD
method, each 5000 point acceleration data record is processed using a 1024 point FFT, employing
50% overlap and a Hanning window using the Matlab CPSD command.
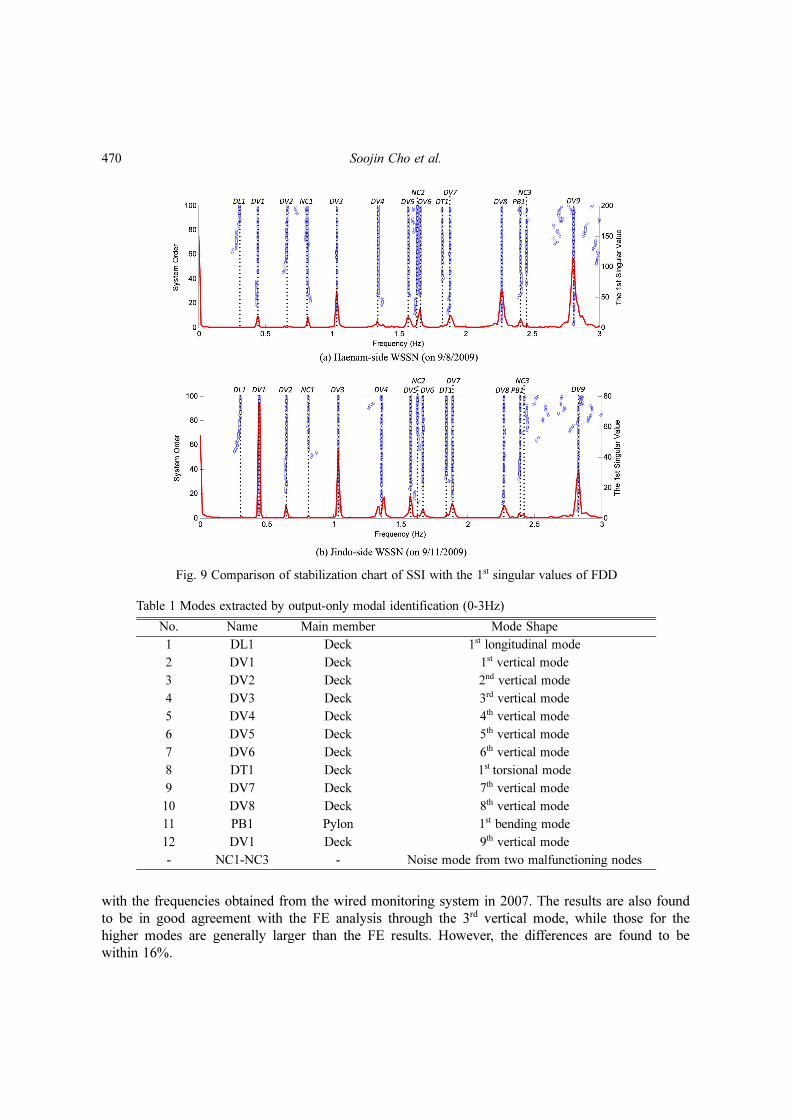
Fig. 9 shows the stabilization charts for SSI plotted along with the 1st singular values of FDD.
Using SSI, 12 stable modes and 3 noise modes (NC1-3) are identified at a high system order (n>60)
in the frequency range of 0-3 Hz. The resonant frequencies are found to have good agreements with
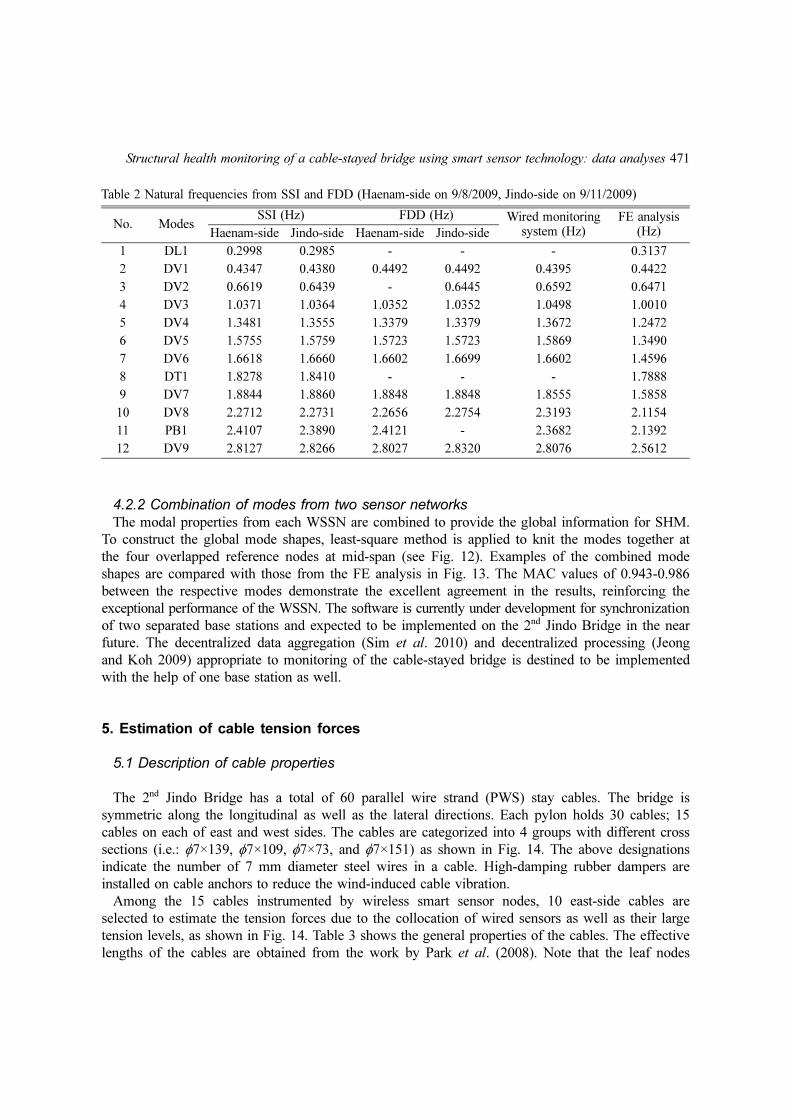
the peak frequencies from FDD. Table 1 gives descriptions of the identified modes; Tables 2 and 3
and Figs. 10 and 11 show the natural frequencies and mode shapes determined by SSI and FDD,
respectively, from the two WSSNs. The results from different modal identification methods are
found to be consistent to each other. Note that the noise modes can be attributed to two malfunctioning
leaf nodes (D-HE12 and D-JE7 - see Fig. 5) with unexpected noises at 0.82 Hz, 1.64 Hz and 2.46 Hz.
Several modes (DL1, DV2, DT1 and PB1 - see Table 1) are found undetected by FDD. In Figs.
10 and 11, some mode shapes extracted by FDD show un-smooth shapes at a few sensor locations,
while those by SSI are generally smooth. If longer acceleration records were collected, the modal
properties of both FDD and SSI would be in better agreement. However, the SSI method can reduce
significantly the amount of data, and thus transmission time, processed in a large-scale WSSN. The
present results show that SSI with a system order greater than 60 yields reasonable results.
In Table 2, the identified natural frequencies are compared with those obtained from both the
wired monitoring system and the FE analysis. The identified natural frequencies show excellent agreements
λCi
ln λi( )∆t
--------------=
470 Soojin Cho et al.
with the frequencies obtained from the wired monitoring system in 2007. The results are also found
to be in good agreement with the FE analysis through the 3rd vertical mode, while those for the
higher modes are generally larger than the FE results. However, the differences are found to be
within 16%.
Table 1 Modes extracted by output-only modal identification (0-3Hz)
No. Name Main member Mode Shape
1 DL1 Deck 1st longitudinal mode
2 DV1 Deck 1st vertical mode
3 DV2 Deck 2nd vertical mode
4 DV3 Deck 3rd vertical mode
5 DV4 Deck 4th vertical mode
6 DV5 Deck 5th vertical mode
7 DV6 Deck 6th vertical mode
8 DT1 Deck 1st torsional mode
9 DV7 Deck 7th vertical mode
10 DV8 Deck 8th vertical mode
11 PB1 Pylon 1st bending mode
12 DV1 Deck 9th vertical mode
- NC1-NC3 - Noise mode from two malfunctioning nodes
Fig. 9 Comparison of stabilization chart of SSI with the 1st singular values of FDD
Structural health monitoring of a cable-stayed bridge using smart sensor technology: data analyses 471
4.2.2 Combination of modes from two sensor networks
The modal properties from each WSSN are combined to provide the global information for SHM.
To construct the global mode shapes, least-square method is applied to knit the modes together at
the four overlapped reference nodes at mid-span (see Fig. 12). Examples of the combined mode
shapes are compared with those from the FE analysis in Fig. 13. The MAC values of 0.943-0.986
between the respective modes demonstrate the excellent agreement in the results, reinforcing the
exceptional performance of the WSSN. The software is currently under development for synchronization
of two separated base stations and expected to be implemented on the 2nd Jindo Bridge in the near
future. The decentralized data aggregation (Sim et al. 2010) and decentralized processing (Jeong
and Koh 2009) appropriate to monitoring of the cable-stayed bridge is destined to be implemented
with the help of one base station as well.
5. Estimation of cable tension forces
5.1 Description of cable properties
The 2nd Jindo Bridge has a total of 60 parallel wire strand (PWS) stay cables. The bridge is
symmetric along the longitudinal as well as the lateral directions. Each pylon holds 30 cables; 15
cables on each of east and west sides. The cables are categorized into 4 groups with different cross
sections (i.e.: φ7×139, φ7×10⁹, φ7×73, and φ7×151) as shown in Fig. 14. The above designations
indicate the number of 7 mm diameter steel wires in a cable. High-damping rubber dampers are
installed on cable anchors to reduce the wind-induced cable vibration.
Among the 15 cables instrumented by wireless smart sensor nodes, 10 east-side cables are
selected to estimate the tension forces due to the collocation of wired sensors as well as their large
tension levels, as shown in Fig. 14. Table 3 shows the general properties of the cables. The effective
lengths of the cables are obtained from the work by Park et al. (2008). Note that the leaf nodes
Table 2 Natural frequencies from SSI and FDD (Haenam-side on 9/8/2009, Jindo-side on 9/11/2009)
No. Modes SSI (Hz) FDD (Hz) Wired monitoring
system (Hz)FE analysis
(Hz)Haenam-side Jindo-side Haenam-side Jindo-side
1 DL1 0.2998 0.2985 - - - 0.3137
2 DV1 0.4347 0.4380 0.4492 0.4492 0.4395 0.4422
3 DV2 0.6619 0.6439 - 0.6445 0.6592 0.6471
4 DV3 1.0371 1.0364 1.0352 1.0352 1.0498 1.0010
5 DV4 1.3481 1.3555 1.3379 1.3379 1.3672 1.2472
6 DV5 1.5755 1.5759 1.5723 1.5723 1.5869 1.3490
7 DV6 1.6618 1.6660 1.6602 1.6699 1.6602 1.4596
8 DT1 1.8278 1.8410 - - - 1.7888
9 DV7 1.8844 1.8860 1.8848 1.8848 1.8555 1.5858
10 DV8 2.2712 2.2731 2.2656 2.2754 2.3193 2.1154
11 PB1 2.4107 2.3890 2.4121 - 2.3682 2.1392
12 DV9 2.8127 2.8266 2.8027 2.8320 2.8076 2.5612

472 Soojin Cho et al.
Fig. 10 Mode shapes from SSI (solid line) and FDD (dashed line): Haenam-side, on 9/8/2009

Structural health monitoring of a cable-stayed bridge using smart sensor technology: data analyses 473
Fig. 11 Mode shapes from SSI (solid line) and FDD (dashed line): Jindo-side, on 9/11/2009

474 Soojin Cho et al.
monitoring the cables are mounted approximately 3 m above the deck to facilitate access to the
nodes; for this location, the rubber dampers do not affect significantly the response of the cable.
5.2 Vibration method for cable tension estimation
Given the importance of cables for the global integrity of a cable-stayed bridge, continuous monitoring
of cable tension forces is prudent to assess cable degradation and anchorage slippage (Cho et al.
2010). In this study, the cable tensions are estimated using the identified natural frequencies. For
this purpose, the tension force and the natural frequencies can be related as (Park et al. 2008)
(9)
where T is cable tension force; n is the order of the dominant modes; fn is the frequency of n-th
dominant modes; m is unit mass of the cable; and Leff is the effective length of the cable. A regression
can be performed between ( fn/n)2 and n2 to obtain the intercept a and slope b in Eq. (9); subsequently, T
can be determined as
(10)
Fig. 8 shows two examples of the measured acceleration data from on tri-axial accelerometers on
the cables of Jindo side. Fig. 15 shows the Fourier amplitude spectra (FAS) for the cable motions
along with the FAS for deck motions. Fig. 15 indicates that of the many peaks apparent in the FAS
fn
n---⎝ ⎠⎛ ⎞
2 T
4mLeff
2----------------
EIπ2n2
4mLeff
4-----------------+ a bn
2+= =
T 4mLeff
2a=
Fig. 12 Overlapped reference nodes installed on the Jindo Bridge

Structural health monitoring of a cable-stayed bridge using smart sensor technology: data analyses 475
for the vertical cable vibration, some can be associated with the deck motion owing to deck-cable
interaction, particularly in the vertical direction.
Fig. 13 Mode shapes identified from the data (left) and from the FE analysis (right)
Fig. 14 Arrangement of stay cables and wireless sensors on cables (sensor numbers in parentheses)

476 Soojin Cho et al.
However, the FAS for the lateral cable vibration do not contain so many peaks related to the deck
motion. Because of the circular cross-section, slenderness and small sag of the stay cable, the modal
properties of the cable are very similar in the vertical and lateral directions. Hence, in this study, the
natural frequencies of the cables are extracted from vertical vibration with complementary use of
Fig. 15 Fourier spectra of acceleration data on the deck and cables (Jindo-side, on 9/11/2009)
Table 3 Properties of the cables monitored
Cables HC4, JC4 HC6, JC6 HC9, JC9 HC13, JC13 HC15, JC13
Cable type φ7×151 φ7×151 φ7×73 φ7×10⁹ φ7×139
Elasticity (tonf/mm2) 20.0 20.0 20.0 20.0 20.0
Area (mm2) 5811.0 5811.0 2809.0 4195.0 5349.0
Length (m) 97.10 65.00 83.17 141.76 174.15
Effective length (m) 95.38 63.33 79.01 136.87 169.69
Unit mass (ton/m) 0.00486 0.00486 0.00236 0.00354 0.00448
Design cable sag (mm) 256.0 96.0 221.0 537.0 809.0
Design tension force (tonf) 237.0 271.0 90.0 160.0 202.0
Allowable tension force (tonf) 470.0 470.0 227.0 339.0 433.0

Structural health monitoring of a cable-stayed bridge using smart sensor technology: data analyses 477
the lateral vibration components. The first five identified frequencies for two cables are: 0.645,
1.294, 1.948, 2.598, and 3.247 Hz for Cable JC15 with Node C-JE8, and 0.772, 1.514, 2.275, 3.027
and 3.789 Hz for Cable JC13 with Node C-JE7. The natural frequencies are found to be almost
proportional to the order of modes (n), which is a dynamic characteristic of a slender cable with
little bending and sag effect (Irvine 1981, Cho et al. 2010).
5.3 Interaction between deck and cables
Fig. 15 shows that the 1st frequency of Cable JC15 with Node C-JE8 is very close to the
frequency of the 2nd vertical mode of the deck, while the 3rd frequency of Cable JC13 with Node C-
JE7 is very close to the frequency of the 8th vertical mode of the deck. If the frequency of
oscillation of the deck and/or tower falls in the neighborhood of the frequencies of the lower modes
of a stay cable, the stay cable may be subjected to large vibration (Pinto da Costa et al. 1996). Such
interaction between deck/pylon and cable vibration in the lower frequency range has been reported
by Caetano et al. (2008) on the International Guadiana cable-stayed bridge in Portugal and by Weng
et al. (2008) on the Gi-Lu cable-stayed bridge in Taiwan. This phenomenon, called as parametric
excitation, is generally difficult to avoid in long-span bridges with many cables. However, if the
cable vibration levels are found to be significant, cable dampers may be introduced to mitigate the
response.
5.4 Estimated cable tension forces
Based on the identified dominant frequencies, the tension forces for the 10 cables are estimated as
shown in Fig. 16. The estimated tension forces for the cables show consistency with respect to the
monitoring periods. In Table 4, the averages of the estimated tension forces are compared with
those obtained from two previous regular inspections in 2007 and 2008, as well as those from the
Fig. 16 Estimated tension forces for 10 cables

478 Soojin Cho et al.
initial design, and those from the maintenance thresholds which are 60% of allowable tension forces
of the cables (ATMACS 2008). The current estimations are found to be very close to the tension
forces from two previous inspections with less than 4% difference. The tension forces of 8 cables
have increased slightly with time, while those of 2 cables (HC6 and JC6) supporting the side spans
have slightly decreased. The estimated cable tension forces are generally larger than the initial
design values (10% at maximum) except JC13. All cable tension values are well within the
maintenance thresholds, indicating that the cables are in safe operation.
6. Conclusions
This paper analysed the data collected from the 2nd Jindo Bridge, a cable-stayed bridge in Korea
that is a structural health monitoring (SHM) international test bed for advanced wireless smart
sensor network (WSSN) technology. A FE model of the bridge has been constructed based on its
detailed drawings. Modal properties of the bridge were evaluated using two different output-only
identification methods: FDD and SSI. Tension forces for 10 selected cables were also derived from
the ambient acceleration data using a vibration method. The results of data analyses are summarized
as follows:
1) Modal properties of the bridge were successfully determined from the ambient acceleration
measurements obtained from the WSSNs using both FDD and SSI. The natural frequencies
identified using the WSSNs were found to be in excellent agreement with those previously obtained
using the existing wired sensors. The extracted mode shapes show excellent agreements with those
from the FE analysis. SSI with high system order (larger than 60) is found to be very appropriate
for extracting the modes without extensive amounts of data.
2) The frequencies of the higher modes of the FE model are found to differ from the identified
values by less than 16%, which indicates the need for updating of the FE model.
3) The interaction between the deck and cables must be considered carefully to obtain accurate
estimates of the natural frequencies of the cables, which are used for tension force estimation. To
Table 4 Comparison of estimated tension forces with those from previous regular inspections in 2007 and 2008
Cables (East-side)
Estimated tension forces (tonf)Initial design values (tonf)
Maintenance thresholds (tonf)Present WSSNs
in 2009 (averaged)
Previous inspections
in 2007 in 2008
Haenam-side
HC4 274.0 (2.04)* 262.7 268.4 246.2 329
HC6 294.7 (-3.19)* 304.6 304.1 271.8 329
HC9 89.3 (0.90)* 86.9 88.5 87.6 158
HC13 170.2 (3.00)* 164.0 165.1 163.6 237
HC15 224.9 (2.18)* 219.9 220.0 204.8 303
Jindo-side
JC4 254.0 (1.30)* 245.1 250.7 245.9 329
JC6 274.5 (-1.09)* 282.0 277.5 271.5 329
JC9 88.5 (2.15)* 85.5 86.6 88.2 158
JC13 154.3 (2.33)* 148.3 150.7 164.1 237
JC15 216.8 (0.14)* 214.1 216.5 201.3 303*The differences from regular inspection in 2008 are shown in the parentheses.

Structural health monitoring of a cable-stayed bridge using smart sensor technology: data analyses 479
this end, complementary use of the lateral vibration data of the cables was shown to be beneficial,
because they are less sensitive to the deck motion.
4) The estimated tension forces for the 10 cables were very close to those from 2 previous regular
inspections (i.e., less than 4% difference).
Finally, a substructural damage identification method for a cable-stayed bridge is now under
development, with full utilization of the decentralized computing capabilities of the wireless smart
sensor nodes. In this approach, substructural modal information for the deck/pylon and cable tension
forces is combined to provide a comprehensive assessment of the structural integrity of the bridge.
Acknowledgements
This work was supported by the Korea Research Foundation Grant funded by the Korean
Government (MEST) (NRF-2008-220-D00117), the National Science Foundation Grant CMS 06-
00433 (Dr. S.C. Liu, Program Manager), and Smart Infrastructure Technology Center (SISTeC) at
KAIST. Their financial supports are greatly appreciated. Additionally, cooperation of the Ministry of
Land, Transport and Maritime Affairs in Korea, Daewoo Engineering Co. Ltd. and Hyundai Construction
Co. Ltd. are gratefully acknowledged.
References
ATMACS (2008), Consulting for the measurement systems for integrated entrusted management of long-spanbridges (The 1st and 2nd Jindo Bridges) (in Korean), Sungnam, Gyunggi-do, Korea.
Brincker, R. Zhang, L. and Andersen, P. (2001), “Modal identification of output-only systems using frequencydomain decomposition” Smart Mater. Struct., 10, 441-445.
Caetano, E., Cunha, A., Gattulli, V. and Lepidi, M. (2008), “Cable-deck dynamic interactions at the InternationalGuadiana Bridge: On-site measurements and finite element modeling”, Struct. Control Health Monit., 15(3),237-264.
Cho, S., Lynch, J.P., Lee, J.J. and Yun, C.B. (2010), “Development of an automated wireless tension forceestimation system for cable-stayed bridge”, J. Intel. Mat. Syst. Str., 21(3), 361-376.
Ernst, J.H. (1965), “Der E-modul von seilen unter berucksienhtigung des durchanges (in German), DerBauingenieur, 40(2), 52-55.
Fujino, Y., Siringoringo, D.M. and Abe M. (2009), “The needs for advanced sensor technologies in riskassessment of civil infrastructures”, Smart Struct. Syst., 5(2), 173-191.
Irvine, M. (1981), Cable structures, Dover Publications, Inc., New York, USA.Jain, A., Jones, N.P. and Scanlan, R.H. (1998), “Effect of modal damping on bridge aeroelasticity”, J. Wind Eng.
Ind. Aerod., 77(8), 421-430.Jang, S., Jo, H., Cho, S., Mechitov, K., Rice, J.A., Sim, S.H., Jung, H.J., Yun, C.B., Spencer, Jr., B.F. and Agha, G.
(2010), “Structural health monitoring of a cable stayed bridge using smart sensor technology: deployment andevaluation”, Smart Struct. Syst., 6(5-6), 439-459.
Jeong, M.J. and Koh, B.H. (2009), “A decentralized approach to damage localization through smart wirelesssensors,” Smart Struct. Syst., 5(1), 43-54.
Koo, K.Y., Lee, J.J., Yun, C.B. and Kim, J.T. (2008), “Damage detection in beam-like structures usingdeflections obtained by modal flexibility matrices”, Smart Struct. Syst., 4(5), 605-628.
Koshimura, K., Tatsumi, M. and Hata, K. (1994), “Vibration control of the main towers of the Akashi KaikyoBridge”, Proceedings of the 1st World Conference on Structural Control, Los Angeles, California, USA.
Li, H., Liu, M., Li, J.H., Guan, X.C. and Ou, J.P. (2007), “Vibration control of stay cables of the Shandong Binzhouyellow drive highway bridge using magnetorehaological fluid dampers”, J. Bridge Eng., 12(4), 401-409.
480 Soojin Cho et al.
MidasIT (2009), http://www.midasit.com.Overschee, P.V. and De Moor, B. (1993), “Subspace algorithms for the stochastic identification problem”, Automatics,29(3), 649-660.
Pakzad, S.N., Fenves, G.L., Kim. S. and Culler, D.E. (2008), “Design and implementation of scalable wirelesssensor network for structural monitoring”, J. Infrastruct. Syst., 14(1), 89-101.
Park, Y.S., Choi, S.M., Yang, W.Y., Hong, H.J. and Kim, W.H. (2008), “A study on tension for cables of a cable-stayed bridge damper is attached (in Korean)”, J. Korean Soc. Steel Constr., 20(5), 609-616.
Peeters, B. and De Roeck, G. (1999), “Reference-based stochastic subspace identification for output-only modalanalysis”, Mech. Syst. Signal Pr., 13(6), 855-878.
Pinto da Costa, A., Martins, J.A.C., Branco, F. and Lilien, J.L. (1996), “Oscillations of bridge stay cablesinduced by periodic motions of deck and/or towers”, J. Eng. Mech.-ASCE, 122(7), 613-622.
Rice, J.A., Mechitov, K., Sim, S.H., Nagayama, T., Jang, S., Kim, R., Spencer, Jr., B.F., Agha, G. and Fujino, Y.(2010), “Flexible smart sensor framework for autonomous structural health monitoring”, Smart Struct. Syst.,6(5-6), 423-438.
Sim, S.H., Carbonell-Marquez, J.F. and Spencer, Jr., B.F. (2010), “Efficient decentralized data aggregation inwireless smart sensor networks,” Proceedings of the SPIE conference on Sensors and Smart Structures Technologiesfor Civil, Mechanical and Aerospace Systems, San Diego, CA, USA.
Weng, J.H., Loh, C.H., Lynch, J.P., Lu, K.C., Lin, P.Y. and Wang, Y. (2008), “Output-only modal identificationof a cable-stayed bridge using wireless monitoring systems”, Eng. Struct., 30(7), 1820-1830.
Yi, J.H. and Yun, C.B. (2004), “Comparative study on modal identification methods using output-onlyinformation”, Struct. Eng. Mech., 17(3-4), 445-466.
Yun, J. (2001), Finite element model updating for cable-stayed bridge using ambient vibration (in Korean),Ph.D. Thesis, Seoul National University, Seoul, Korea.
Related Documents