Journal of Writing Analytics Vol. 2 | 2018 DOI: 10.37514/JWA-J.2018.2.1.06 138 Research Article Structural Features of Undergraduate Writing: A Computational Approach Noah Arthurs, Stanford University Structured Abstract • Background: Over a decade ago, the Stanford Study of Writing (SSW) collected more than 15,000 writing samples from undergraduate students, but to this point the corpus has not been analyzed using computational methods. Through the use of natural language processing (NLP) techniques, this study attempts to reveal underlying structures in the SSW, while at the same time developing a set of interpretable features for computationally understanding student writing. These features fall into three categories: topic-based features that reveal what students are writing about; stance-based features that reveal how students are framing their arguments; and structure-based features that reveal sentence complexity. Using these features, we are able to characterize the development of the SSW participants across four years of undergraduate study, specifically gaining insight into the different trajectories of humanities, social science, and STEM students. While the results are specific to Stanford University’s undergraduate program, they demonstrate that these three categories of features can give insight into how groups of students develop as writers. • Literature Review: The Stanford Study of Writing (Lunsford et al., 2008; SSW, 2018) involved the collection of more than 15,000 writing samples from 189 students in the Stanford class of 2005. The literature surrounding the original study is largely qualitative (Fishman, Lunsford, McGregor, & Otuteye, 2005; Lunsford, 2013; Lunsford, Fishman, & Liew, 2013), so this study makes a first attempt at a quantitative analysis of the SSW. When

Welcome message from author
This document is posted to help you gain knowledge. Please leave a comment to let me know what you think about it! Share it to your friends and learn new things together.
Transcript
Journal of Writing Analytics Vol. 2 | 2018
DOI: 10.37514/JWA-J.2018.2.1.06 138
Research Article
Structural Features of Undergraduate
Writing: A Computational Approach
Noah Arthurs, Stanford University
Structured Abstract
• Background: Over a decade ago, the Stanford Study of Writing (SSW)
collected more than 15,000 writing samples from undergraduate students, but
to this point the corpus has not been analyzed using computational methods.
Through the use of natural language processing (NLP) techniques, this study
attempts to reveal underlying structures in the SSW, while at the same time
developing a set of interpretable features for computationally understanding
student writing. These features fall into three categories: topic-based features
that reveal what students are writing about; stance-based features that reveal
how students are framing their arguments; and structure-based features that
reveal sentence complexity. Using these features, we are able to characterize
the development of the SSW participants across four years of undergraduate
study, specifically gaining insight into the different trajectories of humanities,
social science, and STEM students. While the results are specific to Stanford
University’s undergraduate program, they demonstrate that these three
categories of features can give insight into how groups of students develop as
writers.
• Literature Review: The Stanford Study of Writing (Lunsford et al., 2008;
SSW, 2018) involved the collection of more than 15,000 writing samples from
189 students in the Stanford class of 2005. The literature surrounding the
original study is largely qualitative (Fishman, Lunsford, McGregor, &
Otuteye, 2005; Lunsford, 2013; Lunsford, Fishman, & Liew, 2013), so this
study makes a first attempt at a quantitative analysis of the SSW. When
Structural Features of Undergraduate Writing
Journal of Writing Analytics Vol. 2 | 2018 139
considering the ethics of a computational approach, we find it important not to
stray into the territory of writing evaluation, as purely evaluative systems have
been shown to have limited instructional use in the classroom (Chen & Cheng,
2008; Weaver, 2006). Therefore, we find it important to take a descriptive,
rather than evaluative approach. All of the features that we extract are both
interpretable and grounded in prior research. Topic modeling has been used on
undergraduate writing to improve the prediction of neuroticism and
depression in college students (Resnik, Garron, & Resnik, 2013), stance
markers have been used to show the development of undergraduate writers
(Aull & Lancaster, 2014), and parse trees have been used to measure the
syntactic complexity of student writing (Lu, 2010).
• Research Questions: What computational features are useful for analyzing
the development of student writers? Based on these features, what insights can
we gain into undergraduate writing at Stanford and similar institutions?
• Methodology: To extract topic features, we use LDA topic modeling (Blei,
Ng, & Jordan, 2003) with Gibbs Sampling (Griffiths, 2002). To extract stance
features, we replicate the stance markers approach from a past study (Aull &
Lancaster, 2014). To describe sentence structure, we use parse trees generated
using Shift-Reduce dependency parsing (Sagae & Tsujii, 2008). For each
parse tree, we use the tree depth and the average dependency length as
heuristics for the syntactic complexity of the sentence.
• Results: Topic modeling was useful for sorting papers into academic
disciplines, as well as for distinguishing between argumentative and personal
writing. Stance markers helped us characterize the intersection between the
majors that students hold and the topics that they are writing about at a given
time. Parse tree complexity demonstrated differences between writing in
different disciplines. In addition, we found that students of different
disciplines have different syntactic features even during their first year at
Stanford.
• Discussion: Topic modeling has given us a picture of interdisciplinary study
at Stanford by showing how often students in the SSW wrote about topics
outside their majors. Furthermore, studying interdisciplinary Stanford students
allowed us to examine the intersection of a student’s major and current topic
of writing when analyzing the other two sets of features. Stance markers in the
SSW show that both field of study and topic of writing influence the ways in
which students employ metadiscourse. In addition, when looking at stance
across years, we see that Seniors regress towards their First-Year habits. The
complexity results raise the question of whether different disciplines have
different “ideal” levels of writing complexity.

Arthurs
Journal of Writing Analytics Vol. 2 | 2018 140
• Conclusions: The present study yields insight into undergraduate writing at
Stanford in particular. Notably, we find that students develop most as writers
during their first two years and that students of different majors develop as
writers in different ways. We consider our three categories of features to be
useful because they were able to give us these insights into the dataset. We
hope that, moving forward, educators will be able to use this kind of analysis
to understand how their students are developing as writers.
Keywords: computational features, corpus linguistics, feature extraction, machine learning, NLP,
parse stance, student writing, trees, topic modeling, undergraduate writing, writing analytics
1.0 Background
At the present writing, computational analysis of writing tends to revolve around either
automated evaluation of writing or feedback on knowledge of conventions such as grammar and
spelling. While both of these applications can be useful in certain contexts, neither is able to help
students improve their ability to come up with and express complex ideas. In order to improve
writing education, it is important to take descriptive rather than evaluative approaches to
analyzing student writing and also to dive deeper than surface-level features. The Stanford Study
of Writing (SSW), a dataset of over 15,000 writing samples from Stanford University’s class of
2005, gives us a unique opportunity to computationally track the development of undergraduate
writing. The goal of this study is to find interpretable computational features that can help us
characterize the development of student writers.
The SSW contains many labels for the data, but the two that this study will focus on are year
(First-Year, Sophomore, Junior, Senior) and category of major (Humanities, Social Sciences,
STEM), with the goal of discovering how students of different academic disciplines develop as
writers during their undergraduate careers. In order to characterize this development, we will
focus on three kinds of features:
1. Topic (What are students writing about?) – We use topic modeling to distinguish between
writing of different disciplines and styles.
2. Stance (How are students framing their arguments?) – We count occurrences of stance
markers in order to determine when students are hedging (reducing commitment to a
claim) and when they are boosting (increasing commitment to a claim).
3. Structure (How do students organize their thoughts?) – We use the structure of each
sentence’s parse tree to determine the syntactic complexity of a given writing sample.
Across these three analyses, we find that the features of a given writing sample are influenced by
the student’s year and major, as well as the topic that the student is writing about. We find that
stance features depend on whether or not a student is writing in their own discipline, while
structural features depend mainly on the topic of the writing. In addition, when we look at the
Structural Features of Undergraduate Writing
Journal of Writing Analytics Vol. 2 | 2018 141
overall trends of the participants in the SSW, we find that students change the most as writers
between First-Year and Sophomore Year, which corresponds to their participation in Stanford’s
mandatory introductory writing courses.
The results of this study are specific to the development of Stanford students (specifically to
the Stanford students of the class of 2005), but along the way we try to answer the more widely
applicable question of how computational features can enhance our understanding of student
writing.
2.0 Literature Review
2.1 The Stanford Study of Writing
The Stanford Study of Writing (Lunsford et al., 2008; SSW, 2018) was conducted between 2001
and 2006, and it involved the collection of more than 15,000 writing samples from 189 students
in the Stanford class of 2005. The writing samples were not limited to academic writing, but
included emails, text messages, and many other kinds of writing that the participants performed
in their everyday lives. The students filled out surveys every year, providing information about
how much writing they were doing, what kind of writing they were doing, and how they felt
about their writing. Thirty-six of the students agreed to be interviewed every year as well.
The literature surrounding the original study is largely qualitative, much of it focusing on the
personal narratives of the students who were interviewed. Using these narratives, Lunsford and
the other creators of the study published about writing as performing (Fishman, Lunsford,
McGregor, & Otuteye, 2005), writing as intellectual property (Lunsford, Fishman, & Liew,
2013), and how technology is changing the scope of the writing that students engage in
(Lunsford, 2013).
Despite the importance of the SSW in the field of education, the large number of writing
samples collected, and the careful labelling of the data, no quantitative study of the dataset has
been published. This study seeks to remedy the situation by using low-level textual features to
track the development of the SSW participants’ writing.
2.2 The Ethics of a Computational Approach
In the past, computational approaches to writing have largely fallen into the categories of
polishing and evaluation. Polishing systems (e.g., spellcheck and grammar check) can be useful
tools, especially for experienced writers (Hult, 1986), but they are unlikely to help students
develop their ideas or learn how to express their ideas more clearly. Since this study seeks to
dive deeper into writing than surface-level mechanics, polishing systems warrant only a mention
and no larger discussion. Evaluation of student writing, often referred to as Automated Essay
Scoring (AES), is lucrative for standardized testing companies, but its benefits to students are
limited for a number of reasons:
1. AES problems, including the only publicly available dataset (The Hewlett Foundation,
2018), tend to involve mapping essays to scores/grades directly. This challenge
Arthurs
Journal of Writing Analytics Vol. 2 | 2018 142
encourages end-to-end solutions (Taghipour & Ng, 2016), which in general behave as
black boxes that offer little insight into the writing process.
2. When AES systems do have interpretable features, they tend to be features such as
spelling and grammar. This trend is not surprising, as these purely mechanical features
have been found to be very predictive by themselves (Kumar, Fraser, & Boulanger,
2017). While spelling and grammar skills are important for a writer to have and (as AES
systems generally pick up on) are correlated with effective writing, it is safe to say that
the task of improving as a writer is quite a bit deeper.
3. Finally, AES systems are typically trained on student responses to standardized test
essays. This happens for two reasons: standardized tests are the easiest way to gather
well-structured student writing data, and generally it is large-scale testing organizations
that stand to benefit from solutions to the problem. This situation means that even if AES
systems are able to give helpful feedback, that feedback will be geared towards helping
students succeed at the writing portion of a particular standardized test. When discussing
the use of AES in the classroom, Chen and Cheng note that these systems tend to have
“static and formulaic models of ‘good writing’,” which results in them being helpful for
improving students’ test scores, but not so helpful “if the goal is to communicate the
writer’s thoughts effectively to real audiences and demonstrate the writer’s creativity and
originality” (Chen & Cheng, 2008, p. 108).
Beyond these practical difficulties in deploying AES systems in the classroom, prior research
suggests that students have difficulty learning from feedback alone. Weaver (2006) finds that
feedback even from writing tutors is often not very helpful unless tutors work directly with
students to build up mutual understanding of learning goals, assessment criteria, and
terminology. This identification of difficulty suggests that a computational tool does not become
immediately useful by providing feedback to students.
The discussion above serves to point us towards a more academic approach to analyzing
writing. It should not be surprising that both polishing and evaluative systems are limited in their
ability to benefit the progression of student writers, since both come from industry and have little
to do with the task of teaching students how to form ideas and convey them effectively.
However, even in an academic setting, it is important to embrace humility when applying
computational approaches to other fields. The goal of this study is to build off of existing
educational research, but in order to do so, the NLP techniques used must be reevaluated in this
context, even if they are standard practice in the field of computer science. This study does not
construct new features from scratch. The features in this study are all commonplace within NLP,
and many of them have been used to analyze or evaluate writing. However, with the exception of
Aull and Lancaster’s work on stance markers (2014), little has been said about how these
features relate to the development of writers.
In order to identify writing patterns that are actionable in the classroom, this study takes a
descriptive approach to student writing. The goal is to provide data-driven insights into how
Structural Features of Undergraduate Writing
Journal of Writing Analytics Vol. 2 | 2018 143
groups of students develop as writers, insights which can be useful to educators and education
theorists. As a result, this study will avoid making judgments about the ability of the
computational techniques used to predict the quality of a given piece of writing. Instead it will
focus on analyzing to what extent each feature is able to characterize the changes in student
writing over time.
Finally, it is important to emphasize that all machine learning used must be interpretable to
be useful. Complex end-to-end systems (e.g., neural networks) that predict labels for pieces of
data may be useful for classifying pieces of writing into different categories, but they are not
useful for understanding the differences between those categories. Furthermore, machine
learning must be deployed not with the goal of simulating or replacing educators, but with the
goal of supporting the ability of educators to teach writing effectively.
2.3 The Features
2.3.1 Topic. A topic model is an unsupervised algorithm that finds underlying structure in a
dataset of documents by learning a set of topics. Each topic is associated with a set of words, and
each document is produced by a weighting of the topics. Topic modeling is a well-established
area of study within computer science. The first topic modeling algorithm was introduced over
two decades ago (Papadimitriou, Tamaki, Raghavan, & Vempala, 1998), and Latent Dirichlet
Allocation (LDA) was introduced in 2003 (Blei, Ng, & and Jordan, 2003). Modern topic
modeling algorithms are for the most part variations and extensions of LDA. For example, this
study uses LDA with Gibbs Sampling (Griffiths, 2002).
Topic modeling has been successful in many information retrieval settings. It is most
commonly used to sort through (and recommend) massive amounts of online articles (Wang &
Blei, 2011), but it has also been known to extract useful features from writing of all kinds.
Notably, it has been used on undergraduate writing to improve the prediction of neuroticism and
depression in college students (Resnik, Garron, & Resnik, 2013). We use topic modeling as a
way of describing what students are writing about. Of course, the success of topic modeling in
other settings does not guarantee its success in this setting, so it is important that this study
scrutinize the output of the topic model to understand what aspects of the writing the algorithm is
picking up on.
2.3.2 Stance. Stance (also referred to as metadiscourse) generally refers to a writer’s attitude
towards and positioning of the claims that they are making. There are many categorizations of
stance, but we will focus on two:
1. Hedging – reducing commitment to a particular claim (e.g., “it seems that…”)
2. Boosting – increasing commitment to a particular claim (e.g., “it is clear that…”)
These two rhetorical techniques are particularly relevant because they have been studied in past
quantitative and computational research.
Hyland (1998) measured the frequency of different categories of metadiscourse in 28
academic papers across four disciplines. The study found that hedging was the most common
Arthurs
Journal of Writing Analytics Vol. 2 | 2018 144
category in each discipline, with 15.1 examples per 1,000 words, and boosting (which the paper
refers to as emphatics) was one of the least common categories, with 3.9 examples per 1,000
words.
Aull and Lancaster (2014) define boosters and approximative hedges as “those hedges and
boosters through which writers intimate the extent or degree to which a proposition is true, for
example, generally, truly, certainly” (p. 160) and measure the frequency of these two techniques
in first-year and upper-level undergraduate papers. The study was able to measure frequency
across large datasets by programmatically counting the number of occurrences of a fixed set of
stance markers. It was found that first-year students used approximative hedges at a rate of 1.1
per 1,000 words and boosters at a rate of 4.9 per 1,000 words, while upper-level students
included 1.7 hedges and 2.9 boosters per 1,000 words. Aull and Lancaster argue based on these
results that hedging more and boosting less are signs that undergraduates are developing as
writers, suggesting that “advanced academic writing privileges caution, possibility, and delimited
claims over certainty, while incoming FY writers tend to use stance features that achieve the
opposite kind of stance” (2014, p. 164).
This study seeks to build on the results of Aull and Lancaster by examining how the way
students exhibit stance in a paper varies depending on their field of study and current topic of
writing.
2.3.3 Parse trees. Our structure-based features are based on the parse trees, graph-based
representations of sentences that result from a dependency parsing algorithm. Dependency
parsing, a very common tool in Natural Language Processing (NLP), constructs a parse tree by
defining the main verb of the sentence as the root of the tree and assuming that each of the other
words depends on one other word in the sentence (e.g., the subject of the sentence will depend on
the main verb). Each edge in the tree represents one such dependency (see section 4.4 for
examples and visualizations).
Dependency parsing has been a cornerstone of linguistics and NLP for over 50 years (Hays,
1964) because of its ability to simply and convincingly describe sentence structure. Recent
advances in machine learning have resulted in much improved (and quite reliable) parsing
methods including Shift-Reduce parsing (Sagae & Tsujii, 2008), the algorithm underlying the
dependency parsing in this study. Parse trees are used ubiquitously for machine learning tasks
where sentence structure is an important factor. Notably, they have been used as a feature for
measuring syntactic complexity in student writing (Lu, 2010) and to identify argumentative
structure in essays (Stab & Gurevych, 2014). In this study, we will use parse trees to observe
how the sentence structures of groups of students change over the course of their undergraduate
writing careers.
3.0 Research Questions
This study attempts to answer two questions:
1. What computational features are useful for analyzing the development of student writers?

Structural Features of Undergraduate Writing
Journal of Writing Analytics Vol. 2 | 2018 145
2. Based on these features, what insights can we gain into undergraduate writing at Stanford
and similar institutions?
In order to answer the first question, we define a useful feature to be one that is easily
interpretable and helps distinguish between different categories of writers and writing within the
SSW. In other words, a useful feature is one that gives us insight into the dataset. In order to
answer the second question, we use the fact that our features are easily interpretable to make
broad statements about the writing in the SSW.
One more important piece of background information is that every Stanford student is
required to take First-Year and Sophomore Year courses in writing and rhetoric. When tracking
the development of student writing, we will keep in mind the fact that most students at Stanford
receive the majority of their writing instruction in their first two years. This leads to two more
questions:
1. How does student writing develop in these first two years?
2. Do these changes persist when students are receiving less writing instruction as Juniors
and Seniors?
Of course, we do not expect our answers to these Stanford-specific questions to be generally
applicable, but we do expect them to demonstrate the capabilities of the extracted features.
4.0 Research Methodology
4.1 Breaking Down the Data
While 15,000+ writing samples is a large number, the heterogeneity of the dataset requires that
every piece of analysis use a subset of a subset of a subset of the data in order to be meaningful.
As mentioned above, the SSW has many different kinds of writing (including text messages,
emails, and resumes). Ideally, we would be able to focus solely on the academic writing that the
students submitted, but the labeling of the dataset does not make that possible. Instead, through a
series of divisions of the SSW, we can reach a dataset of paragraph-based writing.
The first such division comes from the fact that only the 13,086 .txt files are suitable for
purely text-based analysis. The remaining divisions used are described below.
4.1.1. Major, year, and status. The three labels in the SSW that this study concerns itself
with are:
1. Year – 9,741 of the .txt writing samples are labeled with whether the student was a First-
Year, Sophomore, Junior, Senior, or Fifth Year when the sample was written. Samples
without a year label are ignored. Because there are so few writing samples for Fifth Year
students, Fifth Year will not be included when analyzing features across years.
2. Major – Students were sorted into Humanities, Social Sciences, and STEM categories
based on their self-reported majors. If a student did not report their major or if they had
two majors in different categories, then they were not put into any category. For the sake

Arthurs
Journal of Writing Analytics Vol. 2 | 2018 146
of simplicity, for the rest of this paper, the term major will be used to refer to the
categories of majors, not to specific majors within these categories.
3. Status – For each writing sample, students reported a status from Final Draft, Rough
Draft, Informal Academic Writing, Rough Draft, Senior Project, Creative Writing, and
Personal Writing. The categories themselves are not very consistent (e.g., Rough Draft
contains both rough drafts of academic essays and rough drafts of resumes), but the Final
Draft category appears to contain most of the essay-writing in the dataset. Therefore, we
limit ourselves to the 3,748 Final Draft writing samples that are labeled with a year.
4.1.2. Paragraphs. Beyond the labels above, there is still the issue that some writing samples
are not structured into paragraphs (e.g., resumes), and even writing samples that are structured
into paragraphs contain peripheral elements that are not the student’s writing (e.g.,
bibliographies). In order to filter out these unwanted sections, we define a paragraph as a line in
a file that:
● Has at least four sentences as determined by the sentence tokenizer included in NLTK
(Bird & Loper, 2004)
● Has at least 40 words
● Is written in English (Langdetect, 2018)
Any line in a writing sample that does not meet these requirements is removed, resulting in a
dataset of paragraph-based writing.
4.1.3. Papers. Finally, we define a paper as a writing sample that includes at least three
paragraphs. This simply serves to filter out writing samples that are too small. By this definition,
the dataset contains 2,838 papers. Table 1 shows the resulting breakdown of students, papers,
and paragraphs1:
Table 1
Breakdown of Data by Discipline and Year
Humanities Social Science STEM Total
Students 19 84 72 189
Papers 531 1147 1098 2838
Paragraphs 4801 11902 9837 27114
First-Year papers 36 117 214 388
Sophomore papers 167 310 344 841
Junior papers 166 281 248 814
Senior papers 68 264 218 552
1 The Fifth-Year papers are included in the total number of papers, despite not having their own row. Similarly, the yearly totals include the
papers from students not labelled with a major.

Structural Features of Undergraduate Writing
Journal of Writing Analytics Vol. 2 | 2018 147
Note that while humanities students make up only 10% of the participants, they submitted 19%
of the papers. Also note that the papers are distributed fairly evenly throughout the first four
years of college.
4.1.4. Quotations. The final bit of preprocessing is to remove quotations from the
paragraphs. When analyzing textual features, it is important to only use the student’s own
writing, which means that any quotations from outside sources need to be removed. Quotations
were found using a regex2, and a new version of each paper was created by removing them
completely3.
4.1.5. Heterogeneity as a confounding factor. We feel confident that these divisions of the
SSW result in a dataset of writing that is structured into paragraphs. However, we recognize that
there are many different kinds of paragraph-based writing that could fit into the Final Draft
category, from research papers to personal narratives to lab reports. Furthermore, we recognize
that the categories themselves contain a certain amount of ambiguity. For example, a student
could reasonably mark the final draft of a short story as either Final Draft or Creative Writing. In
light of this confound, we will try to use features that are fine-grained enough that they do not
depend too much on the context of the writing. We will also take the heterogeneity of the data
into account when coming to conclusions.
4.2 Computing Topic
For this study we used Mallet (McCallum, 2002) to perform Latent Dirichlet Allocation topic
modeling (Blei, Ng, & and Jordan, 2003) with Gibbs Sampling (Griffiths, 2002). To generate the
topics, we used the full versions of the papers (the versions still containing non-paragraph lines
and quotations) because those parts of the text, despite having been removed during
preprocessing, can still contain information about the topic of the paper in question.
For a specified number of topics, Mallet outputs:
● A list of words most associated with each topic found.
● For each document, a weight for each topic. The weights sum to 1, and a larger
weight means that the corresponding topic plays a larger role in the document.
We ran topic modeling with 10, 20, and 30 topics.
4.3 Computing Stance
In order to compute hedging and boosting frequency in the SSW, this study replicates Aull and
Lancaster’s (2014) approach of measuring the frequency of stance markers, phrases that indicate
a particular expression of stance. We used the lists of approximative hedges4 and boosters5 that
2 Using Python’s re package (6.2. Re - Regular Expression Operations., 2018), the regex is " *'.*?'[^a-zA-Z] *|\".*?\"". Note that there are more
stringent requirements for the single quote version in order to avoid interpreting an apostrophe as a quotation mark. 3 We did not filter for length after removing quotations. However, after filtering, 99.97% of paragraphs retained the requirement of having at
least 4 sentences and 99.996% of papers retained the requirement of having at least 12 sentences, with every paper having at least 9 sentences. 4 The markers for approximative hedges are: apparent, apparently, approximately, essentially, evidently, generally, in general, in many cases, in
many ways, in most cases, primarily, largely, mostly, often, relatively, roughly, somewhat, usually, and sometimes.
Arthurs
Journal of Writing Analytics Vol. 2 | 2018 148
were created in Aull and Lancaster’s study. When parsing the SSW, we counted as a match any
string of characters that differed from a stance marker only in capitalization (i.e., Sometimes
would match the stance marker sometimes, but some times would not). Of course, no list of
stance markers could account for all examples of a writer expressing stance. However, the
markers in Aull and Lancaster’s lists are worth measuring, as writers rarely use them except
when expressing stance. Replicating Aull and Lancaster’s approach allows us to test the
generalizability of the results of the 2014 study (specifically the idea that upper-level writers
hedge more and boost less than their first-year classmates) and build on those results by applying
the same techniques across different groups of students and papers.
4.4 Computing Complexity
We can break down the process of writing an essay into three stages: ideation, drafting, and
polishing. Ideation is most likely too abstract to approach computationally, and polishing is too
surface-level to give real insights into how students write. In between the two, drafting, the
process of putting ideas into words, primarily involves determining the structure of the essay:
structuring ideas into paragraphs, paragraphs into points, points into sentences, sentences into
clauses, etc. The lowest level of this process involves choosing a structure for every sentence.
We will first build up a definition of syntactic complexity on the level of sentence structure and
then use that definition to characterize how students develop.
When thinking about sentence structure, the first thing to reach for in the NLP toolkit is the
parse tree. A parse tree is a way of representing a sentence in terms of dependencies: One word
is the root, and any word that depends on the root word will be its child. Each of those nodes will
have as their children any words that depend on them and so on. In order to acquire these parse
trees, we parsed every sentence in our corpus using the spaCy dependency parser (Honnibal &
Johnson, 2015) which implements Shift-Reduce dependency parsing (Sagae & Tsujii, 2008).
Intuitively, a more complicated parse tree will correspond to a more complicated sentence,
but what makes a tree more complicated? Two ways of measuring the shape of a tree are:
1. Branching Factor – how many children does each word have?
2. Tree Depth – How many layers does the tree have?
These two features compete with one another: If two sentences have the same number of words,
the one with the larger branching factor will have a smaller depth.
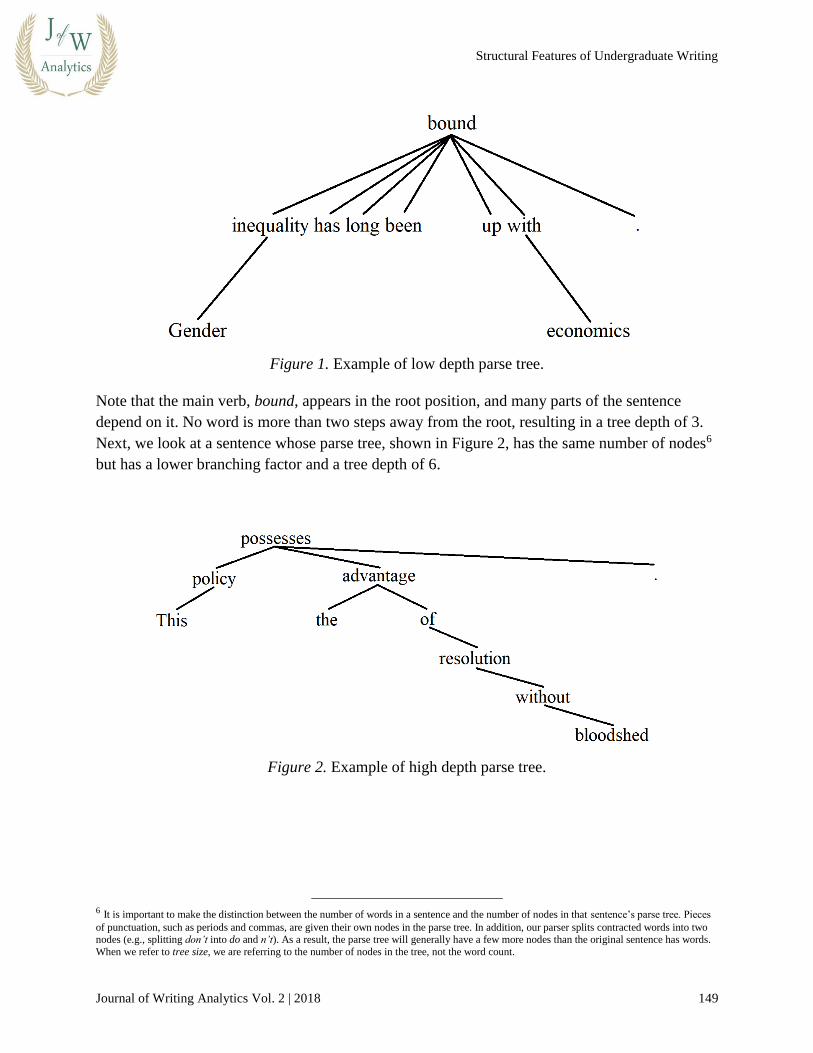
Figure 1 illustrates an example of a parse tree with high branching factor and low depth,
specifically a depth of 3. Each line represents a dependency, with the lower word depending on
the higher word.
5 The markers for boosters are: very, highly, strongly, much, a lot, totally, definitely, clearly, certainly, undoubtedly, without a doubt, doubtless,
extremely, really, truly, obvious, obviously, and no doubt.
Structural Features of Undergraduate Writing
Journal of Writing Analytics Vol. 2 | 2018 149
Figure 1. Example of low depth parse tree.
Note that the main verb, bound, appears in the root position, and many parts of the sentence
depend on it. No word is more than two steps away from the root, resulting in a tree depth of 3.
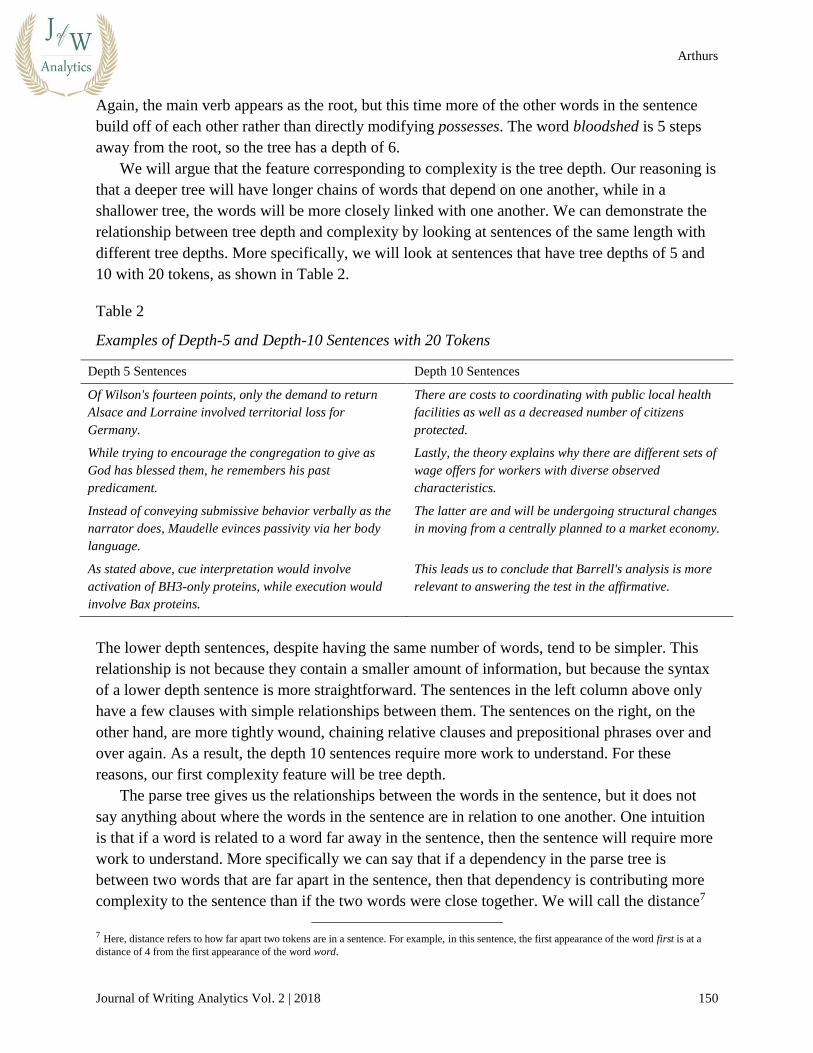
Next, we look at a sentence whose parse tree, shown in Figure 2, has the same number of nodes6
but has a lower branching factor and a tree depth of 6.
Figure 2. Example of high depth parse tree.
6 It is important to make the distinction between the number of words in a sentence and the number of nodes in that sentence’s parse tree. Pieces
of punctuation, such as periods and commas, are given their own nodes in the parse tree. In addition, our parser splits contracted words into two nodes (e.g., splitting don’t into do and n’t). As a result, the parse tree will generally have a few more nodes than the original sentence has words.
When we refer to tree size, we are referring to the number of nodes in the tree, not the word count.
Arthurs
Journal of Writing Analytics Vol. 2 | 2018 150
Again, the main verb appears as the root, but this time more of the other words in the sentence
build off of each other rather than directly modifying possesses. The word bloodshed is 5 steps
away from the root, so the tree has a depth of 6.
We will argue that the feature corresponding to complexity is the tree depth. Our reasoning is
that a deeper tree will have longer chains of words that depend on one another, while in a
shallower tree, the words will be more closely linked with one another. We can demonstrate the
relationship between tree depth and complexity by looking at sentences of the same length with
different tree depths. More specifically, we will look at sentences that have tree depths of 5 and
10 with 20 tokens, as shown in Table 2.
Table 2
Examples of Depth-5 and Depth-10 Sentences with 20 Tokens
Depth 5 Sentences Depth 10 Sentences
Of Wilson's fourteen points, only the demand to return
Alsace and Lorraine involved territorial loss for
Germany.
There are costs to coordinating with public local health
facilities as well as a decreased number of citizens
protected.
While trying to encourage the congregation to give as
God has blessed them, he remembers his past
predicament.
Lastly, the theory explains why there are different sets of
wage offers for workers with diverse observed
characteristics.
Instead of conveying submissive behavior verbally as the
narrator does, Maudelle evinces passivity via her body
language.
The latter are and will be undergoing structural changes
in moving from a centrally planned to a market economy.
As stated above, cue interpretation would involve
activation of BH3-only proteins, while execution would
involve Bax proteins.
This leads us to conclude that Barrell's analysis is more
relevant to answering the test in the affirmative.
The lower depth sentences, despite having the same number of words, tend to be simpler. This
relationship is not because they contain a smaller amount of information, but because the syntax
of a lower depth sentence is more straightforward. The sentences in the left column above only
have a few clauses with simple relationships between them. The sentences on the right, on the
other hand, are more tightly wound, chaining relative clauses and prepositional phrases over and
over again. As a result, the depth 10 sentences require more work to understand. For these
reasons, our first complexity feature will be tree depth.
The parse tree gives us the relationships between the words in the sentence, but it does not
say anything about where the words in the sentence are in relation to one another. One intuition
is that if a word is related to a word far away in the sentence, then the sentence will require more
work to understand. More specifically we can say that if a dependency in the parse tree is
between two words that are far apart in the sentence, then that dependency is contributing more
complexity to the sentence than if the two words were close together. We will call the distance7
7 Here, distance refers to how far apart two tokens are in a sentence. For example, in this sentence, the first appearance of the word first is at a
distance of 4 from the first appearance of the word word.

Structural Features of Undergraduate Writing
Journal of Writing Analytics Vol. 2 | 2018 151
between two words linked in their parse tree a dependency length, and we will use the average
dependency length (ADL) in a sentence as our second complexity feature. To get a sense of how
ADL works for us, Table 3 shows sentences that all have tree size 20 and tree depth 6 but have
varying ADLs.
Table 3
Examples Depth-6, 20 Token Sentences with Varying ADL
ADL Size 20, Depth 6 Sentences
2.35 This combination of high demandingness and high responsiveness is characterized as authoritative parenting
(Arnett 193-94).
2.45 A microbial fuel cell is an electrochemical apparatus which uses the metabolism of microbes to produce an
electric current.
2.85 Moreover, the US adhered to a first - use policy to deter Soviet military aggression against West Berlin.
3.10 This created domestic problems, which spilled into international conflict, because of the size of the Habsburg
monarchy.
3.20 I suggest that polycarbonate be used if possible, especially if the bubble manufacturing is outsourced to a
company.
3.55 Also under consideration is in which direction (more conservative or risky) the group decision tended to
favor.
3.85 I appreciate the curriculum's emphasis on cooperative guidance rather than competition, and investigative
methods rather than memorization.
4.35 Our interpretation falls short when Walton himself, who we can assume is credible, sees the monster
firsthand.
The low-ADL sentences are (unsurprisingly) characterized by very linear constructions.
When reading one of these sentences, one never gets confused or has to rescan part of the
sentence. The high-ADL sentences, on the other hand, are much less straightforward, as (by
definition) they have words that refer back to spots much earlier in the sentence. For example, in
the sentence with ADL of 4.35, Walton depends on sees, but the two have a distance of 10 from
one another8. This means that the reader has to spend half of the sentence holding the subject in
their head before reaching the verb. When these long-range dependencies accumulate, it can
become difficult to understand a sentence without scanning over it multiple times, and as a
result, sentences with very high ADL tend to be confusing and demanding to read. For these
reasons, ADL will be our second complexity feature.
When we combine the features of tree-depth and average dependency length, we have a good
idea of the structural complexity of a given sentence. Tree depth tells us the degree to which the
parts of the sentence are dependent on one another, and ADL tells us how much of the sentence
we have to think about at a time in order to understand it. Of course, no two numbers could tell
8 While “sees” is only 8 words from “Walton”, the two are 10 tokens apart since commas get their own tokens (and as a result their own nodes in
the parse tree).
Arthurs
Journal of Writing Analytics Vol. 2 | 2018 152
the whole story of a sentence’s syntactic complexity, but tree depth and ADL capture our
insights into what makes a parse tree complex. In addition, the values that these two features
output for the sentences above (and many others) line up with our intuitions about which
sentences are more complex.
5.0 Results
5.1 Topic Results
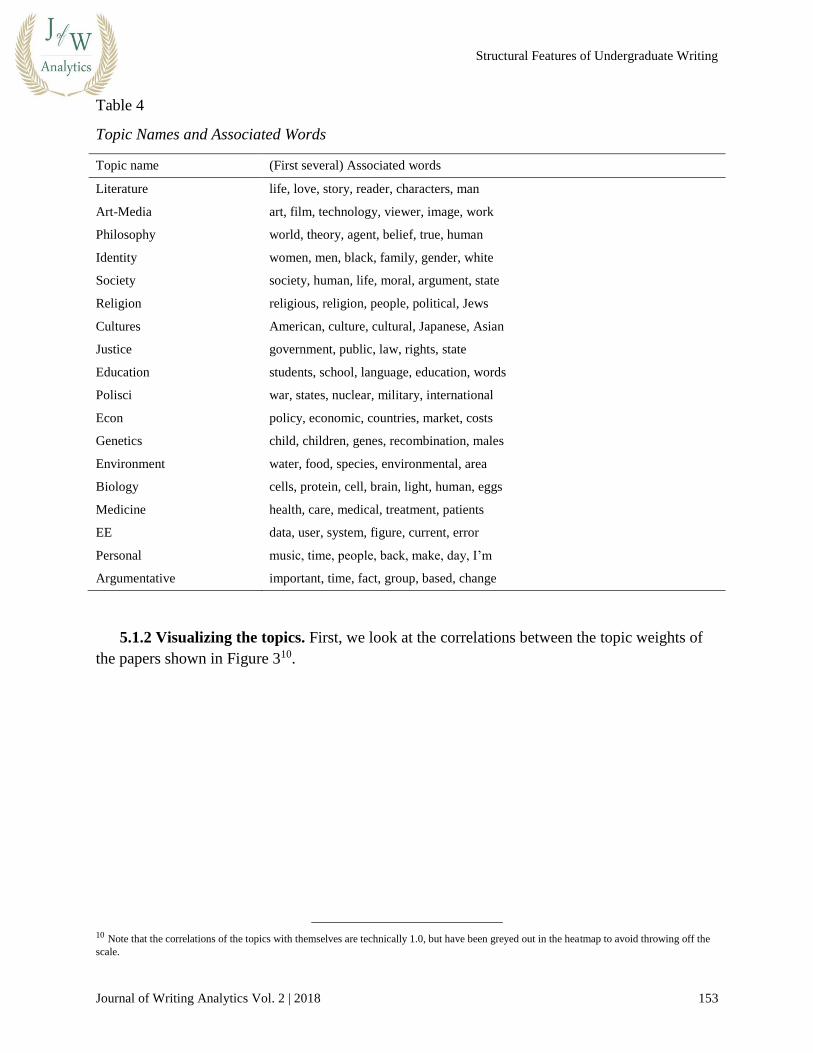
5.1.1 The topics. As mentioned above, we ran LDA topic modelling with 10, 20, and 30
topics. As mentioned above, the algorithm outputs a list of words most associated with each
topic. For each number of topics, we holistically gave each topic a name based on its list of
associated words, as shown in Table 4. The 10 topics were all very distinct, the 20 topics were
mostly distinct but contained two topics corresponding to education and two corresponding to
biology9, and the 30 topics contained a large amount of redundancy. As a result, we chose to
work with the 18 topics acquired by starting with the output of the 20-topic model and
combining the redundant topics. More specifically, for each document, we added the weights
corresponding to the two education topics into a single Education weight and did the same for
biology.
The first thing that jumps out about the 18 topics is that 16 of them are associated with
academic disciplines, and two of them, Personal and Argumentative are associated with styles of
writing. Furthermore, after sorting the 16 discipline-specific topics on a scale from humanities to
social science to STEM, it turned out that seven topics were tied to humanities fields, four were
tied to social science fields, and five were tied to STEM fields. As a result, for each paper, we
can not only say what field the student was studying, but what field they were writing in at the
time.
Table 4 shows the assigned topic names accompanied by the words most associated with
each topic according to the model. They appear in the sorted order described above, and are
divided into humanities, social science, STEM, and style groupings.
9 We consider a pair of topics to be redundant when the lists of words for the two topics do not lend themselves to any natural distinction. The
two Education topics we combined had the following sets of most associated words:
1. students, language, words, English, writing, word, lesson, class, reading, teacher, children, learning, book, read, speech, student,
classroom, time, information, write 2. school, students, education, research, work, Stanford, schools, student, program, science, community, class, teachers, project,
educational, children, experience, working, year, university
The two Biology topics we combined had the following sets of most associated words: 1. protein, light, control, acid, eggs, cells, DNA, trpr, results, concentration, solution, experiment, water, fertilization, gene,
experimental, amino, test, tube, unknown
2. cells, cell, brain, human, proteins, protein, gene, expression, research, response, system, activation, genes, levels, studies, bars, body, specific, DNA, visual
Note that in both cases, there is no obvious way to describe the differences between the two sets. As a result, we combine the topics.
Structural Features of Undergraduate Writing
Journal of Writing Analytics Vol. 2 | 2018 153
Table 4
Topic Names and Associated Words
Topic name (First several) Associated words
Literature life, love, story, reader, characters, man
Art-Media art, film, technology, viewer, image, work
Philosophy world, theory, agent, belief, true, human
Identity women, men, black, family, gender, white
Society society, human, life, moral, argument, state
Religion religious, religion, people, political, Jews
Cultures American, culture, cultural, Japanese, Asian
Justice government, public, law, rights, state
Education students, school, language, education, words
Polisci war, states, nuclear, military, international
Econ policy, economic, countries, market, costs
Genetics child, children, genes, recombination, males
Environment water, food, species, environmental, area
Biology cells, protein, cell, brain, light, human, eggs
Medicine health, care, medical, treatment, patients
EE data, user, system, figure, current, error
Personal music, time, people, back, make, day, I’m
Argumentative important, time, fact, group, based, change
5.1.2 Visualizing the topics. First, we look at the correlations between the topic weights of
the papers shown in Figure 310.
10 Note that the correlations of the topics with themselves are technically 1.0, but have been greyed out in the heatmap to avoid throwing off the
scale.

Arthurs
Journal of Writing Analytics Vol. 2 | 2018 154
Figure 3. Correlations between topics.
We can make the following observations:
● Discipline-specific topics tend to have higher correlations with other topics in their group
and lower correlations with topics in other groups, which to a certain extent justifies the
groupings of the topics. Of course, some topics are correlated strongly with topics in
multiple groups (e.g., Religion, Cultures), but in general, topics are specific to a single
category of major. This pattern indicates that (unsurprisingly) there are not many truly
interdisciplinary pieces of writing in the SSW.
● The most negative correlation is between Argumentative and Personal, which is not
surprising, since writing does not tend to be both argumentative and personal.
● Papers that include STEM topics do not tend to be very argumentative or very personal,
which makes sense, as writing in STEM fields tends to be about reporting facts and
results. Furthermore, personal writing tends to be correlated with humanities topics.
The fact that these correlations line up with our intuitions about how these topics should
behave suggests that the topic distributions can be useful features moving forwards. Another way
to test our intuitions, shown in Figure 4, is to look at the log average topic distribution for papers
by students of each major. We use a log scale11 so that topics with higher average weights (e.g.,
Argumentative) do not wash out the differences between lower-weighted topics when creating
the heat map.
11 The log is base-10, meaning that “-1.0” corresponds to an average weight of 0.1 and “-2.0” corresponds to an average weight of 0.01.

Structural Features of Undergraduate Writing
Journal of Writing Analytics Vol. 2 | 2018 155
Figure 4. Log average topic weights per major.
With only two exceptions, each topic finds its largest average weight among students whose
major category includes that topic. Medicine achieves a higher weight among social science
students because many of the papers with a high Medicine weight were written by students in
Human Biology, which we have classified as a social science12. The other exception is the
Education topic, which is naturally very interdisciplinary.
Perhaps most enlightening is the visualization, shown in Figure 5, of the log average topic
distribution by year13.
12 At the time of the study, Stanford’s Human Biology department only offered a B.A. degree. Therefore, we do not classify Human Biology
majors as STEM students despite the fact that they often take STEM classes as part of their major. 13 Here too, we took the logs (base-10) of the average weights.

Arthurs
Journal of Writing Analytics Vol. 2 | 2018 156
Figure 5. Log average topic weights per year.
Here, we note that First-Year students tend to write more about humanities topics. This trend is
unsurprising, as First-Year writing courses tend to focus on humanities topics. Furthermore, it is
much more common for upperclassmen to write about STEM and social science topics, which
lines up with the fact that introductory courses outside the humanities do not tend to be very
writing-oriented. Overall, the trend seems to be that students move away from the humanities
and towards social science/STEM fields over time.
In order to better visualize these changes in topics over time, we will define a humanities
paper to be one that has more weight in humanities topics than in social science and STEM
topics combined. We will define social science papers and STEM papers similarly. All but 163
of our papers fall into one of these categories. Shown in Figure 6, these designations allow us to
visualize fields in which students of each major spent their time writing.

Structural Features of Undergraduate Writing
Journal of Writing Analytics Vol. 2 | 2018 157
Figure 6. Paper topic by major.
While above we found that there were not a large number of interdisciplinary papers in the
dataset, here we see that the students themselves tend to be fairly interdisciplinary.
As shown in Figure 7, we can also observe how the paper categories of students of different
majors change over time.
Arthurs
Journal of Writing Analytics Vol. 2 | 2018 158
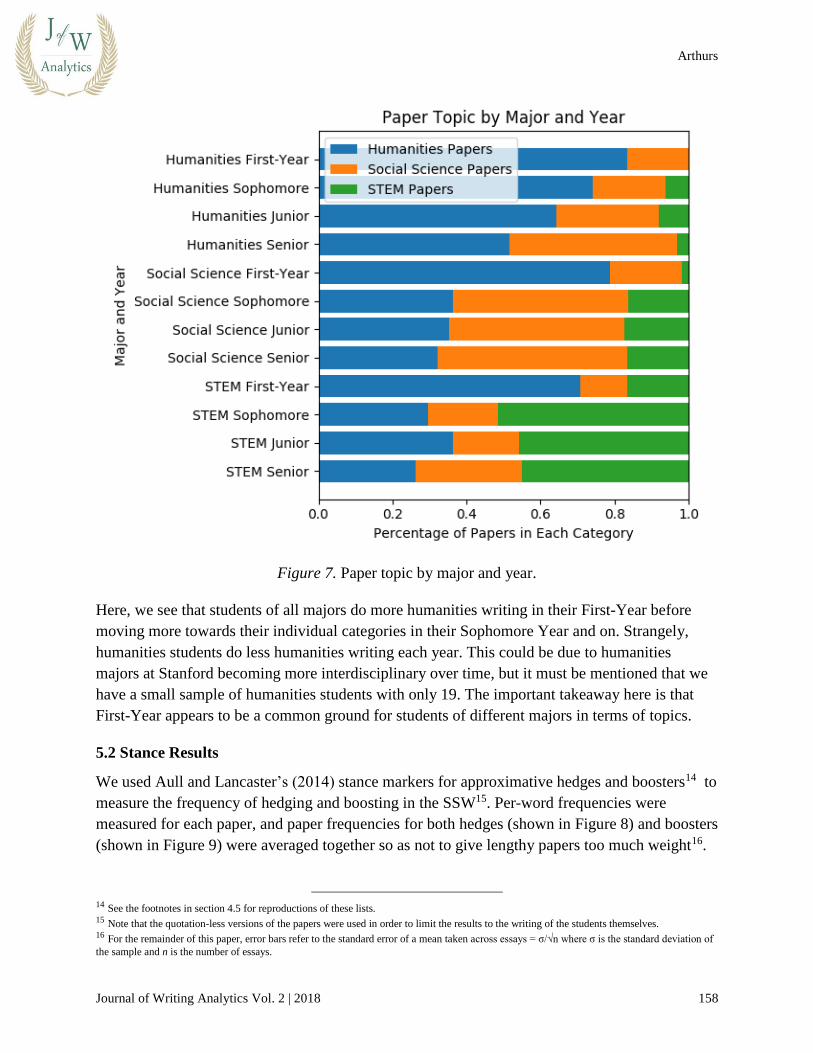
Figure 7. Paper topic by major and year.
Here, we see that students of all majors do more humanities writing in their First-Year before
moving more towards their individual categories in their Sophomore Year and on. Strangely,
humanities students do less humanities writing each year. This could be due to humanities
majors at Stanford becoming more interdisciplinary over time, but it must be mentioned that we
have a small sample of humanities students with only 19. The important takeaway here is that
First-Year appears to be a common ground for students of different majors in terms of topics.
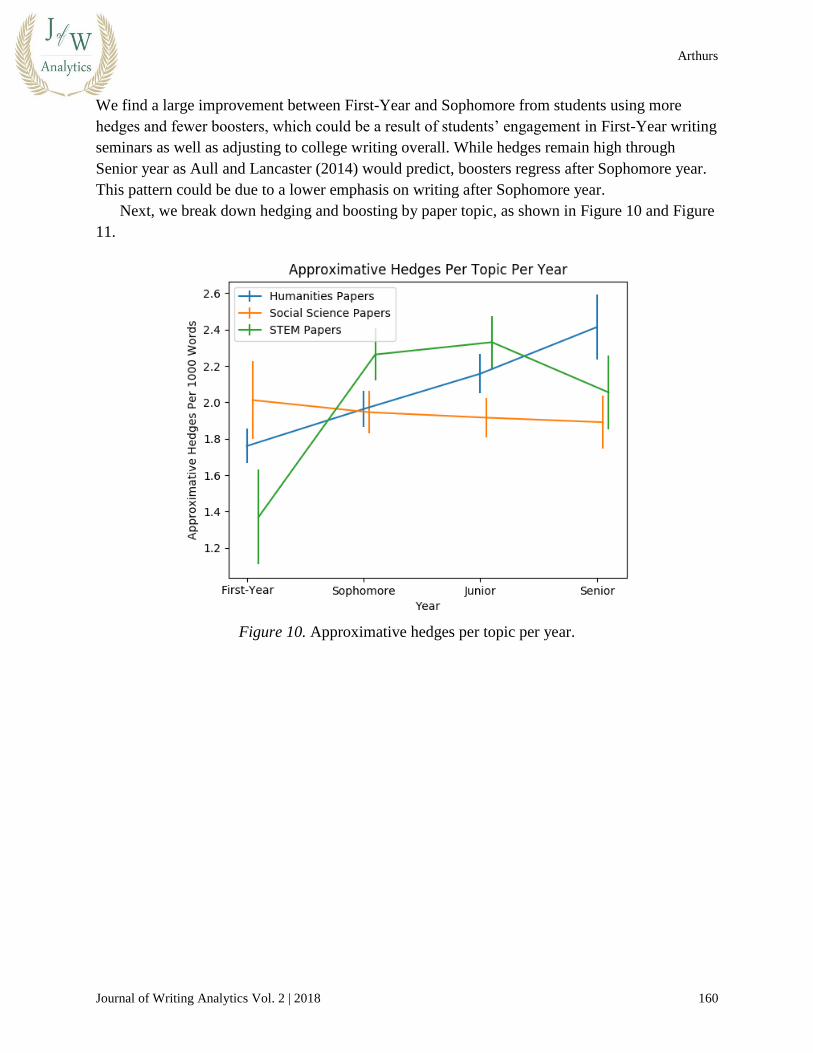
5.2 Stance Results
We used Aull and Lancaster’s (2014) stance markers for approximative hedges and boosters14 to
measure the frequency of hedging and boosting in the SSW15. Per-word frequencies were
measured for each paper, and paper frequencies for both hedges (shown in Figure 8) and boosters
(shown in Figure 9) were averaged together so as not to give lengthy papers too much weight16.
14 See the footnotes in section 4.5 for reproductions of these lists. 15 Note that the quotation-less versions of the papers were used in order to limit the results to the writing of the students themselves. 16 For the remainder of this paper, error bars refer to the standard error of a mean taken across essays = σ/√n where σ is the standard deviation of
the sample and n is the number of essays.

Structural Features of Undergraduate Writing
Journal of Writing Analytics Vol. 2 | 2018 159
Figure 8. Approximative hedges per year.
Figure 9. Boosters per year.
Arthurs
Journal of Writing Analytics Vol. 2 | 2018 160
We find a large improvement between First-Year and Sophomore from students using more
hedges and fewer boosters, which could be a result of students’ engagement in First-Year writing
seminars as well as adjusting to college writing overall. While hedges remain high through
Senior year as Aull and Lancaster (2014) would predict, boosters regress after Sophomore year.
This pattern could be due to a lower emphasis on writing after Sophomore year.
Next, we break down hedging and boosting by paper topic, as shown in Figure 10 and Figure
11.
Figure 10. Approximative hedges per topic per year.

Structural Features of Undergraduate Writing
Journal of Writing Analytics Vol. 2 | 2018 161
Figure 11. Boosters per topic per year.
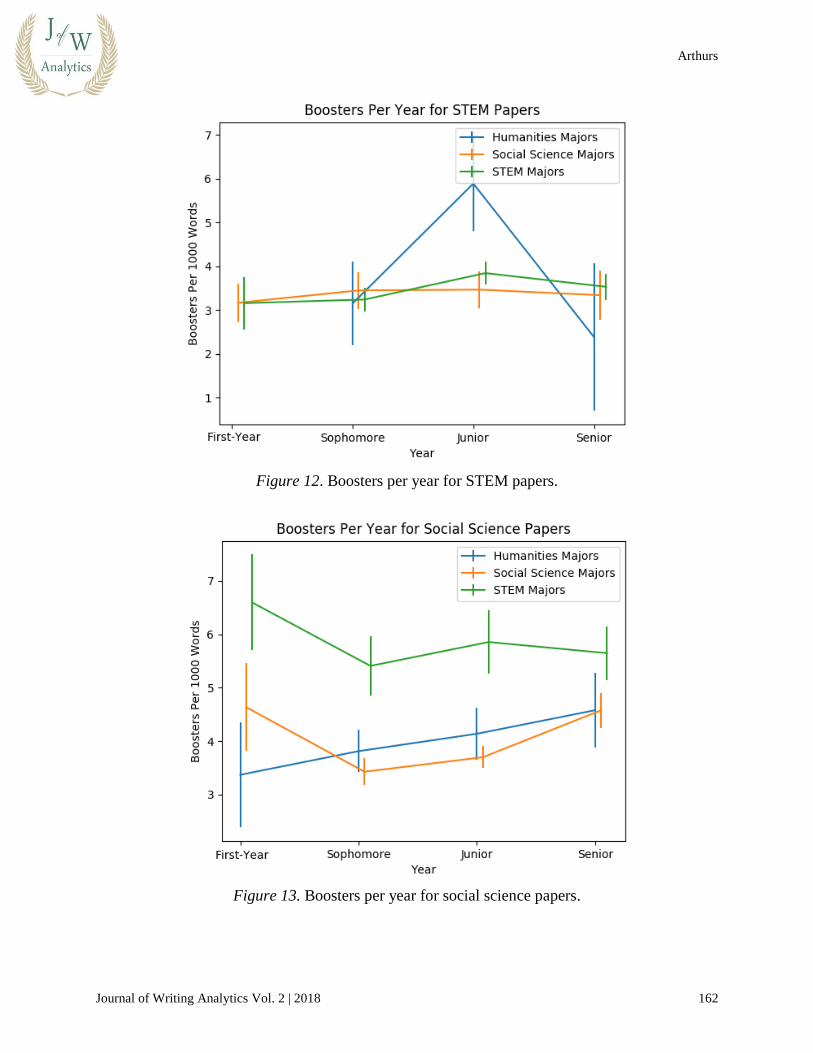
In general, we find that STEM papers have more hedging and less boosting than the other two
categories. However, this does not indicate that STEM students are the cause of these
differences. As Figures 12 and 13 demonstrate, we can observe that while social science students
do a similar amount of boosting to STEM students when writing STEM papers, STEM students
boost far more than social science students when writing social science papers.
Arthurs
Journal of Writing Analytics Vol. 2 | 2018 162
Figure 12. Boosters per year for STEM papers.
Figure 13. Boosters per year for social science papers.

Structural Features of Undergraduate Writing
Journal of Writing Analytics Vol. 2 | 2018 163
This trend could indicate that the low amount of boosting in STEM papers comes more from the
fact that boosting tends to be out of place in STEM contexts. The trend also would imply that
when freed from those contexts, STEM students will state their claims more forcefully than their
social science and humanities classmates.
Our results overall indicate that hedging and boosting behave quite differently and not as
mere opposites of one another. A striking demonstration of difference, shown in Figure 14 and
Figure 15, comes from comparing the behavior of students when writing in their majors vs.
writing outside their majors.
Figure 14. Approximative hedges in and out of major.

Arthurs
Journal of Writing Analytics Vol. 2 | 2018 164
Figure 15. Boosters in and out of major.
As we can see, when writing outside of their majors, students tend to both hedge more and boost
more than when they write within their majors. Aull and Lancaster (2014) attribute the low
hedging and high boosting of First-Year students to the fact that they are not immersed enough in
their fields to properly qualify their claims. However, if this were the only mechanism at play,
we would have found students to be hedging less, not more when writing outside their majors.
To account for this difference, we can attribute a certain amount of caution to students who are
writing in fields that are unfamiliar to them. Our model is then of caution, which results in more
hedging, competing with the lack of domain knowledge that results in students boosting more
when writing about unfamiliar fields.
5.3 Complexity Results
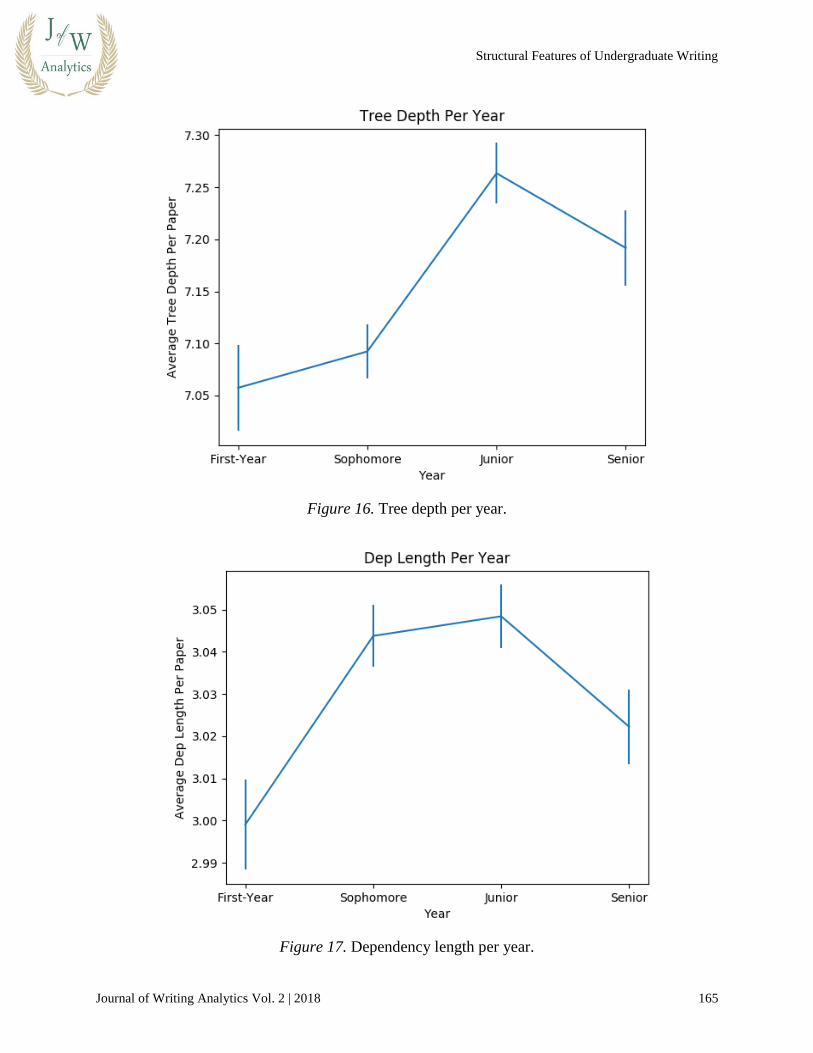
First, we calculate the average tree depth and ADL17 for each essay. Then, as we did for stance
features, when calculating the tree depth or ADL for a group of essays, we average the individual
essay values.
As shown in Figure 16 and Figure 17, we start by plotting our new features against year.
17 The ADL of a paper is calculated by averaging all of the depth lengths in the paper, not by averaging the ADLs of the individual trees.
Structural Features of Undergraduate Writing
Journal of Writing Analytics Vol. 2 | 2018 165
Figure 16. Tree depth per year.
Figure 17. Dependency length per year.
Arthurs
Journal of Writing Analytics Vol. 2 | 2018 166
In general, as the figures suggest, the trend is that complexity goes up as students develop as
writers. We do not know, however, whether sentence complexity is increasing because students
are changing who they are as writers or because they are expressing more complex ideas as they
get deeper into their respective fields.
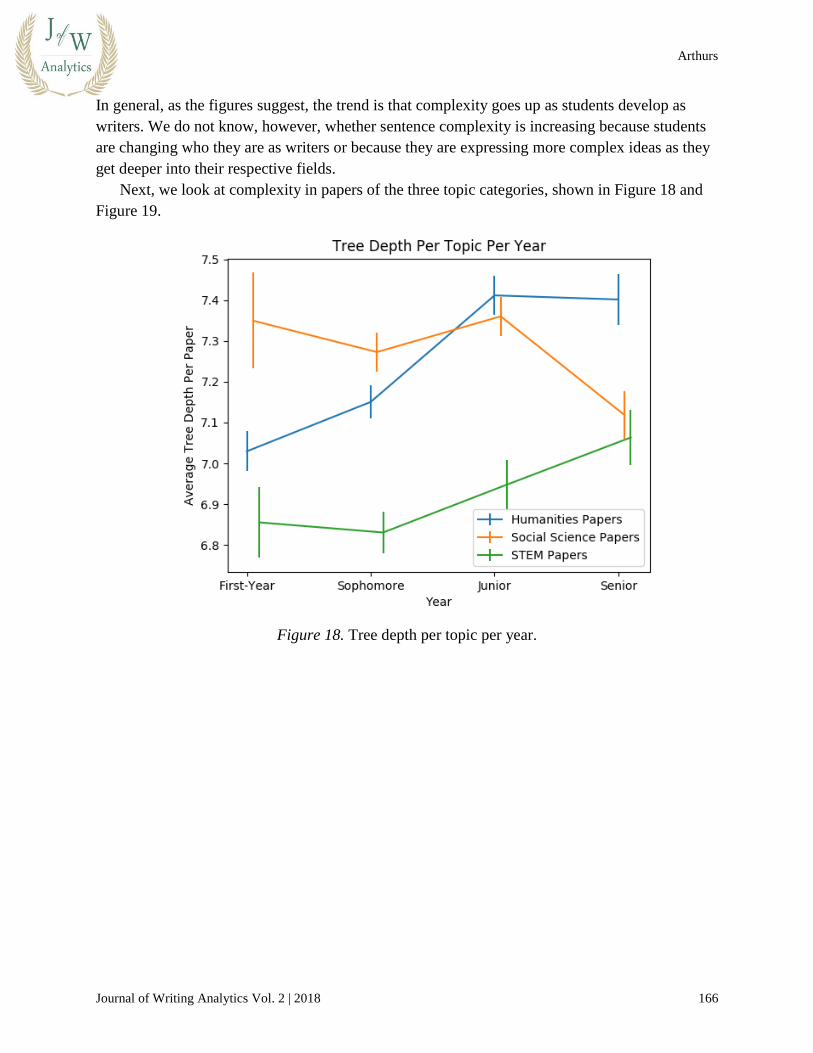
Next, we look at complexity in papers of the three topic categories, shown in Figure 18 and
Figure 19.
Figure 18. Tree depth per topic per year.

Structural Features of Undergraduate Writing
Journal of Writing Analytics Vol. 2 | 2018 167
Figure 19. Dependency length per topic per year.
In both figures, we can then see that STEM papers have the lowest sentence complexity, and
humanities papers have the highest, just barely above social science. Furthermore, we find that
paper topic is much more indicative of sentence complexity than student major. Shown in
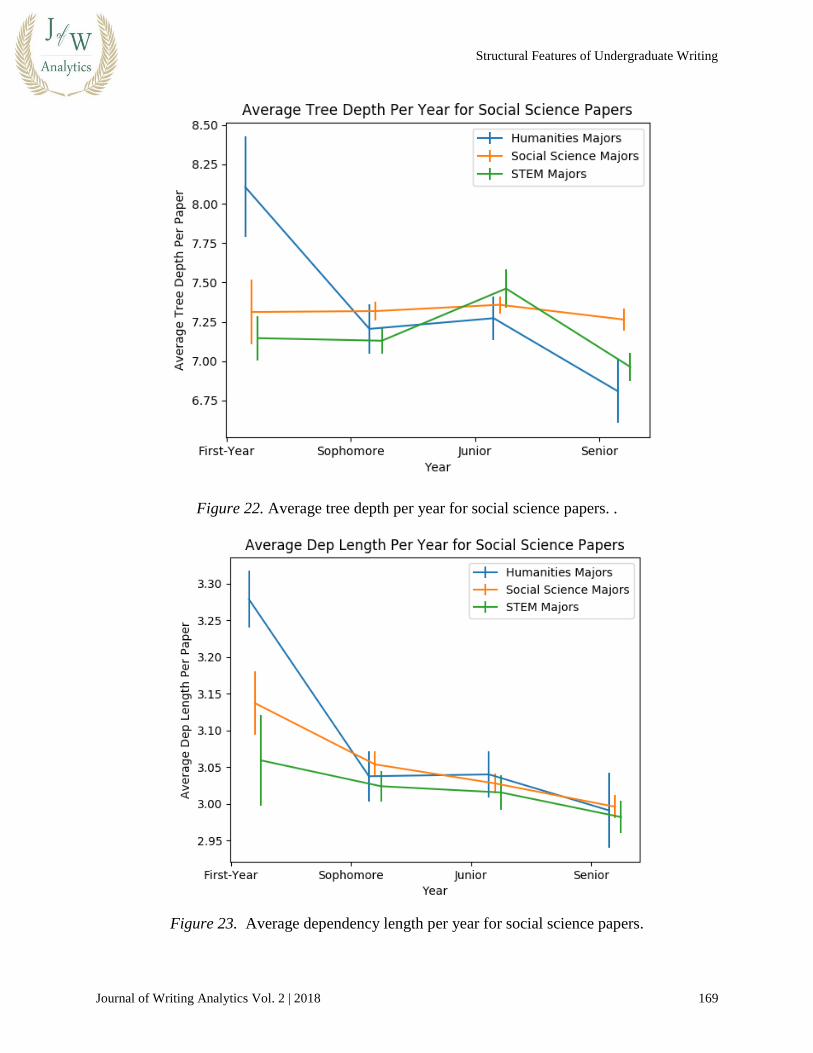
Figures 20 through 23, we can explore this pattern by looking at how students of different majors
behave when writing papers in different categories.

Arthurs
Journal of Writing Analytics Vol. 2 | 2018 168
Figure 20. Average tree depth per year for humanities papers.
Figure 21. Average dependency length per year for humanities papers.
Structural Features of Undergraduate Writing
Journal of Writing Analytics Vol. 2 | 2018 169
Figure 22. Average tree depth per year for social science papers. .
Figure 23. Average dependency length per year for social science papers.

Arthurs
Journal of Writing Analytics Vol. 2 | 2018 170
It seems that students of different major categories exhibit similar complexity features when
writing papers in the same topic category. This contrast would imply that different disciplines
call for different levels of sentence complexity and that the current discipline is a big factor in
determining a student’s syntactic complexity when writing a paper. It makes sense that STEM
papers call for lower complexity, since STEM writing is often about clear communication, which
calls for lower complexity. Humanities writing, on the other hand, is concerned with expressing
complex and nuanced ideas about texts, so syntactic complexity will rise.
One more detail we can see above is that during the First-Year, humanities students have the
most complex syntax, social sciences students second, and STEM students third. Humanities
students in particular use much more complex syntax than their classmates when writing social
science papers in the First-Year. One hypothesis is that students could be coming into Stanford
familiar with one way of writing, and over time, they learn to be more flexible.
6.0 Discussion
6.1 Discussion of Results
The use of topic modeling on the SSW did confirm the unsurprising fact that students of different
majors write about different topics, but also gave a picture of interdisciplinary study at Stanford
by showing how often students wrote about topics outside their majors. Furthermore, the fact that
Stanford students are so interdisciplinary allowed us to examine the intersection of a student’s
major and current topic of writing when analyzing the other two sets of features. One direction
that could be explored more comes from the fact that two of the topics (argumentative and
personal) correspond to styles of writing rather than content of writing. Perhaps future research
could use topic modeling to isolate more writing styles in order to find the relationship that
different groups of students have to different writing styles.
Our study of stance markers in the SSW shows that both field of study and topic of writing
influence the ways in which students employ metadiscourse. In addition, if we take lower
boosting frequency to be a sign of progress, then it is possible for students to regress, as Seniors
employed boosting with similar frequency to First-Year students. We must note, however, that
using such a simple technique as counting the frequency of particular markers could be a source
of error. For example, if students were diversifying and/or camouflaging the ways they express
stance over time, then we would be undercounting stance markers for upper-level students. On
the other hand, many of the stance markers could be used in contexts where stance is not being
expressed. A well-trained model may be able to overcome these difficulties and detect stance
with higher accuracy, but that is beyond the scope of this study.
The two complexity features we extracted ended up being useful for distinguishing between
our three categories of topics. This suggests the idea that there may be different “ideal” levels of
writing complexity within different disciplines. The results also hint towards the idea that
undergraduates come into Stanford already partially sorted into their eventual majors. Unlike
with hedging and boosting, it is unclear what the ideal of syntactic complexity should be. Of

Structural Features of Undergraduate Writing
Journal of Writing Analytics Vol. 2 | 2018 171
course, sentences need to be able to express complex ideas, but if they are too complicated, then
(like the sentences above with high dependency length) they lose clarity and become difficult to
read. The open question then is: At what point does syntax become too simple to convey ideas or
too complicated to convey ideas clearly?
6.2 Confounding Factors
The main confounding factor, as discussed in section 4.1, is the heterogeneity of the dataset.
Throughout the study, we have learned that the field in which students are writing does influence
their expression of stance and syntactic complexity. As a result, it is reasonable to think that the
changes we observe in student writing over time might have as much to do with changes to what
students are writing as how students are changing as writers. Unfortunately, the labels in the
SSW do not help us answer this question, but it is worth noting that content and style are to a
certain extent inseparable. It will always be true that as students are changing as writers, what
they are choosing to (or being asked to) write will change as well. Furthermore, changes in
content are also an important part of the development of a writer. One could reframe some of the
development-based conclusions in this paper in terms of changes in content rather than style, but
that does not necessarily weaken the results. If it turns out that our features pick up more on
content differences than style differences, then the features are still useful for characterizing how
writing changes across different contexts. In addition, the results about the differences between
writing done in different disciplines are not affected by this confound. In order to get to the
bottom of the content vs. style question, there will need to be future studies that collect less
heterogeneous data.
Another confounding factor is the low number of humanities students. We noted above that
humanities students, despite making up only 10% of the students, submitted 19% of the writing
in the dataset. This rate of submission allows us to draw conclusions from a good number of
humanities student papers, but our results could be skewed by the fact that there are a low
number of students producing those papers. This submission rate does not so much affect the
overall conclusions about the features we extracted, but it does mean we should be careful not to
generalize our results about the humanities students in the SSW to all humanities students. In
fact, all of our results specific to certain groups of students should come with this caveat as the
SSW does not avoid selection bias: Because the SSW did not set quotas for how much writing
students should submit, students who were more motivated would submit more writing in
addition to being more likely to participate in the first place.
7.0 Conclusions
7.1 Using the Features
Each set of features discussed in this study gave us different insights into the data:
● Topic modeling ended up being useful for sorting papers into academic disciplines, as
well as for distinguishing between argumentative and personal writing.
Arthurs
Journal of Writing Analytics Vol. 2 | 2018 172
● Stance markers helped us characterize the intersection between the majors that students
hold and the topics that they are writing about at a given time.
● Parse tree complexity made it possible to describe the differences between writing in
different disciplines as well as the differences between students of different disciplines
when they enter Stanford.
We will not claim that these features are necessary or sufficient for characterizing student
writing, but they do reveal some of the distinctions between different categories of students and
different topics of writing. Most importantly, we have shown that the features are interpretable
and capable of tracking the development of groups of student writers.
It is important to address the question of how educators can use our features. One limitation
of this study is that the features only work for us on a broad scale. In other words, we have only
shown that they can give us insights when looking at student writing in aggregate. As a result,
without further research, it would be ill advised to use these features to analyze the writing of
individual students or small groups of students. However, we feel confident that educators can
use these features to gain insights into writing programs as we have gained insight into the SSW.
Data visualizations like the ones we have provided in this study can help educators wrap their
minds around the large-scale patterns and behaviors of students in their programs. The kind of
computational writing analysis that we have done will not automate any part of the process of
teaching writing, but it can be a powerful addition to the educator’s toolbox.
7.2 What Can We Say About Writing at Stanford?
With the caveat that the SSW was collected over a decade ago, we can say:
● Stanford students in the humanities, social sciences, and STEM take different trajectories
as they develop as writers at Stanford. These differences are not limited to the topics that
they write about: It also turns out that students of different disciplines will take different
approaches to writing about the same topic.
● There was a trend in the results of there being a big jump between First-Year and
Sophomore Year, followed by a regression towards First-Year habits during Junior and/or
Senior Year. As mentioned above, this trend could be due to the writing classes that
Stanford First-Year students and Sophomores are required to take. If that is the case, then
the program is succeeding in having an impact on student writing, and it should not be
too surprising that students are returning to old habits when they are not focusing on their
writing as much.
8.0 Directions for Further Research
8.1 Future Computational Approaches to Writing
One hope is that in the future, more computational approaches to analyzing student writing will
take descriptive rather than evaluative approaches. End-to-end systems may be able to deliver

Structural Features of Undergraduate Writing
Journal of Writing Analytics Vol. 2 | 2018 173
stock feedback to students. However, they will not be useful in the classroom without
interpretable features that can give insights to teachers about how their students are learning. As
discussed above, this study shows our features to be useful for analysis of large amounts of
writing data but does not indicate how successful they would be on a smaller scale. Future
research will be necessary in order to build features into systems that can give insight into the
writing of smaller groups of students or individuals. Earlier, we mentioned the potential to give
educators the ability to visualize trends across writing programs, but it could be even more useful
to give teachers the ability to visualize how the students in their classrooms are progressing.
8.2 Recommendations for a Second Stanford Study of Writing
It is very fortuitous that the original study created a dataset that lends itself to computational
approaches. However, in the course of working with the SSW, it becomes clear that it was
(naturally) not designed with modern computational approaches in mind. The following
recommendations may aid in future data collection:
● Labels should be defined for the participants more rigorously. Every student should have
the same idea of what fits into the Rough Draft category, etc.
● Labels should be less sparse (i.e., every student should provide their major, etc.).
● There should also be labels that indicate when two drafts of the same piece of writing
have been submitted. This way duplicate writing is known ahead of time.
● For computational purposes, it would be better to have more students participate and
fewer writing samples per student. While in a qualitative study, it is helpful to understand
every student on a deep personal level, in a quantitative study, the significance of the
results is limited by how many students participate.
Overall, a second, more computationally-minded study would allow us to gain more insights into
how students develop as writers and test more qualitative results from the field of education with
smaller margins of error. In addition, a new SSW would give us the chance to determine if and
how undergraduate students have changed as writers in the past decade at Sanford University.
Author Biography
Noah Arthurs is currently a master’s student in computer science at Stanford University,
specializing in artificial intelligence. He has spent the last several years tutoring undergraduates
in various writing and computer science classes. His research focuses on using computational
techniques to analyze and model the behavior of students and educators in various contexts,
including writing, writing feedback, test-taking, and test-grading.
Acknowledgements
This research would not have been possible without the support of Professors Andrea Lunsford
and Jenn Fishman who conducted the original Stanford Study of Writing and made it possible for
me to work with their magnificent dataset. In addition, many, many thanks to Dr. Chris Piech for

Arthurs
Journal of Writing Analytics Vol. 2 | 2018 174
his compassionate advising, and AJ Alvero for introducing me to the SSW and being a constant
source of encouragement. Finally, thanks to the editors and peer reviewers for The Journal of
Writing Analytics for helping me expand and refine this study.
References
6.2. Re - Regular Expression Operations. (2018, May 1). Retrieved from Python 3.6.5 Documentation:
https://docs.python.org/3/library/re.html
Aull, L. L., & Lancaster, Z. (2014). Linguistic markers of stance in early and advanced academic writing:
A corpus-based comparison. Written Communication, 31(2), 151–183. Retrieved from
https://journals.sagepub.com/doi/abs/10.1177/0741088314527055
Bird, S., & Loper, E. (2004). NLTK: The Natural Language Toolkit. In Proceedings of the ACL 2004 on
Interactive Poster and Demonstration Sessions (p. 31). Association for Computational Linguistics.
Retrieved from https://dl.acm.org/citation.cfm?id=1219075
Blei, D. M., Ng, A. Y., & Jordan, M. I. (2003). Latent Dirichlet Allocation. Journal of Machine Learning
Research 3, 993–1022. Retrieved from http://www.jmlr.org/papers/v3/blei03a.html
Chen, C.-F. E., & Cheng, W.-Y. E. (2008). Beyond the design of automated writing evaluation:
Pedagogical practices and perceived learning effectiveness in EFL writing classes. Retrieved from
https://scholarspace.manoa.hawaii.edu/bitstream/10125/44145/1/12_02_chencheng.pdf
Fishman, J., Lunsford, A. A., McGregor, B., & Otuteye, M. (2005). Performing writing, performing
literacy. College Composition and Communication, 57(2), 224–252. Retrieved from
https://www.jstor.org/stable/30037914
Griffiths, T. (2002). Gibbs sampling in the generative model of Latent Dirichlet Allocation. Retrieved
from http://citeseerx.ist.psu.edu/viewdoc/summary?doi=10.1.1.138.3760
Hays, D. G. (1964). Dependency theory: A formalism and some observations. Language, 40(4), 511–525.
Retrieved from https://www.jstor.org/stable/411934
Honnibal, M., & Johnson, M. (2015). An improved non-monotonic transition system for dependency
parsing. Proceedings of the 2015 Conference on Empirical Methods in Natural Language Processing
(pp. 1373–1378). Retrieved from http://www.aclweb.org/anthology/D15-1162
Hult, C. A. (1986). The computer and the inexperienced writer. Retrieved from
https://eric.ed.gov/?id=ED271772
Hyland, K. (1998). Persuasion and context: The pragmatics of academic metadiscourse. Journal of
Pragmatics, 30(4), 437–455. Retrieved from
http://www2.caes.hku.hk/kenhyland/files/2012/08/metadisc.jop_.pdf
Kumar, V., Fraser, S. N., & Boulanger, D. (2017). Discovering the predictive power of five baseline
writing competences. Journal of Writing Analytics, 1, 176–226. Retrieved from
https://journals.colostate.edu/analytics/article/view/107
Langdetect. (2018, May 1). Retrieved from PyPI: https://pypi.org/project/langdetect/
Lu, X. (2010). Automatic analysis of syntactic complexity in second language writing. International
Journal of Corpus Linguistics, 15(4), 474–496. Retrieved from
http://www.personal.psu.edu/faculty/x/x/xxl13/papers/Lu_inpress_ijcl.pdf
Lunsford, A. A. (2013). Our semi-literate youth? Not so fast. Stanford University. Retrieved from
https://ssw.stanford.edu/sites/default/files/OPED_Our_Semi-Literate_Youth.pdf
Structural Features of Undergraduate Writing
Journal of Writing Analytics Vol. 2 | 2018 175
Lunsford, A. A., Fishman, J., & Liew, W. M. (2013). College writing, identification, and the production
of intellectual property: Voices from the Stanford Study of Writing. College English, 75(5), 470–492.
Retrieved from https://www.jstor.org/stable/24238248
Lunsford, A. A., Stapleton, L., Fishman, J., Krampetz, E., Rogers, P. M., Diogenes, M., & Otuteye, M.
(2008). The Stanford Study of Writing. Stanford University. Retrieved from
https://ssw.stanford.edu/sites/default/files/Senate_report_February_2007.pdf
McCallum, A. K. (2002). Mallet: A machine learning for language toolkit. Retrieved from
http://mallet.cs.umass.edu/
Papadimitriou, C. H., Tamaki, H., Raghavan, P., & Vempala, S. (1998). Latent semantic indexing: A
probabilistic analysis. Proceedings of the Seventeenth ACM SIGACT-SIGMOD-SIGART Symposium
on Principles of Database Systems (pp. 159–168). ACM. Retrieved from
https://core.ac.uk/download/pdf/82505656.pdf
Resnik, P., Garron, A., & Resnik, R. (2013). Using topic modeling to improve prediction of neuroticism
and depression in college students. Proceedings of the 2013 Conference on Empirical Methods in
Natural Language Processing (pp. 1348–1353). Retrieved from
http://www.aclweb.org/anthology/D13-1133
Sagae, K., & Tsujii, J. I. (2008). Shift-reduce dependency DAG parsing. Proceedings of the 22nd
International Conference on Computational Linguistics-Volume 1 (pp. 753–760). Association for
Computational Linguistics. Retrieved from https://dl.acm.org/citation.cfm?id=1599176
SSW. (2018, 30 April). Retrieved from Stanford Study of Writing: https://ssw.stanford.edu/
Stab, C., & Gurevych, I. (2014). Identifying argumentative discourse structures in persuasive essays.
Proceedings of the 2014 Conference on Empirical Methods in Natural Language Processing
(EMNLP) (pp. 46–56). Retrieved from http://www.aclweb.org/anthology/D14-1006
Taghipour, K., & Ng, H. T. (2016). A neural approach to automated essay scoring. Proceedings of the
2016 Conference on Empirical Methods in Natural Language Processing, (pp. 1882–1891).
Retrieved from http://www.aclweb.org/anthology/D16-1193
The Hewlett Foundation. (2018, April 30). Short answer scoring. Retrieved from Kaggle:
https://www.kaggle.com/c/asap-sas
Wang, C., & Blei, D. M. (2011). Collaborative topic modeling for recommending scientific articles.
Proceedings of the 17th ACM SIGKDD International Conference on Knowledge Discovery and Data
Mining (pp. 448–456). ACM. Retrieved from https://dl.acm.org/citation.cfm?id=2020480
Weaver, M. R. (2006). Do students value feedback? Student perceptions of tutors’ written responses.
Assessment & Evaluation in Higher Education 31(3), 379–394. Retrieved from
https://www.tandfonline.com/doi/abs/10.1080/02602930500353061
Related Documents