Structural Condition Assessment of a Parking Deck using Ground Penetrating Radar by Garima Neupane Submitted in Partial Fulfillment of the Requirements for the Degree of Master of Science in Engineering in the Civil and Environmental Engineering Program YOUNGSTOWN STATE UNIVERSITY August, 2020

Welcome message from author
This document is posted to help you gain knowledge. Please leave a comment to let me know what you think about it! Share it to your friends and learn new things together.
Transcript
Structural Condition Assessment of a Parking Deck using Ground Penetrating Radar
by
Garima Neupane
Submitted in Partial Fulfillment of the Requirements
for the Degree of
Master of Science in Engineering
in the
Civil and Environmental Engineering Program
YOUNGSTOWN STATE UNIVERSITY
August, 2020
Structural Condition Assessment of a Parking Deck using Ground Penetrating Radar
Garima Neupane
I hereby release this thesis to the public. I understand that this thesis will be made available from the OhioLINK ETD Center and the Maag Library Circulation Desk for public access. I also authorize the University or other individuals to make copies of this thesis as needed for scholarly research. Signature: _______________________________________________________________ Garima Neupane, Student Date Approvals: _______________________________________________________________ Dr. AKM Anwarul Islam, P.E., Thesis Advisor Date _______________________________________________________________ Dr. Shakir Husain, P.E., Committee Member Date _______________________________________________________________ Dr. Richard A. Deschenes, Committee Member Date _______________________________________________________________ Dr. Salvatore A. Sanders, Dean of Graduate Studies Date
iii
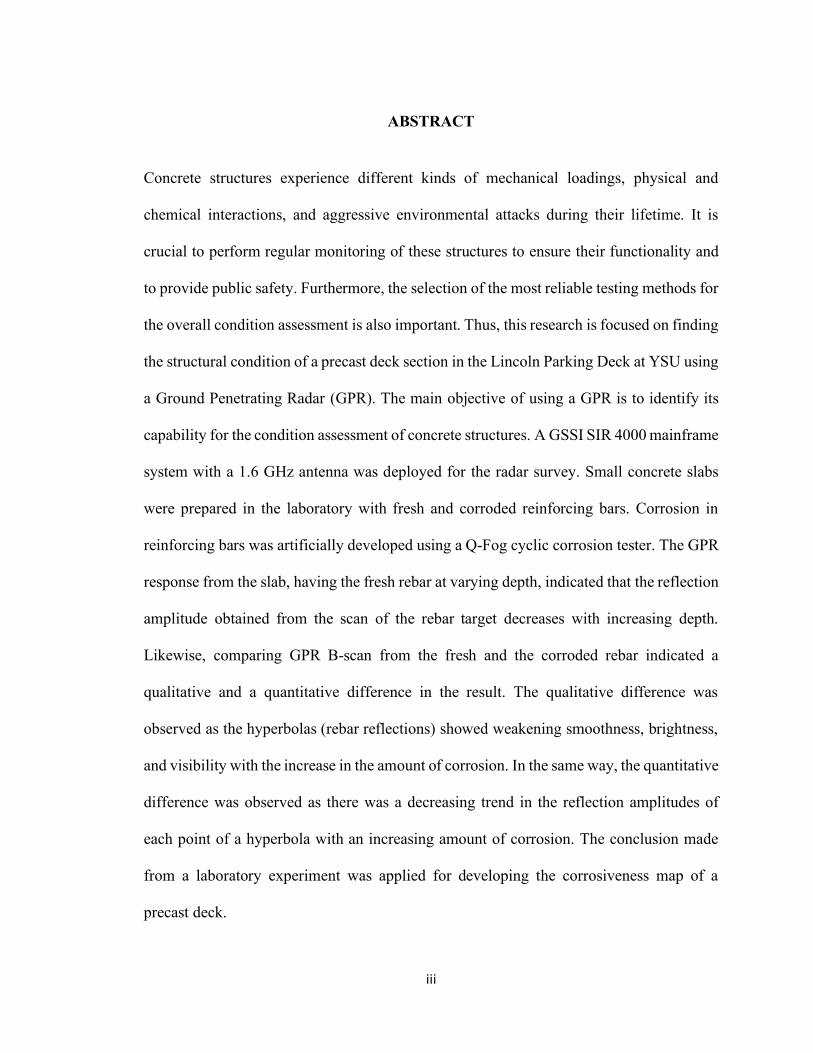
ABSTRACT Concrete structures experience different kinds of mechanical loadings, physical and
chemical interactions, and aggressive environmental attacks during their lifetime. It is
crucial to perform regular monitoring of these structures to ensure their functionality and
to provide public safety. Furthermore, the selection of the most reliable testing methods for
the overall condition assessment is also important. Thus, this research is focused on finding
the structural condition of a precast deck section in the Lincoln Parking Deck at YSU using
a Ground Penetrating Radar (GPR). The main objective of using a GPR is to identify its
capability for the condition assessment of concrete structures. A GSSI SIR 4000 mainframe
system with a 1.6 GHz antenna was deployed for the radar survey. Small concrete slabs
were prepared in the laboratory with fresh and corroded reinforcing bars. Corrosion in
reinforcing bars was artificially developed using a Q-Fog cyclic corrosion tester. The GPR
response from the slab, having the fresh rebar at varying depth, indicated that the reflection
amplitude obtained from the scan of the rebar target decreases with increasing depth.
Likewise, comparing GPR B-scan from the fresh and the corroded rebar indicated a
qualitative and a quantitative difference in the result. The qualitative difference was
observed as the hyperbolas (rebar reflections) showed weakening smoothness, brightness,
and visibility with the increase in the amount of corrosion. In the same way, the quantitative
difference was observed as there was a decreasing trend in the reflection amplitudes of
each point of a hyperbola with an increasing amount of corrosion. The conclusion made
from a laboratory experiment was applied for developing the corrosiveness map of a
precast deck.
iv
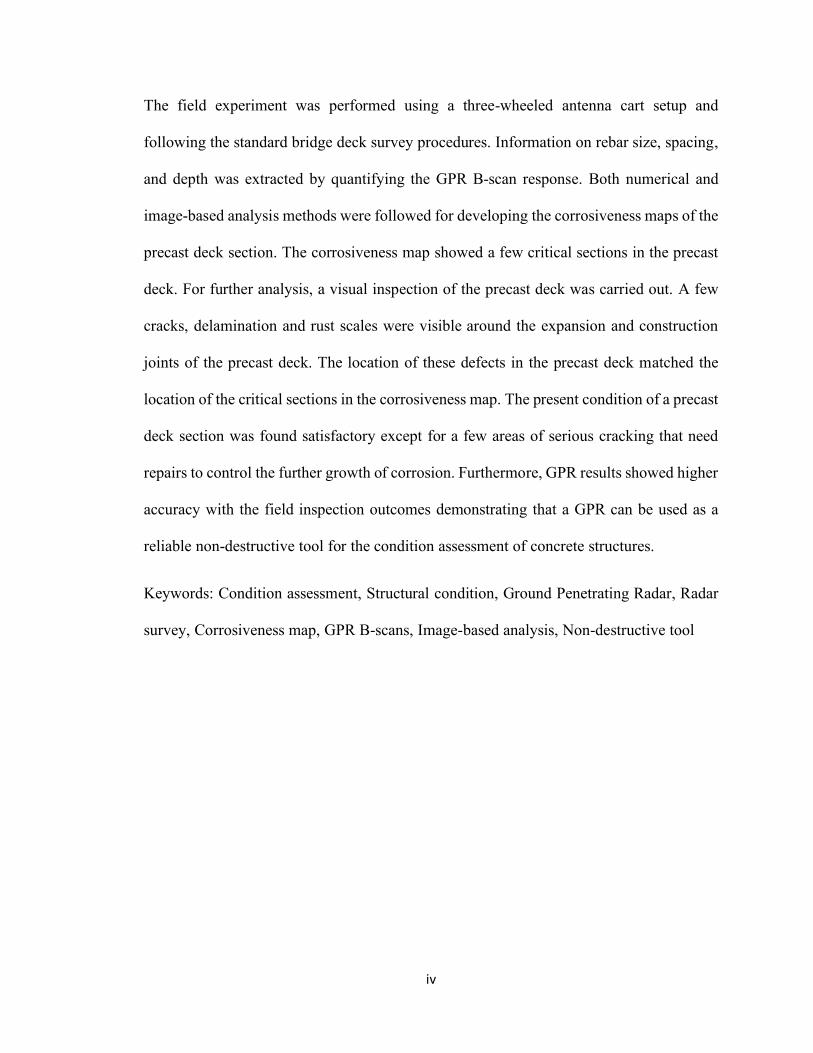
The field experiment was performed using a three-wheeled antenna cart setup and
following the standard bridge deck survey procedures. Information on rebar size, spacing,
and depth was extracted by quantifying the GPR B-scan response. Both numerical and
image-based analysis methods were followed for developing the corrosiveness maps of the
precast deck section. The corrosiveness map showed a few critical sections in the precast
deck. For further analysis, a visual inspection of the precast deck was carried out. A few
cracks, delamination and rust scales were visible around the expansion and construction
joints of the precast deck. The location of these defects in the precast deck matched the
location of the critical sections in the corrosiveness map. The present condition of a precast
deck section was found satisfactory except for a few areas of serious cracking that need
repairs to control the further growth of corrosion. Furthermore, GPR results showed higher
accuracy with the field inspection outcomes demonstrating that a GPR can be used as a
reliable non-destructive tool for the condition assessment of concrete structures.
Keywords: Condition assessment, Structural condition, Ground Penetrating Radar, Radar
survey, Corrosiveness map, GPR B-scans, Image-based analysis, Non-destructive tool
v
ACKNOWLEDGEMENT
I would like to thank my advisor, Dr. AKM Anwarul Islam, for his invaluable guidance
and precious advice during this research. His support has been very useful for the proper
direction to my research. I would also like to thank my thesis committee members, Dr.
Shakir Husain and Dr. Richard A. Deschenes, for their valuable time and feedback.
I am very thankful to Youngstown State University for believing in my potential and
awarding me with a graduate assistant position. I also want to thank all the faculty and staff
members in the Department. I am grateful to Dr. Holly Martin for guiding me in the
Chemistry Lab. I appreciate the time she spent for my research. I also want to thank all my
friends in Youngstown, who were around me for these two years.
Finally, I want to thank my loving and supporting husband for motivating me to gain the
patience throughout my research. Words are insufficient to describe my indebtedness to
my parents, whose love and guidance helped me move forward in my life. Last but not the
least, I would like to thank my brother, who has been a role model and a source of
encouragement throughout my life.
vi
TABLE OF CONTENTS
ABSTRACT .................................................................................................................. iii
ACKNOWLEDGEMENT ...............................................................................................v
LIST OF FIGURES ....................................................................................................... ix
LIST OF TABLES ........................................................................................................ xi
LIST OF ABBREVIATIONS ....................................................................................... xii
Chapter 1 Introduction .....................................................................................................1
1.1 General Overview ..................................................................................................1
1.2 Problem Statement .................................................................................................2
1.3 Research Objectives ...............................................................................................3
1.4 Literature Reviews .................................................................................................4
Chapter 2 Ground Penetrating Radar Imaging Technique.................................................8
2.1 Introduction ............................................................................................................8
2.2 Fundamental Principles of GPR ..............................................................................8
2.3 Data Acquisition Techniques and Types of Image Acquired ................................. 12
2.4 GPR Image........................................................................................................... 13
2.4.1 A-Scan (one-dimensional trace) ..................................................................... 13
2.4.2 B-Scan (two-dimensional cross-section) ........................................................ 13
2.4.3 C-Scan (three-dimensional profiles) ............................................................... 14
2.5 GPR Data Processing ........................................................................................... 15
vii
Chapter 3 Laboratory Experiments ................................................................................ 17
3.1 Materials and Methods ......................................................................................... 18
3.1.1 Rebar and Q-Fog ........................................................................................... 19
3.1.2 Scanning Equipment and Initial Setup ............................................................ 21
3.1.3 Concrete Slabs ............................................................................................... 22
3.1.4 GPR Scan ...................................................................................................... 23
3.1.5 Data Processing ............................................................................................. 24
Chapter 4 Field Experiments .......................................................................................... 26
4.1 Site ....................................................................................................................... 26
4.2 Data Collection .................................................................................................... 29
4.2.1 Survey Area Design ....................................................................................... 30
4.2.2 Equipment and Initial Setup ........................................................................... 30
4.2.3 Performing the Survey ................................................................................... 32
4.3 Data Processing .................................................................................................... 32
4.3.1 Batching of the File........................................................................................ 32
4.3.2 Time Zero Correction .................................................................................... 33
4.3.3 Migration ....................................................................................................... 33
4.4 Analysis and Calculations .................................................................................... 33
4.4.1 Rebar Depth ................................................................................................... 33
4.4.2 Creating a 3D File .......................................................................................... 34
viii
4.4.3 Rebar Spacing ................................................................................................ 34
4.4.4 Rebar Diameter .............................................................................................. 35
4.4.5 Numerical Based Analysis of GPR Scans ....................................................... 35
4.4.6 Image-Based Analysis of GPR Scans ............................................................. 36
4.4.7 Color-Coded Map .......................................................................................... 38
Chapter 5 Results and Discussions ................................................................................. 39
5.1 Results from Laboratory Study ............................................................................. 39
5.1.1 Comparison of GPR Average Estimates with Design Values .......................... 39
5.1.2 Effect of Varying Rebar Depth on Reflection Amplitude ............................... 39
5.1.3 Radar Scanned Image Comparison of Fresh and Rusty Rebar Reflection ....... 41
5.1.4 Quantitative Comparison ............................................................................... 42
5.2 Results from Field Experiments ............................................................................ 45
5.2.1 Rebar Size, Depth, and Spacing ..................................................................... 45
5.2.2 Corrosiveness Map of a Parking Deck............................................................ 47
5.2.3 Field Inspections Images ................................................................................ 51
Chapter 6 Conclusions and Recommendations ............................................................... 54
6.1 Conclusions .......................................................................................................... 54
6.2 Recommendations ................................................................................................ 54
REFERENCES .............................................................................................................. 57
ix
LIST OF FIGURES
Figure 2-1: Antenna setup (GSSI Concrete Handbook, 2017). .........................................9
Figure 2- 2: Typical example of the GPR two-dimensional image showing rebar
reflection (hyperbola), rebar peak and boundary reflection. ............................................ 11
Figure 2-3: B-scan image or radargram. ......................................................................... 14
Figure 2-4: GPR C-scan or 3D image. ........................................................................... 14
Figure 3- 1: Flowchart of laboratory experiments........................................................... 18
Figure 3-2: Reinforcing bar cleaned using sandpaper. .................................................... 19
Figure 3-3: Rebar sample in a Q-FOG machine: (a) after fog function is applied in the
chamber; (b) after dry off function is applied in the chamber. ........................................ 20
Figure 3- 4: GPR setup for the lab measurement. ........................................................... 21
Figure 3-5: Laboratory small scale slab (Type 1, fresh rebar): (a) Plan; and (b) Elevation.
...................................................................................................................................... 23
Figure 3-6: Laboratory small scale slab (Type 2, fresh rebar): (a) Plan; and (b) Elevation.
...................................................................................................................................... 23
Figure 3-7: Performing GPR scan. ................................................................................. 24
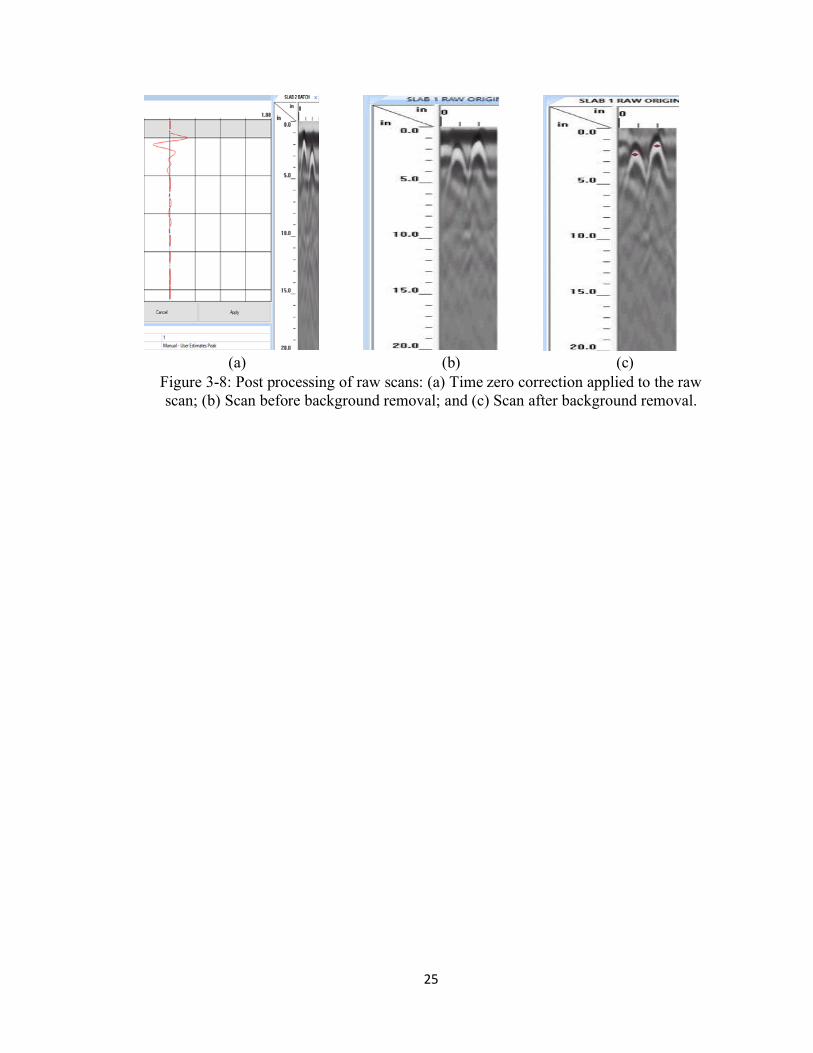
Figure 3-8: Post processing of raw scans: (a) Time zero correction applied to the raw
scan; (b) Scan before background removal; and (c) Scan after background removal. ...... 25
Figure 4- 1: A typical double T-Beam in the Lincoln Parking Deck. .............................. 27
Figure 4- 2: Floor plan of a Lincoln Parking Deck where region represented by a circle is
the survey location: (a) Third Level; and (b) Fourth Level. ............................................ 28
Figure 4- 3: Flowchart of field experiments. .................................................................. 29
Figure 4- 4: Survey grid prepared in Level 3C. .............................................................. 30
x
Figure 4- 5: GPR setup for the field measurement. ......................................................... 31
Figure 4- 6: Locating peak of the target in 2D scans (B-scans). ...................................... 34
Figure 5-1: Average reflection amplitude versus rebar depth. ......................................... 40
Figure 5- 2: Hyperbolic reflection from rebar in slab: (a) Radar scan from fresh rebar; and
(b) Radar scans from rusty rebar. ................................................................................... 41
Figure 5-3: Reflection amplitudes versus depth of five hyperbolic points. ...................... 43
Figure 5-4: Reflection amplitudes versus depth of five hyperbolic points. ...................... 44
Figure 5-5: Numerical or amplitude-based corrosiveness map: (a) Level 3C; and (b)
Level 4C. ....................................................................................................................... 48
Figure 5-6: Image-based corrosiveness map: (a) Level 3C and (b) Level 4C. ................. 49
Figure 5-7: Field inspection images and its corresponding location in image-based
corrosiveness map (Level 4C). ....................................................................................... 51
Figure 5-8: Field inspection images and its corresponding location in image-based
corrosiveness map (Level 3C). ....................................................................................... 52
xi
LIST OF TABLES
Table 2-1: Dielectric constant and reflection strength for different boundary interfaces
(GSSI Concrete Handbook, 2017) .................................................................................. 11
Table 4-1: Typical definition of various conditions using GPR-IBA (Abouhamad et al.,
2017) ............................................................................................................................. 37
Table 5-1: GPR estimates versus actual values ............................................................... 39
Table 5-2: Target picks amplitudes versus rebar depth for Type 1 slab ........................... 40
Table 5-3: Target picks amplitudes versus rebar depth for Type 2 slab ........................... 40
Table 5-4: Reflection amplitude on five points of hyperbola of fresh rebar .................... 42
Table 5-5: Reflection amplitude on five points of hyperbola of rusty rebar (6 days in Q-
Fog) ............................................................................................................................... 43
Table 5-6: Reflection amplitude on five points of hyperbola of rusty rebar (12 days in Q-
Fog) ............................................................................................................................... 43
Table 5-7: Concrete cover of top rebars ......................................................................... 45
Table 5-8: Spacing between the top bars ........................................................................ 46
xii
LIST OF ABBREVIATIONS
GPR Ground Penetrating Radar
GSSI Geophysical Survey Systems, Inc.
NDT Non-Destructive Techniques
GPR-IBA Ground Penetrating Radar-Image-Based Analysis
BCA Bridge Condition Assessment
EM Electromagnetic
CSV Comma-Separated Values
NDE Non-Destructive Evaluation
ASTM American Society for Testing and Materials
ACI American Concrete Institute
TWTT Two-Way Travel Time
1
Chapter 1 Introduction
1.1 General Overview
Concrete structures suffer from various types of deterioration during their lifetime that
tends to damage their integrity and service life. The deterioration in concrete structures is
due to the effect of several chemical and physical phenomena such as sulphate attack,
delayed ettringite formation (DEF), alkali-silica reaction (ASR), shrinkage, freeze-thaw
cycles, and fatigue (Cusatis et al., 2015). Continuous exposure to these types of
phenomenon causes cracking in concrete, which later provides a favorable environment for
developing corrosion in the reinforcing steel leading to a loss in its strength. Other
activities, such as exposure of structures to seismic vibration, heavy load, and mechanical
vibration, can lower its ultimate load carrying capacity. These effects can have a significant
impact on reducing the overall service life of the structure. It is important to protect critical
infrastructure, such as bridges, dams, and roads, to meet the demand due to the current
economic growth in the nation. Among the nation’s bridges, nine percent were structurally
deficient in 2016, and there were on average 188 million trips over a structurally deficient
bridge each day (ASCE, 2017). A total of 18 billion dollars was spent in the repair and
rehabilitation of bridges in 2010. The repair and rehabilitation cost goes on increasing with
the decreased structural condition. It is estimated by ASCE that there must be an increase
in the U.S. gross domestic product (GDP) from 2.5 to 3.5 percent by 2025 to meet the costs
required for the repair and maintenance of infrastructure systems. Continuous monitoring
of structures and immediate response to any damage is essential to minimize the cost
required for the repair and rehabilitation of our surface infrastructure. For condition
monitoring, there is a need for appropriate assessment techniques that can provide
2
sufficient information on the present status of a structure. Therefore, structural condition
assessment is important for finding the existing information and predicting future
performance, providing an immediate response to any damages and to limit the expenses
in maintenance and rehabilitation.
The condition assessment of a structure using a GPR is performed by a numerical based
method (study based on the extracted amplitude values) and image-based method (study
based on the reflection images gained from the survey). The GPR setup for the data
collection comprises the system mainframe (control unit), antenna, and survey cart. For the
data collection, the antenna of the system should be dragged perpendicular to the rebar
target inside the surface. The response from the rebar target appears as the U or V-shaped
hyperbola in the resultant two-dimensional radar image. The radar response is analyzed in
two distinct ways, one is by studying the reflection amplitudes of the hyperbolas and
another is by interpreting the visual images of the two-dimensional radar response.
1.2 Problem Statement
The visual inspection (VI) is one of the traditional methods of non-destructive evaluation
of structures. Although the visual inspection method works best for finding the visible
surface defects, it may not be reliable for predicting the subsurface defects such as
corrosion, voids, cracks, chloride ingression, and delamination (Abouhamad et al., 2017).
Predicting internal damage through visual inspection would be an arbitrary estimate. The
study conducted by Federal Highway Administration (FHWA) to evaluate the reliabilities
of visual inspection for highway bridges has shown greater inconsistencies over the
discrete range of condition ratings obtained from the visual inspection result (FHWA,
2001). Various destructive tests are also used to determine the current state of structures.
3
Destructive tests are performed by introducing physical damages to the test structure that
could affect its overall performance and strength. These tests cannot be used widely
because of its high cost and damage to the structure. Intending to expand assessment
techniques, civil engineering industries and researchers have come up with different non-
destructive evaluation techniques, which include but not limited to half-cell potential
(HCP), impact echo, pulse-echo, chain drag, infrared thermography, and Ground
Penetrating Radar (GPR) (Abouhamad et al., 2017). The bridge deck inspection using
traditional techniques such as hammer sounding and chain dragging depends on the
capacity of the operator to distinguish the good and bad areas of concrete by understanding
the acoustic feedback (Parrillo et al., 2006). These techniques can be labor demanding and
time consuming for the inspection of large areas of concrete. Therefore, using a robust and
reliable technique for the assessment of an existing building without impairing its integrity
is crucial.
1.3 Research Objectives
The condition assessment is the key to finding structural health. It is crucial to perform
regular monitoring and assessment to track any changes in the functionality of the structure.
This provides an early warning sign of any serious damage to the structure and thus ensures
public safety.
The purpose of this study is to perform a non-destructive assessment using GPR and find
the present structural condition of a parking deck. The condition assessment of structures
using GPR is not a new concept; however, using the appropriate method for data
interpretation and validation is always a challenge. This research will focus on finding the
condition of the prestressed double T-beam deck. The structural condition assessment of
4
this prestressed deck will be performed using the GPR set up in a three-wheeled cart. This
research will compare the qualitative and quantitative GPR response from fresh and rusted
rebar inside a small-scale concrete slab. The difference in response from fresh and rusty
rebar will be analyzed for reading and interpreting the radar scan of the parking deck.
1.4 Literature Reviews
Different techniques have been used for the Bridge Condition Assessment (BCA) to date.
Many countries have developed the basic guidelines for the assessment of existing bridges
(Omar, 2018). The comprehensive literature review by Omar (2018) stated that BCA
techniques can be classified into one (or a combination) of five categories including visual
inspection (VI) for finding the apparent condition, load testing (LT) techniques for
estimating safe loading levels, NDT technologies for detecting deterioration indicators,
structural health monitoring (SHM) systems for sensing structural performance, and finite
element modeling (FEM) for numerically predicting bridge reliability.
Application of radar for bridge deck condition assessment started in the late 1970s.
However, the utilization of advanced tools and processing methods only started a few
decades later. Maine Department of Transportation in a collaboration with Geophysical
Survey System (GSSI) used the Bridge Scan GPR system on April 13, 2005, to evaluate
the condition of the asphalt overlaid bridge deck located in Lewiston, Maine. The
conclusion achieved from the analysis of the GPR data was useful to Maine DOT for
conducting the repair work of the surveyed areas (Parrillo et al., 2006). Bridge deck
monitoring and assessment using GPR were performed by Alani et al. (2013) on two major
bridges in the United Kingdom. Deteriorated areas were seen in 3D images, which
corresponded to the signal attenuation in radargram (2D image). The result from the
5
excavation confirmed that the deteriorated areas in the 3D images were due to the presence
of moisture that has penetrated below the upper rebar layer. Two-dimensional image data
of the second bridge also showed the high signal attenuation, which was similar to the
previous bridge inspected. It was found that the presence of numerous micro-cracks on the
surface and the lower areas of the bridge deck have led to the ingression of moisture. Thus,
it was concluded that moisture ingress and delamination of the bridge deck was the reason
behind the attenuation of the signal in radargram. This study also provides the idea of using
the knowledge and conclusion drawn from one experiment to another experiment (Alani et
al., 2013). Dinh et al. (2015) employed the attenuation-based methodology for the
condition assessment of the two bare concrete bridge decks. The condition map prepared
in this study resembles the resultant condition map prepared from other technologies,
which demonstrates that this method can assess the attenuation of GPR data. For automatic
localization and detection of rebar from GPR data, a novel method has been developed by
Dinh et al. (2018). The application of the developed algorithm on the GPR data from
surveys of twenty-six bridge decks indicated excellent performance with an overall
accuracy of detection of 99.60% ± 0.85% (Dinh et al., 2018). Machine learning techniques
have been applied by Imani et al. (2019) for a comprehensive full-depth evaluation of
concrete bridge decks. The implementation of machine learning and a vast library of GPR
data not only provide a full-depth assessment of concrete bridge decks but also avoid the
need for collecting the reflections from the bottom of the deck. Novel approaches, such as
machine learning, deep convolution neural network (CNN) could be beneficial for many
bridge engineers and bridge owners for the full condition assessment; however, specialists
of respective fields are required to execute these methods correctly.
6
Many researchers have employed GPR for the detection of corroded regions in the bridge
deck. Investigation on detecting corrosion in the bridge deck using GPR was carried out
by researchers Kim et al. (2003). A bridge deck map was plotted for three different methods
(two-way travel times (TWTT) of the top of the upper rebar layer, amplitude of the top
rebar layer and visual inspection of radar data) of deterioration modeling. The application
of these different methods for developing a bridge deck corrosiveness map concluded that
GPR can be successfully implemented to identify and plot zones of relatively high
dielectric constant (low EM velocity) and high attenuation. Also, it was verified from other
methods that these zones of high dielectric constant and high attenuation are usually
delaminated areas characterized by high moisture content and chloride ion concentration.
Another experiment by Dinh et al. (2013) on GPR image analysis for corrosiveness
mapping has explained the potential implementation of visual analysis of GPR profiles to
interpret and map the condition of concrete slabs. The result from a GPR-image based
analysis (GPR-IBA) of an underground parking garage has shown a significant correlation
with the destructive test taken from the same site. Among various types of deterioration,
radar is the most sensitive to the degree of rebar corrosion, which correlates well with the
chloride concentration in cores (Dinh et al., 2013). Thus, the experiment showed the
reliability of a GPR on corrosion detection than on delamination. Abouhamad et al. (2017)
carried out two case studies to establish a systematic image-based analysis for
corrosiveness mapping of bridge decks. The analysis of the first case study (Bridge A)
showed that the numerical analysis could not cover all radargram responses because of
chaotic reflections. There was a correlation between the corrosiveness map obtained from
the image-based analysis (IBA) method and actual defects observed through field
7
inspections. On the other hand, the case was not similar for the numerical analysis-based
corrosiveness map. Zaki et al. (2018) investigated the GPR response from corroded rebar
embedded in a concrete slab and summarized the response obtained. The GPR response
from the corroded rebar had lower reflection amplitude and larger travel times of the waves.
Similarly, the radar image obtained from the corroded rebar distinctly featured blurring and
dimming rebar image (hyperbola).
8
Chapter 2 Ground Penetrating Radar Imaging Technique
2.1 Introduction
Among the different non-destructive techniques used for the preliminary inspection,
Ground Penetrating Radar (GPR) imaging technique is considered a reliable option as it
can produce 2D and 3D images of the hidden features easily and has a wide range of the
application. A GPR is used to find the location and size of the metal target in concrete.
The penetration of the GPR signal depends on the electrical conductivity of the target and
thus the image produced is sensitive to defects, such as moisture content, air voids present
in concrete, etc. A GPR scanned image can be processed in the software called RADAN
(RADAN 7, 2015) to obtain the qualitative result in terms of the scanned image and the
quantitative result in terms of the reflection amplitudes from the target. Both results will
help develop the color-coded map, which shows the range from good, moderate to severe
condition of rebar in concrete. A GPR scan obtained from good rebar is different from the
deteriorated one as rebar in good condition reflects the perfect shape bright hyperbolas
while the latter does not. The weak signal in the GPR image may result due to many
anomalies present in concrete surfaces. The visual inspection can assist in the better
interpretation of a GPR image. These results obtained from the GPR can be validated using
other methods of non-destructive testing and destructive testing according to the need.
2.2 Fundamental Principles of GPR
A GPR is a non-destructive tool that radiates the electromagnetic (EM) energy into the
subsurface to scan the embedded target features. The EM wave is emitted from the antenna
of the GPR system. The antenna housing contains of two components, one of which
9
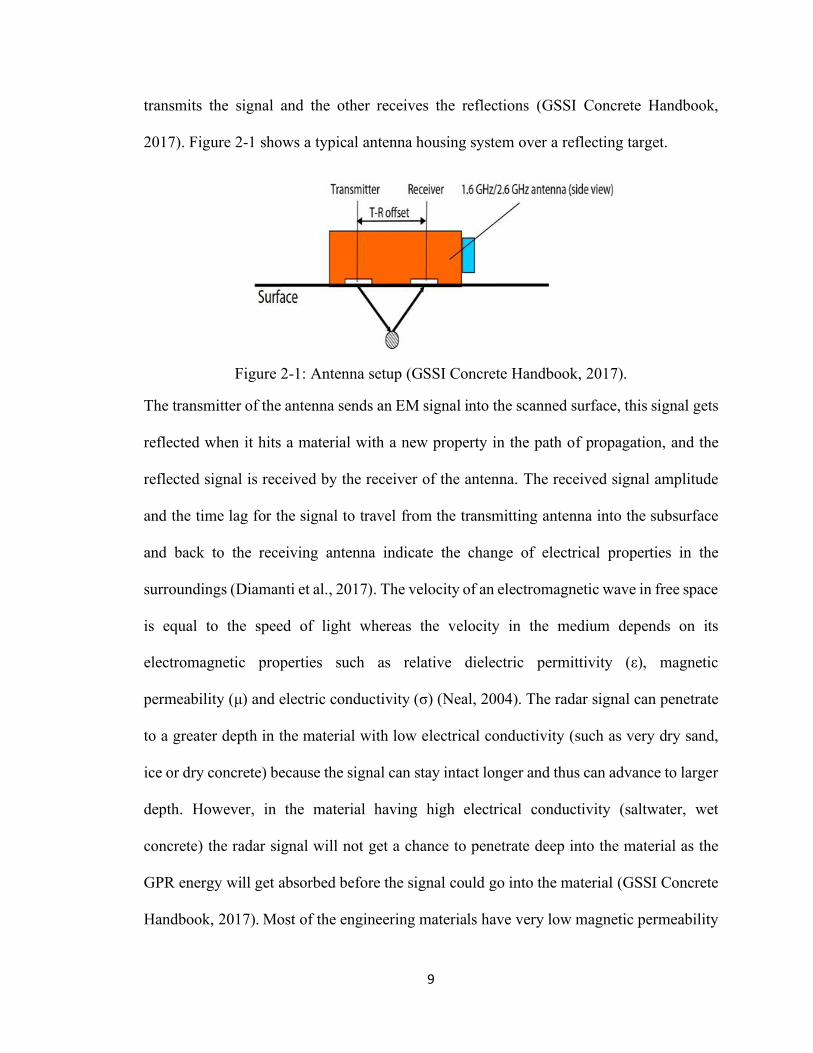
transmits the signal and the other receives the reflections (GSSI Concrete Handbook,
2017). Figure 2-1 shows a typical antenna housing system over a reflecting target.
Figure 2-1: Antenna setup (GSSI Concrete Handbook, 2017).
The transmitter of the antenna sends an EM signal into the scanned surface, this signal gets
reflected when it hits a material with a new property in the path of propagation, and the
reflected signal is received by the receiver of the antenna. The received signal amplitude
and the time lag for the signal to travel from the transmitting antenna into the subsurface
and back to the receiving antenna indicate the change of electrical properties in the
surroundings (Diamanti et al., 2017). The velocity of an electromagnetic wave in free space
is equal to the speed of light whereas the velocity in the medium depends on its
electromagnetic properties such as relative dielectric permittivity (ε), magnetic
permeability (μ) and electric conductivity (σ) (Neal, 2004). The radar signal can penetrate
to a greater depth in the material with low electrical conductivity (such as very dry sand,
ice or dry concrete) because the signal can stay intact longer and thus can advance to larger
depth. However, in the material having high electrical conductivity (saltwater, wet
concrete) the radar signal will not get a chance to penetrate deep into the material as the
GPR energy will get absorbed before the signal could go into the material (GSSI Concrete
Handbook, 2017). Most of the engineering materials have very low magnetic permeability
10
(μ) (Hasan, 2015). The other property of interest is relative permittivity or dielectric
constant (ε). Dielectric constant provides an idea about the speed of radar energy through
a material (GSSI Concrete Handbook, 2017). The velocity of the radar wave in a medium
is inversely proportional to its dielectric constant. The radar wave travels at the speed of
light in the air (ε= 1), whereas it travels at about 1/9 the speed of light in water (ε= 81).
The presence of water in any material results in an increase of its dielectric constant, which
slows down the radar speed.
When the antenna is moved perpendicular to a target, an inverted U or V shape hyperbola
is obtained in the resulting image. This response is because of the wide cone shape of the
radiated antenna beam, which allows the radar to see the target when top of it as well as
before and after its position (GSSI Concrete Handbook, 2017). Similarly, a reflection is
produced when an EM wave travels from the interfaces of two boundaries having a sharp
difference in dielectric constants. Likewise, for the bottom of the concrete slab to be visible
in the scanned image, there must be a contrasting underlying material. The slab bottom is
easily visible when contrasting materials, such as air, water or metal, is present under the
slab, whereas it may be hard to see or even invisible when the material with similar
dielectric constants, such as sand or other concrete structures lies underneath the slab. In
addition, the higher the difference in electrical conductivity between two boundaries, the
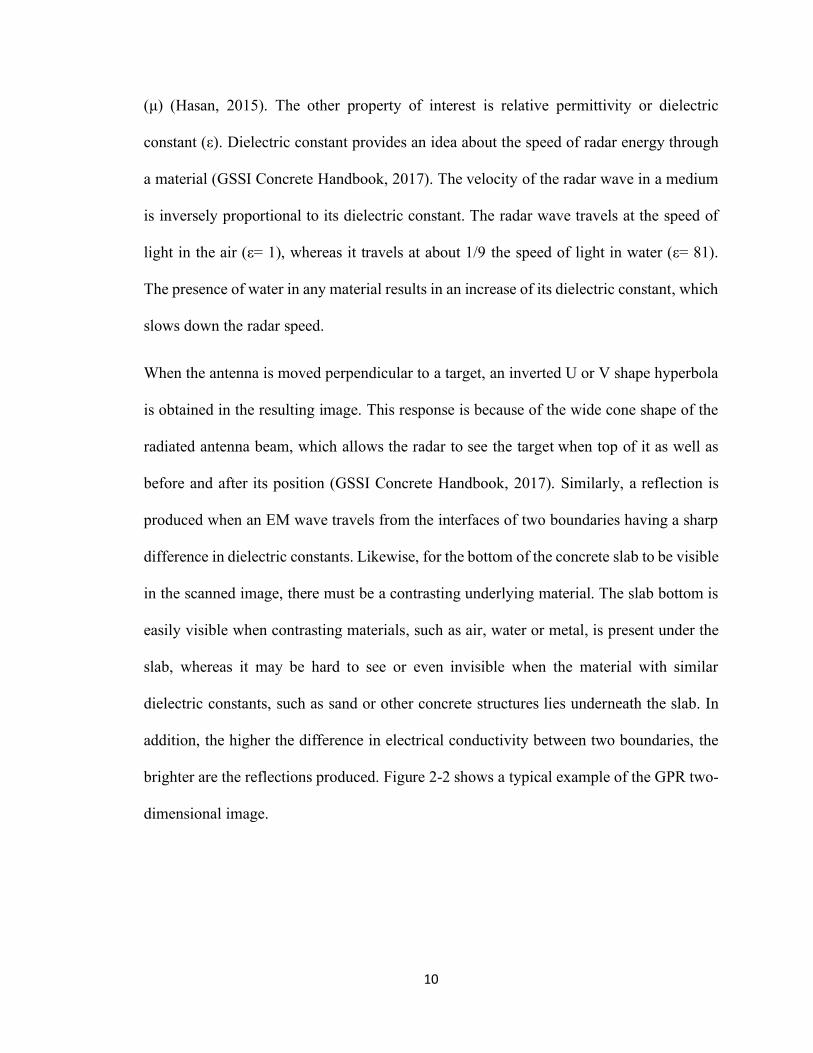
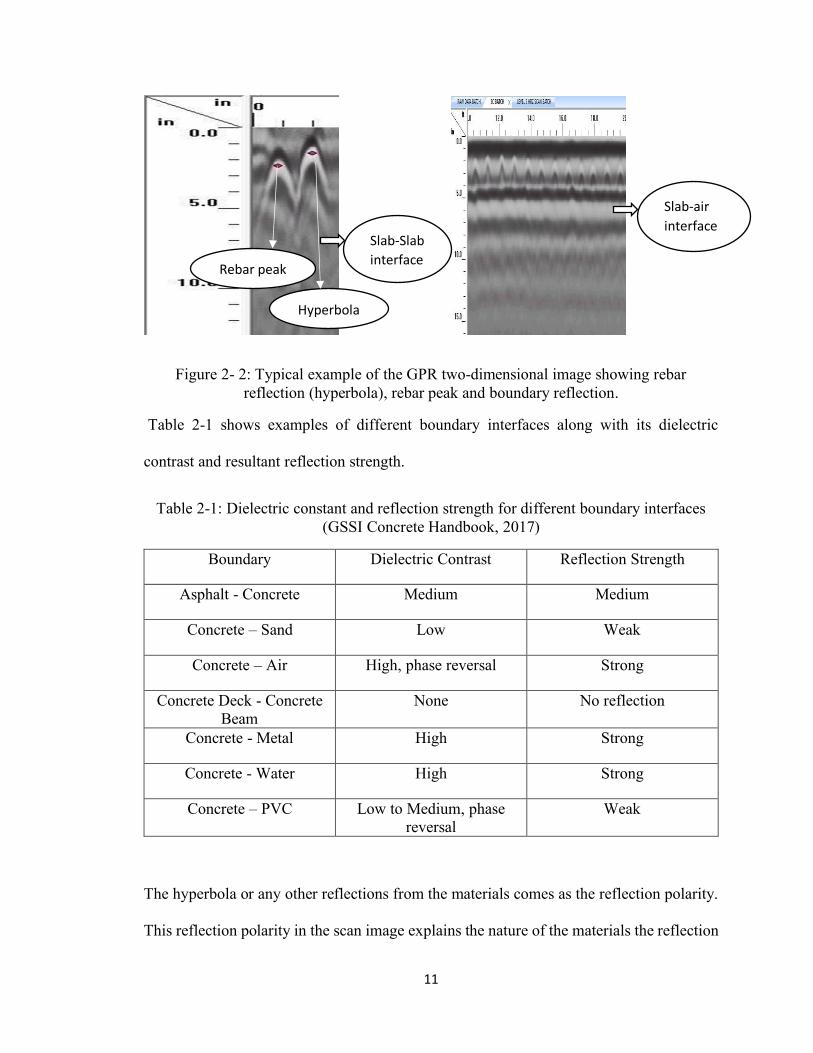
brighter are the reflections produced. Figure 2-2 shows a typical example of the GPR two-
dimensional image.
11
Figure 2- 2: Typical example of the GPR two-dimensional image showing rebar reflection (hyperbola), rebar peak and boundary reflection.
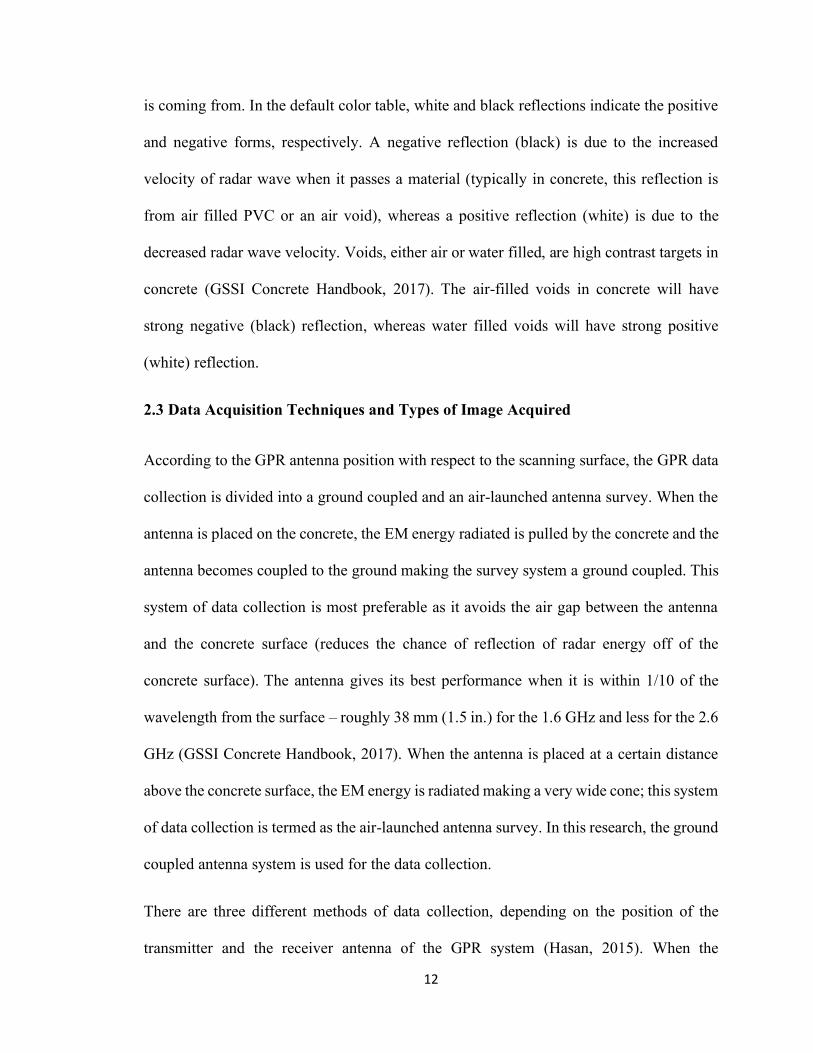
Table 2-1 shows examples of different boundary interfaces along with its dielectric
contrast and resultant reflection strength.
Table 2-1: Dielectric constant and reflection strength for different boundary interfaces (GSSI Concrete Handbook, 2017)
Boundary Dielectric Contrast Reflection Strength
Asphalt - Concrete Medium Medium
Concrete – Sand Low Weak
Concrete – Air High, phase reversal Strong
Concrete Deck - Concrete Beam
None No reflection
Concrete - Metal High Strong
Concrete - Water High Strong
Concrete – PVC Low to Medium, phase reversal
Weak
The hyperbola or any other reflections from the materials comes as the reflection polarity.
This reflection polarity in the scan image explains the nature of the materials the reflection
Hyperbola
Rebar peak
Slab-Slab
interface
Slab-air
interface
12
is coming from. In the default color table, white and black reflections indicate the positive
and negative forms, respectively. A negative reflection (black) is due to the increased
velocity of radar wave when it passes a material (typically in concrete, this reflection is
from air filled PVC or an air void), whereas a positive reflection (white) is due to the
decreased radar wave velocity. Voids, either air or water filled, are high contrast targets in
concrete (GSSI Concrete Handbook, 2017). The air-filled voids in concrete will have
strong negative (black) reflection, whereas water filled voids will have strong positive
(white) reflection.
2.3 Data Acquisition Techniques and Types of Image Acquired
According to the GPR antenna position with respect to the scanning surface, the GPR data
collection is divided into a ground coupled and an air-launched antenna survey. When the
antenna is placed on the concrete, the EM energy radiated is pulled by the concrete and the
antenna becomes coupled to the ground making the survey system a ground coupled. This
system of data collection is most preferable as it avoids the air gap between the antenna
and the concrete surface (reduces the chance of reflection of radar energy off of the
concrete surface). The antenna gives its best performance when it is within 1/10 of the
wavelength from the surface – roughly 38 mm (1.5 in.) for the 1.6 GHz and less for the 2.6
GHz (GSSI Concrete Handbook, 2017). When the antenna is placed at a certain distance
above the concrete surface, the EM energy is radiated making a very wide cone; this system
of data collection is termed as the air-launched antenna survey. In this research, the ground
coupled antenna system is used for the data collection.
There are three different methods of data collection, depending on the position of the
transmitter and the receiver antenna of the GPR system (Hasan, 2015). When the
13
transmitter and receiver of the antenna system are moved together along the scanning
surface, the method is defined as the common offset method. If the transmitter and receiver
are moved along the opposite direction at the same distance rate by targeting a particular
mid-point object in the subsurface, the method is known as the common mid-point
reflection. Likewise, in the third method, the receiver of the antenna is moved by keeping
the transmitter on the same position and recording the data for each position of the receiver
antenna. This method of varying the receiver is called a wide-angle reflection-refraction
method. The common offset method is followed for the GPR survey in this research.
2.4 GPR Image
The image obtained from the GPR survey is not the exact picture of the subsurface area
but is the radar scan that depends upon the size, shape and the electrical properties of the
target. There are three ways of presenting the output of a GPR scan, which are described
below.
2.4.1 A-Scan (one-dimensional trace)
The result of the point measurement, which is presented as the plot between the intensity
of reflections in the Y-axis and the time travel in the X-axis is known as the A-scan of GPR
image. The time travel in the X-axis can also be converted to a depth scale if the velocity
of the propagation of the EM wave in the material is known.
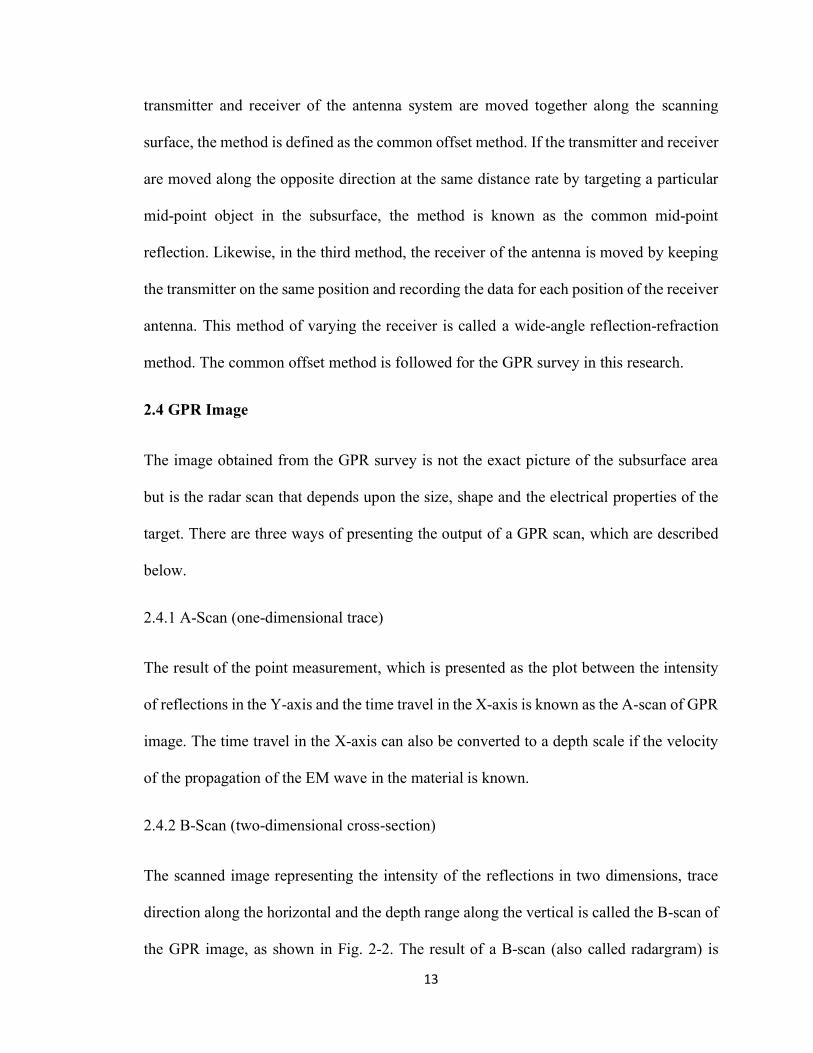
2.4.2 B-Scan (two-dimensional cross-section)
The scanned image representing the intensity of the reflections in two dimensions, trace
direction along the horizontal and the depth range along the vertical is called the B-scan of
the GPR image, as shown in Fig. 2-2. The result of a B-scan (also called radargram) is
14
equivalent to a slice perpendicular through the plane in trace direction (Topczewski, 2007).
B-scans are used in the most of the application of a GPR in assessing the structural
condition.
Figure 2-3: B-scan image or radargram.
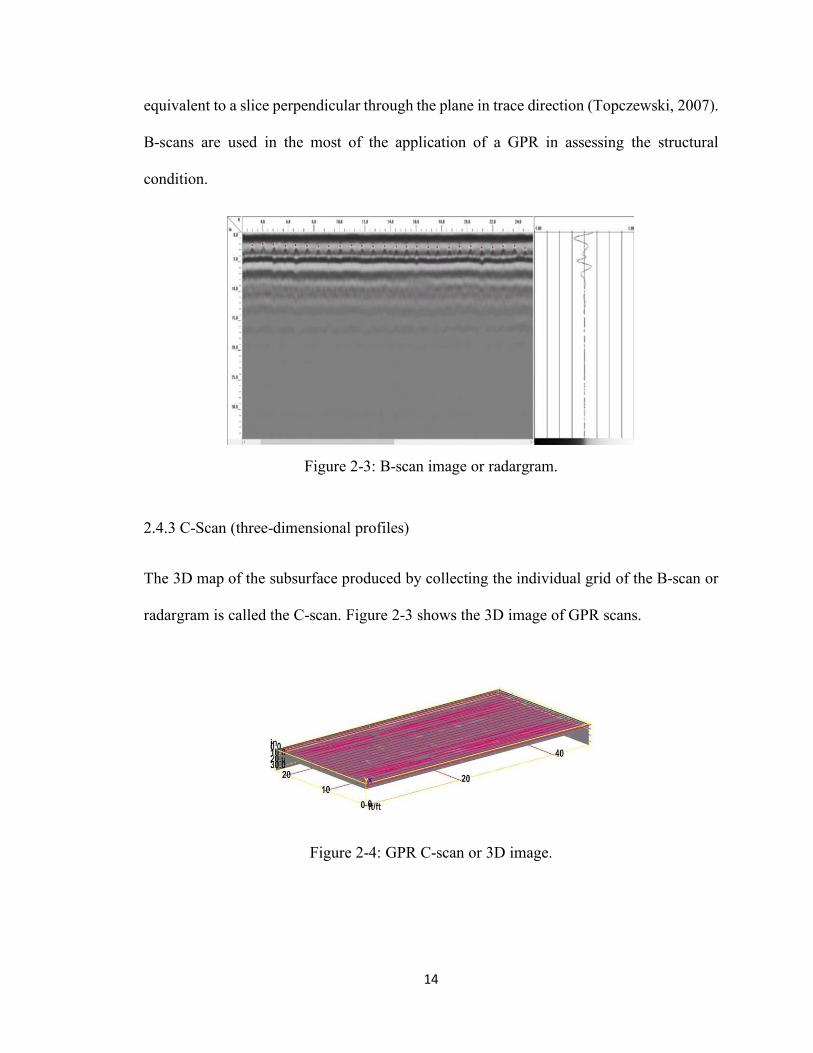
2.4.3 C-Scan (three-dimensional profiles)
The 3D map of the subsurface produced by collecting the individual grid of the B-scan or
radargram is called the C-scan. Figure 2-3 shows the 3D image of GPR scans.
Figure 2-4: GPR C-scan or 3D image.
15
2.5 GPR Data Processing
The application of a GPR in investigating the condition of a bridge deck dates back to the
1970s. With the advent of advance radar tools and processing software, data collection and
interpretation tasks have been increasingly improving. The condition assessment of a
structure using a GPR can be achieved by reading and interpreting the reflection images
obtained from the survey.
The numerical (quantitative) analysis of radar amplitudes following the process outlined in
ASTM D6087 has been the typical approach for data processing (Tarussov et al., 2013).
This numerical analysis method will make the post processing easy and speed the
evaluation. The data processing using only amplitude values disregard 90% of the
information included in the radar profiles (Tarussov et al., 2013). On the other hand, the
most appropriate way of interpreting the data is by visually reading the GPR scan image
and separating the reflections associated with the corrosion related defects. The GPR-
image-based analysis (GPR-IBA) was performed for an underground parking garage in
Montreal by Dinh et al. (2013). The comparison of the GPR images with a series of 100
cores taken from the site confirmed that GPR-IBA correctly identified the corrosion related
anomalies. Likewise, the GPR-IBA method has been applied on several major bridges, and
the results have been confirmed using other testing techniques (Abouhamad et al., 2017).
As the GPR-IBA was conducted by considering the corrosion and non-corrosion related
factors, the results obtained following this method were comparable with other testing
techniques.
The numerical analysis method may overpredict the corrosiveness condition of reinforced
concrete. There are several factors that affect the reflection amplitudes from the rebar.
16
Some of these factors include reinforcing bar spacing/configuration, surface anomalies,
and random scattering (Abouhamad et al., 2017). As a GPR is based on the EM principles,
scanned images of a GPR from fresh and rusty rebar should have clear distinctions.
Therefore, the GPR-IBA method should be used for developing an accurate corrosiveness
map of a reinforced concrete slab even though it requires more time than simply performing
the numerical method.
17
Chapter 3 Laboratory Experiments
The experimental investigation using GSSI SIR 4000 and 1.6 GHz antenna was performed
to investigate the difference between GPR responses from the fresh and rusty rebar at
various depths. Four slabs, two using fresh rebar and the other two using artificially
generated rusty rebar, were made with 27.5 MPa (4000 psi) concrete. To study the effect
of the rebar depth on a GPR response, fresh rebar was kept at varying depths of 51 mm (2
in.), 38 mm (1.5 in.), and 25 mm (1 in.). The reinforcing bar size of the fresh and the rusty
rebar was kept the same for the comparison of the GPR scan results. A Q-lab weathering
and corrosion test chamber (Q-FOG) was used to simulate the natural condition of the
outdoor environment (combined forces of sunlight, moisture, and heat) for generating the
rust in the rebar pieces. Two pieces of rebar were set in the corrosion test chamber for 6
days, while the other two pieces were left in a similar test chamber for 12 days. A GSSI
mini cart was used for the survey of these small laboratory slabs. After 28 days of moist
curing, slabs were left for 24 hours at room temperature for drying. The GPR scans
obtained from the survey were processed in RADAN and values of rebar amplitude, depth
and position were exported in a CSV file. The accuracy of GPR was validated by
comparing the actual values of the rebar depth and spacing with the one obtained from the
experiment. The GPR scanned images obtained from the fresh and the rusty rebar were
compared and discussed. Similarly, the reflection amplitudes of the fresh and the rusty
rebar were compared and discussed as well.
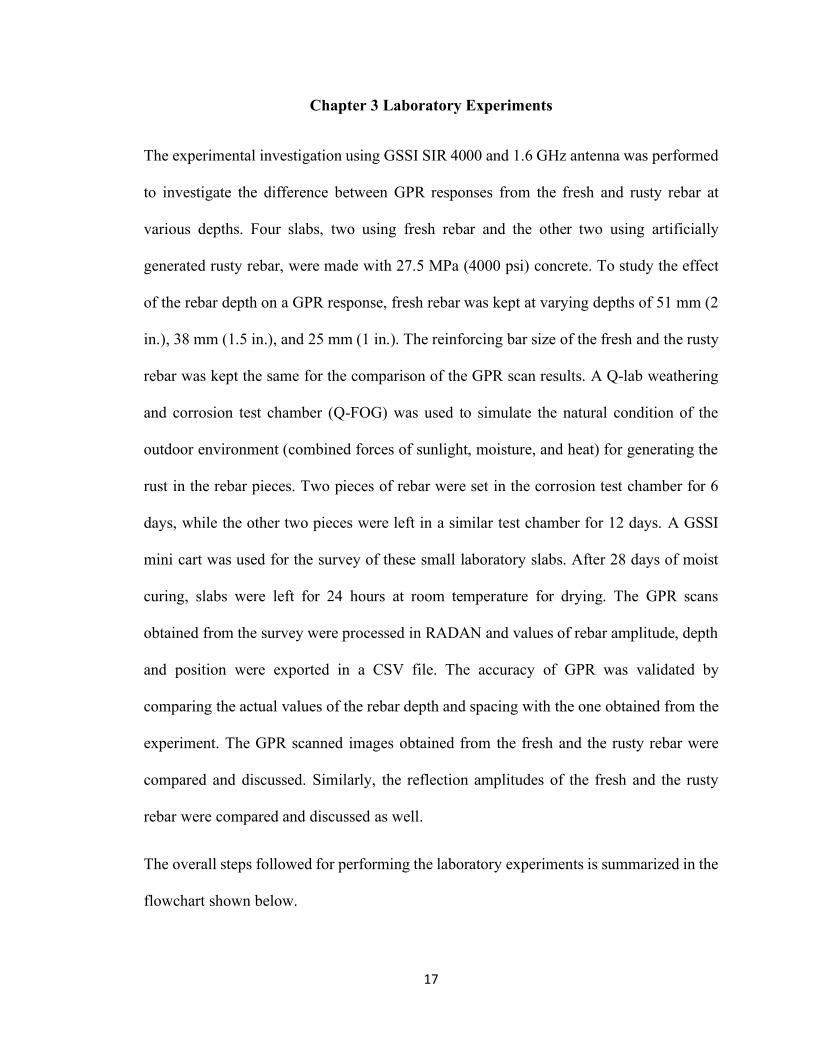
The overall steps followed for performing the laboratory experiments is summarized in the
flowchart shown below.
18
Figure 3- 1: Flowchart of laboratory experiments.
3.1 Materials and Methods
Raw materials for the construction of the slabs were used from the concrete lab at
Youngstown State University. Ordinary Portland Cement, coarse aggregates, fine
Deformed #6 bar (0.75 in.) were cut into required sizes
and cleaned using sandpaper.
Rust formation using Q-Fog. Two rebar treated for 6 days and other two for 12 days.
Two slabs with fresh rebar were constructed. Type 1 (rebar at depth 2in. and 1.5 in.), Type 2 (rebar at
depth 2in. and 1 in.)
Two slabs with rusty rebar were constructed.
Rebar was kept at uniform depth of 1.5 in.
GPR Scan was performed and B-scans (2D-scans) were collected.
Data post-processing using RADAN 7 (time-zero correction, migration, and background removal)
Values of the rebar depth and spacing from
the GPR survey was compared with the
actual values.
Reflection amplitudes of fresh and rusty rebar are compared and discussed.
GPR scan images of the fresh and rusty rebar are compared
and discussed.
19
aggregates, and potable water were used for making the concrete slab. The #6 deformed
reinforcing bars were used as a metal target in the concrete slabs.
3.1.1 Rebar and Q-Fog
The deformed bars were prepared as required for the experiment. The diameter of the rebar
was measured using the Vernier calipers to confirm with the standard value. Rebar was cut
in a required dimension to fit in the slab and the surface of the rebar was prepared by
sanding it with P 220 grit. The sanding of the rebar was performed to remove any oil or
grease present on the surface. The diameter, as per the standard and the lab measurement,
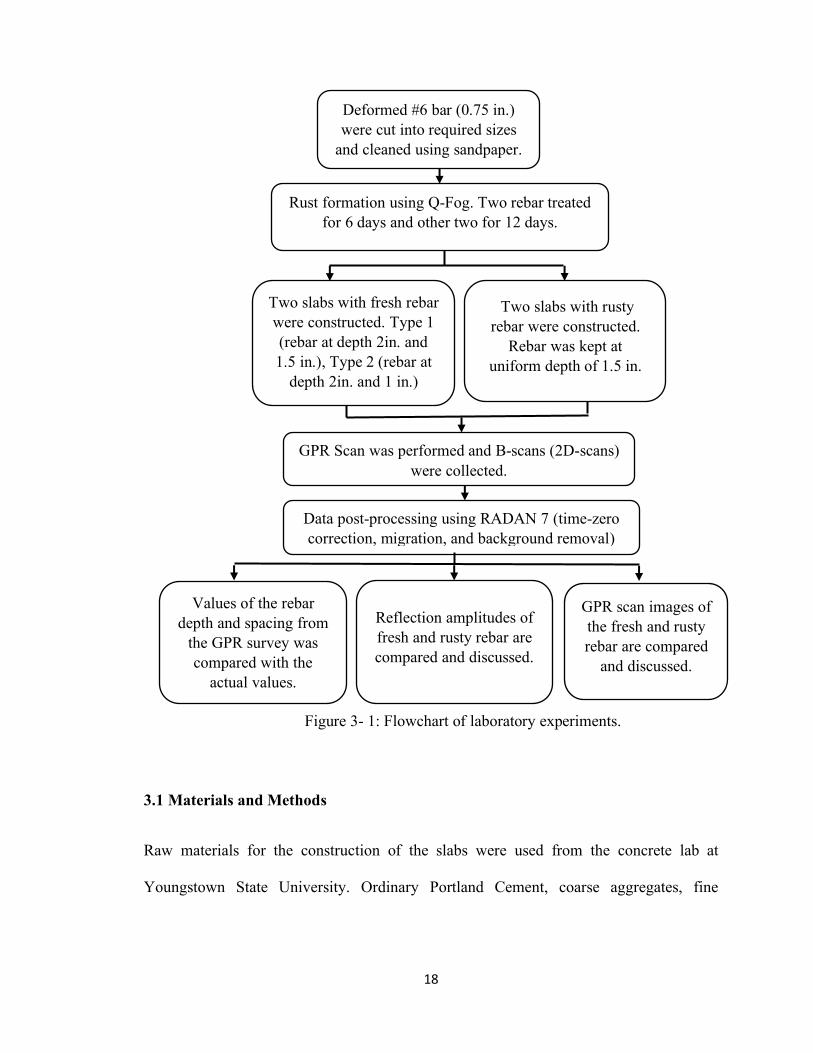
was confirmed to be 19 mm (0.75 in.). Figure 3-1 shows the rebar sample cleaned using
the sandpaper before casting into the slab.
Figure 3-2: Reinforcing bar cleaned using sandpaper.
The Q-Fog, a cyclic corrosion tester, was used to develop the rust scales on the surface of
the rebar. The cleaned rebar samples were placed in the tester to expose them to the
simulated cyclic corrosive environment. This machine exposes the sample to a repetitive
cycle of changing environment, which is controlled by its different functions. Research
20
with cyclic corrosion tests indicate that the relative corrosion rates, structure, and
morphology of rust are similar to those seen outdoors (Q-Lab Technical Bulletin, 2009).
As mentioned in the Q-Lab Technical Bulletin (2009), three different functions of the
machine can be summarized below.
Fog Function: The fog function sprays a fine mist of corrosive solution throughout the
chamber.
Dry off Function: The dry function blows air through the chamber to dry off the test
specimens.
Humidity Function: The humidity function injects hot water vapor into the chamber to
increase the humidity to 100%.
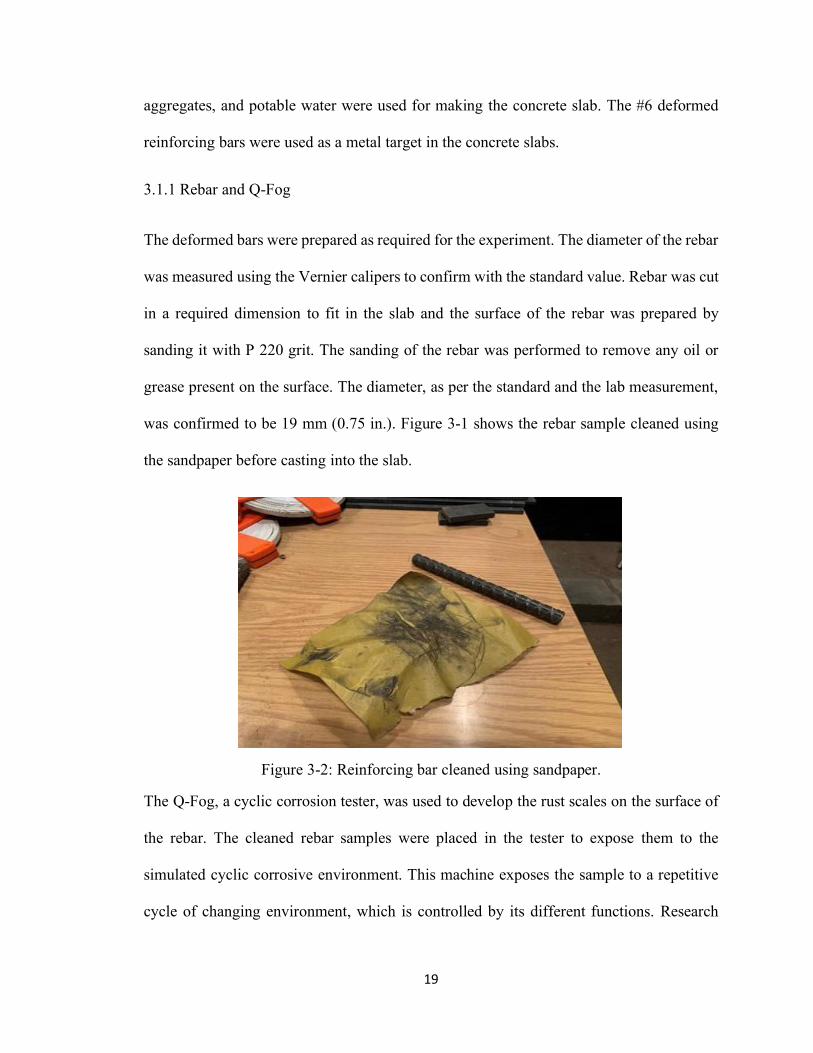
Figure 3-2 shows the rebar specimen in the Q-FOG apparatus after the fog and final dry
off function.
a) b)
Figure 3-3: Rebar sample in a Q-FOG machine: (a) after fog function is applied in the chamber; (b) after dry off function is applied in the chamber.
21
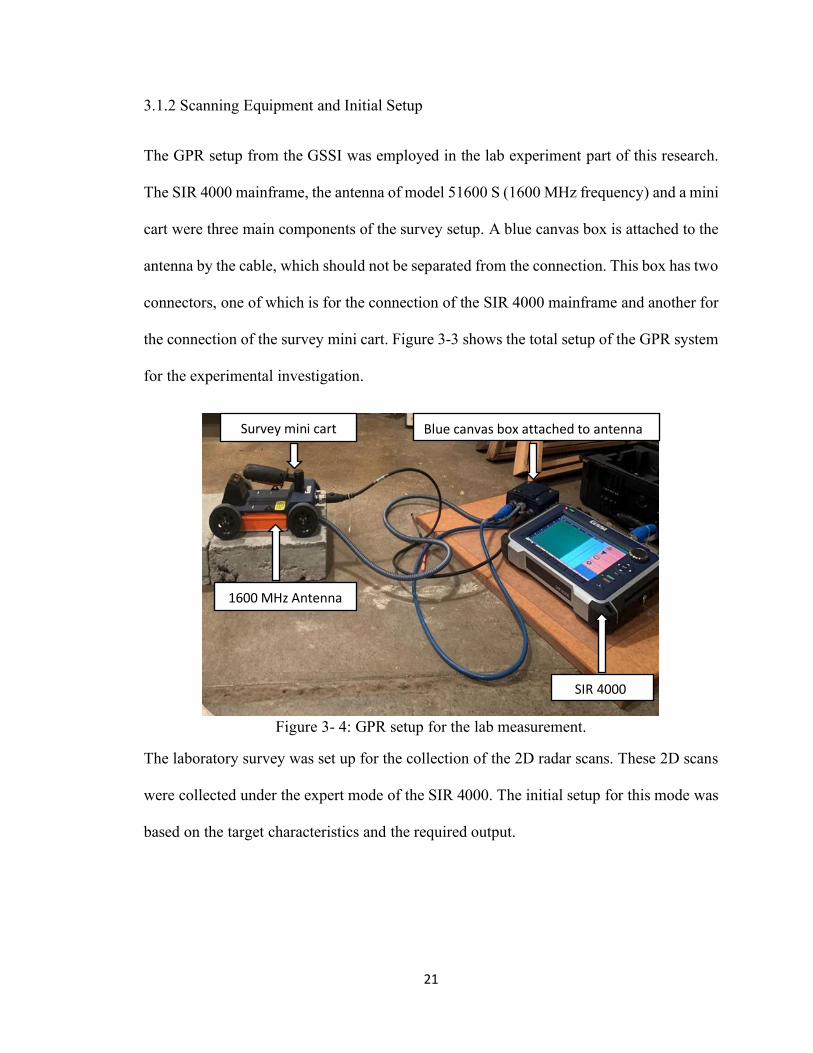
3.1.2 Scanning Equipment and Initial Setup
The GPR setup from the GSSI was employed in the lab experiment part of this research.
The SIR 4000 mainframe, the antenna of model 51600 S (1600 MHz frequency) and a mini
cart were three main components of the survey setup. A blue canvas box is attached to the
antenna by the cable, which should not be separated from the connection. This box has two
connectors, one of which is for the connection of the SIR 4000 mainframe and another for
the connection of the survey mini cart. Figure 3-3 shows the total setup of the GPR system
for the experimental investigation.
Figure 3- 4: GPR setup for the lab measurement.
The laboratory survey was set up for the collection of the 2D radar scans. These 2D scans
were collected under the expert mode of the SIR 4000. The initial setup for this mode was
based on the target characteristics and the required output.
Survey mini cart
Blue canvas box attached to antenna
1600 MHz Antenna
SIR 4000
22
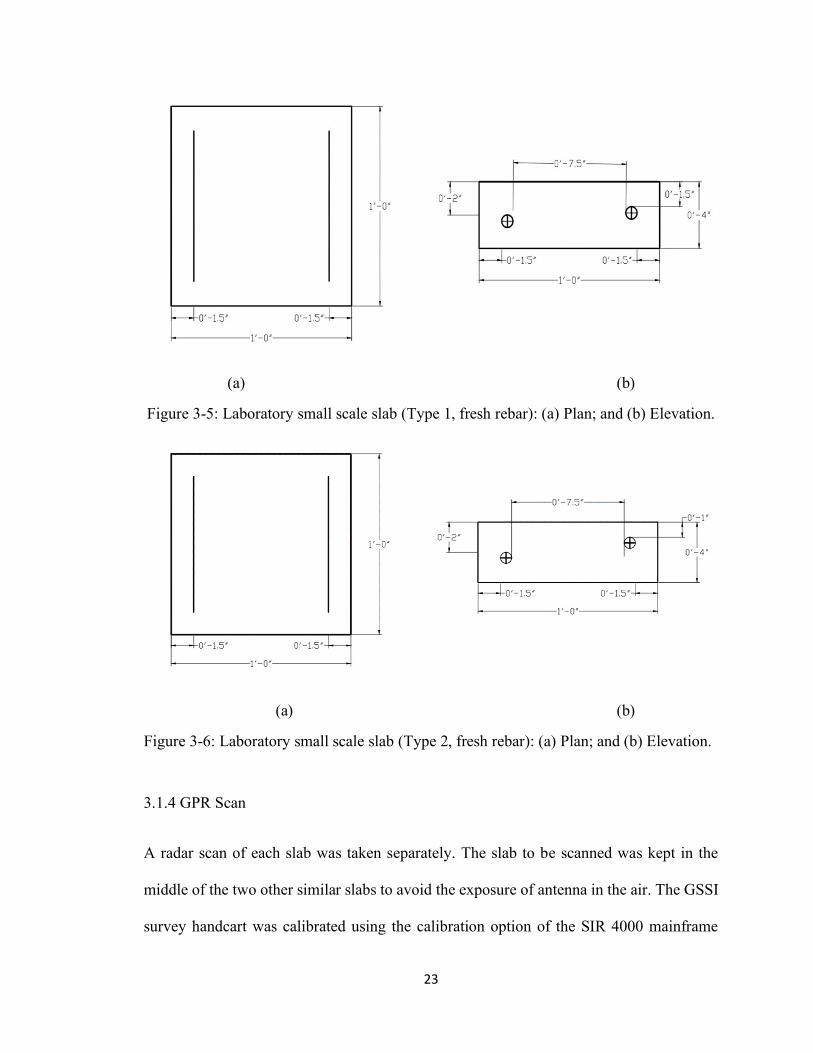
3.1.3 Concrete Slabs
Four small scale slabs were prepared using normal weight concrete having the maximum
size of aggregate of 19 mm (¾ in.), a water to cement ratio of 0.46 and the 28-days
compressive strength of 27.5 MPa (4000 psi). The slabs have uniform dimensions (30.5
cm (12 in.) X 30.5 cm (12 in.) X 10.2 cm (4 in.)). Two slabs contain the fresh rebar and the
other two the rusty rebar. Each slab has two pieces of rebar in it. The two slabs having fresh
rebar are named as Type 1 (set of rebar at depth of 51 mm (2 in.) and 38 mm (1.5 in.)) and
Type 2 (set of rebar at depth of 51 mm (2 in.) and 25 mm (1 in.)) slab, as shown in Figs. 3-
4 and 3-5 respectively. The rusty rebar was kept at a uniform depth of 38 mm (1.5 in.). The
rust in the rebar was generated by using cyclic corrosion tester. The rusty rebar in one of
the slabs was treated for 6 days in the cyclic corrosion tester while the other had them
treated for 12 days. The ability of the antenna to see two closely spaced targets separately
(lateral resolution) is determined by the wavelength (GSSI Concrete Handbook, 2017). The
spacing between the bars was maintained at 19.1 cm (7.5 in.) (greater than for the 1.6 GHz
antenna, which is 7.6 cm (3 in.)) to observe the radar scans from the rebar with good lateral
resolutions.
23
(a) (b)
Figure 3-5: Laboratory small scale slab (Type 1, fresh rebar): (a) Plan; and (b) Elevation.
(a) (b)
Figure 3-6: Laboratory small scale slab (Type 2, fresh rebar): (a) Plan; and (b) Elevation.
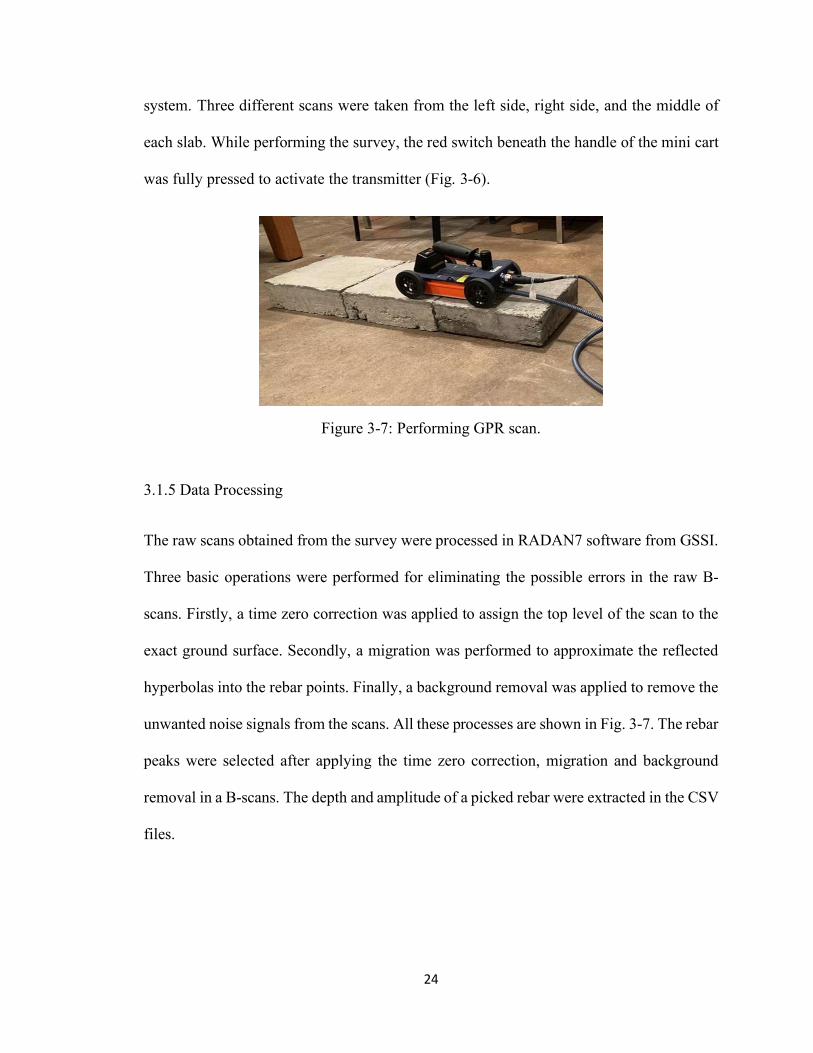
3.1.4 GPR Scan
A radar scan of each slab was taken separately. The slab to be scanned was kept in the
middle of the two other similar slabs to avoid the exposure of antenna in the air. The GSSI
survey handcart was calibrated using the calibration option of the SIR 4000 mainframe
24
system. Three different scans were taken from the left side, right side, and the middle of
each slab. While performing the survey, the red switch beneath the handle of the mini cart
was fully pressed to activate the transmitter (Fig. 3-6).
Figure 3-7: Performing GPR scan.
3.1.5 Data Processing
The raw scans obtained from the survey were processed in RADAN7 software from GSSI.
Three basic operations were performed for eliminating the possible errors in the raw B-
scans. Firstly, a time zero correction was applied to assign the top level of the scan to the
exact ground surface. Secondly, a migration was performed to approximate the reflected
hyperbolas into the rebar points. Finally, a background removal was applied to remove the
unwanted noise signals from the scans. All these processes are shown in Fig. 3-7. The rebar
peaks were selected after applying the time zero correction, migration and background
removal in a B-scans. The depth and amplitude of a picked rebar were extracted in the CSV
files.
25
(a) (b) (c)
Figure 3-8: Post processing of raw scans: (a) Time zero correction applied to the raw scan; (b) Scan before background removal; and (c) Scan after background removal.
26
Chapter 4 Field Experiments
4.1 Site
The non-destructive evaluation (NDE) using the GSSI SIR 4000 was conducted on the
precast deck of Lincoln Parking Deck at Youngstown State University, Ohio. It is a four-
story open parking structure with each floor divided into four sections namely A, B, C and
D. The deck in this parking structure is composed of precast double T-beams connected by
dowel rods and welds. There are three connected double T-beams in between the two
columns. These T-beams have equal dimensions of 18.29 m (60 ft) length, 2.74 m (9 ft)
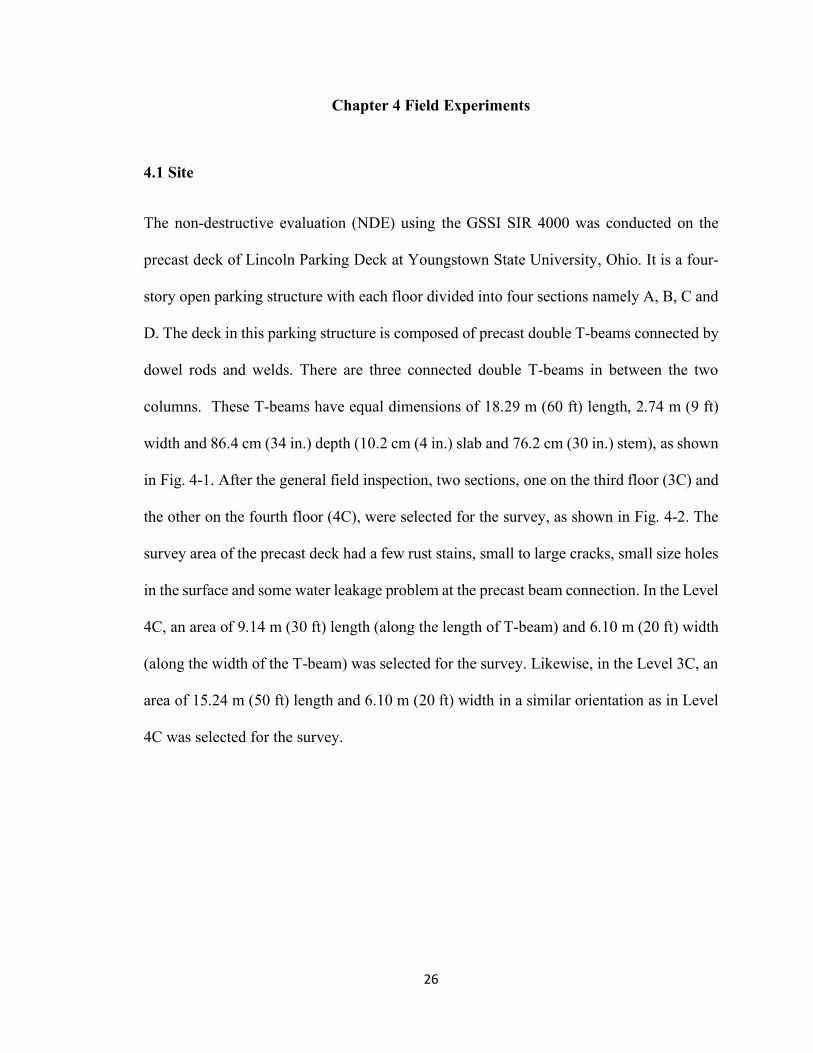
width and 86.4 cm (34 in.) depth (10.2 cm (4 in.) slab and 76.2 cm (30 in.) stem), as shown
in Fig. 4-1. After the general field inspection, two sections, one on the third floor (3C) and
the other on the fourth floor (4C), were selected for the survey, as shown in Fig. 4-2. The
survey area of the precast deck had a few rust stains, small to large cracks, small size holes
in the surface and some water leakage problem at the precast beam connection. In the Level
4C, an area of 9.14 m (30 ft) length (along the length of T-beam) and 6.10 m (20 ft) width
(along the width of the T-beam) was selected for the survey. Likewise, in the Level 3C, an
area of 15.24 m (50 ft) length and 6.10 m (20 ft) width in a similar orientation as in Level
4C was selected for the survey.
27
Figure 4- 1: A typical double T-Beam in the Lincoln Parking Deck.
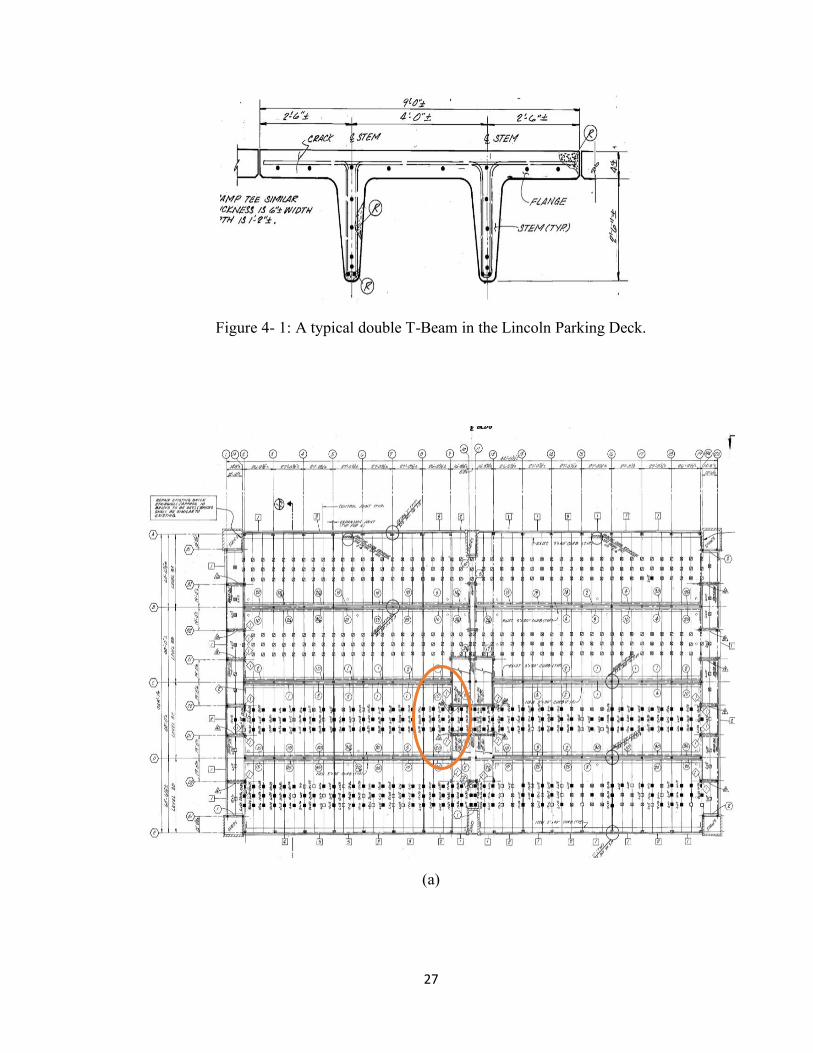
(a)
28
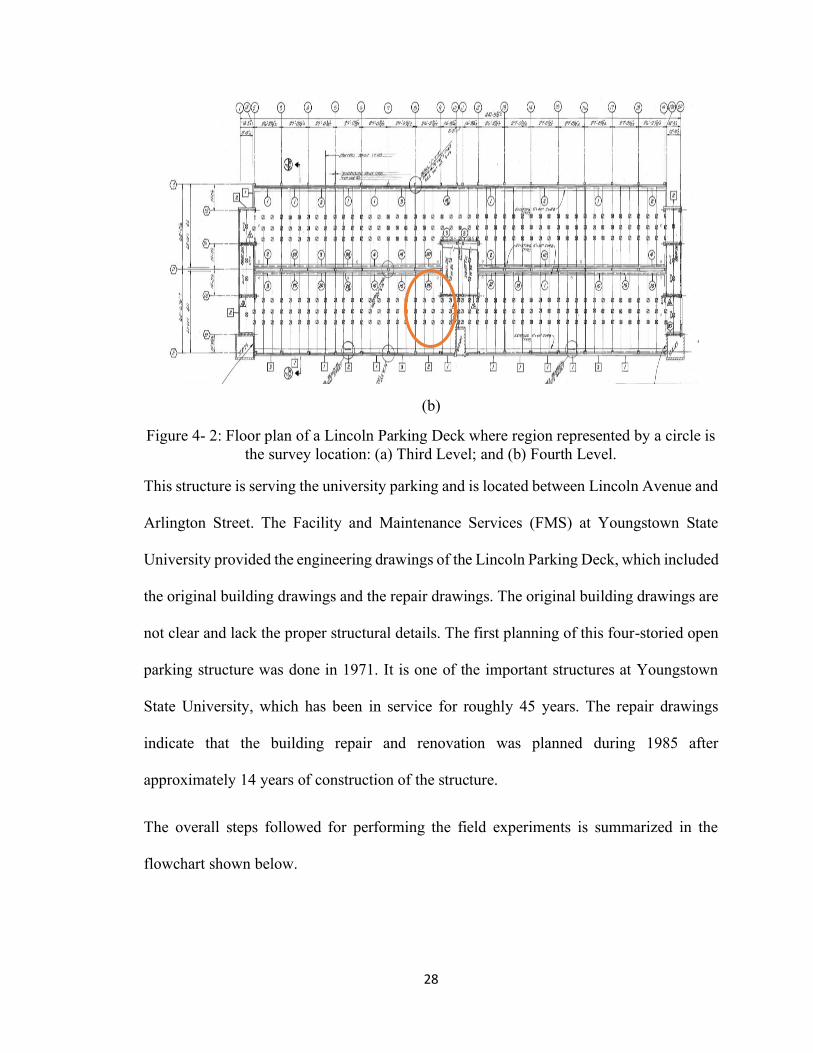
(b)
Figure 4- 2: Floor plan of a Lincoln Parking Deck where region represented by a circle is the survey location: (a) Third Level; and (b) Fourth Level.
This structure is serving the university parking and is located between Lincoln Avenue and
Arlington Street. The Facility and Maintenance Services (FMS) at Youngstown State
University provided the engineering drawings of the Lincoln Parking Deck, which included
the original building drawings and the repair drawings. The original building drawings are
not clear and lack the proper structural details. The first planning of this four-storied open
parking structure was done in 1971. It is one of the important structures at Youngstown
State University, which has been in service for roughly 45 years. The repair drawings
indicate that the building repair and renovation was planned during 1985 after
approximately 14 years of construction of the structure.
The overall steps followed for performing the field experiments is summarized in the
flowchart shown below.
29
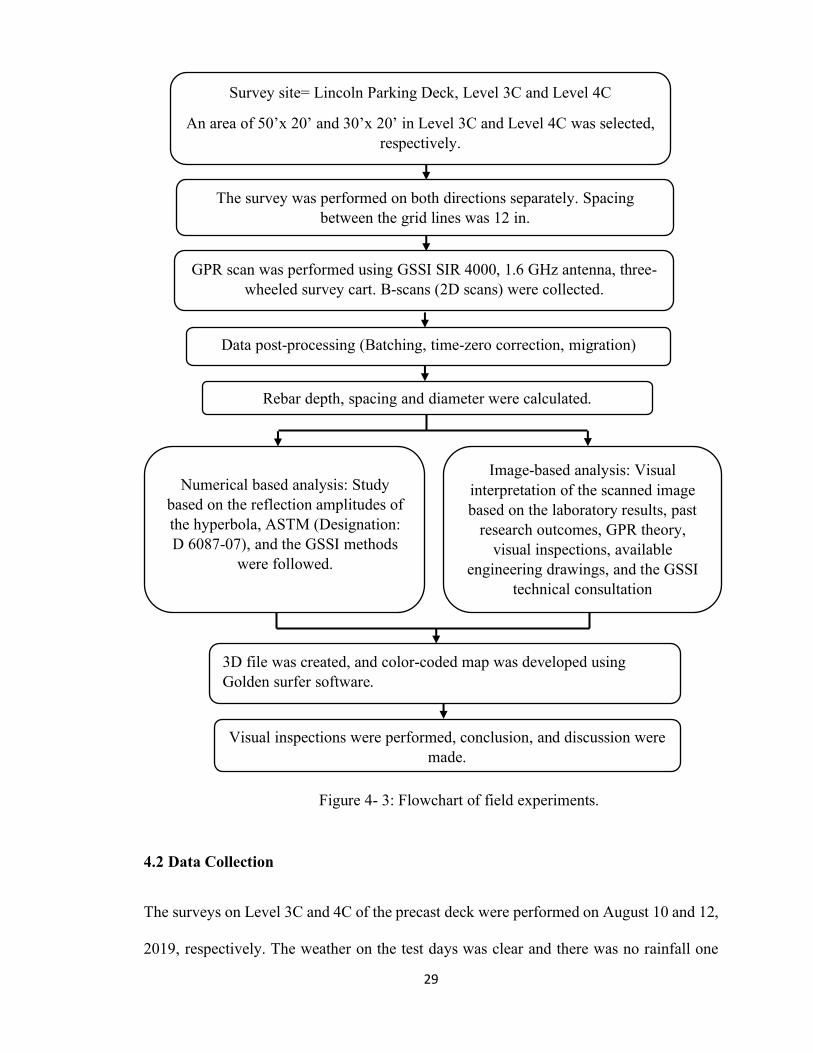
Figure 4- 3: Flowchart of field experiments.
4.2 Data Collection
The surveys on Level 3C and 4C of the precast deck were performed on August 10 and 12,
2019, respectively. The weather on the test days was clear and there was no rainfall one
Survey site= Lincoln Parking Deck, Level 3C and Level 4C
An area of 50’x 20’ and 30’x 20’ in Level 3C and Level 4C was selected, respectively.
The survey was performed on both directions separately. Spacing between the grid lines was 12 in.
GPR scan was performed using GSSI SIR 4000, 1.6 GHz antenna, three-wheeled survey cart. B-scans (2D scans) were collected.
Data post-processing (Batching, time-zero correction, migration)
Rebar depth, spacing and diameter were calculated.
Numerical based analysis: Study based on the reflection amplitudes of the hyperbola, ASTM (Designation: D 6087-07), and the GSSI methods
were followed.
Image-based analysis: Visual interpretation of the scanned image based on the laboratory results, past
research outcomes, GPR theory, visual inspections, available
engineering drawings, and the GSSI technical consultation
3D file was created, and color-coded map was developed using Golden surfer software.
Visual inspections were performed, conclusion, and discussion were made.
30
week before the experiment day. Thus, the influence of rainfall-induced wet conditions on
the radar scan results is considered none to negligible. An engineer's tape and some chalks
were used in the field for creating the required scan surface.
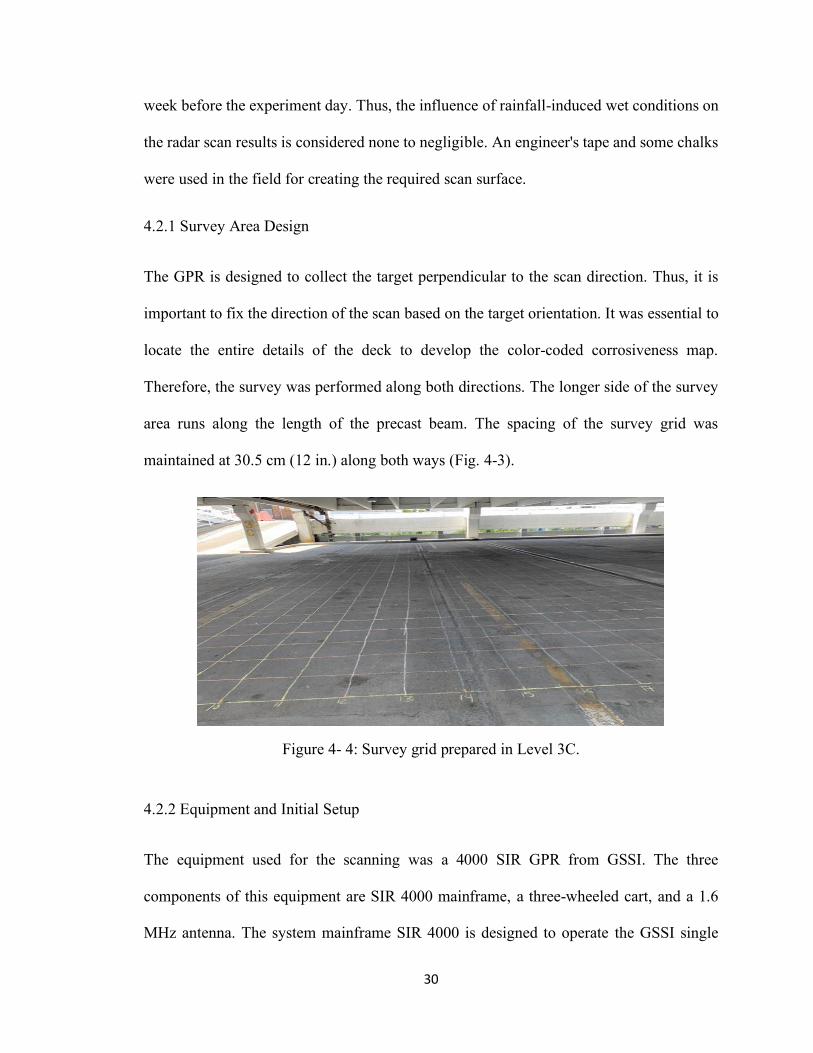
4.2.1 Survey Area Design
The GPR is designed to collect the target perpendicular to the scan direction. Thus, it is
important to fix the direction of the scan based on the target orientation. It was essential to
locate the entire details of the deck to develop the color-coded corrosiveness map.
Therefore, the survey was performed along both directions. The longer side of the survey
area runs along the length of the precast beam. The spacing of the survey grid was
maintained at 30.5 cm (12 in.) along both ways (Fig. 4-3).
Figure 4- 4: Survey grid prepared in Level 3C.
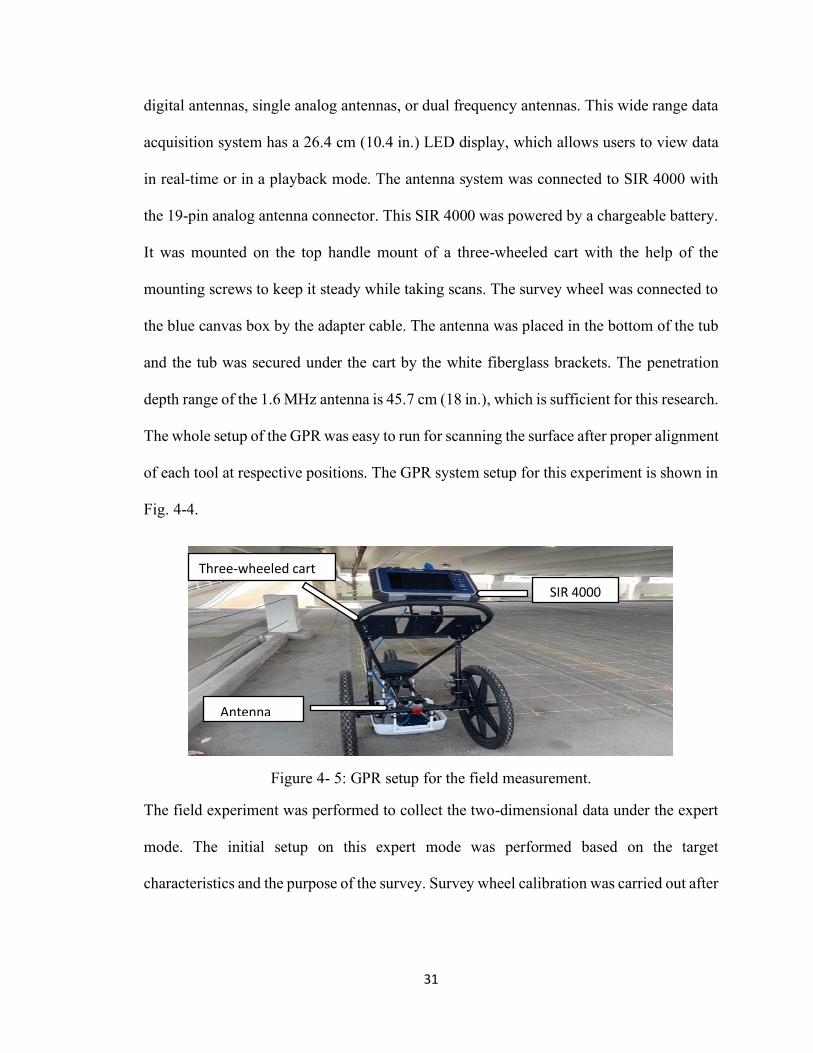
4.2.2 Equipment and Initial Setup
The equipment used for the scanning was a 4000 SIR GPR from GSSI. The three
components of this equipment are SIR 4000 mainframe, a three-wheeled cart, and a 1.6
MHz antenna. The system mainframe SIR 4000 is designed to operate the GSSI single
31
digital antennas, single analog antennas, or dual frequency antennas. This wide range data
acquisition system has a 26.4 cm (10.4 in.) LED display, which allows users to view data
in real-time or in a playback mode. The antenna system was connected to SIR 4000 with
the 19-pin analog antenna connector. This SIR 4000 was powered by a chargeable battery.
It was mounted on the top handle mount of a three-wheeled cart with the help of the
mounting screws to keep it steady while taking scans. The survey wheel was connected to
the blue canvas box by the adapter cable. The antenna was placed in the bottom of the tub
and the tub was secured under the cart by the white fiberglass brackets. The penetration
depth range of the 1.6 MHz antenna is 45.7 cm (18 in.), which is sufficient for this research.
The whole setup of the GPR was easy to run for scanning the surface after proper alignment
of each tool at respective positions. The GPR system setup for this experiment is shown in
Fig. 4-4.
Figure 4- 5: GPR setup for the field measurement.
The field experiment was performed to collect the two-dimensional data under the expert
mode. The initial setup on this expert mode was performed based on the target
characteristics and the purpose of the survey. Survey wheel calibration was carried out after
Three-wheeled cart
Antenna
Tub
SIR 4000
32
saving the initial parameters as it is recommended to carry out the survey wheel calibration
before performing the survey on the new surface.
4.2.3 Performing the Survey
The survey grids were marked with the numeric values along both directions. The surveys
on X- and Y-direction was performed separately and saved in a different file for simplicity
during the data processing. In the beginning, the survey cart was lined with the first profile
and pushed forward along the line until the end of the profile. After completing the scan of
the first profile line, the cart was aligned for the scan of the second profile. The scanning
of the entire profiles (both X- and Y-directions) were executed following a similar pattern.
Field data were saved automatically on SIR 4000 mainframe, which were transferred for
post processing.
4.3 Data Processing
The collected radar scanned images were assessed for the post processing in RADAN.
Firstly, the raw data of the field were studied to find out the general corrections needed for
eliminating the error. The steps performed in RADAN7 can be summarized as follows.
4.3.1 Batching of the File
Opening an individual scan file and performing the post processing steps separately would
be a tedious job. Therefore, scan files of each direction were batched in a single 2D file.
With this batching, all the profiles were opened and processed at the same time.
33
4.3.2 Time Zero Correction
The time zero correction is performed to assign the top of the scan to the exact ground
level. This step is important for the survey performed using an air-launched antenna.
However, to remove the error as much as possible, time zero correction was performed to
the collected data.
4.3.3 Migration
The migration is a tool for the mathematical approximation of the reflected hyperbolas into
the rebar points on their subsurface position. This was performed in the collected data to
make the self-picking of rebar relatively easy and accurate.
4.4 Analysis and Calculations
4.4.1 Rebar Depth
Automatic rebar reflection mapping: This is the process where software implements an
algorithm to locate the hyperbolas and pick up the information on its position and
amplitudes. The obtained peaks of the hyperbola give the depth of the rebar target. This
algorithm used by software might result in an error by misinterpreting the target reflection
with other disturbances.
Self-Picking tool: This is the option in the processing software for self-picking of the rebar
position. The most important advantage of using this option is that it eliminates the error
caused by the disturbances in the target reflection. It involves longer processing time than
automatic mapping as one must go through each profile and pick the target position.
However, due to its accuracy, it is encouraged to use the self-picking tool for picking the
34
target position. Therefore, with the intention of finding more accurate results, the self-
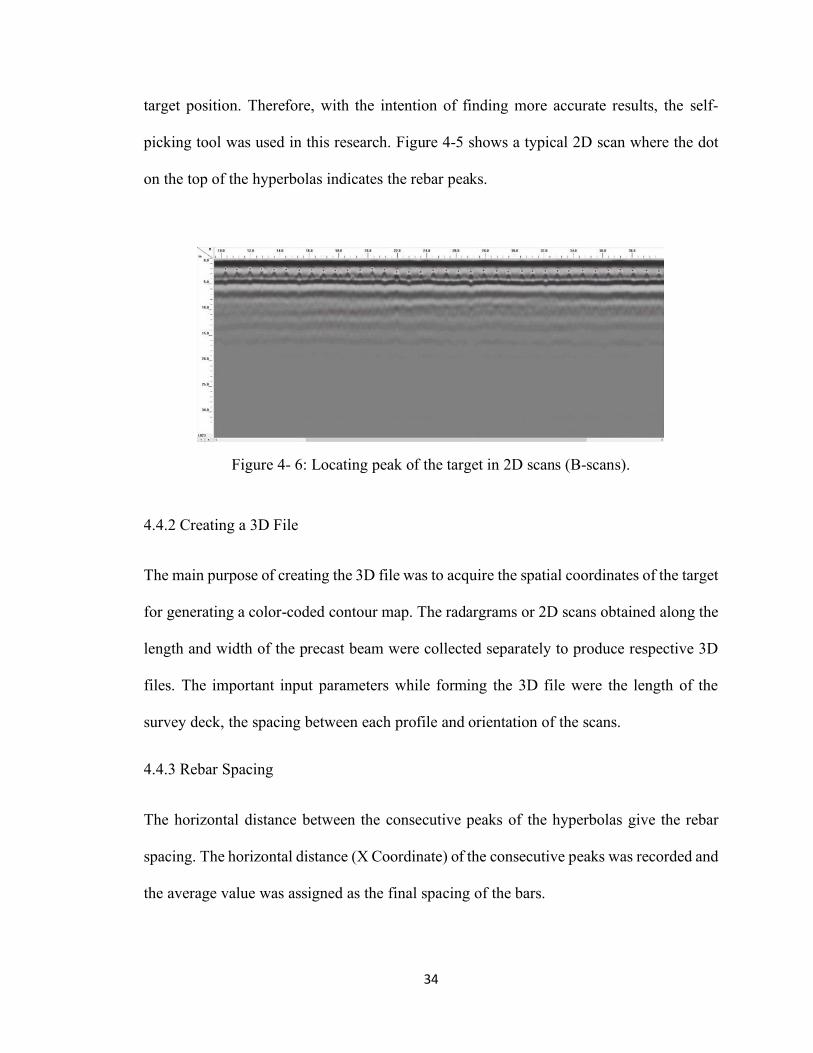
picking tool was used in this research. Figure 4-5 shows a typical 2D scan where the dot
on the top of the hyperbolas indicates the rebar peaks.
Figure 4- 6: Locating peak of the target in 2D scans (B-scans).
4.4.2 Creating a 3D File
The main purpose of creating the 3D file was to acquire the spatial coordinates of the target
for generating a color-coded contour map. The radargrams or 2D scans obtained along the
length and width of the precast beam were collected separately to produce respective 3D
files. The important input parameters while forming the 3D file were the length of the
survey deck, the spacing between each profile and orientation of the scans.
4.4.3 Rebar Spacing
The horizontal distance between the consecutive peaks of the hyperbolas give the rebar
spacing. The horizontal distance (X Coordinate) of the consecutive peaks was recorded and
the average value was assigned as the final spacing of the bars.
35
4.4.4 Rebar Diameter
The diameter of a rebar, cable, or conduit cannot be measured directly using radar. (GSSI
Concrete Handbook, 2017). However, the Concrete Handbook specifies the methods for
measuring the diameter of the top rebar when two or more intersecting bars are laid in the
concrete in such a way that the bars touch each other. The repair drawing of the Lincoln
Parking Deck shows the detail section of the double T-beam where the rebar is placed at
two layers forming the mat. Therefore, the same principle was applied to find the rebar
diameter of the top bar in the deck.
4.4.5 Numerical Based Analysis of GPR Scans
A numerical analysis of the GPR data has been performed to study the scanned surface
based on the extracted amplitude values. The detail steps followed for developing
corrosiveness map using numerical based analysis is described below.
a. The X-coordinate, Y-coordinate and reflection amplitudes of the rebar peaks were
extracted in a CSV file from the 3D file of precast deck section scans on RADAN7.
b. ASTM (Designation: D 6087-07) and GSSI methods as outlined in the GSSI Bridge
Scan Handbook were followed to find out the threshold reflection amplitudes value.
c. The position coordinates and reflection amplitudes were used to create the grid file.
Contour map was created in the Golden Surfer Software by taking the grid file as
an input. The threshold amplitude values were assigned to categorize the good, fair,
poor, and serious regions on the contour map. Finally, the range of three (green,
yellow, and red) colors were used to create the color-coded corrosiveness map.
36
4.4.6 Image-Based Analysis of GPR Scans
The image-based analysis in this research has been performed by visually interpreting the
scanned image response and assigning the condition indices to develop corrosiveness
mapping of the deck. The guidelines presented by Dinh et al. (2013) for forming
corrosiveness mapping are used as the basis for interpreting the scanned images. In
addition, GPR responses from the rusty rebar prepared in the laboratory were considered
as one of the governing parameters for the visual interpretation.
As mentioned in the study by Dinh et al. (2013), the identification of defects is based on
the understanding of the inspected structure mainly considering the following parameters:
1) top rebar amplitude 2) bottom rebar amplitude 3) slab bottom amplitude 4) deformation
of the hyperbolas 5) radar velocity changes 6) visible delamination.
On the other hand, the factors that need to be considered for eliminating unrelated
anomalies include (Dihn et al., 2013): 1) supporting structures 2) the variation of rebar
spacing 3) the variation of rebar depth 4) the previous repairs 5) surface anomalies.
Likewise, a study by Abouhamad et al. (2017) on the corrosiveness mapping of bridge
decks has presented the real implementation of the GPR-IBA on two case studies. Different
examples of anomalous radargram images and causes for such results shown in the paper
were also taken into consideration for the interpretation of the GPR scans (Table 4-1).
37
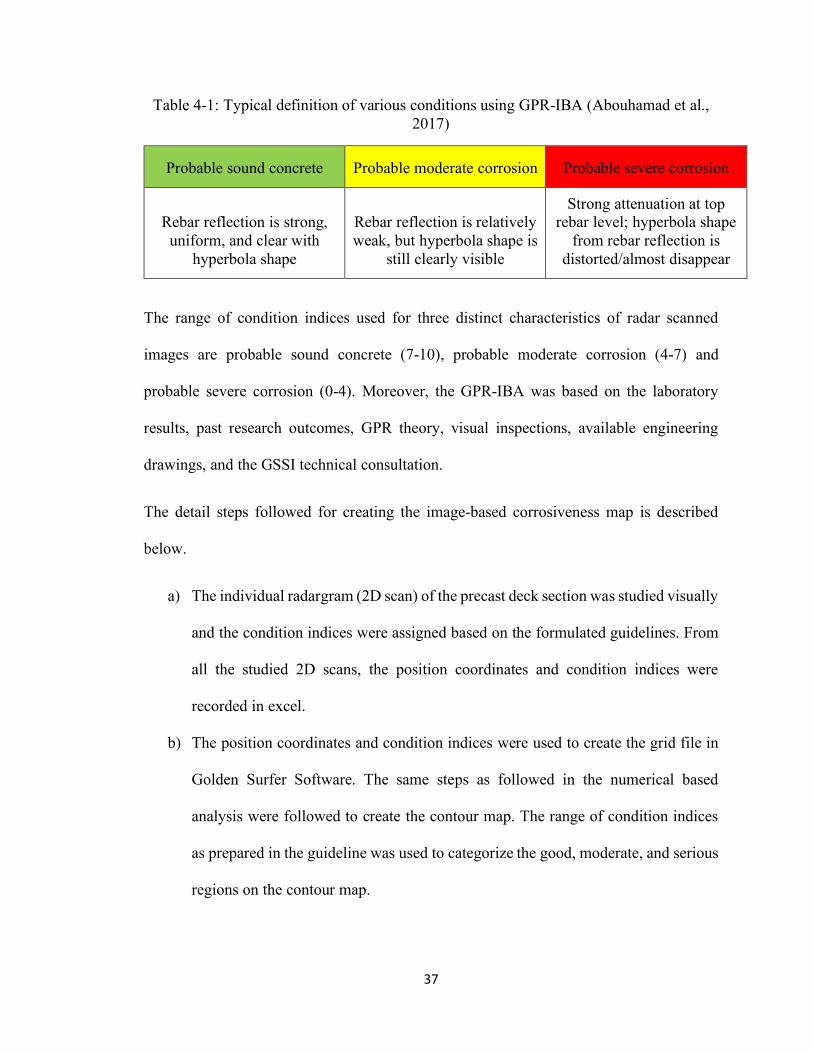
Table 4-1: Typical definition of various conditions using GPR-IBA (Abouhamad et al., 2017)
Probable sound concrete Probable moderate corrosion Probable severe corrosion
Rebar reflection is strong, uniform, and clear with
hyperbola shape
Rebar reflection is relatively weak, but hyperbola shape is
still clearly visible
Strong attenuation at top rebar level; hyperbola shape
from rebar reflection is distorted/almost disappear
The range of condition indices used for three distinct characteristics of radar scanned
images are probable sound concrete (7-10), probable moderate corrosion (4-7) and
probable severe corrosion (0-4). Moreover, the GPR-IBA was based on the laboratory
results, past research outcomes, GPR theory, visual inspections, available engineering
drawings, and the GSSI technical consultation.
The detail steps followed for creating the image-based corrosiveness map is described
below.
a) The individual radargram (2D scan) of the precast deck section was studied visually
and the condition indices were assigned based on the formulated guidelines. From
all the studied 2D scans, the position coordinates and condition indices were
recorded in excel.
b) The position coordinates and condition indices were used to create the grid file in
Golden Surfer Software. The same steps as followed in the numerical based
analysis were followed to create the contour map. The range of condition indices
as prepared in the guideline was used to categorize the good, moderate, and serious
regions on the contour map.
38
4.4.7 Color-Coded Map
A color-coded map of the parking deck was produced using Surfer® (Golden Software,
LLC). For the numerical analysis method, position coordinates and amplitudes of rebar
were given as input to create the contour plot. Similarly, for the image-based analysis
method, position coordinates and condition indices were fed to create the contour map.
39
Chapter 5 Results and Discussions
5.1 Results from Laboratory Study
5.1.1 Comparison of GPR Average Estimates with Design Values
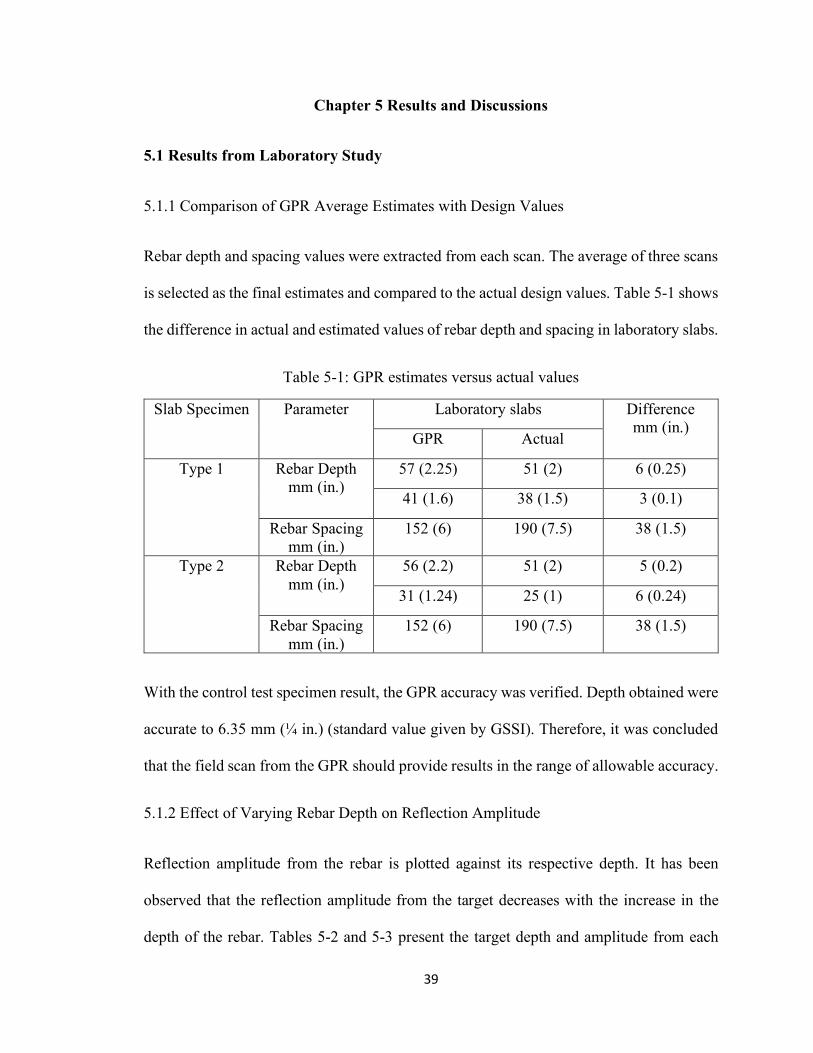
Rebar depth and spacing values were extracted from each scan. The average of three scans
is selected as the final estimates and compared to the actual design values. Table 5-1 shows
the difference in actual and estimated values of rebar depth and spacing in laboratory slabs.
Table 5-1: GPR estimates versus actual values
Slab Specimen Parameter Laboratory slabs Difference mm (in.)
GPR Actual
Type 1 Rebar Depth mm (in.)
57 (2.25) 51 (2) 6 (0.25)
41 (1.6) 38 (1.5) 3 (0.1)
Rebar Spacing mm (in.)
152 (6) 190 (7.5) 38 (1.5)
Type 2 Rebar Depth mm (in.)
56 (2.2) 51 (2) 5 (0.2)
31 (1.24) 25 (1) 6 (0.24)
Rebar Spacing mm (in.)
152 (6) 190 (7.5) 38 (1.5)
With the control test specimen result, the GPR accuracy was verified. Depth obtained were
accurate to 6.35 mm (¼ in.) (standard value given by GSSI). Therefore, it was concluded
that the field scan from the GPR should provide results in the range of allowable accuracy.
5.1.2 Effect of Varying Rebar Depth on Reflection Amplitude
Reflection amplitude from the rebar is plotted against its respective depth. It has been
observed that the reflection amplitude from the target decreases with the increase in the
depth of the rebar. Tables 5-2 and 5-3 present the target depth and amplitude from each
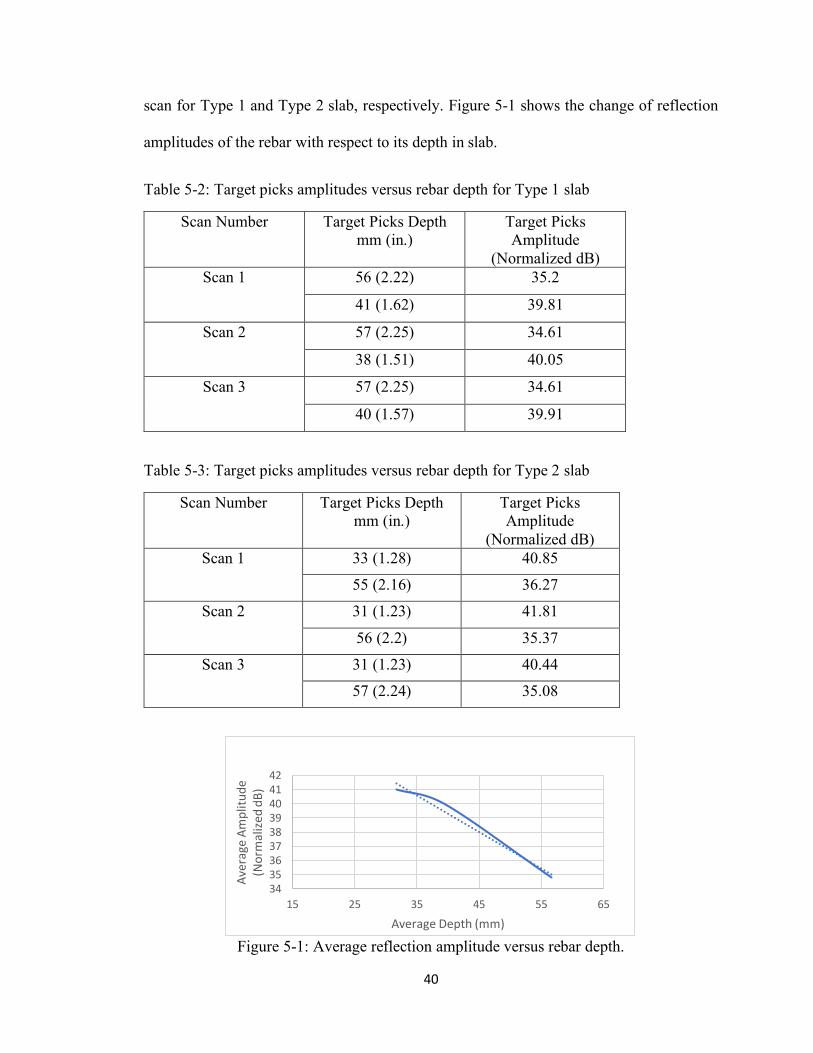
40
scan for Type 1 and Type 2 slab, respectively. Figure 5-1 shows the change of reflection
amplitudes of the rebar with respect to its depth in slab.
Table 5-2: Target picks amplitudes versus rebar depth for Type 1 slab
Scan Number Target Picks Depth mm (in.)
Target Picks Amplitude
(Normalized dB) Scan 1 56 (2.22) 35.2
41 (1.62) 39.81
Scan 2 57 (2.25) 34.61
38 (1.51) 40.05
Scan 3 57 (2.25) 34.61
40 (1.57) 39.91
Table 5-3: Target picks amplitudes versus rebar depth for Type 2 slab
Scan Number Target Picks Depth mm (in.)
Target Picks Amplitude
(Normalized dB) Scan 1 33 (1.28) 40.85
55 (2.16) 36.27
Scan 2 31 (1.23) 41.81
56 (2.2) 35.37
Scan 3 31 (1.23) 40.44
57 (2.24) 35.08
Figure 5-1: Average reflection amplitude versus rebar depth.
343536373839404142
15 25 35 45 55 65
Ave
rage
Am
plit
ud
e(N
orm
aliz
ed d
B)
Average Depth (mm)
41
In real field structures, there is not always the ideal case of having similar rebar depth even
if it is desired so. Thus, reflection amplitudes variation can be seen even if the rebar is in
the same condition. This depth variation is considered one of the many factors influencing
reflection amplitudes making it an unsuitable parameter for the full condition assessment
of structures.
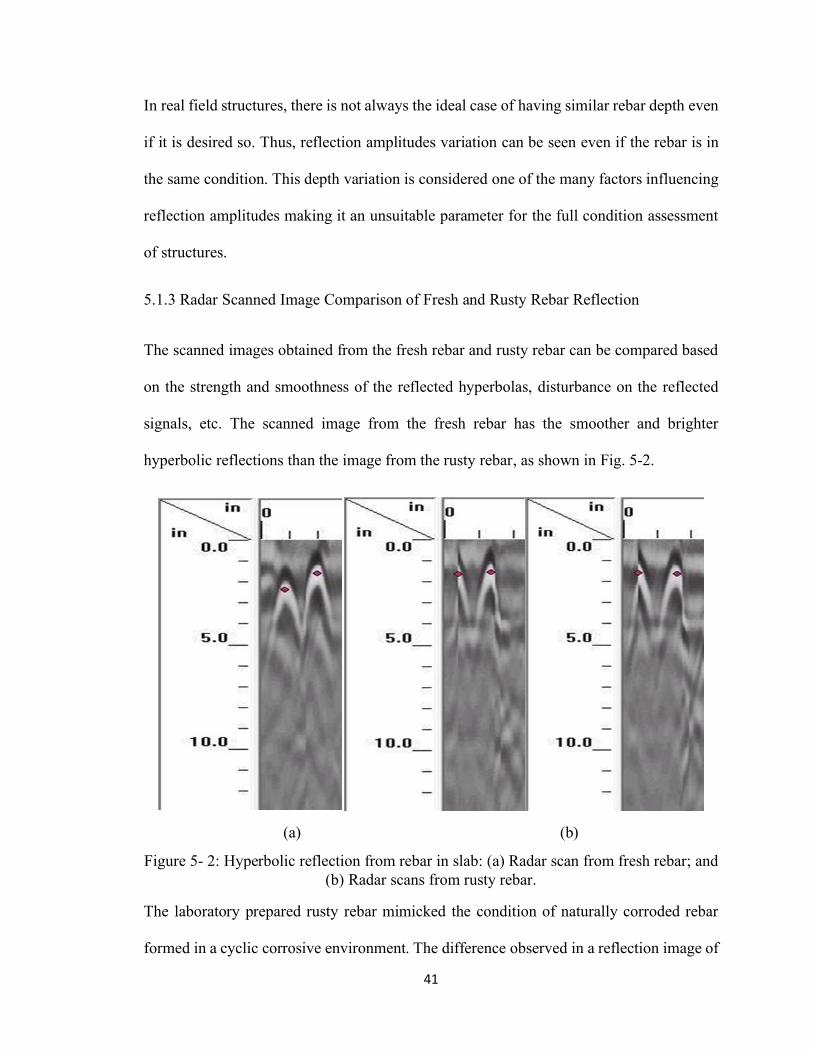
5.1.3 Radar Scanned Image Comparison of Fresh and Rusty Rebar Reflection
The scanned images obtained from the fresh rebar and rusty rebar can be compared based
on the strength and smoothness of the reflected hyperbolas, disturbance on the reflected
signals, etc. The scanned image from the fresh rebar has the smoother and brighter
hyperbolic reflections than the image from the rusty rebar, as shown in Fig. 5-2.
(a) (b)
Figure 5- 2: Hyperbolic reflection from rebar in slab: (a) Radar scan from fresh rebar; and (b) Radar scans from rusty rebar.
The laboratory prepared rusty rebar mimicked the condition of naturally corroded rebar
formed in a cyclic corrosive environment. The difference observed in a reflection image of
42
the fresh and the rusty rebar proves that the GPR shows an unclear response from the
corrosive target. But there can be different possible scenarios where reinforced concrete
undergoes corrosion. Moreover, for the same concrete condition, the response from the
fresh rebar will result in a clear, bright, and smooth hyperbola (as shown in Figure 5-2 (a)),
whereas the response from the rusty rebar will produce less bright, irregular, and unclear
hyperbolas (as shown in in Figure 5-2 (b)).
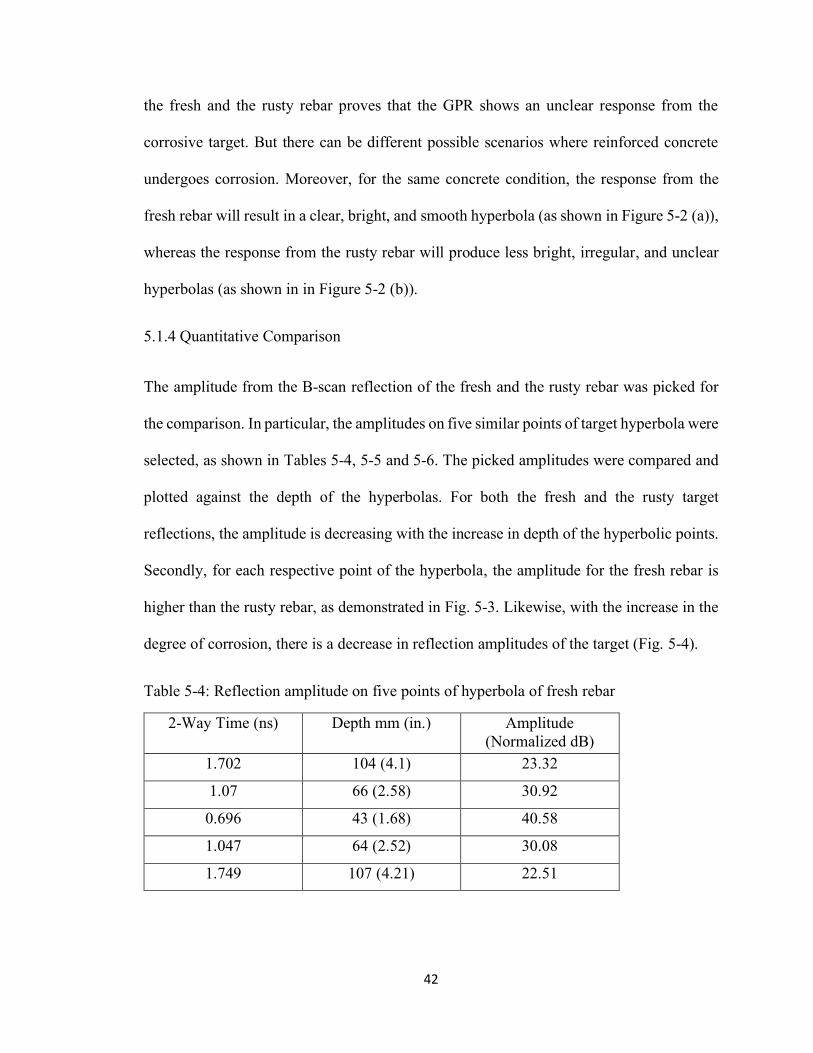
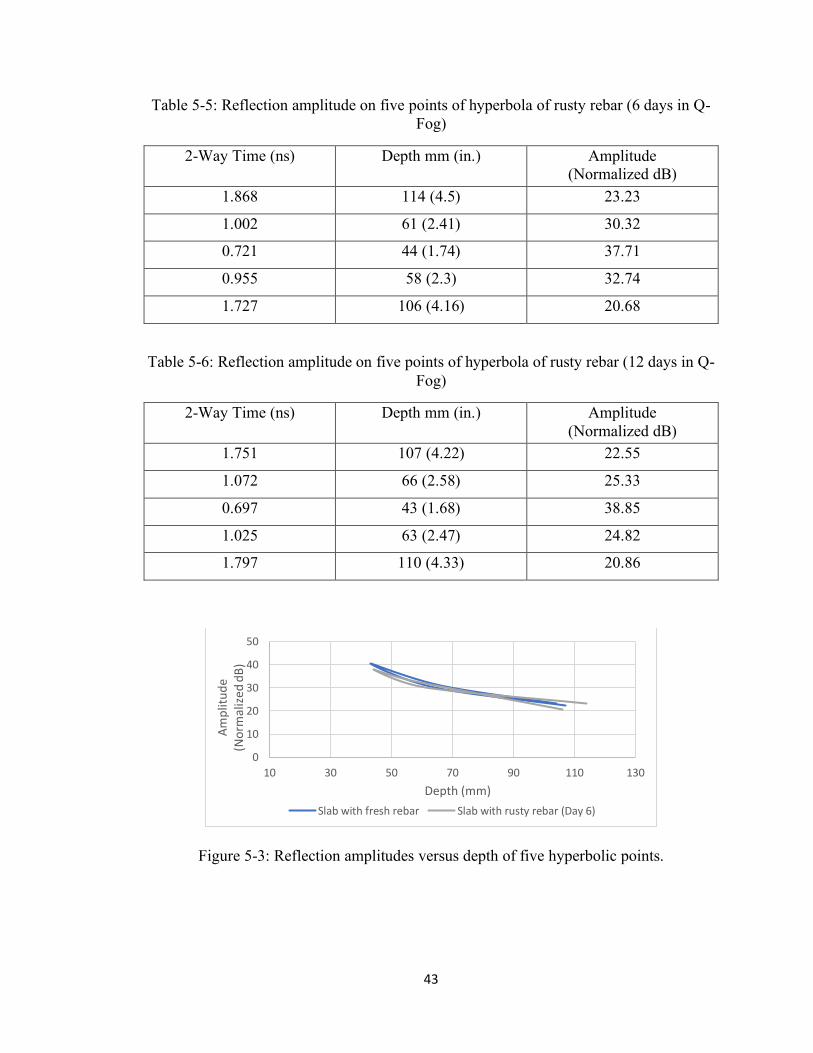
5.1.4 Quantitative Comparison
The amplitude from the B-scan reflection of the fresh and the rusty rebar was picked for
the comparison. In particular, the amplitudes on five similar points of target hyperbola were
selected, as shown in Tables 5-4, 5-5 and 5-6. The picked amplitudes were compared and
plotted against the depth of the hyperbolas. For both the fresh and the rusty target
reflections, the amplitude is decreasing with the increase in depth of the hyperbolic points.
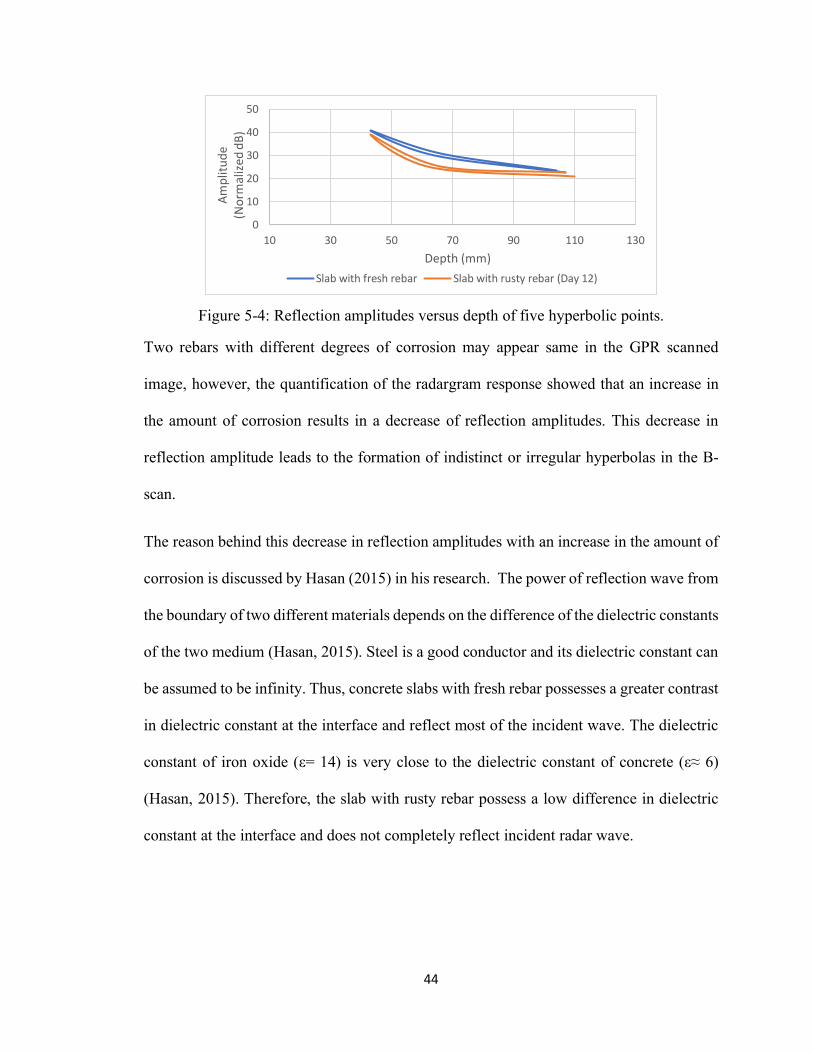
Secondly, for each respective point of the hyperbola, the amplitude for the fresh rebar is
higher than the rusty rebar, as demonstrated in Fig. 5-3. Likewise, with the increase in the
degree of corrosion, there is a decrease in reflection amplitudes of the target (Fig. 5-4).
Table 5-4: Reflection amplitude on five points of hyperbola of fresh rebar
2-Way Time (ns) Depth mm (in.) Amplitude (Normalized dB)
1.702 104 (4.1) 23.32
1.07 66 (2.58) 30.92
0.696 43 (1.68) 40.58
1.047 64 (2.52) 30.08
1.749 107 (4.21) 22.51
43
Table 5-5: Reflection amplitude on five points of hyperbola of rusty rebar (6 days in Q-Fog)
2-Way Time (ns) Depth mm (in.) Amplitude (Normalized dB)
1.868 114 (4.5) 23.23
1.002 61 (2.41) 30.32
0.721 44 (1.74) 37.71
0.955 58 (2.3) 32.74
1.727 106 (4.16) 20.68
Table 5-6: Reflection amplitude on five points of hyperbola of rusty rebar (12 days in Q-Fog)
2-Way Time (ns) Depth mm (in.) Amplitude (Normalized dB)
1.751 107 (4.22) 22.55
1.072 66 (2.58) 25.33
0.697 43 (1.68) 38.85
1.025 63 (2.47) 24.82
1.797 110 (4.33) 20.86
Figure 5-3: Reflection amplitudes versus depth of five hyperbolic points.
0
10
20
30
40
50
10 30 50 70 90 110 130
Am
plit
ud
e
(No
rmal
ized
dB
)
Depth (mm)
Slab with fresh rebar Slab with rusty rebar (Day 6)
44
Figure 5-4: Reflection amplitudes versus depth of five hyperbolic points.
Two rebars with different degrees of corrosion may appear same in the GPR scanned
image, however, the quantification of the radargram response showed that an increase in
the amount of corrosion results in a decrease of reflection amplitudes. This decrease in
reflection amplitude leads to the formation of indistinct or irregular hyperbolas in the B-
scan.
The reason behind this decrease in reflection amplitudes with an increase in the amount of
corrosion is discussed by Hasan (2015) in his research. The power of reflection wave from
the boundary of two different materials depends on the difference of the dielectric constants
of the two medium (Hasan, 2015). Steel is a good conductor and its dielectric constant can
be assumed to be infinity. Thus, concrete slabs with fresh rebar possesses a greater contrast
in dielectric constant at the interface and reflect most of the incident wave. The dielectric
constant of iron oxide (ε= 14) is very close to the dielectric constant of concrete (ε≈ 6)
(Hasan, 2015). Therefore, the slab with rusty rebar possess a low difference in dielectric
constant at the interface and does not completely reflect incident radar wave.
0
10
20
30
40
50
10 30 50 70 90 110 130
Am
plit
ud
e (N
orm
aliz
ed d
B)
Depth (mm)
Slab with fresh rebar Slab with rusty rebar (Day 12)
45
5.2 Results from Field Experiments
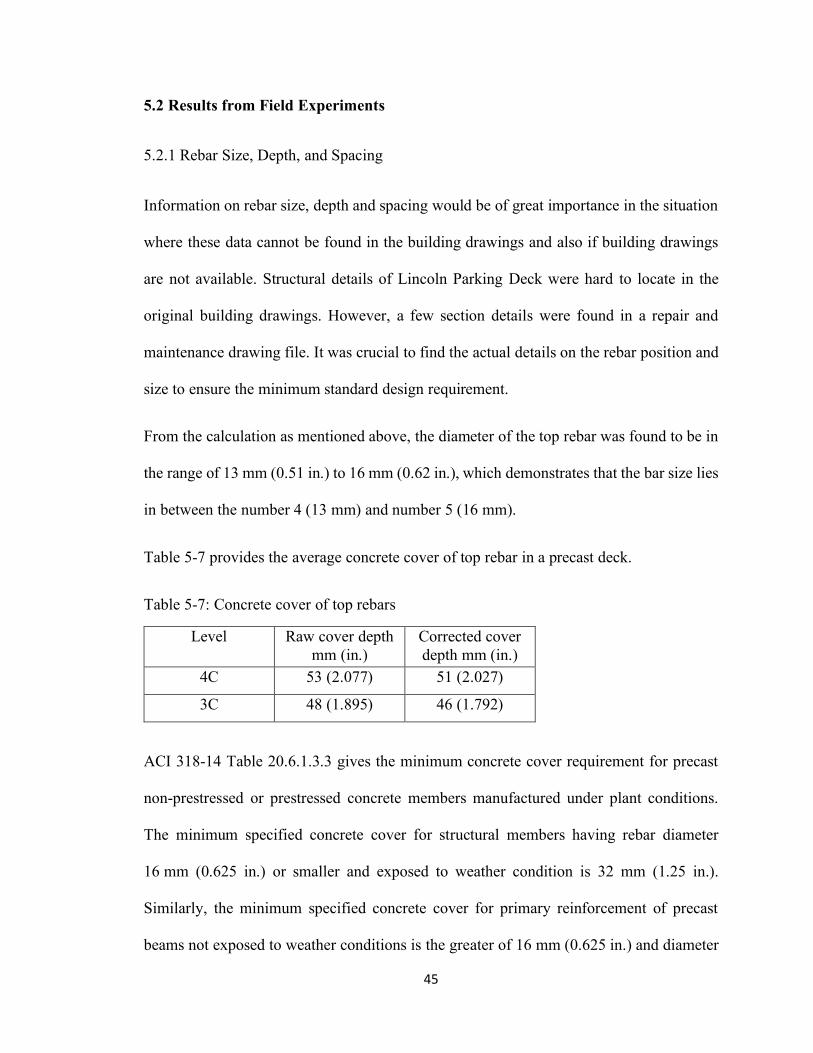
5.2.1 Rebar Size, Depth, and Spacing
Information on rebar size, depth and spacing would be of great importance in the situation
where these data cannot be found in the building drawings and also if building drawings
are not available. Structural details of Lincoln Parking Deck were hard to locate in the
original building drawings. However, a few section details were found in a repair and
maintenance drawing file. It was crucial to find the actual details on the rebar position and
size to ensure the minimum standard design requirement.
From the calculation as mentioned above, the diameter of the top rebar was found to be in
the range of 13 mm (0.51 in.) to 16 mm (0.62 in.), which demonstrates that the bar size lies
in between the number 4 (13 mm) and number 5 (16 mm).
Table 5-7 provides the average concrete cover of top rebar in a precast deck.
Table 5-7: Concrete cover of top rebars
Level Raw cover depth mm (in.)
Corrected cover depth mm (in.)
4C 53 (2.077) 51 (2.027)
3C 48 (1.895) 46 (1.792)
ACI 318-14 Table 20.6.1.3.3 gives the minimum concrete cover requirement for precast
non-prestressed or prestressed concrete members manufactured under plant conditions.
The minimum specified concrete cover for structural members having rebar diameter
16 mm (0.625 in.) or smaller and exposed to weather condition is 32 mm (1.25 in.).
Similarly, the minimum specified concrete cover for primary reinforcement of precast
beams not exposed to weather conditions is the greater of 16 mm (0.625 in.) and diameter
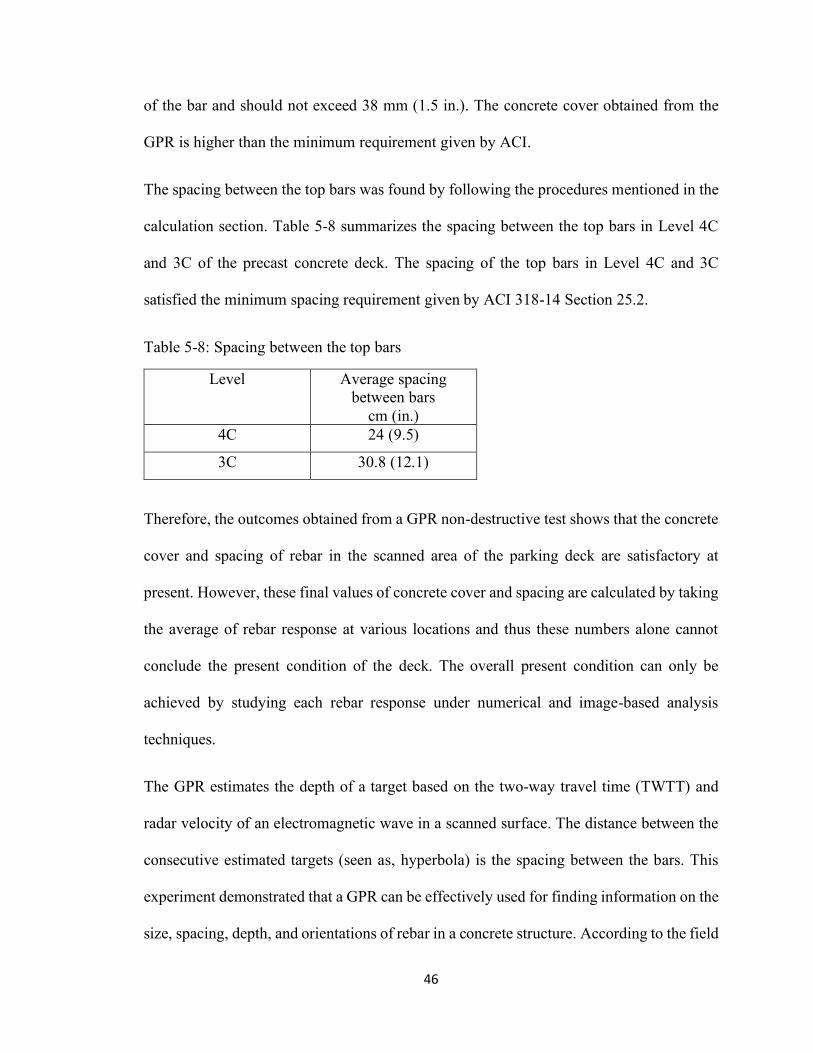
46
of the bar and should not exceed 38 mm (1.5 in.). The concrete cover obtained from the
GPR is higher than the minimum requirement given by ACI.
The spacing between the top bars was found by following the procedures mentioned in the
calculation section. Table 5-8 summarizes the spacing between the top bars in Level 4C
and 3C of the precast concrete deck. The spacing of the top bars in Level 4C and 3C
satisfied the minimum spacing requirement given by ACI 318-14 Section 25.2.
Table 5-8: Spacing between the top bars
Level Average spacing between bars
cm (in.) 4C 24 (9.5)
3C 30.8 (12.1)
Therefore, the outcomes obtained from a GPR non-destructive test shows that the concrete
cover and spacing of rebar in the scanned area of the parking deck are satisfactory at
present. However, these final values of concrete cover and spacing are calculated by taking
the average of rebar response at various locations and thus these numbers alone cannot
conclude the present condition of the deck. The overall present condition can only be
achieved by studying each rebar response under numerical and image-based analysis
techniques.
The GPR estimates the depth of a target based on the two-way travel time (TWTT) and
radar velocity of an electromagnetic wave in a scanned surface. The distance between the
consecutive estimated targets (seen as, hyperbola) is the spacing between the bars. This
experiment demonstrated that a GPR can be effectively used for finding information on the
size, spacing, depth, and orientations of rebar in a concrete structure. According to the field
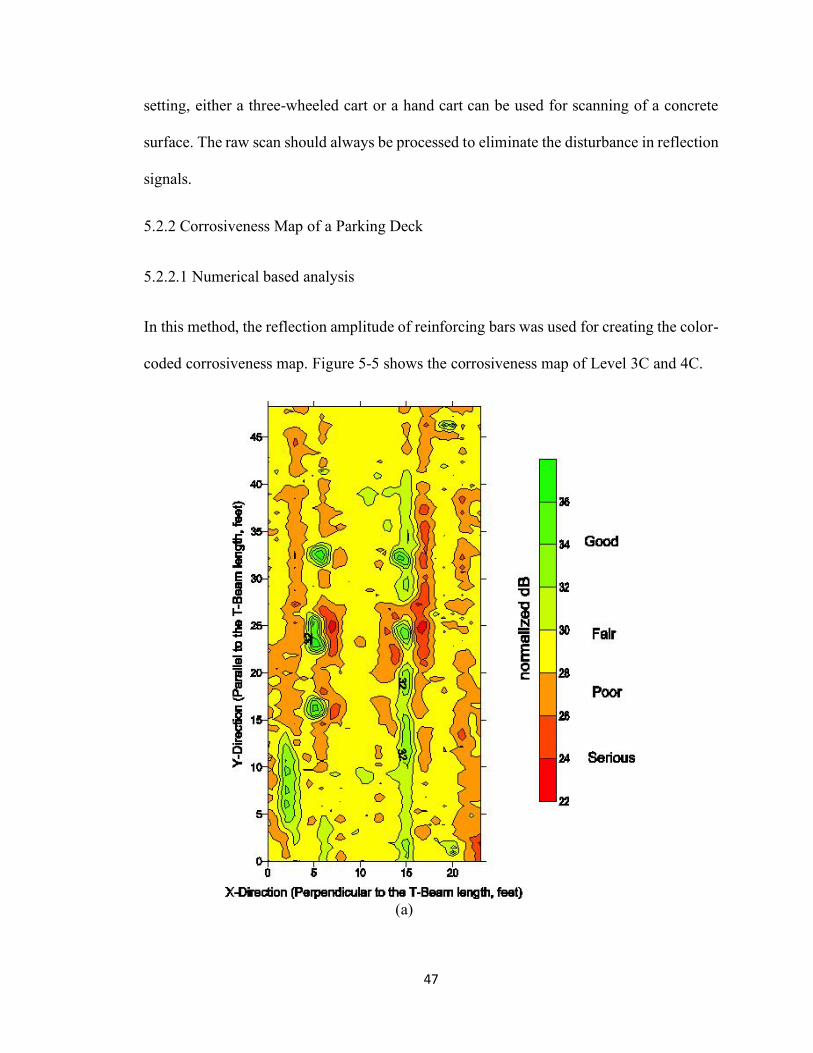
47
setting, either a three-wheeled cart or a hand cart can be used for scanning of a concrete
surface. The raw scan should always be processed to eliminate the disturbance in reflection
signals.
5.2.2 Corrosiveness Map of a Parking Deck
5.2.2.1 Numerical based analysis
In this method, the reflection amplitude of reinforcing bars was used for creating the color-
coded corrosiveness map. Figure 5-5 shows the corrosiveness map of Level 3C and 4C.
(a)
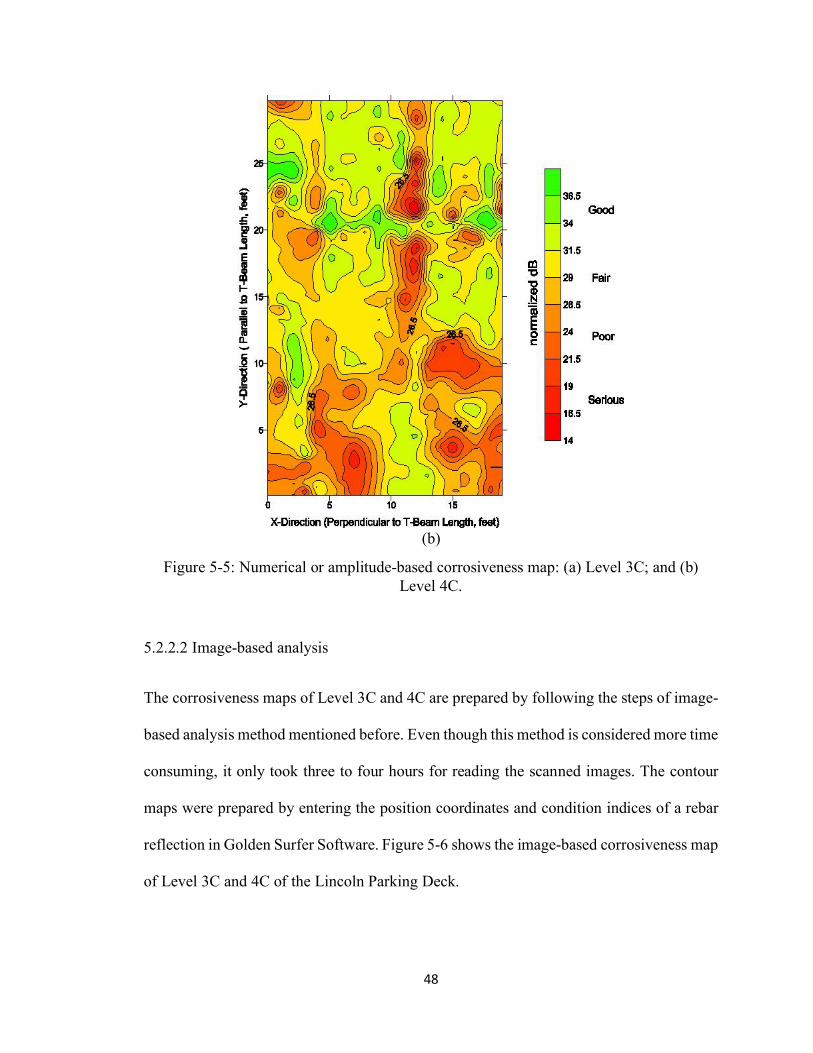
48
(b)
Figure 5-5: Numerical or amplitude-based corrosiveness map: (a) Level 3C; and (b) Level 4C.
5.2.2.2 Image-based analysis
The corrosiveness maps of Level 3C and 4C are prepared by following the steps of image-
based analysis method mentioned before. Even though this method is considered more time
consuming, it only took three to four hours for reading the scanned images. The contour
maps were prepared by entering the position coordinates and condition indices of a rebar
reflection in Golden Surfer Software. Figure 5-6 shows the image-based corrosiveness map
of Level 3C and 4C of the Lincoln Parking Deck.
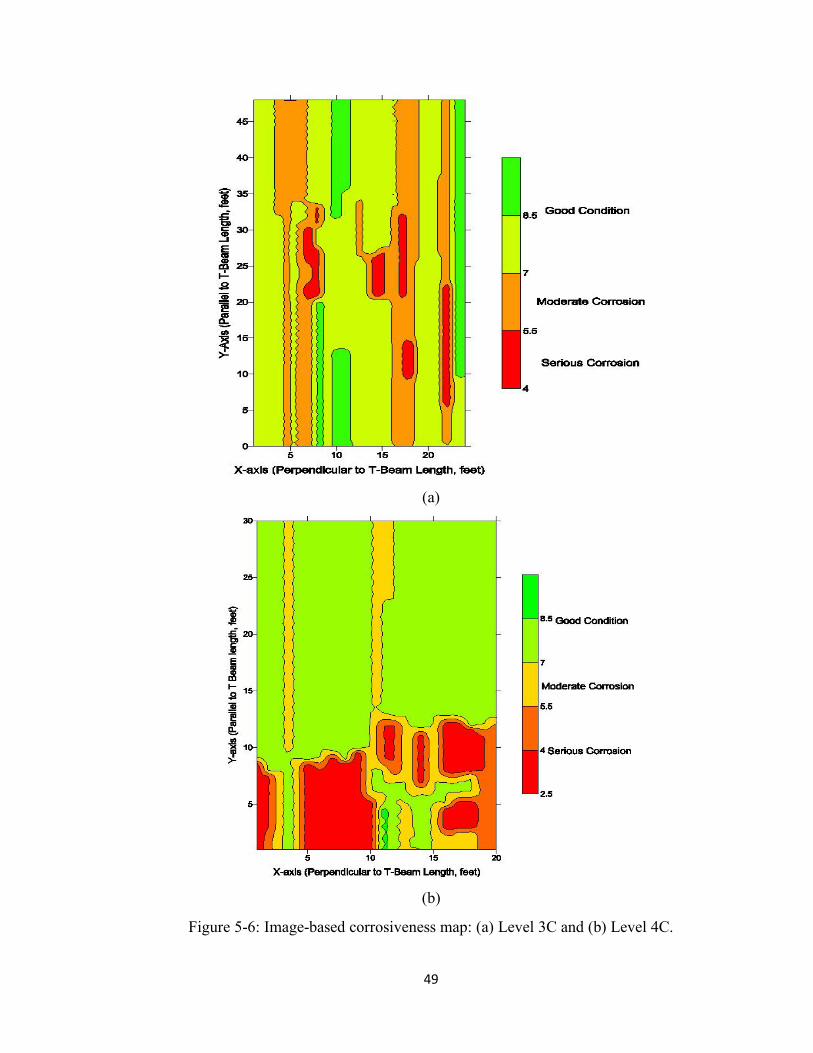
49
(a)
(b)
Figure 5-6: Image-based corrosiveness map: (a) Level 3C and (b) Level 4C.
50
The numerical based corrosiveness map of Level 3C shows most of the scanned area in a
fair condition (yellow). On the other hand, the image-based corrosiveness map of Level 3C
shows the same area in a satisfactory condition (light green). For further investigation,
radargrams (B-scan) of Level 3C were studied. It was found that most of the rebar reflection
in this region had strong, uniform and clear shape hyperbolas. However, the reflection
amplitudes associated with these hyperbolas were relatively small compared to the
maximum amplitudes. This is due to the increase in the target depth in this region.
Therefore, it has been observed that the amplitude analysis does not consider the depth
variations while making corrosiveness maps, which may lead to the false representation of
the surface condition.
Following the same trend as in the previous level, the serious condition predicted in a few
regions of the numerical based map of Level 4C can be observed as a moderate condition
in image-based map. The study of the radargrams revealed that reflected hyperbolas in this
area are in uniform and clear shape but their amplitudes are affected by some disturbances
in the scans.
While evaluating the numerical based and image-based corrosiveness map, it was
understood that both methods can correctly identify the sensitive zones (red) but in some
cases, the numerical based analysis might over-predict the condition as this method is
solely based upon the reflection amplitudes of a target. Therefore, it can be concluded that
the full-scale assessment cannot be achieved by the numerical method alone. Additionally,
results obtained from one testing method should always be evaluated with other available
methods for further validation.
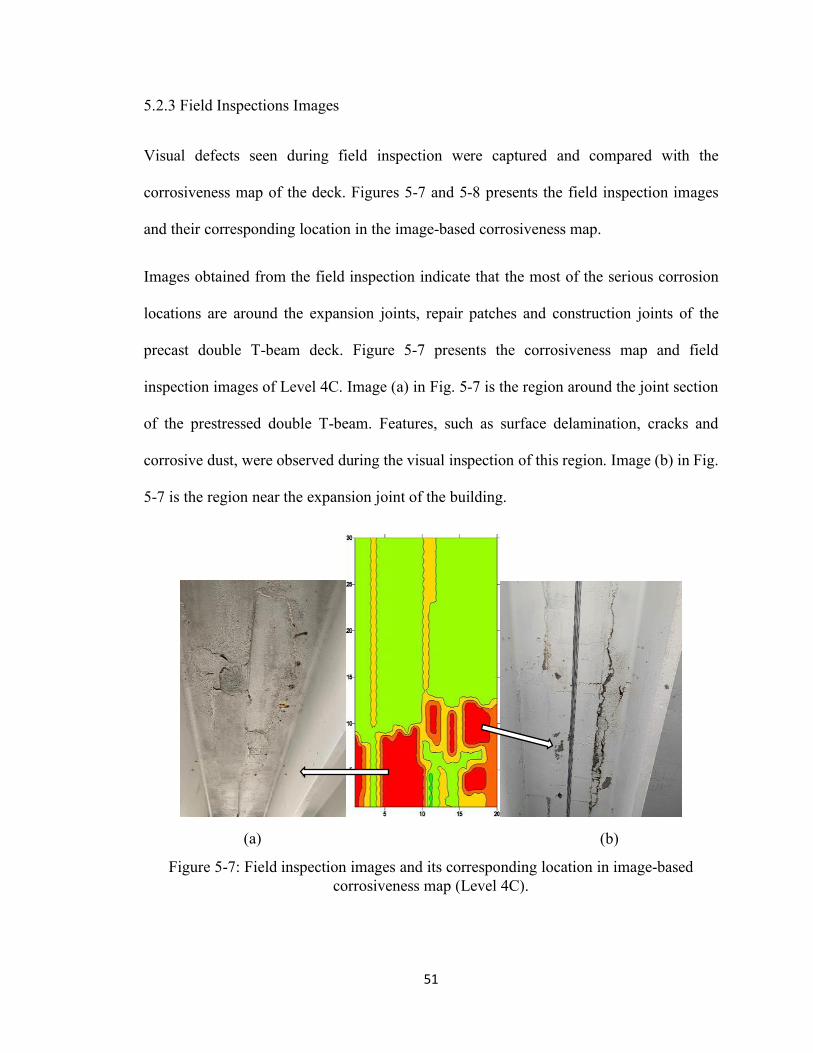
51
5.2.3 Field Inspections Images
Visual defects seen during field inspection were captured and compared with the
corrosiveness map of the deck. Figures 5-7 and 5-8 presents the field inspection images
and their corresponding location in the image-based corrosiveness map.
Images obtained from the field inspection indicate that the most of the serious corrosion
locations are around the expansion joints, repair patches and construction joints of the
precast double T-beam deck. Figure 5-7 presents the corrosiveness map and field
inspection images of Level 4C. Image (a) in Fig. 5-7 is the region around the joint section
of the prestressed double T-beam. Features, such as surface delamination, cracks and
corrosive dust, were observed during the visual inspection of this region. Image (b) in Fig.
5-7 is the region near the expansion joint of the building.
(a) (b)
Figure 5-7: Field inspection images and its corresponding location in image-based corrosiveness map (Level 4C).
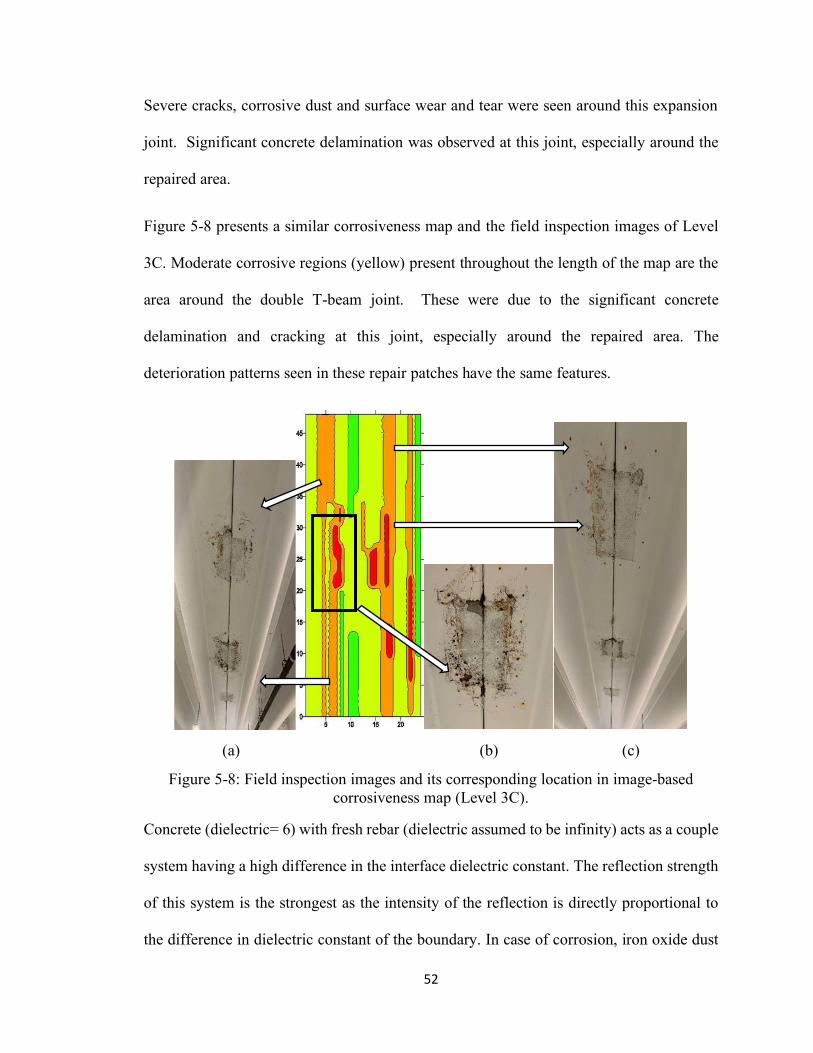
52
Severe cracks, corrosive dust and surface wear and tear were seen around this expansion
joint. Significant concrete delamination was observed at this joint, especially around the
repaired area.
Figure 5-8 presents a similar corrosiveness map and the field inspection images of Level
3C. Moderate corrosive regions (yellow) present throughout the length of the map are the
area around the double T-beam joint. These were due to the significant concrete
delamination and cracking at this joint, especially around the repaired area. The
deterioration patterns seen in these repair patches have the same features.
(a) (b) (c)
Figure 5-8: Field inspection images and its corresponding location in image-based corrosiveness map (Level 3C).
Concrete (dielectric= 6) with fresh rebar (dielectric assumed to be infinity) acts as a couple
system having a high difference in the interface dielectric constant. The reflection strength
of this system is the strongest as the intensity of the reflection is directly proportional to
the difference in dielectric constant of the boundary. In case of corrosion, iron oxide dust
53
(dielectric= 14) present in the rebar decreases the dielectric constant difference of the
boundary resulting in a weak reflection. Moreover, changes in the properties of concrete
and the presence of iron oxide dust are the causes of the abnormal GPR image response.
With the help of GPR scanned images and the visual inspection survey, the present
structural condition of the parking deck has been proposed. Further validation of the result
can be performed by using other available non-destructive techniques and destructive
samples from the site. The corrosiveness map and visual inspection results illustrate that
the overall condition of the surveyed deck is in satisfactory condition except for a few
critical regions that may require repair.
54
Chapter 6 Conclusions and Recommendations
6.1 Conclusions
Firstly, four different slabs, two having fresh rebar and the other two having rusted rebar,
were prepared in the laboratory. The GPR scans from these laboratory slabs were taken to
study the response from the fresh and the rusty bars. The condition assessment of the
Lincoln Parking Deck at Youngstown State University was carried out using a GSSI SIR
4000 mainframe and 1.6 GHz antenna system housed in a three-wheel survey cart. B-scans
obtained from the GPR field survey were post processed and information on rebar position
and size were acquired by quantifying the radargram response. The amplitudes of a target
from the B-scans were extracted to prepare a corrosiveness map using Golden Surfer
Software. Also, the corrosiveness map based on the GPR image response was prepared.
These maps obtained from two different process were compared. The visual inspection of
the surveyed deck was carried to find out the real surface condition of the field. Finally,
the corrosiveness map was analyzed to understand the present condition of the surveyed
parking deck area.
6.2 Recommendations
The main objective of this research was to find the structural condition of a parking deck
using a GPR. Small scale laboratory slabs having fresh and rusted steel bars were
constructed for studying the nature of GPR scans. The reflection amplitudes of a metal
target (rebar) showed a decreasing trend with increasing target depth. The reflection
amplitudes of each point in the hyperbola were decreasing with the increase in the degree
of corrosion. Similarly, with the increase in the amount of corrosion, the B-scan image of
55
rebar displayed a decrease in smoothness, brightness, and visibility of the reflected
hyperbolas. These findings were taken into account while developing the corrosiveness
map of the parking deck. The objective of demonstrating GPR as a reliable non-destructive
technique was achieved by performing the survey in the section of a prestressed double T-
beam of the parking structure. A three-wheeled survey cart by GSSI worked best for
surveying the concrete deck as it was easy to drag the antenna, which was housed at the
bottom (Ground Coupled System) of the cart. This GPR field survey provided the
information on rebar forms and conditions inside the prestressed concrete. The GPR-IBA
method provided the most accurate condition map of a surveyed deck by separating the
actual defects related to corrosion, which could be over or under predicted by the numerical
method. The corrosiveness map of a parking deck clearly indicated the locations of good,
moderate, and severe regions in the survey plots. The visual inspection of the precast deck
provided information on the surface condition. The defect areas observed during the visual
inspection coincided with the severe regions in the corrosiveness map. Repair patches in a
double T-beam joint have a similar nature of deterioration. Most of the cracks were seen
around the expansion joints of the structure. These cracks and delamination near the
expansion joint and repair patches have initiated the chlorination induced corrosion in the
precast deck. As a result, corrosion dust is visible around these critical regions. Severely
cracked zones must be repaired, and effective renovation measures must be taken to
eliminate the further cracking of concrete and prevent further formation of corrosion.
The outcomes obtained from this research proved that GPR can be used as an effective tool
for finding information of rebar in concrete. Interpreting GPR responses is one of the
challenging steps during this assessment. However, basic information from the GPR
56
response can always be extracted based on the fundamental principles of an
electromagnetic radar wave. The GPR results can be further validated by using other non-
destructive techniques and destructive core samples from the site. Nonetheless, one proper
set of assessment should always be carried out in the first place before validating any result.
For the complete set of assessment, a GPR can be reliable and easy tool to follow.
The interaction of reinforced concrete structures with different physical, mechanical, and
chemical factors lead to its deterioration. Proper repair and renovation measures are always
important for keeping the structure safe from further damage. Carrying out destructive
testing for finding the structural condition may not be possible in every case and can be
more expensive and damaging to the service life of a structure. Thus, proper non-
destructive techniques are key for assessing the structures without damaging its integrity.
A GPR provides a clear picture (hyperbolic reflection) of a target inside the concrete, which
is interpreted for the condition assessment of a structure. Further enhancement in the
application of GPR can be achieved by learning the response of its electromagnetic radar
wave to different types of deteriorated concrete environment. As concrete itself is a
complex composite material, its interaction with different factors results in even more
complicated reactions. Therefore, reinforcement bars inside this concrete go through
various corrosion cycles.
During the laboratory experiment, the rebar corrosion was created in an isolated form, so
it did not consider other concrete influences that play a role in the deterioration of the slab.
Also, the laboratory experiment was done at the room temperature. In the real field, both
concrete and rebar undergo continuous deterioration over time under various weather
conditions. Thus, these factors should be taken into account for better and accurate results.
57
REFERENCES
Abouhamad, Mona, et al. “Corrosiveness Mapping of Bridge Decks Using Image-Based Analysis of GPR Data.” Automation in Construction, vol. 80, Aug. 2017, pp. 104–17. ScienceDirect, doi:10.1016/j.autcon.2017.03.004.
ACI Committe 318. Building Code Requirements for Structural Concrete (ACI 318-14). 2014. www.academia.edu, https://www.academia.edu/35050638/Building_Code_Requirements_for_Structural_Concrete_ACI_318-14_Commentary_on_Building_Code_Requirements_for_Structural_Concrete_ACI_.
Alani, Amir M., et al. “Applications of Ground Penetrating Radar (GPR) in Bridge Deck Monitoring and Assessment.” Journal of Applied Geophysics, vol. 97, Oct. 2013, pp. 45–54. ScienceDirect, doi:10.1016/j.jappgeo.2013.04.009.
ASCE. 2017-Infrastructure-Report-Card.Pdf. 2017, https://www.infrastructurereportcard.org/wp-content/uploads/2016/10/2017-Infrastructure-Report-Card.pdf.
Azari, Hoda. “Condition Assessment of Concrete Bridge Deck Using GPR.” Federal Highway Administration (FHWA), Sept. 2016, p. 16. doi:https://www.fhwa.dot.gov/publications/ltbpnews/15073.pdf.
Bachiri, Tahar, et al. “Bridge Deck Condition Assessment by Using GPR: A Review.” MATEC Web of Conferences, edited by A. Khamlichi, vol. 191, 2018, p. 00004. doi:10.1051/matecconf/201819100004.
Cusatis, G., et al. “(14) (PDF) Aging and Deterioration of Concrete Structures: Learning from the Past, Assessing the Present, and Predicting the Future; Science or Magic?” ResearchGate, 2015, https://www.researchgate.net/publication/282117307_Aging_and_Deterioration_of_Concrete_Structures_Learning_from_the_Past_Assessing_the_Present_and_Predicting_the_Future_Science_or_Magic.
Daniels, Jeffrey J. “(14) (PDF) Ground Penetrating Radar Fundamentals.” ResearchGate, Nov. 2000,
58
https://www.researchgate.net/publication/237508286_Ground_Penetrating_Radar_Fundamentals.
Diamanti, Nectaria, et al. “(14) (PDF) Concrete Bridge Deck Deterioration Assessment Using Ground Penetrating Radar (GPR).” ResearchGate, 1 June 2017, https://www.researchgate.net/publication/317422048_Concrete_Bridge_Deck_Deterioration_Assessment_Using_Ground_Penetrating_Radar_GPR.
Dinh, Kien, Tarek Zayed, et al. “(14) (PDF) GPR Image Analysis for Corrosion Mapping in Concrete Slabs.” ResearchGate, 2013, https://www.researchgate.net/publication/289566961_GPR_image_analysis_for_corrosion_mapping_in_concrete_slabs.
Dinh, Kien, Nenad Gucunski, and Trung H. Duong. “An Algorithm for Automatic Localization and Detection of Rebars from GPR Data of Concrete Bridge Decks.” Automation in Construction, vol. 89, May 2018, pp. 292–98. ScienceDirect, doi:10.1016/j.autcon.2018.02.017.
Dinh, Kien, Nenad Gucunski, Jinyoung Kim, et al. Attenuation-Based Methodology for Condition Assessment of Concrete Bridge Decks Using GPR. 2015. doi:10.22260/ISARC2015/0055.
Eisenmann, David, et al. “(14) (PDF) Ground Penetrating Radar Applied to Rebar Corrosion Inspection.” ResearchGate, Jan. 2013, https://www.researchgate.net/publication/258739189_Ground_penetrating_radar_applied_to_rebar_corrosion_inspection.
FHWA. “(1) (PDF) Reliability of Visual Inspection for Highway Bridges.” ResearchGate, 2001. www.researchgate.net, https://www.researchgate.net/publication/273680040_Reliability_of_Visual_Inspection_for_Highway_Bridges.
Geophysical Survey Systems, Inc. Antenna Manual. 2017, https://www.geophysical.com/resources/antenna-manual.
Geophysical Survey Systems, Inc. GSSI-Concrete Handbook. 2017, https://www.geophysical.com/products/structurescan-pro/gssi-concrete-handbook.
59
GSSI-BridgeScan-Handbook.Pdf. 2017, https://www.geophysical.com/wp-content/uploads/2017/10/GSSI-BridgeScan-Handbook.pdf.
GSSI-RADAN-7-Manual.Pdf. 2017, https://www.geophysical.com/wp-content/uploads/2017/10/GSSI-RADAN-7-Manual.pdf.
Geophysical Survey Systems, Inc. “GSSI-SIR 4000 Manual.” GSSI, 2017, https://www.geophysical.com/products/structurescan-pro/gssi-sir-4000-manual.
Hasan, Md Istiaque. Quantitative Non-Destructive Evaluation Of Rebar Diameter And Corrosion Damage In Concrete Using Ground Penetrating Radar. July 2015. rc.library.uta.edu, https://rc.library.uta.edu/uta-ir/handle/10106/25124.
Hoła, J., et al. “Non-Destructive and Semi-Destructive Diagnostics of Concrete Structures in Assessment of Their Durability.” Bulletin of the Polish Academy of Sciences Technical Sciences, vol. 63, no. 1, Mar. 2015, pp. 87–96.doi:10.1515/bpasts-2015-0010.
Huston, Dryver, et al. “Concrete Bridge Deck Condition Assessment with Automated Multisensor Techniques.” Structure and Infrastructure Engineering, vol. 7, no. 7–8, 2010, pp. 613–23.
Imani, A., et al. “Comprehensive Full-Depth Evaluation of Concrete Bridge Decks Based on GPR Surveys and Machine Learning.” SMAR 2019- Fifth Conference on Smart Monitoring, Assessment and Rehabilitation of Civil Structures, 2019, p. 8. doi:https://www.ndt.net/article/smar2019/papers/Tu.2.D.3.pdf.
Kim, Wooyoung, et al. “(14) (PDF) NON-DESTRUCTIVE TESTING (NDT) FOR CORROSION IN BRIDGE DECKS USING GPR.” ResearchGate, 2003, https://www.researchgate.net/publication/329221251_NON-DESTRUCTIVE_TESTING_NDT_FOR_CORROSION_IN_BRIDGE_DECKS_USING_GPR.
Maxy, Meera Elizabeth. Determination of Structural Health of the Lincoln Parking Deck at YSU. Youngstown State University, 2018. etd.ohiolink.edu, https://etd.ohiolink.edu/pg_10?0::NO:10:P10_ACCESSION_NUM:ysu1525857605951599.
60
Neal, Adrian. “(1) (PDF) Ground-Penetrating Radar and Its Use in Sedimentology: Principles, Problems and Progress.” ResearchGate, 2004. www.researchgate.net, https://www.researchgate.net/publication/223007907_Ground-penetrating_radar_and_its_use_in_sedimentology_Principles_problems_and_progress#fullTextFileContent.
Omar, Tarek. “Condition Assessment of Concrete Bridge Decks Using Ground and Airborne Infrared Thermography.” Electronic Thesis and Dissertation Repository. 5252., 2018, p. 254. doi:https://ir.lib.uwo.ca/etd/5252.
Omar, Tarek, and Moncef L. Nehdi. “Non-Destructive Testing of Bridge Deck Using Passive Infrared Thermography and Ground Penetrating Radar.” ResearchGate, 2016, https://www.researchgate.net/publication/308781521_Non-Destructive_Testing_of_Bridge_Deck_Using_Passive_Infrared_Thermography_and_Ground_Penetrating_Radar.
Parrillo, R. “BRIDGE DECK CONDITION ASSESSMENT USING GROUND PENETRATING RADAR.” ECNDT 2006-Tu.4.2.5, 2006, p. 12. doi:https://www.ndt.net/article/ecndt2006/doc/Tu.4.2.5.pdf.
Q-LAB Technical Bulletin LF-8144. Introduction to Cyclic Corrosion Testing. 2009, https://www.q-lab.com/documents/public/aaeb23ca-bb8a-4012-a763-2038a5927ff6.pdf.
RADAN 7 [Computer software]. Ver 7.5.18.02270. Salem, NH, Geophysical Survey Systems (GSSI), 2015.
Rathod, Harsh, et al. “Applicability of GPR and a Rebar Detector to Obtain Rebar Information of Existing Concrete Structures.” Case Studies in Construction Materials, vol. 11, Dec. 2019, p. e00240. ScienceDirect, doi:10.1016/j.cscm.2019.e00240.
Schabowicz, Krzysztof. “Non-Destructive Testing of Materials in Civil Engineering.” Materials, vol. 12, no. 19, Oct. 2019. PubMed Central, doi:10.3390/ma12193237.
Surfer [Computer software]. Ver 7.00. Golden, CO, Golden Software, Inc., 1999.
Tarussov, Alexander, et al. “Condition Assessment of Concrete Structures Using a New Analysis Method: Ground-Penetrating Radar Computer-Assisted Visual Interpretation.”
61
Construction and Building Materials, vol. 38, Jan. 2013, pp. 1246–54. ScienceDirect, doi:10.1016/j.conbuildmat.2012.05.026.
Topczewski, Lukasz. “(14) (PDF) Improvement and Application of Ground Penetrating Radar Non-Destructive Technique for the Concrete Bridge Inspection.” ResearchGate, July 2007, https://www.researchgate.net/publication/275957729_Improvement_and_application_of_Ground_Penetrating_Radar_Non-Destructive_Technique_for_the_concrete_bridge_inspection.
Yelf, Richard J. Application of Ground Penetrating Radar to Civil and Geotechnical Engineering. 2007, https://pdfs.semanticscholar.org/52bc/076faaa4ae67a8765c1a4c7f8f40e269eede.pdf.
Zaki, Ahmad, et al. “Experimental Assessment of Rebar Corrosion in Concrete Slab Using Ground Penetrating Radar (GPR).” International Journal of Corrosion, 2018, doi:https://doi.org/10.1155/2018/5389829.
Related Documents