Structural characterization and Curie temperature determination of a sodium strontium niobate ferroelectric nanostructured powder Silvania Lanfredi a , Diego H.M. Gˆ enova a , Iara A.O. Brito b , Alan R.F. Lima c , Marcos A.L. Nobre a,n a Faculdade de Ciˆ encias e Tecnologia, FCT, Univ Estadual Paulista, UNESP, P.O Box 467, Presidente Prudente-SP, Brazil b Instituto de Biociˆ encias, Letras e Ciˆ encias Exatas, Univ Estadual Paulista. UNESP, P.O Box 6154, S ~ ao Jose´ do Rio Preto-SP, Brazil c Departamento de Quı ´mica, Univ Estadual de Ponta Grossa, UEPG, Ponta Grossa, PR, Brazil article info Article history: Received 28 October 2010 Received in revised form 2 February 2011 Accepted 2 March 2011 Available online 10 March 2011 Keywords: Nanostructured powder Rietveld method Infrared spectroscopy Impedance spectroscopy Ferroelectric Curie temperature abstract The Curie temperature and its correlation with the magnitude of the displacement of the niobium atom from the center of [NbO 6 ] octahedra in NaSr 2 Nb 5 O 15 nanostructured powder were investigated. A single powder was prepared by high-energy ball milling. A powder with an average crystallite size of 37 nm was prepared by calcining the precursor at 1423 K. The refinement of the structural parameters was carried out by the Rietveld method. NaSr 2 Nb 5 O 15 exhibits tetragonal symmetry with the tungsten bronze structure (a ¼b ¼12.3495 (6) ˚ A, c ¼3.8911 (2) ˚ A, V ¼593.432 (5) ˚ A 3 , and Z ¼2). The site occupancy of the Na þ and Sr 2 þ cations and the interatomic distances between the niobium and oxygen atoms were derived. The [NbO 6 ] octahedron undergoes both rotation and tilting depending on the crystallographic site. The Curie temperature of the powder was derived using both the impedance and infrared spectroscopy methods. & 2011 Elsevier Inc. All rights reserved. 1. Introduction Niobates with a tetragonal tungsten bronze (TTB)-type struc- ture are of great scientific, technical, and industrial interest as materials for laser modulation, frequency multiplicity, and the generation of second harmonics for applications in pyroelectric detectors and piezoelectric transducers [1]. Some polycation ferroelectric oxides are also important for microwave telecom- munications involving satellite broadcasting and related devices [2]. In some cases, these materials have the potential to replace members of the classic set of ferroelectric ceramics, such as Pb(Zr,Ti)O 3 (PZT), [(Pb(Mg 1/3 Nb 2/3 )O 3 ] (PMN), and [(Pb,La) (Zr,Ti)O 3 ] (PLZT) [3]. Furthermore, dielectric, thermistor, and chemical sensor properties can be expected. In the last few years, alkaline and alkaline earth niobates with TTB-type structures, such as KSr 2 Nb 5 O 15 , NaSr 2 Nb 5 O 15 , KBa 2 Nb 5 O 15 , NaBa 2 Nb 5 O 15 , and K 3 Li 2 Nb 5 O 15 , have been studied due to the high anisotropy of their crystalline structure [4]. The TTB structure can be consid- ered as a derivative of the classical perovskite structure. It can be described by the chemical formula (A1) 2 (A2) 4 C 4 Nb 10 O 30 . A1, A2, and C denote different oxygen sites in the crystal structure. The A1 cavities have cuboctahedral coordination, the A2 cavities have pentacapped pentagonal prismatic coordination, and the C cav- ities have tricapped trigonal prismatic coordination. The cavity size decreases in the following order: A2 4A1 4C. In TTB-type compounds, alkaline and/or alkaline-earth metals are located in the A1 and A2 sites, while only small cations like Li are found in the C site [5]. Taking into account the TTB-type structure, a wide variety of cation substitutions is possible. In a broad sense, TTB-type compounds with the A 6 Nb 10 O 30 formula, where A ¼ Sr, Ba, are semiconductor oxides containing Nb 5 þ cations. In a TTB- type structure, the coexistence of cations is favorable in both the tetragonal and pentagonal sites. In some of them, cation reparti- tion disorder has been correlated to relaxer behavior [6]. Among TTB-type oxides, the classical ferroelectric quaternary niobates are of particular relevance. The size and type of replacement ions at different sites of the structure and the degree of disorder have a significant effect on the dielectric properties. In particular, the Curie temperature (T C ) is influenced by these parameters. In fact, the value of T C depends on the octahedron distortion [7] because the T C can be changed by application of hydrostatic pressure, which gives rise to further octahedral distortion [8]. In addition, the crystallite size can affect the domain size, and the degree of cooperation between domains can modify the Curie temperature [9]. As a matter of fact, the method of preparation or synthesis and its macroscopic variables, such as the cooling rate and calcination temperature, can change structural properties such as the space group [10]. Alkali–metal Contents lists available at ScienceDirect journal homepage: www.elsevier.com/locate/jssc Journal of Solid State Chemistry 0022-4596/$ - see front matter & 2011 Elsevier Inc. All rights reserved. doi:10.1016/j.jssc.2011.03.001 n Corresponding author. Fax: þ55 18 3221 5682. E-mail address: [email protected] (M.A. Nobre). Journal of Solid State Chemistry 184 (2011) 990–1000

Welcome message from author
This document is posted to help you gain knowledge. Please leave a comment to let me know what you think about it! Share it to your friends and learn new things together.
Transcript
Journal of Solid State Chemistry 184 (2011) 990–1000
Contents lists available at ScienceDirect
Journal of Solid State Chemistry
0022-45
doi:10.1
n Corr
E-m
journal homepage: www.elsevier.com/locate/jssc
Structural characterization and Curie temperature determination of a sodiumstrontium niobate ferroelectric nanostructured powder
Silvania Lanfredi a, Diego H.M. Genova a, Iara A.O. Brito b, Alan R.F. Lima c, Marcos A.L. Nobre a,n
a Faculdade de Ciencias e Tecnologia, FCT, Univ Estadual Paulista, UNESP, P.O Box 467, Presidente Prudente-SP, Brazilb Instituto de Biociencias, Letras e Ciencias Exatas, Univ Estadual Paulista. UNESP, P.O Box 6154, S ~ao Jose do Rio Preto-SP, Brazilc Departamento de Quımica, Univ Estadual de Ponta Grossa, UEPG, Ponta Grossa, PR, Brazil
a r t i c l e i n f o
Article history:
Received 28 October 2010
Received in revised form
2 February 2011
Accepted 2 March 2011Available online 10 March 2011
Keywords:
Nanostructured powder
Rietveld method
Infrared spectroscopy
Impedance spectroscopy
Ferroelectric
Curie temperature
96/$ - see front matter & 2011 Elsevier Inc. A
016/j.jssc.2011.03.001
esponding author. Fax: þ55 18 3221 5682.
ail address: [email protected] (M.A. Nob
a b s t r a c t
The Curie temperature and its correlation with the magnitude of the displacement of the niobium atom
from the center of [NbO6] octahedra in NaSr2Nb5O15 nanostructured powder were investigated. A single
powder was prepared by high-energy ball milling. A powder with an average crystallite size of 37 nm
was prepared by calcining the precursor at 1423 K. The refinement of the structural parameters was
carried out by the Rietveld method. NaSr2Nb5O15 exhibits tetragonal symmetry with the tungsten
bronze structure (a¼b¼12.3495 (6) A, c¼3.8911 (2) A, V¼593.432 (5) A3, and Z¼2). The site
occupancy of the Naþ and Sr2þ cations and the interatomic distances between the niobium and
oxygen atoms were derived. The [NbO6] octahedron undergoes both rotation and tilting depending on
the crystallographic site. The Curie temperature of the powder was derived using both the impedance
and infrared spectroscopy methods.
& 2011 Elsevier Inc. All rights reserved.
1. Introduction
Niobates with a tetragonal tungsten bronze (TTB)-type struc-ture are of great scientific, technical, and industrial interest asmaterials for laser modulation, frequency multiplicity, and thegeneration of second harmonics for applications in pyroelectricdetectors and piezoelectric transducers [1]. Some polycationferroelectric oxides are also important for microwave telecom-munications involving satellite broadcasting and relateddevices [2]. In some cases, these materials have the potential toreplace members of the classic set of ferroelectric ceramics, suchas Pb(Zr,Ti)O3 (PZT), [(Pb(Mg1/3Nb2/3)O3] (PMN), and [(Pb,La)(Zr,Ti)O3] (PLZT) [3]. Furthermore, dielectric, thermistor, andchemical sensor properties can be expected. In the last few years,alkaline and alkaline earth niobates with TTB-type structures,such as KSr2Nb5O15, NaSr2Nb5O15, KBa2Nb5O15, NaBa2Nb5O15, andK3Li2Nb5O15, have been studied due to the high anisotropy oftheir crystalline structure [4]. The TTB structure can be consid-ered as a derivative of the classical perovskite structure. It can bedescribed by the chemical formula (A1)2(A2)4C4Nb10O30. A1, A2,and C denote different oxygen sites in the crystal structure. TheA1 cavities have cuboctahedral coordination, the A2 cavities have
ll rights reserved.
re).
pentacapped pentagonal prismatic coordination, and the C cav-ities have tricapped trigonal prismatic coordination. The cavitysize decreases in the following order: A24A14C. In TTB-typecompounds, alkaline and/or alkaline-earth metals are located inthe A1 and A2 sites, while only small cations like Li are found inthe C site [5]. Taking into account the TTB-type structure, awide variety of cation substitutions is possible. In a broad sense,TTB-type compounds with the A6Nb10O30 formula, where A¼Sr,Ba, are semiconductor oxides containing Nb5þ cations. In a TTB-type structure, the coexistence of cations is favorable in both thetetragonal and pentagonal sites. In some of them, cation reparti-tion disorder has been correlated to relaxer behavior [6]. AmongTTB-type oxides, the classical ferroelectric quaternary niobatesare of particular relevance.
The size and type of replacement ions at different sites of thestructure and the degree of disorder have a significant effect onthe dielectric properties. In particular, the Curie temperature (TC)is influenced by these parameters. In fact, the value of TC dependson the octahedron distortion [7] because the TC can be changed byapplication of hydrostatic pressure, which gives rise to furtheroctahedral distortion [8]. In addition, the crystallite size can affectthe domain size, and the degree of cooperation between domainscan modify the Curie temperature [9]. As a matter of fact, themethod of preparation or synthesis and its macroscopic variables,such as the cooling rate and calcination temperature, can changestructural properties such as the space group [10]. Alkali–metal
S. Lanfredi et al. / Journal of Solid State Chemistry 184 (2011) 990–1000 991
niobate powders are typically prepared via a solid-state reaction.However, this method does not always lead to a homogeneousmixture of starting materials. The synthesis of polycation niobatesby chemical methods leads to the simultaneous improvement ofthe stoichiometry, texture control, chemical homogeneity, phasepurity, and other parameters [11]. Recently, powder preparationbased on the mechanical mixture of oxide/carbonates by high-energy ball milling has been reported, and this preparation candecrease the size of the precursor to the scale of nanometers [12].Unfortunately, most of the information on the Curie temperaturehas been derived from crystals and ceramics with large grainsizes. At present, there is a lack of data on the Curie temperatureof powders.
In this work, the spontaneous polarization of a powder ofNaSr2Nb5O15, its correlation with structural characteristics, and[NbO6] octahedron distortion were analyzed. The lattice para-meters and atomic positions of TTB-type NaSr2Nb5O15 weredetermined by structure refinement using the Rietveld method.The site occupancy by Naþ and Sr2þ and the interatomicdistances between niobium atoms were derived. The Curietemperature was determined using the structural parametersand showed an excellent agreement with the experimental Curietemperature.
2. Experimental procedure
2.1. Synthesis
NaSr2Nb5O15 nanostructured powder was prepared by themechanical mixture of oxides via high-energy ball milling(HEBM) [12]. The starting P.A. reagents were hydrated niobiumoxide (Nb2O5 �4 H2O), which were used to prepare the precursorpowder.
The preparation was carried out using a HEBM type Attritor(Netzsch) with a milling chamber of zirconium (600 ml) that wascooled with circulation water throughout the process. The mix-ture of the starting materials was carried out in isopropylicalcohol using stabilized zirconia balls of 1.2 mm in diameter.A powder to ball weight ratio of 1:16 was used. The mixture wasagitated with a Molinex-type agitator shaft with eccentric radialdisks that accelerated the grinding media, which gave an extraradial impulse during each rotation of the shaft with a motor of1/3 hp. The milling was performed with a rate of 1200 rpm for 5 h.
After milling the reagents, the material was dried in a glovebox with forced air flow at 373 K. Single phase powders wereobtained after calcination at 1423 K for 12 h. The precursor wascalcined in a tube furnace under an integral oxygen atmosphere.An oxygen flow of 300 mL/min was maintained during a completethermal cycle. Powder was deagglomerated in agate mortar witha 350-mesh minimum.
The powder was characterized by X-ray diffraction and infra-red spectroscopy. A fraction of this powder was uniaxially pressedinto pellet form. The green compact was retreated at 1423 K in airfor 2 h at a heating rate of 2.0 K/min. A relative density equal to65% of the theoretical density was reached. The aim of thethermal treatment of the powder compact at the same calcinationtemperature was to eliminate adsorbed gases on the particleinterfaces and release compaction stress. The average crystallitesize was assumed to be equal or very close to the averagecrystallite size of the nanostructured powder. In practice, thedevelopment of large domains and further interaction betweenthem is blocked.
Thus, the additional contribution to the dielectrical propertiesstemming from the cooperative phenomenon assigned to largedomains is prevented. Furthermore, the magnitude of the
intrinsic defect distribution and microstrain in the crystallinelattice were close to the original ones. Therefore, the Curietemperature of a nanostructured powder might be derived witha high level of confidence via impedance spectroscopy.
2.2. Dielectrical characterization
Dielectric measurements were carried out by impedancespectroscopy. Platinum electrodes were deposited on both facesof the sample with a platinum paste coating (TR-7905—Tanaka).After complete solvent evaporation, the sample was dried at1073 K for 30 min. Measurements were taken in the frequencyrange of 5 Hz–13 MHz, with an applied potential of 500 mV usingan Impedance Analyzer Alpha N High Resolution Dielectric fromNovocontrol GmbH, which was controlled by a personal compu-ter. The sample was placed in a sample holder with a two-electrode configuration. Measurements were taken from roomtemperature to 700 K in 50-K steps at a heating rate equal to1.0 K/min in air. A 30-min interval was used prior to thermalstabilization before each measurement. The data were plottedusing the complex plane formalism, Z0(o) versus Z00(o), andanalyzed with Boukamp’s EQUIVCRT software. This programworks in an environment developed for equivalent electriccircuits based on the fitting of the emittance spectra data [13].The impedance of a ceramic can be represented by Zn(o)¼Zgn(o)þZgb
n (o), where Zgn(o) and Zgb
n (o) correspond to the impe-dance of the grain and grain boundary, respectively.
The complex dielectric permittivity, en(o), can be derived fromimpedance data, Zn(o), Zn(o)¼Z0(o)þ jZ00(o), using the followingrelations:
e�ðoÞ ¼ ðjoCoZ�Þ�1¼ e0ðoÞþ je00ðoÞ ð1Þ
where e0(o) and e00(o) represent the real and imaginary parts ofthe permittivity, respectively and Co is the vacuum capacitance.Both parameters e0(o) and e00(o) were extracted from the impe-dance in a conventional way, according to the following equations:
e0ðoÞ ¼ Z00= 2pf eoA9Z92� �
, ð2Þ
e00ðoÞ ¼ Z0= 2pf eoA9Z92� �
ð3Þ
where A represents the geometric factor given by the relation S/l
and 9Z92 represents the impedance modulus.
2.3. Structural characterization
Chemical bonds were analyzed by infrared spectroscopy(FTIR). The sample was diluted in KBr in a ratio of 1:100.Measurements were carried out with an instrument resolutionof 1 cm�1 in the range of 1500–400 cm�1 for 100 scans usinga Fourier transform spectrometer, Model Digilab Excalibur(FTS 3100 HE series). This range is in the mid-infrared, where thecharacteristic bands assigned to Nb–O bonds appear. A quantitativeanalysis of the infrared spectrum was carried out by a carefuldeconvolution of the absorption profiles using a computer-basedprogram (Peak-Fit program) that considers hidden peaks at wave-numbers different from the local maximum in the data stream.This event does not mean that a hidden peak is not discernible.As a matter of fact, a set of peaks is automatically detectable bythe spectrometer. The deconvolution procedure can determine theband position with precision to gain further insight into both theposition and the intensity of the band. The first IR spectrum wascorrected for dark current noises and background using two-pointbase line corrections. For the fit to be as realistic as possible, bandsdetected previously from the transmittance spectrum, which areusually composed of some apparent maxima and well developed
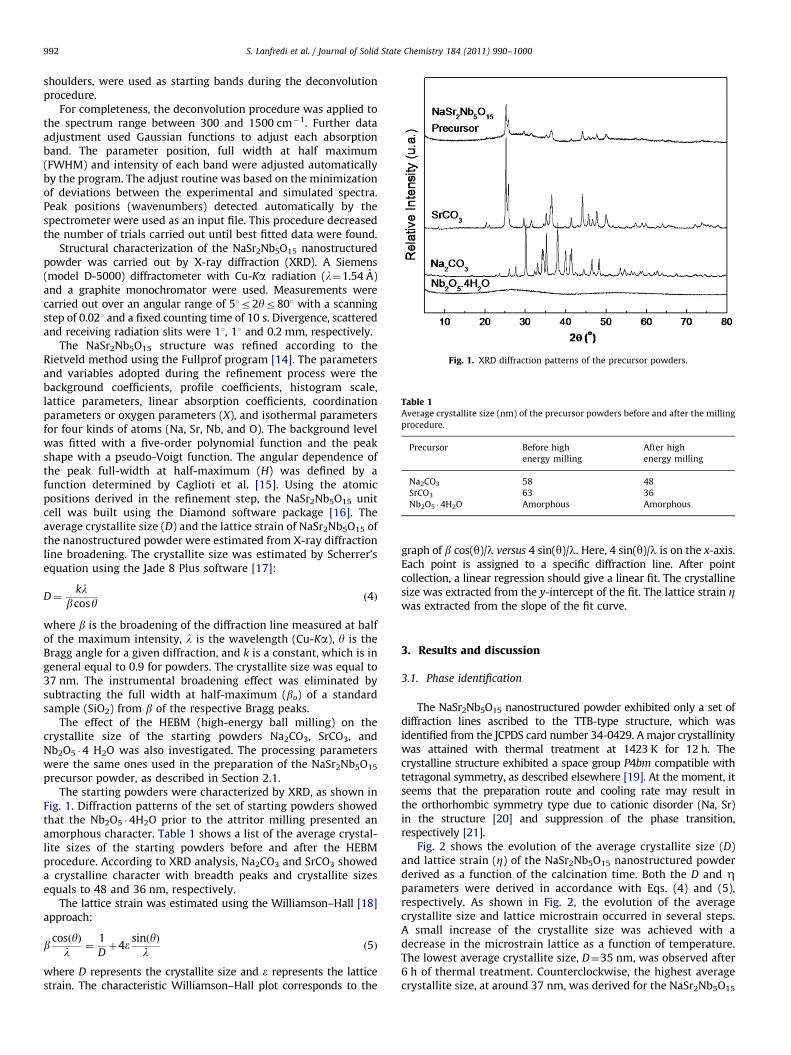
Fig. 1. XRD diffraction patterns of the precursor powders.
Table 1Average crystallite size (nm) of the precursor powders before and after the milling
procedure.
Precursor Before high
energy milling
After high
energy milling
Na2CO3 58 48
SrCO3 63 36
Nb2O5 �4H2O Amorphous Amorphous
S. Lanfredi et al. / Journal of Solid State Chemistry 184 (2011) 990–1000992
shoulders, were used as starting bands during the deconvolutionprocedure.
For completeness, the deconvolution procedure was applied tothe spectrum range between 300 and 1500 cm�1. Further dataadjustment used Gaussian functions to adjust each absorptionband. The parameter position, full width at half maximum(FWHM) and intensity of each band were adjusted automaticallyby the program. The adjust routine was based on the minimizationof deviations between the experimental and simulated spectra.Peak positions (wavenumbers) detected automatically by thespectrometer were used as an input file. This procedure decreasedthe number of trials carried out until best fitted data were found.
Structural characterization of the NaSr2Nb5O15 nanostructuredpowder was carried out by X-ray diffraction (XRD). A Siemens(model D-5000) diffractometer with Cu-Ka radiation (l¼1.54 A)and a graphite monochromator were used. Measurements werecarried out over an angular range of 51r2yr801 with a scanningstep of 0.021 and a fixed counting time of 10 s. Divergence, scatteredand receiving radiation slits were 11, 11 and 0.2 mm, respectively.
The NaSr2Nb5O15 structure was refined according to theRietveld method using the Fullprof program [14]. The parametersand variables adopted during the refinement process were thebackground coefficients, profile coefficients, histogram scale,lattice parameters, linear absorption coefficients, coordinationparameters or oxygen parameters (X), and isothermal parametersfor four kinds of atoms (Na, Sr, Nb, and O). The background levelwas fitted with a five-order polynomial function and the peakshape with a pseudo-Voigt function. The angular dependence ofthe peak full-width at half-maximum (H) was defined by afunction determined by Caglioti et al. [15]. Using the atomicpositions derived in the refinement step, the NaSr2Nb5O15 unitcell was built using the Diamond software package [16]. Theaverage crystallite size (D) and the lattice strain of NaSr2Nb5O15 ofthe nanostructured powder were estimated from X-ray diffractionline broadening. The crystallite size was estimated by Scherrer’sequation using the Jade 8 Plus software [17]:
D¼kl
bcosyð4Þ
where b is the broadening of the diffraction line measured at halfof the maximum intensity, l is the wavelength (Cu-Ka), y is theBragg angle for a given diffraction, and k is a constant, which is ingeneral equal to 0.9 for powders. The crystallite size was equal to37 nm. The instrumental broadening effect was eliminated bysubtracting the full width at half-maximum (bo) of a standardsample (SiO2) from b of the respective Bragg peaks.
The effect of the HEBM (high-energy ball milling) on thecrystallite size of the starting powders Na2CO3, SrCO3, andNb2O5 �4 H2O was also investigated. The processing parameterswere the same ones used in the preparation of the NaSr2Nb5O15
precursor powder, as described in Section 2.1.The starting powders were characterized by XRD, as shown in
Fig. 1. Diffraction patterns of the set of starting powders showedthat the Nb2O5 �4H2O prior to the attritor milling presented anamorphous character. Table 1 shows a list of the average crystal-lite sizes of the starting powders before and after the HEBMprocedure. According to XRD analysis, Na2CO3 and SrCO3 showeda crystalline character with breadth peaks and crystallite sizesequals to 48 and 36 nm, respectively.
The lattice strain was estimated using the Williamson–Hall [18]approach:
bcosðyÞl¼
1
Dþ4e sinðyÞ
lð5Þ
where D represents the crystallite size and e represents the latticestrain. The characteristic Williamson–Hall plot corresponds to the
graph of b cos(y)/l versus 4 sin(y)/l. Here, 4 sin(y)/l is on the x-axis.Each point is assigned to a specific diffraction line. After pointcollection, a linear regression should give a linear fit. The crystallinesize was extracted from the y-intercept of the fit. The lattice strain Zwas extracted from the slope of the fit curve.
3. Results and discussion
3.1. Phase identification
The NaSr2Nb5O15 nanostructured powder exhibited only a set ofdiffraction lines ascribed to the TTB-type structure, which wasidentified from the JCPDS card number 34-0429. A major crystallinitywas attained with thermal treatment at 1423 K for 12 h. Thecrystalline structure exhibited a space group P4bm compatible withtetragonal symmetry, as described elsewhere [19]. At the moment, itseems that the preparation route and cooling rate may result inthe orthorhombic symmetry type due to cationic disorder (Na, Sr)in the structure [20] and suppression of the phase transition,respectively [21].
Fig. 2 shows the evolution of the average crystallite size (D)and lattice strain (Z) of the NaSr2Nb5O15 nanostructured powderderived as a function of the calcination time. Both the D and Zparameters were derived in accordance with Eqs. (4) and (5),respectively. As shown in Fig. 2, the evolution of the averagecrystallite size and lattice microstrain occurred in several steps.A small increase of the crystallite size was achieved with adecrease in the microstrain lattice as a function of temperature.The lowest average crystallite size, D¼35 nm, was observed after6 h of thermal treatment. Counterclockwise, the highest averagecrystallite size, at around 37 nm, was derived for the NaSr2Nb5O15
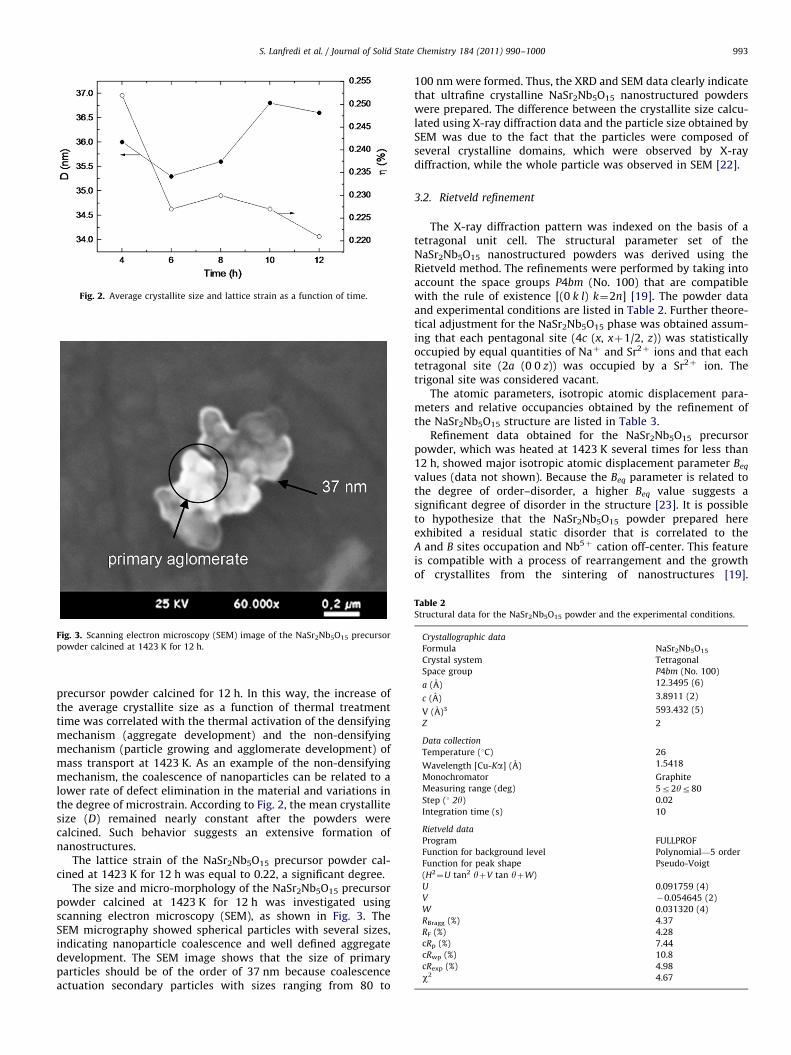
Fig. 3. Scanning electron microscopy (SEM) image of the NaSr2Nb5O15 precursor
powder calcined at 1423 K for 12 h.
Table 2Structural data for the NaSr2Nb5O15 powder and the experimental conditions.
Crystallographic data
Formula NaSr2Nb5O15
Crystal system Tetragonal
Space group P4bm (No. 100)
a (A) 12.3495 (6)
c (A) 3.8911 (2)
V (A)3 593.432 (5)
Z 2
Data collection
Temperature (1C) 26
Wavelength [Cu-Ka] (A) 1.5418
Monochromator Graphite
Measuring range (deg) 5r2yr80
Step (1 2y) 0.02
Integration time (s) 10
Rietveld data
Program FULLPROF
Function for background level Polynomial—5 order
Function for peak shape Pseudo-Voigt
(H2¼U tan2 yþV tan yþW)
U 0.091759 (4)
V �0.054645 (2)
W 0.031320 (4)
RBragg (%) 4.37
RF (%) 4.28
cRp (%) 7.44
cRwp (%) 10.8
cRexp (%) 4.98
w2 4.67
Fig. 2. Average crystallite size and lattice strain as a function of time.
S. Lanfredi et al. / Journal of Solid State Chemistry 184 (2011) 990–1000 993
precursor powder calcined for 12 h. In this way, the increase ofthe average crystallite size as a function of thermal treatmenttime was correlated with the thermal activation of the densifyingmechanism (aggregate development) and the non-densifyingmechanism (particle growing and agglomerate development) ofmass transport at 1423 K. As an example of the non-densifyingmechanism, the coalescence of nanoparticles can be related to alower rate of defect elimination in the material and variations inthe degree of microstrain. According to Fig. 2, the mean crystallitesize (D) remained nearly constant after the powders werecalcined. Such behavior suggests an extensive formation ofnanostructures.
The lattice strain of the NaSr2Nb5O15 precursor powder cal-cined at 1423 K for 12 h was equal to 0.22, a significant degree.
The size and micro-morphology of the NaSr2Nb5O15 precursorpowder calcined at 1423 K for 12 h was investigated usingscanning electron microscopy (SEM), as shown in Fig. 3. TheSEM micrography showed spherical particles with several sizes,indicating nanoparticle coalescence and well defined aggregatedevelopment. The SEM image shows that the size of primaryparticles should be of the order of 37 nm because coalescenceactuation secondary particles with sizes ranging from 80 to
100 nm were formed. Thus, the XRD and SEM data clearly indicatethat ultrafine crystalline NaSr2Nb5O15 nanostructured powderswere prepared. The difference between the crystallite size calcu-lated using X-ray diffraction data and the particle size obtained bySEM was due to the fact that the particles were composed ofseveral crystalline domains, which were observed by X-raydiffraction, while the whole particle was observed in SEM [22].
3.2. Rietveld refinement
The X-ray diffraction pattern was indexed on the basis of atetragonal unit cell. The structural parameter set of theNaSr2Nb5O15 nanostructured powders was derived using theRietveld method. The refinements were performed by taking intoaccount the space groups P4bm (No. 100) that are compatiblewith the rule of existence [(0 k l) k¼2n] [19]. The powder dataand experimental conditions are listed in Table 2. Further theore-tical adjustment for the NaSr2Nb5O15 phase was obtained assum-ing that each pentagonal site (4c (x, xþ1/2, z)) was statisticallyoccupied by equal quantities of Naþ and Sr2þ ions and that eachtetragonal site (2a (0 0 z)) was occupied by a Sr2þ ion. Thetrigonal site was considered vacant.
The atomic parameters, isotropic atomic displacement para-meters and relative occupancies obtained by the refinement ofthe NaSr2Nb5O15 structure are listed in Table 3.
Refinement data obtained for the NaSr2Nb5O15 precursorpowder, which was heated at 1423 K several times for less than12 h, showed major isotropic atomic displacement parameter Beq
values (data not shown). Because the Beq parameter is related tothe degree of order–disorder, a higher Beq value suggests asignificant degree of disorder in the structure [23]. It is possibleto hypothesize that the NaSr2Nb5O15 powder prepared hereexhibited a residual static disorder that is correlated to theA and B sites occupation and Nb5þ cation off-center. This featureis compatible with a process of rearrangement and the growthof crystallites from the sintering of nanostructures [19].
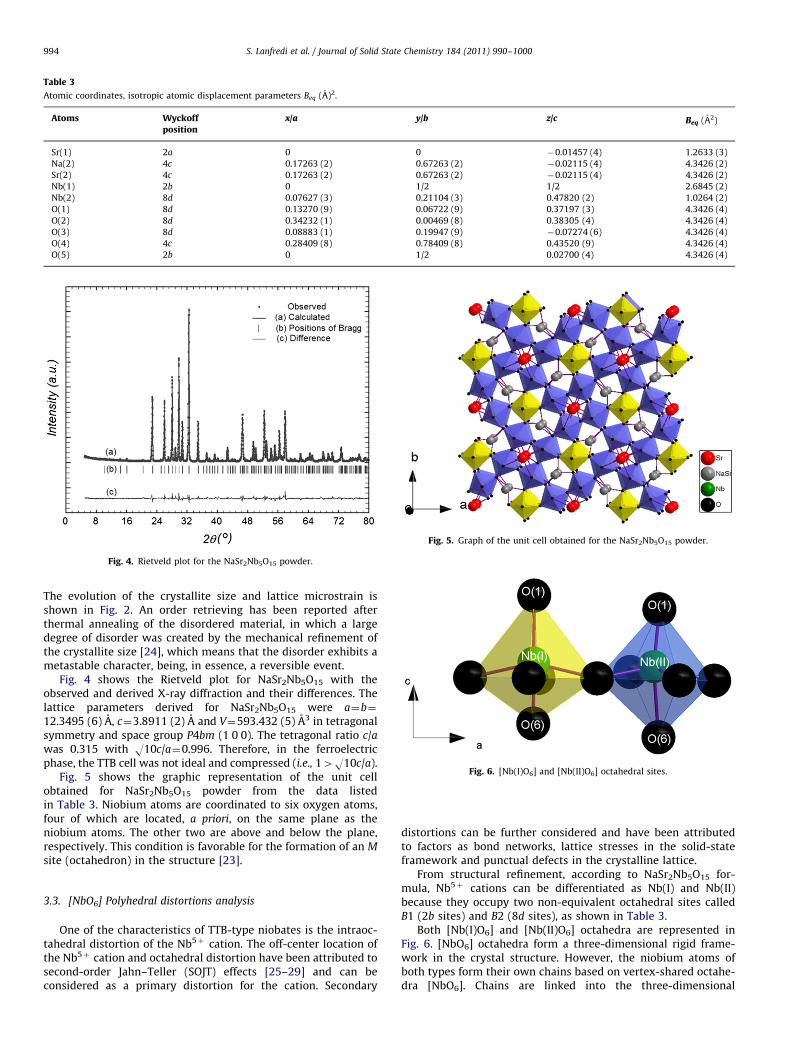
Fig. 4. Rietveld plot for the NaSr2Nb5O15 powder.
Fig. 5. Graph of the unit cell obtained for the NaSr2Nb5O15 powder.
Fig. 6. [Nb(I)O6] and [Nb(II)O6] octahedral sites.
Table 3
Atomic coordinates, isotropic atomic displacement parameters Beq (A)2.
Atoms Wyckoffposition
x/a y/b z/c Beq (A2)
Sr(1) 2a 0 0 �0.01457 (4) 1.2633 (3)
Na(2) 4c 0.17263 (2) 0.67263 (2) �0.02115 (4) 4.3426 (2)
Sr(2) 4c 0.17263 (2) 0.67263 (2) �0.02115 (4) 4.3426 (2)
Nb(1) 2b 0 1/2 1/2 2.6845 (2)
Nb(2) 8d 0.07627 (3) 0.21104 (3) 0.47820 (2) 1.0264 (2)
O(1) 8d 0.13270 (9) 0.06722 (9) 0.37197 (3) 4.3426 (4)
O(2) 8d 0.34232 (1) 0.00469 (8) 0.38305 (4) 4.3426 (4)
O(3) 8d 0.08883 (1) 0.19947 (9) �0.07274 (6) 4.3426 (4)
O(4) 4c 0.28409 (8) 0.78409 (8) 0.43520 (9) 4.3426 (4)
O(5) 2b 0 1/2 0.02700 (4) 4.3426 (4)
S. Lanfredi et al. / Journal of Solid State Chemistry 184 (2011) 990–1000994
The evolution of the crystallite size and lattice microstrain isshown in Fig. 2. An order retrieving has been reported afterthermal annealing of the disordered material, in which a largedegree of disorder was created by the mechanical refinement ofthe crystallite size [24], which means that the disorder exhibits ametastable character, being, in essence, a reversible event.
Fig. 4 shows the Rietveld plot for NaSr2Nb5O15 with theobserved and derived X-ray diffraction and their differences. Thelattice parameters derived for NaSr2Nb5O15 were a¼b¼
12.3495 (6) A, c¼3.8911 (2) A and V¼593.432 (5) A3 in tetragonalsymmetry and space group P4bm (1 0 0). The tetragonal ratio c/awas 0.315 with O10c/a¼0.996. Therefore, in the ferroelectricphase, the TTB cell was not ideal and compressed (i.e., 14O10c/a).
Fig. 5 shows the graphic representation of the unit cellobtained for NaSr2Nb5O15 powder from the data listedin Table 3. Niobium atoms are coordinated to six oxygen atoms,four of which are located, a priori, on the same plane as theniobium atoms. The other two are above and below the plane,respectively. This condition is favorable for the formation of an M
site (octahedron) in the structure [23].
3.3. [NbO6] Polyhedral distortions analysis
One of the characteristics of TTB-type niobates is the intraoc-tahedral distortion of the Nb5þ cation. The off-center location ofthe Nb5þ cation and octahedral distortion have been attributed tosecond-order Jahn–Teller (SOJT) effects [25–29] and can beconsidered as a primary distortion for the cation. Secondary
distortions can be further considered and have been attributedto factors as bond networks, lattice stresses in the solid-stateframework and punctual defects in the crystalline lattice.
From structural refinement, according to NaSr2Nb5O15 for-mula, Nb5þ cations can be differentiated as Nb(I) and Nb(II)because they occupy two non-equivalent octahedral sites calledB1 (2b sites) and B2 (8d sites), as shown in Table 3.
Both [Nb(I)O6] and [Nb(II)O6] octahedra are represented inFig. 6. [NbO6] octahedra form a three-dimensional rigid frame-work in the crystal structure. However, the niobium atoms ofboth types form their own chains based on vertex-shared octahe-dra [NbO6]. Chains are linked into the three-dimensional
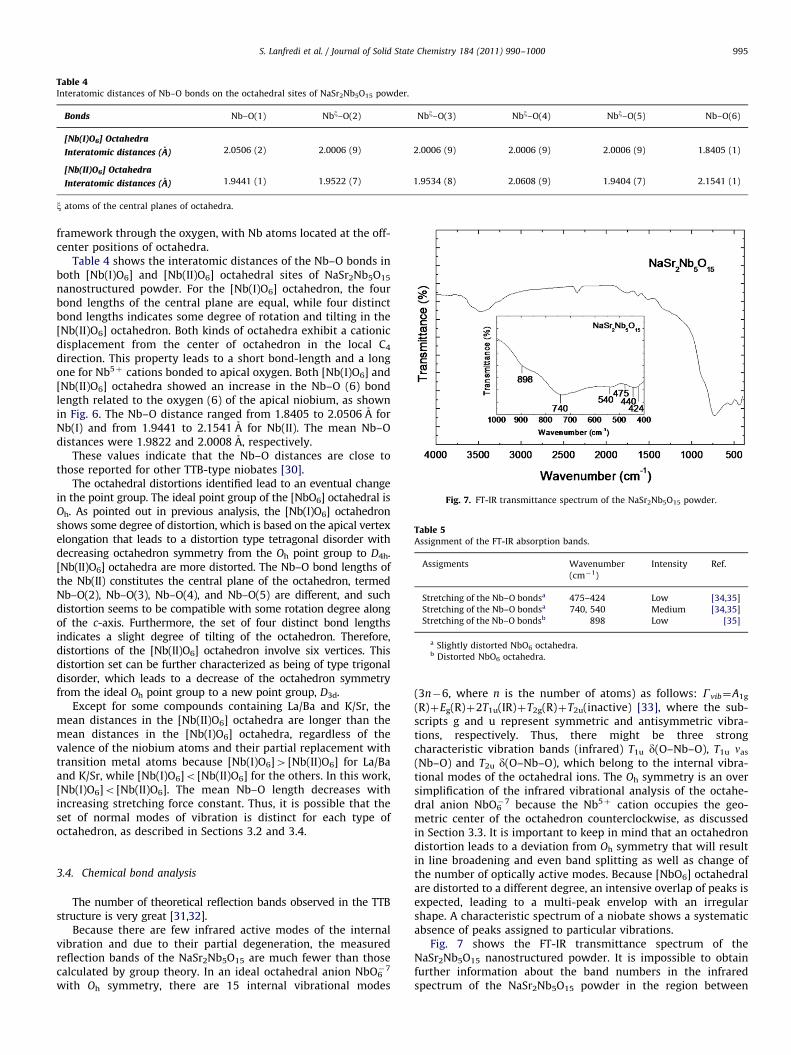
Table 4Interatomic distances of Nb–O bonds on the octahedral sites of NaSr2Nb5O15 powder.
Bonds Nb–O(1) Nbx–O(2) Nbx–O(3) Nbx–O(4) Nbx–O(5) Nb–O(6)
[Nb(I)O6] Octahedra
Interatomic distances (A) 2.0506 (2) 2.0006 (9) 2.0006 (9) 2.0006 (9) 2.0006 (9) 1.8405 (1)
[Nb(II)O6] Octahedra
Interatomic distances (A) 1.9441 (1) 1.9522 (7) 1.9534 (8) 2.0608 (9) 1.9404 (7) 2.1541 (1)
x atoms of the central planes of octahedra.
Fig. 7. FT-IR transmittance spectrum of the NaSr2Nb5O15 powder.
Table 5Assignment of the FT-IR absorption bands.
Assigments Wavenumber
(cm�1)
Intensity Ref.
Stretching of the Nb–O bondsa 475–424 Low [34,35]
Stretching of the Nb–O bondsa 740, 540 Medium [34,35]
Stretching of the Nb–O bondsb 898 Low [35]
a Slightly distorted NbO6 octahedra.b Distorted NbO6 octahedra.
S. Lanfredi et al. / Journal of Solid State Chemistry 184 (2011) 990–1000 995
framework through the oxygen, with Nb atoms located at the off-center positions of octahedra.
Table 4 shows the interatomic distances of the Nb–O bonds inboth [Nb(I)O6] and [Nb(II)O6] octahedral sites of NaSr2Nb5O15
nanostructured powder. For the [Nb(I)O6] octahedron, the fourbond lengths of the central plane are equal, while four distinctbond lengths indicates some degree of rotation and tilting in the[Nb(II)O6] octahedron. Both kinds of octahedra exhibit a cationicdisplacement from the center of octahedron in the local C4
direction. This property leads to a short bond-length and a longone for Nb5þ cations bonded to apical oxygen. Both [Nb(I)O6] and[Nb(II)O6] octahedra showed an increase in the Nb–O (6) bondlength related to the oxygen (6) of the apical niobium, as shownin Fig. 6. The Nb–O distance ranged from 1.8405 to 2.0506 A forNb(I) and from 1.9441 to 2.1541 A for Nb(II). The mean Nb–Odistances were 1.9822 and 2.0008 A, respectively.
These values indicate that the Nb–O distances are close tothose reported for other TTB-type niobates [30].
The octahedral distortions identified lead to an eventual changein the point group. The ideal point group of the [NbO6] octahedral isOh. As pointed out in previous analysis, the [Nb(I)O6] octahedronshows some degree of distortion, which is based on the apical vertexelongation that leads to a distortion type tetragonal disorder withdecreasing octahedron symmetry from the Oh point group to D4h.[Nb(II)O6] octahedra are more distorted. The Nb–O bond lengths ofthe Nb(II) constitutes the central plane of the octahedron, termedNb–O(2), Nb–O(3), Nb–O(4), and Nb–O(5) are different, and suchdistortion seems to be compatible with some rotation degree alongof the c-axis. Furthermore, the set of four distinct bond lengthsindicates a slight degree of tilting of the octahedron. Therefore,distortions of the [Nb(II)O6] octahedron involve six vertices. Thisdistortion set can be further characterized as being of type trigonaldisorder, which leads to a decrease of the octahedron symmetryfrom the ideal Oh point group to a new point group, D3d.
Except for some compounds containing La/Ba and K/Sr, themean distances in the [Nb(II)O6] octahedra are longer than themean distances in the [Nb(I)O6] octahedra, regardless of thevalence of the niobium atoms and their partial replacement withtransition metal atoms because [Nb(I)O6]4[Nb(II)O6] for La/Baand K/Sr, while [Nb(I)O6]o[Nb(II)O6] for the others. In this work,[Nb(I)O6]o[Nb(II)O6]. The mean Nb–O length decreases withincreasing stretching force constant. Thus, it is possible that theset of normal modes of vibration is distinct for each type ofoctahedron, as described in Sections 3.2 and 3.4.
3.4. Chemical bond analysis
The number of theoretical reflection bands observed in the TTBstructure is very great [31,32].
Because there are few infrared active modes of the internalvibration and due to their partial degeneration, the measuredreflection bands of the NaSr2Nb5O15 are much fewer than thosecalculated by group theory. In an ideal octahedral anion NbO6
�7
with Oh symmetry, there are 15 internal vibrational modes
(3n�6, where n is the number of atoms) as follows: Gvib¼A1g
(R)þEg(R)þ2T1u(IR)þT2g(R)þT2u(inactive) [33], where the sub-scripts g and u represent symmetric and antisymmetric vibra-tions, respectively. Thus, there might be three strongcharacteristic vibration bands (infrared) T1u d(O–Nb–O), T1u nas
(Nb–O) and T2u d(O–Nb–O), which belong to the internal vibra-tional modes of the octahedral ions. The Oh symmetry is an oversimplification of the infrared vibrational analysis of the octahe-dral anion NbO6
�7 because the Nb5þ cation occupies the geo-metric center of the octahedron counterclockwise, as discussedin Section 3.3. It is important to keep in mind that an octahedrondistortion leads to a deviation from Oh symmetry that will resultin line broadening and even band splitting as well as change ofthe number of optically active modes. Because [NbO6] octahedralare distorted to a different degree, an intensive overlap of peaks isexpected, leading to a multi-peak envelop with an irregularshape. A characteristic spectrum of a niobate shows a systematicabsence of peaks assigned to particular vibrations.
Fig. 7 shows the FT-IR transmittance spectrum of theNaSr2Nb5O15 nanostructured powder. It is impossible to obtainfurther information about the band numbers in the infraredspectrum of the NaSr2Nb5O15 powder in the region between
S. Lanfredi et al. / Journal of Solid State Chemistry 184 (2011) 990–1000996
400 and 1000 cm�1; see inset. In this region, six bands weretypically picked up by the spectrometer software. Bands werepositioned between 400 and 900 cm�1 as follows: 424, 440, 475,540, 740, and 898 cm�1. Three of them are centered at 540, 740and 898 cm�1. Another three bands are sharp and centered at475, 440 and 424 cm�1. All bands were assigned to Nb–Obonds [34,35]. As a whole, the vibration involving Nb and apicalO bonds should give an absorption band at a higher frequency(small wavenumber, 1/l, or less energetic side of the spectrum)than the Nb–O–Nb bonds of central plane and vice versa.
The sharp absorption positioned around 540–424 cm�1 and theband centered at 740 cm�1 were assigned to Nb–O stretching [34,35].The band centered at 898 cm�1 was assigned to Nb–O stretching ofthe niobium bond with apical oxygen in the [NbO6] octahedron [35].Table 5 lists both the band positions and band characteristics.
The deconvolution of the broad envelop of infrared vibrationsshould allow further identification of each component. A quanti-tative analysis of the infrared spectrum was carried out using acurve-fitting technique that separated unresolved IR stretchingand bending vibrations based on the Gaussian functions [36–39].
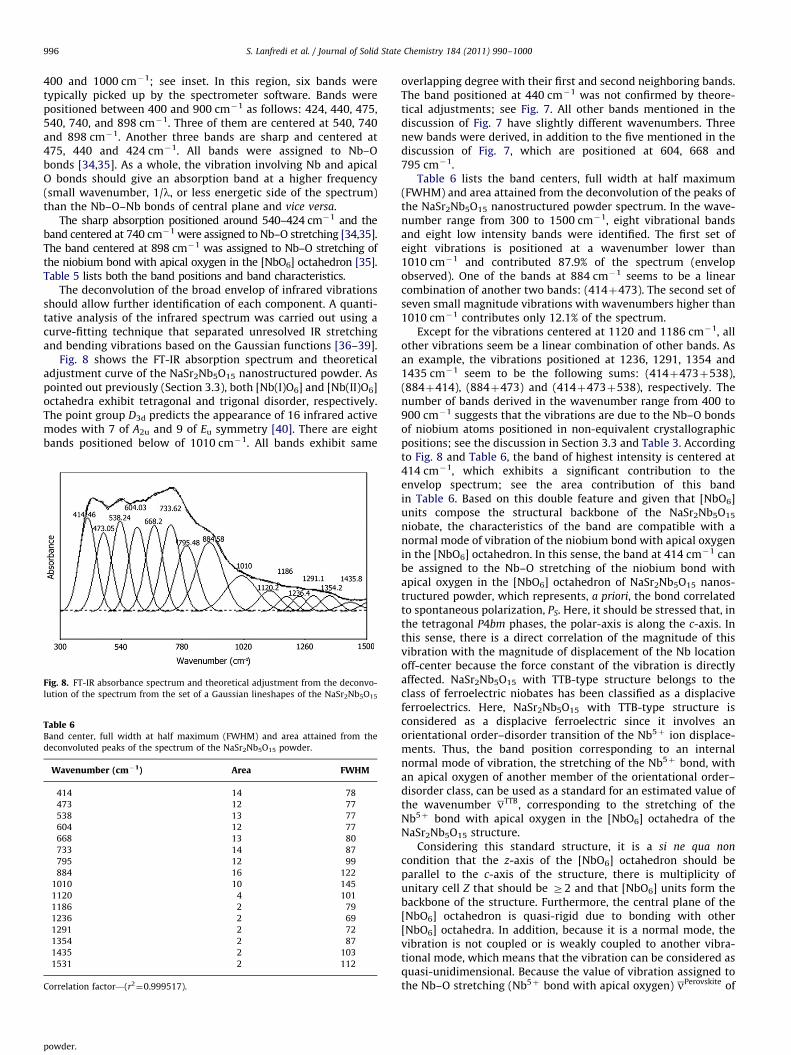
Fig. 8 shows the FT-IR absorption spectrum and theoreticaladjustment curve of the NaSr2Nb5O15 nanostructured powder. Aspointed out previously (Section 3.3), both [Nb(I)O6] and [Nb(II)O6]octahedra exhibit tetragonal and trigonal disorder, respectively.The point group D3d predicts the appearance of 16 infrared activemodes with 7 of A2u and 9 of Eu symmetry [40]. There are eightbands positioned below of 1010 cm�1. All bands exhibit same
Fig. 8. FT-IR absorbance spectrum and theoretical adjustment from the deconvo-
lution of the spectrum from the set of a Gaussian lineshapes of the NaSr2Nb5O15
powder.
Table 6Band center, full width at half maximum (FWHM) and area attained from the
deconvoluted peaks of the spectrum of the NaSr2Nb5O15 powder.
Wavenumber (cm�1) Area FWHM
414 14 78
473 12 77
538 13 77
604 12 77
668 13 80
733 14 87
795 12 99
884 16 122
1010 10 145
1120 4 101
1186 2 79
1236 2 69
1291 2 72
1354 2 87
1435 2 103
1531 2 112
Correlation factor—(r2¼0.999517).
overlapping degree with their first and second neighboring bands.The band positioned at 440 cm�1 was not confirmed by theore-tical adjustments; see Fig. 7. All other bands mentioned in thediscussion of Fig. 7 have slightly different wavenumbers. Threenew bands were derived, in addition to the five mentioned in thediscussion of Fig. 7, which are positioned at 604, 668 and795 cm�1.
Table 6 lists the band centers, full width at half maximum(FWHM) and area attained from the deconvolution of the peaks ofthe NaSr2Nb5O15 nanostructured powder spectrum. In the wave-number range from 300 to 1500 cm�1, eight vibrational bandsand eight low intensity bands were identified. The first set ofeight vibrations is positioned at a wavenumber lower than1010 cm�1 and contributed 87.9% of the spectrum (envelopobserved). One of the bands at 884 cm�1 seems to be a linearcombination of another two bands: (414þ473). The second set ofseven small magnitude vibrations with wavenumbers higher than1010 cm�1 contributes only 12.1% of the spectrum.
Except for the vibrations centered at 1120 and 1186 cm�1, allother vibrations seem be a linear combination of other bands. Asan example, the vibrations positioned at 1236, 1291, 1354 and1435 cm�1 seem to be the following sums: (414þ473þ538),(884þ414), (884þ473) and (414þ473þ538), respectively. Thenumber of bands derived in the wavenumber range from 400 to900 cm�1 suggests that the vibrations are due to the Nb–O bondsof niobium atoms positioned in non-equivalent crystallographicpositions; see the discussion in Section 3.3 and Table 3. Accordingto Fig. 8 and Table 6, the band of highest intensity is centered at414 cm�1, which exhibits a significant contribution to theenvelop spectrum; see the area contribution of this bandin Table 6. Based on this double feature and given that [NbO6]units compose the structural backbone of the NaSr2Nb5O15
niobate, the characteristics of the band are compatible with anormal mode of vibration of the niobium bond with apical oxygenin the [NbO6] octahedron. In this sense, the band at 414 cm�1 canbe assigned to the Nb–O stretching of the niobium bond withapical oxygen in the [NbO6] octahedron of NaSr2Nb5O15 nanos-tructured powder, which represents, a priori, the bond correlatedto spontaneous polarization, PS. Here, it should be stressed that, inthe tetragonal P4bm phases, the polar-axis is along the c-axis. Inthis sense, there is a direct correlation of the magnitude of thisvibration with the magnitude of displacement of the Nb locationoff-center because the force constant of the vibration is directlyaffected. NaSr2Nb5O15 with TTB-type structure belongs to theclass of ferroelectric niobates has been classified as a displaciveferroelectrics. Here, NaSr2Nb5O15 with TTB-type structure isconsidered as a displacive ferroelectric since it involves anorientational order–disorder transition of the Nb5þ ion displace-ments. Thus, the band position corresponding to an internalnormal mode of vibration, the stretching of the Nb5þ bond, withan apical oxygen of another member of the orientational order–disorder class, can be used as a standard for an estimated value ofthe wavenumber nTTB, corresponding to the stretching of theNb5þ bond with apical oxygen in the [NbO6] octahedra of theNaSr2Nb5O15 structure.
Considering this standard structure, it is a si ne qua non
condition that the z-axis of the [NbO6] octahedron should beparallel to the c-axis of the structure, there is multiplicity ofunitary cell Z that should be Z2 and that [NbO6] units form thebackbone of the structure. Furthermore, the central plane of the[NbO6] octahedron is quasi-rigid due to bonding with other[NbO6] octahedra. In addition, because it is a normal mode, thevibration is not coupled or is weakly coupled to another vibra-tional mode, which means that the vibration can be considered asquasi-unidimensional. Because the value of vibration assigned tothe Nb–O stretching (Nb5þ bond with apical oxygen) nPerovskite of
S. Lanfredi et al. / Journal of Solid State Chemistry 184 (2011) 990–1000 997
NaNbO3 (a classical disordered to orientationally ordered (Nb5þ
ion displacements) antiferroelectric with [NbO6] the backbone ofstructure) is known, it can be used as a standard. This value hasbeen reported as 690 cm�1 [34]. Thus, it is sufficient to derive aproper relation between the nPerovskite and nTTBparameters. Thisrelation can be derived from the classical equation that deter-mines the frequency of vibration of the M–O covalent bond fromunidimensional harmonic oscillator theory.
The wavenumber n(nu bar) is defined as the reciprocal of thewavelength:
n¼ 1=l ð6Þ
where n is in units of cm�1 because l is in units of cm.The wavelength and frequency, f, are related by Eq. (7):
f ¼ c=l ð7Þ
where the parameter c represents the speed of light, which isabout 3.00�1010 cm/s.
A new relation between parameters f and l is derived by thesubstitution of Eq. (6) into (7), giving:
f ¼ nc ð8Þ
This equation shows a simple relation between the frequency andother trivial parameters involved in the vibration.
The harmonic oscillator was used as a model for the absorp-tion of infrared radiation by covalently ionically bonded solidswhen the stretching vibration is one normal vibration modeassigned to a specific metal–oxygen bond in an [MeO6] octahe-dron. The frequency for a classical unidimensional harmonicoscillator is:
f ¼1
2p
ffiffiffiffiK
m
sð9Þ
where K represents the force constant of the bond and mrepresents the reduced mass. The reduced mass m is given by:
1
m¼
1
m1þ
1
m2ð10Þ
where m1 and m2 represent the masses of the bonded atoms.Combining Eqs. (8) and (9), it is possible to rewrite the
wavenumber as a function of the force constant K and reducedmass as:
n¼ 1
2pc
ffiffiffiffiK
m
sð11Þ
A simple relation between the wavenumber nPerovskite of thevibration of the niobium bond with apical oxygen in the [NbO6]octahedron of NaNbO3 and the wavenumber nTTB of the vibrationof the niobium bond with apical oxygen in NaSr2Nb5O15 can bederived as follows:
nPerovskite
nTTB¼
ffiffiffiffiffiffiffiffiffiffiffiffiffiffiffiffiffiffiffiffiKperovskite
KTTB
sð12Þ
where Kperovskite and KTTB correspond to the force constant of Nb–O stretching in the perovskite and TTB structures, respectively.Force constants are explicitly derived by relation (11). Theparameter Kperovskite is equal to 3.85�105 dyn cm�1. This valuewas derived from the wavenumber of Nb–O stretching in theperovskite, the oxygen mass, and the niobium mass usingEq. (11). Further insight on the force constant along the polardirection can be acquired from infrared spectroscopy data analy-sis. Classical harmonic oscillator theory should be sufficient. Themajor focus is on the apical Nb–O bond of the [NbO6] octahedron.Thus, it is important to derive both the average force constant atthe apical Nb–O bond and the reduced mass m. For atoms in the
Nb–O bond, a second expression for m is obtained by manipulat-ing the expression for m given by Eq. (10):
m¼ mNbmO
mNbþmOð13Þ
where mNb and mO correspond to the mass of the Nb and O atoms,respectively.
Using Eqs. (13) and (11) can be rewritten as:
n¼ 1
2pc
ffiffiffiffiffiffiffiffiffiffiffiffiffiffiffiffiffiffiffiffiffiffiffiffiffiffiffiffiffiKðmNbþmOÞ
ðmNb �mOÞ
sð14Þ
Eq. (14) describes the physical parameters that influence thestretching frequency of a covalent bond between niobium andapical oxygen, with a reduced mass m equal to mNb�mO/mNbþmO¼2.27�10�26 kg. Then parameters c, p, m and n canbe substituted into Eq. (14) to derive the force constant K.
Therefore, the new parameter K correlated to the TTB structure(KTTB) is equal to 1.38�105 dyn cm�1.
Here, nPerovskite¼ 690cm�1 and nTTB represent the wavenumber
to be estimated for the niobium bond with apical oxygen in theNaSr2Nb5O15 TTB structure. At this point, Eq. (12) can be rewrit-ten as:
nTTB¼
1ffiffiffiffiffiffiffiffiffiffiffiffiffiffiffiffiffiffiffiffiffiffiffiffiffiffiffiffiffiffiffi3:85�105 dyn cm�1
1:38�105 dyn cm�1
r nPerovskite, ð15Þ
nTTB¼ 413cm�1 ð16Þ
According to Eq. (16), the wavenumber expected from thevibration of the bond between niobium and apical oxygen in the[NbO6] octahedron of the NaSr2Nb5O15 TTB structure is 413 cm�1.
In Eq. (16), the parameter nTTB is in excellent accordance withthe experimental value of 414 cm�1, as described in Section 3.4and given in the list of values in Table 6. Furthermore, asexpected, this band exhibits the highest intensity, accordingto Fig. 8 and Table 6.
3.5. Spontaneous polarization
NaSr2Nb5O15 has a P4bm space group according to Fig. 4. Thisspace group is noncentrosymmetric, which indicates the devel-opment of intrinsic ferroelectricity. In this sense, the magnitudeof polarization, called the spontaneous polarization, can bederived from structural parameters. The spontaneous polarizationis a function of the displacement of the Nb5þ at the center of the[NbO6] octahedron. The mechanism of development of the spon-taneous polarization PS in the NaSr2Nb5O15 TTB-type structure isbased on the displacement of the ‘‘homopolar’’ Nb metal atomalong the polar direction at temperatures lower than the Curietemperature. Intrinsic ferroelectric polarization in niobate oxidesis ascribed to the parameter Dz, which gives the magnitude of thedisplacement of the Nb from the central position of the [NbO6]octahedron. The value of z (coordinate of Nb (2) at the 8d site) isdifferent than z¼1/2. Taking into account a niobium octahedron,the difference between both niobium oxygen apical lengths[Nb–O(6)–Nb–O(1)] is proportional to twice the niobium off-center displacement Dz along the polar direction at T5TC (Curietemperature) (see Fig. 6). The magnitude of the spontaneouspolarization of NaSr2Nb5O15 PS depends on the displacement Dz
of Nb5þ from the center of the [NbO6] octahedron. It is interestingto note that, in both [Nb(I)O6] and [Nb(II)O6] octahedra, the sameDz value of 0.105 A was observed.
S. Lanfredi et al. / Journal of Solid State Chemistry 184 (2011) 990–1000998
The magnitude of the parameter PS [41] can be roughlyestimated by the following empirical equation:
PS ¼ ð25879ÞDz ð17Þ
where PS is given in mC cm�2.The spontaneous polarization of the NaSr2Nb5O15 powder was
derived using Eq. (17), with the limit value equal to 27.170.945 mC cm�2.
This value is in excellent accordance with the one previouslyreported for NaSr2Nb5O15, which was equal to 29 mC cm�2 [8]. Itis possible to hypothesize that the increase in the crystallite sizeand the decrease in the degree of lattice strain should lead to agreat spontaneous polarization because ferroelectricity is a coop-erative phenomenon. The value of the spontaneous polarizationderived here is one order of magnitude higher than the sponta-neous polarization value reported for KSr2Nb5O15, which wasapproximately 2.5 mC cm�2 [42]. The value of the PS parameter ofNaSr2Nb5O15 is compatible with those obtained for ferroelectriccompounds of the TTB-type structure with space group P4bm,such as Ba5/4Sr15/4Nb10O30 and Ba6Ti2Nb8O30, which presentspontaneous polarization values of approximately 25 mC cm�2 [41].However, such a magnitude of values is expected for single crystals.Recently, the local spontaneous polarization PS, given in mC cm�2,has been calculated based on the off-center displacement of atomsin the coordination polyhedra by [43]:
PS ¼ ð1=nÞX
ZiDi ð18Þ
where n represents the volume of the unit cell (593.432 A3),Di represents the off-center displacement of atoms i (0.105 A) andZi represents the effective charge of atom i, (1.6021�10�19 C),respectively. The spontaneous polarization of the NaSr2Nb5O15
powder was derived from Eq. (18) with a limit value equal to28.3 mC cm�2.
3.6. Curie temperature analysis
3.6.1. Analysis from dielectric properties
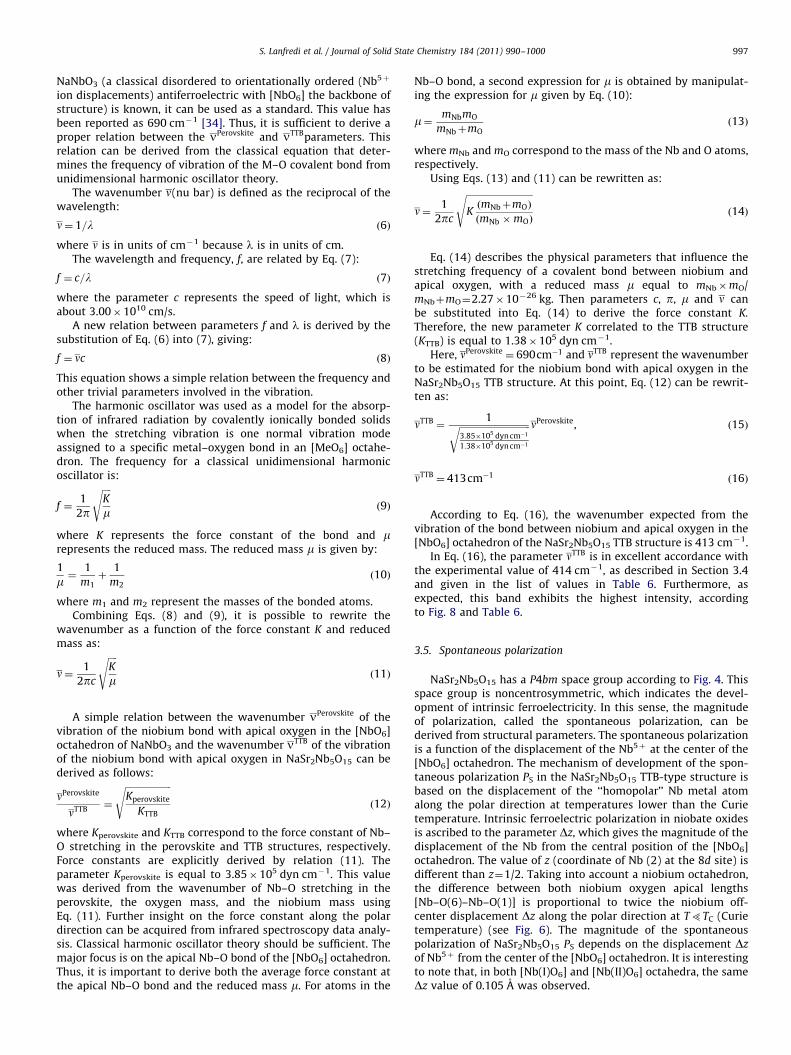
Fig. 9 shows the NaSr2Nb5O15 impedance diagram at 753 K.The impedance diagram shows two response semicircles. Thesemicircles are depressed instead of centered on the abscissa axis.
The most accepted approach to interpret semicircle depressionis to consider them to be due to a statistical distribution ofrelaxation times [44]. In the opposite sense, according to Debye’s
Fig. 9. Experimental and theoretical curves for the NaSr2Nb5O15 powder with the
corresponding equivalent circuit obtained at 753 K. The numbers 1, 2, 3 and 4 give
the log10 (signal frequency) for each corresponding point.
model, a material with a single relaxation time gives an idealsemicircle centered on the abscissa axis. The shape of the diagramsuggests that the electrical response is composed of at least tworelaxation phenomena with different relaxation frequencies. Inaddition, both relaxation phenomena obey a non-Debye model,which is further evidence that both of the contributions follow aCole–Cole type model [45]. Based on previous assumptions, theresponse Zn(o) was assigned to grain and grain boundarymodel [44]. These contributions can be simultaneously derivedfrom the theoretical adjustments of the experimental data. In fact,the electric parameters of both the grain and grain boundaryinterface regions are exact.
An equivalent electric circuit and its respective resistance andcapacitance components were derived for NaSr2Nb5O15 ceramic,as shown in the inset of Fig. 9. The points on the plot representthe experimental data, while the continuous line represents thetheoretical adjustment. Excellent agreement between the experi-mental points and the theoretical curve was obtained. Theelectrical response is well represented by two equivalent parallelRC circuits in series, where R represents the resistance and C
represents the capacitance.The first contribution (low frequency o102 Hz) represents the
grain boundary contribution to the electric response. The secondone (high frequency 4102 Hz) corresponds to a specific propertyof the grain or bulk. The theoretical deconvolution of the electricalresponse is an alternative approach to derive both contribu-tions [46]. As a consequence, the bulk properties can be unequi-vocally derived via Boukamp’s formalism. In this formalism, thenon-ideal character of the polarization phenomenon is repre-sented by a Q parameter instead of a C parameter. Q can beinterpreted as a non-ideal capacitance that is physically deter-mined by the parameter Yo and the exponent n with nr1.Yo tends to approach an ideal capacitance (C) when the exponentn tends toward a value of 1.
By hypothesis, the non-ideal character of Q is only assignedto a distribution of the relaxation times, which is the originof the semicircle decentralization observed in Fig. 9. Thus, theparameter Q(Yo,n) should have an equivalent parameter in theform of an ideal capacitance C before it is an adequate interpreta-tion of the electric properties. In Boukamp’s formalism, theimpedance of a circuit [RQ(Yo,n)] series is given by:
Z�ðoÞ ¼ R
1þRYoðjoÞnð19Þ
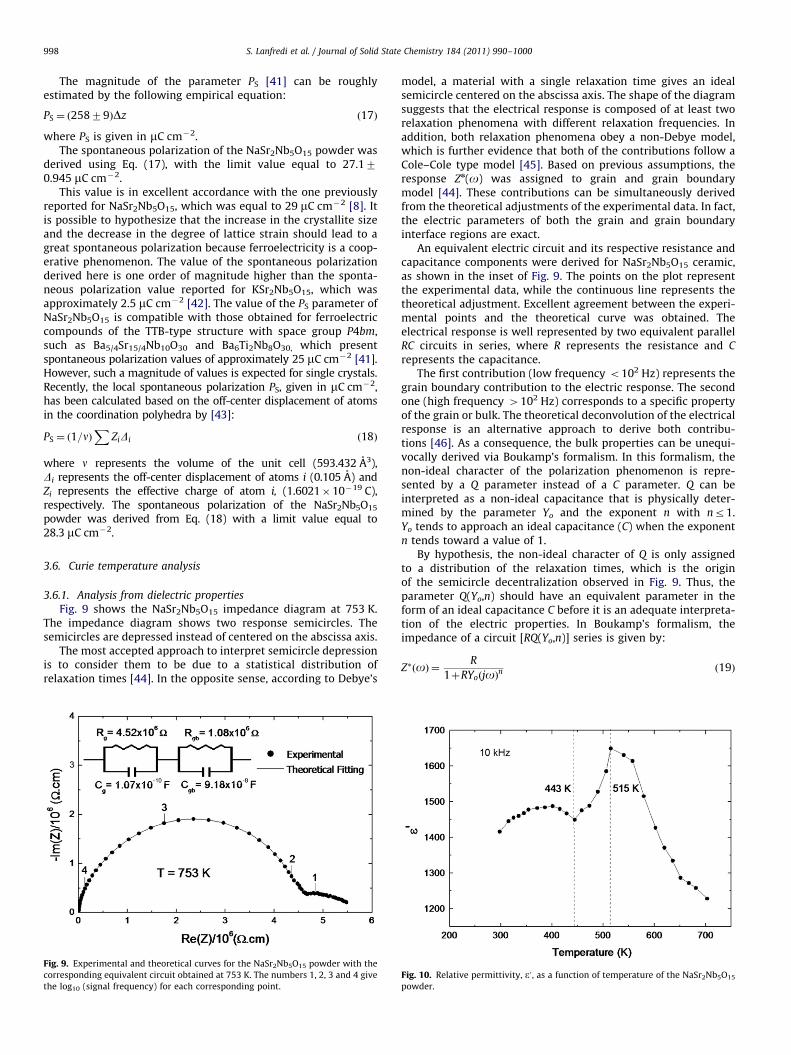
Fig. 10. Relative permittivity, e0 , as a function of temperature of the NaSr2Nb5O15
powder.
S. Lanfredi et al. / Journal of Solid State Chemistry 184 (2011) 990–1000 999
The parameters R, Yo and n are extracted by theoretical fitting.C is derived from:
C ¼ Rð1�n=nÞY ð1=nÞo ð20Þ
In this work, the exponent n is close to unity (quasi-Debye),depending on the measurement temperature. The resistancevalues derived from the grain and grain boundary of NaSr2Nb5O15
at 753 K are equal to 4.52�106 and 1.08�106 O, respectively.The capacitance values of the grain and grain boundary are
equal to 1.07�10�10 and 9.18�10�8 F, respectively. Because theC of the grain is determined, the permittivity e can be derivedfrom Eq. (21):
e¼ Cl
eoAð21Þ
where eo is the vacuum permittivity, l is the thickness of thesample and A is the electrode area.
Fig. 10 shows the curve of the dielectric permittivity (e0) ofNaSr2Nb5O15 as a function of temperature, measured at 10 kHz.Each point of this curve was derived using Eq. (2), see Section 2.2.The permittivity curve of NaSr2Nb5O15 shows a set of anomaliesof small intensity occurring in shoulder form at around298–443 K and a strong and broad polarization peak of highintensity at 515 K, with a permittivity value equal to 1650.Typically, these anomalies have been assigned to phase transi-tions [9]. Strong anomalies have been assigned to phase transitionsinvolving symmetry changes, while anomalies of small magnitudehave been assumed to stem from transitions between spacegroups [8]. The maximum permittivity was previously assignedto the Curie temperature (TC¼518 K) of NaSr2Nb5O15 [10]. Thus,the determination of Curie temperature by direct inspection of thepermittivity versus temperature curve is an imprecise procedure.For the sake of completeness, some anomalies have been reportedat temperatures higher than 620 K [10].
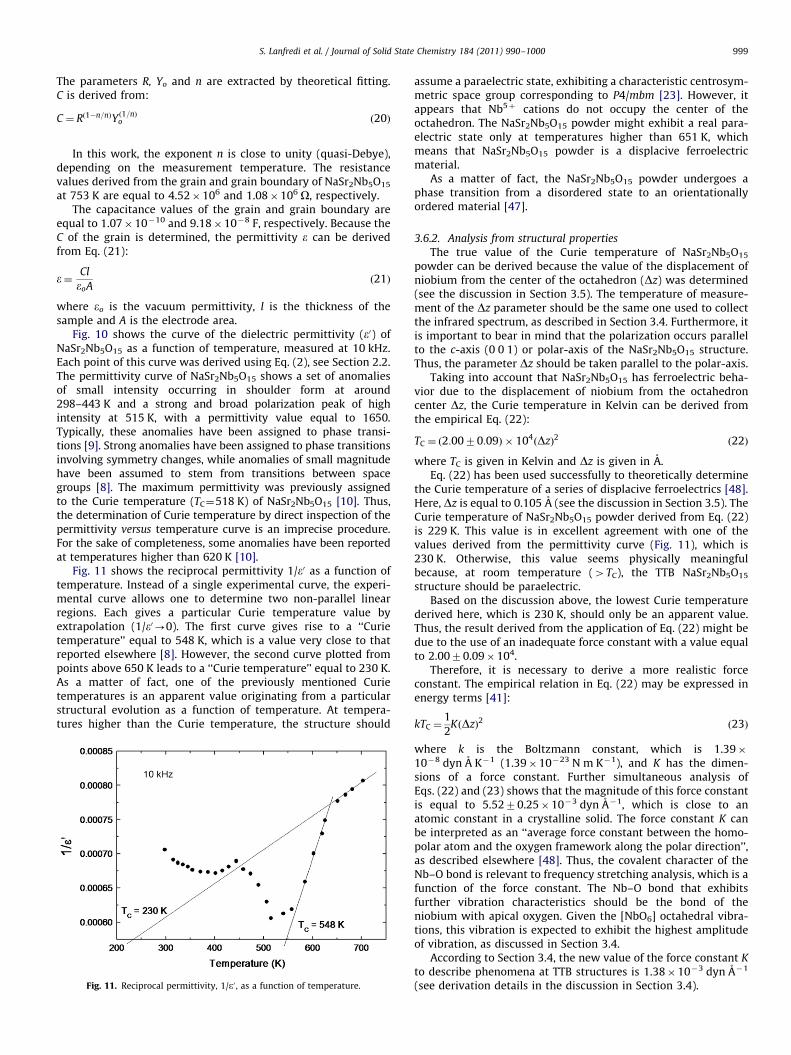
Fig. 11 shows the reciprocal permittivity 1/e0 as a function oftemperature. Instead of a single experimental curve, the experi-mental curve allows one to determine two non-parallel linearregions. Each gives a particular Curie temperature value byextrapolation (1/e0-0). The first curve gives rise to a ‘‘Curietemperature’’ equal to 548 K, which is a value very close to thatreported elsewhere [8]. However, the second curve plotted frompoints above 650 K leads to a ‘‘Curie temperature’’ equal to 230 K.As a matter of fact, one of the previously mentioned Curietemperatures is an apparent value originating from a particularstructural evolution as a function of temperature. At tempera-tures higher than the Curie temperature, the structure should
Fig. 11. Reciprocal permittivity, 1/e0 , as a function of temperature.
assume a paraelectric state, exhibiting a characteristic centrosym-metric space group corresponding to P4/mbm [23]. However, itappears that Nb5þ cations do not occupy the center of theoctahedron. The NaSr2Nb5O15 powder might exhibit a real para-electric state only at temperatures higher than 651 K, whichmeans that NaSr2Nb5O15 powder is a displacive ferroelectricmaterial.
As a matter of fact, the NaSr2Nb5O15 powder undergoes aphase transition from a disordered state to an orientationallyordered material [47].
3.6.2. Analysis from structural properties
The true value of the Curie temperature of NaSr2Nb5O15
powder can be derived because the value of the displacement ofniobium from the center of the octahedron (Dz) was determined(see the discussion in Section 3.5). The temperature of measure-ment of the Dz parameter should be the same one used to collectthe infrared spectrum, as described in Section 3.4. Furthermore, itis important to bear in mind that the polarization occurs parallelto the c-axis (0 0 1) or polar-axis of the NaSr2Nb5O15 structure.Thus, the parameter Dz should be taken parallel to the polar-axis.
Taking into account that NaSr2Nb5O15 has ferroelectric beha-vior due to the displacement of niobium from the octahedroncenter Dz, the Curie temperature in Kelvin can be derived fromthe empirical Eq. (22):
TC ¼ ð2:0070:09Þ � 104ðDzÞ2 ð22Þ
where TC is given in Kelvin and Dz is given in A.Eq. (22) has been used successfully to theoretically determine
the Curie temperature of a series of displacive ferroelectrics [48].Here, Dz is equal to 0.105 A (see the discussion in Section 3.5). TheCurie temperature of NaSr2Nb5O15 powder derived from Eq. (22)is 229 K. This value is in excellent agreement with one of thevalues derived from the permittivity curve (Fig. 11), which is230 K. Otherwise, this value seems physically meaningfulbecause, at room temperature (4TC), the TTB NaSr2Nb5O15
structure should be paraelectric.Based on the discussion above, the lowest Curie temperature
derived here, which is 230 K, should only be an apparent value.Thus, the result derived from the application of Eq. (22) might bedue to the use of an inadequate force constant with a value equalto 2.0070.09�104.
Therefore, it is necessary to derive a more realistic forceconstant. The empirical relation in Eq. (22) may be expressed inenergy terms [41]:
kTC ¼1
2KðDzÞ2 ð23Þ
where k is the Boltzmann constant, which is 1.39�10�8 dyn A K�1 (1.39�10�23 N m K�1), and K has the dimen-sions of a force constant. Further simultaneous analysis ofEqs. (22) and (23) shows that the magnitude of this force constantis equal to 5.5270.25�10�3 dyn A�1, which is close to anatomic constant in a crystalline solid. The force constant K canbe interpreted as an ‘‘average force constant between the homo-polar atom and the oxygen framework along the polar direction’’,as described elsewhere [48]. Thus, the covalent character of theNb–O bond is relevant to frequency stretching analysis, which is afunction of the force constant. The Nb–O bond that exhibitsfurther vibration characteristics should be the bond of theniobium with apical oxygen. Given the [NbO6] octahedral vibra-tions, this vibration is expected to exhibit the highest amplitudeof vibration, as discussed in Section 3.4.
According to Section 3.4, the new value of the force constant K
to describe phenomena at TTB structures is 1.38�10�3 dyn A�1
(see derivation details in the discussion in Section 3.4).
S. Lanfredi et al. / Journal of Solid State Chemistry 184 (2011) 990–10001000
Thus, Eq. (22) can be rewritten as:
TC ¼K
2kðDzÞ2 ð24Þ
where (KTTB/2 k) represents a new constant called the modifiedforce constant, which is equal to 4.96�104 A�2 K. This new valueof the modified force constant should substitute for the forceconstant with a value equal to 2.0070.09�104 in Eq. (22). Thus,the newest equation to derive the Curie temperature of a TTBstructure can be written as:
TC ¼ ð4:96� 104ÞðDzÞ2 ð25Þ
with TC given in Kelvin and Dz in A.Using the equation above, TC is equal to 546 K, because the Dz
derived for the NaSr2Nb5O15 nanostructured powder, is 0.105 A(see Section 3.5). Using Eq. (25) and the analysis of Fig. 11, theCurie temperature of the NaSr2Nb5O15 nanostructured powderprepared was 54672 K. Eq. (25) is not universal because themodified force constant 4.96�104 A�2 K is not a universalconstant.
Therefore, the theoretical value of the Curie temperature(546 K), as given by Eq. (25), is in excellent agreement with thevalue derived experimentally, which is 548 K (see Section 3.6).However, it seems that such a constant can be representative of agroup of materials that maintain a set of intrinsic properties andstructural features in common. In the NaNbO3 single crystal, at588 K, the Nb5þ cation is off centered in the [NbO6] octahedronby a displacement (Dz) of 0.11 A [49]. This value can be sub-stituted into Eq. (25) to derive the Curie temperature of NaNbO3,which is equal to 600.2 K (327.2 1C). Unfortunately, furtheranalysis should be performed using the additional enhancementof the precision in the determination of the Dz parameter. Byhypothesis, at Dz¼0.113 A, the application of Eq. (25) gives avalue of the Curie temperature equal to 663 K (360 1C). This valueis very close to one reported for the Curie temperature of NaNbO3
ceramic, which is 361 1C [50].
4. Conclusion
High-energy ball milling is a suitable method for the prepara-tion of single phase niobate powder with nanostructured featuresand a NaSr2Nb5O15 TTB-type structure. The unitary cell showedthat each pentagonal site is statistically occupied by equalquantities of Naþ and Sr2þ ions and that each tetragonal site isoccupied by an Sr2þ ion. A high distortion of the [Nb(II)O6]octahedra occurs due to contributions from both rotation andtilting. The Curie temperature is a function of the magnitude ofthe parameter displacement of the homopolar atom from theoctahedron center and of the average force constant ascribed tothe vibration of the homopolar cation in the direction parallel tothe polar-axis. The ferroelectric transition in the NaSr2Nb5O15
powder is of displacive type and involves an orientational order–disorder transition of the Nb5þ ion displacements.
Acknowledgments
The authors would like to acknowledge FAPESP, CNPq, andFundunesp for their financial support.
References
[1] T. Karaki, K. Miyashita, M. Nakatsuji, M. Adachi, Jpn. J. Appl. Phys. 37 (1998)5277–5279.
[2] D. Kolar, S. Gaberscek, Z. Stadler, D. Suvorov, Ferroelectrics 27 (1980) 269–272.[3] Y.D. Hou, M.K. Zhu, C.S. Tian, H. Yan, Sensors Actuators A 116 (2004)
455–460.[4] A. Simon, J. Ravez, Comptes. Rendus. Chimie. 9 (2006) 1268–1276.[5] S.C. Abrahams, P.B. Jamieson, J.L. Bernstein, J. Chem. Phys. 54 (1971)
2355–2363.[6] V. Hornebecq, C. Elissalde, F. Weill, A. Villesuzanne, M. Menetrier, J. Ravez,
J. Appl. Cryst. 33 (2000) 1037–1045.[7] J. Ravez, C. R. Acad. Sci. Paris, serie II c (1999) 415–419.[8] M. Lines, A. Glass, Principles and Applications of Ferroelectrics and Related
Materials, Oxford, London, 1977.[9] M.A.L. Nobre, S. Lanfredi, J. Appl. Phys. 93 (2003) 5557–5562.
[10] G.E. Garcıa, P.A. Torres, R. Jimenez, C.J.M. Gonzalez, Chem. Mater. 19 (2007)3575–3580.
[11] Z. Shen, H. Ye, C.L. Mak, K.H. Wong, T.Y. Yum, W. Liu, T. Zou, Mater. Chem.Phys. 99 (2006) 10–14.
[12] S. Lanfredi, L.R. Trindade, A.R. Barros, N.R. Feitosa, M.A.L. Nobre, Ceramica 51(2005) 151–156 in portuguese.
[13] B.A. Boukamp, Equivalent Circuit-EQUIVCRT Program-Users Manual, 3, Uni-versity of Twente, 1989 97.
[14] J.R. Carvajal, An introduction to the Program FullProff 2000, CEA/Saclay,France (2008).
[15] G. Caglioti, A. Paoletti, F.P. Ricci, Nucl. Instrum 3 (1958) 223–228.[16] DIAMOND, Crystal and Molecular Structure Visualization, Crystal Impact, Inc.
1998–2009.[17] JADE 8 PLUS, XRD Pattern Processing and Identification Program, Materials
Data, Inc. 1995–2007.[18] G.K. Williamson, W.H. Hall, Acta Met. 1 (1953) 22–31.[19] S. Lanfredi, C.X. Cardoso, M.A.L. Nobre, Mater. Sci. Eng. 112 (2004) 139–143.[20] J. Ravez, J.P. Budin, P. Hagenmuller, J. Solid State Chem. 5 (1972) 239–246.[21] R.J. Xie, Y. Akimune, J. Mater. Chem. 12 (2002) 3156–3161.[22] C. Vazquez-vazquez, M.C. Blanco, M.A. Lopez-quintela, R.D. Sanchez, J. Rivas,
S.B. Oseroff, J. Mater. Chem. 8 (1998) 991–1000.[23] H. El, A. Belghiti, A. Simon, P. Gravereau, A. Villesuzanne, M. Elaatmani,
J. Ravez, Sol. State Sci. 4 (2002) 933–940.[24] X. Gao, J. Xue, T. Yu, Z. Shen, J. Wang, J. Am. Ceram. Soc. 85 (2002) 833–838.[25] U. Opik, M.H.L. Pryce, Proc. R. Soc. Lond. A 238 (1957) 425–447.[26] R.F.W. Bader, Can. J. Chem. 40 (1962) 1164–1175.[27] R.G. Pearson, J. Am. Chem. Soc. 91 (1969) 4947–4955.[28] R.A. Wheeler, M.H. Whangbo, T. Hughbanks, R. Hoffmann, J.K. Burdett,
T.A. Albright, J. Am. Chem. Soc. 108 (1986) 2222–2236.[29] K.M. Ok, J. Orzechowski, P.S. Halasyamani, Inorg. Chem. 43 (2004) 964–968.[30] G. Foulon, M. Ferriol, A. Brenier, G. Boulon, S. Lecocq, Eur. J. Solid State Inorg.
Chem. 33 (1996) 673–686.[31] The International Tables for Crystallography, vol. A: Space-Group Symmetry,
Ed. T. Haha, D. Reidel, Publishing Comp. Dordrecht, Boston (1983).[32] H.R. Xia, H.R. Xia, H.C. Chen, H. Yu, K.X. Wang, B.Y. Zhao, Phys. Status Solidi
(b) 210 (1998) 47–59.[33] H.R. Xia, C.J. Wang, H. Yu, H.C. Chen, Y.Y. Song, Cryst. Res. Technol. 31 (1996)
889–895.[34] F.J. Farrel, V.A. Maroni, T.G. Spiro, Inorg. Chem. 8 (1969) 2638–2642.[35] J.M. Jehng, I.E. Wachs, Chem Mater. 3 (1991) 100–107.[36] C.I. Merzbacher, W.B. White, J. Non-Cryst. Solids 130 (1991) 18–34.[37] R.D. Husung, R.H. Doremus, J. Mater. Res. 5 (1990) 2209–2217.[38] Kh.M. Elbadry, F.A. Moustaffa, M.A. Azooz, F.H. Elbatal, Indian J. Pure Appl.
Phys. 38 (2000) 741.[39] E.M.A. Khalil, F.H. Elbatal, Y.M. Hamdy, H.M. Zidan, M.S. Aziz,
A.M. Abdelghany, Physica B 405 (2010) 1294–1300.[40] T. Nagai, M. Sugiyama, M. Sando, K. Niihara, Jpn. J. Appl. Phys. 35 (1996)
5163–5167.[41] S.C. Abrahams, S.K. Kurtz, P.B. Jamieson, Phys. Rev 172 (1968) 551–553.[42] S. Alkoyw, C.J. Duran, J. Am. Ceram. Soc. 91 (2008) 1597–1602.[43] C.L. Jia, S.B. Mi, K. Urban, I. Vrejoiu, M. Alexe, D. Hesse, Phys. Rev. Lett. 102
(2009) 117601–117604.[44] M.A.L. Nobre, S. Lanfredi, Catalysis Today 78 (2003) 529–538.[45] K.S. Cole, R.H. Cole, J. Chem. Phys. 9 (1941) 341–351.[46] S. Lanfredi, M.A.L. Nobre, Appl. Phys. Lett. 81 (2002) 451–453.[47] O. Hanske-Petitpierre, Y. Yacoby, J. Mustre de Leon, E.A. Stern, J.J. Rehr, Phys.
Rev. B 44 (1991) 6700–6707.[48] P.B. Jamieson, S.C. Abrahams, J.L. Brenstein, J. Chem. Phys. 50 (1969) 4352–4363.[49] A. Avogadro, G. Bonera, F. Borsa, A. Rigamonti, Phys. Rev. B 9 (1974)
3905–3920.[50] S. Lanfredi, A.C.M. Rodrigues, L. Dessemond, J. Am. Ceram. Soc. 86 (2003)
2103–2110.
Related Documents