Structural changes during deformation in carbon nanotube-reinforced polyacrylonitrile fibers Wenjie Wang a , N. Sanjeeva Murthy b, * , Han Gi Chae c , Satish Kumar c a Department of Physics, University of Vermont, Burlington, VT 05403, United States b New Jersey Center for Biomaterials, Rutgers University, 145 Bevier Road, Piscataway, NJ 08854, United States c School of Polymer, Textile and Fiber Engineering, Georgia Institute of Technology, Atlanta, GA 30332, United States Received 27 October 2007; received in revised form 12 February 2008; accepted 16 February 2008 Available online 23 February 2008 Abstract Structural changes during deformation in solution- and gel-spun polyacrylonitrile (PAN) fibers prepared with multi- and single-wall carbon nanotubes, and vapor-grown carbon nano-fibers were investigated using synchrotron X-ray diffraction data. Deformation of carbon nanotubes (CNTs) contributes to the increased modulus. CNTs, in addition to their mere presence as reinforcement, were found to alter the response of the PAN matrix to stress and thus enhance the performance of the composite. CNTs facilitate the orientation of the PAN crystals during deformation, and increase the load transferred to PAN crystals as evidenced by their increased lateral and axial strains at 75 C. The monotonical decrease in PAN interchain spacing with the fiber strain was accompanied by a reversible helix to zigzag conformational change as well as by changes in the axial repeats of the two conformations. These changes were much larger in gel-spun fibers than in solution-spun fibers, indicating more effective load transfer in gel-spun fibers. Ó 2008 Elsevier Ltd. All rights reserved. Keywords: Polyacrylonitrile; Nanocomposites; Deformation 1. Introduction Polyacrylonitrile (PAN) fiber has been commercially avail- able for decades, most significantly as a precursor of high- quality carbon fiber. As a part of the general effort to develop nano-reinforced materials with enhanced properties, recently there have been attempts to incorporate carbon nanotubes into PAN to enhance its mechanical, thermal and electrical properties [1e7]. To understand the underpinnings for such a property enhancement, knowledge of the structural changes in matrix, inclusions and the interphase between the two are necessary. A number of papers have been published on the structure of PAN using X-ray diffraction (XRD) [8e11], infra- red spectroscopy [10], nuclear magnetic resonance (NMR) [12], and molecular simulations [13e15]. Based on the scattering pattern, PAN is considered either orthorhombic with 3D order [11,16], or hexagonal with 2D order [17]. It has been proposed that hexagonal packing of PAN chains in dry samples becomes orthorhombic due to co-crystallization of PAN with polar solvent molecules [18]. In this study, we use in situ XRD measurements, and draw upon these earlier publications, to understand the deformation process on micro- scopic scale in PAN and its nanocomposites. Experiments were peformed at various temperatures, below and above T g , on PAN and its nanocomposites with single-wall nanotubes (PAN/SWNT), multi-wall carbon nanotubes (PAN/MWNT) and vapor-grown carbon nano-fibers (PAN/VGCNF). 2. Experimental 2.1. Materials PAN and composite fibers prepared by conventional solu- tion spinning and gel spinning with various nanotubes were * Corresponding author. Tel.: þ1 732 445 0488; fax: þ1 732 445 5006. E-mail address: [email protected] (N.S. Murthy). 0032-3861/$ - see front matter Ó 2008 Elsevier Ltd. All rights reserved. doi:10.1016/j.polymer.2008.02.035 Available online at www.sciencedirect.com Polymer 49 (2008) 2133e2145 www.elsevier.com/locate/polymer

Welcome message from author
This document is posted to help you gain knowledge. Please leave a comment to let me know what you think about it! Share it to your friends and learn new things together.
Transcript
Available online at www.sciencedirect.com
Polymer 49 (2008) 2133e2145www.elsevier.com/locate/polymer
Structural changes during deformation in carbonnanotube-reinforced polyacrylonitrile fibers
Wenjie Wang a, N. Sanjeeva Murthy b,*, Han Gi Chae c, Satish Kumar c
a Department of Physics, University of Vermont, Burlington, VT 05403, United Statesb New Jersey Center for Biomaterials, Rutgers University, 145 Bevier Road, Piscataway, NJ 08854, United States
c School of Polymer, Textile and Fiber Engineering, Georgia Institute of Technology, Atlanta, GA 30332, United States
Received 27 October 2007; received in revised form 12 February 2008; accepted 16 February 2008
Available online 23 February 2008
Abstract
Structural changes during deformation in solution- and gel-spun polyacrylonitrile (PAN) fibers prepared with multi- and single-wall carbonnanotubes, and vapor-grown carbon nano-fibers were investigated using synchrotron X-ray diffraction data. Deformation of carbon nanotubes(CNTs) contributes to the increased modulus. CNTs, in addition to their mere presence as reinforcement, were found to alter the response of thePAN matrix to stress and thus enhance the performance of the composite. CNTs facilitate the orientation of the PAN crystals during deformation,and increase the load transferred to PAN crystals as evidenced by their increased lateral and axial strains at 75 �C. The monotonical decrease inPAN interchain spacing with the fiber strain was accompanied by a reversible helix to zigzag conformational change as well as by changes in theaxial repeats of the two conformations. These changes were much larger in gel-spun fibers than in solution-spun fibers, indicating more effectiveload transfer in gel-spun fibers.� 2008 Elsevier Ltd. All rights reserved.
Keywords: Polyacrylonitrile; Nanocomposites; Deformation
1. Introduction
Polyacrylonitrile (PAN) fiber has been commercially avail-able for decades, most significantly as a precursor of high-quality carbon fiber. As a part of the general effort to developnano-reinforced materials with enhanced properties, recentlythere have been attempts to incorporate carbon nanotubesinto PAN to enhance its mechanical, thermal and electricalproperties [1e7]. To understand the underpinnings for sucha property enhancement, knowledge of the structural changesin matrix, inclusions and the interphase between the two arenecessary. A number of papers have been published on thestructure of PAN using X-ray diffraction (XRD) [8e11], infra-red spectroscopy [10], nuclear magnetic resonance (NMR)[12], and molecular simulations [13e15]. Based on the
* Corresponding author. Tel.: þ1 732 445 0488; fax: þ1 732 445 5006.
E-mail address: [email protected] (N.S. Murthy).
0032-3861/$ - see front matter � 2008 Elsevier Ltd. All rights reserved.
doi:10.1016/j.polymer.2008.02.035
scattering pattern, PAN is considered either orthorhombicwith 3D order [11,16], or hexagonal with 2D order [17]. Ithas been proposed that hexagonal packing of PAN chains indry samples becomes orthorhombic due to co-crystallizationof PAN with polar solvent molecules [18]. In this study, weuse in situ XRD measurements, and draw upon these earlierpublications, to understand the deformation process on micro-scopic scale in PAN and its nanocomposites. Experimentswere peformed at various temperatures, below and above Tg,on PAN and its nanocomposites with single-wall nanotubes(PAN/SWNT), multi-wall carbon nanotubes (PAN/MWNT)and vapor-grown carbon nano-fibers (PAN/VGCNF).
2. Experimental
2.1. Materials
PAN and composite fibers prepared by conventional solu-tion spinning and gel spinning with various nanotubes were
2134 W. Wang et al. / Polymer 49 (2008) 2133e2145
described in our previous papers [2,19]. For conventional solu-tion spinning, PAN (molecular weight 100,000 g/mol; 6.7%methylacrylate comonomer) was vacuum dried at 90 �C. Opti-cally homogenous dispersion of carbon nanotubes (CNTs) indimethyl acetamide (DMAc) was prepared by sonication(Branson 3510R-MT, 100 W, 42 kHz) and the CNT/DMAcdispersion was combined with PAN/DMAc solution. The solidconcentration (polymerþ CNT) was 17.5 wt%, and CNTconcentration with respect to polymer was 5 wt%. Fiberswere spun at room temperature by dry-jet-wet spinning. Finaldraw ratio for control PAN and composite fibers was 10. Forgel spinning, PAN (molecular weight 250,000 g/mol; 6.5%methylacrylate comonomer) was used with SWNT. SWNTwas dispersed in N,N-dimethylformamide (DMF) using bathtype sonicator at 40 mg/L concentration. PAN was dissolvedin DMF separately. After 24 h sonication of SWNT/DMF,this solution was added to PAN/DMF solution, and the excessamount of DMF was evaporated to obtain the desired solidconcentration (13.7 wt%). SWNT concentration was set tobe 1 wt% with respect to PAN. Subsequently, fibers werespun into cold methanol bath (approximately �50 �C) to gen-erate gel fibers. After up to 7 days of gelation, the gel fiberswere drawn in glycerol bath (w160 �C) to achieve a totaldraw ratio of 51. All the drawn fibers were dried at constantlength in a vacuum oven at 50 �C. Table 1 lists the propertiesof both the dry-jet-wet-spun and gel-spun fibers.
2.2. Methods
Preliminary XRD data were collected on filament bundlesusing an in-house X-ray facility consisting of a Rigaku rotat-ing anode, copper target, point collimation and a Bruker High-star 2D detector. Extensive XRD data were collected at theArgonne Photon Source (APS) on the DND-CAT beam line5ID-D using X-rays of wavelength 0.1 nm. Single filamentswere attached to a cardboard tab (Miami Valley Gasket, Day-ton, Ohio). Fibers (gauge length¼ 1 in.) were held perpendic-ular to the incident X-ray beam while being stretched to failure(except when exploring reversibility) in an Instron at a constantelongation rate, which was chosen so as to get sufficient num-ber of X-ray frames prior to fiber breakage, the results beinginsensitive to these small changes in quasi-static strain rate:PAN e 0.033 in./min at room temperature, 0.04 in./min at75 �C, and 0.03 in./min at 125 �C; PAN/MWNT e 0.053 in./min at room temperature, 0.04 in./min at 75 �C, and 0.05 in./min at 125 �C; PAN/VGCNF e 0.04 in./min at room temper-ature, 0.04 in./min at 75 �C and 0.04 in./min at 125 �C; Gel
Table 1
Fiber diameter and mechanical properties
Diameter (mm) Tensi
Conventional solution
spinning [19]
PAN 70e80 7.8�PAN/MWNT (95/5) 10.8�PAN/VGCNF (95/5) 10.6�
Gel spinning [2] PAN w20 22.1�PAN/SWNT (99/1) 28.7�
PAN/SWNT and Gel PAN e 0.021 in./min at room tempera-ture and 0.03 in./min at 75 �C. XRD patterns were recordedas the fiber was stretched continuously in the Instron, andthe load-elongation curves were recorded simultaneously.Data were collected for 9 s with gel-spun fibers at room tem-perature and 5 s for all other measurements, and 1 s was al-lowed for data transfer after each frame. We also obtainedXRD data as the fibers were stretched at three pre-selectedtemperatures, ambient (22 �C), below Tg (w75 �C), and aboveTg (w125 �C). Temperature was measured by placing a ther-mocouple right next to the specimen. The fiber was heatedby a stream of hot air whose temperature was continuouslymonitored by a separate thermocouple and electronicallycontrolled.
Uniaxial tensile test data were recorded continuously in theform of relative displacement of the two grips as function oftime. The breakage of the fiber was signified by a sudden de-crease in load. Strain is calculated as a mean of the values over10 s or 6 s (9 s for imaging gel-spun fibers at room tempera-ture and 5 s for all others, respectively; 1 s more for data ac-quisition), the interval between successive X-ray frames. Inthis paper, the term fiber strain, or strain, means the straincalculated for the filament as a whole from the Instron data.The terms lateral strain and axial strain refer to the X-ray orcrystal strain calculated from XRD data, and correspond tothe deformation of the unit cell of the PAN crystals in theequatorial and meridional directions, respectively.
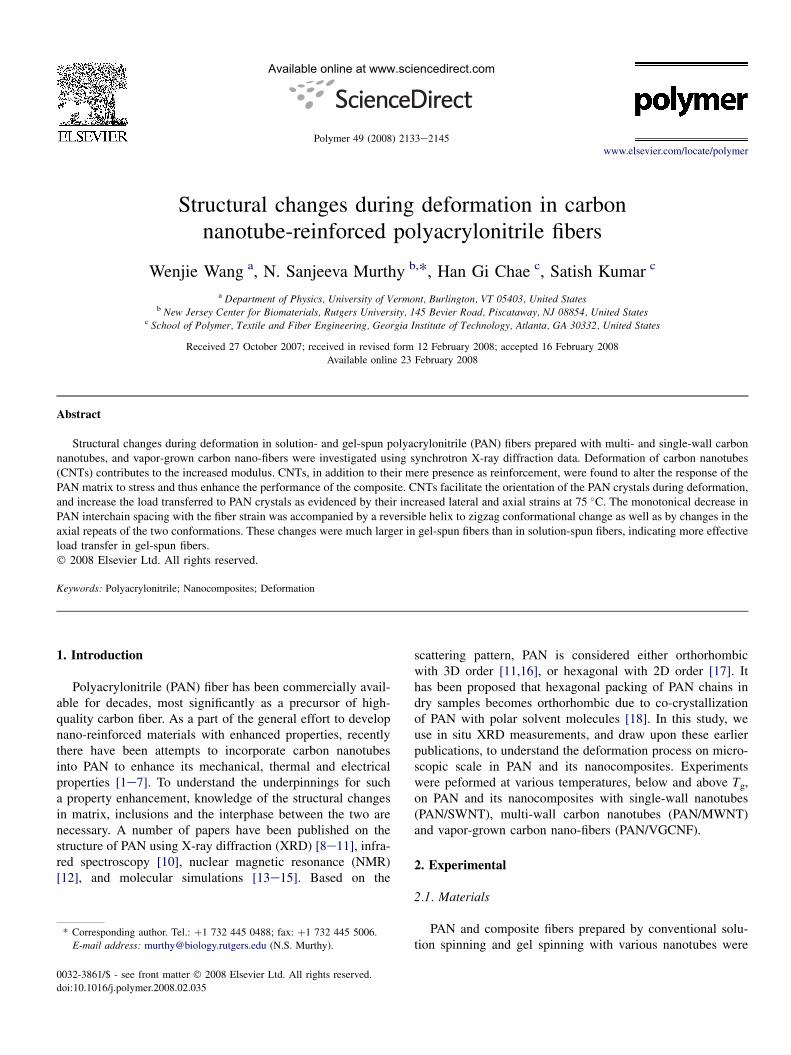
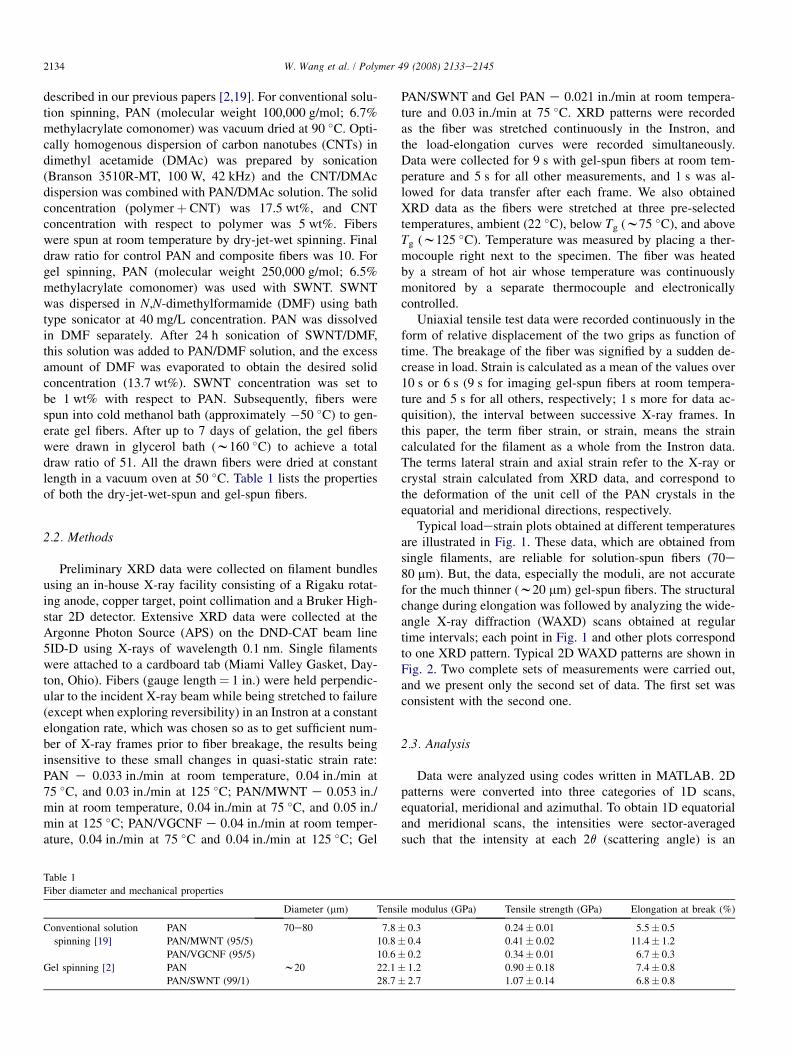
Typical loadestrain plots obtained at different temperaturesare illustrated in Fig. 1. These data, which are obtained fromsingle filaments, are reliable for solution-spun fibers (70e80 mm). But, the data, especially the moduli, are not accuratefor the much thinner (w20 mm) gel-spun fibers. The structuralchange during elongation was followed by analyzing the wide-angle X-ray diffraction (WAXD) scans obtained at regulartime intervals; each point in Fig. 1 and other plots correspondto one XRD pattern. Typical 2D WAXD patterns are shown inFig. 2. Two complete sets of measurements were carried out,and we present only the second set of data. The first set wasconsistent with the second one.
2.3. Analysis
Data were analyzed using codes written in MATLAB. 2Dpatterns were converted into three categories of 1D scans,equatorial, meridional and azimuthal. To obtain 1D equatorialand meridional scans, the intensities were sector-averagedsuch that the intensity at each 2q (scattering angle) is an
le modulus (GPa) Tensile strength (GPa) Elongation at break (%)
0.3 0.24� 0.01 5.5� 0.5
0.4 0.41� 0.02 11.4� 1.2
0.2 0.34� 0.01 6.7� 0.3
1.2 0.90� 0.18 7.4� 0.8
2.7 1.07� 0.14 6.8� 0.8
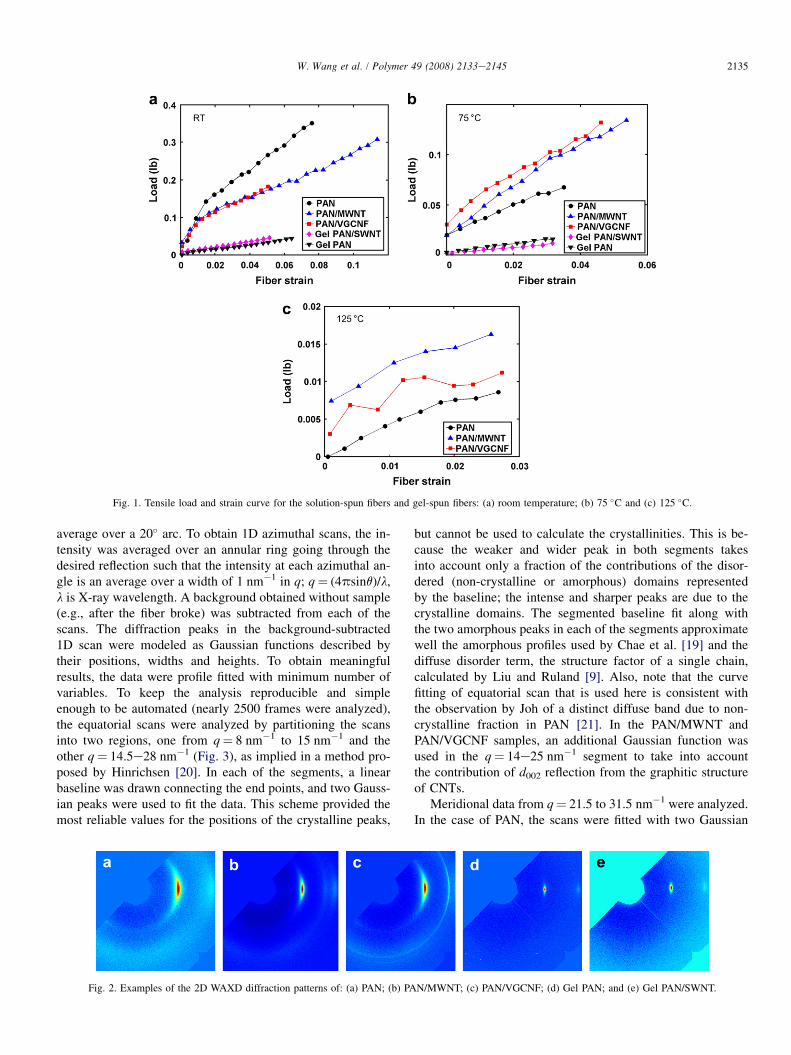
Fig. 1. Tensile load and strain curve for the solution-spun fibers and gel-spun fibers: (a) room temperature; (b) 75 �C and (c) 125 �C.
2135W. Wang et al. / Polymer 49 (2008) 2133e2145
average over a 20� arc. To obtain 1D azimuthal scans, the in-tensity was averaged over an annular ring going through thedesired reflection such that the intensity at each azimuthal an-gle is an average over a width of 1 nm�1 in q; q¼ (4psinq)/l,l is X-ray wavelength. A background obtained without sample(e.g., after the fiber broke) was subtracted from each of thescans. The diffraction peaks in the background-subtracted1D scan were modeled as Gaussian functions described bytheir positions, widths and heights. To obtain meaningfulresults, the data were profile fitted with minimum number ofvariables. To keep the analysis reproducible and simpleenough to be automated (nearly 2500 frames were analyzed),the equatorial scans were analyzed by partitioning the scansinto two regions, one from q¼ 8 nm�1 to 15 nm�1 and theother q¼ 14.5e28 nm�1 (Fig. 3), as implied in a method pro-posed by Hinrichsen [20]. In each of the segments, a linearbaseline was drawn connecting the end points, and two Gauss-ian peaks were used to fit the data. This scheme provided themost reliable values for the positions of the crystalline peaks,
Fig. 2. Examples of the 2D WAXD diffraction patterns of: (a) PAN; (b) PA
but cannot be used to calculate the crystallinities. This is be-cause the weaker and wider peak in both segments takesinto account only a fraction of the contributions of the disor-dered (non-crystalline or amorphous) domains representedby the baseline; the intense and sharper peaks are due to thecrystalline domains. The segmented baseline fit along withthe two amorphous peaks in each of the segments approximatewell the amorphous profiles used by Chae et al. [19] and thediffuse disorder term, the structure factor of a single chain,calculated by Liu and Ruland [9]. Also, note that the curvefitting of equatorial scan that is used here is consistent withthe observation by Joh of a distinct diffuse band due to non-crystalline fraction in PAN [21]. In the PAN/MWNT andPAN/VGCNF samples, an additional Gaussian function wasused in the q¼ 14e25 nm�1 segment to take into accountthe contribution of d002 reflection from the graphitic structureof CNTs.
Meridional data from q¼ 21.5 to 31.5 nm�1 were analyzed.In the case of PAN, the scans were fitted with two Gaussian
N/MWNT; (c) PAN/VGCNF; (d) Gel PAN; and (e) Gel PAN/SWNT.
Fig. 3. Profile fitted equatorial scans: (a) PAN; (b) PAN/MWNT; (c) PAN/VGCNF. The data for gel fibers are similar to that of PAN.
2136 W. Wang et al. / Polymer 49 (2008) 2133e2145
functions corresponding to zigzag and helix sequences. Thepositions of these peaks were used to calculate the chain-axis repeats of the two sequences, and the areas of the peakswere used to calculate the relative fractions of the two se-quences. In the case of PAN/MWNT and PAN/VGCNF, addi-tional Gaussian peaks at higher qs were added to take intoaccount the reflections from carbon structures in nanotubes.The carbon peaks were fitted first and subtracted from the in-tensity profile before fitting the reflections due to zigzag andhelix sequences. The center of the mass (CM) of the intensityprofile was determined as the weighted sum of the positions ofthe resolved Gaussian peaks. If x1 and x2 are the peak centers,w1 and w2 are the respective widths, and A1 and A2 are therespective peak heights, then
CM¼ ðx1A1w1þ x2A2w2Þ=ðA1w1þA2w2Þ ð1Þ
The azimuthal scans of the most intense reflection, the firstequatorial peaks of PAN and carbon, were analyzed to obtainthe degree of orientation of PAN and nanotubes. Orientationwas parameterized by the width of the Gaussian peak thatwas used to fit the scan.
3. Results and discussion
3.1. General
Major features in the WAXD pattern (Figs. 2 and 3) of PANare the two equatorial reflections corresponding to d-spacings
d1 and d2 at q w 12.0 and 20.0 nm�1, respectively [11,17,22],and a diffuse meridional diffraction peaks at w27 nm�1
[16,23]. In addition to d1 and d2 reflections, there is an addi-tional reflection at q w 18 nm�1 in PAN/MWNT and PAN/VGCNF from the separation (d002) of basal planes of graphiticsheets in the nanotubes (Fig. 3b and c). The meridional reflec-tions were diffuse but were of sufficient intensity for detailedanalysis (see Section 3.4).
The equatorial diffraction peaks represent lateral order andtheir d-spacings correspond to the inter-chain spacing. Index-ing these reflections is controversial because of the few ob-served reflections [18,22]; only two intense equatorial peakswere observed in our measurements. Although the splittingof the overlapping peaks has been reported in ultrahigh drawratio at-PAN [24], the overlapping peaks cannot be meaning-fully and reliably resolved in our data. In an orthorhombicunit cell, the first reflection (d1) is commonly indexed as110þ 200, and the second reflection (d2) as 200þ 310 [24].If we assume d1¼ d110¼ d200, d2¼ d310¼ d020, we geta¼ 2d1, b¼ 2d2. This is equivalent to assuming a hexagonalunit cell with a=b ¼
ffiffiffi3p
. In a hexagonal unit cell, by indexingd1 as d100 and d2 as d210, we get d1=d2 ¼
ffiffiffi3p
. But in ourdata we find consistent and reproducible deviation for the d1
to d2 ratio fromffiffiffi3p
that cannot be attributed to experimentalerror, especially during elongation (Fig. 4). Therefore, ortho-rhombic cell is a more appropriate description of our dataand both d1 and d2 spacings are the average of the two over-lapping peaks. Thus, although, our data suggest that unit cellis not hexagonal, the overlapping reflections do not permit
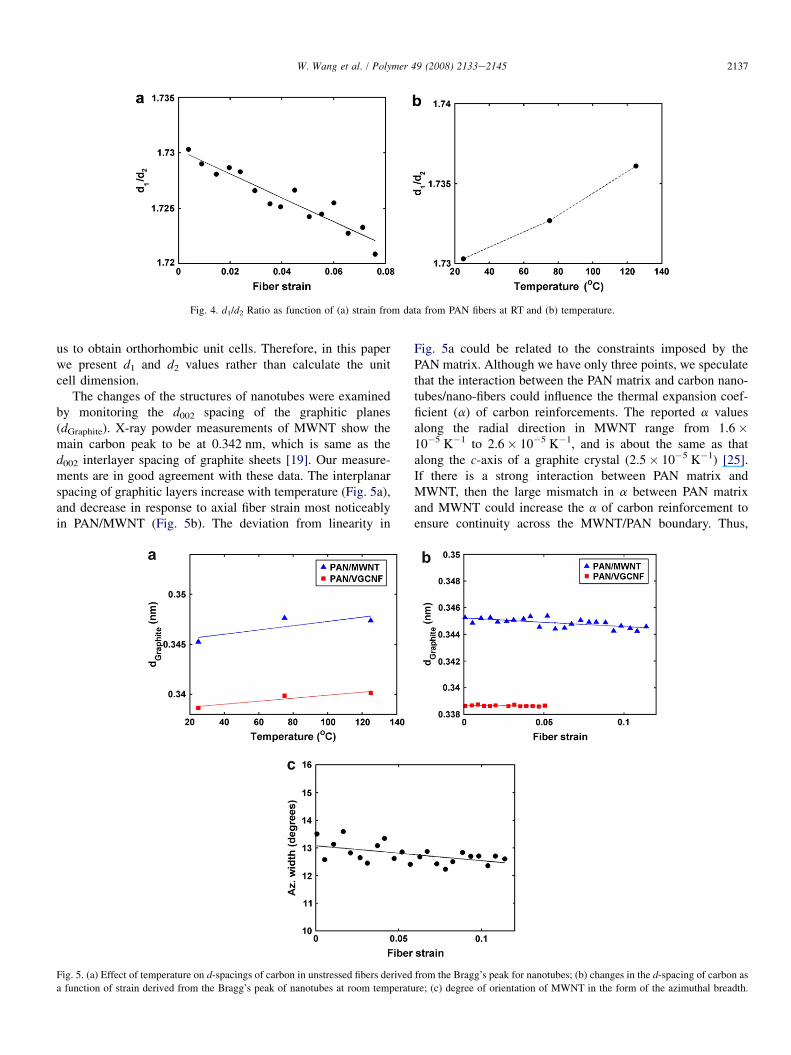
Fig. 4. d1/d2 Ratio as function of (a) strain from data from PAN fibers at RT and (b) temperature.
2137W. Wang et al. / Polymer 49 (2008) 2133e2145
us to obtain orthorhombic unit cells. Therefore, in this paperwe present d1 and d2 values rather than calculate the unitcell dimension.
The changes of the structures of nanotubes were examinedby monitoring the d002 spacing of the graphitic planes(dGraphite). X-ray powder measurements of MWNT show themain carbon peak to be at 0.342 nm, which is same as thed002 interlayer spacing of graphite sheets [19]. Our measure-ments are in good agreement with these data. The interplanarspacing of graphitic layers increase with temperature (Fig. 5a),and decrease in response to axial fiber strain most noticeablyin PAN/MWNT (Fig. 5b). The deviation from linearity in
Fig. 5. (a) Effect of temperature on d-spacings of carbon in unstressed fibers derived
a function of strain derived from the Bragg’s peak of nanotubes at room temperatu
Fig. 5a could be related to the constraints imposed by thePAN matrix. Although we have only three points, we speculatethat the interaction between the PAN matrix and carbon nano-tubes/nano-fibers could influence the thermal expansion coef-ficient (a) of carbon reinforcements. The reported a valuesalong the radial direction in MWNT range from 1.6�10�5 K�1 to 2.6� 10�5 K�1, and is about the same as thatalong the c-axis of a graphite crystal (2.5� 10�5 K�1) [25].If there is a strong interaction between PAN matrix andMWNT, then the large mismatch in a between PAN matrixand MWNT could increase the a of carbon reinforcement toensure continuity across the MWNT/PAN boundary. Thus,
from the Bragg’s peak for nanotubes; (b) changes in the d-spacing of carbon as
re; (c) degree of orientation of MWNT in the form of the azimuthal breadth.
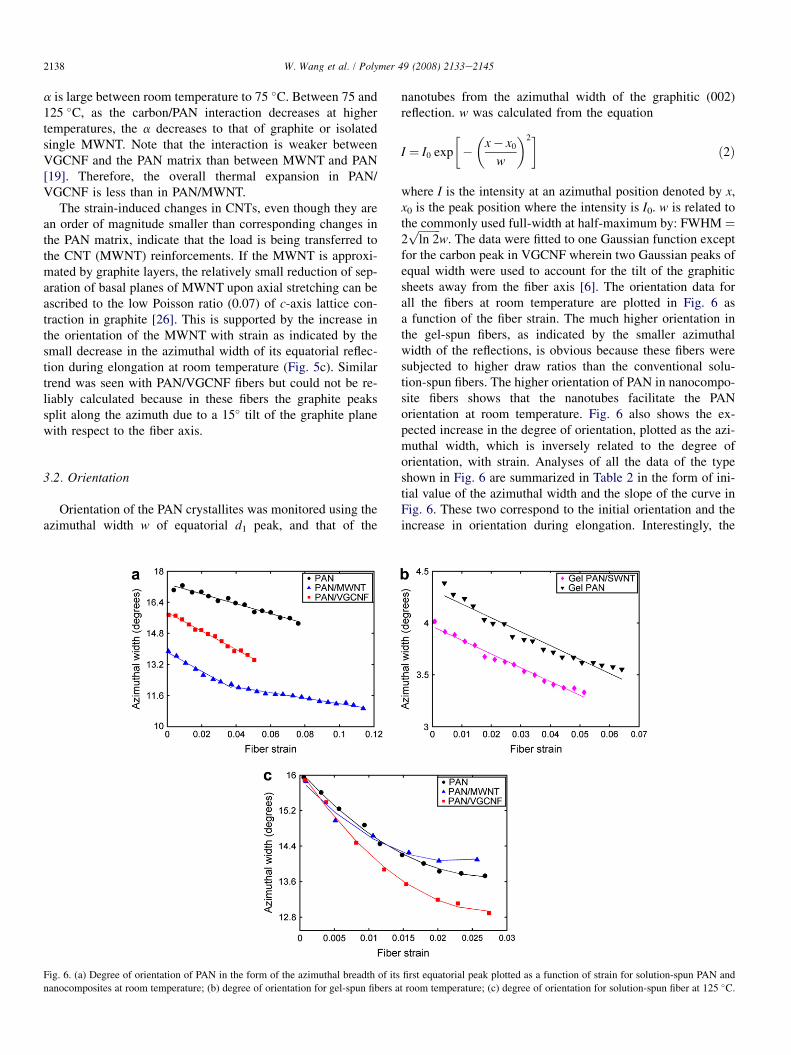
2138 W. Wang et al. / Polymer 49 (2008) 2133e2145
a is large between room temperature to 75 �C. Between 75 and125 �C, as the carbon/PAN interaction decreases at highertemperatures, the a decreases to that of graphite or isolatedsingle MWNT. Note that the interaction is weaker betweenVGCNF and the PAN matrix than between MWNT and PAN[19]. Therefore, the overall thermal expansion in PAN/VGCNF is less than in PAN/MWNT.
The strain-induced changes in CNTs, even though they arean order of magnitude smaller than corresponding changes inthe PAN matrix, indicate that the load is being transferred tothe CNT (MWNT) reinforcements. If the MWNT is approxi-mated by graphite layers, the relatively small reduction of sep-aration of basal planes of MWNT upon axial stretching can beascribed to the low Poisson ratio (0.07) of c-axis lattice con-traction in graphite [26]. This is supported by the increase inthe orientation of the MWNT with strain as indicated by thesmall decrease in the azimuthal width of its equatorial reflec-tion during elongation at room temperature (Fig. 5c). Similartrend was seen with PAN/VGCNF fibers but could not be re-liably calculated because in these fibers the graphite peakssplit along the azimuth due to a 15� tilt of the graphite planewith respect to the fiber axis.
3.2. Orientation
Orientation of the PAN crystallites was monitored using theazimuthal width w of equatorial d1 peak, and that of the
Fig. 6. (a) Degree of orientation of PAN in the form of the azimuthal breadth of its
nanocomposites at room temperature; (b) degree of orientation for gel-spun fibers a
nanotubes from the azimuthal width of the graphitic (002)reflection. w was calculated from the equation
I ¼ I0 exp
���
x� x0
w
�2�ð2Þ
where I is the intensity at an azimuthal position denoted by x,x0 is the peak position where the intensity is I0. w is related tothe commonly used full-width at half-maximum by: FWHM ¼2ffiffiffiffiffiffiffiffiln 2p
w. The data were fitted to one Gaussian function exceptfor the carbon peak in VGCNF wherein two Gaussian peaks ofequal width were used to account for the tilt of the graphiticsheets away from the fiber axis [6]. The orientation data forall the fibers at room temperature are plotted in Fig. 6 asa function of the fiber strain. The much higher orientation inthe gel-spun fibers, as indicated by the smaller azimuthalwidth of the reflections, is obvious because these fibers weresubjected to higher draw ratios than the conventional solu-tion-spun fibers. The higher orientation of PAN in nanocompo-site fibers shows that the nanotubes facilitate the PANorientation at room temperature. Fig. 6 also shows the ex-pected increase in the degree of orientation, plotted as the azi-muthal width, which is inversely related to the degree oforientation, with strain. Analyses of all the data of the typeshown in Fig. 6 are summarized in Table 2 in the form of ini-tial value of the azimuthal width and the slope of the curve inFig. 6. These two correspond to the initial orientation and theincrease in orientation during elongation. Interestingly, the
first equatorial peak plotted as a function of strain for solution-spun PAN and
t room temperature; (c) degree of orientation for solution-spun fiber at 125 �C.
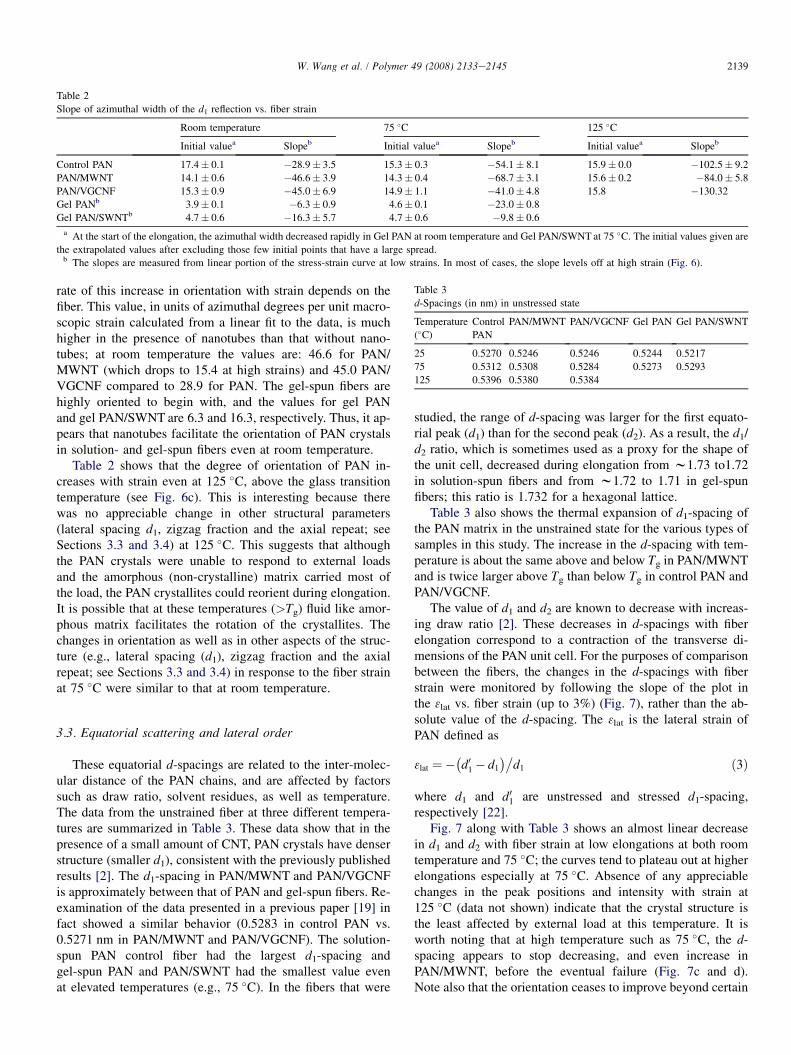
Table 2
Slope of azimuthal width of the d1 reflection vs. fiber strain
Room temperature 75 �C 125 �C
Initial valuea Slopeb Initial valuea Slopeb Initial valuea Slopeb
Control PAN 17.4� 0.1 �28.9� 3.5 15.3� 0.3 �54.1� 8.1 15.9� 0.0 �102.5� 9.2
PAN/MWNT 14.1� 0.6 �46.6� 3.9 14.3� 0.4 �68.7� 3.1 15.6� 0.2 �84.0� 5.8
PAN/VGCNF 15.3� 0.9 �45.0� 6.9 14.9� 1.1 �41.0� 4.8 15.8 �130.32
Gel PANb 3.9� 0.1 �6.3� 0.9 4.6� 0.1 �23.0� 0.8
Gel PAN/SWNTb 4.7� 0.6 �16.3� 5.7 4.7� 0.6 �9.8� 0.6
a At the start of the elongation, the azimuthal width decreased rapidly in Gel PAN at room temperature and Gel PAN/SWNT at 75 �C. The initial values given are
the extrapolated values after excluding those few initial points that have a large spread.b The slopes are measured from linear portion of the stress-strain curve at low strains. In most of cases, the slope levels off at high strain (Fig. 6).
Table 3
d-Spacings (in nm) in unstressed state
Temperature
(�C)
Control
PAN
PAN/MWNT PAN/VGCNF Gel PAN Gel PAN/SWNT
25 0.5270 0.5246 0.5246 0.5244 0.5217
75 0.5312 0.5308 0.5284 0.5273 0.5293
125 0.5396 0.5380 0.5384
2139W. Wang et al. / Polymer 49 (2008) 2133e2145
rate of this increase in orientation with strain depends on thefiber. This value, in units of azimuthal degrees per unit macro-scopic strain calculated from a linear fit to the data, is muchhigher in the presence of nanotubes than that without nano-tubes; at room temperature the values are: 46.6 for PAN/MWNT (which drops to 15.4 at high strains) and 45.0 PAN/VGCNF compared to 28.9 for PAN. The gel-spun fibers arehighly oriented to begin with, and the values for gel PANand gel PAN/SWNT are 6.3 and 16.3, respectively. Thus, it ap-pears that nanotubes facilitate the orientation of PAN crystalsin solution- and gel-spun fibers even at room temperature.
Table 2 shows that the degree of orientation of PAN in-creases with strain even at 125 �C, above the glass transitiontemperature (see Fig. 6c). This is interesting because therewas no appreciable change in other structural parameters(lateral spacing d1, zigzag fraction and the axial repeat; seeSections 3.3 and 3.4) at 125 �C. This suggests that althoughthe PAN crystals were unable to respond to external loadsand the amorphous (non-crystalline) matrix carried most ofthe load, the PAN crystallites could reorient during elongation.It is possible that at these temperatures (>Tg) fluid like amor-phous matrix facilitates the rotation of the crystallites. Thechanges in orientation as well as in other aspects of the struc-ture (e.g., lateral spacing (d1), zigzag fraction and the axialrepeat; see Sections 3.3 and 3.4) in response to the fiber strainat 75 �C were similar to that at room temperature.
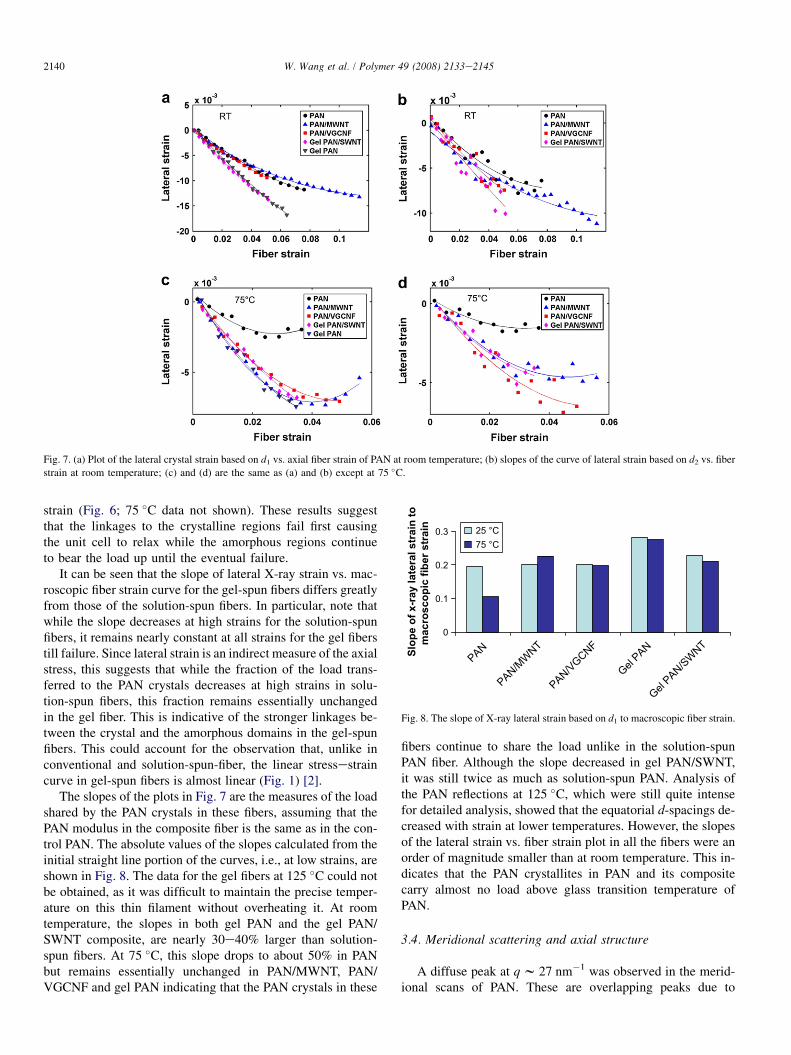
3.3. Equatorial scattering and lateral order
These equatorial d-spacings are related to the inter-molec-ular distance of the PAN chains, and are affected by factorssuch as draw ratio, solvent residues, as well as temperature.The data from the unstrained fiber at three different tempera-tures are summarized in Table 3. These data show that in thepresence of a small amount of CNT, PAN crystals have denserstructure (smaller d1), consistent with the previously publishedresults [2]. The d1-spacing in PAN/MWNT and PAN/VGCNFis approximately between that of PAN and gel-spun fibers. Re-examination of the data presented in a previous paper [19] infact showed a similar behavior (0.5283 in control PAN vs.0.5271 nm in PAN/MWNT and PAN/VGCNF). The solution-spun PAN control fiber had the largest d1-spacing andgel-spun PAN and PAN/SWNT had the smallest value evenat elevated temperatures (e.g., 75 �C). In the fibers that were
studied, the range of d-spacing was larger for the first equato-rial peak (d1) than for the second peak (d2). As a result, the d1/d2 ratio, which is sometimes used as a proxy for the shape ofthe unit cell, decreased during elongation from w1.73 to1.72in solution-spun fibers and from w1.72 to 1.71 in gel-spunfibers; this ratio is 1.732 for a hexagonal lattice.
Table 3 also shows the thermal expansion of d1-spacing ofthe PAN matrix in the unstrained state for the various types ofsamples in this study. The increase in the d-spacing with tem-perature is about the same above and below Tg in PAN/MWNTand is twice larger above Tg than below Tg in control PAN andPAN/VGCNF.
The value of d1 and d2 are known to decrease with increas-ing draw ratio [2]. These decreases in d-spacings with fiberelongation correspond to a contraction of the transverse di-mensions of the PAN unit cell. For the purposes of comparisonbetween the fibers, the changes in the d-spacings with fiberstrain were monitored by following the slope of the plot inthe 3lat vs. fiber strain (up to 3%) (Fig. 7), rather than the ab-solute value of the d-spacing. The 3lat is the lateral strain ofPAN defined as
3lat ¼��d01� d1
�d1 ð3Þ
where d1 and d01 are unstressed and stressed d1-spacing,respectively [22].
Fig. 7 along with Table 3 shows an almost linear decreasein d1 and d2 with fiber strain at low elongations at both roomtemperature and 75 �C; the curves tend to plateau out at higherelongations especially at 75 �C. Absence of any appreciablechanges in the peak positions and intensity with strain at125 �C (data not shown) indicate that the crystal structure isthe least affected by external load at this temperature. It isworth noting that at high temperature such as 75 �C, the d-spacing appears to stop decreasing, and even increase inPAN/MWNT, before the eventual failure (Fig. 7c and d).Note also that the orientation ceases to improve beyond certain
0
0.1
0.2
0.3
PAN
PAN/MWNT
PAN/VGCNF
Gel PAN
Gel PAN/SWNT
25 °C75 °C
Slo
pe o
f x-ray lateral strain
to
macro
sco
pic fib
er strain
Fig. 8. The slope of X-ray lateral strain based on d1 to macroscopic fiber strain.
Fig. 7. (a) Plot of the lateral crystal strain based on d1 vs. axial fiber strain of PAN at room temperature; (b) slopes of the curve of lateral strain based on d2 vs. fiber
strain at room temperature; (c) and (d) are the same as (a) and (b) except at 75 �C.
2140 W. Wang et al. / Polymer 49 (2008) 2133e2145
strain (Fig. 6; 75 �C data not shown). These results suggestthat the linkages to the crystalline regions fail first causingthe unit cell to relax while the amorphous regions continueto bear the load up until the eventual failure.
It can be seen that the slope of lateral X-ray strain vs. mac-roscopic fiber strain curve for the gel-spun fibers differs greatlyfrom those of the solution-spun fibers. In particular, note thatwhile the slope decreases at high strains for the solution-spunfibers, it remains nearly constant at all strains for the gel fiberstill failure. Since lateral strain is an indirect measure of the axialstress, this suggests that while the fraction of the load trans-ferred to the PAN crystals decreases at high strains in solu-tion-spun fibers, this fraction remains essentially unchangedin the gel fiber. This is indicative of the stronger linkages be-tween the crystal and the amorphous domains in the gel-spunfibers. This could account for the observation that, unlike inconventional and solution-spun-fiber, the linear stressestraincurve in gel-spun fibers is almost linear (Fig. 1) [2].
The slopes of the plots in Fig. 7 are the measures of the loadshared by the PAN crystals in these fibers, assuming that thePAN modulus in the composite fiber is the same as in the con-trol PAN. The absolute values of the slopes calculated from theinitial straight line portion of the curves, i.e., at low strains, areshown in Fig. 8. The data for the gel fibers at 125 �C could notbe obtained, as it was difficult to maintain the precise temper-ature on this thin filament without overheating it. At roomtemperature, the slopes in both gel PAN and the gel PAN/SWNT composite, are nearly 30e40% larger than solution-spun fibers. At 75 �C, this slope drops to about 50% in PANbut remains essentially unchanged in PAN/MWNT, PAN/VGCNF and gel PAN indicating that the PAN crystals in these
fibers continue to share the load unlike in the solution-spunPAN fiber. Although the slope decreased in gel PAN/SWNT,it was still twice as much as solution-spun PAN. Analysis ofthe PAN reflections at 125 �C, which were still quite intensefor detailed analysis, showed that the equatorial d-spacings de-creased with strain at lower temperatures. However, the slopesof the lateral strain vs. fiber strain plot in all the fibers were anorder of magnitude smaller than at room temperature. This in-dicates that the PAN crystallites in PAN and its compositecarry almost no load above glass transition temperature ofPAN.
3.4. Meridional scattering and axial structure
A diffuse peak at q w 27 nm�1 was observed in the merid-ional scans of PAN. These are overlapping peaks due to
2141W. Wang et al. / Polymer 49 (2008) 2133e2145
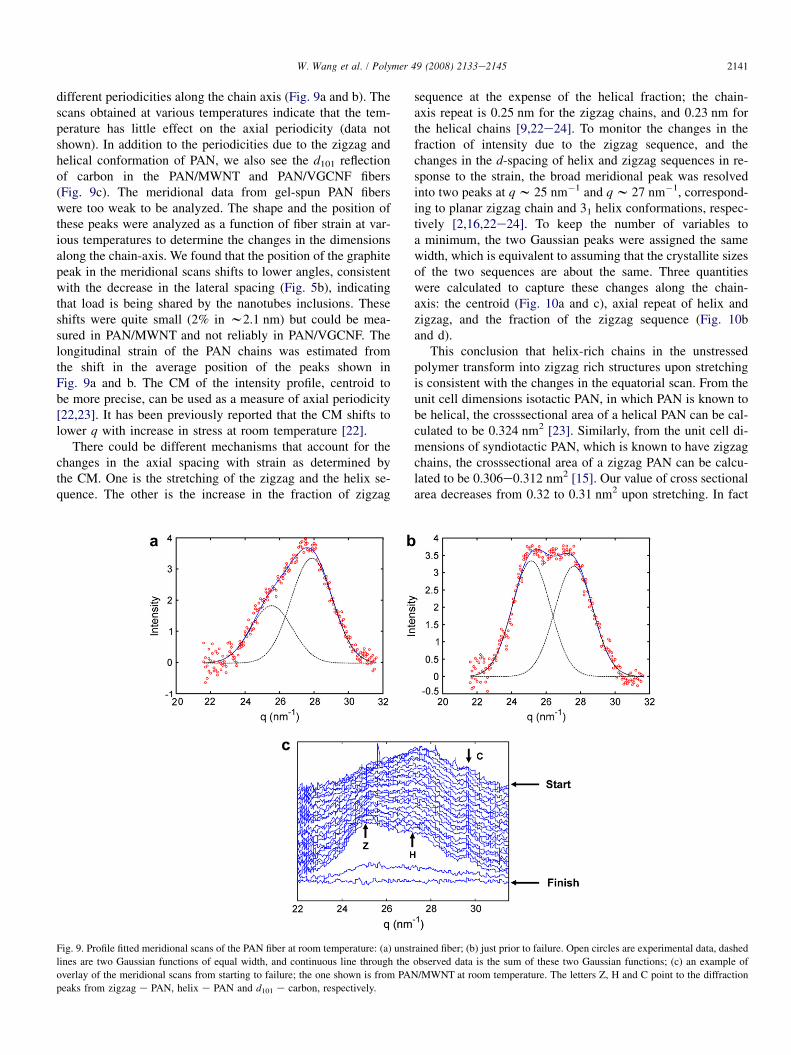
different periodicities along the chain axis (Fig. 9a and b). Thescans obtained at various temperatures indicate that the tem-perature has little effect on the axial periodicity (data notshown). In addition to the periodicities due to the zigzag andhelical conformation of PAN, we also see the d101 reflectionof carbon in the PAN/MWNT and PAN/VGCNF fibers(Fig. 9c). The meridional data from gel-spun PAN fiberswere too weak to be analyzed. The shape and the position ofthese peaks were analyzed as a function of fiber strain at var-ious temperatures to determine the changes in the dimensionsalong the chain-axis. We found that the position of the graphitepeak in the meridional scans shifts to lower angles, consistentwith the decrease in the lateral spacing (Fig. 5b), indicatingthat load is being shared by the nanotubes inclusions. Theseshifts were quite small (2% in w2.1 nm) but could be mea-sured in PAN/MWNT and not reliably in PAN/VGCNF. Thelongitudinal strain of the PAN chains was estimated fromthe shift in the average position of the peaks shown inFig. 9a and b. The CM of the intensity profile, centroid tobe more precise, can be used as a measure of axial periodicity[22,23]. It has been previously reported that the CM shifts tolower q with increase in stress at room temperature [22].
There could be different mechanisms that account for thechanges in the axial spacing with strain as determined bythe CM. One is the stretching of the zigzag and the helix se-quence. The other is the increase in the fraction of zigzag
Fig. 9. Profile fitted meridional scans of the PAN fiber at room temperature: (a) unst
lines are two Gaussian functions of equal width, and continuous line through the
overlay of the meridional scans from starting to failure; the one shown is from PAN
peaks from zigzag e PAN, helix e PAN and d101 e carbon, respectively.
sequence at the expense of the helical fraction; the chain-axis repeat is 0.25 nm for the zigzag chains, and 0.23 nm forthe helical chains [9,22e24]. To monitor the changes in thefraction of intensity due to the zigzag sequence, and thechanges in the d-spacing of helix and zigzag sequences in re-sponse to the strain, the broad meridional peak was resolvedinto two peaks at q w 25 nm�1 and q w 27 nm�1, correspond-ing to planar zigzag chain and 31 helix conformations, respec-tively [2,16,22e24]. To keep the number of variables toa minimum, the two Gaussian peaks were assigned the samewidth, which is equivalent to assuming that the crystallite sizesof the two sequences are about the same. Three quantitieswere calculated to capture these changes along the chain-axis: the centroid (Fig. 10a and c), axial repeat of helix andzigzag, and the fraction of the zigzag sequence (Fig. 10band d).
This conclusion that helix-rich chains in the unstressedpolymer transform into zigzag rich structures upon stretchingis consistent with the changes in the equatorial scan. From theunit cell dimensions isotactic PAN, in which PAN is known tobe helical, the crosssectional area of a helical PAN can be cal-culated to be 0.324 nm2 [23]. Similarly, from the unit cell di-mensions of syndiotactic PAN, which is known to have zigzagchains, the crosssectional area of a zigzag PAN can be calcu-lated to be 0.306e0.312 nm2 [15]. Our value of cross sectionalarea decreases from 0.32 to 0.31 nm2 upon stretching. In fact
rained fiber; (b) just prior to failure. Open circles are experimental data, dashed
observed data is the sum of these two Gaussian functions; (c) an example of
/MWNT at room temperature. The letters Z, H and C point to the diffraction
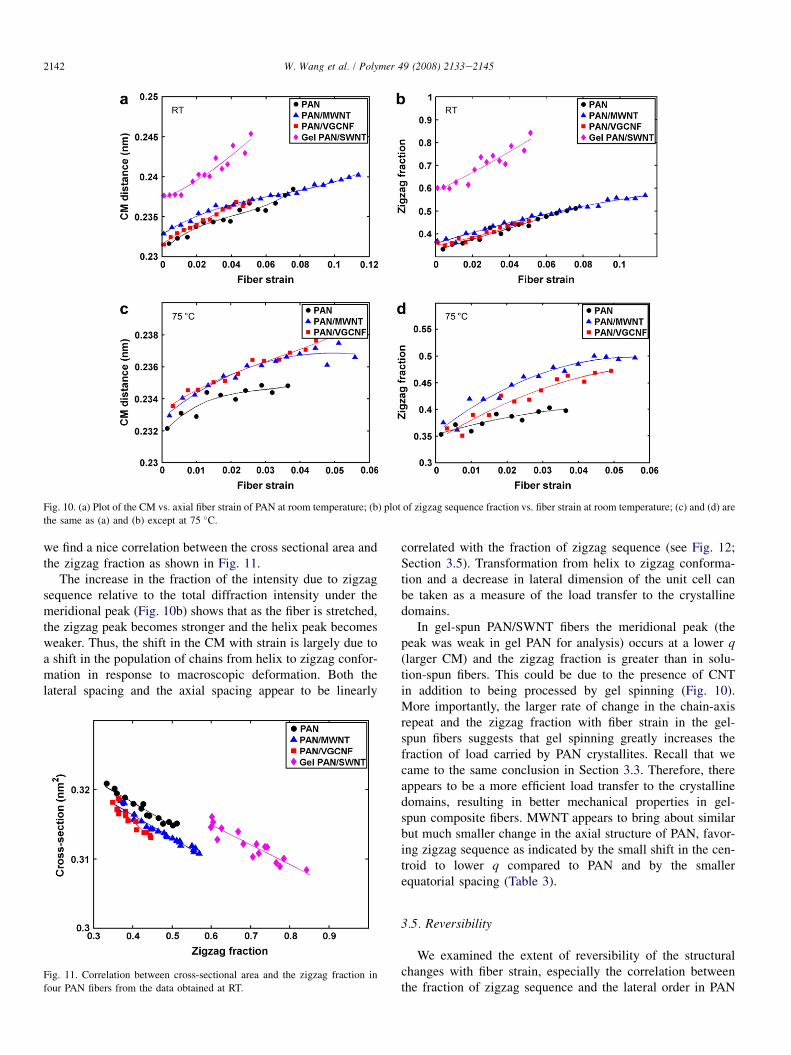
Fig. 10. (a) Plot of the CM vs. axial fiber strain of PAN at room temperature; (b) plot of zigzag sequence fraction vs. fiber strain at room temperature; (c) and (d) are
the same as (a) and (b) except at 75 �C.
2142 W. Wang et al. / Polymer 49 (2008) 2133e2145
we find a nice correlation between the cross sectional area andthe zigzag fraction as shown in Fig. 11.
The increase in the fraction of the intensity due to zigzagsequence relative to the total diffraction intensity under themeridional peak (Fig. 10b) shows that as the fiber is stretched,the zigzag peak becomes stronger and the helix peak becomesweaker. Thus, the shift in the CM with strain is largely due toa shift in the population of chains from helix to zigzag confor-mation in response to macroscopic deformation. Both thelateral spacing and the axial spacing appear to be linearly
Fig. 11. Correlation between cross-sectional area and the zigzag fraction in
four PAN fibers from the data obtained at RT.
correlated with the fraction of zigzag sequence (see Fig. 12;Section 3.5). Transformation from helix to zigzag conforma-tion and a decrease in lateral dimension of the unit cell canbe taken as a measure of the load transfer to the crystallinedomains.
In gel-spun PAN/SWNT fibers the meridional peak (thepeak was weak in gel PAN for analysis) occurs at a lower q(larger CM) and the zigzag fraction is greater than in solu-tion-spun fibers. This could be due to the presence of CNTin addition to being processed by gel spinning (Fig. 10).More importantly, the larger rate of change in the chain-axisrepeat and the zigzag fraction with fiber strain in the gel-spun fibers suggests that gel spinning greatly increases thefraction of load carried by PAN crystallites. Recall that wecame to the same conclusion in Section 3.3. Therefore, thereappears to be a more efficient load transfer to the crystallinedomains, resulting in better mechanical properties in gel-spun composite fibers. MWNT appears to bring about similarbut much smaller change in the axial structure of PAN, favor-ing zigzag sequence as indicated by the small shift in the cen-troid to lower q compared to PAN and by the smallerequatorial spacing (Table 3).
3.5. Reversibility
We examined the extent of reversibility of the structuralchanges with fiber strain, especially the correlation betweenthe fraction of zigzag sequence and the lateral order in PAN
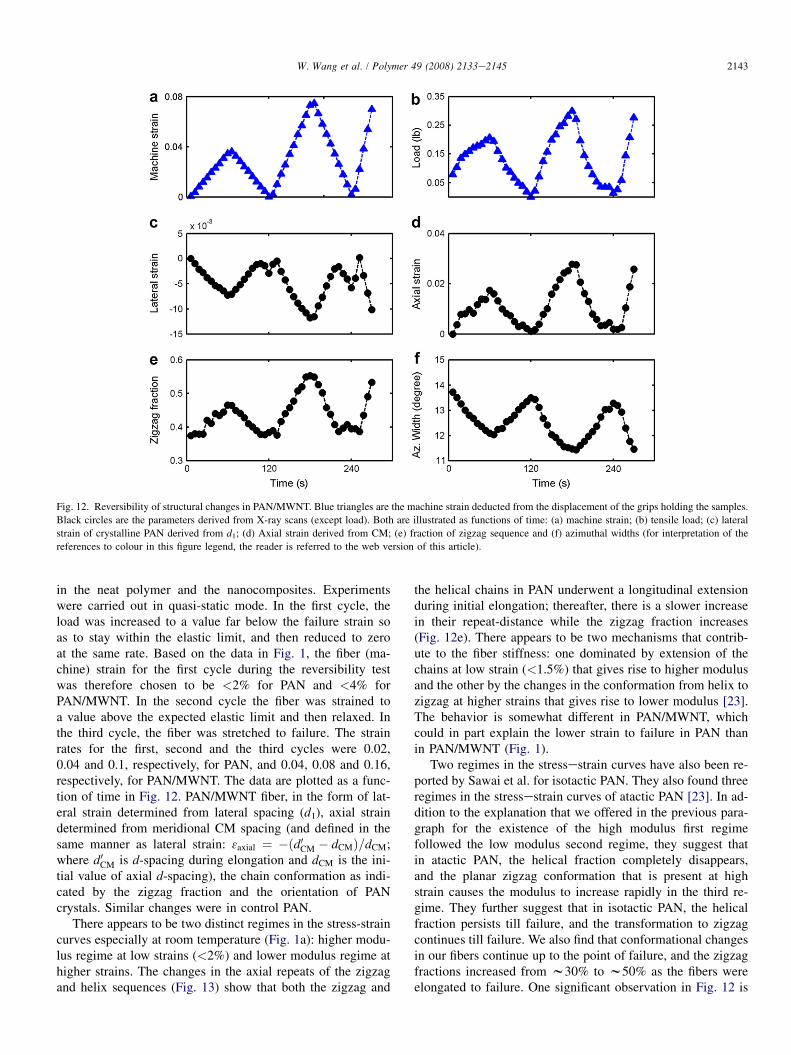
Fig. 12. Reversibility of structural changes in PAN/MWNT. Blue triangles are the machine strain deducted from the displacement of the grips holding the samples.
Black circles are the parameters derived from X-ray scans (except load). Both are illustrated as functions of time: (a) machine strain; (b) tensile load; (c) lateral
strain of crystalline PAN derived from d1; (d) Axial strain derived from CM; (e) fraction of zigzag sequence and (f) azimuthal widths (for interpretation of the
references to colour in this figure legend, the reader is referred to the web version of this article).
2143W. Wang et al. / Polymer 49 (2008) 2133e2145
in the neat polymer and the nanocomposites. Experimentswere carried out in quasi-static mode. In the first cycle, theload was increased to a value far below the failure strain soas to stay within the elastic limit, and then reduced to zeroat the same rate. Based on the data in Fig. 1, the fiber (ma-chine) strain for the first cycle during the reversibility testwas therefore chosen to be <2% for PAN and <4% forPAN/MWNT. In the second cycle the fiber was strained toa value above the expected elastic limit and then relaxed. Inthe third cycle, the fiber was stretched to failure. The strainrates for the first, second and the third cycles were 0.02,0.04 and 0.1, respectively, for PAN, and 0.04, 0.08 and 0.16,respectively, for PAN/MWNT. The data are plotted as a func-tion of time in Fig. 12. PAN/MWNT fiber, in the form of lat-eral strain determined from lateral spacing (d1), axial straindetermined from meridional CM spacing (and defined in thesame manner as lateral strain: 3axial ¼ �ðd0CM � dCMÞ=dCM;where d0CM is d-spacing during elongation and dCM is the ini-tial value of axial d-spacing), the chain conformation as indi-cated by the zigzag fraction and the orientation of PANcrystals. Similar changes were in control PAN.
There appears to be two distinct regimes in the stress-straincurves especially at room temperature (Fig. 1a): higher modu-lus regime at low strains (<2%) and lower modulus regime athigher strains. The changes in the axial repeats of the zigzagand helix sequences (Fig. 13) show that both the zigzag and
the helical chains in PAN underwent a longitudinal extensionduring initial elongation; thereafter, there is a slower increasein their repeat-distance while the zigzag fraction increases(Fig. 12e). There appears to be two mechanisms that contrib-ute to the fiber stiffness: one dominated by extension of thechains at low strain (<1.5%) that gives rise to higher modulusand the other by the changes in the conformation from helix tozigzag at higher strains that gives rise to lower modulus [23].The behavior is somewhat different in PAN/MWNT, whichcould in part explain the lower strain to failure in PAN thanin PAN/MWNT (Fig. 1).
Two regimes in the stressestrain curves have also been re-ported by Sawai et al. for isotactic PAN. They also found threeregimes in the stressestrain curves of atactic PAN [23]. In ad-dition to the explanation that we offered in the previous para-graph for the existence of the high modulus first regimefollowed the low modulus second regime, they suggest thatin atactic PAN, the helical fraction completely disappears,and the planar zigzag conformation that is present at highstrain causes the modulus to increase rapidly in the third re-gime. They further suggest that in isotactic PAN, the helicalfraction persists till failure, and the transformation to zigzagcontinues till failure. We also find that conformational changesin our fibers continue up to the point of failure, and the zigzagfractions increased from w30% to w50% as the fibers wereelongated to failure. One significant observation in Fig. 12 is
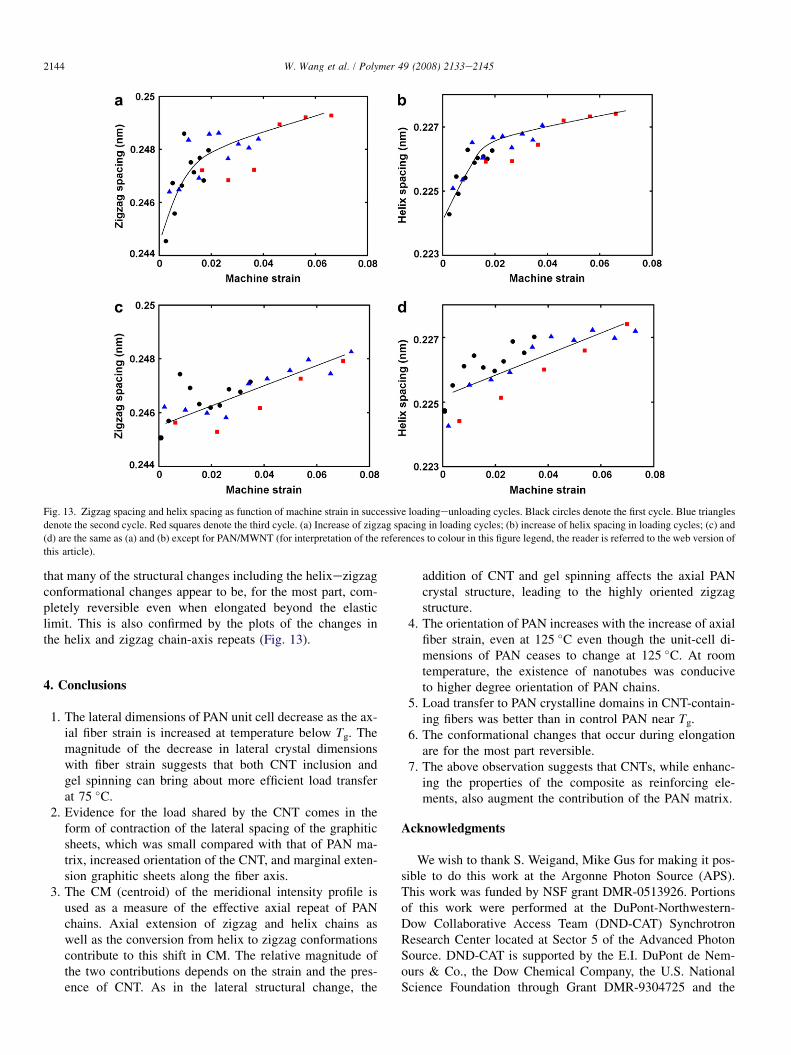
Fig. 13. Zigzag spacing and helix spacing as function of machine strain in successive loadingeunloading cycles. Black circles denote the first cycle. Blue triangles
denote the second cycle. Red squares denote the third cycle. (a) Increase of zigzag spacing in loading cycles; (b) increase of helix spacing in loading cycles; (c) and
(d) are the same as (a) and (b) except for PAN/MWNT (for interpretation of the references to colour in this figure legend, the reader is referred to the web version of
this article).
2144 W. Wang et al. / Polymer 49 (2008) 2133e2145
that many of the structural changes including the helixezigzagconformational changes appear to be, for the most part, com-pletely reversible even when elongated beyond the elasticlimit. This is also confirmed by the plots of the changes inthe helix and zigzag chain-axis repeats (Fig. 13).
4. Conclusions
1. The lateral dimensions of PAN unit cell decrease as the ax-ial fiber strain is increased at temperature below Tg. Themagnitude of the decrease in lateral crystal dimensionswith fiber strain suggests that both CNT inclusion andgel spinning can bring about more efficient load transferat 75 �C.
2. Evidence for the load shared by the CNT comes in theform of contraction of the lateral spacing of the graphiticsheets, which was small compared with that of PAN ma-trix, increased orientation of the CNT, and marginal exten-sion graphitic sheets along the fiber axis.
3. The CM (centroid) of the meridional intensity profile isused as a measure of the effective axial repeat of PANchains. Axial extension of zigzag and helix chains aswell as the conversion from helix to zigzag conformationscontribute to this shift in CM. The relative magnitude ofthe two contributions depends on the strain and the pres-ence of CNT. As in the lateral structural change, the
addition of CNT and gel spinning affects the axial PANcrystal structure, leading to the highly oriented zigzagstructure.
4. The orientation of PAN increases with the increase of axialfiber strain, even at 125 �C even though the unit-cell di-mensions of PAN ceases to change at 125 �C. At roomtemperature, the existence of nanotubes was conduciveto higher degree orientation of PAN chains.
5. Load transfer to PAN crystalline domains in CNT-contain-ing fibers was better than in control PAN near Tg.
6. The conformational changes that occur during elongationare for the most part reversible.
7. The above observation suggests that CNTs, while enhanc-ing the properties of the composite as reinforcing ele-ments, also augment the contribution of the PAN matrix.
Acknowledgments
We wish to thank S. Weigand, Mike Gus for making it pos-sible to do this work at the Argonne Photon Source (APS).This work was funded by NSF grant DMR-0513926. Portionsof this work were performed at the DuPont-Northwestern-Dow Collaborative Access Team (DND-CAT) SynchrotronResearch Center located at Sector 5 of the Advanced PhotonSource. DND-CAT is supported by the E.I. DuPont de Nem-ours & Co., the Dow Chemical Company, the U.S. NationalScience Foundation through Grant DMR-9304725 and the
2145W. Wang et al. / Polymer 49 (2008) 2133e2145
State of Illinois through the Department of Commerce and theBoard of Higher Education Grant IBHE HECA NWU 96. Useof the Advanced Photon Source was supported by the U.S. De-partment of Energy, Office of Science, Office of Basic EnergySciences, under Contract No. W-31-109-ENG-38. Fiber stud-ies at Georgia Tech are supported by a grant from the AirForce Office of Scientific Research (FA 9550-07-1-0233).
References
[1] Guo H, Sreekumar TV, Liu T, Minus M, Kumar S. Polymer
2005;46:3001e5.
[2] Chae HG, Minus ML, Kumar S. Polymer 2006;47:3494e504.
[3] Chae HG, Minus ML, Rasheed A, Kumar S. Polymer 2007;48:3781e9.
[4] Koganemaru A, Bin Y, Agari Y, Matsuo M. Adv Funct Mater
2004;14(9):842e50.
[5] Sreekumar TV, Liu T, Min BG, Guo H, Kumar S, Hauge RH, et al. Adv
Mater 2004;16(1):58e61.
[6] Uchida T, Anderson DP, Minus M, Kumar S. J Mater Sci 2006;
41(18):5851e6.
[7] Ye H, Lam H, Titchenal N, Gogotsi Y, Ko F. Appl Phys Lett 2004;
85(10):1775e9.
[8] Bohn CR, Schaefgen JR, Statton WO. J Polym Sci 1961;55:531e49.
[9] Liu XD, Ruland W. Macromolecules 1993;26:3030e6.
[10] Bashir Z, Tipping AR, Church SP. Polym Int 1994;33:9e17.
[11] Colvin BG, Storr P. Eur Polym J 1974;10:337e40.
[12] Svegliado G, Talamini G, Vidotto G. J Polym Sci Part A Polym Chem
1967;5:2875e81.
[13] Hu XP. J Appl Polym Sci 1996;62:1925e32.
[14] Hobson RJ, Windle AH. Macromolecules 1993;26:6903e7.
[15] Hobson RJ, Windle AH. Polymer 1993;34(17):3582e96.
[16] Sawai D, Yamane A, Takahashi H, Kanamoto T, Ito M, Porter RS.
J Polym Sci Part B Polym Phys 1998;36:629e40.
[17] Allen RA, Ward IM, Bashir Z. Polymer 1994;35(10):2063e71.
[18] Bashir Z. J Polym Sci Part B Polym Phys 1994;32:1115e28.
[19] Chae HG, Sreekumar TV, Uchida T, Kumar S. Polymer 2005;46:
10925e35.
[20] Hinrichsen G. J Polym Sci Polym Symp Series C 1972;38:303e14.
[21] Joh Y. J Poly Sci Polym Chem Ed 1979;17:4051e67.
[22] Allen RA, Ward IM, Bashir Z. Polymer 1994;35(19):4035e40.
[23] Sawai D, Yamane A, Kameda T, Kanamoto T. Macromolecules
1999;32:5622e30.
[24] Yamane A, Sawai D, Kameda T, Kanamoto T, Ito M, Porter RS.
Macromolecules 1997;30:4170e8.
[25] Wong M, Paramsothy M, Xu XJ, Ren Y, Li S, Liao K. Polymer
2003;44:7757e64.
[26] Kelly BT, Martin WH, Nettley PT. Phil Trans Roy Soc Lond Series A
Math Phys Sci 1966;260(1109):37e49.
Related Documents


