Structural and magnetic studies on Zr doped ZnO diluted magnetic semiconductor G. Murtaza a, * , R. Ahmad a , M.S. Rashid b , M. Hassan b , A. Hussnain c , Muhammad Azhar Khan d , M. Ehsan ul Haq a , M.A. Shafique a , S. Riaz e a Centre for Advanced Studies in Physics, Government College University, Lahore 54000, Pakistan b Department of Physics, University of the Punjab, Lahore 54590, Pakistan c Department of Physics, Government College University, Lahore 54000, Pakistan d Department of Physics, The Islamia University of Bahawalpur, Bahawalpur 63100, Pakistan e Centre for Excellence in Solid State Physics, University of the Punjab, Lahore 54590, Pakistan article info Article history: Received 9 September 2013 Received in revised form 31 October 2013 Accepted 7 November 2013 Available online 15 November 2013 Keywords: Zr doped ZnO Solid-State reaction Dilute magnetic semiconductor (DMS) Room temperature ferromagnetism abstract In this study, Zirconium doped Zn 1x Zr x O (with x ¼ 0.00e0.10) samples have been prepared by formal solid-state reaction technique. The Zr doped ZnO samples annealed at 1100 C and characterized by different characterization techniques, such as X-ray diffraction (XRD), Scanning electron microscope (SEM), Vibrating sample magnetometer (VSM) and Fourier transform infrared spectroscopy (FTIR). The X- ray diffraction (XRD) used to study the structural properties. XRD pattern showed that lattice parameters, “a”, “c”, unit cell volume and ZneO bond length increase with doping content (x 0.04) where as these decrease with x > 0.04. On the other hand, reverse trend observed with lattice distortion. The crystallite size decreases with increasing doping content of Zr. FTIR employed to investigate functional chemical bonding properties of different elements and compounds present in materials. The low, medium and high frequency absorption bands observed at 630, 1500 and 3435 cm 1 , which were the common fea- tures of ZneO, HeOeH and OeH bond respectively. SEM used to study surface morphology and measured grain size of specimen. The surface becomes dense and grain size decreases with increasing degree of Zr contents. The SEM micrograph also shows the presence of spherical micro size particles and formation of pores in samples. Magnetic properties were obtained using VSM. The samples exhibit room temperature ferromagnetism. The magnetic hysteresis loops show variation in the value of magnetic parameter. The saturation magnetization (M s ) and coercivity (H c ) decrease, while remanence magneti- zation (M r ) shows gradually increasing trend with Zr content. VSM measurement reveals that sample Zn 0.96 Zr 0.4 O show better result as compared to x ¼ 0.06e0.10. Ó 2013 Elsevier B.V. All rights reserved. 1. Introduction The incipient field of spintronics demands materials that exhibit room temperature ferromagnetism while holding their semi- conducting properties. An ingenious scheme for producing these materials is by substituting magnetic transition metals ions onto the cation sites. The cation site usually used binary semiconductors like ZnO. It is suitable for short wavelength optoelectronic appli- cations because of its wide band gap of 3.3 eV and high binding energy of 60 meV. ZnO is transparent to visible light at room temperature and can be make highly conductive by doping [1]. Moreover, ZnO crystallizes in the hexagonal wurtzite structure having mean lattice constants values of a ¼ 3.2469 A and c ¼ 5.2069 A [2]. The wurtzite structure consists of triangularly arranged alternating biatomic close-packed (0001) planes (Zn and O pairs in the case of ZnO). It was theoretically demonstrated, that GaN and ZnO behave as a typical n-type semiconductors. Therefore, these are ideal nominees for room temperature diluted magnetic semiconductors (DMSs) [3]. DMS are doped with transition metals (Mn, Cr, Co, Ni, Fe, Cu, Y, etc.,) or rare earth metals (Ho, Gd, Nd, Sm, etc.,) using different synthesis techniques. The magnetic ordering in DMS materials is an important factor for their advance applications. These materials offer the advantage of semiconducting properties combined with nonvolatile magnetic properties. The fabrication of these materials depends on thermal equilibrium solubility of doping elements. The DMS from IIeVI and IIIeV groups are the most studied materials. Such DMS have applications in data storage * Corresponding author. Tel./fax: þ92 3214263536. E-mail addresses: [email protected], [email protected] (G. Murtaza). Contents lists available at ScienceDirect Current Applied Physics journal homepage: www.elsevier.com/locate/cap 1567-1739/$ e see front matter Ó 2013 Elsevier B.V. All rights reserved. http://dx.doi.org/10.1016/j.cap.2013.11.002 Current Applied Physics 14 (2014) 176e181

Welcome message from author
This document is posted to help you gain knowledge. Please leave a comment to let me know what you think about it! Share it to your friends and learn new things together.
Transcript
lable at ScienceDirect
Current Applied Physics 14 (2014) 176e181
Contents lists avai
Current Applied Physics
journal homepage: www.elsevier .com/locate/cap
Structural and magnetic studies on Zr doped ZnO diluted magneticsemiconductor
G. Murtaza a,*, R. Ahmad a, M.S. Rashid b, M. Hassan b, A. Hussnain c,Muhammad Azhar Khan d, M. Ehsan ul Haq a, M.A. Shafique a, S. Riaz e
aCentre for Advanced Studies in Physics, Government College University, Lahore 54000, PakistanbDepartment of Physics, University of the Punjab, Lahore 54590, PakistancDepartment of Physics, Government College University, Lahore 54000, PakistandDepartment of Physics, The Islamia University of Bahawalpur, Bahawalpur 63100, PakistaneCentre for Excellence in Solid State Physics, University of the Punjab, Lahore 54590, Pakistan
a r t i c l e i n f o
Article history:Received 9 September 2013Received in revised form31 October 2013Accepted 7 November 2013Available online 15 November 2013
Keywords:Zr doped ZnOSolid-State reactionDilute magnetic semiconductor (DMS)Room temperature ferromagnetism
* Corresponding author. Tel./fax: þ92 3214263536.E-mail addresses: [email protected],
(G. Murtaza).
1567-1739/$ e see front matter � 2013 Elsevier B.V.http://dx.doi.org/10.1016/j.cap.2013.11.002
a b s t r a c t
In this study, Zirconium doped Zn1�xZrxO (with x ¼ 0.00e0.10) samples have been prepared by formalsolid-state reaction technique. The Zr doped ZnO samples annealed at 1100 �C and characterized bydifferent characterization techniques, such as X-ray diffraction (XRD), Scanning electron microscope(SEM), Vibrating sample magnetometer (VSM) and Fourier transform infrared spectroscopy (FTIR). The X-ray diffraction (XRD) used to study the structural properties. XRD pattern showed that lattice parameters,“a”, “c”, unit cell volume and ZneO bond length increase with doping content (x � 0.04) where as thesedecrease with x > 0.04. On the other hand, reverse trend observed with lattice distortion. The crystallitesize decreases with increasing doping content of Zr. FTIR employed to investigate functional chemicalbonding properties of different elements and compounds present in materials. The low, medium andhigh frequency absorption bands observed at 630, 1500 and 3435 cm�1, which were the common fea-tures of ZneO, HeOeH and OeH bond respectively. SEM used to study surface morphology andmeasured grain size of specimen. The surface becomes dense and grain size decreases with increasingdegree of Zr contents. The SEM micrograph also shows the presence of spherical micro size particles andformation of pores in samples. Magnetic properties were obtained using VSM. The samples exhibit roomtemperature ferromagnetism. The magnetic hysteresis loops show variation in the value of magneticparameter. The saturation magnetization (Ms) and coercivity (Hc) decrease, while remanence magneti-zation (Mr) shows gradually increasing trend with Zr content. VSM measurement reveals that sampleZn0.96Zr0.4O show better result as compared to x ¼ 0.06e0.10.
� 2013 Elsevier B.V. All rights reserved.
1. Introduction
The incipient field of spintronics demands materials that exhibitroom temperature ferromagnetism while holding their semi-conducting properties. An ingenious scheme for producing thesematerials is by substituting magnetic transition metals ions ontothe cation sites. The cation site usually used binary semiconductorslike ZnO. It is suitable for short wavelength optoelectronic appli-cations because of its wide band gap of 3.3 eV and high bindingenergy of 60 meV. ZnO is transparent to visible light at roomtemperature and can be make highly conductive by doping [1].
All rights reserved.
Moreover, ZnO crystallizes in the hexagonal wurtzite structurehaving mean lattice constants values of a ¼ 3.2469 �A andc ¼ 5.2069 �A [2]. The wurtzite structure consists of triangularlyarranged alternating biatomic close-packed (0001) planes (Zn andO pairs in the case of ZnO). It was theoretically demonstrated, thatGaN and ZnO behave as a typical n-type semiconductors. Therefore,these are ideal nominees for room temperature diluted magneticsemiconductors (DMSs) [3]. DMS are doped with transition metals(Mn, Cr, Co, Ni, Fe, Cu, Y, etc.,) or rare earth metals (Ho, Gd, Nd, Sm,etc.,) using different synthesis techniques. Themagnetic ordering inDMSmaterials is an important factor for their advance applications.These materials offer the advantage of semiconducting propertiescombined with nonvolatile magnetic properties. The fabrication ofthese materials depends on thermal equilibrium solubility ofdoping elements. The DMS from IIeVI and IIIeV groups are themost studied materials. Such DMS have applications in data storage
G. Murtaza et al. / Current Applied Physics 14 (2014) 176e181 177
and information processing devices [4,5]. Traditional semi-conductors like Ge, Si and GaAs are nonmagnetic and are beingextensively employed in microelectronics devices. There are fewtraditional magnetic semiconductors, such as, EuO, Gd2S3 andFe3O4. Their crystal structure is different to those of traditionalsemiconductors. Hence, magnetic semiconductor cannot replacetraditional nonmagnetic semiconductors. Therefore, dilute mag-netic semiconductors are being investigated in which traditionalnonmagnetic semiconductor like GaAs is doped with transitionmetal ions like Mn to make it magnetic. DMS is preserving itsoriginal semiconducting properties without affecting the crystalstructure and other important properties.
The nonmagnetic semiconductors from group IIeVI [6] and IIIeV [7] show interesting properties of ferromagnetic. Today, thefundamental research is directed to create and control spin polarizecurrents in semiconducting materials. Therefore, extremely effec-tive spin injection is possible in semiconductors. The spin polari-zations of a few percent are possible in ferromagnetic metals [8].Ferromagnetic semiconductors (DMS) facilitate easier integrationof spintronics to existing traditional semiconductor devices.
Fewworks has been reported on the ferromagnetic behaviour ofZr doped ZnO diluted magnetic semiconductor at room tempera-ture in the form of thin films and nanocrystals [9,10]. In the presentwork, we have made attempt to investigate Zn1�xZrxO using thesolid state reaction. Structural, morphological, chemical bondingandmagnetic properties of synthesized Zr doped ZnO bulk sampleshave been analyzed.
2. Experiment
Startingmaterials consist of powders of ZrO2 and ZnO. The ZnO is99.99% pure (Sigma Aldrich, UK) and ZrO2 is 95.00% pure (Merck,Germany). Solid state reaction technique was used to synthesizepowders of zinc and zirconium oxide. A series of Zn1�xZrxO withx¼ 0.0, 0.02, 0.04, 0.06, 0.08, and 0.10were prepared bymixingwellgrinded ZnO and ZrO2 in powder form, according to their molecularweight ratios. For the calcinations process, samples in the powdersform were placed in the digital furnace and the temperature of thefurnace was slowly raised from room temperature to 600 �C. Thepowder samples were calcined in air at 600 �C for 5 h in a digitalfurnace (Nabertherm Model). To get very fine powder, the powderwas again ground for 10min. The pellets of powders weremade at apressure of 3 ton using die and hydraulic press. The samples in thepellet formwere finally sintered in air at 1100 �C for 8 h. The furnacewas automatically switched off after these steps. The sample left tocool inside the furnace. After cooling, the samples were removedfrom the furnace for various characterizations. The prepared sam-ples were characterized by XRD, SEM, FTIR and VSM. X-ray diffrac-tometer (Philips using Cu KN radiation) was used to study structuralproperties like crystalline nature and phase purity. Scanning elec-tron microscope (SEM) of model JEOL JSM-6480 was employed tostudy surface morphology and microstructure of powder samples.Vibrating sample magnetometer (VSM) of Model 7300 series Lake-shore was used to study magnetic properties of samples. Fourier-transform infrared spectroscopy (IR Prestige-21 Szhamdzu) wasapplied to investigate the chemical bonding properties for all thesamples using ATR between the range 4000 and 400 cm�1. Allmeasurements of samples were carried out at room temperature.
3. Results and discussion
3.1. Structure analysis
X-ray diffraction of the undoped ZnO and Zr doped Zn1�xZrxO(x¼ 0.0e0.10) bulk samples in the form of pellets are in closematch
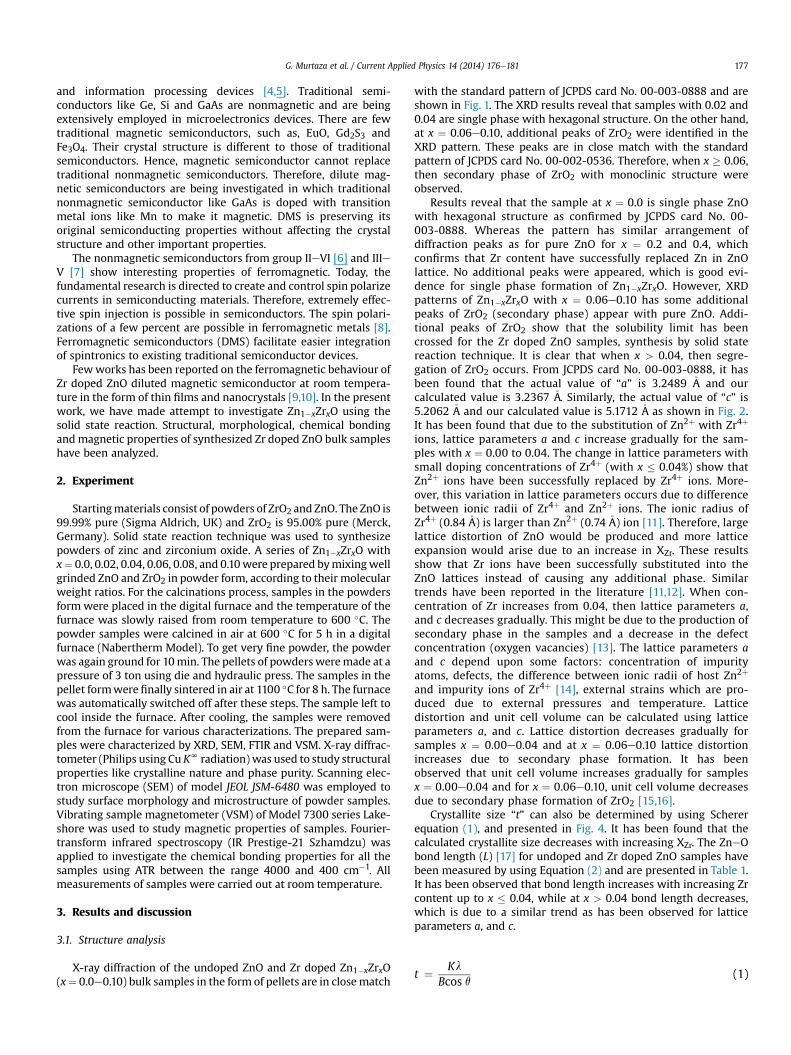
with the standard pattern of JCPDS card No. 00-003-0888 and areshown in Fig. 1. The XRD results reveal that samples with 0.02 and0.04 are single phase with hexagonal structure. On the other hand,at x ¼ 0.06e0.10, additional peaks of ZrO2 were identified in theXRD pattern. These peaks are in close match with the standardpattern of JCPDS card No. 00-002-0536. Therefore, when x � 0.06,then secondary phase of ZrO2 with monoclinic structure wereobserved.
Results reveal that the sample at x ¼ 0.0 is single phase ZnOwith hexagonal structure as confirmed by JCPDS card No. 00-003-0888. Whereas the pattern has similar arrangement ofdiffraction peaks as for pure ZnO for x ¼ 0.2 and 0.4, whichconfirms that Zr content have successfully replaced Zn in ZnOlattice. No additional peaks were appeared, which is good evi-dence for single phase formation of Zn1�xZrxO. However, XRDpatterns of Zn1�xZrxO with x ¼ 0.06e0.10 has some additionalpeaks of ZrO2 (secondary phase) appear with pure ZnO. Addi-tional peaks of ZrO2 show that the solubility limit has beencrossed for the Zr doped ZnO samples, synthesis by solid statereaction technique. It is clear that when x > 0.04, then segre-gation of ZrO2 occurs. From JCPDS card No. 00-003-0888, it hasbeen found that the actual value of “a” is 3.2489 �A and ourcalculated value is 3.2367 �A. Similarly, the actual value of “c” is5.2062 �A and our calculated value is 5.1712 �A as shown in Fig. 2.It has been found that due to the substitution of Zn2þ with Zr4þ
ions, lattice parameters a and c increase gradually for the sam-ples with x ¼ 0.00 to 0.04. The change in lattice parameters withsmall doping concentrations of Zr4þ (with x � 0.04%) show thatZn2þ ions have been successfully replaced by Zr4þ ions. More-over, this variation in lattice parameters occurs due to differencebetween ionic radii of Zr4þ and Zn2þ ions. The ionic radius ofZr4þ (0.84 �A) is larger than Zn2þ (0.74 �A) ion [11]. Therefore, largelattice distortion of ZnO would be produced and more latticeexpansion would arise due to an increase in XZr. These resultsshow that Zr ions have been successfully substituted into theZnO lattices instead of causing any additional phase. Similartrends have been reported in the literature [11,12]. When con-centration of Zr increases from 0.04, then lattice parameters a,and c decreases gradually. This might be due to the production ofsecondary phase in the samples and a decrease in the defectconcentration (oxygen vacancies) [13]. The lattice parameters aand c depend upon some factors: concentration of impurityatoms, defects, the difference between ionic radii of host Zn2þ
and impurity ions of Zr4þ [14], external strains which are pro-duced due to external pressures and temperature. Latticedistortion and unit cell volume can be calculated using latticeparameters a, and c. Lattice distortion decreases gradually forsamples x ¼ 0.00e0.04 and at x ¼ 0.06e0.10 lattice distortionincreases due to secondary phase formation. It has beenobserved that unit cell volume increases gradually for samplesx ¼ 0.00e0.04 and for x ¼ 0.06e0.10, unit cell volume decreasesdue to secondary phase formation of ZrO2 [15,16].
Crystallite size “t” can also be determined by using Schererequation (1), and presented in Fig. 4. It has been found that thecalculated crystallite size decreases with increasing XZr. The ZneObond length (L) [17] for undoped and Zr doped ZnO samples havebeen measured by using Equation (2) and are presented in Table 1.It has been observed that bond length increases with increasing Zrcontent up to x � 0.04, while at x > 0.04 bond length decreases,which is due to a similar trend as has been observed for latticeparameters a, and c.
t ¼ KlBcos q
(1)
30 40 50 60 70 80
x = 0.04
x = 0.02
x = 0.0
**
*
* 104
002
004
112
201
200
10311
0
102
101
002
100
Inte
ns
ity
(a
.u.)
2Theta(degree)
x = 0.06
x = 0.08
x = 0.10
* ZrO2
Fig. 1. XRD patterns of pure ZnO and Zr doped ZnO (with x ¼ 0.0e0.10) bulk samples.
G. Murtaza et al. / Current Applied Physics 14 (2014) 176e181178
L ¼ a2 þ
�1� u
�2!c2
uut (2)
ffiffiffiffiffiffiffiffiffiffiffiffiffiffiffiffiffiffiffiffiffiffiffiffiffiffiffiffiffiffiffiffiffiffiffiffiffiffiffiffiffiffiffiffi3 2
v
Here u is a positional parameter. For wurtzite structure u is givenas,
u ¼�a2
3c2þ 0:25
�(3)
4. Scanning electron microscopy (SEM) analysis
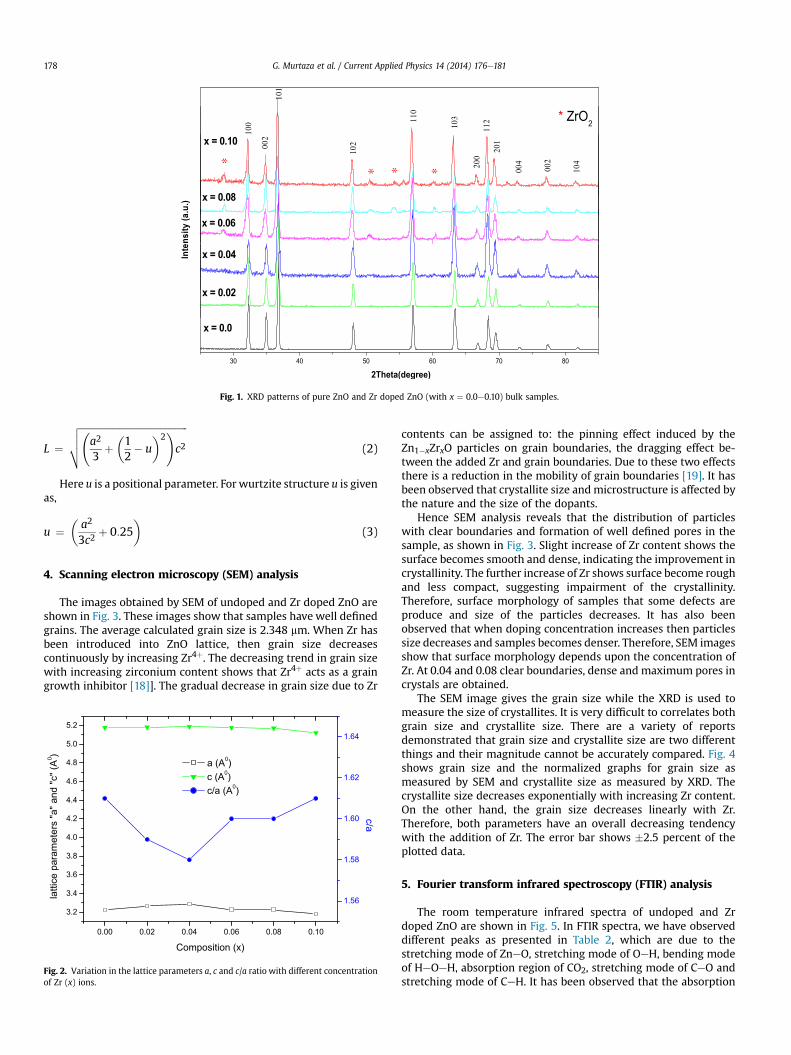
The images obtained by SEM of undoped and Zr doped ZnO areshown in Fig. 3. These images show that samples have well definedgrains. The average calculated grain size is 2.348 mm. When Zr hasbeen introduced into ZnO lattice, then grain size decreasescontinuously by increasing Zr4þ. The decreasing trend in grain sizewith increasing zirconium content shows that Zr4þ acts as a graingrowth inhibitor [18]]. The gradual decrease in grain size due to Zr
0.00 0.02 0.04 0.06 0.08 0.10
3.2
3.4
3.6
3.8
4.0
4.2
4.4
4.6
4.8
5.0
5.2
a (A0) c (A0) c/a (A0)
Composition (x)
latti
ce p
aram
eter
s "a
" and
"c" (
A0 )
1.56
1.58
1.60
1.62
1.64
c/a
Fig. 2. Variation in the lattice parameters a, c and c/a ratio with different concentrationof Zr (x) ions.
contents can be assigned to: the pinning effect induced by theZn1�xZrxO particles on grain boundaries, the dragging effect be-tween the added Zr and grain boundaries. Due to these two effectsthere is a reduction in the mobility of grain boundaries [19]. It hasbeen observed that crystallite size andmicrostructure is affected bythe nature and the size of the dopants.
Hence SEM analysis reveals that the distribution of particleswith clear boundaries and formation of well defined pores in thesample, as shown in Fig. 3. Slight increase of Zr content shows thesurface becomes smooth and dense, indicating the improvement incrystallinity. The further increase of Zr shows surface become roughand less compact, suggesting impairment of the crystallinity.Therefore, surface morphology of samples that some defects areproduce and size of the particles decreases. It has also beenobserved that when doping concentration increases then particlessize decreases and samples becomes denser. Therefore, SEM imagesshow that surface morphology depends upon the concentration ofZr. At 0.04 and 0.08 clear boundaries, dense and maximum pores incrystals are obtained.
The SEM image gives the grain size while the XRD is used tomeasure the size of crystallites. It is very difficult to correlates bothgrain size and crystallite size. There are a variety of reportsdemonstrated that grain size and crystallite size are two differentthings and their magnitude cannot be accurately compared. Fig. 4shows grain size and the normalized graphs for grain size asmeasured by SEM and crystallite size as measured by XRD. Thecrystallite size decreases exponentially with increasing Zr content.On the other hand, the grain size decreases linearly with Zr.Therefore, both parameters have an overall decreasing tendencywith the addition of Zr. The error bar shows �2.5 percent of theplotted data.
5. Fourier transform infrared spectroscopy (FTIR) analysis
The room temperature infrared spectra of undoped and Zrdoped ZnO are shown in Fig. 5. In FTIR spectra, we have observeddifferent peaks as presented in Table 2, which are due to thestretching mode of ZneO, stretching mode of OeH, bending modeof HeOeH, absorption region of CO2, stretching mode of CeO andstretching mode of CeH. It has been observed that the absorption
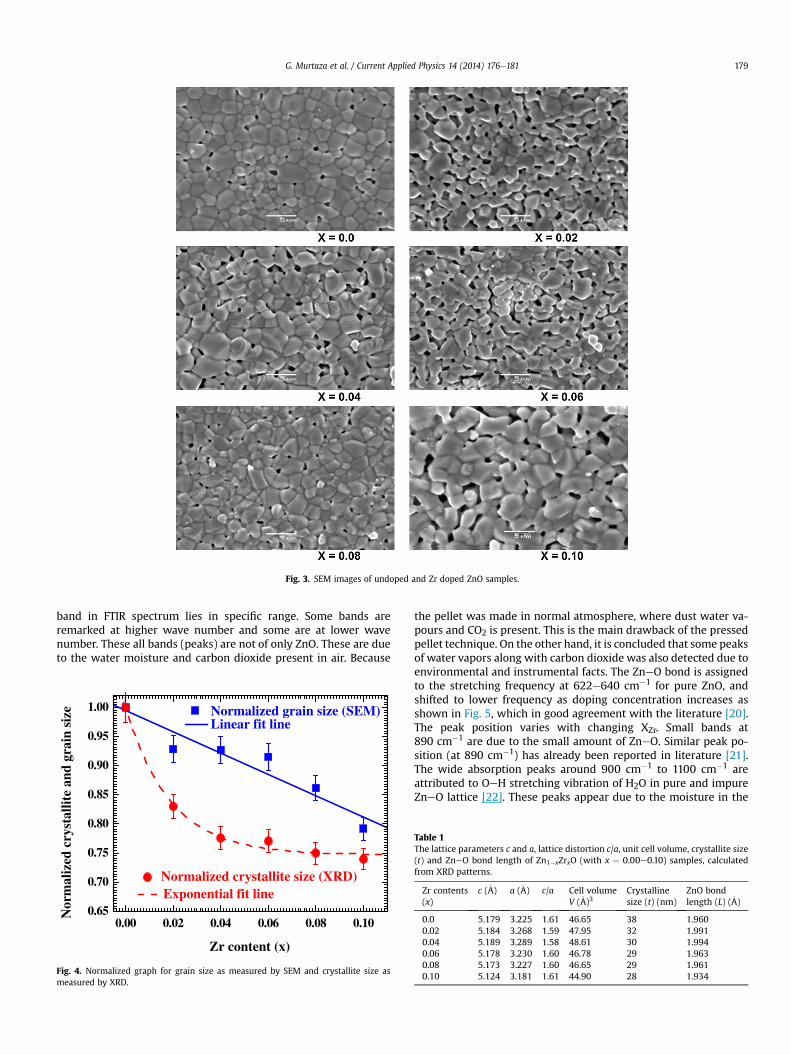
Fig. 3. SEM images of undoped and Zr doped ZnO samples.
G. Murtaza et al. / Current Applied Physics 14 (2014) 176e181 179
band in FTIR spectrum lies in specific range. Some bands areremarked at higher wave number and some are at lower wavenumber. These all bands (peaks) are not of only ZnO. These are dueto the water moisture and carbon dioxide present in air. Because
0.65
0.70
0.75
0.80
0.85
0.90
0.95
1.00Linear fit line
Nor
mal
ized
cry
stal
lite
and
grai
n si
ze
0.00 0.02 0.04 0.06 0.08 0.10
Normalized grain size (SEM)
Zr content (x)
Normalized crystallite size (XRD)Exponential fit line
Fig. 4. Normalized graph for grain size as measured by SEM and crystallite size asmeasured by XRD.
the pellet was made in normal atmosphere, where dust water va-pours and CO2 is present. This is the main drawback of the pressedpellet technique. On the other hand, it is concluded that some peaksof water vapors along with carbon dioxide was also detected due toenvironmental and instrumental facts. The ZneO bond is assignedto the stretching frequency at 622e640 cm�1 for pure ZnO, andshifted to lower frequency as doping concentration increases asshown in Fig. 5, which in good agreement with the literature [20].The peak position varies with changing XZr. Small bands at890 cm�1 are due to the small amount of ZneO. Similar peak po-sition (at 890 cm�1) has already been reported in literature [21].The wide absorption peaks around 900 cm�1 to 1100 cm�1 areattributed to OeH stretching vibration of H2O in pure and impureZneO lattice [22]. These peaks appear due to the moisture in the
Table 1The lattice parameters c and a, lattice distortion c/a, unit cell volume, crystallite size(t) and ZneO bond length of Zn1�xZrxO (with x ¼ 0.00e0.10) samples, calculatedfrom XRD patterns.
Zr contents(x)
c (�A) a (�A) c/a Cell volumeV (�A)3
Crystallinesize (t) (nm)
ZnO bondlength (L) (�A)
0.0 5.179 3.225 1.61 46.65 38 1.9600.02 5.184 3.268 1.59 47.95 32 1.9910.04 5.189 3.289 1.58 48.61 30 1.9940.06 5.178 3.230 1.60 46.78 29 1.9630.08 5.173 3.227 1.60 46.65 29 1.9610.10 5.124 3.181 1.61 44.90 28 1.934
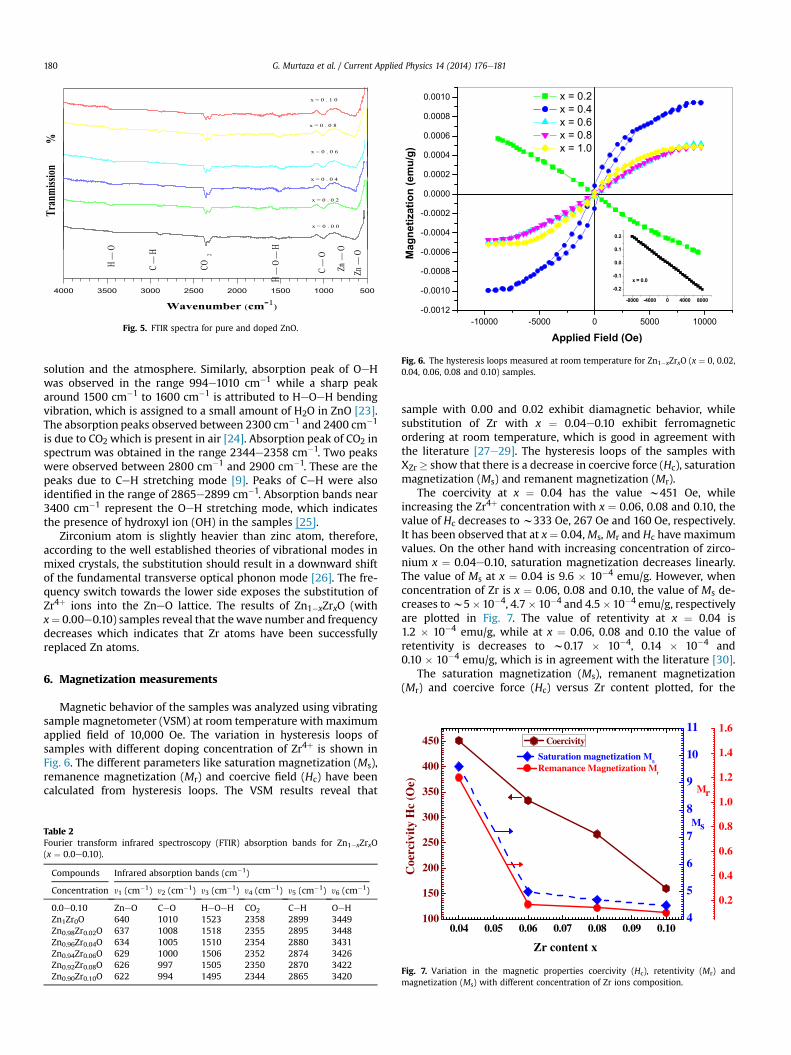
Fig. 5. FTIR spectra for pure and doped ZnO.-10000 -5000 0 5000 10000
-0.0012
-0.0010
-0.0008
-0.0006
-0.0004
-0.0002
0.0000
0.0002
0.0004
0.0006
0.0008
0.0010 x = 0.2 x = 0.4 x = 0.6 x = 0.8 x = 1.0
Ma
gn
etiza
tio
n (e
mu
/g
)
Applied Field (Oe)
Fig. 6. The hysteresis loops measured at room temperature for Zn1�xZrxO (x ¼ 0, 0.02,0.04, 0.06, 0.08 and 0.10) samples.
350
400
450
(Oe)
Coercivity
Mr
1.2
1.4
1.6
Remanance Magnetization Mr
9
10
11
Saturation magnetization Ms
G. Murtaza et al. / Current Applied Physics 14 (2014) 176e181180
solution and the atmosphere. Similarly, absorption peak of OeHwas observed in the range 994e1010 cm�1 while a sharp peakaround 1500 cm�1 to 1600 cm�1 is attributed to HeOeH bendingvibration, which is assigned to a small amount of H2O in ZnO [23].The absorption peaks observed between 2300 cm�1 and 2400 cm�1
is due to CO2 which is present in air [24]. Absorption peak of CO2 inspectrum was obtained in the range 2344e2358 cm�1. Two peakswere observed between 2800 cm�1 and 2900 cm�1. These are thepeaks due to CeH stretching mode [9]. Peaks of CeH were alsoidentified in the range of 2865e2899 cm�1. Absorption bands near3400 cm�1 represent the OeH stretching mode, which indicatesthe presence of hydroxyl ion (OH) in the samples [25].
Zirconium atom is slightly heavier than zinc atom, therefore,according to the well established theories of vibrational modes inmixed crystals, the substitution should result in a downward shiftof the fundamental transverse optical phonon mode [26]. The fre-quency switch towards the lower side exposes the substitution ofZr4þ ions into the ZneO lattice. The results of Zn1�xZrxO (withx¼ 0.00e0.10) samples reveal that thewave number and frequencydecreases which indicates that Zr atoms have been successfullyreplaced Zn atoms.
6. Magnetization measurements
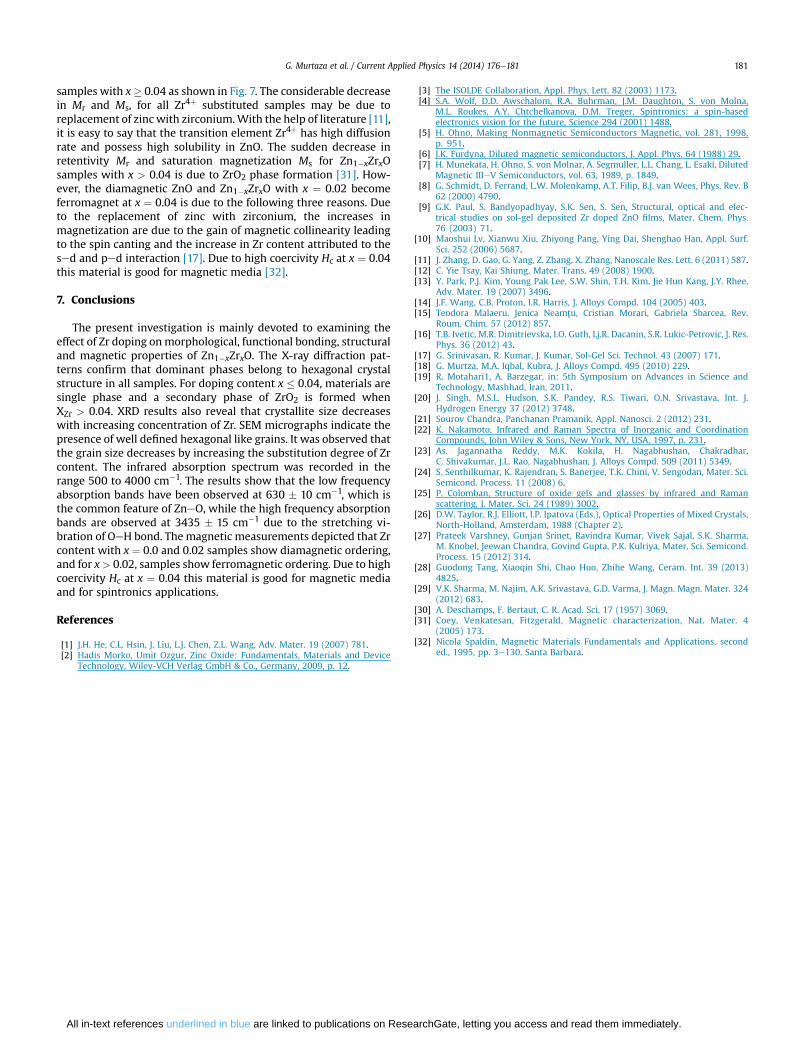
Magnetic behavior of the samples was analyzed using vibratingsample magnetometer (VSM) at room temperature with maximumapplied field of 10,000 Oe. The variation in hysteresis loops ofsamples with different doping concentration of Zr4þ is shown inFig. 6. The different parameters like saturation magnetization (Ms),remanence magnetization (Mr) and coercive field (Hc) have beencalculated from hysteresis loops. The VSM results reveal that
Table 2Fourier transform infrared spectroscopy (FTIR) absorption bands for Zn1�xZrxO(x ¼ 0.0e0.10).
Compounds Infrared absorption bands (cm�1)
Concentration y1 (cm�1) y2 (cm�1) y3 (cm�1) y4 (cm�1) y5 (cm�1) y6 (cm�1)
0.0e0.10 ZneO CeO HeOeH CO2 CeH OeHZn1Zr0O 640 1010 1523 2358 2899 3449Zn0.98Zr0.02O 637 1008 1518 2355 2895 3448Zn0.96Zr0.04O 634 1005 1510 2354 2880 3431Zn0.94Zr0.06O 629 1000 1506 2352 2874 3426Zn0.92Zr0.08O 626 997 1505 2350 2870 3422Zn0.90Zr0.10O 622 994 1495 2344 2865 3420
sample with 0.00 and 0.02 exhibit diamagnetic behavior, whilesubstitution of Zr with x ¼ 0.04e0.10 exhibit ferromagneticordering at room temperature, which is good in agreement withthe literature [27e29]. The hysteresis loops of the samples withXZr � show that there is a decrease in coercive force (Hc), saturationmagnetization (Ms) and remanent magnetization (Mr).
The coercivity at x ¼ 0.04 has the value w451 Oe, whileincreasing the Zr4þ concentration with x ¼ 0.06, 0.08 and 0.10, thevalue of Hc decreases tow333 Oe, 267 Oe and 160 Oe, respectively.It has been observed that at x ¼ 0.04,Ms,Mr and Hc have maximumvalues. On the other hand with increasing concentration of zirco-nium x ¼ 0.04e0.10, saturation magnetization decreases linearly.The value of Ms at x ¼ 0.04 is 9.6 � 10�4 emu/g. However, whenconcentration of Zr is x ¼ 0.06, 0.08 and 0.10, the value of Ms de-creases tow5�10�4, 4.7� 10�4 and 4.5�10�4 emu/g, respectivelyare plotted in Fig. 7. The value of retentivity at x ¼ 0.04 is1.2 � 10�4 emu/g, while at x ¼ 0.06, 0.08 and 0.10 the value ofretentivity is decreases to w0.17 � 10�4, 0.14 � 10�4 and0.10 � 10�4 emu/g, which is in agreement with the literature [30].
The saturation magnetization (Ms), remanent magnetization(Mr) and coercive force (Hc) versus Zr content plotted, for the
0.04 0.05 0.06 0.07 0.08 0.09 0.10100
150
200
250
300
Coe
rciv
ity
Hc
Zr content x
Ms
0.2
0.4
0.6
0.8
1.0
4
5
6
7
8
Fig. 7. Variation in the magnetic properties coercivity (Hc), retentivity (Mr) andmagnetization (Ms) with different concentration of Zr ions composition.
G. Murtaza et al. / Current Applied Physics 14 (2014) 176e181 181
samples with x� 0.04 as shown in Fig. 7. The considerable decreasein Mr and Ms, for all Zr4þ substituted samples may be due toreplacement of zinc with zirconium.With the help of literature [11],it is easy to say that the transition element Zr4þ has high diffusionrate and possess high solubility in ZnO. The sudden decrease inretentivity Mr and saturation magnetization Ms for Zn1�xZrxOsamples with x > 0.04 is due to ZrO2 phase formation [31]. How-ever, the diamagnetic ZnO and Zn1�xZrxO with x ¼ 0.02 becomeferromagnet at x ¼ 0.04 is due to the following three reasons. Dueto the replacement of zinc with zirconium, the increases inmagnetization are due to the gain of magnetic collinearity leadingto the spin canting and the increase in Zr content attributed to thesed and ped interaction [17]. Due to high coercivity Hc at x ¼ 0.04this material is good for magnetic media [32].
7. Conclusions
The present investigation is mainly devoted to examining theeffect of Zr doping onmorphological, functional bonding, structuraland magnetic properties of Zn1�xZrxO. The X-ray diffraction pat-terns confirm that dominant phases belong to hexagonal crystalstructure in all samples. For doping content x � 0.04, materials aresingle phase and a secondary phase of ZrO2 is formed whenXZr > 0.04. XRD results also reveal that crystallite size decreaseswith increasing concentration of Zr. SEM micrographs indicate thepresence of well defined hexagonal like grains. It was observed thatthe grain size decreases by increasing the substitution degree of Zrcontent. The infrared absorption spectrum was recorded in therange 500 to 4000 cm�1. The results show that the low frequencyabsorption bands have been observed at 630 � 10 cm�1, which isthe common feature of ZneO, while the high frequency absorptionbands are observed at 3435 � 15 cm�1 due to the stretching vi-bration of OeH bond. The magnetic measurements depicted that Zrcontent with x ¼ 0.0 and 0.02 samples show diamagnetic ordering,and for x> 0.02, samples show ferromagnetic ordering. Due to highcoercivity Hc at x ¼ 0.04 this material is good for magnetic mediaand for spintronics applications.
References
[1] J.H. He, C.L. Hsin, J. Liu, L.J. Chen, Z.L. Wang, Adv. Mater. 19 (2007) 781.[2] Hadis Morko, Umit Ozgur, Zinc Oxide: Fundamentals, Materials and Device
Technology, Wiley-VCH Verlag GmbH & Co., Germany, 2009, p. 12.
All in-text references underlined in blue are linked to publications on Rese
[3] The ISOLDE Collaboration, Appl. Phys. Lett. 82 (2003) 1173.[4] S.A. Wolf, D.D. Awschalom, R.A. Buhrman, J.M. Daughton, S. von Molna,
M.L. Roukes, A.Y. Chtchelkanova, D.M. Treger, Spintronics: a spin-basedelectronics vision for the future, Science 294 (2001) 1488.
[5] H. Ohno, Making Nonmagnetic Semiconductors Magnetic, vol. 281, 1998,p. 951.
[6] J.K. Furdyna, Diluted magnetic semiconductors, J. Appl. Phys. 64 (1988) 29.[7] H. Munekata, H. Ohno, S. von Molnar, A. Segmuller, L.L. Chang, L. Esaki, Diluted
Magnetic IIIeV Semiconductors, vol. 63, 1989, p. 1849.[8] G. Schmidt, D. Ferrand, L.W. Molenkamp, A.T. Filip, B.J. van Wees, Phys. Rev. B
62 (2000) 4790.[9] G.K. Paul, S. Bandyopadhyay, S.K. Sen, S. Sen, Structural, optical and elec-
trical studies on sol-gel deposited Zr doped ZnO films, Mater. Chem. Phys.76 (2003) 71.
[10] Maoshui Lv, Xianwu Xiu, Zhiyong Pang, Ying Dai, Shenghao Han, Appl. Surf.Sci. 252 (2006) 5687.
[11] J. Zhang, D. Gao, G. Yang, Z. Zhang, X. Zhang, Nanoscale Res. Lett. 6 (2011) 587.[12] C. Yie Tsay, Kai Shiung, Mater. Trans. 49 (2008) 1900.[13] Y. Park, P.J. Kim, Young Pak Lee, S.W. Shin, T.H. Kim, Jie Hun Kang, J.Y. Rhee,
Adv. Mater. 19 (2007) 3496.[14] J.F. Wang, C.B. Proton, I.R. Harris, J. Alloys Compd. 104 (2005) 403.[15] Teodora Malaeru, Jenica Neamtu, Cristian Morari, Gabriela Sbarcea, Rev.
Roum. Chim. 57 (2012) 857.[16] T.B. Ivetic, M.R. Dimitrievska, I.O. Guth, Lj.R. Dacanin, S.R. Lukic-Petrovic, J. Res.
Phys. 36 (2012) 43.[17] G. Srinivasan, R. Kumar, J. Kumar, Sol-Gel Sci. Technol. 43 (2007) 171.[18] G. Murtza, M.A. Iqbal, Kubra, J. Alloys Compd. 495 (2010) 229.[19] R. Motahari1, A. Barzegar, in: 5th Symposium on Advances in Science and
Technology, Mashhad, Iran, 2011.[20] J. Singh, M.S.L. Hudson, S.K. Pandey, R.S. Tiwari, O.N. Srivastava, Int. J.
Hydrogen Energy 37 (2012) 3748.[21] Sourov Chandra, Panchanan Pramanik, Appl. Nanosci. 2 (2012) 231.[22] K. Nakamoto, Infrared and Raman Spectra of Inorganic and Coordination
Compounds, John Wiley & Sons, New York, NY, USA, 1997, p. 231.[23] As. Jagannatha Reddy, M.K. Kokila, H. Nagabhushan, Chakradhar,
C. Shivakumar, J.L. Rao, Nagabhushan, J. Alloys Compd. 509 (2011) 5349.[24] S. Senthilkumar, K. Rajendran, S. Banerjee, T.K. Chini, V. Sengodan, Mater. Sci.
Semicond. Process. 11 (2008) 6.[25] P. Colomban, Structure of oxide gels and glasses by infrared and Raman
scattering, J. Mater. Sci. 24 (1989) 3002.[26] D.W. Taylor, R.J. Elliott, I.P. Ipatova (Eds.), Optical Properties of Mixed Crystals,
North-Holland, Amsterdam, 1988 (Chapter 2).[27] Prateek Varshney, Gunjan Srinet, Ravindra Kumar, Vivek Sajal, S.K. Sharma,
M. Knobel, Jeewan Chandra, Govind Gupta, P.K. Kulriya, Mater. Sci. Semicond.Process. 15 (2012) 314.
[28] Guodong Tang, Xiaoqin Shi, Chao Huo, Zhihe Wang, Ceram. Int. 39 (2013)4825.
[29] V.K. Sharma, M. Najim, A.K. Srivastava, G.D. Varma, J. Magn. Magn. Mater. 324(2012) 683.
[30] A. Deschamps, F. Bertaut, C. R. Acad. Sci. 17 (1957) 3069.[31] Coey, Venkatesan, Fitzgerald, Magnetic characterization, Nat. Mater. 4
(2005) 173.[32] Nicola Spaldin, Magnetic Materials Fundamentals and Applications, second
ed., 1995, pp. 3e130. Santa Barbara.
archGate, letting you access and read them immediately.
Related Documents