1747 INTRODUCTION C ELL ACTIVITIES in three-dimensional (3-D) engi- neered tissues are of great interest for both basic cell biology research and applications, such as tissue engi- neering and pharmacological research. 1,2 Invasive imag- ing methods such as histology and scanning electron mi- croscopy (SEM) are used predominantly to evaluate the development process of engineered tissues and cellular responses to environmental stimuli. These invasive meth- ods, however, have intrinsic disadvantages. These meth- ods do not permit real-time or dynamic imaging, lack real 3-D information, require long and harsh processing steps at discrete time points, and make structure–function cor- relations difficult. Consequently, despite a tremendous increase in tissue-engineering research, few have inves- tigated the dynamics of cell behaviors and biological in- teractions in engineered tissues. The primary limitation has been inadequate imaging technology for high-reso- lution, real-time, noninvasive imaging deep within highly scattering tissues. Confocal microscopy (CM) has been an important ad- vance in microscopy and has enabled the imaging of in- tact, optically nontransparent specimens to produce high- resolution (submicron) images of tissue structure with the use of fluorescent probes. 3–5 For a relatively thick spec- imen (up to several hundred microns), CM accomplishes optical sectioning by scanning the specimen with a fo- cused beam of light and collecting the fluorescence sig- nal via a pinhole aperture that spatially rejects light from out-of-focus areas of the specimen. Imaging depths, how- ever, are limited to a few hundred microns and exoge- nous fluorescence probes are usually required for detec- tion, often limiting the long-term viability of the cells being imaged. Confocal microscopy can be performed in reflectance mode, without the use of fluorescent probes, TISSUE ENGINEERING Volume 10, Number 11/12, 2004 © Mary Ann Liebert, Inc. Structural and Functional Optical Imaging of Three-Dimensional Engineered Tissue Development WEI TAN, Ph.D., 1 AYLIN SENDEMIR-URKMEZ, M.S., 2 LESTER J. FAHRNER, B.S., 3 RUSSELL JAMISON, Ph.D, 1,3,4 DEBORAH LECKBAND, Ph.D, 1,4,5 and STEPHEN A. BOPPART, M.D., Ph.D. 1,3,4,6 ABSTRACT A significant amount of the data collected by cell biologists and tissue engineers relies on invasive imaging techniques to visualize dynamic structural and functional properties in engineered tissues. We report the use of optical coherence tomography and the comparative use of confocal microscopy to nondestructively and noninvasively monitor the structural and functional characteristics of three- dimensional engineered tissues over time. The engineered tissue model is composed of chitosan scaf- folds and fibroblasts transfected with vinculin fused to green fluorescent protein. We image the de- velopmental process of engineered tissues from changes of tissue microarchitecture to cell–matrix adhesions in three dimensions. These findings demonstrate the potential for optical coherence to- mography in applications in cell and tissue biology, tissue engineering, and drug discovery. 1 Beckman Institute for Advanced Science and Technology, 2 Department of Materials Science and Engineering, 3 Department of Electrical and Computer Engineering, 4 Department of Bioengineering, 5 Department of Chemical and Biomolecular Engineer- ing, and 6 College of Medicine, University of Illinois at Urbana-Champaign, Urbana, Illinois.

Welcome message from author
This document is posted to help you gain knowledge. Please leave a comment to let me know what you think about it! Share it to your friends and learn new things together.
Transcript
1747
INTRODUCTION
CELL ACTIVITIES in three-dimensional (3-D) engi-neered tissues are of great interest for both basic cell
biology research and applications, such as tissue engi-neering and pharmacological research.1,2 Invasive imag-ing methods such as histology and scanning electron mi-croscopy (SEM) are used predominantly to evaluate thedevelopment process of engineered tissues and cellularresponses to environmental stimuli. These invasive meth-ods, however, have intrinsic disadvantages. These meth-ods do not permit real-time or dynamic imaging, lack real3-D information, require long and harsh processing stepsat discrete time points, and make structure–function cor-relations difficult. Consequently, despite a tremendousincrease in tissue-engineering research, few have inves-tigated the dynamics of cell behaviors and biological in-teractions in engineered tissues. The primary limitation
has been inadequate imaging technology for high-reso-lution, real-time, noninvasive imaging deep within highlyscattering tissues.
Confocal microscopy (CM) has been an important ad-vance in microscopy and has enabled the imaging of in-tact, optically nontransparent specimens to produce high-resolution (submicron) images of tissue structure with theuse of fluorescent probes.3–5 For a relatively thick spec-imen (up to several hundred microns), CM accomplishesoptical sectioning by scanning the specimen with a fo-cused beam of light and collecting the fluorescence sig-nal via a pinhole aperture that spatially rejects light fromout-of-focus areas of the specimen. Imaging depths, how-ever, are limited to a few hundred microns and exoge-nous fluorescence probes are usually required for detec-tion, often limiting the long-term viability of the cellsbeing imaged. Confocal microscopy can be performed inreflectance mode, without the use of fluorescent probes,
TISSUE ENGINEERINGVolume 10, Number 11/12, 2004© Mary Ann Liebert, Inc.
Structural and Functional Optical Imaging of Three-Dimensional Engineered Tissue Development
WEI TAN, Ph.D.,1 AYLIN SENDEMIR-URKMEZ, M.S.,2 LESTER J. FAHRNER, B.S.,3RUSSELL JAMISON, Ph.D,1,3,4 DEBORAH LECKBAND, Ph.D,1,4,5
and STEPHEN A. BOPPART, M.D., Ph.D.1,3,4,6
ABSTRACT
A significant amount of the data collected by cell biologists and tissue engineers relies on invasiveimaging techniques to visualize dynamic structural and functional properties in engineered tissues.We report the use of optical coherence tomography and the comparative use of confocal microscopyto nondestructively and noninvasively monitor the structural and functional characteristics of three-dimensional engineered tissues over time. The engineered tissue model is composed of chitosan scaf-folds and fibroblasts transfected with vinculin fused to green fluorescent protein. We image the de-velopmental process of engineered tissues from changes of tissue microarchitecture to cell–matrixadhesions in three dimensions. These findings demonstrate the potential for optical coherence to-mography in applications in cell and tissue biology, tissue engineering, and drug discovery.
1Beckman Institute for Advanced Science and Technology, 2Department of Materials Science and Engineering, 3Departmentof Electrical and Computer Engineering, 4Department of Bioengineering, 5Department of Chemical and Biomolecular Engineer-ing, and 6College of Medicine, University of Illinois at Urbana-Champaign, Urbana, Illinois.
to provide detailed images of tissue architecture and cel-lular morphology of living tissue in near real-time.6–8
This method of confocal imaging with reflected light re-lies on the differential backscattering properties from cel-lular morphology and tissue architecture to provide con-trast. Hence, it resembles histological tissue evaluation,except that the subcellular resolution is achieved nonin-vasively and without stains. Although promising for real-time longitudinal studies, it still has penetration limita-tions, particularly for highly scattering tissues.
Multiphoton microscopy, which relies on the simulta-neous absorption of two or more near-infrared photonsfrom a high-intensity short-pulse laser (most commonlya mode-locked titanium:sapphire laser) extends the imag-ing depth of CM, but still with depth limitations of about400–500 �m.9,10 Longer wavelength excitation light inmultiphoton microscopy has the additional advantages ofbeing scattered and absorbed less in biological tissue, re-sulting in improved imaging depths with little thermaldamage. Newer technologies for imaging engineered tis-sues, including high-field strength magnetic resonanceimaging and microcomputed tomography, have been pur-sued for the assessment of cellular structure, with limitedsuccess. These techniques, with long data acquisitionrates, hazards associated with high-energy radiation, andrelatively high costs, are less suitable for both real-timeand long-term imaging.11,12
Optical coherence tomography (OCT) is an emergingtechnique that has the potential for overcoming many ofthe limitations of the current technologies.13,14 OCT mea-sures the intensity of backreflected near-infrared light.OCT combines the high resolutions of most optical tech-niques with an ability to reject multiply scattered photonsand, hence, image at cellular resolutions (several microns)up to several millimeters deep in nontransparent (highlyscattering) tissue. Because OCT relies on variations in in-dices of refraction and optical scattering for image con-trast, no exogenous fluorophores are necessary, enablingcellular imaging within living specimens over time with-out loss of viability. Near-infrared light is scattered lessthan visible light. Therefore, the use of near-infrared wave-lengths in OCT enables deep imaging penetration withinhighly scattering tissues. OCT has been applied in vivo forimaging the microstructures of different tissues includingthe eye, skin, gastrointestinal tract, and nervous systems,to name only a few, and is becoming a promising and pow-erful imaging technology that has widespread applicationsthroughout many fields of biology and medicine.15–20
However, for dynamically evaluating engineered tissues,the optical properties of these constructs are not as obvi-ous or well characterized as for in vivo tissues. Few stud-ies have investigated the use of the OCT technology formonitoring developing in vitro-engineered tissues.21,22
In this article, we report the use of OCT as a nonin-vasive imaging modality to explore 3-D microstructures
TAN ET AL.
and cell activities during the growth of engineered tis-sues. OCT is capable of clearly identifying tissue mi-crostructures and cell distributions, determining thestages of tissue development at a level of detail ap-proaching conventional histology, and generating 3-Dimages of tissue morphology. Compared with other mi-croscopy imaging approaches, OCT permits high-resolu-tion, real-time, deep-tissue, 3-D imaging to be performedrapidly and repeatedly over extended periods of time withintact, living specimens. Furthermore, imaging of engi-neered tissues with both OCT and CM demonstrates theirsynergistic applications for 3-D dynamic structural andfunctional visualizations. This powerful approach to thenoninvasive imaging of the morphology and function ofengineered tissues has enormous potential for a widerange of applications ranging from tissue engineering todrug discovery.
MATERIALS AND METHODS
Cell preparation
Engineered tissues are composed of cells, extracellu-lar matrices, and 3-D scaffolds. In our study, NIH 3T3cells (American Type Culture Collection [ATCC], Man-assas, VA) seeded in a porous chitosan scaffold were usedas an engineered tissue model. Cells were transfectedwith a green fluorescent protein (GFP)–vinculin plasmid,forming a stable cell line that expressed GFP–vinculin.For transfection, 7 � 105 cells were seeded on each wellof a 6-well plate. For each well of cells, 4 �g of DNAand 2 �L of Lipofectamine 2000 reagent were dilutedseparately with 50 �L of FreeStyle 293 expressionmedium and then mixed and cultured for 20 min to formDNA–LF2000 complexes. The concentration of cells andDNA was determined in pilot experiments to be optimalfor transfection efficiency.
Cell culture
Cell cultures were maintained in an incubator at 37°Cand with 5% CO2. For real-time imaging, cell culture wasperformed in a portable microincubator (LU-CPC, Har-vard Apparatus, Holliston, MA) that was placed on themicroscope stages for imaging.
Scaffold preparation
Chitosan scaffolds were prepared according to the fol-lowing procedure: 2% (wt%) chitosan flakes (Sigma, St.Louis, MO) were dissolved in a 0.2 M acetic acid aque-ous solvent. The resulting viscous solution was filteredand transferred to cylindrical molds. Cylinders werefrozen at a rate of 0.3°C/min from room temperature to�20°C. Frozen cylinders (8 mm in diameter and 3 mmin height) were lyophilized for 4 days for complete re-
1748
moval of the solvent. The resulting sponges had an in-terconnected porosity of �80% with an average pore sizeof 100 �m. Scaffolds were sterilized with 80% ethanoland then rehydrated through a series of ethanol/phos-phate-buffered saline (PBS) solutions (70, 50, and 0%ethanol), and finally transferred to the final culturemedium for overnight hydration. Seeding was done byplating 50 �L of a concentrated cell suspension on thescaffolds at a seeding density of 5 � 106 cells/cm.3
Optical coherence tomography
OCT imaging was performed on engineered tissues af-ter 1, 3, and 7 days of culture. Our fiber-based OCT sys-tem used a Nd:YVO4-pumped titanium:sapphire laser as abroad-bandwidth optical source that produced 500 mW ofaverage power and approximately 90-fs pulses with an 80-MHz repetition rate at an 800-nm center wavelength. Laseroutput was coupled into an ultrahigh numerical aperturefiber (UHNA4; Thorlabs, Karslfeld, Germany) to spec-trally broaden the light from 20 nm to more than 100 nm,improving the axial resolution of our system from 14 to 3�m. The reference arm of the OCT interferometer con-
OPTICAL IMAGING OF 3D ENGINEERED TISSUE
tained a galvanometer-driven retroreflector delay line thatwas scanned a distance of 2 mm at a rate of 30 Hz. Thesample arm beam was focused into the tissue by an achro-matic lens (12.5 mm in diameter, 20 mm in focal length)to a 10-�m-diameter spot size (transverse resolution). The12-mW beam was scanned over the engineered tissue witha galvanometer-controlled mirror. The envelope of the in-terference signal was digitized to 12-bit accuracy.
Confocal microscopy imaging
Confocal scanning microscopy (LCSM) (model DM-IRE; Leica Microsystems, Bensheim, Germany) was usedto acquire stacks of 3-D fluorescent images. An argonlaser line at a wavelength of 488 nm was used to excitethe GFP and autofluorescent signal, and the 514-nmwavelength was detected as the reflection signal. Sam-ples were imaged in the sequential scanning mode with�20 and �40 objectives. The autofluorescence of chi-tosan was detected in the same detection channel as theGFP emission. A dye separation algorithm provided byLeica Microsystems was used to separate the fluores-cence signals.
1749
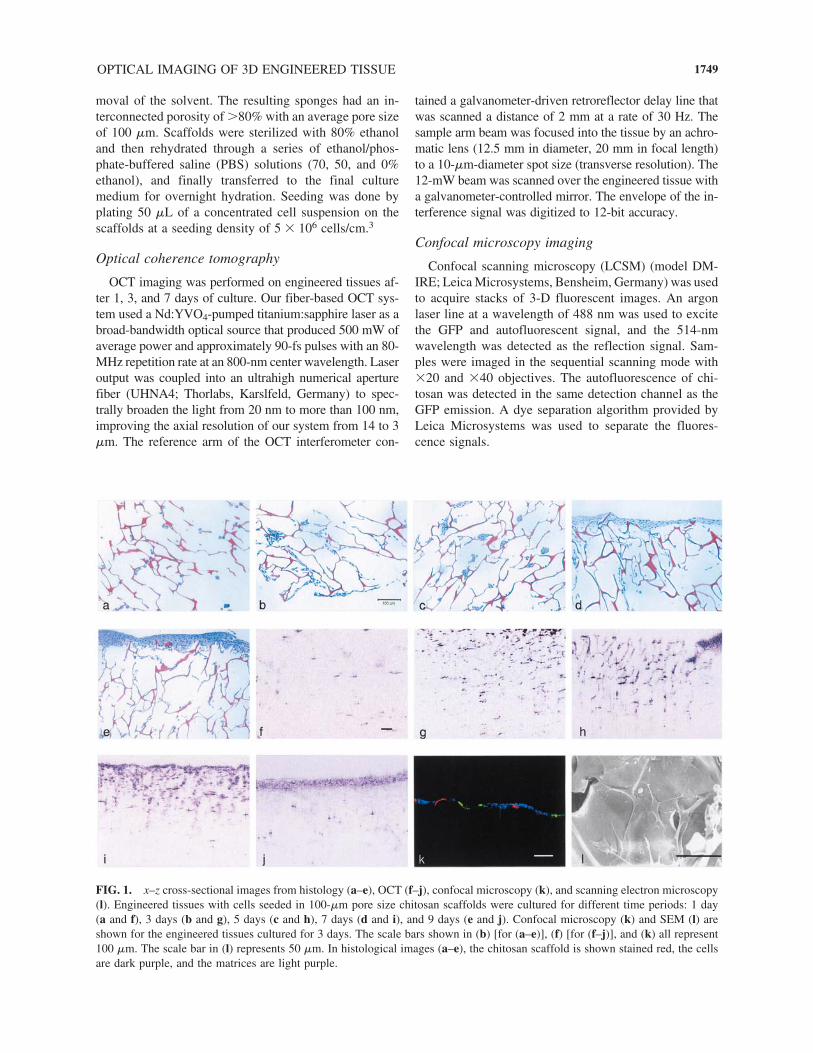
FIG. 1. x–z cross-sectional images from histology (a–e), OCT (f–j), confocal microscopy (k), and scanning electron microscopy(l). Engineered tissues with cells seeded in 100-�m pore size chitosan scaffolds were cultured for different time periods: 1 day(a and f), 3 days (b and g), 5 days (c and h), 7 days (d and i), and 9 days (e and j). Confocal microscopy (k) and SEM (l) areshown for the engineered tissues cultured for 3 days. The scale bars shown in (b) [for (a–e)], (f) [for (f–j)], and (k) all represent100 �m. The scale bar in (l) represents 50 �m. In histological images (a–e), the chitosan scaffold is shown stained red, the cellsare dark purple, and the matrices are light purple.
Histology
Samples were fixed in 3.7% formaldehyde, embeddedin paraffin, cut into 5-�m ultrathin sections with a mi-crotome, and stained with hematoxylin and eosin for lightmicroscopy observations.
Scanning electron microscopy
Engineered tissues were fixed with 2.5% glutaralde-hyde in a 0.1 M cacodylate buffer (pH 7.4) for 1 h atroom temperature and then submerged in 1 wt% osmiumtetroxide in 0.1 M sodium cacodylate for 1.5 h. The spec-imens were washed with 0.1 M cacodylate buffer beforedehydration through a series of graded alcohol solutions.Specimens were placed in hexamethyldisilazane (HMDS;Electron Microscopy Sciences, Fort Washington, PA) fordrying for 45 min before drawing it off. Samples weredried under a fume hood at room temperature and thentransferred to a dry well. The resulting samples were sput-ter coated and examined with a scanning electron mi-croscope.
Three-dimensional reconstruction
Three-dimensional images were reconstructed withSlicer Dicer (Pixotec, Renton, WA) and Analyze 5.0(Mayo Clinic, Rochester, MN).
RESULTS AND DISCUSSION
Comparison of imaging tools
OCT and CM were used to noninvasively examine thegrowth of engineered tissues. For real-time observation,living tissue samples were loaded into a sterile microin-cubator that was subsequently placed onto the stages ofthese microscopes. Conventional histology and SEMwere performed on the same specimens to correlate struc-tural observations between modalities. The use of theselatter two modalities, however, required that samples befixed, sectioned, and stained according to standard pro-cedures.
The representative engineered tissue model for thesestudies is composed of a chitosan scaffold (pore size, 100�m) and fibroblasts transfected with vinculin fused togreen fluorescent protein (GFP). Vinculin is an abundantcytoskeletal protein found in integrin-mediated focal ad-hesions and also in cadherin-mediated cell–cell adherensjunctions. Vinculin expression therefore reflects the de-gree of cell–cell and cell–substrate adhesions. Figure 1compares x–z cross-sectional images obtained by OCT,histology, and CM. From both the histology and OCTimages, several stages of engineered tissue developmentcan be clearly identified. In the initial stage (0–1 day af-ter cell seeding) cells began attaching to the scaffold, and
TAN ET AL.
are mostly spherical in appearance (Fig. 1a). During thenext 2–4 days, cells displayed an elongated morphologyand deposited matrices (Fig. 1b and c). After several moredays, cells lost viability deep within the tissue, or mi-grated to the surface, forming a thick superficial layer ofcells (Fig. 1d and e).
The OCT images demonstrate similar trends in thestructural properties of engineered tissue during devel-opment, as in the histological images. The chitosan scaf-fold alone, without adherent cells, was not visible byOCT. This is attributed to the thin cross-sectional di-mension (typically less than 5 �m) of the scaffold wall,and the low backscattering optical property of the mate-rial. However, after cells were seeded and cultured in thescaffold, the microstructure of the engineered tissues be-came visible by OCT. Figure 1f shows initial cell at-tachment. Cells initially appear as small highly backscat-tering regions in the image. Cells and extracellularmatrices are readily apparent compared with the lowbackscattering chitosan scaffold. Figure 1g and h showsthat cells are uniformly distributed throughout the chi-tosan scaffold after 3–5 days in culture (high cell viabil-ity deep within the tissue), and that the cell number andmatrix density increase with culture time. Figure 1i andj shows an uneven distribution in the engineered tissuesafter 7–9 days in culture. Cells and matrices are dense inthe first 100–200 �m, forming a more highly scatteringlayer near the tissue surface. Cells and deposited matri-ces are less abundant deep within the scaffold. Comparedwith the CM cross-sectional image obtained from a re-constructed 3-D data set (Fig. 1k), OCT image penetra-tion is significantly deeper (2 mm versus 150 �m), andis close to the observation depth of the histological im-ages and the size of these scaffolds. Thus, OCT clearlyextracts critical structural information during the devel-opment of engineered tissues. However, because of thesmall size of the differentiated cells, the individual cellmorphology cannot be imaged at the current OCT imag-ing resolution.
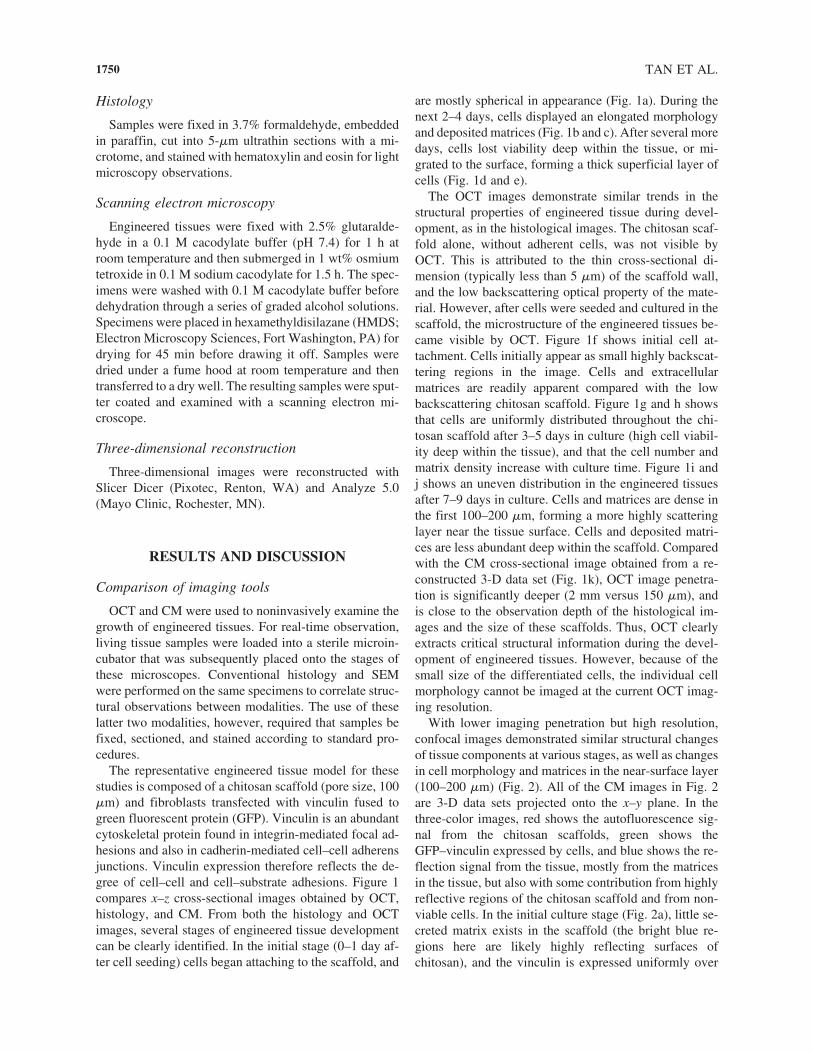
With lower imaging penetration but high resolution,confocal images demonstrated similar structural changesof tissue components at various stages, as well as changesin cell morphology and matrices in the near-surface layer(100–200 �m) (Fig. 2). All of the CM images in Fig. 2are 3-D data sets projected onto the x–y plane. In thethree-color images, red shows the autofluorescence sig-nal from the chitosan scaffolds, green shows theGFP–vinculin expressed by cells, and blue shows the re-flection signal from the tissue, mostly from the matricesin the tissue, but also with some contribution from highlyreflective regions of the chitosan scaffold and from non-viable cells. In the initial culture stage (Fig. 2a), little se-creted matrix exists in the scaffold (the bright blue re-gions here are likely highly reflecting surfaces ofchitosan), and the vinculin is expressed uniformly over
1750
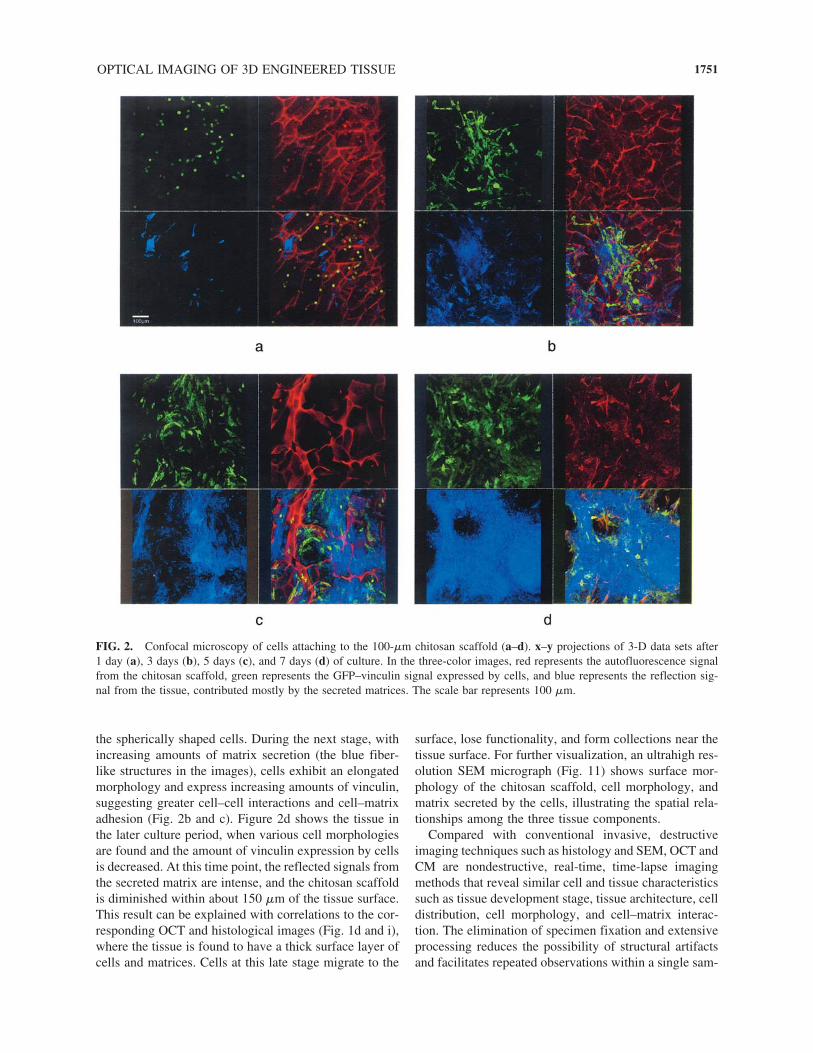
the spherically shaped cells. During the next stage, withincreasing amounts of matrix secretion (the blue fiber-like structures in the images), cells exhibit an elongatedmorphology and express increasing amounts of vinculin,suggesting greater cell–cell interactions and cell–matrixadhesion (Fig. 2b and c). Figure 2d shows the tissue inthe later culture period, when various cell morphologiesare found and the amount of vinculin expression by cellsis decreased. At this time point, the reflected signals fromthe secreted matrix are intense, and the chitosan scaffoldis diminished within about 150 �m of the tissue surface.This result can be explained with correlations to the cor-responding OCT and histological images (Fig. 1d and i),where the tissue is found to have a thick surface layer ofcells and matrices. Cells at this late stage migrate to the
OPTICAL IMAGING OF 3D ENGINEERED TISSUE
surface, lose functionality, and form collections near thetissue surface. For further visualization, an ultrahigh res-olution SEM micrograph (Fig. 11) shows surface mor-phology of the chitosan scaffold, cell morphology, andmatrix secreted by the cells, illustrating the spatial rela-tionships among the three tissue components.
Compared with conventional invasive, destructiveimaging techniques such as histology and SEM, OCT andCM are nondestructive, real-time, time-lapse imagingmethods that reveal similar cell and tissue characteristicssuch as tissue development stage, tissue architecture, celldistribution, cell morphology, and cell–matrix interac-tion. The elimination of specimen fixation and extensiveprocessing reduces the possibility of structural artifactsand facilitates repeated observations within a single sam-
1751
FIG. 2. Confocal microscopy of cells attaching to the 100-�m chitosan scaffold (a–d). x–y projections of 3-D data sets after1 day (a), 3 days (b), 5 days (c), and 7 days (d) of culture. In the three-color images, red represents the autofluorescence signalfrom the chitosan scaffold, green represents the GFP–vinculin signal expressed by cells, and blue represents the reflection sig-nal from the tissue, contributed mostly by the secreted matrices. The scale bar represents 100 �m.
ple over time, and in response to various internal and ex-ternal chemical and mechanical stimuli. Furthermore,there is minimal disturbance to the cell and tissue phys-iology of the living samples, because (1) living samplesare imaged in a sterile microincubator under physiolog-ical conditions; (2) the laser power used to acquire im-ages is low; and (3) the imaging speed is fast, requiringonly a few seconds to acquire an OCT or CM image. Inaddition, OCT and CM can also provide complementaryinformation about the engineered tissue. OCT is able toimage deep (up to 2 mm in this study) into the highlyscattering tissue, and reveal the cell distribution and tis-sue microarchitecture. CM is used to visualize the spa-tial distribution of scaffold, matrix, and cell-specific flu-orescent probes near the tissue surface. Both OCT andCM can provide real 3-D image information, which con-ventional invasive methods cannot provide.
Structural properties of engineered tissuedemonstrated by 3-D OCT
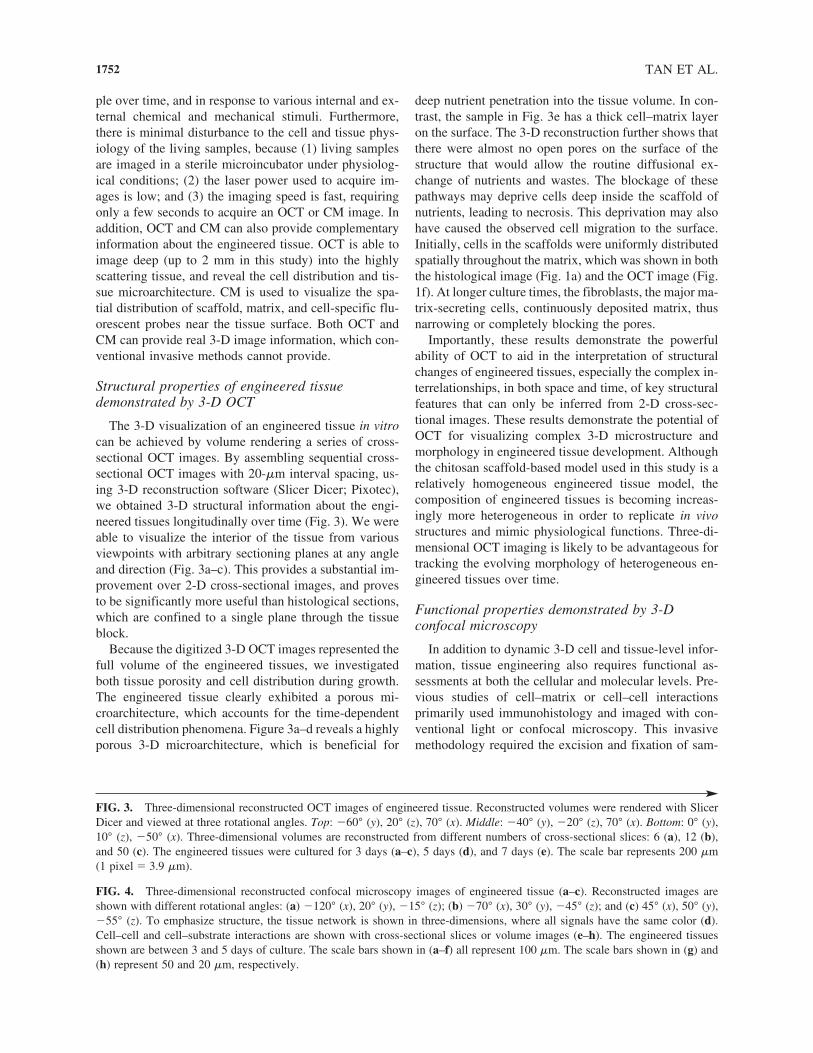
The 3-D visualization of an engineered tissue in vitrocan be achieved by volume rendering a series of cross-sectional OCT images. By assembling sequential cross-sectional OCT images with 20-�m interval spacing, us-ing 3-D reconstruction software (Slicer Dicer; Pixotec),we obtained 3-D structural information about the engi-neered tissues longitudinally over time (Fig. 3). We wereable to visualize the interior of the tissue from variousviewpoints with arbitrary sectioning planes at any angleand direction (Fig. 3a–c). This provides a substantial im-provement over 2-D cross-sectional images, and provesto be significantly more useful than histological sections,which are confined to a single plane through the tissueblock.
Because the digitized 3-D OCT images represented thefull volume of the engineered tissues, we investigatedboth tissue porosity and cell distribution during growth.The engineered tissue clearly exhibited a porous mi-croarchitecture, which accounts for the time-dependentcell distribution phenomena. Figure 3a–d reveals a highlyporous 3-D microarchitecture, which is beneficial for
TAN ET AL.
deep nutrient penetration into the tissue volume. In con-trast, the sample in Fig. 3e has a thick cell–matrix layeron the surface. The 3-D reconstruction further shows thatthere were almost no open pores on the surface of thestructure that would allow the routine diffusional ex-change of nutrients and wastes. The blockage of thesepathways may deprive cells deep inside the scaffold ofnutrients, leading to necrosis. This deprivation may alsohave caused the observed cell migration to the surface.Initially, cells in the scaffolds were uniformly distributedspatially throughout the matrix, which was shown in boththe histological image (Fig. 1a) and the OCT image (Fig.1f). At longer culture times, the fibroblasts, the major ma-trix-secreting cells, continuously deposited matrix, thusnarrowing or completely blocking the pores.
Importantly, these results demonstrate the powerfulability of OCT to aid in the interpretation of structuralchanges of engineered tissues, especially the complex in-terrelationships, in both space and time, of key structuralfeatures that can only be inferred from 2-D cross-sec-tional images. These results demonstrate the potential ofOCT for visualizing complex 3-D microstructure andmorphology in engineered tissue development. Althoughthe chitosan scaffold-based model used in this study is arelatively homogeneous engineered tissue model, thecomposition of engineered tissues is becoming increas-ingly more heterogeneous in order to replicate in vivostructures and mimic physiological functions. Three-di-mensional OCT imaging is likely to be advantageous fortracking the evolving morphology of heterogeneous en-gineered tissues over time.
Functional properties demonstrated by 3-Dconfocal microscopy
In addition to dynamic 3-D cell and tissue-level infor-mation, tissue engineering also requires functional as-sessments at both the cellular and molecular levels. Pre-vious studies of cell–matrix or cell–cell interactionsprimarily used immunohistology and imaged with con-ventional light or confocal microscopy. This invasivemethodology required the excision and fixation of sam-
1752
FIG. 3. Three-dimensional reconstructed OCT images of engineered tissue. Reconstructed volumes were rendered with SlicerDicer and viewed at three rotational angles. Top: �60° (y), 20° (z), 70° (x). Middle: �40° (y), �20° (z), 70° (x). Bottom: 0° (y),10° (z), �50° (x). Three-dimensional volumes are reconstructed from different numbers of cross-sectional slices: 6 (a), 12 (b),and 50 (c). The engineered tissues were cultured for 3 days (a–c), 5 days (d), and 7 days (e). The scale bar represents 200 �m(1 pixel � 3.9 �m).
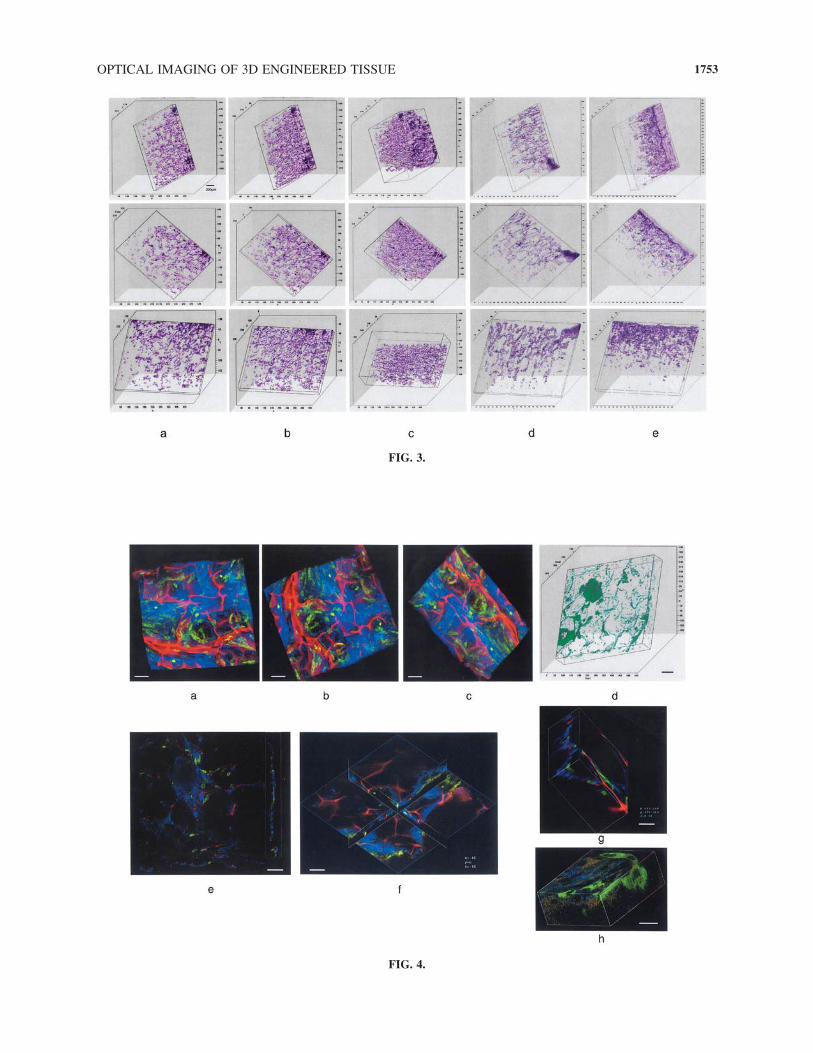
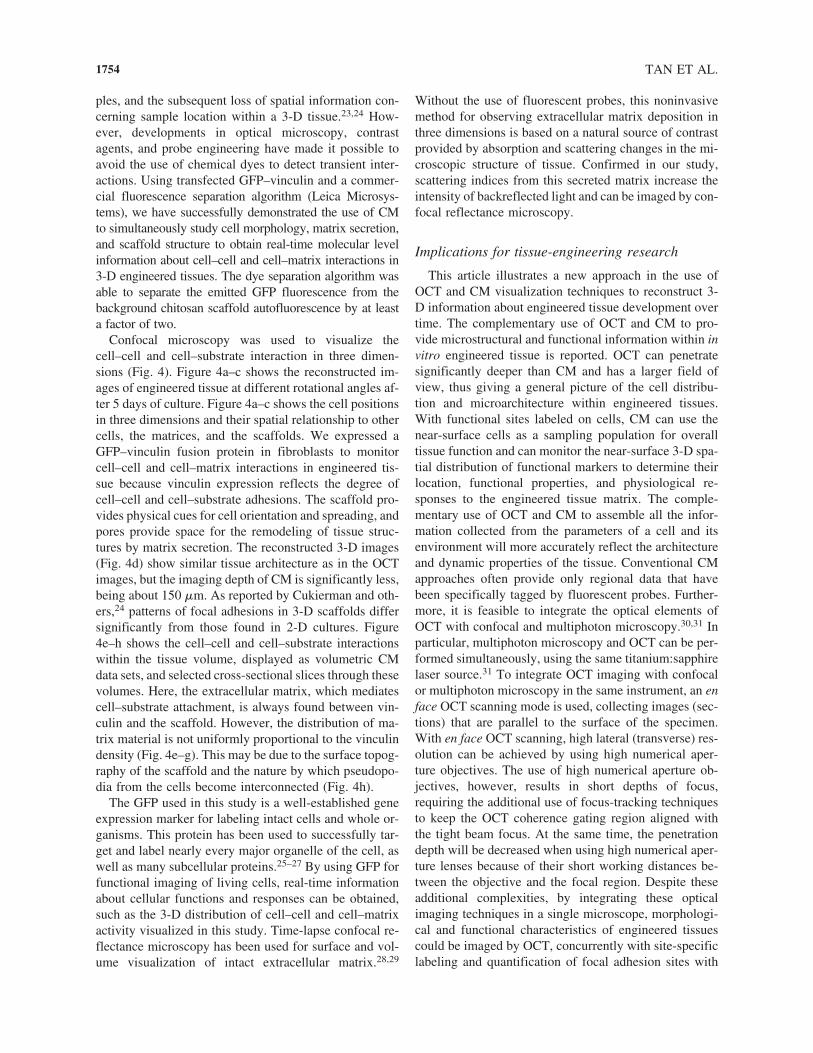
FIG. 4. Three-dimensional reconstructed confocal microscopy images of engineered tissue (a–c). Reconstructed images areshown with different rotational angles: (a) �120° (x), 20° (y), �15° (z); (b) �70° (x), 30° (y), �45° (z); and (c) 45° (x), 50° (y),�55° (z). To emphasize structure, the tissue network is shown in three-dimensions, where all signals have the same color (d).Cell–cell and cell–substrate interactions are shown with cross-sectional slices or volume images (e–h). The engineered tissuesshown are between 3 and 5 days of culture. The scale bars shown in (a–f) all represent 100 �m. The scale bars shown in (g) and(h) represent 50 and 20 �m, respectively.
OPTICAL IMAGING OF 3D ENGINEERED TISSUE 1753
FIG. 3.
FIG. 4.
ples, and the subsequent loss of spatial information con-cerning sample location within a 3-D tissue.23,24 How-ever, developments in optical microscopy, contrastagents, and probe engineering have made it possible toavoid the use of chemical dyes to detect transient inter-actions. Using transfected GFP–vinculin and a commer-cial fluorescence separation algorithm (Leica Microsys-tems), we have successfully demonstrated the use of CMto simultaneously study cell morphology, matrix secretion,and scaffold structure to obtain real-time molecular levelinformation about cell–cell and cell–matrix interactions in3-D engineered tissues. The dye separation algorithm wasable to separate the emitted GFP fluorescence from thebackground chitosan scaffold autofluorescence by at leasta factor of two.
Confocal microscopy was used to visualize thecell–cell and cell–substrate interaction in three dimen-sions (Fig. 4). Figure 4a–c shows the reconstructed im-ages of engineered tissue at different rotational angles af-ter 5 days of culture. Figure 4a–c shows the cell positionsin three dimensions and their spatial relationship to othercells, the matrices, and the scaffolds. We expressed aGFP–vinculin fusion protein in fibroblasts to monitorcell–cell and cell–matrix interactions in engineered tis-sue because vinculin expression reflects the degree ofcell–cell and cell–substrate adhesions. The scaffold pro-vides physical cues for cell orientation and spreading, andpores provide space for the remodeling of tissue struc-tures by matrix secretion. The reconstructed 3-D images(Fig. 4d) show similar tissue architecture as in the OCTimages, but the imaging depth of CM is significantly less,being about 150 �m. As reported by Cukierman and oth-ers,24 patterns of focal adhesions in 3-D scaffolds differsignificantly from those found in 2-D cultures. Figure4e–h shows the cell–cell and cell–substrate interactionswithin the tissue volume, displayed as volumetric CMdata sets, and selected cross-sectional slices through thesevolumes. Here, the extracellular matrix, which mediatescell–substrate attachment, is always found between vin-culin and the scaffold. However, the distribution of ma-trix material is not uniformly proportional to the vinculindensity (Fig. 4e–g). This may be due to the surface topog-raphy of the scaffold and the nature by which pseudopo-dia from the cells become interconnected (Fig. 4h).
The GFP used in this study is a well-established geneexpression marker for labeling intact cells and whole or-ganisms. This protein has been used to successfully tar-get and label nearly every major organelle of the cell, aswell as many subcellular proteins.25–27 By using GFP forfunctional imaging of living cells, real-time informationabout cellular functions and responses can be obtained,such as the 3-D distribution of cell–cell and cell–matrixactivity visualized in this study. Time-lapse confocal re-flectance microscopy has been used for surface and vol-ume visualization of intact extracellular matrix.28,29
TAN ET AL.
Without the use of fluorescent probes, this noninvasivemethod for observing extracellular matrix deposition inthree dimensions is based on a natural source of contrastprovided by absorption and scattering changes in the mi-croscopic structure of tissue. Confirmed in our study,scattering indices from this secreted matrix increase theintensity of backreflected light and can be imaged by con-focal reflectance microscopy.
Implications for tissue-engineering research
This article illustrates a new approach in the use ofOCT and CM visualization techniques to reconstruct 3-D information about engineered tissue development overtime. The complementary use of OCT and CM to pro-vide microstructural and functional information within invitro engineered tissue is reported. OCT can penetratesignificantly deeper than CM and has a larger field ofview, thus giving a general picture of the cell distribu-tion and microarchitecture within engineered tissues.With functional sites labeled on cells, CM can use thenear-surface cells as a sampling population for overalltissue function and can monitor the near-surface 3-D spa-tial distribution of functional markers to determine theirlocation, functional properties, and physiological re-sponses to the engineered tissue matrix. The comple-mentary use of OCT and CM to assemble all the infor-mation collected from the parameters of a cell and itsenvironment will more accurately reflect the architectureand dynamic properties of the tissue. Conventional CMapproaches often provide only regional data that havebeen specifically tagged by fluorescent probes. Further-more, it is feasible to integrate the optical elements ofOCT with confocal and multiphoton microscopy.30,31 Inparticular, multiphoton microscopy and OCT can be per-formed simultaneously, using the same titanium:sapphirelaser source.31 To integrate OCT imaging with confocalor multiphoton microscopy in the same instrument, an enface OCT scanning mode is used, collecting images (sec-tions) that are parallel to the surface of the specimen.With en face OCT scanning, high lateral (transverse) res-olution can be achieved by using high numerical aper-ture objectives. The use of high numerical aperture ob-jectives, however, results in short depths of focus,requiring the additional use of focus-tracking techniquesto keep the OCT coherence gating region aligned withthe tight beam focus. At the same time, the penetrationdepth will be decreased when using high numerical aper-ture lenses because of their short working distances be-tween the objective and the focal region. Despite theseadditional complexities, by integrating these opticalimaging techniques in a single microscope, morphologi-cal and functional characteristics of engineered tissuescould be imaged by OCT, concurrently with site-specificlabeling and quantification of focal adhesion sites with
1754
fluorescence-based microscopy techniques (CM, multi-photon microscopy). These capabilities are ideally suitedfor real-time diagnostic analysis and monitoring duringgrowth of engineered tissue structures.
The approaches described in this article are likely tohave broad impact in a wide range of applications in-voling engineered tissues. These can be broadly classi-fied into therapeutic applications, where the tissue willbe transplanted into a patient, and diagnostic applications,where the tissue will be used for basic science studies incell and tissue biology, or for pharmacological testing ofdrug metabolism, uptake, toxicity, and pathogenicity. Theprocess of forming tissues from cells is a highly orches-trated set of events that occur over time scales rangingfrom seconds to weeks, and with dimensions rangingfrom 1 �m to 1 cm. Current research and developmenthas addressed these problems separately at either end ofthis spectrum with studies of basic biological and bio-physical processes at the molecular level, or with studiesof tissue morphology at discrete time points. In the stud-ies presented here, the 3-D spatial information from en-gineered tissues can be obtained at size scales rangingfrom the molecular level, using molecule-specific probes,to the cell and tissue levels. Dynamic information repre-senting up to four dimensions (x, y, z, and time) can bereadily collected and reconstructed for purposes of visu-alization and quantitative analysis. The additional di-mensions of 3-D space and time are likely to have a sig-nificant impact on tissue-engineering research. Futurework will focus on improving spatial and temporal reso-lutions and the further integration of multimodality opti-cal imaging techniques.
The OCT imaging modality holds promise for appli-cations in cell and tissue biology, tissue engineering, anddrug discovery. This nondestructive method for assess-ing tissue development is likely to significantly enhanceour ability to formulate and direct a strategy for identi-fying and implementing optimal culture conditions thatsupport tissue development in vitro. With deep imagingpenetration depth and high spatial and temporal resolu-tion in three dimensions, OCT will be a powerful tool forgaining new insights into cell dynamics in real time, forelucidating complex biological interactions, and for di-recting new engineering approaches toward functional,biomimetic, and mature engineered tissues.
ACKNOWLEDGMENTS
The authors thank Dr. Benjamin Geiger (WeizmannInstitute of Science, Israel) for providing the GFP-vin-culin plasmid for this work. The authors also thank Drs.Dan Marks and Amy Oldenburg for their efforts in de-veloping and maintaining the OCT imaging system. Thiswork was supported in part by the National Institutes of
OPTICAL IMAGING OF 3D ENGINEERED TISSUE
Health (NIBIB, 1 R01 EB00108-1, S.A.B.), the Univer-sity of Illinois Critical Research Initiative (S.A.B.), theNational Institutes of Health (GMS, 1 R01 51338,D.E.L.), the National Aeronautics and Space Adminis-tration (NASA, NAG8-1922, R.J. and A.S.), and the Uni-versity of Illinois Intercampus Research Initiative inBiotechnology (A.S.).
REFERENCES
1. Langer, R., and Vacanti, J.P. Tissue engineering. Science260, 920, 1993.
2. Friedrich, M.J. Studying cancer in 3 dimensions. JAMA290, 1977, 2003.
3. Stephens, D.J., and Allan, V.J. Light microscopy tech-niques for live cell imaging. Science 300, 82, 2003.
4. Breuls, R.G.M., Mol, A., Petterson, R., Oomens, C.W.J.,Baaijens, F.P.T., and Bouten, C.V.C. Monitoring local cellviability in engineered tissues: A fast, quantitative, andnondestructive approach. Tissue Eng. 9, 269, 2003.
5. Gareau, D.S., Bargo, P.R., Horton, W.A., and Jacques, S.L.Confocal fluorescence spectroscopy of subcutaneous carti-lage expressing green fluorescent protein versus cutaneouscollagen autofluorescence. J. Biomed. Opt. 9, 254, 2004.
6. Clark, A.L., Gillenwater, A.M., Collier, T.G., Alizadeh-Naderi, R., El-Naggar, A.K., and Richards-Kortum, R.R.Confocal microscopy for real-time detection of oral cavityneoplasia. Clin. Cancer Res. 9, 4714, 2003.
7. Sung, K.B., Liang, C., Descour, M., Collier, T., Follen, M.,and Richards-Kortum, R. Fiber-optic confocal reflectancemicroscope with miniature objective for in vivo imaging ofhuman tissues. IEEE Trans. Biomed. Eng. 49, 1168, 2002.
8. Tachihara, R., Choi, C., Langley, R.G., Anderson, R.R.,and Gonzalez, S. In vivo confocal imaging of pigmentedeccrine poroma. Dermatology 204, 185, 2002.
9. Masters, B.R., So, P.T., and Gratton, E. Multiphoton exci-tation microscopy of in vivo human skin: Functional andmorphological optical biopsy based on three-dimensionalimaging, lifetime measurements and fluorescence spec-troscopy. Ann. N.Y. Acad. Sci. 838, 58, 1998.
10. So, P.T., Dong, C.Y., Masters, B.R., and Berland, K.M.Two-photon excitation fluorescence microscopy. Annu.Rev. Biomed. Eng. 2, 399, 2000.
11. Constantinidis, I., Stabler, C.L., Long, R., Jr., and Samba-nis, A. Noninvasive monitoring of a retrievable bioartifi-cial pancreas in vivo. Ann. N.Y. Acad. Sci. 961, 298, 2002.
12. Lin, A.S.P., Barrows, T.H., Cartmella, S.H., and Guldberg,R.E. Microarchitectural and mechanical characterization oforiented porous polymer scaffolds. Biomaterials 24, 481,2003.
13. Huang, D., Swanson, E.A., Lin, C.P., Schuman, J.S., Stin-son, W.G., Chang, W., Hee, M.R., Flotte, T., Gregory, K.,and Puliafito, C.A. Optical coherence tomography. Science254, 1178, 1991.
14. Bouma, B.E., and Tearney, G.J. Handbook of Optical Co-herence Tomography. New York: Marcel Dekker, 2001.
15. Schmitt, J.M. Optical coherence tomography (OCT): A re-view. IEEE J. Select. Topics. Quant. Electr. 5, 1205, 1999.
1755
16. Fujimoto, J.G. Optical coherence tomography for ultrahighresolution in vivo imaging. Nat. Biotechnol. 21, 1361, 2003.
17. Boppart, S.A., Boumal, B.E., Pitris, C., Southern, J.F.,Brezinski, M.E., and Fujimoto, J.G. In vivo cellular opti-cal coherence tomography imaging. Nat. Med. 4, 861,1998.
18. Podoleanu, A.G., Rogers, J.A., Jackson, D.A., and Dunne,S. Three dimensional OCT images from retina and skin.Opt. Exp. 7, 292, 2000.
19. Boppart, S.A., Brezinski, M.E., Bouma, B.E., Tearney,G.J., and Fujimoto, J.G. Investigation of developing em-bryonic morphology using optical coherence tomography.Dev. Biol. 177, 54, 1996.
20. Boppart, S.A., Tearney, G.J., Bouma, B.E., Southern, J.F.,Brezinski, M.E., and Fujimoto, J.G. Noninvasive assess-ment of the developing Xenopus cardiovascular system us-ing optical coherence tomography. Proc. Natl. Acad. Sci.U.S.A. 94, 4256, 1997.
21. Xu, X., Wang, R.K., and El Haj, A. Investigation ofchanges in optical attenuation of bone and neuronal cellsin organ culture or three-dimensional constructs in vitrowith optical coherence tomography: Relevance to cy-tochrome oxidase monitoring. Eur. Biophys. J. 32, 355,2003.
22. Mason, C., Markusen, J.F., Town, M.A., Dunnill, P., andWang, R.K. The potential of optical coherence tomogra-phy in the engineering of living tissue. Phys. Med. Biol.49, 1097, 2004.
23. Zajaczkowski, M.B., Cukierman, E., Galbraith, C.G., andYamada, K.M. Cell–matrix adhesions on poly(vinyl alco-hol) hydrogels. Tissue Eng. 9, 525, 2003.
24. Cukierman, E., Pankov, R., Stevens, D.R., and Yamada,K.M. Taking cell–matrix adhesions to the third dimension.Science 294, 1708, 2001.
TAN ET AL.
25. Balaban, N.Q., Schwarz, U.S., Riveline, D., Goichberg, P.,Tzur, G., Sabanay, I., Mahalu, D., Safran, S., Bershadsky,A., Addad, L., and Geiger, B. Force and focal adhesion as-sembly: A close relationship studied using elastic mi-cropatterned substrates. Nat. Cell Biol. 3, 466, 2001.
26. Tsien, R.Y. The green fluorescent protein. Annu. Rev.Biochem. 67, 509, 1998.
27. Lippincott-Schwartz, J., and Patterson, G.H. Developmentand use of fluorescent protein markers in living cells. Sci-ence 300, 87, 2003.
28. Voytik-Harbin, S.L., Rajwa, B., and Robinson, J.P. Three-dimensional imaging of extracellular matrix and extracel-lular matrix–cell interactions. Methods Cell Biol. 63, 583,2001.
29. Brightman, A.O., Rajwa, B.P., Sturgis, J.E., McCallister,M.E., Robinson, J.P., and Voytik-Harbin, S.L. Time-lapseconfocal reflection microscopy of collagen fibrillogenesisand extracellular matrix assembly in vitro. Biopolymers 54,222, 2000.
30. Dunkers, J.P., Cicerone, M.T., and Washburn, N.R. Co-lin-ear optical coherence and confocal fluorescence micro-scopies for tissue engineering. Opt. Exp. 11, 3074, 2003.
31. Beaurepaire, E., Moreaux, L., Amblard, F., and Mertz, J.Combined scanning optical coherence and two-photon-ex-cited fluorescence microscopy. Opt. Lett. 24, 969, 1999.
Address reprint requests to:Stephen A. Boppart, M.D., Ph.D.Beckman Institute for Advanced
Science and TechnologyUniversity of Illinois at Urbana-Champaign
Urbana, IL 61801
E-mail: [email protected]
1756
Related Documents