Psychological Review 1974, Vol. 81, No. S, 392-425 STRUCTURAL ANALYSIS OF SOCIAL BEHAVIOR 1 LORNA SMITH BENJAMIN * Department of Psychiatry, University of Wisconsin and Wisconsin Psychiatric Institute A brief review of the literature on structural analysis of interpersonal be- havior is followed by a proposal which draws heavily from prior models, especially those of Schaefer and of Leary. The proposed model goes be- yond previous ones in that it has a highly explicit structure which defines behavioral opposites, complements, and antidotes. Built on two axes named affiliation and interdependence, the model describes dyadic social inter- actions in terms of complementary proportions of those underlying dimen- sions. Opposite behaviors appear at 180° angles whereas complementary behaviors appear at topologically similar positions on two separate planes. Antidotes are defined as opposites of complements. Using the questionnaire method, the proposed structure has been tested by the responses of normal as well as psychiatric subjects. Analysis of these data by the techniques of autocorrelation, circumplex analysis, and factor analysis supports the model. The assumption that behavior is orderly and lawful is the basis of scientific psychol- ogy. If the assumption is valid, then it should be possible to develop a model for predicting which particular behaviors will tend to be associated with each other. Anal- ysis of the basic structure of social behavior is one possible approach which might be ex- pected to yield such predictions. The need for a structural model of social behavior has been emphasized by Foa and Turner (1970): . . . there has been some reluctance to recognize that specification of psychological components is likely to be as complex in construction and as revolutionary in consequence as the notion of struc- ture has been in nuclear physics and in genetics [p. 246]. Efforts to describe the structure of social behavior can be viewed in terms of two major categories: the multidimensional ap- proaches which include as many dimensions as are needed to meet a given mathematical criterion, and the approaches which confine the number of dimensions to two or three so that a model can be constructed in real space. The multidimensional approach is 1 Special thanks for encouragement and help with the development of this paper go to Marjorie H. Klein and James Greenley; the editors of Psy- chological Review also made helpful contributions to the final version. 2 Requests for reprints should be sent to Lorna S. Benjamin, Department of Psychiatry, University Hospitals, Madison, Wisconsin 53706. exemplified by Cattell's 16 Personality Fac- tor analysis of personality, and the real-space modeling approach is exemplified by Leary's (1957) interpersonal circle. In defense of the multidimensonal ap- proach, Cattell notes: The busy psychometrist may sometimes feel that sixteen sub-scores is a lot, but such is the real complexity of human nature, and if, as studies show, the majority of these personality character- istics are involved in most criterion predictions, a much better multiple correlation is to be obtained by respecting the complexity than by indulging in a fools paradise of over-simplification [Goldberg & Hase, 1967, p. 3]. In response to the charge of oversimplifica- tion, the modeling approach can name the advantages of parsimony and the manipula- tive possibilities following from having a pic- ture of the model in real space. This paper will be concerned with the second alterna- tive, namely models which are simple enough to be pictured in two or three di- mensions. The development of parsimonious struc- tural models has been pursued, sometimes independently, by theorists from psychiatry and sociology as well as from psychology. At times there has been remarkable overlap in conceptualization suggesting independent convergence on a common underlying struc- ture. Such overlap is illustrated by Chance (1966, p. 133) and Biermann (1969, p. 339) 392

Structural Analysis of Social Behavior
Oct 28, 2014
Welcome message from author
This document is posted to help you gain knowledge. Please leave a comment to let me know what you think about it! Share it to your friends and learn new things together.
Transcript
Psychological Review1974, Vol. 81, No. S, 392-425
STRUCTURAL ANALYSIS OF SOCIAL BEHAVIOR1
LORNA SMITH BENJAMIN *Department of Psychiatry, University of Wisconsin
and Wisconsin Psychiatric Institute
A brief review of the literature on structural analysis of interpersonal be-havior is followed by a proposal which draws heavily from prior models,especially those of Schaefer and of Leary. The proposed model goes be-yond previous ones in that it has a highly explicit structure which definesbehavioral opposites, complements, and antidotes. Built on two axes namedaffiliation and interdependence, the model describes dyadic social inter-actions in terms of complementary proportions of those underlying dimen-sions. Opposite behaviors appear at 180° angles whereas complementarybehaviors appear at topologically similar positions on two separate planes.Antidotes are defined as opposites of complements. Using the questionnairemethod, the proposed structure has been tested by the responses of normalas well as psychiatric subjects. Analysis of these data by the techniques ofautocorrelation, circumplex analysis, and factor analysis supports the model.
The assumption that behavior is orderlyand lawful is the basis of scientific psychol-ogy. If the assumption is valid, then itshould be possible to develop a model forpredicting which particular behaviors willtend to be associated with each other. Anal-ysis of the basic structure of social behavioris one possible approach which might be ex-pected to yield such predictions. The needfor a structural model of social behavior hasbeen emphasized by Foa and Turner (1970):. . . there has been some reluctance to recognizethat specification of psychological components islikely to be as complex in construction and asrevolutionary in consequence as the notion of struc-ture has been in nuclear physics and in genetics[p. 246].
Efforts to describe the structure of socialbehavior can be viewed in terms of twomajor categories: the multidimensional ap-proaches which include as many dimensionsas are needed to meet a given mathematicalcriterion, and the approaches which confinethe number of dimensions to two or threeso that a model can be constructed in realspace. The multidimensional approach is
1 Special thanks for encouragement and helpwith the development of this paper go to MarjorieH. Klein and James Greenley; the editors of Psy-chological Review also made helpful contributionsto the final version.
2 Requests for reprints should be sent to LornaS. Benjamin, Department of Psychiatry, UniversityHospitals, Madison, Wisconsin 53706.
exemplified by Cattell's 16 Personality Fac-tor analysis of personality, and the real-spacemodeling approach is exemplified by Leary's(1957) interpersonal circle.
In defense of the multidimensonal ap-proach, Cattell notes:
The busy psychometrist may sometimes feel thatsixteen sub-scores is a lot, but such is the realcomplexity of human nature, and if, as studiesshow, the majority of these personality character-istics are involved in most criterion predictions, amuch better multiple correlation is to be obtainedby respecting the complexity than by indulging ina fools paradise of over-simplification [Goldberg &Hase, 1967, p. 3].
In response to the charge of oversimplifica-tion, the modeling approach can name theadvantages of parsimony and the manipula-tive possibilities following from having a pic-ture of the model in real space. This paperwill be concerned with the second alterna-tive, namely models which are simpleenough to be pictured in two or three di-mensions.
The development of parsimonious struc-tural models has been pursued, sometimesindependently, by theorists from psychiatryand sociology as well as from psychology.At times there has been remarkable overlapin conceptualization suggesting independentconvergence on a common underlying struc-ture. Such overlap is illustrated by Chance(1966, p. 133) and Biermann (1969, p. 339)
392

STRUCTURAL ANALYSIS OF SOCIAL BEHAVIOR 393
who separately proposed identical modelsfor describing social behavior in general andthe process of psychotherapy in particular.Each of these theorists reduced Leary's in-terpersonal circle to the four quadrants basedon axes representing the two dimensions:positive-negative and active-passive. Leary's(1957) interpersonal circle itself was firstdescribed in a paper by Freedman, Leary,Ossorio, and Coffey (1951) and was builton four nodal points: Dominate and sub-mit were located opposite each other on thevertical axis, whereas love and hate wereoppositional nodal points on the horizontalaxis. Each category in the circle was de-fined in terms of these nodal points, so that,for example, boast was placed on the hateside of dominate, while teach appeared onthe love side of dominate.
An interpersonal circle applying specifi-cally to parental behaviors has been proposedby Schaefer (1965). In his earliest model,the vertical dimension was defined by thepoints control-autonomy, whereas the hori-zontal dimension was defined by the pointslove-hate. This model was supported byfactor analysis of ratings of interviews withmothers in the home, children's reports ofparent behavior, and teacher ratings of class-room behavior. A later version included athird dimension: lax versus firm control,and data in support of this model have beenobtained (Ranson, Schaefer, & Levy, 1968;Schaefer, 1971) in several cultures includingJapan, Canada, Czechoslovakia, Germany,Iran, and India. Schaefer compared hismodel with several others and noted manypoints of convergence. A similar conclusionabout extensive overlap among models ofparent behavior resulted from a literaturesearch by Goldin (1969).
Interpersonal models such as those pro-posed by Leary (1957) and Schaefer (1965)can also be related to classical psychiatrictheory. For example, Carson (1969) ef-fectively used four categories derived fromLeary (hostile-dominant; friendly-domi-nant ; hostile-submissive; friendly-submis-sive) and related his view of interpersonalprocess to the psychiatric theories of HarryStack Sullivan. Chance (1966, p. 132) re-
lated her version of Leary's interpersonalcircle to Freud, Adler, Horney, Jung, andFromm.
Rinn (1965) attempted to expand Leary'sinterpersonal circle so that it would applyto the intrapsychic domains of cognition andfeeling as well as to social interaction. Hesuggested that models in these domainscould be constructed such that specific cogni-tive attitudes and specific feelings wouldparallel specific interpersonal behaviors. Forexample, the behavior "affectionate" wouldbe accompanied by the attitude "sociable"and the feeling "pleasant." Rinn's modeldoes not comprehensively cover cognitionand feeling, but the idea that cognition andfeeling might have a structure which paral-lels interpersonal behaviors deserves furtherdevelopment. The need for such efforts hasbeen detailed by Bergin and Strupp (1970) :There is a renewed appreciation that internal, in-trapsychic or experiential processes, whether theybe of a feeling or of a cognitive nature, have con-siderable power to influence bodily processes, be-havior and the general state of the organism. . . .Massive denials of the problem since the time ofJ. B. Watson have not obviated its importance[p. 25].
In addition to developing an accuratemodel for the structure of interpersonal be-havior and its associated cognitive and feel-ing states, there is a need for a methodologywhich allows the application of this modelto a single individual, to a person as a whole.Carlson (1971) noted that most studies ofpersonality involve between-subject ratherthan within-subject comparisons and con-cluded :Personality psychology would seem to be paying anexorbitant price in potential knowledge for thesecurity afforded by preserving the forms of con-venience and methodological orthodoxy. Mustthese important, unanswered questions be left to•the literature and psychiatry? [p. 207-209].
The present paper presents an extensiveelaboration of the models of interpersonalbehavior developed by Schaefer and byLeary. The proposed model has explicitlogical and mathematical properties and issupported by within-subject as well as be-tween-subject analyses of questionnaire data.There is no attempt here to develop exten-
394 LORNA SMITH BENJAMIN
Go away now 128Exclude 127
Isolate 126Neglect, ignore 125
Bluff, illogical 124Abandon, reject 123
Deprive 122Starve, poison 121
Murderous attack 130Injure 131Frighten 132
Restrain, overprotect 133Shout, criticize 134
Threaten 135Exploit 136
Authoritarian 137Shame, guilt control 138
Dominate 140
Flee, withdraw 228Compete, try one-up 227
No Input, no response 226Stimulate self 225
Defy, suspect 224Distrust, grieve 223Temper tantrum 222
Disgust, refuse, spit 221Suffer, dlsaffillate 230
Do not touch me 231Rigid, hide, grimace 232
Cling, annoy 233Cringe, defend, whine 234Present, yield, appease 235
Resentful comply 236Obey routines 237
Waxy comply 238Be mounted, submit 240
Need new me 328Exclude self, one-down 327
Isolate self 326Neglect, Ignore self 325
Put self on 324Reckless 323
Self deprivation 322Starve, poison self 321
Self hate, suicide 330Injure self 331Frighten self 332
Apathy 333Criticize self 334
No products, nihilistic 335Self sacrifice 336
Person = cause 337Accuse self, guilt 338
I am my own master 340
120 Emancipate118 You can do it
117 Encourage divergence116 Listen, equal 1 tarian
115 Explore, let discover114 Confirm, praise
113 Play, allow peer play112 Smile, greet warmly
111 Kiss, heal, groom110 Embrace, tender, touch
141 Support, cradle, nurse142 Indulge, T.L.C.
143 Protect, keep company144 Reasoned persuasion
145 Stimulate, teach146 Overindulge
147 Intrude148 Possessive
220 Be emancipated218 Unassaultive assert
217 Individualistic216 Cooperative
215 Reveal, discover214 Display, court
213 Play, peer play212 Approach, smile, understand
211 Accept, groom, heal210 Hug, affiliate
241 Accept, nurse, sleep242 Flower child
243 Trust244 Comply willingly
245 Absorb, imitate246 Incompetent
247 Overconform, defer248 Satellite
320 Emancipate self318 Self-confident, reliant
317 Self actualize316 Fair, just
315 Explore self314 Confirm self
313 Entertain self312 Welcome self
311 Heal, groom self310 Self love
341 Self support342 Self care
343 Protect self344 Dignified, respect self
345 Self taught, accomplished346 Overindulge self, addict
347 Self preoccupied348 Self possessed
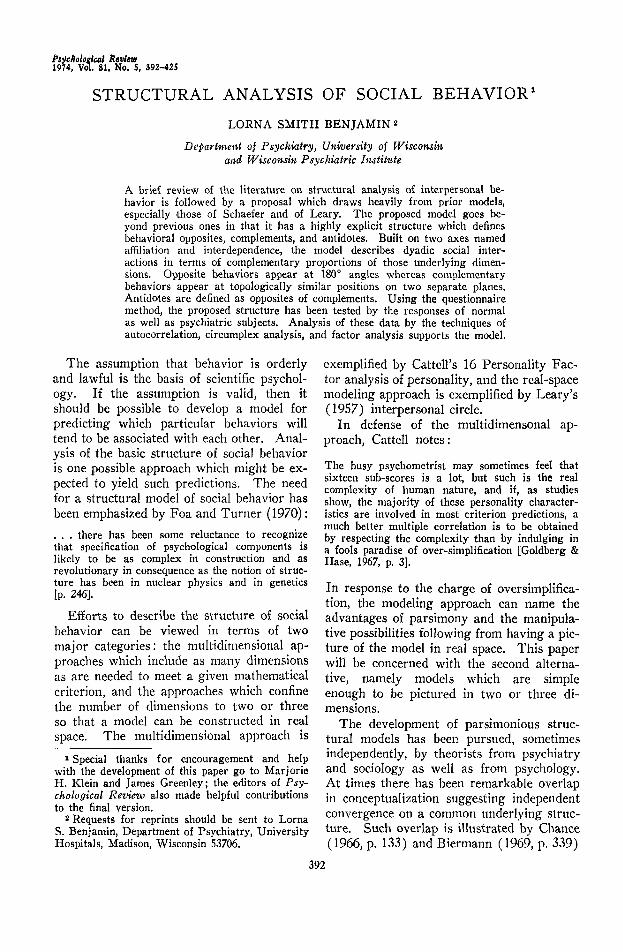
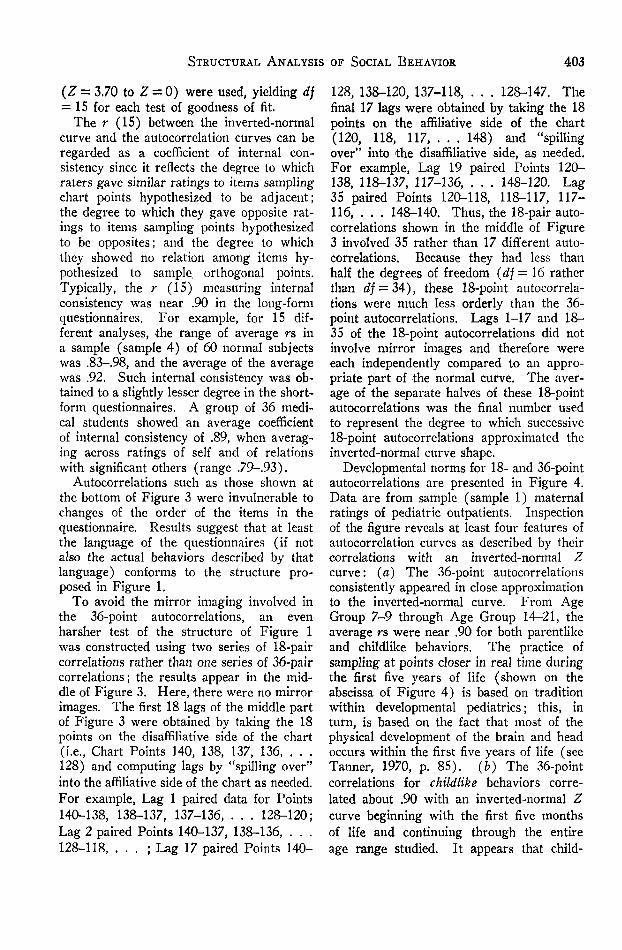
FIGURE 1. The chart of social behavior. (The first surface describes parentlike behaviors;the second, childlike; and the third, introjected attitudes from significant others. From "ABiological Model for Understanding the Behavior of Individuals" by L. S. Benjamin. In JackWestman (Ed.), Individual differences in children. New York: Wiley, 1973, p. 220. Copy-right 1973 by Wiley. Reprinted by permission.)
STRUCTURAL ANALYSIS OF SOCIAL BEHAVIOR 395
sions of the model to the domains of cogni-tion or feeling.
A MODEL OF SOCIAL BEHAVIORThe proposed model appears in a diamond
shape on three planes or surfaces and is pre-sented in Figure 1. The three surfaces arerespectively named parentlike (top), child-like (middle), and introject (bottom). Onthe parentlike surface, behaviors which areprototypically characteristic of parents areentered, and, in general, these are active innature and concerned with what is goingto be done to or for the other person.On the second surface, the childlike plane,behaviors which are prototypically charac-teristic of children are listed; these are typi-cally reactive and concerned with what isgoing to be done to or for the self. Thusthe active-passive dimension of concern toBiermann (1969), Chance (1966), and Os-good (1957) is implicitly included by thepresentation of the model in two planes: thefirst plane representing the active, concern-with-the-other domain, and the second planerepresenting the reactive, concern-with-the-self domain.
The horizontal axis in Figure 1 is namedaffiliation and compares to the horizontalaxis in the models of Schaefer (1965) andLeary (1957) who were in agreement thatone dimension should be defined by the polesof hate and love.
Leary named dominate and submit as op-posites on the vertical axis whereas Schaeferindicated that in this dimension autonomy isthe opposite of control or dominate. Eachdefinition seems reasonable, but the resultingclassifications are quite different. The modelpresented in Figure 1 resolves this dilemmaby defining submit as the complement ofdominate while calling emancipate (allowautonomy) the opposite of dominate or con-trol. Thus the vertical dimension in theparentlike plane of Figure 1 ranges fromdominate to emancipate, while the verticaldimension in the complementary childlikeplane ranges from submit to be emancipated.This vertical dimension is named interde-pendence.
In general, opposite behaviors appear inFigure 1 at 180° angles on each plane, andcomplementary behaviors appear at topo-logically similar positions in the parentlikeand childlike planes of Figure 1. For ex-ample, submit is the complement of domi-nate, and be emancipated is the complementof emancipate. Each successive point on thefirst (parentlike) surface of Figure 1 ismatched by one in the same topological loca-tion on the second (childlike) surface, thetwo being complementary. Beginning withthe point at 12 o'clock and moving clock-wise, complementary pairs respectivelyshown on the parentlike and childlike sur-faces of Figure 1 are emancipate - be eman-cipated; you can do it-unassaultive assert;encourage divergence-individualism; equa-litarian-cooperate; explore, let discover—reveal, discover. Moving clockwise to adifferent quadrant starting at the point domi-nate (270°) the complementary pairs aredominate - submit; shame, guilt control -waxy comply; authoritarian-obey routines;exploit - resentful comply; threaten - pre-sent, yield, appease; shout, criticise-cringe,defend, whine, and so on around the modelfor a total of 36 complementary pairs.
The idea of specifying complements hasalso been put forward by Parsons (in Bald-win, 1967), Feffer (1970), Mueller (1969),Mueller and Billing (1968), Schaefer(1971), Foa (1966), and Carson (1969).Although they mention the importance of theconcept of complementary and reciprocity,these theorists have not yet developed theidea in depth.
The most explicit development of theidea of complementarity has been offered byCarson (1969) who states:When a person "offers" behavior falling withinany of the quadrants of the interpersonal circle,he is, in effect, "inviting" the other person toadopt a complementary stance in respect to both ofthe principle dimensions within the circle [p. 147].
In Carson's terms, this means, for example,that the hostile-submissive person invitesrelations with a hostile-dominant person;and the friendly-submissive person invitesresponse from a friendly-dominant person.Turning to developmental data, Carson fur-
396 LORNA SMITH BENJAMIN
Defy, suspect NonconformityEmotional instability (B)
Hostility (S)
Be emanc ipa ted
Di saf f il i ate
R ig i d , h jde
Be i nd i v idua l i s t i c
ExtroversionStable<S,B)
Hug, a f f i l i a t e
Sub m i tLove(S)
Emotional stability (B)Conformity C o m p l y w i l l i n g l y
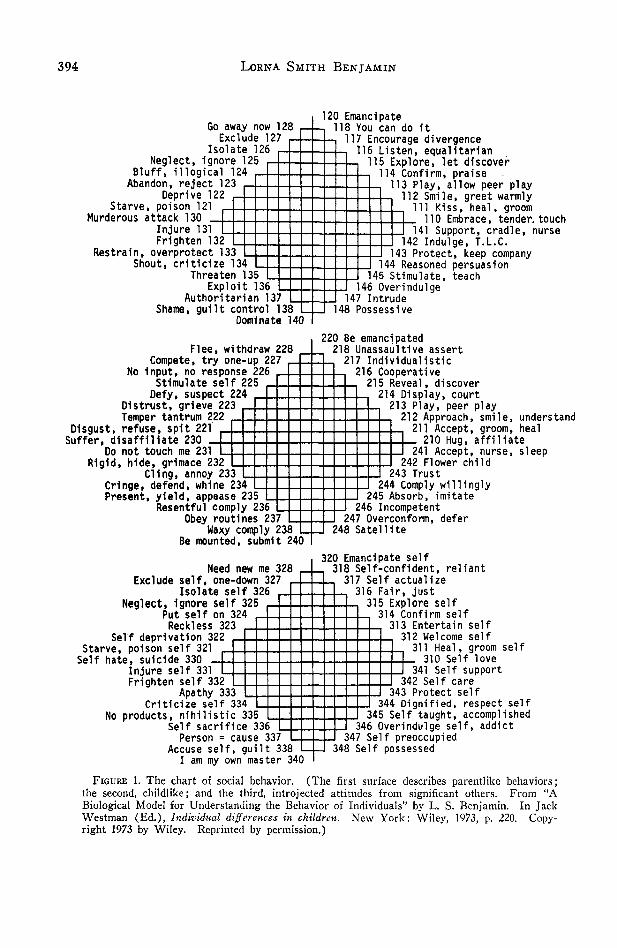
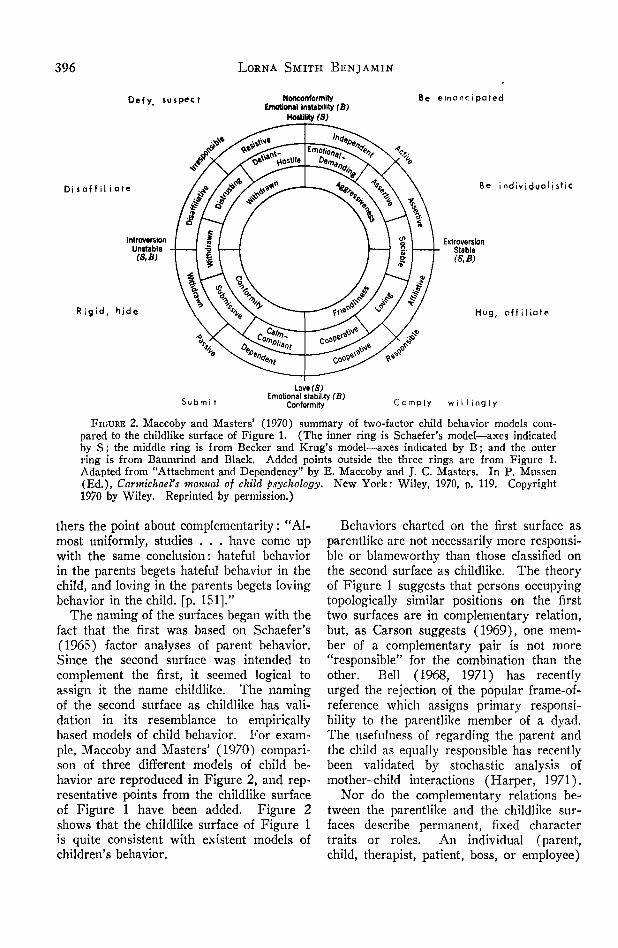
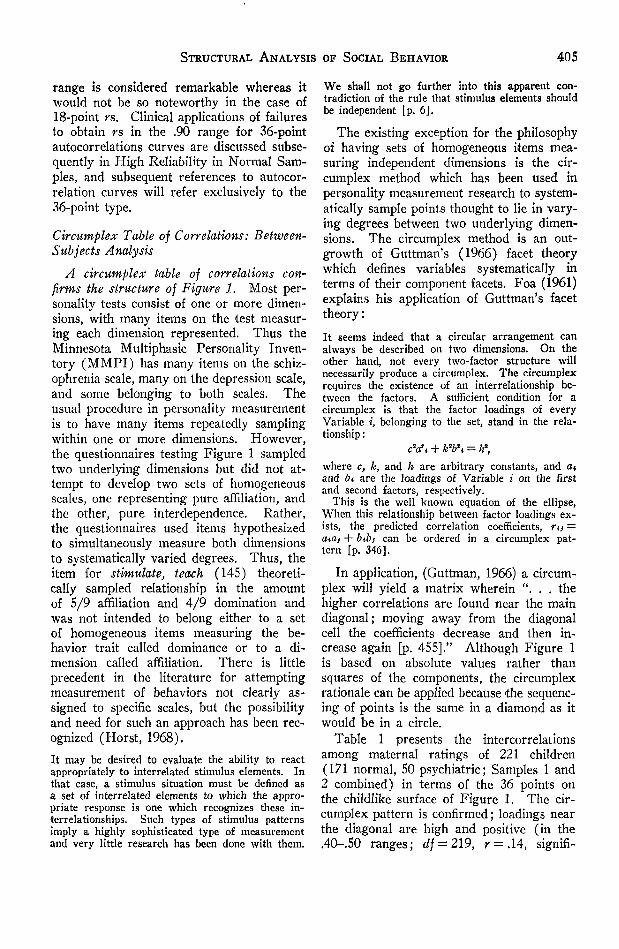
FIGURE 2. Maccoby and Masters' (1970) summary of two-factor child behavior models com-pared to the childlike surface of Figure 1. (The inner ring is Schaefer's model—axes indicatedby S; the middle ring is from Becker and Krug's model—axes indicated by B; and the outerring is from Baumrind and Black. Added points outside the three rings are from Figure 1.Adapted from "Attachment and Dependency" by E. Maccoby and J. C. Masters. In P. Mussen(Ed.), Carmichael's manual of child psychology. New York: Wiley, 1970, p. 119. Copyright1970 by Wiley. Reprinted by permission.)
triers the point about complementarity: "Al-most uniformly, studies . . . have come upwith the same conclusion: hateful behaviorin the parents begets hateful behavior in thechild, and loving in the parents begets lovingbehavior in the child, [p. 151]."
The naming of the surfaces began with thefact that the first was based on Schaefer's(1965) factor analyses of parent behavior.Since the second surface was intended tocomplement the first, it seemed logical toassign it the name childlike. The namingof the second surface as childlike has vali-dation in its resemblance to empiricallybased models of child behavior. For exam-ple, Maccoby and Masters' (1970) compari-son of three different models of child be-havior are reproduced in Figure 2, and rep-resentative points from the childlike surfaceof Figure 1 have been added. Figure 2shows that the childlike surface of Figure 1is quite consistent with existent models ofchildren's behavior.
Behaviors charted on the first surface asparentlike are not necessarily more responsi-ble or blameworthy than those classified onthe second surface as childlike. The theoryof Figure 1 suggests that persons occupyingtopologically similar positions on the firsttwo surfaces are in complementary relation,but, as Carson suggests (1969), one mem-ber of a complementary pair is not more"responsible" for the combination than theother. Bell (1968, 1971) has recentlyurged the rejection of the popular frame-of-reference which assigns primary responsi-bility to the parentlike member of a dyad.The usefulness of regarding the parent andthe child as equally responsible has recentlybeen validated by stochastic analysis ofmother-child interactions (Harper, 1971).
Nor do the complementary relations be-tween the parentlike and the childlike sur-faces describe permanent, fixed charactertraits or roles. An individual (parent,child, therapist, patient, boss, or employee)
STRUCTURAL ANALYSIS OF SOCIAL BEHAVIOR 397
could, for example, be characteristically andrigidly submissive but need not be. Hemight be dominant in some situations andsubmissive in others. Figure 1 is intendedto describe the structure of dyadic interac-tions at any given moment, but the proto-typic names parentlike and childlike are notintended to imply rigidity of role. How-ever, it is possible to use Figure 1 to under-stand any consistent trends in behaviorwhich do characterize a given adult. Forexample, an individual characteristically re-lating to those in authority with markeddeference may be continuing a role begunwith parents during early childhood. Or aperson who is characterologically dominatingmay be identifying with a chronically con-trolling parent. Variations on this theme ofthe relation between adult behavior and ex-perience with significant others during child-hood are explored elsewhere (Benjamin,1973, p. 237). The idea of relating adultbehavior to childhood experience with par-ents is, of course, a basic principle of psycho-analysis, and it has recently been convinc-ingly extended to include siblings as an in-fluential early cause of consistencies in adultbehavior (Toman, 1971).
All points in Figure 1 are represented interms of complementary proportions of thebasic dimensions: affiliation and interde-pendence. The points can be described bythe equation |X| + |Y| = 1, where X refersto points on the abscissa, and Y to those onthe ordinate. For example, on the parent-like surface, the point stimulate, teach has+4/9 affiliation and —5/9 independence.The absolute values of these coordinatessum to 1. If the square of X and Y hadbeen used, then Figure 1 would appear asa circle rather than as a diamond. Use ofabsolute values of X and Y instead of thesquares is conceptually more parsimoniousand allows the poles of the axes to be moresalient than they would be if the surfaceswere circles. The poles of the axes repre-sent primitive, "basic" behaviors whichcould, loosely speaking, be named sexuality,power, murder, and separate territory.Points located progressively further andfurther from these poles are less primitive;
those midway between the poles are themost "civilized." For example, on the topsurface of Figure 1, at about 45 °, the pointsconfirm, praise and explore, let discover ap-pear; at about 315°, the points stimulate,teach and reasoned persuasion appear. Theseare quite "balanced" and genteel by compari-son with sheer power, murder, sexuality, andautonomy located at the poles.
Debating the relative merits of using dia-mond or circular shapes for the planes inFigure 1 is less important than testing thebasic logic of arranging behaviors on aclosed continuum which allows definitionsof opposites and complements. The mostcritical tests of the basic logic of Figure 1are the within-subject autocorrelations andthe between-subject factor analyses appear-ing later in this paper.
Whereas the parentlike and the childlikesurfaces describe interpersonal behaviors,the third or introject surface describes intra-personal behaviors or attitudes, that is, be-haviors directed toward the self rather thantoward others. Points on the introject sur-face were named by deducing what wouldhappen if parentlike behaviors charted on thefirst surface were directed toward the self.For example, starting at 270° on the firstand third surfaces, dominating behaviorturned inward results in the point be my ownmaster. Shame, guilt control turned on theself results in accuse self, guilt; shout, criti-cise turned inward results in criticize self.This logic for naming third-surface pointsapplies for every topologically similar set ofpoints on the first and third surfaces, re-spectively.
The idea that attitudes toward the selfrepresent introjection of the way one hasbeen treated by significant others has prece-dent in both the clinical and research litera-ture (e.g., Herbert, Gelfand, & Hartman,1969). Sullivan (1953, p. 16) was a majorclinical exponent of the point of view thatfrom early infancy, a child's self-concept re-flects the way others thought of him andtreated him. The psychoanalytic idea of in-trojection has also been formulated in socio-logical terms (Cottrell, 1971): "The selfemerges and is perceived by the individual

398 LORNA SMITH BENJAMIN
only through the responses of reference—•others whose role he takes toward his ownacts [p. 552]." Cottrell credits this formula-tion to George Herbert Mead who first de-scribed "taking the role of the other." Foa(1961, 1966) and Parsons (in Baldwin,1967) are two other theorists who also en-dorse the idea that self-concept reflects ex-perience with significant others. Recent sur-veys (Coopersmith, 1967) have confirmedthe relation between parent-child interac-tions and children's self-concepts and havedemonstrated a relation between self-conceptand behavior (Felker & Thomas, 1971).
The points on all three surfaces of Figure1 are assigned a code number which reflectsthe structure of the chart. All points onthe first surface begin with a 100s digit;those on the second surface, with a 200sdigit; and those on the third surface, with a300s digit. The 10s digit of the respectivecode numbers is assigned according to theconventions of geometry: 1, 2, 3, and 4 forthe respective Cartesian quadrants. The Isdigits range from 0 (for points on the polesof the axes) to 9, describing the 9 succes-sive subdivisions of each quadrant. Themain advantage of the coding system is thatit facilitates finding points on the model.For example, the point neglect, ignore isidentified by the code number 125 as beingon the parentlike surface, second quadrant,fifth subdivision. A discussion of some im-plications of the code numbering system andillustrations with everyday examples appearselsewhere (Benjamin, 1973).
Antidotes are specified in terms of thecomplement of the opposite. In other words,the antidote for a given behavior is foundat the point complementary to its opposite.For example, the antidote to defy, suspect(224) is found by first noting the oppositepoint, comply willingly (244), and then find-ing its complement, reasoned persuasion(144). Figure 1 specifies that if a personis in the interpersonal posture described bythe point defy, suspect (224), he is perceiv-ing the other member of the dyad as behav-ing according to point bluff, illogic (124).Thus, the member who is being defied and
suspected must change from —5/9 affiliationto +5/9 affiliation (i.e., be more friendly) ;and from 4/9 emancipation to 4/9 domina-tion (i.e., assume more interpersonal power).If he can do this, then his reasoned persua-sion (144) should elicit comply willingly(244). In practice, the switch from disaffili-ation to genuine affiliation and from hostileemancipation (negligence) to moderatepower, is not always easily done; the figurespecifies what is needed as an antidote todefy, suspect (224) but does not indicatehow to do it. The first two surfaces ofFigure 1 describe 36 such sets of behaviorsand antidotes.
The model in Figure 1 could be elaboratedupon in terms of its relation to other litera-ture (clinical, infrahuman primates) as wellas in terms of clinical within-subject appli-cations. Available examples of the latter in-clude (a) measurements of patient change,(Z>) measurements of changes in the inter-personal style of therapists in training, (r)descriptions of developmental changes inparent-child interactions, and (d) compari-sons of memory of childhood relations withparents to adult relations with significantothers. These possibilities will be presentedelsewhere, and the present paper will be de-voted to the available formal statistical testsof the validity of the model.
ANALYSIS OF THE MODELData have been obtained through a series
of questionnaires labeled A, B, and C. TheSeries A questionnaire allowed rating of in-dividuals in terms of the points on the firsttwo surfaces of Figure 1. For example, theitem describing the point dominate (140)read:
My is the boss of our relationship, always"on top," in control of, in charge of how we usethe available time, space and supplies. He/sheinsists I comply with him/her quickly and quietly"just because he/she said so."
The rater was asked to read into the blankthe name of significant others such as spouse,parent, boss, or therapist. For the most

STRUCTURAL ANALYSIS OF SOCIAL BEHAVIOR 399
part, items were worded3 in concrete be-havioral terms and required no sophisticatedreasoning for interpretation. Years of clini-cal experience are not required to under-stand the relation between the above itemand the concept "dominate." Such directrating of behaviors has recently been shownto be more effective in predicting behavior(Goldfried & Kent, 1972) than the proce-dure of predicting behavior from indirectmeasures of hypothetical personality con-structs.
Each item was rated on a scale ranging0-100 with 10-point intervals marked andanchor points labeled NOT AT ALL (descrip-tive of the person being rated) at 0; MOD-ERATELY at 50; and PERFECTLY at 100. Useof this simple single-stimulus procedure formeasurement rather than the more prestigi-ous forced-choice format (Cronbach, 1960)is supported by Scott's (1968) investigationof major personality tests given under dif-ferent formats with comparable results. Therationale for forced-choice format has usu-ally been that it reduces the possibility ofdefensive distortion, but Scott's results chal-lenge this assumption.
The ratings are interpreted as measuringthe subject's view of his relations with sig-nificant others in both his present and hispast. It is assumed that these ratings ofperceptions (e.g., memory of how motherbehaved) relate more importantly to therater than do the actual behaviors of thepeople being rated (e.g., how mother actu-ally behaved). Stated another way, the as-sumption is that one is moved by how onesees the world more than by how the worldreally is.
An alternate series of questions, Series B,reworded the Series A items so that therater was rating himself in relation to theother person rather than simply rating theother. For example, the self-rating SeriesB item for the point dominate (140) wasI am the boss of my relationship with myI am always "on top," in control of, in charge of
3 The wording of the items was refined duringmany meetings with interested psychiatric resi-dents. Special thanks go to James Guerro, GlenSchurette, Nancy Caine, Russell Caine, and BruceHoltzman.
how we use the available time, space and supplies.I insist he/she comply with me quickly and quietly"just because I said so."
Self-reports have been criticized on thegrounds that defensiveness precludes accu-racy, and the inference usually is (e.g., Mc-Clelland, 1972) that indirect methods suchas the Thematic Apperception Test or theRorschach are needed to get at the truth.However, at least one recent study (Scott& Johnson, 1972) has shown that self-reports can correlate better with peer ratingsthan do the indirect, more "sophisticated"personality measurements. There is, then,no pretense of outsmarting the subject bypenetrating defenses with subtle items andcomplicated expert inferences. The approachis simply consistent with the old medicalaxiom: "If you want to know what is thematter with the patient, ask him." It isunderstood that the subject's answer is notthe whole story, but it appears to provide anexcellent starting point for inquiry.
A third questionnaire, Series C, allowedraters to score themselves in general termson each of the 108 points in Figure 1. Thewording was so general that results of SeriesC ratings might be interpreted as measuringtraits, or habitual ways of relating. For ex-ample, the wording for the point dominate(140) was "I control, am responsible forwhat happens to others. Both the good andthe bad which happens to others is relatedto something I have done, or have notdone." The wording for the point / am myown master (340), representing dominationturned inward, was "I am responsible for,in control of, what happens to me. I planahead, look back, set my bearings and setsail. I am the captain of my ship, the masterof my fate."
Statistical tests reported in the remainderof this paper are based on the followingsamples.4 (a) Maternal ratings of their nor-
41 would like to acknowledge the generous co-operation of Thomas V. Geppert and his colleaguesat the Dean Clinic of Madison, of Marc Hansenand his colleagues at the University of WisconsinFamily Health Service, of Mourad Arganian of theUniversity of Wisconsin Child Psychiatry Section,and of innumerable psychiatric residents at theUniversity of Wisconsin Department of Psychiatry.
400 LORNA SMITH BENJAMIN
OO ANA1BXCU
n c0 '0 '~
0 "'"0 , —
0 ,c
DC
r ijnK)
C
>M3
«01t cJ
f3C
,10 J
1C
[NATE
30
,10
i
'"t70 J
10
— i
(
— it
)
,"i
70' t
ENCOt}0 "!
90 i
J Jio7°]
PCS
e$0
c[N1>SE
3UK "1
e>o<)VBT«lSS
nu»TI!X1
<70
i
1GB DIVERGENCEJN, EQUALITARZANPLORE< LET DISCOVER:ONFIRM, PRAISE
PLAY, ALLOW PEER PLAY00 SMILE, GREET HARMLY
' 90 KISS, HEAL, GROOM^> ?U EMdKA<.E, 1VNUBK 1VUI.H
90 INDULGE, T.L.C.>0 PROTECT, KEEP COMPANY
REASONED PURSUASIONSTIMULATE , TEACH,R INDULGEIDEIVE
1.
t
^1 .
2 •w1 'fnCJ -.
PRO
DU
1 1
• •
i
-,-1.
1.
.
*' .55 •
1 •s
0 -.
1-£ -.-,-i.
008060402002040608000
a
O n
o D aDDD mODDD™ n _, IIi— i n tj
Q ri
D n nD
° °n DaD
D°
1 5 10 15 20 25 3D 35SUCCESSIVE LAGS
008060402002040608000
j aDD D°
D 0°a DD a
D 0D D
D aa Da oa Da o
10 15 20 25 30SUCCESSIVE LAGS
35
STRUCTURAL ANALYSIS OF SOCIAL BEHAVIOR 401
mal children (Series A) and of themselvesin relation to these children (Series B) wereobtained through pediatrics outpatient clin-ics (w=171). ( b ) Maternal ratings ofchildren brought to a child psychiatry clinic(Series A) and of themselves in relation tothese children (Series B) were obtained (n= 51). (c) Undergraduate students (mostlyfemale) in a class on family life rated them-selves on Series C (w = 200). (rf) Therewas a sample of persons willing to rate anentire battery of questionnaires includingratings of themselves in general (Series C),of a significant other person (Series A),and of themselves in relation to that signifi-cant other person (Series B); their memoryof their mother in early and middle child-hood (Series A) and of their relation toher at that time (Series B); their memoryof their father in early and middle childhood(Series A) and of their relation to him atthat time (Series B). (There were 110 sub-jects, including 60 normal and SO psychiatricsubjects.) (e} The battery of question-naires mentioned in d usually took 4-8hours for completion and has recently beenreplaced by a short-form series. In theshort-form series, each chart point is repre-sented by a brief phrase presented in ran-domly selected order. For example, thephrase describing chart point dominate (140)is "controls, is in charge of me." In theshort-form series, ratings are made on a5-point scale labeled 0, 25, 50, 75, and 100;only odd-numbered chart points are sam-pled in one form (Short Form 1), whereaseven-numbered chart points are measured inthe other (Short Form 2). The short-formbattery can be completed in less than anhour, and early returns suggest results arecomparable to the long-form procedure.(The subjects were 36 medical students, 6psychiatric patients, and 50 psychiatric res-idents and their supervisors rating eachother.)
Data have been gathered over a period of
four years, and the analyses presented arerepresentative but by no means exhaustive.Analyses presented include (a) autocorrela-tions among items corresponding to pointson Figure 1 confirming its structure; (&) acircumplex table of correlations confirmingthe structure of Figure 1; (c) factor anal-ysis yielding the proposed underlying dimen-sions and generating a reasonable facsimileof Figure 1; (d~) the principle of comple-ments being confirmed by correlations be-tween surfaces; (e) reliability being high innormal samples and being used to charac-terize subjects; and (/) rating in terms ofsocial desirability being shown to charac-terize normal subjects and endorsements ofsocially undesirable items being more likelyin psychiatric subjects.
Autocorrelations Among Items: Within-Subjects Analysis
Autocorrelations among items correspond-ing to points on Figure 1 confirm its struc-ture. Individual subjects, their spouses,therapists, or other relevant persons can beshown the computer analysis of the ratingsin the form shown in Figure 3. This is ananalysis of a single subject, and it allows aformalized examination of relations amongmemories of early childhood experience andadult behavior. The format of Figure 3, tobe discussed in detail below, allows individ-uals to compare their perceptions among re-lations with their parents, spouses, andchildren. There have been many dramaticmoments when subjects have viewed thecomputer analysis of their ratings and con-vincingly made or accepted observationssuch as "I'm treating my son just like myfather treated me"; "I choose boyfriendswho are mean to me in the same way mymother was"; "I'm just exactly the oppositeof everything my father was"; "My husbandtreats me just like my mother did, and Ireact to him just as I did to her." The ex-position of the clinical implications of this
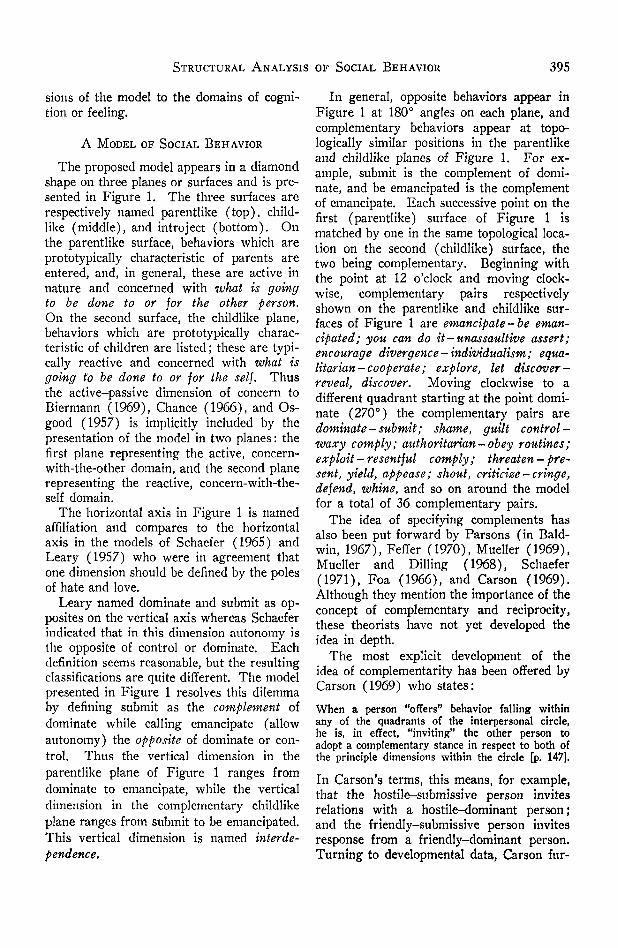
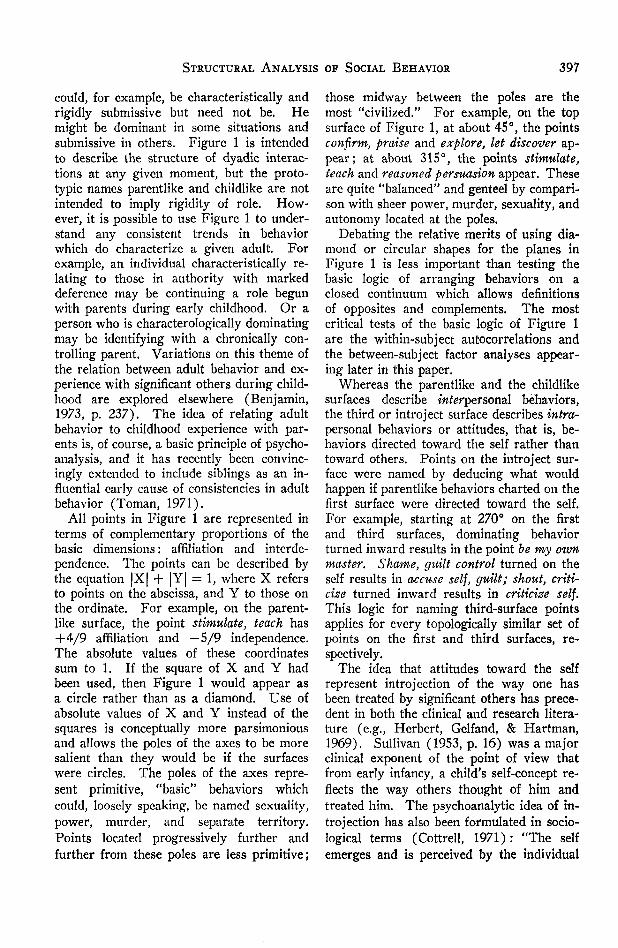
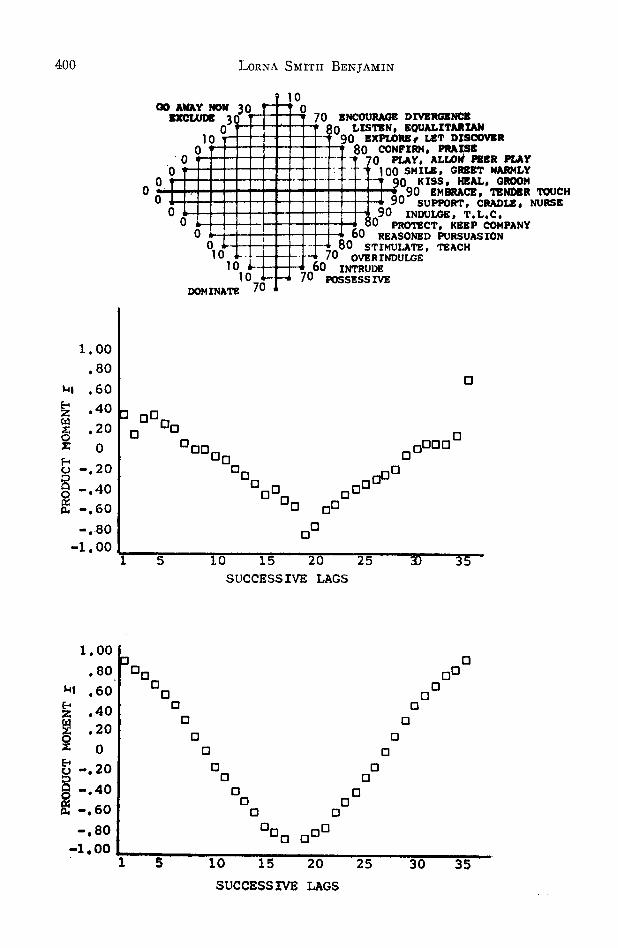
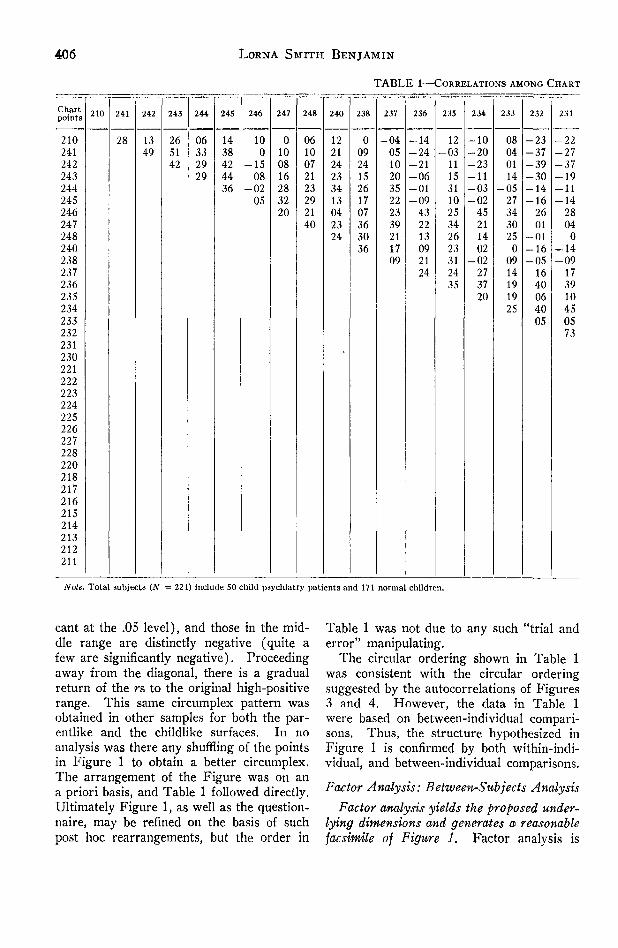
FIGURE 3. Maps and autocorrelations. (Data are from a mother's ratings of her own parent-like behavior in relation to her 18-month-old son. The map at the top of the figure showschart points receiving above-median endorsement and presents the raw data for each respectiveitem. The middle figure presents 18-point autocorrelations performed on these ratings, and thebottom figure, the 36-point autocorrelations.)

402 LORNA SMITH BENJAMIN
procedure is beyond the scope of the presentpaper which is to be confined to formal test-ing of the structure of Figure 1.
Data for Figure 3 were from a mother'sratings of her own parentlike behavior in re-lation to her 18-month-old son. The toppart of the figure presents a map of thispart of her responses to the Series B ques-tionnaire. In constructing a map, the com-puter program finds the subject's medianrating of all items of the questionnaire (i.e.,not just the parentlike items) and prints outthe name of the chart points receiving above-median endorsement along with the scoreactually assigned to the corresponding item.Thus the map presents the chart pointswhose items were judged to be relativelymore characteristic of the person being ratedand gives a phenomenological impression ofthe nature of the relationship. The map atthe top of Figure 3, for example, has mostabove-median endorsements falling on theaffiliative side of the chart, suggesting abasically friendly mother-son relationship.Such friendliness is typically obtained innormal populations and from subjects askedto rate the questionnaires in terms of theirideal of what a good relationship should be.The map in Figure 3 deviates slightly fromthe normal and the ideal in that there ismore than usual endorsement of friendlypower (overindulge = 70, intrude = 60, pos-sessive = 70) and of unfriendly allowing ofautonomy (go away now = 30, exclude =30). It might be noted in passing, however,that excessive endorsements of friendlypower (intimacy, symbiosis) alternatingwith the opposite tendency to exclusion isquite common between mother and childwhen the child is in the age range 18-24months; the data on this theme are com-pletely consistent with the clinical observa-tions of Mahler (1968).
The bottom third of Figure 3 presents aset of 36-pair autocorrelations (df for eachr = 34) computed for the data appearing inthe map in the top third of Figure 3. Forexample, the r at Lag 1 was obtained bypairing the scores for adjacent points onFigure 1. In other words, the score forthe item describing the point encourage di-
vergence (70) was paired with the score forlisten, equalitarian (80); the score for listen,equalitarian was paired with the score forexplore, let discover (90). At Lag 2, rswere among points two steps apart. Forexample, the score for encourage divergence(70) was paired with the score for explore,let discover (90); the score for listen, equali-tarian (80), with that for confirm, praise(80), and so on. At successive lags, pair-ings were among points hypothesized to befurther and further apart until at Lag 17,near opposites were paired: encourage di-vergence (70) was paired with shame, guiltcontrol (10); listen equalitarian (80) waspaired with authoritarian (10), and so on.
The bottom third of Figure 3 shows thatwhen adjacent points were paired, rs werehigh and positive; when orthogonal pointswere paired (Lag 9), rs were near zero;when opposite points were paired, rs werelarge and negative. The smooth, nearly con-tinuous transition from lag to lag shownfor the single subject in Figure 3 was highlycharacteristic of individuals from normalpopulations. Typically, the autocorrelationsappeared in the inverted-normal curve formshown at the bottom of Figure 3. To docu-ment the generality of that finding, it wasconvenient to select a single number repre-senting the degree to which each subject'sautocorrelation approximated the inverted-normal curve shape. Such a number wasfound in the product-moment correlation co-efficient (r) between each autocorrelationcurve and an inverted normal Z curve(Grant, 1962). The right-hand side of theautocorrelation curve shown in the bottomof Figure 3 appears in mirror image to theleft-hand side because of the statistical re-dundancies which will become apparent tothe reader who computes a few sample rsusing the raw data from the top of Figure 3.The 36 pairs involved in computing the rat Lag 1 were identical to those involved inthe r at Lag 35; those for Lag 17 were iden-tical to those for Lag 19, and so on. Be-cause the 36-point autocorrelations appearedin mirror image, only half of the points inthe autocorrelation curve (Lags 1-17) andhalf of the points in the normal Z curve
STRUCTURAL ANALYSIS OF SOCIAL BEHAVIOR 403
(Z = 3.70 to Z = 0) were used, yielding df= 15 for each test of goodness of fit.
The r (15) between the inverted-normalcurve and the autocorrelation curves can beregarded as a coefficient of internal con-sistency since it reflects the degree to whichraters gave similar ratings to items samplingchart points hypothesized to be adjacent;the degree to which they gave opposite rat-ings to items sampling points hypothesizedto be opposites; and the degree to whichthey showed no relation among items hy-pothesized to sample orthogonal points.Typically, the r (15) measuring internalconsistency was near .90 in the long-formquestionnaires. For example, for 15 dif-ferent analyses, the range of average rs ina sample (sample 4) of 60 normal subjectswas .83-.9S, and the average of the averagewas .92. Such internal consistency was ob-tained to a slightly lesser degree in the short-form questionnaires. A group of 36 medi-cal students showed an average coefficientof internal consistency of .89, when averag-ing across ratings of self and of relationswith significant others (range .79-.93).
Autocorrelations such as those shown atthe bottom of Figure 3 were invulnerable tochanges of the order of the items in thequestionnaire. Results suggest that at leastthe language of the questionnaires (if notalso the actual behaviors described by thatlanguage) conforms to the structure pro-posed in Figure 1.
To avoid the mirror imaging involved inthe 36-point autocorrelations, an evenharsher test of the structure of Figure 1was constructed using two series of 18-paircorrelations rather than one series of 36-paircorrelations; the results appear in the mid-dle of Figure 3. Here, there were no mirrorimages. The first 18 lags of the middle partof Figure 3 were obtained by taking the 18points on the disaffiliative side of the chart(i.e., Chart Points 140, 138, 137, 136, . . .128) and computing lags by "spilling over"into the affiliative side of the chart as needed.For example, Lag 1 paired data for Points140-138, 138-137, 137-136, . . . 128-120;Lag 2 paired Points 140-137, 138-136, . . .128-118, . . . ; Lag 17 paired Points 140-
128, 138-120, 137-118, . . . 128-147. Thefinal 17 lags were obtained by taking the 18points on the affiliative side of the chart(120, 118, 117, ... 148) and "spillingover" into the disaffiliative side, as needed.For example, Lag 19 paired Points 120-138, 118-137, 117-136, . . . 148-120. Lag35 paired Points 120-118, 118-117, 117-116, ... 148-140. Thus, the 18-pair auto-correlations shown in the middle of Figure3 involved 35 rather than 17 different auto-correlations. Because they had less thanhalf the degrees of freedom (dj - 16 ratherthan cff = 34), these 18-point autocorrela-tions were much less orderly than the 36-point autocorrelations. Lags 1-17 and 18-35 of the 18-point autocorrelations did notinvolve mirror images and therefore wereeach independently compared to an appro-priate part of the normal curve. The aver-age of the separate halves of these 18-pointautocorrelations was the final number usedto represent the degree to which successive18-point autocorrelations approximated theinverted-normal curve shape.
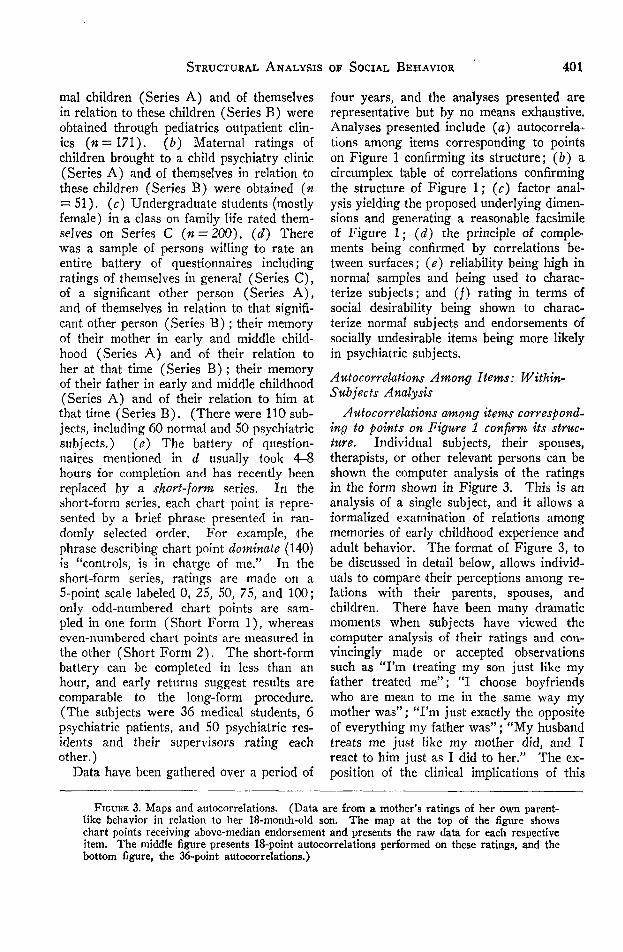
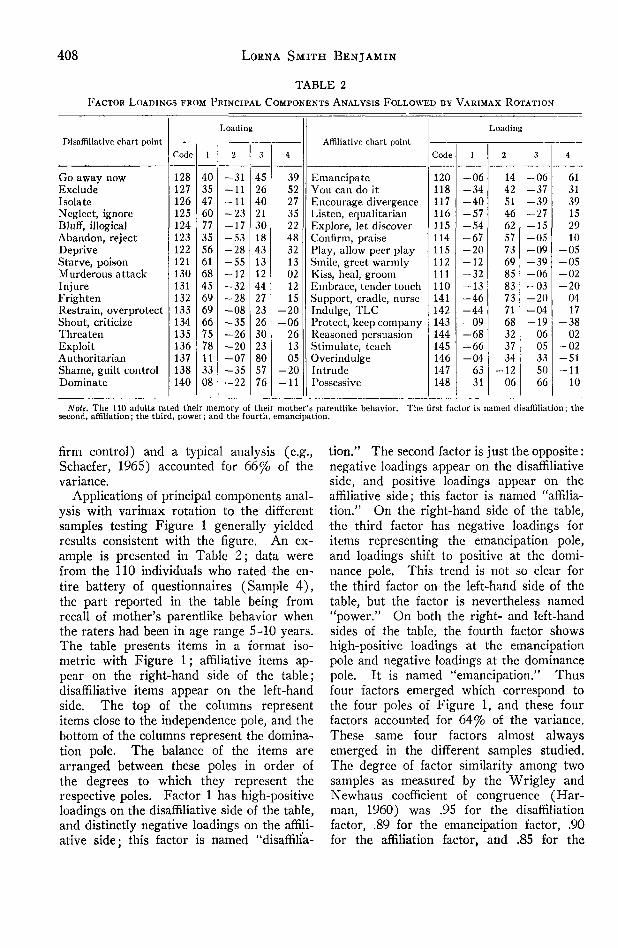
Developmental norms for 18- and 36-pointautocorrelations are presented in Figure 4.Data are from sample (sample 1) maternalratings of pediatric outpatients. Inspectionof the figure reveals at least four features ofautocorrelation curves as described by theircorrelations with an inverted-normal Zcurve: (a) The 36-point autocorrelationsconsistently appeared in close approximationto the inverted-normal curve. From AgeGroup 7-9 through Age Group 14-21, theaverage rs were near .90 for both parentlikeand childlike behaviors. The practice ofsampling at points closer in real time duringthe first five years of life (shown on theabscissa of Figure 4) is based on traditionwithin developmental pediatrics; this, inturn, is based on the fact that most of thephysical development of the brain and headoccurs within the first five years of life (seeTanner, 1970, p. 85). (&) The 36-pointcorrelations for childlike behaviors corre-lated about .90 with an inverted-normal Zcurve beginning with the first five monthsof life and continuing through the entireage range studied. It appears that child-

404 LORNA SMITH BENJAMIN
O---Og BD— a
PARENT-LIKE 1CHILD-LIKE )
PARENT-LIKE )CHILD-LIKE J
36 POINTS
18 POINTS
1 2 3AGE GROUP
FIGURE 4. Comparison of developmental trends in 36-point and 18-pointautocorrelations. (Each individual's respective autocorrelation curves—seeFigure 3—were correlated with an inverted-normal-Z curve to measuregoodness of fit, df = 15. Sample was of 171 normal children. Group 1 = age0-5 months; Group 2 = 6-11 months; Group 3 = 12-17 months; Group 4 =18-23 months; Group 5 = age 2; Group 6 = age 3; Group 7 = age 4; Group8 = age 5-6; Group 9 = age 7-9; Group 10 = age 10-13; Group 11= age14-21.)
like behavior conforms to the structure ofFigure 1 from the earliest years, (c) Au-tocorrelations of ratings of children's par-entlike behavior became progressively moreorderly with increases in age. For AgeGroup 0-5 months, the r between 36-pointautocorrelations and the inverted-normal Zcurve was below .40; it showed nearly pro-gressive increases with each successive agegroup until parentlike behavior reached anadult level in the age range 7-9. It ap-pears that parentlike behavior requires de-velopmental time and/or experience to ap-proximate the structure proposed in Figure1. (d) The 36-point autocorrelations al-ways appeared in closer approximation tothe inverted-normal curve than did the 18-
point autocorrelations performed on thesame data. In Figure 4, the average rs be-tween the 36-point autocorrelation curvesfor childlike behavior and the inverted-nor-mal curve rarely dropped below .90 whereasthose for the 18-point autocorrelations didnot exceed .55. Not shown in Figure 4were the rs for mothers rating their ownparentlike behavior in relation to their chil-dren; the average of these 36-point rs forany of the age groups shown in Figure 4never dropped below .90. Such high-aver-age rs were also obtained in the sample of110 individuals rating the entire battery.Because the 36-point autocorrelations typi-cally correlated so highly with the inverted-normal curve, failure to obtain r in the .90
STRUCTURAL ANALYSIS OF SOCIAL BEHAVIOR 405
range is considered remarkable whereas itwould not be so noteworthy in the case of18-point rs. Clinical applications of failuresto obtain rs in the .90 range for 36-pointautocorrelations curves are discussed subse-quently in High Reliability in Normal Sam-ples, and subsequent references to autocor-relation curves will refer exclusively to the36-point type.
Circumflex Table of Correlations: Belween-Subjects Analysis
A circumplex table of correlations con-firms the structure of Figure 1. Most per-sonality tests consist of one or more dimen-sions, with many items on the test measur-ing each dimension represented. Thus theMinnesota Multiphasic Personality Inven-tory (MMPI) has many items on the schiz-ophrenia scale, many on the depression scale,and some belonging to both scales. Theusual procedure in personality measurementis to have many items repeatedly samplingwithin one or more dimensions. However,the questionnaires testing Figure 1 sampledtwo underlying dimensions but did not at-tempt to develop two sets of homogeneousscales, one representing pure affiliation, andthe other, pure interdependence. Rather,the questionnaires used items hypothesizedto simultaneously measure both dimensionsto systematically varied degrees. Thus, theitem for stimulate, teach (145) theoreti-cally sampled relationship in the amountof 5/9 affiliation and 4/9 domination andwas not intended to belong either to a setof homogeneous items measuring the be-havior trait called dominance or to a di-mension called affiliation. There is littleprecedent in the literature for attemptingmeasurement of behaviors not clearly as-signed to specific scales, but the possibilityand need for such an approach has been rec-ognized (Horst, 1968).It may be desired to evaluate the ability to reactappropriately to interrelated stimulus elements. Inthat case, a stimulus situation must be defined asa set of interrelated elements to which the appro-priate response is one which recognizes these in-terrelationships. Such types of stimulus patternsimply a highly sophisticated type of measurementand very little research has been done with them.
We shall not go further into this apparent con-tradiction of the rule that stimulus elements shouldbe independent [p. 6].
The existing exception for the philosophyof having sets of homogeneous items mea-suring independent dimensions is the cir-cumplex method which has been used inpersonality measurement research to system-atically sample points thought to lie in vary-ing degrees between two underlying dimen-sions. The circumplex method is an out-growth of Guttman's (1966) facet theorywhich defines variables systematically interms of their component facets. Foa (1961)explains his application of Guttman's facettheory:It seems indeed that a circular arrangement canalways be described on two dimensions. On theother hand, not every two-factor structure willnecessarily produce a circumplex. The circumplexrequires the existence of an interrelationship be-tween the factors. A sufficient condition for acircumplex is that the factor loadings of everyVariable i, belonging to the set, stand in the rela-tionship :
cVt + k'b\ = h",where c, k, and h are arbitrary constants, and o»and 61 are the loadings of Variable i on the firstand second factors, respectively.
This is the well known equation of the ellipse,When this relationship between factor loadings ex-ists, the predicted correlation coefficients, r^t =atai + bibi can be ordered in a circumplex pat-tern [p. 346].
In application, (Guttman, 1966) a circum-plex will yield a matrix wherein ". . . thehigher correlations are found near the maindiagonal; moving away from the diagonalcell the coefficients decrease and then in-crease again [p. 455]." Although Figure 1is based on absolute values rather thansquares of the components, the circumplexrationale can be applied because the sequenc-ing of points is the same in a diamond as itwould be in a circle.
Table 1 presents the intercorrelationsamong maternal ratings of 221 children(171 normal, 50 psychiatric; Samples 1 and2 combined) in terms of the 36 points onthe childlike surface of Figure 1. The cir-cumplex pattern is confirmed; loadings nearthe diagonal are high and positive (in the.40-.50 ranges; dj = 2\9, r = .14, signifi-
406 LORNA SMITH BENJAMIN
TABLE 1—CORRELATIONS AMONG CHART
Chartpoints
210241242243244245246247248240238237236235234233232231230221222223224225226227228220218217216215214213212211
210 241
28
242
1349
243
265142
244
06332929
245
1438424436
246
100
-1508
-0205
247
0100816283220
248
0610072123292140
240
122124233413042324
238
0092415261707363036
237
-0405102035222339211709
236
-14-24-21-06-01-09432213092124
235
12-03
1115311025342623312435
234
-10-20-23-11-03-0245211402
-02273720
233
08040114
-052734302500914191925
232
-23-37-39-30-14-162601
-01-16-051640064005
231
-22-27-37-19-11-1428040
-14-09173910450573
Note. Total subjects (N = 221) Include 50 child psychiatry patients and 171 normal children.
cant at the .05 level), and those in the mid-dle range are distinctly negative (quite afew are significantly negative). Proceedingaway from the diagonal, there is a gradualreturn of the rs to the original high-positiverange. This same circumplex pattern wasobtained in other samples for both the par-entlike and the childlike surfaces. In noanalysis was there any shuffling of the pointsin Figure 1 to obtain a better circumplex.The arrangement of the Figure was on ana priori basis, and Table 1 followed directly.Ultimately Figure 1, as well as the question-naire, may be refined on the basis of suchpost hoc rearrangements, but the order in
Table 1 was not due to any such "trial anderror" manipulating.
The circular ordering shown in Table 1was consistent with the circular orderingsuggested by the autocorrelations of Figures3 and 4. However, the data in Table 1were based on between-individual compari-sons. Thus, the structure hypothesized inFigure 1 is confirmed by both within-indi-vidual, and between-individual comparisons.
Factor Analysis: Between-Subjects AnalysisFactor analysis yields the proposed under-
lying dimensions and generates a> reasonablefacsimile o] Figure 1. Factor analysis is

STRUCTURAL ANALYSIS OF SOCIAL BEHAVIOR
POINTS ARRANGED IN CIRCUMFLEX ORDER
407
230
-12-21-26-21-06-07280907
-100312340743125161
221
-19-36-31-20-12-163009
-02-14-011943154609666753
222
-10-12-34-07-1907241010
-24-121428
-11392639383141
223
-18-28-24-1504
-10291517040823371537124134444025
224
-14-22-27-11-18-01300803
-11-092042123916484736534630
225
02-04-05
004026004
-15-04202015241627312127332226
226
-19-28-28-17-04-1235005
-040616472146045657465430534629
227
-11-13-16-0814
-0424162007102128132516333630342349211641
228
-17-21-22-20-11-11280502
-08-02164111401653575243334144385330
220
-24-22-27-20-09-12160402
-15-06
11320727015249325329343027432342
218
142525162519
-151809060119
-03090
-10-09-070
-030
-04-02-08-0610
-0201
217
163921242724
-10030107
-0217
-14-02-04-10-14-05-09-020
-06-06-05-0403
-120653
216
203438254827
-172313202031
-0424
-0301
-14-10-08-08-18-10-11-08-1401
-16-084346
215
083930293328
-061109051315
-090401
-07-10-04-03-10-02-05-07-01-0804
-08-0455554
214
143428402846072716030630
-03050113
-14-07-11-0405
-1002
-02-1404
-13-0336394654
213
153938341640
-12090216012
-15-04-0803
-28-21-16-1401
-19-09-15-18-10-20-154136413951
212
344340381538
-021410180213
-15100218
-27-21-17-17-11-15-04-07-12-08-12-23323344334557
211
224450431548
-030911061603
-2404
-1018
-31-29-13-24-04-30-1101
-26-10-20-2914141719273144
commonly used to test and/or constructpersonality theory on an empirical basis, andwhen used in this way usually results inmany dimensions (e.g., 16 personality fac-tors). However, some critics (e.g., Arm-strong, 1967) feel that such empirical useof factor analysis " . . . may be misleadingas far as the development of theory is con-cerned. The use of comprehensive and ex-plicit a priori analysis is proposed so thatthere will be independent criteria for evalua-tion of factor analytic results [p, 17]."
It may not be necessary to choose betweenthe extremes of constructing a model on apurely rational basis and testing it empiri-
cally or having no model at all and reportinga complex of empirically derived factors.Such a compromise in approach is illustratedby Schaefer (1965) who empirically derivedfactors for describing parent behavior, con-structed a rational model (circumplex) usingthese factors as a basis, and then tested themodel further with factor analyses of differ-ent samples. His factor analytically basedmodel was, as indicated above, the basis forthe parentlike surface of Figure 1. Schae-fer's preference was to use the principalcomponents analysis with varimax rotationof three factors (acceptance versus rejec-tion ; autonomy versus control; lax versus
408 LORNA SMITH BENJAMIN
TABLE 2FACTOR LOADINGS FROM PRINCIPAL COMPONENTS ANALYSIS FOLLOWED BY VARIMAX ROTATION
DisaffUiative chart point
Go away nowExcludeIsolateNeglect, ignoreBluff, illogicalAbandon, rejectDepriveStarve, poisonMurderous attackInjureFrightenRestrain, overprotectShout, criticizeThreatenExploitAuthoritarianShame, guilt controlDominate
Loading
Code
128127126125124123122121130131132133134135136137138140
l
403547607735566168456969667578113308
2
-31-11-11-23-17-53-28-55-12-32-28-08-35-26-20-07-35-22
3
452640213018431312442723263023805776
4
3952273522483213021215
-20-06
261305
-20-11
Affiliative chart point
EmancipateYou can do itEncourage divergenceListen, equalitarianExplore, let discoverConfirm, praisePlay, allow peer playSmile, greet warmlyKiss, heal, groomEmbrace, tender touchSupport, cradle, nurseIndulge, TLCProtect, keep companyReasoned persuasionStimulate, teachOverindulgeIntrudePossessive
Loading
Code
120118117116115114115112111110141142143144145146147148
l
-06-34-40-57-54-67-20-12-32-13-46-44-09-68-66-04
6331
2
14425146625773698583737168323734
-1206
3
-06-37-39-27-15-05-09-39-06-03-20-04-19
0605335066
4
613139152910
-05-05-02-20
0417
-3802
-02-51-11
10
Note, The 110 adults rated their memory of their mother's parentlike behavior. The first factor is named disaffiliation; thesecond, affiliation; the third, power; and the fourth, emancipation.
firm control) and a typical analysis (e.g.,Schaefer, 1965) accounted for 66% of thevariance.
Applications of principal components anal-ysis with varimax rotation to the differentsamples testing Figure 1 generally yieldedresults consistent with the figure. An ex-ample is presented in Table 2; data werefrom the 110 individuals who rated the en-tire battery of questionnaires (Sample 4),the part reported in the table being fromrecall of mother's parentlike behavior whenthe raters had been in age range 5-10 years.The table presents items in a format iso-metric with Figure 1; affiliative items ap-pear on the right-hand side of the table;disaffiliative items appear on the left-handside. The top of the columns representitems close to the independence pole, and thebottom of the columns represent the domina-tion pole. The balance of the items arearranged between these poles in order ofthe degrees to which they represent therespective poles. Factor 1 has high-positiveloadings on the disaffiliative side of the table,and distinctly negative loadings on the affili-ative side; this factor is named "disaffilia-
tion." The second factor is just the opposite:negative loadings appear on the disaffiliativeside, and positive loadings appear on theaffiliative side; this factor is named "affilia-tion." On the right-hand side of the table,the third factor has negative loadings foritems representing the emancipation pole,and loadings shift to positive at the domi-nance pole. This trend is not so clear forthe third factor on the left-hand side of thetable, but the factor is nevertheless named"power." On both the right- and left-handsides of the table, the fourth factor showshigh-positive loadings at the emancipationpole and negative loadings at the dominancepole. It is named "emancipation." Thusfour factors emerged which correspond tothe four poles of Figure 1, and these fourfactors accounted for 64% of the variance.These same four factors almost alwaysemerged in the different samples studied.The degree of factor similarity among twosamples as measured by the Wrigley andNewhaus .coefficient of congruence (Har-man, 1960) was .95 for the disaffiliationfactor, .89 for the emancipation factor, .90for the affiliation factor, and .85 for the
STRUCTURAL ANALYSIS OF SOCIAL BEHAVIOR 409
power factor. This comparison of factorsimilarity was between an analysis of adultsrating their memory of their mother's par-entlike behavior (Sample 4, n—HQ) andan analysis of mother's rating their ownparentlike behavior in relation to their chil-dren (Sample 1, w=171).
Disagreements about how many factors toextract from a factor analysis are wide-spread, and the arguments appear to be ofimportance because, in principal componentsanalysis (Cooley & Lohnes, 1962, pp. 151-153), the number of factors extracted is sup-posed to be a measure of the true dimension-ality of the domain under study. Forexample, in factor-analyzing results of in-telligence tests, the number of factors ex-tracted is often interpreted as an indicationof how many different abilities comprise in-telligence. Thus, whether the analysis yields2 or 12 factors can make a difference in theresulting description of intelligence.
If the number of factors to be extractedfrom the data testing Figure 1 was to bedetermined by the rule that each be asso-ciated with a latent root greater than orequal to 1, slightly less than 20 factors usu-ally emerged, and they accounted forslightly more than 70% of the variance aftervarimax rotation. The reduction of thenumber of factors to 4 was done on the basisof the observation that the first 4 factorsemerging related logically to Figure 1 andaccounted for almost as much variance ascould be accomplished by rotating a muchgreater number of factors.
Convention would suggest that the emer-gence of four factors associated with the fourpoles on the surfaces in Figure 1 necessarilymeans that there are four orthogonal dimen-sions, not two. However, the view that fac-tor analysis uncovers "true" dimensionalityhas been challenged by Guttman (1966)who reviewed the multiple factor analyticefforts of many investigators and remarked:In these algebraic approaches the notion of orderamong variables is absent. More seriously, theapproximate computational procedures used actu-ally have blinded researchers from seeing simpleorder patterns in their own data which may haveimportant psychological implications [p. 444].Guttman proceeded to make his point by
reanalyzing the data from a published studyof number ability which had yielded 10 com-mon factors by the centroid method (a sim-plified approximation to the principal com-ponents solution according to Cooley &Lohnes, 1962, p. 153) and showed how 5out of the 10 factors could be plotted in asimple two-dimensional scheme. He de-scribed his method of finding order amongmany factors as "a simple trial-and-error-graphic method" which plots the correlationsin terms of the approximate rank order ofthe sizes of the r. Guttman (1966) com-ments on the two-dimensional figure he gen-erated :Perhaps the most striking feature . . . is that itsucceeds in portraying in two dimensions the struc-ture of the interrelations of seventeen observedtests despite that fact that the conventional factoranalysis originally made of the data prescribesfive dimensions (or common factors) for thesesame tests. If the number of dimensions is re-garded as a criterion for parsimonious analysisthen surely the two dimensional portrayal is moreparsimonious than the five-dimensional [p. 450].
Later, Guttman (Schlesinger & Guttman,1969) published a computer program de-signed to plot such a two-space for severalfactors to "show how a certain definitionalstructure of the test variables is reflected ina two-space [p. 95]" and called his approach"smallest space analysis."
Guttman approaches factor analysis withconsiderably less reverence and more matter-of-factness than writers who view it as thekey to underlying dimensionality. He notes(Guttman, 1966) : "As has been pointed outelsewhere a 'factor' in the sense of conven-tional factor analysis is essentially but aweighted average of the observed tests andcan be regarded simply as an additionaltest [p. 447]."
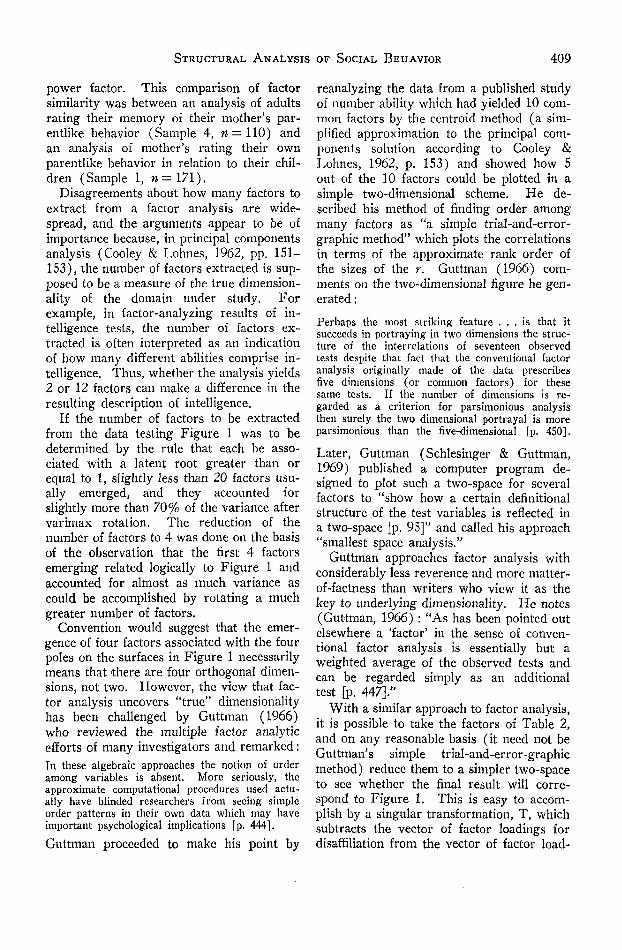
With a similar approach to factor analysis,it is possible to take the factors of Table 2,and on any reasonable basis (it need not beGuttman's simple trial-and-error-graphicmethod) reduce them to a simpler two-spaceto see whether the final result will corre-spond to Figure 1. This is easy to accom-plish by a singular transformation, T, whichsubtracts the vector of factor loadings fordisaffiliation from the vector of factor load-
410 LORNA SMITH BENJAMIN
^ .
: { is'!-J| I '
• Is t?! ~ r.s ai Is s
! i tl ! " I'5 I *"
tg
• il «S
r
3.• 'i ?
a -" «1 i sc ^ 1
T
|| .
£ 5 r *" s^ -5 S o o
•1s If «•tD c/i1 O V O•™ C j * -
^ c ̂'5 •"
5 E£* O ̂•i ii; _co> « tJ
| IBs "^ ̂2 t5 M
C j3
i a 4 a « ^S ^ 3 8 .a •-r i r i1 "3.J21 i1"* O oM t- j^,
\ ! i sga 5 2 2
" * "^ i s "D-5 «| f1 &» S <5 o *
'a I I «^• ij, • • • ^ g<M'5 *.l ? « 1 I ^|\ l l \ l \n\ ft f ;• ̂ ^ m J2 • ° •
s*: s 5 5 «|| | s \
^s& a
<vt-l
44-4
<u1Is.
tu
M-<
STRUCTURAL ANALYSIS OF SOCIAL BEHAVIOR 411
ings for affiliation to yield net affiliation (inTable 2, this would be Factor 2-Factor 1),and which subtracts the vector of factorloadings for power-helplessness from thevector of factor loadings for emancipated-beemancipated to yield net emancipation (inTable 2, this would be Factor 3 from Fac-tor 4).
The results of the transformation, T, ap-plied to the factors of Table 2 are shown inFigure 5. For example, the location of thepoint emancipate in Figure 5 was determinedby T: .14 - (—.06) = .20; .61 - (-.06)= .67. Thus the values from the four-spaceshown in Table 1 for the point emancipateare reduced to the values for the two-spacein Figure 1, and the coordinates for the pointare (.20, .67). Similarly, the location ofthe point dominate in Figure 5 comes fromTable 1: -.22 - (.08) = -.30; -.11 - .76= -.87; result: (—.30, —.87). The trans-formation, T, was applied to factor loadingsfor each item and in the resulting Figure 5,many points conformed quite closely totheory (140, 137, 148, 147, 138, 133, 134,123, 120, 117, 118, 115, 116, 111, 110, and143); a few points were not reasonably closeto expectation (124, 136, 126, and 128),and the rest were moderately close to ex-pectation. Inspection of Figure 5 reveals atendency for clustering to occur around thepoles rather than for the points to spreadthemselves evenly in circumplex order. Thismay be due to the fact that the varimax ro-tation tends to yield high factor loadingsfor as few variables as possible (Cooley &Lohnes, 1962, p. 162). In other words,the varimax rotation is structured to maxi-mize the loadings of a few variables on eachfactor and let the rest of the variables haveloadings which approach zero. This wouldtend to force the points toward the poles ofthe figure. In summary, despite some im-perfections, Figure 5 is judged to be a "rea-sonable facsimile" of the first surface ofFigure 1.
A reasonable facsimile of the childlike sur-face of Figure 1 is presented in Figure 6and was obtained by principal componentsanalysis of maternal ratings of childlike be-havior of 171 normal children (Sample 1)
using varimax rotation followed by thetransformation, T. This analysis rotatedratings of 72 items from both the parentlikeand the childlike surfaces, but similar fig-ures are obtained by separately rotating the36 items from each surface. This invulnera-bility to whether parentlike or childlikeitems were rotated separately or together isdue to the fact that varimax procedure isnot affected by the number of variables ro-tated (Cooley & Lohnes, 1962, pp. 162-163).
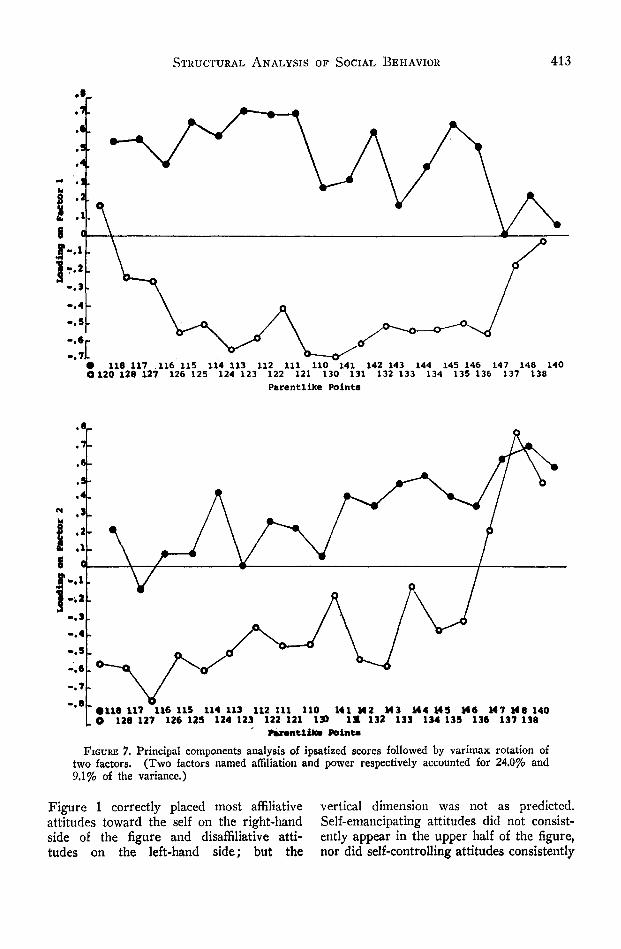
An alternative means of reducing the datato two dimensions which could be relatedto Figure 1 might be to ipsatize scores be-fore factoring for two factors. Accordingly,in Samples 1 and 4, each individual subject'sscore was first standardized to his/her ownmean and sigma, and then principal compo-nents analysis was followed by a varimaxrotation of two factors. This procedure ap-plied to data describing memory of mothers'parentlike behavior (reported in Table 2 andFigure 5) yielded the two factors shown inFigure 7. The first factor to emerge showedhigh positive loadings for points on the affili-ative side of Figure 1 and large negativeloadings on the disaffiliative side. The bowshape of the curves suggests that loadingswere greater for points near the poles ofthe affiliation axis (110 and 130), and thefactor is named affiliation. The second fac-tor tended to show progressively largerloadings for points nearer the dominancepole (140) of the interdependence axis andis named power. These two factors do cor-respond to expectations based on Figure 1and respectively accounted for 24.0% and9.1% of the variance. Since the initialprocedure of extracting four factors and ap-plying T accounted for nearly twice as muchvariance, this ipsatizing procedure was notpursued further.
In small samples, factor analyses of rat-ings in terms of the parentlike and childlikesurfaces consistently conformed to Figure 1.However factor analyses of the part of theSeries C questionnaires (Samples 3 and 4)measuring generalized attitudes toward theself in terms of the introject surface did notconform well to Figure 1. Such factor ana-lytic reconstructions of the third surface of

412 LORNA SMITH BENJAMIN
3fc•oC3
<U
1•JZoa
S 2* 0.
°- 5-t_0) **J AS. S*5-Q^
cn
t.0» 0)
O 'fo +*V) At
u *5 05 * ~ 815 <2 > 2 UD5 * a s s•O *^ CM "*
£ 3 • °-
K | *• => •—
CMCOCM
§ O O* •».
8-<U
v>
01VIl-3C
O.<Du3
«»CM
•
OCN
CMCMCM
|g
S
!
CM
£U
4-*
£
**-iO
criX
oCM
S
O.V)
atVI
<u
Dis
gust
, r
•
(OU
§I• ̂ -
o.a>ua< •
5s-•
8-
O.•
8-
Q<
rsCM
$ •"H 1
w»(
rfM
s (Is0-|
«
^«j=ufc.
u! +j
? E• 5
CM
• *
1 !„ "01 ^ Jj
A « C*» 3
s i ~5 * '§ ^S
o "° o* B
I 1° S.rCl
o
r, S*
8 9 08 I ? r s• §• E Ssi •! *
^ a.
H i *P! I !
• i-J 4O S
8> S3 ** CM JE
5 s!^. C 3 a' t> J K5 5 §• * w s •Ql ^rt
J >. m
> .̂ o ^
• CO 9 CM °CM & °
| J | |
'tn^O
rt
tuu ^
IS •«u OM-t <Uo <->
at -rc 3"rt ^
J^ ^* rt ,2
S 1 |^CO ° " *•
S ft -,35
^ ^ 'rt"3 §
a " s*o 43 i-I * S
s §"-tn yC ^/
1 B(U U
4; ^3
en *— ii <"o s* 1
H^
ato
a
STRUCTURAL ANALYSIS OF SOCIAL BEHAVIOR 413
.8
.1
.6
.3.
,1.
.1
*"'3"-.3.4.5
-.•r-.11
• 118 117 116 115 114 113 112 111 110 141 142 143 144 145 146 147 148 140O 120 128 127 126125 124123 122 121 130 131 132133 134 135136 137 138
Parentlike Points
~*8'~ •118117 116115 114113 112111 110 HI 142 M3 144 MS M6 147148140. O 128 127 126 125 124 123 122 121 130 IX 132 133 134 135 136 137 138
Panntliln Point*FIGURE 7. Principal components analysis of ipsatized scores followed by varimax rotation of
two factors. (Two factors named affiliation and power respectively accounted for 24.0% and9.1% of the variance.)
Figure 1 correctly placed most affiliativeattitudes toward the self on the right-handside of the figure and disaffiliative atti-tudes on the left-hand side; but the
vertical dimension was not as predicted.Self-emancipating attitudes did not consist-ently appear in the upper half of the figure,nor did self-controlling attitudes consistently

414 LORNA SMITH BENJAMIN
appear in the lower half. This failure toreconstruct the third surface in the interde-pendence (vertical) dimension was consist-ent across samples. Possibly it reflects afault in the theory, in the wording of thequestionnaire items, or a generalized con-fusion in people's attitudes about their ownautonomy from or interdependence with in-trojected significant others. Factor analysisof an expanded sample of short-form ratingsof self will, it is hoped, determine whetherthe problem was in the wording of the long-form items. Clinical interviews of subjectsin Sample 4 provided extensive subjectivesupport for the hypothesis that attitudes to-ward the self do relate directly to treatmentreceived from significant others (spouse,mother, father, important siblings). Moreformal testing of the third surface of Figure1 will be forthcoming elsewhere.
Principle of ComplementsThe principle of complements is confirmed
by correlations between surfaces. The prin-ciples of complementary relations (and ofantidotes) should be tested by an experimen-tal setting wherein one behavior (e.g., shout,criticize—134; or confirm, praise—114) isexhibited by the experimenter, and then in-dependent observers reliably rate the sub-ject's response and find a high incidenceof the predicted behavior (e.g., cringe, de-fend, whine—234; or display, court—214).This needed rigorous test of Figure 1 hasnot yet been performed. However, enthusi-astic if unscientific reports from psychiatricresidents, medical students, and patientshave supported the hypothesis about comple-mentary relations and antidotes. An anno-tated sequence of family interactions illus-trating these principles is available elsewhere(Benjamin, 1973, pp. 231-236).
Correlations between maternal ratings oftheir own behavior and of their children'sbehavior (Sample \,n— 171) are consistentwith the principle of complementary rela-tions. Two examples are shown in Figure8. The left-hand side of the Figure showsthe relation between maternal ratings of chil-dren for Point 210, hug, embrace, and ma-ternal ratings of themselves for points on
the parentlike surface. As the parentlikepoints closer to the complement of Point210 (i.e., Point 110—embrace, tender touch)are approached, the rs become larger andmore positive. The right-hand side of Fig-ure 8 shows the relation between ratings ofchildren on Point 218, unassaultive assert,and maternal self-ratings of parentlike be-havior. Inspection of this part of Figure 8shows that correlations between childlike as-sertiveness (218) and parentlike points tendto become more positive as the complemen-tary parentlike Point 118 (You can do it)is approached. Thus, Figure 8 is consistentwith the principle of complementary rela-tions between the parentlike and childlikesurfaces of Figure 1. The left-hand andright-hand sides of Figure 8 show that af-fection begets affection and independencebegets independence (and vice versa) ; theseprinciples have been repeatedly confirmed inthe child development literature (e.g., Baum-rind, 1967; Schaefer & Bayley, 1963).
Not every pair of complementary pointsconformed as closely to theory as the twopairs (110 and 210; 118 and 218) shownin Figure 8. In the total analysis fromwhich the examples presented in Figure 8were selected, many other points showed re-sults close to expectations based on Figure1; a few did not, and the rest were mod-erately close to expectation. The r betweenthe 36 maternal parentlike points and the 36predicted complementary behaviors for chil-dren was significant in 28/36 = 78% of thepossible complementary pairings. A harshertest of theory was to determine whether ther between a given pair of complementarypoints was greater than all other rs betweenthat particular parentlike point (motherrated herself) and all possible childlikepoints (mother rated child). The maximumr occurred exactly as predicted for the fol-lowing pairs: Mother (M) 118-Child (C)218, M 116-C 216, M 114-C 214, M 113-C213, M 112-C 212, M 110-C 210, M 143-C 243, M 134-C 234, and M 148-C 248.The maximum r suggestive of complemen-tary relation held within one point for PairsM 120-C 218, M 115-C 214, M 111-C 210,M 132-C 233, M 142-C 241, M 135-C 234,

STRUCTURAL ANALYSIS OF SOCIAL BEHAVIOR 415
o.+•SI-
S'
H 2-
2-I*
8-r
SI-S'?•
«•
H?-io.T8;i8-r
1
(
1
I1 '
1
11.1.''
1
1
mLx .ft ,TTT . % tv^s™ ™ ™* W 1 1 l > l - ( < U t r t ^
•g^ 25 -H rt ^
^ * ° § B
ijjjlu rS 01 g £5
i* § S! •§ ]3
Igllli ^ S)1^ S "5
V h/i s Cfl tfl
• I
lull llV
1
i g *§,!;
1:o||J
lltttL . T .1 l?!ll1 11 11 jfizji
A • *s ^"^^^ ^*™ ™ 4) ^H c aj *K
J?l^2. a -S .; u.oo "̂̂ S o
£5 O WH (3
k- >» £ *A x <J ,£ ) (_ , •— i O1) fl> 0 k C — U» — >• 5 3 <5 C o V3 a— o c a- 5 £ £U E E +" B — *^ Oi n i - C f i . X M f e a w ^ —
> - « ~ V a a O I - w . u > 9 U O NO. O *> « Uw g > ~ - o i / i £ 3 k V . - u _ 3 i D u — i- e t c o u t
v ' '•? §. j> £.Jj j_rsi;~J<JsJ[*lg1 •- "2 "° • "• Vo1" ?
•- » u c* £ E1) . C f l ) + ' < L ) 4 J Q ) a ' o u t n * - > • « « < ' u U » V o * a c ^ * * " i - ' > U V >U •> O U D 1 O C — C " O t f » f l J • U — 4-» • . f D W a i k . d i > O • U *J "O *O
. .o e — x o — 6 — E 3 C k | i w j t c o o £ 3- x o£ « U C 3 * J V J 3 — ^
f r » r » \ r ^ m f A r ^ ( ^ f ^ r g r g < ^ f M ( M f N < N P « *
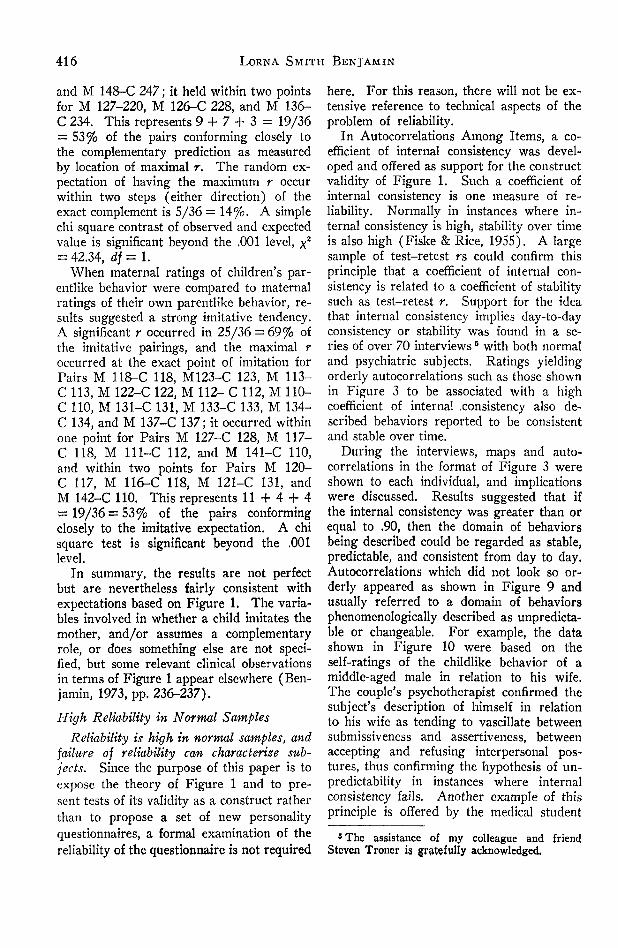
416 LORNA SMITH BENJAMIN
and M 148-C 247; it held within two pointsfor M 127-220, M 126-C 228, and M 136-C 234. This represents 9 + 7 + 3 = 19/36= 53% of the pairs conforming closely tothe complementary prediction as measuredby location of maximal r. The random ex-pectation of having the maximum r occurwithin two steps (either direction) of theexact complement is 5/36 = 14%. A simplechi square contrast of observed and expectedvalue is significant beyond the .001 level, x2
= 42.34, df=l.When maternal ratings of children's par-
entlike behavior were compared to maternalratings of their own parentlike behavior, re-sults suggested a strong imitative tendency.A significant r occurred in 25/36 = 69% ofthe imitative pairings, and the maximal roccurred at the exact point of imitation forPairs M 118-C 118, M123-C 123, M 113-C 113, M 122-C 122, M 112- C 112, M 110-C 110, M 131-C 131, M 133-C 133, M 134-C 134, and M 137-C 137; it occurred withinone point for Pairs M 127-C 128, M 117-C 118, M 111-C 112, and M 141-C 110,and within two points for Pairs M 120-C 117, M 116-C 118, M 121-C 131, andM 142-C 110. This represents 11 + 4 + 4= 19/36 = 53% of the pairs conformingclosely to the imitative expectation. A chisquare test is significant beyond the .001level.
In summary, the results are not perfectbut are nevertheless fairly consistent withexpectations based on Figure 1. The varia-bles involved in whether a child imitates themother, and/or assumes a complementaryrole, or does something else are not speci-fied, but some relevant clinical observationsin terms of Figure 1 appear elsewhere (Ben-jamin, 1973, pp. 236-237).
High Reliability in Normal SamplesReliability is high in normal samples, and
failure of reliability can characterise sub-jects. Since the purpose of this paper is toexpose the theory of Figure 1 and to pre-sent tests of its validity as a construct ratherthan to propose a set of new personalityquestionnaires, a formal examination of thereliability of the questionnaire is not required
here. For this reason, there will not be ex-tensive reference to technical aspects of theproblem of reliability.
In Autocorrelations Among Items, a co-efficient of internal consistency was devel-oped and offered as support for the constructvalidity of Figure 1. Such a coefficient ofinternal consistency is one measure of re-liability. Normally in instances where in-ternal consistency is high, stability over timeis also high (Fiske & Rice, 1955). A largesample of test-retest rs could confirm thisprinciple that a coefficient of internal con-sistency is related to a coefficient of stabilitysuch as test-retest r. Support for the ideathat internal consistency implies day-to-dayconsistency or stability was found in a se-ries of over 70 interviewsB with both normaland psychiatric subjects. Ratings yieldingorderly autocorrelations such as those shownin Figure 3 to be associated with a highcoefficient of internal .consistency also de-scribed behaviors reported to be consistentand stable over time.
During the interviews, maps and auto-correlations in the format of Figure 3 wereshown to each individual, and implicationswere discussed. Results suggested that ifthe internal consistency was greater than orequal to .90, then the domain of behaviorsbeing described could be regarded as stable,predictable, and consistent from day to day.Autocorrelations which did not look so or-derly appeared as shown in Figure 9 andusually referred to a domain of behaviorsphenomenologically described as unpredicta-ble or changeable. For example, the datashown in Figure 10 were based on theself-ratings of the childlike behavior of amiddle-aged male in relation to his wife.The couple's psychotherapist confirmed thesubject's description of himself in relationto his wife as tending to vascillate betweensubmissiveness and assertiveness, betweenaccepting and refusing interpersonal pos-tures, thus confirming the hypothesis of un-predictability in instances where internalconsistency fails. Another example of thisprinciple is offered by the medical student
5 The assistance of my colleague and friendSteven Troner is gratefully acknowledged.

STRUCTURAL ANALYSIS OF SOCIAL BEHAVIOR 417
.70
.60«•! .50g .405| .30Q .20* .10G -ooi -.'o0 -.20"• -.30
-.40-.50-.60-.70— ftn
D a a a a aD D D D OD ao D a D Q
D Do u° D
D 0a a
1 5 10 15 20 25 30 35S U C C E S S I V E LAGS
FIGURE 9. Autocorrelations for self-ratings of thechildlike behavior of a middle-aged male in rela-tion to his wife. (Autocorrelation curves such asthis which fail to show the order illustrated inFigure 3 usually describe a domain of behaviorscharacterized as unpredictable, unstable, or chaotic.)
who, on seeing the disorder among auto-correlations between his ratings of his fa-ther's parentlike behavior, exclaimed: "Inever knew what to expect from him. Hemight be nice and friendly one moment, andthen WHAMO, the next minute he'd bebeating us up for no reason at all." Thisfinding that failures of internal consistencyreflect unstable unpredictable interpersonalpostures was confirmed in nearly 100% ofthe interviews.
If it is correct to reason that failure toobtain a high degree of internal consistencyrepresents the significant psychological phe-nomenon of behavioral chaos and changerather than "failure" of a test, then it wouldfollow that internal consistency should behigher in normal samples than in psychiatricsamples. The hypothesis is confirmed sincethe average correlation between the auto-correlation curve and the inverted normalcurve for the childlike behavior of 171 pedi-atric outpatients (Sample 1) was .92, where-as the comparable correlation for a sample(Sample 2) of 50 child psychiatry patientswas .68. In a sample of 60 normal volun-teers (Sample 4) the average r betweenautocorrelation curves and the inverted nor-mal curve for childlike behavior in relationto a significant other person was .97, whereasthe same coefficient of internal consistency
for 50 (also Sample 4) psychiatric patientswas .81. Without exception, for every setof ratings, the average internal consistencywas greater in the normal sample than inthe psychiatric sample.
The idea that reliability is a property ofpeople as well as of scales has been ex-pressed by others (Jackson, 1971, p. 243)and similarly, lack of order (Foa, 1968) orreliability (Hersch & Scheibe, 1967) haspreviously been seen as reflecting psycho-pathology.
Although internal consistency is morecharacteristic of normals, it can appear inpsychiatric subjects and can also reflect psy-chopathology. For example, Figure 10shows a map of the self-ratings made shortlybefore the subject made a serious suicideattempt. The correlation between the auto-correlation curve for the ratings shown inFigure 10 and the inverted normal curvewas .98 showing that murderous attack hadbeen directed toward the self with impres-sive consistency just before this suicide at-tempt. No one would be inclined to labelthis highly consistent and integrated disaffi-liation toward self as "good" or "healthy,"so autocorrelation curves should be inter-preted in conjunction with the maps of theratings.
The autocorrelations shown in Figure 11were obtained from a medical student re-sponding to the short-form questionnairewith ratings of his memory of his father.The map appearing at the top of Figure 11shows that opposing tendencies were en-
FIGURE 10. Map of self-ratings completed shortlybefore the subject made a serious suicide attempt.(Autocorrelations associated with these ratingsshowed a high degree of internal consistency ori-ented around self-destruction.)

418 LORNA SMITH BENJAMIN
Neglect, Ignore
Exclude 95
50
50 Emancipate
25
25
Threaten 100
Authoritarian 100
Dominate 100
Encourage divergence
99 Play, allow peer play
0
50 Stimulate, teach
75 Intrude
2 4 6 8 10 12 14 16 16 20 22 24 26 28 30 32 34 36
Successive Laas
FIGURE 11. Map and autocorrelations of a male medical student rating hismemory of his father. (The autocorrelations increase as more oppositepoints are paired, indicating ambivalent memory and/or double-binding be-havior by the father.)
dorsed: neglect, ignore (125) and stimu-late, teach (145) both received above-medianratings; exclude (127) and intrude (147);emancipate (120) and dominate (140); en-courage divergence (117) and authoritarian(137) all received relatively high degrees ofendorsement. These opposing tendencies orambivalences are reflected in the autocorrela-tions shown at the bottom of Figure 11.Correlations become progressively larger aspaired points become more oppositional.Autocorrelations falling into a pattern likeFigure 11 may be one answer to the prob-lem of how to define and study ambivalence.(Minkowich, Weingarten, & Blum, 1966)
Clearly there is a need for methodological advanceto encourage fruitful exploration of a topic socentral to theories of personality formation [i.e.,ambivalence]. The development of a simple, easilyadministered technique for the assessment of indi-vidual differences in ambivalent feelings, generallyapplicable in studies of interpersonal relationships,is a worthwhile objective in itself [p. 32].
There has also been a test of agreementbetween persons rating videotaped inter-views in terms of Figure 1. Two femalegraduate students6 initially unfamiliar with
8 Acknowledgment and thanks are extended toLinda Kasuboski and Eileen Weil for making theratings. Frederick Brown and Dennis Cook alsocontributed generously to this effort through their
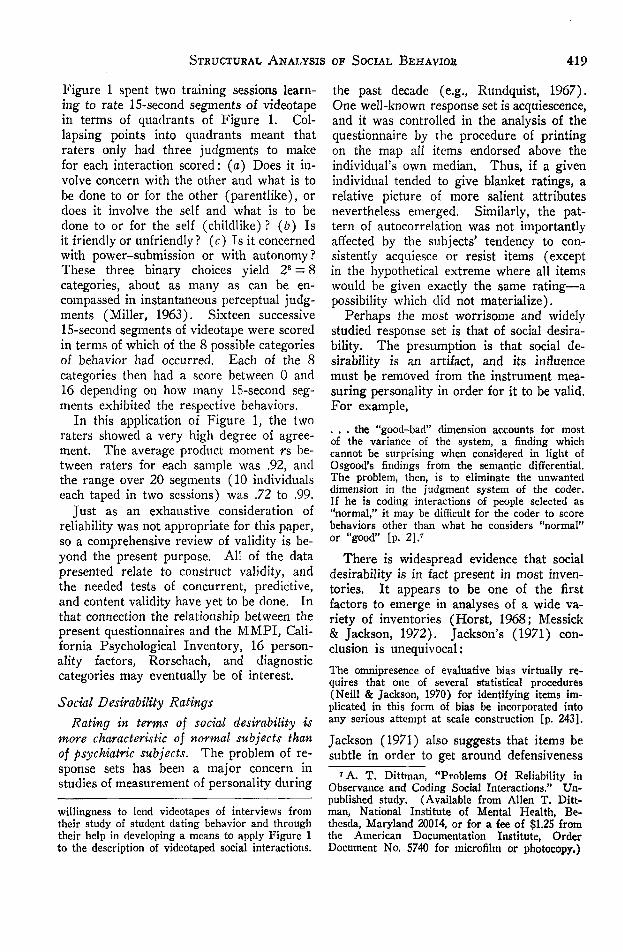
STRUCTURAL ANALYSIS OF SOCIAL BEHAVIOR 419
Figure 1 spent two training sessions learn-ing to rate 15-second segments of videotapein terms of quadrants of Figure 1. Col-lapsing points into quadrants meant thatraters only had three judgments to makefor each interaction scored: (a) Does it in-volve concern with the other and what is tobe done to or for the other (parentlike), ordoes it involve the self and what is to bedone to or for the self (childlike) ? (b) Isit friendly or unfriendly? (c) Is it concernedwith power-submission or with autonomy?These three binary choices yield 23 = 8categories, about as many as can be en-compassed in instantaneous perceptual judg-ments (Miller, 1963). Sixteen successive15-second segments of videotape were scoredin terms of which of the 8 possible categoriesof behavior had occurred. Each of the 8categories then had a score between 0 and16 depending on how many 15-second seg-ments exhibited the respective behaviors.
In this application of Figure 1, the tworaters showed a very high degree of agree-ment. The average product moment rs be-tween raters for each sample was .92, andthe range over 20 segments (10 individualseach taped in two sessions) was .72 to .99.
Just as an exhaustive consideration ofreliability was not appropriate for this paper,so a comprehensive review of validity is be-yond the present purpose. All of the datapresented relate to construct validity, andthe needed tests of concurrent, predictive,and content validity have yet to be done. Inthat connection the relationship between thepresent questionnaires and the MM PI, Cali-fornia Psychological Inventory, 16 person-ality factors, Rorschach, and diagnosticcategories may eventually be of interest.
Social Desirability RatingsRating in terms of social desirability is
more characteristic of normal subjects thanof psychiatric subjects. The problem of re-sponse sets has been a major concern instudies of measurement of personality during
willingness to lend videotapes of interviews fromtheir study of student dating behavior and throughtheir help in developing a means to apply Figure 1to the description of videotaped social interactions.
the past decade (e.g., Rundquist, 1967).One well-known response set is acquiescence,and it was controlled in the analysis of thequestionnaire by the procedure of printingon the map all items endorsed above theindividual's own median. Thus, if a givenindividual tended to give blanket ratings, arelative picture of more salient attributesnevertheless emerged. Similarly, the pat-tern of autocorrelation was not importantlyaffected by the subjects' tendency to con-sistently acquiesce or resist items (exceptin the hypothetical extreme where all itemswould be given exactly the same rating—apossibility which did not materialize).
Perhaps the most worrisome and widelystudied response set is that of social desira-bility. The presumption is that social de-sirability is an artifact, and its influencemust be removed from the instrument mea-suring personality in order for it to be valid.For example,. . . the "good-bad" dimension accounts for mostof the variance of the system, a finding whichcannot be surprising when considered in light ofOsgood's findings from the semantic differential.The problem, then, is to eliminate the unwanteddimension in the judgment system of the coder.If he is coding interactions of people selected as"normal," it may be difficult for the coder to scorebehaviors other than what he considers "normal"or "good" [p. 2].T
There is widespread evidence that socialdesirability is in fact present in most inven-tories. It appears to be one of the firstfactors to emerge in analyses of a wide va-riety of inventories (Horst, 1968; Messick& Jackson, 1972). Jackson's (1971) con-clusion is unequivocal:The omnipresence of evaluative bias virtually re-quires that one of several statistical procedures(Neill & Jackson, 1970) for identifying items im-plicated in this form of bias be incorporated intoany serious attempt at scale construction [p. 243].
Jackson (1971) also suggests that items besubtle in order to get around defensiveness
? A. T. Dittman, "Problems Of Reliability inObservance and Coding Social Interactions." Un-published study. (Available from Allen T. Ditt-man, National Institute of Mental Health, Be-thesda, Maryland 20014, or for a fee of $1.25 fromthe American Documentation Institute, OrderDocument No. 5740 for microfilm or photocopy.)
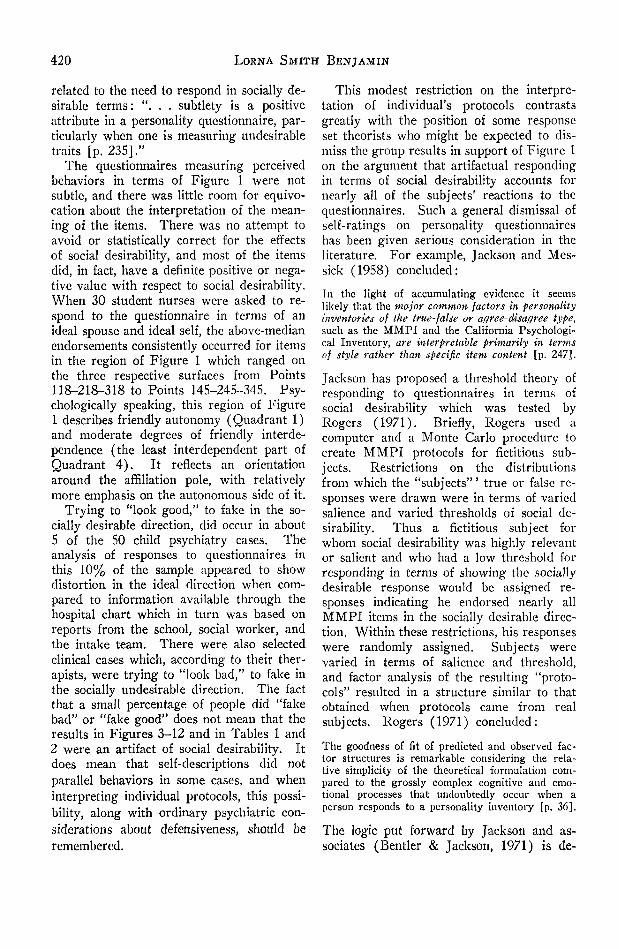
420 LORNA SMITH BENJAMIN
related to the need to respond in socially de-sirable terms: ". . . subtlety is a positiveattribute in a personality questionnaire, par-ticularly when one is measuring undesirabletraits [p. 235]."
The questionnaires measuring perceivedbehaviors in terms of Figure 1 were notsubtle, and there was little room for equivo-cation about the interpretation of the mean-ing of the items. There was no attempt toavoid or statistically correct for the effectsof social desirability, and most of the itemsdid, in fact, have a definite positive or nega-tive value with respect to social desirability.When 30 student nurses were asked to re-spond to the questionnaire in terms of anideal spouse and ideal self, the above-medianendorsements consistently occurred for itemsin the region of Figure 1 which ranged onthe three respective surfaces from Points118-218-318 to Points 145-245-345. Psy-chologically speaking, this region of Figure1 describes friendly autonomy (Quadrant 1)and moderate degrees of friendly interde-pendence (the least interdependent part ofQuadrant 4). It reflects an orientationaround the affiliation pole, with relativelymore emphasis on the autonomous side of it.
Trying to "look good," to fake in the so-cially desirable direction, did occur in about5 of the 50 child psychiatry cases. Theanalysis of responses to questionnaires inthis 10% of the sample appeared to showdistortion in the ideal direction when com-pared to information available through thehospital chart which in turn was based onreports from the school, social worker, andthe intake team. There were also selectedclinical cases which, according to their ther-apists, were trying to "look bad," to fake inthe socially undesirable direction. The factthat a small percentage of people did "fakebad" or "fake good" does not mean that theresults in Figures 3-12 and in Tables 1 and2 were an artifact of social desirability. Itdoes mean that self-descriptions did notparallel behaviors in some cases, and wheninterpreting individual protocols, this possi-bility, along with ordinary psychiatric con-siderations about defensiveness, should beremembered.
This modest restriction on the interpre-tation of individual's protocols contrastsgreatly with the position of some responseset theorists who might be expected to dis-miss the group results in support of Figure 1on the argument that artifactual respondingin terms of social desirability accounts fornearly all of the subjects' reactions to thequestionnaires. Such a general dismissal ofself-ratings on personality questionnaireshas been given serious consideration in theliterature. For example, Jackson and Mes-sick (1958) concluded:In the light of accumulating evidence it seemslikely that the major common factors in personalityinventories of the true-false or agree-disagree type,such as the MMPI and the California Psychologi-cal Inventory, are interpretable primarily in termsof style rather than specific item content [p. 247].
Jackson has proposed a threshold theory ofresponding to questionnaires in terms ofsocial desirability which was tested byRogers (1971). Briefly, Rogers used acomputer and a Monte Carlo procedure tocreate MMPI protocols for fictitious sub-jects. Restrictions on the distributionsfrom which the "subjects"' true or false re-sponses were drawn were in terms of variedsalience and varied thresholds of social de-sirability. Thus a fictitious subject forwhom social desirability was highly relevantor salient and who had a low threshold forresponding in terms of showing the sociallydesirable response would be assigned re-sponses indicating he endorsed nearly allMMPI items in the socially desirable direc-tion. Within these restrictions, his responseswere randomly assigned. Subjects werevaried in terms of salience and threshold,and factor analysis of the resulting "proto-cols" resulted in a structure similar to thatobtained when protocols came from realsubjects. Rogers (1971) concluded:
The goodness of fit of predicted and observed fac-tor structures is remarkable considering the rela-tive simplicity of the theoretical formulation com-pared to the grossly complex cognitive and emo-tional processes that undoubtedly occur when aperson responds to a personality inventory [p. 36].
The logic put forward by Jackson and as-sociates (Bentler & Jackson, 1971) is de-
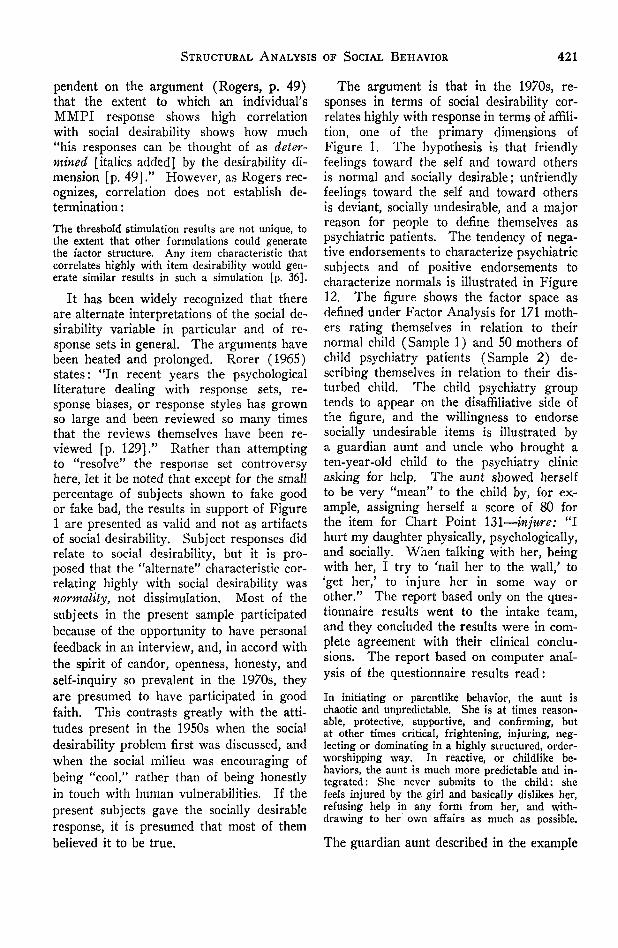
STRUCTURAL ANALYSIS OF SOCIAL BEHAVIOR 421
pendent on the argument (Rogers, p. 49)that the extent to which an individual'sMMPI response shows high correlationwith social desirability shows how much"his responses can be thought of as deter-mined [italics added] by the desirability di-mension [p. 49]." However, as Rogers rec-ognizes, correlation does not establish de-termination :The threshold stimulation results are not unique, tothe extent that other formulations could generatethe factor structure. Any item characteristic thatcorrelates highly with item desirability would gen-erate similar results in such a simulation [p. 36].
It has been widely recognized that thereare alternate interpretations of the social de-sirability variable in particular and of re-sponse sets in general. The arguments havebeen heated and prolonged. Rorer (1965)states: "In recent years the psychologicalliterature dealing with response sets, re-sponse biases, or response styles has grownso large and been reviewed so many timesthat the reviews themselves have been re-viewed [p. 129]." Rather than attemptingto "resolve" the response set controversyhere, let it be noted that except for the smallpercentage of subjects shown to fake goodor fake bad, the results in support of Figure1 are presented as valid and not as artifactsof social desirability. Subject responses didrelate to social desirability, but it is pro-posed that the "alternate" characteristic cor-relating highly with social desirability wasnormality, not dissimulation. Most of thesubjects in the present sample participatedbecause of the opportunity to have personalfeedback in an interview, and, in accord withthe spirit of candor, openness, honesty, andself-inquiry so prevalent in the 1970s, theyare presumed to have participated in goodfaith. This contrasts greatly with the atti-tudes present in the 1950s when the socialdesirability problem first was discussed, andwhen the social milieu was encouraging ofbeing "cool," rather than of being honestlyin touch with human vulnerabilities. If thepresent subjects gave the socially desirableresponse, it is presumed that most of thembelieved it to be true.
The argument is that in the 1970s, re-sponses in terms of social desirability cor-relates highly with response in terms of affili-tion, one of the primary dimensions ofFigure 1. The hypothesis is that friendlyfeelings toward the self and toward othersis normal and socially desirable; unfriendlyfeelings toward the self and toward othersis deviant, socially undesirable, and a majorreason for people to define themselves aspsychiatric patients. The tendency of nega-tive endorsements to characterize psychiatricsubjects and of positive endorsements tocharacterize normals is illustrated in Figure12. The figure shows the factor space asdefined under Factor Analysis for 171 moth-ers rating themselves in relation to theirnormal child (Sample 1) and 50 mothers ofchild psychiatry patients (Sample 2) de-scribing themselves in relation to their dis-turbed child. The child psychiatry grouptends to appear on the disaffiliative side ofthe figure, and the willingness to endorsesocially undesirable items is illustrated bya guardian aunt and uncle who brought aten-year-old child to the psychiatry clinicasking for help. The aunt showed herselfto be very "mean" to the child by, for ex-ample, assigning herself a score of 80 forthe item for Chart Point 131—injure: "Ihurt my daughter physically, psychologically,and socially. When talking with her, beingwith her, I try to 'nail her to the wall,' to'get her,' to injure her in some way orother." The report based only on the ques-tionnaire results went to the intake team,and they concluded the results were in com-plete agreement with their clinical conclu-sions. The report based on computer anal-ysis of the questionnaire results read:In initiating or parentlike behavior, the aunt ischaotic and unpredictable. She is at times reason-able, protective, supportive, and confirming, butat other times critical, frightening, injuring, neg-lecting or dominating in a highly structured, order-worshipping way. In reactive, or childlike be-haviors, the aunt is much more predictable and in-tegrated : She never submits to the child: shefeels injured by the girl and basically dislikes her,refusing help in any form from her, and with-drawing to her own affairs as much as possible.
The guardian aunt described in the example

422 LORNA SMITH BENJAMIN
yae,
§*i sD ocfcOa. Z
ooo
H h
o•
mo
*
i mi
o•
Toin
O•in
o•
ro
o•(N
I
O•
fMI
o
oino
ou
s
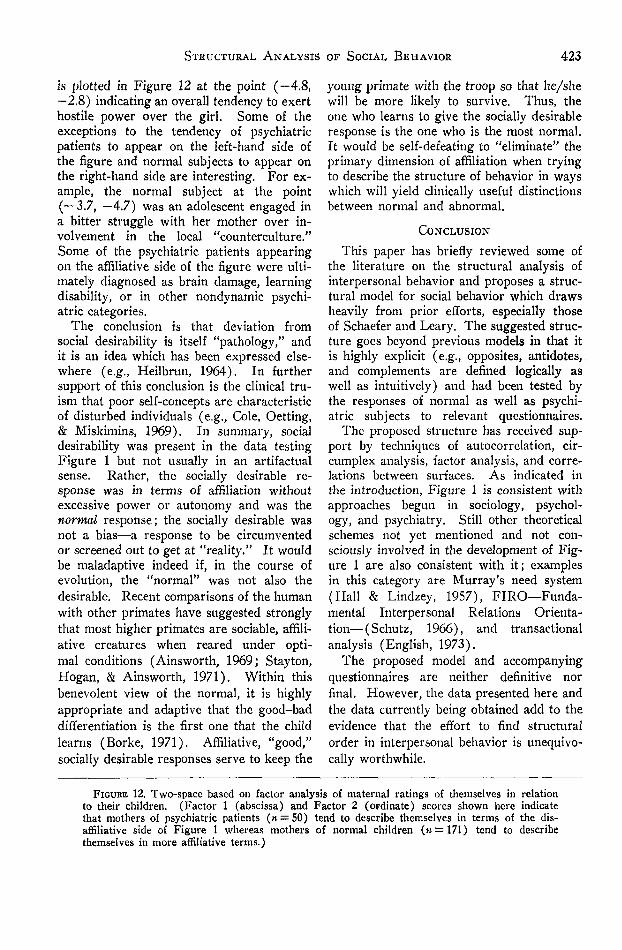
STRUCTURAL ANALYSIS OF SOCIAL BEHAVIOR 423
is plotted in Figure 12 at the point (—4.8,—2.8) indicating an overall tendency to exerthostile power over the girl. Some of theexceptions to the tendency of psychiatricpatients to appear on the left-hand side ofthe figure and normal subjects to appear onthe right-hand side are interesting. For ex-ample, the normal subject at the point(—3.7, —4.7) was an adolescent engaged ina bitter struggle with her mother over in-volvement in the local "counterculture."Some of the psychiatric patients appearingon the affiliative side of the figure were ulti-mately diagnosed as brain damage, learningdisability, or in other nondynamic psychi-atric categories.
The conclusion is that deviation fromsocial desirability is itself "pathology," andit is an idea which has been expressed else-where (e.g., Heilbrun, 1964). In furthersupport of this conclusion is the clinical tru-ism that poor self-concepts are characteristicof disturbed individuals (e.g., Cole, Getting,& Miskimins, 1969). In summary, socialdesirability was present in the data testingFigure 1 but not usually in an artifactualsense. Rather, the socially desirable re-sponse was in terms of affiliation withoutexcessive power or autonomy and was thenormal response; the socially desirable wasnot a bias—a response to be circumventedor screened out to get at "reality." It wouldbe maladaptive indeed if, in the course ofevolution, the "normal" was not also thedesirable. Recent comparisons of the humanwith other primates have suggested stronglythat most higher primates are sociable, affili-ative creatures when reared under opti-mal conditions (Ainsworth, 1969; Stayton,Hogan, & Ainsworth, 1971). Within thisbenevolent view of the normal, it is highlyappropriate and adaptive that the good-baddifferentiation is the first one that the childlearns (Borke, 1971). Affiliative, "good,"socially desirable responses serve to keep the
young primate with the troop so that he/shewill be more likely to survive. Thus, theone who learns to give the socially desirableresponse is the one who is the most normal.It would be self-defeating to "eliminate" theprimary dimension of affiliation when tryingto describe the structure of behavior in wayswhich will yield clinically useful distinctionsbetween normal and abnormal.
CONCLUSIONThis paper has briefly reviewed some of
the literature on the structural analysis ofinterpersonal behavior and proposes a struc-tural model for social behavior which drawsheavily from prior efforts, especially thoseof Schaefer and Leary. The suggested struc-ture goes beyond previous models in that itis highly explicit (e.g., opposites, antidotes,and complements are defined logically aswell as intuitively) and had been tested bythe responses of normal as well as psychi-atric subjects to relevant questionnaires.
The proposed structure has received sup-port by techniques of autocorrelation, cir-cumplex analysis, factor analysis, and corre-lations between surfaces. As indicated inthe introduction, Figure 1 is consistent withapproaches begun in sociology, psychol-ogy, and psychiatry. Still other theoreticalschemes not yet mentioned and not con-sciously involved in the development of Fig-ure 1 are also consistent with it; examplesin this category are Murray's need system(Hall & Lindzey, 1957), FIRO—Funda-mental Interpersonal Relations Orienta-tion— (Schutz, 1966), and transactionalanalysis (English, 1973).
The proposed model and accompanyingquestionnaires are neither definitive norfinal. However, the data presented here andthe data currently being obtained add to theevidence that the effort to find structuralorder in interpersonal behavior is unequivo-cally worthwhile.
FIGURE 12. Two-space based on factor analysis of maternal ratings of themselves in relationto their children. (Factor 1 (abscissa) and Factor 2 (ordinate) scores shown here indicatethat mothers of psychiatric patients (n — 50) tend to describe themselves in terms of the dis-affiliative side of Figure 1 whereas mothers of normal children (n = 171) tend to describethemselves in more affiliative terms.)
424 LORNA SMITH BENJAMIN
REFERENCESAinsworth, M. D. S. Object relations, dependency,
and attachment: A theoretical review of theinfant-mother relationship. Child Development,1969, 40, 969-1025.
Armstrong, J. S. Derivation of theory by meansof factor analysis or Tom Swift and his electricfactor analysis machine. American Statistician,1967, 21, 17-21.
Armstrong, J. S., & Soelberg, P. On the inter-pretation of factor analysis. Psychological Bul-letin, 1968, 70, 361-364.
Baldwin, D. L. Theories of child development.New York: Wiley, 1967.
Baumrind, D. Child care practices antecedingthree patterns of preschool behavior. GeneticPsychology Monographs, 1967, 75, 43-88.
Bell, R. Q. A reinterpretation of the direction ofeffects in studies of socialization. PsychologicalReview, 1968, 75, 81-95.
Bell, R. Q. Stimulus control of parent or care-taker behavior by offspring. Developmental Psy-chology, 1971, 4, 63-72.
Bentler, P. M. & Jackson, D. N. Identification ofcontent and style: A two-dimensional interpreta-tion of acquiescence. Psychological Bulletin,1971, 76, 186-204.
Benjamin, L. S. A biological model for under-standing the behavior of individuals. In JackWestman (Ed.), Individual differences in chil-dren. New York: Wiley, 1973.
Bergin, A. E., & Strupp, H. H. New directionsin psychotherapy research. Journal of AbnormalPsychology, 1970, 76, 13-26.
Biermann, R. Dimensions of interpersonal facili-tation on psychotherapy and child development.Psychological Bulletin, 1969, 72, 338-352.
Borke, M. Interpersonal perception of youngchildren: Egocentrism or empathy ? Develop-mental Psychology, 1971, 5, 263-269.
Carlson, R. Where is the person in personalityresearch? Psychological Bulletin, 1971, 75, 203-219.
Carson, R. C. Interaction concepts of personality.Chicago: Adline, 1969.
Chance, E. Content analysis of verbalizationsabout interpersonal experience. In L. Gottschalk& A. Auerbach (Eds.), Methods of research inpsychotherapy. New York: Appleton-Century-Crofts, 1966.
Cole, C. W., Getting, E. R., & Miskimins, R. W.Self concept therapy for adolescent females.Journal of Abnormal Psychology, 1969, 74, 642-645.
Cooley, W. W., & Lohnes, P. R. Multivariateprocedures for the behavioral sciences. NewYork: Wiley, 1962.
Coopersmith, S. The antecedents of self-esteem.San Francisco: W. H. Freeman, 1967.
Cottrell, L. Interpersonal interaction in the de-velopment of self. In D. A. Goslin (Ed.),Handbook of socialization theory and research.Chicago: Rand-McNally, 1971.
Cronbach, L. J. Essentials of psychological test-ing. (2nd ed.) New York: Harper, 1960.
English, R. TA's Disney World. PsychologyToday, April 1973, 45-51.
Feffer, M. Developmental analysis of interpersonalbehavior. Psychological Review, 1970, 77, 197-214.
Felker, D. W., & Thomas, S. B. Self-initiatedverbal reinforcement and positive self-concept.Child Development, 1971, 42, 2185-2187.
Fiske, D. W., & Rice, L. Intra-individual responsevariability. Psychological Bulletin, 1955, 52,217-250.
Foa, U. G. Convergences in the analyses of thestructure of interpersonal behavior. Psychologi-cal Review, 1961, 68, 341-353.
Foa, U. G. Perception in behavior in reciprocalroles: The ringex model. Psychological Mono-graphs, 1966, 80 (15, Whole No. 623).
Foa, U. G. Three kinds of behavioral changes.Psychological Bulletin, 1968, 70, 460-473.
Foa, U. G., & Turner, J. L. Psychology in theyear 2000: Going structural ? American Psy-chologist, 1970, 25, 244-247.
Freedman, M. B., Leary, T. F., Ossorio, A. G., &Coffey, H. S. The interpersonal dimension ofpersonality. Journal of Personality, 1951, 20,143-161.
Goldberg, L. R., & Hase, H. D. Strategies andtactics of personality inventory construction: Anempirical investigation. (ORI Research Mono-graph, Vol. 7, No. 1) Eugene: Oregon ResearchInstitute, 1967.
Goldfried, M. R., & Kent, R. N. Traditionalversus behavioral personality assessment: Acomparison of methodological and theoreticalassumption. Psychological Bulletin, 1972, 77,409-420.
Goldin, P. C. A review of children's reports ofparent behaviors. Psychological Bulletin, 1969,71, 222-236.
Grant, D. A. Testing the hull hypothesis and thestrategy and tactics of investigating theoreticalmodels. Psychological Review, 1962, 69, 54-61.
Guttman, L. Order analysis of correlation ma-trices. In R. B. Cattell (Ed.), Handbook ofmultivariate experimental psychology. Chicago:Rand-McNally, 1966.
Hall, C. S., & Lindzey, G. Theories of person-ality. New York: Wiley, 1957.
Harman, H. H. Modern factor analysis. Chicago:University of Chicago Press, 1960.
Harper, L. V. The young as a source stimuli con-trolling caretaker behavior. Developmental Psy-chology, 1971, 4, 73-88.
Heilbrun, A. B., Jr. Social learning theory, socialdesirability, and the MMPI. Psychological Bul-letin, 1964, 61, 377-387.
Herbert, E. W., Gelfand, D. M., & Hartman, D. P.Imitation and self-esteem as determinants of self-critical behavior. Child Development, 1969, 40,421-430.
STRUCTURAL ANALYSIS OF SOCIAL BEHAVIOR 425
Hersch, P. D., & Scheibe, K. Reliability and va-lidity of internal-external control as a personalitydimension. Journal 0} Consulting Psychology,1967, 31, 609-613.
Horst, P. Personality: Measurement 0} dimen-sions, San Francisco: Jossey-Bass, 1968.
Jackson, D. N. The dynamics of structured per-sonality tests: 1971. Psychological Review, 1971,78, 229-248.
Jackson, D. N., & Messick, S. Content and stylein personality assessment. Psychological Bulle-tin, 1958, 55, 243-252.
Leary, T. Interpersonal diagnosis of personality.New York: Ronald Press, 1957.
Maccoby, E., & Masters, J. C. Attachment anddependency. In P. Mussen (Ed.), Carmichael'smanual of child psychology. New York: Wiley,1970.
Mahler, M. On human symbiosis and the vicissi-tudes of individuation, Volume 1: Infantile psy-chosis. New York: International UniversitiesPress, 1968.
McClelland, D. C. Opinions predict opinions: Sowhat else is new? Journal of Consulting andClinical Psychology, 1972, 38, 325-326.
Messick, S., & Jackson, D. N. Judgmental di-mensions of psychopathology. Journal of Con-sulting and Clinical Psychology, 1972, 38, 418-427.
Miller, G. A. The magical number seven, plus orminus two: Some limits on our capacity forprocessnig information. In R. D. Luce, R. R.Bush, & E. Galanter, (Eds.), Readings in mathe-matical psychology. (Vol. 1) New York: Wiley,1963.
Minkowich, A., Weingarten, L., & Blum, G. Em-pirical contributions to a theory of ambivalence.Journal of Abnormal Psychology, 1966, 71, 30-41.
Mueller, W. J. Patterns of behavior and theirreciprocal impact in the family and in psycho-therapy. Journal of Counseling PsychologyMonograph, 1969, 16(2, Pt. 2).
Mueller, W. J., & Dilling, C. A. Therapist-clientinterview behavior and personality characteris-tics of therapists. Journal of Protective Tech-niques and Personality Assessment, 1968, 32,281-288.
Neill, J. A., & Jackson, D. N. An evaluation ofitem selection strategies in personality scale con-struction. Educational and Psychological Mea-surement, 1970, 30, 647-661.
Osgood, C. E., Suci, G. J., & Tannenbaum, P. H.The measurement of meaning. Urbana: Uni-versity of Illinois Press, 1957.
Ranson, G. J., Schaefer, E. S., & Levy, B. Cross-national validity of a spherical conceptual model
for parent behavior. Child Development, 1968,39, 1227-1235.
Rinn, J. Structure of phenomenal domains. Psy-chological Review, 1965, 72, 445-466.
Rogers, T. B. The process of responding topersonality items: Some issues, a theory, andsome research. Multivariate Behavioral Re-search Monographs, 1971 (No. 71-6).
Rorer, L. G. The great response-style myth, Psy-chological Bulletin, 1965, 63, 129-156.
Rundquist, E. A. Item response characteristics inattitude and personality measurement: A reac-tion to L. G. Rorer's 'The great response—stylemyth'. (Tech. Bull. STB G7-16). San Diego:U. S. Naval Personnel Research Activity, 1967.
Schaefer, E. S. A configurational analysis ofchildren's reports of parent behavior. Journalof Consulting Psychology, 1965, 29, 552-557.
Schaefer, E. S. From circular to spherical con-ceptual models for parent behavior and childbehavior. In J. P. Hill (Ed.), Minnesota Sym-posia on Child Psychology. (Vol. 4). Minne-apolis : University of Minnesota Press, 1971.
Schaefer, E. S., & Bayley, N. Maternal behavior,child behavior, and their intercorrelations frominfancy through adolescence. Monographs of theSociety for Research in Child Development, 1963,28 (3, Whole No. 87).
Schlesinger, I. M., & Guttman, L. Smallest spaceanalysis of intelligence and achievement tests.Psychological Bulletin, 1969, 71, 95-100.
Schutz, W. C. The interpersonal underworld.Palo Alto, Calif.: Science and Behavior Books,1966.
Scott, W. A. Comparative validities of forced-choice and single-stimuli tests. PsychologicalBulletin, 1968, 70, 231-244.
Scott, W. A., & Johnson, R. C. Comparativevalidities of direct and indirect personality tests.Journal of Consulting and Clinical Psychology,1972, 38, 301-318.
Stayton, D. J., Hogan, E., & Ainsworth, M. D. S.Infant obedience and maternal behavior: Theorigins of socialization reconsidered. Child De-velopment, 1971, 42, 1057-1069.
Sullivan, H. S. The interpersonal theory of psy-chiatry. New York: W. Norton, 1953.
Tanner, J. M. Physical Growth. In P. H. Mussen(Ed.), Manual of Child Psychology. New York:Wiley, 1970.
Toman, W. The duplication theorem of social re-lationships as tested in the general population.Psychological Review, 1971, 78, 380-390.
(Received May 22, 1973; revision receivedApril 10, 1974)
Related Documents