[Skriv här] BOULE DIAGNOSTICS INTERIM REPORT 1 JANUARY–30 SEPTEMBER 2017 1 Quarter July–September 2017 • Net sales amounted to SEK 109.7 million (108.5), up 1.1 percent. Adjusted for the change in exchange rates, this corresponds to an increase of 2.6 percent. • Number of instruments sold in the quarter was 1,116 (1,071), an increase of 4 percent. • Cash flow from operating activities amounted to SEK 10.1 million (12.7). • Operating profit was SEK 28.2 million (24.8) which corresponds to an operating margin of 25.7 percent (22.9). • Net profit amounted to SEK 21.6 million (19.3). • Earnings per share before dilution amounted to SEK 4.51 (4.11) and after dilution to SEK 4.48 (4.02). Significant events during the quarter STRATEGIC AGREEMENTS TO STRENGTHEN AND EXPAND THE PRODUCT PORTFOLIO In quarter four 2017, Boule will commence sales and distribution of a CRP product from Orion Diagnostica Oy via Boule’s own sales organization in Mexico. Boule has signed a global distribution agreement with CellaVision for their newly developed product for smaller and medium size laboratories. Sales start is planned for 2018. Boule has also signed a global agreement for the sale of a clinical chemistry product for veterinary applications. The product is a strong complement to the company's own hematology products, and sales start is planned for the first quarter of 2018. NON-RECURRING ITEMS The quarterly result has been positively affected by SEK 4.5 million for reversed provisions relating to employee bonus and option programs as well as the shutdown of the Chinese production facility. Interim period January-September 2017 • Net sales amounted to SEK 320.5 million (294.9), up 8.7 percent. Adjusted for the change in the exchange rates, this corresponds to an increase of 6.9 percent. • Number of instruments sold in the period was 3,255 (2,761), an increase of 18 percent. • Cash flow from operating activities amounted to SEK 33.6 million (8.0). • Operating profit, including efficiency improvements and non-recurring costs was SEK 39.5 million (45.8) which corresponds to an operating margin of 12.3 percent (15.5). • Net profit amounted to SEK 29.2 million (34.6). • Earnings per share before dilution amounted to SEK 6.09 (7.34) and after dilution to SEK 6.04 (7.19). Significant events after the quarter NEW CFO Christina Rubenhag joined Boule as CFO on 9 October. She succeeds Fredrik Alpsten who had previously announced that he will leave Boule to take up a position at another company. AGREEMENT ON LOCAL PRODUCTION IN RUSSIA To boost growth and profitability and strengthen our local presence in Russia, one of the company's largest markets, Boule has signed an agreement to start local production of reagents. Local production will be set up in collaboration with a local partner. Sales to customers are expected to start in 2018. MAJOR TENDER WON IN MEXICO In late October, Boule, in partnership with one of its Mexican distributors, won a public tender for hematology systems. The initial value of the order is estimated to SEK 3 million and includes instruments, reagents and controls. Product shipments will start in the fourth quarter of 2017. Key figures Jul- Sep 2017 Jul- Sep 2016 Oct 16- Sep 17 (R12) Oct 15- Sep 16 (R12) Growth in sales, % 1.1 22.2 11.2 15.1 Net sales, SEK million 109.7 108.5 426.3 383.3 Gross margin, % 51.8 50.2 47.2 47.3 Operating profit/loss, SEK million 28.2 24.8 40.8 46.4 Operating margin, % 25.7 22.9 9.6 12.1 Net debt, SEK million -89.0 -39.6 -89.0 -39.6 Return on equity, % 9.2 9.1 13.0 17.5 Net debt/EBIT (R12), times -2.2 -0.9 -2.2 -0.9 Earnings per share, after dilution, SEK 4.48 4.02 6.34 7.45 Boule Diagnostics AB (publ) Interim report January–September 2017 Strong quarter with good margins 10 20 30 40 50 60 260 300 340 380 420 460 Q3 Q4 Q1 Q2 Q3 Q4 Q1 Q2 Q3 Q4 Q1 Q2 Q3 2014 2015 2016 2017 SEK million SEK million Net sales (R12) and EBIT (R12) Net sales EBIT

Welcome message from author
This document is posted to help you gain knowledge. Please leave a comment to let me know what you think about it! Share it to your friends and learn new things together.
Transcript

[Skriv här]
BOULE DIAGNOSTICS INTERIM REPORT 1 JANUARY–30 SEPTEMBER 2017 1
Quarter July–September 2017 • Net sales amounted to SEK 109.7 million (108.5), up
1.1 percent. Adjusted for the change in exchange
rates, this corresponds to an increase of 2.6 percent.
• Number of instruments sold in the quarter was
1,116 (1,071), an increase of 4 percent.
• Cash flow from operating activities amounted to SEK
10.1 million (12.7).
• Operating profit was SEK 28.2 million (24.8) which
corresponds to an operating margin of 25.7 percent
(22.9).
• Net profit amounted to SEK 21.6 million (19.3).
• Earnings per share before dilution amounted to SEK
4.51 (4.11) and after dilution to SEK 4.48 (4.02).
Significant events during the quarter STRATEGIC AGREEMENTS TO STRENGTHEN AND EXPAND THE PRODUCT PORTFOLIO
In quarter four 2017, Boule will commence sales and distribution of a CRP product from Orion Diagnostica Oy via Boule’s own sales organization in Mexico.
Boule has signed a global distribution agreement with CellaVision for their newly developed product for smaller and medium size laboratories. Sales start is planned for 2018.
Boule has also signed a global agreement for the sale of a clinical chemistry product for veterinary applications. The product is a strong complement to the company's own hematology products, and sales start is planned for the first quarter of 2018. NON-RECURRING ITEMS
The quarterly result has been positively affected by SEK 4.5 million for reversed provisions relating to employee bonus and option programs as well as the shutdown of the Chinese production facility.
Interim period January-September 2017 • Net sales amounted to SEK 320.5 million (294.9), up
8.7 percent. Adjusted for the change in the exchange
rates, this corresponds to an increase of 6.9 percent.
• Number of instruments sold in the period was
3,255 (2,761), an increase of 18 percent.
• Cash flow from operating activities amounted to SEK
33.6 million (8.0).
• Operating profit, including efficiency improvements
and non-recurring costs was SEK 39.5 million (45.8)
which corresponds to an operating margin of 12.3
percent (15.5).
• Net profit amounted to SEK 29.2 million (34.6).
• Earnings per share before dilution amounted to SEK
6.09 (7.34) and after dilution to SEK 6.04 (7.19).
Significant events after the quarter NEW CFO
Christina Rubenhag joined Boule as CFO on 9 October. She succeeds Fredrik Alpsten who had previously announced that he will leave Boule to take up a position at another company.
AGREEMENT ON LOCAL PRODUCTION IN RUSSIA
To boost growth and profitability and strengthen our local presence in Russia, one of the company's largest markets, Boule has signed an agreement to start local production of reagents. Local production will be set up in collaboration with a local partner. Sales to customers are expected to start in 2018.
MAJOR TENDER WON IN MEXICO
In late October, Boule, in partnership with one of its Mexican distributors, won a public tender for hematology systems. The initial value of the order is estimated to SEK 3 million and includes instruments, reagents and controls. Product shipments will start in the fourth quarter of 2017.
Key figures
Jul-Sep 2017
Jul-Sep 2016
Oct 16-Sep 17 (R12)
Oct 15-Sep 16 (R12)
Growth in sales, % 1.1 22.2 11.2 15.1
Net sales, SEK million 109.7 108.5 426.3 383.3
Gross margin, % 51.8 50.2 47.2 47.3
Operating profit/loss, SEK million 28.2 24.8 40.8 46.4
Operating margin, % 25.7 22.9 9.6 12.1
Net debt, SEK million -89.0 -39.6 -89.0 -39.6
Return on equity, % 9.2 9.1 13.0 17.5
Net debt/EBIT (R12), times -2.2 -0.9 -2.2 -0.9
Earnings per share, after dilution, SEK 4.48 4.02 6.34 7.45
Boule Diagnostics AB (publ) Interim report January–September 2017
Strong quarter with good margins
10
20
30
40
50
60
260
300
340
380
420
460
Q3 Q4 Q1 Q2 Q3 Q4 Q1 Q2 Q3 Q4 Q1 Q2 Q3
2014 2015 2016 2017
SEK millionSEK million Net sales (R12) and EBIT (R12)
Net sales EBIT

BOULE DIAGNOSTICS INTERIM REPORT 1 JANUARY–30 SEPTEMBER 2017 2
Comments from CEO Fredrik Dalborg
The third quarter 2017 was a solid one for Boule. Sales developed well and growth continued, even in comparison with the record third quarter of 2016. In the second quarter 2017 the gross margin declined because of the geographic revenue mix and the EBIT margin also declined due to one-off costs related to activities to increase future efficiency and profitability. In light of this, it is great to see the record profitability in the third quarter, with a gross margin at 51.8% and EBIT margin at 25.7%.
During the third quarter Boule made significant progress to develop and strengthen the product portfolio in line with previously communicated priorities. In November Boule will be introducing a new veterinary hematology instrument, which will be launched in combination with a new platform for veterinary clinical chemistry. Sales start for both these platforms is scheduled for the first quarter 2018. Boule also signed an agreement with Orion Diagnostica Oy to distribute the QuickRead go CRP system in Mexico. In addition, a global distribution agreement with CellaVision has been signed. According to the agreement Boule will promote and distribute the new CellaVision platform for digital morphology in small and medium sized labs, Boules core customer segment. Sales start is planned for the second half of 2018.
EARNINGS AND SALES
Revenue growth continued in the third quarter of 2017, and at SEK 109.7 million a new record for quarterly sales was established. In September, thanks to strong efforts from the Sales, Order and Production departments, a new record for monthly instrument shipments was set at 592 units. During the full quarter 1,116 instruments were sold, an increase of 4%. Compared to the second quarter 2017 the revenue growth was 5.2% and compared to the strong third quarter 2016, when major tenders in Latin America strengthened revenues, the growth was 1.1% (2.6% at constant currencies). Solid growth in Asia, Africa and Middle East continued while a slow-down in the US market was observed. In the US market, two out of three distributors are showing strong growth, while the third is facing some challenges. The Boule team is working closely with the distributor in question to address these challenges.
Both the gross margin and the EBIT margin were strong in the third quarter 2017. This is a favorable development mainly driven by higher sales and a favorable geographic mix combined with the efficiency and margin improvement initiatives.
LOOKING FORWARD
Significant progress was made during the quarter to strengthen and develop the company for the future in line with established priorities. Among other things, multiple distribution agreements have been signed in order to strengthen our product portfolio. Boule will also strengthen the position in the important Russian market by starting up local manufacturing of reagents. The reagent manufacturing will be set up in collaboration with a local partner and will start during 2018.
In addition to this a thorough proof of concept study has been completed, and a development project has been started that will lead to the launch of our next generation
hematology platform. During the course of the project the share of capitalized R&D is expected to increase.
As previously communicated, Boule’s priorities are:
1. Further measures to support and strengthen the company's sales and profitability growth.
2. To continue to improve current products and develop new ones.
3. To strengthen and expand our product portfolio via distribution agreements, OEM contracts and possible acquisitions.
Fredrik Dalborg
President and CEO
BOULE DIAGNOSTICS INTERIM REPORT 1 JANUARY–30 SEPTEMBER 2017 3
Group performance January-September 2017
NET SALES
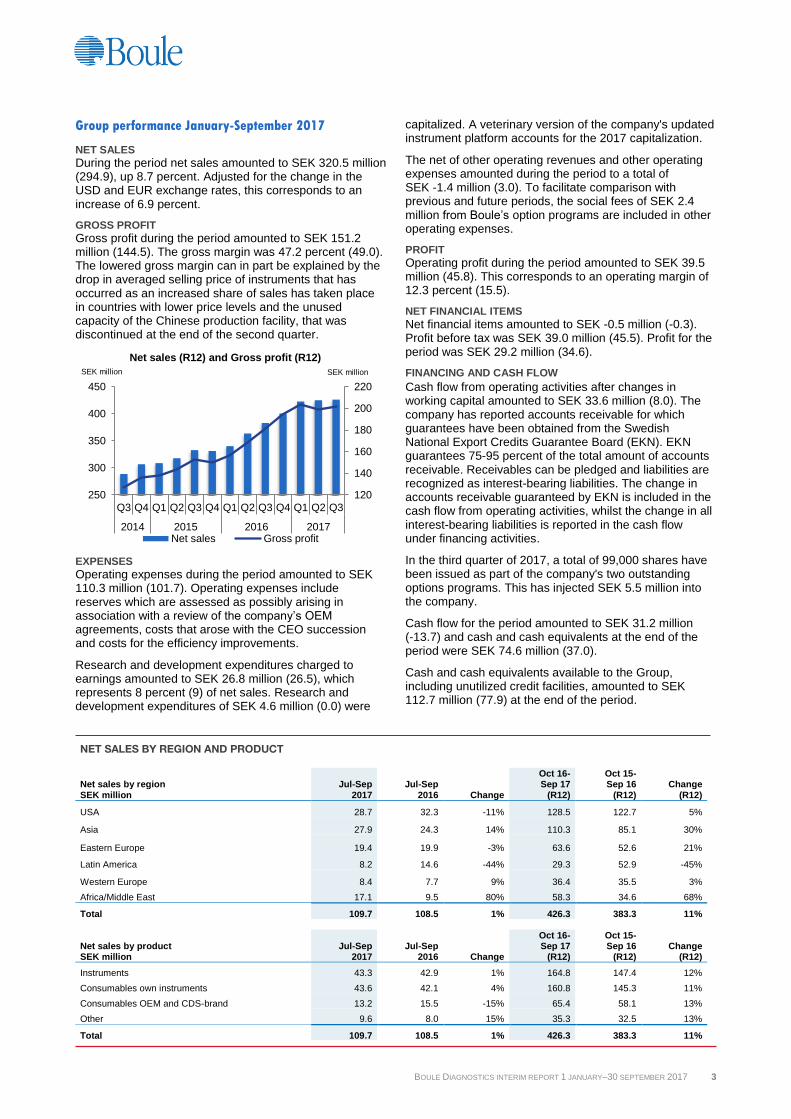
During the period net sales amounted to SEK 320.5 million (294.9), up 8.7 percent. Adjusted for the change in the USD and EUR exchange rates, this corresponds to an increase of 6.9 percent.
GROSS PROFIT
Gross profit during the period amounted to SEK 151.2 million (144.5). The gross margin was 47.2 percent (49.0). The lowered gross margin can in part be explained by the drop in averaged selling price of instruments that has occurred as an increased share of sales has taken place in countries with lower price levels and the unused capacity of the Chinese production facility, that was discontinued at the end of the second quarter.
EXPENSES
Operating expenses during the period amounted to SEK 110.3 million (101.7). Operating expenses include reserves which are assessed as possibly arising in association with a review of the company’s OEM agreements, costs that arose with the CEO succession and costs for the efficiency improvements.
Research and development expenditures charged to earnings amounted to SEK 26.8 million (26.5), which represents 8 percent (9) of net sales. Research and development expenditures of SEK 4.6 million (0.0) were
capitalized. A veterinary version of the company's updated instrument platform accounts for the 2017 capitalization.
The net of other operating revenues and other operating expenses amounted during the period to a total of SEK -1.4 million (3.0). To facilitate comparison with previous and future periods, the social fees of SEK 2.4 million from Boule’s option programs are included in other operating expenses.
PROFIT Operating profit during the period amounted to SEK 39.5 million (45.8). This corresponds to an operating margin of 12.3 percent (15.5).
NET FINANCIAL ITEMS
Net financial items amounted to SEK -0.5 million (-0.3). Profit before tax was SEK 39.0 million (45.5). Profit for the period was SEK 29.2 million (34.6).
FINANCING AND CASH FLOW Cash flow from operating activities after changes in working capital amounted to SEK 33.6 million (8.0). The company has reported accounts receivable for which guarantees have been obtained from the Swedish National Export Credits Guarantee Board (EKN). EKN guarantees 75-95 percent of the total amount of accounts receivable. Receivables can be pledged and liabilities are recognized as interest-bearing liabilities. The change in accounts receivable guaranteed by EKN is included in the cash flow from operating activities, whilst the change in all interest-bearing liabilities is reported in the cash flow under financing activities.
In the third quarter of 2017, a total of 99,000 shares have been issued as part of the company's two outstanding options programs. This has injected SEK 5.5 million into the company.
Cash flow for the period amounted to SEK 31.2 million (-13.7) and cash and cash equivalents at the end of the period were SEK 74.6 million (37.0).
Cash and cash equivalents available to the Group, including unutilized credit facilities, amounted to SEK 112.7 million (77.9) at the end of the period.
120
140
160
180
200
220
250
300
350
400
450
Q3 Q4 Q1 Q2 Q3 Q4 Q1 Q2 Q3 Q4 Q1 Q2 Q3
2014 2015 2016 2017
SEK millionSEK million
Net sales (R12) and Gross profit (R12)
Net sales Gross profit
NET SALES BY REGION AND PRODUCT
Net sales by region SEK million
Jul-Sep 2017
Jul-Sep 2016 Change
Oct 16- Sep 17
(R12)
Oct 15- Sep 16 (R12)
Change (R12)
USA 28.7 32.3 -11% 128.5 122.7 5%
Asia 27.9 24.3 14% 110.3 85.1 30%
Eastern Europe 19.4 19.9 -3% 63.6 52.6 21%
Latin America 8.2 14.6 -44% 29.3 52.9 -45%
Western Europe 8.4 7.7 9% 36.4 35.5 3%
Africa/Middle East 17.1 9.5 80% 58.3 34.6 68%
Total 109.7 108.5 1% 426.3 383.3 11%
Net sales by product SEK million
Jul-Sep 2017
Jul-Sep 2016 Change
Oct 16- Sep 17
(R12)
Oct 15- Sep 16 (R12)
Change (R12)
Instruments 43.3 42.9 1% 164.8 147.4 12%
Consumables own instruments 43.6 42.1 4% 160.8 145.3 11%
Consumables OEM and CDS-brand 13.2 15.5 -15% 65.4 58.1 13%
Other 9.6 8.0 15% 35.3 32.5 13%
Total 109.7 108.5 1% 426.3 383.3 11%

BOULE DIAGNOSTICS INTERIM REPORT 1 JANUARY–30 SEPTEMBER 2017 4
305 12802646
39565892
8473
11397
14422
17723
20498
24319
27574
0
500
1 000
1 500
2 000
2 500
3 000
3 500
4 000
4 500
0
5 000
10 000
15 000
20 000
25 000
30 000
2006 2007 2008 2009 2010 2011 2012 2013 2014 2015 2016 2017 Q3
No. of instruments sold per year**
Accumulated No. of instruments sold
Accumulated No. of instruments sold*
Accumulated No. of instrumetns sold No. of instruments sold per year
INVESTMENTS
Total investments amounted to SEK 6.7 million (3.5).
EQUITY AND LIABILITIES Group equity on 30 September 2017 totaled SEK 247.1 million (223.3) and equity/asset ratio was 63 percent (66).
Interest bearing liabilities, that are primarily accounts receivable financing and a bank loan at the US subsidiary company, amounted to SEK 62.6 million (55.9) on 30 September 2017. SEK 28.1 million (22.8) of the interest-bearing liabilities were non-current and SEK 34.5 million (33.1) were current. At 30 September 2017, other non-interest-bearing current liabilities and accounts payable totaled to SEK 73.5 million (59.1).
The net debt on 30 September 2017 amounted to SEK -89.0 million (-39.6).
At the end of the period deferred tax assets and deferred tax liabilities totaled SEK 0.2 million (0.5) and SEK 11.9 million (3.4) respectively.
MARKET
Boule markets its products to hospitals, clinics, laboratories and companies within blood diagnostics in both the human and veterinary areas. Blood diagnostics means that only blood is analyzed via e.g. clinical chemical analysis or blood cell counting concerning changes in different blood components. The global market of decentralized hematology diagnostics is valued at around SEK 5 billion of which Boule has a market share of around 8 percent.
SIGNIFICANT RISKS AND UNCERTAINITIES
The Group’s operations are subjected to a number of risks
and uncertainties. There is always a risk of competitors
offering more efficient and better products than Boule and
that the customer base will shrink as a result. Faulty and
delayed deliveries or non-deliveries from the company’s
suppliers could in turn result in delayed, defective or faulty
deliveries by the company.
There is no guarantee that the company’s operations will
not be subjected to restrictions by government agencies or
that that they will obtain the regulatory approval they need
in the future. There is also the risk that the company could
lose its ability to develop products, or that its products
cannot be launched on schedule or that market reception
is poorer than expected. These risks could result in lower
sales, which would then have a negative impact on the
company’s earnings. The company is also exposed to
customers who are unable to pay and the possibility of the
company being unable to finance its operations.
Boule is currently exposed to currency exchange risks.
+/- 10% of the exchange rate USD/SEK affects the net
sales by +/- SEK 20 million and net profit by +/- SEK 4
million. We are continuously working on operationally
reducing our exchange rate exposure.
For a more detailed description of the risks, see the Annual Report for 2016. Compared with the Annual Report, the risks are deemed to remain unchanged.
TRANSACTIONS WITH RELATED PARTIES
There were no transactions with related parties in this period.
PARENT COMPANY
Boule Diagnostics AB (publ.), Corporate Registration Number 556535-0252 is a Swedish corporation with its registered address in Stockholm. The address of its headquarters is Domnarvsgatan 4, SE-163 53 Spånga, Sweden.
The Parent Company’s revenues derive from Group-wide services.
Receivables from Group companies mainly relate to receivables from the Swedish subsidiary Boule Medical AB. Risks and uncertainties in the Parent Company indirectly match those of the Group.
*Boule tied instruments.
** Number of instruments sold are accumulated for the last twelve months.
BOULE DIAGNOSTICS INTERIM REPORT 1 JANUARY–30 SEPTEMBER 2017 5
NUMBER OF SHARES
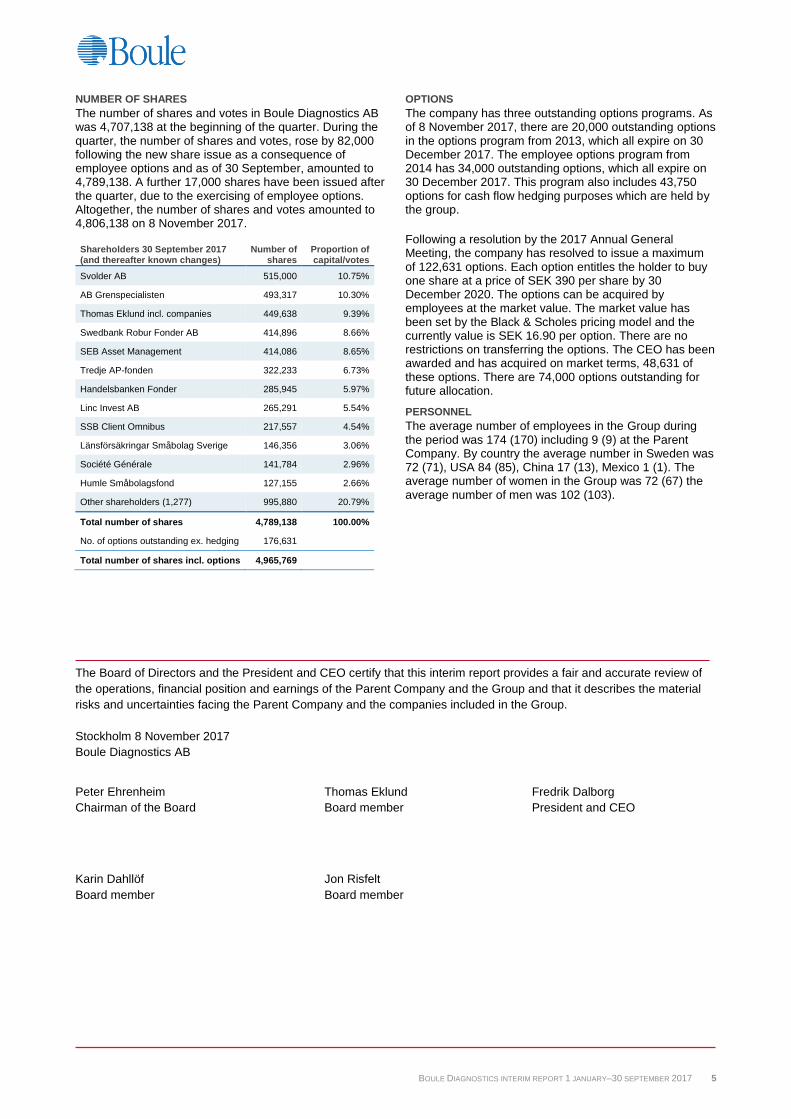
The number of shares and votes in Boule Diagnostics AB was 4,707,138 at the beginning of the quarter. During the quarter, the number of shares and votes, rose by 82,000 following the new share issue as a consequence of employee options and as of 30 September, amounted to 4,789,138. A further 17,000 shares have been issued after the quarter, due to the exercising of employee options. Altogether, the number of shares and votes amounted to 4,806,138 on 8 November 2017.
Shareholders 30 September 2017 (and thereafter known changes)
Number of shares
Proportion of capital/votes
Svolder AB 515,000 10.75%
AB Grenspecialisten 493,317 10.30%
Thomas Eklund incl. companies 449,638 9.39%
Swedbank Robur Fonder AB 414,896 8.66%
SEB Asset Management 414,086 8.65%
Tredje AP-fonden 322,233 6.73%
Handelsbanken Fonder 285,945 5.97%
Linc Invest AB 265,291 5.54%
SSB Client Omnibus 217,557 4.54%
Länsförsäkringar Småbolag Sverige 146,356 3.06%
Société Générale 141,784 2.96%
Humle Småbolagsfond 127,155 2.66%
Other shareholders (1,277) 995,880 20.79%
Total number of shares 4,789,138 100.00%
No. of options outstanding ex. hedging 176,631
Total number of shares incl. options 4,965,769
OPTIONS
The company has three outstanding options programs. As of 8 November 2017, there are 20,000 outstanding options in the options program from 2013, which all expire on 30 December 2017. The employee options program from 2014 has 34,000 outstanding options, which all expire on 30 December 2017. This program also includes 43,750 options for cash flow hedging purposes which are held by the group.
Following a resolution by the 2017 Annual General Meeting, the company has resolved to issue a maximum of 122,631 options. Each option entitles the holder to buy one share at a price of SEK 390 per share by 30 December 2020. The options can be acquired by employees at the market value. The market value has been set by the Black & Scholes pricing model and the currently value is SEK 16.90 per option. There are no restrictions on transferring the options. The CEO has been awarded and has acquired on market terms, 48,631 of these options. There are 74,000 options outstanding for future allocation.
PERSONNEL
The average number of employees in the Group during the period was 174 (170) including 9 (9) at the Parent Company. By country the average number in Sweden was 72 (71), USA 84 (85), China 17 (13), Mexico 1 (1). The average number of women in the Group was 72 (67) the average number of men was 102 (103).
The Board of Directors and the President and CEO certify that this interim report provides a fair and accurate review of
the operations, financial position and earnings of the Parent Company and the Group and that it describes the material
risks and uncertainties facing the Parent Company and the companies included in the Group.
Stockholm 8 November 2017
Boule Diagnostics AB
Peter Ehrenheim Thomas Eklund Fredrik Dalborg
Chairman of the Board Board member President and CEO
Karin Dahllöf Jon Risfelt
Board member Board member

BOULE DIAGNOSTICS INTERIM REPORT 1 JANUARY–30 SEPTEMBER 2017 6
Consolidated statement of comprehensive income and other comprehensive income
Jul-Sep Jul-Sep Jan-Sep Jan-Sep
SEK million 2017 2016 2017 2016
Net sales 109.7 108.5 320.5 294.9
Cost of goods sold -52.8 -54.0 -169.4 -150.4
Gross profit 56.8 54.5 151.2 144.5
Gross margin 51.8% 50.2% 47.2% 49.0%
Other operating revenues 6.1 2.5 4.7 4.4
Selling and marketing expenses -19.6 -16.6 -62.3 -53.8
Administrative expenses -7.3 -6.8 -21.3 -21.4
Research and development expenses -7.9 -8.2 -26.8 -26.5
Other operating expenses 0.0 -0.5 -6.1 -1.5
Operating profit/loss 28.2 24.8 39.5 45.8
Operating margin 25.7% 22.9% 12.3% 15.5%
Financial income 0.7 0.0 1.7 0.0
Financial expenses -0.7 -0.1 -1.4 -0.6
Exchange rate differences -0.4 -0.1 -0.7 0.2
Net financial items -0.5 -0.2 -0.5 -0.3
Profit/loss before tax 27.8 24.6 39.0 45.5
Current tax -0.7 -0.5 -0.7 -2.5
Deferred tax -5.4 -4.8 -9.1 -8.4
Net profit/loss 21.6 19.3 29.2 34.6
Other comprehensive income
Items that may be allocated to net profit/loss for the period Translation differences for the period from the translation of foreign operations -4.0 1.6 -11.1 2.9
Other comprehensive income/loss for the period -4.0 1.6 -11.1 2.9
Total comprehensive income/loss for the period 17.6 20.9 18.1 37.5
Earnings per share, before dilution, SEK 4.51 4.11 6.09 7.34
Earnings per share, after dilution, SEK 4.48 4.02 6.04 7.19
Since the Group has no controlling influence, the entire earnings accrue to the Parent Company.

BOULE DIAGNOSTICS INTERIM REPORT 1 JANUARY–30 SEPTEMBER 2017 7
Consolidated statement of financial position
30 Sep 30 Sep 31 Dec
SEK million 2017 2016 2016
Assets
Fixed assets
Intangible assets
Capitalized development expenses 26.6 25.6 24.6
Goodwill 72.4 75.8 79.1
Total intangible assets 98.9 101.4 103.7
Tangible fixed assets
Plant and machinery 2.8 6.5 4.2
Equipment, tools, fixtures and fittings 9.9 10.8 12.0
Leasehold improvements 4.6 3.9 4.3
Total tangible fixed assets 17.3 21.2 20.5
Financial fixed assets
Long-term accounts receivables (guaranteed 75-95 % by EKN) 31.9 22.6 28.1
Deferred tax assets 0.2 0.5 0.5
Total financial fixed assets 32.1 23.1 28.6
Total fixed assets 148.3 145.7 152.8
Current assets
Inventory
Raw materials and supplies 30.8 35.6 36.1
Intermediate goods 4.5 5.9 5.5
Finished goods and goods for resale 14.6 12.1 17.6
Total inventory 49.8 53.6 59.2
Current receivables
Tax assets 2.7 2.6 1.9
Accounts receivable 57.6 56.5 53.9
Accounts receivable (guaranteed 75-95 % by EKN) 45.1 35.9 40.5
Other receivables 4.3 2.0 5.0
Prepaid expenses and accrued income 12.6 8.3 6.6
Total current receivables 122.4 105.3 107.8
Cash and cash equivalents 74.6 37.0 44.6
Total current assets 246.8 195.9 211.6
Total assets 395.1 341.6 364.3

BOULE DIAGNOSTICS INTERIM REPORT 1 JANUARY–30 SEPTEMBER 2017 8
Consolidated statement of financial position (cont.) 30 Sep 30 Sep 31 Dec
SEK million 2017 2016 2016
EQUITY
Share capital 4.8 4.7 4.7
Other contributed capital 196.1 190.6 190.6
Translation reserve 6.7 12.9 17.8
Retained earnings including net profit/loss for the period 39.5 15.1 16.6
Total equity 247.1 223.3 229.8
LIABILITIES
Long-term liabilities
Long-term interest-bearing liabilities 1.5 7.6 4.7
Long-term interest-bearing liabilities (of EKN guaranteed receivables) 26.6 15.3 22.3
Deferred tax liabilities 11.9 3.4 3.5
Total long-term liabilities 40.0 26.2 30.4
Current liabilities
Current interest-bearing liabilities 0.8 8.5 2.1
Current interest-bearing liabilities (of EKN guaranteed receivables) 33.7 24.6 28.3
Accounts payable 21.6 17.5 21.9
Tax liabilities 0.6 2.2 3.8
Other liabilities 15.5 10.0 8.6
Accrued liabilities and deferred income 34.7 28.8 38.5
Provisions 1.0 0.5 1.0
Total current liabilities 108.0 92.1 104.2
Total liabilities 148.0 118.3 134.6
Total equity and liabilities 395.1 341.6 364.3
Consolidated statement of changes of equity
Translation
reserve
Retained earnings
incl. profit/loss for period
Other contributed
capital
Total equity capital
Share
capital SEK million
Equity, opening balance, Jan. 1, 2016 4.7 190.6 10.0 -16.8 188.5
Total comprehensive income/loss for the period
Net profit/loss for the period 34.6 34.6
Other comprehensive income for the period 2.9 2.9
Total comprehensive income/loss for the period 2.9 34.6 37.6
Transactions with shareholders
Option programs 0.0
Dividends -2.8 -2.8
Equity, closing balance, Sep. 30, 2016 4.7 190.6 12.9 15.1 223.3
Equity, opening balance, Jan. 1, 2017 4.7 190.6 17.8 16.6 229.8
Total comprehensive income/loss for the period
Net profit/loss for the period 29.2 29.2
Other comprehensive income for the period -11.1 -11.1
Total comprehensive income/loss for the period -11.1 29.2 18.1
Transactions with shareholders Shares issued through the exercise of options 0.1 5.5 5.6 Option programs 0.1 0.1
Dividends -6.6 -6.6
Equity, closing balance, Sep. 30, 2017 4.8 196.1 6.7 39.5 247.1
BOULE DIAGNOSTICS INTERIM REPORT 1 JANUARY–30 SEPTEMBER 2017 9
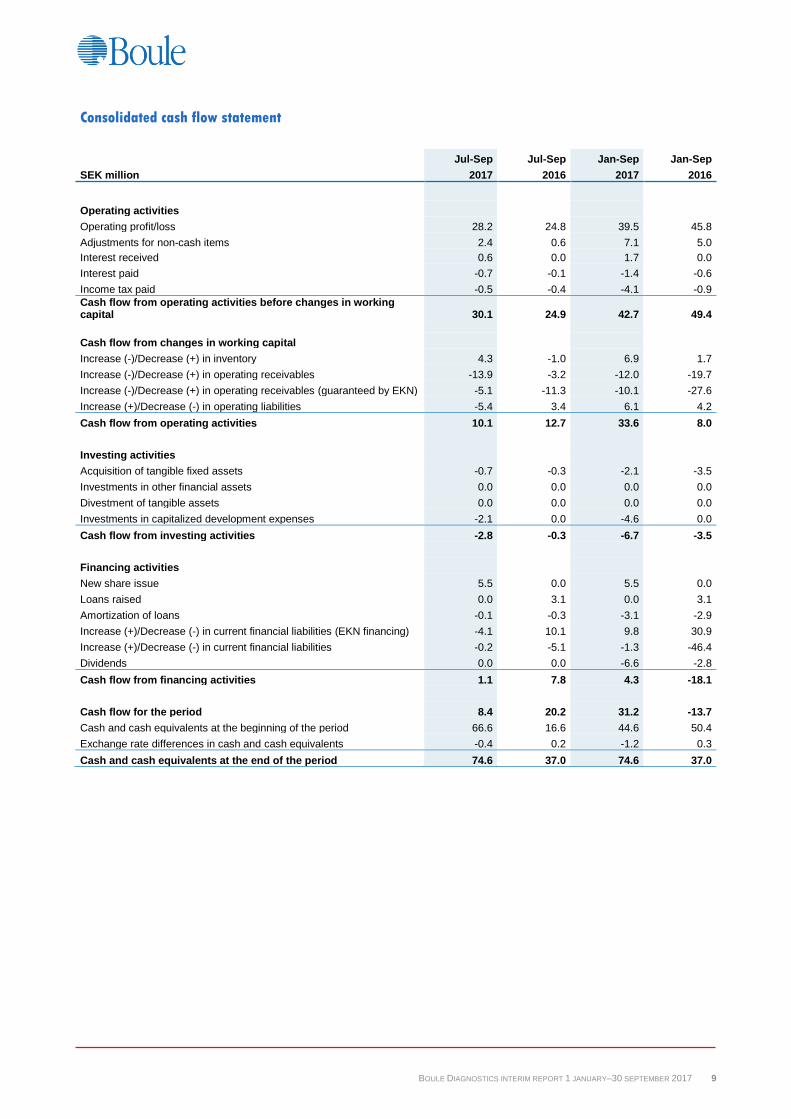
Consolidated cash flow statement
Jul-Sep Jul-Sep Jan-Sep Jan-Sep
SEK million 2017 2016 2017 2016
Operating activities
Operating profit/loss 28.2 24.8 39.5 45.8
Adjustments for non-cash items 2.4 0.6 7.1 5.0
Interest received 0.6 0.0 1.7 0.0
Interest paid -0.7 -0.1 -1.4 -0.6
Income tax paid -0.5 -0.4 -4.1 -0.9
Cash flow from operating activities before changes in working capital 30.1 24.9 42.7 49.4
Cash flow from changes in working capital
Increase (-)/Decrease (+) in inventory 4.3 -1.0 6.9 1.7
Increase (-)/Decrease (+) in operating receivables -13.9 -3.2 -12.0 -19.7
Increase (-)/Decrease (+) in operating receivables (guaranteed by EKN) -5.1 -11.3 -10.1 -27.6
Increase (+)/Decrease (-) in operating liabilities -5.4 3.4 6.1 4.2
Cash flow from operating activities 10.1 12.7 33.6 8.0
Investing activities
Acquisition of tangible fixed assets -0.7 -0.3 -2.1 -3.5
Investments in other financial assets 0.0 0.0 0.0 0.0
Divestment of tangible assets 0.0 0.0 0.0 0.0
Investments in capitalized development expenses -2.1 0.0 -4.6 0.0
Cash flow from investing activities -2.8 -0.3 -6.7 -3.5
Financing activities
New share issue 5.5 0.0 5.5 0.0
Loans raised 0.0 3.1 0.0 3.1
Amortization of loans -0.1 -0.3 -3.1 -2.9
Increase (+)/Decrease (-) in current financial liabilities (EKN financing) -4.1 10.1 9.8 30.9
Increase (+)/Decrease (-) in current financial liabilities -0.2 -5.1 -1.3 -46.4
Dividends 0.0 0.0 -6.6 -2.8
Cash flow from financing activities 1.1 7.8 4.3 -18.1
Cash flow for the period 8.4 20.2 31.2 -13.7
Cash and cash equivalents at the beginning of the period 66.6 16.6 44.6 50.4
Exchange rate differences in cash and cash equivalents -0.4 0.2 -1.2 0.3
Cash and cash equivalents at the end of the period 74.6 37.0 74.6 37.0

BOULE DIAGNOSTICS INTERIM REPORT 1 JANUARY–30 SEPTEMBER 2017 10
Parent Company income statement
SEK million Jul-Sep
2017 Jul-Sep
2016 Jan-Sep
2017 Jan-Sep
2016
Net sales 5.6 5.7 17.1 17.3
Administrative expenses -2.9 -6.6 -21.0 -17.7
Other operating income 0.0 0.0 0.0 0.0
Other operating expenses 0.0 0.0 0.0 0.0
Operating profit/loss 2.7 -0.9 -4.0 -0.4
Profit/loss from financial items 0.0 0.0 0.0 0.0
Loss after financial items 2.7 -0.9 -4.0 -0.4
Group contribution 0.0 0.0 0.0 0.0
Profit/loss before tax 2.7 -0.9 -4.0 -0.4
Tax 0.0 0.0 0.0 0.0
Net profit/loss 2.7 -0.9 -4.0 -0.4
Since no items are recognized in Other comprehensive income the Parent Company’s results correspond
to comprehensive income.

BOULE DIAGNOSTICS INTERIM REPORT 1 JANUARY–30 SEPTEMBER 2017 11
Parent Company balance sheet 30 Sep
2017 30 Sep
2016 31 Dec
2016 SEK million
Assets
Financial fixed assets
Shares in Group companies 157.3 157.3 157.3
Deferred tax asset 4.7 0.0 4.7
Total financial fixed assets 162.0 157.3 162.0
Total fixed assets 162.0 157.3 162.0
Current assets
Receivables from Group companies 42.3 26.2 52.0
Other receivables 1.8 1.5 2.0
Total current receivables 44.1 27.8 54.0
Cash and bank balances 3.0 0.8 0.4
Total current assets 47.1 28.6 54.4
Total assets 209.1 185.8 216.4
Equity and liabilities
Total equity 191.8 174.3 196.7
Long-term liabilities
Long-term interest-bearing liabilities 0.0 0.0 0.0
Current liabilities
Current interest-bearing liabilities 0.0 0.0 0.0
Liabilities to Group companies 0.6 0.6 0.6
Other liabilities 16.7 11.0 19.1
Total current liabilities 17.3 11.5 19.7
Total liabilities 17.3 11.5 19.7
Total equity and liabilities 209.1 185.8 216.4

BOULE DIAGNOSTICS INTERIM REPORT 1 JANUARY–30 SEPTEMBER 2017 12
NOTE 1 ACCOUNTING POLICYS Boule Diagnostics AB (publ.) applies IFRS (International
Financial Reporting Standards) as adopted by the EU. This
interim report has been prepared in accordance with IAS 34
Interim Financial Reporting. The interim report for the Parent
Company has been prepared in accordance with the Swedish
Annual Accounts Act. Chapter 9 and RFR 2 Accounting for
Legal Entities. The interim report should be read together with
the Annual Report for the fiscal year that ended on December
31, 2016. The accounting policies match the policies applied in
the preceding fiscal year. For all financial assets and liabilities
carrying amount is a good approximation of fair value. The
interim information found on page 1-15 is an integrated part
of this financial report.
A number of new or revised IFRS Standards, as well as
statements of interpretation of these, will come in to effect only
in the coming financial years and have not been applied in the
preparation of these financial statements. Preparations for the
implementation of IFRS 9 and IFRS 15 are ongoing.
NOTE 2
Group Parent company 30 September, SEK million 2017 2016 2017 2016 Pledged assets 133.6 119.8 85.8 83.3
Contingent liabilities 0.0 1.8 63.1 36.8

BOULE DIAGNOSTICS INTERIM REPORT 1 JANUARY–30 SEPTEMBER 2017 13
Quarterly overview
2017 2016 2015
Jul-Sep Apr-Jun Jan-Mar Oct-Dec Jul-Sep Apr-Jun Jan-Mar Oct-Dec Jul-Sep
Net sales, SEK million 109.7 104.3 106.6 105.8 108.5 102.0 84.4 88.4 88.8
Gross profit, SEK million 56.8 43.6 50.8 50.1 54.5 47.7 42.3 36.8 41.3
Gross margin, % 51.8 41.8 47.6 47.4 50.2 46.8 50.1 41.6 46.6
EBITDA, SEK million 30.2 1.4 14.1 5.7 25.5 13.3 10.4 2.7 10.5
EBITDA margin, % 27.5 1.3 13.2 5.4 23.5 13.0 12.3 3.1 11.9
EBIT, SEK million 28.2 -0.7 12.0 1.3 24.8 12.6 8.4 0.6 8.9
EBIT margin, % 25.7 -0.7 11.2 1.2 22.9 12.4 9.9 0.7 10.0
Profit after tax, SEK million 21.6 -1.1 8.7 1.5 19.3 9.0 6.3 1.3 5.1
Earnings per share before dilution, SEK 4.51 -0.24 1.84 0.32 4.11 1.91 1.33 0.28 1.07
Earnings per share after dilution, SEK 4.48 -0.24 1.79 0.31 4.02 1.89 1.33 0.27 1.07
Cash flow from operating activities per share, SEK 7.02 4.96 3.93 2.53 2.70 -0.24 1.30 2.59 2.25
Return on equity, % 9.2 -0.5 3.7 0.6 9.1 4.5 3.3 0.7 2.7
Net debt/EBIT (R12) -2.2 -1.9 -1.6 -1.2 -0.9 -0.8 -0.9 -0.7 -0.5
Equity/assets ratio, % 63 59 63 63 65 66 68 60 64
Definitions (boule.com)
USE OF KEY PERFORMANCE INDICATORS NOT DEFINED IN IFRS The Boule Group report is prepared in accordance with IFRS. IFRS only defines a few key performance indicators. Boule applies the ESMA
(European Securities and Market Authority) guidelines for alternative key performance indicators (Alternative Performance Measures). In
brief, an alternative performance measure is a financial measure of historical or future earnings development, financial position, or cash flow
that is not defined or specified in IFRS. In order to support management's and other stakeholders' analysis of the Group's development, Boule
reports some key performance indicators that are not defined in IFRS. Management believes that this information will facilitate an analysis of
the Group's development. This additional data is acts as a complement to IFRS and does not replace the key performance indicators defined
in IFRS. Boule's definitions of metrics not defined in IFRS shown on page 13 may differ from those of other companies. Calculations of all key
performance indicators may be reconciled against items in the income statement and balance sheet.
Gross profit is net sales less costs for goods sold
Gross margin is gross profit divided by net sales
EBITDA (Earnings before interest, taxes, depreciation and amortization) is profit before net financial items, taxes and
depreciation/amortization of tangible and intangible assets
EBITDA margin is EBITDA divided by net sales
EBIT (Earnings Before Interest and Taxes) is operating profit before net financial items and taxes
EBIT margin (operating margin) is EBIT divided by net sales
Working capital is inventories, accounts receivable (non-current and current) and cash less accounts payable
Interest coverage ratio is operating profit plus financial income divided by financial expenses
Net debt is interest-bearing liabilities less interest-bearing assets
Net debt/equity ratio is net debt divided by equity
Equity/assets ratio is equity divided by total assets
Return on equity is profit for the period after tax divided by average equity

BOULE DIAGNOSTICS INTERIM REPORT 1 JANUARY–30 SEPTEMBER 2017 14
About Boule Diagnostics Boule Diagnostics AB (publ) is one of the few companies on the global diagnostics market that develops, manufactures
and markets instruments and consumable products for blood diagnostics under its own direction. The company serves
hospitals, clinics, laboratories and companies within blood diagnostics in both the human and veterinary areas. The
group has an annual sale of a little over SEK 400 million and around 170 employees. Sales are made via distributors in
over 100 countries and directly in Sweden and the USA. The company operates via subsidiary operating companies in
Sweden and USA. Since 2011, Boule shares have been listed on the Nasdaq Stockholm.
VISION
Boule is to establish a global position as one of the three leading companies within
decentralized blood diagnostics.
MISSION
Boule is to help its customers obtain better blood test results to enable more effective
treatment of patients.
BUSNIESS CONCEPT
Boule develops, manufactures and markets high quality and user-friendly systems for
automated blood cell count analysis on the global human and veterinarian markets.
FINANCIAL TARGETS
Boule should achieve:
• An annual operating margin (EBIT-margin) above 15 percent.
• Average long-term growth in sales above 10 percent per year.
• Net debt (interest bearing debts minus cash and cash equivalents) no greater
than three times operating profit (EBIT) on an annualized basis.
STRATEGIES • To commercialize high quality systems for the decentralized market for blood cell
count analysis.
• To tie consumables to our proprietary instruments to assure quality and ensure
added sales.
• Global presence and parallel distribution channels to quickly meet local demand.
• Actively work to broaden our product offer via acquisition and partnerships.
Our hematology systems
Boule as an investment
BUSINESS MODEL
The model entails selling
consumables of high quality and
good profitability that are tied to
Boule’s own instruments, to a
continuously increasing installed
base of instruments.
GROWTH
Over the past five years, Boule
has enjoyed average annual
growth of 10 percent and the
company envisages continued
good growth potential at global
level. Boule has long experience
of both organic growth and growth
by acquisition.
DIVIDEND
The general goal of the Boule
board is to give shareholders a
dividend that reflects both a good
direct return and dividend growth.
The annual dividend should
correspond to 25-50 percent of
profit for the period, after taking
due consideration to company
liquidity.
BOULE DIAGNOSTICS INTERIM REPORT 1 JANUARY–30 SEPTEMBER 2017 15
Information to shareholders
CALENDAR
This information is information that Boule Diagnostics AB is obliged to make public pursuant to the EU Market Abuse Regulation. The information was
submitted for publication, through the agency of the contact person set out above, at 08.45 CET on November 8, 2017
FOR FURTHER INFORMATION, PLEASE CONTACT:
Fredrik Dalborg
CEO and President
+46-8-744 77 00
Year-end report 2018-02-16
Interim report first quarter 2018-05-14
Annual General Meeting 2018 2018-05-14
Interim report second quarter 2018-08-15
Interim report third quarter 2018-11-06
BOULE DIAGNOSTICS INTERIM REPORT 1 JANUARY–30 SEPTEMBER 2017 16
Auditor's Report
Boule Diagnostics AB (publ) Co no 556535-0252
Introduction
We have conducted a general review of the financial interim report information in the summary for Boule
Diagnostics AB (publ) as of 30 September 2017 and the nine-month period that ended on this date. It is the
responsibility of the Board of Directors and the Chief Executive Officer to prepare and present these interim
financial statements in accordance with IAS 34 and the Annual Accounts Act. Our responsibility is to express
an opinion on this interim report based on our general review.
The scope and focus of the review
We have conducted our general review in accordance with the International Standard on Review
Engagements ISRE 2410 Review of interim financial report information performed by the independent
auditor of the entity. A review consists of making inquiries, primarily of persons responsible for financial and
accounting matters, and applying analytical and other review procedures. A review has a different focus and
is substantially limited in scope compared to the focus and scope of an audit conducted in accordance with
ISA and generally accepted auditing practice. The procedures performed in a review do not enable us to
obtain a level of assurance that would make us aware of all significant circumstances that might be identified
in an audit. Therefore, the opinion expressed based on a review does not give the same level of assurance as
an opinion expressed on the basis of an audit.
Opinion
On the basis of our review, nothing has come to our attention that causes us to believe that the interim report
was not, in all material aspects, prepared for the Group's part in accordance with IAS 34 and the Annual
Accounts Act and, in the case of the parent company, the Annual Accounts Act.
Stockholm 08 November 2017
Öhrlings PricewaterhouseCoopers AB
Leonard Daun Authorized Public Accountant
Related Documents