Strong Performers and Successful Reformers in Education LESSONS FROM PISA FOR MEXICO

Welcome message from author
This document is posted to help you gain knowledge. Please leave a comment to let me know what you think about it! Share it to your friends and learn new things together.
Transcript

Strong Performers and Successful Reformers
in EducationLessons From PIsA For mexIco

The statistical data for Israel are supplied by and under the responsibility of the relevant Israeli authorities. The use of such data by the oecD is without prejudice to the status of the Golan Heights, east Jerusalem and Israeli settlements in the West Bank under the terms of international law.
Photo credits: Fotolia.com © AinoaGetty Images © John Foxx
corrigenda to oecD publications may be found on line at: www.oecd.org/publishing/corrigenda.
© oecD 2010
You can copy, download or print oecD content for your own use, and you can include excerpts from oecD publications, databases and multimedia products in your own documents, presentations, blogs, websites and teaching materials, provided that suitabele acknowledgment of oecD as source and copyright owner is given. All requests for public or commercial use and translation rights should be submitted to [email protected]. requests for permission to photocopy portions of this material for public or commercial use shall be addressed directly to the copyright clearance center (ccc) at [email protected] or the centre français d’exploitation du droit de copie (cFc) at [email protected].
This work is published on the responsibility of the secretary-General of the oecD. The opinions expressed and arguments employed herein do not necessarily reflect the official views of the organisation or of the governments of its member countries.
Please cite this publication as: oecD (2010), Strong Performers and Successful Reformers in Education: Lessons from PiSa for Mexico

Table of Contents
3STRONG PERFORMERS AND SUCCESSFUL REFORMERS IN EDUCATION: LESSONS FROM PISA FOR MEXICO © OECD 2010
ReadeR’s Guide ..........................................................................................................................................................................................................................7
ChapTEr 1 PRoGRess in Pisa.........................................................................................................................................................................................9
Introduction ................................................................................................................................................................................................................................. 10
Learning outcomes and access to education ................................................................................................................................................... 10
• Access to education of 15-year-olds ................................................................................................................................................................... 12
Highlights of Mexico’s performance trends .................................................................................................................................................... 12
• Reading ................................................................................................................................................................................................................................. 12
• Mathematics ....................................................................................................................................................................................................................... 14
• Science ................................................................................................................................................................................................................................. 18
• Student background factors and their relation to reading performance ..................................................................................... 19
• The potential benefits of improvements in student learning outcomes ....................................................................................... 21
ChapTEr 2 seeinG Mexico’s Results in a coMPaRative PeRsPective: exteRnal BenchMaRkinG ...23
Learning outcomes ................................................................................................................................................................................................................ 24
• Mean performance of Mexico’s 15-year-olds in the middle of the rankings ......................................................................... 24
• Relative shares of students ‘at risk’ ...................................................................................................................................................................... 31
• Relative shares of top performing students .................................................................................................................................................... 35
ChapTEr 3 inteRnal BenchMaRkinG: What Mexican schools can leaRn fRoM otheR Mexican schools ...............................................................................................................................................................................................................37
Introduction ................................................................................................................................................................................................................................. 38
The relationship of socio-economic indicators with performance ................................................................................................. 38
Variability in socio-economic background ....................................................................................................................................................... 40
• Different performance of schools with students of similar socio-economic backgrounds ............................................ 42
ChapTEr 4 a lonG-teRM PeRsPective foR Mexico: soMe lessons fRoM today’s toP PeRfoRMinG education systeMs .......................................................................................................................................................................45
Introduction ................................................................................................................................................................................................................................. 46
Learning from top performing education systems ....................................................................................................................................... 47
• Developing a commitment to education and acceptance among all stakeholders that all students can achieve at high levels ................................................................................................................................................................................................... 47
• Establishing ambitious, focused and coherent educational standards that are shared across the system and aligned with high stakes gateways and instructional systems ................................................................................................ 48
• Developing more capacity at the point of delivery ................................................................................................................................ 50
• Providing a work organisation in which teachers can use their potential – management, accountability and knowledge management .................................................................................................................................................................................. 53
• Institutionalising improved instructional practice ..................................................................................................................................... 54

Table of ConTenTs
4 © OECD 2010 STRONG PERFORMERS AND SUCCESSFUL REFORMERS IN EDUCATION: LESSONS FROM PISA FOR MEXICO
• Aligning incentive structures and engaging stakeholders..................................................................................................................... 55
• Extending accountability to superiors with accountability towards professional colleagues, parents and the public ............................................................................................................................................................................................................................ 56
• Investing resources where they can make the most difference ........................................................................................................ 57
• Balancing local responsibility with a capable centre with the authority and legitimacy to act ............................... 59
• Ensuring coherence of policies and practices, aligning policies across all aspects of the system, establishing coherence of policies over sustained periods of time and securing consistency of implementation ................... 60
• Ensuring an outward orientation of the system to keep the system learning and to recognise challenges and potential future threats to current success ...................................................................................................................................................... 61
An opportunity for Mexico .............................................................................................................................................................................................. 62
RefeRences ..................................................................................................................................................................................................................................65
Boxes
Box 1.A The PISA index of economic, social and cultural status (ESCS) ..................................................................................................................16
Box 2.A A context for interpreting the performance of countries ...............................................................................................................................30
Box 3.A Measuring students’ socio-economic background in PISA ..........................................................................................................................38
Box 4.A The Co-operation Agreement “Improving Education in Mexican Schools” ............................................................................................46
Figures
Figure 1.1 PISA results and enrolment for Mexico 2000 – 2009 ..........................................................................................................11
Figure 1.2 Mexico’s trends in reading and percentiles of student performance ....................................................................................13
Figure 1.3 Summary of changes in reading performance 2000 – 2009 of participating countries ........................................................14
Figure 1.4 Change in mathematics performance between 2003 and 2009 ..........................................................................................15
Figure 1.5 Relative performance and changes in performance of countries since 2003 .......................................................................17
Figure 1.6 Percentage of students performing below proficiency Level 2 in mathematics in 2003 and 2009 ......................................17
Figure 1.7 Change in science performance of participating countries between 2006 and 2009 ..........................................................18
Figure 1.8 Percentage of students performing below proficiency Level 2 in science in 2006 and 2009 ...............................................19
Figure 1.9 Relationship between students’ socio-economic background and reading performance 2000 – 2009 ................................20
Figure 1.10 Home language and reading performance of students in 2000 and 2009 ...........................................................................20
Figure 1.11 Students with an immigrant background and who speak a different language at home from the language of the assessment.. 21
Figure 2.1 How proficient are students in reading? ............................................................................................................................27
Figure 2.2 How proficient are students in mathematics? .....................................................................................................................28
Figure 2.3 How proficient are students in science? .............................................................................................................................29
Figure 2.4 Summary descriptions for the seven levels of proficiency in reading ..................................................................................32
Figure 3.1 Range of students’ socio-economic background in participating countries and economies ................................................40
Figure 3.2 Range of schools’ socio-economic background in participating countries and economies..................................................41
Figure 3.3a Distribution of student performance among Mexican students and schools in relation to ESCS index .................................42
Figure 3.3b Distribution of student performance among Mexican students and schools in relation to ESCS index (selected ranges) ......43
Figure 4.1 Total public expenditure on education, as a percentage of total public expenditure (2000, 2007) .....................................58

Table of ConTenTs
5STRONG PERFORMERS AND SUCCESSFUL REFORMERS IN EDUCATION: LESSONS FROM PISA FOR MEXICO © OECD 2010
TaBles
Table 1.1 Mexico’s mean scores in PISA assessments, annualised trends and enrolment of 15-year-olds .......................................................11
Table 1.2 Trends in enrolment of 15-year-olds in selected OECD and partner countries......................................................................................12
Table 2.1 Benchmark countries ................................................................................................................................................................................................24
Table 2.2 Performance on the 2009 PISA assessment of 15-year-olds (benchmarking) .........................................................................................25
Table 2.3 Comparison of the proportion of students at the lower end of an international scale of the economic, social and cultural background of students ............................................................................................................................................................................31
Table 2.4 Percentage of students below Level 2 and at Level 5 or above on the reading scale in PISA 2000 and 2009 ............................................................................................................................................................................................33
Table 2.5 Percentage of students at each proficiency level on the reading scale 2009 ..........................................................................................34
Table 2.6 Benchmarking averages: Proficiency levels in PISA 2009 ............................................................................................................................35
Table 3.1 Socio-economic indicators and the relationship with performance in reading .....................................................................................39


7STRONG PERFORMERS AND SUCCESSFUL REFORMERS IN EDUCATION: LESSONS FROM PISA FOR MEXICO © OECD 2010
reader’s GuideData underlying the figuresThe data referred to in this volume are presented in the volumes of the main PISA report PISA 2009 Results and, in greater detail, on the PISA website (www.pisa.oecd.org).
Five symbols are used to denote missing data:
a The category does not apply in the country concerned. Data are therefore missing.
c There are too few observations or no observation to provide reliable estimates (i.e. there are fewer than 30 students or fewer than five schools with valid data).
m Data are not available. These data were not submitted by the country or were collected but subsequently removed from the publication for technical reasons.
w Data have been withdrawn or have not been collected at the request of the country concerned.
x Data are included in another category or column of the table.
Country coverageThis publication features data on 65 countries and economies, including all 34 OECD countries and 31 partner countries and economies. The data from another 10 partner countries were collected one year later and will be published in 2011.
The statistical data for Israel are supplied by and under the responsibility of the relevant Israeli authorities. The use of such data by the OECD is without prejudice to the status of the Golan Heights, East Jerusalem and Israeli settlements in the West Bank under the terms of international law.
Calculating international averagesAn OECD average was calculated for most indicators presented in this report. The OECD average corresponds to the arithmetic mean of the respective country estimates.
Readers should, therefore, keep in mind that the term “OECD average” refers to the OECD countries included in the respective comparisons.
Rounding figuresBecause of rounding, some figures in tables may not exactly add up to the totals. Totals, differences and averages are always calculated on the basis of exact numbers and are rounded only after calculation.
All standard errors in this publication have been rounded to one or two decimal places. Where the value 0.00 is shown, this does not imply that the standard error is zero, but that it is smaller than 0.005.
Reporting student dataThe report uses “15-year-olds” as shorthand for the PISA target population. PISA covers students who are aged between 15 years 3 months and 16 years 2 months at the time of assessment and who have completed at least 6 years of formal schooling, regardless of the type of institution in which they are enrolled and of whether they are in full-time or part-time education, of whether they attend academic or vocational programmes, and of whether they attend public or private schools or foreign schools within the country.
Reporting school dataThe principals of the schools in which students were assessed provided information on their schools’ characteristics by completing a school questionnaire. Where responses from school principals are presented in this publication, they are weighted so that they are proportionate to the number of 15-year-olds enrolled in the school.

ReadeR’s Guide
8 © OECD 2010 STRONG PERFORMERS AND SUCCESSFUL REFORMERS IN EDUCATION: LESSONS FROM PISA FOR MEXICO
Focusing on statistically significant differencesThis volume discusses only statistically significant differences or changes. These are denoted in darker colours in figures and in bold font in tables.
Abbreviations used in this reportESCS PISA index of economic, social and cultural status
GDP Gross domestic product
PPP Purchasing power parity
S.D. Standard deviation
S.E. Standard error
Further documentationFor further information on the PISA assessment instruments and the methods used in PISA, see the PISA 2009 Technical Report (OECD, forthcoming) and the PISA website (www.pisa.oecd.org).
This report uses the OECD’s StatLinks service. Below each table and chart is a url leading to a corresponding Excel workbook containing the underlying data. These urls are stable and will remain unchanged over time. In addition, readers of the e-books will be able to click directly on these links and the workbook will open in a separate window, if their Internet browser is open and running.

1
9STRONG PERFORMERS AND SUCCESSFUL REFORMERS IN EDUCATION: LESSONS FROM PISA FOR MEXICO © OECD 2010
progress in pISa

1PRoGRess sinCe 2000
10 © OECD 2010 STRONG PERFORMERS AND SUCCESSFUL REFORMERS IN EDUCATION: LESSONS FROM PISA FOR MEXICO
inTRoduCTionOn 28 November 2007, President Calderon presented the Mexican government’s main strategies, objectives and performance targets in education. The first performance target established in the Education Sector Programme 2007-2012 of President Calderon’s administration was to raise student performance substantially to reach a combined country average of 435 score points in the Programme for International Student Assessment (PISA) in reading and mathematics by 2012 (SEP, 2007).
This chapter presents a summary of the trends in Mexico’s performance in PISA starting from the first assessment in 2000 to the most recent one in 2009 and considers performance in relation to the PISA target established by President Calderon for 2012. Trends regarding access to education by 15-year-olds, student performance and issues of equity indicated by the impact of socio-economic background on students’ performance in Mexico are also examined.
For reading, PISA provides trend lines since 2000, for mathematics since 2003 and for science since 2006. Mexico participated in every PISA assessment since 2000, making complete data available for the country. The number of students participating in PISA has also grown considerably during this period, rising from approximately 4 600 students in 2000 to more than 38 000 in 2009, making Mexico the country with the largest student sample. Since the 2003 PISA assessment, Mexico has also included all of the 32 federal entities in order to allow for between-state comparisons by the National Institute for the Evaluation of Education (Instituto Nacional para la Evaluación de la Educación, INEE).1
The performance gains that Mexico has achieved since President Calderon established the PISA performance target have been significant and Mexico seems well on track to meet its 2012 target. The performance target of 435 score-points considers a combined average of country mean scores for reading and mathematics, starting from a 392 score-point baseline using 2003 PISA results.2 The changes in Mexico’s performance are of significant relevance. As a case in point, the predictive power of student performance at school on subsequent success in education and on the labour market has been demonstrated by longitudinal studies in Australia, Canada and Denmark (OECD, 2010). In addition, the long-term economic value of these improvements that will accrue to Mexico as the better educated 15-year-olds progress into the labour market and become better qualified workers, could be in the order of USD 6.4 trillion over the working life of today’s 15-year-olds.3
leaRninG ouTComes and aCCess To eduCaTion In reading, Mexico’s mean performance declined between 2000 and 2003 from 422 to 400 score points, which was, in part, attributable to a significant increase in the number of 15-year-olds enrolled in schools between 2000 and 2003.4 Between 2003 and 2006 reading performance rose from 400 to 410 score points and between 2006 and 2009 from 410 to 425 score points.
In mathematics, where PISA began with the measurement of trends in 2003, the performance of Mexico rose from 385 to 406 between 2003 and 2006, and to 419 in 2009.5
As noted before, Mexico appears to be on the trajectory to meet its performance target in PISA for 2012. The performance target considers a combined average of country mean scores for reading and mathematics, starting from a 392 score-point baseline using 2003 PISA results. Mexico’s performance in the 2006 PISA assessment (combined average of 408), placed it 27 score points below the 2012 performance target, compared with 43 score points for its 2003 performance. The combined average in 2009 of Mexico’s reading and mathematics scores (422), places it 13 score points below the 2012 target, which is roughly the same level of improvement that Mexico’s combined scores show between 2006 and 2009.
In science, where PISA began with the measurement of trends in 2006, Mexico achieved 410 score points in 2006 and 416 score points in 2009. However, this increase is statistically significant only with 87% confidence, while the OECD describes changes as robust only if they are large enough to be statistically significant at a 95% confidence level.
Figure 1.1 presents the scores for Mexico in all three PISA assessments for reading, mathematics and science, in relation to the government’s performance target for 2012 for the combined average of reading and mathematics scores, and shows the percentage of enrolment of 15-year-olds for the PISA assessment years.

1PRoGRess sinCe 2000
11STRONG PERFORMERS AND SUCCESSFUL REFORMERS IN EDUCATION: LESSONS FROM PISA FOR MEXICO © OECD 2010
Note: The performance target set by the Mexican government for 2012 considers a combined average of country mean scores for reading and mathematics, starting from a 392 score-point baseline using 2003 PISA results.
Sources: PISA 2009 Results Volume V, Table V.2.1, Figure V.1.2; PISA 2000 Technical Report, Table 31; Learning for Tomorrow’s World - First Results from PISA 2003, Table A3.1; PISA 2006: Science Competencies for Tomorrow’s World, Volume 1, Table A2.1; PISA 2009 Results Volume I, Table A2.1.
• Figure 1.1 • PISA results and enrolment for Mexico 2000 – 2009
410410
406
419
375
400
425
450
PISA
Mea
n C
ount
ry S
core
435
422
400
385
425
2012 PISA Performance Target
Reading Mathematics Science Combined Average Reading and Mathematics
OECD 2009 Averages: 493Reading 496Mathematics 501Science
416
2000 2003 2006 2009 2012
2000 2003 2006 2009 2012PISA Assessment Years
50
55
60
65
70
Perc
enta
ge e
nrol
men
t
Enrolment 15-year-olds
The data show that Mexico is well on track to meeting its performance target. The 2009 PISA results for Mexico in reading and mathematics are, respectively, 10 and 16 score points below the performance target set by the government for 2012. In order to meet the performance targets established for 2012, the annualised performance trend in mathematics would need to continue for the period 2009 – 2012. For reading, if Mexico continues with the same degree of improvement between 2009 and 2012 as it did between 2006 and 2009, the performance target will be reached. Table 1.1 presents Mexico’s scores, including its combined average in reading and mathematics, the 2012 performance target, OECD averages for 2009, annualised rates based on changes in performance over time and enrolment percentages of 15-year-olds. Only the annualised rate for mathematics, however, is statistically significant.
OECD Average 2009* (S.E.)
Mean country scores for Mexico
Period of comparison
Annualised performance trends
(S.E.)2009 2006 2003 2000
Reading 493 (0.6) 425 (2.0) 410 (3.1) 400 (4.1) 422 (3.3) 9 years 0.4 (0.7)
Mathematics 496 (0.6) 419 (1.8) 406 (2.9) 385 (3.6) a 6 years 5.5 (0.8)
Science 501 (0.5) 416 (1.8) 410 (2.7) a a 3 years 2.1 (1.4)
Combined Average Scores (reading and mathematics) 422 408 392
Performance Target 2012 435
Enrolment 15-year-olds 66.24% 62.85% 58.07% 51.64%
Table 1.1 Mexico’s mean scores in PISA assessments, annualised trends and enrolment of 15-year-olds
Note: The performance target set by the Mexican government for 2012 considers a combined average of country mean scores for reading and mathematics, starting from a 392 score-point baseline using 2003 PISA results. The combined average is thus included for 2006 and 2009 PISA assessment years.
Source: PISA 2009 Results Volume V, Figure V.1.2, Table V.2.1, Table V.2.8, Table V.3.1, Table V.3.4; PISA 2000 Technical Report, Table 31; Learning for Tomorrow’s World - First Results from PISA 2003, Table A3.1; PISA 2006: Science Competencies for Tomorrow’s World, Vol. 1, Table A2.1; PISA 2009 Results Volume I, Table A2.1.

1PRoGRess sinCe 2000
12 © OECD 2010 STRONG PERFORMERS AND SUCCESSFUL REFORMERS IN EDUCATION: LESSONS FROM PISA FOR MEXICO
Table 1.2 Trends in enrolment of 15-year-olds in selected oeCd and partner countries
2000 2003 2006 2009
Pop
ula
tio
n
of 1
5-ye
ar
old
s
15-y
ear-
old
s en
rolle
d
Perc
enta
geen
rolm
ent
Pop
ula
tio
n
of 1
5-ye
ar
old
s
15-y
ear-
old
s en
rolle
d
Perc
enta
geen
rolm
ent
Pop
ula
tio
n
of 1
5-ye
ar
old
s
15-y
ear-
old
s en
rolle
d
Perc
enta
geen
rolm
ent
Pop
ula
tio
n
of 1
5-ye
ar
old
s
15-y
ear-
old
s en
rolle
d
Perc
enta
geen
rolm
ent
OEC
D Mexico 2 127 504 1 098 605 51.64% 2 192 452 1 273 163 58.07% 2 200 916 1 383 364 62.85% 2 151 771 1 425 397 66.24%
Turkey a a a 1 351 492 725 030 53.65% 1 423 514 800 968 56.27% 1 336 842 859 172 64.27%
Israel a a a a a a 122 626 109 370 89.19% 122 701 112 254 91.49%
Chile a a a a a a 299 426 255 459 85.32% 290 056 265 542 91.55%
Portugal 132 325 127 165 96.10% 109 149 99 216 90.90% 115 426 100 816 87.34% 115 669 107 583 93.01%
OECD Country Average: 95.86%
Partner Economy Average: 89.22%
Part
ners
Colombia a a a a a a 897 477 543 630 60.57% 893 057 582 640 65.24%
Indonesia a a a 4 281 895 3 113 548 72.71% 4 238 600 3 119 393 73.59% 4 267 801 3 158 173 74.00%
Panama a a a a a a a a a 57 919 43 623 75.32%
Albania a a a a a a a a a 55 587 42 767 76.94%
Brazil 3 464 330 1 841 843 53.17% 3 618 332 2 359 854 65.22% 3 390 471 2 374 044 70.02% 3 292 022 2 654 489 80.63%
Sources: PISA 2000 Technical Report, Table 31; Learning for Tomorrow’s World - First Results from PISA 2003, Table A3.1; PISA 2006, Science Competencies for Tomorrow’s World, Vol. 1, Table A2.1; PISA 2009 Results: What Students Know and Can Do - Student Performance in Reading, Mathematics and Science, Table A2.1.
access to education of 15-year-oldsBecause PISA assessments are administered to 15-year-old students in participating countries, it is possible to track trends in enrolment compared with the total population of this age group between 2000 and 2009 in participating countries. Enrolment of 15-year-olds in Mexico has increased by nearly 15 percentage points from 2000 to 2009, rising from 52% to 66%, which is the highest increase among OECD countries within that period, albeit starting from a very low level. Turkey, as the OECD country with the lowest enrolment in 2009 (after Mexico) increased its enrolment by 11 percentage points between 2003 and 2009, from 54% to 64%. However, Brazil has seen even more progress, with an increase from 53% in 2000 to 80% in 2009.
The largest three-year increase in Mexico of 15-year-olds occurred between 2000 and 2003 when enrolment increased from 52% to 58%.
Among the partner countries with the lowest enrolment, only Colombia (with 65%) had lower enrolment than Mexico in 2009. Table 1.2 presents available data for the five OECD countries and five partner countries with the lowest enrolment rates of 15-year-olds in schools (at Grade 7 or above) for the PISA 2009 assessment and for previous years.
HiGHliGHTs of mexiCo’s PeRfoRmanCe TRends When comparing trends in reading, 38 countries with valid results from the 2000 and 2009 assessments are considered.6 When comparing trends in mathematics, 39 countries with valid results from the 2003 and 2009 assessments are considered. PISA 2000 results in mathematics are not considered, since the first full assessment in mathematics took place in 2003. The first full science assessment took place in 2006. When comparing trends in science, therefore, the 56 countries with valid results from the 2006 and 2009 assessments are included. Similarly, the number of OECD countries used for OECD averages for each assessment also varies.7
readingMexico’s country mean score in reading in 2009 is 425, in 2000 it was 422 but the increase is not statistically significant and there has been an unusual pattern of a decline between 2000 and 2003 and then increases between 2003 and 2009. Since 2003, the year established as the baseline of the performance target set by the Mexican government for 2012, Mexico’s country mean score in reading has risen 25 score points in 2009, placing it 10 score points below the performance target.

1PRoGRess sinCe 2000
13STRONG PERFORMERS AND SUCCESSFUL REFORMERS IN EDUCATION: LESSONS FROM PISA FOR MEXICO © OECD 2010
Of the 38 participating countries with valid results for both the 2000 and 2009 assessments, Mexico is one of 21 countries whose differences in performance are not statistically significant for this period (9 years), while 13 countries did show significant improvements, with Peru as the most improved and with Ireland as the country with the largest decrease along with Sweden, Czech Republic and Australia. As already mentioned, however, the increase in performance for Mexico is statistically significant for the period between 2003 and 2009.
Mexico’s share of students performing below proficiency Level 2 dropped significantly by 4.0 percentage points, placing it among the 14 countries with statistically significant improvements in this area. The percentiles for Mexico’s trends in reading are presented in Figure 1.2.
2000 2003 2006 2009PISA assessments
250
300
350
400
450
500
600
Scor
e
550
Level 1a
Level 2
Level 3
Level 4
Proficiencylevels
Level 1b and
below
Sources: OECD, PISA 2000, 2003, 2006, 2009 Databases.
• Figure 1.2 •Mexico’s trends in reading and percentiles of student performance
The association of socio-economic background with performance in reading also decreased significantly for Mexico between 2000 and 2009, making it one of only nine participating countries to have improved socio-economic equity. The comparatively weak link between performance and social background, however, should be interpreted in light of the fact that a third of 15-year-olds still need to be included into schools.
The relationship between student socio-economic background and performance is captured by a slope co-efficient of the PISA index of economic, social and cultural status (ESCS) in a regression explaining student performance in reading (Box 1.A).
Figure 1.3 summarises trends in reading performance for countries with comparable results, including Mexico.8 The first column provides information on whether reading performance in PISA 2009 was above (blue), at (no colour) or below (grey) the average for OECD countries. Countries are sorted by the magnitude of change in reading performance from PISA 2000 to PISA 2009 (second column). Increases in performance are indicated in blue; decreases are indicated in grey. No colour means that there was no statistically significant change in performance. In addition, the chart highlights changes in reading performance separately for boys and girls, changes in the proportion of lowest performers (below proficiency Level 2) and in the proportion of top performers (students at proficiency Levels 5 and 6). The last column shows changes in the relationship between the socio-economic background of students and student performance, which provides an indication of whether equity in the distribution of educational opportunities has increased (when the relationship has weakened) or decreased (when the relationship has strengthened). This is treated in greater detail later in this chapter.

1PRoGRess sinCe 2000
14 © OECD 2010 STRONG PERFORMERS AND SUCCESSFUL REFORMERS IN EDUCATION: LESSONS FROM PISA FOR MEXICO
Mean score in reading 2009
Change in reading performance between 2000 to 2009
All students Boys Girls
Share of students below proficiency
Level 2
Share of students at proficiency Level 5
or above
Association of socio-economic
background with reading performance
Peru 370 43 35 50 -14.8 0.4 0.1Chile 449 40 42 40 -17.6 0.8 -7.6Albania 385 36 35 39 -13.7 0.1 -9.9Indonesia 402 31 23 39 -15.2 -6.9Latvia 484 26 28 23 -12.5 -1.2 -11.0Israel 474 22 9 35 -6.7 3.3 -8.4Poland 500 21 14 28 -8.2 1.3 -1.5Portugal 489 19 12 26 -8.6 0.6 -4.7Liechtenstein 499 17 16 17 -6.4 -0.4 -13.3Brazil 412 16 9 21 -6.2 0.8 -0.6Korea 539 15 4 25 0.0 7.2 8.5Hungary 494 14 11 17 -5.1 1.0 -4.2Germany 497 13 10 15 -4.2 -1.2 -7.7Greece 483 9 3 13 -3.1 0.6 2.0Hong Kong-China 533 8 0 17 -0.8 2.9 -8.6Switzerland 501 6 1 10 -3.6 -1.1 -2.3Mexico 425 3 1 6 -4.0 -0.5 -7.3Belgium 506 -1 0 -5 -1.2 -0.8 0.7Bulgaria 429 -1 -8 6 0.7 0.6 -4.5Italy 486 -1 -5 2 2.1 0.5 3.2Denmark 495 -2 -5 -1 -2.7 -3.4 -3.2Norway 503 -2 -5 -1 -2.5 -2.8 0.4Russian Federation 459 -2 -6 1 -0.1 -0.0 1.4Japan 520 -2 -6 3 3.5 3.6 cRomania 424 -3 -18 11 -0.9 -1.5 10.7United States 500 -5 -2 -6 -0.3 -2.4 -9.2Iceland 500 -7 -10 -6 2.3 -0.5 5.4New Zealand 521 -8 -8 -8 0.6 -3.0 4.9France 496 -9 -15 -4 4.6 1.1 7.0Thailand 421 -9 -6 -10 5.8 -0.2 -0.7Canada 524 -10 -12 -10 0.7 -4.0 -6.4Finland 536 -11 -12 -8 1.2 -4.0 5.8Spain 481 -12 -14 -10 3.3 -0.9 1.5Australia 515 -13 -17 -13 1.8 -4.9 -1.4Czech Republic 478 -13 -17 -6 5.6 -1.9 -11.4Sweden 497 -19 -24 -15 4.9 -2.2 7.7Argentina 398 -20 -15 -22 7.7 -0.7 -1.7Ireland 496 -31 -37 -26 6.2 -7.3 5.8
Mean score in reading 2009 is statistically significantly above the OECD average. Changes in reading and in the share of students at proficiency Level 5 or above are statistically significantly positive. Changes in the share of students below proficiency Level 2 and in the association of socio-economic background with reading is statistically significantly negative.
Mean score in reading 2009 is not statistically significantly different from the OECD average. Changes in reading, in the share of students at proficiency Level 5 or above, in the share of students below proficiency Level 2 and in the association of socio-economic background with reading are not statistically significantly different.
Mean score in reading 2009 is statistically significantly below the OECD average. Changes in reading and in the share of students at proficiency Level 5 or above are statistically significantly negative. Changes in the share of students below proficiency Level 2 and in the association of socio-economic background with reading is statistically significantly positive.
Countries are ranked in descending order of the change in reading performance between 2000 and 2009 for all students. Source: OECD, PISA 2009 Database, Tables V.2.1, V.2.2, V.2.4 and V.4.3.
• Figure 1.3 •Summary of changes in reading performance 2000 – 2009 of participating countries
MathematicsMexico is the country with the largest absolute change in mathematics performance with a 33 score-point increase between 2003 and 2009. Although changes in performance in mathematics are expected to be smaller than those in reading due to the shorter time period between performance results (i.e. 2003 – 2009), Mexico’s country mean score in 2009 of 419 in mathematics makes it the country with the largest change in mathematics scores.
Students in 8 of the 39 countries with comparable results in both 2003 and 2009 PISA assessments show improvements in mathematics that are statistically significant, with Mexico as the country with the largest improvement, followed by the partner country Brazil (with a 30 score point improvement), and Turkey, Greece and Portugal with improvements of above 20 score points. At the other end of the spectrum, the Czech Republic, Ireland and Sweden saw significant decreases in performance, with 24, 16 and 15 score point differences,

1PRoGRess sinCe 2000
15STRONG PERFORMERS AND SUCCESSFUL REFORMERS IN EDUCATION: LESSONS FROM PISA FOR MEXICO © OECD 2010
respectively. Figure 1.4 presents the relative changes in performance in mathematics for all 39 countries. As performance remained unchanged for most of the participating countries (22 out of 39) with a 95% confidence interval, the p-value is presented for interpretative purposes in the figure.
-25
-20
-15
-10
-5
0
5
10
15
20
25
30
35
40
p-valuein %
Mex
ico
Bra
zil
Turk
ey
Gre
ece
Port
ugal
Ital
y
Tuni
sia
Ind
one
sia
Ger
man
y
Swit
zerl
and
Serb
ia
Pola
nd
Uru
guay
Uni
ted
Sta
tes
Ho
ng K
ong
-Chi
na
Ko
rea
No
rway
Thai
land
Liec
hten
stei
n
Hun
gary
oec
d a
vera
ge –
28
Rus
sian
Fed
erat
ion
Latv
ia
Slov
ak R
epub
lic
Spai
n
Mac
ao-C
hina
Finl
and
Luxe
mb
our
g
New
Zea
land
Jap
an
Can
ada
Icel
and
Aus
tral
ia
Den
mar
k
Net
herl
and
s
Bel
gium
Fran
ce
Swed
en
Irel
and
Cze
ch R
epub
lic
0 0 1 0 0 0 0 5 4 15 29 29 33 37 46 47 48 74 97 97 98 92 78 76 67 58 28 10 27 36 7 0 1 1 5 0 0 0 0 0
Note: Statistically significant score point changes are marked in a darker tone. Countries are ranked in descending order of the score point change on the mathematical scale between 2003 and 2009. Source: OECD, PISA 2009 Database, Table V.3.1.
Scor
e po
int c
hang
e in
mat
hem
atic
s pe
rfor
man
ce
betw
een
2003
and
200
9
• Figure 1.4 •Change in mathematics performance between 2003 and 2009
Countries that show improvements in mathematics performance such as Mexico, however, can still perform well below the OECD average, while those that show a decline in performance can continue to outperform others. The relative standing of countries according to their mean performance in mathematics and the observed changes in mathematics performance are shown in Figure 1.5.
None of the top-performing countries increased their scores in mathematics, and none of the lowest-performing countries saw a decline in their performance. Mexico is one of the seven countries showing a significant improvement that scored below the OECD average both in 2003 and in 2009, while Germany is the only country that is above the OECD average and shows statistically significant improvement. Brazil and Tunisia, while being among the most improved, still score below 400 points. All of the countries that show a decline in performance started with average or above average mean scores.
Changes in mean mathematics achievement describe overall trends, but can mask changes among the lowest- and the highest-achieving students. It is therefore important to look at changes in the proportion of students reaching certain proficiency levels. The proficiency levels used in mathematics in the PISA 2009 assessment are the same as those established for mathematics when it was the major area of assessment in 2003.
Mexico is the country with the largest decrease of students performing below the baseline Proficiency Level 2 in mathematics between 2003 and 2009. In 2003, 66% of students scored below Level 2 on the mathematics scale, dropping to 51% in PISA 2009, although it is still the OECD country with the highest percentage of students performing at these levels, and the country with the fifth highest percentage out of 39 countries with comparable data. The second largest drop was seen in Turkey with slightly over 10 percentage points (from 52% to 42%), followed by Greece with a decrease of 9 percentage points (from 39% to 30%) (PISA 2009 Results Volume V, Table V.3.2).

1PRoGRess sinCe 2000
16 © OECD 2010 STRONG PERFORMERS AND SUCCESSFUL REFORMERS IN EDUCATION: LESSONS FROM PISA FOR MEXICO
Box 1.A The Pisa index of economic, social and cultural status (esCs)
The PISA index of economic, social and cultural status (ESCS) is based on students’ responses to the PISA student questionnaire and is derived from the following three indices: highest occupational status of parents, highest educational level of parents in years of education according to ISCED, and home possessions. The index of home possessions comprises all items on the indices of family wealth (WEALTH), cultural possessions (CULTPOSS) and home educational resources (HEDRES), as explained below, as well as books in the home recoded into a four-level categorical variable (0-10 books, 11-25 or 26-100 books, 101-200 or 201-500 books, more than 500 books).
WEALTH: Index based on the students’ responses on whether they had the following at home: a room of their own, a link to the Internet, a dishwasher (treated as a country-specific item), a DVD player and three other country-specific items (student questionnaire ST20); and their responses on the number of cellular phones, televisions, computers, cars and rooms with a bath or shower (student questionnaire ST21).
CULTPOSS: Index based on the students’ responses to whether they had the following at home: classic literature, books of poetry and works of art (some items in student questionnaire ST20).
HEDRES: Index based on the items measuring the existence of educational resources at home including a desk and a quiet place to study, a computer that students can use for schoolwork, educational software, books to help with students’ school work, technical reference books and a dictionary (some items in student questionnaire ST20).
The ESCS was derived from a principal component analysis of standardised variables (each variable has an OECD mean of zero and a standard deviation of one), taking the factor scores for the first principal component as measures of the index of economic, social and cultural status.
Principal component analysis was also performed for each participating country to determine to what extent the components of the index operate in similar ways across countries. The analysis revealed that patterns of factor loading were very similar across countries, with all three components contributing to a similar extent to the index. The reliability of the index ranged from 0.41 to 0.81. These results support the cross-national validity of the PISA ESCS. The imputation of components for students missing data on one component was done on the basis of a regression on the other two variables, with an additional random error component.
While across 28 OECD countries with comparable data for the 2003 and 2009 assessments, the share of students below Level 2 (i.e. less than 420 score points) remained broadly similar, with a minor decrease from 21.6% to 20.8%, some countries show significant changes. Figure 1.5 presents the percentage of students performing below proficiency Level 2 for participating countries, including Mexico, as well as relative changes between 2003 and 2009.
While none of the countries with a below-average share of lowest performers saw further reductions in their respective percentages, the share of students performing below Level 2 did increase in France, the Czech Republic, Ireland, Sweden, Belgium, Luxembourg and Iceland.
At the other end of the performance scales, the percentage of top performers (i.e. scoring above 607 score points) decreased slightly from 14.7% in 2003 to 13.4% in 2009 on average across the 28 OECD countries with comparable data. Mexico is one of the four countries that showed statistically significant increases in the percentage of top performing students, going from 0.4% in 2003 to 0.7% in 2009.9 The other three countries were Portugal with an increase by more than four percentage points to almost 10%, Italy with nearly two percentage points to 9%, and Greece with an increase of almost two percentage points to nearly 6%. Mexico, however, still has the lowest percentage of top performers in mathematics in 2009 among OECD countries and the third lowest percentage among the 39 participating countries with comparable data (after Indonesia with 0.1% and Tunisia with 0.3%) (PISA Results 2009 Volume V, Table V.3.2).

1PRoGRess sinCe 2000
17STRONG PERFORMERS AND SUCCESSFUL REFORMERS IN EDUCATION: LESSONS FROM PISA FOR MEXICO © OECD 2010
• Figure 1.6 • Percentage of students performing below proficiency Level 2 in mathematics in 2003 and 2009
Countries are ranked in ascending order of the percentage of students below proficiency Level 2 in mathematics in 2009. Source: OECD, PISA 2009 Database, Table V.3.2
0
10
20
30
40
50
60
70
80
90 2009 2003
Perc
enta
ge o
f stu
dent
s be
low
pro
ficie
ncy
Leve
l 2
Cha
nge
in th
e pe
rcen
tage
of
stud
ents
bel
ow p
rofic
ienc
y Le
vel 2
in m
athe
mat
ics
betw
een
2003
and
200
9
Finl
and
0
Ko
rea
0
Ho
ng K
ong
- Chi
na
0
Liec
hten
stei
n
0
Mac
ao- C
hina
0
Can
ada
0
Jap
an
0
Net
herl
and
s
0
Swit
zerl
and
0
New
Zea
land
0
Aus
tral
ia
0
Icel
and
+
Den
mar
k
0
No
rway
0
Ger
man
y
0
Bel
gium
+
Pola
nd
0
Irel
and
+
Slov
ak R
epub
lic
0
Swed
en
+
Hun
gary
0
Cze
ch R
epub
lic
+
Fran
ce
+
Latv
ia
0
Uni
ted
Sta
tes
0
Port
ugal
-
Spai
n
0
Luxe
mb
our
g
+
Ital
y
-
Rus
sian
Fed
erat
ion
0
Gre
ece
-
Serb
ia
0
Turk
ey
-
Uru
guay
0
Mex
ico
-
Thai
land
0
Bra
zil
-
Tuni
sia
-
Ind
one
sia
0
2009 higher than 2003
2009 lower than 2003
No statistically significant difference
95% confidence level + - 0
Mexico
Brazil
Turkey
Greece
PortugalItaly
Tunisia
GermanyIceland
Australia
Denmark
Netherlands
Belgium
France
SwedenIrelandCzech Republic
Indonesia
Switzerland
Serbia
Poland
Uruguay
United States
Hong Kong-China
Korea
Norway
Thailand
Liechtenstein
Hungary
Russian Federation
Latvia
Slovak Republic
Spain
Macao- ‐China
Finland
Luxembourg
New Zealand
JapanCanada
350
400
450
500
550
600
30 20 10 0 10 20 30 40
Score point change in mathematics between 2003 and 2009
PISA 2009 performance above OECD average Performance improved
PISA 2009 performance below OECD averagePerformance improved
PISA 2009 performance below OECD averagePerformance declined
PISA 2009 performance above OECD averagePerformance declined
OECD average - 34
• Figure 1.5 •Relative performance and changes in performance of countries since 2003
Score point change in mathematics performance between 2003 and 2009
Note: Score point changes in mathematics between 2003 and 2009 that are statistically significant are indicated in darker tone. Source: OECD, PISA 2009 Database, Table V.3.1
Mea
n sc
ore
in m
athe
mat
ics
in 2
009

1PRoGRess sinCe 2000
18 © OECD 2010 STRONG PERFORMERS AND SUCCESSFUL REFORMERS IN EDUCATION: LESSONS FROM PISA FOR MEXICO
scienceTrends in science performance are derived by comparing results from PISA 2009 with those from the PISA 2006 assessment. Thus, there are 56 participating countries for which comparable data are available in both PISA assessments, including 33 OECD countries. The PISA 2006 mean for OECD countries was set at 500 and the standard deviation was set at 100, establishing the scale against which science performance in PISA 2009 is compared. Several countries showed marked changes in science performance (PISA Results 2009 Volume V, Table V.3.4).
In science, where PISA began with the measurement of trends in 2006, Mexico achieved 410 score points in 2006 and 416 score points in 2009. However, this increase is statistically significant only with 87% confidence, while the OECD reports changes as robust only if they are large enough to be statistically significant at a 95% confidence level.The same is true for 40 other countries where any observed differences were not statistically significant at a 95% confidence level. Figure 1.7 provides the p-value, which allows the reader to interpret the score point differences.
-20
-15
-10
-5
0
5
10
15
20
25
30
35
p-valuein %
Note: Statistically significant score point changes are marked in a darker tone. Countries are ranked in descending order of the score point change in science performance between 2006 and 2009. Source: OECD, PISA 2009 Database, Table V.3.4
• Figure 1.7 •Change in science performance of participating countries between 2006 and 2009
Q
atar
0Tu
rkey
0Po
rtug
al0
Ko
rea
0Tu
nisi
a0
Bra
zil
0C
olo
mb
ia1
Ital
y0
No
rway
1U
nite
d S
tate
s3
Pola
nd2
Ro
man
ia10
Arg
enti
na23
Chi
le11
Jap
an14
Kyr
gyzs
tan
12Se
rbia
12H
ong
Ko
ng- C
hina
13M
exic
o13
Bul
gari
a56
Swit
zerl
and
31Ic
elan
d15
Ger
man
y38
Latv
ia38
Thai
land
34Li
thua
nia
47D
enm
ark
47Fr
ance
59o
ecd
ave
rage
– 3
324
Slov
ak R
epub
lic70
N
ew Z
eala
nd72
Isra
el86
Aus
tral
ia93
Mac
ao- C
hina
94Sp
ain
97Ir
elan
d95
Uru
guay
84U
nite
d K
ingd
om
80R
ussi
an F
eder
atio
n83
Hun
gary
79Li
echt
enst
ein
70Lu
xem
bo
urg
43N
ethe
rlan
ds
69G
reec
e57
Esto
nia
43B
elgi
um39
Can
ada
11Jo
rdan
21C
roat
ia13
Slov
enia
2Sw
eden
6A
zerb
aija
n6
Finl
and
2M
ont
eneg
ro0
Ind
one
sia
14C
hine
se T
aip
ei2
Cze
ch R
epub
lic2
Scor
e po
int c
hang
e in
sci
ence
per
form
ance
bet
wee
n 20
06 a
nd 2
009
Eleven of the 56 countries that have comparable results in both 2006 and 2009 show increases in student performance, including 7 out of 33 OECD countries. Turkey increased its performance by 30 score points, and Portugal, Korea, Italy, Norway, the United States and Poland by between 10 and 19 score points. Among the partner countries, Qatar increased its performance by 30 score points, and Tunisia, Brazil and Colombia by 14 or 15 score points. Conversely, 3 OECD countries presented significant decreases in mean country scores in science: Czech Republic (decrease of 12 score points), Finland (9 score points) and Slovenia (7 score points).
In a number of countries, the share of the lowest performers in science decreased between 2006 and 2009. In Turkey the proportion of students performing below Level 2 decreased by 17 percentage points, from 47% to 30%. This is the largest reduction among all countries. Chile saw a reduction in the percentage of lowest performers by seven percentage points and now 32% of students in Chile perform below proficiency Level 2 in science. Italy now shows 21% of students below Level 2, a 5 percentage point decrease since 2006. In the United States and Iceland, 18% of students now perform below Level 2, a decrease of 6 percentage points in the United States and 3 percentage points in Iceland. In Mexico, the percentage of students below Level 2 decreased by four percentage points to 47%, but it is still the highest among OECD countries (Figure 1.8).

1PRoGRess sinCe 2000
19STRONG PERFORMERS AND SUCCESSFUL REFORMERS IN EDUCATION: LESSONS FROM PISA FOR MEXICO © OECD 2010
• Figure 1.8 •Percentage of students performing below proficiency Level 2 in science in 2006 and 2009
Countries are ranked in ascending order of the percentage of students below proficiency Level 2 in science in 2009. Source: OECD, PISA 2009 Database, Table V.3.5
Finl
and
+
Ko
rea
-
Ho
ng K
ong
-Chi
na
0
Esto
nia
0
Can
ada
0
Mac
ao-C
hina
0
Jap
an
0
Chi
nese
Tai
pei
0
Liec
hten
stei
n
0
Aus
tral
ia
0
Pola
nd
-
Net
herl
and
s
0
New
Zea
land
0
Swit
zerl
and
0
Hun
gary
0
Latv
ia
0
Slov
enia
0
Ger
man
y
0
Uni
ted
Kin
gdo
m
-
Irel
and
0
No
rway
-
Port
ugal
-
Den
mar
k
0
Lith
uani
a
-
Cze
ch R
epub
lic
-Ic
elan
d-
Bel
gium
0
Uni
ted
Sta
tes
-
Spai
n
0
Cro
atia
0
Swed
en
+
Slov
ak R
epub
lic
0
Fran
ce
0
Ital
y
-
Rus
sian
Fed
erat
ion
0
Luxe
mb
oug
0
Gre
ece
0
Turk
ey
-
Chi
le
-
Isra
el
0
Serb
ia
-
Bul
gari
a
0
Ro
man
ia
0
Uru
guay
0
Thai
land
0
Jord
an
0
Mex
ico
-
Arg
enti
na
0
Mo
nten
egro
+
Tuni
sia
-
Co
lom
bia
-
Bra
zil
-
Qat
ar
-
Ind
one
sia
0
Aze
rbai
jan
0
Kyr
gyst
an
-
10
0
20
30
40
50
60
70
80
90
100 2009 2006
Perc
enta
ge o
f stu
dent
s be
low
pro
ficie
ncy
Leve
l 2
Cha
nge
in th
e pe
rcen
tage
of s
tude
nts
belo
w p
rofic
ienc
y Le
vel 5
or
abov
e in
sc
ienc
e be
twee
n 20
06 a
nd 2
009
2009 higher than 2006
2009 lower than 2006
No statistically significant difference
95% confidence level + - 0
At the other end of the performance spectrum, the percentage of students performing at Level 5 or higher (i.e. 626 score points and higher) remained relatively unchanged in all but 7 of the 56 OECD and partner participating countries. Among these, five participating economies showed statistically significant decreases (Canada with 2.3 percentage points, Slovenia with 3 percentage points, Chinese Taipei with 5.8 percentage points, the Czech Republic with 3.2 percentage points and Chile with 0.8 percentage points), and only Italy and Qatar increased their percentages of top-performing students in science from 4.6% to 5.8% and from 0.3% to 1.4%, respectively. Although Mexico had the same percentage of top performers as Qatar in 2006 (0.3%), its share of top performers remained unchanged in 2009. Mexico is still the OECD country with the smallest percentage of top performers in science, and is one of 12 countries out of the participating 56 economies with comparable data with less than 1.0% of students performing at top levels.
student background factors and their relation to reading performanceBetween 2000 and 2009 the socio-economic background of Mexican students has remained broadly similar. (PISA 2009 Results Volume V, Table V.4.2). However, the impact that the socio-economic background of students has on their learning outcomes decreased significantly in Mexico, showing improved equity in the distribution of learning opportunities. Figure 1.9 presents the relationship of socio-economic background (as measured by the PISA economic, social and cultural status index) with student performance.
With regards to the association of socio-economic background on performance between schools, Mexico is one of eight participating countries that show significant decreases in the impact of socio-economic background across schools. In other words, socio-economic inequalities between Mexican schools have also declined. Figure 1.11 presents the changes observed for this period in the relationship of socio-economic background on reading performance between and within schools.
Data for Mexico show that the performance gap between native students and students with an immigrant background remains considerable (at a 99 score point difference with a standard error of 7.5) and remained unchanged between 2000 and 2009 (see PISA Results 2009 Volume V, Table V.4.4). Mexico is one of 11 countries where the percentage of students who speak a different language at home, most of the time, from the language of the assessment, increased between 2000 and 2009 (from 2% to 3% for Mexico). The performance gap, however, with students who speak the same language at home as the language of the assessment remained largely unchanged during the same period, although it was rather high to begin with: A 71 score point difference in 2000 (compared with 95 score points in 2009). In fact, in 2009, the score point difference in Mexico was the third highest among the 32 countries with comparable performance data.

1PRoGRess sinCe 2000
20 © OECD 2010 STRONG PERFORMERS AND SUCCESSFUL REFORMERS IN EDUCATION: LESSONS FROM PISA FOR MEXICO
0
10
20
30
40
50
60
70
Scor
e po
int d
iffer
ence
ass
ocia
ted
with
one
uni
t inc
reas
e in
the
PISA
inde
x of
eco
nom
ic, s
ocia
l and
cul
tura
l sta
tus
• Figure 1.9 •Relationship between students’ socio-economic background and reading performance 2000 – 2009
New
Zea
land
0
Bul
gari
a
0
Hun
gary
0
Bel
gium
0
Aus
tral
ia
0
Cze
ch R
epub
lic
-
Ger
man
y
-
Swed
en
+
Isra
el
0
Uni
ted
Sta
tes
-
Peru
0
Swit
zerl
and
0
Arg
enti
na
0
Irel
and
0
Po
land
0
oec
d a
vera
ge –
26
0
Rus
sian
Fed
erat
ion
0
Den
mar
k
0
Ro
man
ia
+ N
orw
ay0
Gre
ece
0
Ital
y
0
Ko
rea
+
Can
ada
-
Chi
le
-
Alb
ania
-
Finl
and
+
Port
ugal
0
Sp
ain
0
Latv
ia
-
Bra
zil
0
Icel
and
+
Liec
hten
stei
n
0
Mex
ico
-
Tha
iland
0
Ho
ng K
ong
- Chi
na
-
Ind
one
sia
0
Cha
nge
in th
e re
latio
nshi
p be
twee
n th
e so
cio-
econ
omic
bac
kgro
und
and
read
ing
perf
orm
ance
be
twee
n 20
00 a
nd 2
009
2009 higher than 2000
2009 lower than 2000
No statistically significant difference
95% confidence level + - 0
2009 2000
Countries are ranked in descending order of the overall association of the socio-economic background in 2009. Source: OECD, PISA Database 2009, Table V.4.3
-40
-20
0
20
40
60
80
100
120
Scor
e po
int d
iffer
ence
• Figure 1.10 •Home language and reading performance of students in 2000 and 2009
Note: Statistically significant score point differences are marked in a darker tone. Countries are ranked in descending order of the performance difference between students who speak at home a language that is different from the language of assessment and those who speak at home the language of assessment in 2009. Source: OECD, PISA 2009 Database, Table V.4.5
2009 higher than 2000
2009 lower than 2000
No statistically significant difference
95% confidence level + - 0
20002009
Cze
ch R
epub
lic
0
Ind
one
sia
0
Aus
tral
ia
0
Isra
el
0
Spai
n
0
Latv
ia
0
Can
ada
-
Thai
land
0
Alb
ania
0
Port
ugal
0
Irel
and
+
Uni
ted
Sta
tes
-
Bel
gium
+
Swit
zerl
and
-
Rus
sian
Fed
erat
ion
0
New
Zea
land
0
No
rway
0
Ger
man
y
-
Ho
ng K
ong
- Chi
na
0
Bra
zil
0
Liec
hten
stei
n
0
Finl
and
0
Ital
y
0
Den
mar
k
0
Ro
man
ia
+
Icel
and
0
Fran
ce
0
Swed
en
0
Gre
ece
0
Mex
ico
0
Bul
gari
a
0
Peru
0
Cha
nge
in p
erfo
rman
ce d
iffer
ence
bet
wee
n st
uden
ts
who
spe
ak a
t hom
e a
lang
uage
that
is d
iffer
ent f
rom
th
e la
ngua
ge o
f ass
essm
ent a
nd th
ose
who
spe
ak a
t ho
me
the
lang
uage
of a
sses
smen
t
Students who speak the language of instruction at home perform better

1PRoGRess sinCe 2000
21STRONG PERFORMERS AND SUCCESSFUL REFORMERS IN EDUCATION: LESSONS FROM PISA FOR MEXICO © OECD 2010
• Figure 1.11 •Students with an immigrant background and who speak a different language at home
from the language of the assessment
Countries are ranked in descending order of the association between socio-economic background and reading performance between schools in 2009. Source: OECD, PISA 2009 Database, Table V.4.3
60
40
20
0
20
40
60
80
100
120
140
160
Scor
e po
int d
iffer
ence
ass
ocia
ted
with
one
uni
t inc
reas
e in
the
stud
ent-
leve
l PIS
A in
dex
of e
cono
mic
, soc
ial a
nd c
ultu
ral s
tatu
s
C
zech
Rep
ublic
-
0
Ger
man
y
0
0
Liec
hten
stei
n
0
0
Bel
gium
0
-
Isra
el
0
0
Bul
gari
a
0
0
Hun
gary
0
0
Arg
enti
na
0
0
Ital
y
0
0
Swit
zerl
and
0
0
Aus
tral
ia
0
+
Uni
ted
Sta
tes
0
0
oec
d a
vera
ge –
26
+
+
Ko
rea
+
0
New
Zea
land
0
0
Peru
0
0
Bra
zil
0
0
Irel
and
0
0
Swed
en
+
0
Chi
le
0
0
Gre
ece
0
-
Den
mar
k
0
0
Ro
man
ia
+
0
Port
ugal
0
-
Alb
ania
0
0R
ussi
an F
eder
atio
n
+
-H
ong
Ko
ng- C
hina
0
0
Can
ada
-
-
No
rway
0
0
Latv
ia
0
-
Mex
ico
0
-
Pola
nd
+
-
Ind
one
sia
0
0
Spai
n
0
0
Finl
and
+
0
Tha
iland
0
0
Icel
and
+
0
Relationship between socio-economic background and reading performance,
between schools
Relationship between socio-economic background and
reading performance, within schools Cha
nge
in th
e re
latio
nshi
p be
twee
n so
cio-
econ
omic
bac
kgro
und
and
read
ing
perf
orm
ance
between schoolswithin schools
Between schools in 2009
Within schools in 2009
Between schools in 2000
Within schools in 2000
2009 higher than 2000
2009 lower than 2000
No statistically significant difference
95% confidence level + - 0
The potential benefits of improvements in student learning outcomesEven in the face of limited public budgets, the value and potential benefits of improving student learning outcomes as they translate into innovation, productivity gains and long-term economic growth for a country far outweigh the costs. A recent OECD study conducted in collaboration with the Hoover Institute at Stanford University uses economic modelling to quantify the costs of low-performing educational systems, and the potential benefits of improvements (OECD, 2010a). The study suggests that even a relatively modest improvement of 25 score points in average PISA scores over the next 20 years – by 2030 – could represent a gain of USD 4.8 trillion for Mexico, over the lifetime of the generation born in 2010 (expressed in real present value of projected improvements in GDP) (OECD, 2010).
This should also be considered in light of Mexico’s increases in PISA scores for the period 2003 to 2009, for example, which show improvements of 25 score points in reading and more than 30 score points in mathematics. Improvements in student learning outcomes not only have large potential benefits in terms of long-term wellbeing for countries, PISA results show that improvement is possible.

1PRoGRess sinCe 2000
22 © OECD 2010 STRONG PERFORMERS AND SUCCESSFUL REFORMERS IN EDUCATION: LESSONS FROM PISA FOR MEXICO
Notes
1. INEE is producing a PISA country report in spanish entitled Mexico en PISA 2009 (INEE, 2010) which also includes a review of state-level performance.
2. The 392 score point baseline corresponds to the simple rounded average of Mexico’s country mean scores in PISA for 2003 in reading (399.72) and mathematics (385.22). For this reason, the average of scores for reading and mathematics are used as a metric in this chapter.
3. This is based on the assumptions presented in the OECD report The High Cost of Low Educational Performance (OECD, 2010a), Table C1, and a linear relationship between the 33 score-point improvement of Mexico’s country mean score in mathematics and GDP increases calculated in the report.
4. Between 2000 and 2009 Mexico made significant gains in the access of 15-year-olds to education. The period of 2000 to 2003 corresponds to the largest three-year increase in enrolment of 15-year-olds in Mexico during this time, going from 52% to 58% of the total population of this age group.
5. Because of rounding errors, the improvement for the period 2003 to 2009 in mathematics is identified as 33 score points, not 34 as would be suggested by rounded figures.
6. Establishing performance trends in international assessments of education implies certain degrees of measurement errors and wider confidence intervals. A discussion of the methodology used for trends in PISA results, including linking error and countries excluded from the comparisons, is presented in Annex A1 of PISA 2009 Results Volume V.
7. Variation in OECD averages used for reference: The varying number of OECD countries participating in successive PISA assessments since 2000 is reflected through separate OECD averages that provide reference points for trend comparisons. For reading, the main reference is the OECD average for the 26 OECD countries that participated in both PISA 2000 and PISA 2009, while for comparisons involving all 4 assessments, the average for the 23 OECD countries that participated in all 4 assessments is also provided. For mathematics, trends can be calculated for the OECD average in 28 OECD countries that have valid results for both PISA 2003 and PISA 2009. Thirty-three OECD countries have valid results for the 2006 and 2009 assessments in science.
8. When comparing trends in reading, 38 countries with valid results from the 2000 and 2009 assessments are considered. When comparing trends in mathematics, 39 countries with valid results from the 2003 and 2009 assessments are considered. PISA 2000 results in mathematics are not considered, since the first full assessment in mathematics took place in 2003. The first full science assessment took place in 2006. When comparing trends in science, therefore, the 56 countries with valid results from the 2006 and 2009 assessments are included.
9. This should be considered in the context of the large sample size for Mexico in 2009 (38 250 participating students).

2
23STRONG PERFORMERS AND SUCCESSFUL REFORMERS IN EDUCATION: LESSONS FROM PISA FOR MEXICO © OECD 2010
Seeing Mexico’s results in a Comparative perspective: External Benchmarking

2seeinG mexiCo’s ResulTs in a ComPaRaTiVe PeRsPeCTiVe: exTeRnal benCHmaRKinG
24 © OECD 2010 STRONG PERFORMERS AND SUCCESSFUL REFORMERS IN EDUCATION: LESSONS FROM PISA FOR MEXICO
This chapter compares Mexico with three groups of countries in terms of their performance on PISA and other OECD benchmarks. The first group are the OECD countries, the second group are G20 countries with available data and the third group are countries with a level of GDP per capita similar to that of Mexico. Table 2.1 presents these groups of countries.
Since the focus of the PISA 2009 assessment was on reading, results on reading are examined in greater detail than results in mathematics and science. Unless noted otherwise, references to tables and figures refer to OECD’s PISA 2009 report.
Table 2.1 benchmark countries
Criteria Countries
OECD Countries
Australia, Austria, Belgium, Canada, Chile, Czech Republic, Denmark, Finland, France, Germany, Greece, Hungary, Iceland, Ireland, Israel, Italy, Japan, Korea, Luxembourg, Mexico, Netherlands, New Zealand, Norway, Poland, Portugal, Slovak Republic, Spain, Sweden, Switzerland, Turkey, United Kingdom, United States
Partner countries and economies in 2009 (when data is available)
Albania, Argentina, Azerbaijan, Brazil, Bulgaria, Colombia, Costa Rica, Croatia*, Georgia*, Himachal-Pradesh India*, Hong Kong-China, Indonesia, Jordan, Kazakhstan, Kyrgyzstan, Latvia, Liechtenstein, Lithuania, Macao-China, Malaysia*, Malta*, Mauritius, Miranda-Venezuela*, Montenegro, Netherlands-Antilles*, Panama, Peru, Qatar, Romania, Russian Federation, Serbia, Shanghai-China, Singapore, Tamil Nadu-India*, Chinese Taipei, Thailand, Trinidad and Tobago, Tunisia, Uruguay, United Arab Emirates*, Viet Nam*
G20 countries (when data is available)
Argentina, Australia, Brazil, Canada, China, France, Germany, India, Indonesia, Italy, Japan, Mexico, Russia, Saudi Arabia, South Africa, Korea, Turkey, United Kingdom, United States, (European Union)
Countries with similar level of GDP per capita Argentina, Brazil, Chile, Croatia, Estonia, Hungary, Latvia, Lithuania, Mexico, Poland, Romania, Russian Federation, Trinidad and Tobago, Turkey
*These partners and economies carried out the PISA assessment in 2010 instead of 2009.
leaRninG ouTComes
Mean performance of Mexico’s 15-year-olds in the middle of the rankings Table 2.2 sets out Mexico’s performance on PISA. There is, of course, significant performance variability within Mexico, including between and within individual states. Mexico measured the performance of states individually on PISA 2009. Among the 15 G20 countries with data from PISA, Mexico ranks 12th in reading, mathematics and science. Among the 14 benchmarking countries with a similar level of GDP per capita, Mexico ranks 10th in reading, 11th in mathematics and 11th in science.
As described in Chapter 1, Mexico has seen significant performance gains in mathematics since 2003, which were mainly driven by improvements at the bottom of the performance distribution (visible in higher performance at the bottom 10th and 25th percentiles) while performance remained largely unchanged at the top end of the performance distribution. Student performance in reading and science has remained broadly unchanged since 2000 and 2006, respectively, when PISA began to measure these trends.
Average performance should also be seen against a range of socio-economic background indicators, most of which give Mexico a significant disadvantage compared with other industrialised countries (see Table 3.1 in the next chapter and Box 2.1 in PISA 2009 Results).

2seeinG mexiCo’s ResulTs in a ComPaRaTiVe PeRsPeCTiVe: exTeRnal benCHmaRKinG
25STRONG PERFORMERS AND SUCCESSFUL REFORMERS IN EDUCATION: LESSONS FROM PISA FOR MEXICO © OECD 2010
[Part 1/2]
Table 2.2 Performance on the 2009 Pisa assessment of 15-year-olds (benchmarking)
GdP per capita (in equivalent
usd converted
using PPPs) escs
Reading Mathematics science
Mean performance
all countries/economies lower rank
all countries/economies upper rank
Mean performance
all countries/economies lower rank
all countries/economies upper rank
Mean performance
all countries/economies lower rank
all countries/economies upper rank
oec
d Australia 37 615 0.34 515 10 8 514 17 13 527 11 7Austria 36 839 0.06 470 41 36 496 28 20 494 36 25Belgium 34 662 0.20 506 14 10 515 17 13 507 24 18Canada 36 397 0.50 524 7 5 527 12 9 529 10 7Chile 14 106 -0.57 449 44 44 421 51 47 447 45 43Czech Republic 23 995 -0.09 478 37 31 493 31 22 500 29 21Denmark 36 326 0.30 495 26 18 503 21 18 499 30 22Estonia 20 620 0.15 501 21 11 512 14 14 528 11 7Finland 35 322 0.37 536 4 2 541 7 4 554 3 2France 32 495 -0.13 496 27 14 497 28 19 498 33 22Germany 34 683 0.18 497 26 14 513 13 13 520 15 10Greece 27 793 -0.02 483 37 27 466 40 38 470 41 39Hungary 18 763 -0.20 494 27 16 490 34 23 503 27 19Iceland 36 325 0.72 500 19 12 507 19 17 496 32 26Ireland 44 381 0.05 496 27 15 487 35 28 508 23 16Israel 26 444 -0.02 474 40 33 447 44 42 455 43 42Italy 31 016 -0.12 486 31 27 483 36 32 489 37 32Japan 33 635 -0.01 520 9 5 529 12 8 539 6 4Korea 26 574 -0.15 539 4 2 546 6 3 538 7 4Luxembourg 82 456 0.19 472 39 36 489 33 28 484 39 37Mexico 14 128 -1.22 425 49 46 419 51 49 416 51 50Netherlands 39 594 0.27 508 16 8 526 13 8 522 16 7New Zealand 27 020 0.09 521 9 6 519 14 12 532 9 6Norway 53 672 0.47 503 18 10 498 26 19 500 29 21Poland 16 312 -0.28 500 22 11 495 29 21 508 22 17Portugal 22 638 -0.32 489 31 23 487 36 28 493 36 27Slovak Republic 20 270 -0.09 477 37 32 497 28 19 490 37 29Slovenia 26 557 0.07 483 33 30 501 21 19 512 19 16Spain 31 469 -0.31 481 35 30 483 36 32 488 37 32Sweden 36 785 0.33 497 26 13 494 30 21 495 34 25Switzerland 41 800 0.08 501 21 11 534 9 6 517 17 12Turkey 13 362 -1.16 464 43 39 445 44 41 454 44 42United Kingdom 34 957 0.20 494 27 19 492 31 23 514 19 14United States 46 434 0.17 500 25 11 487 36 26 502 29 19oecd average 32 219 493 496 501
Part
ners Albania 3 459 -0.95 385 60 59 377 61 57 391 60 58
Argentina 6 645 -0.62 398 59 55 388 58 55 401 59 53Azerbaijan 3 851 -0.64 362 64 63 431 47 45 373 64 62Brazil 7 185 -1.16 412 54 51 386 58 55 405 56 52Bulgaria 5 163 -0.11 429 50 45 428 51 45 439 47 44Colombia 4 684 -1.15 413 55 50 381 59 56 402 58 53Croatia 13 200 -0.18 476 39 33 460 40 39 486 39 33Dubai (UAE) 47 565 0.42 459 43 41 453 42 41 466 41 40Hong Kong-China 29 898 -0.80 533 4 3 555 4 3 549 3 2Indonesia 1 924 -1.55 402 58 54 371 63 59 383 62 59Jordan 2 997 -0.57 405 58 53 387 58 55 415 52 50Kazakhstan 6 772 -0.51 390 60 58 405 54 53 400 58 53Kyrgyzstan 726 -0.65 314 65 65 331 65 65 330 65 65Latvia 12 638 -0.13 484 34 27 482 37 32 494 35 25Liechtenstein 123 970 0.09 499 23 11 536 9 5 520 16 10Lithuania 11 584 -0.05 468 41 38 477 38 36 491 37 28Macao-China 36 249 -0.70 487 30 27 525 12 10 511 19 16Montenegro 5 909 -0.24 408 56 53 403 54 53 401 58 54Panama 5 920 -0.81 371 64 61 360 64 62 376 64 60Peru 3 771 -1.31 370 64 61 365 64 61 369 64 62Qatar 62 451 0.51 372 63 61 368 63 61 379 62 60Romania 7 856 -0.34 424 50 46 427 49 45 428 49 47Russian Federation 9 149 -0.21 459 43 41 468 39 38 478 40 38Serbia 5 336 0.07 442 46 45 442 44 42 443 46 44Shanghai-China -0.49 556 1 1 600 1 1 575 1 1Singapore 38 523 -0.43 526 6 5 562 2 2 542 6 4Chinese Taipei -0.33 495 27 17 543 7 4 520 15 11Thailand 3 689 -1.31 421 51 47 419 52 48 425 49 47Trinidad and Tobago 15 738 -0.58 416 52 50 414 52 51 410 53 51Tunisia 3 483 -1.20 404 58 54 371 63 59 401 58 53Uruguay 7 206 -0.70 426 50 46 427 49 45 427 49 47Average 16 812 432 437 440
Countries similar to Mexico in GDP, OECD and Partner Countries within 0.5 S.D.
Countries below -1 in ESCS
Notes: Data available only. GDP for Partner Countries, South Arabia and South Africa from World Bank Database. Indicator: GDP per capita (current USD) Year 2007. Source: PISA 2009 Results, Table I.2.20, Figures I.3.b, I.2.16, I.3.11 and I.3.22. Education at a Glance 2010, Table X2.1. Catalog Source: World Development Indicators

2seeinG mexiCo’s ResulTs in a ComPaRaTiVe PeRsPeCTiVe: exTeRnal benCHmaRKinG
26 © OECD 2010 STRONG PERFORMERS AND SUCCESSFUL REFORMERS IN EDUCATION: LESSONS FROM PISA FOR MEXICO
[Part 2/2]
Table 2.2 Performance on the 2009 Pisa assessment of 15-year-olds (benchmarking)GdP per capita (in equivalent
usd converted
using PPPs) escs
Reading Mathematics science
Mean performance
all countries/economies lower rank
all countries/economies upper rank
Mean performance
all countries/economies lower rank
all countries/economies upper rank
Mean performance
all countries/economies lower rank
all countries/economies upper rank
G20
Argentina 6 645 -0.62 398 59 55 388 58 55 401 59 53Australia 37 615 0.34 515 10 8 514 17 13 527 11 7Brazil 7 185 -1.16 412 54 51 386 58 55 405 56 52Canada 36 397 0.50 524 7 5 527 12 9 529 10 7China a a a a a a a a a a aFrance 32 495 -0.13 496 27 14 497 28 19 498 33 22Germany 34 683 0.18 497 26 14 513 13 13 520 15 10India a a a a a a a a a a aIndonesia 924 -1.55 402 58 54 371 63 59 383 62 59Italy 31 016 -0.12 486 31 27 483 36 32 489 37 32Japan 33 635 -0.01 520 9 5 529 9 5 539 6 4Mexico 14 128 -1.22 425 49 46 419 51 49 416 51 50Russian Federation 149 -0.21 459 43 41 468 39 38 478 40 38Saudi Arabia a a a a a a a a a a aSouth Africa a a a a a a a a a a aKorea 26 574 -0.15 539 4 2 546 6 3 538 7 4Turkey 13 362 -1.16 464 43 39 445 44 41 454 44 42United Kingdom 34 957 0.20 494 27 19 492 31 23 514 19 14United States 46 434 0.17 500 25 11 487 36 26 502 29 19Average (Countries with PISA results -15)
21 318 475 471 480
cou
ntri
es w
ith
sim
ilar
leve
l of
econ
omic
dev
elop
men
t Argentina 645 -0.62 398 59 55 388 58 55 401 59 53Brazil 7 185 -1.16 412 54 51 386 58 55 405 56 52Chile 14 106 -0.57 449 44 44 421 51 47 447 45 43Croatia 13 200 -0.18 476 39 33 460 40 39 486 39 33Estonia 20 620 0.15 501 21 11 512 14 14 528 11 7Hungary 18 763 -0.20 494 27 16 490 34 23 503 27 19Latvia 12 638 -0.13 484 34 27 482 37 32 494 35 25Lithuania 11 584 -0.05 468 41 38 477 38 36 491 37 28Mexico 14 128 -1.22 425 49 46 419 51 49 416 51 50Poland 16 312 -0.28 500 22 11 495 29 21 508 22 17Romania 7 856 -0.34 424 50 46 427 49 45 428 49 47Russian Federation 9 149 -0.21 459 43 41 468 39 38 478 40 38Trinidad and Tobago 15 738 -0.58 416 52 50 414 52 51 410 53 51
Turkey 13 362 -1.16 464 43 39 445 44 41 454 44 42Average 12 086 425 419 430
Countries similar to Mexico in GDP, G20 Countries within 0.3 S.D.
Countries below -1 in ESCS
Notes: Data available only. GDP for Partner Countries, South Arabia and South Africa from World Bank Database. Indicator: GDP per capita (current USD) Year 2007. Source: PISA 2009 Results, Table I.2.20, Figures I.3.b, I.2.16, I.3.11 and I.3.22. Education at a Glance 2010, Table X2.1. Catalog Source: World Development Indicators

2seeinG mexiCo’s ResulTs in a ComPaRaTiVe PeRsPeCTiVe: exTeRnal benCHmaRKinG
27STRONG PERFORMERS AND SUCCESSFUL REFORMERS IN EDUCATION: LESSONS FROM PISA FOR MEXICO © OECD 2010
Percentage of students
Shanghai-ChinaKorea
FinlandHong Kong-China
CanadaSingapore
EstoniaJapan
AustraliaNetherlands
New ZealandMacao-China
NorwayPoland
DenmarkChinese Taipei
LiechtensteinSwitzerland
IcelandIreland
SwedenHungary
LatviaUnited States
PortugalBelgium
United KingdomGermany
SpainFrance
ItalySloveniaGreece
Slovak RepublicCroatia
Czech RepublicLithuania
TurkeyLuxembourg
IsraelRussian Federation
AustriaChile
Dubai (UAE)Serbia
MexicoRomaniaBulgaria
UruguayThailand
Trinidad and TobagoColombia
JordanMontenegro
BrazilTunisia
ArgentinaIndonesia
AlbaniaKazakhstan
QatarPeru
PanamaAzerbaijanKyrgyzstan
Countries are ranked in descending order of the percentage of students at Levels 2, 3, 4, 5 and 6.Source: OECD, PISA 2009 Database, Table I.2.1.
100 80 60 40 20 0 20 40 60 80 100
• Figure 2.1 •How proficient are students in reading?
Percentage of students at the different levels of reading proficiency
Level 1aLevel 1bBelow Level 1b Level 2 Level 3 Level 4 Level 5 Level 6
Shanghai-ChinaKoreaFinlandHong Kong-ChinaCanadaSingaporeEstoniaJapanAustraliaNetherlandsNew ZealandMacao-ChinaNorwayPolandDenmarkChinese TaipeiLiechtensteinSwitzerlandIcelandIrelandSwedenHungaryLatviaUnited StatesPortugalBelgiumUnited KingdomGermanySpainFranceItalySloveniaGreeceSlovak RepublicCroatiaCzech RepublicLithuaniaTurkeyLuxembourgIsraelRussian FederationAustriaChileDubai (UAE)SerbiaMexicoRomaniaBulgaria UruguayThailandTrinidad and TobagoColombiaJordanMontenegroBrazilTunisiaArgentinaIndonesiaAlbaniaKazakhstanQatarPeruPanamaAzerbaijanKyrgyzstan
Students at Level 1a or below
Students at Level 2 or above

2seeinG mexiCo’s ResulTs in a ComPaRaTiVe PeRsPeCTiVe: exTeRnal benCHmaRKinG
28 © OECD 2010 STRONG PERFORMERS AND SUCCESSFUL REFORMERS IN EDUCATION: LESSONS FROM PISA FOR MEXICO
Percentage of students
Countries are ranked in descending order of the percentage of students at Levels 2, 3, 4, 5 and 6.Source: OECD, PISA 2009 Database, Table I.3.1.
100 80 60 40 20 0 20 40 60 80 100
• Figure 2.2 •How proficient are students in mathematics?
Percentage of students at the different levels of mathematics proficiency
Level 1Below Level 1 Level 2 Level 3 Level 4 Level 5 Level 6
Students at Level 1 or below
Students at Level 2 or above
Shanghai-ChinaFinland
KoreaHong Kong-China
LiechtensteinSingapore
Macao-ChinaCanada
JapanEstonia
Chinese TaipeiNetherlandsSwitzerland
New ZealandAustralia
IcelandDenmark
NorwayGermanyBelgium
United KingdomSlovenia
PolandIreland
Slovak RepublicSweden
HungaryCzech Republic
FranceLatvia
AustriaUnited States
PortugalSpain
LuxembourgItaly
LithuaniaRussian Federation
GreeceCroatia
Dubai (UAE)Israel
SerbiaTurkey
AzerbaijanRomaniaBulgariaUruguayMexico
ChileThailand
Trinidad and TobagoMontenegroKazakhstan
ArgentinaJordan
AlbaniaBrazil
ColombiaPeru
TunisiaQatar
IndonesiaPanama
Kyrgyzstan
Shanghai-ChinaFinlandKoreaHong Kong-ChinaLiechtensteinSingaporeMacao-ChinaCanadaJapanEstoniaChinese TaipeiNetherlandsSwitzerlandNew ZealandAustraliaIcelandDenmarkNorwayGermanyBelgiumUnited KingdomSloveniaPolandIrelandSlovak RepublicSwedenHungaryCzech RepublicFranceLatviaAustriaUnited StatesPortugalSpainLuxembourgItalyLithuaniaRussian FederationGreeceCroatiaDubai (UAE)IsraelSerbiaTurkeyAzerbaijanRomaniaBulgariaUruguayMexicoChileThailandTrinidad and TobagoMontenegroKazakhstanArgentinaJordanAlbaniaBrazilColombiaPeruTunisiaQatarIndonesiaPanamaKyrgyzstan

2seeinG mexiCo’s ResulTs in a ComPaRaTiVe PeRsPeCTiVe: exTeRnal benCHmaRKinG
29STRONG PERFORMERS AND SUCCESSFUL REFORMERS IN EDUCATION: LESSONS FROM PISA FOR MEXICO © OECD 2010
Percentage of students
Countries are ranked in descending order of the percentage of students at Levels 2, 3, 4, 5 and 6.Source: OECD, PISA 2009 Database, Table I.3.4.
100 80 60 40 20 0 20 40 60 80 100
• Figure 2.3 •How proficient are students in science?
Percentage of students at the different levels of science proficiency
Students at Level 1 or below
Students at Level 2 or above
Shanghai-ChinaFinland
KoreaHong Kong-China
EstoniaCanada
Macao-ChinaJapan
Chinese TaipeiLiechtenstein
SingaporeAustralia
PolandNetherlands
New ZealandSwitzerland
HungaryLatvia
SloveniaGermany
United KingdomIreland
NorwayPortugal
DenmarkLithuania
Czech RepublicIceland
BelgiumUnited States
SpainCroatia
SwedenSlovak Republic
FranceItaly
AustriaRussian Federation
LuxembourgGreeceTurkey
Dubai (UAE)ChileIsrael
SerbiaBulgaria
RomaniaUruguayThailand
JordanMexico
Trinidad and TobagoArgentina
MontenegroTunisia
ColombiaBrazil
KazakhstanAlbaniaPanama
QatarIndonesia
PeruAzerbaijanKyrgyzstan
Shanghai-ChinaFinlandKoreaHong Kong-ChinaEstoniaCanadaMacao-ChinaJapanChinese TaipeiLiechtensteinSingaporeAustraliaPolandNetherlandsNew ZealandSwitzerlandHungaryLatviaSloveniaGermanyUnited KingdomIrelandNorwayPortugalDenmarkLithuaniaCzech RepublicIcelandBelgiumUnited StatesSpainCroatiaSwedenSlovak RepublicFranceItalyAustriaRussian FederationLuxembourgGreeceTurkeyDubai (UAE)ChileIsraelSerbiaBulgariaRomaniaUruguayThailandJordanMexicoTrinidad and TobagoArgentinaMontenegroTunisiaColombiaBrazilKazakhstanAlbaniaPanamaQatarIndonesiaPeruAzerbaijanKyrgyzstan
Level 1Below Level 1 Level 2 Level 3 Level 4 Level 5 Level 6

2seeinG mexiCo’s ResulTs in a ComPaRaTiVe PeRsPeCTiVe: exTeRnal benCHmaRKinG
30 © OECD 2010 STRONG PERFORMERS AND SUCCESSFUL REFORMERS IN EDUCATION: LESSONS FROM PISA FOR MEXICO
The data in Box 2.A show that countries vary in their demographic, social and economic contexts. These differences need to be taken into account when interpreting differences in student performance. At the same time, the future economic and social prospects of both individuals and countries depend on the results they actually achieve, not on the performance they might have achieved under different social and economic conditions. That is why the results that are actually achieved by students, schools and countries are the focus of the analysis in this publication.
Even after accounting for the demographic, economic and social context of education systems, the question remains: to what extent is an international test meaningful when differences in languages and cultures lead to very different
Box 2.A a context for interpreting the performance of countries
•The limited wealth of Mexico means that it can devote only limited resources to education. However, low average income is not incompatible with high educational performance. As shown in Volume II of PISA 2009 Results, the wealth of families influences the educational performance of their children. Similarly, the relative prosperity of some countries allows them to spend more on education, while other countries find themselves constrained by a lower national income. In fact, the relationship suggests that 6% of the variation between OECD countries’ mean scores can be predicted on the basis of their GDP per capita. Mexico, one of the most disadvantaged countries in the OECD, which ranks 32nd, just below Hungary and Poland, and above Chile and Turkey in terms of GDP per capita, has a substantial economic disadvantage among other OECD countries because of the amount of money it has available to spend on education. At the same time, the fact that the best performing country or economy, Shanghai-China, has a GDP per capita well below the OECD average underlines that low average income is not incompatible with high educational performance. The fact that Brazil and Poland, both with similar GDP per capita to Mexico, have shown significant improvement in PISA results over the last 10 years, shows that Mexico could show significant improvement despite the country’s socio-economic challenges.
•Only Turkey spends less per student. While GDP per capita reflects the potential resources available for education in each country, it does not directly measure the financial resources actually invested in education. Across OECD countries, expenditure per student explains 9% of the variation in PISA mean performance between countries. Deviations from the trend line suggest that moderate spending per student cannot automatically be equated with poor performance by education systems. For example, Estonia and Poland, which spend around USD 40 000 per student, perform at the same level as Norway and the United States, which spend over USD 100 000 per student. Similarly, New Zealand, one of the highest performing countries in reading, spends well below the average per student. Mexico spends USD 21 175 and has a similar GDP per capita to Poland (see Table I.2.20 in PISA 2009 Results).
•Parents in Mexico are less educated than in most other OECD countries. Given the close interrelationship between a student’s performance and their parents’ level of education observed in Volume II of PISA 2009 Results, it is also important to bear in mind the educational attainment of adult populations when comparing the performance of OECD countries, since countries with more highly educated adults are at an advantage over countries in which parents have less education. A comparison of the percentage of 35- to 44-year-olds, which roughly corresponds to the age group of the parents of the 15-year-olds assessed in PISA, who have attained upper secondary or tertiary levels of education, ranks Mexico 29th among the 34 OECD countries, with 15.7%, while Canada, Japan, Finland, the United States and Korea are above the 40%, Canada for example with 54.2%. Chile has an advantage over Mexico with 24.4%.
•The share of students from disadvantaged backgrounds in Mexico is far above average. Socio-economic disadvantage and heterogeneity in student populations pose major challenges for teachers and education systems. As shown in Volume II of PISA 2009 Results, teachers instructing socio-economically disadvantaged children are likely to face greater challenges than teachers with students from more privileged socio-economic backgrounds. A comparison of the proportion of students at the lower end of an international scale of the economic, social and cultural background of students, which is described in detail in Volume II of PISA 2009 Results, ranks Mexico 34th among the 34 OECD countries. The greater socio-economic variability in Mexico thus results from a disproportionate share of students from poor families and socio-economically disadvantaged contexts.

2seeinG mexiCo’s ResulTs in a ComPaRaTiVe PeRsPeCTiVe: exTeRnal benCHmaRKinG
31STRONG PERFORMERS AND SUCCESSFUL REFORMERS IN EDUCATION: LESSONS FROM PISA FOR MEXICO © OECD 2010
ways in which subjects such as language, mathematics or science are taught and learned across countries? It is inevitable that not all tasks on the international PISA assessments are equally appropriate in different cultural contexts and equally relevant in different curricular and instructional contexts. To gauge this, PISA asked every country to identify those tasks from the PISA tests that it considered most appropriate for an international test. Countries were advised to give an on-balance rating for each task with regard to its relevance to “preparedness for life”, authenticity and interest for 15-year-olds. Tasks given a high rating by each country are referred to as that country’s ‘preferred’ questions for PISA. PISA then scored every country on its own preferred questions and compared the resulting performance with the performance on the entire set of PISA tasks. Mexico’s relative standing remains the same, irrespective of whether all PISA items or the items preferred by Mexico are used as a basis for comparisons.
relative shares of students ‘at risk’In reading, 40% of 15-year-olds in Mexico do not reach the PISA baseline Level 2 of reading proficiency, a percentage that is significantly above the OECD average, 18.1%, and that has changed very little since 2000 when it was 44%. Mexico also stands above the G20 average, 25.8%. By contrast, in Canada, Finland and Korea, the proportion of poor performers is only between 6% and 9%, in Turkey 24% and in Chile 30%. There are two countries with similar GDP per capita to Mexico showing significant improvement in this area: Poland, which reduced the share of poor performers from 23.2% in 2000 to 15% in 2009 and Brazil which reduced the share of poor performers from 55.8% to 44.6%, respectively (see Table II.4 in PISA 2009 Results).
Table 2.3Comparison of the proportion of students at the lower end of an international scale of the economic, social and cultural background of students
Pisa index of economic, social and cultural status (escs)share of students in their country whose Pisa index of economic, social and cultural status is
below -1 Mean index
s.e.
oec
d Australia 0.34 (0.01) 3.4
Austria 0.06 (0.02) 8.4
Belgium 0.20 (0.02) 9.0
Canada 0.50 (0.02) 3.7
Chile -0.57 (0.04) 37.2
Czech Republic -0.09 (0.01) 9.2
Denmark 0.30 (0.02) 7.2
Estonia 0.15 (0.02) 6.7
Finland 0.37 (0.02) 3.9
France -0.13 (0.03) 13.9
Germany 0.18 (0.02) 8.2
Greece -0.02 (0.03) 17.7
Hungary -0.20 (0.03) 19.1
Iceland 0.72 (0.01) 3.5
Ireland 0.05 (0.03) 10.4
Israel -0.02 (0.03) 12.7
Italy -0.12 (0.01) 21.4
Japan -0.01 (0.01) 7.9
Korea -0.15 (0.03) 15.8
Luxembourg 0.19 (0.01) 16.1
Mexico -1.22 (0.03) 58.2
Netherlands 0.27 (0.03) 6.5
New Zealand 0.09 (0.02) 8.6
Norway 0.47 (0.02) 2.4
Poland -0.28 (0.02) 20.7
Portugal -0.32 (0.04) 33.5
Slovak Republic -0.09 (0.02) 10.4
Slovenia 0.07 (0.01) 10.2
Spain -0.31 (0.03) 29.0
Sweden 0.33 (0.02) 5.1
Switzerland 0.08 (0.02) 11.1
Turkey -1.16 (0.05) 58.0
United Kingdom 0.20 (0.02) 5.6
United States 0.17 (0.04) 10.4
Source: PISA 2009 Results Volume I: Tables I.2.20 and II.3.2.

2seeinG mexiCo’s ResulTs in a ComPaRaTiVe PeRsPeCTiVe: exTeRnal benCHmaRKinG
32 © OECD 2010 STRONG PERFORMERS AND SUCCESSFUL REFORMERS IN EDUCATION: LESSONS FROM PISA FOR MEXICO
• Figure 2.4 •Summary descriptions for the seven levels of proficiency in reading
level
lowerscorelimit
Percentage of students able to perform tasks at each level or above (oecd average) characteristics of tasks
6
698
0.8% of students across the OECD can perform tasks at Level 6 on the reading scale
Tasks at this level typically require the reader to make multiple inferences, comparisons and contrasts that are both detailed and precise. They require demonstration of a full and detailed understanding of one or more texts and may involve integrating information from more than one text. Tasks may require the reader to deal with unfamiliar ideas, in the presence of prominent competing information, and to generate abstract categories for interpretations. Reflect and evaluate tasks may require the reader to hypothesise about or critically evaluate a complex text on an unfamiliar topic, taking into account multiple criteria or perspectives, and applying sophisticated understandings from beyond the text. A salient condition for access and retrieve tasks at this level is precision of analysis and fine attention to detail that is inconspicuous in the texts.
5
626
7.6% of students across the OECD can perform tasks at least at Level 5 on the reading scale
Tasks at this level that involve retrieving information require the reader to locate and organise several pieces of deeply embedded information, inferring which information in the text is relevant. Reflective tasks require critical evaluation or hypothesis, drawing on specialised knowledge. Both interpretative and reflective tasks require a full and detailed understanding of a text whose content or form is unfamiliar. For all aspects of reading, tasks at this level typically involve dealing with concepts that are contrary to expectations.
4
553
28.3% of students across the OECD can perform tasks at least at Level 4 on the reading scale
Tasks at this level that involve retrieving information require the reader to locate and organise several pieces of embedded information. Some tasks at this level require interpreting the meaning of nuances of language in a section of text by taking into account the text as a whole. Other interpretative tasks require understanding and applying categories in an unfamiliar context. Reflective tasks at this level require readers to use formal or public knowledge to hypothesise about or critically evaluate a text. Readers must demonstrate an accurate understanding of long or complex texts whose content or form may be unfamiliar.
3
480
57.2% of students across the OECD can perform tasks at least at Level 3 on the reading scale
Tasks at this level require the reader to locate, and in some cases recognise the relationship between, several pieces of information that must meet multiple conditions. Interpretative tasks at this level require the reader to integrate several parts of a text in order to identify a main idea, understand a relationship or construe the meaning of a word or phrase. They need to take into account many features in comparing, contrasting or categorising. Often the required information is not prominent or there is much competing information; or there are other obstacles in the text, such as ideas that are contrary to expectation or negatively worded. Reflective tasks at this level may require connections, comparisons, and explanations, or they may require the reader to evaluate a feature of the text. Some reflective tasks require readers to demonstrate a fine understanding of the text in relation to familiar, everyday knowledge. Other tasks do not require detailed text comprehension but require the reader to draw on less common knowledge.
2
407
81.2% of students across the OECD can perform tasks at least at Level 2 on the reading scale
Some tasks at this level require the reader to locate one or more pieces of information, which may need to be inferred and may need to meet several conditions. Others require recognising the main idea in a text, understanding relationships, or construing meaning within a limited part of the text when the information is not prominent and the reader must make low level inferences. Tasks at this level may involve comparisons or contrasts based on a single feature in the text. Typical reflective tasks at this level require readers to make a comparison or several connections between the text and outside knowledge, by drawing on personal experience and attitudes.
1a
335
94.3% of students across the OECD can perform tasks at least at Level 1a on the reading scale
Tasks at this level require the reader: to locate one or more independent pieces of explicitly stated information; to recognise the main theme or author’s purpose in a text about a familiar topic; or to make a simple connection between information in the text and common, everyday knowledge. Typically the required information in the text is prominent and there is little, if any, competing information. The reader is explicitly directed to consider relevant factors in the task and in the text.
1b
262
98.9% of students across the OECD can perform tasks at least at Level 1b on the reading scale
Tasks at this level require the reader to locate a single piece of explicitly stated information in a prominent position in a short, syntactically simple text with a familiar context and text type, such as a narrative or a simple list. The text typically provides support to the reader, such as repetition of information, pictures or familiar symbols. There is minimal competing information. In tasks requiring interpretation the reader may need to make simple connections between adjacent pieces of information.

2seeinG mexiCo’s ResulTs in a ComPaRaTiVe PeRsPeCTiVe: exTeRnal benCHmaRKinG
33STRONG PERFORMERS AND SUCCESSFUL REFORMERS IN EDUCATION: LESSONS FROM PISA FOR MEXICO © OECD 2010
Level 2 on the PISA reading scale can be considered a baseline level of proficiency, at which students begin to demonstrate the reading competencies that will enable them to participate effectively and productively in life. Students proficient at Level 2 are capable of very basic tasks such as locating information that meets several conditions, making comparisons or contrasts around a single feature, working out what a well-defined part of a text means even when the information is not prominent, and making connections between the text and personal experience. Some tasks at this level require students to locate one or more pieces of information, which may need to be inferred and may need to meet several conditions. Others require recognising the main idea in a text, understanding relationships or construing meaning within a limited part of the text when the information is not prominent and the reader must make low level inferences. Tasks at this level may involve comparisons or contrasts based on a single feature in the text. Typical reflective tasks at this level require students to make a comparison or several connections between the text and outside knowledge, by drawing on personal experience and attitudes.
As part of the Canadian Youth in Transitions Survey, a follow-up study was made on students who had been assessed by PISA in 2000. It showed that students scoring below Level 2 face a disproportionately higher risk of poor post-secondary participation or low labour-market outcomes at age 19, and even more so at age 21, the latest age for which data are currently available. For example, the odds of Canadian students who had reached Level 5 in reading at age 15 to achieve a successful transition to post-secondary education by age 21 were 20 times higher than for those who had not achieved the baseline Level 2, even after adjustments for socio-economic differences are made
Table 2.4Percentage of students below level 2 and at level 5 or above on the reading scale in Pisa 2000 and 2009
Proficiency levels in Pisa 2000 Proficiency levels in Pisa 2009change between 2000 and 2009 (Pisa
2009 - Pisa 2000)
Below level 2 (less than 407 score
points)
level 5 or above (above 626 score
points)
Below level 2 (less than 407 score
points)
level 5 or above (above 626 score
points)
Below level 2 (less than 407 score
points)
level 5 or above (above 626 score
points)
% s.e. % s.e. % s.e. % s.e. % dif. s.e. % dif. s.e.
OEC
D Australia 12.5 (0.9) 17.6 (1.2) 14.2 (0.6) 12.8 (0.8) 1.8 (1.0) -4.9 (1.4)Austria 19.3 (0.9) 7.5 (0.7) m m m m m m m mBelgium 19.0 (1.3) 12.0 (0.7) 17.7 (0.9) 11.2 (0.6) -1.2 (1.6) -0.8 (0.9)Canada 9.6 (0.4) 16.8 (0.5) 10.3 (0.5) 12.8 (0.5) 0.7 (0.6) -4.0 (0.7)Chile 48.2 (1.9) 0.5 (0.1) 30.6 (1.5) 1.3 (0.3) -17.6 (2.4) 0.8 (0.3)Czech Republic 17.5 (0.8) 7.0 (0.6) 23.1 (1.3) 5.1 (0.5) 5.6 (1.5) -1.9 (0.7)Denmark 17.9 (0.9) 8.1 (0.5) 15.2 (0.9) 4.7 (0.5) -2.7 (1.3) -3.4 (0.7)Finland 7.0 (0.7) 18.5 (0.9) 8.1 (0.5) 14.5 (0.8) 1.2 (0.8) -4.0 (1.2)France 15.2 (1.1) 8.5 (0.5) 19.8 (1.2) 9.6 (1.0) 4.6 (1.6) 1.1 (1.1)Germany 22.6 (1.0) 8.8 (0.5) 18.5 (1.1) 7.6 (0.6) -4.2 (1.4) -1.2 (0.8)Greece 24.4 (2.1) 5.0 (0.7) 21.3 (1.8) 5.6 (0.5) -3.1 (2.8) 0.6 (0.8)Hungary 22.7 (1.5) 5.1 (0.8) 17.6 (1.4) 6.1 (0.7) -5.1 (2.1) 1.0 (1.0)Iceland 14.5 (0.7) 9.1 (0.7) 16.8 (0.6) 8.5 (0.6) 2.3 (0.9) -0.5 (0.9)Ireland 11.0 (1.0) 14.2 (0.8) 17.2 (1.0) 7.0 (0.5) 6.2 (1.4) -7.3 (1.0)Israel 33.2 (3.2) 4.2 (0.8) 26.5 (1.2) 7.4 (0.6) -6.7 (3.4) 3.3 (1.0)Italy 18.9 (1.1) 5.3 (0.5) 21.0 (0.6) 5.8 (0.3) 2.1 (1.3) 0.5 (0.6)Japan 10.1 (1.5) 9.9 (1.1) 13.6 (1.1) 13.4 (0.9) 3.5 (1.9) 3.6 (1.4)Korea 5.8 (0.7) 5.7 (0.6) 5.8 (0.8) 12.9 (1.1) 0.0 (1.1) 7.2 (1.2)Luxembourg m m m m 26.0 (0.6) 5.7 (0.5) m m m mMexico 44.1 (1.7) 0.9 (0.2) 40.1 (1.0) 0.4 (0.1) -4.0 (2.0) -0.5 (0.2)Netherlands m m m m 14.3 (1.5) 9.8 (1.1) m m m mNew Zealand 13.7 (0.8) 18.7 (1.0) 14.3 (0.7) 15.7 (0.8) 0.6 (1.1) -3.0 (1.3)Norway 17.5 (1.1) 11.2 (0.7) 15.0 (0.8) 8.4 (0.9) -2.5 (1.3) -2.8 (1.1)Poland 23.2 (1.4) 5.9 (0.9) 15.0 (0.8) 7.2 (0.6) -8.2 (1.7) 1.3 (1.1)Portugal 26.3 (1.9) 4.2 (0.5) 17.6 (1.2) 4.8 (0.5) -8.6 (2.2) 0.6 (0.8)Spain 16.3 (1.1) 4.2 (0.5) 19.6 (0.9) 3.3 (0.3) 3.3 (1.4) -0.9 (0.6)Sweden 12.6 (0.7) 11.2 (0.7) 17.4 (0.9) 9.0 (0.7) 4.9 (1.2) -2.2 (1.0)Switzerland 20.4 (1.3) 9.2 (1.0) 16.8 (0.9) 8.1 (0.7) -3.6 (1.6) -1.1 (1.3)United Kingdom m m m m 18.4 (0.8) 8.0 (0.5) m m m mUnited States 17.9 (2.2) 12.2 (1.4) 17.6 (1.1) 9.9 (0.9) -0.3 (2.4) -2.4 (1.6)OECD average-26 19.3 (0.3) 9.0 (0.2) 18.1 (0.2) 8.2 (0.1) -1.2 (0.3) -0.8 (0.2)
Part
ners Albania 70.4 (1.1) 0.1 (0.1) 56.7 (1.9) 0.2 (0.1) -13.7 (2.2) 0.1 (0.1)
Argentina 43.9 (4.5) 1.7 (0.5) 51.6 (1.9) 1.0 (0.2) 7.7 (4.9) -0.7 (0.5)Brazil 55.8 (1.7) 0.6 (0.2) 49.6 (1.3) 1.3 (0.2) -6.2 (2.1) 0.8 (0.3)Bulgaria 40.3 (2.1) 2.2 (0.6) 41.0 (2.6) 2.8 (0.5) 0.7 (3.3) 0.6 (0.8)Hong Kong-China 9.1 (1.0) 9.5 (0.8) 8.3 (0.7) 12.4 (0.8) -0.8 (1.2) 2.9 (1.1)Indonesia 68.7 (2.5) 0.0 c 53.4 (2.3) 0.0 c -15.2 (3.4) c cLatvia 30.1 (2.0) 4.2 (0.6) 17.6 (1.2) 2.9 (0.4) -12.5 (2.4) -1.2 (0.8)Liechtenstein 22.1 (2.1) 5.1 (1.6) 15.7 (1.8) 4.6 (1.4) -6.4 (2.7) -0.4 (2.1)Peru 79.5 (1.5) 0.1 (0.1) 64.8 (1.7) 0.5 (0.2) -14.8 (2.2) 0.4 (0.2)Romania 41.3 (1.5) 2.2 (0.3) 40.4 (2.0) 0.7 (0.2) -0.9 (2.5) -1.5 (0.3)Russian Federation 27.4 (1.7) 3.2 (0.5) 27.4 (1.3) 3.2 (0.5) -0.1 (2.2) -0.0 (0.7)Thailand 37.1 (1.7) 0.5 (0.2) 42.9 (1.5) 0.3 (0.2) 5.8 (2.3) -0.2 (0.2)Note: Values that are statistically significant are indicated in bold. Source: PISA 2009 Results Volume V: Table V.2.2

2seeinG mexiCo’s ResulTs in a ComPaRaTiVe PeRsPeCTiVe: exTeRnal benCHmaRKinG
34 © OECD 2010 STRONG PERFORMERS AND SUCCESSFUL REFORMERS IN EDUCATION: LESSONS FROM PISA FOR MEXICO
Table 2.5 Percentage of students at each proficiency level on the reading scale 2009
Proficiency levels
Below Level 1b (less than 262.04
score points)
Level 1b (from 262.04 to less than 334.75
score points)
Level 1a (from 334.75 to less than 407.47
score points)
Level 2 (from 407.47 to less than 480.18
score points)
Level 3 (from 480.18 to less than 552.89
score points)
Level 4 (from 552.89 to less than 625.61
score points)
Level 5 (from 625.61 to less than 698.32
score points)
Level 6 (above 698.32 score points)
% S.E. % S.E. % S.E. % S.E. % S.E. % S.E. % S.E. % S.E.
OEC
D Australia 1.0 (0.1) 3.3 (0.3) 10.0 (0.4) 20.4 (0.6) 28.5 (0.7) 24.1 (0.7) 10.7 (0.5) 2.1 (0.3)Austria 1.9 (0.4) 8.1 (0.8) 17.5 (1.0) 24.1 (1.0) 26.0 (0.9) 17.4 (0.9) 4.5 (0.4) 0.4 (0.1)Belgium 1.1 (0.3) 4.7 (0.5) 11.9 (0.6) 20.3 (0.7) 25.8 (0.9) 24.9 (0.7) 10.1 (0.5) 1.1 (0.2)Canada 0.4 (0.1) 2.0 (0.2) 7.9 (0.3) 20.2 (0.6) 30.0 (0.7) 26.8 (0.6) 11.0 (0.4) 1.8 (0.2)Chile 1.3 (0.2) 7.4 (0.8) 21.9 (1.0) 33.2 (1.1) 25.6 (1.1) 9.3 (0.7) 1.3 (0.2) 0.0 (0.0)Czech Republic 0.8 (0.3) 5.5 (0.6) 16.8 (1.1) 27.4 (1.0) 27.0 (1.0) 17.4 (1.0) 4.7 (0.4) 0.4 (0.1)Denmark 0.4 (0.1) 3.1 (0.3) 11.7 (0.7) 26.0 (0.9) 33.1 (1.2) 20.9 (1.1) 4.4 (0.4) 0.3 (0.1)Estonia 0.3 (0.1) 2.4 (0.4) 10.6 (0.9) 25.6 (1.3) 33.8 (1.0) 21.2 (0.8) 5.4 (0.5) 0.6 (0.2)Finland 0.2 (0.1) 1.5 (0.2) 6.4 (0.4) 16.7 (0.6) 30.1 (0.8) 30.6 (0.9) 12.9 (0.7) 1.6 (0.2)France 2.3 (0.5) 5.6 (0.5) 11.8 (0.8) 21.1 (1.0) 27.2 (1.0) 22.4 (1.1) 8.5 (0.8) 1.1 (0.3)Germany 0.8 (0.2) 4.4 (0.5) 13.3 (0.8) 22.2 (0.9) 28.8 (1.1) 22.8 (0.9) 7.0 (0.6) 0.6 (0.2)Greece 1.4 (0.4) 5.6 (0.9) 14.3 (1.1) 25.6 (1.1) 29.3 (1.2) 18.2 (1.0) 5.0 (0.5) 0.6 (0.2)Hungary 0.6 (0.2) 4.7 (0.8) 12.3 (1.0) 23.8 (1.2) 31.0 (1.3) 21.6 (1.1) 5.8 (0.7) 0.3 (0.1)Iceland 1.1 (0.2) 4.2 (0.4) 11.5 (0.7) 22.2 (0.8) 30.6 (0.9) 21.9 (0.8) 7.5 (0.6) 1.0 (0.2)Ireland 1.5 (0.4) 3.9 (0.5) 11.8 (0.7) 23.3 (1.0) 30.6 (0.9) 21.9 (0.9) 6.3 (0.5) 0.7 (0.2)Israel 3.9 (0.7) 8.0 (0.7) 14.7 (0.6) 22.5 (1.0) 25.5 (0.9) 18.1 (0.7) 6.4 (0.5) 1.0 (0.2)Italy 1.4 (0.2) 5.2 (0.3) 14.4 (0.5) 24.0 (0.5) 28.9 (0.6) 20.2 (0.5) 5.4 (0.3) 0.4 (0.1)Japan 1.3 (0.4) 3.4 (0.5) 8.9 (0.7) 18.0 (0.8) 28.0 (0.9) 27.0 (0.9) 11.5 (0.7) 1.9 (0.4)Korea 0.2 (0.2) 0.9 (0.3) 4.7 (0.6) 15.4 (1.0) 33.0 (1.2) 32.9 (1.4) 11.9 (1.0) 1.0 (0.2)Luxembourg 3.1 (0.3) 7.3 (0.4) 15.7 (0.6) 24.0 (0.7) 27.0 (0.6) 17.3 (0.6) 5.2 (0.4) 0.5 (0.2)Mexico 3.2 (0.3) 11.4 (0.5) 25.5 (0.6) 33.0 (0.6) 21.2 (0.6) 5.3 (0.4) 0.4 (0.1) 0.0 (0.0)Netherlands 0.1 (0.1) 1.8 (0.3) 12.5 (1.4) 24.7 (1.5) 27.6 (1.2) 23.5 (1.7) 9.1 (1.0) 0.7 (0.2)New Zealand 0.9 (0.2) 3.2 (0.4) 10.2 (0.6) 19.3 (0.8) 25.8 (0.8) 24.8 (0.8) 12.9 (0.8) 2.9 (0.4)Norway 0.5 (0.1) 3.4 (0.4) 11.0 (0.7) 23.6 (0.8) 30.9 (0.9) 22.1 (1.2) 7.6 (0.9) 0.8 (0.2)Poland 0.6 (0.1) 3.1 (0.3) 11.3 (0.7) 24.5 (1.1) 31.0 (1.0) 22.3 (1.0) 6.5 (0.5) 0.7 (0.1)Portugal 0.6 (0.1) 4.0 (0.4) 13.0 (1.0) 26.4 (1.1) 31.6 (1.1) 19.6 (0.9) 4.6 (0.5) 0.2 (0.1)Slovak Republic 0.8 (0.3) 5.6 (0.6) 15.9 (0.8) 28.1 (1.0) 28.5 (1.1) 16.7 (0.8) 4.2 (0.5) 0.3 (0.1)Slovenia 0.8 (0.1) 5.2 (0.3) 15.2 (0.5) 25.6 (0.7) 29.2 (0.9) 19.3 (0.8) 4.3 (0.5) 0.3 (0.1)Spain 1.2 (0.2) 4.7 (0.4) 13.6 (0.6) 26.8 (0.8) 32.6 (1.0) 17.7 (0.7) 3.2 (0.3) 0.2 (0.1)Sweden 1.5 (0.3) 4.3 (0.4) 11.7 (0.7) 23.5 (1.0) 29.8 (1.0) 20.3 (0.9) 7.7 (0.6) 1.3 (0.3)Switzerland 0.7 (0.2) 4.1 (0.4) 12.1 (0.6) 22.7 (0.7) 29.7 (0.8) 22.6 (0.8) 7.4 (0.7) 0.7 (0.2)Turkey 0.8 (0.2) 5.6 (0.6) 18.1 (1.0) 32.2 (1.2) 29.1 (1.1) 12.4 (1.1) 1.8 (0.4) 0.0 (0.0)United Kingdom 1.0 (0.2) 4.1 (0.4) 13.4 (0.6) 24.9 (0.7) 28.8 (0.8) 19.8 (0.8) 7.0 (0.5) 1.0 (0.2)United States 0.6 (0.1) 4.0 (0.4) 13.1 (0.8) 24.4 (0.9) 27.6 (0.8) 20.6 (0.9) 8.4 (0.8) 1.5 (0.4)oecd total 1.1 (0.1) 4.8 (0.1) 13.8 (0.3) 24.4 (0.3) 27.9 (0.3) 19.9 (0.3) 7.0 (0.2) 1.0 (0.1)oecd average 1.1 (0.0) 4.6 (0.1) 13.1 (0.1) 24.0 (0.2) 28.9 (0.2) 20.7 (0.2) 6.8 (0.1) 0.8 (0.0)
Part
ners Albania 11.3 (0.9) 18.7 (1.3) 26.6 (1.2) 25.6 (1.3) 14.4 (1.2) 3.1 (0.5) 0.2 (0.1) 0.0 c
Argentina 10.8 (1.1) 15.8 (1.3) 25.0 (1.3) 25.4 (1.2) 16.0 (1.0) 6.0 (0.8) 0.9 (0.2) 0.1 (0.1)Azerbaijan 9.7 (1.1) 26.1 (1.1) 36.9 (1.2) 21.5 (1.2) 5.3 (0.8) 0.5 (0.2) 0.0 (0.0) 0.0 cBrazil 5.0 (0.4) 16.0 (0.7) 28.6 (0.8) 27.1 (0.8) 15.9 (0.9) 6.1 (0.5) 1.2 (0.2) 0.1 (0.1)Bulgaria 8.0 (1.1) 12.9 (1.4) 20.1 (1.4) 23.4 (1.1) 21.8 (1.4) 11.0 (1.1) 2.6 (0.5) 0.2 (0.1)Colombia 4.2 (0.7) 13.9 (1.0) 29.0 (1.2) 30.6 (1.1) 17.1 (1.0) 4.6 (0.5) 0.5 (0.2) 0.0 (0.0)Croatia 1.0 (0.2) 5.0 (0.4) 16.5 (1.0) 27.4 (1.0) 30.6 (1.2) 16.4 (1.0) 3.1 (0.4) 0.1 (0.1)Dubai (UAE) 3.7 (0.2) 9.4 (0.5) 17.9 (0.5) 25.4 (0.7) 23.5 (0.8) 14.8 (0.7) 4.8 (0.5) 0.5 (0.2)Hong Kong-China 0.2 (0.1) 1.5 (0.3) 6.6 (0.6) 16.1 (0.8) 31.4 (0.9) 31.8 (0.9) 11.2 (0.7) 1.2 (0.3)Indonesia 1.7 (0.4) 14.1 (1.3) 37.6 (1.6) 34.3 (1.4) 11.2 (1.3) 1.0 (0.3) 0.0 c 0.0 cJordan 6.9 (0.6) 13.6 (0.8) 27.6 (1.0) 31.8 (1.0) 16.5 (1.0) 3.4 (0.4) 0.2 (0.1) 0.0 cKazakhstan 7.5 (0.7) 20.4 (1.0) 30.7 (0.9) 24.1 (0.9) 13.1 (0.9) 3.7 (0.5) 0.4 (0.1) 0.0 cKyrgyzstan 29.8 (1.2) 29.7 (0.9) 23.8 (0.9) 11.5 (0.8) 4.2 (0.6) 1.0 (0.3) 0.1 (0.1) 0.0 cLatvia 0.4 (0.2) 3.3 (0.6) 13.9 (1.0) 28.8 (1.5) 33.5 (1.2) 17.2 (1.0) 2.9 (0.4) 0.1 cLiechtenstein 0.0 c 2.8 (1.2) 12.8 (1.8) 24.0 (2.8) 31.1 (2.8) 24.6 (2.3) 4.2 (1.4) 0.4 cLithuania 0.9 (0.3) 5.5 (0.6) 17.9 (0.9) 30.0 (1.0) 28.6 (0.9) 14.1 (0.8) 2.8 (0.4) 0.1 (0.1)Macao-China 0.3 (0.1) 2.6 (0.3) 12.0 (0.4) 30.6 (0.6) 34.8 (0.7) 16.9 (0.5) 2.8 (0.2) 0.1 (0.1)Montenegro 5.9 (0.5) 15.8 (0.8) 27.8 (0.8) 28.0 (0.9) 16.8 (0.8) 5.0 (0.5) 0.6 (0.2) 0.0 cPanama 13.3 (1.8) 23.1 (1.8) 28.9 (1.8) 20.7 (1.4) 10.1 (1.4) 3.4 (0.7) 0.5 (0.2) 0.0 cPeru 14.1 (0.9) 22.0 (1.0) 28.7 (1.1) 22.1 (0.9) 10.1 (0.9) 2.6 (0.5) 0.4 (0.2) 0.0 (0.0)Qatar 17.8 (0.3) 22.4 (0.5) 23.2 (0.6) 18.3 (0.4) 11.1 (0.5) 5.4 (0.3) 1.5 (0.2) 0.2 (0.1)Romania 4.1 (0.7) 12.7 (1.1) 23.6 (1.2) 31.6 (1.3) 21.2 (1.3) 6.1 (0.7) 0.7 (0.2) 0.0 cRussian Federation 1.6 (0.3) 6.8 (0.6) 19.0 (0.8) 31.6 (1.0) 26.8 (0.9) 11.1 (0.7) 2.8 (0.4) 0.3 (0.1)Serbia 2.0 (0.4) 8.8 (0.7) 22.1 (0.9) 33.2 (1.0) 25.3 (1.0) 7.9 (0.6) 0.8 (0.2) 0.0 (0.0)Shanghai-China 0.1 (0.0) 0.6 (0.1) 3.4 (0.5) 13.3 (0.9) 28.5 (1.2) 34.7 (1.0) 17.0 (1.0) 2.4 (0.4)Singapore 0.4 (0.1) 2.7 (0.3) 9.3 (0.5) 18.5 (0.6) 27.6 (0.8) 25.7 (0.7) 13.1 (0.5) 2.6 (0.3)Chinese Taipei 0.7 (0.2) 3.5 (0.4) 11.4 (0.6) 24.6 (0.8) 33.5 (1.1) 21.0 (1.0) 4.8 (0.8) 0.4 (0.2)Thailand 1.2 (0.3) 9.9 (0.8) 31.7 (1.1) 36.8 (1.2) 16.7 (0.8) 3.3 (0.5) 0.3 (0.2) 0.0 cTrinidad and Tobago 9.6 (0.5) 14.2 (0.6) 21.0 (0.8) 25.0 (0.9) 19.0 (0.9) 8.9 (0.5) 2.1 (0.3) 0.2 (0.1)Tunisia 5.5 (0.5) 15.0 (0.8) 29.6 (1.1) 31.5 (1.2) 15.1 (1.0) 3.1 (0.5) 0.2 (0.1) 0.0 cUruguay 5.5 (0.6) 12.5 (0.7) 23.9 (0.7) 28.0 (0.7) 20.3 (0.7) 8.1 (0.5) 1.7 (0.3) 0.1 (0.1)
Source: PISA 2009 Results Volume I: Table I.2.1

2seeinG mexiCo’s ResulTs in a ComPaRaTiVe PeRsPeCTiVe: exTeRnal benCHmaRKinG
35STRONG PERFORMERS AND SUCCESSFUL REFORMERS IN EDUCATION: LESSONS FROM PISA FOR MEXICO © OECD 2010
(OECD, 2010b).1 Similarly, of the Canadian students who performed below Level 2 in 2000, over 60% had not gone on to any post-school education by the age of 21; by contrast, more than half of the students (55%) who had performed at Level 2 as their highest level were at college or university.1
In mathematics, the proportion of students in Mexico below Level 2 on the PISA mathematics scale is 50.8% (OECD countries average 20.8%, G20 countries average 32.6% and countries with similar GDP per capita average 38.8%) but Mexico has been able to considerably reduce the proportion of poor performers ccompared to the percentage in 2003 (65.9%) (see Table I.3.1 and V.3.2 in PISA 2009 Results). Students proficient at Level 2 in mathematics can employ basic algorithms, formulae, procedures or conventions. They can interpret and recognise mathematical situations in contexts that require no more than direct inference, extract relevant information from a single source and make use of a single representational mode. They are capable of direct reasoning and making literal interpretations of results. In science, the proportion of students below Level 2 on the PISA science scale is at, 47.4% (OECD countries average 17.9%, G20 countries average 26.2% and countries with similar GDP per capita average 28.9%). To reach Level 2 requires competencies such as identifying key features of a scientific investigation, recalling single scientific concepts and information relating to a situation, and using results of a scientific experiment represented in a data table as they support a personal decision. In contrast, students not reaching Level 2 in science often confuse key features of an investigation, apply incorrect scientific information, and mix personal beliefs with scientific facts in support of a decision.
Table 2.6 benchmarking averages: Proficiency levels in Pisa 2009
Reading Mathematics science
Below level 2 level 5 or above Below level 2 level 5 or above Below level 2 level 5 or above
% % % % % %
OECD average 18.1 8.2 20.8 13.4 17.9 8.5
G20 average 25.8 7.0 32.6 10.3 26.6 7.3
Countries With Similar GDP/Capita Average 28.3 3.2 38.8 4.9 28.9 3.6
Mexico 40.1 0.4 50.8 0.7 47.4 0.2
Source: PISA 2009 Results Volume V: Table V.2.2, Table V.3.2, V.3.5 and I.2.1.
relative shares of top performing studentsMexico has a small share of top perfomers. In reading, the proportion of students reaching Levels 5 and 6 is 0.4%, in science it is 0.2% and in mathematics 0.7% (see Table 2.6). (See Figures I.2.14, I.3.9 and I.3.20 in PISA 2009 Results).
Students proficient at Level 6 on the PISA reading scale are capable of conducting fine-grained analysis of texts, which requires detailed comprehension of both explicit information and unstated implications and capable of reflecting on and evaluating what they read at a more general level. They can overcome preconceptions in the face of new information, even when that information is contrary to expectations. They are capable of recognising what is provided in a text, both conspicuously and more subtly, while at the same time being able to apply a critical perspective to it, drawing on sophisticated understandings from beyond the text. This combination of a capacity to absorb the new and to evaluate it is greatly valued in knowledge economies, which depend on innovation and nuanced decision-making that draw on all the available evidence. Mexico has virtually no students that can be considered highest-performing readers (OECD countries average 0.8%, G20 countries average 0.8%, countries with similar GDP per capita average 0.2%). By contrast, the corresponding figures for Australia, Canada, Finland, Japan, New Zealand, Singapore or Shanghai-China range from 1.8% to 2.9%. (See Table I.2.1 in PISA 2009 Results).
At the next highest level, Level 5 on the PISA reading literacy scale, students can still handle texts that are unfamiliar in either form or content. They can find information in such texts, demonstrate detailed understanding and infer which information is relevant to the task. Using such texts, they are also able to evaluate critically and build hypotheses, draw on specialised knowledge and accommodate concepts that may be contrary to expectations. Mexico has 0.4% of its students reaching Level 5 or above (OECD countries average 8.2%, G20 countries average 7% and countries with similar GDP per capita average 3.2%). In Shanghai-China (19.5%), New Zealand and Singapore (15.7%), Finland (14.5%) and Japan (13.4%) the corresponding percentages are significantly higher.

2seeinG mexiCo’s ResulTs in a ComPaRaTiVe PeRsPeCTiVe: exTeRnal benCHmaRKinG
36 © OECD 2010 STRONG PERFORMERS AND SUCCESSFUL REFORMERS IN EDUCATION: LESSONS FROM PISA FOR MEXICO
Virtually no students in Mexico reach the highest level of performance in mathematics, compared with an OECD average of 3%, and figures ranging up to 27% in Shanghai-China (Table I.3.1 in PISA 2009 Results). Students proficient at Level 6 on the mathematics scale are capable of advanced mathematical thinking and reasoning. These students can apply insight and understanding, along with a mastery of symbolic and formal mathematical operations and relationships, to develop new approaches and strategies for addressing novel situations. They can formulate and accurately communicate their actions and reflections regarding their findings, interpretations, arguments, and the appropriateness of these to the given situations.
At the next highest level, Level 5 on the PISA mathematics scale, students can still develop and work with models in complex situations, identifying constraints and specifying assumptions. They can select, compare and evaluate appropriate problem-solving strategies for dealing with complex problems related to these models. Students at this level can work strategically using broad, well-developed thinking and reasoning skills, appropriate linked representations, symbolic and formal characterisations, and insight pertaining to these situations. In Mexico 0.7% of students reach the PISA mathematics Level 5, compared with 13% on average across OECD countries (G20 countries average 10.3 %, countries with similar GDP per capita average 4.9%). In Shanghai-China half of the students reach Level 5, in Singapore and Hong Kong-China it is over 30% and in Chinese Taipei, Korea, Switzerland, Finland, Japan and Belgium over 20%. Poland reaches 10.4% and Turkey 5.6%.
Students proficient at Level 6 in science can consistently identify, explain and apply scientific knowledge and in a variety of complex life situations. They can link different information sources and explanations and use evidence from those sources to justify decisions. They clearly and consistently demonstrate advanced scientific thinking and reasoning, and they use their scientific understanding to solve unfamiliar scientific and technological situations. Students at this level can use scientific knowledge and develop arguments in support of recommendations and decisions that centre on personal, social or global situations. Virtually no students in Mexico reach the Level 6 in science (OECD countries average 1.1%, G20 countries average 1%, countries with similar GDP per capita average 0.3%). In Singapore, the percentage is 4.6%, in Shanghai-China 3.9%, in New Zealand 3.6%, in Finland 3.3% and in Australia 3.1%.
Students proficient at the PISA science Level 5 can identify the scientific components of many complex life situations, apply both scientific concepts and knowledge about science to these situations, and can compare, select and evaluate appropriate scientific evidence for responding to life situations. Students at this level can use well-developed inquiry abilities, link knowledge appropriately and bring critical insights to situations. They can construct explanations based on evidence and arguments that emerge from their critical analysis. In Mexico 0.2% of students reach this level (OECD countries average 8.5%). In Shanghai-China it is 24.3%, in Singapore 19.9%, in Finland 18.7%, in New Zealand 17.6% and in Japan, Hong Kong-China and Poland 7.5% and Turkey 1.1%.
Notes
1. Defined here as the share of students in their country whose PISA index of economic, social and cultural status is below one standard deviation of the international mean.

3
37STRONG PERFORMERS AND SUCCESSFUL REFORMERS IN EDUCATION: LESSONS FROM PISA FOR MEXICO © OECD 2010
Internal Benchmarking: What Mexican Schools can learn
from Other Mexican Schools

3inTeRnal benCHmaRKinG: wHaT mexiCan sCHools Can leaRn fRom oTHeR mexiCan sCHools
38 © OECD 2010 STRONG PERFORMERS AND SUCCESSFUL REFORMERS IN EDUCATION: LESSONS FROM PISA FOR MEXICO
inTRoduCTionBecause learning outcomes are correlated to the socio-economic background of students, it is important to consider this factor when looking at student results in PISA. For OECD countries such as Mexico, as well as Turkey, Chile and partner country Brazil, that have a large share of students from disadvantaged backgrounds, this is particularly relevant. The PISA index of economic, social and cultural status (ESCS) attempts to account for differences in background between students and schools. Although the correlation between student performance and higher index levels is positive (i.e. students and schools with higher values in the PISA index of economic, social and cultural status and thus higher socio-economic conditions tend to perform better), the distribution of PISA results for Mexico also shows that performance is not dictated by socio-economic levels.
This chapter reviews the performance of Mexican students in terms of the variation within and between schools, and the impact of socio-economic background on performance. Significantly, the chapter shows that some schools with a relatively low PISA index of economic, social and cultural status perform above average for Mexico, while others (including some private schools with students from relatively advantaged backgrounds) perform below what one could reasonably expect from them, given their socio-economic background.
Box 3.A measuring students’ socio-economic background in Pisa
As discussed in Chapter 1, students’ socio-economic background is summarised in the PISA index of social, economic and cultural status. This index is calculated by taking into consideration the parents’ education and occupations and an array of household possessions. The index is standardised to have a mean of zero and a standard deviation of one across OECD countries. Throughout this report, a student’s socio-economic background refers to the student’s score on this index. A school’s socio-economic background refers to the average socio-economic index of the students attending that school. The average socio-economic index of the students in the country is referred to as the socio-economic profile of the education system. A low score on the index relates to a socio-economically disadvantaged background; a high score on the index relates to a socio-economically advantaged background.
THe RelaTionsHiP of soCio-eConomiC indiCaToRs wiTH PeRfoRmanCeCountries such as Mexico and Turkey with larger proportions of socio-economically disadvantaged students face greater challenges than other countries with smaller percentages of students from disadvantaged backgrounds. PISA 2009 results show that the share of socio-economically disadvantaged students as measured by the PISA index of economic, social and cultural status below -1.0 can explain 46% of the performance variation among OECD countries (PISA 2009 Results Volume I, Figure I.2.4). Mexico is the country with the highest percentage of 15-year-old participating students with a PISA index of economic, social and cultural status below -1.0, with 58.2%, followed by Turkey with 58.0% and then Chile with 37.2%.
When controlling for these and other socio-economic indicators presented in Table 3.1, Mexico’s reading performance, adjusted by the share of participating students with a PISA index of economic, social and cultural status below -1.0, increases from 425 to 474, placing it on par with Luxembourg and above Austria, the Czech Republic, Israel and the Slovak Republic.
The PISA index of economic, social and cultural status varies considerably, across OECD countries, ranging from 0.72 for Iceland to -1.22 for Mexico with the lowest mean country value, more than one standard deviation below the average OECD student. The socio-economic profile of the education system in Mexico for 2009 remained unchanged since 2000 (PISA 2009 Results Volume V, Table V.4.2).

3inTeRnal benCHmaRKinG: wHaT mexiCan sCHools Can leaRn fRom oTHeR mexiCan sCHools
39STRONG PERFORMERS AND SUCCESSFUL REFORMERS IN EDUCATION: LESSONS FROM PISA FOR MEXICO © OECD 2010
[Part 1/2]
Table 3.1 socio-economic indicators and the relationship with performance in reading
Socio-economic indicators
Mean performance
on the reading scale
GDP per capita (in equivalent
USD converted using PPPs)1
Cumulative expenditure per student between 6 and 15 years(in equivalent
USD converted using PPPs)1
Percentage of the population
in the age group 35-44 years with tertiary education1
Proportion of 15-year-
olds with an immigrant
background
Share of students in their country whose PISA index of
economic, social and cultural
status is below -1
15-year-old student
population Average index
OEC
D Australia 515 37 615 72 386 37.6 19.3 3.4 240 851 0.20Austria 470 36 839 97 789 19.3 15.2 8.4 87 326 0.05Belgium 506 34 662 80 145 35.3 14.8 9.0 119 140 0.18Canada 524 36 397 80 451 54.2 24.4 3.7 360 286 0.42Chile 449 14 106 23 597 24.4 0.5 37.2 247 270 -0.82Czech Republic 478 23 995 44 761 14.4 2.3 9.2 113 951 -0.33Denmark 495 36 326 87 642 37.1 8.6 7.2 60 855 0.45Estonia 501 20 620 43 037 34.6 8.0 6.7 12 978 -0.12Finland 536 35 322 71 385 43.8 2.6 3.9 61 463 0.62France 496 32 495 74 659 31.2 13.1 13.9 677 620 0.00Germany 497 34 683 63 296 26.7 17.6 8.2 766 993 -0.14Greece 483 27 793 48 422 26.5 9.0 17.7 93 088 -0.30Hungary 494 18 763 44 342 19.0 2.1 19.1 105 611 -0.47Iceland 500 36 325 94 847 36.2 2.4 3.5 4 410 0.68Ireland 496 44 381 75 924 36.8 8.3 10.4 52 794 0.45Israel 474 26 444 53 321 45.9 19.7 12.7 103 184 -0.10Italy 486 31 016 77 310 15.2 5.5 21.4 506 733 -0.23Japan 520 33 635 77 681 48.4 0.3 7.9 1 113 403 0.71Korea 539 26 574 61 104 42.5 0.0 15.8 630 030 0.28Luxembourg 472 82 456 155 624 28.4 40.2 16.1 5 124 0.67Mexico 425 14 128 21 175 15.7 1.9 58.2 1 305 461 -1.33Netherlands 508 39 594 80 348 32.5 12.1 6.5 183 546 0.30New Zealand 521 27 020 48 633 39.9 24.7 8.6 55 129 -0.28Norway 503 53 672 101 265 38.4 6.8 2.4 57 367 0.94Poland 500 16 312 39 964 18.8 0.0 20.7 448 866 -0.52Portugal 489 22 638 56 803 14.5 5.5 33.5 96 820 -0.69Slovak Republic 477 20 270 32 200 13.9 0.5 10.4 69 274 -0.46Slovenia 483 26 557 77 898 23.7 7.8 10.2 18 773 -0.03Spain 481 31 469 74 119 32.6 9.5 29.0 387 054 -0.13Sweden 497 36 785 82 753 32.7 11.7 5.1 113 054 0.31Switzerland 501 41 800 104 352 36.4 23.5 11.1 80 839 0.26Turkey 464 13 362 12 708 10.6 0.5 58.0 757 298 -1.46United Kingdom 494 34 957 84 899 33.0 10.6 5.6 683 380 0.32United States 500 46 434 105 752 43.0 19.5 10.4 3 373 264 0.56Source: OECD, Education at a Glance 2010: OECD Indicators.
[Part 2/2]
Table 3.1 socio-economic indicators and the relationship with performance in reading
Adjusted performance on the reading scale
Reading performance adjusted by
GPD per capita
Reading performance adjusted by cumulative
expenditure per student between 6 and 15 years
Reading performance adjusted by GDP per capita and the
percentage of the age group 35-44 years
with tertiary education
Reading performance adjusted by the proportion of
15-year-olds with an immigrant background
Reading performance adjusted by the share of students in their country whose PISA index of economic, social and cultural status is below -1
Reading performance adjusted by the size of the 15-year-old student population
OEC
D Australia 513 514 506 512 502 515Austria 468 463 488 469 463 470Belgium 505 503 500 505 499 505Canada 522 522 492 520 512 524Chile 457 460 455 452 475 449Czech Republic 482 484 499 480 472 478Denmark 493 490 487 495 486 494Estonia 506 507 494 502 492 500Finland 535 535 518 538 523 535France 495 494 495 495 495 496Germany 496 499 502 495 490 498Greece 485 488 487 483 486 482Hungary 500 500 509 496 499 494Iceland 499 494 494 502 487 500Ireland 490 494 488 496 491 495Israel 476 478 452 471 472 473Italy 487 484 508 487 493 486Japan 519 518 496 523 512 521Korea 542 541 522 542 540 540Luxembourg 451 451 481 464 474 471Mexico 433 437 443 428 474 427Netherlands 505 506 507 508 499 508New Zealand 523 526 507 517 514 520Norway 494 495 495 504 489 503Poland 507 508 515 503 507 501Portugal 493 492 511 491 510 489Slovak Republic 483 486 498 480 472 477Slovenia 485 481 493 484 478 482Spain 481 480 479 481 497 481Sweden 496 494 496 497 486 497Switzerland 496 492 495 497 496 500Turkey 472 478 488 467 513 465United Kingdom 493 490 492 494 484 495United States 494 491 485 497 495 506
Source: OECD, Education at a Glance 2010: OECD Indicators.

3inTeRnal benCHmaRKinG: wHaT mexiCan sCHools Can leaRn fRom oTHeR mexiCan sCHools
40 © OECD 2010 STRONG PERFORMERS AND SUCCESSFUL REFORMERS IN EDUCATION: LESSONS FROM PISA FOR MEXICO
VaRiabiliTy in soCio-eConomiC baCKGRound The range of students’ socio-economic background in Mexico places it as one of the countries with the largest student variability. Variability of socio-economic background among schools in Mexico is also one of the broadest, although less so than for students. Figures 3.1 and 3.2 show the range between the 25th and 75th percentile of
Countries are ranked in ascending order of the interquartile range of the distribution of student-level socio-economic background. Source: OECD, PISA 2009 Database, Table II.5.2.
-2.5 -2.0 -1.5 -1.0 -0.5 0 0.5 1.0 1.5 2.0PISA index of economic,social and cultural status
Dubai (UAE)Czech Republic
NorwaySlovak Republic
AustriaJapan
New ZealandAustralia
QatarUnited Kingdom
PolandChinese Taipei
RomaniaSingapore
SwedenFinland
Macao-ChinaKorea
CanadaCroatia
IsraelGermany
KazakhstanIreland
Trinidad and TobagoEstonia
SwitzerlandNetherlands
DenmarkRussian Federation
OECD averageIceland
United StatesMontenegro
HungarySerbia
SloveniaLiechtenstein
BelgiumLatvia
BulgariaKyrgyzstan
Hong Kong-ChinaItaly
AlbaniaAzerbaijan
GreeceLuxembourg
JordanLithuania
Shanghai-ChinaIndonesia
SpainChile
PortugalArgentina
PeruTurkeyBrazil
UruguayThailand
ColombiaMexicoTunisia
Panama
25th 75th
Percentiles
• Figure 3.1 •Range of students’ socio-economic background in participating countries and economies
Countries are ranked in ascending order of the interquartile range of the distribution of student-level socio-economic background. Source: OECD, PISA 2009 Database, Table II.5.2.

3inTeRnal benCHmaRKinG: wHaT mexiCan sCHools Can leaRn fRom oTHeR mexiCan sCHools
41STRONG PERFORMERS AND SUCCESSFUL REFORMERS IN EDUCATION: LESSONS FROM PISA FOR MEXICO © OECD 2010
Countries are ranked in ascending order of the interquartile range of the distribution of school-level socio-economic background. Source: OECD, PISA 2009 Database, Table II.5.2.
-2.5 -2.0 -1.5 -1.0 -0.5 0 0.5 1.0 1.5 2.0PISA index of economic,social and cultural status
NorwaySwedenFinland
Czech RepublicSingapore
EstoniaIreland
NetherlandsCanada
United KingdomMacao-China
PolandKazakhstan
AustraliaIceland
DenmarkChinese Taipei
New ZealandCroatia
Russian FederationSlovak Republic
JapanSwitzerland
KoreaSerbiaJordanAustriaLatvia
RomaniaOECD average
QatarKyrgyzstan
Hong Kong-ChinaTrinidad and Tobago
GreeceLithuania
IsraelSlovenia
GermanyBulgaria
MontenegroUnited States
AlbaniaDubai (UAE)
SpainPortugalBelgium
LuxembourgLiechtenstein
HungaryItaly
BrazilAzerbaijan
Shanghai-ChinaUruguay
TurkeyTunisia
IndonesiaChile
ArgentinaColombia
MexicoPeru
ThailandPanama
25th 75th
Percentiles
• Figure 3.2 • Range of schools’ socio-economic background in participating countries and economies
the socio-economic background of students and schools for Mexico in the context of participating countries and economies. Longer bars indicate more diverse background of students and schools within the school system, and the placement along the PISA index of economic, social and cultural status axis indicates the relative level of socio-economic background.
Countries are ranked in ascending order of the interquartile range of the distribution of school-level socio-economic background. Source: OECD, PISA 2009 Database, Table II.5.2.
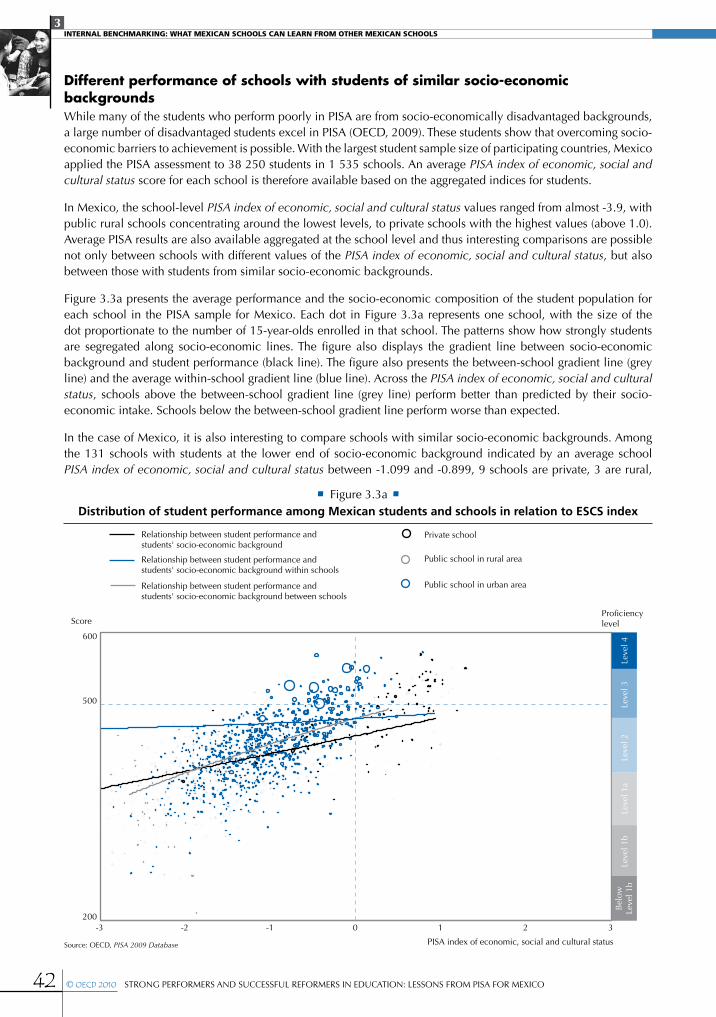
3inTeRnal benCHmaRKinG: wHaT mexiCan sCHools Can leaRn fRom oTHeR mexiCan sCHools
42 © OECD 2010 STRONG PERFORMERS AND SUCCESSFUL REFORMERS IN EDUCATION: LESSONS FROM PISA FOR MEXICO
Different performance of schools with students of similar socio-economic backgroundsWhile many of the students who perform poorly in PISA are from socio-economically disadvantaged backgrounds, a large number of disadvantaged students excel in PISA (OECD, 2009). These students show that overcoming socio-economic barriers to achievement is possible. With the largest student sample size of participating countries, Mexico applied the PISA assessment to 38 250 students in 1 535 schools. An average PISA index of economic, social and cultural status score for each school is therefore available based on the aggregated indices for students.
In Mexico, the school-level PISA index of economic, social and cultural status values ranged from almost -3.9, with public rural schools concentrating around the lowest levels, to private schools with the highest values (above 1.0). Average PISA results are also available aggregated at the school level and thus interesting comparisons are possible not only between schools with different values of the PISA index of economic, social and cultural status, but also between those with students from similar socio-economic backgrounds.
Figure 3.3a presents the average performance and the socio-economic composition of the student population for each school in the PISA sample for Mexico. Each dot in Figure 3.3a represents one school, with the size of the dot proportionate to the number of 15-year-olds enrolled in that school. The patterns show how strongly students are segregated along socio-economic lines. The figure also displays the gradient line between socio-economic background and student performance (black line). The figure also presents the between-school gradient line (grey line) and the average within-school gradient line (blue line). Across the PISA index of economic, social and cultural status, schools above the between-school gradient line (grey line) perform better than predicted by their socio-economic intake. Schools below the between-school gradient line perform worse than expected.
In the case of Mexico, it is also interesting to compare schools with similar socio-economic backgrounds. Among the 131 schools with students at the lower end of socio-economic background indicated by an average school PISA index of economic, social and cultural status between -1.099 and -0.899, 9 schools are private, 3 are rural,
• Figure 3.3a • Distribution of student performance among Mexican students and schools in relation to ESCS index
200
500
-3 -2 -1 0 1 2 3
Score
PISA index of economic, social and cultural status
Proficiencylevel
Relationship between student performance and students' socio‐economic background
Relationship between student performance and students' socio-economic background within schools
Relationship between student performance and students' socio‐economic background between schools
Private school
Public school in rural area
Public school in urban area
Bel
owLe
vel 1
bLe
vel 1
aLe
vel 2
Leve
l 3Le
vel 4
Leve
l 1b
600
Source: OECD, PISA 2009 Database

3inTeRnal benCHmaRKinG: wHaT mexiCan sCHools Can leaRn fRom oTHeR mexiCan sCHools
43STRONG PERFORMERS AND SUCCESSFUL REFORMERS IN EDUCATION: LESSONS FROM PISA FOR MEXICO © OECD 2010
and 119 are public urban. Average performance of the schools within this relatively narrow range, however, varies greatly. Within this socio-economic range, the difference between the highest and lowest averages for schools is almost 200 score points, with public urban schools performing between 330 and 528 score points. The private schools within this range had average scores between 408 and 461 and public rural schools between 350 and 461. Within this range, 6 schools performed above the OECD average of 493 score points, and 9 schools have average scores higher than the country average for Mexico of 425. These results should also be considered in light of the fact that the correlation between a school’s value in the PISA index of economic, social and cultural status and the index of quality of a school’s educational resources is by far the highest for Mexico (0.59) among OECD countries (PISA 2009 Results Volume II, Figure II.2.3).
At the other end of the socio-economic spectrum of students in Mexico, 70 out of 71 schools with an average value in the PISA index of economic, social and cultural status between 0.5 and 1.5 are private. Among these however, 1 out of 3 private schools scores below the OECD average and 6 schools have scores below the country average for Mexico. Among the 71 schools within this socio-economic range, average scores varied from below the country average for Mexico (408) to well above the OECD average (572). Figure 3.3b shows the two ranges discussed here (-1.099 to -0.899 and 0.5 to 1.5).
• Figure 3.3b • Distribution of student performance among Mexican students and schools in relation to ESCS index
(selected ranges)
200
500
-3 -2 -1 0 1 2 3
Score
PISA index of economic, social and cultural status
Proficiencylevel
Bel
owLe
vel 1
bLe
vel 1
aLe
vel 2
Leve
l 3Le
vel 4
Leve
l 1b
600
Relationship between student performance and students' socio‐economic background
Relationship between student performance and students' socio-economic background within schools
Relationship between student performance and students' socio‐economic background between schools
Private school
Public school in rural area
Public school in urban area
These comparisons show that performance varies considerably between schools serving students from similar socio -economic backgrounds in Mexico, as measured by the PISA index of economic, social and cultural status. Even among schools with students from relatively disadvantaged backgrounds (with an index score circa -1.0), Mexican schools show that relatively higher performance is possible. Conversely, even among private schools that serve students from higher socio-economic backgrounds, performance varies considerably. Thus, results suggest that there are things that Mexican schools can learn from other Mexican schools that are doing more with similar students from similar backgrounds.
Source: OECD, PISA 2009 Database


4
45STRONG PERFORMERS AND SUCCESSFUL REFORMERS IN EDUCATION: LESSONS FROM PISA FOR MEXICO © OECD 2010
a long-Term perspective for Mexico:
Some lessons from Today’s Top performing Education Systems

4a lonG-TeRm PeRsPeCTiVe foR mexiCo: some lessons fRom Today’s ToP PeRfoRminG eduCaTion sysTems
46 © OECD 2010 STRONG PERFORMERS AND SUCCESSFUL REFORMERS IN EDUCATION: LESSONS FROM PISA FOR MEXICO
inTRoduCTionThis chapter draws together the evidence from PISA and an examination of a selection of today’s highest performing education systems – Canada, Finland, Japan, Singapore and Shanghai-China - in order to provide a long-term perspec-tive for educational improvement in Mexico. PISA defines countries as high performing if almost all of their students are in high school at the appropriate age; the top quarter of performers place among the countries whose top quarter are among the best performers in the world, with respect to their mastery of the kinds of complex knowledge and skills nee-ded in advanced economies as well their ability to apply that knowledge and those skills to problems with which they are not familiar; student performance is only weakly related to their socio-economic background; and spending per pupil is not at the top of the league tables. Put another way, PISA defines superior performance as high participation, high quality, high equity and high efficiency.
Since the start of his administration, President Calderon set forth important education reform initiatives. In 2007, the Mexican government set public targets for improvements in student learning outcomes relating to PISA (discussed in Chapter 1) and the national ENLACE assessment (Evaluación Nacional del Logro Académico en Centros Escolares) for 2012. In May 2008, the Mexican Government and the National Union of Educational Workers (SNTE), the largest trade union in Latin America, jointly launched the Alliance for Educational Quality to promote innovative educational policies and to mobilise human, material and institutional resources to improve student learning outcomes. The OECD has assisted the Mexican Government with advice in this process (see Box 4.A).
2008 also brought the first national teachers’ examination in Mexico for those candidates wishing to become tenured teachers after finishing teacher education programmes or with temporary assignments. The competitive and public nature of the national exam for tenured positions, administered to over 80 000 candidates in its first year, marked an important milestone in modernising Mexico’s policies relating to improving the quality of its teaching force. As discussed later in this chapter, excellence in teaching and school leadership through effective recruitment, development, rewarding and retaining of effective teachers and principals are central to today’s high-performing education systems.
Box 4.A The Co-operation agreement “improving education in mexican schools”
The Mexican government and the OECD established the Co-operation Agreement “Improving Education in Mexican Schools” in 2008. The purpose of the two-year agreement was to provide the Mexican government with relevant policy advice and recommendations in support of ongoing and future reform efforts in Mexico to improve educational outcomes, based on a review of international practices, evidence and OECD research. The results of this work have been presented in the following reports: Establishing a Framework for Evaluation and Teacher Incentives: Considerations for Mexico, Improving Schools: Strategies for Action in Mexico, and Evaluating and Rewarding the Quality of Teachers: International Practices. In addition, an updated edition of the OECD report on evaluating school contributions to student learning using value-added methods entitled La medición del aprendizaje de los alumnos: Mejores prácticas para evaluar el valor agregado de las escuelas has also been produced. Recommendations provided to Mexico by the OECD are presented in these reports.
PISA results for Mexico and other countries show that improvement is not only possible, but that it can happen within a relatively short period – within six years, for example, which is the term length of a federal administration in Mexico. As discussed in Chapter 1, Mexico has shown significant progress in the past decade in terms of student achievement and the enrolment of 15-year-olds. Results in PISA between 2003 and 2009 show particularly strong improvement in mathematics, making Mexico the country with the largest increase (33 score points) in its country mean score. Mexico thus seems to be on the way, if performance improvement trends are maintained, to reaching the government’s target in PISA for 2012.
Furthermore, the large variation of performance between Mexican schools, even between those serving students from similar socio-economic backgrounds (discussed in Chapter 3), shows that improved performance is not limited by socio-economic constraints and that Mexican schools can perhaps learn from other Mexican schools. However, Mexico’s results compared to other OECD and G20 countries and to countries with a similar level of GDP per capita (as discussed in Chapter 2), show that further improvement is urgently needed.

4a lonG-TeRm PeRsPeCTiVe foR mexiCo: some lessons fRom Today’s ToP PeRfoRminG eduCaTion sysTems
47STRONG PERFORMERS AND SUCCESSFUL REFORMERS IN EDUCATION: LESSONS FROM PISA FOR MEXICO © OECD 2010
National and sub-national (e.g. state) education systems are very complex. The way they function is highly dependent upon their interaction with other systems that are no less complex and with cultural, political, social and economic factors that have a direct bearing on the goals and effectiveness of education systems. Thus, for a complex federal system such as Mexico’s, policy elements need to be considered within the conditions, constraints and opportunities at national and state levels.
One might suppose that there is a single best way to organise a national or state education system to achieve world-class status. But the experience from the top performing countries and economies discussed here suggests otherwise. Reform experiences in these countries and economies suggest that nations tend to go through a natural progression of education development that loosely follows their trajectory of economic development. The education development progression is characterised by a movement from relatively low teacher quality to relatively high teacher quality; from a focus on low-level, basic skills to a focus on high-level, complex skills and creativity; from Tayloristic1 forms of work organisation to professional forms of work organisation, from primary accountability to superiors to primary accountability to one’s professional colleagues, parents and the public; and from a belief that only some students can and need to achieve high learning standards to a conviction that all students need to meet such high standards.
An analysis of the high performing education systems suggests that the processes of development and the ingredients of top performance are far from random. Common underlying principles of educational success are summarised below and are the focus of this chapter.2
leaRninG fRom ToP PeRfoRminG eduCaTion sysTems
Developing a commitment to education and acceptance among all stakeholders that all students can achieve at high levelsIn countries with limited natural resources, such as Finland, Singapore and Japan, education appears to have high status at least in part because the public at large has understood that the country must live by its human resources and its human resources depend on the quality of its education. That is, the value that a country places on education depends in part on that country’s view of how human capital fits into the way it generates income and livelihoods. Placing a high value on education may be an underlying condition for building a world-class education system and it may be that most countries that have not had to live by the quality of their human resources in the past will not succeed unless their political leaders explain why they must do so now and certainly in the future.
But placing a high value on education will get a country only so far if the teachers, parents and citizens of that country believe that only some subset of the nation’s children can or need to achieve high standards. This is a subtle but important point. Germany is a country in which it was widely assumed until recently that the children of working class people would themselves get working class jobs and would not profit from the curriculum offered by the Gymnasium. PISA shows these attitudes to be mirrored in the perception of students about their own educational future. While in Germany only a quarter of 15-year-olds in PISA said that they expect to go on to university, fewer than those who actually will, in Japan and Korea it is nine out of 10 students. The results of these differences can also be seen in the distribution of student performance within each of these countries and in the impact that socio-economic background has on learning.
Furthermore, societies may also subscribe to a widespread view that student achievement is mainly a product of inherited intelligence, not effort and hard work. At times, teachers may feel guilty pressing students whom they perceive to be less capable to achieve at higher levels because they think it unfair to the student to do so. In a country such as Mexico where smaller, often rural community schools may serve indigenous students from lower socio-economic backgrounds whose first language is different from Spanish, expectations may play a vital role. Teachers, for example, may establish goals that enable each student to achieve up to that student’s perceived ability rather than to achieve high universal standards.
In Canada, Finland, Japan, Singapore, Shanghai-China and Hong Kong-China, parents, teachers and the public at large tend to share the belief that all students are capable of achieving high standards and need to do so. Recognising that the road to dropping out from high schools starts early, Ontario created the “Student Success Initiative” in high schools. Rather than sending out a team from the ministry, they gave the districts money to hire a “Student Success Leader” to co-ordinate efforts in their district. The ministry also gave money for the district leaders to meet and share

4a lonG-TeRm PeRsPeCTiVe foR mexiCo: some lessons fRom Today’s ToP PeRfoRminG eduCaTion sysTems
48 © OECD 2010 STRONG PERFORMERS AND SUCCESSFUL REFORMERS IN EDUCATION: LESSONS FROM PISA FOR MEXICO
strategies. Again each high school was given support to hire a provincially-funded Student Success teacher and was required to create a Student Success team to track early indicators of academic struggles and design appropriate interventions.3 The outcomes of this work have changed Ontario’s system profoundly and within a few years the high school graduation rate increased from 68% to 79%.
With a different institutional setup, Finland’s special teachers fulfil a similar role of early diagnosis and support, working closely with the class teachers to identify students in need of extra help and to work individually or in small groups with struggling students to provide the extra help and support they need to keep up with their classmates. It is not left solely to the discretion of the regular class teacher to identify a problem and alert the special teacher, every comprehensive school has a “pupils’ multi-professional care group” that meets at least twice a month for two hours and which consists of the principal, the special education teacher, the school nurse, the school psychologist, a social worker, and the teachers whose students are being discussed. The parents of any child being discussed are contacted prior to the meeting and are sometimes asked to be present. Underpinning the entire Singaporean education system is the belief – for students of all ethnic backgrounds and all ranges of ability – that education is the route to advancement and that hard work and effort pay off. The government has developed a wide range of educational and social policies to advance this goal, with early intervention and multiple pathways to education and career. The success of the government’s economic and educational policies has brought about immense social mobility that has created a shared sense of national mission and made cultural support for education a near-universal value.
Establishing ambitious public goals that are viable and that implicate all students at different performance levels is thus important. The performance targets set by the Mexican government for PISA and the percentage of students achieving certain attainment levels in the national ENLACE assessment are an important start towards setting higher expectations The challenge ahead in Mexico will be to continue to foster higher expectations and to support them with student and school support systems that characterise today’s most advanced education systems.
establishing ambitious, focused and coherent educational standards that are shared across the system and aligned with high stakes gateways and instructional systemsResults from PISA suggest that, across OECD countries, schools and countries where students work in a climate characterised by high performance expectations and the readiness to invest effort, good teacher-student relations and high teacher morale tend to achieve better results.
One trend across countries over recent years has been for countries to articulate the expectations that societies have in relation to learning outcomes and to translate these expectations into educational goals and standards. High performing countries and economies have developed world class academic standards for their students and these tend to be a consistent predictor for the overall performance of education systems. The approaches to standard-setting in OECD countries range from the definition of broad educational goals up to the formulation of concise performance expectations in well-defined subject areas. Whatever the approach, such standards shape high performing education systems by establishing rigorous, focused and coherent content at all grade levels; reducing overlap in curricula across grades; reducing variation in implemented curricula across classrooms; facilitating co-ordination of various policy drivers ranging from curricula to teacher training; and reducing inequity in curricula across socio-economic groups.
For a country such as Mexico that has a wide variety of educational contents across and within states, clear and rigorous common national standards are an important means to address discrepancies. The concept of equity, in this sense, relates to the expected results for all students, as reflected in clear standards that ensure that all students are equally prepared for life and the labour market.
Most countries have incorporated their standards into systems of high quality curricula and external examinations at the secondary school level that are used to construct clear gateways for students either into the workforce and good jobs or to the next stage of education, or both.4 High performing education systems are focused on the acquisition of complex, higher order thinking skills and, in many, on the application of those skills to real-world problems. The re-organisation of traditional subjects into ‘learning domains’ as they are referred to in Shanghai-China provides a more recent example of such efforts.
For that reason, examinations in high performing systems do not solely rely all on multiple-choice computer-scored tests, which educators in these countries believe cannot properly measure higher order thinking skills in and of

4a lonG-TeRm PeRsPeCTiVe foR mexiCo: some lessons fRom Today’s ToP PeRfoRminG eduCaTion sysTems
49STRONG PERFORMERS AND SUCCESSFUL REFORMERS IN EDUCATION: LESSONS FROM PISA FOR MEXICO © OECD 2010
themselves. Instead, essay-type responses on timed examinations are commonly used and educators also factor into the grade pieces of course work that could not possibly be produced in a timed examination. Many nations also use oral examinations. Multiple-choice computer-scored tests are a good starting point, particularly for assessments that do not have serious impacts on the trajectory of students, but other instruments may be more suitable to assess higher-order thinking skills and competencies on examinations that define gateways for students.
In some of the countries, when the exams are over, newspapers publish many of the exam questions, mostly prompts for the students to write short essays, and the ministry publishes examples of answers that earned top grades. In this way, students, parents and teachers all learn what is considered to be high quality student work and students can compare their own work to a clear example of work that meets the standard. The standard in such systems consists of the narrative statements of what students should know and be able to do, the questions asked in the exams and the responses of the students who earned good grades on the exams.
Often these examinations are linked to national qualifications systems. In countries with systems of this sort, one cannot go on to the next phase of one’s education or begin a career in a particular field without a document showing that one is qualified to do so, according to a set of rules and standards laid down by the state. Everyone knows what is required to get a given qualification, in terms both of the content studied and the level of performance that has to be demonstrated to earn it. Countries using qualifications systems typically establish key gateways for students in their systems, one of the most important of which is a gateway that lies at the end of lower secondary education and the beginning of upper secondary education. In most of the countries studied, all students are expected to master a common curriculum by the age of 15 or 16. Then they pursue more individualised paths. Which opportunities are available to them is a function of the qualifications they have earned. Much the same thing happens at the end of upper secondary education and, in some countries, the end-of-school examination determines access to university.
There is a finality about a qualifications system, however, that seems threatening. Indeed some qualifications systems are set up as screening and sorting systems, and those designed with that purpose can have a serious and lasting impact on students. However, even in the most exam-driven education systems in East Asia, there are considerable efforts underway to address these weaknesses while maintaining their strengths. As Chinese phraseology puts it, public examinations are conceived as the baton that conducts the entire orchestra, and rather than removing the baton, the East Asian countries are placing emphasis on adapting the baton so that it conducts good music.
Perhaps more importantly, examination systems do not have to be set up that way. In Sweden, and a number of other northern European countries, the qualifications systems are established so that it is never too late to earn a given qualification. In such systems, it cannot be said that one has failed the exams, but only that one has not yet succeeded in them. Perhaps it is not a coincidence that Sweden is also the OECD country with the highest incidence and intensity of adult learning in both formal and non-formal education, and the country with the highest level of adult literacy and numeracy skills too. In Sweden and most of the Northern European countries, one can get an upper-secondary school certificate in any adult education centre, and, because the exam is exactly the same, everyone views the 45-year-old who just got her diploma as having met a standard every bit as high as the student who got one at the usual age.
In such systems, where it is never too late to get any qualification, the advantage of having a qualification system is that the examinations are always available and the standards are never lowered or waived. Students know that they have to take tough courses and study hard in order to get the qualification and so they do. One does not get to go on to the next stage simply because one has put in the requisite time. One gets to move on only if one has met the requisite performance standards. This is a system with very high stakes for the students. There are typically low or no stakes for the teachers in these systems. The result is a higher standard of education across the whole society than is the case in a society that is forever waiving the standards to give students second chances. It is true that high-stakes examination systems can lead to a focus on test preparation at the expense of real learning, the development of large private tutoring industries that tend to favour the wealthy and incentives for cheating. These dangers are real and systems attempt to address these issues. Experience from high performing education systems shows that these dangers can be mitigated.
Because the examinations are typically externally graded, the teacher, student and parents feel that they are all on the same side, working to the same end, and one never sees the situation in which parents go to the school administration to change the grade of a student, pitting the teacher who wants to preserve some standard against parents who want the best possible future for their children. Parents and students know that neither the teacher

4a lonG-TeRm PeRsPeCTiVe foR mexiCo: some lessons fRom Today’s ToP PeRfoRminG eduCaTion sysTems
50 © OECD 2010 STRONG PERFORMERS AND SUCCESSFUL REFORMERS IN EDUCATION: LESSONS FROM PISA FOR MEXICO
nor the administration can change the grade, and therefore the only way to improve the outcome for the student is for the student to work harder and do better work. In many of those countries, training for teachers is focused on enabling them to teach those required courses to their students well.
In the countries that use these systems, the best minds in the country determine what topics will be taught in what sequence through the grades and in some countries, the officials responsible for specifying the curriculum framework also play an important part in supervising the writing of the textbooks. The result is a powerful, coherent system of instruction that is available to all students.
There are recent and ongoing experiences and reform efforts in Mexico pertaining to the establishment of content and performance standards for students. To map out Mexico’s course for long-term improvement, further steps need to include the development of world-class standards for all the subjects in the core curriculum, to create carefully considered curriculum frameworks for those subjects that can guide the work of teachers and instructional materials publishers, to develop examinations focused on complex thinking skills to assess whether students have met the standards across the core curriculum, and to create a system of gateways using the new examinations that constitute a well developed qualifications system.
Developing more capacity at the point of delivery
Attracting high quality teachers The quality of an education system cannot exceed the quality of its teachers and principals. Corporations, professional partnerships, national militaries and national governments know that they have to pay attention to how the pool is established from which they recruit; how they recruit; how they select their staff; the kind of initial training their recruits get before they present themselves for employment; how they mentor new recruits and induct them into their service; what kind of continuing training they get; how their compensation is structured; how they reward their best performers and how they either improve the performance of those who are struggling or get rid of them; and how they provide opportunities for the best performers to acquire more status and responsibility.
With respect to the pool from which an industry or an organisation recruits its professionals, the aim generally is to do whatever is possible to generate a pool that comes from the highest possible segment of the general ability distribution. Most firms and industries rely heavily on elementary, secondary and post-secondary institutions to do that sorting for them. That is what the top Japanese ministries are doing when they decide to recruit from the University of Tokyo. They are more interested in these institutions because they believe they are good at getting the very best in terms of what the Japanese call “applied intelligence” than because of the specific knowledge and skill they are buying.
Because no industry can afford to source its professionals from a uniformly high slice of the general cognitive ability pool, they structure their operations so that they can put the best of the best in key positions and use others who may not be quite as good in supporting positions. More often than not, they use pyramidal structures which both permit them to make the most of their best professionals and put those of lesser ability in supporting positions.
So what determines the pool from which an entire industry can select? It varies, but the country profiles suggest that it includes some combination of the social status associated with the occupation and work, the sense of personal contribution one can make and the financial rewards one can expect. In some countries the status of the teaching profession has changed significantly. Finland raised the social status of its teachers to a level where there are few occupations that have higher social status than teaching. Finnish teachers have earned the trust of parents and the wider society by their demonstrated ability to use professional discretion and judgement in the way they manage their classrooms and respond to the challenge of helping virtually all students become successful learners. In 2010 over 6 600 applicants competed for 660 available slots in primary school preparation programmes in the eight universities that educate teachers.5 While teachers in Finland have always enjoyed a degree of respect in society, a combination of raising the bar for entry into the profession and granting teachers greater autonomy and control over their classrooms and working conditions than their peers enjoy elsewhere, has helped to raise the status of the profession and make teaching the single most desirable career choice among young Finns. Consequently, teaching is now a highly selective occupation in Finland, with highly-skilled, well-trained teachers spread throughout the country. Also in the traditionally Confucian cultures, teachers have long had higher social status than is generally true in the West. In some of the East Asian countries, teachers’ compensation is fixed by law to make sure that teachers are among the highest paid of all positions in the civil service.

4a lonG-TeRm PeRsPeCTiVe foR mexiCo: some lessons fRom Today’s ToP PeRfoRminG eduCaTion sysTems
51STRONG PERFORMERS AND SUCCESSFUL REFORMERS IN EDUCATION: LESSONS FROM PISA FOR MEXICO © OECD 2010
By raising the bar to entering the teaching profession, these systems discourage young people with poor qualifications from entering teaching and attract people with high qualifications. Capable young people who could go into high status occupations are not likely to enter an occupation that the society perceives as easy to get into and therefore likely to attract people who could not get into more demanding occupations.
Developing and retaining high quality teachersAt the same time, recruitment of top performing graduates can only be one of several components of human resource management in education. Ontario provides a compelling case for how a successful reform trajectory began not by waiting for a new generation of teachers but with investing in the existing schools and teachers, wherever they stood, enlisting their commitment to reform and supporting their improvement. This involved extensive capacity building in schools as well as the system and quarterly meetings between the system leaders with the major teachers’ unions, superintendents’ organisations and principal associations to discuss ongoing reform strategies.6
In Germany and Japan, once teachers have completed their pre-service training and begun their teaching service, they enter with one or two years of heavily supervised teaching; during such a period the new teacher typically receives a reduced workload, strong mentoring by master teachers and continued formal instruction. In some countries, this initial induction period is also a trial period during which the new teacher can be counselled out of the profession if he or she does not seem likely to become a good teacher.
Singapore’s high quality teaching force is also the result of deliberate policy action, extending from:
•Recruitment and teacher training, where carefully selected prospective teachers receive a monthly stipend that is competitive with the monthly salary for fresh graduates in other fields in exchange for a commitment to teaching for at least three years;
•Through high quality initial training with very close links to schools and a strong emphasis on pedagogical content;
•A close watch on occupational starting salaries and adjustments to salaries for new teachers to ensure that teaching is considered equally as attractive as other occupations for new graduates and different career opportunities;
•An entitlement of 100 hours of professional development per year to keep up with the rapid changes occurring in the world and to be able to constantly improve their practice; 7
•Up to an annual performance appraisal by a number of people and against 16 different competencies8 where teachers who do outstanding work receive a bonus from the school’s bonus pool.
In general, the best performing countries are working to move their initial teacher education programmes toward a model less based on the preparation of academics and more based on the preparation of professionals in clinical settings in which they get into schools earlier, spend more time there and get more and better support in the process. In Finland, for example, there is considerable emphasis on giving prospective teachers the diagnostic skills they will need to find out why particular students are not learning as well as the skills needed to figure out what kind of individual help that student needs to perform up to the standards required. This builds on an approach to teacher education with four distinguishing qualities:
•First, a research-based emphasis that encourages teachers to actively contribute to the knowledge base on effective teaching practices throughout their career, with teacher candidates not only expected to become familiar with the knowledge base in education and human development, but also required to write a research-based dissertation as the final requirement for the Masters degree.
•Second, a strong focus on developing pedagogical content knowledge. Because teacher education in Finland is a shared responsibility between the teacher education faculty and the academic subject faculty, there is substantial attention to subject-specific pedagogy for prospective primary as well as upper-grade teachers.
•Third, all Finnish teachers are trained to diagnose students with learning difficulties and to differentiate their instruction based on the learning needs and styles of their students.
•Fourth, a very strong clinical component which includes both extensive course work on how to teach – with a strong emphasis on using research based on state-of-the-art practice – and at least a full year of clinical experience in a school associated with the university. These model schools are intended to develop and model innovative practices, as well as to foster research on learning and teaching.

4a lonG-TeRm PeRsPeCTiVe foR mexiCo: some lessons fRom Today’s ToP PeRfoRminG eduCaTion sysTems
52 © OECD 2010 STRONG PERFORMERS AND SUCCESSFUL REFORMERS IN EDUCATION: LESSONS FROM PISA FOR MEXICO
Some of the top performing countries in East Asia have ways to make the most of their top-performing teachers. At the school level, the best teachers in these countries typically lead the process of lesson development. The master teachers are also called upon to coach new teachers and to play a key role in analysing the problems of students who are having difficulties with learning. The district and provincial offices of education often identify the best of the teachers who emerge from this process and relieve them of some or all of their teaching duties so that they can give lectures to their peers, provide demonstrations and coach other teachers on a district, provincial and even national scale. Carefully picked schools are often asked to pilot new programmes or policies before they are scaled up and the best teachers in those schools are enlisted as co-researchers to evaluate the effectiveness of the new practices. Indeed, the initial preparation of teachers in those countries includes instruction in research skills; it is expected that teachers will use those skills to generate evidence to improve their practice in a disciplined way. Research is an integral part of what it means to be a professional teacher in those countries.
In most OECD countries, and that is certainly true for Mexico as well, once teachers are hired, it is very hard to remove them from professional service, irrespective of the quality of their work. The high quality of teachers in those countries appears to be a function of the policies in those countries that affect the pool from which teachers are initially drawn, their compensation, the status of teachers, the high standards of entering university programmes preparing teachers, the quality of their initial preparation and the attention given to the quality of their induction into the preparation following their initial induction.
Canada offers an example in which issues of collective bargaining can be successfully separated from professional issues, where teachers and their organisations collaborate effectively with ministry staff in self-governing bodies to govern issues of entry, discipline and the professional development of teachers. Central to success in Ontario in this area was the signing of a four-year collective bargaining agreement with the four major teachers’ unions in which the ministry was able to negotiate items that were consistent both with its educational strategy and with the unions’ interests, thus providing a basis for pushing forward the educational agenda while creating a sustained period of labour peace that allowed for a continued focus on educational improvement.
Unless Mexico raises the professional status of its existing teaching force in similar ways as have been achieved in Ontario, unless it upgrades the pool from which it selects new teachers, is more selective in admitting candidates for initial teacher education and training, greatly improves the quality of that training, finds practical and effective ways of motivating continuous improvement at all levels, greatly improves the process of initial induction and restructures the occupation to provide increased and appropriate responsibilities for the best teachers, then it is unlikely to match the performance of the best-performing countries.
As discussed in the beginning of this chapter, important steps have been taken in Mexico with regards to recruiting, developing, rewarding and retaining effective teachers and principals. These efforts are consistent with the approaches in the high performing systems profiled and identified by performance in PISA. For Mexico to maintain and, indeed, go beyond recent improvement trends however, sustained and focused efforts will be needed for the coming years.
Developing capable school leadersAn effective leadership system for educators in top performing countries and economies appears to provide a supportive framework for professional accountability in which teachers feel more accountable to one another for their performance. Singapore’s approach to leadership is exemplary in this respect and modelled on that found in large corporations, where the key is not just the training programme, but the whole approach to identifying and developing talent. In Singapore, young teachers are continuously assessed for their leadership potential and given opportunities to demonstrate and learn, for example, by serving on committees, then being promoted to head of department at a relatively young age. Some are transferred to the ministry for a period. After these experiences are monitored, potential principals are selected for interviews and go through leadership situational exercises. If they pass these, then they go to National Institute for Education, the country’s sole teacher training institution, for six months of executive leadership training, with their salaries paid. The process is comprehensive, intensive and includes an international study trip and a project on school innovation.
More generally, countries are paying increasing attention to redefining school leadership roles to drive improvements in learning outcomes and to responsibly manage increased school autonomy and accountability. This comes at a time when greater decentralisation in many countries is being coupled with more school autonomy, more accountability for school and student results, a better use of the knowledge base of education and pedagogical

4a lonG-TeRm PeRsPeCTiVe foR mexiCo: some lessons fRom Today’s ToP PeRfoRminG eduCaTion sysTems
53STRONG PERFORMERS AND SUCCESSFUL REFORMERS IN EDUCATION: LESSONS FROM PISA FOR MEXICO © OECD 2010
processes, as well as broader responsibility for supporting the schools’ local communities, other schools and other public services. OECD’s comparative review of school leadership roles identified four groups of interrelated leadership responsibilities as central for improving schooling outcomes:
•First, a focus on supporting, evaluating and developing teacher quality as the core of effective leadership. Leadership responsibilities associated with improved teacher quality include, in particular, coordinating the curriculum and teaching programme, monitoring and evaluating teacher practice, promoting teacher professional development and supporting collaborative work cultures.
•Second, the setting of learning objectives and the implementation of thoughtful assessments to help students develop their full potential. Aligning instruction with central standards, setting school goals for student performance, measuring progress against those goals and making adjustments in the school program to improve individual and overall performance are the dynamic aspects of managing curriculum and instruction. School leaders’ purposeful use of data is essential to ensure that attention is being paid to the progress of every student.
•Third, the strategic use of resources and their alignment with pedagogical purposes to focus all operational activities within the school on the objective of improving teaching and learning.
•Fourth, leadership engagements beyond the school, in partnerships with other schools, communities, social agencies, universities to foster greater cohesion among all those concerned with the achievement and wellbeing of every child.
Providing a work organisation in which teachers can use their potential – management, accountability and knowledge managementMany of the best performing countries have had centralised, bureaucratic and controlling education systems, but most of those countries have rebalanced their systems to provide more discretion to school heads and school faculties. When this is combined with effective accountability systems, evidence shows that this is closely related to school performance.
Once highly centralised systems concluded that top-down initiatives were insufficient to achieve deep and lasting changes in practice, because reforms were focused on things that were too distant from the instructional core of teaching and learning; because reforms assumed that teachers would know how to do things they actually didn’t know how to do; because too many conflicting reforms asked teachers to do too many things simultaneously; or because teachers and schools did not buy in to the reform strategy.
Finland and Ontario, Canada provide examples for how formerly centralised systems have shifted emphasis towards: improving the act of teaching; careful and detailed attention to implementation, along with opportunities for teachers to practice new ideas and learn from their colleagues; the development of an integrated strategy and set of expectations for both teachers and students; and securing support from teachers for the reforms. This is the also the direction towards which Japan and other Asian countries are moving. In some countries, great discretion is given to the faculty as a whole and its individual members. In others, more discretion is given to schools that are doing well and less to those that might be struggling. In some countries, the school head is little more than the lead teacher. In others, the authorities continue to look to the school head to set the direction and manage the faculty. The common element, however, is the degree to which all of these systems are creating forms of work organisation that are moving from bureaucratic management to the kinds of professional forms of work organisation more likely to be found in professional partnerships than in mass production industrial organisations.
What is important here is that a truly professional staff have both the responsibility and the authority to design, manage, budget for and organise the programme of the school in its entirety within the framework provided by the goals, curriculum, examinations and qualifications systems put in place by the state. But a much harder challenge has to do with the importance of trust.
Trust cannot be legislated. Some may therefore argue that this lesson from Finland, for example, may be less relevant for Mexico where issues of trust may be very different, especially if one views trust as a precondition for the kinds of deep institutional reforms embodied in the development of the comprehensive school. But in the case of the relationship between teachers and the larger society, one can argue that trust is at least as much a consequence of important policy decisions as it is a pre-existing condition. Given the respect that teachers have historically enjoyed in Finland, there was a solid base to build on. The combination in Finland, however, of much more rigorous

4a lonG-TeRm PeRsPeCTiVe foR mexiCo: some lessons fRom Today’s ToP PeRfoRminG eduCaTion sysTems
54 © OECD 2010 STRONG PERFORMERS AND SUCCESSFUL REFORMERS IN EDUCATION: LESSONS FROM PISA FOR MEXICO
preparation, coupled with the devolution of much greater decision-making authority over things like curriculum and assessment, enabled teachers to exercise the kind of professional autonomy other professionals enjoy. This trust that was granted to them by the government, coupled with their new-found status as university graduates from highly selective programmes, empowered teachers to practise their profession in ways that deepened the trust afforded them by parents and others in the community.
institutionalising improved instructional practice In some of the top performing countries in Asia, for example, class sizes are larger than expected and teachers typically use whole-group instruction through the entire class period. They also pointed out that, in these countries, one sees little lecturing by the teacher. Instead the teacher gives real world problems to the whole class and, having observed their students attempting to solve those problems, asks several to come to the blackboard to talk about their approaches to the problem, knowing that some of those students have made errors in the strategy they have selected for solving the problem. In Japan and Shanghai-China, for example, the teacher uses these differences in strategy to develop a class discussion that focuses on the underlying concepts involved in solving the problem and thereby promotes a deep understanding of the topic under discussion, bringing along both the quickest and the slowest students in the class as they do so. Nothing could so vividly demonstrate the point that instructional practice matters.
In this way, Japanese teachers maximise their contact time with each student in the class. Students are not whiling away their time when the teacher is dealing with a small group in the classroom. Students who misunderstand some important point in mathematics will find that they can identify with a student who is at the blackboard and has made a similar mistake and can, in effect, get individual attention without monopolising the teachers’ time. Asian teachers often complain about class sizes getting too small to find a useful range of student solutions to a problem in order to conduct a good class, instead of complaining that the class is too large to teach effectively. Japan, along with Korea, has opted for high cumulative expenditure on education, with large class sizes and high teachers’ salaries. Also with large class sizes, Mexico, on the other hand, is one of only four OECD countries to prioritise teachers’ salaries, while spending small amounts in non-salary expenditures compared to other OECD countries.
The Finnish education system pursues very similar goals to those of Japan and Korea, but with different strategies, with a learner-centred approach that places considerable emphasis on student self-assessment, in which students are expected to take an active role in designing their own learning activities and to work collaboratively in teams on projects that cut across traditional subject or disciplinary lines. By the time students enrol in upper secondary school (grades 10-12), they are expected to be able to take sufficient charge of their own learning to be able to design their own individual programme where, without a grade structure, each student proceeds at his or her own pace within the modular structure.
Similarly, the inquiry-based curriculum component in Shanghai-China asks students, with support and guidance from teachers, to identify research topics based on their experiences, seeking to develop the capacity of students to learn to learn, to think creatively and critically, to participate in social life and to promote social welfare. In fact, one very significant change implemented in Shanghai-China through the slogan “return class time to students” was the increase in student activities in classes relative to teachers’ lecturing. This has caused a fundamental change in the perception of a good class, which was once typified by good teaching, with well-designed presentations by the teachers. Videos of model teaching used to concentrate on teachers’ activities. Now, model classes are filmed with two cameras, one of which records student activities. Teachers’ performances are now also evaluated by the time given to student participation and how well student activities are organised.
These are, of course, matters of instructional practice. In Mexico, educators in larger schools often consider matters of instructional practice to be entirely in the purview of the individual teacher in his or her classroom. In countries as different as Finland, Japan or Shanghai-China, however, the practice of individual teachers is a matter for all the teachers in the school and beyond.
Teachers work together to produce lessons that are superior in their power to engage students in the work and to convey the knowledge and skills specified in the syllabus. Because teachers work together on this, no teacher’s classroom is private. It is not uncommon in Asian classrooms for teachers to occupy the last three rows in a classroom as they observe the practice of a teacher they particularly admire. There is no mystery in such a setting about which teachers are most and least capable. Those who are less capable are under considerable pressure from their colleagues to improve their practice and they have plenty of opportunities to do so, simply through

4a lonG-TeRm PeRsPeCTiVe foR mexiCo: some lessons fRom Today’s ToP PeRfoRminG eduCaTion sysTems
55STRONG PERFORMERS AND SUCCESSFUL REFORMERS IN EDUCATION: LESSONS FROM PISA FOR MEXICO © OECD 2010
the process of observing the practice of their most capable colleagues and participating in the critiques of their practice, especially for the new lessons they are creating. Finland has incorporated a similar approach in its teacher development programmes: Student teachers regularly participate in problem-solving groups, a common feature in Finnish schools. The problem-solving groups engage in a cycle of planning, action, and reflection/evaluation that is reinforced throughout the teacher education programme and is, in fact, a model for what teachers will plan for their own students, who are expected to use similar kinds of research and inquiry in their own studies. In a way, the entire Finnish system is intended to improve through continual reflection, evaluation, and problem-solving, at the level of the classroom, school, municipality and nation.
High performing countries generally consider teaching a profession where teachers work together to frame what they believe good practice to be, conduct field-based research to confirm or disprove the approaches they develop and then judge their colleagues by the degree to which they use practices proven effective in their classrooms. This amounts to the collective search for ever more effective practices of the sort pursued in Canada, Finland, Japan, Shanghai-China and Singapore. In this way standards for practice can emerge and the effectiveness of practice can be steadily improved over time. As pointed out above, in the East Asian countries studied here, as well as in Canada and Finland’s teacher training schools, those teachers who exhibit the very best practice are released, full-time or part-time from their regular classroom duties to mentor new teachers, provide demonstrations to teachers in their own schools and other schools and to lecture to education audiences in their province or even nationally. They conduct their own research and university researchers examine their practice. In this way, classroom teachers codify and continually advance the standards for acceptable teaching practice.
In many high performing systems, the way teachers work may be compared with the way physicians think about the practice of medicine. Doctors would not think of developing their own drugs. Nor would they think of themselves as professionals if they did not carefully study the most effective procedures yet developed anywhere to deal with the presenting symptoms. Indeed, their sense of themselves as professionals comes in large measure from their deep knowledge of a wide range of presenting symptoms, their ability to successfully diagnose a patient with those symptoms and their ability to identify and execute the most effective procedures available anywhere for the treatment of the problem they have diagnosed. It is much the same with teachers in the schools of the countries with the most effective education systems. It is their ability to diagnose individual students to unlock the difficulties they are having, their encyclopaedic repertoire of effective solutions to the problems in student learning they encounter, their ability to execute a lesson with such panache and skill that the students find it enthralling and totally engaging and their devotion to the improvement of their craft that makes them a professional teacher.
One must remember that all of this occurs in countries in which the standards for what students are meant to know and be able to do are clear. While teachers often tend to think of themselves as professionals to the extent that they have the freedom to choose what they will teach, as well as how they teach it, in the highest performing countries, teachers have a great deal of freedom with respect to how they teach, but less with respect to what students are expected to know and be able to do. In Mexico, there have been recent small-scale efforts aimed at exploring standards of good teaching practices. Institutionalising high quality instructional practice of the sort observed in high performing systems, consistently and at scale, however, will remain a formidable challenge.
aligning incentive structures and engaging stakeholdersIncentives in education should be understood broadly in terms of how they determine why people do the things they do. Examining whether the incentives that operate on students, parents, teachers and others in some countries are more likely to produce higher performance than the incentives that operate on those actors in other countries can provide important insights into why some countries rank higher on the education league tables than others.
Consider students. In countries with high stakes examination systems (i.e. systems in which students cannot go on to the next stage of their life – be it work or further education – unless they show that they are qualified to do so), students know what they have to do to succeed and they put in the work that is needed to do it.
An illustrative example is given by a student in Toyota City, Japan, who wants to work on the line at a Toyota plant. That student knows that he or she must get good grades in tough subjects and earn the recommendation of her principal, so she takes those tough courses and works hard in school. The same is true of the student in Germany who wants to work for Daimler Benz in their machine shop or the student in Singapore who wants to go to work in the factory automation shop a few blocks from his home. The reason examination systems matter is that they

4a lonG-TeRm PeRsPeCTiVe foR mexiCo: some lessons fRom Today’s ToP PeRfoRminG eduCaTion sysTems
56 © OECD 2010 STRONG PERFORMERS AND SUCCESSFUL REFORMERS IN EDUCATION: LESSONS FROM PISA FOR MEXICO
provide strong incentives for students to take tough courses and study hard. One of the most striking features lower performing education systems, including Mexico’s, in contrast with the education systems of the most successful countries is the failure to provide strong incentives to the average student to work hard in school. If examination systems are considered to not be the most appropriate mechanism to establish proper incentives, for whatever reason, then the point remains that there should be some other means, no less effective, to motivate students to work as hard in school as students in other countries do.
Consider the teacher. If teachers do not work as hard at their job as teachers in other countries do, they are not likely to get the same results. The question is what incentives are most likely to produce that result. In hierarchical, bureaucratic and top-down work environments, the answer is that management should measure output carefully and then provide rewards to those whose measured output exceeds expectations. In those environments, workers are competing with one another, and most workers, resenting the worker who outperforms them, create social norms in which the outstanding performer is an outcast in the group. But, in professional work environments, such as professional partnerships, the success of the whole group depends on maximizing the output of each worker, so workers tend to collaborate to increase output, workers support getting rid of workers who pull the performance of the group down, and they approve of paying more to those who, by their effort or skill, increase the rewards coming to the group as a whole. Although rewards for improved performance have been used effectively in other fields, their recent use in the education sector, particularly for teachers, is still being explored, monitored and evaluated.
The learning environment is also shaped by parents in important ways. Parents who are interested in their children’s education are more likely to support their school’s efforts and participate in school activities, thus adding to available resources, and school principals can define their schools’ educational objectives and guide their schools towards them. These parents also tend to come from a high socio-economic status. PISA shows that school principals’ perceptions of parents’ constant pressure to adopt high academic standards and to raise student achievement tend to be positively related to higher school performance in 19 OECD countries. PISA also shows that the socio-economic background of students and schools and key features of the learning environment are closely interrelated and that both link to performance in important ways, perhaps because students with socio-economically advantaged backgrounds bring with them a higher level of discipline and more positive perceptions of school values, or perhaps because parental expectations of good classroom discipline and strong teacher commitment are higher in schools with advantaged socio-economic intake. Conversely, disadvantaged schools may experience less parental pressure to reinforce effective disciplinary practices or ensure that absent or unmotivated teachers are replaced. In summary, students perform better in schools with a stronger school climate, partly because such schools tend to have more students from advantaged backgrounds who generally perform well, partly because the favourable socio-economic characteristics of students reinforce the favourable climate and partly for reasons unrelated to socio-economic variables.9
However, there are significant differences in the way education systems involve parents in different countries. As pointed out above, in many countries in both Europe and Asia certain teachers are designated as either homeroom teachers or class teachers. These teachers follow the student through anywhere between two and nine grades. They assume a certain holistic responsibility for the students in their class and form a close relationship not only with the student but with that student’s parents. In both Asia and Europe, it is typical in such cases that a notebook is passed back and forth between the teacher and the parents, in which each party shares information about the student with the other party.
extending accountability to superiors with accountability towards professional colleagues, parents and the publicIn general, high performing countries tend to have an effective accountability system. The experience of Germany is a lesson in that respect. Having believed itself to be among the world’s best performers without any means to validate this, it was shocked into action when the data from PISA showed that it was not. But the form that accountability takes differs from country to country and that form of accountability appears to matter.
Some accountability systems publish data on the performance of students and schools to inform the public and the system managers about their performance. In systems that permit parents and students to choose between schools, this data can also influence those choices and thus hold schools accountable with market forces based on performance data supplied by the schools between which they are choosing. In some systems, these data are also used by school administrators to allocate resources of various kinds, often to provide additional resources to schools that are struggling.

4a lonG-TeRm PeRsPeCTiVe foR mexiCo: some lessons fRom Today’s ToP PeRfoRminG eduCaTion sysTems
57STRONG PERFORMERS AND SUCCESSFUL REFORMERS IN EDUCATION: LESSONS FROM PISA FOR MEXICO © OECD 2010
Beyond that, accountability systems in the best-performing countries can be divided into those that employ administrative (or vertical) accountability and those that employ professional (or lateral) accountability systems.
Administrative accountability refers to systems in which student achievement test data are used by administrators to reward good teachers, good schools and good districts and to punish teachers, schools and districts that consistently produce poor results. Among the features of administrative accountability are often test-based accountability systems that use data on student performance to make decisions about which teachers and school principals to hire, to promote and to retain and for making decisions about the compensation of individual teachers.
Professional accountability refers to systems in which teachers feel themselves accountable not so much to school administrators as to their fellow teachers, as professionals in most fields feel themselves accountable for their performance to other professionals in the same field.
In the case of education, professional accountability includes the kind of personal responsibility that teachers feel to the parents of their students in countries in which certain teachers move with a class through two, three or more grades, and take broad responsibility for the growth and development of those children not just in the subject they teach but across the board, working in close partnership with other teachers and with the parents of those students.
Jurisdictions such as Japan, Finland and Ontario in Canada, which use the more professional forms of work organisation tend to emphasise collegial forms of teacher and school leader accountability, seeking to ensure that reform becomes a two-way street, rather than something imposed from above. This is because people who expect to be treated as professionals and think of themselves as professionals are more likely to respond to professional and familial modes of accountability and to view negatively the use of administrative forms of accountability of the sort that they identify with Tayloristic work environments.
Singapore provides an example where both administrative and professional accountability are combined in an approach centred on performance management, with a wide range of indicators and with involvement of a wide range of professionals in making judgements about the performance of adults in the system. Teachers, principals, ministry, other staff and students all have incentives to work hard. For maintaining the performance of teachers and principals, serious attention is paid to setting annual goals, to garnering the needed support to meet them and to assessing whether they have been met. Data on student performance are included, but so too are a range of other measures, such as contribution to school and community, and judgements by a number of senior practitioners. Reward and recognition systems include honours and salary bonuses. Individual appraisals take place within the context of school excellence plans.
It is important to note that an emphasis on professional accountability at the frontline does not stand in contrast with the establishment of centralised standards and assessments but goes hand in hand with these.
investing resources where they can make the most differenceThe PISA data show no consistent correlation between the overall amount of money spent on education and the results in terms of student achievement, whether what is spent is calculated on a per capita basis or a proportion of GDP basis. Mexico already invests a high percentage of the public budget in education (at nearly 22%, it is the highest among OECD countries, and well above the OECD average of 13.3%), although annual per pupil spending at the primary, secondary and post-secondary (non-tertiary) levels in Mexico remains below the OECD average, at USD 2 165 compared to USD 7 572, respectively (Education at a Glance 2010: Tables B4.1 and B1.2). Figure 4.1 shows relative importance of public expenditure on education as a percentage of total public expenditure for the years 2000 and 2007.
If Mexico wants to continue to improve even beyond recent performance trends, and it is unable to radically improve the efficiency with which its education funds are spent, it will have to greatly increase the amount spent per student to get those results. Public accounts in Mexico, however, as in other OECD and non-OECD countries, face financial constraints likely to remain unchanged for years to come. If an expansion in education spending is not available, the challenge is therefore to increase the return on the investment in education and to direct the resources to students and schools who need them most. Shanghai-China provides a telling example in this respect. The most impressive outcome there is not Shanghai-China’s high average score, but the very small variability in school performance that is achieved despite considerably social and economic inequalities in the population of the province.

4a lonG-TeRm PeRsPeCTiVe foR mexiCo: some lessons fRom Today’s ToP PeRfoRminG eduCaTion sysTems
58 © OECD 2010 STRONG PERFORMERS AND SUCCESSFUL REFORMERS IN EDUCATION: LESSONS FROM PISA FOR MEXICO
0
5
10
15
20
25
Perc
enta
ge o
f tot
al p
ublic
exp
endi
ture
OECD average
2007 2000
On average, OECD countries devote 13.3% of total public expenditure to education in 2007, but values for individual countries range from less than 10% in the Czech Republic, Italy and Japan, to nearly 22% in Mexico. The proportion of public expenditure on education increased between 1995 and 2007 in 18 of the 27 countries with comparable data in both 1995 and 2007. However, the main increase took place from 1995 to 2000, while public expenditure on education and on other public sectors increased in the same proportions from 2000 to 2007.
Mex
ico
Slov
ak R
epub
lic
Rus
sian
Fed
erat
ion
New
Zea
land
Chi
le1
Icel
and
No
rway
Bra
zil
Den
mar
k
Ko
rea
Uni
ted
Sta
tes
Esto
nia
Aus
tral
ia
Irel
and
Isra
el
Swed
en
Finl
and
Bel
gium
Can
ada2
Slov
enia
Swit
zerl
and
Net
herl
and
s
Uni
ted
Kin
gdo
m
Pola
nd
Port
ugal
Spai
n
Aus
tria
Fran
ce
Hun
gary
Ger
man
y
Cze
ch R
epub
lic
Jap
an
Ital
y
• Figure 4.1 •Total public expenditure on education, as a percentage of total public expenditure (2000, 2007) The chart shows direct public expenditure on educational institutions plus public subsidies to households (which include subsidies for living costs such as scholarships and grants to students/households and students loans), and other private entities, as a percentage of total public expenditure, by year. It must be recalled that public sectors
differ in terms of their size and breadth of responsibility from country to country.
1. Year of reference 2008 instead of 2007. 2. Year of reference 2006 instead of 2007. Countries are ranked in descending order of total public expenditure on education at all levels of education as a percentage of total public expenditure in 2007. Source: OECD, Education at a Glance 2010: OECD Indicators, Table B4.1
This has not come about by chance, but rather should be seen in the context of considerable efforts to improve the school system by converting “weaker schools” to stronger schools. These efforts have included:
•systematically upgrading the infrastructure of all schools to similar levels;
•the establishment of a system of financial transfer payments with positive discrimination; the transfer of teachers between disadvantaged and advantaged schools, either temporarily10 or permanently;
•the paring of high-performing with low performing districts and schools, where the authorities exchange and discuss their educational development plans and cooperate to deal with problems such as teachers’ capacity building, where teachers’ professional development common to both authorities and they share their curricula, teaching materials and good practices; and
•the establishment of school consortia and the commissioned administration of schools under which the government commissions “good” public schools to take over the administration of “weak” ones, by having the “good” school appoint its experienced leader (such as the deputy principal) to be the principal of the “weak” school and sending a team of experienced teachers to lead in teaching, in the expectation that the ethos, management style and teaching methods of the high performing school can be transferred to the poorer performing school.

4a lonG-TeRm PeRsPeCTiVe foR mexiCo: some lessons fRom Today’s ToP PeRfoRminG eduCaTion sysTems
59STRONG PERFORMERS AND SUCCESSFUL REFORMERS IN EDUCATION: LESSONS FROM PISA FOR MEXICO © OECD 2010
In a large and complex educational system such as Mexico’s, equity in the distribution of resources between schools is important. Some of Mexico’s lowest performing schools in poor rural and indigenous regions tend to have fewer resources than urban schools. National compensatory programs for schools in rural and indigenous regions have been scaled back, with resources focused on centrally designed and operated programs. Funding mechanisms that allocate resources to the schools where they are most needed, within a model of clear goal setting, assessment and accountability, can increase the equity of resource distribution even among the most remote and marginalised schools.
Balancing local responsibility with a capable centre with the authority and legitimacy to act Many countries have pursued a shift in public and governmental concern away from mere control over the resources and content of education towards a focus on outcomes, which becomes visible when changes in the distribution of decision-making responsibilities in education are reviewed across successive PISA assessments. Coupled with this have been efforts to devolve responsibility to the frontline, encouraging responsiveness to local needs. PISA shows a clear relationship between the relative autonomy of schools and schooling outcomes across systems – when autonomy is coupled with accountability.
PISA results show that school autonomy in defining the curriculum and assessment relates positively to the systems’ overall performance. For example, school systems that provide schools with greater discretion in making decisions regarding student assessment policies, the courses offered, the course content and the textbooks used, tend to be school systems that perform at higher levels on PISA. Data from PISA also show that in school systems where most schools post achievement data publicly, schools with greater discretion in managing their resources tend to show higher levels of performance. In school systems where schools do not post achievement data publicly, a student who attends a school with greater autonomy in resource management than the average OECD school tends to perform lower than a student attending a school with an average level of autonomy. In contrast, in school systems where schools do post achievement data publicly, a student who attends a school with above-average autonomy scores higher in reading than a student attending a school with an average level of autonomy.
Many systems, such as Mexico’s, have decentralised decisions concerning the delivery of educational services while keeping control over the definition of outcomes, the design of curricula, standards and testing. The question of shared responsibilities with sub-national educational authorities, mainly state governments in the case of Mexico vis-a-vis federal institutions and national standards, is an important one.
The case of Ontario demonstrates a clear theory of comparative advantage in terms of who does what. The role of the ministry is to set clear expectations and targets, to provide funding, to create a working collective bargaining agreement that supports improved teaching and learning, to provide external expertise, and to provide support for struggling schools. The role of the district is to align its personnel and hiring policies with the overall strategy, and to support the schools as they go through continuous processes of learning. Much of the real dynamics happen in the schools, where teachers work in communities to think about practical problems and to learn from one another. While the mission and pressure comes from the top, there is clear recognition that it is at the school level where change has to be implemented and that the role of other actors in the system is to support the learning and change occurring in schools. An important, yet often underestimated barrier to achieving system coherence is often the lack of a shared understanding among key stakeholders about how key governmental leaders see the problems of the system and what lies behind the policies and programmes they have designed in response. Efforts of the Ontario government to build a sense of shared understanding and common purpose among key stakeholder groups provides an example for how this can be achieved.
Singapore’s ‘thinking schools – learning nation’ reform pursued similar goals, organising schools with greater autonomy into geographic clusters and given more autonomy, with successful principals appointed as cluster Superintendents, to mentor others and to promote innovation. Along with greater autonomy came new forms of accountability. The old inspection system was abolished and replaced with a school excellence model, under which each school sets its own goals and annually assesses its progress towards them against nine functional areas, five “enablers”, as well as four results areas in academic performance.11 Greater autonomy for schools also led to an increased focus on identifying and developing highly effective school leaders able to lead school transformations, backed by an external review every six years.

4a lonG-TeRm PeRsPeCTiVe foR mexiCo: some lessons fRom Today’s ToP PeRfoRminG eduCaTion sysTems
60 © OECD 2010 STRONG PERFORMERS AND SUCCESSFUL REFORMERS IN EDUCATION: LESSONS FROM PISA FOR MEXICO
Importantly, most, if not all, of the high performing systems have some level of authority in their system of education governance that is ultimately responsible, some agency or group of agencies that can be said to be responsible in a decisive way for the effectiveness and efficiency of the whole education system. This is typically the national or state ministry of education. These agencies are held responsible by everyone concerned for the effectiveness and efficiency of education in their state or nation. They tend to attract capable people. Employment in these agencies is widely thought to be a worthy goal for leading educators in these countries. Their opinions are taken seriously, even if not mandated by law, because of the respect in which their staff is held. Because they are held accountable for the quality and efficiency of education in their country, they assume responsibility for long range planning for their education systems. They commission research to assist them in making those decisions. They make deliberate use of that research in their decision-making.
All of this has consequences. Countries that have such systems in place have education systems the parts and pieces of which appear to have been designed to work harmoniously with each other. They can make effective plans and they can mobilise their capacity to make sure those plans are carried out. They have the capacity to do the necessary analyses, to deliver effective support to the field, to monitor the degree to which their plans are being implemented, to judge the results and to change course if needed. If a country or a state in a federal system lacks this capacity, it may not be able to make comprehensive, coherent plans, and if it has the capacity to plan, it may not make much difference what its policies are because they may have little impact if the nation or state lacks the staff needed to carry them out well. The experience of the best performing countries suggests that high performance relies on the willingness to invest in the capacity to do the planning and management necessary to produce high performance at scale.
ensuring coherence of policies and practices, aligning policies across all aspects of the system, establishing coherence of policies over sustained periods of time and securing consistency of implementation The most successful education systems are setting goals for the curriculum and for student achievement that emphasise the attainment of complex, higher order thinking skills and the ability to apply those skills to problems they have never seen before rather than mastery of the kinds of basic skills they formerly settled for as a minimum standard. These countries and economies are shifting the structure of their systems from ones that track students from different social backgrounds into different schools and programmes, intended to supply the economy with workers suited for elite jobs, middle class jobs, working class jobs and lower class jobs, toward systems designed increasingly to provide almost all workers with the skills needed for jobs previously thought to be needed only by elite workers. Many countries on this trajectory are working to improve the quality of the pool from which they recruit their teachers and they are finding that, in order to recruit and retain these young people, they need to abandon bureaucratic and administrative control for systems in which accountability to other professionals and to parents produces a constant pressure for improved performance. They find that they have to finance their education systems so that all students have access to the educational resources they need to succeed against high standards.
These are not independently conceived and executed changes. They are, and were, part of a whole effort. Policies and practices tend to be aligned across all aspects of the system, they tend to be coherent over sustained periods of time, and they tend to be consistently implemented without excessive control. That is not to say that the process of reform is smooth. Reform trajectories in even the most successful systems show that the path can be confusing and fraught with political controversy.
Apart from the inevitable political issues, moving away from administrative and bureaucratic control toward professional norms of control can be counterproductive if a nation does not yet have teachers and schools with the capacity to implement these policies and practices. Devolving authority down to lower levels can be problematic if there is not agreement on what the students need to know and should be able to do and if the standards are not high enough.
A county’s success in making these transitions depends greatly on the degree to which it is successful in creating and executing plans that, at any given time, produce the maximum coherence in the system. No country does this perfectly, though Finland, Japan, Ontario in Canada, Singapore, Hong Kong-China and Shanghai-China seem to have had success in this respect over the years.

4a lonG-TeRm PeRsPeCTiVe foR mexiCo: some lessons fRom Today’s ToP PeRfoRminG eduCaTion sysTems
61STRONG PERFORMERS AND SUCCESSFUL REFORMERS IN EDUCATION: LESSONS FROM PISA FOR MEXICO © OECD 2010
Singapore demonstrates perhaps the most consistent alignment between policies and their implementation, in which the Ministry of Education, the National Institute for Education and schools share responsibility and accountability and where no policy is announced without a plan for building the capacity to implement it. One of the most striking things about visiting Singapore is that the visitor hears the same clear focus on the same bold outcomes, careful attention to implementation and evaluation, and orientation towards the future wherever one goes – whether in the ministries of manpower, national development, community development, education or in the universities, technical institutes or schools. “Milestone” courses bring together top officials from all the ministries to create a shared understanding of national goals. A focus on effective implementation runs throughout the government. Because of the value placed on human resource development and the understanding of its critical relationship to economic development, Singapore’s government provides a very clear vision of what is needed in education. This means that the Ministry of Education can then design the policies and implement the practices that will meet this vision. Whenever a policy is developed or changed, there is enormous attention to the details of implementation – from the Ministry of Education, to the National Institute of Education, cluster superintendents, principals and teachers. The result is a remarkable fidelity of implementation and relatively little variation across schools.
While different mechanisms would be needed in the much larger, varied, and decentralised system of Mexico, finding ways to bring greater alignment and to make all the parts work together is essential for producing results in classrooms. Because state-level educational authorities are responsible for service delivery, finding the right balance between national guidelines, state-level flexibility in implementation and school-based decision making will be key. The lesson for Mexico is that, regardless of where a country or state is on the development spectrum, coherence – the degree to which the parts and pieces fit well together and reinforce each other – is an important feature of system effectiveness.
In order for Mexico’s educational system to continue improving, it will need to make sure that the assessments it uses are testing what students should be taught, the instructional materials that are available match the content that teachers are supposed to be teaching, teacher education programs (at the normales) are preparing teachers to teach what students are expected to learn, the standards for admission are high enough to attract the kinds of people who will be needed, there is a pool of qualified applicants to become potential teachers, the programmes of those institutions are designed to attract young people who could choose to be doctors and architects and engineers, the incentives that influence young people include incentives to take tough courses and work hard in school, the credentials that young people get in school match the needs and expectations of employers and colleges, and so on. This is a partial list, but the point is that the parts and pieces have to fit together and there will be a lot of parts and pieces in a successful plan.
Mexico has a variety of initiatives currently underway to address many of these challenges in areas such as reviewing content and curriculum to make it more skills and competencies-based, the competitive selection process for tenured teaching positions, teacher recognition and rewards programs that could be used to define an incentives and stimuli policy for in-service teachers, and pilot programs focused on a limited number of under-performing schools. Another area where Mexico has made significant progress is in student assessment and evaluation.
Since its first administration in 2006, the yearly census-based ENLACE assessment has become a cornerstone of public accountability and school improvement efforts in Mexico. SEP is also currently exploring the use of student achievement results from ENLACE for school-level value-added methods. The OECD has provided SEP with specific recommendations on how the ENLACE assessment can be further developed to support these and other policy levers for improvement. A clear vision of an evaluation framework in Mexico should allow for the distinct but complementary purposes of different assessments (i.e. ENLACE, EXCALE12 or possible school-based assessments), and how they should continue to develop in the future within a common national framework. As these and other initiatives continue to develop, a systematic process of analysis, design, planning, monitoring and evaluation should ensure the coherence of these initiatives and support effective implementation at state and local levels.
ensuring an outward orientation of the system to keep the system learning and to recognise challenges and potential future threats to current successLooking at five of the world’s highest performers discussed in this chapter – Ontario in Canada, Finland, Japan, Shanghai-China and Singapore – the reader will see five of the world’s most determined international benchmarkers. In a recent interview for the OECD, Premier McGuinty in Ontario made a point of saying that his own views about the right strategy for Ontario to pursue were shaped by the visits he made to other countries with high education

4a lonG-TeRm PeRsPeCTiVe foR mexiCo: some lessons fRom Today’s ToP PeRfoRminG eduCaTion sysTems
62 © OECD 2010 STRONG PERFORMERS AND SUCCESSFUL REFORMERS IN EDUCATION: LESSONS FROM PISA FOR MEXICO
performance to see how they did it. Finland was benchmarking the performance and practices of the world’s best performers in the run-up to its dramatic emergence as one of the world’s top performers. Japan launched its long-running career as one of the world’s leading performers when the government that it installed during the Meiji Restoration visited the capitals of the industrialising West and decided that it would bring back to Japan the best that the rest of the world had to offer in education policy and practice. It has been doing so ever since. When Deng Xiaoping took the helm in China and launched its rise on the world’s industrial stage, he directed China’s education institutions to form partnerships with the best educational institutions in the world and to bring back to China the best of their policies and practices.
In the latter half of the 20th century Singapore did exactly what Japan had done a century earlier, but with even greater focus and discipline. Singapore’s Economic Development Board, the nerve centre of the Singaporean government, is staffed by engineers who view the government and administration of Singapore as a set of design challenges. Whether Singapore is interested in designing a better sewer system, retirement system or school system, it sends key people in the relevant sector to visit those countries that are the world’s best performers in those areas with instructions to find out how they do it and to put together a design for Singapore that is superior to anything that they have seen anywhere. Whenever Singapore seeks to create a new institution, it routinely benchmarks its planning to the best in the world. If Singapore is not in a position to create a world-class institution in a particular field, it will try to import the expertise. All Singapore educational institutions – from the National University of Singapore to individual schools – are being encouraged to create global connections in order to develop “future-ready Singaporeans”. They have never stopped learning from other countries as systematically as possible. A strong and consistent effort both to do disciplined international benchmarking and to incorporate the results of that benchmarking into policy and practice is a common characteristic of the highest performing countries.
an oPPoRTuniTy foR mexiCoOECD experience has shown that two basic elements must exist for a country to embark on an effective reform process: a popular sentiment that things must change in a given sector and the political will of a country’s leadership to establish lasting and effective reform processes.13 On both counts, as discussed earlier in this chapter, Mexico has established favourable conditions for educational reform. Given the dimensions of Mexico’s education system as well as the complexities involved in education reform, the challenge is thus to ensure that immediate and short-term actions are aligned with long-term plans for superior educational outcomes.
It is useful to put this challenge in the context of economic development and international competitiveness. As countries move from low-income, low-valued-added economic systems in which competition is based on price towards high-income, high-value-added economic systems in which they compete on quality and innovation, they tend to move from one end of this dimension line to another as their economies change and they accumulate the resources needed to enable them to take the next step in their education system development.
One can see how this process is working in the case of Brazil, for example as it tries to overcome a history of ignoring the educational needs of its native population, and in the case of Poland as it moved toward a more inclusive stance in its education policy. The linkage between education and economic development has been particular tight in Singapore, driven from the top of government. As Singapore evolved from an economy based on port and warehousing activities, through a low-wage, labour-intensive manufacturing economy, then to a more capital and skill-intensive industry and finally to its current focus on knowledge-intensive industrial clusters, the education system ramped up the quality of its education and the supply of specific skills needed to make Singapore globally competitive. None of these countries has moved all the way toward the right hand side of the economic development spectrum, but they are well on the way.
The lesson for Mexico might thus be that different states, and even some regions within states, might be at different points on the economic development spectrum. Some states might be in a situation not far from that of Brazil, where the priorities are setting up effective systems for tracking student and school performance, getting standards for student achievement in place, making sure that teachers meet minimum performance and qualification standards, producing more equity in school finance and resources, and developing effective educational interventions that can assist struggling schools, among others. These states are likely to find, just like Brazil and other nations at a similar stage of their development have found, that the most effective management systems are systems in which there is a lot of detailed direction from the top, administrative accountability works best and content and performance standards (including curriculum) need to be specified in some detail.

4a lonG-TeRm PeRsPeCTiVe foR mexiCo: some lessons fRom Today’s ToP PeRfoRminG eduCaTion sysTems
63STRONG PERFORMERS AND SUCCESSFUL REFORMERS IN EDUCATION: LESSONS FROM PISA FOR MEXICO © OECD 2010
Other states might be at a very different point on the development curve. They might have the management, the financial resources and the institutional infrastructure needed to match the performance and adopt the systems developed by the world’s better-performing systems. Where their education systems do not yet match the best performing systems, they might still adapt methods used by Finland, Canada and some of the East Asian economies that perform very well. They will be in a position to recruit a substantial proportion of their teachers from the best university students in the country and to offer them a lot of discretion in the way they do their job. They will be looking for ways to build the capacity of their systems and to support their teachers. Their accountability systems will tend to the professional model, not the administrative model. Rather than regulating and directing what goes on in the school, they will focus on devising incentives and support systems that will align the interests of the school faculty with the public interest.
Most states will be somewhere in between and the challenge will be to develop policies that encourage states to move forward on this trajectory, within a national vision and avoid increasing inequalities. There is no one best system to do this. As discussed earlier, however, there are clear pathways from any starting point on the trajectory to wider participation, raising the quality of educational outcomes, improving equity in the distribution of educational opportunities and producing greater value for the money invested in education.
As noted in Chapter 1, the gains from improved learning outcomes, put in terms of Mexico’s current GDP, exceed today’s value of the short-term business-cycle management by far. This is not to say that efforts should not be directed at issues of economic recession, but it is to say that the long-term issues cannot be neglected. It is a matter of not forgetting about the importance of educational outcomes in the face of the urgency of current economic and political crises. In a competitive, globalised society, success will go to those individuals and countries which are swift to adapt, slow to complain and open to change. Governments need to ensure that countries rise to this challenge. The OECD will continue to help mexico and other countries support these efforts.

4a lonG-TeRm PeRsPeCTiVe foR mexiCo: some lessons fRom Today’s ToP PeRfoRminG eduCaTion sysTems
64 © OECD 2010 STRONG PERFORMERS AND SUCCESSFUL REFORMERS IN EDUCATION: LESSONS FROM PISA FOR MEXICO
Notes
1. Tayloristic forms of work organisation refers to the form of management focused on improving productivity made popular by the work of Frederick Winslow Taylor, also known as “scientific management” because of “The Principles of Scientific Management”, published in 1911. Generally, the approach proposed by Taylor focused on ‘scientific’ working methods, as opposed to “rule-of-thumb”; prescriptive employee selection, training and development; detailed instruction and supervision of what employees are expected to do; and a clear division of work between higher-level managers and workers who perform specific tasks. Tayloristic forms of organisation thus refers to a vision in which workers and teachers should be given precise instructions and guidance, with close and careful supervision, to reduce variation and under-performance as much as possible. Professional criteria and innovation in this type of an environment are not fostered.
2. The considerations and recommendations presented in Establishing a Framework for Evaluation and Teacher Incentives: Considerations for Mexico (OECD, 2010) in the areas of education policy reform, public accountability, student learning outcomes, value-added methods, teacher evaluation, teacher incentives and stimuli correspond to several of these principles, with specific details appropriate to Mexico provided. In the OECD publication Improving schools: Strategies for action in Mexico, recommendations are provided on the topics of teacher policy and school leadership and management.
3. In Canada, an important element in the development of the Student Success strategy was the creation of a new programme in high schools called the High Skills Major. This aimed to take high school students who were not engaged by the traditional academic curriculum and give them a different menu of courses. While earlier approaches in this vein have justifiably been accused of tracking working class students away from higher end jobs, by working with prospective employers, the High Skill Major programme created more hands-on courses to give students practical skills and lead to employment opportunities.
4. Among OECD countries, in the Czech Republic, Denmark, Estonia, Finland, France, Hungary, Iceland, Ireland, Israel, Italy, Japan, Korea, Luxembourg, the Netherlands, New Zealand, Norway, Poland, the Slovak Republic, Slovenia, Turkey and the United Kingdom, standards-based external examinations exist throughout the systems for students attending secondary education level. In Australia they cover 81% of the secondary students, in Canada 51% and in Germany 35%. In Austria, Belgium, Chile, Greece, Mexico, Portugal, Spain, Sweden, Switzerland and the United States such examinations do not exist or only exist in minor parts of the system (Table IV.3.11 in PISA 2009 Results). Across OECD countries, students in school systems that require standards-based external examinations perform, on average, over 16 points higher than those in school systems that do not use such examinations (Figure IV.2.6a in PISA 2009 Results).
5. In Finland, the admissions process occurs in two stages. The initial paper screen is based on the applicant’s Matriculation Exam score, upper secondary school record and out-of-school accomplishments. Those who pass that screening must then take a written exam; be observed in a teaching-like activity in which their interaction and communication skills can be assessed; and finally be interviewed to assess, among other things, the strength of their motivation to teach.
6. The ministry also created the Ontario Education Partnership Table where a wider range of stakeholders could meet with ministry officials two to four times a year.
7. Shanghai-China provides a similar system where each teacher is expected to engage in 240 hours of professional development within 5 years.
8. Included in this Enhanced Performance Management System is their contribution to the academic and character development of the students in their charge, their collaboration with parents and community groups and their contribution to their colleagues and the school as a whole.
9. The effect of parental pressure is particularly closely related to socio-economic background, with little independent effect, whereas factors related to the climate within the school such as discipline and student-teacher relationships are also related to performance independently of socio-economic and demographic effects in many countries.
10. Teachers transferred temporarily from rural to urban schools are expected to return to the rural schools to enrich them with their new urban experiences.
11. The five enablers are leadership, staff management, strategic planning, resources and student-focused processes. The four result areas are outcomes of holistic development of students (which includes academic results), staff wellbeing results, administrative and operational results and results of engagement with partners and community.
12. Administered by the National Institute for the Evaluation of Education (Instituto Nacional para la Evaluación de la Educación, INEE), these are the Educational Quality and Achievement Exams (Exámenes de la Calidad y el Logro Educativos, EXCALE). EXCALE exams are sample-based assessments administered in four-year cycles to students of certain key grade levels at the pre-primary, primary and secondary levels.
13. From the opening remarks of OECD Secretary-General, Angel Gurría, delivered on 25 September 2008, in Mexico City, Mexico, entitled “The Art of Making Reform Happen: Learning from Each Other”.

65STRONG PERFORMERS AND SUCCESSFUL REFORMERS IN EDUCATION: LESSONS FROM PISA FOR MEXICO © OECD 2010
referencesoecd (2009a), Top of the Class, OECD Publishing.
oecd (2010a), The High Cost of Low Educational Performance, OECD Publishing.
oecd (2010b), PISA 2009 Results (Volumes I-V), OECD Publishing.
oecd (forthcoming), Against the Odds: Disadvantaged Students who Succeed at School, OECD Publishing.
seP (2007), Programa Sectorial de Educación – Secretaría de Educación Pública 2007-2012, Government of Mexico, accessed 24 April 2010 at www.sep.gob.mx/wb/sep1/programa_sectorial.

oecD PUBLIsHInG, 2, rue André-Pascal, 75775 PArIs ceDex 16
ORGANISATION FOR ECONOMIC CO-OPERATIONAND DEVELOPMENT
The oecD is a unique forum where governments work together to address the economic, social and environmental challenges of globalisation. The oecD is also at the forefront of efforts to understand and to help governments respond to new developments and concerns, such as corporate governance, the information economy and the challenges of an ageing population. The organisation provides a setting where governments can compare policy experiences, seek answers to common problems, identify good practice and work to co-ordinate domestic and international policies.
The oecD member countries are: Australia, Austria, Belgium, canada, chile, the czech republic, Denmark, Finland, France, Germany, Greece, Hungary, Iceland, Ireland, Israel, Italy, Japan, Korea, Luxembourg, mexico, the netherlands, new Zealand, norway, Poland, Portugal, the slovak republic, slovenia, spain, sweden, switzerland, Turkey, the United Kingdom and the United states. The european commission takes part in the work of the oecD.
oecD Publishing disseminates widely the results of the organisation’s statistics gathering and research on economic, social and environmental issues, as well as the conventions, guidelines and standards agreed by its members.
Related Documents