Stress Relaxation Behavior of Glass Fiber-Reinforced Polyester Composites Prepared by the Newly Proposed Rubber Pressure Molding Kamal K. Kar, 1,2 S.D. Sharma, 1 Prashant Kumar, 2 Akash Mohanty 2 1 Advanced Nano Engineering Materials Laboratory, Materials Science Programme, Indian Institute of Technology, Kanpur 208016, India 2 Advanced Nano Engineering Materials Laboratory, Department of Mechanical Engineering, Indian Institute of Technology, Kanpur 208016, India Stress-relaxation behavior of glass fiber-reinforced polyester composites, prepared by a recently devel- oped manufacturing method called rubber pressure molding (RPM), is investigated with special reference to the effect of environmental temperature (2708C to +1008C), fiber volume fraction (30–60%), and initial load level (1–5 kN). It is found that the stress-relaxation rate decreases with an increase in the applied load of com- posites and a decrease in temperature. Below glass transition temperature, the rate of stress relaxation increases with an increase in volume fraction of fibers in the composites, whereas above glass transition tem- perature, it increases with a decrease in the volume fraction of fibers. The experimental results for a given composites are summarized by four values, the slopes of the two straight lines (two separate relaxation pro- cesses), and their intercepts upon the stress axis. Both the slopes are dependent upon the applied load, tem- perature, and volume fraction of fibers in the compo- sites. Relaxation times in both primary and secondary are calculated over the wide range of temperatures, loads, and volume fraction of fibers in the composites. It depends strongly on the temperature, but does not depend strongly on the applied load and volume frac- tion of fibers. The performances of the composites are also evaluated through conventional compression- molding process. The rate of stress relaxation is small when the composites are made of newly proposed RPM technique when compared with the conventional process. POLYM. COMPOS., 29:1077–1097, 2008. ª 2008 Society of Plastics Engineers INTRODUCTION Glass-reinforced polyester laminates are the most com- monly used composite materials in the construction of marine craft, with their worldwide consumption by the boat and ship-building industries. In addition to this, these are also widely used in spacecraft, aircraft, automobile, defence, railways, transportation, construction, chemical, and other industries. Several methods, i.e., filament-wind- ing process, pultrusion method, vacuum-bagging technique, autoclave technique, matching die set compression mold- ing, resin-transfer molding, resin infusion and other LCM (liquid composite molding) techniques, etc., have been developed to manufacture these FRP products. Among these, autoclave technique is a best method for the manu- facturing of some aeronautic parts based on glass fiber/car- bon fiber and epoxy resin. Nowadays, LCM techniques (such as resin-transfer molding, infusion, bladder molding, etc.) are becoming more and more popular in the aeronau- tic industry. But a major cost issue for manufacturing of fiber-reinforced plastic (FRP) structures and parts using autoclave and LCM techniques are the requirement of ex- pensive tooling and disposable-bagging materials. Addi- tionally, it requires long cure times though it is a function of cure system, involves high energy consumption, volatile toxic byproducts and creates residual stress in the materi- als, and necessitates the use of expensive tooling capable of withstanding high autoclave temperature. Again the re- sidual stress developed during the processing of composites is a function of heat generation during curing of resin, thermal dissymmetry of tooling, resin shrinkage, etc. It has been suggested that decreasing the manufacturing cost is a key step to further increase the overall usage of FRP products. The recently developed rubber pressure molding (RPM) technique employs a steel die and rubber punch to produce FRP composites such as flat, flat with curve, and flat with Correspondence to: Kamal K. Kar; e-mail: [email protected] Contract grant sponsor: Ministry of Human Resource Development, New Delhi. DOI 10.1002/pc.20484 Published online in Wiley InterScience (www.interscience.wiley.com). V V C 2008 Society of Plastics Engineers POLYMERCOMPOSITES—-2008

Welcome message from author
This document is posted to help you gain knowledge. Please leave a comment to let me know what you think about it! Share it to your friends and learn new things together.
Transcript

Stress Relaxation Behavior of Glass Fiber-ReinforcedPolyester Composites Prepared by the NewlyProposed Rubber Pressure Molding
Kamal K. Kar,1,2 S.D. Sharma,1 Prashant Kumar,2 Akash Mohanty21Advanced Nano Engineering Materials Laboratory, Materials Science Programme,Indian Institute of Technology, Kanpur 208016, India
2Advanced Nano Engineering Materials Laboratory, Department of Mechanical Engineering,Indian Institute of Technology, Kanpur 208016, India
Stress-relaxation behavior of glass fiber-reinforcedpolyester composites, prepared by a recently devel-oped manufacturing method called rubber pressuremolding (RPM), is investigated with special referenceto the effect of environmental temperature (2708C to+1008C), fiber volume fraction (30–60%), and initial loadlevel (1–5 kN). It is found that the stress-relaxation ratedecreases with an increase in the applied load of com-posites and a decrease in temperature. Below glasstransition temperature, the rate of stress relaxationincreases with an increase in volume fraction of fibersin the composites, whereas above glass transition tem-perature, it increases with a decrease in the volumefraction of fibers. The experimental results for a givencomposites are summarized by four values, the slopesof the two straight lines (two separate relaxation pro-cesses), and their intercepts upon the stress axis. Boththe slopes are dependent upon the applied load, tem-perature, and volume fraction of fibers in the compo-sites. Relaxation times in both primary and secondaryare calculated over the wide range of temperatures,loads, and volume fraction of fibers in the composites.It depends strongly on the temperature, but does notdepend strongly on the applied load and volume frac-tion of fibers. The performances of the composites arealso evaluated through conventional compression-molding process. The rate of stress relaxation is smallwhen the composites are made of newly proposedRPM technique when compared with the conventionalprocess. POLYM. COMPOS., 29:1077–1097, 2008. ª 2008Society of Plastics Engineers
INTRODUCTION
Glass-reinforced polyester laminates are the most com-
monly used composite materials in the construction of
marine craft, with their worldwide consumption by the
boat and ship-building industries. In addition to this, these
are also widely used in spacecraft, aircraft, automobile,
defence, railways, transportation, construction, chemical,
and other industries. Several methods, i.e., filament-wind-
ing process, pultrusion method, vacuum-bagging technique,
autoclave technique, matching die set compression mold-
ing, resin-transfer molding, resin infusion and other LCM
(liquid composite molding) techniques, etc., have been
developed to manufacture these FRP products. Among
these, autoclave technique is a best method for the manu-
facturing of some aeronautic parts based on glass fiber/car-
bon fiber and epoxy resin. Nowadays, LCM techniques
(such as resin-transfer molding, infusion, bladder molding,
etc.) are becoming more and more popular in the aeronau-
tic industry. But a major cost issue for manufacturing of
fiber-reinforced plastic (FRP) structures and parts using
autoclave and LCM techniques are the requirement of ex-
pensive tooling and disposable-bagging materials. Addi-
tionally, it requires long cure times though it is a function
of cure system, involves high energy consumption, volatile
toxic byproducts and creates residual stress in the materi-
als, and necessitates the use of expensive tooling capable
of withstanding high autoclave temperature. Again the re-
sidual stress developed during the processing of composites
is a function of heat generation during curing of resin,
thermal dissymmetry of tooling, resin shrinkage, etc. It
has been suggested that decreasing the manufacturing cost
is a key step to further increase the overall usage of FRP
products.
The recently developed rubber pressure molding (RPM)
technique employs a steel die and rubber punch to produce
FRP composites such as flat, flat with curve, and flat with
Correspondence to: Kamal K. Kar; e-mail: [email protected]
Contract grant sponsor: Ministry of Human Resource Development, New
Delhi.
DOI 10.1002/pc.20484
Published online in Wiley InterScience (www.interscience.wiley.com).
VVC 2008 Society of Plastics Engineers
POLYMER COMPOSITES—-2008
curve to cone [1–8]. This type of steel and rubber combina-
tion gives a uniform hydrostatic pressure distribution over
the complex-shaped FRP composite part and produces a
product with uniform distribution of fibers and resin and
minimal void content [1–8]. The uniform pressure distribu-
tion has been supported by finite-element analysis. Another
advantage of RPM technique over the other techniques,
i.e., vacuum-bagging technique, autoclave technique,
matching die set compression molding, resin-transfer mold-
ing, etc., is that the rubber mold could be used repeatedly
without sacrificing product quality [7]. Again the cost of
rubber mold is �10 times cheaper than the steel mold [7]
In addition, the RPM is very simple process compared to
the other conventional techniques [1–8].
The long-term mechanical behavior of the FRP compo-
sites is very important for structural applications. This
requires a type of accelerated mechanical testing of the
materials. Creep and stress relaxation are the two widely
accepted test methods for predicting the long-term mechan-
ical performance of the composites. Stress-relaxation
behavior of composites determines the dimensional stabil-
ity of load-bearing structures and the retention of clamping
force for bolts fastened to composites. Since stress relaxa-
tion represents the basic time-dependent response of the
material, the measurement of stress relaxation is considered
very important aspect in the life of the material [9]. The
stress-relaxation studies of oil palm fiber-reinforced phenol
formaldehyde composites and banana fiber-reinforced
polyester composites have been reported by Thomas and
coworkers [10, 11]. It is observed that the incorporation of
banana fiber in the polyester matrix reduces the rate of
stress relaxation. Hybridization of banana fiber with glass
fiber has been found to decrease the rate of stress relaxa-
tion. The relaxation curve of the neat polyester sample
shows a regular decrease in stress with time [10]. There are
reports in the literature that the unfilled materials usually
only have one relaxation mechanism [9]. With the incorpo-
ration of fiber, the nature of the relaxation curves changes
especially during the final stages. Effect of fiber volume
fraction has also been studied and it is found that at rela-
tively low fiber loading, the fibers instead of acting as rein-
forcements act as flaws. The increased rate of stress relaxa-
tion in the case of composites with low fiber loading can
be attributed to the lower contribution of the fibers in stress
transfer. In addition, the strength characteristics of the fiber
are not reflected in strength and modulus values of com-
posite at low fiber content. At higher fiber loading, the
slope of the curve is decreased considerably at the final
stages of relaxation due to better stress transfer between
the fiber and matrix [12]. Geethamma et al. [13] have stud-
ied the tensile stress relaxation of short-coir-fiber-rein-
forced natural rubber composites. The relaxation mecha-
nisms of both the unfilled compound and the composite
have been influenced by the strain rate, fiber loading, and
fiber orientation. Kawai et al. [14] have investigated stress-
relaxation behavior of unidirectional T800H/3631 carbon/
epoxy composite at elevated temperature and relatively
high tensile strain levels. Stress-relaxation tests have been
performed at 1008C on plain coupon specimens with differ-
ent fiber orientations, h ¼ 08, 108, 308, 458, and 908. Afterthe strain hold, the axial stress quickly relaxes with time in
a short period. The stress-relaxation rate of the composite
tends to become zero, irrespective of the fiber orientation.
The associated relaxation modulus depends on the level of
strain. Shimizu et al. [15] have developed a method for
lifetime prediction of anticorrossive GFRP (ECR-glass/
polyester) pipe by stress-relaxation test. Lifshitz and Rotem
[16] have determined time-dependent longitudinal strength
of unidirectional glass fiber-reinforced epoxy and polyester
composites by studying delayed fracture in creep and stress
relaxation. The limiting stress, below which there is no
danger of delayed fracture, is �0.65 and 0.4 times the ulti-
mate failure stress for the glass–epoxy and glass–polyester
composites, respectively. Gutman and Soncino [17] have
studied the environmental effect on stress relaxation in
polyester-fiberglass composite. The stress-relaxation
behavior is investigated under various chemical environ-
ments and temperatures. Wortmann and Schulz [18] have
investigated the stress-relaxation behavior of polypropyl-
ene fibers in the temperature range of 250 and þ308C.The moduli, as well as the characteristic relaxation time,
show pronounced temperature dependencies. Ikeda and
Azinomoto [19] have used the stress-relaxation test to eval-
uate the chemical resistance of FRPs.
In spite of its obvious importance, there is surprisingly
no systematic work to demonstrate the stress-relaxation
behavior especially at low temperature, i.e., less than
2508C with the variation of fiber volume fraction in the
composites (30–60 vol%), load levels, i.e., 1–5 kN. The
purpose of this investigation is to understand the mecha-
nism of stress relaxation under the above-mentioned condi-
tions. Specifically, this investigation seeks to answer the
following questions: (1) What is the effect of times, tem-
peratures, stress levels, and volume fraction of fibers in the
composites made by the newly proposed RPM technique
for the use in structural applications? (2) Literature results
reveal that the stress-relaxation phenomenon is a combina-
tion of primary and secondary relaxation process. If this is
true, what is the effect of times, temperatures, stress levels,
and volume fraction of fibers in the composites on the rate
of primary and secondary-relaxation processes? (3) Are
these processes dependent with each other? (4) What are
the effects of times, temperatures, stress levels, and volume
fraction of fibers in the composites on relaxation times? (5)
It is necessary to know, what is happened at the transition
temperature, i.e., glass transition temperature? To find out
the answers of these questions, the following methodolo-
gies have been adopted. The FRP composites of glass fiber
and polyester resin with vol% of fiber 30–60 were prepared
by both newly proposed RPM and regular compression-
molding techniques. The natural rubber with 45 phr (per
hundred rubber) carbon black was used to make a rubber
mold used in RPM technique. The stress-relaxation experi-
ment is carried out over a wide range of temperature
1078 POLYMER COMPOSITES—-2008 DOI 10.1002/pc
(2708C to þ1008C), fiber volume fraction (30–60%), ini-
tial load level (1–5 kN), and time (600 s).
EXPERIMENTAL
Raw Materials
Glass fiber (E-glass, 4-satin) used in this study was sup-
plied by Harsh Deep Industries, India. Unsaturated polyes-
ter resin (matrix), methyl ethyl ketone peroxide (curative),
cobalt octate (accelerator), epoxy resin (Araldite LY 556
IN), and hardener (HY951) were supplied by M/S Maypee
Industries, Lucknow, India. Resin viscosity at 258C is 146
cps measured by Brookfield viscometer. No other diluents
were added to reduce its viscosity. S.R. Chemicals, India,
supplied natural rubber (ISNR 10). Natural rubber is
cheaper than silicone/butyl/polybutadiene rubber. That is
why it is used to make a rubber mold in RPM technique.
Other rubber chemicals such as zinc oxide, stearic acid, ac-
celerator (TMTD; tetramethyl thiuram disulfide), sulphur
(curing agent), and carbon black (N330) used to make the
rubber mold were received from Avadh Rubber Limited,
India.
Mixing of Rubber Chemicals
The compounding ingredients (rubber chemicals) were
mixed with NR on a two roll mixing mill at a temperature
of 25–508C and friction ratio of 1:1.1 according to the
ASTM D 3182-89. Natural rubber (100 phr; ISNR 10), 5
phr of sulphur, 5 phr of zinc oxide, 2.5 phr of TMTD (ac-
celerator), 3 phr of stearic acid, and 45 phr of carbon black
(N330) were used in this study to make a rubber mold.
Curing and Molding of Rubber Punch
The curing characteristics of the mixed natural rubber
were evaluated at a temperature of 1508C with a Rheome-
ter R-100S according to ASTM D 2084-93. Subsequent
molding for rubber punch was carried out in a hydraulic
press at a temperature of 1508C for 40 min under a pres-
sure of 5 MPa. The curing pressure was measured through
pressure gauge attached to the hydraulic press.
Preparation of Test Specimen
The composite laminates were prepared from woven E-
glass fabric (4-satin) and unsaturated polyester resin.
Methyl ethyl ketone peroxide and cobalt octoate were used
as curative and accelerator, respectively, for the curing of
unsaturated polyester resin with a weight percentage of
1.2% each. Six layers were used to prepare the laminates,
which yield a thickness of 2–3 mm depending upon the
volume fraction of the laminates. The wet preform was pre-
pared by hand-layup process. It was then cured in a hydrau-
lic press at a temperature of 258C and a pressure of 0.5
MPa for 24 h [1–8]. Composite laminates were prepared by
RPM technique as well as conventional compression mold-
ing. For RPM technique, the laminate is kept between a
steal plate and the rubber sheet, and for conventional com-
pression molding, the laminate is pressed by keeping it in
between two nickel chrome plated steel plates in the hy-
draulic press [1–8]. The laminates with different fiber vol-
ume fraction were prepared by varying the pressure applied
on the laminates during curing. After sufficient trials and
measurement of fiber volume fraction for each trial, the
appropriate pressure was selected for a given combination
TABLE 1. Curing pressure used for making composite laminates of
different volume fractions by newly proposed RPM and conventional
techniques.
Applied curing
pressure (MPa)
Volume fraction
of laminate
in conventional
technique (%)
Volume fraction
of laminate in
RPM technique (%)
0.06 30 32
0.16 40 43
0.41 50 53
2.62 60 63
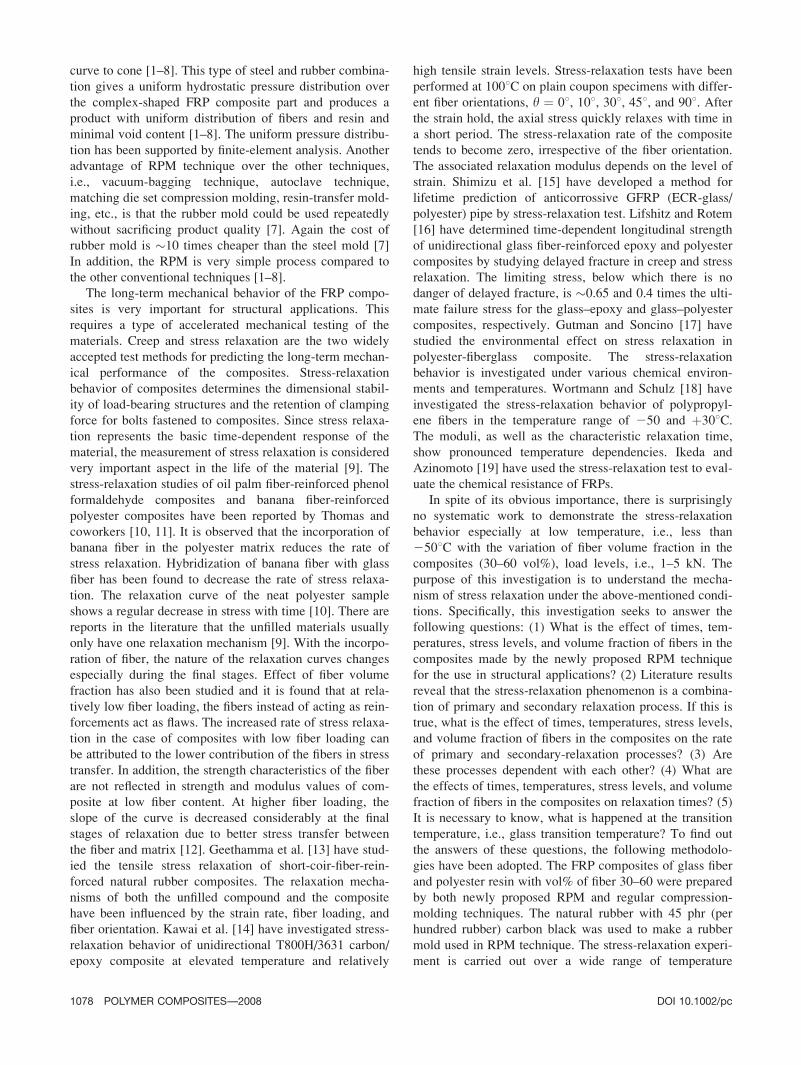
FIG. 1. Dimensions of specimen for stress-relaxation test (all dimen-
sions are in millimeters).
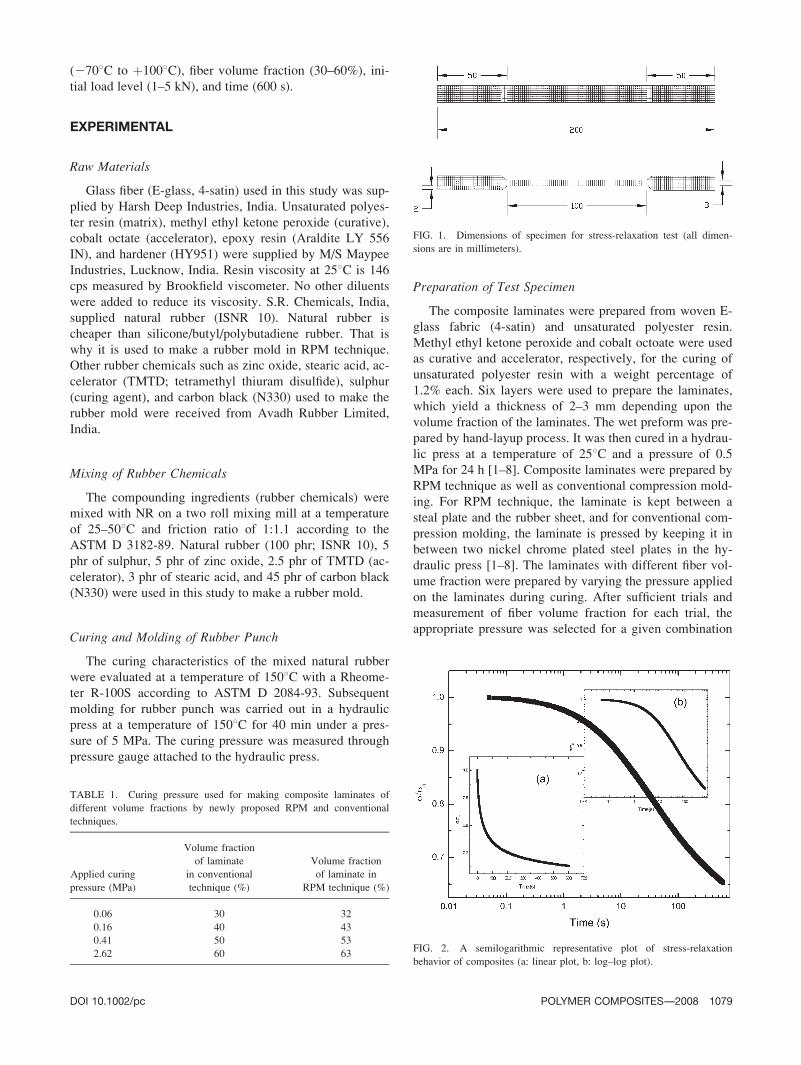
FIG. 2. A semilogarithmic representative plot of stress-relaxation
behavior of composites (a: linear plot, b: log–log plot).
DOI 10.1002/pc POLYMER COMPOSITES—-2008 1079

of laminate area and thickness to get the required fiber vol-
ume fraction. The details of pressure used for achieving
required fiber volume fractions of 30–63% are given in Ta-
ble 1. The specimens are cut from the cured laminates
using a diamond cutter as per specifications, i.e., length L¼ 200 mm, width b ¼ 10 mm, and thickness h ¼ 2–3 mm.
End tabs of length 50 mm were used on both the sides of
the specimen as shown in Fig. 1. The width of specimen
was kept at 10 mm due to limitations of testing equipment.
The end tabs were prepared from the same material and
bonded to the specimen with epoxy resin (Araldite LY 556
IN) mixed with 10% hardener (HY951). The tabs were
allowed to cure at room temperature for 24 h.
Measurement of Stress Relaxation
Stress-relaxation test was carried out on Zwick/Roell
Z010 universal testing machine of 10 kN capacity equipped
with an environmental chamber to control the temperatures
in the range of 280 to þ2508C. The specimen was kept
FIG. 3. Effect of loads and temperatures on stress-relaxation behavior of FRP composite [C: conventional
process (30 vol% fiber) and R: RPM technique (32 vol% fiber)].
1080 POLYMER COMPOSITES—-2008 DOI 10.1002/pc
inside this chamber for 30 min. The specimen thickness
and width data were recorded with a dial guage having a
least count of 0.01 mm. Initial strains corresponding to
load values 1, 2, 3, 4, and 5 kN were applied at the cross-
head speed of 10 mm/min. After reaching the peak load,
the strain is maintained constant for 10 min. The load ver-
sus time data was recorded for each specimen. The modu-
lus of FRP components depends on the fiber volume frac-
tion and also on the temperature. To normalize this effect,
the stress at time t was divided by the stress at zero time
and plotted against time.
RESULTS AND DISCUSSION
Three types of plot have been used in the investigation
of stress relaxation of viscoelastic materials. Gent [20] and
Derham and Thomas [21] have used a semilogarithmic plot
of r(t)/r(1) against log 10(t), where r(t) and r(1) are the
stresses at time t and 1 s, respectively. Cotten and Boonstra
[22], Voet et al. [23], and MacKenzie and Scanlan [24]
have preferred a plot of log 10[r(t)/r(1)] against log 10(t)
assuming a power law relationship between these quanti-
ties. Other investigators [25, 26] have liked a semilogarith-
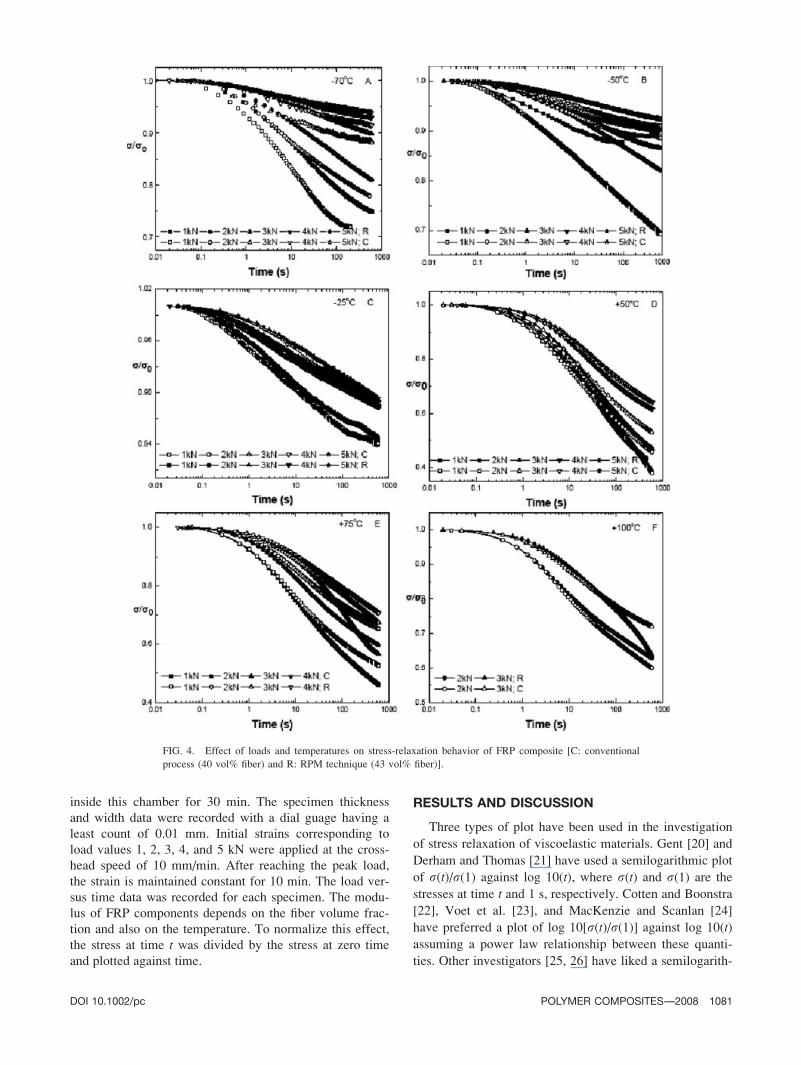
FIG. 4. Effect of loads and temperatures on stress-relaxation behavior of FRP composite [C: conventional
process (40 vol% fiber) and R: RPM technique (43 vol% fiber)].
DOI 10.1002/pc POLYMER COMPOSITES—-2008 1081
mic plot of log 10[r(t)/r(1)] against time t implying an
exceptional equation. All these graphs have been claimed
to be linear: the slope of the semilogarithmic plot in the
first case is r(1)21d[r(t)]/d[log 10(t)], of fully logarithmic
plot is r(t)21d[r(t)]/d[log 10(t)], and that of semilogarith-
mic plot of exponential relationship is r(t)21d[r(t)]/td[log10(t)]. Linearity in all these plots implies that r(1)21,
r(t)21, and r(t)21/t are constant throughout the region.The nature of the plot is not same in the case of long
glass fiber-reinforced polyester composites. The stress-
relaxation behavior of 30 vol% fiber-reinforced polyester
composites at a load of 5 kN and temperature of 508C is
shown in inset A of Fig. 2 (as a representative). The time
at which the maximum stress is recorded by tensile testing
machine is taken as the time zero and the maximum stress
value is used to calculate the reference stress, r0. It is a
simple linear plot of ratio of stress versus time, not a loga-
rithmic or semilogarithmic plot. Nonlinear nature is
observed here. The experimental points appear to lie upon
two straight lines rather than one. The first one of greater
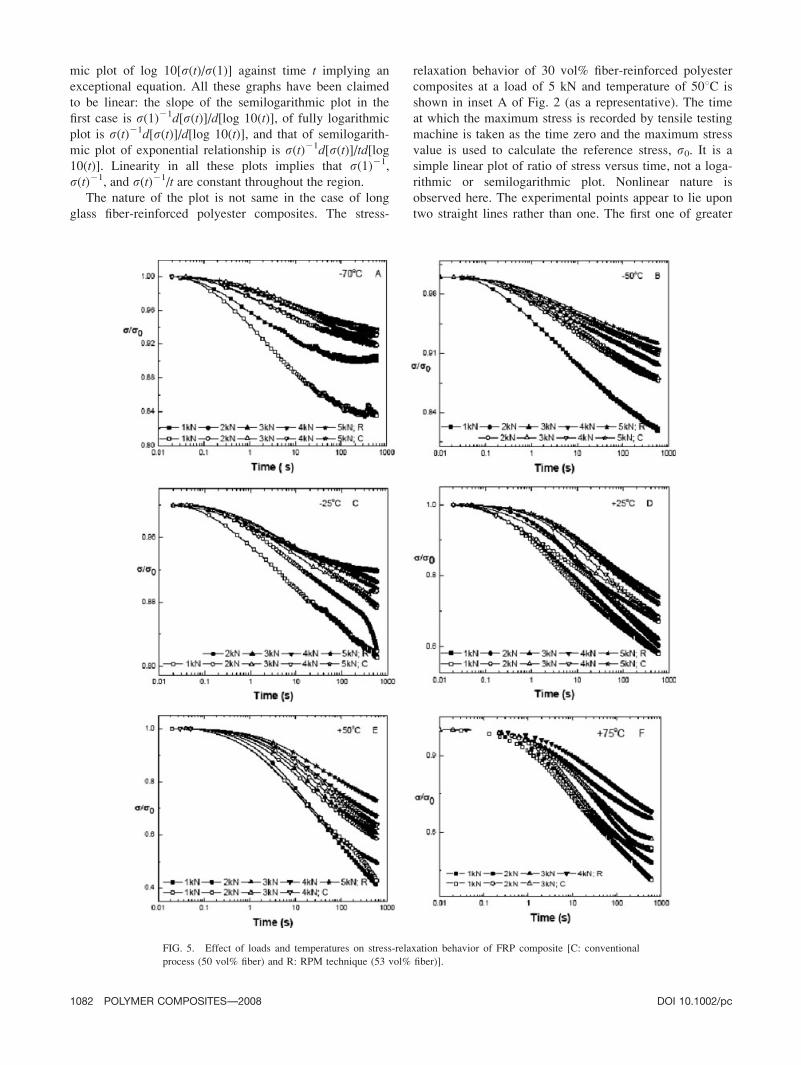
FIG. 5. Effect of loads and temperatures on stress-relaxation behavior of FRP composite [C: conventional
process (50 vol% fiber) and R: RPM technique (53 vol% fiber)].
1082 POLYMER COMPOSITES—-2008 DOI 10.1002/pc

slope applies for time less than 100 s, and the second one
with lesser slope for longer times. But when the same
results are replotted in log–log scale (shown in inset B of
Fig. 2), the nature of stress relaxation is different and not
equal to the linear plot. The low rate of stress relaxation,
i.e., lesser slope is observed at short period of time, i.e.,
less than 10 s and high rate of stress relaxation at higher
time. Plotting these results as a semilogarithmic scale in
Fig. 2 gives a similar nature consisting of two straight lines
with the greater slope appearing at higher times. In this
investigation, semilogarithmic plots are used for the sake
of convenience.
The effect of initial load, i.e., stress upon the stress-
relaxation behavior is investigated at various temperatures
and fiber volume fraction of composites made by the regu-
lar conventional process and newly proposed RPM tech-
nique. These stress-relaxation results over a range of temp,
i.e., 270 to þ1008C, volume fraction of fibers, i.e., 30–
63% and loads, i.e., 1–5 kN are shown in Figs. 3–6. It is
evident from these Figs. 3–6 that the stress-relaxation pro-
FIG. 6. Effect of loads and temperatures on stress-relaxation behavior of FRP composite [C: conventional
process (60 vol% fiber) and R: RPM technique (63 vol% fiber)].
DOI 10.1002/pc POLYMER COMPOSITES—-2008 1083
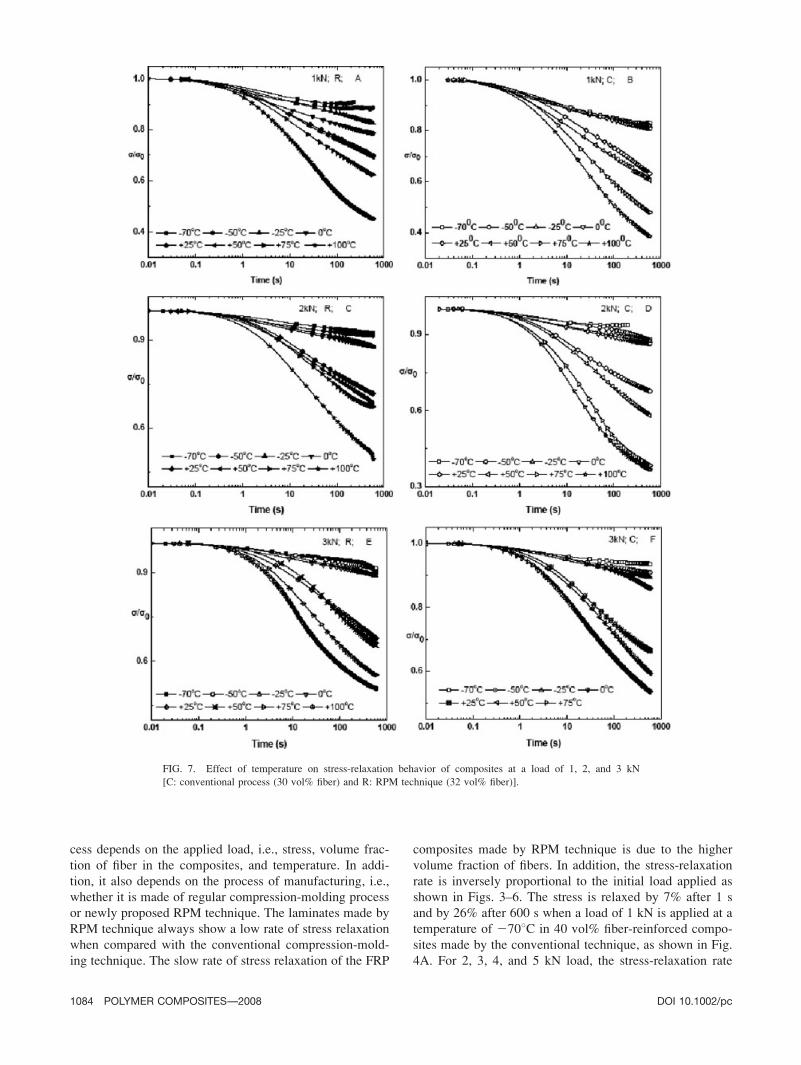
cess depends on the applied load, i.e., stress, volume frac-
tion of fiber in the composites, and temperature. In addi-
tion, it also depends on the process of manufacturing, i.e.,
whether it is made of regular compression-molding process
or newly proposed RPM technique. The laminates made by
RPM technique always show a low rate of stress relaxation
when compared with the conventional compression-mold-
ing technique. The slow rate of stress relaxation of the FRP
composites made by RPM technique is due to the higher
volume fraction of fibers. In addition, the stress-relaxation
rate is inversely proportional to the initial load applied as
shown in Figs. 3–6. The stress is relaxed by 7% after 1 s
and by 26% after 600 s when a load of 1 kN is applied at a
temperature of 2708C in 40 vol% fiber-reinforced compo-
sites made by the conventional technique, as shown in Fig.
4A. For 2, 3, 4, and 5 kN load, the stress-relaxation rate
FIG. 7. Effect of temperature on stress-relaxation behavior of composites at a load of 1, 2, and 3 kN
[C: conventional process (30 vol% fiber) and R: RPM technique (32 vol% fiber)].
1084 POLYMER COMPOSITES—-2008 DOI 10.1002/pc

decreases progressively. The percentage of stress relaxed
after 1 and 600 s at a load of 5 kN is 2 and 10%, respec-
tively. As the initial load is increased from 1 to 5 kN, the
decrease in the percentage of stress relaxed after 1 and 600
s is 5 and 16%, respectively. The material shows higher
percentage of stress relaxation at lower initial loads as the
relaxation due to the rearrangement of molecular chains of
polymer forms a significant part of the total relaxation pro-
cess. For the RPM technique, the stress-relaxation rate is
also in similar nature. As for example for a load of 1 kN,
temp of 2708C and 43 vol% fiber-reinforced composites,
the percentage of stress relaxed after 1 and 600 s is 4 and
12%, respectively. The corresponding values for 5 kN load
are 1 and 6%, respectively. As the initial load is increased
from 1 to 5 kN, there is a decrease of 3 and 6% stress
relaxed after 1 and 600 s, respectively. Same trends are
also observed at 250, 225, and 08C for all other compo-
sites made by both techniques as shown in Figs. 3–6. The
understanding of stress-relaxation behavior of glass fiber-
reinforced polyester composites at room temperature, i.e.,
258C is most important as they are used in making general-
purpose items. The percentage of stresses relaxed for 30
vol% fiber-reinforced composites made by the conven-
tional technique after 1 and 600 s are 7 and 39%, respec-
tively, at a load of 1 kN. The decreases in the percentage
of stresses relaxed after 1 and 600 s as the load is increased
from 1 to 5 kN are 4 and 3%, respectively. Similarly, for
the RPM technique, the stresses relaxed after 1 and 600 s
for 1 kN load are 5 and 30%, respectively. As the load is
increased from 1 to 5 kN, but the decreases in the percent-
age of stresses relaxed after 1 and 600 s are same, which is
2%. At 60 vol% fiber-reinforced composites made by the
conventional technique and temperature of 258C, the per-
centages of stresses relaxed for 1 kN load after 1 and 600 s
are 9 and 47%, respectively. The corresponding decrease in
the stresses relaxed as the load is increased from 1 to 4 kN
are 4 and 15%, respectively. For the composites made by
RPM technique at a load of 1 kN, the percentages of
stresses relaxed after 1 and 600 s are 5 and 40%, respec-
tively. There is a decrease in the percentage of stress
relaxed by 5% after 1 s and 14% after 600 s as the load is
increased from 1 to 5 kN, respectively. As the environmen-
tal temperature is varying with times and the composites
products are subjected to high temperatures during their
service life, the stress-relaxation behavior of glass fiber-re-
inforced polyester composite at an elevated temperature is
important and studied at 50, 75, and 1008C. The relaxation
behavior of 30–32 vol% fiber-reinforced composites at a
FIG. 8. Effect of temperature on stress-relaxation behavior of composites at a load of 4 and 5 kN [C: con-
ventional process (40 vol% fiber) and R: RPM technique (43 vol% fiber)].
DOI 10.1002/pc POLYMER COMPOSITES—-2008 1085

temperature of 508C is shown in Fig. 3D. The percentages
of stress relaxed at an applied load of 1 kN after 1 and 600
s for the composites made by RPM technique are 7 and
55%, respectively. As the load is increased from 1 to 5 kN,
the percentages of stress relaxed after 1 and 600 s decrease
by 4 and 21%, respectively. For the conventional compres-
sion molding, the percentages of stress relaxed at an
applied load of 1 kN after 1 and 600 s are 9 and 61%,
respectively. The percentages of stress relaxed decrease by
6 and 26% as the load is increased from 1 to 5 kN, respec-
tively. Similar results are also observed for other compo-
sites at a temperature of 508C made by both techniques.
Figure 3F shows the stress-relaxation data for 30–32% fiber
volume fraction at a higher temperature, i.e., 1008C. For anapplied load of 1 kN on the composite made by the RPM
technique, the percentages of stress relaxed after 1 and 600
s are 4 and 31%, respectively, which shows a correspond-
ing increase of 1 and 18% when load is increased to 3 kN.
The similar trends are also observed for the composites
made by the conventional compression molding. The
stress-relaxation data of 63 vol% fiber-reinforced compo-
sites made by the RPM technique at a temperature of
1008C is shown in Fig. 6F. The percentages of stress
relaxed after 1 and 600 s are 6 and 42%, respectively, at an
applied load of 1 kN load. As the load is increased to 3 kN,
the percentages of stress relaxed after 1 and 600 s decrease
by 2 and 6%, respectively. For the composites made by
conventional compression molding, the percentages of
stress relaxed after 1 and 600 s are 5 and 32%, respec-
tively, which show a decrease of 2 and 5% as the load is
increased to 3 kN.
For better understanding the stress-relaxation behavior
of long fiber-reinforced composites, the measurements
have been made at various temperatures, i.e., 270, 250,
225, 0, þ25, þ50, þ75, and 1008C over a range of applied
load, i.e., 1–5 kN, and volume fraction of fibers, i.e., 30–
63%. Above 1008C, the polyester composites become sus-
ceptible to atmospheric oxidation. So, the stress relaxation
due to the chemical oxidation at this applied load will be
added to the normal relaxation process due to the visco-
elastic nature. In addition, the composites are in above
glass transition temperature. To eliminate these factors, no
measurements have been done above 1008C. The relaxa-
tion curves as shown in Figs. 7–10 (few selective figs)
show the usual two straight lines. The rate of stress relaxa-
tion increases with an increase of temperature for all com-
FIG. 9. Effect of temperature on stress-relaxation behavior of composites at a load of 4 and 5 kN [C: con-
ventional process (50 vol% fiber) and R: RPM technique (53 vol% fiber)].
1086 POLYMER COMPOSITES—-2008 DOI 10.1002/pc

posites. In addition, the rate of stress relaxation is more for
the composites made by the conventional technique when
compared with RPM technique. Figure 7E and F shows the
stress relaxation data for 30 and 32 vol% fiber-reinforced
composites at an applied load of 3 kN. For the composites
made by conventional technique (Fig. 7F), at 2708C, thepercentages of stress relaxed after 1 and 600 s are 2 and
10%, respectively. As the temperature is increased to 258C,the percentage of stress relaxed increases by 5 and 22%,
respectively. When the temperature is increased from 270
to 1008C, the percentages of stress relaxed after 1 and 600
s increase by 9 and 39%, respectively. Whereas in the case
of RPM technique, the percentages of stress relaxed for 32
vol% fiber-reinforced composites are 1 and 6% at 2708Cafter 1 and 600 s, respectively. When temperature is
increased to 258C, the stress relaxed after 1 and 600 s
increases by 2 and 15%, respectively. Similarly when the
temperature is increased to 758C, the stress relaxed after 1
and 600 s increases by 5 and 20%, respectively. This
behavior is obvious because at the lower temperatures the
FIG. 10. Effect of temperature on stress-relaxation behavior of composites at a load of 1, 2, and 3 kN
[C: conventional process (60 vol% fiber) and R: RPM technique (63 vol% fiber)].
DOI 10.1002/pc POLYMER COMPOSITES—-2008 1087

matrix is more stiff and rigid and there is less opportunity
for polymer segments to rearrange themselves to facilitate
relaxation. At lower fiber volume fraction, the behavior of
composite is mostly governed by matrix properties, i.e.,
polyester. The stress-relaxation data of 40–43 vol% fiber-
reinforced composites at 5 kN load is shown in Fig. 8C and
D. The composites made by conventional compression
molding, the percentages of stress relaxed after 1 and 600 s
at 2708C are 2 and 10%, respectively. As the temperature
increases to 08C, the percentages of stress relaxed increase
by 2 and 14%, respectively. When the temperature is fur-
ther increased to 508C, the percentages of stress relaxed
increase by 3 and 20%, respectively. A similar variation is
observed for RPM specimens with slightly lower stress-
relaxation rate. Figure 9A and B shows stress-relaxation
data for 50–53 vol% fiber-reinforced composites at an
applied load of 4 kN. The composites made by RPM tech-
nique, at 2708C and load of 4 kN, and the percentages of
FIG. 11. Effect of volume fraction of fibers in composites on stress relaxation at a temperature of 2708C(C: conventional process and R: RPM technique).
1088 POLYMER COMPOSITES—-2008 DOI 10.1002/pc
stress relaxed after 1 and 600 s are 2 and 6%, respectively.
As the temperature is increased to 08C, the percentage of
stress relaxed after 600 s increases by 14%. When the tem-
perature is further increased to 508C, the percentages of
stress relaxed after 1 and 600 s increase by 3 and 20%,
respectively. In case of convention technique, the variation
is similar. The stress-relaxation data for 60–63 vol% fiber-
reinforced composites at an applied load of 3 kN load is
shown in Fig. 10E and F. The composites made by RPM
technique, the percentages of stress relaxed after 1 and 600
s are 2 and 8%, respectively, at 2708C and applied load of
3 kN. As the temperature is increased to 08C, the stress
relaxed after 600 s increases by 13%. Similar trend is also
observed for the composites made by conventional tech-
nique.
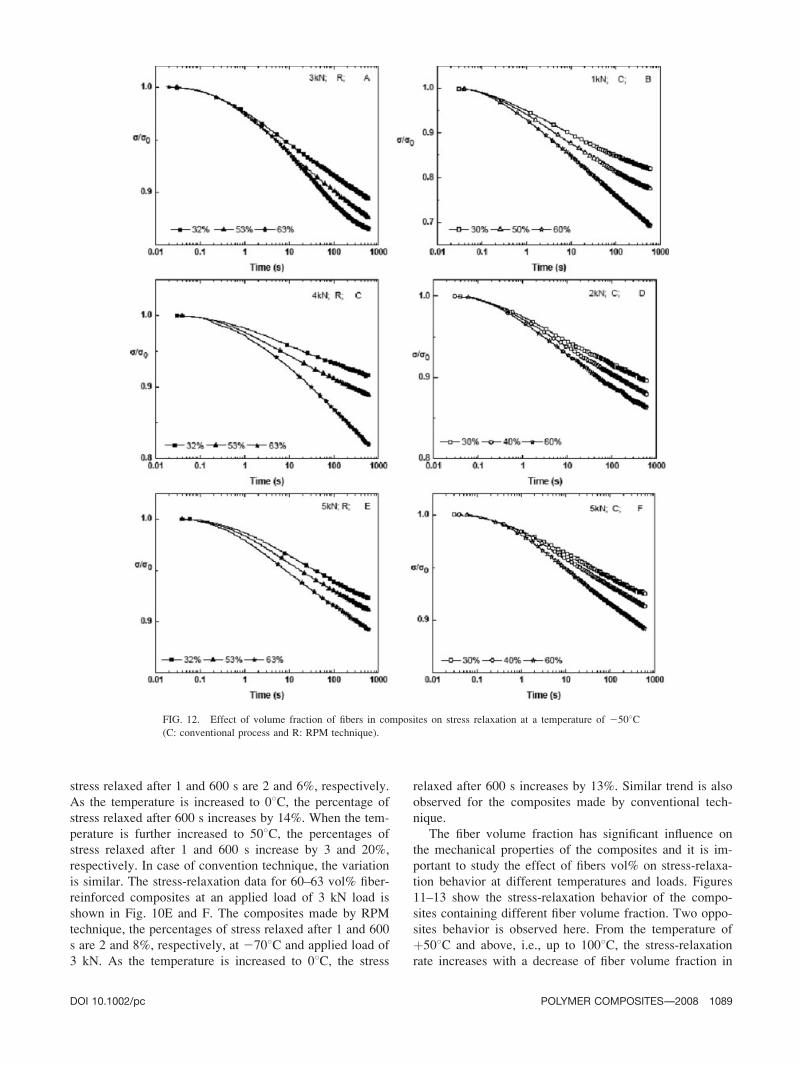
The fiber volume fraction has significant influence on
the mechanical properties of the composites and it is im-
portant to study the effect of fibers vol% on stress-relaxa-
tion behavior at different temperatures and loads. Figures
11–13 show the stress-relaxation behavior of the compo-
sites containing different fiber volume fraction. Two oppo-
sites behavior is observed here. From the temperature of
þ508C and above, i.e., up to 1008C, the stress-relaxation
rate increases with a decrease of fiber volume fraction in
FIG. 12. Effect of volume fraction of fibers in composites on stress relaxation at a temperature of 2508C(C: conventional process and R: RPM technique).
DOI 10.1002/pc POLYMER COMPOSITES—-2008 1089
the composites, whereas the stress-relaxation rate increases
with an increase of fiber volume fraction at low tempera-
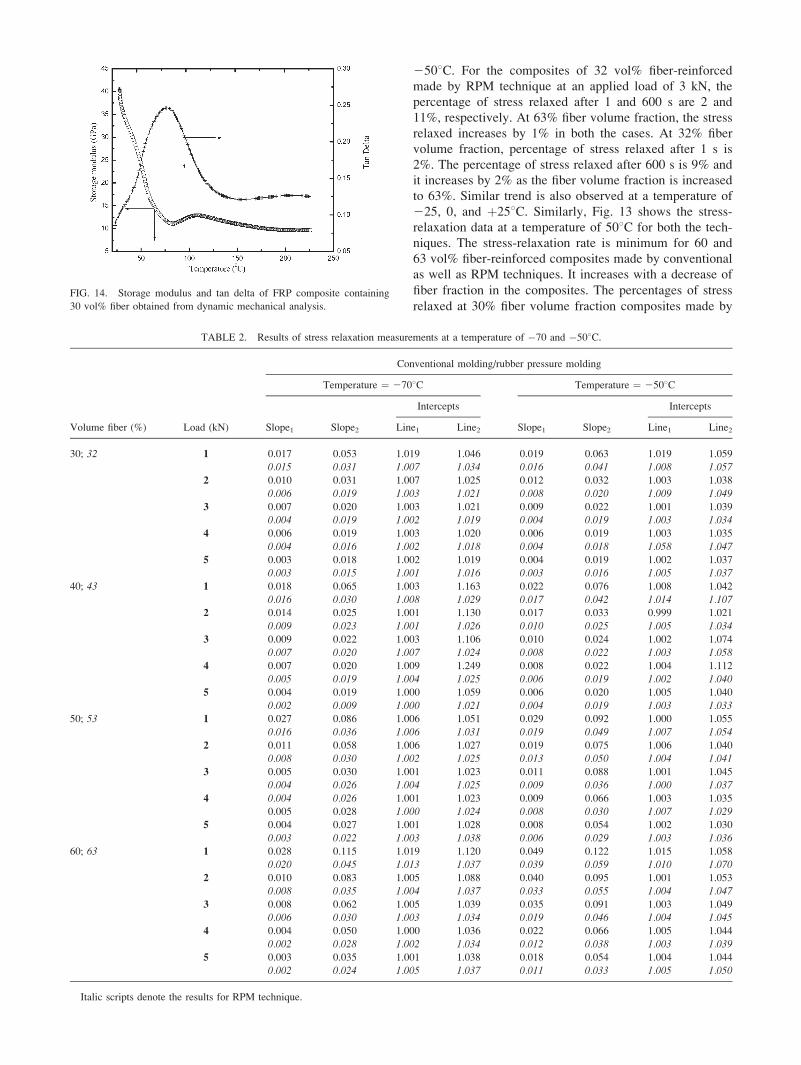
ture, i.e., þ508C to 21008C. This change over time is due
to the glass transition temperature of polyester composites,
which is �678C determined by dynamic mechanical analy-
sis (Fig. 14). Below this glass transition temperature, the
material behaves as a hard material and the stress-relaxa-
tion behavior is dominated by the overall stiffness of the
composites. But above the glass transition temperature, the
polymer, i.e., polyester resin dominates the stress-relaxa-
tion behavior, which is viscoelastic in nature. As for exam-
ple, Fig. 11 shows the stress-relaxation behavior at a tem-
perature of 2708C over an applied load of 1–5 kN. For
both techniques, the stress-relaxation rate is minimum for
30% fiber-reinforced composites. At 30 vol% fiber-rein-
forced composites made by the conventional technique, the
percentage of stress relaxed at an applied load of 5 kN after
1 and 600 s is 1 and 7%, respectively. As the fiber volume
fraction is increased to 60%, the percentages of stress
relaxed increase by 2% only after 1 s. Similar trend is also
observed for the composites made by RPM technique. Fig-
ure 12 shows the stress-relaxation data at a temperature of
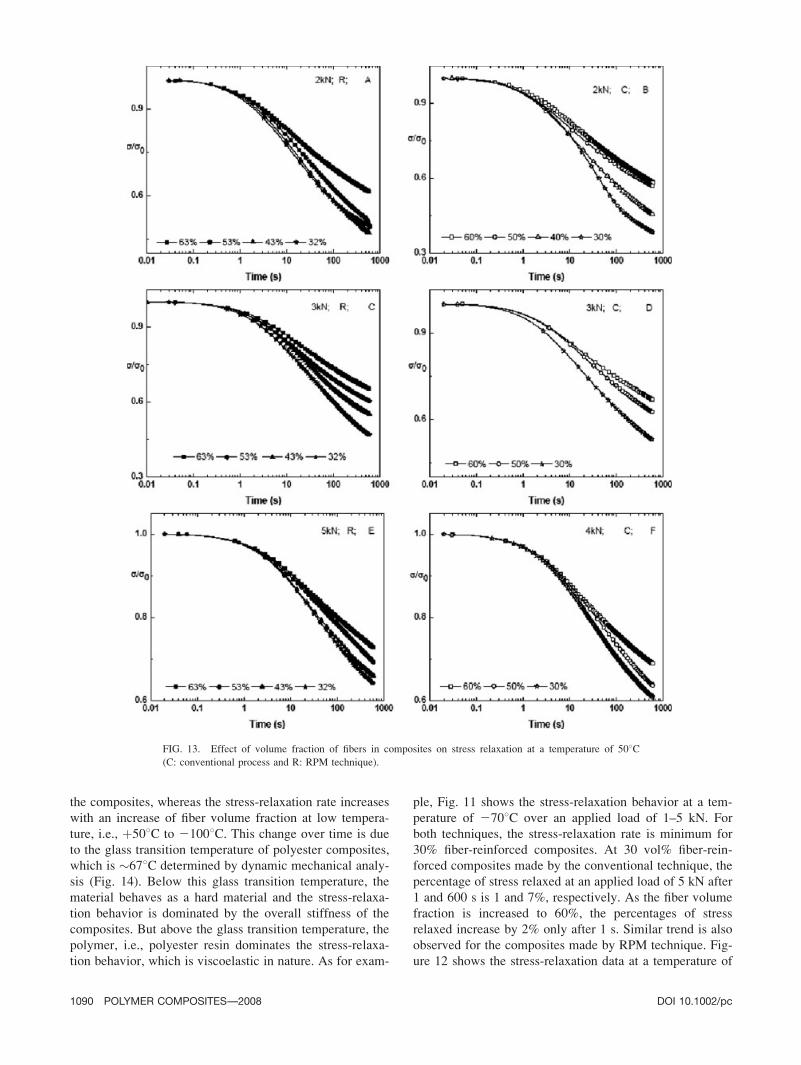
FIG. 13. Effect of volume fraction of fibers in composites on stress relaxation at a temperature of 508C(C: conventional process and R: RPM technique).
1090 POLYMER COMPOSITES—-2008 DOI 10.1002/pc
2508C. For the composites of 32 vol% fiber-reinforced
made by RPM technique at an applied load of 3 kN, the
percentage of stress relaxed after 1 and 600 s are 2 and
11%, respectively. At 63% fiber volume fraction, the stress
relaxed increases by 1% in both the cases. At 32% fiber
volume fraction, percentage of stress relaxed after 1 s is
2%. The percentage of stress relaxed after 600 s is 9% and
it increases by 2% as the fiber volume fraction is increased
to 63%. Similar trend is also observed at a temperature of
225, 0, and þ258C. Similarly, Fig. 13 shows the stress-
relaxation data at a temperature of 508C for both the tech-
niques. The stress-relaxation rate is minimum for 60 and
63 vol% fiber-reinforced composites made by conventional
as well as RPM techniques. It increases with a decrease of
fiber fraction in the composites. The percentages of stress
relaxed at 30% fiber volume fraction composites made byFIG. 14. Storage modulus and tan delta of FRP composite containing
30 vol% fiber obtained from dynamic mechanical analysis.
TABLE 2. Results of stress relaxation measurements at a temperature of �70 and �508C.
Volume fiber (%) Load (kN)
Conventional molding/rubber pressure molding
Temperature ¼ 2708C Temperature ¼ 2508C
Slope1 Slope2
Intercepts
Slope1 Slope2
Intercepts
Line1 Line2 Line1 Line2
30; 32 1 0.017 0.053 1.019 1.046 0.019 0.063 1.019 1.059
0.015 0.031 1.007 1.034 0.016 0.041 1.008 1.057
2 0.010 0.031 1.007 1.025 0.012 0.032 1.003 1.038
0.006 0.019 1.003 1.021 0.008 0.020 1.009 1.049
3 0.007 0.020 1.003 1.021 0.009 0.022 1.001 1.039
0.004 0.019 1.002 1.019 0.004 0.019 1.003 1.034
4 0.006 0.019 1.003 1.020 0.006 0.019 1.003 1.035
0.004 0.016 1.002 1.018 0.004 0.018 1.058 1.047
5 0.003 0.018 1.002 1.019 0.004 0.019 1.002 1.037
0.003 0.015 1.001 1.016 0.003 0.016 1.005 1.037
40; 43 1 0.018 0.065 1.003 1.163 0.022 0.076 1.008 1.042
0.016 0.030 1.008 1.029 0.017 0.042 1.014 1.1072 0.014 0.025 1.001 1.130 0.017 0.033 0.999 1.021
0.009 0.023 1.001 1.026 0.010 0.025 1.005 1.034
3 0.009 0.022 1.003 1.106 0.010 0.024 1.002 1.074
0.007 0.020 1.007 1.024 0.008 0.022 1.003 1.0584 0.007 0.020 1.009 1.249 0.008 0.022 1.004 1.112
0.005 0.019 1.004 1.025 0.006 0.019 1.002 1.040
5 0.004 0.019 1.000 1.059 0.006 0.020 1.005 1.040
0.002 0.009 1.000 1.021 0.004 0.019 1.003 1.03350; 53 1 0.027 0.086 1.006 1.051 0.029 0.092 1.000 1.055
0.016 0.036 1.006 1.031 0.019 0.049 1.007 1.054
2 0.011 0.058 1.006 1.027 0.019 0.075 1.006 1.040
0.008 0.030 1.002 1.025 0.013 0.050 1.004 1.041
3 0.005 0.030 1.001 1.023 0.011 0.088 1.001 1.045
0.004 0.026 1.004 1.025 0.009 0.036 1.000 1.037
4 0.004 0.026 1.001 1.023 0.009 0.066 1.003 1.035
0.005 0.028 1.000 1.024 0.008 0.030 1.007 1.029
5 0.004 0.027 1.001 1.028 0.008 0.054 1.002 1.030
0.003 0.022 1.003 1.038 0.006 0.029 1.003 1.036
60; 63 1 0.028 0.115 1.019 1.120 0.049 0.122 1.015 1.058
0.020 0.045 1.013 1.037 0.039 0.059 1.010 1.070
2 0.010 0.083 1.005 1.088 0.040 0.095 1.001 1.053
0.008 0.035 1.004 1.037 0.033 0.055 1.004 1.047
3 0.008 0.062 1.005 1.039 0.035 0.091 1.003 1.049
0.006 0.030 1.003 1.034 0.019 0.046 1.004 1.045
4 0.004 0.050 1.000 1.036 0.022 0.066 1.005 1.044
0.002 0.028 1.002 1.034 0.012 0.038 1.003 1.0395 0.003 0.035 1.001 1.038 0.018 0.054 1.004 1.044
0.002 0.024 1.005 1.037 0.011 0.033 1.005 1.050
Italic scripts denote the results for RPM technique.

conventional technique after 1 and 600 s are 3 and 38%,
respectively. As the fiber volume fraction is increased to
60%, the percentage of stress relaxed after 600 s decreases
by 16%. Similar trend is also observed at higher tempera-
ture, i.e., 75 and 1008C. At 32% fiber volume fraction com-
posites made by RPM technique, the percentages of stress
relaxed after 1 and 600 s are 4 ad 31%, respectively, show-
ing a corresponding increase by 1 and 6% as the fiber vol-
ume fraction is increased to 63%. Similar trend is also
observed for other techniques.
The experimental results for a given composites are
summarized by four values, the slopes of the two straight
lines (two separate relaxation processes), and their inter-
cepts upon the r(t)/r(0) axis at log 10(t) ¼ 0 (i.e., at
t ¼ 1 s). These quantities from the semilogarithmic plots
are given in Tables 2–5. Both the slopes are dependent
upon the applied load, temperature, volume fraction of
fibers in the composites, and method of manufacturing.
It decreases with the increasing load applied in the com-
posites, whereas increases with an increase in tempera-
ture. But the dependence on load and temperature of the
later slope is always greater. The difference in slope
between early and later lines and the difference in the
intercepts are plotted in Figs. 15 and 16 for the compo-
sites made by RPM and conventional technique over a
wide range of temperature, load, and volume fraction of
TABLE 3. Results of stress relaxation measurements at a temperature of –25 and 08C.
Volume fiber (%) Load (kN)
Conventional molding/rubber pressure molding
Temperature ¼ –258C Temperature ¼ 08C
Slope1 Slope2
Intercepts
Slope1 Slope2
Intercepts
Line1 Line2 Line1 Line2
30; 32 1 0.053 0.129 1.009 1.045 0.059 0.133 1.005 1.055
0.049 0.079 1.005 1.046 0.049 0.092 1.010 1.0732 0.041 0.098 1.000 1.026 0.047 0.111 1.006 1.045
0.043 0.071 1.008 1.042 0.046 0.085 1.004 1.044
3 0.039 0.092 1.000 1.037 0.042 0.099 1.002 1.052
0.031 0.066 1.002 1.038 0.039 0.076 1.004 1.062
4 0.028 0.076 1.003 1.032 0.032 0.086 1.005 1.092
0.021 0.048 1.005 1.046 0.028 0.055 1.003 1.071
5 0.027 0.066 1.003 1.035 0.031 0.074 1.002 1.097
0.019 0.044 1.002 1.047 0.023 0.051 1.003 1.113
40; 43 1 0.058 0.137 1.010 1.042 0.068 0.139 1.014 1.055
0.051 0.091 1.011 1.061 0.061 0.121 1.008 1.055
2 0.049 0.109 1.004 1.038 0.055 0.122 1.005 1.067
0.046 0.087 1.003 1.043 0.052 0.117 1.004 1.071
3 0.044 0.097 1.004 1.037 0.048 0.119 1.004 1.062
0.037 0.074 1.004 1.052 0.041 0.111 1.003 1.0814 0.039 0.089 1.006 1.046 0.041 0.109 1.002 1.074
0.029 0.056 1.001 1.055 0.033 0.096 1.004 1.123
5 0.030 0.079 1.002 1.051 0.033 0.102 1.003 1.080
0.021 0.053 1.003 1.063 0.030 0.071 1.004 1.12650; 53 1 0.062 0.144 1.001 1.051 0.071 0.148 1.001 1.042
0.062 0.121 1.003 1.054 0.061 0.127 1.000 1.085
2 0.057 0.132 1.000 1.027 0.059 0.142 0.999 1.039
0.057 0.119 1.005 1.055 0.052 0.120 1.002 1.0743 0.051 0.122 1.003 1.033 0.051 0.139 1.001 1.105
0.045 0.118 1.004 1.053 0.041 0.119 1.001 1.083
4 0.041 0.119 1.003 1.042 0.047 0.122 1.004 1.084
0.036 0.097 1.004 1.055 0.038 0.099 1.004 1.1265 0.043 0.112 1.004 1.041 0.033 0.112 1.001 1.122
0.032 0.081 1.002 1.051 0.034 0.088 0.999 1.123
60; 63 1 0.066 0.151 1.008 1.051 0.072 0.155 0.996 1.073
0.062 0.127 1.017 1.074 0.063 0.127 1.007 1.036
2 0.062 0.144 1.005 1.058 0.064 0.148 1.006 1.112
0.059 0.122 1.005 1.058 0.059 0.128 0.999 1.097
3 0.055 0.135 1.005 1.071 0.055 0.139 1.002 1.099
0.047 0.120 1.003 1.049 0.046 0.126 1.006 1.092
4 0.043 0.132 1.008 1.068 0.049 0.137 1.001 1.110
0.039 0.103 1.002 1.064 0.041 0.109 1.005 1.267
5 0.043 0.119 1.003 1.063 0.044 0.120 1.001 1.114
0.033 0.088 1.002 1.072 0.037 0.092 1.000 1.130
Italic scripts denote the results for RPM technique.
1092 POLYMER COMPOSITES—-2008 DOI 10.1002/pc

composites. All points lie close to a single straight line
through the origin regardless of the type of applied load,
temperature, volume fraction of fibers, and method of
manufacturing. They are dependent with each other. The
same interrelation is observed in the approximate con-
stancy of the time at which two straight lines of the
semilogarithmic plot intercept. This time represents the
change over time from short-time relaxation process to
the long-time relaxation process. These relaxation times
are calculated using equation given below.
rr0
ðtÞ ¼ rr0
� �1þA1e
� ts1 þ A2e
� ts2
where r/r0(t), (r/r0)1, A1, A2, s1, and s2 are ratio of stress
at time t, ratio of stress at equilibrium point, material con-
stant, another material constant, primary relaxation time,
secondary relaxation time, and time, respectively. Figure
17 shows a typical relaxation process of 32 vol% fiber-rein-
forced composites made by RPM technique at a tempera-
ture of 508C and load of 5 kN. These experimental data are
used to calculate the relaxation times using the equation.
The short-time relaxation is represented by secondary
relaxation time, whereas the long-time relaxation is
denoted by primary relaxation time. The secondary and pri-
mary relaxation times of 43 vol% fiber-reinforced compo-
sites made by RPM technique at an applied load of 1 kN
TABLE 4. Results of stress relaxation measurements at a temperature of þ25 and þ508C.
Volume fiber (%) Load (kN)
Conventional molding/rubber pressure molding
Temperature ¼ þ258C Temperature ¼ þ508C
Slope1 Slope2
Intercepts
Slope1 Slope2
Intercepts
Line1 Line2 Line1 Line2
30; 32 1 0.076 0.161 0.998 1.138 0.097 0.197 1.003 1.423
0.066 0.133 1.008 1.191 0.088 0.163 1.007 1.3442 0.066 0.153 0.999 1.205 0.091 0.192 1.005 1.400
0.061 0.128 1.011 1.359 0.086 0.157 1.005 1.543
3 0.061 0.151 1.005 1.257 0.089 0.184 1.003 1.341
0.053 0.126 1.001 1.452 0.084 0.155 1.007 1.365
4 0.055 0.144 1.004 1.250 0.088 0.183 1.001 1.417
0.048 0.119 1.009 1.330 0.084 0.146 1.001 1.316
5 0.051 0.131 1.002 1.232 0.086 0.179 1.001 1.292
0.042 0.098 1.003 1.269 0.079 0.144 0.996 1.333
40; 43 1 0.079 0.169 1.001 1.105 0.097 0.194 1.005 1.432
0.066 0.137 0.999 1.002 0.088 0.161 1.019 1.385
2 0.068 0.161 1.016 1.165 0.090 0.189 1.015 1.477
0.063 0.131 1.001 1.102 0.085 0.155 1.005 1.392
3 0.065 0.159 0.996 1.232 0.088 0.180 1.006 1.447
0.059 0.129 1.004 1.003 0.083 0.155 0.997 1.3474 0.057 0.151 1.004 1.189 0.085 0.178 1.005 1.342
0.052 0.127 1.007 1.101 0.081 0.144 1.006 1.262
5 0.053 0.139 1.001 1.251 0.082 0.176 1.004 1.352
0.048 0.099 1.001 1.003 0.079 0.144 1.006 1.30550; 53 1 0.085 0.173 0.997 1.122 0.094 0.192 1.019 1.360
0.081 0.143 1.003 1.089 0.087 0.159 1.001 1.302
2 0.081 0.169 1.007 1.229 0.089 0.187 1.009 1.428
0.077 0.139 1.000 1.143 0.085 0.154 1.008 1.3033 0.077 0.163 1.000 1.229 0.087 0.180 1.004 1.340
0.071 0.133 1.002 1.131 0.081 0.152 1.000 1.266
4 0.072 0.157 1.001 1.209 0.084 0.177 1.001 1.277
0.066 0.133 1.003 1.190 0.081 0.144 1.002 1.2865 0.071 0.152 1.003 1.199 0.082 0.175 1.002 1.205
0.059 0.127 1.004 1.175 0.079 0.142 1.001 1.119
60; 63 1 0.093 0.188 1.027 1.229 0.093 0.191 1.007 1.277
0.085 0.155 1.008 1.184 0.086 0.155 1.018 1.356
2 0.087 0.181 1.019 1.231 0.088 0.185 1.009 1.260
0.081 0.153 1.001 1.227 0.083 0.153 1.007 1.250
3 0.083 0.177 1.004 1.226 0.085 0.179 1.006 1.261
0.079 0.149 1.183 1.195 0.079 0.152 1.004 1.278
4 0.080 0.173 1.006 1.242 0.081 0.176 1.002 1.263
0.078 0.143 1.006 1.196 0.079 0.144 0.999 1.222
5 0.079 0.171 1.005 1.002 0.081 0.174 1.004 1.244
0.076 0.141 1.004 1.201 0.076 0.141 1.007 1.242
Italic scripts denote the results for RPM technique.
DOI 10.1002/pc POLYMER COMPOSITES—-2008 1093
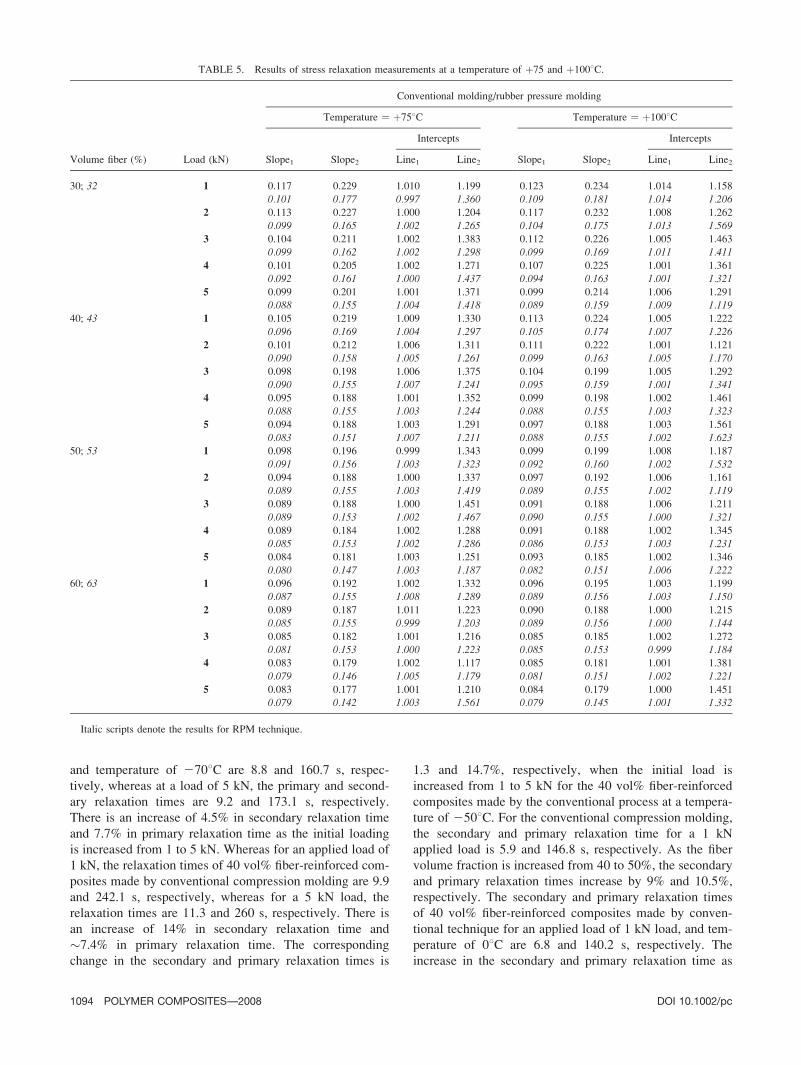
and temperature of 2708C are 8.8 and 160.7 s, respec-
tively, whereas at a load of 5 kN, the primary and second-
ary relaxation times are 9.2 and 173.1 s, respectively.
There is an increase of 4.5% in secondary relaxation time
and 7.7% in primary relaxation time as the initial loading
is increased from 1 to 5 kN. Whereas for an applied load of
1 kN, the relaxation times of 40 vol% fiber-reinforced com-
posites made by conventional compression molding are 9.9
and 242.1 s, respectively, whereas for a 5 kN load, the
relaxation times are 11.3 and 260 s, respectively. There is
an increase of 14% in secondary relaxation time and
�7.4% in primary relaxation time. The corresponding
change in the secondary and primary relaxation times is
1.3 and 14.7%, respectively, when the initial load is
increased from 1 to 5 kN for the 40 vol% fiber-reinforced
composites made by the conventional process at a tempera-
ture of 2508C. For the conventional compression molding,
the secondary and primary relaxation time for a 1 kN
applied load is 5.9 and 146.8 s, respectively. As the fiber
volume fraction is increased from 40 to 50%, the secondary
and primary relaxation times increase by 9% and 10.5%,
respectively. The secondary and primary relaxation times
of 40 vol% fiber-reinforced composites made by conven-
tional technique for an applied load of 1 kN load, and tem-
perature of 08C are 6.8 and 140.2 s, respectively. The
increase in the secondary and primary relaxation time as
TABLE 5. Results of stress relaxation measurements at a temperature of þ75 and þ1008C.
Volume fiber (%) Load (kN)
Conventional molding/rubber pressure molding
Temperature ¼ þ758C Temperature ¼ þ1008C
Slope1 Slope2
Intercepts
Slope1 Slope2
Intercepts
Line1 Line2 Line1 Line2
30; 32 1 0.117 0.229 1.010 1.199 0.123 0.234 1.014 1.158
0.101 0.177 0.997 1.360 0.109 0.181 1.014 1.2062 0.113 0.227 1.000 1.204 0.117 0.232 1.008 1.262
0.099 0.165 1.002 1.265 0.104 0.175 1.013 1.569
3 0.104 0.211 1.002 1.383 0.112 0.226 1.005 1.463
0.099 0.162 1.002 1.298 0.099 0.169 1.011 1.411
4 0.101 0.205 1.002 1.271 0.107 0.225 1.001 1.361
0.092 0.161 1.000 1.437 0.094 0.163 1.001 1.321
5 0.099 0.201 1.001 1.371 0.099 0.214 1.006 1.291
0.088 0.155 1.004 1.418 0.089 0.159 1.009 1.119
40; 43 1 0.105 0.219 1.009 1.330 0.113 0.224 1.005 1.222
0.096 0.169 1.004 1.297 0.105 0.174 1.007 1.226
2 0.101 0.212 1.006 1.311 0.111 0.222 1.001 1.121
0.090 0.158 1.005 1.261 0.099 0.163 1.005 1.170
3 0.098 0.198 1.006 1.375 0.104 0.199 1.005 1.292
0.090 0.155 1.007 1.241 0.095 0.159 1.001 1.3414 0.095 0.188 1.001 1.352 0.099 0.198 1.002 1.461
0.088 0.155 1.003 1.244 0.088 0.155 1.003 1.323
5 0.094 0.188 1.003 1.291 0.097 0.188 1.003 1.561
0.083 0.151 1.007 1.211 0.088 0.155 1.002 1.62350; 53 1 0.098 0.196 0.999 1.343 0.099 0.199 1.008 1.187
0.091 0.156 1.003 1.323 0.092 0.160 1.002 1.532
2 0.094 0.188 1.000 1.337 0.097 0.192 1.006 1.161
0.089 0.155 1.003 1.419 0.089 0.155 1.002 1.1193 0.089 0.188 1.000 1.451 0.091 0.188 1.006 1.211
0.089 0.153 1.002 1.467 0.090 0.155 1.000 1.321
4 0.089 0.184 1.002 1.288 0.091 0.188 1.002 1.345
0.085 0.153 1.002 1.286 0.086 0.153 1.003 1.2315 0.084 0.181 1.003 1.251 0.093 0.185 1.002 1.346
0.080 0.147 1.003 1.187 0.082 0.151 1.006 1.222
60; 63 1 0.096 0.192 1.002 1.332 0.096 0.195 1.003 1.199
0.087 0.155 1.008 1.289 0.089 0.156 1.003 1.150
2 0.089 0.187 1.011 1.223 0.090 0.188 1.000 1.215
0.085 0.155 0.999 1.203 0.089 0.156 1.000 1.144
3 0.085 0.182 1.001 1.216 0.085 0.185 1.002 1.272
0.081 0.153 1.000 1.223 0.085 0.153 0.999 1.184
4 0.083 0.179 1.002 1.117 0.085 0.181 1.001 1.381
0.079 0.146 1.005 1.179 0.081 0.151 1.002 1.221
5 0.083 0.177 1.001 1.210 0.084 0.179 1.000 1.451
0.079 0.142 1.003 1.561 0.079 0.145 1.001 1.332
Italic scripts denote the results for RPM technique.
1094 POLYMER COMPOSITES—-2008 DOI 10.1002/pc

the load is increased from 1 to 5 kN is 8 and 6%, respec-
tively. Whereas the relaxation times for 1 kN load are 6.2
and 186.1 s. The increase in the relaxation times as the
load increases from 1 to 5 kN is 9 and 18%, respectively,
for RPM technique at 08C. Similarly, the secondary and
primary relaxation times for 1 kN load are 8.2 and 182.9 s,
respectively, for 30 vol% fiber-reinforced composites at
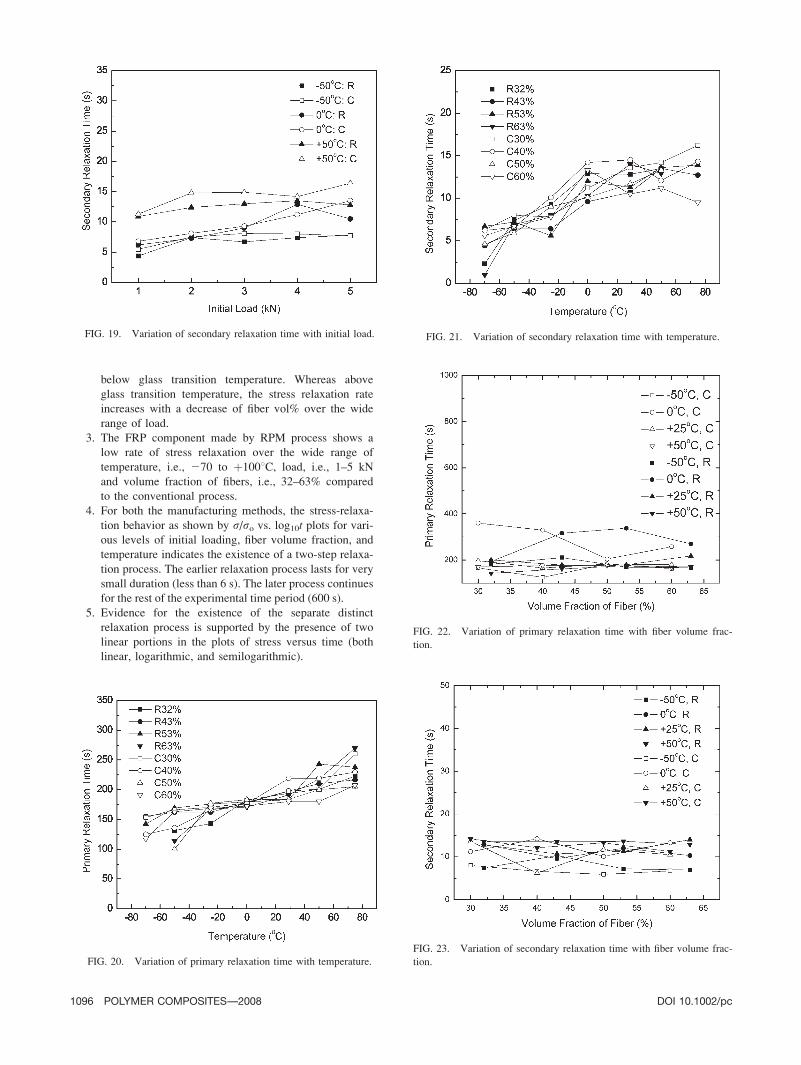
258C. For better understanding of the effect of applied load
on primary and secondary relaxation times, these are plot-
ted against load over a wide range of temperature, i.e.,
270 to þ1008C for both techniques as shown in Figs. 18
and 19, respectively. Slight dependency is observed for
secondary relaxation time with load whereas primary relax-
ation times are independent on applied load.
As the application temperature varies and the compo-
sites products are subjected to high temperatures during
their service life, the relaxation times of glass-reinforced
polyester composite is also studied over a wide range of
temperature, i.e., 2708C to þ1008C. The relaxation times
are plotted against temperature for both the process and
shown in Figs. 20 and 21. A strong dependency of both
relaxation times with temperature is observed for compo-
sites made by both techniques. But not such dependencies
are observed when the relaxation times are plotted against
volume fraction of fibers in the composites as shown in
Figs. 22 and 23.
CONCLUSIONS
The stress relaxation behavior of glass fiber polyester
composites prepared by RPM and conventional compres-
sion molding has been studied with particular emphasis on
the effect of temperature, initial load, i.e., stress and fiber
volume fraction in the composites. The following conclu-
sions are made:
1. The stress relaxation rate decreases as the initial load-
ing is increased from 1 to 5 kN over the temperature
range tested, i.e., 270 to þ1008C and volume fraction
of fibers, i.e., 30–63%.
2. The stress relaxation rate increases with an increase of
fiber volume fraction in the composites, i.e., 30–63%
over a temperature range from 270 to þ258C, i.e.,
FIG. 18. Variation of primary relaxation time with initial load.
FIG. 17. A typical curve showing experimental and fitted data at a tem-
perature of 508C and load of 5 kN for 30% fiber-reinforced composites.
FIG. 15. Relation between intercept differences and slope differences
in graphs for relaxations of the composites made by rubber pressure
molding.
FIG. 16. Relation between intercept differences and slope differences
in graphs for relaxation of the composites made by conventional com-
pression molding.
DOI 10.1002/pc POLYMER COMPOSITES—-2008 1095
below glass transition temperature. Whereas above
glass transition temperature, the stress relaxation rate
increases with a decrease of fiber vol% over the wide
range of load.
3. The FRP component made by RPM process shows a
low rate of stress relaxation over the wide range of
temperature, i.e., 270 to þ1008C, load, i.e., 1–5 kN
and volume fraction of fibers, i.e., 32–63% compared
to the conventional process.
4. For both the manufacturing methods, the stress-relaxa-
tion behavior as shown by r/ro vs. log10t plots for vari-ous levels of initial loading, fiber volume fraction, and
temperature indicates the existence of a two-step relaxa-
tion process. The earlier relaxation process lasts for very
small duration (less than 6 s). The later process continues
for the rest of the experimental time period (600 s).
5. Evidence for the existence of the separate distinct
relaxation process is supported by the presence of two
linear portions in the plots of stress versus time (both
linear, logarithmic, and semilogarithmic).
FIG. 23. Variation of secondary relaxation time with fiber volume frac-
tion.
FIG. 22. Variation of primary relaxation time with fiber volume frac-
tion.
FIG. 21. Variation of secondary relaxation time with temperature.FIG. 19. Variation of secondary relaxation time with initial load.
FIG. 20. Variation of primary relaxation time with temperature.
1096 POLYMER COMPOSITES—-2008 DOI 10.1002/pc
6. The two relaxation process are dependent with each
other, as the difference in slopes between earlier and
latter lines and the difference in the intercepts lie on
the straight line when they are plotted with each other.
7. The relaxation times of both primary and secondary
strongly depend on the temperature.
ACKNOWLEDGMENT
The authors acknowledge Avadh Rubber India Ltd.,
Lucknow, India, for providing rubber and chemicals.
REFERENCES
1. K.K. Kar, P. Kumar, T.K. Saha, and S.D. Sharma, Indian
Patent 2078/Del/2004, 25th October (2004).
2. K.K. Kar, S.D. Sharma, S.K. Behera, and P. Kumar, J.Appl. Polym. Sci., 101(2), 1095 (2006).
3. K.K. Kar, S.D. Sharma, S.K. Behera, and P. Kumar,
Kautsch. Gummi Kunstst., 59(4), 169 (2006).
4. K.K. Kar, S.D. Sharma, S.K. Behera, and P. Kumar, J. Elas-tomer Plast., 39(2), 117 (2007).
5. K.K. Kar, S.D. Sharma, S.K. Behera, and P. Kumar, Curr.Sci., 90(11), 1492 (2006).
6. K.K. Kar, S.D. Sharma, T.K. Sah, and P. Kumar, J. Rein-forc. Plast. Compos., 26(3), 269 (2007).
7. S.D. Sharma, P. Kumar, and K.K. Kar, Polym. Compos.,27(5), 504 (2006).
8. K.K. Kar, S.D. Sharma, and P. Kumar, Polym. Compos.,in press.
9. C.I. MacKenzie and J. Scanlan, Polymer, 25, 559 (1984).
10. L.A. Pothan, N.R. Neelakantan, B. Rao, and S. Thomas,
J. Reinforc. Plast. Compos., 23(2), 153 (2004).
11. M.S. Sreekala, M.G. Kumaran, J. Reethamma, and S.
Thomas, Compos. Sci. Technol., 61, 1175 (2001).
12. L.A. Pothan, S. Thomas, and N.R. Neelakantan, J. Reinforc.Plast. Compos., 16(8), 744 (1997).
13. V.G. Geethamma, L.A. Pothen, B. Rao, N.R. Neelakantan,
and S. Thomas, J. Appl. Polym. Sci., 94(1), 96 (2004).
14. M. Kawai, T. Kazama, Y. Masuko, H. Tsuda, J. Takahashi,
and K. Kemmochi, JSME Int. J. Ser A: Solid Mech. Mater.Eng., 47(1), 8 (2004).
15. T. Shimizu, M. Mizoguchi, A. Nakai, H. Hamada, and Y.
Fujii, in Proceedings of the 10th U. S.–Japan Conference onComposite Materials, Stanford, CA, United States, Septem-
ber 16–18, 320 (2002).
16. J.M. Lifshitz and A. Rotem, Fibre Sci. Technol., 3(1), 1 (1970).
17. E.M. Gutman and R. Soncino, Polym. Compos., 16(6), 518(1995).
18. J. Wortmann and K.V. Schulz, Polymer, 36, 315 (1995).
19. S. Ikeda and K.K. Azinomoto, Fushoku Boshoku Bumon Iin-kai Shiryo (Nippon Zairyo Gakkai), 26(4), 127 (1987).
20. A.N. Gent, Rubber Chem. Technol., 36, 397 (1963).
21. C.J. Derham and A.G. Thomas, Nature, 218, 81 (1968).
22. G.R Cotten and B.B. Boonstra, J. Appl. PoIym. Sci., 9, 3395(1965).
23. A. Voet, A.K. Sircar, and F.R. Cook, Rubber Chem. Tech-nol., 44, 175 (1971).
24. C.I. MacKenzie and J. Scanlan, Polymer, 26, 559 (1984).
25. A.N. Gent, Ed., Engineering With Rubber, Oxford Univer-
sity Press, New York (1992).
26. A.V. Tobolsky, Properties and Structure of Polymers,Wiley, New York (1960).
DOI 10.1002/pc POLYMER COMPOSITES—-2008 1097
Related Documents


![Untitled-2 [radekoncar.com.mk]radekoncar.com.mk/wp-content/uploads/2019/06/Elektricni-ormari-.pdf · PP2 polyester PW3 polyester PP3 polyester PW4 polyester PP4 polyester PW5 polyester](https://static.cupdf.com/doc/110x72/5fc2e1f5b98d77452302c149/untitled-2-pp2-polyester-pw3-polyester-pp3-polyester-pw4-polyester-pp4-polyester.jpg)