Journal of Advanced Concrete Technology Vol. 19, 999-1015, September 2021 / Copyright © 2021 Japan Concrete Institute 999 Technical report Stress Development and Crack Monitoring of Massive Concrete Walls with Embedded Air-cooling Pipes Suduo Xue 1 , Yan Geng 2* , Xiongyan Li 3 , Jinguang Li 4 and Yanjie Song 5 Received 7 September 2020, accepted 23 August 2021 doi:10.3151/jact.19.999 Abstract Thermal cracking is a severe problem faced with massive concrete structures especially in early ages. In order to control the temperature distribution and lower cracking risk of a large-dimension reinforced concrete wall during construction, air pipe cooling was applied to experimental concrete walls with embedded corrugated pipes. Three levels of inlet air- flow velocity (about 4, 8, and 12 m/s) were studied and compared with the wall without pipe cooling. Temperature dis- tribution and strain development were obtained with embedded sensors. Besides, surface crack depth development with age was monitored with the ultrasonic testing analyzer. Moreover, stress distributions were derived through thermo- mechanical analysis to illustrate the strain and cracking trend of concrete walls under the specific cooling scenarios as in the experiment. According to the results, cooling efficiency was closely related to pipe intervals. In the pipe-intensive region, air pipe cooling effectively reduced the peak temperature and concrete volumetric deformation. However, higher air velocity induced more considerable tensile stress both surrounding the pipe and on the outer surface in the region of larger pipe intervals. It indicates that the proper airflow velocity should be carefully investigated for the purpose of cracking control under a given pipe arrangement. 1. Introduction Thermal cracking caused by significant hydration heat in early ages is a severe problem faced with mass con- crete structures, such as dams (Malkawi et al. 2003), bridge piers (Bertagnoli et al. 2011), massive slabs (Qin et al. 2014) and the outer LNG storage tanks (Zhai et al. 2015). These structures usually experience rapid tem- perature rise in the core during the first few days after casting and thus considerable temperature gradients occur between the core and the external surfaces, lead- ing to relatively large tensile stress compared with the corresponding low tensile strength at the early age of concrete (ACI 2005a, 2005b). Meanwhile, micro- thermal cracks may consequently occur in the young concrete (Klemczak et al. 2015) and gradually develop into noticeable cracking through structures (ACI 2007), resulting in possible damage of concrete or even reduc- ing the service life of structures (Briffaut et al. 2012). Therefore, it is of great significance to carry out neces- sary technological measurements in order to control the temperature distribution at the early ages (ACI 2005a, 2005b; Wang et al. 2013, Alam et al. 2018; Liu et al. 2016), among which dissipating the hydration heat through embedded pipes is a convenient and effective practice. Currently, the water-cooling system (Mizobuchi et al. 2013), as a typical post-cooling method, is most com- monly utilized in dams, spillways and sluices. Many researches have been conducted to establish theoretical heat transfer equations (Zhu et al. 1999; Yang et al. 2011), to optimize pipe arrangement (Zhu et al. 2014) and to develop intelligent water-cooling systems (Lin et al. 2014). However, water temperature, water velocity and cooling duration should be carefully calculated to avoid high thermal gradients and potential cracking, since an inappropriate cooling plan may lead to high thermal stresses in concrete surrounding the cooling pipes, according to Singh and Rai (2018). Like the water-cooling system, an air-cooling system with embedded pipes substitutes the water with airflow inside the pipe. It finds suitable application in water- deficient areas and avoids high water pressure at the bottom of vertical pipes in tall prisms. More importantly, it takes advantage of the pre-installed prestressing ducts and therefore no additional cost is needed. Although they essentially both take advantage of internal forced heat convection, there are still some distinct characteris- 1 Professor, College of Architecture and Civil Engi- neering, Beijing University of Technology, No. 100 Pingleyuan Chaoyang District, Beijing, China. 2 Engineer, MCC Central Research Institute of Building and Construction, College of Architecture and Civil Engineering Beijing University of Technology, No. 100 Pingleyuan Chaoyang District, Beijing, China. *Corresponding author, E-mail: [email protected] 3 Professor, College of Architecture and Civil Engi- neering, Beijing University of Technology, No. 100 Pingleyuan Chaoyang District, Beijing, China. 4 Senior Engineer, Department of Civil Engineering, China Huanqiu Contracting & Engineering Co. Ltd., No. 1 Chuangda 2nd Road, Chaoyang District, Beijing, China. 5 Engineer, Department of Civil Engineering, China Huanqiu Contracting & Engineering Co. Ltd., No. 1 Chuangda 2nd Road, Chaoyang District, Beijing, China.

Welcome message from author
This document is posted to help you gain knowledge. Please leave a comment to let me know what you think about it! Share it to your friends and learn new things together.
Transcript

Journal of Advanced Concrete Technology Vol. 19, 999-1015, September 2021 / Copyright © 2021 Japan Concrete Institute 999
Technical report
Stress Development and Crack Monitoring of Massive Concrete Walls with Embedded Air-cooling Pipes Suduo Xue1, Yan Geng2*, Xiongyan Li3, Jinguang Li4 and Yanjie Song5
Received 7 September 2020, accepted 23 August 2021 doi:10.3151/jact.19.999
Abstract Thermal cracking is a severe problem faced with massive concrete structures especially in early ages. In order to control the temperature distribution and lower cracking risk of a large-dimension reinforced concrete wall during construction, air pipe cooling was applied to experimental concrete walls with embedded corrugated pipes. Three levels of inlet air-flow velocity (about 4, 8, and 12 m/s) were studied and compared with the wall without pipe cooling. Temperature dis-tribution and strain development were obtained with embedded sensors. Besides, surface crack depth development with age was monitored with the ultrasonic testing analyzer. Moreover, stress distributions were derived through thermo-mechanical analysis to illustrate the strain and cracking trend of concrete walls under the specific cooling scenarios as in the experiment. According to the results, cooling efficiency was closely related to pipe intervals. In the pipe-intensive region, air pipe cooling effectively reduced the peak temperature and concrete volumetric deformation. However, higher air velocity induced more considerable tensile stress both surrounding the pipe and on the outer surface in the region of larger pipe intervals. It indicates that the proper airflow velocity should be carefully investigated for the purpose of cracking control under a given pipe arrangement.
1. Introduction
Thermal cracking caused by significant hydration heat in early ages is a severe problem faced with mass con-crete structures, such as dams (Malkawi et al. 2003), bridge piers (Bertagnoli et al. 2011), massive slabs (Qin et al. 2014) and the outer LNG storage tanks (Zhai et al. 2015). These structures usually experience rapid tem-perature rise in the core during the first few days after casting and thus considerable temperature gradients occur between the core and the external surfaces, lead-ing to relatively large tensile stress compared with the corresponding low tensile strength at the early age of concrete (ACI 2005a, 2005b). Meanwhile, micro-
thermal cracks may consequently occur in the young concrete (Klemczak et al. 2015) and gradually develop into noticeable cracking through structures (ACI 2007), resulting in possible damage of concrete or even reduc-ing the service life of structures (Briffaut et al. 2012). Therefore, it is of great significance to carry out neces-sary technological measurements in order to control the temperature distribution at the early ages (ACI 2005a, 2005b; Wang et al. 2013, Alam et al. 2018; Liu et al. 2016), among which dissipating the hydration heat through embedded pipes is a convenient and effective practice.
Currently, the water-cooling system (Mizobuchi et al. 2013), as a typical post-cooling method, is most com-monly utilized in dams, spillways and sluices. Many researches have been conducted to establish theoretical heat transfer equations (Zhu et al. 1999; Yang et al. 2011), to optimize pipe arrangement (Zhu et al. 2014) and to develop intelligent water-cooling systems (Lin et al. 2014). However, water temperature, water velocity and cooling duration should be carefully calculated to avoid high thermal gradients and potential cracking, since an inappropriate cooling plan may lead to high thermal stresses in concrete surrounding the cooling pipes, according to Singh and Rai (2018).
Like the water-cooling system, an air-cooling system with embedded pipes substitutes the water with airflow inside the pipe. It finds suitable application in water-deficient areas and avoids high water pressure at the bottom of vertical pipes in tall prisms. More importantly, it takes advantage of the pre-installed prestressing ducts and therefore no additional cost is needed. Although they essentially both take advantage of internal forced heat convection, there are still some distinct characteris-
1Professor, College of Architecture and Civil Engi-neering, Beijing University of Technology, No. 100 Pingleyuan Chaoyang District, Beijing, China. 2Engineer, MCC Central Research Institute of Building and Construction, College of Architecture and Civil Engineering Beijing University of Technology, No. 100 Pingleyuan Chaoyang District, Beijing, China. *Corresponding author, E-mail: [email protected], College of Architecture and Civil Engi-neering, Beijing University of Technology, No. 100 Pingleyuan Chaoyang District, Beijing, China. 4Senior Engineer, Department of Civil Engineering, China Huanqiu Contracting & Engineering Co. Ltd., No. 1 Chuangda 2nd Road, Chaoyang District, Beijing, China. 5Engineer, Department of Civil Engineering, China Huanqiu Contracting & Engineering Co. Ltd., No. 1 Chuangda 2nd Road, Chaoyang District, Beijing, China.
S. Xue, Y. Geng, X. Li, J. Li and Y. Song / Journal of Advanced Concrete Technology Vol. 19, 999-1015, 2021 1000
tics for the air-cooling pipes in pipe material, surface profile, dimension and internal fluid state. For example, the air pipes in this paper are corrugated metal pipes in larger diameters and intended for pre-stressing after the concrete is mature. However, the water pipes are usually in smaller diameters, made from plastic materials, espe-cially designed and placed in concrete for the purpose of temperature control. Therefore, from the aspects of both convenience and economy, it is worthwhile to undertake detailed investigations into the cooling effectiveness of the air-cooling system.
So far, only a few researches are sought out in the lit-erature about the establishment of air pipe cooling theo-ries and their application in massive concrete structures. Hedlund and Groth (1998) reported the application of an air-cooling system in the columns of the Igelsta Bridge. Azenha et al. (2014) utilized air-cooling with embedded pre-stressing ducts on the construction of the dam spill-way and performed thermo-mechanical FE analysis, validating the feasibility of air-cooling technique in concrete cracking control. Ishikawa (2007) discussed the effectiveness of air pipe cooling in avoiding crack-ing in a massive concrete foundation in extreme weather conditions in Qatar. Li et al. (2019) established an automatic air-cooling system and carried out several cooling experiments with different inlet air velocities, reporting its cooling efficiency and providing guidance to practical application. Geng et al. (2019) proposed the relationship between inlet air velocity and internal forced convection coefficient with in situ concrete ex-periments and proved the accuracy of the presented fi-nite element method. Nonetheless, no parametric study is found in the literature to assess the influences of criti-cal factors (such as air velocity, air temperature and pipe spacing) on concrete cracking and to provide instruc-tions on the selection of optimal cooling plan with reli-able experiments.
In this paper, air-cooling experiments were carried out on experimental concrete walls (3.6×0.8×3.6 m) through 100 mm diameter horizontal and vertical em-bedded corrugated pipes immediately after concrete pouring. Three levels of average inlet air flow rate
(about 4, 8, and 12 m/s) were considered and compared with the case without air-cooling to investigate the in-fluences of flow rate on strain-stress development and surface cracking. Moreover, thermo-mechanical analysis was conducted with the proposed finite element method (FEM) under the specific cooling scenarios (including cooling durations, air inlet velocity, air temperature and layout of cooling pipes) for better understanding of stress and temperature distribution throughout the ex-perimental walls. Besides, time-dependent material properties were considered in the FE model. Air-cooling pipes were explicit simulated using Neumann/Robin condition. Then thermal stresses at representative points were obtained, the developing trends of which were validated by the monitored surface cracks. This simula-tion makes it possible to assess cracking risk quantita-tively in space and time and to optimize air-cooling plan for practical engineering structures through parametric analysis with the proposed FEM.
2. Experiments
2.1 General description The air-cooling experiments were performed outdoor with a novel air pipe cooling system, which is mainly comprised of four parts: electronic control unit, motor and air blower, ventilation pipes (including massive steel pipes, horizontal canvas ventilation pipes and ver-tical PVC ventilation pipes) and sensors (including air velocity sensors and air temperature sensors). Photo-graphic representation and schematic illustration of the cooling system have been reported in previous research by the authors (Geng et al. 2019), as shown in Fig. 1. In general, three levels of air velocities can be provided through the three massive pipes at the same time by automatically adjusting the opening angle of the electric control valve. Besides, a manual valve is fixed on the inlet end of each ventilation pipe to adjust the inlet air velocity, which is checked by the control unit in real time.
The four experimental walls (5° in arc) were designed based on an actual outer wall of a LNG storage tank.
(a) Photographic illustration (b) Schematic illustration
Fig. 1 Air cooling system (Geng et al. 2019).
S. Xue, Y. Geng, X. Li, J. Li and Y. Song / Journal of Advanced Concrete Technology Vol. 19, 999-1015, 2021 1001
The arcs were intended to reserve the curvature of the original tank segments. The arrangement of the metal corrugated pipes in the wall originated from a practical project, as shown in Fig. 1(b). The horizontal pipes were in the center of the cross section and closely tied to the vertical ones. The lowest horizontal pipe was 0.85 m away from the foundation because this arrangement came from the original design of the LNG storage tank to meet its technical requirements. Although it would lead to higher temperatures at the bottom part, this ar-rangement was still kept to reflect the actual strain-stress distribution in practical LNG tanks. Structural distribution rebars (20 mm diameter) were arranged on both surfaces of the wall with an interval of 0.2 m. A concrete foundation (7×10.8×1 m) and eight columns (1.5×1.2×4 m) were constructed one month earlier be-fore the pouring of the wall, providing fixed constraints for the walls. The concrete mix proportion was listed in Table 1, the same with that in a previous research by the authors (Geng et al. 2018).
Before concrete pouring, the air-cooling system was carefully checked to ensure that all possible gaps in connections were sealed with silicone sealant in case of air leakage. Meanwhile, air velocity in each branch pipe was confirmed to reach the specified value as 4 m/s, 8 m/s and 12 m/s for Walls B, C and D, respectively. After concrete pouring, the air-cooling system kept operating for 3 days to provide the three different air-flows into the corrugated pipes of the prescribed walls simultane-ously, while Wall A served as a comparison without arti-ficial cooling. Since fluctuations of ±10% may occur
during the whole ventilating process, the inlet air veloc-ity was recorded every 10 minutes for the purpose of average calculation. Plywood formwork (thermal con-ductivity of 0.15 W/(m·°C), thickness of 18 mm) was removed after 7 days of curing. Then all the four walls were exposed to the same outdoor environment, whose temperature and wind speed were monitored through air temperature and velocity sensors. The accuracy of those the sensors was 0.1°C and 0.1 m/s, respectively. Al-though a previous work (Geng et al. 2019) has pre-sented the temperature-oriented analysis, this paper fo-cused on the influences of air-cooling on concrete strain and stress, serving as a further investigation into the mechanical field of mass concrete structures.
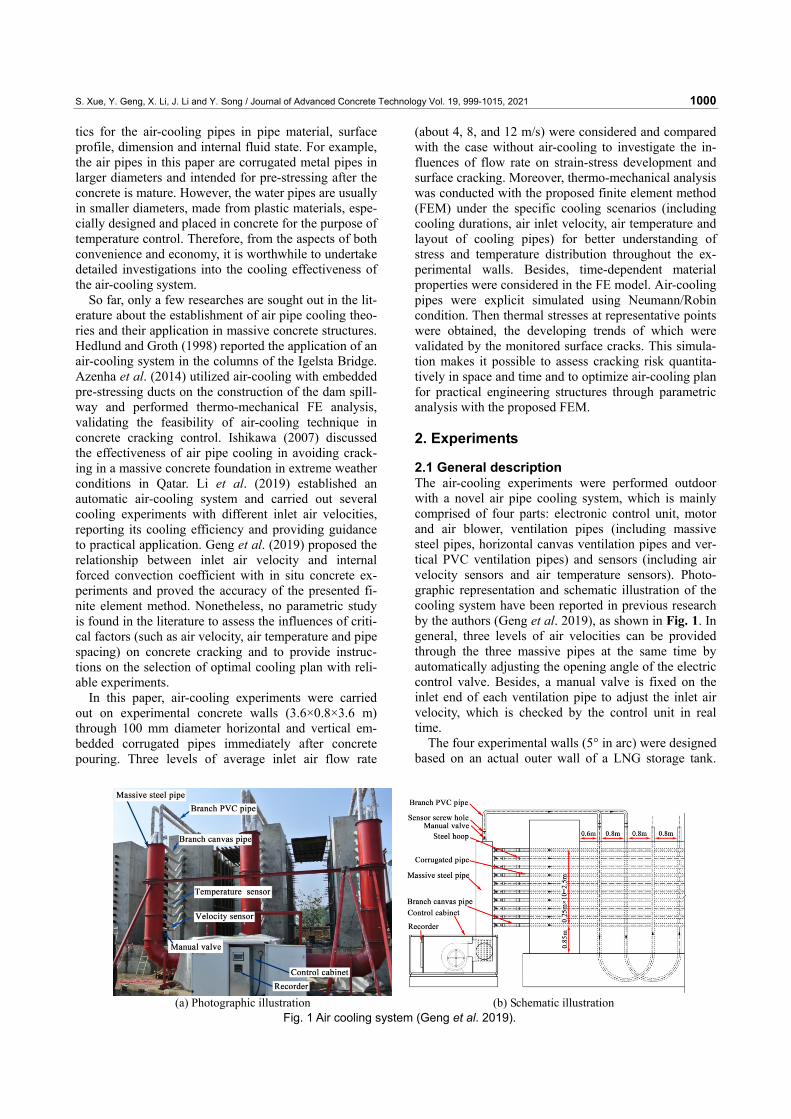
2.2 Sensor arrangement In order to grasp the early-age temperature development and strain evolution inside the concrete wall, four PT100 resistance temperature detectors (RTD, with an accuracy of 0.01°C) and six vibration wire extensom-eters (VW, with an accuracy of 1 με) were properly tied to rebars and embedded in each concrete wall at repre-sentative points, as shown in Fig. 2. It should be men-tioned that the VW sensors also contain internal tem-perature sensors for strain compensation. Among all the test points, temperature test points T1, T2 and T3 were in the cross-section center and T4 was near the surface. Another RTD was placed beside the walls to monitor environment temperatures.
As for the strain points, S1 to S5 were along the lengthwise orientation, among which S1 to S3 were in
Table 1 Concrete mix proportion (Geng et al. 2018).
Water (kg/m3)
Cement (kg/m3)
Slag powder (kg/m3)
Fine aggregate (kg/m3)
Coarse aggregate (kg/m3)
Super-plasticizer (kg/m3) W/B
140 310 142 759 1006 9.04 0.31
Fig. 2 Arrangement of sensors.
S. Xue, Y. Geng, X. Li, J. Li and Y. Song / Journal of Advanced Concrete Technology Vol. 19, 999-1015, 2021 1002
the center of the cross section. Meanwhile, S4 and S5 were fixed at 0.05 m away from the corrugated pipe surface and the wall surface, respectively; besides, S6 was located along the thickness orientation. The meas-urement frequency was set to 0.5 h (hour), lasting for a duration of 14 days.
Data recording started from the instant of solidariza-tion (or full bond) between concrete and the metallic sensor, which determined the initial values of the VW extensometers. According to Azenha et al. (2009), it is essential to assess ‘zeroing’ of the measured strains, since the data recorded does not have physical meaning before strain sensors solidarize to concrete. In this ex-periment, the zeroing point was deemed the concrete initial setting time, which was tested to be 2.25 hours with on-site samples according to the Chinese Standard GB/T 50080-2016 (SAC 2016). According to Schindler (2004), the initial setting of a particular mixture occurs at the same hydration degree α(te) which is closely re-lated to equivalent time te. Since temperatures at differ-ent parts of the experimental walls nearly stayed the same before the initial setting, it is suitable to use the same initial setting time for all the monitoring points.
2.3 Crack monitoring After formwork removal, wall surface cracks were monitored. The depth was measured every 7 days with the ultrasonic pulse velocity method (Helal et al. 2015), a commonly used nondestructive testing (NDT) tech-nique. It is known that when an ultrasonic pulse travels through the concrete with cracks, the transit time will be longer than in similar concrete without cracks because of diffraction around the crack, while energy transmis-sion across the concrete-air interface can be neglected (BSI 2004).
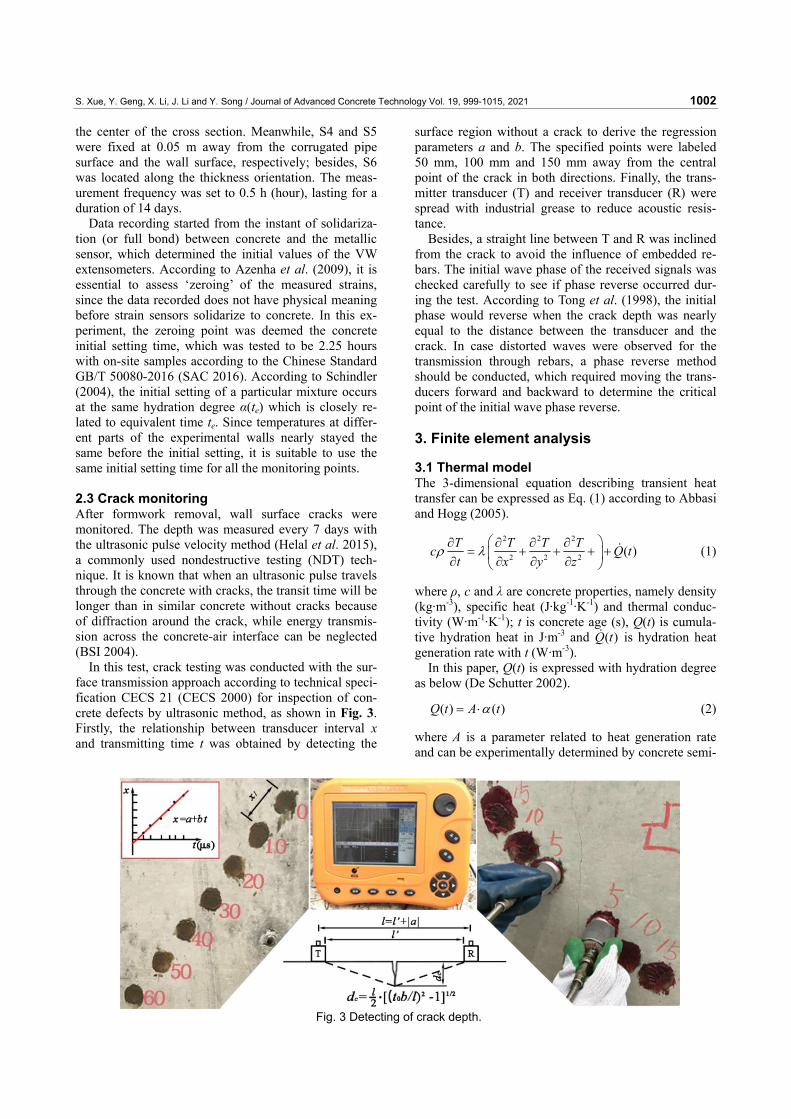
In this test, crack testing was conducted with the sur-face transmission approach according to technical speci-fication CECS 21 (CECS 2000) for inspection of con-crete defects by ultrasonic method, as shown in Fig. 3. Firstly, the relationship between transducer interval x and transmitting time t was obtained by detecting the
surface region without a crack to derive the regression parameters a and b. The specified points were labeled 50 mm, 100 mm and 150 mm away from the central point of the crack in both directions. Finally, the trans-mitter transducer (T) and receiver transducer (R) were spread with industrial grease to reduce acoustic resis-tance.
Besides, a straight line between T and R was inclined from the crack to avoid the influence of embedded re-bars. The initial wave phase of the received signals was checked carefully to see if phase reverse occurred dur-ing the test. According to Tong et al. (1998), the initial phase would reverse when the crack depth was nearly equal to the distance between the transducer and the crack. In case distorted waves were observed for the transmission through rebars, a phase reverse method should be conducted, which required moving the trans-ducers forward and backward to determine the critical point of the initial wave phase reverse.
3. Finite element analysis
3.1 Thermal model The 3-dimensional equation describing transient heat transfer can be expressed as Eq. (1) according to Abbasi and Hogg (2005).
2 2 2
2 2 2 ( )T T T Tc Q tt x y z
ρ λ⎛ ⎞∂ ∂ ∂ ∂
= + + + +⎜ ⎟∂ ∂ ∂ ∂⎝ ⎠ (1)
where ρ, c and λ are concrete properties, namely density (kg·m-3), specific heat (J·kg-1·K-1) and thermal conduc-tivity (W·m-1·K-1); t is concrete age (s), Q(t) is cumula-tive hydration heat in J·m-3 and ( )Q t is hydration heat generation rate with t (W·m-3).
In this paper, Q(t) is expressed with hydration degree as below (De Schutter 2002).
( ) ( )Q t A tα= ⋅ (2)
where A is a parameter related to heat generation rate and can be experimentally determined by concrete semi-
Fig. 3 Detecting of crack depth.
S. Xue, Y. Geng, X. Li, J. Li and Y. Song / Journal of Advanced Concrete Technology Vol. 19, 999-1015, 2021 1003
adiabatic temperature test as previously illustrated in Geng et al. (2019). ( )tα is hydration degree function with a value between 0 and 1, where 1 denotes the com-pletion of hydration.
For each time t, it is expressed with equivalent time te according to the Arrhenius equation,
0
1 1expt
Ae
r
Et dt
R T T⎡ ⎤⎛ ⎞
= −⎢ ⎥⎜ ⎟⎢ ⎥⎝ ⎠⎣ ⎦
∫ (3)
where reference temperature Tr is 273 K, gas constant R is 8.314 J·mol-1·K-1and T is concrete temperature (K). As for activation energy EA, it is theoretically taken as 33500 J·mol-1 under 293 K in general according to Hat-tel and Thorborg (2003) if no tests were carried out for the concrete utilized.
The boundary condition for Eq. (1) is defined as,
( )s cT h T Tn
λ ∂ = ⋅ −∂ (4)
where n refers to x, y or z direction, Ts and Tc are the temperatures at the environment boundary and concrete surface respectively, h is convective coefficient (W·m-
2·K-1) which is closely related to airflow state and physi-cal properties of the surface.
As for the concrete surface in this case, only natural convection occurs, while under the case of air-cooling with embedded pipes heat exchange between the airflow and the corrugated pipe is internal forced convection (Gengel 2007). When air flows into the pipe at an aver-age velocity inu , the relationship between air flow rate um and internal forced convective heat transfer coeffi-cient hp conforms to Eq. (5) according to the in-situ test conducted by Geng et al. (2019).
0.82674.9127p mh u= ⋅ (5)
where um is the sectional mean air velocity and simpli-fied to be 0.78 inu . 3.2 Mechanical model Since the thick wall was restrained by the foundation and two columns, stresses were induced initially both internally and externally (Nagy 1997). Therefore,
thermo-mechanical coupling analysis was performed in this research to evaluate the cracking. After the transient heat transfer analysis, a mechanical analysis was pre-ceded with the computed temperature distribution.
The total strain ε(t, t′) of concrete can be divided into stress dependent component εcσ(t, t′) and stress inde-pendent component εcn(t), which can be expressed as,
( ) ( ) ( ) ( ) ( ) ( ), , ,c cn c sh Tt t t t t t t t a T tσ σε ε ε ε ε Δ′ ′ ′= + = + + (6)
where t′ is the loading age on concrete, εsh(t) is shrink-age strain and aT is thermal dilation coefficient which is tested as 1.25×10⁻⁵/°C at 7 days according to the Chi-nese test code DL/T 5150 for hydraulic concrete (NEA 2017). εcσ(t, t′) can be expressed as,
( )0
, ( , ) ( )t
c t t J t t d tσε σ′ ′ ′= ∫ (7)
where J(t, t′) is a creep function that can be expressed by the fib Model Code 2010 (fib 2013).
( )( ),1( , )
ci ci
t tJ t t
E t Eϕ ′
′ = +′
(8)
where Eci(t′) is the elastic modulus at t′ and φ(t,t′) is creep coefficient.
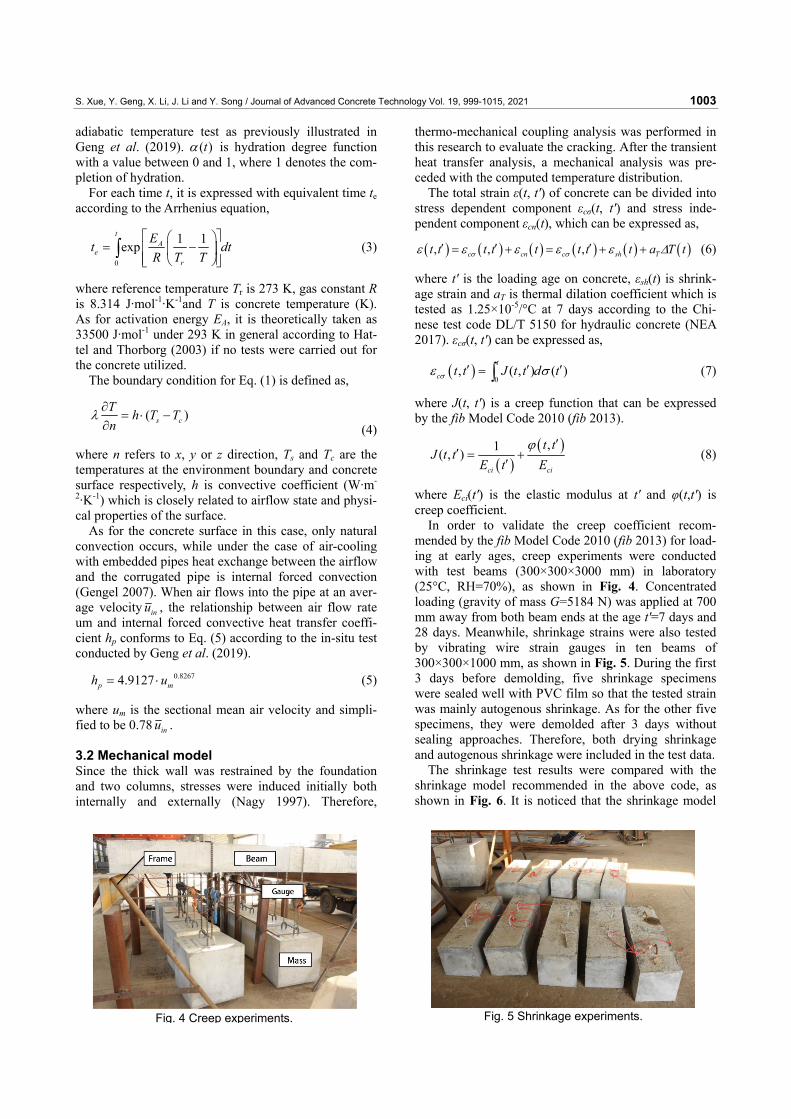
In order to validate the creep coefficient recom-mended by the fib Model Code 2010 (fib 2013) for load-ing at early ages, creep experiments were conducted with test beams (300×300×3000 mm) in laboratory (25°C, RH=70%), as shown in Fig. 4. Concentrated loading (gravity of mass G=5184 N) was applied at 700 mm away from both beam ends at the age t′=7 days and 28 days. Meanwhile, shrinkage strains were also tested by vibrating wire strain gauges in ten beams of 300×300×1000 mm, as shown in Fig. 5. During the first 3 days before demolding, five shrinkage specimens were sealed well with PVC film so that the tested strain was mainly autogenous shrinkage. As for the other five specimens, they were demolded after 3 days without sealing approaches. Therefore, both drying shrinkage and autogenous shrinkage were included in the test data.
The shrinkage test results were compared with the shrinkage model recommended in the above code, as shown in Fig. 6. It is noticed that the shrinkage model
Fig. 4 Creep experiments.
Fig. 5 Shrinkage experiments.

S. Xue, Y. Geng, X. Li, J. Li and Y. Song / Journal of Advanced Concrete Technology Vol. 19, 999-1015, 2021 1004
of the above code doesn’t agree well with the test data which may be accounted for the proportion of slag and low w/b ratio (water to binder) of the concrete. There-fore, the parameters in the shrinkage model are modi-fied and expressed as Eq. (9).
( )( )
1.2
1.2
0.3
0.32
( ) 123 1 ( 3)
( ) 123 1 445 ( 3)( ) 0.035
tsh
t ssh
s
t e tt tt e t
t t h
ε
ε
−
−
= − − ≤
−= − − − >
− + ⋅
(9)
where ts is concrete age (in days) at the beginning of drying and it is taken as 3 days in this paper. Notional size h (in mm) is related to cross-section area Ac and perimeter u of concrete in contact with the atmosphere.
Then the creep coefficient can be calculated accord-ing to Eq. (10).
( ), total e sh
e
t tε ε ε
ϕε− −′ = (10)
where εtotal is the tested total strain, εe is elastic strain obtained at the instant of loading and εsh is shrinkage strain calculated according to Eq. (9).
Figure 7 shows the tested creep coefficients. It can be observed that although there was an average deviation of 5% over 112 days, the tested creep coefficients were generally in accordance with the creep model recom-mended by the fib Model Code 2010 (fib 2013), which was adopted in this paper.
Considering stress variations at early ages, numerical integrations are implemented on short time intervals Δti. Eqs. (7) and (8) are approximated with a Taylor series to express the explicit relationship between stress incre-ment Δσi and Δεi during time interval Δti, which refers to Borst et al. (1994) and Faria et al. (2006).
3.3 FEM modelling 3.3.1 Material properties Since concrete physical properties vary a lot at early ages, standard material tests at different ages have been conducted and reported in previous work (Geng et al. 2018). Hereby they are only listed in Table 2. ( )eQ t ,
( )t ef t , ( )c ef t and ( )c eE t are expressed with hydration degree ( )etα . The 28-day compressive and tensile split-ting strength are 62.1 and 4.6 MPa, respectively. Apart from these properties, the test values of λc and cc are
0 20 40 60 80 100 120-500
-400
-300
-200
-100
0
Shr
inka
ge (μ
ε)
Time (day)
CEB-FIB 2010 MODIFIED TESTED
Fig. 6 Comparison of shrinkage model. Fig. 7 Tested creep coefficient.
Table 2 Thermal and mechanical properties (Geng et al. 2018).
Symbol Value Symbol (te is in days) Expression
ρ (kg·m-3) 2366
1 d 1.697 ( )etα 0.870.751 ete−−
2 d 1.423 3 d 1.568 5 d 1.595
( )eQ t (J·kg-1)
51.72 10 ( )etα× ×
7 d 1.552 10 d 1.560
λ (W·m-1·K-1)
14 d 1.536 1 d 958 2 d 982
( )c ef t (Pa)
{ }6 0.4764.3 10 1 [1 ( )]etα× × − −
3 d 962 5 d 962
( )t ef t (Pa)
{ }6 0.474.8 10 1 [1 ( )]etα× × − −
7 d 964 10 d 964
c (J·kg-1·K-1)
14 d 965
( )c eE t (Pa)
{ }0.640.9 ln [1 ( )]939.5 10 1 ete α− −× × −

S. Xue, Y. Geng, X. Li, J. Li and Y. Song / Journal of Advanced Concrete Technology Vol. 19, 999-1015, 2021 1005
directly defined in the material property module in the simulation because they varied a lot during the first few days. The values of λc are slightly smaller than the rec-ommended range of 1.9 to 3.3 W·m-1·K-1 by ACI Com-mittee 207 (ACI 2007), while it is pretty similar to the empirical value of 1.5 W·m-1·K-1 for dry concrete from Jendele et al. (2014); it may be accounted for the incor-poration of slag and the low humidity of the test sam-ples (Kim et al. 2003). 3.3.2 FE Model Figure 8 shows the 3D finite element model, where age-dependent concrete properties are applied to the newly-cast experiment wall and constant properties at 28 days are given to mature concrete columns. Accord-ing to a simple comparison of stress σx between the model with and without reinforcement in Case A, a maximum deviation of 0.2 MPa was observed at the top region of the wall. Therefore, reinforcement is consid-ered in the analysis through embedding rebars (truss element) into the concrete for better accuracy. The elas-tic modulus Es of rebars is 206 GPa and Poisson ratio μ is taken as 0.3.
In heat transfer analysis, 8-node linear heat transfer brick elements, 4-node heat transfer quadrilateral shell elements and 2-node heat transfer links are used for concrete, corrugated pipe and rebar, respectively. The general mesh size is 0.1 m and the minimum concrete
element size is 0.025 m around the pipe. It has been proved that simulation accuracy is only enhanced by 0.05°C with twice refinement of meshes (Geng et al. 2019). In the subsequent mechanical analysis, element types are changed to 8-node linear brick elements for concrete, 4-node doubly curved shell for pipes and 2-node linear 3-D truss elements for rebars, while meshes are kept the same. The whole analysis duration is 14 days.
3.3.3 Boundary conditions In this analysis, boundary conditions comprise both me-chanical and thermal conditions. As for the mechanical boundary, the walls are totally constrained in the bottom of the wall and by the columns. Thermal boundaries denote ambient temperature and heat transfer coefficient. As shown in Fig. 4, there are three main boundary types in the model, namely wall surfaces, pipe surfaces and surrounding surfaces. Since air-cooling lasts from the 1st day to the 3rd day, heat transfer coefficient changes along the pipe surface at the end of the air-cooling. Be-sides, heat transfer coefficient on the wall surface changes at the 7th day due to formwork removal. The values of convection coefficient at those boundaries are listed in Table 3, together with initial and environment temperatures.
Since natural convection occurs at wall surfaces and surrounding surfaces, the heat transfer coefficients hs in
Table 3 Boundary conditions. Boundary condition Location Value
Surrounding surface 17.5 3.6 (Before demoulding)
Natural convection hs [W/(m2·ºC)] Wall surface 17.5 ( After demoulding)
3.52 m sinu = 11.3 7.64 m sinu = 21.5
Internal forced convection hp [W/(m2·ºC)] 11.35 m sinu = 29.8
Inlet air temperature (ºC) Inlet Equal to environment temperature Newly cast Wall 20.1 Initial temperature (ºC) Columns and foundation 10.2
Temperature of the environment (ºC) Environment Taken from the records of air temperature sensor
Fig. 8 FE model of the experiment wall and columns.
S. Xue, Y. Geng, X. Li, J. Li and Y. Song / Journal of Advanced Concrete Technology Vol. 19, 999-1015, 2021 1006
Table 3 are calculated to be 3.6 W/(m2·K) before de-molding considering the heat preservation of formwork according to Honorio et al. (2014). After demolding, it turns to 17.5 W/(m2·K) according to Liu and Harris (2007). As for the air-cooling pipes, they were explicit simulated using convective boundaries (Neu-mann/Robin boundary condition) governed by Newton cooling law and the internal forced convection coeffi-cients hp at the pipe surfaces during the cooling process are calculated with Eq. (5). It should be noticed that hp along the pipe length is assumed to be constant since the wall length is relatively short. Anyway, this is only a simplified approach to establish a rough relationship between airflow rate and thermal stress. This parameter should be further refined for the cooling simulations of longer walls.
As can be noted in Table 3, the inlet air temperature was equal to the environment temperature. The initial temperature of concrete after concrete pouring is about 10ºC higher than environment. On one hand, the casting time was at night in October (Beijing) when environ-ment temperature dropped sharply and remained rela-tively low. On the other hand, since the temperature at the time of concrete mixing in the plant was still mild in the evening, the initial temperature of concrete compo-nents before mixing may be a little higher than that after transportation to the construction site.
4. Results
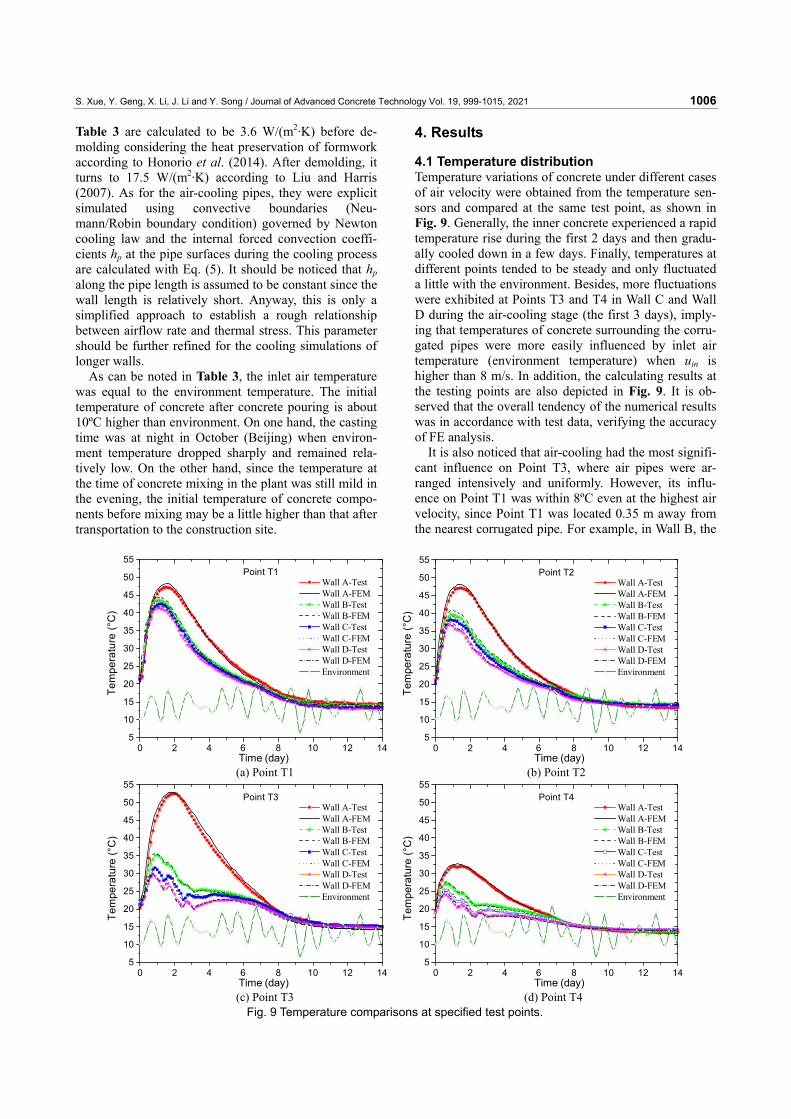
4.1 Temperature distribution Temperature variations of concrete under different cases of air velocity were obtained from the temperature sen-sors and compared at the same test point, as shown in Fig. 9. Generally, the inner concrete experienced a rapid temperature rise during the first 2 days and then gradu-ally cooled down in a few days. Finally, temperatures at different points tended to be steady and only fluctuated a little with the environment. Besides, more fluctuations were exhibited at Points T3 and T4 in Wall C and Wall D during the air-cooling stage (the first 3 days), imply-ing that temperatures of concrete surrounding the corru-gated pipes were more easily influenced by inlet air temperature (environment temperature) when uin is higher than 8 m/s. In addition, the calculating results at the testing points are also depicted in Fig. 9. It is ob-served that the overall tendency of the numerical results was in accordance with test data, verifying the accuracy of FE analysis.
It is also noticed that air-cooling had the most signifi-cant influence on Point T3, where air pipes were ar-ranged intensively and uniformly. However, its influ-ence on Point T1 was within 8ºC even at the highest air velocity, since Point T1 was located 0.35 m away from the nearest corrugated pipe. For example, in Wall B, the
0 2 4 6 8 10 12 145
10
15
20
25
30
35
40
45
50
55
Time (day)
Wall A-TestWall A-FEMWall B-TestWall B-FEMWall C-TestWall C-FEMWall D-TestWall D-FEMEnvironment
Point T1
Tem
pera
ture
(°C
)
0 2 4 6 8 10 12 14
5
10
15
20
25
30
35
40
45
50
55
Time (day)
Wall A-TestWall A-FEMWall B-TestWall B-FEMWall C-TestWall C-FEMWall D-TestWall D-FEMEnvironment
Point T2
Tem
pera
ture
(°C
)
(a) Point T1 (b) Point T2
0 2 4 6 8 10 12 145
10
15
20
25
30
35
40
45
50
55
Time (day)
Wall A-TestWall A-FEMWall B-TestWall B-FEMWall C-TestWall C-FEMWall D-TestWall D-FEMEnvironment
Point T3
Tem
pera
ture
(°C
)
0 2 4 6 8 10 12 14
5
10
15
20
25
30
35
40
45
50
55
Time (day)
Wall A-TestWall A-FEMWall B-TestWall B-FEMWall C-TestWall C-FEMWall D-TestWall D-FEMEnvironment
Point T4
Tem
pera
ture
(°C
)
(c) Point T3 (d) Point T4
Fig. 9 Temperature comparisons at specified test points.
S. Xue, Y. Geng, X. Li, J. Li and Y. Song / Journal of Advanced Concrete Technology Vol. 19, 999-1015, 2021 1007
highest temperatures at Points T3, T2 and T1 decreased by 17.3, 7.5 and 3.7ºC, respectively; in Wall D, the highest temperatures at Points T3, T2 and T1 decreased by 23.3, 10.5 and 5.3ºC, respectively. It indicates that there is a loss of efficiency with the extension of dis-tance from the pipe boundary. Higher air circulation velocities do not lead to a significant increase of the influence range of each pipe.
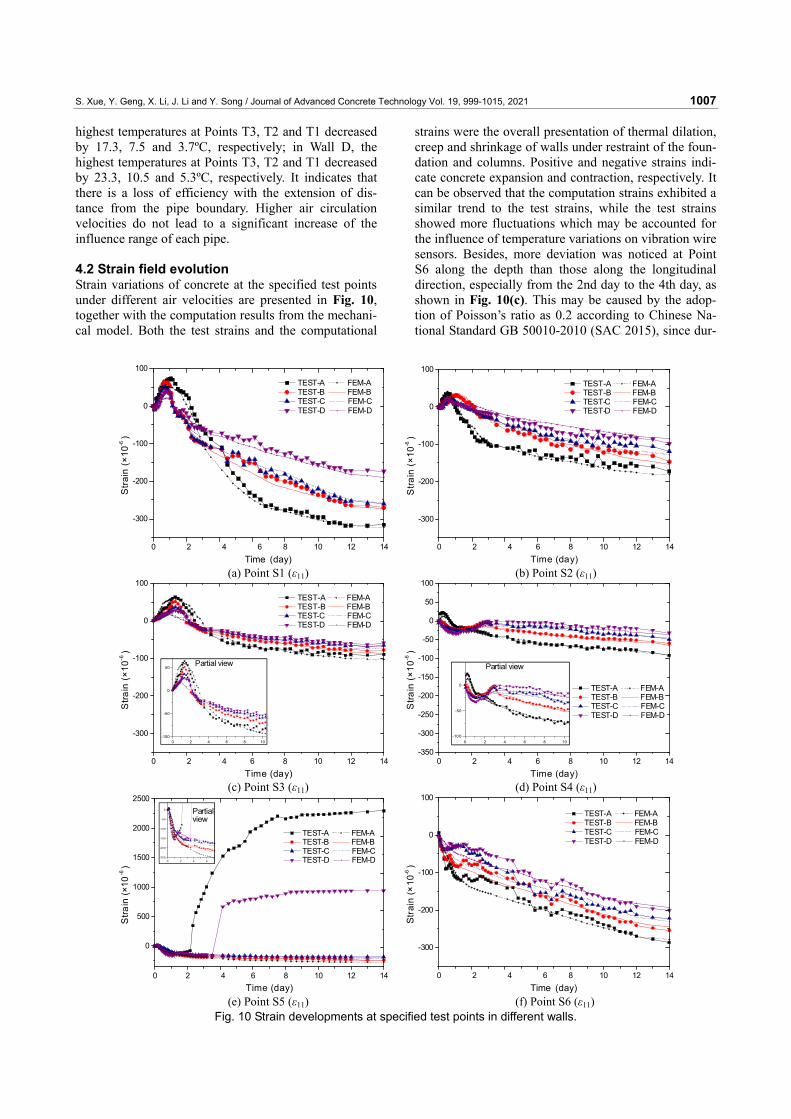
4.2 Strain field evolution Strain variations of concrete at the specified test points under different air velocities are presented in Fig. 10, together with the computation results from the mechani-cal model. Both the test strains and the computational
strains were the overall presentation of thermal dilation, creep and shrinkage of walls under restraint of the foun-dation and columns. Positive and negative strains indi-cate concrete expansion and contraction, respectively. It can be observed that the computation strains exhibited a similar trend to the test strains, while the test strains showed more fluctuations which may be accounted for the influence of temperature variations on vibration wire sensors. Besides, more deviation was noticed at Point S6 along the depth than those along the longitudinal direction, especially from the 2nd day to the 4th day, as shown in Fig. 10(c). This may be caused by the adop-tion of Poisson’s ratio as 0.2 according to Chinese Na-tional Standard GB 50010-2010 (SAC 2015), since dur-
0 2 4 6 8 10 12 14
-300
-200
-100
0
100
Stra
in(×
10-6
)
Time (day)
TEST-A FEM-ATEST-B FEM-BTEST-C FEM-CTEST-D FEM-D
0 2 4 6 8 10 12 14
-300
-200
-100
0
100
Stra
in(×
10-6
)
Time (day)
TEST-A FEM-ATEST-B FEM-BTEST-C FEM-CTEST-D FEM-D
(a) Point S1 (ε11) (b) Point S2 (ε11)
0 2 4 6 8 10 12 14
-300
-200
-100
0
100
Stra
in(×
10-6
)
Time (day)
TEST-A FEM-ATEST-B FEM-BTEST-C FEM-CTEST-D FEM-D
0 2 4 6 8 10-100
-50
0
50Partial view
0 2 4 6 8 10 12 14
-350
-300
-250
-200
-150
-100
-50
0
50
100
Stra
in(×
10-6
)
Time (day)
TEST-A FEM-ATEST-B FEM-BTEST-C FEM-CTEST-D FEM-D
0 2 4 6 8 10-10 0
-50
0
Partial view
(c) Point S3 (ε11) (d) Point S4 (ε11)
0 2 4 6 8 10 12 14
0
500
1000
1500
2000
2500
Stra
in(×
10-6
)
Time (day)
TEST-A FEM-ATEST-B FEM-BTEST-C FEM-CTEST-D FEM-D0 2 4 6
-250
-200
-150
-100
-50
0 Partialview
0 2 4 6 8 10 12 14
-300
-200
-100
0
100
Str
ain
(×10
-6)
Time (day)
TEST-A FEM-ATEST-B FEM-BTEST-C FEM-CTEST-D FEM-D
(e) Point S5 (ε11) (f) Point S6 (ε11)
Fig. 10 Strain developments at specified test points in different walls.

S. Xue, Y. Geng, X. Li, J. Li and Y. Song / Journal of Advanced Concrete Technology Vol. 19, 999-1015, 2021 1008
ing the very early ages Poisson’s ratio can be greater due to the viscoelastic properties of concrete. In Fig. 10(e), the computation of strains failed to predict crack-ing of concrete Wall A and Wall D because no cracking criteria were defined in the finite element mechanical model. Despite these two aspects, this mechanical model had sufficient precision in predicting strain evo-lution of concrete walls under different cooling cases.
From the aspect of monitored strain evolution, the positive strains along the length direction at Points S1, S2 and S3 rose to a maximum of 74, 38 and 22 με, re-spectively, as shown in Figs. 10(a), 10(b) and 10(c). The positive strains mainly accounted for the hydration of cementitious materials in the first 2 days. Then due to both thermal contraction and autogenous shrinkage, the strain curves decreased sharply to negative strains until they reached a relatively steady state. It is also observed that the absolute values of both positive and negative strains were larger at Point S1 than those at Point S3, which was caused by the stronger constraint at the bot-tom. Moreover, the strain development at Points S1, S2 and S3 under air-cooling cases showed a similar ten-dency as that of Wall A. However, positive strains and negative strains (absolute value) were both the smallest in Wall D. Since higher air velocities lead to a lower peak temperature and a minor difference with the final equilibrium temperature, there is a reduction in the volumetric deformation during the heating and cooling phases. This explains why the increase of air velocity in cooling pipes lead to the reduction of internal strains. Similar trend can be noticed for the strains along the width direction, as shown in Fig. 10(f), while no posi-tive strains appeared during the first few days. It implies that thermal expansion is less evident along the width direction near the top corner.
As for the region surrounding the vertical corrugated pipe, as shown in Fig. 10(d), strains seemed to go up promptly under air-cooling cases from the 1st to the 3rd day when the air-cooling stopped; in contrast, the strain at Point S4 in Wall A kept decreasing. Although Point S4 was at the same position in the four walls, the condi-tions were quite different between air-cooling cases and the normal case without air-cooling, since in wall A Point S4 concerned the concrete core while in other cases it was close to the cooling duct (an external sur-
face). It indicates that air-cooling reduces the contrac-tion of concrete surrounding the pipe or may even lead to positive strains, which may be caused by tensile stress around the cooling pipe due to cold air boundary. This point will be further illustrated in stress discussion later.
In addition, enormous tensile strains were observed at the S5 in Wall A and Wall D, while no tensile strain emerged in Wall B or in Wall C, indicating that tensile cracking happens to both the wall without air-cooling and the wall with inlet air flow of 11.35 m/s. In Wall A, tensile strain suddenly arose up to 400 με at the 2nd day and then went up rapidly to 2200 till the 7th day after casting. In Wall D, tensile strain popped up at the 3rd day and moderately grew from 600 με to 1000 με.
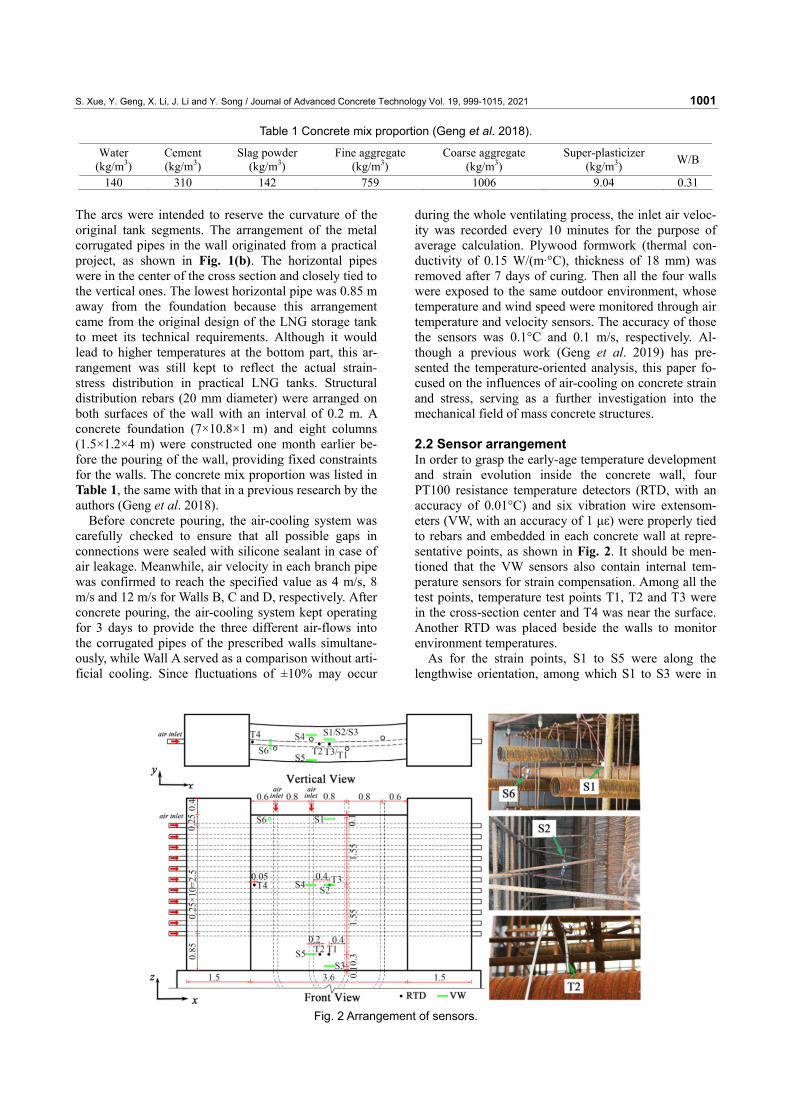
4.3 Wall surface cracking Surface cracks on the walls were first observed on the arc wall’s outer surface instantly after formwork re-moval (the 7th day). There were mainly two kinds of cracks, namely local edge cracks and vertical cracks, as shown in Fig. 11.
One obvious local edge crack at the height of 1m oc-curred on the outer surface for each of the four walls, which may be due to external restraint by older adjacent columns. The depth of the edge crack CB-1 on Wall A was 50.37 mm at the 3rd day after demolding and slightly increased to 79.72 mm on the 28th day. Mean-while, it was also observed that the depth of edge crack CB-2 (on Wall B), CB-3 (on Wall C) and CB-4 (on Wall D) were quite similar to that on Wall A, with a deviation of about 10 mm. It indicates that local edge cracking is relatively shallow and will not develop deeper for the long-term duration.
Meanwhile, vertical cracks were observed along the vertical corrugated pipe only on Wall A and Wall D, which was consistent with the strain developments at Point S5 (5 mm away from the surface) depicted in Fig. 10(e). The surface crack on Wall A stretched from bot-tom to the top, in accordance with the cracking pattern demonstrated by Klemczak and Knoppik-Wróbel (2015) under continuous edge restraint. However, the vertical crack on Wall D was only 0.6 m in height at the 3rd day and merely extended to 1.6 m in height. The crack depth obtained from ultrasonic testing are listed in Table 4. It
Fig. 11 Surface cracks on Walls A and D.
S. Xue, Y. Geng, X. Li, J. Li and Y. Song / Journal of Advanced Concrete Technology Vol. 19, 999-1015, 2021 1009
is noticed that surface cracking went deeper almost line-arly during the first 24 days and tended to slow down after 31 days. Besides, the crack CV-2 on Wall D was shallower with an average reduction of 21.8%.
5. Discussion
5.1 Temperature field analysis Based on the confidence and accuracy of temperature field analysis, thermo-mechanical analysis was further conducted to investigate the stress distribution of the walls under air-cooling. The results are discussed in comprehensive consideration of temperature, strain and cracking results presented above.
It has been concluded in a previous research by the authors (Geng et al. 2019) that the influence range of a single pipe is quite limited regardless of the internal ventilation rate. This phenomenon is also confirmed by the contours derived from the finite element analysis, as shown in Fig. 12.
From the aspect of spatial scale, it is noticed that the concrete wall under air-cooling was generally divided into two regions by the corrugated pipes according to pipe arrangement and temperature distribution. One region is the upper region where horizontal pipes were uniformly arranged besides vertical pipes. The other is the lower region where only vertical pipes worked.
In the upper region, concrete temperatures were rela-tively uniform where the maximum temperature differ-ences δTSmax between the outer surface and local high-temperature zone of Walls B, C and D were 6.26, 4.29 and 3.08°C, respectively, yet δTSmax of Wall A was 16.78°C at about 1.9 m from the base on the 2nd day. It indicates that the temperature gradient near the outer surface primarily decreased with air-cooling, accounting for decreased thermal stress and alleviation of cracking in the upper region. However, the maximum tempera-ture differences δTPmax between the pipe surface and local high-temperature zone were 14.11, 18.63 and 19.82°C for Walls B, C and D, respectively. It implies that greater thermal stress was aroused with the increase of ventilating velocity.
In the lower region, since no horizontal pipes were ar-ranged and the distance between vertical pipes was rela-tively far, peak temperatures of Walls B, C and D were little influenced by air-cooling. As can be obtained in Fig. 12, the highest temperatures at t=1 day were only reduced by 1.98, 3.15 and 3.53°C, respectively, com-
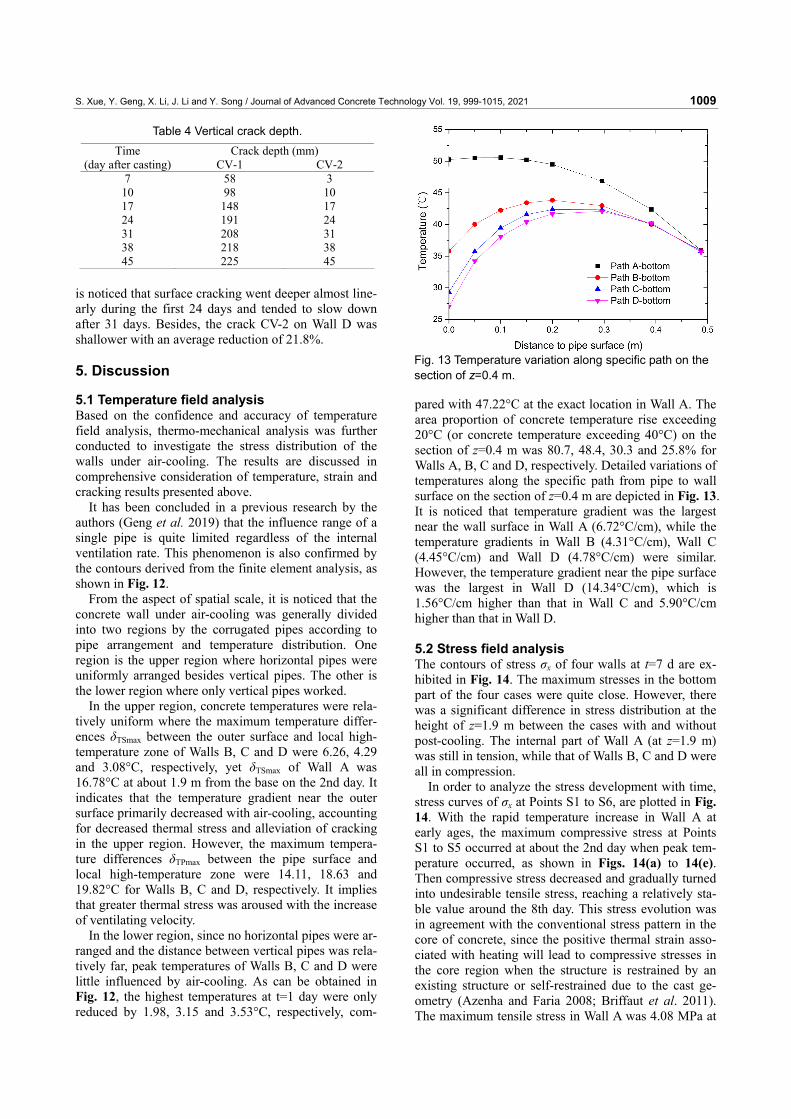
pared with 47.22°C at the exact location in Wall A. The area proportion of concrete temperature rise exceeding 20°C (or concrete temperature exceeding 40°C) on the section of z=0.4 m was 80.7, 48.4, 30.3 and 25.8% for Walls A, B, C and D, respectively. Detailed variations of temperatures along the specific path from pipe to wall surface on the section of z=0.4 m are depicted in Fig. 13. It is noticed that temperature gradient was the largest near the wall surface in Wall A (6.72°C/cm), while the temperature gradients in Wall B (4.31°C/cm), Wall C (4.45°C/cm) and Wall D (4.78°C/cm) were similar. However, the temperature gradient near the pipe surface was the largest in Wall D (14.34°C/cm), which is 1.56°C/cm higher than that in Wall C and 5.90°C/cm higher than that in Wall D.
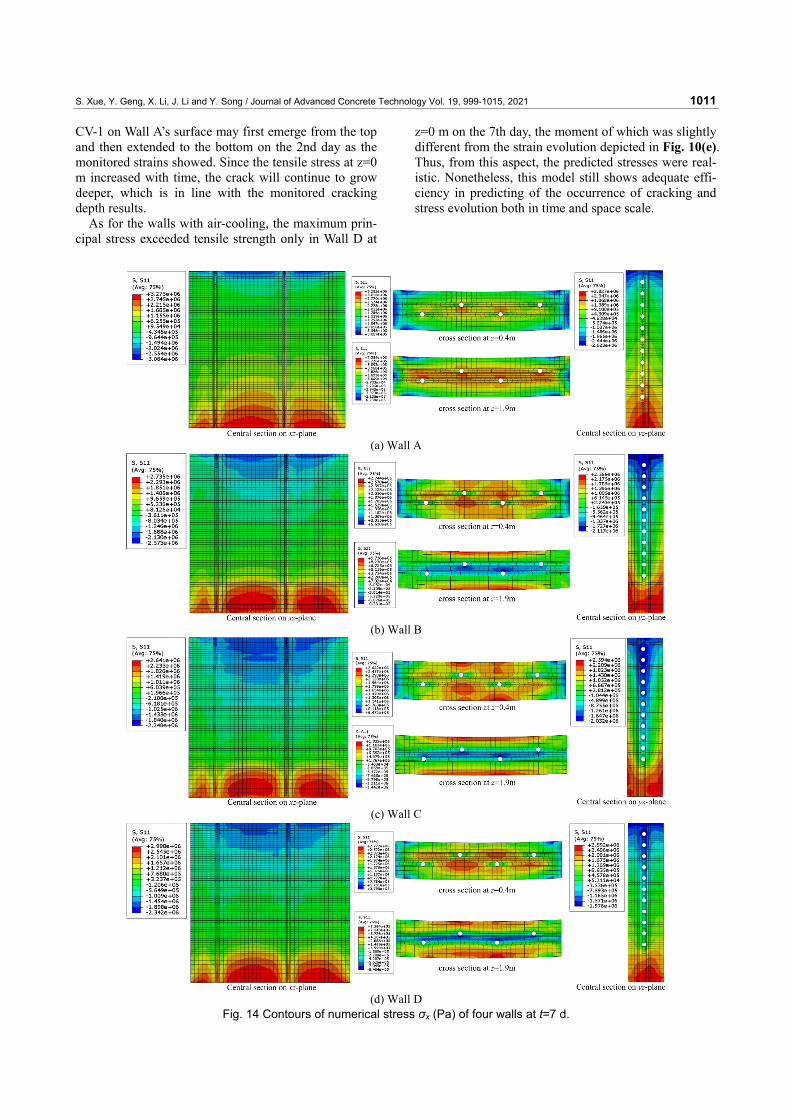
5.2 Stress field analysis The contours of stress σx of four walls at t=7 d are ex-hibited in Fig. 14. The maximum stresses in the bottom part of the four cases were quite close. However, there was a significant difference in stress distribution at the height of z=1.9 m between the cases with and without post-cooling. The internal part of Wall A (at z=1.9 m) was still in tension, while that of Walls B, C and D were all in compression.
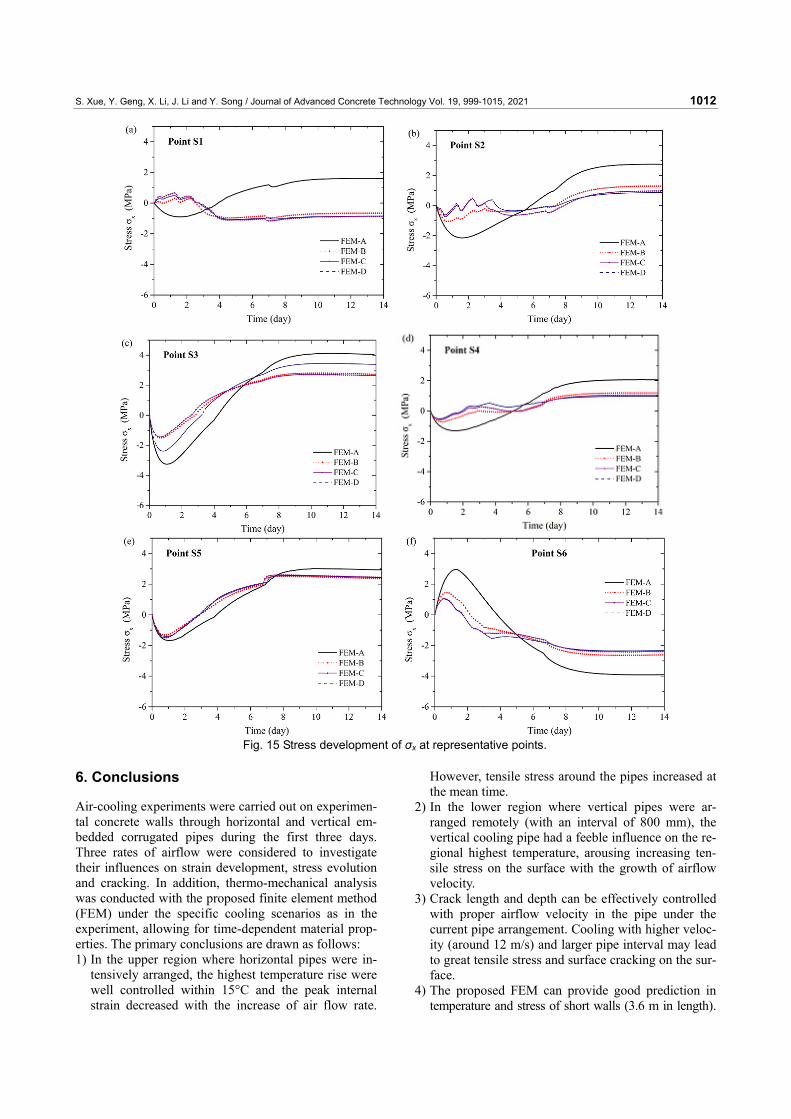
In order to analyze the stress development with time, stress curves of σx at Points S1 to S6, are plotted in Fig. 14. With the rapid temperature increase in Wall A at early ages, the maximum compressive stress at Points S1 to S5 occurred at about the 2nd day when peak tem-perature occurred, as shown in Figs. 14(a) to 14(e). Then compressive stress decreased and gradually turned into undesirable tensile stress, reaching a relatively sta-ble value around the 8th day. This stress evolution was in agreement with the conventional stress pattern in the core of concrete, since the positive thermal strain asso-ciated with heating will lead to compressive stresses in the core region when the structure is restrained by an existing structure or self-restrained due to the cast ge-ometry (Azenha and Faria 2008; Briffaut et al. 2011). The maximum tensile stress in Wall A was 4.08 MPa at
Table 4 Vertical crack depth. Crack depth (mm) Time
(day after casting) CV-1 CV-2 7 58 3
10 98 10 17 148 17 24 191 24 31 208 31 38 218 38 45 225 45
Fig. 13 Temperature variation along specific path on the section of z=0.4 m.

S. Xue, Y. Geng, X. Li, J. Li and Y. Song / Journal of Advanced Concrete Technology Vol. 19, 999-1015, 2021 1010
Point S3, which was quite close to the concrete tensile strength and showed great risk of cracking. In the cool-ing cases (Walls B, C and D), the stress evolution at Point S3, S4 and S5 resembled the evolution of Wall A, while the maximum tensile stress was smaller. For ex-ample, the maximum tensile stress at Point S3 of Walls B, C and D was 2.72 MPa, 2.63 MPa and 4.10 MPa, respectively. However, the stress evolution at Points S1 and S2 were very different in the walls with post-cooling. During the first few days, tensile stress oc-curred and fluctuated with temperature, although the value was no more than 1.0 MPa.
At Point S6, as shown in Fig. 15(f), since this point
was at the top surface and near the column, the tensile stress σx reached 2.97 MPa at the 2nd day, which was very close to the tensile strength 3.92 MPa at the corre-sponding age. Then the stress decreased and turned into compressive stress during the cooling phase.
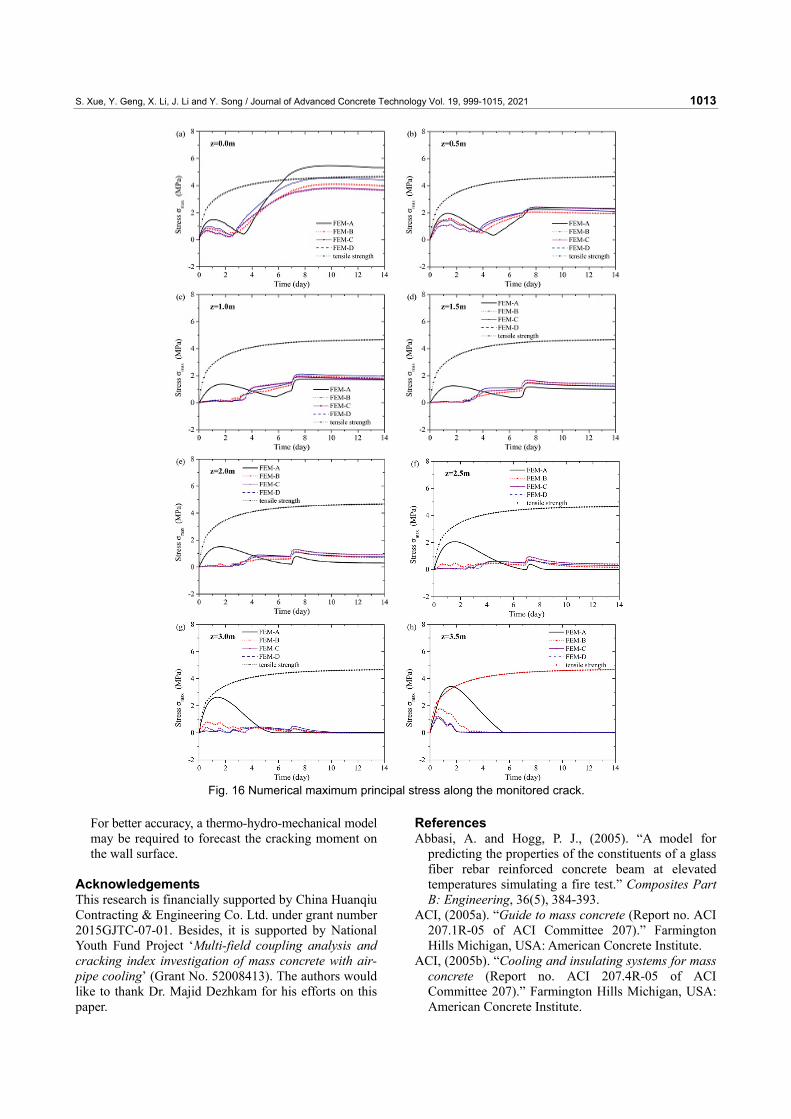
In order to further analyze the stress distribution along the observed vertical cracking on the vertical sur-face (CV-1 and CV-2), curves of maximum principal stress were plotted in Fig. 16. It can be observed that the tensile stress of Wall A exceeded the tensile strength at z=0 m on about the 6th day and z=3.5 m on the first day. Besides, the tensile stress at z=3.0 m nearly reached the tensile strength. Therefore, it is predicted that the crack
(a) Wall A
(b) Wall B
(c) Wall C
(d) Wall D
Fig. 12 Contours of temperatures (°C) of the four walls at t=1 day.
S. Xue, Y. Geng, X. Li, J. Li and Y. Song / Journal of Advanced Concrete Technology Vol. 19, 999-1015, 2021 1011
CV-1 on Wall A’s surface may first emerge from the top and then extended to the bottom on the 2nd day as the monitored strains showed. Since the tensile stress at z=0 m increased with time, the crack will continue to grow deeper, which is in line with the monitored cracking depth results.
As for the walls with air-cooling, the maximum prin-cipal stress exceeded tensile strength only in Wall D at
z=0 m on the 7th day, the moment of which was slightly different from the strain evolution depicted in Fig. 10(e). Thus, from this aspect, the predicted stresses were real-istic. Nonetheless, this model still shows adequate effi-ciency in predicting of the occurrence of cracking and stress evolution both in time and space scale.
(a) Wall A
(b) Wall B
(c) Wall C
(d) Wall D
Fig. 14 Contours of numerical stress σx (Pa) of four walls at t=7 d.
S. Xue, Y. Geng, X. Li, J. Li and Y. Song / Journal of Advanced Concrete Technology Vol. 19, 999-1015, 2021 1012
6. Conclusions
Air-cooling experiments were carried out on experimen-tal concrete walls through horizontal and vertical em-bedded corrugated pipes during the first three days. Three rates of airflow were considered to investigate their influences on strain development, stress evolution and cracking. In addition, thermo-mechanical analysis was conducted with the proposed finite element method (FEM) under the specific cooling scenarios as in the experiment, allowing for time-dependent material prop-erties. The primary conclusions are drawn as follows: 1) In the upper region where horizontal pipes were in-
tensively arranged, the highest temperature rise were well controlled within 15°C and the peak internal strain decreased with the increase of air flow rate.
However, tensile stress around the pipes increased at the mean time.
2) In the lower region where vertical pipes were ar-ranged remotely (with an interval of 800 mm), the vertical cooling pipe had a feeble influence on the re-gional highest temperature, arousing increasing ten-sile stress on the surface with the growth of airflow velocity.
3) Crack length and depth can be effectively controlled with proper airflow velocity in the pipe under the current pipe arrangement. Cooling with higher veloc-ity (around 12 m/s) and larger pipe interval may lead to great tensile stress and surface cracking on the sur-face.
4) The proposed FEM can provide good prediction in temperature and stress of short walls (3.6 m in length).
Fig. 15 Stress development of σx at representative points.
S. Xue, Y. Geng, X. Li, J. Li and Y. Song / Journal of Advanced Concrete Technology Vol. 19, 999-1015, 2021 1013
For better accuracy, a thermo-hydro-mechanical model may be required to forecast the cracking moment on the wall surface.
Acknowledgements This research is financially supported by China Huanqiu Contracting & Engineering Co. Ltd. under grant number 2015GJTC-07-01. Besides, it is supported by National Youth Fund Project ‘Multi-field coupling analysis and cracking index investigation of mass concrete with air-pipe cooling’ (Grant No. 52008413). The authors would like to thank Dr. Majid Dezhkam for his efforts on this paper.
References Abbasi, A. and Hogg, P. J., (2005). “A model for
predicting the properties of the constituents of a glass fiber rebar reinforced concrete beam at elevated temperatures simulating a fire test.” Composites Part B: Engineering, 36(5), 384-393.
ACI, (2005a). “Guide to mass concrete (Report no. ACI 207.1R-05 of ACI Committee 207).” Farmington Hills Michigan, USA: American Concrete Institute.
ACI, (2005b). “Cooling and insulating systems for mass concrete (Report no. ACI 207.4R-05 of ACI Committee 207).” Farmington Hills Michigan, USA: American Concrete Institute.
Fig. 16 Numerical maximum principal stress along the monitored crack.
S. Xue, Y. Geng, X. Li, J. Li and Y. Song / Journal of Advanced Concrete Technology Vol. 19, 999-1015, 2021 1014
ACI, (2007). “Report on thermal and volume change effects on cracking of mass concrete (Report no. ACI 207.4R-07 of ACI Committee 207).” Farmington Hills Michigan, USA: American Concrete Institute.
Alam, T. and Kim, M. H., (2018). “A comprehensive review on single phase heat transfer enhancement techniques in heat exchanger applications.” Renewable & Sustainable Energy Reviews, 81-1, 813-839.
Azenha, M. and Faria, R., (2008). “Temperatures and stresses due to cement hydration on the R/C foundation of a wind tower - A case study.” Engineering Structures, 30(9), 2392-2400.
Azenha, M., Faria, R. and Ferreira, D., (2009). “Identification of early-age concrete temperatures and strains: Monitoring and numerical simulation.” Cement and Concrete Composites, 31(6), 369-378.
Azenha, M., Lameiras, R., Sousa, C. D. and Barros, J., (2014). “Application of air cooled pipes for reduction of early age cracking risk in a massive RC wall.” Engineering Structures, 62-63, 148-163.
Bertagnoli, G., Mancini, G. and Tondolo, F., (2011). “Early age cracking of massive concrete piers.” Magazine of Concrete Research, 63(10), 723-736.
Borst, R. and Boogaard, A., (1994). “Finite element modeling of deformation and cracking in early-age concrete.” ASCE Journal of Engineering Mechanics, 120(12), 2519-2534.
Briffaut, M., Benboudjema, F., Torrenti, J. M. and Nahas, G., (2011). “Numerical analysis of the thermal active restrained shrinkage ring test to study the early age behavior of massive concrete structures.” Engineering Structures, 33,1390-1401.
Briffaut, M., Benboudjema, F., Torrenti, J. M. and Nahas, G., (2012). “Effects of the early age thermal behavior on long term damage risks in massive concrete structures.” European Journal of Environmental and Civil Engineering, 16(5), 589-605.
BSI, (2004). “Testing concrete, Part 4: Determination of ultrasonic pulse velocity (British Standard BS EN 12504-4).” London: British Standards Institution.
CECS, (2000). “Technical specification for inspection of concrete defects by ultrasonic method (Technical specification CECS 21 of the China Association for Engineering Construction Standardization).” Beijing: China City Press.
De Schutter, G., (2002). “Finite element simulation of thermal cracking in massive hardening concrete elements using degree of hydration based material laws.” Computers & Structures, 80(27), 2035-2042.
Faria, R., Azenha, M. and Figueiras, J. A., (2006). “Modelling of concrete at early ages: Application to an externally restrained slab.” Cement and Concrete Composites, 28(6), 572-585.
fib, (2013). “fib Model Code 2010 for concrete structures.” Berlin, Germany: Ernst & Sohn.
Geng, Y., Li, X. Y., Xue, S. D., Li, J. G. and Song, Y. J., (2018). “Early-age thermal analysis and strain monitoring of massive concrete structures.” Computers
and Concrete, 21(3), 279-289. Geng, Y., Li, X. Y., Xue, S. D., Li, J. G. and Song, Y. J.,
(2019). “Experimental and theoretical internal forced convection investigation on air pipe cooling of large-dimension RC walls.” Construction and Building Materials, 194, 161-170.
Gengel, Y. A., (2007). “Heat and mass transfer: A practical approach.” 3rd ed. New York: McGraw-Hill Higher Education.
Groth, P. and Hedlund, H., (1998). “Air cooling of concrete by means of embedded cooling pipes, Part II: Application in design.” Materials and Structures, 31, 387-392.
Hattel, J. H. and Thorborg, J., (2003). “A numerical model for predicting the thermomechanical conditions during hydration of early-age concrete.” Applied Mathematical Modelling, 27(1), 1-26.
Hedlund, H. and Groth, P., (1998). “Air cooling of concrete by means of embedded cooling pipes, Part I: Laboratory tests of heat transfer coefficients.” Materials and Structures, 31, 329-334.
Helal, J., Sofi, M. and Mendis, P., (2015). “Non-destructive testing of concrete: A review of methods.” Electronic Journal of Structural Engineering, 14(1), 97-105.
Honorio, T., Bary, B. and Benboudjema, F., (2014). “Evaluation of the contribution of boundary and initial conditions in the chemo-thermal analysis of a massive concrete structure.” Engineering Structures, 80, 173-188.
Ishikawa, S., Matsukawa, K., Nakanishi, S. and Kawai, H., (2007). “Air pipe cooling system.” Concrete International, 29, 45-49.
Jendele, L., Šmilauer, V. and Červenka, J., (2014). “Multiscale hydro-thermo-mechanical model for early-age and mature concrete structures.” Advances in Engineering Software, 72(2), 134-146.
Kim, K. H., Jeon, S. E. and Kim, J. K., (2003). “An experimental study on thermal conductivity of concrete.” Cement and Concrete Research, 33(3), 363-371.
Klemczak, B. and Knoppik-Wróbel, A., (2015). “Reinforced concrete tank walls and bridge abutments: Early-age behaviour, analytic approaches and numerical models.” Engineering Structures, 84, 233-251.
Li, X. Y., Geng, Y., Xue, S. D., Li, J. G. and Song, Y. J., (2019). “Automatic air-cooling system for early-age crack control in concrete.” Civil Engineering, 172(5), 58-64.
Lin, P. and Li, Q. B., (2014). “A real-time temperature data transmission approach for intelligent cooling control of mass concrete.” Mathematical Problems in Engineering, Vol. 2014, Article ID 514606.
Liu, W. C., Cao, W. L. and Yan, H. Q., (2016). “Experimental and numerical studies of controlling thermal cracks in mass concrete foundation by circulating water.” Applied Sciences, 6(4), 110.
S. Xue, Y. Geng, X. Li, J. Li and Y. Song / Journal of Advanced Concrete Technology Vol. 19, 999-1015, 2021 1015
Liu, Y. and Harris, D. J., (2007). “Full-scale measurements of convective coefficient on external surface of a low-rise building in sheltered conditions.” Building and Environment, 42(7), 2718-2736.
Malkawi, A. I. H., Mutasher, S. A. and Qiu, T. J., (2003). “Thermal-structural modeling and temperature control of roller compacted concrete gravity dam.” Journal of Performance of Constructed Facilities, 17(4), 177-187.
Mizobuchi, T., Kanda, T. and Kunieda, M., (2013). “Effect of heat elimination by pipe-cooling system for temperature rise with heat of cement hydration in beam using high strength engineered cementitious composites.” In: Proc. 9th International Conference on Creep, Shrinkage, and Durability Mechanics (CONCREEP-9), Cambridge, Massachusetts, USA 22-25 September 2013. Reston, Virginia, USA: American Society of Civil Engineers, 725-733.
Nagy, A., (1997). “Thermally induced softening and cracking in concrete with minimal reinforcement.” Materials and Structures, 30, 527-532.
NEA, (2017). “Test code for hydraulic concrete (China National Energy Administration Standard DL/T 5150).” Beijing: China Electric Power Press.
Qin, F., Fan, F. and Li, Z., (2014). “Thermal simulation of hydration heat in slab of Taishan Nuclear Power Plant Unit 2.” Proc. 2014 International Conference on Computing in Civil and Building Engineering, Orlando, Florida, USA 23-25 June 2014. Reston, Virginia, USA: American Society of Civil Engineers.
SAC, (2015). “Code for design of concrete structures (GB 50010-2010).” The Standardization Administration of the People’s Republic of China, Beijing: China Architecture & Building Press.
SAC, (2016). “Test method of performance on ordinary fresh concrete (GB/T 50080-2016).” The Standardi-zation Administration of the People’s Republic of
China, Beijing: China Architecture & Building Press. Schlinder, A. K., (2004). “Prediction of concrete setting.”
Proceedings of International RILEM Conference on Advances in Concrete through Science and Engineering, Evanston, Illinois, USA 21-24 March 2004. Paris, France: RILEM Publications S.A.R.L.
Singh, P. R. and Rai, D. C., (2018). “Effect of piped water cooling on thermal stress in mass concrete at early ages.” Journal of Engineering Mechanics, 144(3), Article ID 04017183.
Tong, S. X., Zhang X. Y. and Jin Y., (1998). “Crack depth detection in concrete by ultrasonic initial wave phrase reverse method.” Journal of Building Materials, 1(3), 287-290.
Wang, Q., Yan, P. Y. and Feng, J. J., (2013). “Design of high-volume fly ash concrete for a massive foundation slab.” Magazine of Concrete Research, 65(2), 71-81.
Xiang, Y. Y., Zhang, Z. H., He, S. H. and Dong, G., (2005). “Thermal-mechanical analysis of a newly cast concrete wall of a subway structure.” Tunnelling and Underground Space Technology, 20, 442-451.
Yang, J. K., Lee, Y. and Kim, J. K., (2011). “Heat transfer coefficient in flow convection of pipe-cooling system in massive concrete.” Journal of Advanced Concrete Technology, 9(1),103-114.
Zhai, X. M., Wang, Y. H. and Wang, H., (2015). “Thermal stress analysis of concrete wall of LNG tank during construction period.” Materials and Structures, 49(6), 1-14.
Zhu, B. F., (1999). “Effect of cooling by water flowing in nonmetal pipes embedded in mass concrete.” Journal of Construction Engineering and Management, 125(1), 61-68.
Zhu, B. F., (2014). “Thermal stresses and temperature control of mass concrete.” Waltham, UK: Butterworth- Heinemann.
Related Documents