Svensk Kärnbränslehantering AB Swedish Nuclear Fuel and Waste Management Co Box 250, SE-101 24 Stockholm Phone +46 8 459 84 00 R-14-31 Stress application and the effect on creep of copper Karin Mannesson, Henrik C M Andersson-Östling Swerea KIMAB AB May 2016

Welcome message from author
This document is posted to help you gain knowledge. Please leave a comment to let me know what you think about it! Share it to your friends and learn new things together.
Transcript
Svensk Kärnbränslehantering ABSwedish Nuclear Fueland Waste Management Co
Box 250, SE-101 24 Stockholm Phone +46 8 459 84 00
R-14-31
Stress application and the effect on creep of copper
Karin Mannesson, Henrik C M Andersson-Östling Swerea KIMAB AB
May 2016

Stress application and the effect on creep of copper
Karin Mannesson, Henrik C M Andersson-Östling Swerea KIMAB AB
ISSN 1402-3091SKB R-14-31ID 1455695
May 2016
This report concerns a study which was conducted for Svensk Kärnbränslehantering AB (SKB). The conclusions and viewpoints presented in the report are those of the authors. SKB may draw modified conclusions, based on additional literature sources and/or expert opinions.
A pdf version of this document can be downloaded from www.skb.se.
© 2016 Svensk Kärnbränslehantering AB


SKB R-14-31 3
Abstract
Stress application experiments have been performed on phosphorous doped, oxygen free copper intended for nuclear waste disposal canisters. The creep experiments were performed by altering the load application schedule and comparing the results to a standard creep test performed on the same material. The results show that if the load is increased when the specimen is in a primary creep stage, a new defined primary creep will result. If the load is increased when the specimen is in the tertiary stage, a sharply increased tertiary creep rate will result. If the load is increased in the secondary stage the result on the creep strain is slight.
The reason for the behaviour is not immediately clear but it is theorized that it is dependent on the dislocation substructure in the metal grains, and the exhaustion of ductility in the material.
The delayed application of load compared to the reference tests decreases creep life and creep ductility.


SKB R-14-31 5
Contents
1 Background 7
2 Aim of work 9
3 Experimental and material 11
4 Results 13
5 Discussion 17
6 Conclusions 21
References 23

SKB R-14-31 7
1 Background
The proposed method for disposal of spent nuclear fuel in Sweden is to encase the waste in canisters made up of an inner cast iron insert and an outer thick copper shell. The cast iron insert is load bear-ing and the outer copper shell provides corrosion resistance during the repository which is thought to last for up to 100 000 to 1 million years. The completed canister will after manufacture be placed in a bentonite clay lined hole in the bedrock at a depth of 500 m. The bentonite clay, which initially is relatively dry, will be slowly saturated with groundwater and swell to completely fill the gap between the surrounding bedrock and the canister. Due to manufacturing tolerances and practicality, there has to be a radial gap of 1.5 mm between the cast iron and the copper shell. This gap will close due to the swelling and the hydrostatic pressure at the depth where the repository is proposed, 500 m. Since the canister copper shell will be approximately 100 °C during the initial deposit due to residual radioactivity in the waste, the closure can be attributed to creep in the copper. The temperature will gradually decrease as the radioactivity is spent, and eventually reach the temperature in the bedrock surrounding the repository (SKB 2006, 2010).
The key mechanical property of the copper material in the canister is creep ductility. The chemical composition of the copper is carefully chosen to maximise the creep potential while not compromis-ing other properties such as corrosion behaviour. This means that the copper has to be oxygen free, low sulphur and an addition of phosphorous has been made to increase creep. It is known that phos-phorous doped copper exhibit greatly increased creep elongation when tested (Andersson-Östling and Sandström 2009). The phosphorous addition does not affect the short time plastic behaviour in the same way. Previous experience also shows that the way in which the load is applied does greatly affect the creep behaviour (Andersson-Östling and Sandström 2011). This is important since the load application in the real repository is not trivial. It depends on the groundwater saturation of the bentonite, the temperature and the residual radioactive heat and longevity of the fuel rods in each individual canister. The cylinder will come to contact with the insert as soon as the full hydrostatic pressure is reached. The time to full wetting of bentonite will vary a lot between different deposition holes. The process could be either hastened or delayed due to the previously mentioned external fac-tors, but no more initial creep deformations is envisaged after 100 years, with a safety margin. In the above mentioned work (Andersson-Östling and Sandström 2011) loading times of up to 6 months were studied and the effect on initial strain and the creep life. A standard creep test is loaded within 2–20 minutes and is then creep tested for thousands of hours. The ductility exhibited by the material is then divided into 15 % loading strain and a further 30–50 % creep strain for a total strain of around 60 %. When the loading time was extended to 6 months the total strain was still 60 % but the loading strain increased to 30 %. What the results show is the importance of the load application procedure to the end result.
In the real repository the stresses and strains on the canister can only be extrapolated because of the timescale. The saturation of the bentonite clay and the subsequent swelling is reasonably well known, but the conditions in the rest of the repository might include new stresses and strains that are unknown at this time. It is therefore important to know the creep behaviour of the copper after long hold times.


SKB R-14-31 9
2 Aim of work
The aim of the present investigation is to vary the load application for creep testing of phosphorous doped copper. The load levels are applied in stages with a dwell creep period between load increases. The results will be used to further increase the copper creep behaviour knowledge base on which the models used for extended extrapolation is based.

SKB R-14-31 11
3 Experimental and material
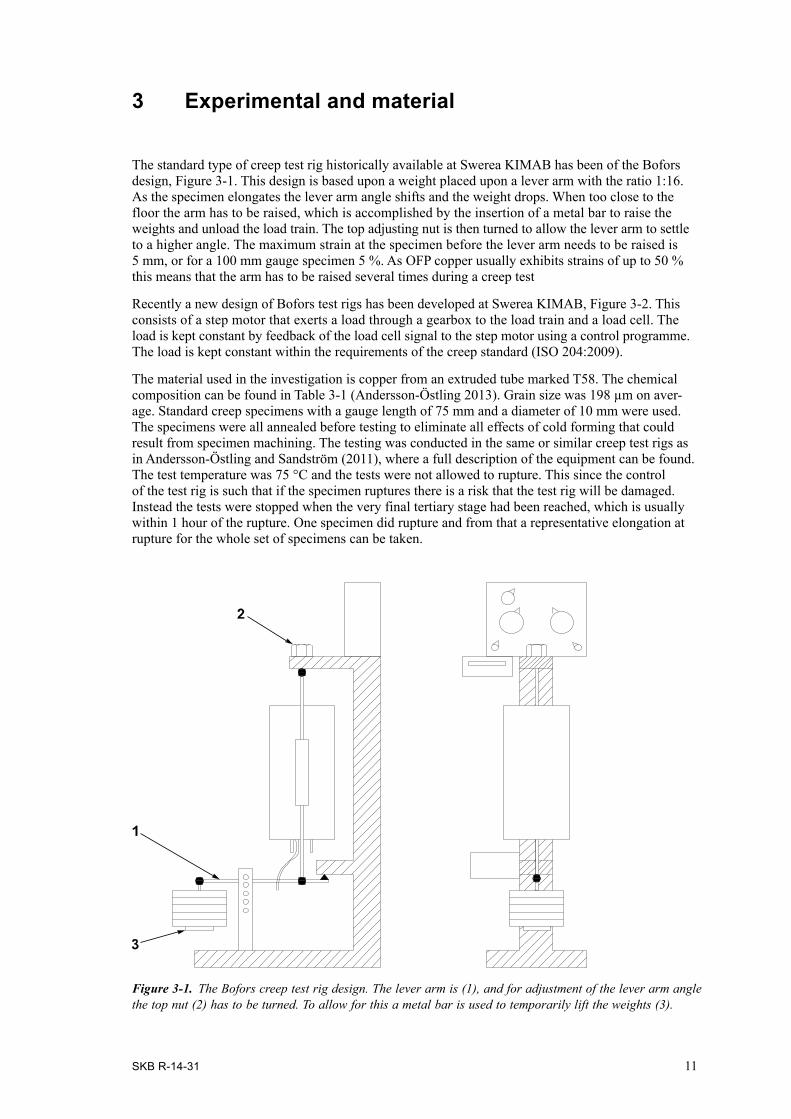
The standard type of creep test rig historically available at Swerea KIMAB has been of the Bofors design, Figure 3-1. This design is based upon a weight placed upon a lever arm with the ratio 1:16. As the specimen elongates the lever arm angle shifts and the weight drops. When too close to the floor the arm has to be raised, which is accomplished by the insertion of a metal bar to raise the weights and unload the load train. The top adjusting nut is then turned to allow the lever arm to settle to a higher angle. The maximum strain at the specimen before the lever arm needs to be raised is 5 mm, or for a 100 mm gauge specimen 5 %. As OFP copper usually exhibits strains of up to 50 % this means that the arm has to be raised several times during a creep test
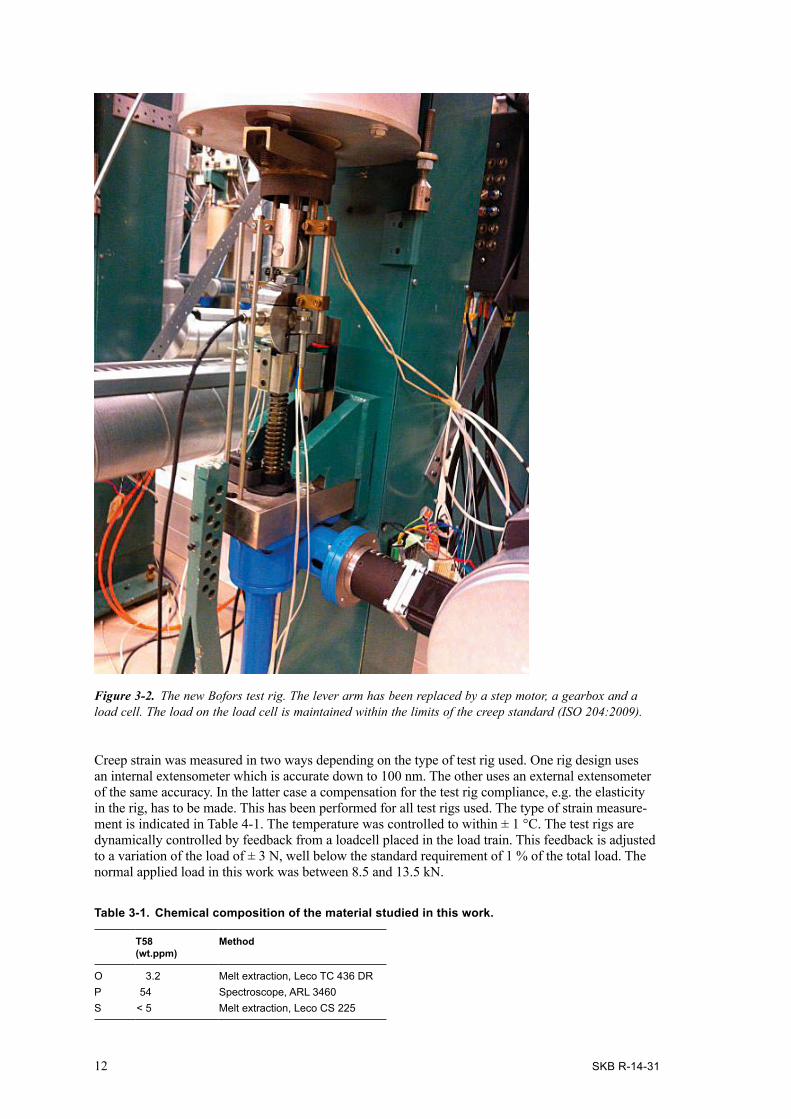
Recently a new design of Bofors test rigs has been developed at Swerea KIMAB, Figure 3-2. This consists of a step motor that exerts a load through a gearbox to the load train and a load cell. The load is kept constant by feedback of the load cell signal to the step motor using a control programme. The load is kept constant within the requirements of the creep standard (ISO 204:2009).
The material used in the investigation is copper from an extruded tube marked T58. The chemical composition can be found in Table 3-1 (Andersson-Östling 2013). Grain size was 198 µm on aver-age. Standard creep specimens with a gauge length of 75 mm and a diameter of 10 mm were used. The specimens were all annealed before testing to eliminate all effects of cold forming that could result from specimen machining. The testing was conducted in the same or similar creep test rigs as in Andersson-Östling and Sandström (2011), where a full description of the equipment can be found. The test temperature was 75 °C and the tests were not allowed to rupture. This since the control of the test rig is such that if the specimen ruptures there is a risk that the test rig will be damaged. Instead the tests were stopped when the very final tertiary stage had been reached, which is usually within 1 hour of the rupture. One specimen did rupture and from that a representative elongation at rupture for the whole set of specimens can be taken.
Figure 3-1. The Bofors creep test rig design. The lever arm is (1), and for adjustment of the lever arm angle the top nut (2) has to be turned. To allow for this a metal bar is used to temporarily lift the weights (3).
12 SKB R-14-31
Creep strain was measured in two ways depending on the type of test rig used. One rig design uses an internal extensometer which is accurate down to 100 nm. The other uses an external extensometer of the same accuracy. In the latter case a compensation for the test rig compliance, e.g. the elasticity in the rig, has to be made. This has been performed for all test rigs used. The type of strain measure-ment is indicated in Table 4-1. The temperature was controlled to within ± 1 °C. The test rigs are dynamically controlled by feedback from a loadcell placed in the load train. This feedback is adjusted to a variation of the load of ± 3 N, well below the standard requirement of 1 % of the total load. The normal applied load in this work was between 8.5 and 13.5 kN.
Table 3-1. Chemical composition of the material studied in this work.
T58 (wt.ppm)
Method
O 3.2 Melt extraction, Leco TC 436 DRP 54 Spectroscope, ARL 3460S < 5 Melt extraction, Leco CS 225
Figure 3-2. The new Bofors test rig. The lever arm has been replaced by a step motor, a gearbox and a load cell. The load on the load cell is maintained within the limits of the creep standard (ISO 204:2009).
SKB R-14-31 13
4 Results
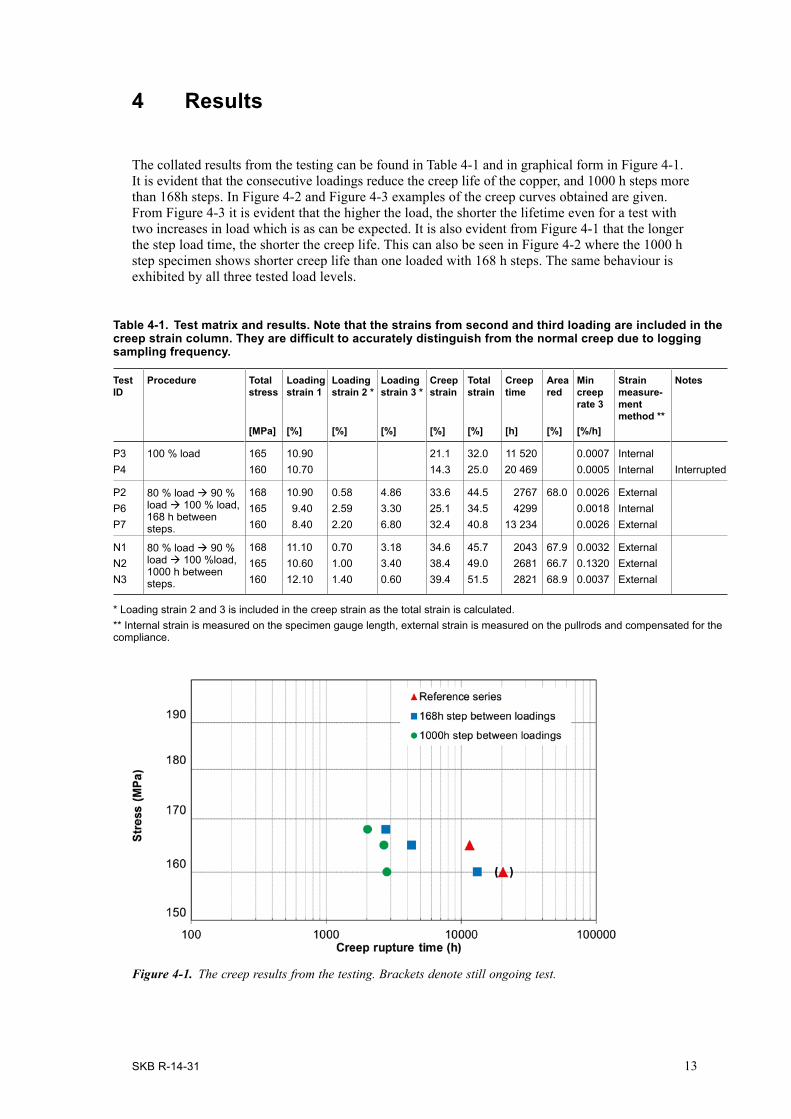
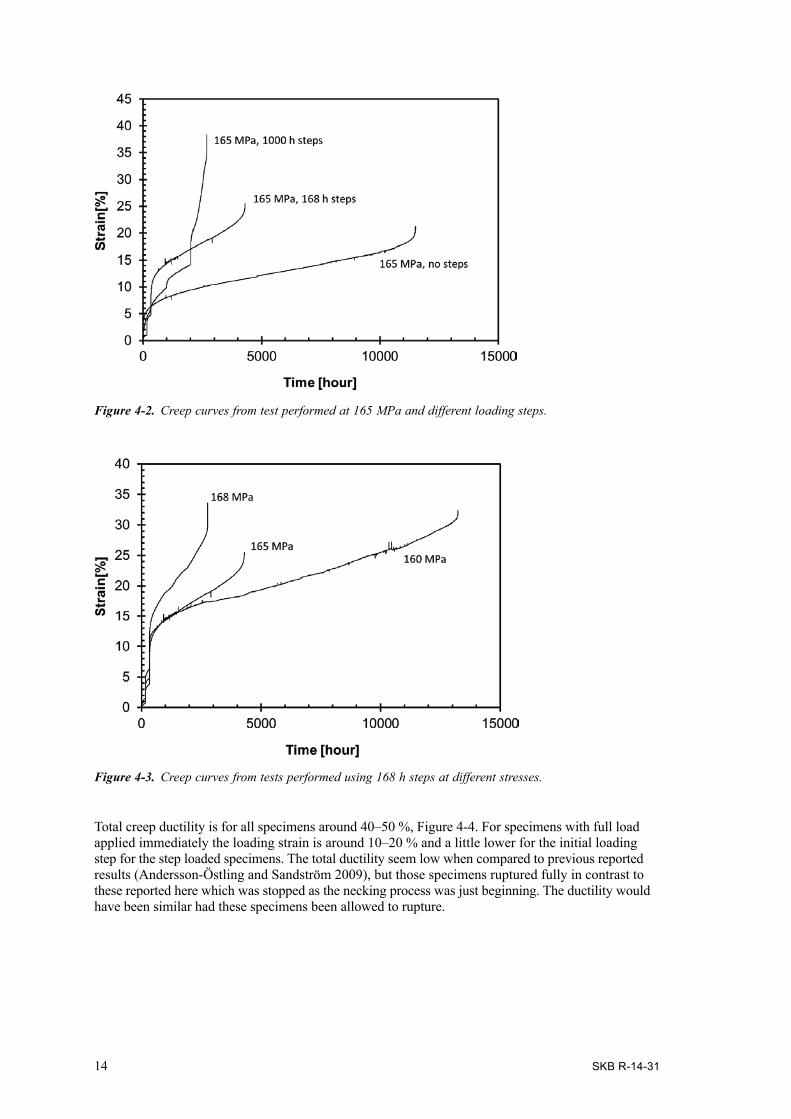
The collated results from the testing can be found in Table 4-1 and in graphical form in Figure 4-1. It is evident that the consecutive loadings reduce the creep life of the copper, and 1000 h steps more than 168h steps. In Figure 4-2 and Figure 4-3 examples of the creep curves obtained are given. From Figure 4-3 it is evident that the higher the load, the shorter the lifetime even for a test with two increases in load which is as can be expected. It is also evident from Figure 4-1 that the longer the step load time, the shorter the creep life. This can also be seen in Figure 4-2 where the 1000 h step specimen shows shorter creep life than one loaded with 168 h steps. The same behaviour is exhibited by all three tested load levels.
Table 4-1. Test matrix and results. Note that the strains from second and third loading are included in the creep strain column. They are difficult to accurately distinguish from the normal creep due to logging sampling frequency.
Test ID
Procedure Total stress
Loading strain 1
Loading strain 2 *
Loading strain 3 *
Creep strain
Total strain
Creep time
Area red
Min creep rate 3
Strain measure-ment method **
Notes
[MPa] [%] [%] [%] [%] [%] [h] [%] [%/h]
P3 100 % load 165 10.90 21.1 32.0 11 520 0.0007 InternalP4 160 10.70 14.3 25.0 20 469 0.0005 Internal Interrupted
P2 80 % load à 90 % load à 100 % load, 168 h between steps.
168 10.90 0.58 4.86 33.6 44.5 2767 68.0 0.0026 ExternalP6 165 9.40 2.59 3.30 25.1 34.5 4299 0.0018 InternalP7 160 8.40 2.20 6.80 32.4 40.8 13 234 0.0026 External
N1 80 % load à 90 % load à 100 %load, 1000 h between steps.
168 11.10 0.70 3.18 34.6 45.7 2043 67.9 0.0032 ExternalN2 165 10.60 1.00 3.40 38.4 49.0 2681 66.7 0.1320 ExternalN3 160 12.10 1.40 0.60 39.4 51.5 2821 68.9 0.0037 External
* Loading strain 2 and 3 is included in the creep strain as the total strain is calculated.** Internal strain is measured on the specimen gauge length, external strain is measured on the pullrods and compensated for the compliance.
Figure 4-1. The creep results from the testing. Brackets denote still ongoing test.
14 SKB R-14-31
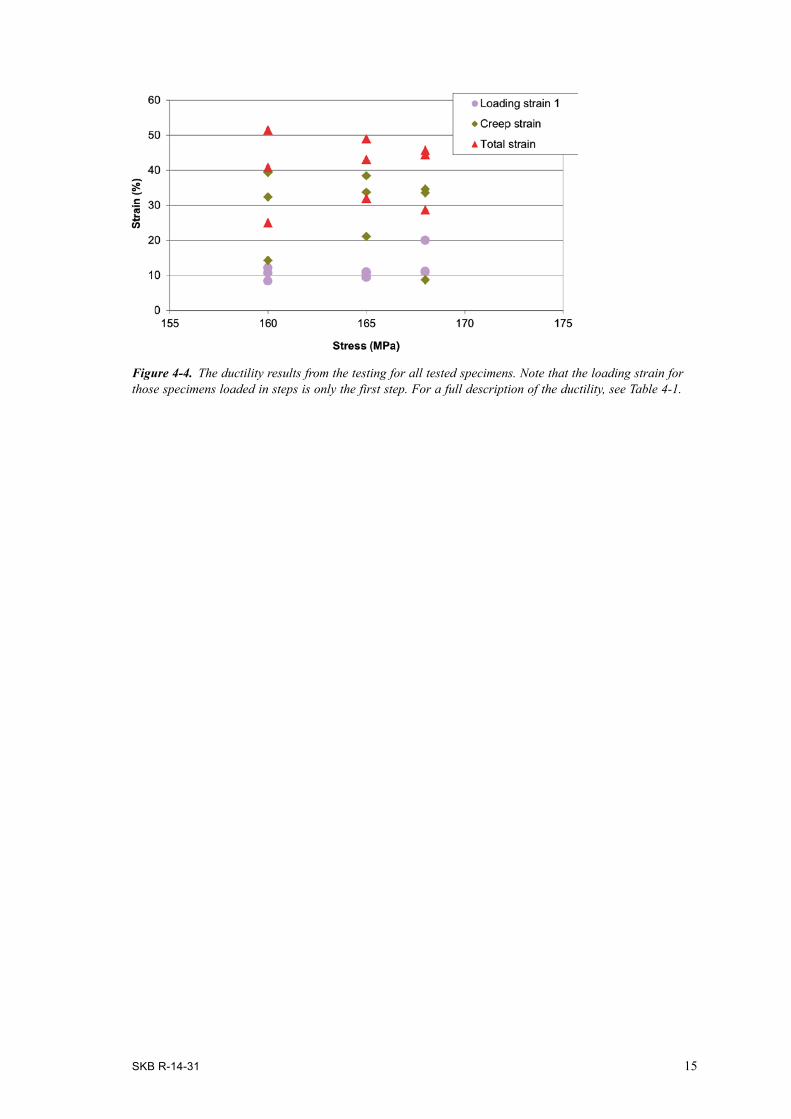
Total creep ductility is for all specimens around 40–50 %, Figure 4-4. For specimens with full load applied immediately the loading strain is around 10–20 % and a little lower for the initial loading step for the step loaded specimens. The total ductility seem low when compared to previous reported results (Andersson-Östling and Sandström 2009), but those specimens ruptured fully in contrast to these reported here which was stopped as the necking process was just beginning. The ductility would have been similar had these specimens been allowed to rupture.
Figure 4-2. Creep curves from test performed at 165 MPa and different loading steps.
Figure 4-3. Creep curves from tests performed using 168 h steps at different stresses.
SKB R-14-31 15
Figure 4-4. The ductility results from the testing for all tested specimens. Note that the loading strain for those specimens loaded in steps is only the first step. For a full description of the ductility, see Table 4-1.


SKB R-14-31 17
5 Discussion
The work presented in this investigation aims at studying the creep response of the phosphorous doped copper when subjected to increased load with long intervals between loadings. The result show that the creep life is reduced when compared to instantly loaded specimens at the same ulti-mate stress. This while the total ductility seems to reach the same measurement. The unexpected result is the behaviour of the strain when the step loading is performed. In Figure 4-2 the results from three tests performed at 165 MPa with different load steps is presented. It can be observed that the 168 h steps responds to each load step by presenting an “primary creep” load strain, i.e. the strain is similar to one where an unloaded specimen is loaded and the strain shows a logarithmic decreases after an initial fast strain. This is true for both the initial loading and the two 168 h step loadings. The 1000 h step load specimen has another shape. The last load step at 2000 h is at first “primary” in shape but rapidly changes to a “tertiary” shape, meaning that the logarithmic decreasing strain is replaced by an exponential increase in strain and final rupture. The intermediate load step at 1000 h is almost not visible as a small bump in the curve. The reason behind the behaviour is not clear. It seems that the response from the material is dependent on where in the creep curve the speci-men is. That means that if the specimen is in a primary stage of creep the response is a “primary” strain behaviour, if the specimen is in a tertiary stage the result is a sharply increased creep rate or “tertiary” rate and if the specimen is in the secondary stage, the result is a minimal strain increase.
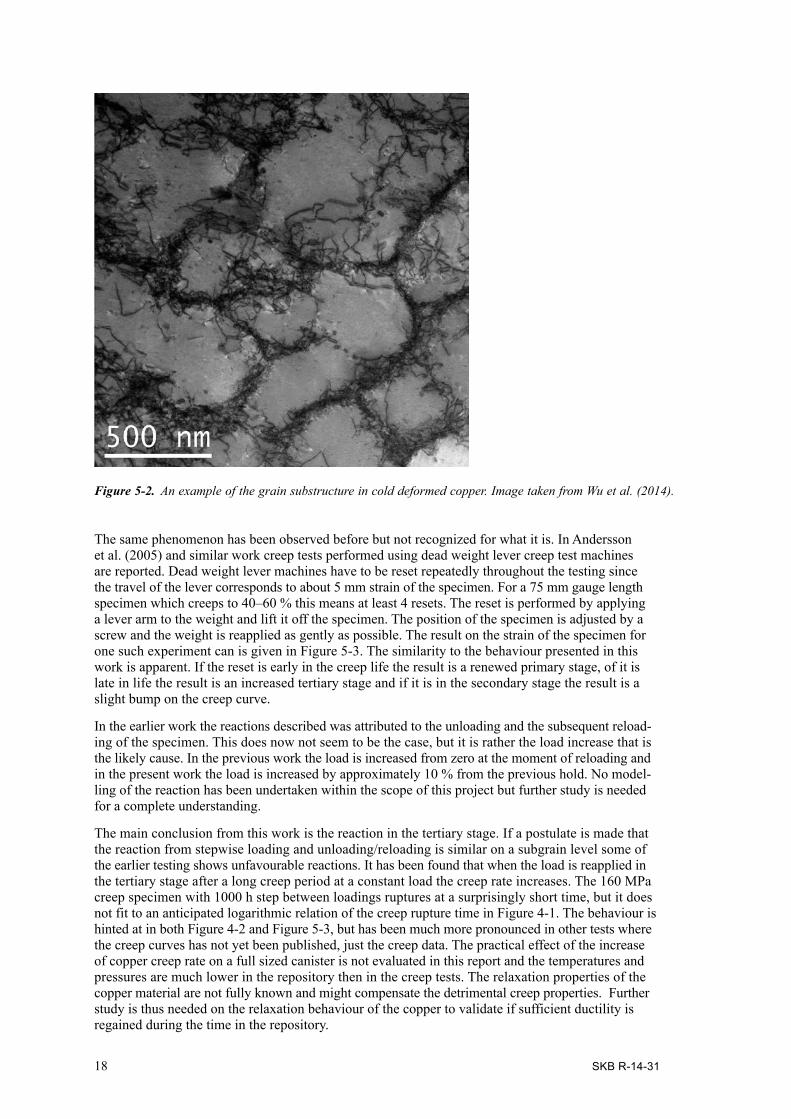
If the above mentioned phenomenon is valid the underlying mechanism must be the dislocation movement rate and the grain substructure. The creep curve as measured in the lab is distinguished by three different stages, primary secondary and tertiary, Figure 5-1. If cavity formation is discounted the reason for the three stages is the development of the grain substructure. The substructure is made up from dislocations bands which criss-cross the grains in three dimensions, Figure 5-2. The creep curve can now be viewed as the primary stage when the substructure is developing, the secondary stage in which the substructure is relatively constant and the third where the substructure is breaking up. This is a simplified view as it does not take cavity band crack formation into consideration, but it is sufficient for the discussion of the creep rates in the present work.
The hypothesis is as follows. If an increased load is applied when the specimen is in a primary stage the substructure is still developing and it adjusts to the new load by transforming to a new stress state. If the load is applied in the tertiary stage where the substructure is breaking up, the process is accelerated by the increased load. If the load is applied in the secondary stage where the work hardening (dislocation formation) is balanced by the creep recovery (dislocation annihilation) the increased load just adds a rate component to the already stable process.
Figure 5-1. A typical creep curve with primary, secondary and tertiary stages marked.
18 SKB R-14-31
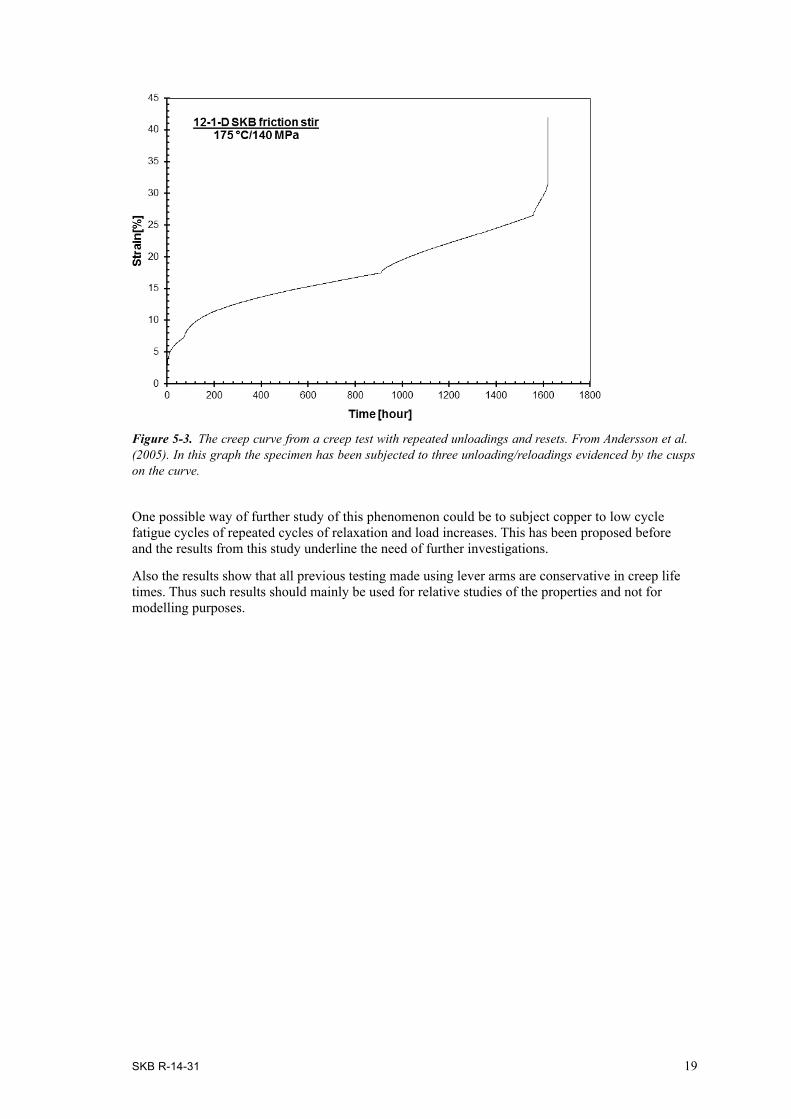
The same phenomenon has been observed before but not recognized for what it is. In Andersson et al. (2005) and similar work creep tests performed using dead weight lever creep test machines are reported. Dead weight lever machines have to be reset repeatedly throughout the testing since the travel of the lever corresponds to about 5 mm strain of the specimen. For a 75 mm gauge length specimen which creeps to 40–60 % this means at least 4 resets. The reset is performed by applying a lever arm to the weight and lift it off the specimen. The position of the specimen is adjusted by a screw and the weight is reapplied as gently as possible. The result on the strain of the specimen for one such experiment can is given in Figure 5-3. The similarity to the behaviour presented in this work is apparent. If the reset is early in the creep life the result is a renewed primary stage, of it is late in life the result is an increased tertiary stage and if it is in the secondary stage the result is a slight bump on the creep curve.
In the earlier work the reactions described was attributed to the unloading and the subsequent reload-ing of the specimen. This does now not seem to be the case, but it is rather the load increase that is the likely cause. In the previous work the load is increased from zero at the moment of reloading and in the present work the load is increased by approximately 10 % from the previous hold. No model-ling of the reaction has been undertaken within the scope of this project but further study is needed for a complete understanding.
The main conclusion from this work is the reaction in the tertiary stage. If a postulate is made that the reaction from stepwise loading and unloading/reloading is similar on a subgrain level some of the earlier testing shows unfavourable reactions. It has been found that when the load is reapplied in the tertiary stage after a long creep period at a constant load the creep rate increases. The 160 MPa creep specimen with 1000 h step between loadings ruptures at a surprisingly short time, but it does not fit to an anticipated logarithmic relation of the creep rupture time in Figure 4-1. The behaviour is hinted at in both Figure 4-2 and Figure 5-3, but has been much more pronounced in other tests where the creep curves has not yet been published, just the creep data. The practical effect of the increase of copper creep rate on a full sized canister is not evaluated in this report and the temperatures and pressures are much lower in the repository then in the creep tests. The relaxation properties of the copper material are not fully known and might compensate the detrimental creep properties. Further study is thus needed on the relaxation behaviour of the copper to validate if sufficient ductility is regained during the time in the repository.
Figure 5-2. An example of the grain substructure in cold deformed copper. Image taken from Wu et al. (2014).
SKB R-14-31 19
One possible way of further study of this phenomenon could be to subject copper to low cycle fatigue cycles of repeated cycles of relaxation and load increases. This has been proposed before and the results from this study underline the need of further investigations.
Also the results show that all previous testing made using lever arms are conservative in creep life times. Thus such results should mainly be used for relative studies of the properties and not for modelling purposes.
Figure 5-3. The creep curve from a creep test with repeated unloadings and resets. From Andersson et al. (2005). In this graph the specimen has been subjected to three unloading/reloadings evidenced by the cusps on the curve.

SKB R-14-31 21
6 Conclusions
From the results presented in this work the following conclusions can be made:
• A stepwise loading of the copper creep specimens decrease the overall creep life compared to a specimen not stepwise loaded to the same stress.
• The ductility measured for all specimens is similar to previous experiments on similar copper.
• A load increase when the specimen is in a primary stage of creep results in a renewed primary shape of the curve.
• In a similar way a load increase in the tertiary stage results in an increased tertiary response, and a load increase in the secondary stage results in a slight increase in creep rate.
• The reason for the responses is not immediately clear and need further study.

SKB R-14-31 23
References
SKB’s (Svensk Kärnbränslehantering AB) publications can be found at www.skb.com/publications. References to SKB’s unpublished documents are listed separately at the end of the reference list. Unpublished documents will be submitted upon request to [email protected].
Andersson H C M, Seitisleam F, Sandström R, 2005. Creep testing of thick-wall copper electron beam and friction stir welds at 75, 125 and 175 °C. SKB TR-05-08, Svensk Kärnbränslehantering AB.
Andersson-Östling H C M, Sandström R, 2009. Survey of creep properties of copper intended for nuclear waste disposal. SKB TR-09-32, Svensk Kärnbränslehantering AB.
Andersson-Östling H C M, Sandström R, 2011. Effect of loading rate on creep of phosphorous doped copper. SKB TR-11-09, Svensk Kärnbränslehantering AB.
ISO 204:2009. Metallic materials – Uniaxial creep testing in tension – Method of test. Geneva: International Organization for Standardization.
SKB, 2006. Kapsel för använt kärnbränsle. Konstruktionsförutsättningar. SKB R-06-02, Svensk Kärn bränsle hantering AB. (In Swedish.)
SKB, 2010. Design and production of the KBS-3 repository. SKB TR-10-12, Svensk Kärnbränsle-hantering AB.
Wu R, Pettersson N, Martinsson Å, Sandström R, 2014. Cell structure in cold worked and creep deformed phosphorus alloyed copper. Materials Characterization 90, 21–30.
Unpublished documentsAndersson-Östling H C M, 2013. Measurements of hardness and P, S and O levels in copper. KIMAB-2013-123, Swerea KIMAB AB. SKBdoc 1409401 ver 1.0, Svensk Kärnbränslehantering AB.
Related Documents