Geophys. J. Int. (2009) 179, 601–614 doi: 10.1111/j.1365-246X.2009.04302.x Stress aligned cracks in the upper crust of the Val d’Agri region as revealed by shear wave splitting M. Pastori, 1 D. Piccinini, 2 L. Margheriti, 3 L. Improta, 2 L. Valoroso, 3 L. Chiaraluce 3 and C. Chiarabba 3 1 Universit` a degli Studi di Perugia, Dipartimento di Scienze della Terra, Geologia struttutale e Geofisica, Perugia, Italy 2 Istituto Nazionale di Geofisica e Vulcanologia, Sismologia e Tettonofisica, Roma, Italy 3 Istituto Nazionale di Geofisica e Vulcanologia, Centro Nazionale Terremoti, Roma, Italy. E-mail: [email protected] Accepted 2009 June 17. Received 2009 June 15; in original form 2009 February 10 SUMMARY Shear wave splitting is measured at 19 seismic stations of a temporary network deployed in the Val d’Agri area to record low-magnitude seismic activity. The splitting results suggest the pres- ence of an anisotropic layer between the surface and 15 km depth (i.e. above the hypocentres). The dominant fast polarization direction strikes NW–SE parallel to the Apennines orogen and is approximately parallel to the maximum horizontal stress in the region, as well as to major normal faults bordering the Val d’Agri basin. The size of the normalized delay times in the study region is about 0.01 s km −1 , suggesting 4.5 percent shear wave velocity anisotropy (SWVA). On the south-western flank of the basin, where most of the seismicity occurs, we found larger values of normalized delay times, between 0.017 and 0.02 s km −1 . These high values suggest a 10 percent of SWVA. These parameters agree with an interpretation of seismic anisotropy in terms of the Extensive-Dilatancy Anisotropy (EDA) model that considers the rock volume pervaded by fluid-saturated microcracks aligned by the active stress field. Anisotropic parameters are con- sistent with borehole image logs from deep exploration wells in the Val d’Agri oil field that detect pervasive fluid saturated microcracks striking NW–SE parallel to the maximum hor- izontal stress in the carbonatic reservoir. However, we cannot rule out the contribution of aligned macroscopic fractures because the main Quaternary normal faults are parallel to the maximum horizontal stress. The strong anisotropy and the seismicity concentration testify for active deformation along the SW flank of the basin. Key words: Seismicity and tectonics; Seismic anisotropy; Crustal structure. INTRODUCTION The Val d’Agri area, in the Southern Apennines range of Italy (Fig. 1), has attracted the attention of geoscientists over the past two decades. The presence of oil fields, ranking as the largest in onshore Europe, and the high seismogenic potential documented by historical earthquakes motivated geophysical investigations that focus on the subsurface structure and seismotectonics (Cucci et al. 2004; Shiner et al. 2004). The Val d’Agri oil field, discovered in the late 1980s along the north-eastern part of the valley (Fig. 2), is characterized by high flow rates, with oil and associated gas spilled from a Cretaceous limestone and dolomite reservoir hosted in the Apulia Platform (Holton 1999). Traditional well logging and advanced borehole imaging tools have been used to improve the understanding of the fracture production mechanisms and the relationship with the stress field (Trice 1999; Shiner et al. 2004). Apart conventional studies of fractured reservoir properties de- veloped by oil industries, seismology may be seen as a tool to reveal how much the upper crust is cracked (Barton & Zoback 1994). Seis- mic anisotropy is a commonly observed property of the Earth’s crust (Crampin & Chastin 2003) and is quantifiable by the shear wave splitting, equivalent to the birefringence in optics. When a seismic shear wave travels through an anisotropic medium, its energy is split into two components with orthogonal polarization directions that travel at different velocities. The polarization direction of the fastest wave is called fast direction (φ) and the lag of the slower wave is the delay time (δt). There are, at least, two main interpretations for shear wave split- ting in the crust (Crampin & Lovell 1991): the presence of fluid- saturated microcraks or fractures, aligned or opened by the ac- tive stress field; or the intrinsic structural fabric due to the aligned macroscopic fractures or anisotropic minerals (the latter is gen- erally found in metamorphic rocks and in its foliation, Brocher C 2009 The Authors 601 Journal compilation C 2009 RAS

Welcome message from author
This document is posted to help you gain knowledge. Please leave a comment to let me know what you think about it! Share it to your friends and learn new things together.
Transcript
Geophys. J. Int. (2009) 179, 601–614 doi: 10.1111/j.1365-246X.2009.04302.x
Stress aligned cracks in the upper crust of the Val d’Agri regionas revealed by shear wave splitting
M. Pastori,1 D. Piccinini,2 L. Margheriti,3 L. Improta,2 L. Valoroso,3 L. Chiaraluce3
and C. Chiarabba3
1Universita degli Studi di Perugia, Dipartimento di Scienze della Terra, Geologia struttutale e Geofisica, Perugia, Italy2Istituto Nazionale di Geofisica e Vulcanologia, Sismologia e Tettonofisica, Roma, Italy3Istituto Nazionale di Geofisica e Vulcanologia, Centro Nazionale Terremoti, Roma, Italy. E-mail: [email protected]
Accepted 2009 June 17. Received 2009 June 15; in original form 2009 February 10
S U M M A R YShear wave splitting is measured at 19 seismic stations of a temporary network deployed in theVal d’Agri area to record low-magnitude seismic activity. The splitting results suggest the pres-ence of an anisotropic layer between the surface and 15 km depth (i.e. above the hypocentres).The dominant fast polarization direction strikes NW–SE parallel to the Apennines orogen andis approximately parallel to the maximum horizontal stress in the region, as well as to majornormal faults bordering the Val d’Agri basin. The size of the normalized delay times in thestudy region is about 0.01 s km−1, suggesting 4.5 per cent shear wave velocity anisotropy(SWVA). On the south-western flank of the basin, where most of the seismicity occurs, wefound larger values of normalized delay times, between 0.017 and 0.02 s km−1. These highvalues suggest a 10 per cent of SWVA.
These parameters agree with an interpretation of seismic anisotropy in terms of theExtensive-Dilatancy Anisotropy (EDA) model that considers the rock volume pervaded byfluid-saturated microcracks aligned by the active stress field. Anisotropic parameters are con-sistent with borehole image logs from deep exploration wells in the Val d’Agri oil field thatdetect pervasive fluid saturated microcracks striking NW–SE parallel to the maximum hor-izontal stress in the carbonatic reservoir. However, we cannot rule out the contribution ofaligned macroscopic fractures because the main Quaternary normal faults are parallel to themaximum horizontal stress.
The strong anisotropy and the seismicity concentration testify for active deformation alongthe SW flank of the basin.
Key words: Seismicity and tectonics; Seismic anisotropy; Crustal structure.
I N T RO D U C T I O N
The Val d’Agri area, in the Southern Apennines range of Italy(Fig. 1), has attracted the attention of geoscientists over the pasttwo decades. The presence of oil fields, ranking as the largest inonshore Europe, and the high seismogenic potential documentedby historical earthquakes motivated geophysical investigations thatfocus on the subsurface structure and seismotectonics (Cucci et al.2004; Shiner et al. 2004).
The Val d’Agri oil field, discovered in the late 1980s along thenorth-eastern part of the valley (Fig. 2), is characterized by highflow rates, with oil and associated gas spilled from a Cretaceouslimestone and dolomite reservoir hosted in the Apulia Platform(Holton 1999). Traditional well logging and advanced boreholeimaging tools have been used to improve the understanding of thefracture production mechanisms and the relationship with the stressfield (Trice 1999; Shiner et al. 2004).
Apart conventional studies of fractured reservoir properties de-veloped by oil industries, seismology may be seen as a tool to revealhow much the upper crust is cracked (Barton & Zoback 1994). Seis-mic anisotropy is a commonly observed property of the Earth’s crust(Crampin & Chastin 2003) and is quantifiable by the shear wavesplitting, equivalent to the birefringence in optics. When a seismicshear wave travels through an anisotropic medium, its energy issplit into two components with orthogonal polarization directionsthat travel at different velocities. The polarization direction of thefastest wave is called fast direction (φ) and the lag of the slowerwave is the delay time (δt).
There are, at least, two main interpretations for shear wave split-ting in the crust (Crampin & Lovell 1991): the presence of fluid-saturated microcraks or fractures, aligned or opened by the ac-tive stress field; or the intrinsic structural fabric due to the alignedmacroscopic fractures or anisotropic minerals (the latter is gen-erally found in metamorphic rocks and in its foliation, Brocher
C© 2009 The Authors 601Journal compilation C© 2009 RAS
602 M. Pastori et al.
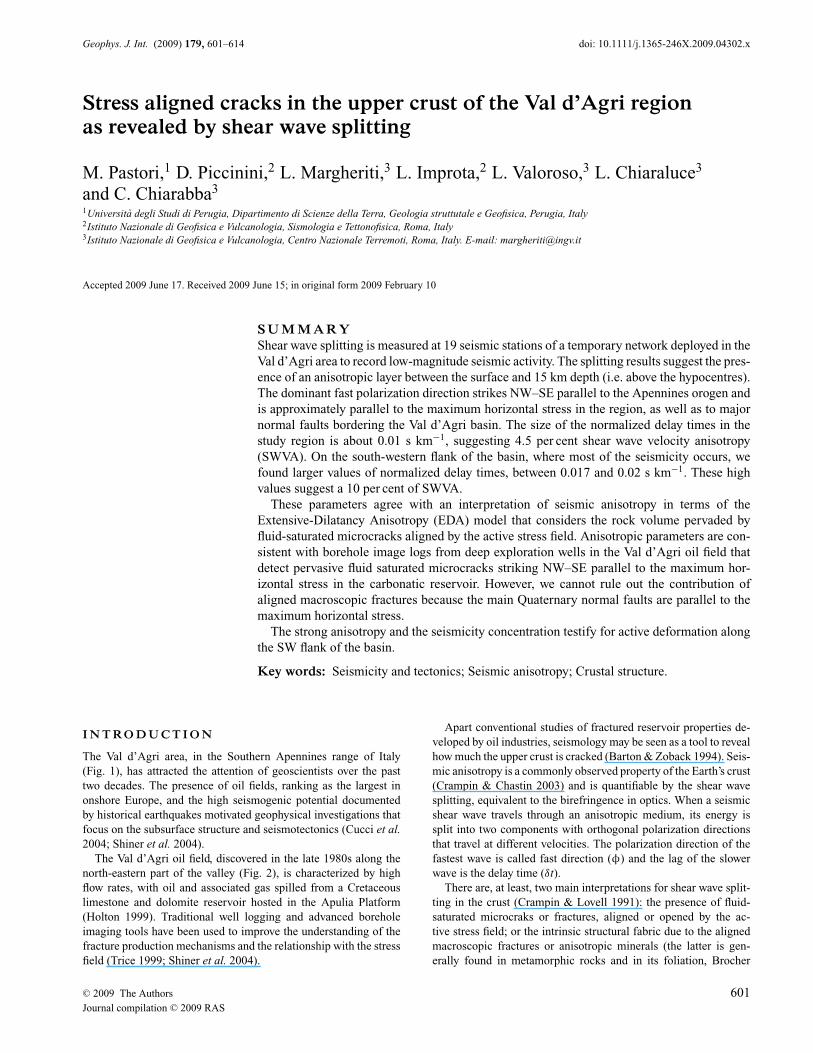
Figure 1. Topographic map of the southern sector of the Southern Apennines (PM: Pergola–Melandro basin, AV: Agri Valley basin, DV: Diano Valley) withhistorical (squares) and instrumental seismicity (dots). The black lines represent the orientation of minimum horizontal stress from stress indicators (modifiedafter Cucci et al. 2004).
et al. 1990). In the first hypothesis, φ is typically polarized par-allel to the direction of maximum horizontal stress, as suggestedby the Extensive-Dilatancy Anisotropy model (EDA; see Crampin1978) and δt is a measure of the intensity and/or thickness of thefracture field. Thus, the dominant fracture direction and the crackdensity and subsequently the horizontal maximum stress direction,can be estimated from anisotropic parameters. On the other hand ifanisotropy is caused by intrinsic structural fabric, as macroscopicaligned fracture field or aligned anisotropic minerals φ is parallelto the strike of the fractures or to the mineral alignment and is notrelated to the active stress field whereas δt, measures the fabricstrength (Zinke & Zoback 2000).
In this paper, we investigate crustal anisotropy of the Val d’Agriregion by performing shear wave splitting analysis on micro-earthquakes recorded by a dense temporary network. Seismicanisotropy can yield valuable information on upper crustal structureand fracture field to be compared to borehole image logs from deepexploration wells, available in this region, for an improved under-standing of the origins of shear wave splitting of the local stressfield and of faulting processes active in the area.
G E O L O G I C A L A N D S E I S M O L O G I C A LS E T T I N G
The Val d’Agri is a Quaternary extensional basin located in the axialzone of the Southern Apennines (Fig. 1), a NE-verging thrust-belt
resulting from the Miocene–Early Pleistocene deformation of basinand shelf domains (Dewey et al. 1989; Patacca & Scandone 1989).
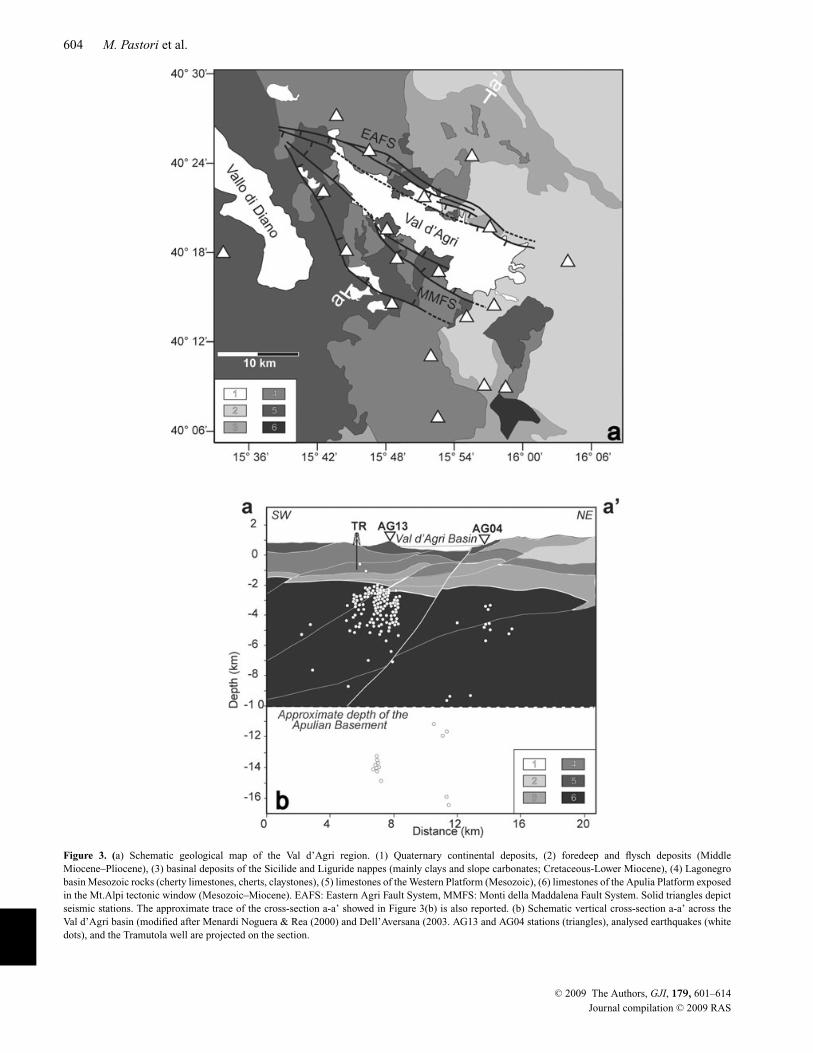
The basin is elongated about N120◦ and approximately 30 kmlong and 5 km wide (Figs 2 and 3a). The basin infill, that con-sists of continental deposits up to 500 m thick, is emplaced on acomplex thrust-and-fold system (Fig. 3b) deeply explored by com-mercial reflection profiles and wells (Menardi Noguera & Rea 2000;Dell’Aversana 2003; Shiner et al. 2004). Hydrocarbon explorationshows that the shallow architecture of the thrust-and-fold systemderives from a poli-phase tectonic history (Menardi Noguera & Rea2000; Shiner et al. 2004; Catalano et al. 2004). Thin-skinned tec-tonics was responsible for the building up because Middle Miocenetimes of a pile of rootless nappe, which is actually drilled down to2–4 km below sea level. Mesozoic carbonates of the Western Car-bonate Platform overthrust coeval pelagic sequences of the Lagone-gro basin (mainly consisting of cherty-limestones and cherts), whichin turn overlay tectonically deeply deformed Mio-Pliocene foredeepdeposits (Shiner et al. 2004). This stack of thrust-sheets overthrustedwith an overall E-vergence shelf limestones of the Apulia Platformup to 7 km thick, that underwent thick-skinned tectonics during LatePliocene–Early Pleistocene times (Menardi Noguera & Rea 2000).
Lacking evidence of a large-scale involvement of crystallinethrust-sheets of the Paleozoic basement within the shallow belt,the upper crust consists of a stack of sedimentary units at least10 km thick. Consequently, we cannot expect any preferred orienta-tion of crystals in the investigated crust, and hence, we can assume
C© 2009 The Authors, GJI, 179, 601–614
Journal compilation C© 2009 RAS
Stress aligned cracks by shear wave splitting 603
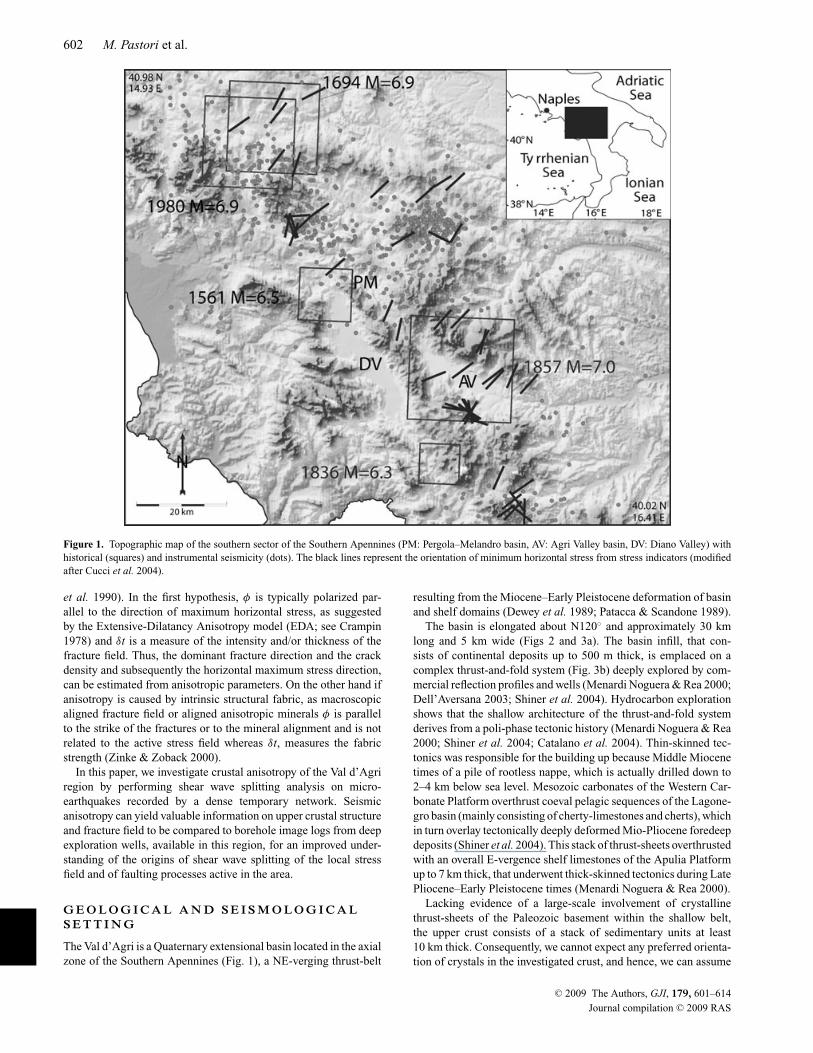
Figure 2. Distribution of seismic stations (triangles), location of events analysed in this study (dots) and distribution of the main quaternary fault systems(MMFS: Monti della Maddalena Fault System, EAFS: eastern Agri Fault System and MAF: Monte Aquila Fault). Val d’Agri oil field and location of Tramutolawell (TR) are also reported.
that only fluid filled cracks and fractures should be responsible forseismic anisotropy in the crust of the area.
The Southern Apennines is among the areas of peninsular Italywith the highest seismogenic potential. Present-day seismicity con-centrates along the range axis and defines an about 30 km wide and15 km deep seismic belt (Chiarabba et al. 2005). Historical seismic-ity catalogues (e.g. Boschi et al. 2000; Valensise & Pantosti 2001)report two destructive events in the investigated area: the 1857 Me7.0 destructive earthquake (with about 11 000 casualties, Burrato& Valensise 2008; and reference therein), localized just in centralAgri Valley, and the 1561 Me 6.5 event localized about 15 km to thenorth-west in the Pergola–Melandro basin (Fig. 1). Crustal seismic-ity is related to a NE–SW extension stress regime well documentedby all stress indicators, as the T-axes inferred from moment tensorsand focal mechanisms of moderate-large earthquakes (Gaspariniet al. 1982; Pondrelli et al. 2006), borehole breakouts analysis(Amato & Montone 1997) and GPS measurements (Hunstad et al.2003; Serpelloni et al. 2005). Structural data and stress indicatorsdelineate a quite homogeneous local stress field, consistent withthe regional SW–NE extension (Fig. 1; Cucci et al. 2004; Maschioet al. 2005).
During the first phase (Lower Plestocene), the genesis and evo-lution of the Val d’Agri were driven by a system of SW-dippingtranstensive faults bounding the valley to the NE (here on after,Eastern Agri Fault System; EAFS in Figs 2 and 3a). Two contrastingseismotectonic models are present in literature for the recent evo-lution and seismogenic potential of active faults. Most of authors(Benedetti et al. 1998; Mazzoli et al. 2000; Michetti et al. 2000;Cello et al. 2000, 2003; Barchi et al. 2007) interpret the EAFS,
which attains to mature geomorphic and structural signatures, asthe main driving structure of the area. In particular, Benedetti et al.(1998) consider this structure as causative fault of the 1857 earth-quake. Conversely, Maschio et al. (2005) present an alternativemodel, in which the basin evolution of the basin has been controlledbecause Upper Pleistocene by a NE-dipping normal-fault systemrecognized to the west of the basin, along the Maddalena ridge(here on after, Monti Maddalena Fault System; MMFS in Figs 2and 3a). This structure, whose recent faulting activity is also in-ferred by high-resolution seismics prospecting (Improta & Bruno2007) and paleoseismic trenches (D’Addezio et al. 2006), is quotedas the main fault of the area (Maschio et al. 2005). Passive seis-mic data corroborate this hypothesis, highlighting the presence ofmicro-seismicity aligned on a NW-trending, NE-dipping fault be-tween 1 and 6 km depth that can be related to southern splays of theMMFS (Valoroso et al. 2009).
S H E A R WAV E S P L I T T I N G DATAA N D M E T H O D
We analyse a dataset recorded by a dense temporary seismic net-work during a 13 months long experiment. The network is composedby 19 portable stations (Fig. 2) equipped with digital acquisitionsystems (Reftek130 and Marslite88) and three-component short pe-riod sensors (Lennartz 3D-1s and 5s) continuously-recording with asampling rate of 125 Hz. Around 2000 low-magnitude earthquakes(−0.2 < ML < 2.7) were recorded, from May 2005 to June 2006(Valoroso et al. 2009). Micro-earthquakes preferentially
C© 2009 The Authors, GJI, 179, 601–614
Journal compilation C© 2009 RAS
604 M. Pastori et al.
Figure 3. (a) Schematic geological map of the Val d’Agri region. (1) Quaternary continental deposits, (2) foredeep and flysch deposits (MiddleMiocene–Pliocene), (3) basinal deposits of the Sicilide and Liguride nappes (mainly clays and slope carbonates; Cretaceous-Lower Miocene), (4) Lagonegrobasin Mesozoic rocks (cherty limestones, cherts, claystones), (5) limestones of the Western Platform (Mesozoic), (6) limestones of the Apulia Platform exposedin the Mt.Alpi tectonic window (Mesozoic–Miocene). EAFS: Eastern Agri Fault System, MMFS: Monti della Maddalena Fault System. Solid triangles depictseismic stations. The approximate trace of the cross-section a-a’ showed in Figure 3(b) is also reported. (b) Schematic vertical cross-section a-a’ across theVal d’Agri basin (modified after Menardi Noguera & Rea (2000) and Dell’Aversana (2003. AG13 and AG04 stations (triangles), analysed earthquakes (whitedots), and the Tramutola well are projected on the section.
C© 2009 The Authors, GJI, 179, 601–614
Journal compilation C© 2009 RAS
Stress aligned cracks by shear wave splitting 605
concentrate at shallow depth (1–6 km) along the south-westernmargin of the Val d’Agri basin. Sparse earthquakes occur in thearea above 15 km depth.
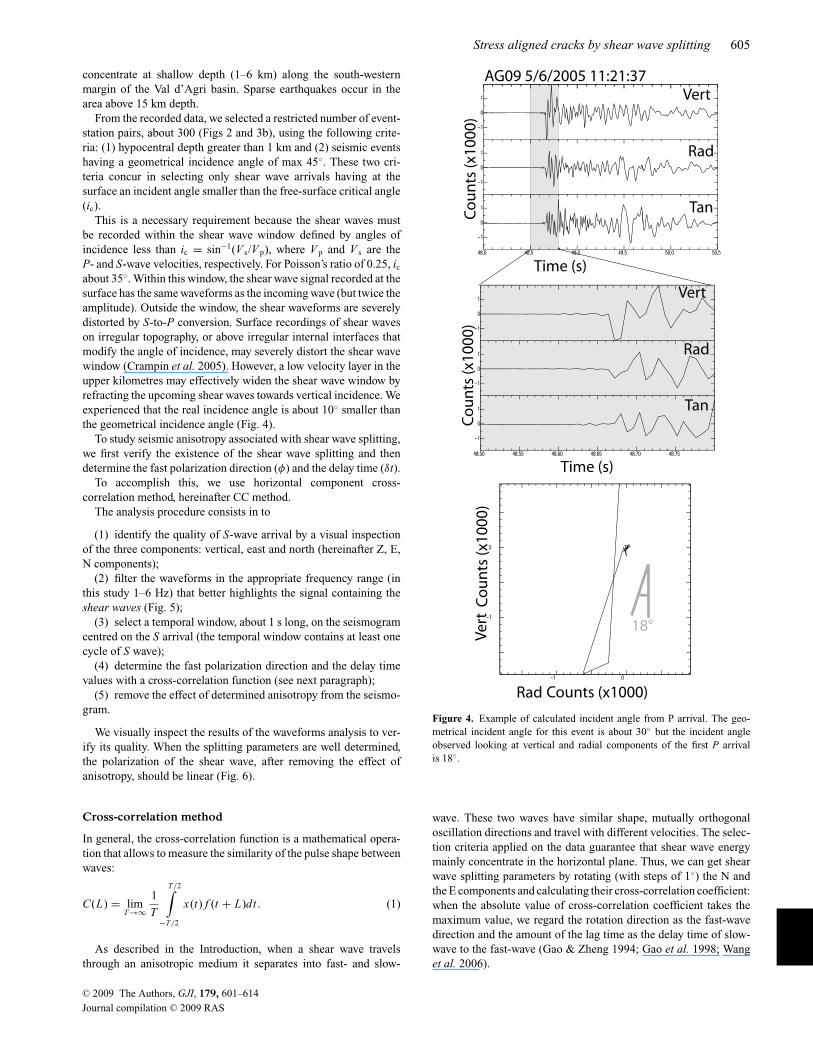
From the recorded data, we selected a restricted number of event-station pairs, about 300 (Figs 2 and 3b), using the following crite-ria: (1) hypocentral depth greater than 1 km and (2) seismic eventshaving a geometrical incidence angle of max 45◦. These two cri-teria concur in selecting only shear wave arrivals having at thesurface an incident angle smaller than the free-surface critical angle(ic).
This is a necessary requirement because the shear waves mustbe recorded within the shear wave window defined by angles ofincidence less than ic = sin−1(V s/V p), where V p and V s are theP- and S-wave velocities, respectively. For Poisson’s ratio of 0.25, ic
about 35◦. Within this window, the shear wave signal recorded at thesurface has the same waveforms as the incoming wave (but twice theamplitude). Outside the window, the shear waveforms are severelydistorted by S-to-P conversion. Surface recordings of shear waveson irregular topography, or above irregular internal interfaces thatmodify the angle of incidence, may severely distort the shear wavewindow (Crampin et al. 2005). However, a low velocity layer in theupper kilometres may effectively widen the shear wave window byrefracting the upcoming shear waves towards vertical incidence. Weexperienced that the real incidence angle is about 10◦ smaller thanthe geometrical incidence angle (Fig. 4).
To study seismic anisotropy associated with shear wave splitting,we first verify the existence of the shear wave splitting and thendetermine the fast polarization direction (φ) and the delay time (δt).
To accomplish this, we use horizontal component cross-correlation method, hereinafter CC method.
The analysis procedure consists in to
(1) identify the quality of S-wave arrival by a visual inspectionof the three components: vertical, east and north (hereinafter Z, E,N components);
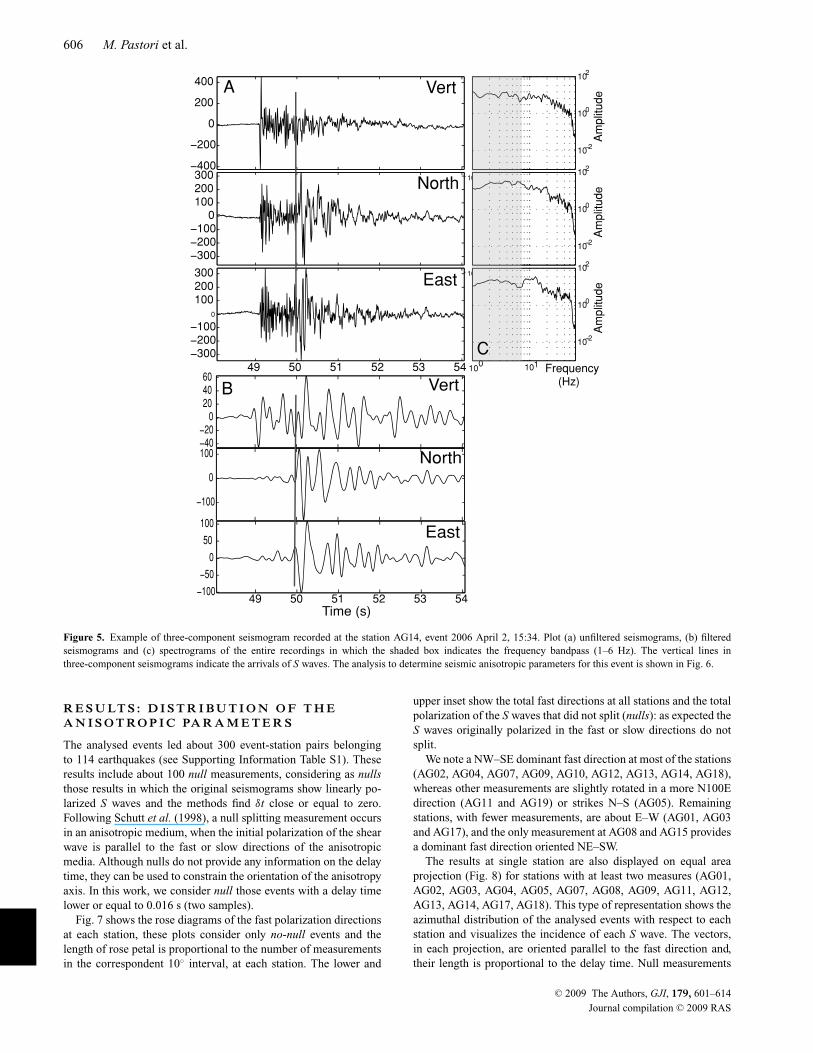
(2) filter the waveforms in the appropriate frequency range (inthis study 1–6 Hz) that better highlights the signal containing theshear waves (Fig. 5);
(3) select a temporal window, about 1 s long, on the seismogramcentred on the S arrival (the temporal window contains at least onecycle of S wave);
(4) determine the fast polarization direction and the delay timevalues with a cross-correlation function (see next paragraph);
(5) remove the effect of determined anisotropy from the seismo-gram.
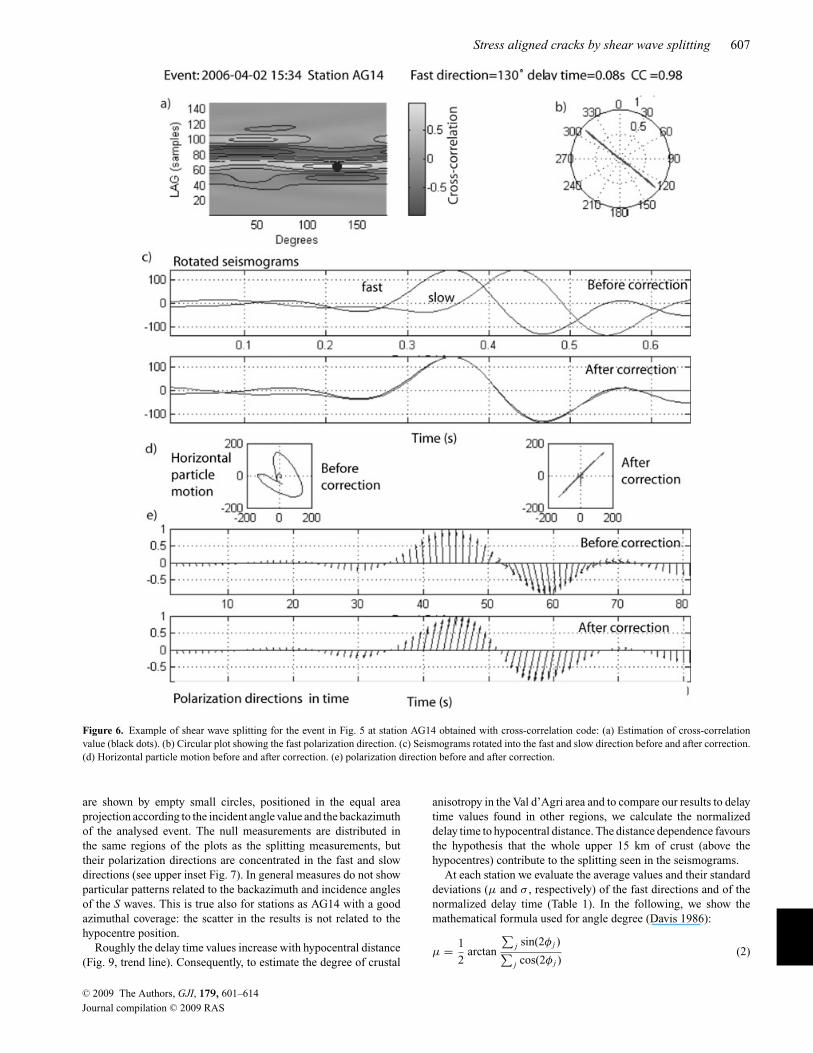
We visually inspect the results of the waveforms analysis to ver-ify its quality. When the splitting parameters are well determined,the polarization of the shear wave, after removing the effect ofanisotropy, should be linear (Fig. 6).
Cross-correlation method
In general, the cross-correlation function is a mathematical opera-tion that allows to measure the similarity of the pulse shape betweenwaves:
C(L) = limT →∞
1
T
T/2∫
−T/2
x(t) f (t + L)dt . (1)
As described in the Introduction, when a shear wave travelsthrough an anisotropic medium it separates into fast- and slow-
Figure 4. Example of calculated incident angle from P arrival. The geo-metrical incident angle for this event is about 30◦ but the incident angleobserved looking at vertical and radial components of the first P arrivalis 18◦.
wave. These two waves have similar shape, mutually orthogonaloscillation directions and travel with different velocities. The selec-tion criteria applied on the data guarantee that shear wave energymainly concentrate in the horizontal plane. Thus, we can get shearwave splitting parameters by rotating (with steps of 1◦) the N andthe E components and calculating their cross-correlation coefficient:when the absolute value of cross-correlation coefficient takes themaximum value, we regard the rotation direction as the fast-wavedirection and the amount of the lag time as the delay time of slow-wave to the fast-wave (Gao & Zheng 1994; Gao et al. 1998; Wanget al. 2006).
C© 2009 The Authors, GJI, 179, 601–614
Journal compilation C© 2009 RAS
606 M. Pastori et al.
Figure 5. Example of three-component seismogram recorded at the station AG14, event 2006 April 2, 15:34. Plot (a) unfiltered seismograms, (b) filteredseismograms and (c) spectrograms of the entire recordings in which the shaded box indicates the frequency bandpass (1–6 Hz). The vertical lines inthree-component seismograms indicate the arrivals of S waves. The analysis to determine seismic anisotropic parameters for this event is shown in Fig. 6.
R E S U LT S : D I S T R I B U T I O N O F T H EA N I S O T RO P I C PA R A M E T E R S
The analysed events led about 300 event-station pairs belongingto 114 earthquakes (see Supporting Information Table S1). Theseresults include about 100 null measurements, considering as nullsthose results in which the original seismograms show linearly po-larized S waves and the methods find δt close or equal to zero.Following Schutt et al. (1998), a null splitting measurement occursin an anisotropic medium, when the initial polarization of the shearwave is parallel to the fast or slow directions of the anisotropicmedia. Although nulls do not provide any information on the delaytime, they can be used to constrain the orientation of the anisotropyaxis. In this work, we consider null those events with a delay timelower or equal to 0.016 s (two samples).
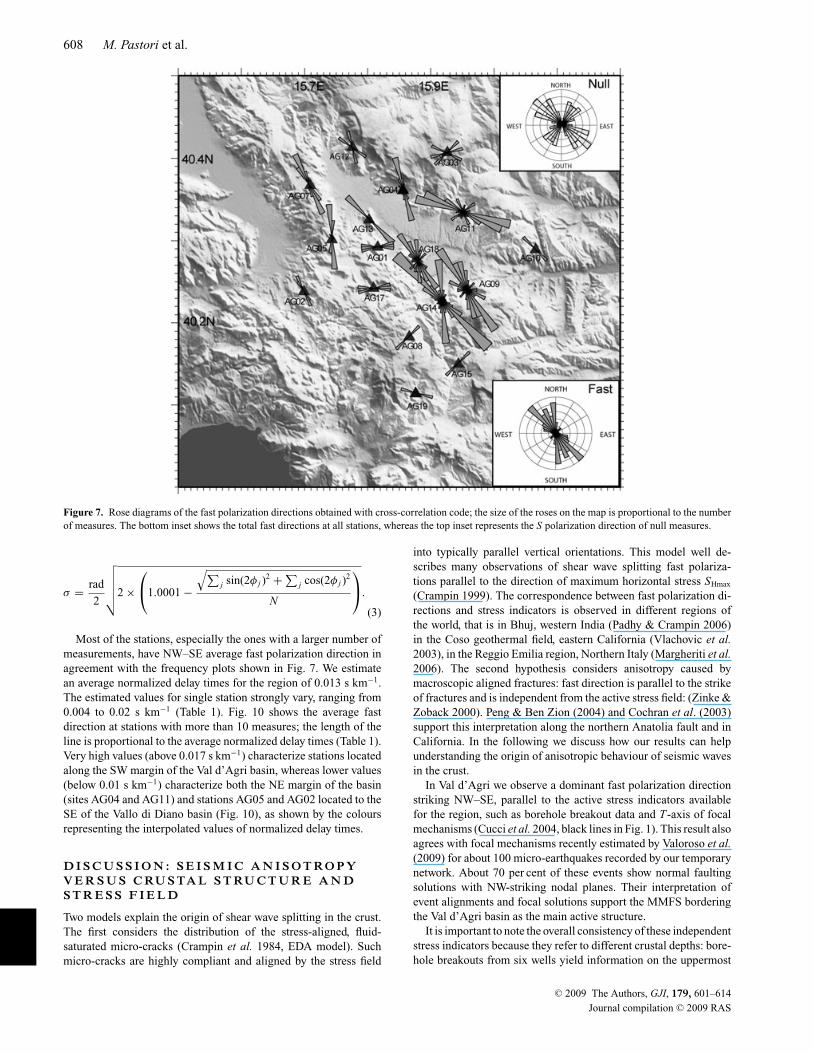
Fig. 7 shows the rose diagrams of the fast polarization directionsat each station, these plots consider only no-null events and thelength of rose petal is proportional to the number of measurementsin the correspondent 10◦ interval, at each station. The lower and
upper inset show the total fast directions at all stations and the totalpolarization of the S waves that did not split (nulls): as expected theS waves originally polarized in the fast or slow directions do notsplit.
We note a NW–SE dominant fast direction at most of the stations(AG02, AG04, AG07, AG09, AG10, AG12, AG13, AG14, AG18),whereas other measurements are slightly rotated in a more N100Edirection (AG11 and AG19) or strikes N–S (AG05). Remainingstations, with fewer measurements, are about E–W (AG01, AG03and AG17), and the only measurement at AG08 and AG15 providesa dominant fast direction oriented NE–SW.
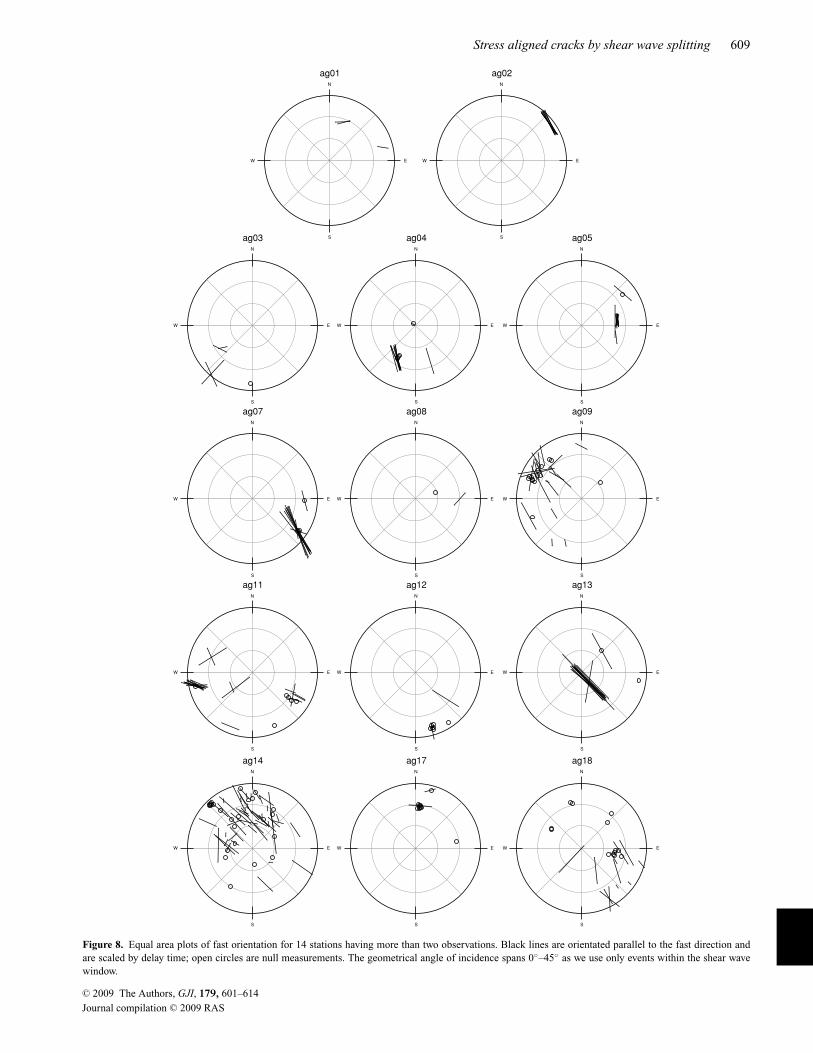
The results at single station are also displayed on equal areaprojection (Fig. 8) for stations with at least two measures (AG01,AG02, AG03, AG04, AG05, AG07, AG08, AG09, AG11, AG12,AG13, AG14, AG17, AG18). This type of representation shows theazimuthal distribution of the analysed events with respect to eachstation and visualizes the incidence of each S wave. The vectors,in each projection, are oriented parallel to the fast direction and,their length is proportional to the delay time. Null measurements
C© 2009 The Authors, GJI, 179, 601–614
Journal compilation C© 2009 RAS
Stress aligned cracks by shear wave splitting 607
Figure 6. Example of shear wave splitting for the event in Fig. 5 at station AG14 obtained with cross-correlation code: (a) Estimation of cross-correlationvalue (black dots). (b) Circular plot showing the fast polarization direction. (c) Seismograms rotated into the fast and slow direction before and after correction.(d) Horizontal particle motion before and after correction. (e) polarization direction before and after correction.
are shown by empty small circles, positioned in the equal areaprojection according to the incident angle value and the backazimuthof the analysed event. The null measurements are distributed inthe same regions of the plots as the splitting measurements, buttheir polarization directions are concentrated in the fast and slowdirections (see upper inset Fig. 7). In general measures do not showparticular patterns related to the backazimuth and incidence anglesof the S waves. This is true also for stations as AG14 with a goodazimuthal coverage: the scatter in the results is not related to thehypocentre position.
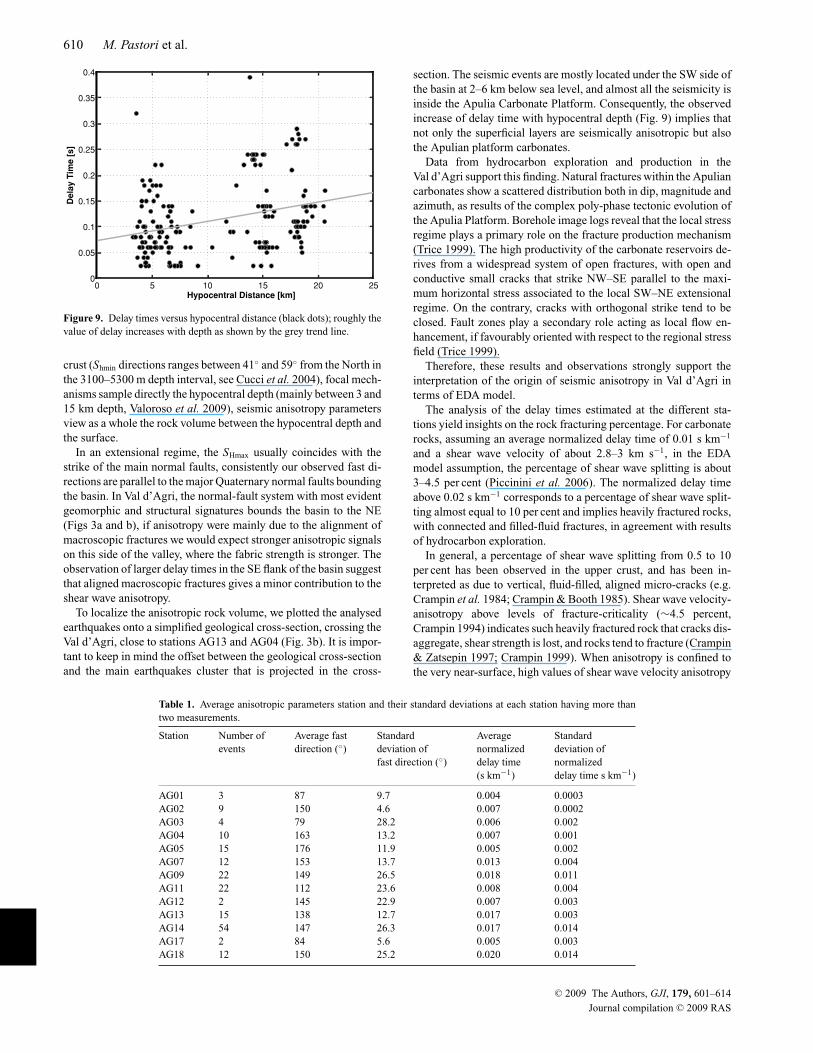
Roughly the delay time values increase with hypocentral distance(Fig. 9, trend line). Consequently, to estimate the degree of crustal
anisotropy in the Val d’Agri area and to compare our results to delaytime values found in other regions, we calculate the normalizeddelay time to hypocentral distance. The distance dependence favoursthe hypothesis that the whole upper 15 km of crust (above thehypocentres) contribute to the splitting seen in the seismograms.
At each station we evaluate the average values and their standarddeviations (μ and σ , respectively) of the fast directions and of thenormalized delay time (Table 1). In the following, we show themathematical formula used for angle degree (Davis 1986):
μ = 1
2arctan
∑j sin(2φ j )∑j cos(2φ j )
(2)
C© 2009 The Authors, GJI, 179, 601–614
Journal compilation C© 2009 RAS
608 M. Pastori et al.
Figure 7. Rose diagrams of the fast polarization directions obtained with cross-correlation code; the size of the roses on the map is proportional to the numberof measures. The bottom inset shows the total fast directions at all stations, whereas the top inset represents the S polarization direction of null measures.
σ = rad
2
√√√√√2 ×⎛⎝1.0001 −
√∑j sin(2φ j )
2 + ∑j cos(2φ j )
2
N
⎞⎠.
(3)
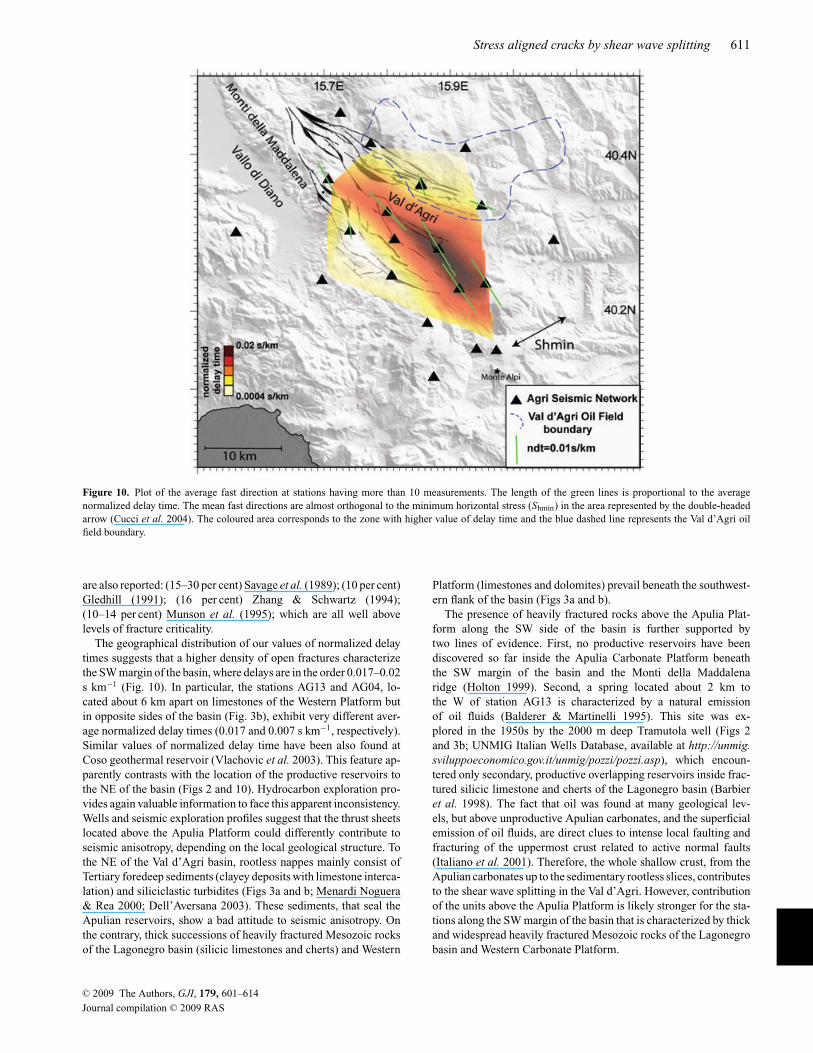
Most of the stations, especially the ones with a larger number ofmeasurements, have NW–SE average fast polarization direction inagreement with the frequency plots shown in Fig. 7. We estimatean average normalized delay times for the region of 0.013 s km−1.The estimated values for single station strongly vary, ranging from0.004 to 0.02 s km−1 (Table 1). Fig. 10 shows the average fastdirection at stations with more than 10 measures; the length of theline is proportional to the average normalized delay times (Table 1).Very high values (above 0.017 s km−1) characterize stations locatedalong the SW margin of the Val d’Agri basin, whereas lower values(below 0.01 s km−1) characterize both the NE margin of the basin(sites AG04 and AG11) and stations AG05 and AG02 located to theSE of the Vallo di Diano basin (Fig. 10), as shown by the coloursrepresenting the interpolated values of normalized delay times.
D I S C U S S I O N : S E I S M I C A N I S O T RO P YV E R S U S C RU S TA L S T RU C T U R E A N DS T R E S S F I E L D
Two models explain the origin of shear wave splitting in the crust.The first considers the distribution of the stress-aligned, fluid-saturated micro-cracks (Crampin et al. 1984, EDA model). Suchmicro-cracks are highly compliant and aligned by the stress field
into typically parallel vertical orientations. This model well de-scribes many observations of shear wave splitting fast polariza-tions parallel to the direction of maximum horizontal stress SHmax
(Crampin 1999). The correspondence between fast polarization di-rections and stress indicators is observed in different regions ofthe world, that is in Bhuj, western India (Padhy & Crampin 2006)in the Coso geothermal field, eastern California (Vlachovic et al.2003), in the Reggio Emilia region, Northern Italy (Margheriti et al.2006). The second hypothesis considers anisotropy caused bymacroscopic aligned fractures: fast direction is parallel to the strikeof fractures and is independent from the active stress field: (Zinke &Zoback 2000). Peng & Ben Zion (2004) and Cochran et al. (2003)support this interpretation along the northern Anatolia fault and inCalifornia. In the following we discuss how our results can helpunderstanding the origin of anisotropic behaviour of seismic wavesin the crust.
In Val d’Agri we observe a dominant fast polarization directionstriking NW–SE, parallel to the active stress indicators availablefor the region, such as borehole breakout data and T-axis of focalmechanisms (Cucci et al. 2004, black lines in Fig. 1). This result alsoagrees with focal mechanisms recently estimated by Valoroso et al.(2009) for about 100 micro-earthquakes recorded by our temporarynetwork. About 70 per cent of these events show normal faultingsolutions with NW-striking nodal planes. Their interpretation ofevent alignments and focal solutions support the MMFS borderingthe Val d’Agri basin as the main active structure.
It is important to note the overall consistency of these independentstress indicators because they refer to different crustal depths: bore-hole breakouts from six wells yield information on the uppermost
C© 2009 The Authors, GJI, 179, 601–614
Journal compilation C© 2009 RAS
Stress aligned cracks by shear wave splitting 609
Figure 8. Equal area plots of fast orientation for 14 stations having more than two observations. Black lines are orientated parallel to the fast direction andare scaled by delay time; open circles are null measurements. The geometrical angle of incidence spans 0◦–45◦ as we use only events within the shear wavewindow.
C© 2009 The Authors, GJI, 179, 601–614
Journal compilation C© 2009 RAS
610 M. Pastori et al.
Figure 9. Delay times versus hypocentral distance (black dots); roughly thevalue of delay increases with depth as shown by the grey trend line.
crust (Shmin directions ranges between 41◦ and 59◦ from the North inthe 3100–5300 m depth interval, see Cucci et al. 2004), focal mech-anisms sample directly the hypocentral depth (mainly between 3 and15 km depth, Valoroso et al. 2009), seismic anisotropy parametersview as a whole the rock volume between the hypocentral depth andthe surface.
In an extensional regime, the SHmax usually coincides with thestrike of the main normal faults, consistently our observed fast di-rections are parallel to the major Quaternary normal faults boundingthe basin. In Val d’Agri, the normal-fault system with most evidentgeomorphic and structural signatures bounds the basin to the NE(Figs 3a and b), if anisotropy were mainly due to the alignment ofmacroscopic fractures we would expect stronger anisotropic signalson this side of the valley, where the fabric strength is stronger. Theobservation of larger delay times in the SE flank of the basin suggestthat aligned macroscopic fractures gives a minor contribution to theshear wave anisotropy.
To localize the anisotropic rock volume, we plotted the analysedearthquakes onto a simplified geological cross-section, crossing theVal d’Agri, close to stations AG13 and AG04 (Fig. 3b). It is impor-tant to keep in mind the offset between the geological cross-sectionand the main earthquakes cluster that is projected in the cross-
section. The seismic events are mostly located under the SW side ofthe basin at 2–6 km below sea level, and almost all the seismicity isinside the Apulia Carbonate Platform. Consequently, the observedincrease of delay time with hypocentral depth (Fig. 9) implies thatnot only the superficial layers are seismically anisotropic but alsothe Apulian platform carbonates.
Data from hydrocarbon exploration and production in theVal d’Agri support this finding. Natural fractures within the Apuliancarbonates show a scattered distribution both in dip, magnitude andazimuth, as results of the complex poly-phase tectonic evolution ofthe Apulia Platform. Borehole image logs reveal that the local stressregime plays a primary role on the fracture production mechanism(Trice 1999). The high productivity of the carbonate reservoirs de-rives from a widespread system of open fractures, with open andconductive small cracks that strike NW–SE parallel to the maxi-mum horizontal stress associated to the local SW–NE extensionalregime. On the contrary, cracks with orthogonal strike tend to beclosed. Fault zones play a secondary role acting as local flow en-hancement, if favourably oriented with respect to the regional stressfield (Trice 1999).
Therefore, these results and observations strongly support theinterpretation of the origin of seismic anisotropy in Val d’Agri interms of EDA model.
The analysis of the delay times estimated at the different sta-tions yield insights on the rock fracturing percentage. For carbonaterocks, assuming an average normalized delay time of 0.01 s km−1
and a shear wave velocity of about 2.8–3 km s−1, in the EDAmodel assumption, the percentage of shear wave splitting is about3–4.5 per cent (Piccinini et al. 2006). The normalized delay timeabove 0.02 s km−1 corresponds to a percentage of shear wave split-ting almost equal to 10 per cent and implies heavily fractured rocks,with connected and filled-fluid fractures, in agreement with resultsof hydrocarbon exploration.
In general, a percentage of shear wave splitting from 0.5 to 10per cent has been observed in the upper crust, and has been in-terpreted as due to vertical, fluid-filled, aligned micro-cracks (e.g.Crampin et al. 1984; Crampin & Booth 1985). Shear wave velocity-anisotropy above levels of fracture-criticality (∼4.5 percent,Crampin 1994) indicates such heavily fractured rock that cracks dis-aggregate, shear strength is lost, and rocks tend to fracture (Crampin& Zatsepin 1997; Crampin 1999). When anisotropy is confined tothe very near-surface, high values of shear wave velocity anisotropy
Table 1. Average anisotropic parameters station and their standard deviations at each station having more thantwo measurements.
Station Number of Average fast Standard Average Standardevents direction (◦) deviation of normalized deviation of
fast direction (◦) delay time normalized(s km−1) delay time s km−1)
AG01 3 87 9.7 0.004 0.0003AG02 9 150 4.6 0.007 0.0002AG03 4 79 28.2 0.006 0.002AG04 10 163 13.2 0.007 0.001AG05 15 176 11.9 0.005 0.002AG07 12 153 13.7 0.013 0.004AG09 22 149 26.5 0.018 0.011AG11 22 112 23.6 0.008 0.004AG12 2 145 22.9 0.007 0.003AG13 15 138 12.7 0.017 0.003AG14 54 147 26.3 0.017 0.014AG17 2 84 5.6 0.005 0.003AG18 12 150 25.2 0.020 0.014
C© 2009 The Authors, GJI, 179, 601–614
Journal compilation C© 2009 RAS
Stress aligned cracks by shear wave splitting 611
Figure 10. Plot of the average fast direction at stations having more than 10 measurements. The length of the green lines is proportional to the averagenormalized delay time. The mean fast directions are almost orthogonal to the minimum horizontal stress (Shmin) in the area represented by the double-headedarrow (Cucci et al. 2004). The coloured area corresponds to the zone with higher value of delay time and the blue dashed line represents the Val d’Agri oilfield boundary.
are also reported: (15–30 per cent) Savage et al. (1989); (10 per cent)Gledhill (1991); (16 per cent) Zhang & Schwartz (1994);(10–14 per cent) Munson et al. (1995); which are all well abovelevels of fracture criticality.
The geographical distribution of our values of normalized delaytimes suggests that a higher density of open fractures characterizethe SW margin of the basin, where delays are in the order 0.017–0.02s km−1 (Fig. 10). In particular, the stations AG13 and AG04, lo-cated about 6 km apart on limestones of the Western Platform butin opposite sides of the basin (Fig. 3b), exhibit very different aver-age normalized delay times (0.017 and 0.007 s km−1, respectively).Similar values of normalized delay time have been also found atCoso geothermal reservoir (Vlachovic et al. 2003). This feature ap-parently contrasts with the location of the productive reservoirs tothe NE of the basin (Figs 2 and 10). Hydrocarbon exploration pro-vides again valuable information to face this apparent inconsistency.Wells and seismic exploration profiles suggest that the thrust sheetslocated above the Apulia Platform could differently contribute toseismic anisotropy, depending on the local geological structure. Tothe NE of the Val d’Agri basin, rootless nappes mainly consist ofTertiary foredeep sediments (clayey deposits with limestone interca-lation) and siliciclastic turbidites (Figs 3a and b; Menardi Noguera& Rea 2000; Dell’Aversana 2003). These sediments, that seal theApulian reservoirs, show a bad attitude to seismic anisotropy. Onthe contrary, thick successions of heavily fractured Mesozoic rocksof the Lagonegro basin (silicic limestones and cherts) and Western
Platform (limestones and dolomites) prevail beneath the southwest-ern flank of the basin (Figs 3a and b).
The presence of heavily fractured rocks above the Apulia Plat-form along the SW side of the basin is further supported bytwo lines of evidence. First, no productive reservoirs have beendiscovered so far inside the Apulia Carbonate Platform beneaththe SW margin of the basin and the Monti della Maddalenaridge (Holton 1999). Second, a spring located about 2 km tothe W of station AG13 is characterized by a natural emissionof oil fluids (Balderer & Martinelli 1995). This site was ex-plored in the 1950s by the 2000 m deep Tramutola well (Figs 2and 3b; UNMIG Italian Wells Database, available at http://unmig.sviluppoeconomico.gov.it/unmig/pozzi/pozzi.asp), which encoun-tered only secondary, productive overlapping reservoirs inside frac-tured silicic limestone and cherts of the Lagonegro basin (Barbieret al. 1998). The fact that oil was found at many geological lev-els, but above unproductive Apulian carbonates, and the superficialemission of oil fluids, are direct clues to intense local faulting andfracturing of the uppermost crust related to active normal faults(Italiano et al. 2001). Therefore, the whole shallow crust, from theApulian carbonates up to the sedimentary rootless slices, contributesto the shear wave splitting in the Val d’Agri. However, contributionof the units above the Apulia Platform is likely stronger for the sta-tions along the SW margin of the basin that is characterized by thickand widespread heavily fractured Mesozoic rocks of the Lagonegrobasin and Western Carbonate Platform.
C© 2009 The Authors, GJI, 179, 601–614
Journal compilation C© 2009 RAS
612 M. Pastori et al.
Although seismic anisotropy is not directly an indicator of faultactivity, results of our study induce to speculate on the seismo-tectonic settings of the Val d’Agri area. The highly fractured rockvolume and the prevalence of micro-seismicity lead us to supposethat along the MMFS bordering the SW flank of the basin, rockslose shear-strength and earthquakes occur whenever there is a smalllevel of stress accumulation. This is confirmed by the intense micro-seismicity occurring at the southern termination of the MMFS(Fig. 2). This scenario indicates that stress cannot accumulate inthe shallow portion of MMFS. At the same time in case of nu-cleation of large magnitude earthquake below 6 km depth on theMMFS this heavily fractured and filled-fluid volume can favour theslip on the fault (Cocco & Rice 2002). Finally the strong anisotropyand seismicity concentration indicate active deformation along theSW flank of the basin.
C O N C LU S I O N S
Shear wave splitting measurements reveal the presence of seismicanisotropy in upper 15 km of the crust in Val d’Agri. Anisotropicparameters (fast direction and delay time) and null measurementssuggest that the rock volume beneath the basin is heavily fractured,with cracks aligned in the Apenninic direction (NW–SE). Interpre-tation of shear wave splitting in term of EDA model is preferred;average fast directions indicate that the minimum horizontal stress(Shmin) is SW–NE trending, consistent with the regional (Amato& Montone 1997) and local stress indicators (Cucci et al. 2004;Maschio et al. 2005; Valoroso et al. 2009).
The normalized delay times of about 0.01 s km−1 imply a fractura-tion of about 4.5 per cent in the sampled rock volume. These resultsare consistent with the high flow rates and productivity of the oilreservoirs inside the Apulian carbonates (Holton 1999). ShallowerMesozoic rocks of the Western Carbonate Platform and Lagone-gro basin further contribute to the observed delay time. The rockvolume more intensely fractured (normalized delay times about0.02 s km−1) is located beneath the south-western border of thebasin, where most of the micro-seismicity occurs. The stronganisotropy and the seismicity concentration indicate active defor-mation along the SW flank of the basin.
Finally our study promotes shear wave splitting analysis as a vi-able and inexpensive tool to characterize oil reservoirs. The localstress field influences the productivity of oil reservoirs, togetherwith lithologic, stratigraphic and structural features. According toBarton et al. (1997), natural open fractures can have preferentialproduction characteristics if aligned parallel to the maximum hori-zontal stress in extensional tectonics regions. Our results, comparedto studies on the reservoir productivity performed by oil industry(Trice 1999), indicate that this relationship occurs in the Val d’Agriarea. For this reason we believe that shear wave splitting analysisprovides parameters directly related to the strike of the subsurfacefractures and to their density (number of cracks per unit volume),and consequently, can be an effective technique to locate high per-meability volumes (Vlahovic et al. 2003). Therefore, further shearwave splitting experiments could lead to a better understanding ofthe relationship between local stress field and the degree of fractur-ing in the carbonatic reservoirs.
A C K N OW L E D G M E N T S
We thank the editor Prof. Jean Virieux and the anonymous revieversfor the comments and suggestions that helped us to improve the
manuscript. L. Improta greatly acknowledges Prof. Paolo Scandonefor fruitful discussions about the Tramutola well. We also thankProf. M. R. Barchi for useful comments. This research has benefitedfrom founding provided by the Italian Presidenza del Consigliodei Ministri–Dipartimento della Protezione Civile (DPC). Scientificpapers fonded by DPC do not represent its official opinion andpolicies.
R E F E R E N C E S
Amato, A. & Montone, P., 1997. Present-day stress field and active tectonicsin southern peninsular Italy, Geophys. J. Int., 130(2), 519–534.
Balderer, W. & Martinelli, G., 1995. Geochemistry of groundwaters andgases occurring in the 23 November, 1980 earthquake area (SouthernItaly), Environ. Geochem. Health, 16(Suppl.), 147–164.
Barbier, E., Musmeci, F. & Saracco, L., 1998. Banca Nazionale Dati Geoter-mici, CD-Rom, International Institute for Geothermal Research–CNR,Pisa.
Barchi, M., Amato, A., Cippitelli, G., Merlini, S. & Montone, P., 2007.Extensional tectonics and seismicity in the axial zone of the SouthernApennines, in Boll. Soc. Geol. It., Special Issue 7, pp. 47–56.
Barton, C. & Zoback, M.D., 1994. Stress perturbations associated with activefaults penetrated by boreholes: possible evidence for near-complete stressdrop a new technique for stress magnitude measurement, J. geophys. Res.,99(B5), 9373–9390.
Barton, C.A., Hickman, S., Morin, R., Zoback, M.D., Finkbeiner, T., Sass,J. & Benoit, D., 1997. Insitu stress and fracture permeability along theStillwater Fault Zone, Dixie Valley, Nevada, in Proceedings of the Twenty-Second Workshop on Geothermal Reservoir Engineering, SGP-TR-156,Stanford University, Stanford, CA, January 27–29.
Benedetti, L., Tapponier, P., King, G.C.P. & Piccardi, L., 1998. Surfacerupture of the 1857 southern Italian earthquake?, Terra Nova. Eur. J.Geosci., 10(4), 206–210.
Boschi, E., Guidoboni, E., Ferrari, G., Mariotti, D., Valensise, G. &Gasperini, P., 2000. Catalogue of strong Italian Earthquakes, Ann. Ge-ofis., 36, 237–243.
Brocher, T.M. & Christensen, N.I., 1990. Seismic anisotropy due to preferredmineral orientation observed in shallow crustal rocks in southern Alaska,Geology, 18, 737–740.
Burrato, P. & Valensise, G., 2008. Rise and fall of a hypothesized seismicgap: source complexity in the M (sub w) 7.0 16 December 1857 SouthernItaly earthquake, Bull. seism. Soc. Am., 98(1), 139–148.
Catalano, S., Monaco, C., Tortorici, L., Paltrinieri, W. & Steel, N., 2004.Neogene-quaternary tectonic evolution of the Southern Apennines, Tec-tonics, 23, TC2003, doi:10.1029/2003TC001512.
Cello, G., Gambini, R., Mazzoli, S., Read, A., Tondi, E. & Zucconi,V., 2000. Fault zone characteristics and scaling properties of the Vald’Agri fault system (Southern Apennines, Italy), J. Geod., 29(3–5), 293–307.
Cello, G., Tondi, E., Van Dijk, J.P., Mattioni, L., Micarelli, L. & Pinti, 2003.Geometry, kinematics and scaling properties of faults and fractures astools for modelling geofluid reservoirs; examples from the Apennines,Italy, Geological Society, Special Publications, 212, 7–22.
Chiarabba, C., Jovane & Di Stefano, R., 2005. A new view of Italian seismic-ity using 20 years of instrumental recordings, Tectonophysics, 395(3–4),251–268.
Cocco, M. & Rice, J.R., 2002. Pore pressure and poroelasticity effects inCoulomb stress analysis of earthquake interactions, J. geophys. Res., 107,doi:10.1029/2000JB00138.
Cochran, E.S., Vidale, J.E. & Li, Y.G., 2003. Near-fault anisotropy fol-lowing the Hector Mine earthquake, J. geophys. Res., 108(B9), 2436,doi:10.1029/2002JB002352.
Crampin, S., 1978. Seismic-wave propagation through a cracked solid: po-larization as a possible dilatancy diagnostic, Geophys. J. Int., 53(3), 467–496.
Crampin, S., 1994. The fracture criticality of crustal rocks, Geophys. J. Int.,118, 428–438.
C© 2009 The Authors, GJI, 179, 601–614
Journal compilation C© 2009 RAS
Stress aligned cracks by shear wave splitting 613
Crampin, S., 1999. Calculable fluid-rock interactions, J. geol. Soc. Lond.,156, 501–514.
Crampin, S. & Chastin, S., 2003. A review of shear wave splitting in thecrack-critical crust, Geophys. J. Int., 155, 221–240.
Crampin, S. & Booth, D.C., 1985. Shear-wave polarizations near the NorthAnatolian Fault–II. Interpretation in terms of crack-induced anisotropy,Geophys. J. Int., 838(1), 75–92.
Crampin, S. & Lovell, J.H., 1991. A decade of shear-wave splitting in theEarth’s crust: what does it mean? What use can we make of it? And whatshould we do next?, Geophys. J. Int., 107, 387–407.
Crampin, S. & Peacock, S., 2005. A review of shear-wave splitting inthe compliant crack-critical anisotropic Earth, Wave Motion, 41, 59–77.
Crampin, S. & Zatsepin, S.V., 1997. Modelling the compliance of crustalrock–II. Response to temporal changes before earthquakes, Geophys. J.Int., 129(3), 495–506.
Crampin, S., Chesnokov, E.M. & Hipkin, R.A., 1984. Seismic anisotropy—the state of the art, Geophys. J. Roy. Astr. Soc., 76, 1–16.
Cucci, L., Pondrelli, S., Freopoli, A., Mariucci, M.T. & Moro, M., 2004.Local pattern of stress field and seismogenic sources in Meandro Pergolabasin and in Agri valley (Southern Italy), Geophys. J. Int., 156, 575–583.
D’Addezio, G., Karner, B.D., Burrato, P., Insinga, D., Maschio, L., Ferranti,L. & Renne, P.R., 2006. Tephrochronology in faulted Middle-Pleistocenetephra layer in the Val d’Agri area (southern Italy), Ann. Geophys., 40,1029–1040.
Davis, J.C., 1986. Statistics and data analysis in Geology, 2nd edn, Wiley,New York.
Dell’Aversana, P., 2003. Integration loop of ‘global offset’ seismic, con-tinuous profiling magnetotelluric and gravity data, First break, 21,32–41.
Dewey, J.F., Helman, M.L., Turco, E., Hutton, D.W.H. & Knott, S.P., 1989.Kinematics of the western Mediterranean, in Alpine Tectonics, Vol. 45,pp. 265–283, eds Coward, M.P., Dietrich, D. & Park, R.G., GeologicalSociety, London, Special Publications.
Gao, Y. & Zheng, S., 1994. On shear wave splitting in Tangshan region(II)—correlation function analysis method [J], Earthq. Res. China, 10(9),22–32.
Gao, Y., Wang, P., Zheng, S., Wang, M., Chen, Y. & Zhou, H., 1998. Temporalchange in shear-wave splitting at an isolated swarm of small earthquakesin 1992 near Dongfang, Hainan Island, southern China, Geophys. J. Int.,135, 102–112.
Gasparini, C., Iannaccone, G., Scandone, P. & Scarpa, R., 1982. Seismotec-tonics of the Calabrian Arc, Tectonophysics, 84(2–4), 267–286.
Gledhill, K.R., 1991. Evidence for shallow and pervasive seismic anisotropyin the Wellington Region, New Zealand, J. geophys. Res., 96(B13),21 503–21 516.
Holton, J., 1999. Four geologic settings dominate oil, gas fields of Italy,Sicily, Oil Gas J., 97(49), 81–84.
Hunstad, I., Selvaggi, G., D’agostino, N., England, P., Clarke, P. & Pierozzi,M., 2003. Geodetic strain in peninsular Italy between 1875 and 2001,Geophys. Res. Lett., 30(4), 1181, doi:10.1029/2002GL016447.
Improta, L. & Bruno, P.P., 2007. Combining seismic reflection with mul-tifold wide-aperture profiling; an effective strategy for high-resolutionshallow imaging of active faults, Geophys. Res. Lett., 34(20), L20310,doi:10.1029/2007GL031893.
Italiano, F., Martelli, M., Martinelli, G., Nuccio, P.M. & Paternoster, M.,2001. Significance of earthquake-related anomalies in fluids of Val D’Agri(Southern Italy), Terra Nova, 13(4), 249–257.
Margheriti, L., Ferulano, M.F. & Di Bona, M., 2006. Seismic anisotropyand its relation with crust structure and stress field in the Reggio Emiliaregion (Northern Italy), Geophys. J. Int., 167(2), 1035–1045.
Maschio, L., Ferranti, L. & Burrato, P., 2005. Active extension in Val d’Agriarea, Southern Apennines, Italy; implications for the geometry of theseismogenic belt, Geophys. J. Int., 162(2), 591–609.
Mazzoli, S. et al., 2000. Time and space variability of thin skinned andthick skinned thrust tectonics in the Apennines (Italy), Rendiconti LinceiScienze Fisiche e Naturali, IX, 5–39.
Menardi Noguera, A. & Rea, G., 2000. Deep structure of the Campanian-Lucanian Arc (Southern Apennine, Italy), Tectonophysics, 324(4),239–265.
Michetti, A.M., Serva, L. & Vittori, E., 2000. ITHACA (Italian hazardfrom Capable Faulting), a database of active capable faults of the Italianonshore territori, Database on CD-ROM. Internal report of ANPA-AgenziaNazionale Protezione Ambiente, Roma.
Munson, C.G., Thurber, C.H., Li, Y. & Okubo, P.G., 1995. Crustal shearwave anisotropy in southern Hawaii: Spatial and temporal analysis,J. geophys. Res. 100(B10), 20 367–20 377.
Padhy, S. & Crampin, S., 2006. High pore-fluid pressures at Bhuj, inferredfrom 90◦-flips in shear-wave polarizations, Geophys. J. Int., 164, 370–376.
Patacca, E. & Scandone, P., 1989. Post-Tortonian mountain building in theApennines. The role of the passive sinking of a relic lithospheric slab,The Lithosphere in Italy, 80, 157–176.
Peng, Z. & Ben-Zion, Y., 2004. Systematic analysis of crustal anisotropyalong the Karadere–Duzce branch of the North Anatolian fault, Geophys.J. Int., 159, 253–274.
Piccinini, D., Margheriti, L., Chiaraluce, L. & Cocco, M., 2006. Spaceand time variations of crustal anisotropy during the 1997 Umbria-Marche, central Italy, seismic sequence, Geophys. J. Int., 167, 1482–1490.
Pondrelli, S., Salimbeni, S., Ekstrom, G., Morelli, A., Gasparini, P. &Vannucci, G., 2006. The Italian CMT dataset from 1977 to the present,Phys. Earth planet. Inter., 159(3–4), 286–303.
Savage, M.K., Shih, X.R., Meyer, R.P. & Aster, R.C., 1989. Shear-waveanisotropy of active tectonic regions via automated S-wave polarizationanalysis, Tectonophysics, 165, 279–292.
Schutt, D., Humphreys, E.D. & Dueker, K., 1998. Anisotropy of the Yel-lowstone Hot Spot Wake, Eastern Snake River Plain, Idaho, Pure appl.Geophys., 151, 443–462.
Serpelloni, E., Anzidei, M., Baldi, P., Casula, G. & Galvani, A., 2005.Crustal velocity and strain-rate fields in Italy and surrounding regions;new results from the analysis of permanent and non-permanent GPSnetworks, Geophys. J. Int., 161(3), 861–880.
Shiner, P., Beccacini, A. & Mazzoli, S., 2004. Thin-skinned versus thick-skinned structural models for Apulian carbonate reservoirs; constraintsfrom the Val d’Agri fields, S Apennines, Italy, Mar. Petrol. Geol., 121(7),805–827.
Trice, R., 1999. Application of borehole image logs in constructing3D static models of productive fracture network in the Apulian Plat-form, Southern Apennines, in Borehole imaging: applications andcase histories, Vol. 159, pp. 156–176, eds Lovell, M.A., Williamson,G. & Harvey, P.K., Geological Society, London, Special Publications,doi:10.1144/GSL.SP.1999.159.01.08.
UNMIG-Italian National Mine Office, 2008. Wells Database available athttp://unmig.sviluppoeconomico.gov.it/unmig/pozzi/pozzi.asp
Valensise, G. & Pantosti, D., 2001. Database of potential sources for earth-quakes lager than M 5.5 in Italy, Annali di Geofisica, 44, 180 (withCD-ROM).
Valoroso, L., Improta, L., Chiaraluce, L., Di Stefano, R., Ferranti, L., Govoni,A. & Chiarabba, C., 2009. Active faults and induced seismicity in theVal d’Agri area (Southern Apennines, Italy), Geophys. J. Int., 178(1),488–502.
Vlahovic, G., Elkibbi, M. & Rial, J.A., 2003. Shear-wave splitting and reser-voir crack characterization; the Coso geothermal field, J. Volc. Geotherm.Res., 120(1–2), 123–140.
Wang, X., Liu, J., Zhang, G., Ma, H. & Wang, H., 2006. Study on shearwave splitting in the aftershock region of the Yao′an earthquake in 2000,Acta seism. Sinica, 19(2) 123–135.
Zhang & Schwartz, 1994. Seismic anisotropy in the shallow crust of theLoma Prieta segment of the San Andreas fault system, J. geophys. Res.,99(B5), 9651–9661.
Zinke, J.C. & Zoback, M.D, 2000. Structure-related and stress-inducedshear-wave velocity anisotropy: observations from microearthquakes nearthe Calaveras Fault in Central California, Bull. seism. Soc. Am., 90(5),1305–1312.
C© 2009 The Authors, GJI, 179, 601–614
Journal compilation C© 2009 RAS
614 M. Pastori et al.
S U P P O RT I N G I N F O R M AT I O N
Additional Supporting Information may be found in the online ver-sion of this article:
Table S1. The name of the event indicates the years (A), 5 means2005, the month (MM), the day (DD), the hour (hh) and theminute (mm) of the earthquake origin time; hypocentral coordi-nates (long, lat, depth), stations name and its coordinates (long, lat,
elevation), backazimuth, incident angle, fast direction, delay time,cross-correlation coefficient, hypocentral distance and normalizeddelay time.
Please note: Wiley-Blackwell are not responsible for the content orfunctionality of any supporting materials supplied by the authors.Any queries (other than missing material) should be directed to thecorresponding author for the article.
C© 2009 The Authors, GJI, 179, 601–614
Journal compilation C© 2009 RAS
Related Documents