2001 Annual Report Strength,Vision and Responsiveness

Welcome message from author
This document is posted to help you gain knowledge. Please leave a comment to let me know what you think about it! Share it to your friends and learn new things together.
Transcript
2001 Annual Repor t
Strength,Vision and Responsiveness
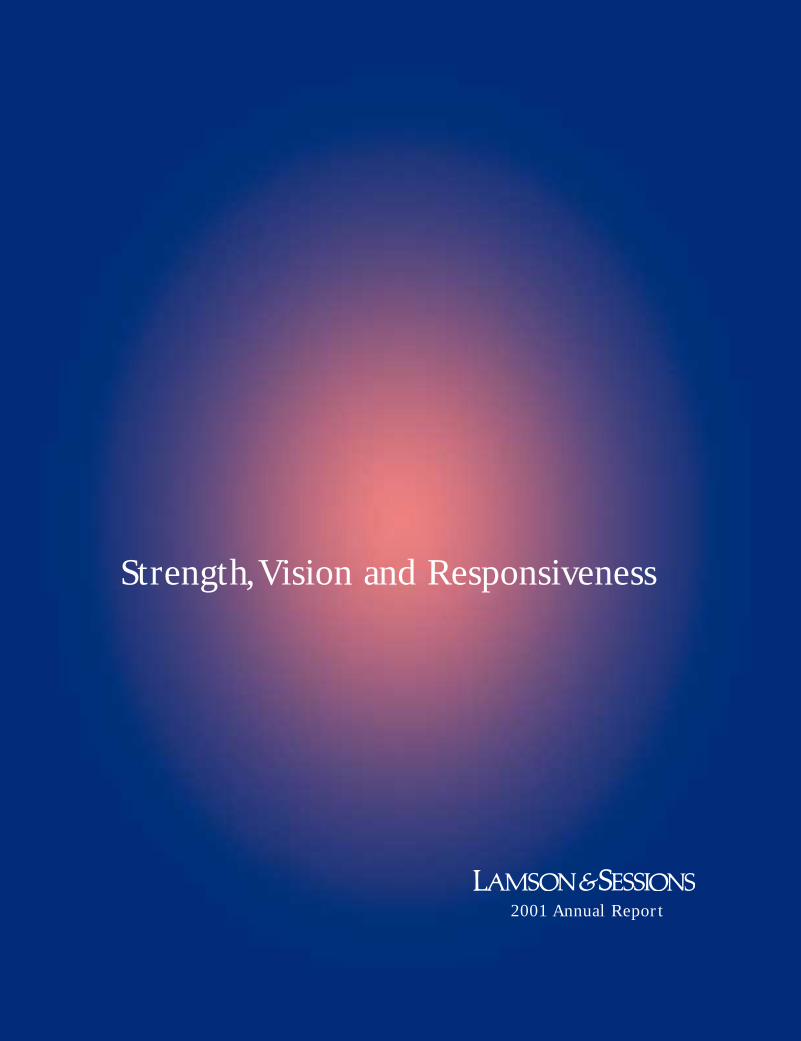
The Fundamentals
of Our Success
About the Company:
With well-recognized brand strength
and market leadership, a strategic
vision focusing on growth opportuni-
ties and a commitment to flexibility
and responsiveness, Lamson &
Sessions is positioned for long-term
sales and earnings growth. The
Company consists of three
business segments. Carlon provides
electrical and telecommunications
raceway systems, nonmetallic
enclosures, outlet boxes and electrical
fittings to the electrical and telecom-
munications markets. Lamson Home
Products offers consumer products
such as lighting controls, flexible
conduit and fittings, switch and outlet
boxes and wireless chimes, which
are available through home centers,
hardware stores and mass merchan-
disers for the do-it-yourself home
improvement market. The PVC Pipe
segment supplies conduit for the
telecommunications, electrical
distribution and power utility markets.
StrategicDrivers
CustomerSatisfaction
HighPerformance
Culture
InnovativeProducts and
Services
Sustainable Revenue and Profit
Growth
➣
➣
➣
➣
OperationalExcellence
➣
➣
Contents:
1 - Financial Summary
2 - Shareholder Letter
5 - Strength
6 - Vision
7 - Responsiveness
- Form 10-K Report
- Corporate Information
InformationTechnology
as a CompetitiveAdvantage
1
Trademarks The following terms used in this annual report are trademarks of Lamson & Sessions and those indicated by the “®” are registered in the U.S. Patent and Trademark Office: Bore-Gard®, Carflex®, Carlon®, Lamson and Lamson Home Products.
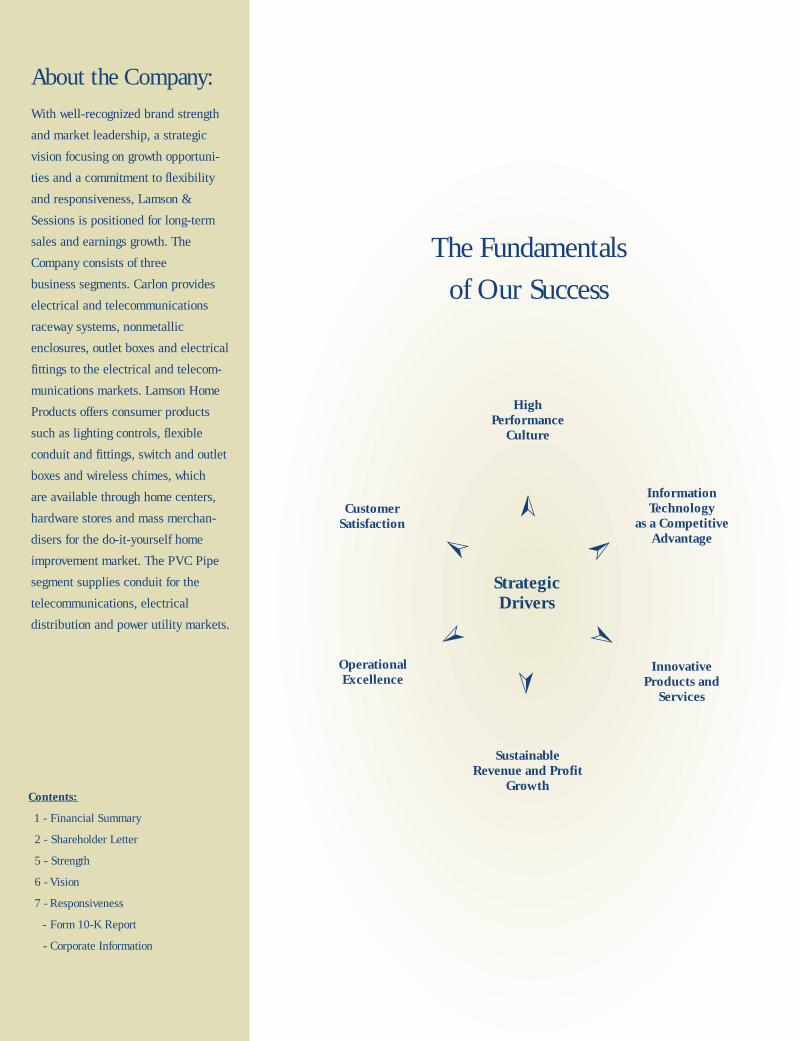
2001Fiscal Years Ended
(Dollars in Thousands, except per share data) 2001 2000 %Fav/(Unfav)
Net Sales $352,672 $348,733 1Gross Profit 61,400 88,619 (31)Operating Income 6,183 34,487 (82)Net (Loss) Income (3,843) 21,448 (118)Diluted (Loss) Earnings per Share ($0.28) $1.53 (118)Cash Flow from Operations 30,076 27,521 9Long-Term Debt 104,266 130,276* 20
As a % of Equity 128.4 151.4* 15Equity 81,224 86,029 (6)
*Increase in Long-Term Debt due to acquisitions.
Financial Summary
1
Trademarks The following terms used in this annual report are trademarks of Lamson & Sessions and those indicated by the “®” are registered in the U.S. Patent and Trademark Office: Carlon®, Lamson and Lamson Home Products.
2001Sales
in m
illio
ns
in m
illio
ns
$400
97
300
200
100
0
98 99 00 01
Earnings Per Share$2.00
97*
1.50
1.00
.50
.00
98 99 00 01
Operating Cash Flow$40
97
30
20
10
0
98 99 00 01*1997 EPS is before effect of accounting change
Fiscal Years Ended(Dollars in thousands, except percentages and per share data) 2001 2000 %Fav/(Unfav)
Net Sales $352,672 $348,733 1Gross Profit 61,400 88,619 (31)Operating Income 6,183 34,487 (82)Net (Loss) Income (3,843) 21,448 (118)Diluted (Loss) Earnings Per Share (0.28) 1.53 (118)Cash Flow from Operations 30,076 27,521 9Long-Term Debt 104,266 130,276* 20
As a % of Equity 128.4 151.4* 15Equity 81,224 86,029 (6)
Financial Summary
D
2
The decline in earnings in 2001 reflected
the overall slump in the U.S. and global
economies, which affected all of our markets.
Among our major markets, the telecommunica-
tions industry was hit especially hard through-
out the year, as companies cut capital spending
and delayed plans for further build-out of the
communications infrastructure. Although unit
shipments increased in our PVC Pipe segment,
prices for electrical conduit were the lowest we
have seen in more than 10 years, impacted by
a global imbalance of polyvinyl chloride (PVC) resin supply over demand. Margins were squeezed due to the
precipitous decline in selling prices, which outpaced the reduction in our raw material costs. In the electrical
distribution and retail markets, many of our customers undertook inventory reduction programs, resulting
in less demand for our products.
In response, we acted aggressively to minimize the impact of these adverse market conditions. During the
year, we strengthened our Company on a number of fronts:
• Organizationally, we completed the integration of two major acquisitions that we made in late 2000
and incorporated them into our business stream. These acquisitions expanded our position in the telecommu-
nications infrastructure market, which, we believe, will provide us greater opportunity for long-term profitable
growth when the telecommunications market improves.
• We reduced costs throughout all areas of the Company while improving efficiency and enhancing
productivity, which helped to diminish the effect of the short-term decline in demand. Further, as demand
rebounds, we expect that these cost-cutting measures will enable our manufacturing plants and distribution
centers to handle greater unit volumes without significant increases in expenses.
• Our market share position remained strong in all of our businesses. We introduced new products and
supported our customers with competitive pricing, improved service levels and high quality. With a solid
market leadership position, we are maintaining a strong foundation for sustainable long-term growth in sales
and earnings.
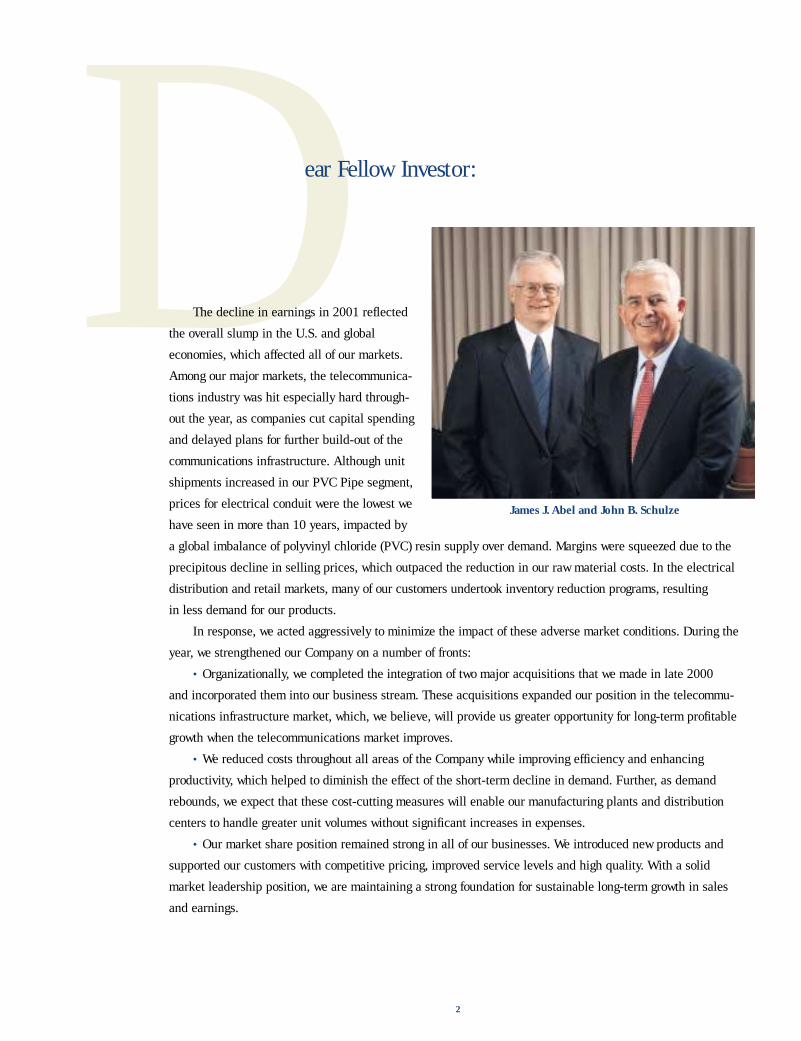
James J. Abel and John B. Schulze
ear Fellow Investor:
3
Sales Per Associate
in th
ousa
nds
*2000 adjusted for pro rata comparison of sales per associate after acquisitions.
$400
97
300
200
100
0
98 99 00* 01
in m
illio
ns
Shareholders’ Equity$100
97
80
0
98 99 00 01
60
40
20
in m
illio
ns
(Earnings Before Interest, Taxes, Depreciation and Amortization)EBITDA
$50
97
40
30
10
20
0
98 99 00 01
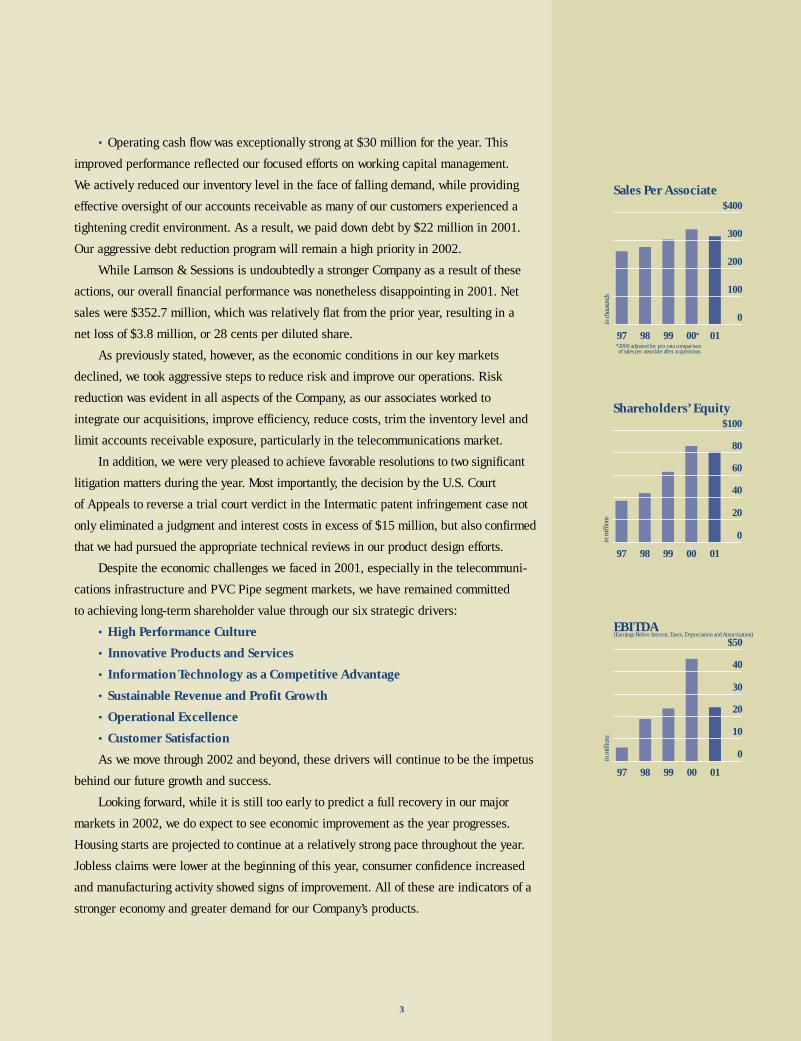
• Operating cash flow was exceptionally strong at $30 million for the year. This
improved performance reflected our focused efforts on working capital management.
We actively reduced our inventory level in the face of falling demand, while providing
effective oversight of our accounts receivable as many of our customers experienced a
tightening credit environment. As a result, we paid down debt by $22 million in 2001.
Our aggressive debt reduction program will remain a high priority in 2002.
While Lamson & Sessions is undoubtedly a stronger Company as a result of these
actions, our overall financial performance was nonetheless disappointing in 2001. Net
sales were $352.7 million, which was relatively flat from the prior year, resulting in a
net loss of $3.8 million, or 28 cents per diluted share.
As previously stated, however, as the economic conditions in our key markets
declined, we took aggressive steps to reduce risk and improve our operations. Risk
reduction was evident in all aspects of the Company, as our associates worked to
integrate our acquisitions, improve efficiency, reduce costs, trim the inventory level and
limit accounts receivable exposure, particularly in the telecommunications market.
In addition, we were very pleased to achieve favorable resolutions to two significant
litigation matters during the year. Most importantly, the decision by the U.S. Court
of Appeals to reverse a trial court verdict in the Intermatic patent infringement case not
only eliminated a judgment and interest costs in excess of $15 million, but also confirmed
that we had pursued the appropriate technical reviews in our product design efforts.
Despite the economic challenges we faced in 2001, especially in the telecommuni-
cations infrastructure and PVC Pipe segment markets, we have remained committed
to achieving long-term shareholder value through our six strategic drivers:
• High Performance Culture
• Innovative Products and Services
• Information Technology as a Competitive Advantage
• Sustainable Revenue and Profit Growth
• Operational Excellence
• Customer Satisfaction
As we move through 2002 and beyond, these drivers will continue to be the impetus
behind our future growth and success.
Looking forward, while it is still too early to predict a full recovery in our major
markets in 2002, we do expect to see economic improvement as the year progresses.
Housing starts are projected to continue at a relatively strong pace throughout the year.
Jobless claims were lower at the beginning of this year, consumer confidence increased
and manufacturing activity showed signs of improvement. All of these are indicators of a
stronger economy and greater demand for our Company’s products.
4
John B. SchulzeChairman, President and Chief Executive Officer
James J. AbelExecutive Vice President, Secretary,Treasurer and Chief Financial Officer
We are encouraged by several dynamics involved with our PVC Pipe segment. Our PVC resin suppliers
have recently announced price increases based on rising export market demand combined with replenishment
of domestic inventory stocks. If these increases hold, we anticipate improvement in selling prices and margins
for our pipe products.
Rising consumer confidence and spending are positive signs for our home improvement market. Also,
the magnitude of inventory reductions undertaken by major retailers in 2001 is not likely to be repeated.
However, we expect margins in our Carlon and Lamson Home Products business segments to be under
pressure from higher raw material costs throughout the year, although these pressures should be offset
somewhat by the reduction in our overhead cost base resulting from the expense reduction efforts completed
during 2001.
We continue to believe the telecommunications infrastructure market will return to strong growth that
will be sustained over the long term when the next stage of infrastructure expansion gets under way. Recovery
in this market is expected to begin no sooner than the fourth quarter of 2002, with annual growth of 5 to
15 percent projected for 2003 and 2004. This next stage of infrastructure development, focusing on the
construction of metropolitan area fiber networks and improved access to commercial and residential markets,
is still necessary for telecommunications and cable companies to serve their customers more effectively.
As the recovery takes place, Lamson & Sessions is positioned to take full advantage of it. Our plants are
operating more efficiently than ever and our capacity is well distributed geographically. We offer outstanding
products and service to meet the demands of our customers. The Company has an excellent management
information system and is staffed by a well-motivated and highly trained group of associates.
In a challenging environment where much is beyond our control, it takes strength, vision and
responsiveness to succeed. The people and businesses of Lamson & Sessions combine all of those qualities.
We thank our associates for their continuing dedication and hard work, as well as our customers and
investors for their ongoing support.
On behalf of our Board of Directors, we gratefully acknowledge the outstanding service, energy and
counsel of John C. Morley, President of Evergreen Ventures Ltd., LLC and retired President and Chief Executive
Officer of Reliance Electric, who is retiring from our Board this year. John’s knowledge, experience and
incisive thoughts were highly valued during his six-year tenure on the Lamson & Sessions Board.
Strength
5
Lamson & Sessions possesses many key strengths that position us well to take advantage of growing markets.
These strengths form a solid foundation from which the Company can achieve long-term profitable growth.
Market Strength
As a leader in providing a variety of nonmetallic products for electrical, telecommunications, industrial,
residential and utility construction applications, Lamson & Sessions aggressively defended its market position
in 2001. Our diverse product line is competitively priced and designed to meet our customers’ needs.
Brand Strength
Our Carlon brand is well-recognized, with a strong reputation for technological innovation and high-quality
products and service. Architects and engineers specify Carlon products for cable television companies,
telephone companies, military installations, various health and education institutional facilites and many
other power and communications applications.
Organizational Strength
Dedicated to fostering a culture of continuous improvement and outstanding performance, our associates
focus on providing value to our customers and our shareholders. Reducing costs and improving efficiency
to enhance productivity and maximize customer satisfaction are key components of our culture.
Product Strength
Our expertise in thermoplastic processing is well known. We pioneered trenchless technology for electrical,
telecommunications and waste-water markets and consistently have developed innovative electrical and cable
management products.
IT Capability Strength
Initiatives in information technology have enhanced customer service and generated competitive advantages
for the Company. For example, Carlon’s eConnect business-to-business Web site allows quick access to
information on orders, pricing and delivery, while our Enterprise Resource Planning (ERP) system has
brought more associates into the decision-making process to improve responsiveness and performance.
Strength Through Acquisitions
Strategic acquisitions have broadened our product lines and strengthened our position in the telecommunica-
tions infrastructure market. These acquisitions were fully and successfully integrated in 2001, ensuring
that Lamson & Sessions will be a major participant in the long-term expansion of the telecommunications
infrastructure market.
Vision
6
Pursuing long-term growth opportunities requires vision and commitment. At Lamson & Sessions, we combine
our strengths, capabilities and market leadership with a vision that directs us toward opportunity. Our
entire organization is committed to achieving this vision through our dedication to operational excellence
and customer satisfaction.
Recognizing Opportunity
Prior to the strategic acquisitions of 2000, the management team at Lamson & Sessions recognized the
potential for significant long-term growth in the telecommunications infrastructure market. That opportunity,
as we envisioned it then, still exists today. Major players in the telecommunications industry are faced with
the need to expand their infrastructure to serve their customers better. Increased capital spending in this
market is inevitable as these companies build out their metropolitan area fiber networks that will complement
and augment their existing infrastructure. This next stage of the telecommunications build-out will make
high-speed data and communications networks a reality for most homes and businesses. Lamson & Sessions
enjoys strong relationships with telecommunications companies and their suppliers, and offers the right
products to serve their current and future needs as they continue to develop and refine their infrastructure
environments. We are poised to take full advantage of the growth in this market as it takes place.
Pursuing Growth
In pursuing our vision for sustainable revenue and profit growth, we continue to focus on market opportunities
that stem from our existing strengths and offer excellent potential. We have positioned our Company to attain
our goals through strategic investments in people, facilities, technology and product development, which will
enhance our ability to serve customers in growing markets.
Associate Development
Our commitment includes promoting life-long learning among our associates, enhancing their skills through
specialized training, providing the tools and resources they need and empowering them to deliver the highest
level of service to customers and value to shareholders. Emphasizing continuing education and development
for our associates helps improve productivity, enhance efficiency and increase profitability through a shared
strategic focus.
FResponsiveness
7
lexibility and responsiveness are integral to our culture at Lamson & Sessions. Armed with our strengths and
directed by our vision, we are able to respond effectively and in whatever way necessary to succeed, even in the
face of the most difficult market conditions and the toughest customer demands.
Market Conditions
In response to the market challenges of 2001, Lamson & Sessions took a number of actions that not only minimized
the impact of short-term slowdowns in its markets, but also strengthened the Company’s operations for the future.
We cut expenses throughout the organization, reduced excess capacity, eliminated non-performing product lines and
consolidated operations. By rationalizing and streamlining operations during the global economic slump, we
increased our long-term prospects for profitability and strengthened our position for growth when our markets recover.
Credit Conditions
The eroding activity level in the general economy and the significant decline in the telecommunications market
created several challenging situations regarding our customers’ credit quality and our debt leverage in the second
half of 2001. We aggressively dealt with the potential accounts receivable and inventory exposures and reduced
our debt level by $22 million. In 2002, we are actively evaluating changes in our capital structure to mitigate
any potential adverse impact from further deterioration in our markets and to ensure that we have the financial
flexibility to support our business needs and opportunities when our markets recover.
Integration of Acquisitions
When Lamson & Sessions had the opportunity to broaden its presence in a dynamic industry that we had targeted
for growth, we responded quickly with two of the most strategic acquisitions in our Company’s history. In doing so,
we strengthened our telecommunications business by substantially increasing our market share and improving
our capability to serve the infrastructure market. The acquisitions were integrated efficiently and effectively, and
significant cost synergies were realized in 2001. The timely and successful integration of these acquisitions puts
Lamson & Sessions in an excellent position to move forward as a leader in this long-term growth market.
Service to Customers
Lamson & Sessions’ philosophy is to meet and exceed customer expectations by offering high-quality products and
service and delivering them on time, in full and error-free. Providing world-class customer service is essential to
maintain our leadership position. In the telecommunications market, for example, customers demand quick access
to innovative, scalable and durable products, which Lamson & Sessions provides. Critical mass and outstanding
technical expertise are necessary to support major national customers.
Commitment to Shareholders
We take our responsibility to shareholders seriously by fostering open communication with the investment
community and providing insightful information on our businesses and markets. Through responsiveness to our
shareholders as well as our customers, the associates of Lamson & Sessions consistently demonstrate our
commitment to do what it takes to serve all of our constituencies.
10-K2001 Form 10-K
The Lamson & Sessions Co. and Subsidiaries
SECURITIES AND EXCHANGE COMMISSIONWASHINGTON, DC 20549
F O R M 10-K� ANNUAL REPORT PURSUANT TO SECTION 13 OR 15(d)
OF THE SECURITIES EXCHANGE ACT OF 1934
For the fiscal year ended December 29, 2001
COMMISSION FILE NUMBER 1-313
THE LAMSON & SESSIONS CO.(Exact name of Registrant as specified in its charter)
Ohio 34-0349210(State of Incorporation) (I.R.S. Employer Identification No.)
25701 Science Park Drive, Cleveland, Ohio 44122(Address of Principal Executive Offices) (Zip Code)
216-464-3400(Registrant’s telephone number, including area code)
SECURITIES REGISTERED PURSUANT TO SECTION 12(b) OF THE ACT
Title of each class Name of each Exchange on Which Registered
Common Shares, without par value New York Stock ExchangePacific Stock Exchange
SECURITIES REGISTERED PURSUANT TO SECTION 12(g) OF THE ACT: NONE
Indicate by check mark whether the Registrant (1) has filed all reports required to be filed by Section 13 or 15(d) of theSecurities Exchange Act of 1934 during the preceding 12 months (or for such shorter period that the Registrant was requiredto file such reports), and (2) has been subject to such filing requirements for the past 90 days. Yes � No □
Indicate by check mark if disclosure of delinquent filers pursuant to Item 405 of Regulation S-K is not contained herein,and will not be contained, to the best of Registrant’s knowledge, in definitive proxy or information statements incorporated byreference in Part III of this Form 10-K or any amendment to this Form 10-K. □
The aggregate market value of the voting stock held as of February 8, 2002 by non-affiliates of the Registrant:$52,801,571.
As of February 8, 2002 the Registrant had outstanding 13,777,608 common shares
DOCUMENTS INCORPORATED BY REFERENCE
Portions of the Registrant’s Proxy Statement for the Annual Meeting of Shareholders to be held on April 26,2002 are incorporated by reference into Part III of this report.
THE LAMSON & SESSIONS CO.
INDEX TOANNUAL REPORT ON FORM 10-K
For The Fiscal Year Ended December 29, 2001
PART IItem 1. Business
Item 2. Properties
Item 3. Legal Proceedings
Item 4. Submission of Matters to Security Holders
PART IIItem 5. Market for the Registrant’s Common Stock and Related Security Holder Matters
Item 6. Selected Financial Data
Item 7. Management’s Discussion and Analysis of Financial Condition and Results of Operations
Item 7(a). Market Risk Disclosures
Item 8. Financial Statements and Supplementary Data
Item 9. Disagreements on Accounting and Financial Disclosure
PART IIIItem 10. Directors and Executive Officers of the Registrant
Item 11. Executive Compensation
Item 12. Security Ownership of Certain Beneficial Owners and Management
Item 13. Certain Relationships and Related Transactions
PART IVItem 14. Exhibits, Financial Statement Schedules and Reports on Form 8-K
2
PART I
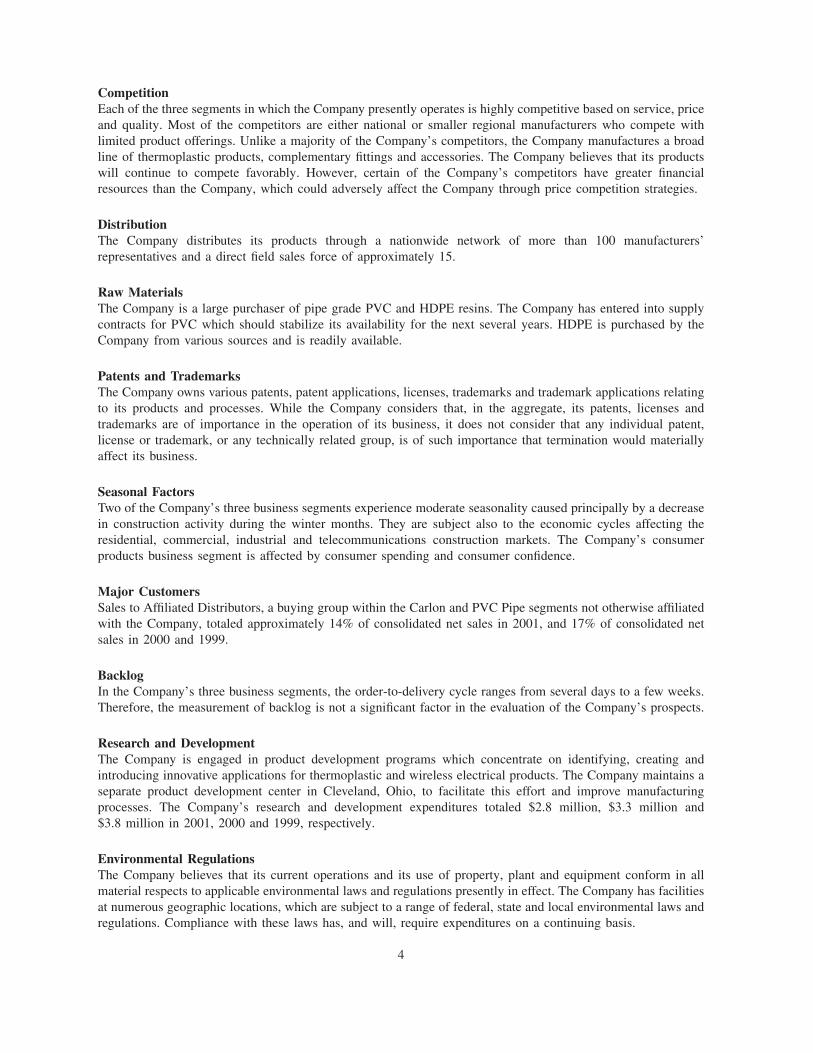
Item 1. BUSINESS
The Lamson & Sessions Co., an Ohio corporation, (the ‘‘Company’’ or ‘‘Lamson & Sessions’’), founded in 1866,is a diversified manufacturer and distributor of a broad line of thermoplastic electrical, consumer, telecommunica-tions and engineered sewer products for major domestic markets. The markets for thermoplastic electricalconduit, related fittings and accessories, wiring devices and sewer pipe include: the construction, utility andtelecommunications industries, municipalities, other government agencies, and contractors; and ‘‘do-it-yourself’’home remodelers.
Principal Products and MarketsThe Company is engaged in the manufacture and distribution of a broad line of thermoplastic electrical,telecommunications and engineered sewer products. In addition, the Company distributes a wide variety ofconsumer electrical wiring devices, home security devices, wireless electrical and other wireless products.
All of the Company’s thermoplastic electrical products compete with and serve as substitutes for similar metallicproducts. The Company’s engineered sewer pipe products compete with and serve as substitutes for clay,concrete, ductile iron, asbestos cement and polyethylene products. The Company’s thermoplastic electricalproducts offer several advantages over these other products. Specifically, nonmetallic electrical and telecommuni-cations conduit and related fittings and accessories are generally less expensive, lighter and easier to install thanmetallic products. They do not rust, corrode or conduct electricity. Thermoplastics, either polyvinyl chloride(PVC) or high density polyethylene (HDPE), are the materials of choice to protect fiber optic cable.Thermoplastic sewer pipe weighs less than alternative products, is easier and more economical to install, does notdegenerate due to chemical attack as do some competing products, and eliminates avoidable problems which canbe caused by infiltration and exfiltration.
Three markets are served, each of which has unique product and marketing requirements. These markets are:
Carlon – Industrial, Residential, Commercial, Telecommunications and Utility Construction: The major cus-tomers served are electrical contractors and distributors, original equipment manufacturers, electric powerutilities, cable television (CATV), telephone and telecommunications companies. The principal products sold bythis segment include electrical and telecommunications raceway systems and a broad line of nonmetallicenclosures, electrical outlet boxes and fittings. Examples of the applications for the products included in thissegment are multi-cell duct systems and HDPE conduit designed to protect underground fiber optic cables,allowing future cabling expansion and flexible conduit used inside buildings to protect communications cable.The 2000 acquisitions of Pyramid Industries, Inc. (‘‘Pyramid’’) and Ameriduct Worldwide, Inc. (‘‘Ameriduct’’)are included as part of the Carlon segment.
Lamson Home Products – Consumer: The major customers served are home centers and mass merchandisersfor the ‘‘do-it-yourself’’ home improvement market. The products included in this segment are electrical outletboxes, liquidtight conduit, electrical fittings, chimes and lighting controls.
PVC Pipe: This business segment primarily supplies electrical, power and communications conduit to theelectrical distribution, telecommunications, consumer and power utility markets. The 1/2-inch to 6-inch electricaland telecommunications conduit is made from PVC and is used to protect wire or fiber optic cables supportingthe infrastructure of our power or telecommunications systems.
A breakdown of net sales as a percent of total net sales by major business segment for 2001, 2000 and 1999, is asfollows:
2001 2000 1999(Dollars in thousands)Carlon $188,161 53% $142,979 41% $120,975 42%Lamson Home Products 62,128 18% 63,351 18% 53,401 18%PVC Pipe 102,383 29% 142,403 41% 117,005 40%
$352,672 100% $348,733 100% $291,381 100%
See discussion of segment products in Note L of financial statements.
3
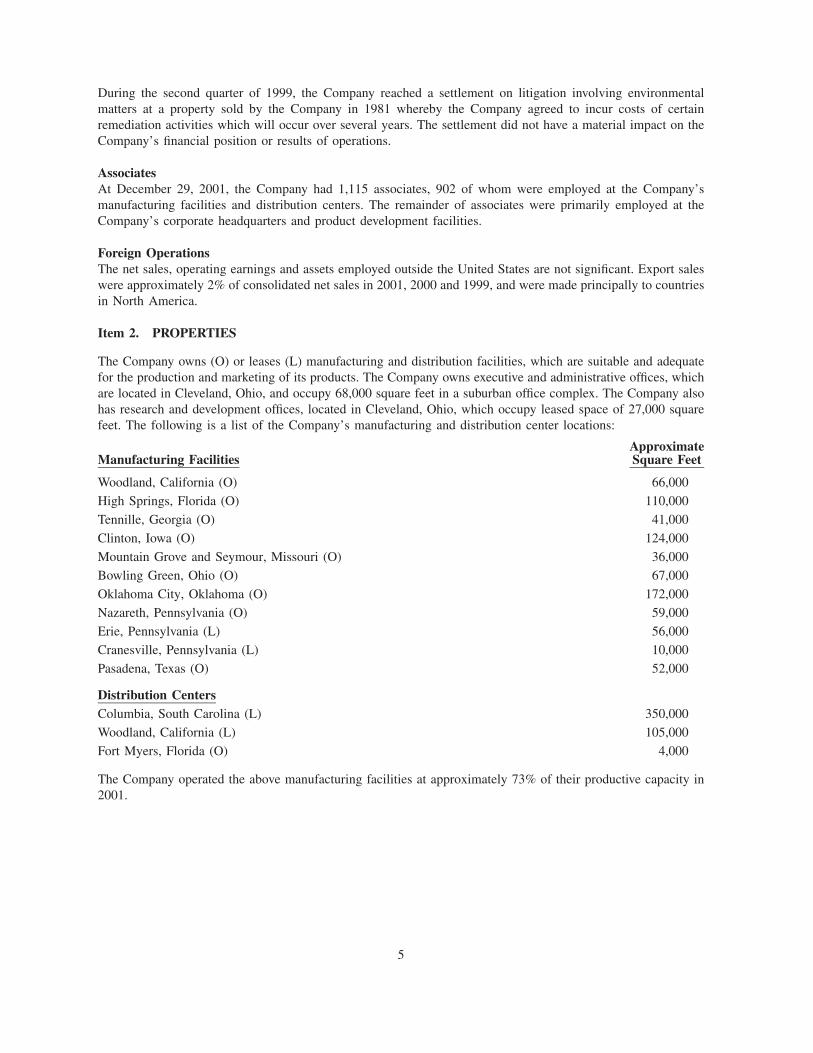
CompetitionEach of the three segments in which the Company presently operates is highly competitive based on service, priceand quality. Most of the competitors are either national or smaller regional manufacturers who compete withlimited product offerings. Unlike a majority of the Company’s competitors, the Company manufactures a broadline of thermoplastic products, complementary fittings and accessories. The Company believes that its productswill continue to compete favorably. However, certain of the Company’s competitors have greater financialresources than the Company, which could adversely affect the Company through price competition strategies.
DistributionThe Company distributes its products through a nationwide network of more than 100 manufacturers’representatives and a direct field sales force of approximately 15.
Raw MaterialsThe Company is a large purchaser of pipe grade PVC and HDPE resins. The Company has entered into supplycontracts for PVC which should stabilize its availability for the next several years. HDPE is purchased by theCompany from various sources and is readily available.
Patents and TrademarksThe Company owns various patents, patent applications, licenses, trademarks and trademark applications relatingto its products and processes. While the Company considers that, in the aggregate, its patents, licenses andtrademarks are of importance in the operation of its business, it does not consider that any individual patent,license or trademark, or any technically related group, is of such importance that termination would materiallyaffect its business.
Seasonal FactorsTwo of the Company’s three business segments experience moderate seasonality caused principally by a decreasein construction activity during the winter months. They are subject also to the economic cycles affecting theresidential, commercial, industrial and telecommunications construction markets. The Company’s consumerproducts business segment is affected by consumer spending and consumer confidence.
Major CustomersSales to Affiliated Distributors, a buying group within the Carlon and PVC Pipe segments not otherwise affiliatedwith the Company, totaled approximately 14% of consolidated net sales in 2001, and 17% of consolidated netsales in 2000 and 1999.
BacklogIn the Company’s three business segments, the order-to-delivery cycle ranges from several days to a few weeks.Therefore, the measurement of backlog is not a significant factor in the evaluation of the Company’s prospects.
Research and DevelopmentThe Company is engaged in product development programs which concentrate on identifying, creating andintroducing innovative applications for thermoplastic and wireless electrical products. The Company maintains aseparate product development center in Cleveland, Ohio, to facilitate this effort and improve manufacturingprocesses. The Company’s research and development expenditures totaled $2.8 million, $3.3 million and$3.8 million in 2001, 2000 and 1999, respectively.
Environmental RegulationsThe Company believes that its current operations and its use of property, plant and equipment conform in allmaterial respects to applicable environmental laws and regulations presently in effect. The Company has facilitiesat numerous geographic locations, which are subject to a range of federal, state and local environmental laws andregulations. Compliance with these laws has, and will, require expenditures on a continuing basis.
4
During the second quarter of 1999, the Company reached a settlement on litigation involving environmentalmatters at a property sold by the Company in 1981 whereby the Company agreed to incur costs of certainremediation activities which will occur over several years. The settlement did not have a material impact on theCompany’s financial position or results of operations.
AssociatesAt December 29, 2001, the Company had 1,115 associates, 902 of whom were employed at the Company’smanufacturing facilities and distribution centers. The remainder of associates were primarily employed at theCompany’s corporate headquarters and product development facilities.
Foreign OperationsThe net sales, operating earnings and assets employed outside the United States are not significant. Export saleswere approximately 2% of consolidated net sales in 2001, 2000 and 1999, and were made principally to countriesin North America.
Item 2. PROPERTIES
The Company owns (O) or leases (L) manufacturing and distribution facilities, which are suitable and adequatefor the production and marketing of its products. The Company owns executive and administrative offices, whichare located in Cleveland, Ohio, and occupy 68,000 square feet in a suburban office complex. The Company alsohas research and development offices, located in Cleveland, Ohio, which occupy leased space of 27,000 squarefeet. The following is a list of the Company’s manufacturing and distribution center locations:
ApproximateManufacturing Facilities Square Feet
Woodland, California (O) 66,000
High Springs, Florida (O) 110,000
Tennille, Georgia (O) 41,000
Clinton, Iowa (O) 124,000
Mountain Grove and Seymour, Missouri (O) 36,000
Bowling Green, Ohio (O) 67,000
Oklahoma City, Oklahoma (O) 172,000
Nazareth, Pennsylvania (O) 59,000
Erie, Pennsylvania (L) 56,000
Cranesville, Pennsylvania (L) 10,000
Pasadena, Texas (O) 52,000
Distribution CentersColumbia, South Carolina (L) 350,000
Woodland, California (L) 105,000
Fort Myers, Florida (O) 4,000
The Company operated the above manufacturing facilities at approximately 73% of their productive capacity in2001.
5
Item 3. LEGAL PROCEEDINGS
On September 23, 1999, the Company announced that a United States District Court jury in the Northern Districtof Illinois found that the Company willfully infringed on a patent held by Intermatic Incorporated (‘‘Intermatic’’)of Spring Grove, Illinois, relating to the design of an in-use weatherproof electrical outlet cover, and awardedIntermatic $12.5 million in damages plus pre-judgment interest of approximately $1.5 million. The Companypursued a vigorous appeal and on December 17, 2001 the United States Court of Appeals ruled that, as a matterof law, Lamson & Sessions’ products did not infringe Intermatic’s patent and that the Company has no liability toIntermatic. The trial jury’s earlier verdict in favor of Intermatic in the amount of $12.5 million, plus pre-judgmentand post-judgment interest estimated to be in excess of $3 million, was reversed. Intermatic filed for a rehearingof the ruling to the Court of Appeals en banc, which was denied. Management has no knowledge of Intermatic’sintention with respect to any further appeals.
During the first quarter of 2001, the Company settled its litigation against PW Eagle and received a payment of$2.05 million, representing a partial recovery of costs incurred in current and previous quarters, arising out of thefailed sale of the PVC Pipe segment in 1999.
The Company is also a party to various other claims and matters of litigation incidental to the normal course of itsbusiness. Management believes that the final resolution of these matters will not have a material adverse effect onthe Company’s financial position, cash flows or results of operations.
Item 4. SUBMISSION OF MATTERS TO SECURITY HOLDERS
None.
6
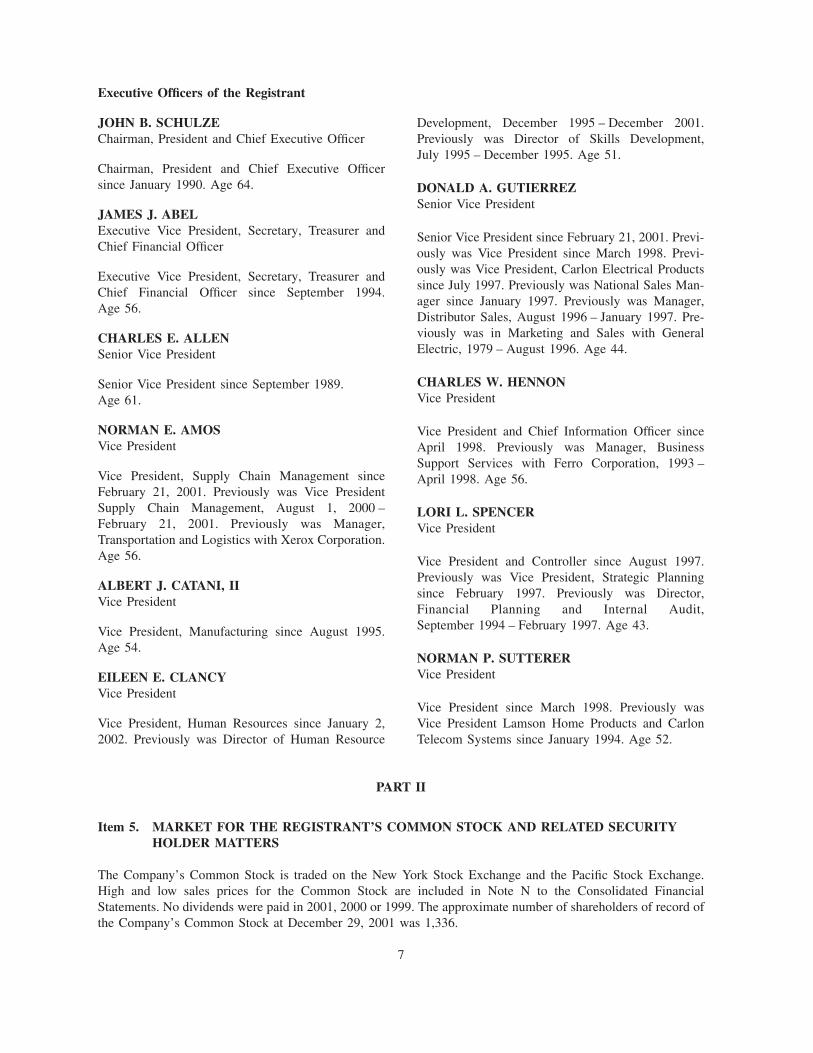
Executive Officers of the Registrant
JOHN B. SCHULZE Development, December 1995 – December 2001.Chairman, President and Chief Executive Officer Previously was Director of Skills Development,
July 1995 – December 1995. Age 51.Chairman, President and Chief Executive Officersince January 1990. Age 64. DONALD A. GUTIERREZ
Senior Vice PresidentJAMES J. ABELExecutive Vice President, Secretary, Treasurer and Senior Vice President since February 21, 2001. Previ-Chief Financial Officer ously was Vice President since March 1998. Previ-
ously was Vice President, Carlon Electrical ProductsExecutive Vice President, Secretary, Treasurer andsince July 1997. Previously was National Sales Man-Chief Financial Officer since September 1994.ager since January 1997. Previously was Manager,Age 56.Distributor Sales, August 1996 – January 1997. Pre-viously was in Marketing and Sales with GeneralCHARLES E. ALLENElectric, 1979 – August 1996. Age 44.Senior Vice President
CHARLES W. HENNONSenior Vice President since September 1989.Vice PresidentAge 61.
NORMAN E. AMOS Vice President and Chief Information Officer sinceVice President April 1998. Previously was Manager, Business
Support Services with Ferro Corporation, 1993 –Vice President, Supply Chain Management since April 1998. Age 56.February 21, 2001. Previously was Vice PresidentSupply Chain Management, August 1, 2000 – LORI L. SPENCERFebruary 21, 2001. Previously was Manager, Vice PresidentTransportation and Logistics with Xerox Corporation.Age 56. Vice President and Controller since August 1997.
Previously was Vice President, Strategic PlanningALBERT J. CATANI, II
since February 1997. Previously was Director,Vice President
Financial Planning and Internal Audit,September 1994 – February 1997. Age 43.Vice President, Manufacturing since August 1995.
Age 54.NORMAN P. SUTTERERVice PresidentEILEEN E. CLANCY
Vice PresidentVice President since March 1998. Previously was
Vice President, Human Resources since January 2, Vice President Lamson Home Products and Carlon2002. Previously was Director of Human Resource Telecom Systems since January 1994. Age 52.
PART II
Item 5. MARKET FOR THE REGISTRANT’S COMMON STOCK AND RELATED SECURITYHOLDER MATTERS
The Company’s Common Stock is traded on the New York Stock Exchange and the Pacific Stock Exchange.High and low sales prices for the Common Stock are included in Note N to the Consolidated FinancialStatements. No dividends were paid in 2001, 2000 or 1999. The approximate number of shareholders of record ofthe Company’s Common Stock at December 29, 2001 was 1,336.
7
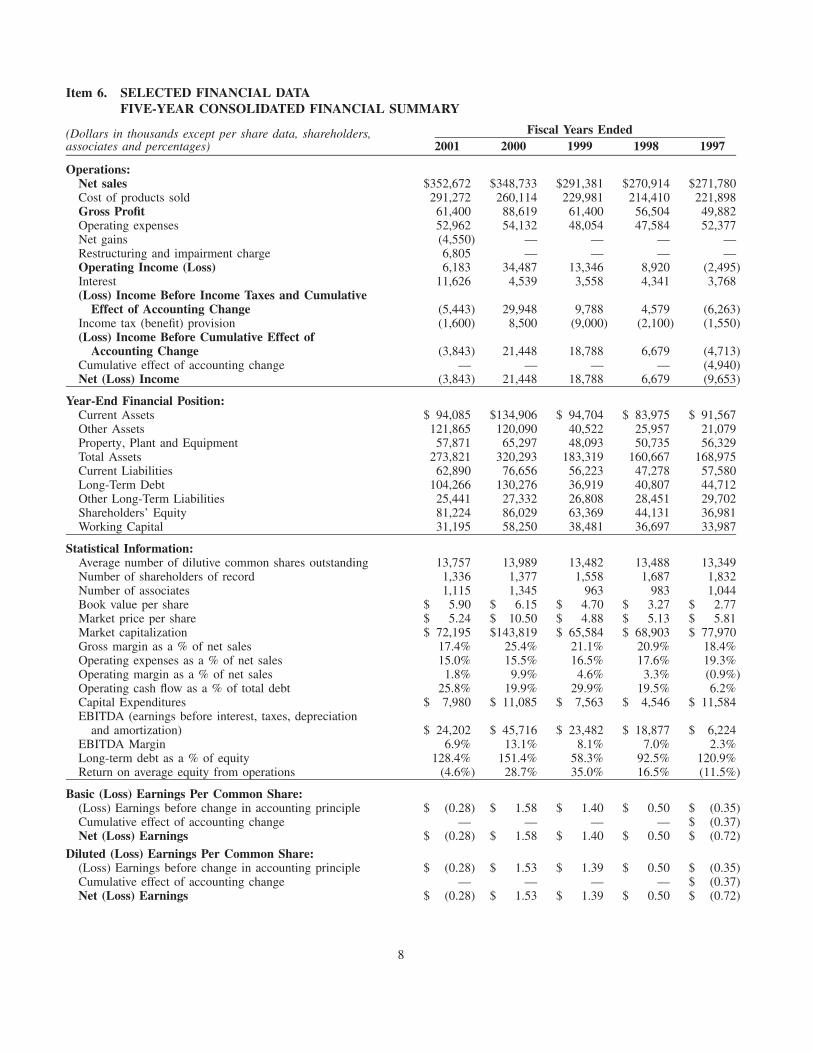
Item 6. SELECTED FINANCIAL DATAFIVE-YEAR CONSOLIDATED FINANCIAL SUMMARY
Fiscal Years Ended(Dollars in thousands except per share data, shareholders,associates and percentages) 2001 2000 1999 1998 1997
Operations:Net sales $352,672 $348,733 $291,381 $270,914 $271,780Cost of products sold 291,272 260,114 229,981 214,410 221,898Gross Profit 61,400 88,619 61,400 56,504 49,882Operating expenses 52,962 54,132 48,054 47,584 52,377Net gains (4,550) — — — —Restructuring and impairment charge 6,805 — — — —Operating Income (Loss) 6,183 34,487 13,346 8,920 (2,495)Interest 11,626 4,539 3,558 4,341 3,768(Loss) Income Before Income Taxes and Cumulative
Effect of Accounting Change (5,443) 29,948 9,788 4,579 (6,263)Income tax (benefit) provision (1,600) 8,500 (9,000) (2,100) (1,550)(Loss) Income Before Cumulative Effect of
Accounting Change (3,843) 21,448 18,788 6,679 (4,713)Cumulative effect of accounting change — — — — (4,940)Net (Loss) Income (3,843) 21,448 18,788 6,679 (9,653)
Year-End Financial Position:Current Assets $ 94,085 $134,906 $ 94,704 $ 83,975 $ 91,567Other Assets 121,865 120,090 40,522 25,957 21,079Property, Plant and Equipment 57,871 65,297 48,093 50,735 56,329Total Assets 273,821 320,293 183,319 160,667 168,975Current Liabilities 62,890 76,656 56,223 47,278 57,580Long-Term Debt 104,266 130,276 36,919 40,807 44,712Other Long-Term Liabilities 25,441 27,332 26,808 28,451 29,702Shareholders’ Equity 81,224 86,029 63,369 44,131 36,981Working Capital 31,195 58,250 38,481 36,697 33,987
Statistical Information:Average number of dilutive common shares outstanding 13,757 13,989 13,482 13,488 13,349Number of shareholders of record 1,336 1,377 1,558 1,687 1,832Number of associates 1,115 1,345 963 983 1,044Book value per share $ 5.90 $ 6.15 $ 4.70 $ 3.27 $ 2.77Market price per share $ 5.24 $ 10.50 $ 4.88 $ 5.13 $ 5.81Market capitalization $ 72,195 $143,819 $ 65,584 $ 68,903 $ 77,970Gross margin as a % of net sales 17.4% 25.4% 21.1% 20.9% 18.4%Operating expenses as a % of net sales 15.0% 15.5% 16.5% 17.6% 19.3%Operating margin as a % of net sales 1.8% 9.9% 4.6% 3.3% (0.9%)Operating cash flow as a % of total debt 25.8% 19.9% 29.9% 19.5% 6.2%Capital Expenditures $ 7,980 $ 11,085 $ 7,563 $ 4,546 $ 11,584EBITDA (earnings before interest, taxes, depreciation
and amortization) $ 24,202 $ 45,716 $ 23,482 $ 18,877 $ 6,224EBITDA Margin 6.9% 13.1% 8.1% 7.0% 2.3%Long-term debt as a % of equity 128.4% 151.4% 58.3% 92.5% 120.9%Return on average equity from operations (4.6%) 28.7% 35.0% 16.5% (11.5%)
Basic (Loss) Earnings Per Common Share:(Loss) Earnings before change in accounting principle $ (0.28) $ 1.58 $ 1.40 $ 0.50 $ (0.35)Cumulative effect of accounting change — — — — $ (0.37)Net (Loss) Earnings $ (0.28) $ 1.58 $ 1.40 $ 0.50 $ (0.72)
Diluted (Loss) Earnings Per Common Share:(Loss) Earnings before change in accounting principle $ (0.28) $ 1.53 $ 1.39 $ 0.50 $ (0.35)Cumulative effect of accounting change — — — — $ (0.37)Net (Loss) Earnings $ (0.28) $ 1.53 $ 1.39 $ 0.50 $ (0.72)
8
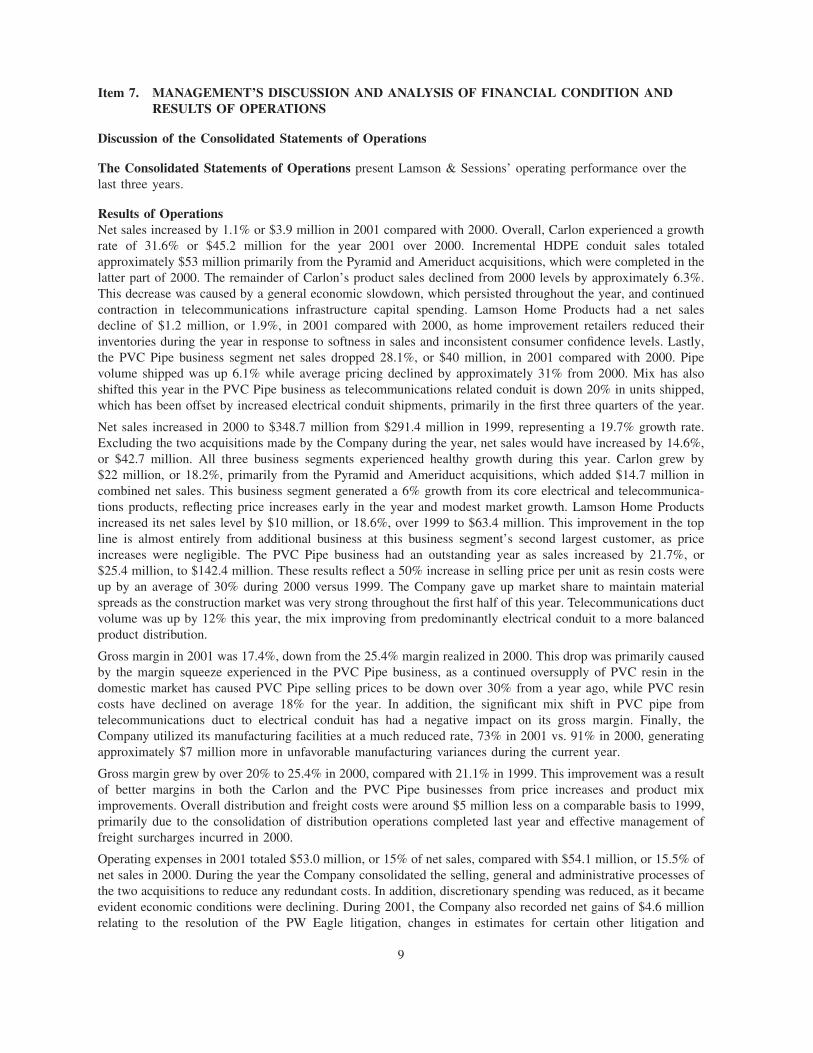
Item 7. MANAGEMENT’S DISCUSSION AND ANALYSIS OF FINANCIAL CONDITION ANDRESULTS OF OPERATIONS
Discussion of the Consolidated Statements of Operations
The Consolidated Statements of Operations present Lamson & Sessions’ operating performance over thelast three years.
Results of OperationsNet sales increased by 1.1% or $3.9 million in 2001 compared with 2000. Overall, Carlon experienced a growthrate of 31.6% or $45.2 million for the year 2001 over 2000. Incremental HDPE conduit sales totaledapproximately $53 million primarily from the Pyramid and Ameriduct acquisitions, which were completed in thelatter part of 2000. The remainder of Carlon’s product sales declined from 2000 levels by approximately 6.3%.This decrease was caused by a general economic slowdown, which persisted throughout the year, and continuedcontraction in telecommunications infrastructure capital spending. Lamson Home Products had a net salesdecline of $1.2 million, or 1.9%, in 2001 compared with 2000, as home improvement retailers reduced theirinventories during the year in response to softness in sales and inconsistent consumer confidence levels. Lastly,the PVC Pipe business segment net sales dropped 28.1%, or $40 million, in 2001 compared with 2000. Pipevolume shipped was up 6.1% while average pricing declined by approximately 31% from 2000. Mix has alsoshifted this year in the PVC Pipe business as telecommunications related conduit is down 20% in units shipped,which has been offset by increased electrical conduit shipments, primarily in the first three quarters of the year.
Net sales increased in 2000 to $348.7 million from $291.4 million in 1999, representing a 19.7% growth rate.Excluding the two acquisitions made by the Company during the year, net sales would have increased by 14.6%,or $42.7 million. All three business segments experienced healthy growth during this year. Carlon grew by$22 million, or 18.2%, primarily from the Pyramid and Ameriduct acquisitions, which added $14.7 million incombined net sales. This business segment generated a 6% growth from its core electrical and telecommunica-tions products, reflecting price increases early in the year and modest market growth. Lamson Home Productsincreased its net sales level by $10 million, or 18.6%, over 1999 to $63.4 million. This improvement in the topline is almost entirely from additional business at this business segment’s second largest customer, as priceincreases were negligible. The PVC Pipe business had an outstanding year as sales increased by 21.7%, or$25.4 million, to $142.4 million. These results reflect a 50% increase in selling price per unit as resin costs wereup by an average of 30% during 2000 versus 1999. The Company gave up market share to maintain materialspreads as the construction market was very strong throughout the first half of this year. Telecommunications ductvolume was up by 12% this year, the mix improving from predominantly electrical conduit to a more balancedproduct distribution.
Gross margin in 2001 was 17.4%, down from the 25.4% margin realized in 2000. This drop was primarily causedby the margin squeeze experienced in the PVC Pipe business, as a continued oversupply of PVC resin in thedomestic market has caused PVC Pipe selling prices to be down over 30% from a year ago, while PVC resincosts have declined on average 18% for the year. In addition, the significant mix shift in PVC pipe fromtelecommunications duct to electrical conduit has had a negative impact on its gross margin. Finally, theCompany utilized its manufacturing facilities at a much reduced rate, 73% in 2001 vs. 91% in 2000, generatingapproximately $7 million more in unfavorable manufacturing variances during the current year.
Gross margin grew by over 20% to 25.4% in 2000, compared with 21.1% in 1999. This improvement was a resultof better margins in both the Carlon and the PVC Pipe businesses from price increases and product miximprovements. Overall distribution and freight costs were around $5 million less on a comparable basis to 1999,primarily due to the consolidation of distribution operations completed last year and effective management offreight surcharges incurred in 2000.
Operating expenses in 2001 totaled $53.0 million, or 15% of net sales, compared with $54.1 million, or 15.5% ofnet sales in 2000. During the year the Company consolidated the selling, general and administrative processes ofthe two acquisitions to reduce any redundant costs. In addition, discretionary spending was reduced, as it becameevident economic conditions were declining. During 2001, the Company also recorded net gains of $4.6 millionrelating to the resolution of the PW Eagle litigation, changes in estimates for certain other litigation and
9
environmental liabilities and a gain on the sale of a non-strategic business. The Company also incurred arestructuring and impairment charge of $7.7 million to reduce excess capacity, eliminate underperformingproduct lines and reduce salaried staff of which $.9 million was included in cost of products sold. In summary,the Company earned $6.2 million in operating income, or 1.8% of net sales, in 2001 ($9.4 million, or 2.7%,excluding the restructuring and impairment charge and net gains) vs. $34.5 million, or 9.9%, of net sales in 2000.
Operating expenses were $54.1 million in 2000 ($6.1 million higher than 1999), or 15.5% of net sales, comparedwith 16.5% of net sales in 1999. Continued productivity improvements in general administrative activities offsetincreases in sales commission and legal, professional and acquisition related expenses. The result was more thana two-and-a-half times increase in operating income to $34.5 million (9.9% of net sales) in 2000 versus$13.3 million (4.6% of net sales) in 1999.
Interest expense increased by $7 million in 2001 due to the acquisition debt of approximately $113 million added inlate 2000. The Company had an average borrowing rate during 2001 of 6.81% compared with 7.85% in 2000.
The Company’s earnings before interest, taxes, depreciation and amortization (EBITDA) was $24.2 million for2001 compared with the $45.7 million EBITDA earned in 2000.
Financial ConditionDespite the lower operating income in 2001, the Company focused on generating cash flow from working capitalreductions. Working capital was $31.2 million at the end of 2001 compared with $58.3 million at the end of 2000.The current ratio decreased to 1.50 in 2001 from 1.76 in 2000 as accounts receivable and inventory declined by acombined $34.9 million from lower economic activity and improved inventory control, while payables andaccruals declined by $17.7 million. Cash flow generated from operating activities was a strong $30.1 million in2001 vs. $27.5 million in 2000.
Accounts receivable were $39.2 million at the end of 2001, compared with $56.6 million at the end of 2000. Dayssales outstanding in 2001 were about 49.5 and approximately the same as the 50.8 days for 2000.
Inventory levels at the end of 2001 were $42.1 million compared with $59.6 million at the end of 2000. As aresult, annual inventory turns increased from 3.9 times in 2000 to 4.9 times in 2001. All inventory categories havebeen reduced. However, the largest reduction came in PVC resin and related products for which pounds ininventory were 6% lower and average unit cost at year-end was more than 30% below the 2000 year-end levels.
Accounts payable decreased by $6.6 million in 2001 from the prior year-end, primarily from the purchasing ofraw material inventory and lower unit costs for these items.
The current balance in deferred tax assets decreased due to lower than expected 2002 operating results limitingthe short-term utilization of net operating losses. Accrued liabilities at 2001 year-end were approximately$11 million less than the prior year, as the final purchase price adjustment for Ameriduct was paid in 2001;incentive compensation is lower in the current year; and legal and environmental liabilities have been adjusted toreflect current evaluations of these items. The current portion of long-term debt has increased to reflect theamortization schedule of term debt provided in our credit agreement. The strong operating cash flow experiencedin the fourth quarter of the year allowed the Company to pay down debt by over $22 million during 2001, a15.9% reduction.
Capital expenditures totaled approximately $8.0 million in 2001 compared with $11.1 million in 2000. Thecurrent year spending was primarily for distribution center productivity, new product tooling and qualityenhancements.
The Company has adequate credit capacity available to support its current operational expense and capitalspending needs as well as those anticipated for the remainder of 2002. However, the Company has beenexperiencing lower earnings levels in its PVC Pipe business, reflecting an oversupply of raw material available tosupport existing market demand as well as extremely low demand levels in the telecommunications infrastructuremarket, which is expected to continue through 2002. Unless the EBITDA level improves sufficiently, theCompany will seek a further amendment to its secured credit agreement in order to prevent a covenant violationand, concurrently, evaluate changes to its capital structure in order to ensure an appropriate degree of financialflexibility. The Company has commenced negotiations of such an amendment so that it can be entered into beforea covenant violation occurs.
10
OutlookThe following paragraphs contain forward-looking comments. The comments are subject to, and the actual futureresults may be impacted by, the cautionary limitations and factors outlined in the following narrative comments.
The Company’s sales have been supported by a very steady residential construction base throughout 2000 and2001. Housing starts are expected to decline modestly during the first half of 2002 from the 1.5 million unit levelto closer to a 1.4 million unit level before trending back up in the second half of 2002. These levels are still fairlystrong compared with previous economic downturns. Interest rate cuts should help maintain the level of existinghome sales, which contributes to home improvement product sales of Lamson Home Products. Constructionspending in the industrial and commercial markets are expected to be weaker than the general market, which maycause a lag in the recovery of our PVC Pipe business segment.
The telecommunications infrastructure market spending remains weak as telephone and cable TV companies’capital spending plans continue to be reduced. This situation is not expected to improve appreciably until thefourth quarter of 2002, or the first half of 2003. Spending in this market is required long term, we believe, to buildout the metropolitan rings, expand corporate and institutional high-speed data and communications networks andto provide broadband services to the home. As part of the restructuring charge taken in 2001, the Company hasreduced the capacity of its HDPE assets servicing this market by eliminating excess equipment and consolidatingoperations. The Company is also exploring other market opportunities such as gas collection, water drainage andsewer markets to better utilize its manufacturing capacity while the telecommunications market remains soft.
We believe that the cost of PVC resin may be near a cyclical floor during the fourth quarter of 2001, as PVC resinmanufacturing companies are expressing that they are selling resin for almost their cash cost and several haveannounced price increases in the first quarter of 2002. This, along with reduced inventories channel-wide andincreased feed stock costs, should cause a stabilization of pricing in the market. Additional PVC resinmanufacturing capacity scheduled to be brought up the first part of 2002 along with the lower projected U.S.construction activity the first half of the year, however, will keep the pricing environment competitive.Improvement in the PVC Pipe segment will require further substantial improvement in the PVC export market,particularly in the Pacific Rim to absorb the current supply imbalance in the domestic market and stabilize thesecosts. Should the supply/demand imbalance be resolved by a strengthened export market, price levels in the PVCPipe business segment could improve quickly and more than offset a modest softening of demand in theindustrial/commercial market in 2002.
This Management’s Discussion and Analysis of Financial Condition and Results of Operations containsexpectations that are forward-looking statements that involve risks and uncertainties within the meaning of thePrivate Securities Litigation Reform Act of 1995. Actual results may differ materially from those expected as aresult of a variety of factors, such as: (i) the volatility of resin pricing, (ii) the ability of the Company to passthrough raw material cost increases to its customers, (iii) maintaining a stable level of housing starts,telecommunications infrastructure spending, consumer confidence and general construction trends, (iv) furtherdeterioration in the country’s general economic condition affecting the markets for the Company’s products and(v) the ability of the Company to obtain an amendment to its secured credit agreement.
Item 7(a). MARKET RISK DISCLOSURES
The following discussion about the Company’s market risk disclosures involves forward-looking statements.Actual results could differ materially from those projected in the forward-looking statements. The Company isexposed to market risk related to changes in interest rates and commodity prices for PVC and HDPE resins. TheCompany does not use derivative financial instruments for speculative or trading purposes.
Almost all of the Company’s long-term debt obligations bear interest at a variable rate. In order to mitigate therisk associated with interest rate fluctuations, in the first quarter of 2001, the Company entered into two interestrate swap agreements for a total notional amount of $58.5 million and effectively fixed the variable rate debt at5.41% and 5.48% plus the Company’s risk premium of 1.5% to 3.5%. The notional amount is used to calculatethe contractual cash flow to be exchanged and does not represent exposure to credit loss.
These risks and others that are detailed in this Form 10-K must be considered by any investor or potential investorin the Company.
11
THE LAMSON & SESSIONS CO. AND SUBSIDIARIES
INDEX TO CONSOLIDATED FINANCIAL STATEMENTSAND FINANCIAL STATEMENT SCHEDULE
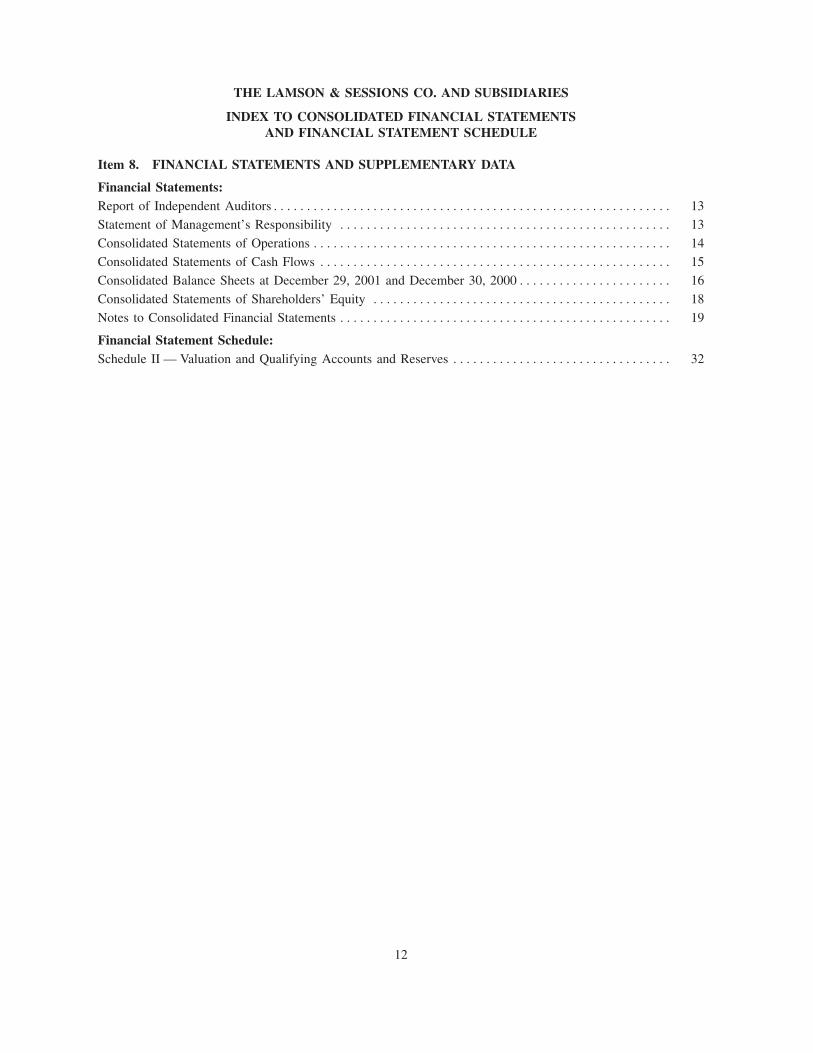
Item 8. FINANCIAL STATEMENTS AND SUPPLEMENTARY DATA
Financial Statements:Report of Independent Auditors************************************************************ 13
Statement of Management’s Responsibility ************************************************** 13
Consolidated Statements of Operations ****************************************************** 14
Consolidated Statements of Cash Flows ***************************************************** 15
Consolidated Balance Sheets at December 29, 2001 and December 30, 2000*********************** 16
Consolidated Statements of Shareholders’ Equity ********************************************* 18
Notes to Consolidated Financial Statements ************************************************** 19
Financial Statement Schedule:Schedule II — Valuation and Qualifying Accounts and Reserves ********************************* 32
12
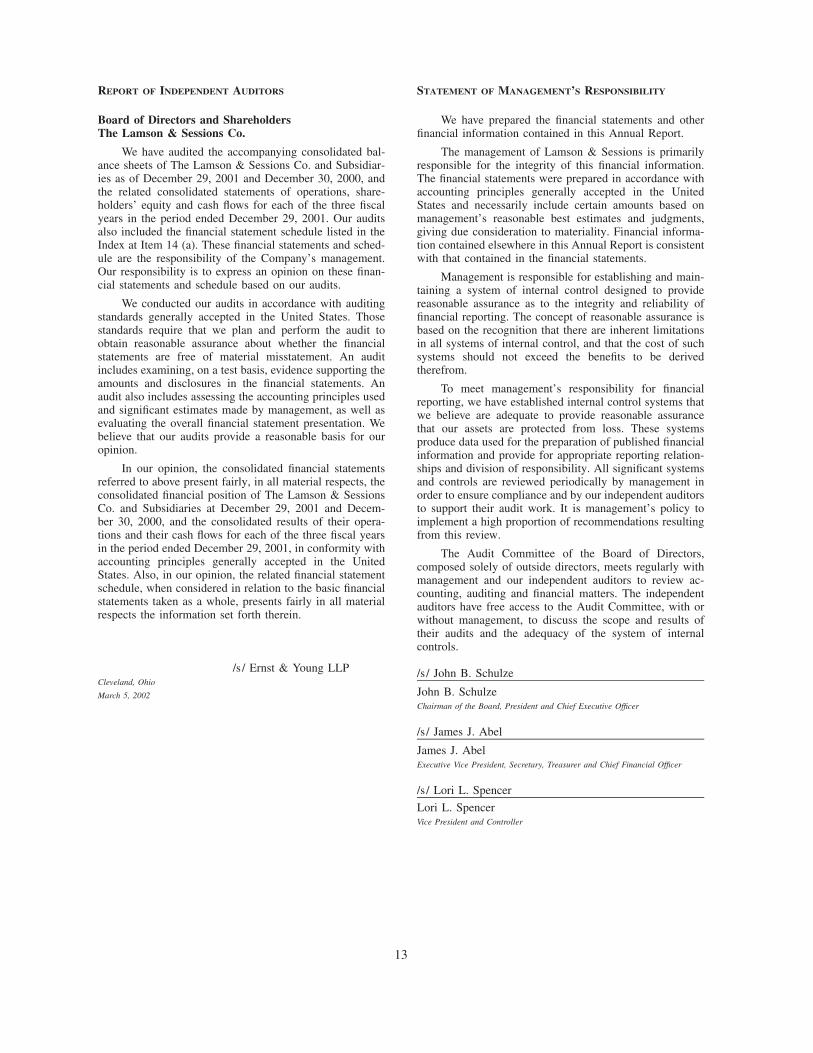
REPORT OF INDEPENDENT AUDITORS STATEMENT OF MANAGEMENT’S RESPONSIBILITY
Board of Directors and Shareholders We have prepared the financial statements and otherThe Lamson & Sessions Co. financial information contained in this Annual Report.
We have audited the accompanying consolidated bal- The management of Lamson & Sessions is primarilyance sheets of The Lamson & Sessions Co. and Subsidiar- responsible for the integrity of this financial information.ies as of December 29, 2001 and December 30, 2000, and The financial statements were prepared in accordance withthe related consolidated statements of operations, share- accounting principles generally accepted in the Unitedholders’ equity and cash flows for each of the three fiscal States and necessarily include certain amounts based onyears in the period ended December 29, 2001. Our audits management’s reasonable best estimates and judgments,also included the financial statement schedule listed in the giving due consideration to materiality. Financial informa-Index at Item 14 (a). These financial statements and sched- tion contained elsewhere in this Annual Report is consistentule are the responsibility of the Company’s management. with that contained in the financial statements.Our responsibility is to express an opinion on these finan- Management is responsible for establishing and main-cial statements and schedule based on our audits. taining a system of internal control designed to provide
We conducted our audits in accordance with auditing reasonable assurance as to the integrity and reliability ofstandards generally accepted in the United States. Those financial reporting. The concept of reasonable assurance isstandards require that we plan and perform the audit to based on the recognition that there are inherent limitationsobtain reasonable assurance about whether the financial in all systems of internal control, and that the cost of suchstatements are free of material misstatement. An audit systems should not exceed the benefits to be derivedincludes examining, on a test basis, evidence supporting the therefrom.amounts and disclosures in the financial statements. An To meet management’s responsibility for financialaudit also includes assessing the accounting principles used reporting, we have established internal control systems thatand significant estimates made by management, as well as we believe are adequate to provide reasonable assuranceevaluating the overall financial statement presentation. We that our assets are protected from loss. These systemsbelieve that our audits provide a reasonable basis for our produce data used for the preparation of published financialopinion. information and provide for appropriate reporting relation-
In our opinion, the consolidated financial statements ships and division of responsibility. All significant systemsreferred to above present fairly, in all material respects, the and controls are reviewed periodically by management inconsolidated financial position of The Lamson & Sessions order to ensure compliance and by our independent auditorsCo. and Subsidiaries at December 29, 2001 and Decem- to support their audit work. It is management’s policy tober 30, 2000, and the consolidated results of their opera- implement a high proportion of recommendations resultingtions and their cash flows for each of the three fiscal years from this review.in the period ended December 29, 2001, in conformity with The Audit Committee of the Board of Directors,accounting principles generally accepted in the United composed solely of outside directors, meets regularly withStates. Also, in our opinion, the related financial statement management and our independent auditors to review ac-schedule, when considered in relation to the basic financial counting, auditing and financial matters. The independentstatements taken as a whole, presents fairly in all material auditors have free access to the Audit Committee, with orrespects the information set forth therein. without management, to discuss the scope and results of
their audits and the adequacy of the system of internalcontrols.
/s / Ernst & Young LLP /s/ John B. SchulzeCleveland, Ohio
John B. SchulzeMarch 5, 2002Chairman of the Board, President and Chief Executive Officer
/s / James J. Abel
James J. AbelExecutive Vice President, Secretary, Treasurer and Chief Financial Officer
/s / Lori L. Spencer
Lori L. SpencerVice President and Controller
13
THE LAMSON & SESSIONS CO. AND SUBSIDIARIES
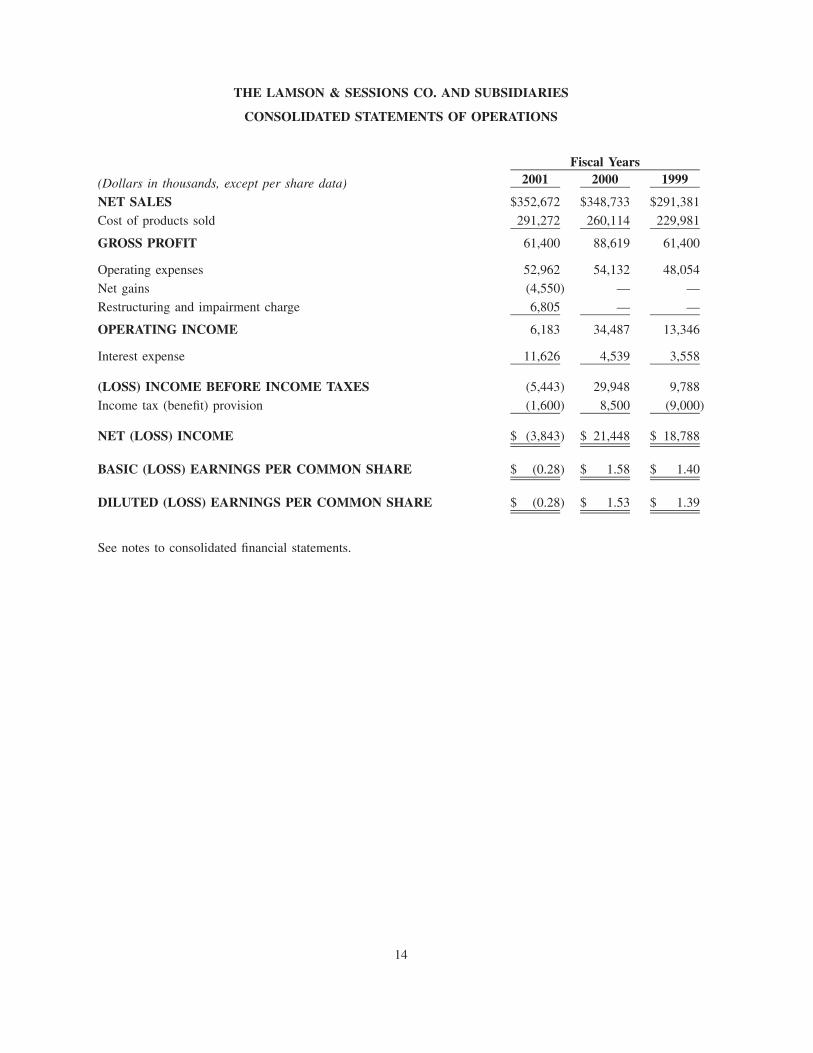
CONSOLIDATED STATEMENTS OF OPERATIONS
Fiscal Years2001 2000 1999(Dollars in thousands, except per share data)
NET SALES $352,672 $348,733 $291,381
Cost of products sold 291,272 260,114 229,981
GROSS PROFIT 61,400 88,619 61,400
Operating expenses 52,962 54,132 48,054
Net gains (4,550) — —
Restructuring and impairment charge 6,805 — —
OPERATING INCOME 6,183 34,487 13,346
Interest expense 11,626 4,539 3,558
(LOSS) INCOME BEFORE INCOME TAXES (5,443) 29,948 9,788
Income tax (benefit) provision (1,600) 8,500 (9,000)
NET (LOSS) INCOME $ (3,843) $ 21,448 $ 18,788
BASIC (LOSS) EARNINGS PER COMMON SHARE $ (0.28) $ 1.58 $ 1.40
DILUTED (LOSS) EARNINGS PER COMMON SHARE $ (0.28) $ 1.53 $ 1.39
See notes to consolidated financial statements.
14
THE LAMSON & SESSIONS CO. AND SUBSIDIARIES
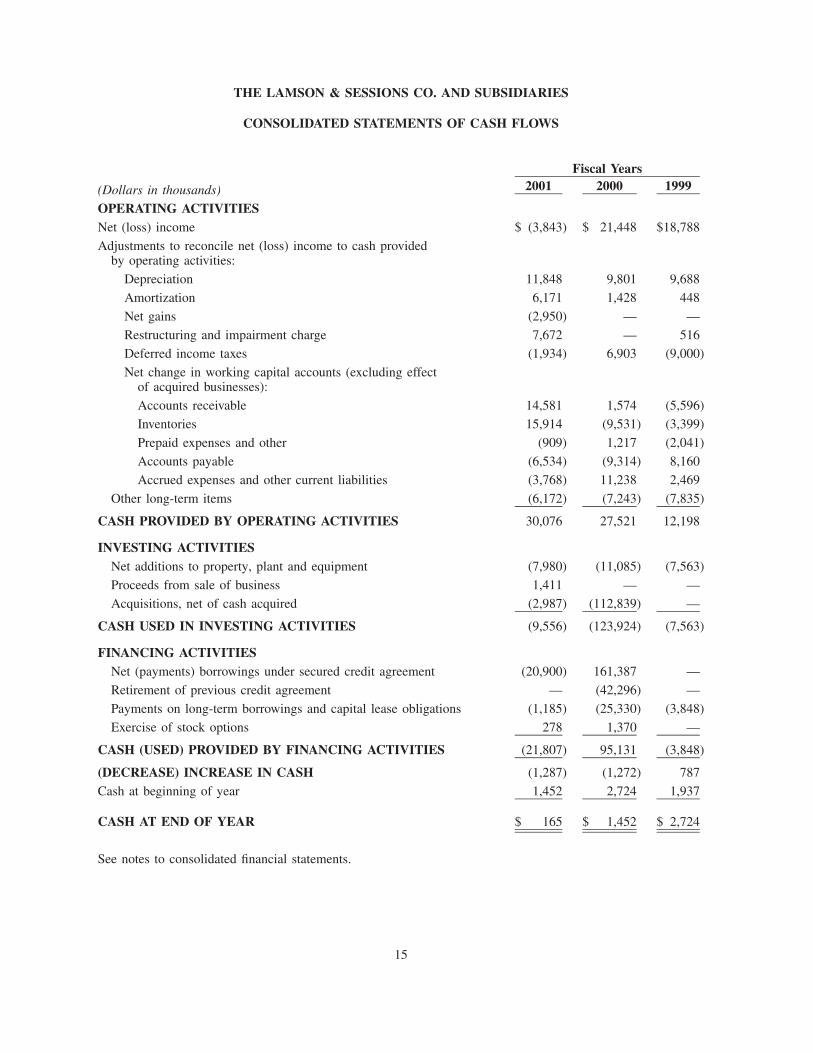
CONSOLIDATED STATEMENTS OF CASH FLOWS
Fiscal Years2001 2000 1999(Dollars in thousands)
OPERATING ACTIVITIESNet (loss) income $ (3,843) $ 21,448 $18,788
Adjustments to reconcile net (loss) income to cash providedby operating activities:
Depreciation 11,848 9,801 9,688
Amortization 6,171 1,428 448
Net gains (2,950) — —
Restructuring and impairment charge 7,672 — 516
Deferred income taxes (1,934) 6,903 (9,000)
Net change in working capital accounts (excluding effectof acquired businesses):
Accounts receivable 14,581 1,574 (5,596)
Inventories 15,914 (9,531) (3,399)
Prepaid expenses and other (909) 1,217 (2,041)
Accounts payable (6,534) (9,314) 8,160
Accrued expenses and other current liabilities (3,768) 11,238 2,469
Other long-term items (6,172) (7,243) (7,835)
CASH PROVIDED BY OPERATING ACTIVITIES 30,076 27,521 12,198
INVESTING ACTIVITIESNet additions to property, plant and equipment (7,980) (11,085) (7,563)
Proceeds from sale of business 1,411 — —
Acquisitions, net of cash acquired (2,987) (112,839) —
CASH USED IN INVESTING ACTIVITIES (9,556) (123,924) (7,563)
FINANCING ACTIVITIESNet (payments) borrowings under secured credit agreement (20,900) 161,387 —
Retirement of previous credit agreement — (42,296) —
Payments on long-term borrowings and capital lease obligations (1,185) (25,330) (3,848)
Exercise of stock options 278 1,370 —
CASH (USED) PROVIDED BY FINANCING ACTIVITIES (21,807) 95,131 (3,848)
(DECREASE) INCREASE IN CASH (1,287) (1,272) 787
Cash at beginning of year 1,452 2,724 1,937
CASH AT END OF YEAR $ 165 $ 1,452 $ 2,724
See notes to consolidated financial statements.
15
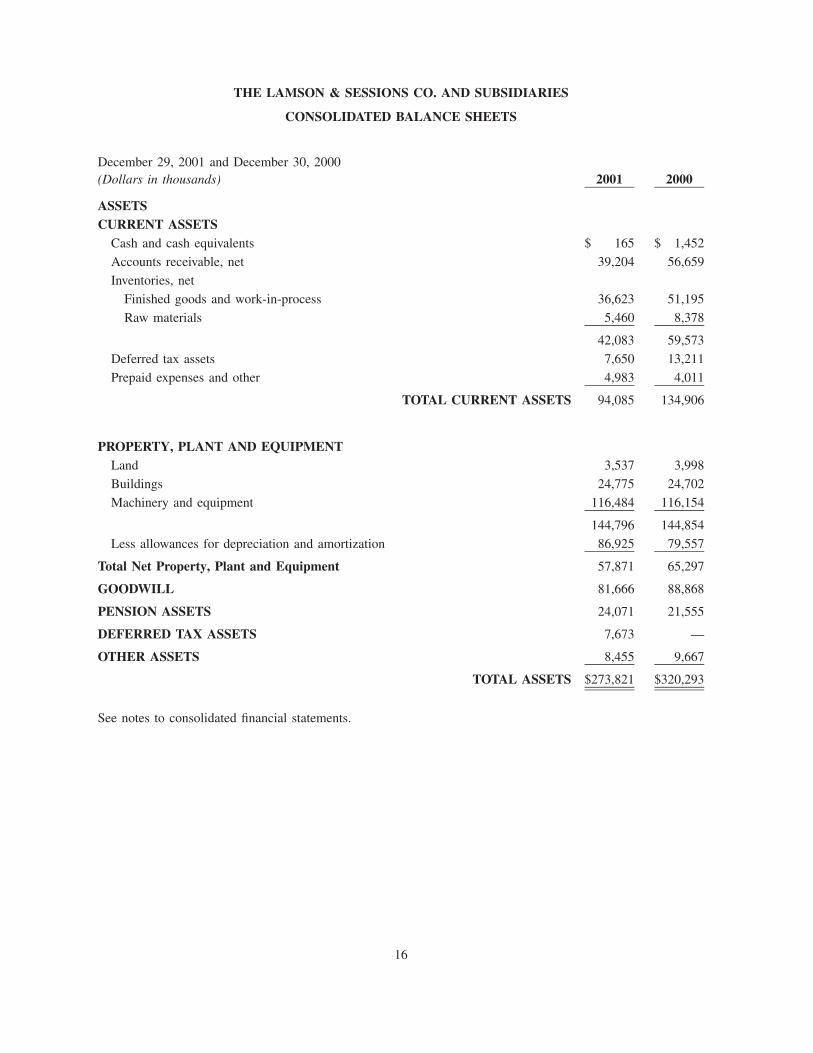
THE LAMSON & SESSIONS CO. AND SUBSIDIARIES
CONSOLIDATED BALANCE SHEETS
December 29, 2001 and December 30, 2000(Dollars in thousands) 2001 2000
ASSETSCURRENT ASSETS
Cash and cash equivalents $ 165 $ 1,452
Accounts receivable, net 39,204 56,659
Inventories, net
Finished goods and work-in-process 36,623 51,195
Raw materials 5,460 8,378
42,083 59,573
Deferred tax assets 7,650 13,211
Prepaid expenses and other 4,983 4,011
TOTAL CURRENT ASSETS 94,085 134,906
PROPERTY, PLANT AND EQUIPMENTLand 3,537 3,998
Buildings 24,775 24,702
Machinery and equipment 116,484 116,154
144,796 144,854
Less allowances for depreciation and amortization 86,925 79,557
Total Net Property, Plant and Equipment 57,871 65,297
GOODWILL 81,666 88,868
PENSION ASSETS 24,071 21,555
DEFERRED TAX ASSETS 7,673 —
OTHER ASSETS 8,455 9,667
TOTAL ASSETS $273,821 $320,293
See notes to consolidated financial statements.
16
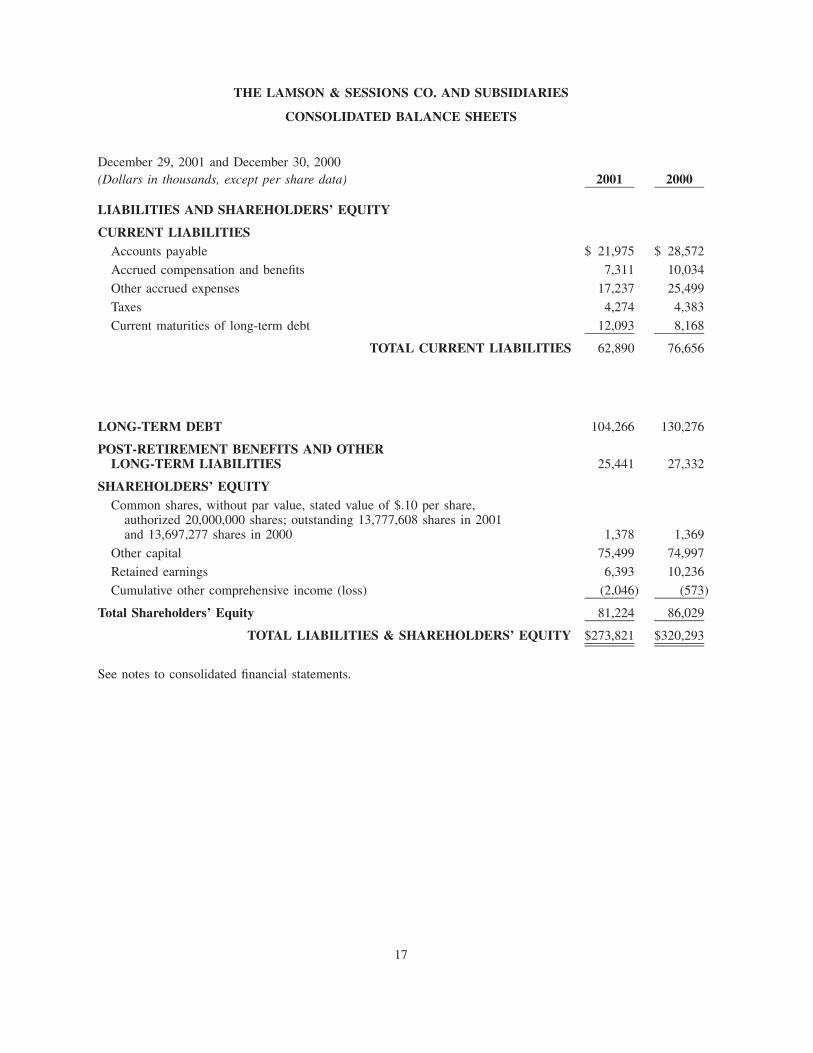
THE LAMSON & SESSIONS CO. AND SUBSIDIARIES
CONSOLIDATED BALANCE SHEETS
December 29, 2001 and December 30, 2000(Dollars in thousands, except per share data) 2001 2000
LIABILITIES AND SHAREHOLDERS’ EQUITY
CURRENT LIABILITIESAccounts payable $ 21,975 $ 28,572
Accrued compensation and benefits 7,311 10,034
Other accrued expenses 17,237 25,499
Taxes 4,274 4,383
Current maturities of long-term debt 12,093 8,168
TOTAL CURRENT LIABILITIES 62,890 76,656
LONG-TERM DEBT 104,266 130,276
POST-RETIREMENT BENEFITS AND OTHERLONG-TERM LIABILITIES 25,441 27,332
SHAREHOLDERS’ EQUITYCommon shares, without par value, stated value of $.10 per share,
authorized 20,000,000 shares; outstanding 13,777,608 shares in 2001and 13,697,277 shares in 2000 1,378 1,369
Other capital 75,499 74,997
Retained earnings 6,393 10,236
Cumulative other comprehensive income (loss) (2,046) (573)
Total Shareholders’ Equity 81,224 86,029
TOTAL LIABILITIES & SHAREHOLDERS’ EQUITY $273,821 $320,293
See notes to consolidated financial statements.
17
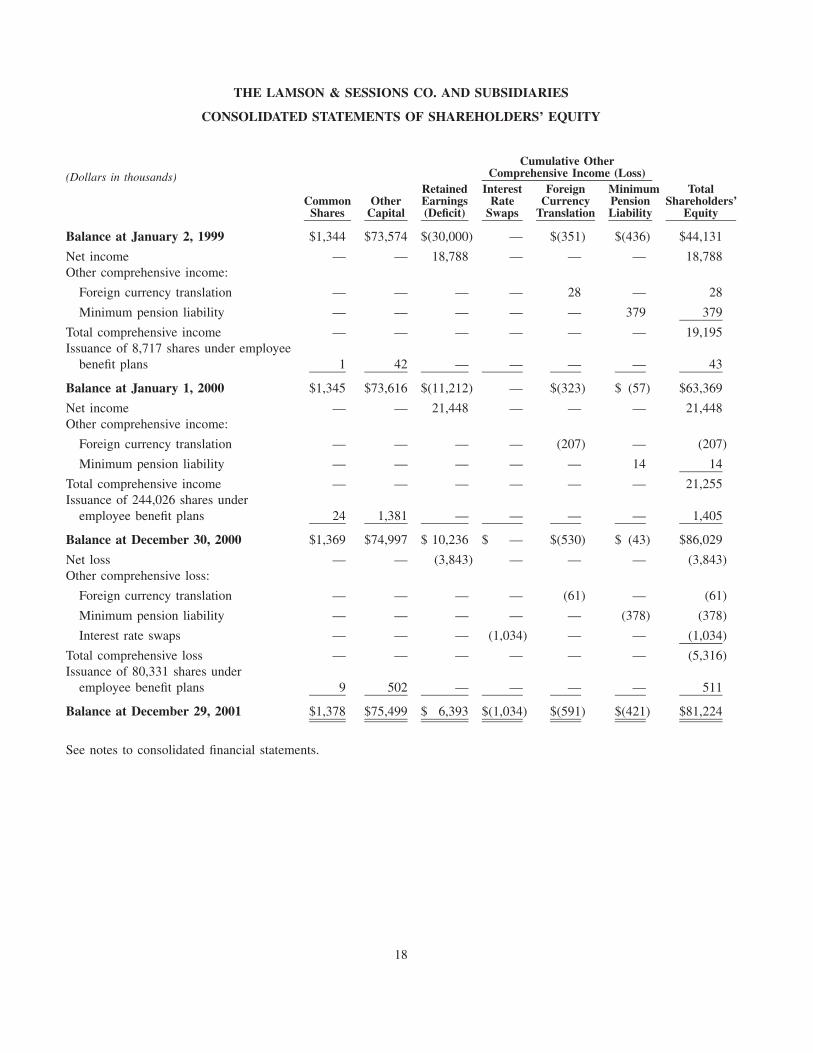
THE LAMSON & SESSIONS CO. AND SUBSIDIARIES
CONSOLIDATED STATEMENTS OF SHAREHOLDERS’ EQUITY
Cumulative OtherComprehensive Income (Loss)(Dollars in thousands)
Retained Interest Foreign Minimum TotalCommon Other Earnings Rate Currency Pension Shareholders’
Shares Capital (Deficit) Swaps Translation Liability Equity
Balance at January 2, 1999 $1,344 $73,574 $(30,000) — $(351) $(436) $44,131
Net income — — 18,788 — — — 18,788Other comprehensive income:
Foreign currency translation — — — — 28 — 28
Minimum pension liability — — — — — 379 379
Total comprehensive income — — — — — — 19,195Issuance of 8,717 shares under employee
benefit plans 1 42 — — — — 43
Balance at January 1, 2000 $1,345 $73,616 $(11,212) — $(323) $ (57) $63,369
Net income — — 21,448 — — — 21,448Other comprehensive income:
Foreign currency translation — — — — (207) — (207)
Minimum pension liability — — — — — 14 14
Total comprehensive income — — — — — — 21,255Issuance of 244,026 shares under
employee benefit plans 24 1,381 — — — — 1,405
Balance at December 30, 2000 $1,369 $74,997 $ 10,236 $ — $(530) $ (43) $86,029
Net loss — — (3,843) — — — (3,843)Other comprehensive loss:
Foreign currency translation — — — — (61) — (61)
Minimum pension liability — — — — — (378) (378)
Interest rate swaps — — — (1,034) — — (1,034)
Total comprehensive loss — — — — — — (5,316)Issuance of 80,331 shares under
employee benefit plans 9 502 — — — — 511
Balance at December 29, 2001 $1,378 $75,499 $ 6,393 $(1,034) $(591) $(421) $81,224
See notes to consolidated financial statements.
18
THE LAMSON & SESSIONS CO. AND SUBSIDIARIES
NOTES TO CONSOLIDATED FINANCIAL STATEMENTS
Three fiscal years ended December 29, 2001
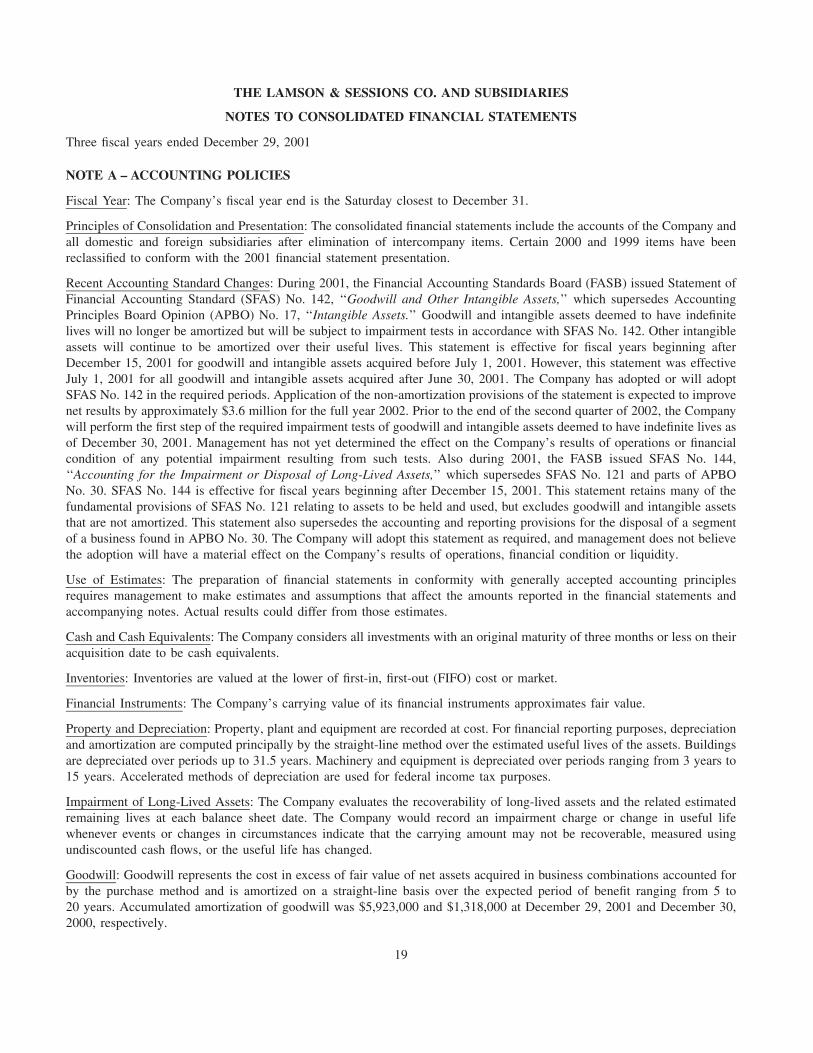
NOTE A – ACCOUNTING POLICIES
Fiscal Year: The Company’s fiscal year end is the Saturday closest to December 31.
Principles of Consolidation and Presentation: The consolidated financial statements include the accounts of the Company andall domestic and foreign subsidiaries after elimination of intercompany items. Certain 2000 and 1999 items have beenreclassified to conform with the 2001 financial statement presentation.
Recent Accounting Standard Changes: During 2001, the Financial Accounting Standards Board (FASB) issued Statement ofFinancial Accounting Standard (SFAS) No. 142, ‘‘Goodwill and Other Intangible Assets,’’ which supersedes AccountingPrinciples Board Opinion (APBO) No. 17, ‘‘Intangible Assets.’’ Goodwill and intangible assets deemed to have indefinitelives will no longer be amortized but will be subject to impairment tests in accordance with SFAS No. 142. Other intangibleassets will continue to be amortized over their useful lives. This statement is effective for fiscal years beginning afterDecember 15, 2001 for goodwill and intangible assets acquired before July 1, 2001. However, this statement was effectiveJuly 1, 2001 for all goodwill and intangible assets acquired after June 30, 2001. The Company has adopted or will adoptSFAS No. 142 in the required periods. Application of the non-amortization provisions of the statement is expected to improvenet results by approximately $3.6 million for the full year 2002. Prior to the end of the second quarter of 2002, the Companywill perform the first step of the required impairment tests of goodwill and intangible assets deemed to have indefinite lives asof December 30, 2001. Management has not yet determined the effect on the Company’s results of operations or financialcondition of any potential impairment resulting from such tests. Also during 2001, the FASB issued SFAS No. 144,‘‘Accounting for the Impairment or Disposal of Long-Lived Assets,’’ which supersedes SFAS No. 121 and parts of APBONo. 30. SFAS No. 144 is effective for fiscal years beginning after December 15, 2001. This statement retains many of thefundamental provisions of SFAS No. 121 relating to assets to be held and used, but excludes goodwill and intangible assetsthat are not amortized. This statement also supersedes the accounting and reporting provisions for the disposal of a segmentof a business found in APBO No. 30. The Company will adopt this statement as required, and management does not believethe adoption will have a material effect on the Company’s results of operations, financial condition or liquidity.
Use of Estimates: The preparation of financial statements in conformity with generally accepted accounting principlesrequires management to make estimates and assumptions that affect the amounts reported in the financial statements andaccompanying notes. Actual results could differ from those estimates.
Cash and Cash Equivalents: The Company considers all investments with an original maturity of three months or less on theiracquisition date to be cash equivalents.
Inventories: Inventories are valued at the lower of first-in, first-out (FIFO) cost or market.
Financial Instruments: The Company’s carrying value of its financial instruments approximates fair value.
Property and Depreciation: Property, plant and equipment are recorded at cost. For financial reporting purposes, depreciationand amortization are computed principally by the straight-line method over the estimated useful lives of the assets. Buildingsare depreciated over periods up to 31.5 years. Machinery and equipment is depreciated over periods ranging from 3 years to15 years. Accelerated methods of depreciation are used for federal income tax purposes.
Impairment of Long-Lived Assets: The Company evaluates the recoverability of long-lived assets and the related estimatedremaining lives at each balance sheet date. The Company would record an impairment charge or change in useful lifewhenever events or changes in circumstances indicate that the carrying amount may not be recoverable, measured usingundiscounted cash flows, or the useful life has changed.
Goodwill: Goodwill represents the cost in excess of fair value of net assets acquired in business combinations accounted forby the purchase method and is amortized on a straight-line basis over the expected period of benefit ranging from 5 to20 years. Accumulated amortization of goodwill was $5,923,000 and $1,318,000 at December 29, 2001 and December 30,2000, respectively.
19
THE LAMSON & SESSIONS CO. AND SUBSIDIARIES
NOTES TO CONSOLIDATED FINANCIAL STATEMENTS – Continued
NOTE A – ACCOUNTING POLICIES – Continued
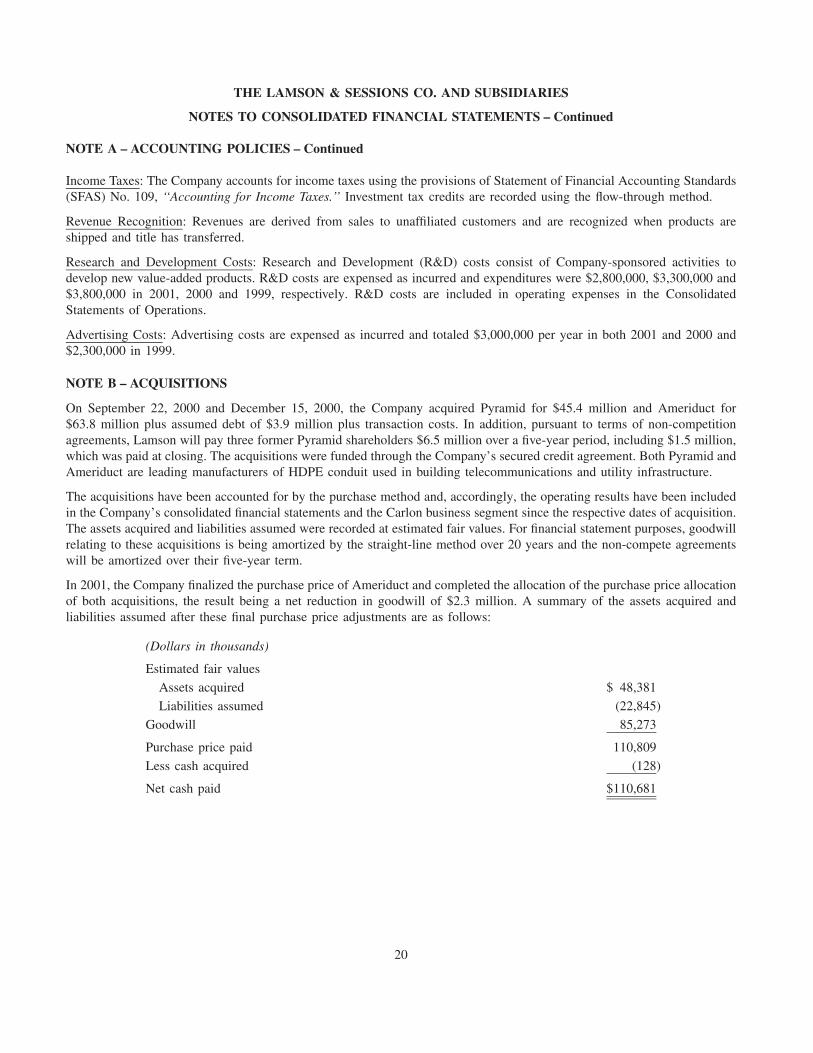
Income Taxes: The Company accounts for income taxes using the provisions of Statement of Financial Accounting Standards(SFAS) No. 109, ‘‘Accounting for Income Taxes.’’ Investment tax credits are recorded using the flow-through method.
Revenue Recognition: Revenues are derived from sales to unaffiliated customers and are recognized when products areshipped and title has transferred.
Research and Development Costs: Research and Development (R&D) costs consist of Company-sponsored activities todevelop new value-added products. R&D costs are expensed as incurred and expenditures were $2,800,000, $3,300,000 and$3,800,000 in 2001, 2000 and 1999, respectively. R&D costs are included in operating expenses in the ConsolidatedStatements of Operations.
Advertising Costs: Advertising costs are expensed as incurred and totaled $3,000,000 per year in both 2001 and 2000 and$2,300,000 in 1999.
NOTE B – ACQUISITIONS
On September 22, 2000 and December 15, 2000, the Company acquired Pyramid for $45.4 million and Ameriduct for$63.8 million plus assumed debt of $3.9 million plus transaction costs. In addition, pursuant to terms of non-competitionagreements, Lamson will pay three former Pyramid shareholders $6.5 million over a five-year period, including $1.5 million,which was paid at closing. The acquisitions were funded through the Company’s secured credit agreement. Both Pyramid andAmeriduct are leading manufacturers of HDPE conduit used in building telecommunications and utility infrastructure.
The acquisitions have been accounted for by the purchase method and, accordingly, the operating results have been includedin the Company’s consolidated financial statements and the Carlon business segment since the respective dates of acquisition.The assets acquired and liabilities assumed were recorded at estimated fair values. For financial statement purposes, goodwillrelating to these acquisitions is being amortized by the straight-line method over 20 years and the non-compete agreementswill be amortized over their five-year term.
In 2001, the Company finalized the purchase price of Ameriduct and completed the allocation of the purchase price allocationof both acquisitions, the result being a net reduction in goodwill of $2.3 million. A summary of the assets acquired andliabilities assumed after these final purchase price adjustments are as follows:
(Dollars in thousands)
Estimated fair values
Assets acquired $ 48,381
Liabilities assumed (22,845)
Goodwill 85,273
Purchase price paid 110,809
Less cash acquired (128)
Net cash paid $110,681
20
THE LAMSON & SESSIONS CO. AND SUBSIDIARIES
NOTES TO CONSOLIDATED FINANCIAL STATEMENTS – Continued
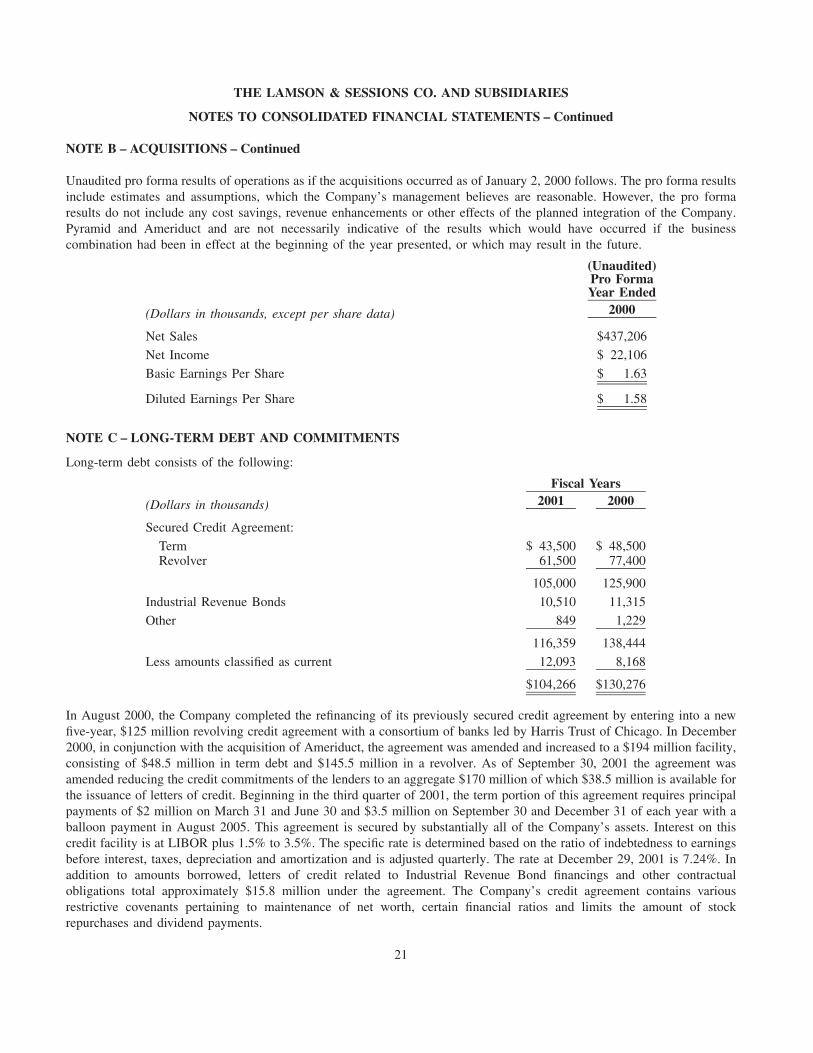
NOTE B – ACQUISITIONS – Continued
Unaudited pro forma results of operations as if the acquisitions occurred as of January 2, 2000 follows. The pro forma resultsinclude estimates and assumptions, which the Company’s management believes are reasonable. However, the pro formaresults do not include any cost savings, revenue enhancements or other effects of the planned integration of the Company.Pyramid and Ameriduct and are not necessarily indicative of the results which would have occurred if the businesscombination had been in effect at the beginning of the year presented, or which may result in the future.
(Unaudited)Pro FormaYear Ended
2000(Dollars in thousands, except per share data)
Net Sales $437,206
Net Income $ 22,106
Basic Earnings Per Share $ 1.63
Diluted Earnings Per Share $ 1.58
NOTE C – LONG-TERM DEBT AND COMMITMENTS
Long-term debt consists of the following:
Fiscal Years2001 2000(Dollars in thousands)
Secured Credit Agreement:
Term $ 43,500 $ 48,500Revolver 61,500 77,400
105,000 125,900
Industrial Revenue Bonds 10,510 11,315
Other 849 1,229
116,359 138,444
Less amounts classified as current 12,093 8,168
$104,266 $130,276
In August 2000, the Company completed the refinancing of its previously secured credit agreement by entering into a newfive-year, $125 million revolving credit agreement with a consortium of banks led by Harris Trust of Chicago. In December2000, in conjunction with the acquisition of Ameriduct, the agreement was amended and increased to a $194 million facility,consisting of $48.5 million in term debt and $145.5 million in a revolver. As of September 30, 2001 the agreement wasamended reducing the credit commitments of the lenders to an aggregate $170 million of which $38.5 million is available forthe issuance of letters of credit. Beginning in the third quarter of 2001, the term portion of this agreement requires principalpayments of $2 million on March 31 and June 30 and $3.5 million on September 30 and December 31 of each year with aballoon payment in August 2005. This agreement is secured by substantially all of the Company’s assets. Interest on thiscredit facility is at LIBOR plus 1.5% to 3.5%. The specific rate is determined based on the ratio of indebtedness to earningsbefore interest, taxes, depreciation and amortization and is adjusted quarterly. The rate at December 29, 2001 is 7.24%. Inaddition to amounts borrowed, letters of credit related to Industrial Revenue Bond financings and other contractualobligations total approximately $15.8 million under the agreement. The Company’s credit agreement contains variousrestrictive covenants pertaining to maintenance of net worth, certain financial ratios and limits the amount of stockrepurchases and dividend payments.
21
THE LAMSON & SESSIONS CO. AND SUBSIDIARIES
NOTES TO CONSOLIDATED FINANCIAL STATEMENTS – Continued
NOTE C – LONG-TERM DEBT AND COMMITMENTS – Continued
The Company’s Industrial Revenue Bond financings include several issues due in annual installments from 2000 through2023 with interest at variable rates. The weighted average rate for these bonds at December 29, 2001 was 1.78%.
The Company’s headquarters is subject to a mortgage payable in equal monthly installments through 2003 with interest at8.625%.
The aggregate minimum combined maturities of long-term debt for the years 2003 through 2006 are approximately$12,070,811, $11,660,000, $72,760,000 and $665,000 respectively, with $7,110,000 due thereafter.
Interest paid was $9,573,000, $4,026,000 and $3,679,000 in 2001, 2000 and 1999, respectively.
Rental expense was $6,268,000, $5,861,000 and $4,908,000 in 2001, 2000 and 1999, respectively. Aggregate futureminimum payments related to non-cancelable operating leases with initial or remaining terms of one year or more for theyears 2002 through 2006 are approximately $3,637,000, $3,129,000, $2,699,000, $1,964,000 and $1,578,000, respectively,with $5,139,000 due thereafter.
NOTE D – DERIVATIVES AND HEDGING
Effective as of December 31, 2000, the Company adopted Statement of Financial Accounting Standards No.(SFAS) 133,‘‘Accounting for Derivative Instruments and Hedging Activities’’ which was issued in June, 1998 by theFinancial Accounting Standards Board (FASB), as amended by SFAS 137, ‘‘Accounting for Derivative Instruments andHedging Activities — Deferral of Effective Date of SFAS 133’’ and SFAS 138, ‘‘Accounting for Certain DerivativeInstruments and Certain Hedging Activities.’’
As a result of the adoption of SFAS 133, the Company is required to recognize all derivative financial instruments as eitherassets or liabilities at fair value. Derivative instruments that are not hedges must be adjusted to fair value through net income.Under the provisions of SFAS 133, changes in the fair value of derivative instruments that are classified as fair value hedgesare offset against changes in the fair value of the hedged assets, liabilities, or firm commitments, through net income.Changes in the fair value of derivative instruments that are classified as cash flow hedges are recognized in othercomprehensive income until such time as the hedged items are recognized in net income.
The adoption of SFAS 133 did not result in any transition adjustment as the Company had no derivative instrumentsoutstanding at December 31, 2000. During the first quarter of 2001, the Company entered into two interest rate swapagreements for a total notional amount of $58.5 million which effectively fixes interest rates on its variable rate debt at 5.41%and 5.48% plus the Company’s risk premium of 1.5% to 3.5%, respectively. These transactions are considered cash flowhedges and, thus, the fair market value at the end of the year of a $1,034,000 (net of $661,000 in tax) loss has beenrecognized in other comprehensive income (loss). There is no ineffectiveness on the cash flow hedges, therefore, all changesin the fair value of these derivatives are recorded in equity and not included in the current period’s income statement.Approximately a $1,482,000 loss on the fair value of the hedges is classified in current accrued liabilities, with the remaining$212,000 loss classified as a long-term liability.
The Company has no derivative instruments that are classified as fair value hedges.
22
THE LAMSON & SESSIONS CO. AND SUBSIDIARIES
NOTES TO CONSOLIDATED FINANCIAL STATEMENTS – Continued
NOTE E – PENSION AND OTHER POST-RETIREMENT BENEFIT PLANS
The Company sponsors several qualified and nonqualified pension plans and other post-retirement benefit plans for its currentand former employees. The following table provides a reconciliation of the changes in the benefit obligations and fair value ofplan assets over each of the two years in the period ended December 29, 2001 and December 30, 2000, respectively, and astatement of the funded status at both years’ end:
Pension Benefits Other Benefits2001 2000 2001 2000(Dollars in thousands)
Change in Benefit ObligationObligation at beginning of year $73,799 $74,079 $13,094 $14,040
Service cost 1,054 886 14 13
Interest cost 5,280 5,300 911 980
Plan participants’ contribution — — 98 96
Plan amendment 223 76 — —
Actuarial loss (gain) 2,077 163 695 (23)
Benefits paid (6,616) (6,705) (2,080) (2,012)
Obligation at end of year $75,817 $73,799 $12,732 $13,094
Effective January 1, 2000, the Company amended its salaried associates retirement benefits program by phasing out certainmedical benefits.
Pension Benefits Other Benefits2001 2000 2001 2000(Dollars in thousands)
Change in Plan AssetsFair value of plan assets at beginning of year $ 89,975 $88,679
Actual return on plan assets (11,158) 7,684
Employer contributions 310 317 $ 1,982 $ 1,916
Plan participants’ contributions — — 98 96
Benefits paid (6,616) (6,705) (2,080) (2,012)
Fair value of plan assets at end of year $ 72,511 $89,975 $ — $ —
Plan assets include 860,856 shares of the Company’s common stock with a fair market value at December 29, 2001 of $4.5million and 760,856 common shares with a fair value of $8.0 million at December 30, 2000.
Pension Benefits Other Benefits2001 2000 2001 2000(Dollars in thousands)
Funded StatusFund status at end of year $ (3,306) $16,176 $(12,732) $(13,094)
Unrecognized actuarial loss (gain) 23,702 2,219 (1,425) (2,342)
Unrecognized transition (asset) (1,164) (1,252) — —
Unrecognized prior service cost (gain) 448 246 (2,236) (2,433)
Net amount recognized at end of year $19,680 $17,389 $(16,393) $(17,869)
The pension benefits table above provides information relating to the funded status of all defined benefit pension plans on anaggregated basis. The projected benefit obligation, accumulated benefit obligation, and fair value of plan assets for the
23
THE LAMSON & SESSIONS CO. AND SUBSIDIARIES
NOTES TO CONSOLIDATED FINANCIAL STATEMENTS – Continued
NOTE E – PENSION AND OTHER POST-RETIREMENT BENEFIT PLANS – Continued
pension plans with accumulated benefit obligations in excess of plan assets were $5.3 million, $4.9 million and $0,respectively, as of December 29, 2001 and $4.4 million, $4.1 million and $0, respectively, as of December 30, 2000.
The following table provides the amounts recognized in the consolidated balance sheets for both years:
Pension Benefits Other Benefits2001 2000 2001 2000(Dollars in thousands)
Prepaid benefit cost $24,071 $21,555
Accrued benefit liability (5,081) (4,280) $(16,393) $(17,869)
Intangible asset — 71 — —
Accumulated other comprehensive income 690 43 — —
$19,680 $17,389 $(16,393) $(17,869)
The assumptions used in the measurement of the Company’s benefit obligations at December 29, 2001 and December 30,2000 were:
Pension Benefits Other Benefits2001 2000 2001 2000
Discount rate 7.2% 7.5% 7.25% 7.5%
Expected return on plan assets 9.5% 9.5%
Rate of salary increase 5.0% 5.0%
For measurement purposes, a 8.5% average health care cost trend rate was used for 2002 (8.8% in 2001). The rate is assumedto decline gradually each year to an ultimate rate of 5.5% in 2008 and thereafter. A 1% change in assumed health care costtrend rates would have the following effects:
1% Increase 1% Decrease(Dollars in thousands)
Net periodic benefit cost $ 74 $ (67)
Accumulated post-retirement benefit obligation $932 $(839)
The components of net periodic benefit cost (income) are as follows:
Pension Benefits Other Benefits2001 2000 1999 2001 2000 1999(Dollars in thousands)
Service cost $ 1,054 $ 886 $ 1,277 $ 14 $ 13 $ 329
Interest cost 5,280 5,300 5,179 911 980 1,132
Expected return on assets (8,241) (8,111) (7,660) — — —
Net amortization and deferral (72) (93) 193 (420) (394) (115)
Defined contribution plans 965 1,147 709 — — —
$(1,014) $ (871) $ (302) $ 505 $ 599 $1,346
In addition to the defined benefit plans described above, the Company also sponsors a defined contribution plan, which coverssubstantially all full-time associates. The Company’s matching contribution is a minimum of 50% of voluntary employeecontributions of up to 6% of wages.
The Company remains contingently liable for certain post-retirement benefits of certain businesses previously sold.
24
THE LAMSON & SESSIONS CO. AND SUBSIDIARIES
NOTES TO CONSOLIDATED FINANCIAL STATEMENTS – Continued
NOTE F – LITIGATION
On September 23, 1999, the Company announced that a United States District Court jury in the Northern District of Illinoisfound that the Company willfully infringed on a patent held by Intermatic Incorporated (‘‘Intermatic’’) of Spring Grove,Illinois, relating to the design of an in-use weatherproof electrical outlet cover, and awarded Intermatic $12.5 million indamages plus pre-judgment interest of approximately $1.5 million. The Company pursued a vigorous appeal and onDecember 17, 2001 the United States Court of Appeals ruled that, as a matter of law, Lamson & Sessions’ products did notinfringe Intermatic’s patent and that the Company has no liability to Intermatic. The trial jury’s earlier verdict in favor ofIntermatic in the amount of $12.5 million, plus pre-judgment and post-judgment interest estimated to be in excess of$3 million, was reversed. Intermatic filed for a rehearing of the ruling to the Court of Appeals en banc, which was denied.Management has no knowledge of Intermatic’s intention with respect to any further appeals.
During the first quarter of 2001, the Company settled its litigation against PW Eagle and received a payment of $2.05 million,(net gain of $1.6 million) representing a partial recovery of costs incurred in current and previous quarters, arising out of thefailed sale of the PVC Pipe segment in 1999.
The Company is also a party to various other claims and matters of litigation incidental to the normal course of its business.Management believes that the final resolution of these matters will not have a material adverse effect on the Company’sfinancial position, cash flows or results of operations.
NOTE G – ENVIRONMENTAL
The Company believes that its current operations and its use of property, plant and equipment conform in all material respectsto applicable environmental laws and regulations presently in effect. The Company has facilities at numerous geographiclocations, which are subject to a range of federal, state and local environmental laws and regulations. Compliance with theselaws has, and will, require expenditures on a continuing basis.
During the second quarter of 1999, the Company reached a settlement on litigation involving environmental matters at aproperty sold by the Company in 1981 whereby the Company agreed to incur costs of certain remediation activities whichwill occur over several years. The settlement did not have a material impact on the Company’s financial position or results ofoperations.
NOTE H – COMMON, PREFERRED, PREFERENCE STOCK
The Company has authorized 1,200,000 and 3,000,000 shares of Serial Preferred and Preference Stock, respectively, none ofwhich is issued or outstanding at December 29, 2001 or December 30, 2000. The Company has reserved for issuance 200,000shares of Cumulative Redeemable Serial Preference Stock, Series II, without par value (‘‘Series II Preference Stock’’), whichrelates to the Rights Agreement, dated as of September 8, 1998, between the Company and National City Bank (the ‘‘RightsAgreement’’).
Under the Company’s Rights Agreement, each shareholder has the right to purchase from the Company one one-hundredth ofa share of the Series II Preference Stock, subject to adjustment, upon payment of an exercise price of $44.75. The Rights willbecome exercisable only after a person or group acquires beneficial ownership of or commences a tender or exchange offerfor 15% or more of the Company’s Common Shares. Rights held by persons who exceed that threshold will be void. In theevent that a person or group acquires beneficial ownership of 15% or more of the Company’s Common Shares, or a 15%shareholder merges into or with the Company or engages in one of a number of self-dealing transactions, each Right wouldentitle its holder to purchase a number of the Company’s Common Shares (or, in certain cases, common stock of an acquirer)having a market value of twice the Right’s exercise price.
25
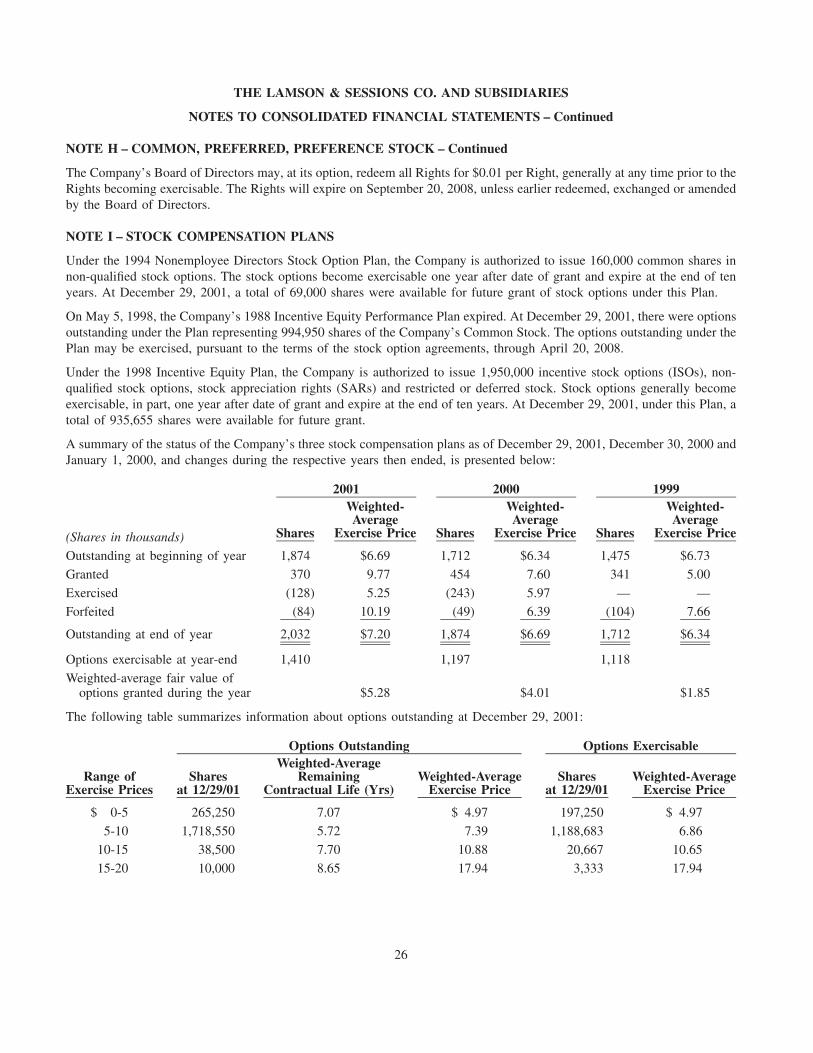
THE LAMSON & SESSIONS CO. AND SUBSIDIARIES
NOTES TO CONSOLIDATED FINANCIAL STATEMENTS – Continued
NOTE H – COMMON, PREFERRED, PREFERENCE STOCK – Continued
The Company’s Board of Directors may, at its option, redeem all Rights for $0.01 per Right, generally at any time prior to theRights becoming exercisable. The Rights will expire on September 20, 2008, unless earlier redeemed, exchanged or amendedby the Board of Directors.
NOTE I – STOCK COMPENSATION PLANS
Under the 1994 Nonemployee Directors Stock Option Plan, the Company is authorized to issue 160,000 common shares innon-qualified stock options. The stock options become exercisable one year after date of grant and expire at the end of tenyears. At December 29, 2001, a total of 69,000 shares were available for future grant of stock options under this Plan.
On May 5, 1998, the Company’s 1988 Incentive Equity Performance Plan expired. At December 29, 2001, there were optionsoutstanding under the Plan representing 994,950 shares of the Company’s Common Stock. The options outstanding under thePlan may be exercised, pursuant to the terms of the stock option agreements, through April 20, 2008.
Under the 1998 Incentive Equity Plan, the Company is authorized to issue 1,950,000 incentive stock options (ISOs), non-qualified stock options, stock appreciation rights (SARs) and restricted or deferred stock. Stock options generally becomeexercisable, in part, one year after date of grant and expire at the end of ten years. At December 29, 2001, under this Plan, atotal of 935,655 shares were available for future grant.
A summary of the status of the Company’s three stock compensation plans as of December 29, 2001, December 30, 2000 andJanuary 1, 2000, and changes during the respective years then ended, is presented below:
2001 2000 1999Weighted- Weighted- Weighted-Average Average Average
Shares Exercise Price Shares Exercise Price Shares Exercise Price(Shares in thousands)
Outstanding at beginning of year 1,874 $6.69 1,712 $6.34 1,475 $6.73
Granted 370 9.77 454 7.60 341 5.00
Exercised (128) 5.25 (243) 5.97 — —
Forfeited (84) 10.19 (49) 6.39 (104) 7.66
Outstanding at end of year 2,032 $7.20 1,874 $6.69 1,712 $6.34
Options exercisable at year-end 1,410 1,197 1,118
Weighted-average fair value ofoptions granted during the year $5.28 $4.01 $1.85
The following table summarizes information about options outstanding at December 29, 2001:
Options Outstanding Options ExercisableWeighted-Average
Range of Shares Remaining Weighted-Average Shares Weighted-AverageExercise Prices at 12/29/01 Contractual Life (Yrs) Exercise Price at 12/29/01 Exercise Price
$ 0-5 265,250 7.07 $ 4.97 197,250 $ 4.97
5-10 1,718,550 5.72 7.39 1,188,683 6.86
10-15 38,500 7.70 10.88 20,667 10.65
15-20 10,000 8.65 17.94 3,333 17.94
26
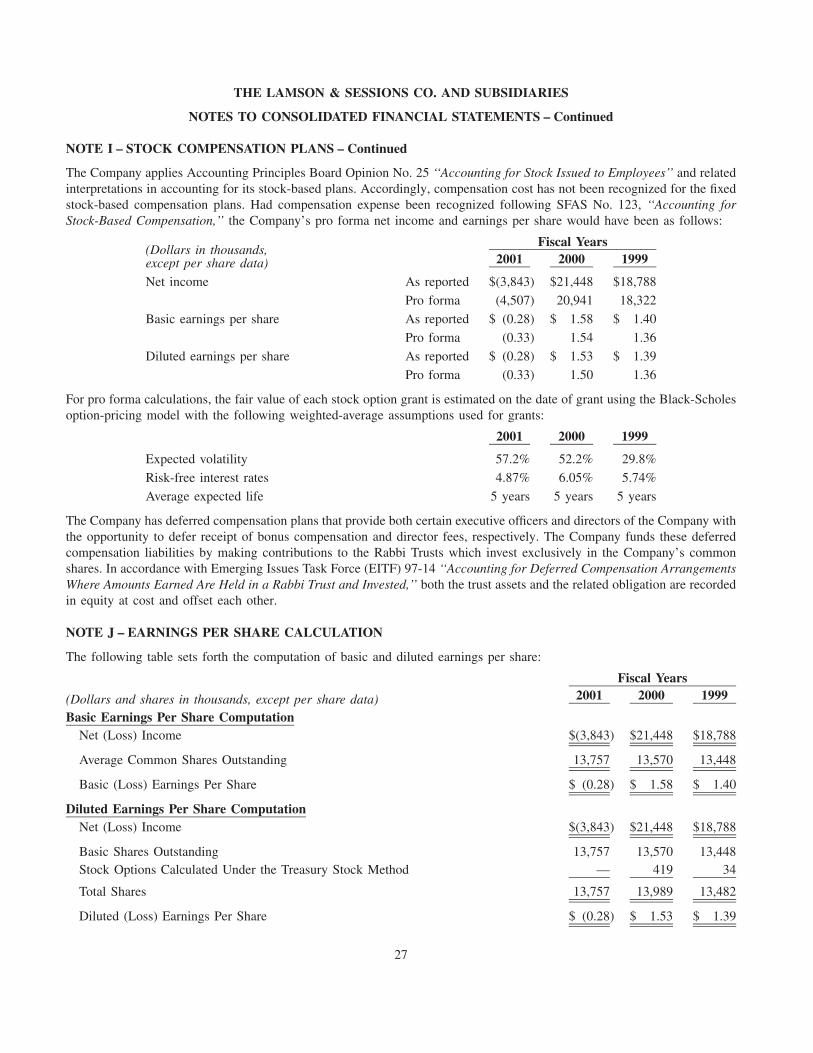
THE LAMSON & SESSIONS CO. AND SUBSIDIARIES
NOTES TO CONSOLIDATED FINANCIAL STATEMENTS – Continued
NOTE I – STOCK COMPENSATION PLANS – Continued
The Company applies Accounting Principles Board Opinion No. 25 ‘‘Accounting for Stock Issued to Employees’’ and relatedinterpretations in accounting for its stock-based plans. Accordingly, compensation cost has not been recognized for the fixedstock-based compensation plans. Had compensation expense been recognized following SFAS No. 123, ‘‘Accounting forStock-Based Compensation,’’ the Company’s pro forma net income and earnings per share would have been as follows:
Fiscal Years(Dollars in thousands,
2001 2000 1999except per share data)
Net income As reported $(3,843) $21,448 $18,788
Pro forma (4,507) 20,941 18,322
Basic earnings per share As reported $ (0.28) $ 1.58 $ 1.40
Pro forma (0.33) 1.54 1.36
Diluted earnings per share As reported $ (0.28) $ 1.53 $ 1.39
Pro forma (0.33) 1.50 1.36
For pro forma calculations, the fair value of each stock option grant is estimated on the date of grant using the Black-Scholesoption-pricing model with the following weighted-average assumptions used for grants:
2001 2000 1999
Expected volatility 57.2% 52.2% 29.8%
Risk-free interest rates 4.87% 6.05% 5.74%
Average expected life 5 years 5 years 5 years
The Company has deferred compensation plans that provide both certain executive officers and directors of the Company withthe opportunity to defer receipt of bonus compensation and director fees, respectively. The Company funds these deferredcompensation liabilities by making contributions to the Rabbi Trusts which invest exclusively in the Company’s commonshares. In accordance with Emerging Issues Task Force (EITF) 97-14 ‘‘Accounting for Deferred Compensation ArrangementsWhere Amounts Earned Are Held in a Rabbi Trust and Invested,’’ both the trust assets and the related obligation are recordedin equity at cost and offset each other.
NOTE J – EARNINGS PER SHARE CALCULATION
The following table sets forth the computation of basic and diluted earnings per share:
Fiscal Years2001 2000 1999(Dollars and shares in thousands, except per share data)
Basic Earnings Per Share ComputationNet (Loss) Income $(3,843) $21,448 $18,788
Average Common Shares Outstanding 13,757 13,570 13,448
Basic (Loss) Earnings Per Share $ (0.28) $ 1.58 $ 1.40
Diluted Earnings Per Share ComputationNet (Loss) Income $(3,843) $21,448 $18,788
Basic Shares Outstanding 13,757 13,570 13,448Stock Options Calculated Under the Treasury Stock Method — 419 34
Total Shares 13,757 13,989 13,482
Diluted (Loss) Earnings Per Share $ (0.28) $ 1.53 $ 1.39
27
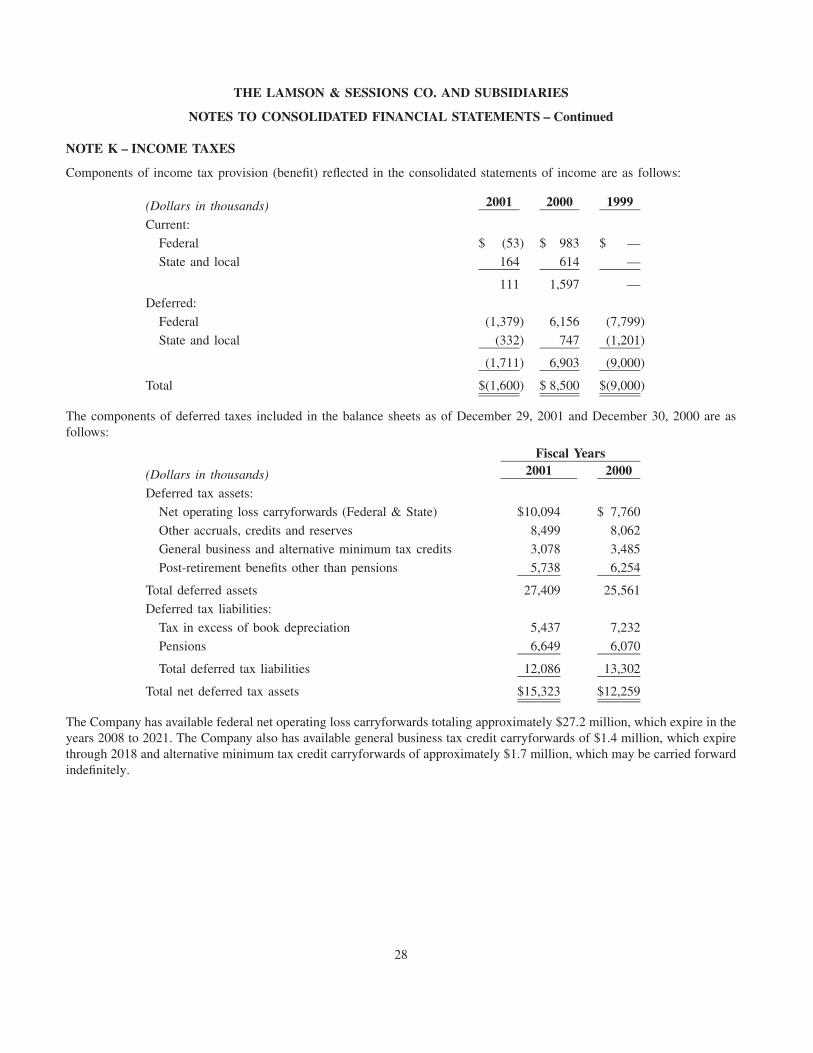
THE LAMSON & SESSIONS CO. AND SUBSIDIARIES
NOTES TO CONSOLIDATED FINANCIAL STATEMENTS – Continued
NOTE K – INCOME TAXES
Components of income tax provision (benefit) reflected in the consolidated statements of income are as follows:
2001 2000 1999(Dollars in thousands)
Current:
Federal $ (53) $ 983 $ —
State and local 164 614 —
111 1,597 —
Deferred:
Federal (1,379) 6,156 (7,799)
State and local (332) 747 (1,201)
(1,711) 6,903 (9,000)
Total $(1,600) $ 8,500 $(9,000)
The components of deferred taxes included in the balance sheets as of December 29, 2001 and December 30, 2000 are asfollows:
Fiscal Years2001 2000(Dollars in thousands)
Deferred tax assets:
Net operating loss carryforwards (Federal & State) $10,094 $ 7,760
Other accruals, credits and reserves 8,499 8,062
General business and alternative minimum tax credits 3,078 3,485
Post-retirement benefits other than pensions 5,738 6,254
Total deferred assets 27,409 25,561
Deferred tax liabilities:
Tax in excess of book depreciation 5,437 7,232
Pensions 6,649 6,070
Total deferred tax liabilities 12,086 13,302
Total net deferred tax assets $15,323 $12,259
The Company has available federal net operating loss carryforwards totaling approximately $27.2 million, which expire in theyears 2008 to 2021. The Company also has available general business tax credit carryforwards of $1.4 million, which expirethrough 2018 and alternative minimum tax credit carryforwards of approximately $1.7 million, which may be carried forwardindefinitely.
28
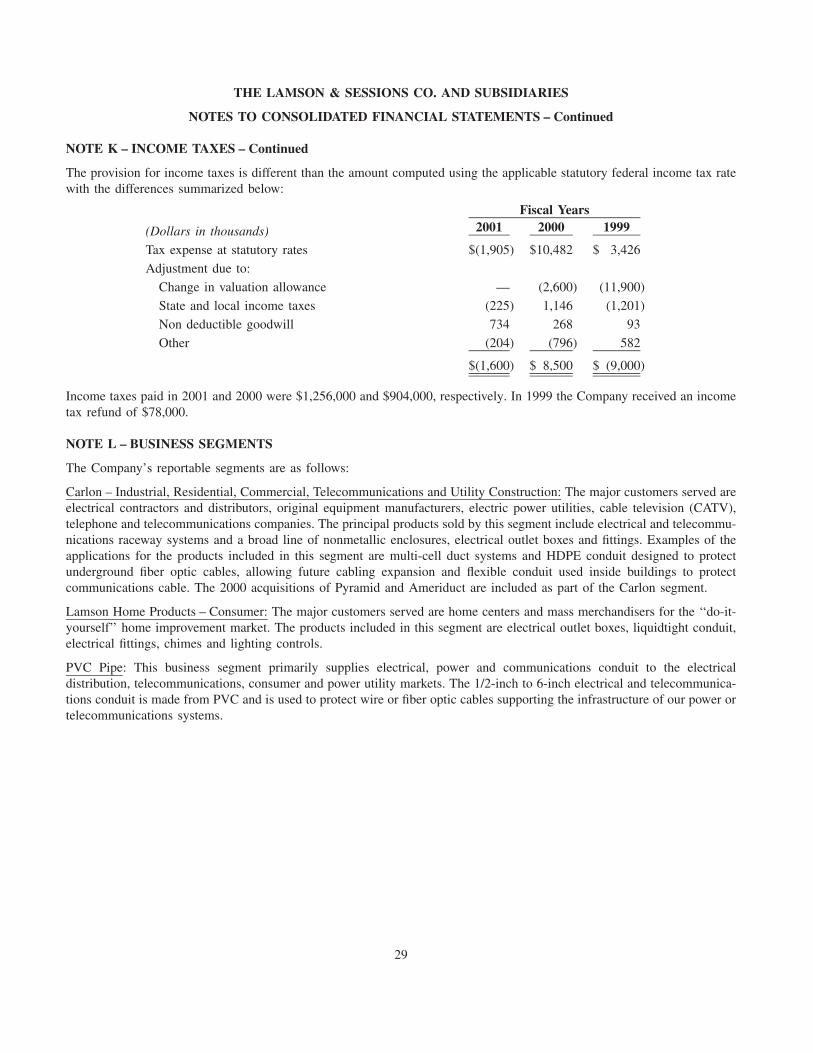
THE LAMSON & SESSIONS CO. AND SUBSIDIARIES
NOTES TO CONSOLIDATED FINANCIAL STATEMENTS – Continued
NOTE K – INCOME TAXES – Continued
The provision for income taxes is different than the amount computed using the applicable statutory federal income tax ratewith the differences summarized below:
Fiscal Years2001 2000 1999(Dollars in thousands)
Tax expense at statutory rates $(1,905) $10,482 $ 3,426
Adjustment due to:
Change in valuation allowance — (2,600) (11,900)
State and local income taxes (225) 1,146 (1,201)
Non deductible goodwill 734 268 93
Other (204) (796) 582
$(1,600) $ 8,500 $ (9,000)
Income taxes paid in 2001 and 2000 were $1,256,000 and $904,000, respectively. In 1999 the Company received an incometax refund of $78,000.
NOTE L – BUSINESS SEGMENTS
The Company’s reportable segments are as follows:
Carlon – Industrial, Residential, Commercial, Telecommunications and Utility Construction: The major customers served areelectrical contractors and distributors, original equipment manufacturers, electric power utilities, cable television (CATV),telephone and telecommunications companies. The principal products sold by this segment include electrical and telecommu-nications raceway systems and a broad line of nonmetallic enclosures, electrical outlet boxes and fittings. Examples of theapplications for the products included in this segment are multi-cell duct systems and HDPE conduit designed to protectunderground fiber optic cables, allowing future cabling expansion and flexible conduit used inside buildings to protectcommunications cable. The 2000 acquisitions of Pyramid and Ameriduct are included as part of the Carlon segment.
Lamson Home Products – Consumer: The major customers served are home centers and mass merchandisers for the ‘‘do-it-yourself’’ home improvement market. The products included in this segment are electrical outlet boxes, liquidtight conduit,electrical fittings, chimes and lighting controls.
PVC Pipe: This business segment primarily supplies electrical, power and communications conduit to the electricaldistribution, telecommunications, consumer and power utility markets. The 1/2-inch to 6-inch electrical and telecommunica-tions conduit is made from PVC and is used to protect wire or fiber optic cables supporting the infrastructure of our power ortelecommunications systems.
29
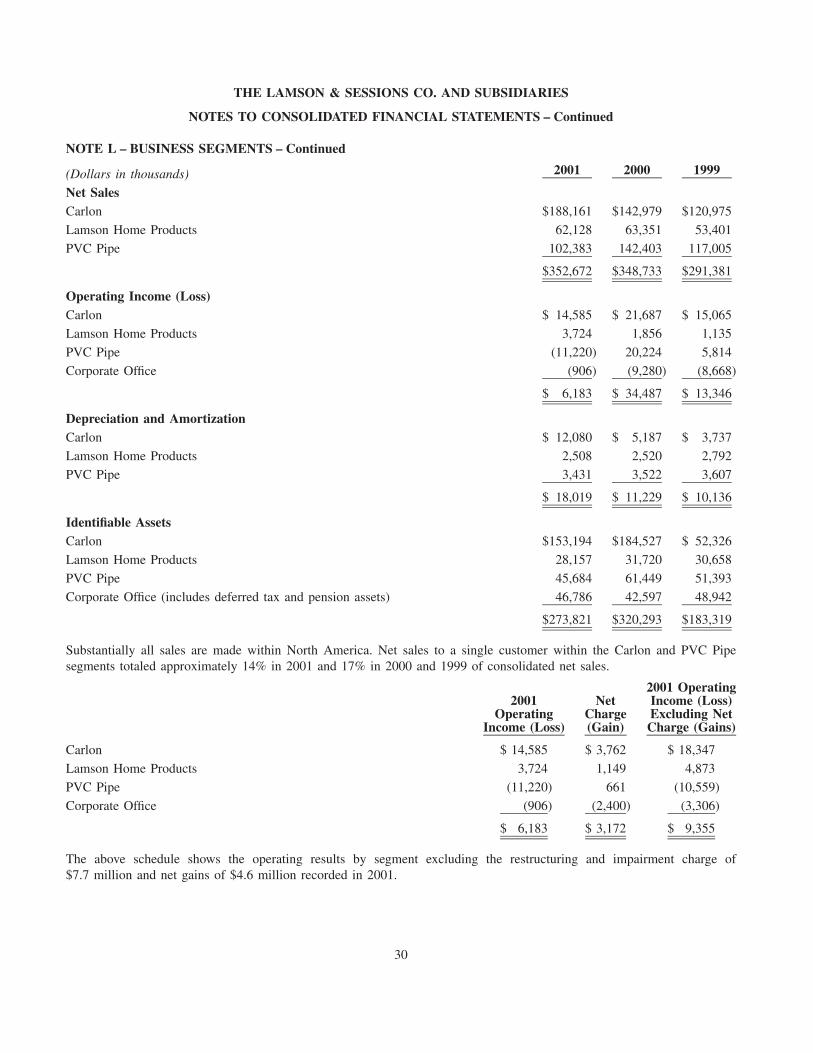
THE LAMSON & SESSIONS CO. AND SUBSIDIARIES
NOTES TO CONSOLIDATED FINANCIAL STATEMENTS – Continued
NOTE L – BUSINESS SEGMENTS – Continued
2001 2000 1999(Dollars in thousands)
Net SalesCarlon $188,161 $142,979 $120,975
Lamson Home Products 62,128 63,351 53,401
PVC Pipe 102,383 142,403 117,005
$352,672 $348,733 $291,381
Operating Income (Loss)Carlon $ 14,585 $ 21,687 $ 15,065
Lamson Home Products 3,724 1,856 1,135
PVC Pipe (11,220) 20,224 5,814
Corporate Office (906) (9,280) (8,668)
$ 6,183 $ 34,487 $ 13,346
Depreciation and AmortizationCarlon $ 12,080 $ 5,187 $ 3,737
Lamson Home Products 2,508 2,520 2,792
PVC Pipe 3,431 3,522 3,607
$ 18,019 $ 11,229 $ 10,136
Identifiable AssetsCarlon $153,194 $184,527 $ 52,326
Lamson Home Products 28,157 31,720 30,658
PVC Pipe 45,684 61,449 51,393
Corporate Office (includes deferred tax and pension assets) 46,786 42,597 48,942
$273,821 $320,293 $183,319
Substantially all sales are made within North America. Net sales to a single customer within the Carlon and PVC Pipesegments totaled approximately 14% in 2001 and 17% in 2000 and 1999 of consolidated net sales.
2001 Operating2001 Net Income (Loss)
Operating Charge Excluding NetIncome (Loss) (Gain) Charge (Gains)
Carlon $ 14,585 $ 3,762 $ 18,347
Lamson Home Products 3,724 1,149 4,873
PVC Pipe (11,220) 661 (10,559)
Corporate Office (906) (2,400) (3,306)
$ 6,183 $ 3,172 $ 9,355
The above schedule shows the operating results by segment excluding the restructuring and impairment charge of$7.7 million and net gains of $4.6 million recorded in 2001.
30
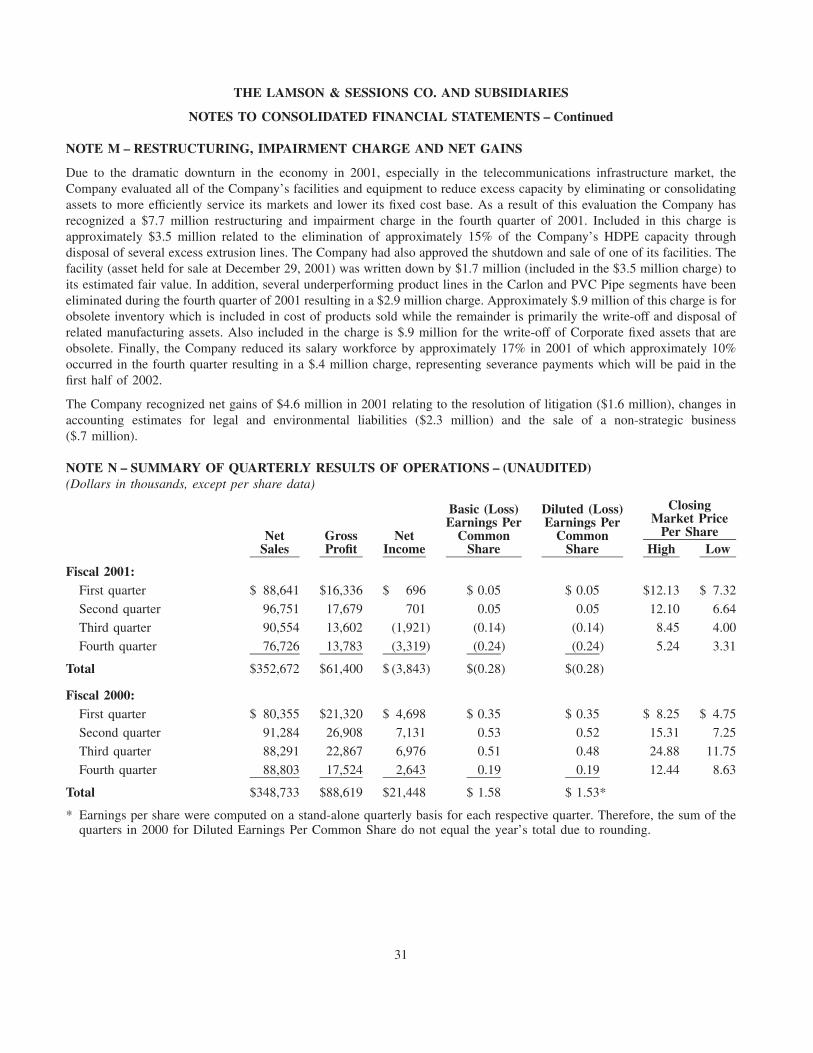
THE LAMSON & SESSIONS CO. AND SUBSIDIARIES
NOTES TO CONSOLIDATED FINANCIAL STATEMENTS – Continued
NOTE M – RESTRUCTURING, IMPAIRMENT CHARGE AND NET GAINS
Due to the dramatic downturn in the economy in 2001, especially in the telecommunications infrastructure market, theCompany evaluated all of the Company’s facilities and equipment to reduce excess capacity by eliminating or consolidatingassets to more efficiently service its markets and lower its fixed cost base. As a result of this evaluation the Company hasrecognized a $7.7 million restructuring and impairment charge in the fourth quarter of 2001. Included in this charge isapproximately $3.5 million related to the elimination of approximately 15% of the Company’s HDPE capacity throughdisposal of several excess extrusion lines. The Company had also approved the shutdown and sale of one of its facilities. Thefacility (asset held for sale at December 29, 2001) was written down by $1.7 million (included in the $3.5 million charge) toits estimated fair value. In addition, several underperforming product lines in the Carlon and PVC Pipe segments have beeneliminated during the fourth quarter of 2001 resulting in a $2.9 million charge. Approximately $.9 million of this charge is forobsolete inventory which is included in cost of products sold while the remainder is primarily the write-off and disposal ofrelated manufacturing assets. Also included in the charge is $.9 million for the write-off of Corporate fixed assets that areobsolete. Finally, the Company reduced its salary workforce by approximately 17% in 2001 of which approximately 10%occurred in the fourth quarter resulting in a $.4 million charge, representing severance payments which will be paid in thefirst half of 2002.
The Company recognized net gains of $4.6 million in 2001 relating to the resolution of litigation ($1.6 million), changes inaccounting estimates for legal and environmental liabilities ($2.3 million) and the sale of a non-strategic business($.7 million).
NOTE N – SUMMARY OF QUARTERLY RESULTS OF OPERATIONS – (UNAUDITED)(Dollars in thousands, except per share data)
ClosingBasic (Loss) Diluted (Loss)Market PriceEarnings Per Earnings Per
Per ShareNet Gross Net Common CommonSales Profit Income Share Share High Low
Fiscal 2001:First quarter $ 88,641 $16,336 $ 696 $ 0.05 $ 0.05 $12.13 $ 7.32
Second quarter 96,751 17,679 701 0.05 0.05 12.10 6.64
Third quarter 90,554 13,602 (1,921) (0.14) (0.14) 8.45 4.00
Fourth quarter 76,726 13,783 (3,319) (0.24) (0.24) 5.24 3.31
Total $352,672 $61,400 $ (3,843) $(0.28) $(0.28)
Fiscal 2000:First quarter $ 80,355 $21,320 $ 4,698 $ 0.35 $ 0.35 $ 8.25 $ 4.75
Second quarter 91,284 26,908 7,131 0.53 0.52 15.31 7.25
Third quarter 88,291 22,867 6,976 0.51 0.48 24.88 11.75
Fourth quarter 88,803 17,524 2,643 0.19 0.19 12.44 8.63
Total $348,733 $88,619 $21,448 $ 1.58 $ 1.53*
* Earnings per share were computed on a stand-alone quarterly basis for each respective quarter. Therefore, the sum of thequarters in 2000 for Diluted Earnings Per Common Share do not equal the year’s total due to rounding.
31
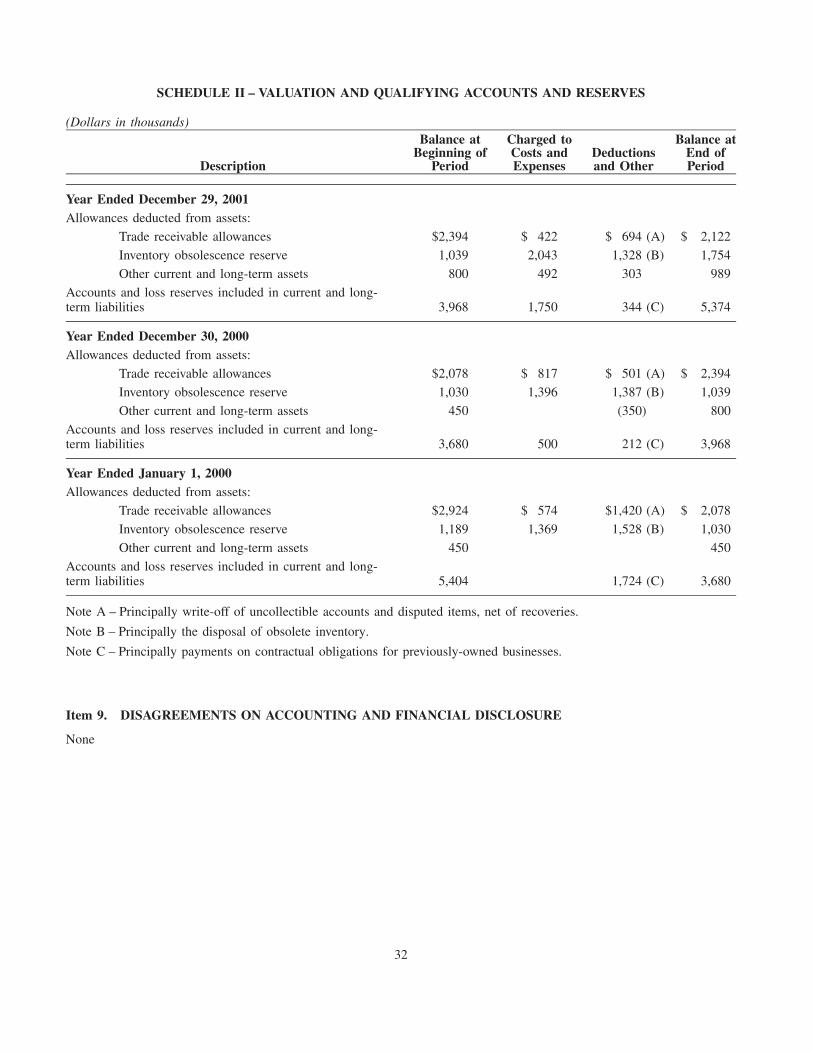
SCHEDULE II – VALUATION AND QUALIFYING ACCOUNTS AND RESERVES
(Dollars in thousands)Balance at Charged to Balance at
Beginning of Costs and Deductions End ofDescription Period Expenses and Other Period
Year Ended December 29, 2001Allowances deducted from assets:
Trade receivable allowances $2,394 $ 422 $ 694 (A) $ 2,122
Inventory obsolescence reserve 1,039 2,043 1,328 (B) 1,754
Other current and long-term assets 800 492 303 989
Accounts and loss reserves included in current and long-term liabilities 3,968 1,750 344 (C) 5,374
Year Ended December 30, 2000Allowances deducted from assets:
Trade receivable allowances $2,078 $ 817 $ 501 (A) $ 2,394
Inventory obsolescence reserve 1,030 1,396 1,387 (B) 1,039
Other current and long-term assets 450 (350) 800
Accounts and loss reserves included in current and long-term liabilities 3,680 500 212 (C) 3,968
Year Ended January 1, 2000Allowances deducted from assets:
Trade receivable allowances $2,924 $ 574 $1,420 (A) $ 2,078
Inventory obsolescence reserve 1,189 1,369 1,528 (B) 1,030
Other current and long-term assets 450 450
Accounts and loss reserves included in current and long-term liabilities 5,404 1,724 (C) 3,680
Note A – Principally write-off of uncollectible accounts and disputed items, net of recoveries.
Note B – Principally the disposal of obsolete inventory.
Note C – Principally payments on contractual obligations for previously-owned businesses.
Item 9. DISAGREEMENTS ON ACCOUNTING AND FINANCIAL DISCLOSURE
None
32
PART III
Item 10. DIRECTORS AND EXECUTIVE OFFICERS OF THE REGISTRANT
(a) Directors
The information set forth under the caption ‘‘Election of Directors’’ in the Company’s definitive proxystatement for its Annual Meeting of Shareholders to be held April 26, 2002 is hereby incorporated by reference.
(b) Executive Officers – See Part I
(c) Compliance with Section 16(a) of the Exchange Act.
The information set forth under the caption ‘‘Section 16(a) Beneficial Ownership Reporting Compliance’’ inthe Company’s definitive proxy statement for its Annual Meeting of Shareholders to be held April 26, 2002 ishereby incorporated by reference.
Item 11. EXECUTIVE COMPENSATION
The information set forth under the caption ‘‘Executive Compensation’’ in the Company’s definitive proxy statement for itsAnnual Meeting of Shareholders to be held April 26, 2002 is hereby incorporated by reference.
Item 12. SECURITY OWNERSHIP OF CERTAIN BENEFICIAL OWNERS AND MANAGEMENT
The information set forth under the captions ‘‘Ownership of the Company’s Common Shares,’’ ‘‘Election of Directors’’ and‘‘Security Ownership of Management’’ in the Company’s definitive Proxy Statement for its Annual Meeting of Shareholdersto be held April 26, 2002 is hereby incorporated by reference.
Item 13. CERTAIN RELATIONSHIPS AND RELATED TRANSACTIONS
During the past fiscal year, the Company, in the normal course of business, utilized the services of the law firm of Jones, Day,Reavis & Pogue, in which Mr. Coquillette, a director of the Company, is a partner. The Company plans to continue using theservices of the firm in 2002.
33
PART IV
Item 14. EXHIBITS, FINANCIAL STATEMENT SCHEDULES, AND REPORTS ON FORM 8-K
(a) The following documents are filed as part of this report:
Consolidated financial statements of The Lamson & Sessions Co. and Subsidiaries are included in Item 8 ofthis report:
1. Financial Statements
Consolidated Statements of Operations for Fiscal Years Ended 2001, 2000 and 1999.
Consolidated Statements of Cash Flows for Fiscal Years Ended 2001, 2000 and 1999.
Consolidated Balance Sheets at December 29, 2001 and December 30, 2000.
Consolidated Statements of Shareholders’ Equity for Fiscal Years Ended 2001, 2000 and 1999.
Notes to Consolidated Financial Statements.
2. Financial Statement Schedule
Schedule II – Valuation and Qualifying Accounts and Reserves.
All other schedules for which provision is made in the applicable accounting regulations of the Securitiesand Exchange Commission are not required under the related instructions or are inapplicable and,therefore, have been omitted.
3. The exhibits listed in the accompanying Exhibit Index and required by Item 601 of Regulation S-K(numbered in accordance with Item 601 of Regulation S-K) are filed or incorporated by reference as part ofthis Report.
(b) Reports on Form 8-K
None.
(c) Exhibits – See 14(a) 3.
34
SIGNATURES
Pursuant to the requirements of Section 13 or 15(d) of the Securities Exchange Act of 1934, the Registrant has duly causedthis report to be signed on its behalf by the undersigned, thereunto duly authorized, on this March 5, 2002.
THE LAMSON & SESSIONS CO.
By: /s / James J. Abel
James J. AbelExecutive Vice President, Secretary,Treasurer and Chief Financial Officer
Pursuant to the requirements of the Securities Exchange Act of 1934, this report has been signed below by the followingpersons on behalf of the Registrant and in the capacities indicated as of February 20, 2002.
Signature Title
/s / John B. Schulze Chairman of the Board, President andChief Executive OfficerJohn B. Schulze(Principal Executive Officer)
/s / James J. Abel Executive Vice President, Secretary,Treasurer and Chief Financial OfficerJames J. Abel(Principal Financial Officer)
/s / Lori L. Spencer Vice President and Controller(Principal Accounting Officer)Lori L. Spencer
/s / James T. Bartlett* Director
James T. Bartlett*
/s / Francis H. Beam, Jr.* Director
Francis H. Beam, Jr.*
/s / Martin J. Cleary* Director
Martin J. Cleary*
/s / William H. Coquillette* Director
William H. Coquillette*
/s / John C. Dannemiller* Director
John C. Dannemiller*
/s / George R. Hill* Director
George R. Hill*
/s / A. Malachi Mixon, III* Director
A. Malachi Mixon, III*
35
Signature Title
/s / John C. Morley* Director
John C. Morley*
/s / D. Van Skilling* Director
D. Van Skilling*
* The undersigned, by signing his name hereto, does sign and execute this Annual Report on Form 10-K pursuant to aPower of Attorney executed on behalf of the above-named directors of The Lamson & Sessions Co. and filed herewithas Exhibit 24 on behalf of The Lamson & Sessions Co. and each such person.
March 5, 2002
By: /s / James J. Abel
James J. Abel, Attorney-in-fact
36
EXHIBIT INDEX
Management Contracts and Compensatory Plans required to be filed pursuant to Item 14 of Form 10-K are identified with anasterisk (*).
Exhibit No. Description of Document
3(a) Amended Articles of Incorporation of the Company (incorporated by reference to Exhibit 4(a) to the Company’sRegistration Statement on Form S-8 (Registration No. 333-32875) filed with the Securities and ExchangeCommission on August 5, 1997).
3(b) Amended Code of Regulations of the Company (incorporated by reference to Exhibit 3(a) to the Company’sQuarterly Report on Form 10-Q for the quarter ended March 31, 2001 (the ‘‘first quarter 2001 Form 10-Q’’)).
4(a) Form of Rights Certificate (incorporated by reference to Exhibit 4.1 to the Company’s Registration Statement onForm 8-A filed with the Securities and Exchange Commission on September 9, 1998).
4(b) Rights Agreement, dated as of September 8, 1998, by and between the Company and National City Bank(incorporated by reference to Exhibit 4.1 to the Company’s Registration Statement on Form 8-A filed with theSecurities and Exchange Commission on September 9, 1998).
*10(a) Form of Three-Year Executive Change-in-Control Agreement between the Company and certain executiveofficers (incorporated by reference to Exhibit 10(b) to the Company’s Annual Report on Form 10-K for the yearended January 1, 2000).
*10(b) Form of Two-Year Executive Change-in-Control Agreement between the Company and certain executive officers(incorporated by reference to Exhibit 10(c) to the Company’s Annual Report on Form 10-K for the year endedJanuary 1, 2000).
*10(c) Form of Indemnification Agreement between the Company and the Directors and certain officers (incorporatedby reference to Exhibit 10(g) to the Company’s Annual Report on Form 10-K for the year ended December 31,1994).
10(d) Asset Purchase Agreement between Iochpe-Maxion Ohio, Inc. and The Lamson & Sessions Co. dated as ofMay 4, 1994 (incorporated by reference to Exhibit 10 to the Company’s Current Report on Form 8-K dated as ofMay 27, 1994).
10(e) Share Purchase Agreement, dated as of August 20, 2000, by and among the Company, Pyramid Industries, Inc.and the shareholders of Pyramid Industries, Inc. (incorporated by reference to Exhibit 2 of the Company’sCurrent Report on Form 8-K, filed with the Securities and Exchange Commission on October 6, 2000).
10(f) Share Purchase Agreement, dated as of December 6, 2000, by and among the Company, Ameriduct Worldwide,Inc. and the shareholders of Ameriduct Worldwide, Inc. (incorporated by reference to Exhibit 2 of theCompany’s Current Report on Form 8-K, filed with the Securities and Exchange Commission on January 2,2001).
10(g) Amended and Restated Credit Agreement, dated as of December 15, 2000, among the Company, the Guarantorsparty thereto, the Lenders party thereto, National City Bank, as Syndication Agent, Bank of America, N.A., asDocumentation Agent and Harris Trust and Savings Bank as Administrative Agent (incorporated by reference toExhibit 10(a) to the Company’s Quarterly Report on Form 10-Q for the quarterly period ended September 29,2001 (the ‘‘third quarter 2001 Form 10-Q’’)).
10(h) First Amendment to the Amended and Restated Credit Agreement, entered into as of August 1, 2001, among theCompany, the Guarantors party thereto, the Lenders party thereto and Harris Trust and Savings Bank, asAdministrative Agent for the Lenders (incorporated by reference to Exhibit 10(a) to the Company’s QuarterlyReport on Form 10-Q for the quarterly period ended June 30, 2001).
10(i) Second Amendment to the Amended and Restated Credit Agreement, entered into as of October 31, 2001,among the Company, the Guarantors party thereto, the Lenders party thereto and Harris Trust and Savings Bank,as Administrative Agent for the Lenders (incorporated by reference to Exhibit 10(b) to the third quarter 2001Form 10-Q).
10(j) Mortgage and Security Agreement, dated October 29, 1993, between The Lamson & Sessions Co. and PFL LifeInsurance Company (incorporated by reference to Exhibit 10(j) to the Company’s Annual Report on Form 10-Kfor the year ended January 1, 1994).
*10(k) Form of Amended and Restated Supplemental Executive Retirement Agreement dated as of March 20, 1990between the Company and certain of its executive officers (incorporated by reference to Exhibit 10(e) to theCompany’s Annual Report on Form 10-K for the year ended December 30, 1995).
37
Exhibit No. Description of Document
*10(l) First Amendment to The Lamson & Sessions Co. Amended and Restated Supplemental Retirement Agreement,effective January 1, 2000 (incorporated by reference to Exhibit 10(ak) to the Company’s Annual Report onForm 10-K for the year ended January 1, 2000).
*10(m) 1988 Incentive Equity Performance Plan (as amended and restated as of February 26, 1998) (incorporated byreference to Exhibit 4(c) of the Company’s Registration Statement on Form S-3 (Registration No. 333-65795)filed with the Securities and Exchange Commission on October 16, 1998).
*10(n) Amendment No. 3 to The Lamson & Sessions Co. 1988 Incentive Equity Performance Plan (as amended andrestated as of February 26, 1998) (incorporated by reference to Exhibit 10(am) to the Company’s Annual Reporton Form 10-K for the year ended January 1, 2000).
*10(o) Amendment No. 4 to The Lamson & Sessions Co. 1988 Incentive Equity Performance Plan (as amended andrestated as of February 26, 1998), dated as of October 19, 2000 (incorporated by reference to Exhibit 10(d) to thefirst quarter 2001 Form 10-Q).
*10(p) Form of two-year non-qualified stock option agreement under the Company’s 1988 Incentive EquityPerformance Plan (incorporated by reference to Exhibit 10(e) to the third quarter 2001 Form 10-Q).
*10(q) Form of three-year non-qualified stock option agreement under the Company’s 1988 Incentive EquityPerformance Plan (incorporated by reference to Exhibit 10(f) to the third quarter 2001 Form 10-Q).
*10(r) 1998 Incentive Equity Plan (as amended and restated as of April 27, 2001) (incorporated by reference toAppendix A of the Company’s Proxy Statement dated March 23, 2001).
*10(s) Form of two-year non-qualified stock option agreement under the Company’s 1998 Incentive Equity Plan(incorporated by reference to Exhibit 10(c) to the third quarter 2001 Form 10-Q).
*10(t) Form of three-year non-qualified stock option agreement under the Company’s 1998 Incentive Equity Plan(incorporated by reference to Exhibit 10(d) to the third quarter 2001 Form 10-Q).
*10(u) The Company’s Long-Term Incentive Plan (incorporated by reference to Exhibit 10(h) to the Company’s AnnualReport on Form 10-K for the year ended December 28, 1996).
*10(v) Amendment No. 1 to The Lamson & Sessions Co. Long-Term Incentive Plan, effective January 1, 2000(incorporated by reference to Exhibit 10(an) to the Company’s Annual Report on Form 10-K for the year endedJanuary 1, 2000).
*10(w) The Lamson & Sessions Co. Deferred Savings Plan (as amended and restated as of February 17, 1998 byAmendments 1-6) (incorporated by reference to Exhibit 4(c) to the Company’s Registration Statement onForm S-8 filed with the Securities and Exchange Commission on February 26, 1998 (RegistrationNo. 333-46953).
*10(x) Amendment No. 7 to The Lamson & Sessions Co. Deferred Savings Plan (incorporated by reference toExhibit 10(a) to the first quarter 2001 Form 10-Q).
*10(y) Amendment No. 8 to The Lamson & Sessions Co. Deferred Savings Plan (incorporated by reference toExhibit 10(b) to the first quarter 2001 Form 10-Q).
*10(z) Amendment No. 9 to The Lamson & Sessions Co. Deferred Savings Plan (incorporated by reference toExhibit 10(c) to the first quarter 2001 Form 10-Q).
*10(aa) The Lamson & Sessions Co. Nonemployee Directors Stock Option Plan, as amended and restated as of July 19,2001 (incorporated by reference to Exhibit 10(g) to the third quarter 2001 Form 10-Q).
*10(bb) Form of non-qualified stock option agreement under the Company’s Nonemployee Directors Stock Option Plan(incorporated by reference to Exhibit 10(h) to the third quarter 2001 Form 10-Q).
*10(cc) The Lamson & Sessions Co. Deferred Compensation Plan for Nonemployee Directors, as amended and restatedas of October 18, 2001 (incorporated by reference to Exhibit 10(i) to the third quarter 2001 Form 10-Q).
*10(dd) The Lamson & Sessions Co. Deferred Compensation Plan for Executive Officers, as amended and restated as ofOctober 18, 2001 (incorporated by reference to Exhibit 10(j) to the third quarter 2001 Form 10-Q).
21 Subsidiaries of the Registrant, filed herewith.
23 Consent of Independent Auditors, filed herewith.
24 Powers of Attorney, filed herewith.
38
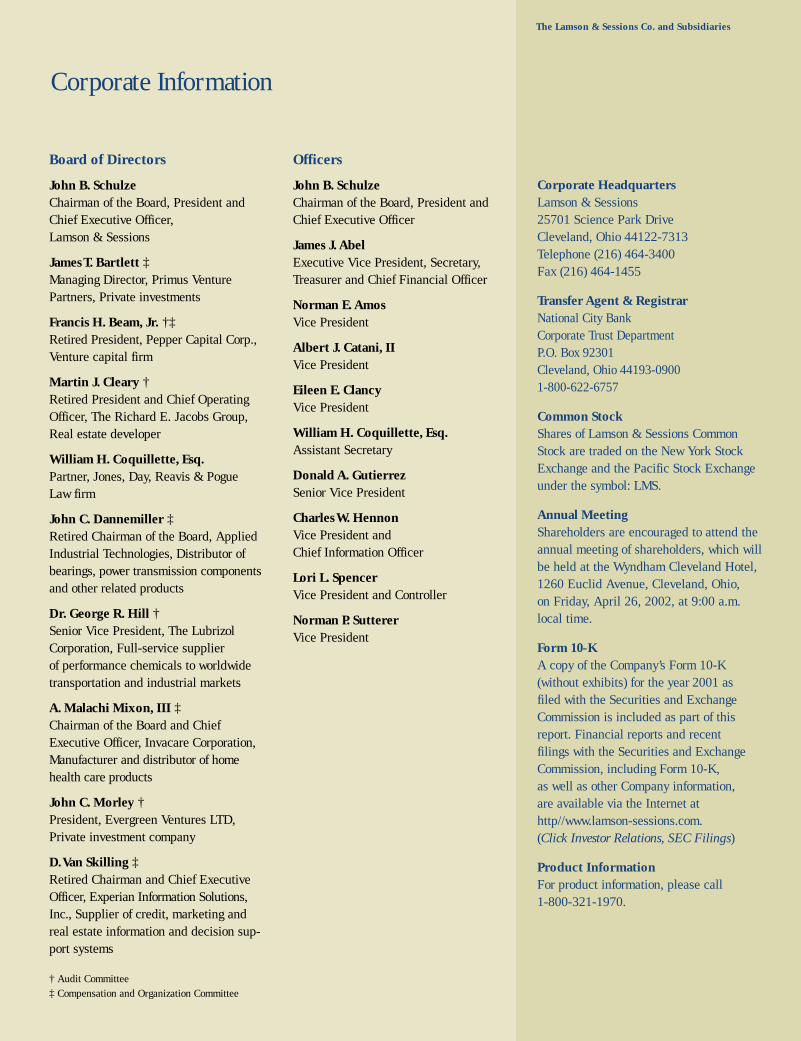
Board of Directors
John B. SchulzeChairman of the Board, President and Chief Executive Officer, Lamson & Sessions
James T. Bartlett ‡Managing Director, Primus VenturePartners, Private investments
Francis H. Beam, Jr. †‡Retired President, Pepper Capital Corp.,Venture capital firm
Martin J. Cleary †Retired President and Chief OperatingOfficer, The Richard E. Jacobs Group, Real estate developer
William H. Coquillette, Esq.Partner, Jones, Day, Reavis & Pogue Law firm
John C. Dannemiller ‡Retired Chairman of the Board, AppliedIndustrial Technologies, Distributor ofbearings, power transmission componentsand other related products
Dr. George R. Hill †Senior Vice President, The Lubrizol Corporation, Full-service supplier of performance chemicals to worldwide transportation and industrial markets
A. Malachi Mixon, III ‡Chairman of the Board and ChiefExecutive Officer, Invacare Corporation,Manufacturer and distributor of homehealth care products
John C. Morley †President, Evergreen Ventures LTD, Private investment company
D.Van Skilling ‡Retired Chairman and Chief ExecutiveOfficer, Experian Information Solutions,Inc., Supplier of credit, marketing andreal estate information and decision sup-port systems
† Audit Committee‡ Compensation and Organization Committee
Officers
John B. SchulzeChairman of the Board, President and Chief Executive Officer
James J. AbelExecutive Vice President, Secretary, Treasurer and Chief Financial Officer
Norman E. AmosVice President
Albert J. Catani, IIVice President
Eileen E. ClancyVice President
William H. Coquillette, Esq.Assistant Secretary
Donald A. GutierrezSenior Vice President
Charles W. HennonVice President and Chief Information Officer
Lori L. SpencerVice President and Controller
Norman P. SuttererVice President
Corporate Information
The Lamson & Sessions Co. and Subsidiaries
Corporate HeadquartersLamson & Sessions 25701 Science Park Drive Cleveland, Ohio 44122-7313Telephone (216) 464-3400 Fax (216) 464-1455
Transfer Agent & RegistrarNational City Bank Corporate Trust DepartmentP.O. Box 92301Cleveland, Ohio 44193-0900 1-800-622-6757
Common StockShares of Lamson & Sessions Common Stock are traded on the New York Stock Exchange and the Pacific Stock Exchangeunder the symbol: LMS.
Annual MeetingShareholders are encouraged to attend theannual meeting of shareholders, which willbe held at the Wyndham Cleveland Hotel,1260 Euclid Avenue, Cleveland, Ohio, on Friday, April 26, 2002, at 9:00 a.m.local time.
Form 10-KA copy of the Company’s Form 10-K (without exhibits) for the year 2001 as filed with the Securities and Exchange Commission is included as part of thisreport. Financial reports and recent filings with the Securities and ExchangeCommission, including Form 10-K, as well as other Company information, are available via the Internet athttp//www.lamson-sessions.com.(Click Investor Relations, SEC Filings)
Product InformationFor product information, please call 1-800-321-1970.
25701 Science Park Drive
Cleveland, Ohio 44122-7313
216-464-3400
http://www.lamson-sessions.com
Related Documents