Strengthening management and oversight of Global Fund grants: Lessons learned from the OGAC pilot experiences with executive dashboards in Nicaragua, Zanzibar, Tanzania and Nigeria The Leadership, Management and Sustainability Program Management Sciences for Health December 2007 Prepared by: Wayne Stinson Cary Perry Eduardo Samayoa Catherine Severo Marc Pechevis, HCI Saeed Osmani

Welcome message from author
This document is posted to help you gain knowledge. Please leave a comment to let me know what you think about it! Share it to your friends and learn new things together.
Transcript

Strengthening management and oversight of Global Fund grants:
Lessons learned from the OGAC pilot
experiences with executive
dashboards in Nicaragua, Zanzibar,
Tanzania and Nigeria
The Leadership, Management and Sustainability Program Management Sciences for Health
December 2007
Prepared by:
Wayne Stinson Cary Perry
Eduardo Samayoa Catherine Severo
Marc Pechevis, HCI
Saeed Osmani
Management Sciences for Health Tel: 617.250.9500
784 Memorial Drive Web site: www.msh.org
Cambridge, MA 02139 USA
For more information please contact Catherine Severo ([email protected])
This report was made possible through support provided by the US Agency for International
Development, under the terms of Cooperative Agreement Number GPO-A-00-05-00024-00.
The opinions expressed herein are those of the author(s) and do not necessarily reflect the
views of the US Agency for International Development.

Lessons learned on strengthening oversight and management of GF grants with dashboards
3
Table of Contents
Acronyms ............................................................................................................ 4
Executive Summary ................................................................................................. 5
Part 1: Identifying lessons from pilot year efforts to strengthen GF grant oversight and
management .......................................................................................................... 8
Introduction and purpose....................................................................................... 8 Methodology for reviewing the pilot experience ........................................................ 9 Background ......................................................................................................... 9
Part 2: Strengthening CCM oversight: diagnostic and capacity issues ........................... 12
Targeting technical support for oversight ............................................................... 12 CCM oversight capacity assessment ...................................................................... 13
Part 3: Strengthening CCM oversight through better information: Executive Dashboards 16
Overview ........................................................................................................... 16 Grant dashboards in the context of the Three One’s ................................................ 16 Design considerations for information tools ............................................................ 17 The design phase for information tools .................................................................. 25
Part 4: Conclusions and Recommendations .............................................................. 37
Annex 1: Rapid Assessment of CCM Oversight Capacity .......................................... 41 Annex 2: Menu of recommended indicators ............................................................ 47

Lessons learned on strengthening oversight and management of GF grants with dashboards
4
Acronyms
AIDS Acquired Immuno-Deficiency Syndrome
CBOs Community Based Organizations
CCM Country Coordinating Mechanism
CLWD Communities living with one of the 3 Diseases
CSOs Civil Society Organizations
FBOs Faith Based Organizations
FPM Fund Portfolio Manager
GA Grant Agreement
GF Global Fund
GMS Grant Management Solutions
HIV Human Immuno-Deficiency Virus
INGO International NGO
LFA Local Fund Agent
LOE Level of Effort
MDGs Millennium Development Goals
NGO Non-Governmental Organization
OGAC Office of the Global AIDS Coordinator
PEPFAR President’s Emergency Plan for AIDS Relief
PLWA People Living With HIV/AIDS
PLWD People Living With Diseases
PMI President’s Malaria Initiative
PR Principal Recipient
PSMP Procurement and Supply Management Plan
RBM Roll Back Malaria
SOW Scope of Work
SR Sub Recipient
SSR Sub-Sub-Recipient
TA Technical Assistance
TB Tuberculosis
TL Team Leader
TSAP Technical Support Advisory Panel
TSF Technical Support Facility
UNAIDS United Nations AIDS Program
UNICEF United Nations Children’s Fund
USAID United States Agency for International Development
WHO World Health Organization

Lessons learned on strengthening oversight and management of GF grants with dashboards
5
Executive Summary
From June 2006 through December 2007, the Office of the Global AIDS Coordinator (OGAC)
provided funds for Management Sciences for Health’s Leadership, Management and
Sustainability program (LMS) to undertake a pilot program of technical support to Country
Coordinating Mechanisms (CCMs) and Principal Recipients (PRs) receiving grants from the
Global Fund to fight AIDS, TB and Malaria (Global Fund). As part of its efforts to identify
lessons from the pilot phase, OGAC asked LMS to prepare a report analyzing the dashboard
experiment. LMS was instructed to identify the conditions needed for replication of the
dashboard as a standard tool and to draw conclusions on its potential for improving
oversight and management.
To fulfill this charge, LMS convened a working group which conducted a series of face-to-
face and virtual discussions from June through September 2007. Participants in the working
group concluded that broad aspects of governance and grant management had more impact
on conditions for replication than did software selection and dashboard design. Hence, this
report situates the executive dashboard option within the context of strengthening CCM
oversight and PR management, rather than as a stand-alone tool.
Strengthening CCM oversight: diagnostic and capacity issues
Two crucial questions for this pilot evaluation were ―How can we identify CCMs and PRs that
are ready for a dashboard approach?‖ and ―In countries which are not ready for a
dashboard, what should be done to strengthen grant oversight and monitoring?‖ The
working group used the image of a ―three-legged stool‖ required for effective management
and oversight of grants:
Reporting systems, from sub-recipients to PRs and from the latter to the Global Fund
Dashboard tools, used primarily to present existing information more effectively
Action steps, based on information, particularly actions to remedy implementation
problems.
The working group summarized the experiences from the pilot year in targeting technical
support in a table (see Chart 1: Simple mapping tool for identifying TA priorities on page 13
of this report). This table may be used to determine if a country (CCM and PR tandem) is
ready for a dashboard, or if more basic structural or information strengthening work needs
to be done first.
The LMS working group also developed a CCM rapid assessment tool to guide diagnosis of
CCM oversight capacity. (See Annex 1) The tool looks at three major areas: the strength of
data reporting, the quality and effectiveness of grant management and CCM oversight, and
the potential capacity for developing and using information tools.
Using Executive Dashboards to Strengthen CCM oversight
The executive dashboard tool responds to the need of managers and decision makers for
highly graphic presentations of key management and performance indicators for each grant.
LMS has promoted the use of dashboards for:
Overall CCM governance and communication with constituencies and leaders
CCM oversight of grant implementation
PR management of individual grants and sub-recipients.

Lessons learned on strengthening oversight and management of GF grants with dashboards
6
The dashboards provide different amounts of detail (and number of screens or pages) for
each of these levels, from information on individual SRs to succinct summaries of all grants
for higher political levels. The amount of detail provided balances the time the users can
devote to the function and the distance of the user from the level of implementation. The
African dashboards have been developed in Microsoft Excel (see the example on pages 18-
22 for the Round 4 Malaria grant in Tanzania), while Latin American dashboards use Excel
and Crystal Xcelsius (see Attachment A for the Honduras CCM Dashboard).
Dashboards intended for strengthening overall CCM governance and communication can
include additional indicators pertaining to CCM internal management and Secretariat
performance. Dashboards for management may show Sub Recipient information.
The working group spent substantial time debating the relative merits of alternative
software packages, with general agreement that design should start with Excel. PRs/CCMs
which can access capable IT support should move quickly to Xcelsius once basic capability
and user interest have been confirmed. The process for developing new information tools
includes the following steps: deciding what tools to develop; determining appropriate
software; outlining essential presentations; developing dashboard ―architecture,‖ based on a
hierarchy of information needs; developing a flagging system for items requiring attention;
determining data requirements; developing data entry sheets; and developing Follow-up
and Actions pages.
One clear lesson from early oversight work is that international support groups cannot
simply hand over responsibility for dashboards to the GF Secretariat, PRs and resource
centers without also offering continued technical support and facilitation. Dashboards are
not rigid tools but resources for organizational change - and external facilitation (i.e., from a
local or international support group) will usually make the evolution more effective. Two
case studies, one from Nicaragua and the other from Tanzania illustrate the process of
institutionalizing a dashboard within a PR and how longer term support can enable a CCM
and its PRs to use the dashboard to improve oversight.
Conclusions and Recommendations
The working group developed the following conclusions about how technical support to CCM
oversight and PR management should be delivered effectively:
1. In general, technical support should focus on basic structures and processes of good
governance before working on oversight (unless good governance is already in place).
2. Information tools developed for CCM oversight should highlight overall progress and flag
specific problems, but not go the level of detail required for routine management.
3. Information tools should focus on areas likely to require action, including programmatic
blockages and work plan implementation, and should encourage users to make
judgments and plan follow up.
4. TS providers should generally start by encouraging more effective use of existing
sources (especially PR reports, GF and AIDSPAN ratings) before moving to more
sophisticated (and demanding) tools.

Lessons learned on strengthening oversight and management of GF grants with dashboards
7
5. New information tools, especially dashboards, should start from existing demand (the
needs, interests and resources of our host country clients) rather than from what TS
providers think the CCM should want and use.
6. To the extent possible, TS providers should build on existing reporting schedules,
formats and definitions rather than attempting to introduce parallel systems.
7. In countries committed to the Three One’s, the decision to use a dashboard tool should
take into account Three One’s partners, so that the dashboard is not seen as a
duplicative or rival system.
8. Every dashboard for CCM oversight should be able to answer five questions:
a. Where is the money?
b. Where are the drugs?
c. Are activities rolling out as planned?
d. Have performance targets been achieved?
e. Are conditions precedent and other requirements being met?
9. Full CCM meetings should generally review only summary sheets, focusing on overall
program status and follow up actions required.
10. More effort must be placed upon establishing and documenting long term support
arrangements with locally resident technical support partners or contractors.
Experience in implementing recommended changes has been mixed, with successful
introduction of dashboards in Latin America and a greater number of obstacles to their
introduction in Africa. Additional work will be needed in a future project to develop a
dashboard prototype and take forward the standardization of instruction manuals and other
complementary tools and documents.

Lessons learned on strengthening oversight and management of GF grants with dashboards
8
Part 1: Identifying lessons from pilot year efforts to strengthen GF grant oversight and management
Introduction and purpose
From June 2006 through December 2007, the Office of the Global AIDS Coordinator (OGAC)
financed a pilot phase of technical support to Country Coordinating Mechanisms (CCMs) and
Principal Recipients (PRs) receiving grants from the Global Fund to fight AIDS, TB and
Malaria (Global Fund). Funding from the President’s Emergency Plan for AIDS Relief
(PEPFAR) was attributed to existing public health technical support cooperative agreements
and contractors of the United States Aid for International Development (USAID) for
individual short term assignments in 38 target countries. Management Sciences for Health’s
Leadership, Management and Sustainability program (LMS) carried out seven such
assignments focusing on CCM governance and PR grants management.1
Four of those assignments involved strengthening the CCM to provide oversight for GF
grants and/or strengthening the PR’s monitoring and management of the grant and grant
Sub-Recipients (SRs). In parallel, similar work was engaged in a fifth country (Honduras)
financed through the USAID/Honduras buy-in to the LMS project. During the first of these
assignments (Nicaragua), and drawing on several previous years experience with the PR
Nicasalud (a large national NGO), the LMS team developed a computerized summary
reporting tool, the Executive Dashboard. (This tool was inspired by the executive dashboard
developed for the Global Fund itself in 2005.2) Following review of this work in October 2006
by LMS, a decision was made to attempt adaptation of the Nicaragua executive dashboard
to countries in Africa as a tool for strengthening CCM oversight. Adaptation and replication
was attempted in Zanzibar, Tanzania and Nigeria.
In May 2007, as part of its efforts to identify lessons from the pilot phase, OGAC asked LMS
to prepare this report analyzing the four dashboard experiments. LMS was instructed to
identify the conditions needed for replication of the dashboard as a standard tool and to
draw conclusions on its potential for improving oversight and management.
To fulfill this charge, LMS convened a working group which conducted a series of face-to-
face and virtual discussions from June through September 2007. Participants in the working
group concluded early on that broad aspects of governance and grant management had
more impact on conditions for replication than did software selection and dashboard design.
Hence, this report situates the executive dashboard option within the context of
strengthening governance and management, rather than as a stand-alone tool. This report
makes recommendations for dashboard design, including software selection, and defines the
steps required to produce a dashboard and introduce it to the PR and CCM. Brief case
studies illustrate the successful use of a dashboard by the Honduras CCM and the ongoing
struggles of Zanzibar, Tanzania and Nigeria to use theirs. Conclusions are drawn about the
human, IT, and data quality conditions needed for dashboards, and strengthening efforts
needed before dashboards become appropriate. Finally we make recommendations for
1 In Nicaragua, Zanzibar, Tanzania, Pakistan, Nigeria, Cote d’Ivoire, Guinea. This support was financed through
USAID Cooperative Agreement number GPO-A-00-05-00024-00, as part of the USG technical assistance effort for the Global Fund to fight AIDS, TB, and Malaria. 2 See http://www.theglobalfund.org/en/files/about/replenishment/The%20Global%20Fund%20Mid-
Year%20Progress%202005%20%20-%20June%202005.pdf

Lessons learned on strengthening oversight and management of GF grants with dashboards
9
planning and implementing technical support for strengthened management and oversight
of Global Fund Grants.
Methodology for reviewing the pilot experience
With an eye to synthesizing experience and improving future LMS products and services,
three MSH staff and one consultant met for three days in June 2007 to review the Executive
Dashboards created in Nicaragua and replicated in three African countries and to define:
Conditions for replication
Recommendations on use of Excel versus Xcelcius for a generic version of the
dashboard
Process for replication.
Members of the working group were:
Eduardo Samayoa, Senior Program Associate, LMS (oversight work in Nicaragua and
Honduras and inventor of the Executive Dashboard)
Cary Perry, Monitoring and Evaluation Specialist, LMS (oversight work in Nicaragua
and Honduras)
Wayne Stinson, consultant (oversight work in Tanzania, Zanzibar, and Nigeria)
Saeed Osmani, MSH Manager of IT Support (dashboard work in Zanzibar).
Also participating via distance communications was Marc Pechevis, HCI, France (oversight
work in Tanzania) and Catherine Severo, Global Fund Support Manager, LMS (oversight
work in Zanzibar, Tanzania, Nigeria, Cote d’Ivoire, Guinea Conakry).
This group drew lessons from MSH/LMS technical assistance to the following countries to
strengthen oversight:
Nicaragua (July to September 2006)
Tanzania Mainland (September 2006 to January 2007; some follow up support)
Zanzibar (September 2006 to January 2007; some follow up support)
Nigeria (December 2006 through March 2007).
Honduras (January 2007 to present)
Three drafts of the report were produced from June to September 2007. Further information
was drawn from a detailed analysis of the Honduran experience and from follow-up in
Tanzania and Nigeria six months after the first sets of visits and integrated into this final
report. This additional observation has provided much sobering information on the need for
long term follow-up to strengthen CCM oversight and use of the dashboards in general.
Background
Country Coordinating Mechanisms, established to guide Global Fund activities at country
level, have five major responsibilities:
Governance
Harmonization
Proposal development

Lessons learned on strengthening oversight and management of GF grants with dashboards
10
Oversight
Communication.
Oversight is fundamentally a CCM responsibility and differs from management because it
looks across grants and programs to identify cross-cutting policy and implementation
issues. It is strategic, in the sense of setting and following up on broad objectives and
service delivery approaches rather than individual agencies or activities, sometimes even
beyond the scope of individual funding sources. (Tanzanian oversight, for example, is
intended to cover all relevant national programs, not simply those funded by GFATM.)
Oversight is a cyclic activity, following the grant reporting cycle. Typically, the oversight
process starts with reporting by implementing groups, followed by data-based reviews by
objective analysts (i.e., not representing implementing groups), and finally action to
diagnose and resolve implementation bottlenecks. These three stages in the oversight
process are equally critical, especially since information without action may be largely
wasted.
Grant management is primarily a full-time responsibility of individual PRs and SRs, not of
the CCM. Principal Recipients, as signatories of the Grant Agreements, have legal
responsibility for grant performance. The PR may manage the grant directly or delegate
some of the management functions to an SR. In all cases, GF grant management includes
maintenance of key operational systems: partnership coordination, financial management,
human resources mobilization and deployment, procurement and distribution, supervision,
technical coordination, annual planning, technical reporting, among others. CCMs neither
can nor should become involved in grant management functions, except to the extent that
they involve higher level policy issues or systemic problems requiring intervention by higher
authorities.
Many programs also require grant coordination, a process that lies between management
of individual organizations and oversight by the CCM. The need for coordination arises in
grants with multiple PRs, as in Tanzania’s Round 4 HIV grant. The Global Fund Portfolio
Manager has indicated that all four recipients must work together and will be judged
together, hence the need for information sharing, peer review, and joint efforts to solve
problems. The need for coordination also arises where a country has more than one grant
for the same disease or where a single PR manages more than one grant.
Strong reporting systems and data-driven decision making and actions are essential for all
five of the CCM functions, but especially for oversight. The reporting systems currently
available in recipient countries are often weakest in the very countries where they are most
essential. Many CCMs, moreover, continue to see the proposal development function as the
most critical one for continued donor funding. Yet GF’s performance-based funding approach
emphasizes effective and efficient implementation; continuity of funding is conditional upon
good management and high performance. GF Board decisions on additional grants are
increasingly informed by evidence that the CCM and PRs have learned from past
performance and resolved systemic problems. Good PR management and timely problem-
solving CCM oversight both require timely, high quality information and analytical skills.
Work with CCMs and PRs since 2002 has identified a number of frequent problems with
governance and management, many of which have consequent effects on oversight.
Common problems include:
Superficial or limited efforts by CCM to understand and follow the GF grants and their
implementation, increasing as the number of grants per country increases
Lack of clear processes and designated responsibilities for oversight
Lessons learned on strengthening oversight and management of GF grants with dashboards
11
Uncertain and sometimes contested relationships between the CCM and Principal
Recipients
Conflicts of interest when CCM members, Chairs or Vice Chairs are representatives of
PR or SR institutions
Weak national reporting systems leading to parallel reporting for GF requirements
Poor data quality, poor or tardy compliance with reporting deadlines
Excessively voluminous, non quantified, and tardy reporting to the CCM
Failure of the CCM to acquire the technical expertise needed for oversight
Ignorance of significant problems in grant implementation
Reluctance by the CCM to take action even when problems are recognized or failure
to mobilize CCM members to assist the PR to resolve problems beyond its authority.
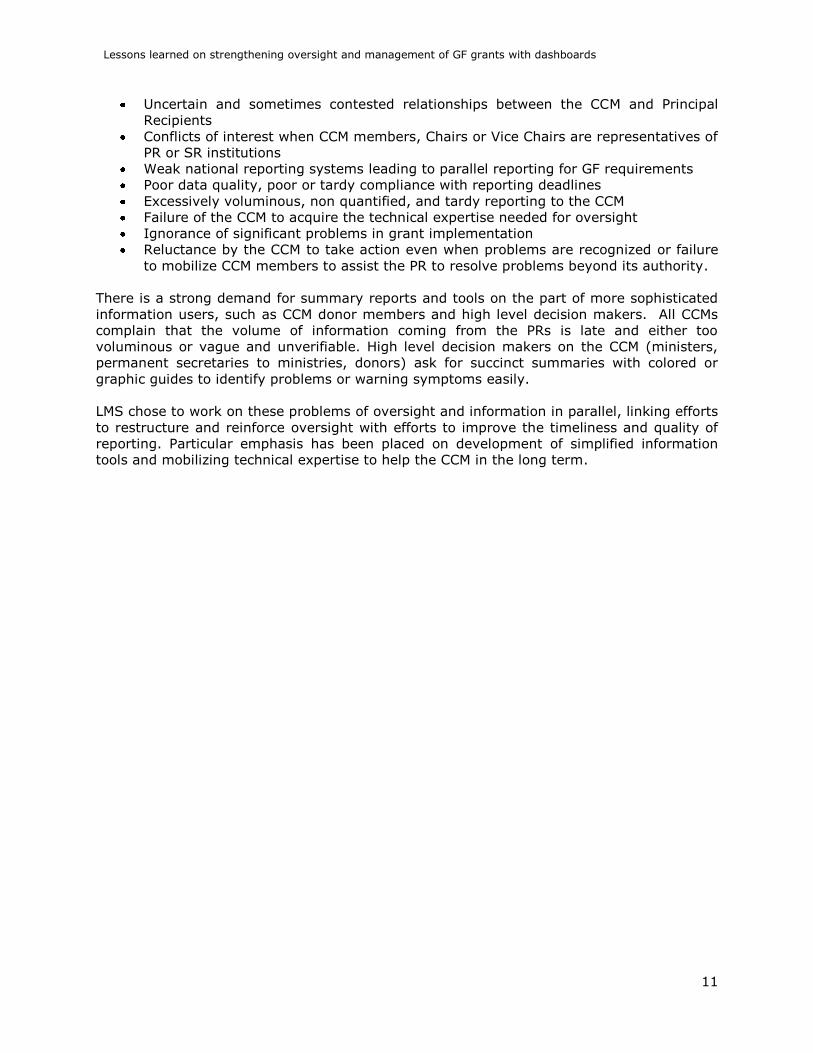
There is a strong demand for summary reports and tools on the part of more sophisticated
information users, such as CCM donor members and high level decision makers. All CCMs
complain that the volume of information coming from the PRs is late and either too
voluminous or vague and unverifiable. High level decision makers on the CCM (ministers,
permanent secretaries to ministries, donors) ask for succinct summaries with colored or
graphic guides to identify problems or warning symptoms easily.
LMS chose to work on these problems of oversight and information in parallel, linking efforts
to restructure and reinforce oversight with efforts to improve the timeliness and quality of
reporting. Particular emphasis has been placed on development of simplified information
tools and mobilizing technical expertise to help the CCM in the long term.

Lessons learned on strengthening oversight and management of GF grants with dashboards
12
Part 2: Strengthening CCM oversight: diagnostic and capacity issues
Dashboards have been widely praised because of their potential contribution to reducing
Global Fund oversight problems; however, their actual contribution and use have been
mixed because of weak reporting by Principal Recipients and ineffective information use by
CCMs and oversight committees. This is because information tools, no matter how well
presented, provide only raw material for strengthening management, coordination and
oversight. People, and the way in which they work together, are more important than
information tools and are often slower to change.
The working group used the image of a ―three-legged stool‖ required for effective
management and oversight of grants:
Reporting systems, from sub-recipients to PRs and from the latter to the Global Fund
Dashboard tools, used primarily to present existing information more effectively
Action steps, based on information, particularly actions to remedy implementation
problems.
Therefore, two crucial questions to this pilot evaluation are ―How can we identify CCMs and
PRs which are ready for a dashboard approach?‖ and ―In countries which are not ready for a
dashboard, what should be done to strengthen grant oversight and monitoring?‖
Targeting technical support for oversight
Technical support for CCM oversight or M&E strengthening usually begins with a diagnostic
phase, whether an M&E Self Assessment or a shorter diagnosis conducted by the LMS or
GMS team. The results of this phase will be used to select interventions appropriate to the
capacity gaps of the PR or CCM and to select consultants with the skills needed to deliver
the interventions.
The working group summarized the experiences from the pilot year in targeting technical
support in the following table (See Chart 1). This table may be used to determine if a
country (CCM and PR tandem) is ready for a dashboard, or if more basic structural or
information strengthening work needs to be done first. If the latter is the case, the
dashboard should NOT be proposed. It might, however, be proposed in a second phase of
support if preliminary strengthening has been completed successfully.
Information for this analysis should come from an oversight or M&E diagnostic but also from
review of the CCM structure and procedures and the relations between the CCM and the
PR(s) in the recent past. Information should also be drawn from the Grant Progress
Reports, Phase 2 Score Cards and other documents on the GF website.
As noted in this table, the types of consultants needed for these different functions will vary,
depending on the strength of reporting systems and the readiness of CCMs and PRs to use
available information for effective oversight and management. Consultants to support data-
based oversight and management range from governance specialists (for basic structure
and process), to HMIS or M&E experts, to program management or public health people
with intermediate Excel and/or Xcelsius skills. In some cases, the appropriate consultant

Lessons learned on strengthening oversight and management of GF grants with dashboards
13
may be a specialist in financial management or procurement, rather than a measurement
specialist.
Chart 1: Simple mapping tool for identifying TA priorities
Context Responses Comments
Data supply Information use Technical support options
Appropriate types of
consultant
Financial or
programmatic data are unavailable or very unreliable
Statistical
presentations are ignored because they are unreliable
HMIS and M&E
support for selected PRs
HMIS and M&E
specialists
PR reporting
systems are
basically OK, but . . .
The CCM
oversight function
is not defined; committee and procedures are not established.
Create oversight
committee and
procedures within broader governance structure; strengthen secretariat
Governance
specialists
PR systems should
be in place before
developing information tools
PR reporting systems are basically OK, but . . .
CCM doesn’t know how to use information, especially links between financial,
procurement and performance data
Train CCM and/or oversight committee to use existing GF reports
M&E specialist with strong programmatic understanding
Dashboards may be easier to understand than available reports, but they may not
be worth the extra effort when already available information t is not used
Information is
available and problems are recognized, but . . .
No one does
anything; the CCM ignores even known problems.
Strengthen CCM
motivation and capacity to act on available information
Financial
management, procurement, other
Dashboards will
generally not resolve problems of CCM inaction
PR reporting
systems are basically OK, and
The CCM has
moderately good capacity to analyze and act on data.
Excel-based
dashboard (perhaps simple at first)
Program specialist
with intermediate Excel skills (and access to home office technical support)
Pairing of program
and Excel specialists, as in Africa, generally not necessary.
PR and SR
reporting systems are basically OK, and
CCM has high
capacity to analyze and act on data
Xcelsius-based
dashboard
Consultant should
have basic Xcelsius skills but with immediate access to home
office technical support
Xcelsius should be
considered experimental in many countries (especially Africa).
CCM oversight capacity assessment
The Global Fund has focused considerable attention upon preparation of diagnostic tools to
be used by the Local Fund Agent to assess capacity of the PR. With WHO and other
partners, the Global Fund has also developed the M&E Self Assessment Tool for review of

Lessons learned on strengthening oversight and management of GF grants with dashboards
14
national M&E systems for diseases. However, little attention has been focused upon
diagnosis of the oversight capacity of the CCM.
The LMS working group developed a CCM rapid assessment tool to guide diagnosis of CCM
oversight capacity. (See the CCM oversight rapid assessment tool in Annex 1.) The tool
looks at three major areas: the strength of data reporting, the quality and effectiveness of
grant management and CCM oversight, and the potential capacity for developing and using
information tools.
The CCM oversight rapid assessment tool may be used either informally or in a workshop
setting. Specific steps for its use are as follows:
1. Gather further information on USAID and GFATM concerns and issues
a. Meet with USAID
b. Review documents, interview key informants regarding GFATM concerns
2. Assess interests and capacity of information users, especially CCM and program
managers
a. Meet with CCM
b. Meet with oversight group if available; otherwise with key individuals
interested in oversight
c. Assess the use and usefulness of available information tools, including
PU/DRs, direct PR reports, site visits
d. Assess the adequacy and appropriateness of current oversight procedures (as
officially planned and as actually conducted)
e. Assess the adequacy and appropriateness of CCM responses to known
problems
3. Assess interests and capacity of data providers, especially PRs and LSRs
a. Meet with program managers, M&E managers, and those responsible for
financial reporting and procurement
b. Rapidly assess SR reporting to PRs
c. Review reports to LFA and GF (PU/DRs) for completeness and timeliness
d. Determine how existing information tools are used for program management
4. Assess available information tools for content, utility
a. Verbal PR presentations
b. Progress Updates/Disbursement Requests
5. Assess capacity and processes of CCM Secretariat
a. M&E capacity
b. Ability to obtain local expert assistance when needed
6. Identify and assess potential local support institutions and consultants (universities,
computing centers, donors).
a. Assess ability to develop and update information tools
b. Identify at least two individuals able to take responsibility for GF support
c. Assess ability to contract with (1) MSH; (2) CCM Secretariat
Results of this rapid assessment will be used to select the support interventions and to
explain to the CCM what kinds of strengthening it needs to undertake. (It will also allow the
consultants to categorize the CCM in the simple mapping chart – Chart 1 - if they were not
able to do so using existing documents.)

Lessons learned on strengthening oversight and management of GF grants with dashboards
15
Response strategies may begin during the second week of the first field visit and will require
two additional visits with longer term follow up by local consultants or other local partners.
The steps below are condensed but form the heart of country implementation.
1. Work with key members of CCM and others to outline oversight process:
a. What kinds of information PRs will provide to oversight group and on what
schedule
b. How the oversight group will be constituted and what it will do
c. How the oversight group will report to full CCM
d. What follow up actions will occur when problems are identified
2. Work with PRs and others to strengthen use of information for grant management
a. Outline process for coordinated review of SR reports
b. Develop coordination process for multiple implementing groups (PRs/LSRs)
c. Encourage involvement of non GFTS partners to strengthen routine reporting
systems
3. Decide if new information tools are necessary, feasible
a. Specify the information needs of various users (e.g., oversight group,
Secretariat, PR coordinating group, individual PRs)
b. Decide if first step should be to support better use of available reports (e.g.
PU/DR)
c. Do not develop new information tools if basic reporting and oversight
processes are not already in place. Fix that problem first.
d. If new tools are necessary and information users are ready, decide for whom
(per above) and how much information each group will be able to absorb.
e. Identify who will maintain tools after external assistance ends; adjust tool
strategy to sustainability requirements.
4. Plan for long term involvement of local partner
a. Develop contracting arrangement between local partner and GFTS
b. Also identify potential technical support arrangement between local group and
CCM or Secretariat
5. Identify next steps:
a. Stakeholders to confirm membership of oversight group
b. Local TA partner to gather additional information
c. External consultant to begin drafting information tools.
Thus the decision to undertake a dashboard approach takes into account each of the three
―legs‖ of the oversight ―stool‖: reporting systems, quality of existing information, and
capacity to take action.

Lessons learned on strengthening oversight and management of GF grants with dashboards
16
Part 3: Strengthening CCM oversight through better information: Executive Dashboards
Overview
The executive dashboard tool responds to the need of managers and decision makers for
highly graphic presentations of key management and performance indicators for each grant.
LMS has promoted the use of dashboards for:
Overall CCM governance and communication with constituencies and leaders
CCM oversight of grant implementation
PR management of individual grants and sub-recipients.
The dashboards provide different amounts of detail (and number of screens or pages) for
each of these levels, from information on individual SRs to succinct summaries of all grants
for higher political levels. The amount of detail provided balances the time the users can
devote to the function and the distance of the user from the level of implementation. The
African dashboards have been developed in Microsoft Excel3, while Latin American
dashboards use Excel and Crystal Xcelsius.4
As an example, the following pages show dashboards for the Round 4 Malaria grant in
Tanzania. (Please see also Attachment A: the Honduras Dashboard for a full presentation
about a CCM level dashboard.)
Grant dashboards in the context of the Three One’s
The Nicaragua dashboard was created in an environment free of PEPFAR or Three One’s
considerations. In the process of transferring the dashboard to Zanzibar, Tanzania and
Nigeria, the LMS consultants were required to justify this approach within the context the
Three One’s philosophy of consolidated M&E systems and national indicators. In all three
countries, the World Bank was assisting the National AIDS Commissions and Ministries of
Health to develop national HIV/AIDS MIS systems. In Nigeria, furthermore, the federalist
style of government means that health reporting channels information through state
systems, on the way to national level. There was considerable debate in each country about
the appropriateness of a dashboard when all other efforts were directed at consolidation;
World Bank consultants can object strenuously to the introduction of a dashboard.
Four arguments have been used successfully to justify the dashboard as an additional but
not duplicative tool:
1. The dashboard uses existing information from the PRs and SRs, it does not require
collection of additional information. Dashboards reformat information in a user-
friendly way for decision makers. Therefore it is a presentation mechanism for busy
decision makers and managers, not a reporting mechanism.
3 MS Office Excel 2003 4 Business Objects Crystal Xcelsius v4.5

Lessons learned on strengthening oversight and management of GF grants with dashboards
17
2. The World Bank efforts focus on HIV/AIDS but do not concern TB and malaria. The
need for summary reports for these grants cannot be solved by the World Bank
work.
3. Furthermore, the new HIV/AIDS MIS will not be operational for some time (6 to 18
months at the time of these consultancies), while the CCM needs information about
HIV/AIDS grants immediately. CCM work cannot be delayed to coincide with start-
up of the MIS. If at some future time, the MIS can produce dashboard information,
then the grant dashboard for AIDS grants could be stopped.
4. Dashboards include management information, not just health indicators. Therefore,
dashboards overlap only partially with the HIV/AIDS MIS outputs, focusing
specifically on the Global Fund grants.
Design considerations for information tools
The following discussion distinguishes three sub-topics:
Dashboard contents
Dashboard ―architecture‖
Software
Dashboard contents
Regardless of intended use, every dashboard should answer at least the following
questions:
Where is the money?
Where are the drugs?
Are activities rolling out as planned?
Have performance targets been achieved? Are conditions precedent and other requirements being met?
Dashboards intended for strengthening overall CCM governance and communication can
include additional indicators pertaining to CCM internal management and Secretariat
performance.

Lessons learned on strengthening oversight and management of GF grants with dashboards
18
30 September 2007
S1 Comment S2 Comment S3 Comment
Expected Actual Due Date
No. Expected
Reports
No. On-Time
Reports
LFA to GF 7 14 15-Apr-07 6 6
GF to PR 14 14 15-Jul-07 6 6
PR to MoHSW 7 60 15-Oct-07 6 6
MoHSW to SSRs 14 22 (Median) 15-Jan-08 6
MoHSW to SSRs 14 28(Longest)
S4 Comment
BudgetedCommitted/
PaidProcurements
48,891,733 46,938,713 Drugs (ACT)
S5 Comment
Indicators
Target AchievedAchievement
Rate
# of severe malaria cases correctly treated 338,000 393,587 116%
# of uncomplicated malaria cases correctly treated 8,560,000 4,495,268 53%
# of health facilities with no drug stock-outs 2,334 4,111 176%
# of sentinel sites for resistance 20 19 95%
# of NGO/CBO staff trained on BCC 2,541 3,010 118%
# of Radio/TV spots produced and aired 2,000 1,563 78%
# of deliverers trained on epidemic containment 9,710 8,710 90%
# of districts connected to NMCP by internet 24 0 0%
Preparation date: 20-Nov-07 Printing Date
Prepared by: UCC
GFATM, Round 4, MALARIA
Grant has now been fully disbursed. Implementing groups have adequate resources for
near future.
Lengthy delays between MoF and MoH.
S2: Last Fund Disbursement Pipeline (days)
Cumulative Performance
31-Jan-08
Summary of Indicators
01-Aug-05Grant Start Date:
31-Jul-08
$76,086,764
S3: Financial Reporting by LSRs
Data Updated to:
27-Dec-07
Phase 2
MoF
12-Jul-07
Next Shipment DueLast Shipment Received
Grant Finish Date:
Total Value:
Current Status:
Principal Recipient:
Cumulative Performance
0% 10% 20% 30% 40% 50% 60% 70% 80% 90% 100%
S1: Program Budget (cumulative,USD)
-
10,000,000
20,000,000
30,000,000
40,000,000
50,000,000
60,000,000
US
D
ALL (temp) 54,201,787 54,201,787 54,201,787 54,201,787
Approved Budget Disbursed to PR Disbursed from PR Spent or Obligated

Lessons learned on strengthening oversight and management of GF grants with dashboards
19

Lessons learned on strengthening oversight and management of GF grants with dashboards
20
01-Aug-05
31-Jul-08
30 September 2007
Are technical targets being achieved?
P1 Comment
Indicators Target Achieved
Achievement
Rate
# of severe malaria cases correctly treated 338,000 393,587 116%
# of uncomplicated malaria cases correctly treated 8,560,000 4,495,268 53%
# of health facilities with no drug stock-outs 2,334 4,111 176%
# of sentinel sites for resistance 20 19 95%
# of NGO/CBO staff trained on BCC 2,541 3,010 118%
# of Radio/TV spots produced and aired 2,000 1,563 78%
# of deliverers trained on epidemic containment 9,710 8,710 90%
# of districts connected to NMCP by internet 24 0 0%
P2 Comment P3 Comment
P4 Comment
Preparation Date: 20-Nov-07
Prepared by: UCC Printing Date 27-Dec-07
P1: Cumulative Performance
Yes, very well (except for internet connectivity).
Internet connections delayed by procurement requirements for more than 2 years! Equipment is now in country; installation expected to begin shortly. Need to update treatment target and results; also radio indicator. Drug stock-out
indicator should be verified.
GFATM, Round 4, MALARIA
Performance IndicatorsGrant Start Date:
Grant Finish Date:
Data Updated to:
Cumulative Performance
0% 10% 20% 30% 40% 50% 60% 70% 80% 90% 100%
P4: No of Health facilities with no Drug stockouts
0
1,000
2,000
3,000
4,000
5,000
6,000
0 (baseline) Quarter 2 Quarter 4 Quarter 6 Quarter 8
Target
Achievement
P2: No of severe cases correctly treated
0
100,000
200,000
300,000
400,000
500,000
600,000
0 (baseline) Quarter 2 Quarter 4 Quarter 6 Quarter 8
Target
Achievement
P3: No of uncomplicated cases correctly treated using ACT
0
2,000,000
4,000,000
6,000,000
8,000,000
10,000,000
12,000,000
0 (baseline) Quarter 2 Quarter 4 Quarter 6 Quarter 8
Target
Achievement

Lessons learned on strengthening oversight and management of GF grants with dashboards
21

Lessons learned on strengthening oversight and management of GF grants with dashboards
22

Lessons learned on strengthening oversight and management of GF grants with dashboards
23
As noted, the degree of detail used to answer these questions will vary by program phase,
data availability, and user sophistication. (Annex 2 presents a menu of suggested indicators,
with notes regarding their appropriateness for different levels.)
Volume of information
It is essential to avoid information overload for users, especially when there are multiple
grants, PRs, and SRs. In general, it is better to start simply and gain ―buy-in‖ from data
producers and users before moving to more sophisticated information tools. The following
matrix in Chart 2 correlates dashboard users, with objectives, and types of presentations.
Note that the Oversight Committee and Secretariat are likely to require multiple
dashboards, perhaps totaling up to 50 pages for a complex program (e.g. Tanzania)
although some may be studied through hyperlinks and printed only when detailed questions
must be analyzed.
Chart 2: Information users and inter-linked dashboards
User Contents Presentations Comments
Political leaders,
donors,
constituencies,
public
Overall grant
performance, CCM
information
Generally one summary
dashboard (1 page) for all
grants
Identify level of
detail which each of
these user groups
require
CCM as a whole Grant
performance, plus
summary report
from Oversight
committee
One summary dashboard
(1-2 pages) for each
grant, plus analysis of
oversight findings, actions
taken & recommendations
Full CCM should
generally not review
detailed dashboards
Oversight
Committee (all
grants)
Implementation
details (financial,
procurement, HR)
in Phase I, and
technical
performance in
Phase II
Summary dashboard for
each grant (2-3 pages)
including highlights and
actions
Avoid data overload;
ensure that
committee answers
the five questions
above and can easily
access PR detail
when needed
Grant or disease
coordination
committee
Information on
each PRs and
selected SRs
implementing a
single grant
As above plus detailed
dashboards (3-4 pages)
for each PR (if there is a
multi PR grant) and/or
objective
Dashboards facilitate
information
exchange among PRs
with shared
objectives and
responsibilities
Individual PRs Same as above but
with details for
individual SRs
Summary dashboard for
grant, with detailed
dashboards for each SR
and/or objective, this may
include a map of SR
distribution
Develop in
conjunction with
Oversight Committee
dashboards
Software selection
The working group spent substantial time debating the relative merits of alternative
software packages, with general agreement that design should start with Excel. PRs/CCMs
which can access capable IT support should move quickly to Xcelsius once basic capability
and user interest have been confirmed. Excel is simpler than Xcelsius and more widely

Lessons learned on strengthening oversight and management of GF grants with dashboards
24
known, but a well-designed Xcelsius presentation shows greater detail and has greater
potential for exciting users. Chart 3 summarizes the two packages.
Chart 3: Comparison of Excel and Xcelsius for Dashboard Development
Software Advantages Disadvantages
Excel Widely known and many more
people trained in its use than
for Xcelsius; rows and columns
can be easily added to facilitate
maintenance; TA consultants
likely to know it well
Time to create engaging graphs
for presentation is long; Pages
hold a limited number of graphs
(4-5); Many printouts needed
requiring a lot of paper and color
capability
Xcelsius Engaging graphs and pictorial
representations; Graphs can be
quickly created from Excel
spreadsheets; Someone with
good computing skills can be
taught to use it; Interactive
slides can hold more graphs
that Excel
Known by few people; Capacity to
maintain dashboard and make
changes is less available locally
Must be printed by exporting to
Power Point slides which can be
manipulated to show graphs
under a drop down box, but
information contained in the slides
can only be changed in the
original Excel document;
Additional cost of software license
The following may be considered prerequisites for moving from Excel to Xcelsius:
Strong and sustainable software capability within the CCM Secretariat or a support
organization with an established relationship (i.e., contract, grant, or MoU) with the
CCM. (Generally, at least three individuals should have strong software presentation
skills and commitment to learn Xcelsius.)
A rich and generally reliable data set. (Xcelsius is often the most appropriate
presentation package for a program with multiple sub-recipients and service
providers reporting on the same indicators.)
A long term (minimum six to nine months) partnership with MSH or other Global
Fund M&E/IT support group.
Regardless of software selection, the working group agreed that attractiveness of dashboard
presentation has a major bearing on use. While Xcelsius lends itself to greater artistry than
Excel, much can be done within Excel as well. The success of Eduardo Samoyoa’s Excel
forms for data collection for the Nicaragua PR and his dashboards in Xcelsius for the
Nicaragua PR and the Honduras CCM demonstrate the utility of good data presentation. An
example of a prototype CCM dashboard with basic indicators that has been exported to
Power Point from Xcelsius can be found in Attachment A. It displays indicators for
monitoring of the Honduras Global Fund Project performance and management of the
Honduras CCM and CCM secretariat.

Lessons learned on strengthening oversight and management of GF grants with dashboards
25
Technical support consultants’ qualifications
All dashboard consultants should be competent in Excel (i.e., with intermediate skills, able
to develop dashboards with only minimal technical support from an Excel specialist).5 All
dashboard consultants, moreover, should know enough about Xcelsius to determine its
feasibility and appropriateness for a specific program. They should be able to discuss
technical feasibility with local partners and determine if sustainable capability exists. They
should also be able to present a previously prepared Xcelsius dashboard to information
users. Technical support for Xcelsius dashboards may come ―virtually,‖ through an expert
pool in the home office, provided that field consultants are able to prepare preliminary
information in Excel.
The design phase for information tools
Initial design
The following summarizes the process for developing new information tools. (These steps
must be modified where new tools are either not needed or may be introduced after more
basic oversight and management processes have been established.)
1. Decide what tools to develop; these may include:
a. CCM oversight tools
b. Higher (―presidential‖) level dashboard
c. Grant management/coordination dashboards
d. Secretariat dashboard
2. Determine appropriate software (See Chart 3: Comparison of Excel and Xcelsius)
a. Interest/ability of users to use complex information
b. Sustainability with local support resources
c. Use Excel unless prerequisites for Xcelsius have been met.
3. Outline essential presentations
a. Where is the money?
b. Where are the drugs?
c. Are activities rolling out as planned?
d. Have performance targets been achieved?
e. Are conditions precedent and other requirements being met?
f. Are the CCM and Secretariat meeting their own performance objectives?
4. Develop dashboard ―architecture,‖ based on a hierarchy of information needs (see
Chart 1: Information users and inter-linked dashboards)
a. Detailed dashboards for program management and grant coordination (charts
for individual implementing groups and program objectives)
b. Summary dashboards for oversight (charts for individual rounds and
programs, e.g., R4 HIV)
c. Highlight and action pages for full CCM (one for each round and program)
d. Higher (―presidential‖) dashboard for political leaders and others (one
dashboard for all GF-supported activities)
5 Essential Excel skills, defined here as ―intermediate,‖ include: (1) ability to develop and
format graphic presentations, with linkages to data sheets; (2) facility with conditional
formatting; (3) ability to develop simple formulas. Competence in developing macros may
be useful but is not essential.

Lessons learned on strengthening oversight and management of GF grants with dashboards
26
5. Develop flagging system for items requiring attention
a. Red for action needed
b. Orange for early warnings
6. Determine data requirements
a. Build as much as possible on existing reporting systems, especially PU/DRs
b. Options for financial reporting
c. Tracking commodity procurement and availability
d. Identifying critical actions, e.g. conditions precedent and application deadlines
e. Develop definition sheet
7. Develop data entry sheets
a. Lock cells which should not be changed
b. Use color codes for cells which data providers must update
8. Develop Highlights and Actions page
Output: Prototype tools, including contents, architecture, and software selection.
Facilitate local capacity to support oversight
One clear lesson from early oversight work is that international support groups cannot
simply hand over responsibility for dashboards to the GF Secretariat, PRs and resource
centers without also offering continued technical support and facilitation. Most ―hand over‖
arrangements - usually designed as manuals, a training session, and a local resource center
– have led to only weak oversight, with dashboards updated but not adjusted to changing
needs, and oversight committees either not meeting or working ineffectively. It is clear that
more proactive facilitation from outside the GF implementing group makes a big difference
in oversight and eventually grant performance.
It is necessary to keep the full oversight cycle in mind and recognize that even good
dashboards do not guarantee a functioning process. Key elements generally include the
following:
CCM leadership, including insistence that PRs provide timely and accurate data and
cooperate with the oversight process and any follow up
A Secretariat able to obtain and digest PR reports, follow up on missing information,
and monitor PR compliance with oversight recommendations
PRs able to provide timely financial, procurement and performance data
A technical support group, able both to input dashboard data and update
presentations AND to make necessary changes for new grants, Round 2 approvals,
and evolving needs.
A strong and well-facilitated oversight committee or committees, able to ask
perceptive questions, interpret dashboard and other data, and provide appropriate
recommendations to the full CCM
A CCM able to interpret digested program information and to make appropriate
decisions to resolve problems.
Experience in Tanzania and elsewhere shows that good tools and motivated reviewers, while
necessary, do not ensure success; rather, tools, reviewers and processes must evolve
synergistically, with likely adjustments over time in all three. Dashboards must adapt to
changing needs; reviewers must learn to ask perceptive questions and share sensitive

Lessons learned on strengthening oversight and management of GF grants with dashboards
27
information; and processes need to be adjusted for institutional constraints and individual
resources. Dashboards are not rigid tools but resources for organizational change - and
external facilitation (i.e., from a local or international support group) will usually make the
evolution more effective.
Nicaragua aside, most countries have had difficulty ensuring that all oversight elements
were in place together, resulting in poor reporting, inadequate technical review, and failure
to identify and implement necessary improvements. Chart 4 below illustrates:
Chart 4: Status of oversight components six to nine months after OGAC assistance
Country CCM
leadership Secretariat capacity
PR reporting Dashboard production
Review process
Actions to
resolve problems
Nicaragua Complete
change in CCM membership
due to national elections
Weak. CCM
without an Executive Secretary for
over a year.
Good at PR
level, weak from sub-recipients due
to SR turnover and lack of training.
Used by PR to
integrate information and send
reports to CCM
Internal to
PR
Internal
to PR
Tanzania
Mainland
Strong Weak, no
M&E capacity
Until recently,
inadequate for effective review, good for a few PRs
Good,
through University Computing Centre (UCC)
Now in
place for third review cycle
Often
delayed, will need ongoing support
Zanzibar New and intermittent
Weak, no M&E capacity
Good for some grants,
deficient for
others
Good, as above
Two excellent
review
meetings
Will need ongoing
support
Nigeria Strong No functioning Secretariat
Adequate for oversight review
WHO support did not occur due to personal
transfer; US-based consultant has updated dashboards
CCM oversight committee just getting
started one year later, few experts mobilized
Will need ongoing support
Each oversight step requires organizational will and capacity, as well as individual skills; and
it is rare that all come into place simultaneously. In Tanzania, for example, poor PR
reporting made dashboards difficult to compile or misleading; the absence of review
committees led to submission of undigested data to the TNCM Executive Committee. Data
quality is now improving, and well-facilitated review meetings are producing carefully
formulated recommendations. In Zanzibar, CCM leadership has been weak and has failed to
support an otherwise well-planned review process. Nigeria, somewhat surprisingly, has
continued to generate review data, but the departure of a key WHO support person and
slow start-up of the new Oversight Committee, as well as absence of an effective
Secretariat, has crippled other elements in the process.
It is recommended that technical support groups maintain facilitation and fill critical gaps
until the cycle becomes a self-reinforcing virtuous circle. This support can be funded
through local consultants, perhaps mentored by the Grant Management Solutions (GMS)

Lessons learned on strengthening oversight and management of GF grants with dashboards
28
Project, technical support from other international donors, or USAID mission field support
(as currently in Tanzania and Nigeria). Facilitated support should generally last at least six
months. In some cases, a support group (local or international) may have to temporarily fill
M&E functions normally assigned to the Secretariat. External consultants may need to help
resolve implementation blocks or fine-tune dashboard components. Oversight tools and
processes are works in progress; external facilitation and continued technical support should
be available for at least the first two review cycles to ensure sustainability.
From the beginning, moreover, external support groups should develop ties with local
resource groups, such as WHO in Nigeria and University Computing Centre in Tanzania.
These groups should be mandated to technical assistance and facilitation to all key actors in
the oversight cycle, including:
PRs, to provide high quality and timely data
Secretariats, to strengthen M&E capacity, follow up on recommendations, and ensure
that reporting obligations are met
Oversight review groups, to orient members to use of dashboards and to facilitate
meetings
CCM members, to provide appropriate data and recommendations.
All those involved in dashboard production, to ensure that tools evolve with changing
needs.
Output: Sustainable grant management and program oversight processes, including
dashboards
The case study from Nicaragua on the next three pages shows how the dashboard was
introduced in one country.

Lessons learned on strengthening oversight and management of GF grants with dashboards
29
Conditions for success:
The design of the processes needs to be carried out in a participatory way. This
guarantees the success of their implementation.
1. Designing the Pathway
One of the objectives of the technical assistance offered by MSH to the Nicaragua CCM and PR
was:
To design a system for programmatic and financial monitoring and evaluation by the
Principal Recipient (PR)
The first stage of technical assistance to the Principal Recipient consisted of scanning different
country experiences in monitoring and evaluation of Global Fund projects jointly with the PR’s
Global Fund team, with priority given to Latin American countries with a similar language and
culture. The experiences of Peru, Colombia, Cuba, Argentina and Honduras permitted the PR
Global Fund team to have a broader vision of the processes of monitoring and evaluation, to
learn about successful experiences, and to have parameters for comparison with the
Nicaraguan experience.
The next stage consisted of designing the pathway to develop effective oversight of the
implementation of the project through the three processes of monitoring, supervision and
evaluation. For each process, the PR team developed detailed descriptions of the procedures,
activities, persons responsible for undertaking the activities, and the regulations that should
govern the system. Designing these processes in a joint and participatory fashion guarantees the
success of their implementation
Finally a process of validation of these processes was carried out. It was important to share with
all of the staff in the PR the processes that were being designed with the goal of having them
know and approve the procedures, activities, persons responsible, and the regulations. In this
way greater buy-in was created.
In the case of Nicaragua the Principal Recipient is a network of NGOs called NICASALUD. Its
structure allows it to encompass more than 26 NGOs of which the majority are Sub Recipients
During this processs, days were spent working on validation and approval jointly with the
Executive Management, Deputy Technical Management, Coordinators of the Family Health and
Global Fund Projects, and the technical team for programmatic and financial monitoring.
NICARAGUA CASE STUDY AT MSH 2007
Monitoring and Evaluation of the
Global Fund Program in
Nicaragua
08 /2007
BY EDUARDO SAMAYOA

Lessons learned on strengthening oversight and management of GF grants with dashboards
30
Conditions for Success:
Having personnel with intermediate knowledge in the use of Excel responsible
for updating the information system.
Conditions for Success
Train technical personnel in the use of Xcelcius and be able to count on personnel who can
update the system
2. Setting up the Pathway
In order to operationalize the processes of monitoring, supervision, and evaluation, the next
stage consisted of designing the information system. The purpose of this system is to provide
periodic and systematic information to the PR, Sub Recipients, and LFA about the progress of
indicators of coverage and the targets proposed for each quarter during the year.
With this end in mind, a simple and flexible system was designed - one that required the
minimum use of software packages (Excel spreadsheets). The information permits feedback to
be provided efficiently, not only to Sub Recipients but also to the CCM in order to optimize the
project’s planning and implementation processes. The system was designed to have three
levels: Level 1 collects all the information about activities implemented in the action plans of Sub
Recipients. Level 2 consolidates the information at the national level, and Level 3 consolidates
information to be sent to the CCM and LFA.
Monitoring, supervision and evaluation of the entire Project is carried out through indicators of
coverage, quarterly targets, and operational plans from the PR and each Sub Recipient. It is
important to emphasize that in NicaSalud each person responsible technically for the Project
components is the same person responsible for entering the information generated by the Sub
Recipients.
3. Observing the results
The third stage of this technical assistance consisted of designing a system that would permit the
results to be reviewed by the PR Global Fund team and action to be taken when results
demonstrated problems in implementation. In order to provide oversight of progress in
programmatic, financial and managerial performance of Sub Recipients, an early warning
system (dashboard) was created for the Principal Recipient. The goal of the early warning
system is to identify in a timely fashion, the level of financial, programmatic and managerial
progress by Sub Recipients in order to make supervisory visits, if necessary, to help correct
bottlenecks in implementation.
This early warning system was designed using the software Xcelcius, which displays indicators of
process, results, and impact of the project in 4 slides. These results are transmitted monthly to the
CCM and communicated to the Sub Recipients and to the LFA. A training workshop was held for
all of the technical personnel in the projects in how to use and operate Xcelsius (for a total of 12
people).

Lessons learned on strengthening oversight and management of GF grants with dashboards
31
4. Basic Conditions for Replicating the Process
The basic conditions for replicating the process can be summarized as:
1. Clearly define the pathway: use a participatory consensus building process to define the
processes, procedures, activities, persons responsible and regulations for the processes of grant
monitoring, supervision of sub recipients, and evaluation
2. Design a process by which the senior management of the PR can validate the processes
described above in order to gain institutional commitment
3. Define an information system (with programmatic and financial indicators) that permits the
collection of data from sub-recipients and its consolidation
4. Design an early warning system or dashboard to display quarterly results graphically in an
attractive and easily understood way and train staff in the use of the system
5. Have dedicated staff from the PR, with intermediate skills in Excel, specifically for the
development of monitoring and evaluation activities.

Lessons learned on strengthening oversight and management of GF grants with dashboards
32
Facilitate first and second review cycles
Experience in Tanzania and elsewhere shows that success with introduction of the
dashboard was more likely when MSH had the resources to facilitate at least the first cycle
of oversight processes, including all three stages of data reporting, dashboard production,
and review/action. The following are key steps.
1. Ensure CCM leadership support for oversight process and data requirements
2. Secretariat or other dashboard ―owner‖ to request most recent PU/DRs; enter
available information into data sheet
3. Dashboard ―owner‖ to request additional information and updates from implementing
groups
4. Dashboard ―owner‖ to input data, update and possibly adjust presentation pages
5. Plan to use on-screen presentations for details, reserve printouts for summary pages
6. Orient information users to existing and/or new tools; facilitate first review and
development of recommendations
7. Review group to highlight issues and recommend actions to CCM
8. Specific technical assistance for certain follow up actions (especially financial and
procurement supply management)
9. Prepare report
10. Repeat process for second cycle (but with less TA).
Develop follow up plan with local TA group
Sustainability and continuation are key concerns. Continuing support should be facilitated
through local technical organizations. Although LMS made concerted efforts to identify and
hand over the dashboard to local TA providers, these efforts were not always successful.
The following table summarizes these experiences:
Where Hand over to: Result:
Nicaragua Nicasalud with some follow up by LMS
residential team
Internalized process
Zanzibar MOH & University Computing Centre Ltd, a
Dar es Salaam based partner
CCM did not follow up effectively
with UCC to ensure support
Tanzania PRs and University Computing Centre Ltd, a
sub-recipient under 2 grants
Additional TS needed from LMS
and UCC for start up
Nigeria WHO Nigeria, TB Advisor with commitment
from WHO Resident Representative
Failed transfer, TB Advisor was
transferred to another country.
When dashboards have been institutionalized and the information begins to be used by the
CCM, they should evolve, from simple presentations to more complex tools as data flow
improves and users become more sophisticated in their diagnoses and responses. Medium
term TA providers would facilitate this process by:
1. Continue to build capacity within PRs to provide high quality information
2. Continue to build capacity among CCM members to use information to identify issues
and target problem solving
3. Facilitate evolution of information tools as reporting process improves and users
become more sophisticated
4. Include dashboard process in annual work plans and budgets.

Lessons learned on strengthening oversight and management of GF grants with dashboards
33
Output: Sustainable grant management and program oversight processes, including
dashboards
The following case study of dashboard introduction in Tanzania illustrates how longer term
support can enable a CCM and its PRs to use the dashboard to improve oversight.

Lessons learned on strengthening oversight and management of GF grants with dashboards
34

Lessons learned on strengthening oversight and management of GF grants with dashboards
35
By Wayne Stinson6
Country Coordinating Mechanisms for Global Fund programs sometimes put greater energy
into development of new proposals than they do into routine oversight and the smooth flow
of approved funds from GFATM to implementing groups and beneficiaries. The Global Fund
has insisted all along that grants are to be performance-based, contingent on demonstrated
progress, with significant funding hurdles at the transition from Phase 1 to Phase 2 (24
months). Yet CCMs have been slow to set up effective oversight procedures to ensure timely
resolution of the many system constraints facing program expansion—in hiring and
procurement, financial and service reporting, public-private partnerships, and even public to
public relationships (as in decentralization). Potential resources have been ―lost‖ as a result,
as GFATM delays disbursement requests and/or reduces grants.
One of the chief obstacles to oversight and effective decision making has been the lack of
effectively presented information. In some cases, CCM members may be overwhelmed by
voluminous reports or poorly digested statistics with limited bearing on program operations.
In other instances, Principal Recipients submit tardy, incomplete reports. National leaders
and beneficiary representatives on the CCM may have the seniority and authority to address
policy constraints and systemic blockages but lack the time to analyze poorly presented
data or master the management intricacies of implementation. Available reports typically
lack information on the common system constraints mentioned above, moreover, making it
difficult to determine exactly where delays are occurring. Effective oversight requires
appropriate and well-presented information, as well as strong motivation to take action
when problems arise.
Management Sciences for Health (MSH), with funding from USAID, has strengthened
oversight in several countries, including Tanzania, using an information tool known as the
Executive Dashboard. Linked with timely and accurate reporting (already mandated), the
dashboard attempts to answer five basic questions for every grant:
Where is the money?
Where are the people, drugs, commodities, equipment?
Are activities on schedule? Are operational deadlines being met?
Are performance targets being achieved?
Have requirements for time-bound actions and conditions precedent been met?
The data that dashboards present are essentially those already collected and reported (no
new reporting systems); but dashboards summarize them succinctly and provide
automated red flags when actions are needed. Executive Dashboards, in effect, work like
those in cars: minimizing complexity for non-mechanics, reassuring drivers about routine
situations but alerting them to problems, and using summary indicators to identify issues
6 This document was originally prepared with assistance from Ken Heise, Resident Advisor in Tanzania, in December 2007 for the USAID/Tanzania Mission Director, Pamela White, who is a CCM Tanzania representative of the donor constituency.
Case study from Tanzania: Executive dashboards as a tool for management of Global Fund grants

Lessons learned on strengthening oversight and management of GF grants with dashboards
36
for investigation. Dashboards do not replace looking through the windshield or even
occasionally under the hood, but they do provide vital guidance for those prepared to act.
Dashboards are only tools, however, not independent agents; and they only work if applied
appropriately. A fundamental requirement is that dashboards be used as part of a regular
managerial and technical review process and be linked directly to actions. In Tanzania, a
country with more than half a billion dollars in approved grants, oversight was long
enfeebled by the absence of an effective oversight process, starting with timely reporting,
appropriate review by technical specialists, and responsive decision making and follow up by
the CCM (known in Tanzania as the TNCM). Dashboards have become the center point for
that process – now largely in place – providing a vehicle for Technical Working Groups in
Malaria, HIV and TB to summarize findings. TWG reviewers study each chart, enter their
findings in spaces provided, and make explicit recommendations to the Global Fund
Secretariat and Executive Committee. These recommendations, in turn, link automatically to
a TNCM action page, where decisions can be recorded and responsibilities assigned.
The dashboard is a tool for determined actors, not an end in its own right. The dashboard,
and the oversight process it supports, is now coming into its own in Tanzania and appears
likely to improve grant performance. MSH and its local partner, University Computing
Centre, are now adapting the dashboard to a recently signed TB grant to ensure that
potential problems are identified well in advance and do not delay grant performance.

Lessons learned on strengthening oversight and management of GF grants with dashboards
37
Part 4: Conclusions and Recommendations Depending on the level of oversight capacity and information quality of a CCM or PR,
external consultants may support CCM grant oversight and PR grants management and
monitoring in a variety of ways:
1. By providing direct TA to PRs to improve data collection and reporting, including
indicator selection, data quality, and HMIS.
2. Through governance reform, specifically to establish oversight structures and
processes, and to strengthen secretariat M&E capacity.
3. Through strengthening of the CCM’s capacity to diagnose and act on readily available
information, such as GF reports, AIDSPAN ratings, and feedback from direct contact
with PRs.
4. Through development of new oversight tools, ranging from simple PowerPoint
summaries, to Excel-based dashboards (light to complex), to full Xcelsius
presentations.
5. By extending CCM dashboards to the PR level and adapting them for grant
coordination and routine management.
The working group developed the following conclusions about how technical support to CCM
oversight and PR management should be delivered effectively:
11. Oversight of grant implementation is fundamentally an issue of governance and is likely
to be problematic (explicitly or implicitly) in almost every country with weak governance.
Resolution of oversight problems generally requires prior resolution of issues regarding
CCM membership, committee structure, and work procedures, as well as creation of an
effective secretariat. It also benefits from collaborative relationships between the CCM
and principal recipients. In general, technical support should focus on basic structures
and processes of good governance before working on oversight (unless good governance
is already in place).
12. Oversight differs significantly from management and from traditional M&E. The CCM’s
scope looks beyond individual grants and PRs and focuses on national progress and
obstacles in tackling the three target diseases. It contributes to resolving specific
problems, especially when they cut across individual organizations, but it does not
become involved in routine program or organizational management. Information tools
developed for CCM oversight should highlight overall progress and flag specific
problems, but not go the level of detail required for routine management.
13. Oversight also differs from traditional M&E in that it emphasizes action even more than
information. Information tools should focus on areas likely to require action, including
programmatic blockages and work plan implementation, and should encourage users to
make judgments and plan follow up. As such, information tools need to evolve over
time, with perhaps greater managerial detail during startup quarters and more emphasis
on technical performance once basic systems are in place. Technical support for
oversight, in addition to improving governance, should encompass problem analysis and
solution development at appropriate levels and in specific technical areas (especially
financial management and procurement).
14. On the information side of oversight, TS providers should generally start by encouraging
more effective use of existing sources (especially PR reports, GF and AIDSPAN ratings)
before moving to more sophisticated (and demanding) tools. As CCM oversight capacity
increases, however – especially the capacity for analysis and action – TS providers and

Lessons learned on strengthening oversight and management of GF grants with dashboards
38
local TS partners should move to more elaborate methods, including both Excel and
Xcelsius dashboards.
15. New information tools, especially dashboards, should start from existing demand (the
needs, interests and resources of our host country clients) rather than from what TS
providers think the CCM should want and use. TS providers need to educate the CCM to
stimulate demand but should not assume that demand will increase just because they
have introduced a pretty tool.
16. Tools, moreover, should follow existing processes rather than require major changes,
especially in data reporting. To the extent possible, TS providers should build on existing
reporting schedules, formats and definitions rather than attempting to introduce parallel
systems. Depending on our scope of work, TS providers may support development of
PR reporting systems, but this is generally a longer term task than development of a
dashboard.
17. In countries committed to the Three One’s, the decision to use a dashboard tool should
take into account Three One’s partners, so that the dashboard is not seen as a
duplicative or rival system.
18. Every dashboard for CCM oversight needs to address certain basic questions, but with
varying levels of detail depending on grant complexity and CCM oversight capacity.
These questions include:
a. Where is the money?
b. Where are the drugs?
c. Are activities rolling out as planned?
d. Have performance targets been achieved?
e. Are conditions precedent and other requirements being met?
19. Above all, information tools are intended to simplify oversight and management, not to
add significantly to reporting and analytical burdens. Few oversight committees can
review more than 10-15 pages for all current grants. Additional detail should be readily
accessible, however, through spreadsheet linkages (Excel) or interactive displays
(Xcelsius). Full CCM meetings should generally review only summary sheets, focusing on
overall program status and follow up actions required.
20. The first priority of TS providers working with CCMs and PRs is to people (especially
those involved in oversight and management), rather than to products (manuals and
dashboards). The ability of short-term TS providers to facilitate long term organizational
change has been constrained due to the rapid nature of the technical support prescribed
by the scope of work in this pilot phase. Although LMS teams developed innovative and
high quality products, teams had limited capacity (varying from country to country) to
support implementation. More effort must be placed upon establishing and documenting
long term support arrangements with locally resident technical support partners or
contractors, to whom short term TS providers can hand over.
Experience in implementing recommended changes has been mixed, with successful
introduction of dashboards in Latin America and a greater number of obstacles to their
introduction in Africa. Greater care must be exercised in evaluating readiness for a
dashboard approach: the diagnostic tools provided in this report will enable future teams to
target the dashboard intervention to countries with suitable skills and conditions, or to

Lessons learned on strengthening oversight and management of GF grants with dashboards
39
select other strengthening interventions more appropriate to the capacity and information
gaps of the specific CCM or PR.
CCMs and PRs that complete their initial phases of strengthening successfully, have local IT
providers and TS partners to provide long term support, may become suitable in subsequent
years for introduction of grant dashboards.
Additional work will be needed in a future project to develop a dashboard prototype and
take forward the standardization of instruction manuals and other complementary tools and
documents, as well as to translate them into various languages. Additional efforts might
also be directed towards:
Development of the mapping function for PR management of SRs;
Improvement of the summary dashboards for leaders and decision makers;
Development of summary presentation techniques for complex situations including
multiple PRs, multiple grants for the same diseases, and presentation of final results
of grants that have closed.
Finally, given the level of interest expressed by the Global Fund itself, a technical
presentation or technical discussion session of the dashboard with Global Fund and USG
representatives might be worthwhile. If, after additional replication efforts, a prototype
could be finalized and the conditions for replication laid out clearly, the Global Fund itself
might wish to take replication forward as part of its M&E and CCM oversight strengthening
interventions.

Lessons learned on strengthening oversight and management of GF grants with dashboards
40

Lessons learned on strengthening oversight and management of GF grants with dashboards
41
Annex 1: Rapid Assessment of CCM Oversight Capacity
Dimension Indicators Beginning
1
Intermediate
2
Advanced
3
Score Evidence
1. Oversight
Oversight
structure,
processes, and
procedures for
information
collection and use
1.1 Does
the CCM have a
defined
committee, group,
office or specified
individuals whose
role is to assist the
CCM with
oversight?
No defined
oversight
committee, office
or individuals
responsible for
assisting the CCM
with oversight
CCM has
secretariat and /or
oversight
committee but they
are not functional
CCM has secretariat
and/or oversight
committee that are
fully functional in
overseeing GF grants
1.2 Does the CCM
have a defined
process for
oversight?
No defined
oversight
processes
CCM has some
processes but they
are not complete
or well defined
CCM has defined
processes and or/
operations manual
1.3 Does the CCM
or an internal
oversight group
review quarterly
reports and use
data for decision
making?
CCM or internal
oversight group
does not review
quarterly reports
or provide
feedback
CCM or internal
oversight group
reviews quarterly
reports but does
not know how to
interpret statistics
CCM or internal
oversight group
regularly reviews
quarterly reports
and/or dashboards
1.4 Does the CCM
investigate
problems?
CCM does not
recognize
problems or does
not investigate in
an appropriate,
timely or
substantive way.‖
CCM knows about
problems and can
diagnose but does
not respond
effectively
CCM diagnoses
problems and
responds effectively

Lessons learned on strengthening oversight and management of GF grants with dashboards
42
Dimension Indicators Beginning
1
Intermediate
2
Advanced
3
Score Evidence
1.5 Do they
validate data
independently
through site visits?
CCM does not
make site visits
CCM makes
occasional site
visits
CCM plans for regular
site visits and/or has a
system for validating
data
1.6 Does the CCM
use resource
persons or other
experts to
investigate
problems?
CCM never uses
resource persons
to investigate
problems
Asks a CCM
member or a staff
member of PR or
SR to explain
more, or to get
additional
information
May develop specific
terms of reference
and mobilize or
engage an expert or
resource person to
investigate a problem.
:
1.7 Does the CCM
receive regular
help with oversight
from technical
support agencies?
CCM receives no
help
CCM receives help
but it is insufficient
for needs or not
routinely available
CCM regularly receives
help from agencies
such as WHO,
UNAIDS, USAID, GTZ
Please list all
agencies:

Lessons learned on strengthening oversight and management of GF grants with dashboards
43
2. Data Capacity
Dimension Indicators Beginning
1
Intermediate
2
Advanced
3
Score Evidence
Equipment and
Tools
2.1 Does the CCM
Chairman or
Secretariat have
access to
computer
equipment,
projectors and a
printer?
CCM Chairman or
Secretariat does
not have
computer
equipment,
projector. or
printer
CCM Chairman or
Secretariat has or
has access to at
least one computer
but not sufficient
for needs. No color
printer or projector
CCM Chairman or
Secretariat has
sufficient computer,
projector, and color
printer equipment
2.2 Do the CCM
members have
access to the
Internet to send
and receive email?
Most CCM
members do not
have regular
access to the
Internet or may
only have access
through
cybercafés or
other people’s
offices
CCM President and
Secretariat have
internet access at
least daily, not all
CCM members
have internet
All CCM members and
Secretariat staff are
accessible by and
have access to high
speed internet
2.3 Does the CCM
have a reliable
source of
electricity?
CCM has
unreliable source
of electricity
CCM has
moderately reliable
electricity
CCM has a reliable
source of electricity
2.4 Does the CCM
have access to IT
support for
software and data
management
needs?
CCM has no
source of IT
support
CCM has access to
some IT support
but source needs
capacity building in
GF needs
CCM has access to
highly capable source
of IT support

Lessons learned on strengthening oversight and management of GF grants with dashboards
44
Dimension Indicators Beginning
1
Intermediate
2
Advanced
3
Score Evidence
Human resources 2.5 Does the CCM
Secretariat have
identified staff for
M&E?
No identified staff
or consultant with
confirmed TOR
and time
expectations for
M&E
Only one person
(staff or
consultant) for
M&E
More than one person
(staff or consultant)
dedicated to M&E
2.6 Does the CCM
have staff with
capacity in Excel to
maintain and
further develop
Excel-based
dashboards?
No capacity in
Excel. Would
depend on others
to maintain and
further develop
dashboard
Only one person
with intermediate
Excel skills to
maintain and
further develop
dashboard
Several staff with
intermediate Excel
skills
2.7 Does the CCM
have experts or
resource persons
who are co-opted
to support the
CCM oversight
process?
Occasional support
from MOH, PR or
SR
Resource persons
available
occasionally upon
request
Experts co-opted to
participate in
oversight committee
or activities on an
ongoing basis.

Lessons learned on strengthening oversight and management of GF grants with dashboards
45
Dimension Indicators Beginning
1
Intermediate
2
Advanced
3
Score Evidence
3. Information Use and Interpretation
Preparation and
capacity of the
M&E or Oversight
Committee
3.1 Do members
have statistical
understanding and
familiarity with
graphs?
No members with
statistical
understanding and
familiarity with
graphs
At least one
member with
statistical
understanding and
familiarity with
graphs
More than one
member with
statistical training
and/or familiarity with
graphs
3.2 Do members
have M&E
training?
No members
have M&E training
At least one
member with M&E
training
More than one
member with M&E
training
3.3 Do members
have
programmatic
public health
knowledge?
No members
have
programmatic
public health
knowledge
At least one
member with
programmatic
public health
knowledge
More than one
member with
programmatic public
health knowledge
3.4 Are members
action-oriented or
good at problem
solving?
Members are not
action-oriented or
good at problem
solving
At least one CCM
member is
reported by others
to be action
oriented and
problem solving
Evidence from
minutes or interviews
that the CCM has a
reputation for being
action oriented and
solving problems
4.Communi-
cation
Use of electronic
means of
communication
and
communication
strategies
4.1 How do
members of the
CCM and/or
secretariat
communicate with
each other and
with stakeholders?
Minimal use of
email, power point
presentations, or
other electronic
means. Most
communication by
mail or phone or
face to face
meetings
Moderate use of
email, power point
presentations, and
other electronic
means.
Over 50% of
communication takes
place electronically.
Members frequently
make use of power
point presentations
with stakeholders.

Lessons learned on strengthening oversight and management of GF grants with dashboards
46
Dimension Indicators Beginning
1
Intermediate
2
Advanced
3
Score Evidence
4.2 Does the CCM
produce an annual
report, maintain a
website or send
out other
communications?
No annual reports
or website. Few
bulletins or other
communications
with CCM
constituencies
Communications
materials and
moderate efforts to
communicate with
constituencies. May
have a website but
it is not kept up to
date
Website and/or annual
reports or other
communications
materials
5. External Demand for Information
Motivation to
collect and use
data
5.1 Is there
demand for
information on
grant progress
from political
leaders?
No demand from
political leaders
Some political
leaders have
requested
information
Senior political leaders
are requesting
information on a
regular basis
5.2 Is there
demand for
information from
the GF and other
donors or risk that
the country may
lose grant money?
CCM does not
sense pressure
from political
leaders to improve
performance. No
conditions
precedent
CCM senses some
pressure from
political leaders to
improve
performance.
Existence of some
conditions
precedent
CCM has several
conditions precedent
and/or has been
notified by the GF that
the grant is at risk of
being cancelled
5.3 Are CCM
members or the PR
demanding
information?
No demand from
other CCM
members or PR for
information
A few CCM
members voice
concern that they
are not able to
oversee grant due
to a lack of
information
CCM demonstrates
that there is a lot of
value placed on
monitoring of GF
grant. CCM has
repeatedly requested
information from the
PR

Lessons learned on strengthening oversight and management of GF grants with dashboards
47
Annex 2: Menu of recommended indicators Question
addressed Indicator Definition Data source Levels of
use Alerts
Where is the money? (Are
funds reaching implementation levels promptly?)
Total funding request Total requested from GFATM for all phases
GF website CCM, oversight, PR
Approved funding
(cumulative)
Cumulative total which GF has
approved to report date
GF website CCM,
oversight, PR
Total funds disbursed (cumulative)
Cumulative total which GF has disbursed to PRs
GF website CCM, oversight, PR
Funds disbursed to SRs (cumulative)
Total which PR has either disbursed to SRs OR reserved for its own costs
Special PR report (i.e., not reported to LFA)
CCM, oversight, PR
Have expenditures occurred in accordance with budget (by PR, by objective, by cost
category)?
Proportion of cumulative budget which PR reports as spent
Special PR report (i.e., not reported to LFA)
CCM, oversight, PR
Red flag for >20% discrepancies
Above indicators for current fiscal year
As above, but for current fiscal year only
Special PR report (i.e., not reported
to LFA)
CCM, oversight, PR
Red flag for >20%
discrepancies
Where are the drugs? (Are required commodities in
country and reaching beneficiaries?)
% of funds budgeted for pharmaceuticals which have been spent
Actual budget through period of Progress Update/Cumulative through period of progress update
Most recent PU/DR CCM, oversight, PR
Red flag for >20% discrepancies
% of funds budgeted for health products
which have been spent
Actual budget through period of Progress Update/Cumulative through
period of progress update
Most recent PU/DR CCM, oversight, PR
Red flag for >20%
discrepancies

Lessons learned on strengthening oversight and management of GF grants with dashboards
48
Question
addressed
Indicator Definition Data source Levels of
use
Alerts
Are activities rolling out as planned? (Have staff been hired
and trained?)
# of senior posts required vs. # filled
Program management positions Special PR report (i.e., not reported to LFA)
Oversight, PR
Red flag if any positions are unfilled
% of each training target met
cumulative # trained/cumulative # targeted for training
Most recent PU/DR Oversight, PR
Red flag for <80% of target; dark green if >150% of target
Has access increased?
Proportion of each target for facility development which has been achieved
Cumulative number of facilities strengthened/Cumulative target for each type of facility
Most recent PU/DR Oversight, PR
Red flag for <80% of target; dark green if >150% of target
Do GF and AIDSPAN rate this grant positively?
Most recent FPM rating Grant performance report on GF website
CCM, oversight
Red flag if B2 or C
AIDSPAN rating AIDSPAN website CCM,
oversight
Have
performance targets been achieved?
Proportion of target
achieved (cumulative)
Actual results to date
(cumulative)/Intended targets to date (cumulative)
Most recent PU/DR Oversight,
PR
Red flag for
<80% of target; dark green if >150% of target
Proportion of target achieved (trend line)
Above, as reported for each time period
Current and previous PU/DRs
Oversight, PR
Red shading between trend lines for target
and achievement (unless achievement exceeds target)
Proportion of target achieved (most recent
period)
Above, as reported for most recent period
Current and previous PU/DRs
PR Red flag for <80% of target;
dark green if >150% of target

Lessons learned on strengthening oversight and management of GF grants with dashboards
49
Question
addressed
Indicator Definition Data source Levels of
use
Alerts
Are conditions precedent and other requirements
being met?
Status of PR response to GF conditions precedent
Have any major conditions in the Grant Agreement been met?
Grant performance report on GF website
CCM, oversight, PR
Red flag if not met
Status of each condition precedent
Itemization of conditions precedent not yet met and the current status of PR response
Most recent PU/DR CCM, oversight, PR
Red flag if not met
Status of Phase II application
Date due; current status (if appropriate)
Information from PR
CCM, oversight, PR
Orange flag if due date in the
next three months; red flag if overdue
Reports due and
submitted to LFA/GF
Date due; current status (if
appropriate)
Due dates from
grant agreement; submission dates from PR
Oversight,
PR
Orange flag if
due date in the next three months; red flag if overdue
Status of significant work plan deadlines
Information from PR
PR
Are the CCM and Secretariat meeting their own performance objectives?
# of CCM meetings with quorum held in past 12 months
Secretariat reports CCM Red flag if below standard
# of oversight review
meetings held in past 12 months
Secretariat reports CCM Red flag if below
standard
% of Secretariat staff
positions filled
Secretariat reports CCM Red flag if any
positions are unfilled
Related Documents