1 Introduction Although past geographical debates and differences over the superiority of qualitative versus quantitative methods continue to find some resonance in contemporary writings (Barnes and Hannah, 2001; Kwan and Schwanen, 2009; Leszczynski, 2009; Plummer and Sheppard, 2001), there is a growing consensus today that it is important to marry the strengths of seemingly diverse approaches to improve empirical analysis and enhance causal inference (Bergmann et al, 2009; Hamilton, 2009; Zolnik, 2009). The recognition that combining qualitative and quantitative approaches can enhance expla- natory power and the resulting calls for better integration of the two approaches have helped destabilize easy identifications such as qualitative critical/emancipatory or quantitative unreflective/extractive (Kwan, 2004; Sheppard, 2001). Indeed, both qualitative and quantitative writings can be rigorous (or sloppy). They can also both be harnessed in favor of agendas viewed as progressive (or reactionary). The distinctive affinities, advantages, and drawbacks of each approach mean, nonetheless, that investigations capitalizing on the advantages of both can advance scholarship that is theoretically informed and empirically rigorous (Lieberman, 2005). Indeed, this recognition is substantially responsible for growing calls for studies that combine qualitative and quantitative approaches (Philip, 1998; Turner and Robbins, 2008; Zimmerer, 2007). This paper contributes to ongoing conversations in geography and other social sciences to take advantage of the distinctive merits of qualitative and quantitative approaches for theory development and validation (Barnes, 2009; Gutman et al, 2004; Rocheleau,1995; 2007; Turner et al, 2007). It does so by focusing on these issues in the context of natural resource governance (specifically, forest governance), a field in which similar arguments in favor of combining qualitative and quantitative approaches are also in evidence (Ostrom and Nagendra, 2006; Poteete et al, 2010). Strengthening causal inference through qualitative analysis of regression residuals: explaining forest governance in the Indian Himalaya Arun Agrawal School of Natural Resources and Environment, University of Michigan, 440 Church Street, Ann Arbor, MI 48104, USA; e-mail: [email protected] Ashwini Chhatre Department of Geography, University of Illinois at Urbana-Champaign, 232 Davenport MC-150, 607 S.Mathews Ave., Urbana IL 61801, USA; e-mail: [email protected] Received 31 July 2009; in revised form 22 June 2010 Environment and Planning A 2011, volume 43, pages 328 ^ 346 Abstract. This paper contributes to fertile debates in environmental social sciences on the uses of and potential synergies between qualitative and quantitative analytical approaches for theory development and validation. Relying on extensive fieldwork on local forest governance in India, and using a dataset on 205 forest commons, we propose a methodological innovation for combining qualitative and quantitative analyses to improve causal inference. Specifically, we demonstrate that qualitative knowl- edge of cases that are the least well predicted by quantitative modeling can strengthen causal inference by helping check for possible omitted variables, measurement errors, nonlinearities in posited relationships, and possible interaction effects, and thereby lead to analytical improvements in the quantitative analysis. In the process, the paper also presents a contextually informed and theoretically engaged empirical analysis of forest governance in north India, showing in particular the importance of institutional and historical factors in influencing commons outcomes. doi:10.1068/a42302

Welcome message from author
This document is posted to help you gain knowledge. Please leave a comment to let me know what you think about it! Share it to your friends and learn new things together.
Transcript
1 IntroductionAlthough past geographical debates and differences over the superiority of qualitativeversus quantitative methods continue to find some resonance in contemporary writings(Barnes and Hannah, 2001; Kwan and Schwanen, 2009; Leszczynski, 2009; Plummerand Sheppard, 2001), there is a growing consensus today that it is important to marrythe strengths of seemingly diverse approaches to improve empirical analysis andenhance causal inference (Bergmann et al, 2009; Hamilton, 2009; Zolnik, 2009). Therecognition that combining qualitative and quantitative approaches can enhance expla-natory power and the resulting calls for better integration of the two approaches havehelped destabilize easy identifications such as qualitative� critical/emancipatoryor quantitative � unreflective/extractive (Kwan, 2004; Sheppard, 2001). Indeed, bothqualitative and quantitative writings can be rigorous (or sloppy). They can also both beharnessed in favor of agendas viewed as progressive (or reactionary).
The distinctive affinities, advantages, and drawbacks of each approach mean,nonetheless, that investigations capitalizing on the advantages of both can advancescholarship that is theoretically informed and empirically rigorous (Lieberman, 2005).Indeed, this recognition is substantially responsible for growing calls for studies thatcombine qualitative and quantitative approaches (Philip, 1998; Turner and Robbins,2008; Zimmerer, 2007). This paper contributes to ongoing conversations in geographyand other social sciences to take advantage of the distinctive merits of qualitative andquantitative approaches for theory development and validation (Barnes, 2009; Gutmanet al, 2004; Rocheleau, 1995; 2007; Turner et al, 2007). It does so by focusing on theseissues in the context of natural resource governance (specifically, forest governance),a field in which similar arguments in favor of combining qualitative and quantitativeapproaches are also in evidence (Ostrom and Nagendra, 2006; Poteete et al, 2010).
Strengthening causal inference through qualitative analysisof regression residuals: explaining forest governance in theIndian Himalaya
Arun AgrawalSchool of Natural Resources and Environment, University of Michigan, 440 Church Street,Ann Arbor, MI 48104, USA; e-mail: [email protected]
Ashwini ChhatreDepartment of Geography, University of Illinois at Urbana-Champaign, 232 Davenport MC-150,607 S.Mathews Ave., Urbana IL 61801, USA; e-mail: [email protected] 31 July 2009; in revised form 22 June 2010
Environment and Planning A 2011, volume 43, pages 328 ^ 346
Abstract. This paper contributes to fertile debates in environmental social sciences on the uses of andpotential synergies between qualitative and quantitative analytical approaches for theory developmentand validation. Relying on extensive fieldwork on local forest governance in India, and using a dataseton 205 forest commons, we propose a methodological innovation for combining qualitative andquantitative analyses to improve causal inference. Specifically, we demonstrate that qualitative knowl-edge of cases that are the least well predicted by quantitative modeling can strengthen causalinference by helping check for possible omitted variables, measurement errors, nonlinearities inposited relationships, and possible interaction effects, and thereby lead to analytical improvementsin the quantitative analysis. In the process, the paper also presents a contextually informed andtheoretically engaged empirical analysis of forest governance in north India, showing in particularthe importance of institutional and historical factors in influencing commons outcomes.
doi:10.1068/a42302
It shows how a deep knowledge of cases, context, and historyöthe strongest aspectsof qualitative methodsöcan powerfully be combined with quantitative and statisticalmethods to strengthen causal inference. In the process, it also fleshes out a specific buthighly generalizable strategy to combine qualitative and quantitative approaches thatcan be used by others interested in such integration.
Our strategy to integrate qualitative and quantitative methods hinges on carefulanalysis of observations with the highest and lowest regression residuals as a sourceof information. Quantitative studies rarely analyze residuals beyond their utility asindicators of goodness of model fit (Mur and Lauridsen, 2007). A focus on residuals,especially those that are the most distant from the fitted regression model, is inherentlyan attempt to understand why particular observations depart from the explicitlyarticulated and implicitly stated hypotheses that statistical models represent. The casesthat correspond to high and low residuals are typically the ones for which the theoryand data have the least correspondence. Closer investigation and intimate knowledgeof the cases that correspond to these residuals, we show, can help in identifying omittedvariables, refine measures of specific variables, provide a deeper awareness of thefunctional form of the relationship between dependent and causal variables, andstrengthen inference by improving the understanding of causal mechanisms at playöin short, help in advancing knowledge in ways that are the objective of all carefulresearch.
Our approach is in some contrast, then, to more statistically oriented analyses ofoutliers. We refrain from using the term `outlier' to refer to the highest and lowestresiduals, so as to distinguish our approach from conventional statistical measuresof leverage and influence. `Outliers' are observations that are distinct from most otherdata points in a sample (Bollen and Jackman, 1990, page 258). They may be cases withextremely high or low values on specific variables, or ones where the residual is largecompared with other residuals from a regression analysis. But an outlier observationis influential only when its deletion causes a pronounced change in one or more of theestimated parameters (see Andrews and Pregibon, 1978).
Our objective in examining the cases that correspond to the highest and lowestresiduals, even if such residuals do not exert a large effect on coefficient estimates(Kahn and Udry, 1986, pages 734 ^ 737), is to identify patterns in the entire dataset.Our approach helps address standard criticisms of quantitative approaches that focuson the difficulty of deriving causal inference from statistical correlations or on the lackof texture or nuance supposed to characterize statistical analyses. It also helps addresscriticisms of qualitative approaches that point to difficulties in generalizing from acase. Statistical approaches are necessary for testing and validating theory when largeamounts of relevant and reliable data are accessible. But causal inference based on theidentification of patterns in the data can be strengthened by deeper knowledge of casesin the dataset.
The strategy of examining the highest and lowest residuals is especially valuable forthe field of common property and natural resource governance. Early analyses ofcommon property systems enhanced the understanding of how such systems work indifferent contexts, and demonstrated that sustainable resource governance is possiblewithout market-based and state-based solutions (McCay and Acheson, 1987; McKean,1992; NRC, 1986). Ostrom's (1990) influential study of the governance of the commonsused earlier studies and strategic-choice analytical techniques to make theoreticaladvances and identify institutional variables that enable collective action on the com-mons. Other scholars have identified additional variables that may explain observedsuccesses in the governance of the commons (Baland and Platteau, 1996; Wade, 1994).
Explaining forest governance in the Indian Himalaya 329
More recent work has begun to use different quantitative techniques to address themany hypotheses about determinants of successful common-pool resource governance(Agrawal and Chhatre 2007; Andersson et al, 2006; Chhatre and Agrawal, 2008; 2009;Coleman and Steed, 2009; Persha and Blomley, 2009).
But difficulties continue to beset efforts to understand the causal mechanismsthat underpin successful functioning of resource governance institutions. One of themost important problems stems from the sheer number of causal variables identifiedin the literature (Agrawal and Chhatre, 2006). In any given analysisöqualitative orquantitativeöit is extremely difficult to know a priori which of the potentially relevantvariables need the closest analytical attention. In addition, scholars of commons alsoconfront problems related to the functional form of the relationship between a givencausal variable and the dependent variable, and in identifying how particular causalprocesses work across the range of observed values in the sample. The strategy weadvance in this paper for analyzing residuals, therefore, is highly relevant for scholarsof the commons, and scholars of land change more generally.
We illustrate our argument using a fieldwork-based dataset of 205 cases of forestgovernance from the Indian Himalaya. Section 2 presents the results of our initial OLSregression model. This model is based on existing theoretical arguments in the field ofcommon property and analyzes how sociopolitical, institutional, and biophysical variablesaffect changes in resource conditionöthe common objective of much analysis in the studyof natural resource management. The model produces a set of high and low residuals, as istrue of all statistical models. In section 3 we examine the diagnostic properties of themodel, and provide arguments and evidence in support of our choice of specific cases forqualitative analysis. Section 4 presents the new model, based on the information revealedby a closer investigation of the cases corresponding to the highest and lowest residuals.It also discusses the extent to which the results of the new model are an improvement uponthe initial analysis and theoretical insights. Section 5 examines our findings in relation tostudies of the commons and, more generally, comparative analyses that rely on regressionmodels.We should note that because in this paper we seek explicitly to show how deeperknowledge of the cases and context led us to a better modelöpresented in section 4(and can lead others in an analogous fashion), the overall organization of the paper departsfrom the common `introduction ^ data ^methods ^ results ^ discussion ^ conclusion' formatused in many statistically oriented papers.
2 Common property governance in Himachal Pradesh: initial findingsOur sample of 205 cases concerns the governance of forest resources in HimachalPradesh in northern India. Our regression model is built around five classes of potentialcausal influences identified in the literature on the commons (Agrawal and Chhatre,2006)öbiophysical, demographic, economic, institutional, and sociopoliticalötoexplain change in the condition of local resources. For each class of influence, weexamine several variables that have been highlighted in the literature and which appearrelevant to the Himachal Pradesh context. Table 1 provides information about thespecific studies on which we draw to identify the independent variables for the ensuinganalysis.
The state of Himachal Pradesh in India is ecologically highly diverse owing todistinct climatic and physiographic factors, and significant variation in altitude.Forests in the state are governed through a number of institutional arrangements,most generally: under private, communal, and state or public management.We selectedforests for data collection by sampling across the altitudinal gradient in the state: fromthe lower hills (5900 m above mean sea level), the middle hills (between 900 and1800 m), and the high hills (41800 m). Within each altitude class, we selected cases
330 A Agrawal, A Chhatre
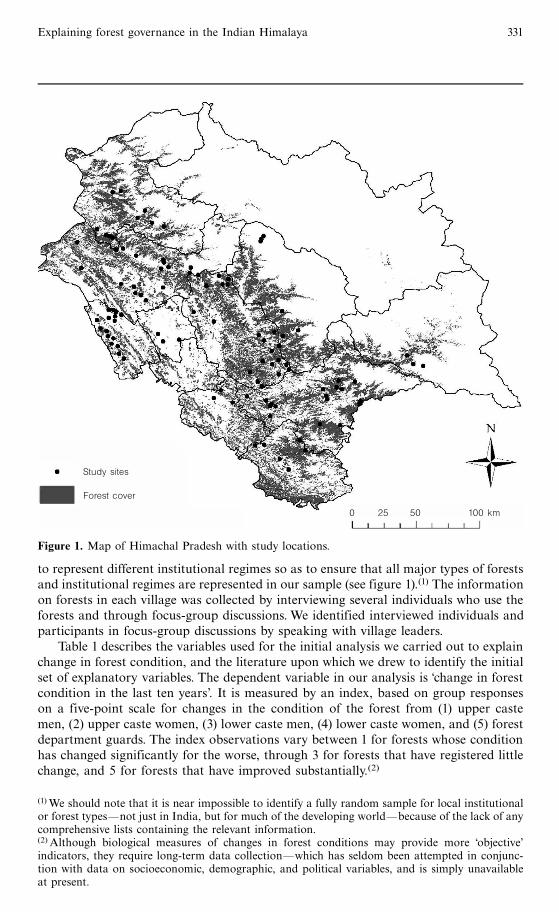
to represent different institutional regimes so as to ensure that all major types of forestsand institutional regimes are represented in our sample (see figure 1).(1) The informationon forests in each village was collected by interviewing several individuals who use theforests and through focus-group discussions. We identified interviewed individuals andparticipants in focus-group discussions by speaking with village leaders.
Table 1 describes the variables used for the initial analysis we carried out to explainchange in forest condition, and the literature upon which we drew to identify the initialset of explanatory variables. The dependent variable in our analysis is change in forestcondition in the last ten years'. It is measured by an index, based on group responseson a five-point scale for changes in the condition of the forest from (1) upper castemen, (2) upper caste women, (3) lower caste men, (4) lower caste women, and (5) forestdepartment guards. The index observations vary between 1 for forests whose conditionhas changed significantly for the worse, through 3 for forests that have registered littlechange, and 5 for forests that have improved substantially.(2)
Study sites
Forest cover
0 25 50 100 km
Figure 1. Map of Himachal Pradesh with study locations.
(1)We should note that it is near impossible to identify a fully random sample for local institutionalor forest typesönot just in India, but for much of the developing worldöbecause of the lack of anycomprehensive lists containing the relevant information.(2) Although biological measures of changes in forest conditions may provide more `objective'indicators, they require long-term data collectionöwhich has seldom been attempted in conjunc-tion with data on socioeconomic, demographic, and political variables, and is simply unavailableat present.
Explaining forest governance in the Indian Himalaya 331
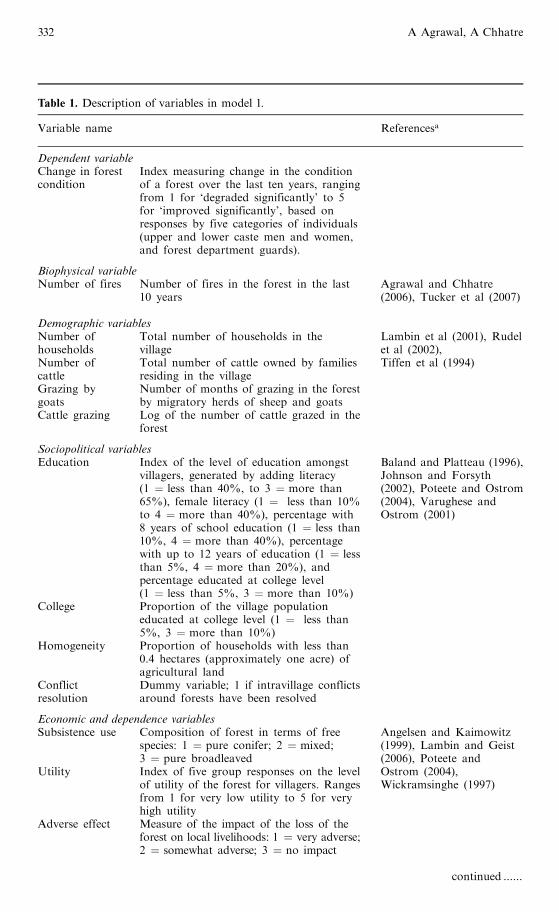
Table 1. Description of variables in model 1.
Variable name Referencesa
Dependent variableChange in forestcondition
Index measuring change in the conditionof a forest over the last ten years, rangingfrom 1 for `degraded significantly' to 5for `improved significantly', based onresponses by five categories of individuals(upper and lower caste men and women,and forest department guards).
Biophysical variableNumber of fires Number of fires in the forest in the last
10 yearsAgrawal and Chhatre(2006), Tucker et al (2007)
Demographic variablesNumber ofhouseholdsNumber ofcattle
Total number of households in thevillageTotal number of cattle owned by familiesresiding in the village
Lambin et al (2001), Rudelet al (2002),Tiffen et al (1994)
Grazing bygoats
Number of months of grazing in the forestby migratory herds of sheep and goats
Cattle grazing Log of the number of cattle grazed in theforest
Sociopolitical variablesEducation Index of the level of education amongst
villagers, generated by adding literacy(1 � less than 40%, to 3 � more than65%), female literacy (1 � less than 10%to 4 � more than 40%), percentage with8 years of school education (1 � less than10%, 4 � more than 40%), percentagewith up to 12 years of education (1 � lessthan 5%, 4 � more than 20%), andpercentage educated at college level(1 � less than 5%, 3 � more than 10%)
Baland and Platteau (1996),Johnson and Forsyth(2002), Poteete and Ostrom(2004), Varughese andOstrom (2001)
College Proportion of the village populationeducated at college level (1 � less than5%, 3 � more than 10%)
Homogeneity Proportion of households with less than0.4 hectares (approximately one acre) ofagricultural land
Conflictresolution
Dummy variable; 1 if intravillage conflictsaround forests have been resolved
Economic and dependence variablesSubsistence use
Utility
Adverse effect
Composition of forest in terms of freespecies: 1 � pure conifer; 2 � mixed;3 � pure broadleavedIndex of five group responses on the levelof utility of the forest for villagers. Rangesfrom 1 for very low utility to 5 for veryhigh utilityMeasure of the impact of the loss of theforest on local livelihoods: 1 � very adverse;2 � somewhat adverse; 3 � no impact
Angelsen and Kaimowitz(1999), Lambin and Geist(2006), Poteete andOstrom (2004),Wickramsinghe (1997)
continued ......
332 A Agrawal, A Chhatre
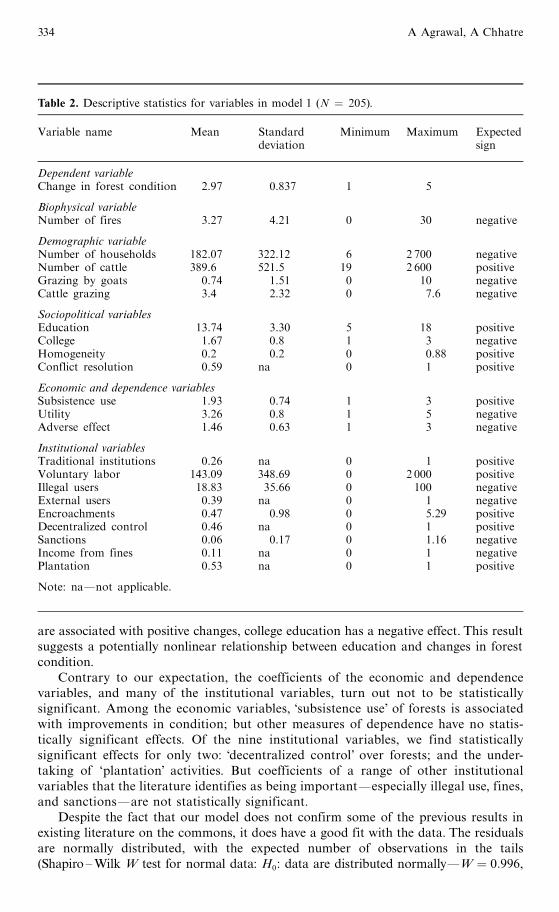
Our choice of independent variables was shaped by the existing literature onthe subject as well as factors that seem to be particularly relevant in the contextof Himachal Pradesh.(3) Table 2 provides descriptive statistics for the variables usedin the analysis.
The results of the regression analysis are presented in table 3. The table indicatesthat most of the biophysical, demographic, and sociopolitical variables included in theanalysis are statistically significant. `Number of fires' in village forests is associatedwith negative changes in forest condition. `Number of households', and `grazing bygoats', and cattle grazing' have statistically significant negative coefficients. However,the variable `number of cattle' has a significant and positive association with changesin forest condition. The positive coefficient is in agreement with the hypothesis thathigher overall wealth (represented by cattle), controlling for the levels of grazing in theforest and for homogeneity in the village, contributes positively to changes in forestcondition.
When we come to sociopolitical variables, we find that higher levels of overalleducation, greater homogeneity in landholding, and presence of conflict-resolutionmechanisms in the surveyed villages all contribute to improved forest condition. How-ever, college education is associated with negative changes in forests. Education, thus,has a complex relationship with resource governance. Whereas overall education levels
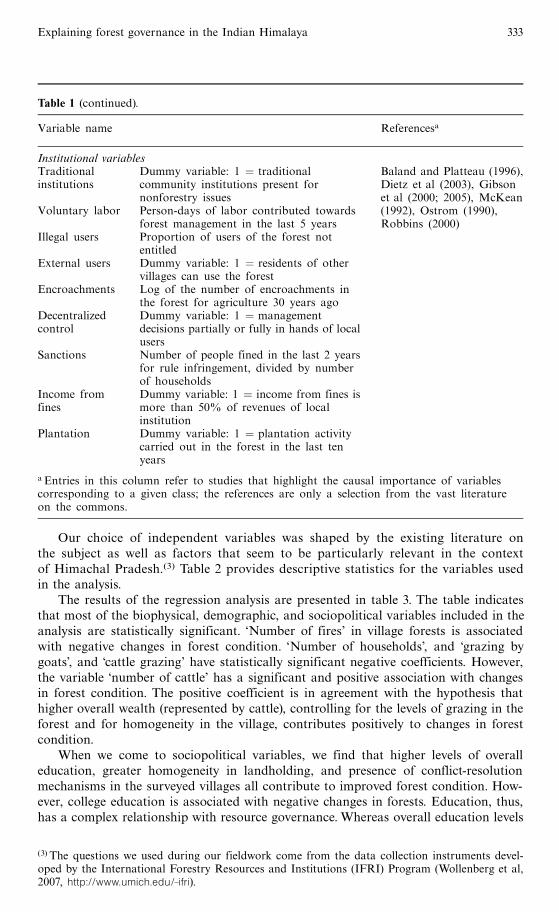
Table 1 (continued).
Variable name Referencesa
Institutional variablesTraditionalinstitutions
Voluntary labor
Illegal users
External users
Encroachments
Decentralizedcontrol
Sanctions
Income fromfines
Plantation
Dummy variable: 1 � traditionalcommunity institutions present fornonforestry issuesPerson-days of labor contributed towardsforest management in the last 5 yearsProportion of users of the forest notentitledDummy variable: 1 � residents of othervillages can use the forestLog of the number of encroachments inthe forest for agriculture 30 years agoDummy variable: 1 � managementdecisions partially or fully in hands of localusersNumber of people fined in the last 2 yearsfor rule infringement, divided by numberof householdsDummy variable: 1 � income from fines ismore than 50% of revenues of localinstitutionDummy variable: 1 � plantation activitycarried out in the forest in the last tenyears
Baland and Platteau (1996),Dietz et al (2003), Gibsonet al (2000; 2005), McKean(1992), Ostrom (1990),Robbins (2000)
a Entries in this column refer to studies that highlight the causal importance of variablescorresponding to a given class; the references are only a selection from the vast literatureon the commons.
(3) The questions we used during our fieldwork come from the data collection instruments devel-oped by the International Forestry Resources and Institutions (IFRI) Program (Wollenberg et al,2007, http://www.umich.edu/~ifri).
Explaining forest governance in the Indian Himalaya 333
are associated with positive changes, college education has a negative effect. This resultsuggests a potentially nonlinear relationship between education and changes in forestcondition.
Contrary to our expectation, the coefficients of the economic and dependencevariables, and many of the institutional variables, turn out not to be statisticallysignificant. Among the economic variables, `subsistence use' of forests is associatedwith improvements in condition; but other measures of dependence have no statis-tically significant effects. Of the nine institutional variables, we find statisticallysignificant effects for only two: `decentralized control' over forests; and the under-taking of `plantation' activities. But coefficients of a range of other institutionalvariables that the literature identifies as being importantöespecially illegal use, fines,and sanctionsöare not statistically significant.
Despite the fact that our model does not confirm some of the previous results inexisting literature on the commons, it does have a good fit with the data. The residualsare normally distributed, with the expected number of observations in the tails(Shapiro ^Wilk W test for normal data: H0: data are distributed normallyöW � 0:996,
Table 2. Descriptive statistics for variables in model 1 (N � 205).
Variable name Mean Standard Minimum Maximum Expecteddeviation sign
Dependent variableChange in forest condition 2.97 0.837 1 5
Biophysical variableNumber of fires 3.27 4.21 0 30 negative
Demographic variableNumber of households 182.07 322.12 6 2 700 negativeNumber of cattle 389.6 521.5 19 2 600 positiveGrazing by goats 0.74 1.51 0 10 negativeCattle grazing 3.4 2.32 0 7.6 negative
Sociopolitical variablesEducation 13.74 3.30 5 18 positiveCollege 1.67 0.8 1 3 negativeHomogeneity 0.2 0.2 0 0.88 positiveConflict resolution 0.59 na 0 1 positive
Economic and dependence variablesSubsistence use 1.93 0.74 1 3 positiveUtility 3.26 0.8 1 5 negativeAdverse effect 1.46 0.63 1 3 negative
Institutional variablesTraditional institutions 0.26 na 0 1 positiveVoluntary labor 143.09 348.69 0 2 000 positiveIllegal users 18.83 35.66 0 100 negativeExternal users 0.39 na 0 1 negativeEncroachments 0.47 0.98 0 5.29 positiveDecentralized control 0.46 na 0 1 positiveSanctions 0.06 0.17 0 1.16 negativeIncome from fines 0.11 na 0 1 negativePlantation 0.53 na 0 1 positive
Note: naÐnot applicable.
334 A Agrawal, A Chhatre
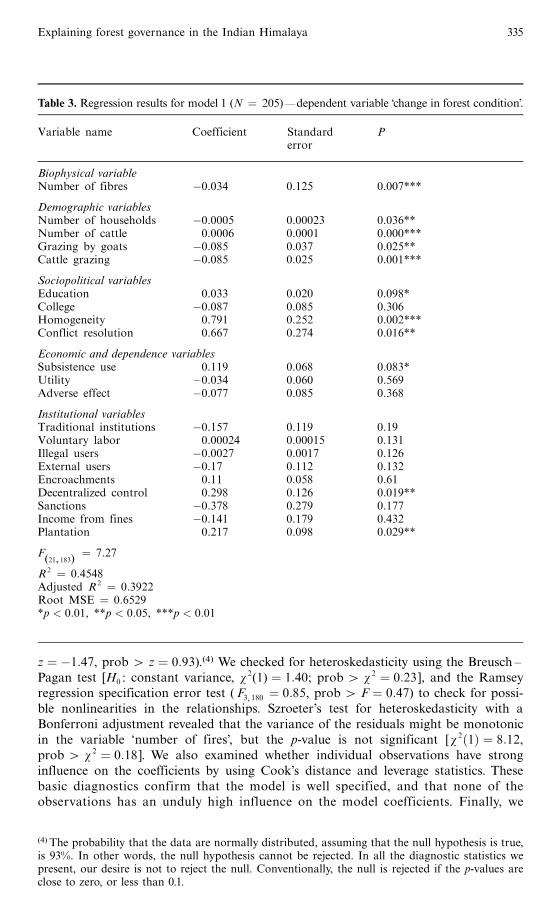
z � ÿ1:47, prob 4 z � 0:93).(4) We checked for heteroskedasticity using the Breusch ^Pagan test [H0 : constant variance, w
2(1) � 1:40; prob 4 w 2 � 0:23 ], and the Ramseyregression specification error test (F3 180 � 0:85, prob 4 F � 0:47) to check for possi-ble nonlinearities in the relationships. Szroeter's test for heteroskedasticity with aBonferroni adjustment revealed that the variance of the residuals might be monotonicin the variable `number of fires', but the p-value is not significant [w 2�1� � 8:12,prob 4 w 2 � 0:18 ]. We also examined whether individual observations have stronginfluence on the coefficients by using Cook's distance and leverage statistics. Thesebasic diagnostics confirm that the model is well specified, and that none of theobservations has an unduly high influence on the model coefficients. Finally, we
,
Table 3. Regression results for model 1 (N � 205)ödependent variable change in forest condition'.
Variable name Coefficient Standard Perror
Biophysical variableNumber of fibres ÿ0.034 0.125 0.007***
Demographic variablesNumber of households ÿ0.0005 0.00023 0.036**Number of cattle 0.0006 0.0001 0.000***Grazing by goats ÿ0.085 0.037 0.025**Cattle grazing ÿ0.085 0.025 0.001***
Sociopolitical variablesEducation 0.033 0.020 0.098*College ÿ0.087 0.085 0.306Homogeneity 0.791 0.252 0.002***Conflict resolution 0.667 0.274 0.016**
Economic and dependence variablesSubsistence use 0.119 0.068 0.083*Utility ÿ0.034 0.060 0.569Adverse effect ÿ0.077 0.085 0.368
Institutional variablesTraditional institutions ÿ0.157 0.119 0.19Voluntary labor 0.00024 0.00015 0.131Illegal users ÿ0.0027 0.0017 0.126External users ÿ0.17 0.112 0.132Encroachments 0.11 0.058 0.61Decentralized control 0.298 0.126 0.019**Sanctions ÿ0.378 0.279 0.177Income from fines ÿ0.141 0.179 0.432Plantation 0.217 0.098 0.029**
F(21, 183)
� 7:27
R 2 � 0:4548Adjusted R 2 � 0:3922Root MSE � 0:6529*p < 0:01, **p < 0:05, ***p < 0:01
(4) The probability that the data are normally distributed, assuming that the null hypothesis is true,is 93%. In other words, the null hypothesis cannot be rejected. In all the diagnostic statistics wepresent, our desire is not to reject the null. Conventionally, the null is rejected if the p-values areclose to zero, or less than 0.1.
Explaining forest governance in the Indian Himalaya 335
checked for multicollinearity by calculating the variance inflation factor (VIF) foreach variable. The scores indicate that none of the variables are strongly correlated(maximum VIF � 2:83, only four variables with VIF 4 2:00).
3 Qualitative analysis of residualsAlthough our regression model has a good fit with the data, an analysis of casescorresponding to the highest and lowest residuals provides additional information toimprove the fit between the model and our data. We selected the five highest and fivelowest residuals to examine whether these cases yield new information (these tenobservations are 5% of the full set of cases). Our rationale for selecting the highestand lowest residuals is that these observations conform the least with the theoryencoded in our OLS regression model; therefore, the cases corresponding to themare the most likely to provide new information. Indeed, given the statistical confirma-tion of a good fit of the regression model with the data by conventional regressiondiagnostics, it may be quite appropriate to end analysis with the findings presentedin table 3.(5) The approach we advocate suggests, however, that it may be fruitfulto continue the analysis with a qualitative examination of cases corresponding to thehighest and lowest residuals.
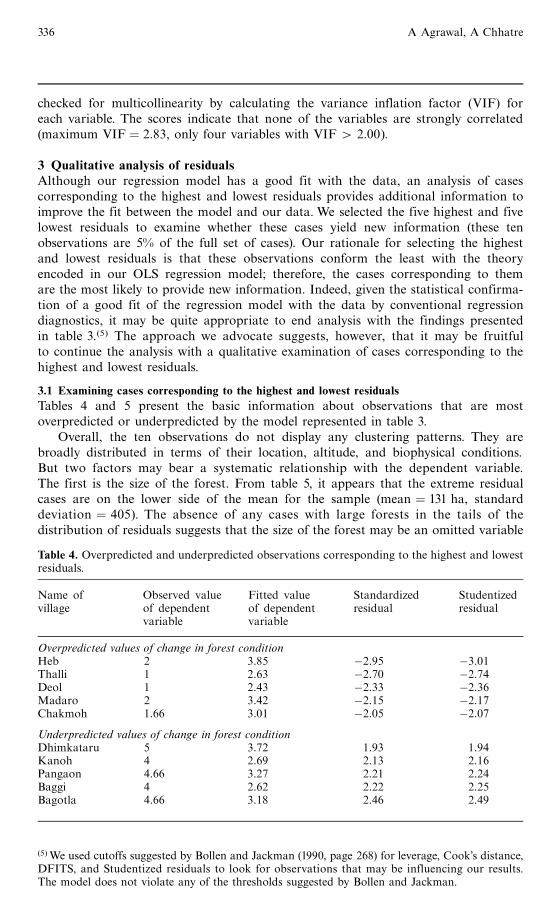
3.1 Examining cases corresponding to the highest and lowest residualsTables 4 and 5 present the basic information about observations that are mostoverpredicted or underpredicted by the model represented in table 3.
Overall, the ten observations do not display any clustering patterns. They arebroadly distributed in terms of their location, altitude, and biophysical conditions.But two factors may bear a systematic relationship with the dependent variable.The first is the size of the forest. From table 5, it appears that the extreme residualcases are on the lower side of the mean for the sample (mean � 131 ha, standarddeviation � 405). The absence of any cases with large forests in the tails of thedistribution of residuals suggests that the size of the forest may be an omitted variable
(5)We used cutoffs suggested by Bollen and Jackman (1990, page 268) for leverage, Cook's distance,DFITS, and Studentized residuals to look for observations that may be influencing our results.The model does not violate any of the thresholds suggested by Bollen and Jackman.
Table 4. Overpredicted and underpredicted observations corresponding to the highest and lowestresiduals.
Name of Observed value Fitted value Standardized Studentizedvillage of dependent of dependent residual residual
variable variable
Overpredicted values of change in forest conditionHeb 2 3.85 ÿ2.95 ÿ3.01Thalli 1 2.63 ÿ2.70 ÿ2.74Deol 1 2.43 ÿ2.33 ÿ2.36Madaro 2 3.42 ÿ2.15 ÿ2.17Chakmoh 1.66 3.01 ÿ2.05 ÿ2.07Underpredicted values of change in forest conditionDhimkataru 5 3.72 1.93 1.94Kanoh 4 2.69 2.13 2.16Pangaon 4.66 3.27 2.21 2.24Baggi 4 2.62 2.22 2.25Bagotla 4.66 3.18 2.46 2.49
336 A Agrawal, A Chhatre
that is correlated with other exogenous variables and exerts a causal effect on thedependent variable.
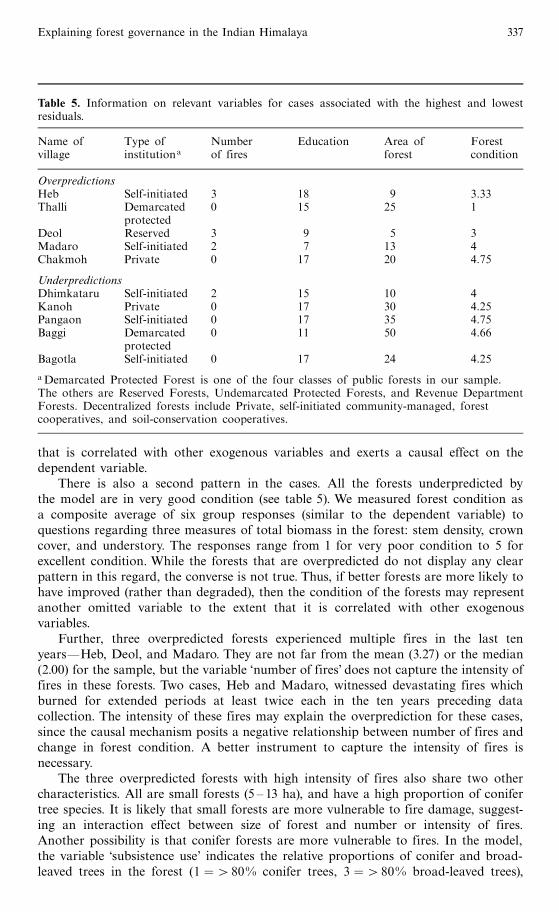
There is also a second pattern in the cases. All the forests underpredicted bythe model are in very good condition (see table 5). We measured forest condition asa composite average of six group responses (similar to the dependent variable) toquestions regarding three measures of total biomass in the forest: stem density, crowncover, and understory. The responses range from 1 for very poor condition to 5 forexcellent condition. While the forests that are overpredicted do not display any clearpattern in this regard, the converse is not true. Thus, if better forests are more likely tohave improved (rather than degraded), then the condition of the forests may representanother omitted variable to the extent that it is correlated with other exogenousvariables.
Further, three overpredicted forests experienced multiple fires in the last tenyearsöHeb, Deol, and Madaro. They are not far from the mean (3.27) or the median(2.00) for the sample, but the variable `number of fires' does not capture the intensity offires in these forests. Two cases, Heb and Madaro, witnessed devastating fires whichburned for extended periods at least twice each in the ten years preceding datacollection. The intensity of these fires may explain the overprediction for these cases,since the causal mechanism posits a negative relationship between number of fires andchange in forest condition. A better instrument to capture the intensity of fires isnecessary.
The three overpredicted forests with high intensity of fires also share two othercharacteristics. All are small forests (5 ^ 13 ha), and have a high proportion of conifertree species. It is likely that small forests are more vulnerable to fire damage, suggest-ing an interaction effect between size of forest and number or intensity of fires.Another possibility is that conifer forests are more vulnerable to fires. In the model,the variable `subsistence use' indicates the relative proportions of conifer and broad-leaved trees in the forest (1 �480% conifer trees, 3 �480% broad-leaved trees),
Table 5. Information on relevant variables for cases associated with the highest and lowestresiduals.
Name of Type of Number Education Area of Forestvillage institutiona of fires forest condition
OverpredictionsHeb Self-initiated 3 18 9 3.33Thalli Demarcated 0 15 25 1
protectedDeol Reserved 3 9 5 3Madaro Self-initiated 2 7 13 4Chakmoh Private 0 17 20 4.75
UnderpredictionsDhimkataru Self-initiated 2 15 10 4Kanoh Private 0 17 30 4.25Pangaon Self-initiated 0 17 35 4.75Baggi Demarcated 0 11 50 4.66
protectedBagotla Self-initiated 0 17 24 4.25
aDemarcated Protected Forest is one of the four classes of public forests in our sample.The others are Reserved Forests, Undemarcated Protected Forests, and Revenue DepartmentForests. Decentralized forests include Private, self-initiated community-managed, forestcooperatives, and soil-conservation cooperatives.
Explaining forest governance in the Indian Himalaya 337
capturing the logic that forests dominated by broad-leaved species in our study areaare considered by the residents to be superior to those dominated by conifer species interms of their contributions to subsistence uses like grazing, grass and leaf fodder,fuelwood, and fertilizer. Together, the three cases suggest a possible interaction effectbetween `subsistence use' and `number of fires'.
The overprediction for the Thalli demarcated protected forest raises an interestingissue. The dataset contains 205 forests distributed over 103 villages. Thalli village hastwo forests in the sample, one of them being a self-initiated forest-management insti-tution. The local women's group has been protecting this forest since 1992, but therehave been several conflicts between the women and a group of goat-herding familieswho rely on this forest. During the decade before the study was undertaken, the conflictwas partially settled by allowing the goat herders grazing privileges in higher altitude.Demarcated Protected Forest of the same village. Over the years before data collection,it is likely that degradation of the forest (as evident from its low observed value on thedependent variable) was a result of the shift of pressure away from the forest protectedby the women's group. The model fails to capture this dependency between twoobservations from the same village. In other words, it represents a violation of theassumption that all observations are independent of each other. Rather, it appears to bethe case that observations might be clustered by village.
There are two private forests among these ten cases: Chakmoh is overpredicted;and Kanoh is underpredicted. Several of the variables in the model are measured at thelevel of the village (for example, `education', `number of cattle', and `homogeneity').Many of these variables represent causal mechanisms which cannot be interpretedeasily for privately owned forests. For example, the `subsistence use' variable capturesthe hypothesis that broad-leaved forests provide better subsistence than do coniferforests, and that subsistence utility of forests is relevant to changes in forest conditionover time. However, to the extent that most villagers are excluded from decisionsregarding the management (or even use) of private forests, it is not meaningful toassume such a relationship for all forests. The dummy variable `decentralized control'represents the hypothesis that forests will improve when users are able to makecollective decisions regarding the management of the forest in relation to their levelof dependence and other factors. The variable includes private forests, but the dis-cussion above suggests that these forests perhaps belong to the other category. Thedummy variable should represent community management, rather than decentralizedmanagement.
Three of the five underpredicted cases are self-initiated forest-management institu-tionsöDhimkataru, Pangaon, and Bagotla. These are forests that have improved morethan predicted by the model. Bagotla represents a successful case of self-initiatedcommunity management, protection having started in 1960 in response to an increas-ing scarcity of subsistence products such as fuelwood and fodder. The forest was closedto all grazing for a decade to allow regeneration and the survival of planted saplingsand was opened to grazing just before data collection. The negative coefficients on thegrazing variables in our model likely bring down the predicted value for Bagotla morethan is warranted by the hypothesis, since the model assumes that the level of grazingrecorded in 2000 is representative of the intensity of grazing over the last several years.This is an implicit assumption in the measurement of several variables, but is partic-ularly true for causal mechanisms that are played out over time but measured onlycross-sectionally.
In a similar vein, the underprediction of Pangaon self-initiated community forestmay be attributable to the mismeasurement of a variable. Pangaon is close to the city ofManali, which has witnessed substantial illegal felling of valuable cedar trees to meet
338 A Agrawal, A Chhatre
urban demand. Pangaon villagers, led by its Yuvak Mandal (a youth organization) andMahila Mandal (a women's organization), and supported by the district administra-tion, initiated intensive patrolling in their forest in 1990. Villagers contributed severalhundred person-days in the first few years to patrol the two forests and successfullyreduced illegal timber harvests. However, by the mid-1990s, the villages had shifted to asystem of third-party monitoring through the seasonal hiring of guards to protect theforest. The variables for monitoring and enforcement in the modelö`voluntary labor'and `illegal users'ödo not sufficiently represent the process in Pangaon. `Voluntarylabor' is a measure of the total number of person-days of voluntary labor in the lastfive years, but does not capture the effect of high values of voluntary labor prior to thelast five yearsöas for Pangaon.
Finally, there is the case of Heb. This is a village with high levels of `education',(a value of 18, compared with the sample mean of 13.7). Villagers blame the high levelof education as a source of problems: `overeducated' people find it below their dignityto participate in community monitoring and enforcement activities. On the other hand,Baggi has a relatively low score on `education'. Heb is overpredicted by the model,whereas Baggi is underpredicted. The combination of the two suggests that education'may have a nonlinear effect on the dependent variable, with high values having anegative effect. In other words, if there was an inverse U-shaped relationship betweeneducation and change in forest condition, the inclusion of a quadratic term in themodel would make the prediction of Heb slightly lower, and the prediction of Baggislightly higher than the present model.
In summary, the qualitative analysis of the cases predicted least well by our initialmodel generates the following additional insights. (1) Size of the forest may have apositive relationship with change in forest condition. Further, the effect of `subsistenceuse' and `number of fires' may be conditional on the size of the forest. (2) Thecondition of the forest is another possible omitted variable. (3) `Number of fires' doesnot capture well the causal processes linking the incidence of fire with changes in forestcondition. Additionally, effects of fires may be moderated by the composition of theforest and better represented by an interaction between `number of fires' and `subsis-tence use'. (4) The dummy variable `decentralized control' should be replaced withone for community-managed forests. (5) Education may have a nonlinear effect onoutcomes, which needs to be tested through the inclusion of a quadratic term.(6) Two forests per village may violate the independence assumption. One possiblecorrection for this is the Huber ^White `sandwich' estimator for the variance of theerrors in a regression with robust standard errors; another would be to test for spatialautoregression and spatial autocorrelation.
4 Presentation and discussion of new modelTo examine these hypotheses, we reanalyzed our data.We incorporated three new variables(`forest area', `forest condition', and education squared') into the model.We also includedthe interaction terms identified above.We rescaled `number of fires' to represent intensityby down-weighting the cases with many fires. We did this by reclassifying the continuousvariable into a five-level categorical variable, reducing the distance between the low andhigh values from 30 to 4. The qualitative argument for this transformation is that if a forestexperiences a high-intensity fire, it is unlikely to have another fire for a few years. Thus,forests with lower number of fires may still sustain significant damage. The rescaledvariable accounts for this possibility without ignoring the negative impact of multiplelow-intensity fires.We estimated the model with (and without) the Huber ^White sandwichestimator to correct for possible violation of the independence assumption throughclustering at the village level. In addition, we tested for spatial autoregression by including
Explaining forest governance in the Indian Himalaya 339
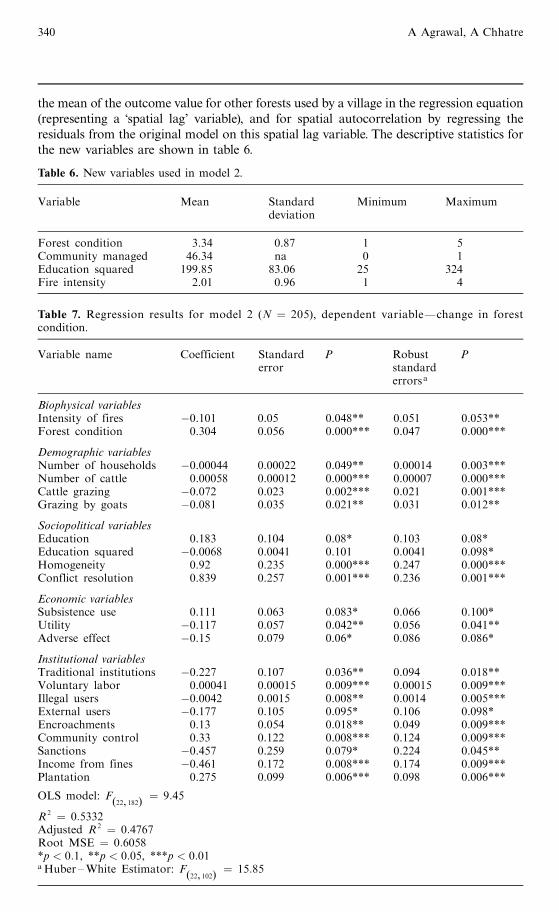
the mean of the outcome value for other forests used by a village in the regression equation(representing a `spatial lag' variable), and for spatial autocorrelation by regressing theresiduals from the original model on this spatial lag variable. The descriptive statistics forthe new variables are shown in table 6.
Table 6. New variables used in model 2.
Variable Mean Standard Minimum Maximumdeviation
Forest condition 3.34 0.87 1 5Community managed 46.34 na 0 1Education squared 199.85 83.06 25 324Fire intensity 2.01 0.96 1 4
Table 7. Regression results for model 2 (N � 205), dependent variableöchange in forestcondition.
Variable name Coefficient Standard P Robust Perror standard
errorsa
Biophysical variablesIntensity of fires ÿ0.101 0.05 0.048** 0.051 0.053**Forest condition 0.304 0.056 0.000*** 0.047 0.000***
Demographic variablesNumber of households ÿ0.00044 0.00022 0.049** 0.00014 0.003***Number of cattle 0.00058 0.00012 0.000*** 0.00007 0.000***Cattle grazing ÿ0.072 0.023 0.002*** 0.021 0.001***Grazing by goats ÿ0.081 0.035 0.021** 0.031 0.012**
Sociopolitical variablesEducation 0.183 0.104 0.08* 0.103 0.08*Education squared ÿ0.0068 0.0041 0.101 0.0041 0.098*Homogeneity 0.92 0.235 0.000*** 0.247 0.000***Conflict resolution 0.839 0.257 0.001*** 0.236 0.001***
Economic variablesSubsistence use 0.111 0.063 0.083* 0.066 0.100*Utility ÿ0.117 0.057 0.042** 0.056 0.041**Adverse effect ÿ0.15 0.079 0.06* 0.086 0.086*
Institutional variablesTraditional institutions ÿ0.227 0.107 0.036** 0.094 0.018**Voluntary labor 0.00041 0.00015 0.009*** 0.00015 0.009***Illegal users ÿ0.0042 0.0015 0.008** 0.0014 0.005***External users ÿ0.177 0.105 0.095* 0.106 0.098*Encroachments 0.13 0.054 0.018** 0.049 0.009***Community control 0.33 0.122 0.008*** 0.124 0.009***Sanctions ÿ0.457 0.259 0.079* 0.224 0.045**Income from fines ÿ0.461 0.172 0.008*** 0.174 0.009***Plantation 0.275 0.099 0.006*** 0.098 0.006***
OLS model: F(22, 182)
� 9:45
R 2 � 0:5332Adjusted R 2 � 0:4767Root MSE � 0:6058*p < 0:1, **p < 0:05, ***p < 0:01aHuber ±White Estimator: F
(22, 102)� 15:85
340 A Agrawal, A Chhatre
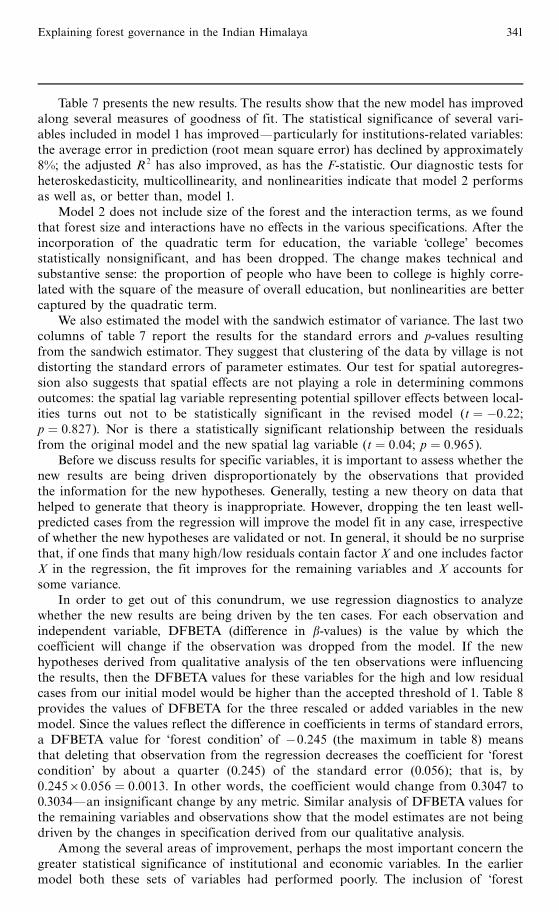
Table 7 presents the new results. The results show that the new model has improvedalong several measures of goodness of fit. The statistical significance of several vari-ables included in model 1 has improvedöparticularly for institutions-related variables:the average error in prediction (root mean square error) has declined by approximately8%; the adjusted R 2 has also improved, as has the F-statistic. Our diagnostic tests forheteroskedasticity, multicollinearity, and nonlinearities indicate that model 2 performsas well as, or better than, model 1.
Model 2 does not include size of the forest and the interaction terms, as we foundthat forest size and interactions have no effects in the various specifications. After theincorporation of the quadratic term for education, the variable college' becomesstatistically nonsignificant, and has been dropped. The change makes technical andsubstantive sense: the proportion of people who have been to college is highly corre-lated with the square of the measure of overall education, but nonlinearities are bettercaptured by the quadratic term.
We also estimated the model with the sandwich estimator of variance. The last twocolumns of table 7 report the results for the standard errors and p-values resultingfrom the sandwich estimator. They suggest that clustering of the data by village is notdistorting the standard errors of parameter estimates. Our test for spatial autoregres-sion also suggests that spatial effects are not playing a role in determining commonsoutcomes: the spatial lag variable representing potential spillover effects between local-ities turns out not to be statistically significant in the revised model (t � ÿ0:22;p � 0:827). Nor is there a statistically significant relationship between the residualsfrom the original model and the new spatial lag variable (t � 0:04; p � 0:965).
Before we discuss results for specific variables, it is important to assess whether thenew results are being driven disproportionately by the observations that providedthe information for the new hypotheses. Generally, testing a new theory on data thathelped to generate that theory is inappropriate. However, dropping the ten least well-predicted cases from the regression will improve the model fit in any case, irrespectiveof whether the new hypotheses are validated or not. In general, it should be no surprisethat, if one finds that many high/low residuals contain factor X and one includes factorX in the regression, the fit improves for the remaining variables and X accounts forsome variance.
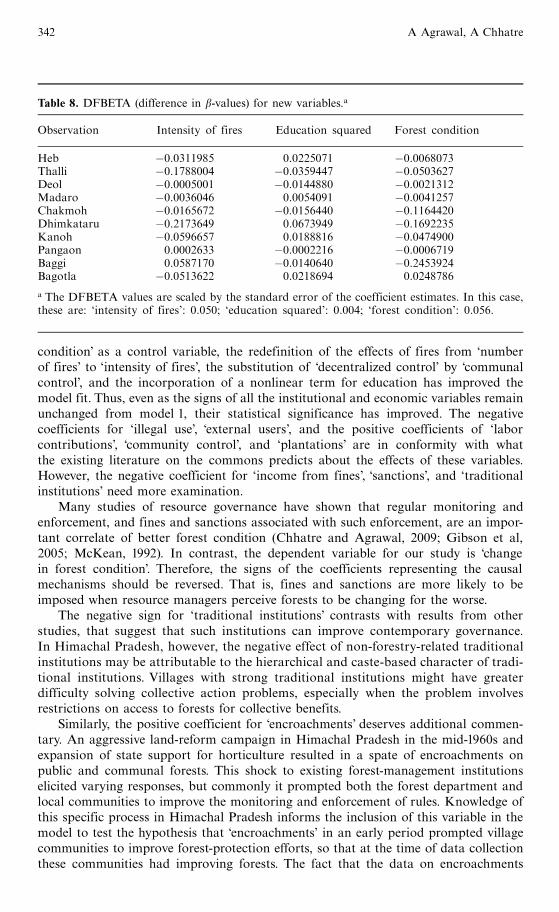
In order to get out of this conundrum, we use regression diagnostics to analyzewhether the new results are being driven by the ten cases. For each observation andindependent variable, DFBETA (difference in b-values) is the value by which thecoefficient will change if the observation was dropped from the model. If the newhypotheses derived from qualitative analysis of the ten observations were influencingthe results, then the DFBETA values for these variables for the high and low residualcases from our initial model would be higher than the accepted threshold of 1. Table 8provides the values of DFBETA for the three rescaled or added variables in the newmodel. Since the values reflect the difference in coefficients in terms of standard errors,a DFBETA value for `forest condition' of ÿ0:245 (the maximum in table 8) meansthat deleting that observation from the regression decreases the coefficient for `forestcondition' by about a quarter (0.245) of the standard error (0.056); that is, by0:24560:056 � 0:0013. In other words, the coefficient would change from 0.3047 to0.3034öan insignificant change by any metric. Similar analysis of DFBETA values forthe remaining variables and observations show that the model estimates are not beingdriven by the changes in specification derived from our qualitative analysis.
Among the several areas of improvement, perhaps the most important concern thegreater statistical significance of institutional and economic variables. In the earliermodel both these sets of variables had performed poorly. The inclusion of `forest
Explaining forest governance in the Indian Himalaya 341
condition' as a control variable, the redefinition of the effects of fires from `numberof fires' to `intensity of fires', the substitution of `decentralized control' by communalcontrol', and the incorporation of a nonlinear term for education has improved themodel fit. Thus, even as the signs of all the institutional and economic variables remainunchanged from model 1, their statistical significance has improved. The negativecoefficients for `illegal use', external users', and the positive coefficients of `laborcontributions', community control', and `plantations' are in conformity with whatthe existing literature on the commons predicts about the effects of these variables.However, the negative coefficient for `income from fines', `sanctions', and `traditionalinstitutions' need more examination.
Many studies of resource governance have shown that regular monitoring andenforcement, and fines and sanctions associated with such enforcement, are an impor-tant correlate of better forest condition (Chhatre and Agrawal, 2009; Gibson et al,2005; McKean, 1992). In contrast, the dependent variable for our study is changein forest condition'. Therefore, the signs of the coefficients representing the causalmechanisms should be reversed. That is, fines and sanctions are more likely to beimposed when resource managers perceive forests to be changing for the worse.
The negative sign for `traditional institutions' contrasts with results from otherstudies, that suggest that such institutions can improve contemporary governance.In Himachal Pradesh, however, the negative effect of non-forestry-related traditionalinstitutions may be attributable to the hierarchical and caste-based character of tradi-tional institutions. Villages with strong traditional institutions might have greaterdifficulty solving collective action problems, especially when the problem involvesrestrictions on access to forests for collective benefits.
Similarly, the positive coefficient for encroachments' deserves additional commen-tary. An aggressive land-reform campaign in Himachal Pradesh in the mid-1960s andexpansion of state support for horticulture resulted in a spate of encroachments onpublic and communal forests. This shock to existing forest-management institutionselicited varying responses, but commonly it prompted both the forest department andlocal communities to improve the monitoring and enforcement of rules. Knowledge ofthis specific process in Himachal Pradesh informs the inclusion of this variable in themodel to test the hypothesis that `encroachments' in an early period prompted villagecommunities to improve forest-protection efforts, so that at the time of data collectionthese communities had improving forests. The fact that the data on encroachments
Table 8. DFBETA (difference in b-values) for new variables.a
Observation Intensity of fires Education squared Forest condition
Heb ÿ0.0311985 0.0225071 ÿ0.0068073Thalli ÿ0.1788004 ÿ0.0359447 ÿ0.0503627Deol ÿ0.0005001 ÿ0.0144880 ÿ0.0021312Madaro ÿ0.0036046 0.0054091 ÿ0.0041257Chakmoh ÿ0.0165672 ÿ0.0156440 ÿ0.1164420Dhimkataru ÿ0.2173649 0.0673949 ÿ0.1692235Kanoh ÿ0.0596657 0.0188816 ÿ0.0474900Pangaon 0.0002633 ÿ0.0002216 ÿ0.0006719Baggi 0.0587170 ÿ0.0140640 ÿ0.2453924Bagotla ÿ0.0513622 0.0218694 0.0248786
a The DFBETA values are scaled by the standard error of the coefficient estimates. In this case,these are: `intensity of fires': 0.050; `education squared': 0.004; `forest condition': 0.056.
342 A Agrawal, A Chhatre
concern events that took place nearly thirty years ago suggests that histories of forestgovernance play a crucial role in determining the outcomes of commons management.
Indeed, the second statistical model, incorporating new insights from knowledge ofthe most overpredicted and underpredicted cases, shows just how important contextualand historical knowledge can be for informing quantitative analyses and improvingcausal inference. Such knowledge played a key role in the identification of new vari-ables and potential interactions among variables, improving the measures of existingvariables, inferring the functional form of the predicted relationship between causaland outcome variables, and interpreting the observed relationships.
5 Scope of findings and conclusionsIn this paper we have attempted to show that knowledge of particular cases andinsights based on a thorough knowledge of causal processes in specific contexts canbe united productively with statistical analysis to improve causal inference. We haveapplied this commonly accepted view to the analysis of the highest and lowest residualsthat are present in nearly all regression analyses. Our approach points toward fruitfulbut underexplored avenues along which to invest analytical energies for scholarsinterested in productive conversations across the common quantitative ^ qualitativedivisions in geographical and social scientific research.
Our results suggest that new hypotheses based on an inspection of residualsand knowledge about the cases corresponding to the residuals can improve the fitof regression models with existing data. The potential improvements relate directly tothe common diagnostics that analysts use to evaluate the robustness of statisticalanalysis. But improved understanding of causal processes is even more important.
The regression diagnostics associated with our first model indicated that com-monly used quantitative assessments of regression models are critical first steps inevaluating the goodness of fit of models. But the subsequent inspection of high andlow residuals and the statistical tests of resulting hypotheses yielded additional payoffs.On the one hand, the combination of qualitative and quantitative approaches helped usidentify more precisely the effects of education, fire, encroachments, and past historiesof forest governance. The subsequent quantitative analysis also allowed us to discardinvestigations along blind alleys.
The approach we advocate is likely to be especially useful in the case of medium-sized datasets that contain more than 30 and fewer than 500 observations. For largerdatasets, inspection of specific observations is less likely to yield patterns relevantacross the full data. For smaller datasets statistical techniques may not constitute thebest analytical approach: Boolean or more conventional comparative approaches mayyield better results (Ragin, 2000).
We have concentrated our attention in this paper on forest commons and studies ofresource governance. Our revised analysis points to the importance of institutional aswell as biophysical factors in shaping outcomes related to changes in forest conditions.But it is useful to draw attention to the different ways in which the revised analysisshows the importance of historical factors. A focus on the extreme cases shows the needto understand the contextually specific effects of historical forest-protection effortsmounted in response to encroachments, histories of experiences of fires in forests,and the historically hierarchical nature of traditional forest-management institutions.
If our substantive focus illustrates the importance of history and context in relationto resource governance, our methodological approach identifies potential analyticalpayoffs that result from combining qualitative and quantitative methods. In general,the approach we propose is highly relevant to other fields of inquiry into human ^environment interactions. Indeed, because high and low residuals are common to most
Explaining forest governance in the Indian Himalaya 343
statistical analyses, the specific approach proposed in this paper may be useful in manyareas of scholarly research in human geography, land change, common property,political ecology, comparative politics, and resource governance.
Acknowledgements. We are grateful to Bear Braumoeller, Giacomo Chiozza, William Clark,Margaret McKean, Elinor Ostrom, Amy Poteete, Katharine Sims, and three anonymous refereesfor insightful comments and suggestions for improving this paper. An earlier version of thispaper was presented to the Science Environment and Development Group at the KennedySchool of Government at Harvard University. We thank the audience for their comments andsuggestions. We also wish to thank Satya Prasanna, Akshay Jasrotia, Vishal Sharma, HarryFischer, and Sonya Suter for assistance with data collection, analysis, and preparation ofmaps. We wish to acknowledge financial support from the Ford Foundation and the MacArthurFoundation, and via NSF grant # SES 0961868.
ReferencesAgrawal A, Chhatre A, 2006 ` Explaining success on the commons: community forest governance
in the Indian Himalaya'' World Development 34 149 ^ 166Agrawal A, Chhatre A, 2007, ` Institutions, co-governance, and forests in the Indian Himalayas''
Comparative Studies in International Development 42(1/2) 67 ^ 86Andersson K, Gibson C, Lehoucq F, 2006, ` Municipal politics and forest governance: comparative
analysis of decentralization in Bolivia and Guatemala''World Development 34 576 ^ 595Andrews D F, Pregibon D, 1978, ` Finding the outliers that matter'' Journal of the Royal Statistical
Society B 40 85 ^ 93Angelsen A, Kaimowitz D, 1999, ` Rethinking the causes of deforestation: lessons from economic
models'' World Bank Research Observer 14(1) 73 ^ 98Baland J-M, Platteau J-P, 1996 Halting Degradation of Natural Resources: IsThere a Role for Rural
Communities? (Clarendon Press, Oxford)Barnes T J, 2009, ` Not only ... but also: quantitative and critical geography'' The Professional
Geographer 61 292 ^ 300Barnes T J, Hannah M, 2001, ` Guest editorial. The place of numbers: histories, geographies,
and theories of quantification'' Environment and Planning D: Society and Space 19 379 ^ 383Bergmann L, Sheppard E, Plummer P S, 2009, ` Capitalism beyond harmonious equilibrium:
mathematics as if human agency mattered'' Environment and Planning A 41 265 ^ 283Bollen K A, Jackman RW, 1990, ` Regression diagnostics: an expository treatment of outliers
and influential cases'', in Modern Methods of Data Analysis Eds J Fox, J S Long (Sage,Newbury Park, CA) pp 257 ^ 291
Chhatre A, Agrawal A, 2008, ` Forest commons and local enforcement''Proceedings of the NationalAcademy of Sciences of the United States of America 105 13286 ^ 13291
Chhatre A, Agrawal A, 2009, ` Synergies and trade-offs between carbon storage and livelihoodbenefits from forest commons'' Proceedings of the National Academy of Sciences of the UnitedStates of America 106 17667 ^ 17670
Coleman E, Steed B, 2009,` Monitoring and sanctioning in the commons: an application to forestry''Ecological Economics 68 2106 ^ 2113
Dietz T, Ostrom E, Stern P, 2003, ` The struggle to govern the commons'', Special Issue: Tragedyof the commons? Science 302 1907 ^ 1912
Gibson C C, McKean M A, Ostrom E (Eds), 2000 People and Forests: Communities, Institutions,and Governance (MIT Press, Cambridge, MA)
Gibson CC,Williams J, Ostrom E, 2005, ` Local enforcement and better forests''WorldDevelopment33 273 ^ 284
Gutman G, Janetos A, Justice C, Moran E, Mustard J, Rindfuss R, Skole D,Turner B, CochraneM,2004 Land Change Science: Observing, Monitoring, and Understanding Trajectories of Changeon the Earth's Surface (Kluwer Academic, NewYork)
HamiltonT, 2009,` Power in numbers: a call for analytical generosity toward new political strategies''Environment and Planning A 41 284 ^ 301
Johnson C, Forsyth T, 2002, ` In the eyes of the state: negotiating a `rights-based approach' to forestconservation in Thailand'' World Development 30 1591 ^ 1605
Kahn JR,Udry J R,1986,` Marital coital frequency: unnoticed outliers and unspecified interactionslead to erroneous conclusions''American Sociological Review 51 734 ^737
Kwan M-P, 2004, ` Beyond difference: from canonical geography to hybrid geographies''Annalsof the Association of American Geographers 94 756 ^ 763
344 A Agrawal, A Chhatre
Kwan M-P, Schwanen T, 2009, ` Guest editorial. Critical quantitative geographies'' Environmentand Planning A 41 261 ^ 264
Lambin E, Geist H, 2006 Land-use and Land-cover Change: Local Processes to Global Impacts(Springer, NewYork)
Lambin E, Turner B, Geist H, Agbola S, Angelsen A, 2006, ` The causes of land use and landcover change: moving beyond the myths'' Global Environmental Change 11 2 ^ 13
Leszczynski A, 2009, ` Quantitative limits to qualitative engagements: GIS, its critics, and thephilosophical divide'' The Professional Geographer 61 350 ^ 365
Lieberman E S, 2005, ` Nested analysis as a mixed-method strategy for comparative research''American Political Science Review 99 435 ^ 452
McCay B J, Acheson J (Eds), 1987 The Question of the Commons: The Culture and Ecology ofCommunal Resources (University of Arizona Press, Tucson, AZ)
McKeanM,1992,` Success on the commons: a comparative examination of institutions for commonproperty resource management'' Journal of Theoretical Politics 4 247 ^ 281
Mur J, Lauridsen J, 2007, ` Outliers and spatial dependence in cross-sectional regressions''Environment and Planning A 39 1752 ^ 1769
NRC, 1986 Proceedings of the Conference on Common Property Resource Management NationalResearch Council (National Academy Press,Washington, DC)
Ostrom E, 1990 Governing the Commons: The Evolution of Institutions for Collective Action(Cambridge University Press, NewYork)
Ostrom E, Nagendra H, 2006, ` Insights on linking forests, trees, and people from the air, on theground, and in the laboratory'' Proceedings of the National Academy of Sciences of the UnitedStates of America 103 19224 ^ 19231
Persha L, Blomley T, 2009, ` Management decentralization and montane forest conditions inTanzania'' Conservation Biology 23 1485 ^ 1496
Philip L J, 1998, ` Combining qualitative and quantitative approaches to social research in humangeographyöan impossible mixture? Environment and Planning A 30 261 ^ 276
Plummer P, Sheppard E, 2001, ` Must emancipatory economic geography be qualitative?''Antipode33 194 ^ 199
Poteete AR,OstromE, 2004,` Heterogeneity, group size and collective action: the role of institutionsin forest management''Development and Change 35 437 ^ 461
Poteete A, Janssen M A, Ostrom E, 2010 Working Together: Collective Action, the Commons, andMultiple Methods in Practice (Princeton University Press, Princeton, NJ)
Ragin C, 2000 Fuzzy Set Social Science (University of Chicago Press, Chicago, IL)Robbins P, 2000, ` The rotten institution: corruption in natural resource management'' Political
Geography 19 423 ^ 443Rocheleau D, 1995, ` Maps, numbers, text and context: mixing methods in feminist political
ecology'' The Professional Geographer 47 458 ^ 466Rocheleau D. 2007, ` Political ecology in the key of policy: from changes of explanation to webs
of relation'' Geoforum 39 716 ^ 727Rudel T K, Bates D, Machinguiashi R, 2002, `A tropical forest transition: agricultural change,
out-migration, and secondary forests in the Ecuadorian Amazon''Annals of the Associationof American Geographers 92 87 ^ 102
Sheppard E, 2001, Quantitative geography: representations, practices, and possibilities''Environment and Planning D: Society and Space 19 535 ^ 554
Tiffen M, Mortimore M, Gichuki F, 1994 More PeopleöLess Erosion: Environmental Recoveryin Kenya (JohnWiley, Chichester, Sussex)
Tucker C, Randolph J, Catellanos E, 2007, ` Institutions, biophysical factors and history: anintegrative analysis of private and common property forests in Guatemala and Honduras''Human Ecology 35 259 ^ 274
Turner B L II, Robbins P, 2008, ` Land change science and political ecology: similarities,implications, and differences for sustainability science''Annual Review of Environment andResources 33 295 ^ 316
Turner B L II, Lambin E F, Reenberg A, 2007, ` The emergence of land change science for globalenvironmental change and sustainability'' Proceedings of the National Academy of Sciences ofthe United States of America 104 20666 ^ 20671
Varughese G, Ostrom E, 2001, ` The contested role of heterogeneity in collective action: someevidence from community forestry in Nepal'' World Development 29 747 ^ 765
WadeR,1994VillageRepublics: EconomicConditions forCollectiveAction in South India (ICSPress,Oakland, CA)
Explaining forest governance in the Indian Himalaya 345

Wickramasinghe A, 1997, `Anthropogenic factors and forest management in Sri Lanka''AppliedGeography 17(2) 87 ^ 110
Wollenberg E, Merino L, Agrawal A, Ostrom E, 2007, ` Fourteen years of monitoring community-managed forests: learning from IFRI's experience'' International Forestry Review 9 670 ^ 684
Zimmerer K S, 2007, ` Cultural ecology (and political ecology) in the `environmental borderlands':exploring the expanded connectivities within geography'' Progress in Human Geography 31227 ^ 244
Zolnik E, 2009,``Context in human geography: amulti-level approach to studyhuman ^ environmentinteractions'' The Professional Geographer 61 336 ^ 349
ß 2011 Pion Ltd and its Licensors
346 A Agrawal, A Chhatre

Conditions of use. This article may be downloaded from the E&P website for personal researchby members of subscribing organisations. This PDF may not be placed on any website (or otheronline distribution system) without permission of the publisher.
Related Documents