Streamflow Regime and Changes in Large Northern Watersheds: Human Impacts vs. Natural Variations Daqing Yang, Douglas Kane Water and Environment Research.
Dec 14, 2015
Welcome message from author
This document is posted to help you gain knowledge. Please leave a comment to let me know what you think about it! Share it to your friends and learn new things together.
Transcript


Streamflow Regime and Changes in Large Northern Watersheds:
Human Impacts vs. Natural Variations
Daqing Yang, Douglas Kane
Water and Environment Research Center
University of Alaska Fairbanks, AK99775
Baisheng Ye
Cold & Arid Regions Environmental and Engineering Research Institute, Chinese Academy of Sciences,
Lanzhou 730000, P. R. China
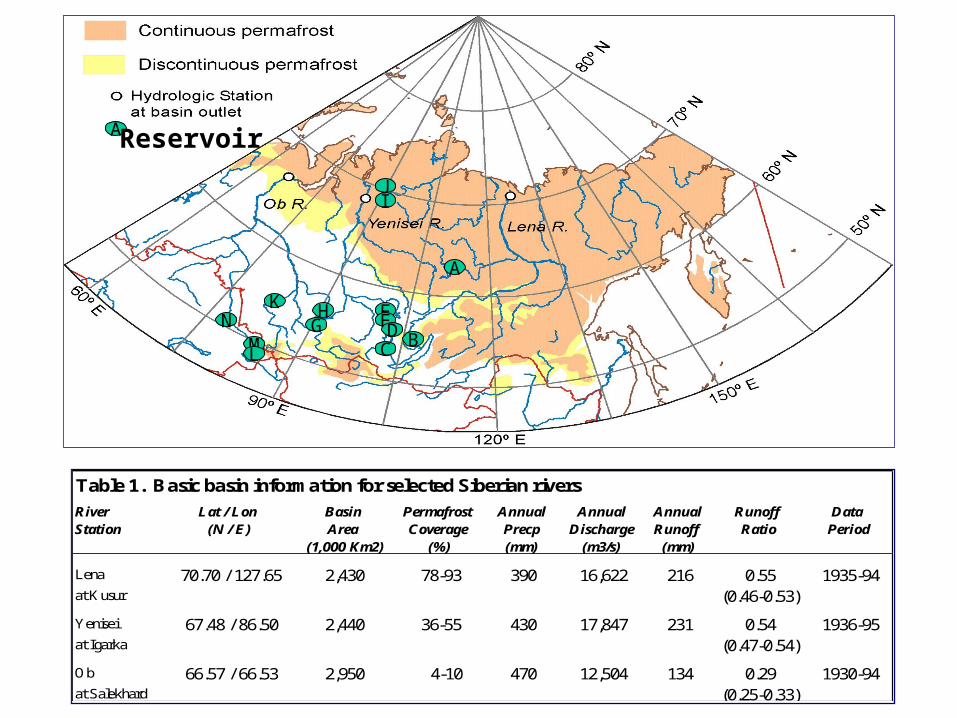
Table 1. Basic basin information for selected Siberian rivers
River Lat / Lon Basin Permafrost Annual Annual Annual Runoff Data Station (N / E) Area Coverage Precp Discharge Runoff Ratio Period
(1,000 Km2) (%) (mm) (m3/s) (mm)
Lena 70.70 / 127.65 2,430 78-93 390 16,622 216 0.55 1935-94at Kusur (0.46-0.53)
Yenisei 67.48 / 86.50 2,440 36-55 430 17,847 231 0.54 1936-95at Igarka (0.47-0.54)
Ob 66.57 / 66.53 2,950 4-10 470 12,504 134 0.29 1930-94at Salekhard (0.25-0.33)
A
FEDC
HG
IJ
K
ML
NB
A Reservoir
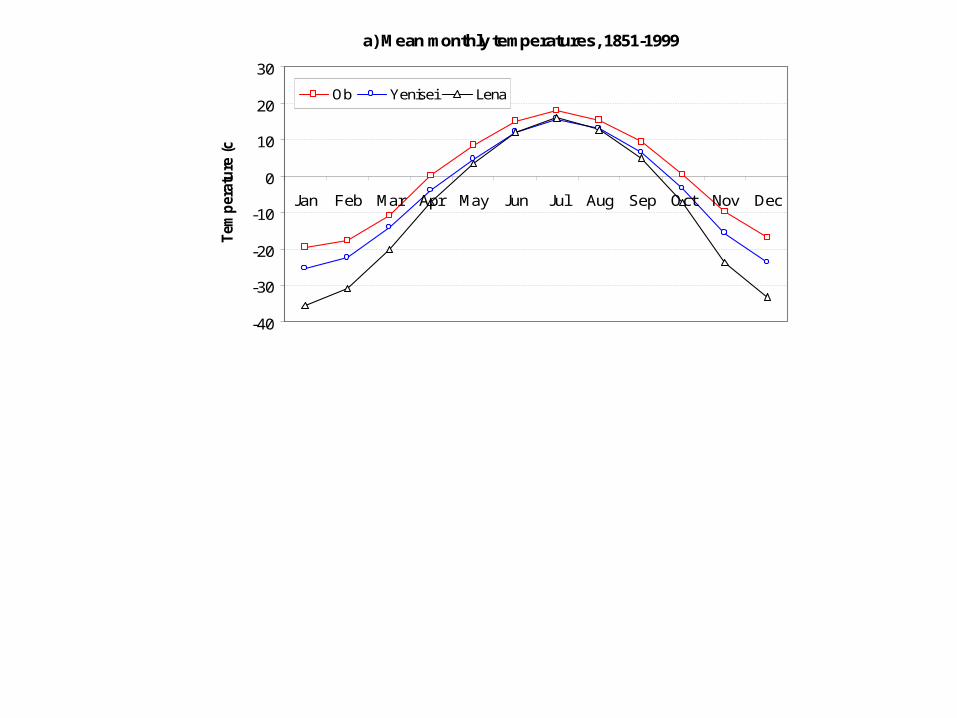
a) Mean monthly temperatures, 1851-1999
-40
-30
-20
-10
0
10
20
30
Jan Feb Mar Apr May Jun Jul Aug Sep Oct Nov Dec
Tem
per
atu
re (
c)
Ob Yenisei Lena
b) Mean monthly Precip, 1900-98
0
10
20
30
40
50
60
70
80
90
1 2 3 4 5 6 7 8 9 10 11 12
Month
Pre
cip
(m
m)
Ob
Yenisei
Lena
0
20,000
40,000
60,000
80,000
100,000
120,000
Jan Feb Mar Apr May Jun Jul Aug Sep Oct Nov Dec
0
20,0 00
40,0 00
60,0 00
80,0 00
100,0 00
120,0 00
J an Feb Ma r Ap r May J un Ju l A ug S ep Oc t N ov D ec
0
20,00 0
40,00 0
60,00 0
80,00 0
1 00,00 0
1 20,00 0
Ja n Fe b Mar A pr Ma y Ju n Jul Au g Se p Oct No v De c
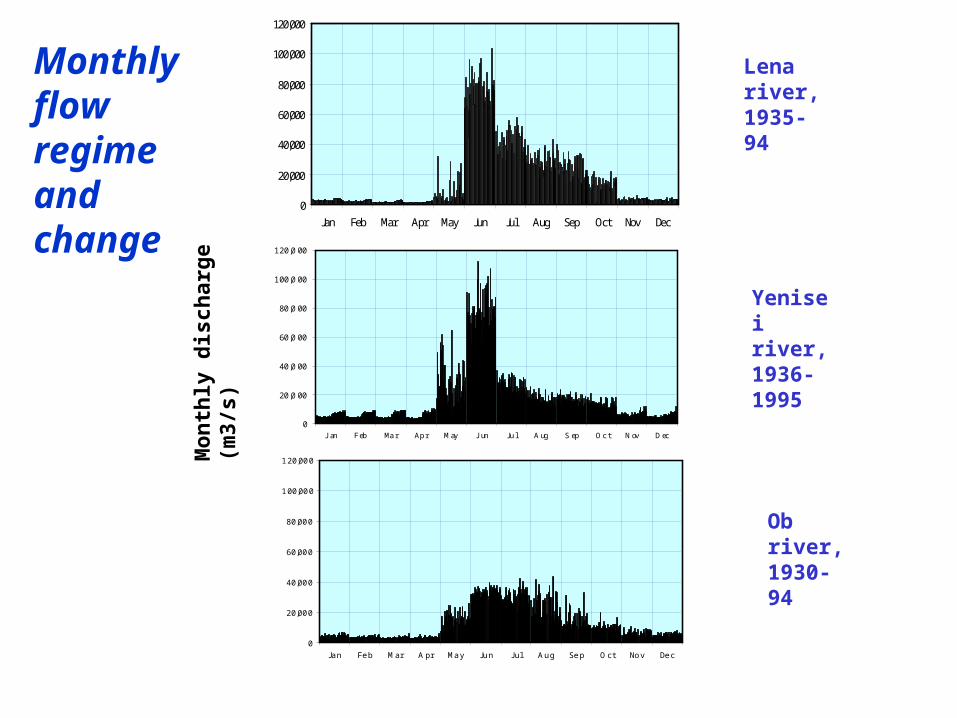
Mon
thly
dis
char
ge (
m3/
s)
Lena river, 1935-94
Yenisei river, 1936-1995
Ob river, 1930-94
Monthly flow regime and change
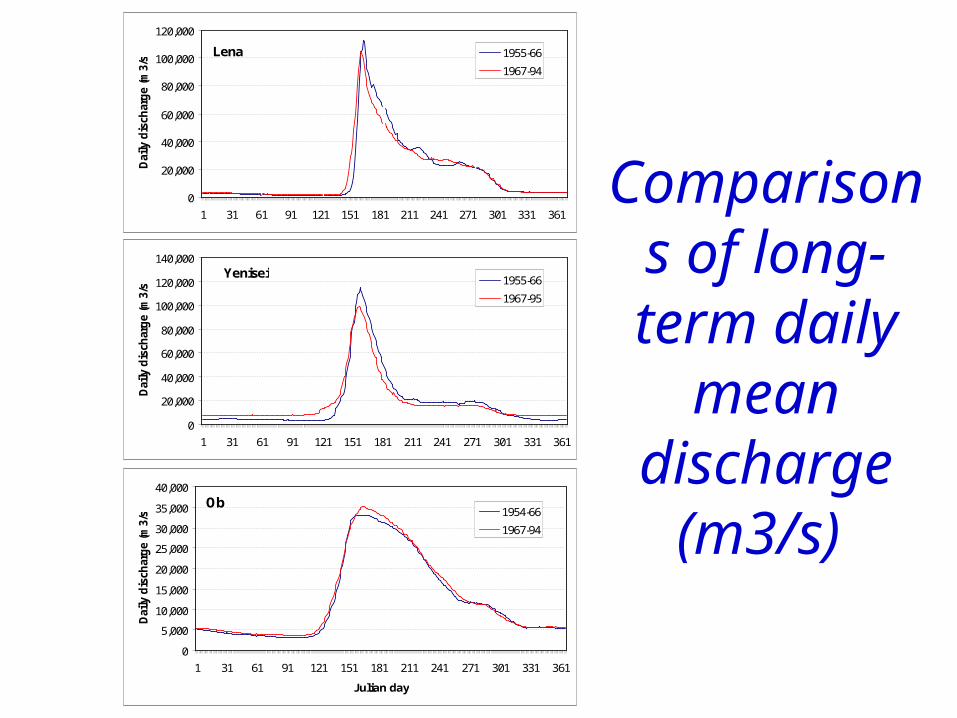
Comparisons of long-term daily mean discharge
(m3/s)
0
20,000
40,000
60,000
80,000
100,000
120,000
1 31 61 91 121 151 181 211 241 271 301 331 361
Dai
ly d
isch
arg
e (m
3/s)
1955-66
1967-94
Lena
0
20,000
40,000
60,000
80,000
100,000
120,000
140,000
1 31 61 91 121 151 181 211 241 271 301 331 361
Dai
ly d
isch
arg
e (m
3/s)
1955-66
1967-95
Yenisei
0
5,000
10,000
15,000
20,000
25,000
30,000
35,000
40,000
1 31 61 91 121 151 181 211 241 271 301 331 361
Julian day
Dai
ly d
isch
arg
e (m
3/s) 1954-66
1967-94
Ob
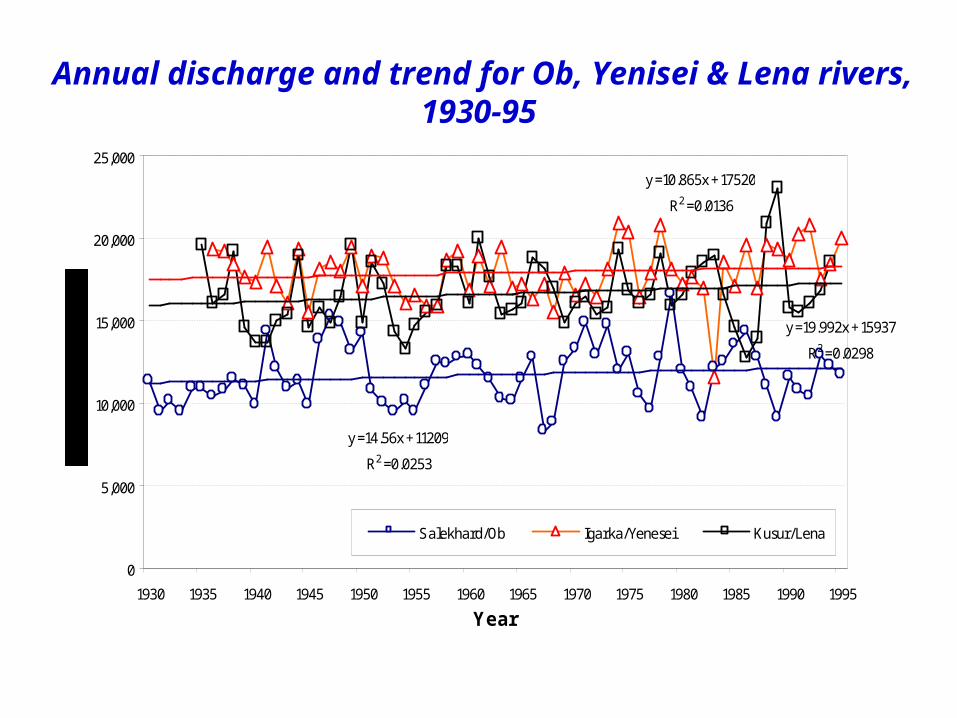
y = 14.56x + 11209
R2 = 0.0253
y = 10.865x + 17520
R2 = 0.0136
y = 19.992x + 15937
R2 = 0.0298
0
5,000
10,000
15,000
20,000
25,000
1930 1935 1940 1945 1950 1955 1960 1965 1970 1975 1980 1985 1990 1995
Year
Salekhard/Ob Igarka/Yenesei Kusur/Lena
Annual discharge and trend for Ob, Yenisei & Lena rivers, 1930-95
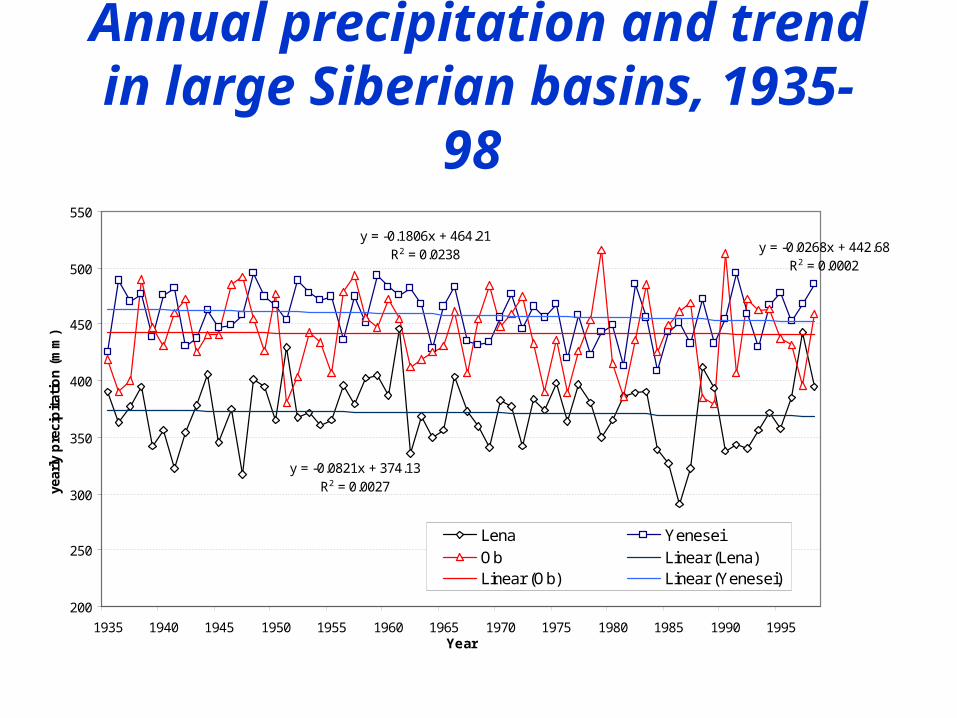
Annual precipitation and trend in large Siberian basins, 1935-98
y = -0.0821x + 374.13R2 = 0.0027
y = -0.0268x + 442.68R2 = 0.0002
y = -0.1806x + 464.21R2 = 0.0238
200
250
300
350
400
450
500
550
1935 1940 1945 1950 1955 1960 1965 1970 1975 1980 1985 1990 1995Year
year
ly p
reci
pit
atio
n (
mm
)
Lena YeneseiOb Linear (Lena)Linear (Ob) Linear (Yenesei)

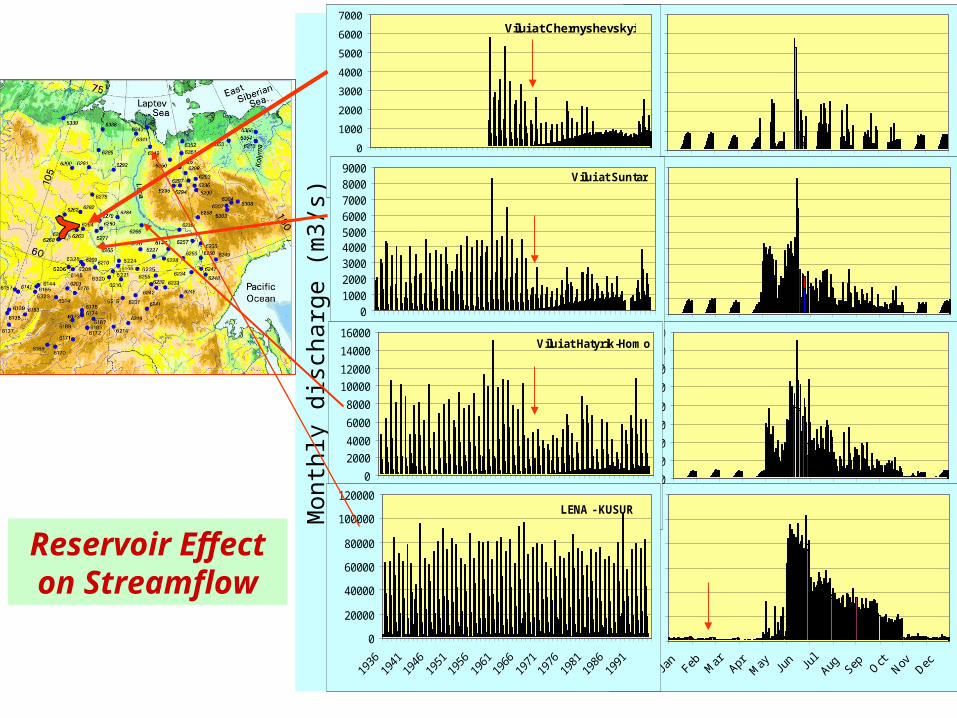
Vilui reservoir, operated in 1967,max. capacity 35.9km3, 7% Lena River total runoff
EF
D
A
B
C
H
Aldan tributary Area ----28.6% Runoff ---- 30%
Data ---1942-1990
Upper Lena basin Area ----36.9%Runoff --- 42%
Data ---1936-1990
Vilui basin Area ---18.6%Runoff ---- 9%
Data ---1936-1990
LENA – KUSUR Area ----2,430,000km2
Runoff ---523.9km3 Data ---1939-1994
G
Mon
thly
dis
char
ge (
m3/
s)
0
1000
2000
3000
4000
5000
6000
7000
Jan
Feb Mar
AprM
ay Jun Ju
lAug Sep O
ctNov Dec
010002000
3000400050006000
700080009000
0
2000
4000
6000
8000
10000
12000
14000
16000
Vilui at Chernyshevskyi
0
1000
2000
3000
4000
5000
6000
7000
1936
1941
1946
1951
1956
1961
1966
1971
1976
1981
1986
0
20000
40000
60000
80000
100000
120000
Vilui at Suntar
0100020003000400050006000700080009000
Vilui at Hatyrik-Homo
0
2000
4000
6000
8000
10000
12000
14000
16000
Reservoir Effect on Streamflow
LENA - KUSUR
0
20000
40000
60000
80000
100000
120000
Vilui at Chernyshevskyi
0
500
1,000
1,500
2,000
2,500
3,000
3,500
Jan Feb Mar Apr May Jun Jul Aug Sep Oct Nov Dec
59-67
68-90
Vilui at Suntar
0
500
1,000
1,500
2,000
2,500
3,000
3,500
4,000
Jan Feb Mar Apr May Jun Jul Aug Sep Oct Nov Dec
42-67
68-90
Vilui at Hatyrik-Homo
01,000
2,0003,000
4,0005,000
6,0007,000
8,0009,000
Jan Feb Mar Apr May Jun Jul Aug Sep Oct Nov Dec
42-67
68-90
LENA - KUSUR
0
10,000
20,000
30,000
40,000
50,000
60,000
70,000
80,000
Jan Feb Mar Apr May Jun Jul Aug Sep Oct Nov Dec
43-67
68-90
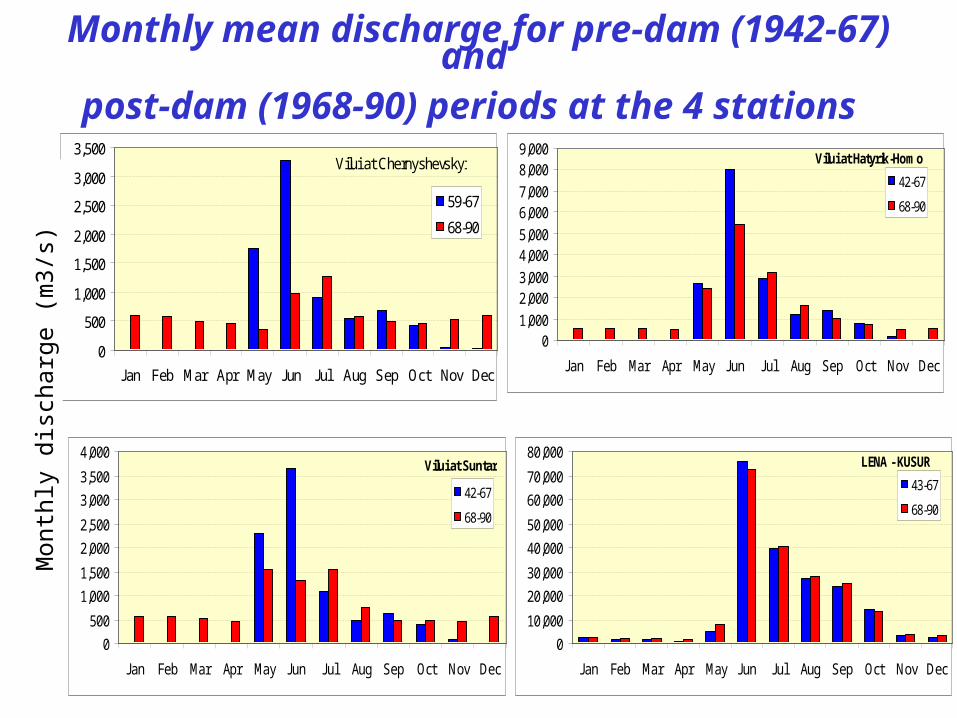
Monthly mean discharge for pre-dam (1942-67) and post-dam (1968-90) periods at the 4 stations
Mon
thly
dis
char
ge (
m3/
s)
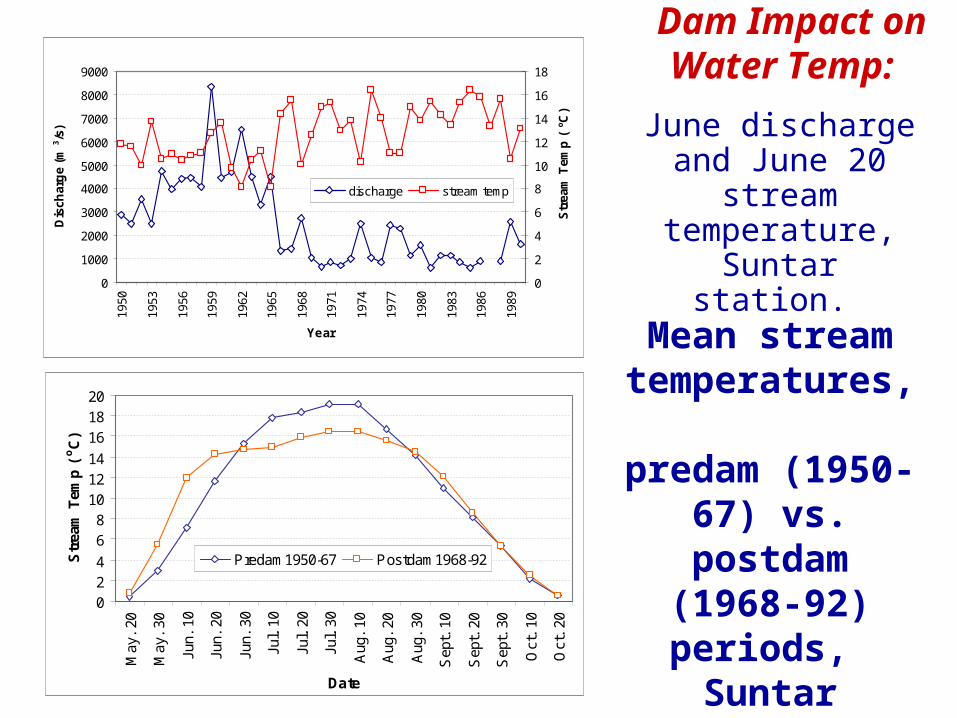
Mean stream temperatures,
predam (1950-67) vs. postdam (1968-
92) periods, Suntar station.
June discharge and June 20
stream temperature,
Suntar station. 0
1000
2000
3000
4000
5000
6000
7000
8000
9000
1950
1953
1956
1959
1962
1965
1968
1971
1974
1977
1980
1983
1986
1989
Year
Dis
char
ge
(m3/s
)
0
2
4
6
8
10
12
14
16
18
Str
eam
Tem
p (
oC
)
discharge stream temp
024
68
101214
161820
May
. 20
May
. 30
Jun.
10
Jun.
20
Jun.
30
Jul.
10
Jul.
20
Jul.
30
Aug
. 10
Aug
. 20
Aug
. 30
Sep
t. 1
0
Sep
t. 2
0
Sep
t. 3
0
Oct
. 10
Oct
. 20
Date
Str
eam
Tem
p (
oC
)
Predam1950-67 Postdam1968-92
Dam Impact on Water Temp:
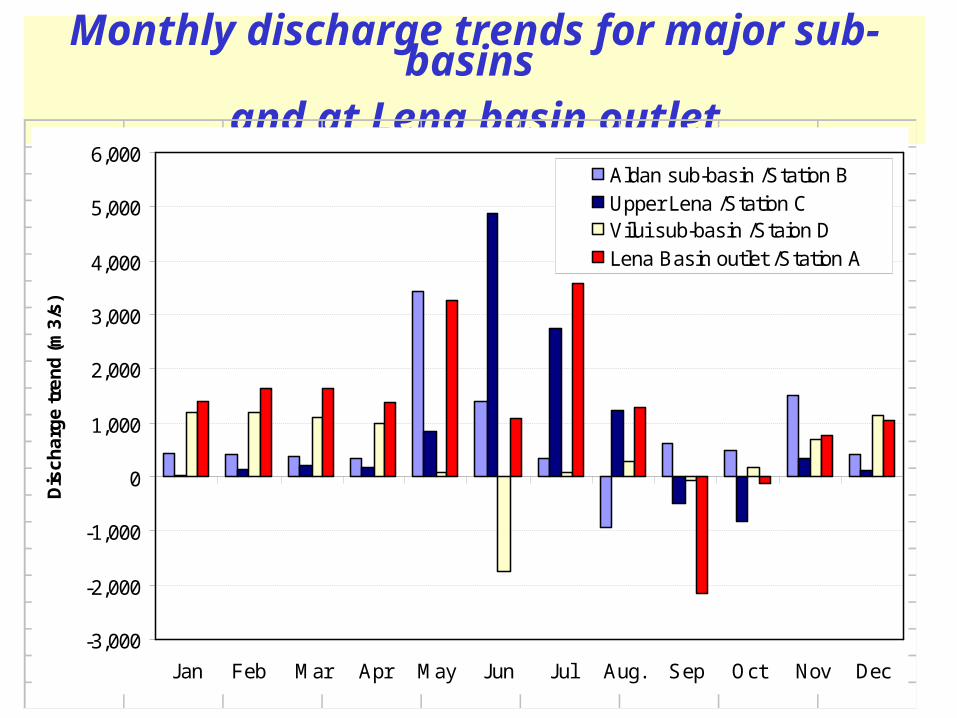
Monthly discharge trends for major sub-basins and at Lena basin outlet
-3,000
-2,000
-1,000
0
1,000
2,000
3,000
4,000
5,000
6,000
Jan Feb Mar Apr May Jun Jul Aug. Sep Oct Nov Dec
Dis
ch
arg
e t
ren
d (
m3
/s)
Aldan sub-basin /Station BUpper Lena /Station CVilui sub-basin /Staion DLena Basin outlet /Station A
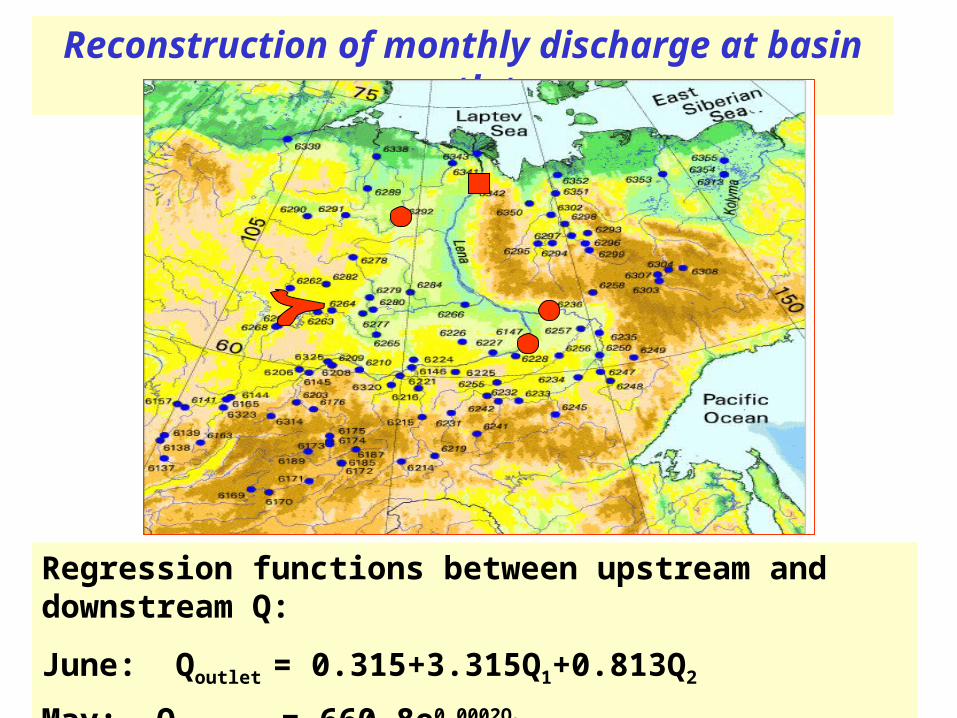
Reconstruction of monthly discharge at basin outlet
Regression functions between upstream and downstream Q:
June: Qoutlet = 0.315+3.315Q1+0.813Q2
May: Qoutlet = 660.8e0.0002Q2
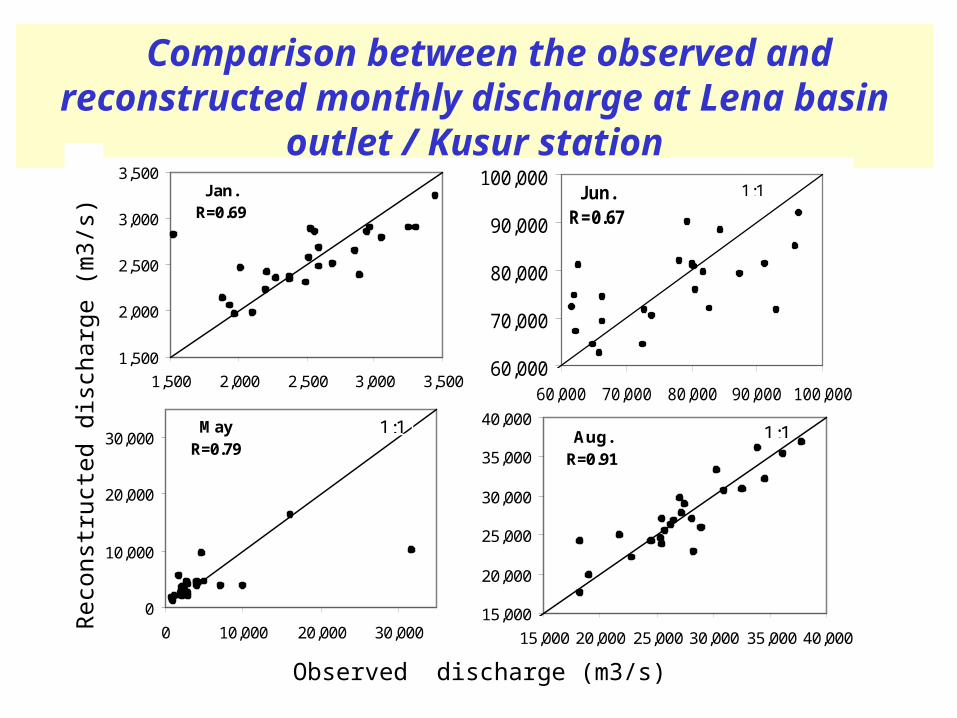
Comparison between the observed and reconstructed monthly discharge at Lena basin outlet / Kusur station
Jan.R=0.69
1,500
2,000
2,500
3,000
3,500
1,500 2,000 2,500 3,000 3,500
MayR=0.79
0
10,000
20,000
30,000
0 10,000 20,000 30,000
1:1
Jun.R=0.67
60,000
70,000
80,000
90,000
100,000
60,000 70,000 80,000 90,000 100,000
1:1
Aug.R=0.91
15,000
20,000
25,000
30,000
35,000
40,000
15,000 20,000 25,000 30,000 35,000 40,000
1:1
Rec
onst
ruct
ed d
isch
arge
(m
3/s)
Observed discharge (m3/s)

1,000
2,000
3,000
4,000
5,000
1935 1945 1955 1965 1975 1985 1995
Jan
Comparison between observed and reconstructed monthly discharge at the Lena basin outlet, 1942-90
30,000
50,000
70,000
90,000
110,000
1935 1945 1955 1965 1975 1985 1995
Observation reconstructed
Jun
Mon
thly
dis
char
ge (
m3/
s)
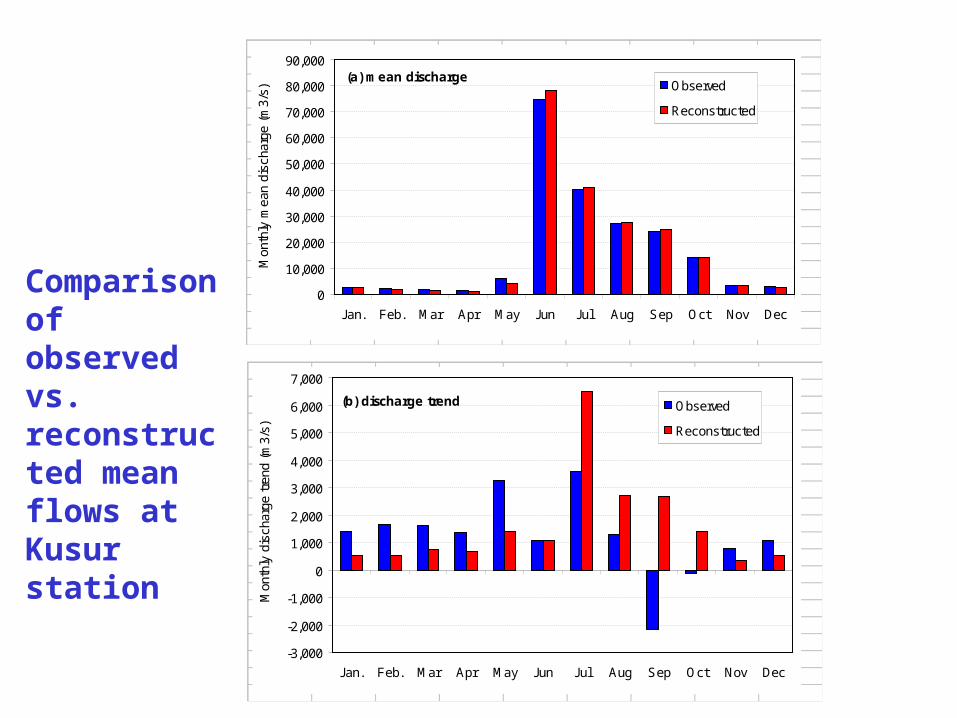
(a) mean discharge
0
10,000
20,000
30,000
40,000
50,000
60,000
70,000
80,000
90,000
Jan. Feb. Mar Apr May Jun Jul Aug Sep Oct Nov Dec
Mon
thly
mea
n di
scha
rge
(m3/
s)
Observed
Reconstructed
(b) discharge trend
-3,000
-2,000
-1,000
0
1,000
2,000
3,000
4,000
5,000
6,000
7,000
Jan. Feb. Mar Apr May Jun Jul Aug Sep Oct Nov Dec
Mon
thly
dis
char
ge t
rend
(m
3/s)
Observed
Reconstructed
Comparison of observed vs. reconstructed mean flows at Kusur station

Comparisons of annual discharge and its trend,
observed vs. reconstructed, Lena basin outlet
12,000
14,000
16,000
18,000
20,000
22,000
24,000
1940 1945 1950 1955 1960 1965 1970 1975 1980 1985 1990 1995 2000
Year
Ann
ual D
isch
arge
(m
3/s)
Observed Reconstructed
Linear (Observed) Linear (Reconstructed)

A
FED
C
HG
IJ
K
ML
NB
A Reservoir

Related Documents