(byAr ANJd AlkAcdeg STREAM-TEMPERATURE CHARACTERISTICS IN GEORGIA By T.R. Dyar and S.J. Alhadeff NO~ 7 , ýJ F U.S. GEOLOGICAL SURVEY Water-Resources Investigations Report 96-4203 Prepared in cooperation with GEORGIA DEPARTMENT OF NATURAL RESOURCES ENVIRONMENTAL PROTECTION DIVISION Atlanta, Georgia 1997 )G?ý,T 0 + 4) PA3es

Welcome message from author
This document is posted to help you gain knowledge. Please leave a comment to let me know what you think about it! Share it to your friends and learn new things together.
Transcript
(byAr ANJd AlkAcdeg
STREAM-TEMPERATURECHARACTERISTICS IN GEORGIA
By T.R. Dyar and S.J. Alhadeff
NO~7 , ýJ F
U.S. GEOLOGICAL SURVEY
Water-Resources Investigations Report 96-4203
Prepared in cooperation with
GEORGIA DEPARTMENT OF NATURAL RESOURCESENVIRONMENTAL PROTECTION DIVISION
Atlanta, Georgia1997
)G?ý,T 0+ 4) PA3es
U.S. DEPARTMENT OF THE INTERIOR
BRUCE BABBITT, Secretary
U.S. GEOLOGICAL SURVEY
Charles G. Groat, Director
For additional information write to:
District ChiefU.S. Geological Survey3039 Amwiler Road, Suite 130Peachtree Business CenterAtlanta, GA 30360-2824
Copies of this report can be purchased from:
U.S. Geological SurveyBranch of Information ServicesDenver Federal CenterBox 25286Denver, CO 80225-0286
CONTENTS
Page
A b stract . . .. . . .. . . .. . . . . .. . . . . .. . . . .. . . .. . .. .. . . .. . .. . . . .. . . .. . . .. . . . .. . . .. . .. .. . .. . .. . . . . .. . 1Introdu ction ................... ................................................................ 1
Purpose and scope ........................................................................ 2Previous investigations ..................................................................... 2Station-identification system ................................................................ 3Stream -tem perature data ................................................................... 3
Long-term stream-temperature characteristics ........................................................ 6Natural stream -temperature characteristics ..................................................... 7R egression analysis ....................................................................... 7
Harm onic m ean coeffi cient ............................................................ 7A m plitude coefficient ................................................................ 10Phase coefficient ................................................................... 13
Statew ide harm onic equation ............................................................... 13Examples of estimating natural stream-temperature characteristics ................................ 15
P anther C reek ..................................................................... 15W est A rm uchee Creek .............................................................. 15A lcovy R iver ..................................................................... 18A ltam aha R iver ................................................................... 18
Summary of stream-temperature characteristics by river basin ......................................... 19Savannah R iver basin ..................................................................... 19O geechee R iver basin ..................................................................... 25A ltam aha R iver basin ..................................................................... 25Satilla-St M arys River basins ............................................................... 26Suwannee-Ochlockonee River basins ........................................................ 27Chattahoochee River basin ................................................................. 27F lint R iver b asin ......................................................................... 28C oosa R iver basin ........................................................................ 29Tennessee R iver basin .................................................................... 31
Selected references ............................................................................ 31T abu lar data ............ ..................... .... .................................. .......... 33Graphs showing harmonic stream-temperature curves of observed data and statewide harmonic
equation for selected stations, figures 14-211 ..................................................... 51
iii
ILLUSTRATIONSPage
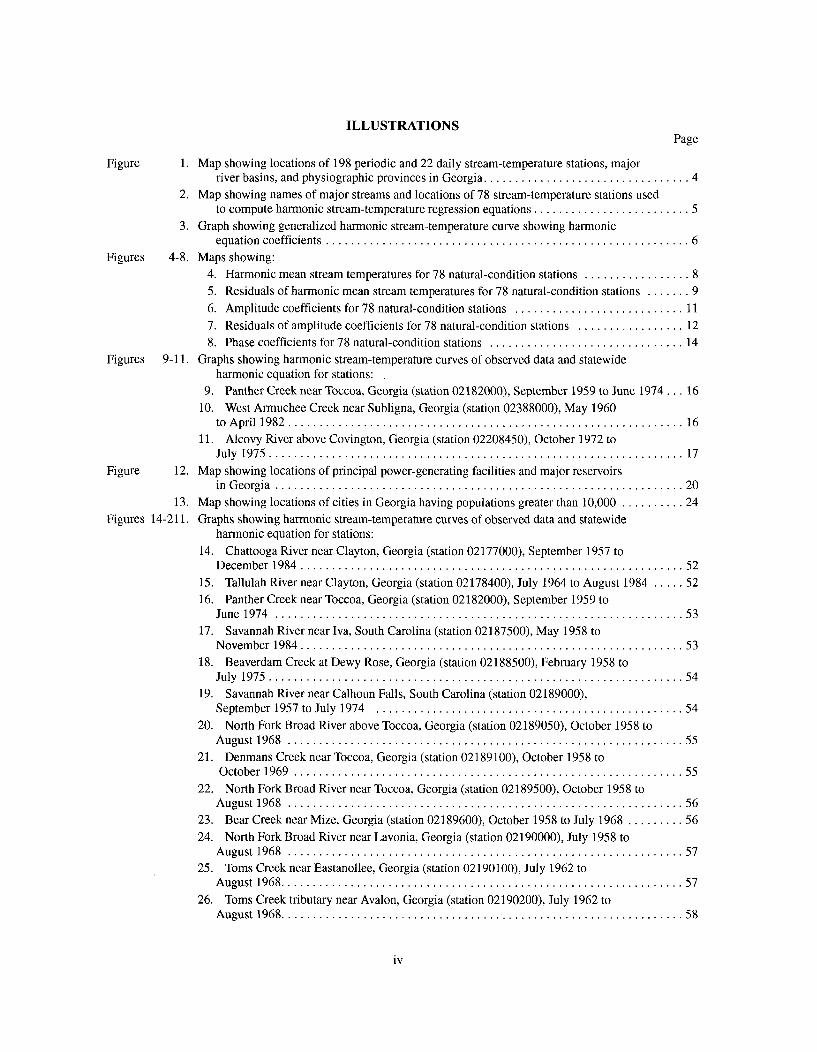
Figure 1. Map showing locations of 198 periodic and 22 daily stream-temperature stations, majorriver basins, and physiographic provinces in Georgia ................................. 4
2. Map showing names of major streams and locations of 78 stream-temperature stations usedto compute harmonic stream-temperature regression equations ......................... 5
3. Graph showing generalized harmonic stream-temperature curve showing harmonicequation coeffi cients .......................................................... 6
Figures 4-8. Maps showing:4. Harmonic mean stream temperatures for 78 natural-condition stations ................. 85. Residuals of harmonic mean stream temperatures for 78 natural-condition stations ....... 9
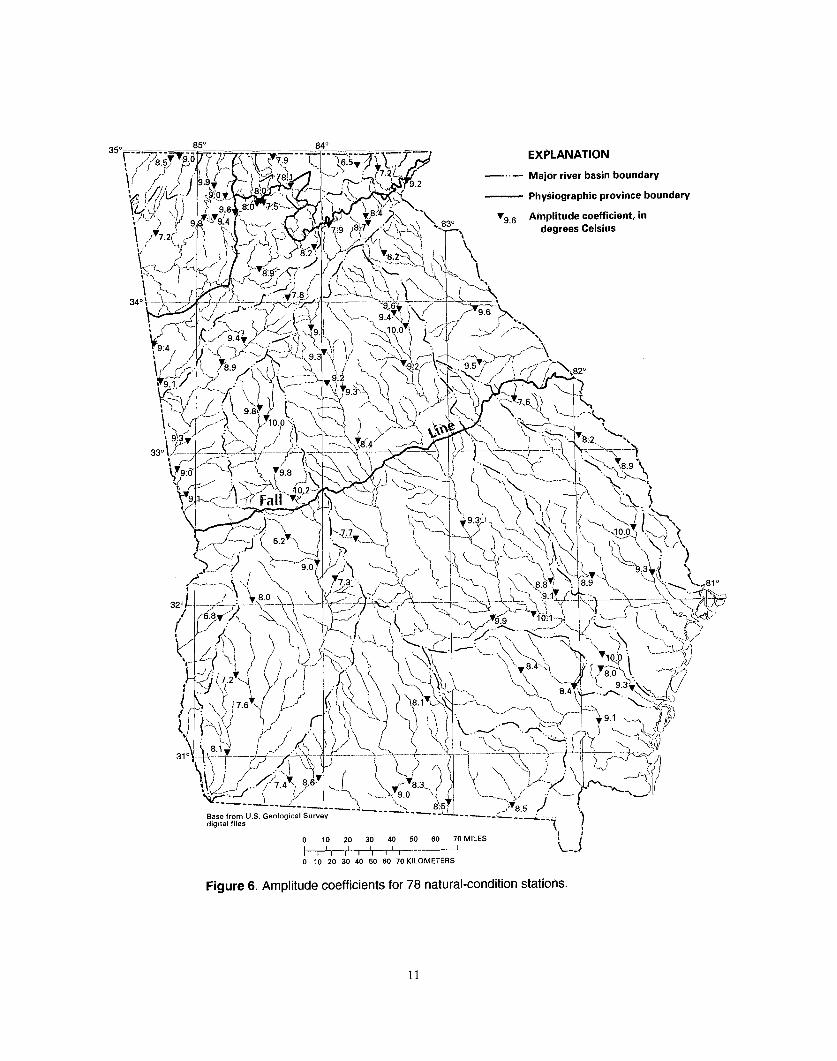
6. Amplitude coefficients for 78 natural-condition stations ........................... 11
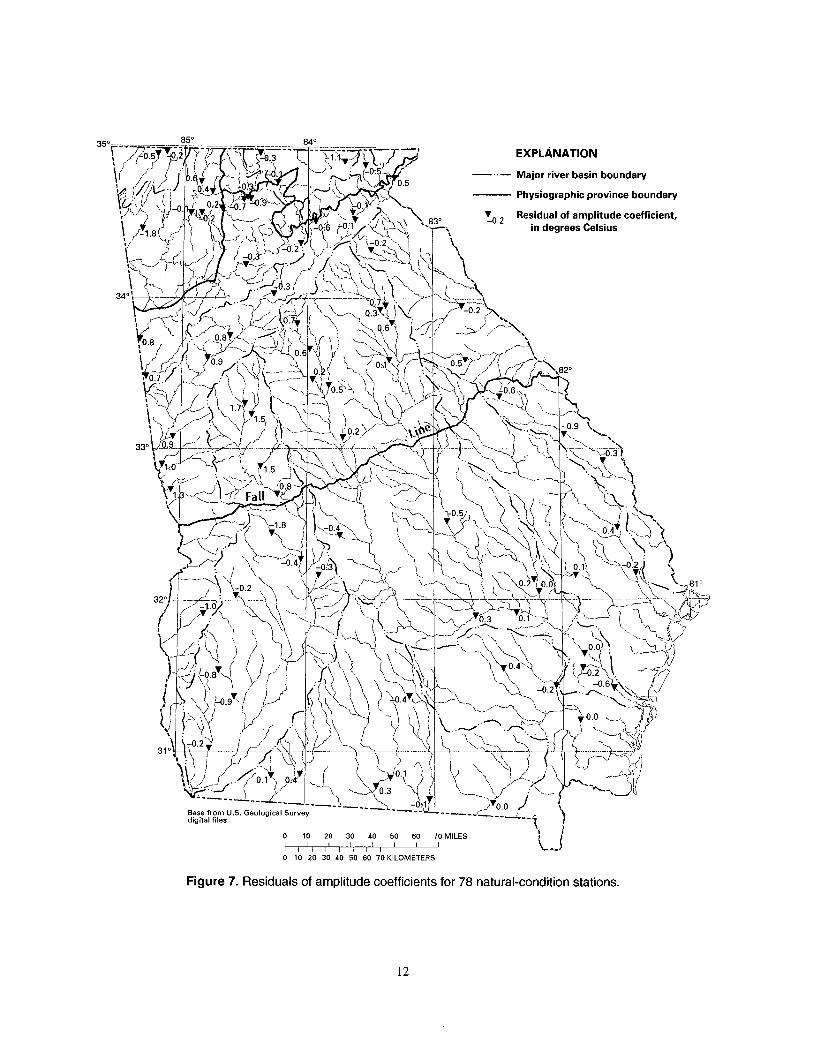
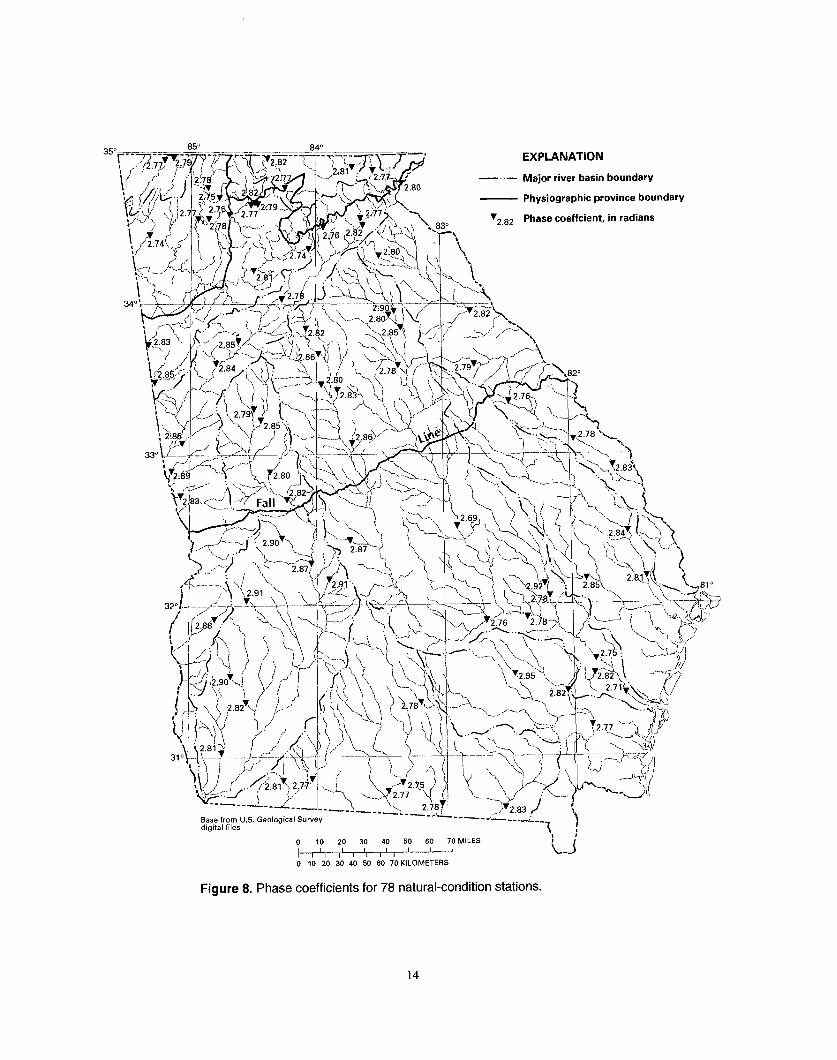
7. Residuals of amplitude coefficients for 78 natural-condition stations ................. 128. Phase coefficients for 78 natural-condition stations ............................... 14
Figures 9-11. Graphs showing harmonic stream-temperature curves of observed data and statewideharmonic equation for stations:
9. Panther Creek near Toccoa, Georgia (station 02182000), September 1959 to June 1974... 16
10. West Armuchee Creek near Subligna, Georgia (station 02388000), May 1960to A pril 1982 ............................................................... 16
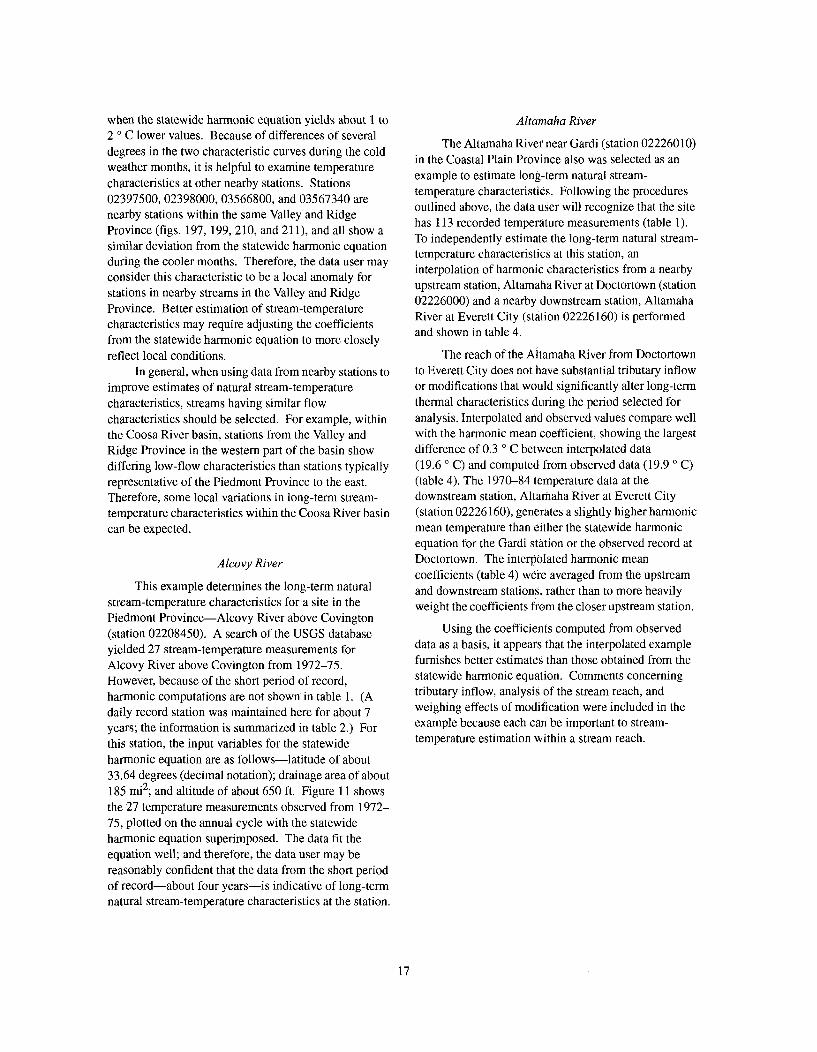
11. Alcovy River above Covington, Georgia (station 02208450), October 1972 toJuly 1975 .................................................................. 17
Figure 12. Map showing locations of principal power-generating facilities and major reservoirsin G eorgia ................................................................. 20
13. Map showing locations of cities in Georgia having populations greater than 10,000 .......... 24
Figures 14-211. Graphs showing harmonic stream-temperature curves of observed data and statewideharmonic equation for stations:
14. Chattooga River near Clayton, Georgia (station 02177000), September 1957 toD ecem ber 1984 ............................................................. 52
15. Tallulah River near Clayton, Georgia (station 02178400), July 1964 to August 1984 ..... 5216. Panther Creek near Toccoa, Georgia (station 02182000), September 1959 to
June 1974 ................................................................. 5317. Savannah River near Iva, South Carolina (station 02187500), May 1958 to
N ovem ber 1984 ............................................................. 5318. Beaverdam Creek at Dewy Rose, Georgia (station 02188500), February 1958 to
Ju ly 1975 ........ .......... ..................... ............. ........... ... 5419. Savannah River near Calhoun Falls, South Carolina (station 02189000),
Septem ber 1957 to July 1974 ................................................. 5420. North Fork Broad River above Toccoa, Georgia (station 02189050), October 1958 to
A ugust 1968 ............................................................... 5521. Denmans Creek near Toccoa, Georgia (station 02189100), October 1958 to
O ctober 1969 .............................................................. 5522. North Fork Broad River near Toccoa, Georgia (station 02189500), October 1958 to
A ugust 1968 ............................................................... 5623. Bear Creek near Mize, Georgia (station 02189600), October 1958 to July 1968 ......... 5624. North Fork Broad River near Lavonia, Georgia (station 02190000), July 1958 to
A ugust 1968 ............................................................... 5725. Toms Creek near Eastanollee, Georgia (station 02190100), July 1962 to
A ugust 1968 ................................................................ 5726. Toms Creek tributary near Avalon, Georgia (station 02190200), July 1962 to
A ugust 1968 ................................................................ 58
iv
Figures 14-211.
Figure
ILLUSTRATIONS-ContinuedPage
Graphs showing harmonic stream-temperature curves of observed data and statewideharmonic equation for stations:-Continued
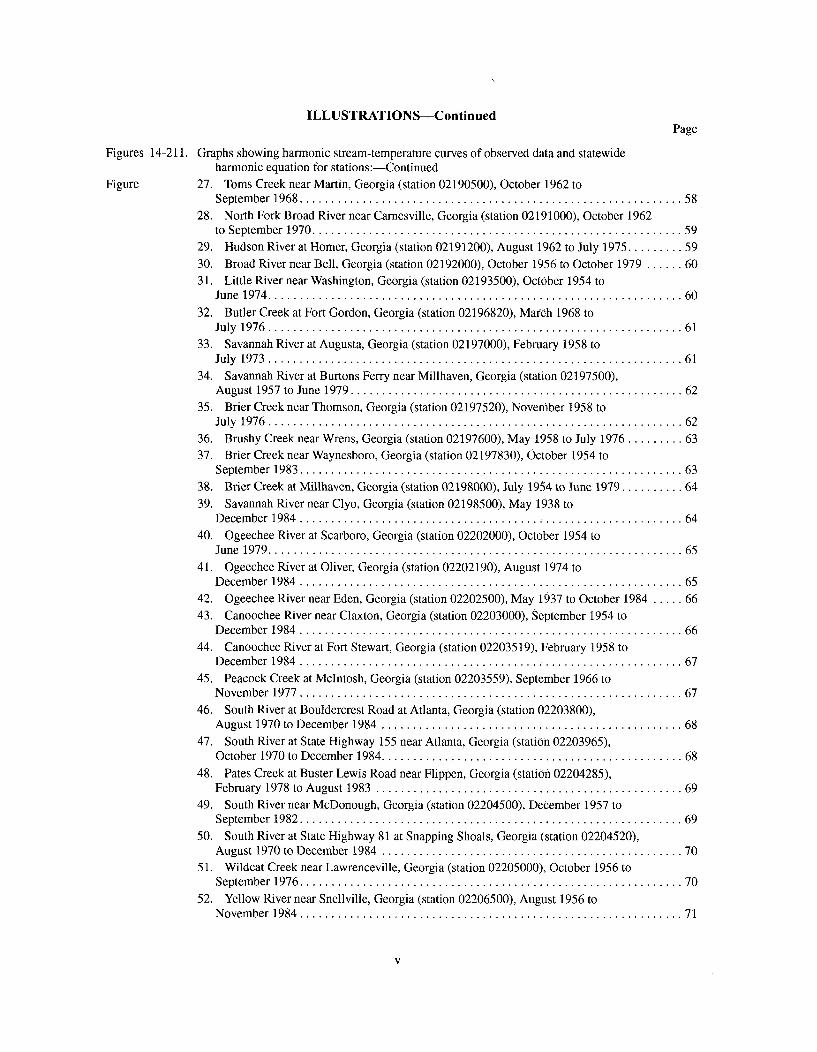
27. Toms Creek near Martin, Georgia (station 02190500), October 1962 toSeptem ber 1968 ............................................................. 58
28. North Fork Broad River near Camesville, Georgia (station 02191000), October 1962to Septem ber 1970 .................................... ...................... 59
29. Hudson River at Homer, Georgia (station 02191200), August 1962 to July 1975 ......... 5930. Broad River near Bell, Georgia (station 02192000), October 1956 to October 1979 ...... 6031. Little River near Washington, Georgia (station 02193500), October 1954 to
Ju ne 1974 ............... .................................. ................. 6032. Butler Creek at Fort Gordon, Georgia (station 02196820), March 1968 to
Ju ly 197 6 ........ .......... ..................... ............. .............. 6 133. Savannah River at Augusta, Georgia (station 02197000), February 1958 to
Ju ly 1973 ........ .......................................................... 6 134. Savannah River at Burtons Ferry near Millhaven, Georgia (station 02197500),
A ugust 1957 to June 1979 ..................................................... 6235. Brier Creek near Thomson, Georgia (station 02197520), November 1958 to
July 197 6 ............................ .... .................................. 6236. Brushy Creek near Wrens, Georgia (station 02197600), May 1958 to July 1976 ......... 6337. Brier Creek near Waynesboro, Georgia (station 02197830), October 1954 to
Septem ber 1983 ............................................................. 6338. Brier Creek at Millhaven, Georgia (station 02198000), July 1954 to June 1979 .......... 6439. Savannah River near Clyo, Georgia (station 02198500), May 1938 to
D ecem ber 1984 ...................................... ...................... 6440. Ogeechee River at Scarboro, Georgia (station 02202000), October 1954 to
Ju ne 1979 ......................... ......................................... 6541. Ogeechee River at Oliver, Georgia (station 02202190), August 1974 to
D ecem ber 1984 ............................................................. 6542. Ogeechee River near Eden, Georgia (station 02202500), May 1937 to October 1984 ..... 6643. Canoochee River near Claxton, Georgia (station 02203000), September 1954 to
D ecem ber 1984 ............................................................. 6644. Canoochee River at Fort Stewart, Georgia (station 02203519), February 1958 to
D ecem ber 1984 ...................................... ...................... 6745. Peacock Creek at McIntosh, Georgia (station 02203559), September 1966 to
N ovem ber 1977 ............................................................. 6746. South River at Bouldercrest Road at Atlanta, Georgia (station 02203800),
August 1970 to December 1984 ................................................ 6847. South River at State Highway 155 near Atlanta, Georgia (station 02203965),
October 1970 to December 1984 ................................................ 6848. Pates Creek at Buster Lewis Road near Flippen, Georgia (station 02204285),
February 1978 to August 1983 ................................................. 6949. South River near McDonough, Georgia (station 02204500), December 1957 to
Septem ber 1982 ............................................................. 6950. South River at State Highway 81 at Snapping Shoals, Georgia (station 02204520),
August 1970 to December 1984 ................................................ 7051. Wildcat Creek near Lawrenceville, Georgia (station 02205000), October 1956 to
Septem ber 1976 ............................................................. 7052. Yellow River near Snellville, Georgia (station 02206500), August 1956 to
N ovem ber 1984 ............................................................. 71
v
Figures 14-211.
ILLUSTRATIONS-ContinuedPage
Graphs showing harmonic stream-temperature curves of observed data and statewideharmonic equation for stations:-Continued
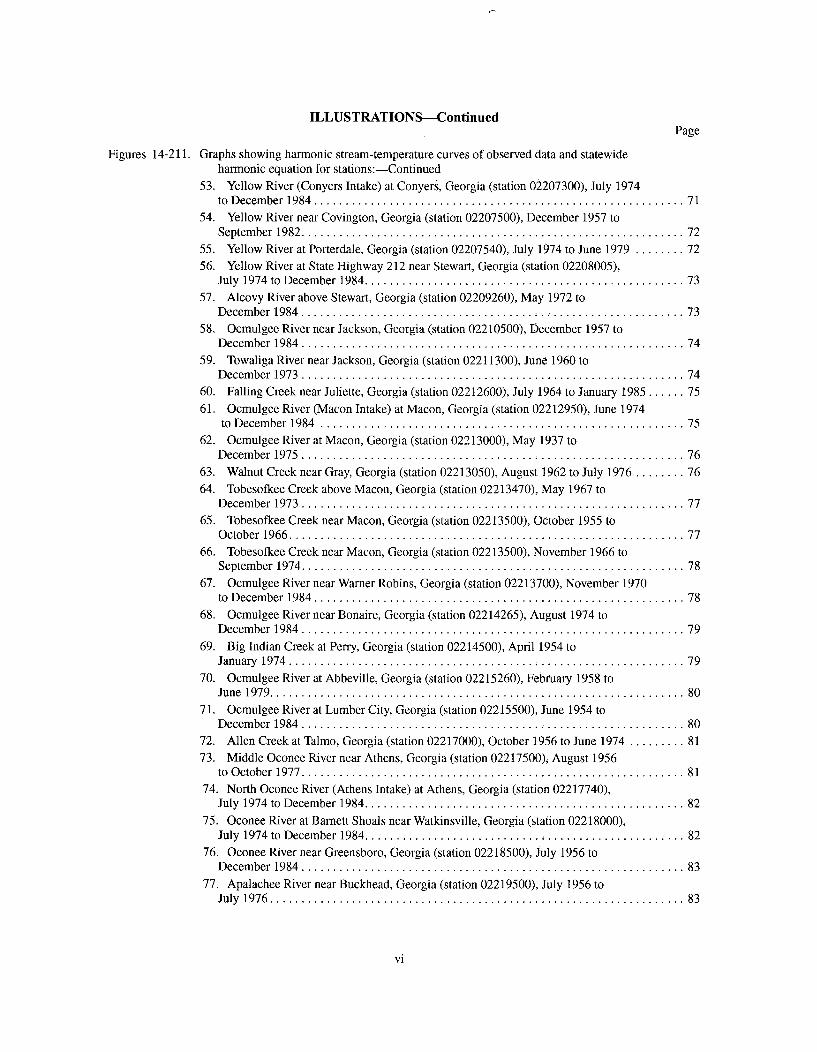
53. Yellow River (Conyers Intake) at Conyers, Georgia (station 02207300), July 1974to D ecem ber 1984 ........................................................... 71
54. Yellow River near Covington, Georgia (station 02207500), December 1957 toSeptem ber 1982 ............................................................. 72
55. Yellow River at Porterdale, Georgia (station 02207540), July 1974 to June 1979 ........ 7256. Yellow River at State Highway 212 near Stewart, Georgia (station 02208005),
July 1974 to Decem ber 1984 ................................................... 7357. Alcovy River above Stewart, Georgia (station 02209260), May 1972 to
D ecem ber 1984 ............................................................. 7358. Ocmulgee River near Jackson, Georgia (station 02210500), December 1957 to
D ecem ber 1984 ............................................................. 7459. Towaliga River near Jackson, Georgia (station 02211300), June 1960 to
D ecem ber 1973 ............................................................. 7460. Falling Creek near Juliette, Georgia (station 02212600), July 1964 to January 1985 ...... 7561. Ocmulgee River (Macon Intake) at Macon, Georgia (station 02212950), June 1974
to D ecem ber 1984 .......................................................... 7562. Ocmulgee River at Macon, Georgia (station 02213000), May 1937 to
D ecem ber 1975 ..................................... ....................... 7663. Walnut Creek near Gray, Georgia (station 02213050), August 1962 to July 1976 ........ 7664. Tobesofkee Creek above Macon, Georgia (station 02213470), May 1967 to
D ecem ber 1973 ............................................................. 7765. Tobesofkee Creek near Macon, Georgia (station 02213500), October 1955 to
O ctober 1966 ............................................................... 7766. Tobesofkee Creek near Macon, Georgia (station 02213500), November 1966 to
Septem ber 1974 ............................................................. 7867. Ocmulgee River near Warner Robins, Georgia (station 02213700), November 1970
to D ecem ber 1984 ........................................................... 7868. Ocmulgee River near Bonaire, Georgia (station 02214265), August 1974 to
D ecem ber 1984 ............................................................. 7969. Big Indian Creek at Perry, Georgia (station 02214500), April 1954 to
January 1974 ....................................... ....................... 7970. Ocmulgee River at Abbeville, Georgia (station 02215260), February 1958 to
Ju ne 197 9 ........ .......... .................................. .............. 8071. Ocmulgee River at Lumber City, Georgia (station 02215500), June 1954 to
D ecem ber 1984 ...................................... ...................... 8072. Allen Creek at Talmo, Georgia (station 02217000), October 1956 to June 1974 ......... 8173. Middle Oconee River near Athens, Georgia (station 02217500), August 1956
to O ctober 1977 ............................................................. 8174. North Oconee River (Athens Intake) at Athens, Georgia (station 02217740),
July 1974 to Decem ber 1984 ................................................... 8275. Oconee River at Barnett Shoals near Watkinsville, Georgia (station 02218000),
July 1974 to D ecem ber 1984 ............................ ...................... 8276. Oconee River near Greensboro, Georgia (station 02218500), July 1956 to
D ecem ber 1984 ............................................................. 8377. Apalachee River near Buckhead, Georgia (station 02219500), July 1956 to
July 1976 .................................................... .............. 83
vi
ILLUSTRATIONS-ContinuedPage
Figures 14-211. Graphs showing harmonic stream-temperature curves of observed data and statewide regressionequation for stations:
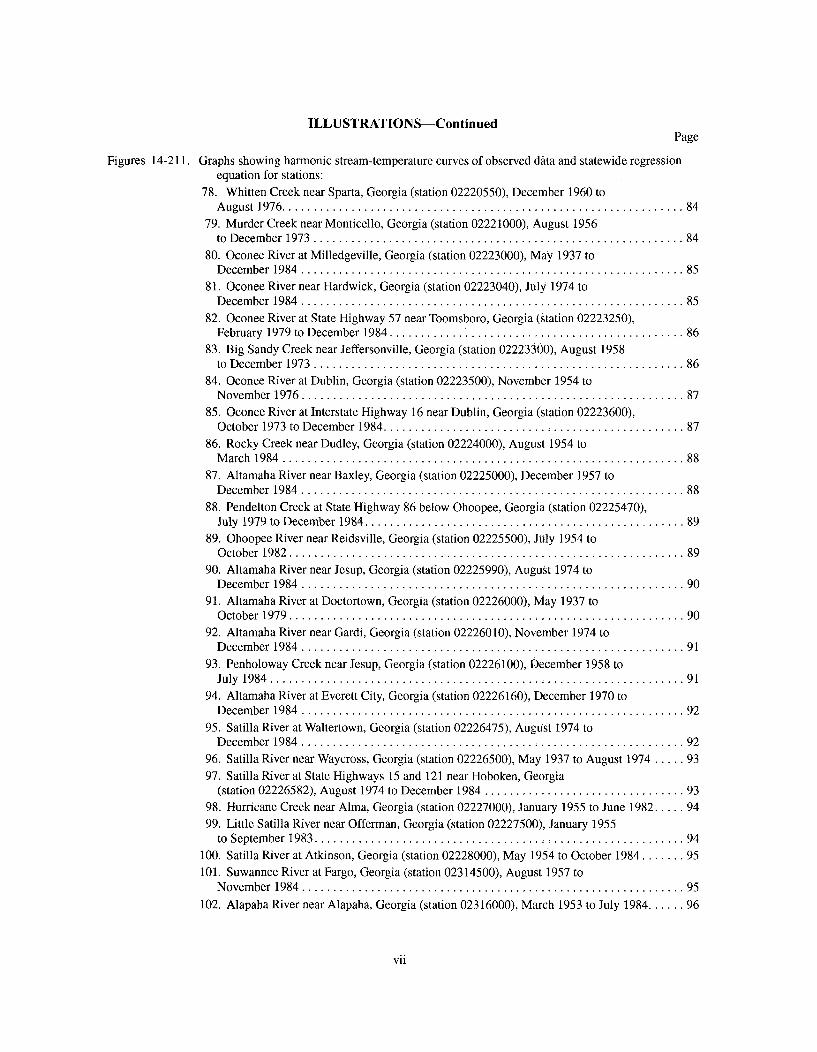
78. Whitten Creek near Sparta, Georgia (station 02220550), December 1960 toA ugust 1976 ................................................................ 84
79. Murder Creek near Monticello, Georgia (station 02221000), August 1956to D ecem ber 1973 .................................... ...................... 84
80. Oconee River at Milledgeville, Georgia (station 02223000), May 1937 toD ecem ber 1984 ............................................................. 85
81. Oconee River near Hardwick, Georgia (station 02223040), July 1974 toD ecem ber 1984 ............................................................. 85
82. Oconee River at State Highway 57 near Toomsboro, Georgia (station 02223250),February 1979 to December 1984 ....................................... 86
83. Big Sandy Creek near Jeffersonville, Georgia (station 02223300), August 1958to D ecem ber 1973 ........................................................... 86
84. Oconee River at Dublin, Georgia (station 02223500), November 1954 toN ovem ber 1976 ............................................................. 87
85. Oconee River at Interstate Highway 16 near Dublin, Georgia (station 02223600),October 1973 to December 1984 .......................... ..................... 87
86. Rocky Creek near Dudley, Georgia (station 02224000), August 1954 toM arch 1984 ................................................................ 88
87. Altamaha River near Baxley, Georgia (station 02225000), December 1957 toD ecem ber 1984 ............................................................. 88
88. Pendelton Creek at State Highway 86 below Ohoopee, Georgia (station 02225470),July 1979 to December 1984 ................................................... 89
89. Ohoopee River near Reidsville, Georgia (station 02225500), July 1954 toO ctober 1982 ............................................................... 89
90. Altamaha River near Jesup, Georgia (station 02225990), August 1974 toD ecem ber 1984 ............................................................. 90
91. Altamaha River at Doctortown, Georgia (station 02226000), May 1937 toO ctober 1979 ....................................... ....................... 90
92. Altamaha River near Gardi, Georgia (station 02226010), November 1974 toD ecem ber 1984 ............................................................. 91
93. Penholoway Creek near Jesup, Georgia (station 02226100), December 1958 toJu ly 1984 ........ .......... ..................... ... . ...................... 9 1
94. Altamaha River at Everett City, Georgia (station 02226160), December 1970 toD ecem ber 1984 ..................................... ....................... 92
95. Satilla River at Waltertown, Georgia (station 02226475), August 1974 toD ecem ber 1984 ..................................... ....................... 92
96. Satilla River near Waycross, Georgia (station 02226500), May 1937 to August 1974 ..... 9397. Satilla River at State Highways 15 and 121 near Hoboken, Georgia
(station 02226582), August 1974 to December 1984 ................................ 9398. Hurricane Creek near Alma, Georgia (station 02227000), January 1955 to June 1982 ..... 9499. Little Satilla River near Offerman, Georgia (station 02227500), January 1955
to Septem ber 1983 ........................................................... 94100. Satilla River at Atkinson, Georgia (station 02228000), May 1954 to October 1984 ....... 95101. Suwannee River at Fargo, Georgia (station 02314500), August 1957 to
N ovem ber 1984 ............................................................. 95102. Alapaha River near Alapaha, Georgia (station 02316000), March 1953 to July 1984 ...... 96
vii
Figures 14-211.
ILLUSTRATIONS-ContinuedPage
Graphs showing harmonic stream-temperature curves of observed data and statewideregression equation for stations-Continued
103. Alapaha River at Statenville, Georgia (station 02317500), January 1954 toA ugu st 1974 ................................................................ 96
104. New River at U.S. Highway 82 near Tifton, Georgia (station 02317718), July 1979to D ecem ber 1984 ........................................................... 97
105. Withlacoochee River near Valdosta, Georgia (station 02317749), November 1974to D ecem ber 1984 ........................................................... 97
106. Withlacoochee River at State Highway 94 near Valdosta, Georgia (station02317757), November 1974 to December 1984 .............. ..................... 98
107. Little River at U.S. Highway 82 near Tifton, Georgia (station 02317800),A ugust 1977 to June 1982 ............................. ....................... 98
108. Little River near Adel, Georgia (station 02318000), October 1955 to March 1961 ........ 99
109. Little River near Adel, Georgia (station 02318000), April 1961 to July 1974 ............ 99110. Withlacoochee River near Quitman, Georgia (station 02318500), August 1957
to D ecem ber 1984 .......................................................... 100
111. Okapilco Creek at U.S. Highway 84 at Quitman, Georgia (station 02318725),November 1974 to December 1984 ............................................. 100
112. Withlacoochee River near Clyattville, Georgia (station 02318960), November 1974 toD ecem ber 1984 ............................................................ 101
113. Ochlockonee River near Moultrie, Georgia (station 02327205), July 1979 toD ecem ber 1984 ............................................................ 101
114. Ochlockonee River near Thomasville, Georgia (station 02327500), April 1954 toD ecem ber 1984 ............................................................ 102
115. Tired Creek near Cairo, Georgia (station 02328000), May 1954 to July 1974 .......... 102116. Ochlockonee River near Calvary, Georgia (station 02328200), August 1974 to
D ecem ber 1984 ....................................... .................... 103117. Chattahoochee River near Leaf, Georgia (station 02331000), September 1957 to
A ugust 1976 ............................................................... 103118. Chattahoochee River near Cornelia, Georgia (station 02331600), February 1968 to
N ovem ber 1984 ..................................... ...................... 104119. Chestatee River at State Highway 52 near Dahlonega, Georgia (station 02333500),
October 1956 to September 1976 .............................................. 104120. Chattahoochee River near Buford, Georgia (station 02334500), May 1957 to
A ugust 1977 ............................................................... 105121. Chattahoochee River near Norcross, Georgia (station 02335000), October 1957 to
Septem ber 1976 ............................................................ 105
122. Big Creek near Alpharetta, Georgia (station 02335700), May 1960 toSeptem ber 1976 ............................................................ 106
123. Chattahoochee River at Atlanta, Georgia (station 02336000), May 1937 toD ecem ber 1938 ............................................................ 106
124. Chattahoochee River at Atlanta, Georgia (station 02336000), November 1957to Septem ber 1979 .......................................................... 107
125. Peachtree Creek at Atlanta, Georgia (station 02336300), July 1959 toD ecem ber 1984 ............................................................ 107
126. Chattahoochee River at Interstate Highway 285 near Atlanta, Georgia(station 02336502), July 1975 to December 1984 .................................. 108
viii
Figures 14-211.
ILLUSTRATIONS-ContinuedPage
Graphs showing harmonic stream-temperature curves of observed data and statewideregression equation for stations:-Continued
127. Sweetwater Creek near Austell, Georgia (station 02337000), May 1957 toD ecem ber 1984 ............................................................ 108
128. North Fork Camp Creek at Atlanta, Georgia (station 02337100), October 1963to July 1970 ......................................... ..................... 109
129. Chattahoochee River near Fairburn, Georgia (station 02337170), July 1965 toD ecem ber 1984 ............................................................ 109
130. Dog River at State Highway 166 near Fairplay, Georgia (station 02337438),July 1974 to M ay 1979 .................................. .................... 110
131. Snake Creek near Whitesburg, Georgia (station 02337500), October 1959 toJuly 19 84 ................................................................. 110
132. Chattahoochee River near Whitesburg, Georgia (station 02338000),February 1958 to December 1984 ......................... ; .................... 1i1
133. Chattahoochee River at U.S. Highway 27 at Franklin, Georgia (station 02338500),February 1958 to December 1984 .............................................. 1ll
134. Chattahoochee River (LaGrange Intake) near LaGrange, Georgia (station 02338720),July 1974 to D ecem ber 1984 ............................ ; .................... 112
135. Yellowjacket Creek near LaGrange, Georgia (station 02339000), August 1956 toSeptem ber 1970 ...................................... ..................... 112
136. Chattahoochee River at West Point, Georgia (station 02339500), September 1957to Septem ber 1974 .......................................................... 113
137. Chattahoochee River at West Point, Georgia (station 02339500), October 1974 toD ecem ber 1984 ........................................ .................... 113
138. Long Cane Creek near West Point, Georgia (station 02339720), July 1974 toD ecem ber 1984 ...................................... ..................... 114
139. Mountain Oak Creek near Hamilton, Georgia (station 02340500), August 1956 toJu ne 1974 ......................... .................. .................. .. 114
140. Chattahoochee River at Columbus, Georgia (station 02341500), October 1940 toSeptem ber 1974 ...................................... .................... 115
141. Upatoi Creek near Columbus, Georgia (station 02341800), April 1965 toSeptem ber 1983 ...................................... ..................... 115
142. Pataula Creek near Lumpkin, Georgia (station 02343200), August 1962 toN ovem ber 1973 ............................................................ 116
143. Chattahoochee River at Columbia, Alabama (station 02343500), November 1940 toA pril 1958 ........................................... .................... 116
144. Chattahoochee River at Alaga, Alabama (station 02344000), January 1964 toJuly 1974 .......................................... . .................... 117
145. Chattahoochee River near Steam Mill, Georgia (station 02344040), October 1974to D ecem ber 1984 .................................... ..................... 117
146. Flint River at State Highway 138 near Jonesboro, Georgia (station 02344180),M ay 1958 to Decem ber 1984 .................................................. 118
147. Flint River at State Highway 54 near Fayetteville, Georgia (station 02344190),July 1975 to D ecem ber 1984 .................................................. 118
148. Camp Creek near Fayetteville, Georgia (station 02344300), July 1960 toSeptember 1970 .................................................. 119
149. Flint River at Ackert Road near Inman, Georgia (station 02344380), July 1975to D ecem ber 1984 .......................................................... 119
ix
Figures 14-211.
ILLUSTRATIONS-ContinuedPage
Graphs showing harmonic stream-temperature curves of observed data and statewideregression equation for stations:-Continued
150. Flint River at State Highway 92 above Griffin, Georgia (station 02344400),July 1975 to Decem ber 1984 .................................................. 120
151. Flint River near Griffin, Georgia (station 02344500), August 1956 to July 1976 ........ 120152. Line Creek near Senoia, Georgia (station 02344700), September 1964 to July 1976 ..... 121153. Potato Creek near Thomaston, Georgia (station 02346500), July 1956 to June 1974 ..... 121154. Flint River near Culloden, Georgia (station 02347500), April 1954 to June 1979 ....... 122155. Whitewater Creek below Rambulette Creek near Butler, Georgia (station
02349000), April 1954 to November 1973 ........................................ 122156. Flint River at Montezuma, Georgia (station 02349500), May 1954 to
D ecem ber 1984 ............................................................ 123157. Turkey Creek at Byromville, Georgia (station 02349900), July 1954 to
June 19 82 ......................... ...................................... .. 123158. Flint River at State Highway 27 near Vienna, Georgia (station 02350001),
July 1979 to D ecem ber 1984 .................................................. 124159. Kinchafoonee Creek at Preston, Georgia (station 02350600), May 1954 to July 1984 .... 124160. Flint River at Albany, Georgia (station 02352500), May 1954 to December 1984 ....... 125161. Flint River (Putney Intake) near Putney, Georgia (station 02352790),
August 1974 to December 1984 ........................ ...................... 125162. Flint River at Newton, Georgia (station 02353000), August 1956 to October 1984 ...... 126163. Pachitla Creek near Edison, Georgia (station 02353400), October 1954 to
N ovem ber 1973 ............................................................ 126164. Ichawaynochaway Creek at Milford, Georgia (station 02353500), April 1954 to
Ju ly 1984 ................................................................. 127165. Flint River at Bainbridge, Georgia (station 02356000), April 1954 to July 1973 ........ 127166. Flint River below State Docks at Bainbridge, Georgia (station 02356015),
July 1974 to D ecem ber 1984 .................................................. 128167. Spring Creek near Iron City, Georgia (station 02357000), August 1957 to July 1978 .... 128168. Cartecay River near Ellijay, Georgia (station 02379500), June 1.957 to August 1975 ..... 129169. Ellijay River at Ellijay, Georgia (station 02380000), June 1957 to July 1974 ........... 129170. Coosawattee River near Ellijay, Georgia (station 02380500), May 1963 to
A ugust 1983 ............................................................... 130171. Scarecorn Creek at Hinton, Georgia (station 02382000), May 1959 to July 1974 ....... 130172. Coosawattee River at Carters, Georgia (station 02382500), July 1965 to
D ecem ber 1972 ..................................... ..................... 131173. Rock Creek near Fairmount, Georgia (station 02383000), July 1957 to
Septem ber 1972 ............................................................ 131174. Coosawattee River near Pine Chapel, Georgia (station 02383500), June 1957 to
D ecem ber 1972 ............................................................ 132175. Coosawattee River near Calhoun, Georgia (station 02383540), August 1974 to
D ecem ber 1984 ............................................................ 132176. Conasauga River (Dalton Intake) near Dalton, Georgia (station 02384748),
July 1974 to Decem ber 1984 ................................................. 133177. Holly Creek near Chatsworth, Georgia (station 02385800), July 1960 to
Ju ne 19 83 ......................... ... ..................................... 133178. Conasauga River at Tilton, Georgia (station 02387000), June 1957 to
D ecem ber 1984 ............................................................ 134
x
Figures 14-211.
ILLUSTRATIONS-ContinuedPage
Graphs showing harmonic stream-temperature curves of observed data and statewideregression equation for stations:--Continued
179. Conasauga River near Resaca, Georgia (station 02387050), August 1974 toD ecem ber 1984 ............................................................ 134
180. Oostanaula River at Resaca, Georgia (station 02387500), September 1957 toD ecem ber 1972 ............................................................ 135
181. Oostanaula River at Interstate Highway 75 at Resaca, Georgia (station 02387502),August 1974 to December 1984 ............................................... 135
182. West Armuchee Creek near Subligna, Georgia (station 02388000), May 1960to A pril 1982 .............................................................. 136
183. Oostanaula River at Rome, Georgia (station 02388500), September 1957 toD ecem ber 1973 ............................................................ 136
184. Oostanaula River (Rome Intake) at Rome, Georgia (station 02388520),August 1974 to December 1984 ............................................... 137
185. Etowah River near Dawsonville, Georgia (station 02389000), September 1956 toA ugust 1984 ............................................................... 137
186. Shoal Creek near Dawsonville, Georgia (station 02389300), June 1958 toJu ne 1974 ................................................................. 138
187. Etowah River at Canton, Georgia (station 02392000), June 1957 toO ctober 1984 .............................................................. 138
188. Little River near Roswell, Georgia (station 02392500), August 1959 toSeptem ber 1964 ............................................................ 139
189. Little River near Roswell, Georgia (station 02392500), October 1964 to June 1975 ..... 139190. Etowah River at Allatoona Dam above Cartersville, Georgia (station 02394000),
October 1938 to September 1939 .............................................. 140191. Etowah River at Allatoona Dam above Cartersville, Georgia (station 02394000),
January 1958 to November 1984 ............................................... 140192. Hills Creek near Taylorsville, Georgia (station 02394950), June 1959 to July 1974 ...... 141193. Etowah River above Kingston, Georgia (station 02394980), August 1974 to
D ecem ber 1984 ............................................................ 141194. Etowah River near Kingston, Georgia (station 02395000), October 1969 to
Septem ber 1984 ............................................................ 142195. Etowah River at Rome, Georgia (station 02396000), September 1957 to
D ecem ber 1984 ............................................................ 142196. Coosa River near Rome, Georgia (station 02397000), July 1957 to
D ecem ber 1984 ............................................................ 143197. Cedar Creek near Cedartown, Georgia (station 02397500), June 1957 to
D ecem ber 1984 ............................................................ 143198. Coosa River near Coosa, Georgia (station 02397530), August 1974 to
D ecem ber 1984 ............................................................ 144199. Chattooga River at Summerville, Georgia (station 02398000), July 1957 to
D ecem ber 1984 ............................................................ 144200. Chattooga River at Chattoogaville, Georgia (station 02398037), August 1974
to D ecem ber 1984 .......................................................... 145201. Little River near Buchanan, Georgia (station 02411800), May 1959 to
A ugu st 1975 ............................................................... 145202. Tallapoosa River below Tallapoosa, Georgia (station 02411930), July 1974 to
N ovem ber 1984 ............................................................ 146
xi
Figures 14-211.
ILLUSTRATIONS-ContinuedPage
Graphs showing harmonic stream-temperature curves of observed data and statewide regressionequation for stations:-Continued
203. Little Tallapoosa River below Bowdon, Georgia (station 02413210), July 1974 toD ecem ber 1984 ....................................... .................... 146
204. Hiwassee River at Presley, Georgia (station 03545000), August 1951 toJune 1982 ................................................................. 147
205. Nottely River near Blairsville, Georgia (station 03550500), August 1951 toJune 1982 ................................................................. 147
206. Nottely River at Nottely Dam near Ivylog, Georgia (station 03553500),Septem ber 1951 to July 1974 ................................................. 148
207. Toccoa River near Dial, Georgia (station 03558000), January 1951 to June 1984 ....... 148208. Toccoa River near Blue Ridge, Georgia (station 03559000), January 1951 to
July 1974 ................................ ................................. 14 9209. Fightingtown Creek at McCaysville, Georgia (station 03560000), January 1951
to June 1974 ............................................................... 149210. South Chickamauga Creek at Graysville, Georgia (station 03566800), August 1974
to N ovem ber 1984 ................................... ...................... 150211. West Chickamauga Creek near Lakeview, Georgia (station 03567340), August 1974
to D ecem ber 1984 .......................................................... 150
xii
TABLESPage
Table 1. Periodic stream-temperature stations, periods of analyses, selected station information,and harm onic properties ...................................................... 34
2. Stream-temperature daily record stations, periods of analyses, selected stationinformation, and harmonic properties .................... ....................... 44
3. Periodic stream-temperature stations used for regression analyses, periods of analyses,selected station information, and harmonic properties ............................... 47
4. Estimates of harmonic coefficients for Altamaha River near Gardi using interpolation andobserved data compared with estimates from the statewide harmonic equation ............ 18
5. Power generating plants in Georgia ................................................ 21
VERTICAL DATUM
Sea Level: In this report, "sea level" refers to the National Geodetic Vertical Datum of 1929 (NGVD of 1929)-ageodetic datum derived from a general adjustment of the first-order level nets of both the United States and Canada,formerly called "Seal Level Datum of 1929."
xiii
STREAM-TEMPERATURE CHARACTERISTICS
IN GEORGIA
By T.R. Dyar and S.J. Alhadeff
ABSTRACT
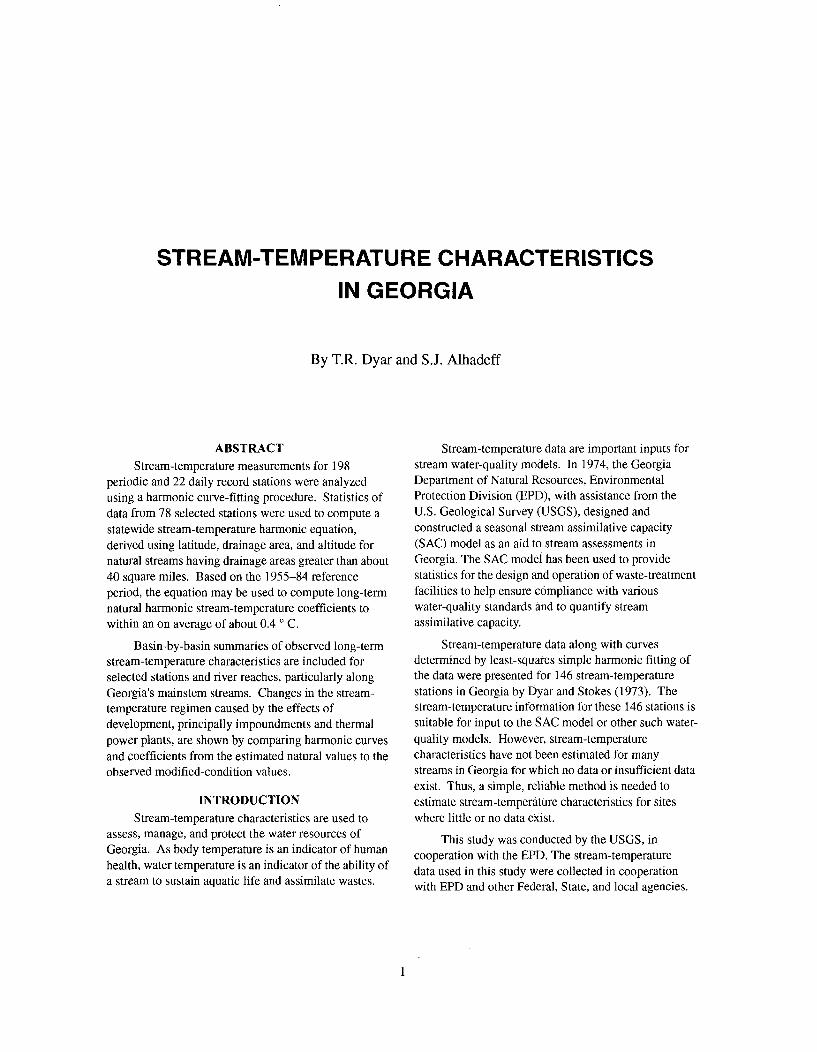
Stream-temperature measurements for 198periodic and 22 daily record stations were analyzedusing a harmonic curve-fitting procedure. Statistics ofdata from 78 selected stations were used to compute astatewide stream-temperature harmonic equation,derived using latitude, drainage area, and altitude fornatural streams having drainage areas greater than about40 square miles. Based on the 1955-84 referenceperiod, the equation may be used to compute long-termnatural harmonic stream-temperature coefficients towithin an on average of about 0.4 0 C.
Basin-by-basin summaries of observed long-termstream-temperature characteristics are included forselected stations and river reaches, particularly alongGeorgia's mainstem streams. Changes in the stream-temperature regimen caused by the effects ofdevelopment, principally impoundments and thermalpower plants, are shown by comparing harmonic curvesand coefficients from the estimated natural values to theobserved modified-condition values.
INTRODUCTIONStream-temperature characteristics are used to
assess, manage, and protect the water resources ofGeorgia. As body temperature is an indicator of humanhealth, water temperature is an indicator of the ability ofa stream to sustain aquatic life and assimilate wastes.
Stream-temperature data are important inputs forstream water-quality models. In 1974, the GeorgiaDepartment of Natural Resources, EnvironmentalProtection Division (EPD), with assistance from theU.S. Geological Survey (USGS), designed andconstructed a seasonal stream assimilative capacity(SAC) model as an aid to stream assessments inGeorgia. The SAC model has been used to providestatistics for the design and operation of waste-treatmentfacilities to help ensure compliance with variouswater-quality standards and to quantify streamassimilative capacity.
Stream-temperature data along with curvesdetermined by least-squares simple harmonic fitting ofthe data were presented for 146 stream-temperaturestations in Georgia by Dyar and Stokes (1973). Thestream-temperature information for these 146 stations issuitable for input to the SAC model or other such water-quality models. However, stream-temperaturecharacteristics have not been estimated for manystreams in Georgia for which no data or insufficient dataexist. Thus, a simple, reliable method is needed toestimate stream-temperature characteristics for siteswhere little or no data exist.
This study was conducted by the USGS, incooperation with the EPD. The stream-temperaturedata used in this study were collected in cooperationwith EPD and other Federal, State, and local agencies.
I
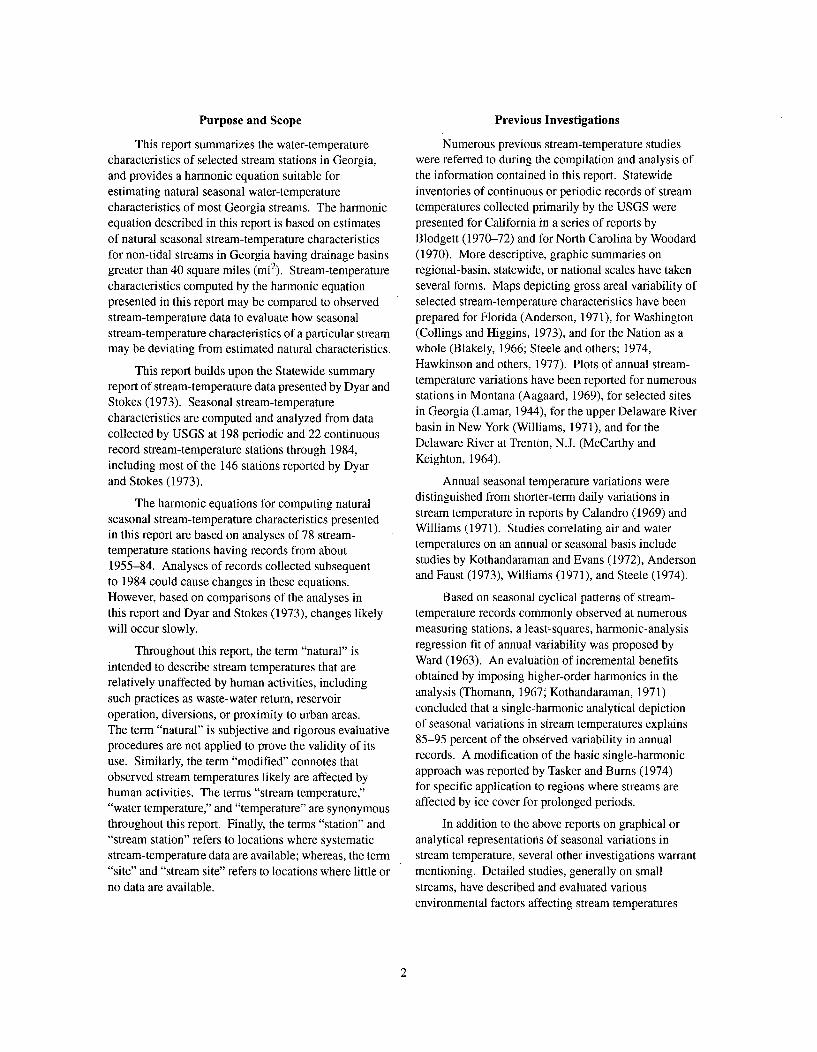
Purpose and Scope
This report summarizes the water-temperaturecharacteristics of selected stream stations in Georgia,and provides a harmonic equation suitable forestimating natural seasonal water-temperaturecharacteristics of most Georgia streams. The harmonicequation described in this report is based on estimatesof natural seasonal stream-temperature characteristicsfor non-tidal streams in Georgia having drainage basinsgreater than 40 square miles (mi 2). Stream-temperaturecharacteristics computed by the harmonic equationpresented in this report may be compared to observedstream-temperature data to evaluate how seasonalstream-temperature characteristics of a particular streammay be deviating from estimated natural characteristics.
This report builds upon the Statewide summaryreport of stream-temperature data presented by Dyar andStokes (1973). Seasonal stream-temperaturecharacteristics are computed and analyzed from datacollected by USGS at 198 periodic and 22 continuousrecord stream-temperature stations through 1984,including most of the 146 stations reported by Dyarand Stokes (1973).
The harmonic equations for computing naturalseasonal stream-temperature characteristics presentedin this report are based on analyses of 78 stream-temperature stations having records from about1955-84. Analyses of records collected subsequentto 1984 could cause changes in these equations.However, based on comparisons of the analyses inthis report and Dyar and Stokes (1973), changes likelywill occur slowly.
Throughout this report, the term "natural" isintended to describe stream temperatures that arerelatively unaffected by human activities, includingsuch practices as waste-water return, reservoiroperation, diversions, or proximity to urban areas.The term "natural" is subjective and rigorous evaluativeprocedures are not applied to prove the validity of itsuse. Similarly, the term "modified" connotes thatobserved stream temperatures likely are affected byhuman activities. The terms "stream temperature,""water temperature," and "temperature" are synonymousthroughout this report. Finally, the terms "station" and"stream station" refers to locations where systematicstream-temperature data are available; whereas, the term"site" and "stream site" refers to locations where little orno data are available.
Previous Investigations
Numerous previous stream-temperature studieswere referred to during the compilation and analysis ofthe information contained in this report. Statewideinventories of continuous or periodic records of streamtemperatures collected primarily by the USGS werepresented for California in a series of reports byBlodgett (1970-72) and for North Carolina by Woodard(1970). More descriptive, graphic summaries onregional-basin, statewide, or national scales have takenseveral forms. Maps depicting gross areal variability ofselected stream-temperature characteristics have beenprepared for Florida (Anderson, 1971), for Washington(Collings and Higgins, 1973), and for the Nation as awhole (Blakely, 1966; Steele and others; 1974,Hawkinson and others, 1977). Plots of annual stream-temperature variations have been reported for numerousstations in Montana (Aagaard, 1969), for selected sitesin Georgia (Lamar, 1944), for the upper Delaware Riverbasin in New York (Williams, 1971), and for theDelaware River at Trenton, N.J. (McCarthy andKeighton, 1964).
Annual seasonal temperature variations weredistinguished from shorter-term daily variations instream temperature in reports by Calandro (1969) andWilliams (1971). Studies correlating air and watertemperatures on an annual or seasonal basis includestudies by Kothandaraman and Evans (1972), Andersonand Faust (1973), Williams (1971), and Steele (1974).
Based on seasonal cyclical patterns of stream-temperature records commonly observed at numerousmeasuring stations, a leastlsquares, harmonic-analysisregression fit of annual variability was proposed byWard (1963). An evaluation of incremental benefitsobtained by imposing higher-order harmonics in theanalysis (Thomann, 1967; Kothandaraman, 1971)concluded that a single~harmonic analytical depictionof seasonal variations in stream temperatures explains85-95 percent of the observed variability in annualrecords. A modification of the basic single-harmonicapproach was reported by Tasker and Burns (1974)for specific application to regions where streams areaffected by ice cover for prolonged periods.
In addition to the above reports on graphical oranalytical representations of seasonal variations instream temperature, several other investigations warrantmentioning. Detailed studies, generally on smallstreams, have described and evaluated variousenvironmental factors affecting stream temperatures
2
(Pluhowski, 1970; Moore, 1967). Collings andHiggins (1973) related stream-temperature harmoniccoefficients to selected characteristics of a basin usinga multiple-regression approach and found the mostfrequently occurring, statistically significant variableswere drainage area, channel slope, mean basinaltitude, and mean annual streamflow. Gilroy andSteele (1972) evaluated the effects of reduced samplingfrequencies of stream-temperature measurements asdepicted by harmonic coefficients for selectedlong-term daily records.
Station-Identification System
The stream-temperature station numbers arebased upon a numbering system which has been usedfor USGS surface-water stations since October 1, 1950.In this system, the station-identification number isassigned according to downstream order and gapsare left in the series of numbers to allow for newstations that may be established; hence, the numbersare not consecutive. The complete number of eachstation, such as 02331655, includes the two-digit partnumber "02" plus the downstream-order number"331655," which can be from 6 to 12 digits (Stokesand McFarlane, 1995). The tables and most figures inthis report adhere to this system.
In figures 1 and 2 of this report, the USGSstream-station numbers are shortened by omitting thefirst two digits. Similarly, in the text of this report, allstream-temperature station names that are referenced toGeorgia cities are shortened to omit the "Ga." part. Forexample, the complete station number and name for theabbreviated "392500, Little River near Roswell," is"02392500, Little River near Roswell, Ga." Otherabbreviated station numbers can be completed similarlywith the exception of stations having abbreviatednumbers greater than'5000-these stations require aleading "03" rather than a leading "02." For example,the complete station number for station 545000 is03545000. The number and name abbreviations areintended to improve the readability of the report. Thetables and most figures in this report contain completestation numbers and names.
Stream-Temperature Data
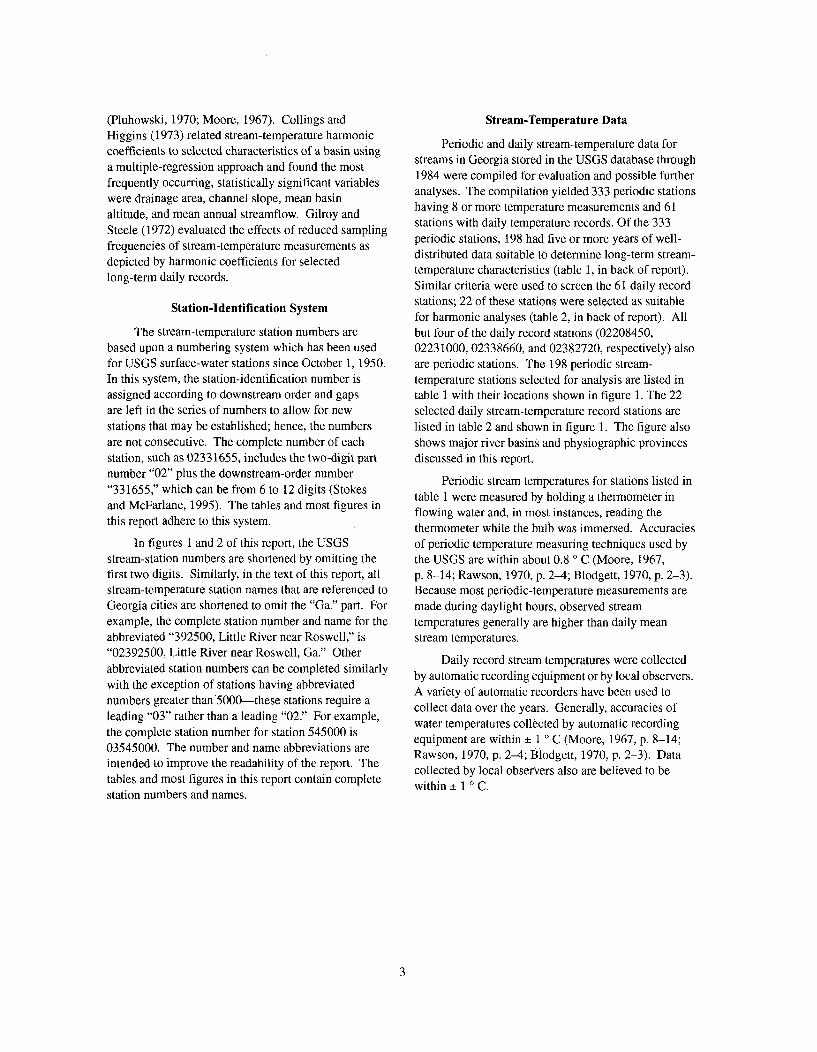
Periodic and daily stream-temperature data forstreams in Georgia stored in the USGS database through1984 were compiled for evaluation and possible furtheranalyses. The compilation yielded 333 periodic stationshaving 8 or more temperature measurements and 61stations with daily temperature records. Of the 333periodic stations, 198 had five or more years of well-distributed data suitable to determine long-term stream-temperature characteristics (table 1, in back of report).Similar criteria were used to screen the 61 daily recordstations; 22 of these stations were selected as suitablefor harmonic analyses (table 2, in back of report). Allbut four of the daily record stations (02208450,02231000, 02338660, and 02382720, respectively) alsoare periodic stations. The 198 periodic stream-temperature stations selected for analysis are listed intable 1 with their locations shown in figure 1. The 22selected daily stream-temperature record stations arelisted in table 2 and shown in figure 1. The figure alsoshows major river basins and physiographic provincesdiscussed in this report.
Periodic stream temperatures for stations listed intable 1 were measured by holding a thermometer inflowing water and, in most instances, reading thethermometer while the bulb was immersed. Accuraciesof periodic temperature measuring techniques used bythe USGS are within about 0.8 0 C (Moore, 1967,p. 8-14; Rawson, 1970, p. 2-4; Blodgett, 1970, p. 2-3).Because most periodic-temperature measurements aremade during daylight hours, observed streamtemperatures generally are higher than daily meanstream temperatures.
Daily record stream temperatures were collectedby automatic recording equipment or by local observers.A variety of automatic recorders have been used tocollect data over the years. Generally, accuracies ofwater temperatures collected by automatic recordingequipment are within ± 1 ° C (Moore, 1967, p. 8-14;Rawson, 1970, p. 2-4; Biodgett, 1970, p. 2-3). Datacollected by local observers also are believed to bewithin ± 1 0 C.
3
TENNESSEE RIVER BASIN
35' 85 84F,56 -4 7r EXPLANATION
0,0 L" Y- L .(1-n7 17000- Major river basin boundary
3 52 A Physiographic province boundary357 0 5 Y005 380500 ''33100
55 380,'91002 8Stream temperature station and• ~~~189100A .• 'bQ0• 83-A60 Sr3330P 13 6_001_ A9'0 1W000
RIV" MASiN "-s(O, identification number383000,J- 1'x'121700 191000
3 988 20. ,98"0l\.' .:.C -A389000 1 091" 00 PeriodicA430 0 3926. 18750, V 208450
39770b ,' 00 -5 Aooo /. Daily
3 94P80 f A/.5 5
2195003 4 0'3939 8" . I 'e3 I, " "" 18909S Periodic and daily
W .k0•0 189002180000
1 1 ,337170 /"• • ; i "~25 / 2-, 15500" 2
A4 , "10/\ ,.3~.44 8 o . 0400...21500.../ ;9ooo8
35005000
-J 205100
2341500, 1 192O0 2> 0\ 0\1500 4218200
I)350 1 •o C. S 22500 \,,-.3o....341 0 , )5 3326430A ' O -12'>22400-' "" -. " '
OA°-- 3a 3,' .:&"A,, --- ,•s.•-'"-
......... 20•3555 !
237000I SR, A13555
~)~ k~3570 31i0 A317 .... RlYER BASINS,22750°.. L.r-.. ,. :,
226500 •.~ATLL-S MAYS •268 02261000..
337 78,o 80001 ..22 500 '1.23500
-413 j3725 1- -\ (10
!357oo00... /5\S•..1A:N N E EOCH'LOCK ,NEE-,AUcIL -I'.i.__L .. •'L_
4040 S428 040
0 3750 # y.. 0A70 A .27 0..0 , / : . . 31000"96-2
3447-00*./ 3254000' 000015 2
AA 15 0 '' 350 -
. .* --. ... .~ . -- 15960 .A ...'31ioo,,/ tBase from U.S. Geological Survey A ........digital files .. . I -• '
0 10 20 30 40 50 60 70 MILES 7I i I I I
010 20 30 40 50 60 70 KILOMETERS
Figure 1. Locations of 198 periodic and 22 daily stream-temperature stations,major river basins, and physiographic provinces in Georgia.
4
840EXPLANATION
.... Major river basin boundary
Physiographic province boundary
830 V192000 Stream temperature station andridentification number
34'
Base from U.S. Geological Surveydigital files
0 10 20 30 40 50 60 70 MILESI I I I ' I 'I I I r I - -
0 10 20 30 40 50 60 70 KILOMETERS
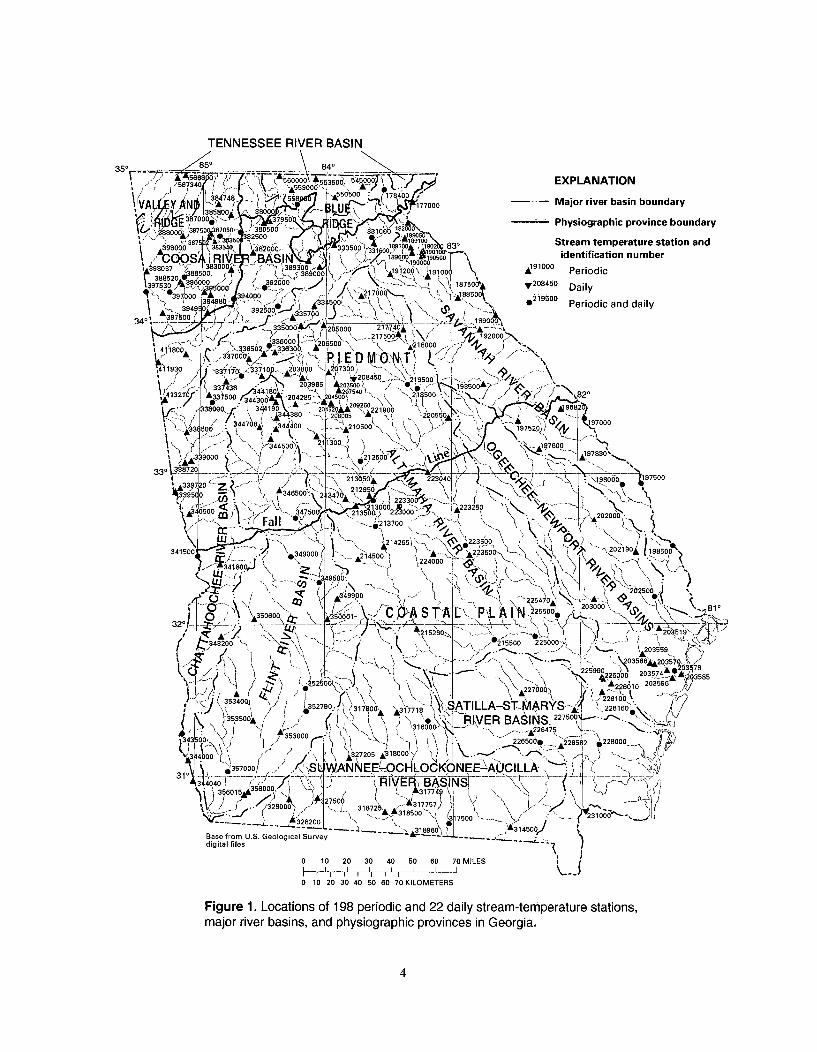
Figure 2. Names of major streams and locations of 78 stream-temperature stationsused to compute harmonic stream-temperature regression equations.
5
LONG-TERM STREAM-TEMPERATURECHARACTERISTICS
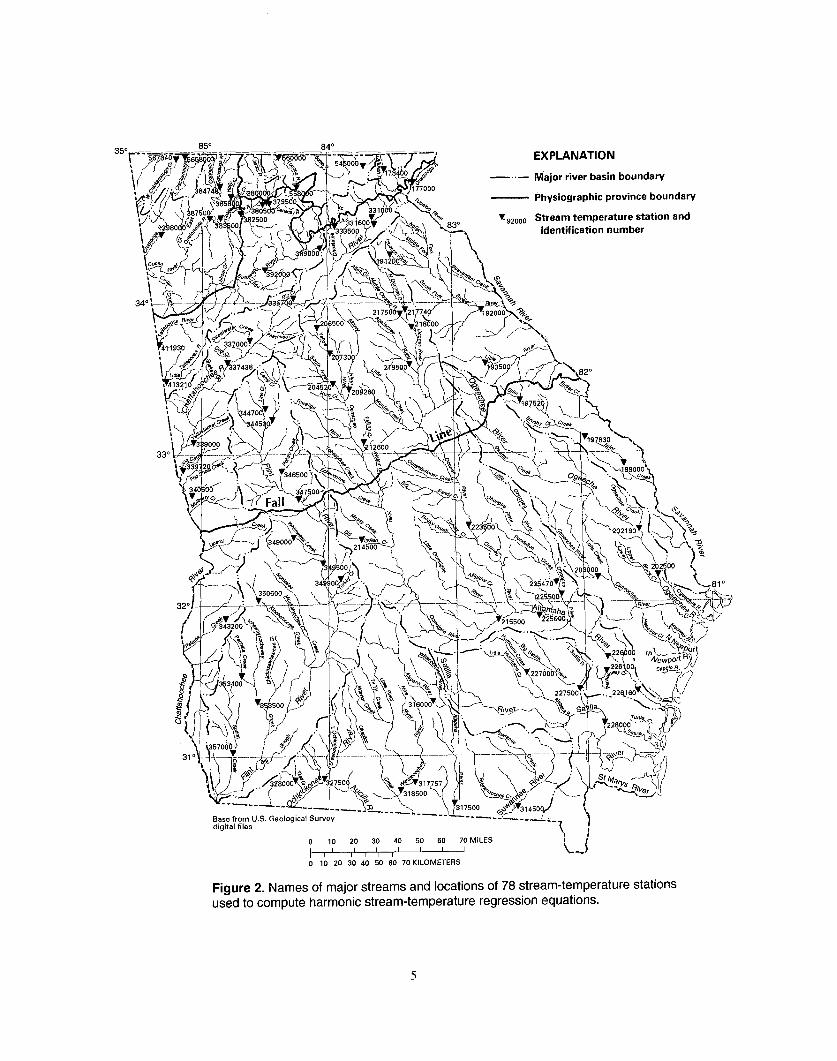
Dyar and Stokes (1973) demonstrated that annualseasonal or long-term stream-temperaturecharacteristics may be represented by a harmonic(sinusoidal) function of the following form (Ward, 1963;Collings, 1969; and Steele and Gilroy, 1972):
T=M+A [sin (b t+c)] (1)
where
T is the harmonic-mean stream temperature onday "t";
M is the harmonic-mean coefficient or the long-term mean stream temperature for the periodof record used in the analysis;
A is the amplitude coefficient or annual rangein temperature of the harmonic function (orone-half the estimated annual variation instream temperature for the period of record);
b is a constant to convert time of year "t" todegrees of arc;
t is the time of year expressed as a day number,where t = 1 for October 1; and
c is the phase coefficient of the harmonicfunction.
A generalized example of a harmonic temperaturecurve computed from equation (1) is shown in figure 3.Harmonic coefficients for equation (1) (M, A, and c)may be determined by plotting stream-temperaturestation data for the selected period of analysis on asingle annual time segment, without regard to year,and computing the least-square harmonic fit from thedata points. The selected annual time segment is astandard "water year" used by the USGS, whichrepresents a period of October 1 to September 30 ofthe following calendar year.
Stream-temperature data for each station listed intables 1 and 2 were plotted and harmonic-functioncoefficients were computed from a least-squaressinusoidal fit of the data. The computed coefficients,standard errors, and variances are listed in tables 1 and2. Multiple analyses were performed for six periodic
45
U)2
0U')ww
CD
CL0
z
wI-
Lu.
I--
40 -
35 I-
I I I I I I I I
Harmonic equationT= M + A[sin(bt + c)] 2nT(°Celsius)=1 3.2 + 8.4[sinQ(-t + 2.69)]
Stream-temperature
measurement
30k-
25[
20
15
Harmonic - A
function 0
0C=Phase angle=2.69 Radians
- - M=Mean annual=13-20C - - -°- ° --0 0
0 0- 0 08
Qo00000 000
---00 0----0
0000
00 000 e0
0 00
110I-Lu
100 Z
LL90 C/)
IIIIIr
(D80 LU
0Z
70 i
60Ir
50 LujIr
LU4-40 <
F,
10 A=Amplitude=8.4 0C
5
00
I I 1 01 1 1 1 1 1 1 10OCT NOV DEC JAN FEB MAR APR MAY JUNE JULY AUG SEPT
DAY OF THE WATER YEAR (t)
Figure 3. Generalized harmonic stream-temperature curve showing harmonicequation coefficients.
6
stations (02213500, 02318000, 02336000, 02339500,02392500, and 02394000) because reservoirsconstructed upstream from the stations during the periodof record interrupted the homogeneity of the tempera-ture data. Graphs of the annualized stream-temperaturedata and harmonic-function curves for selected periodicstations listed in table 1 are shown in back of this report.
Natural Stream-Temperature Characteristics
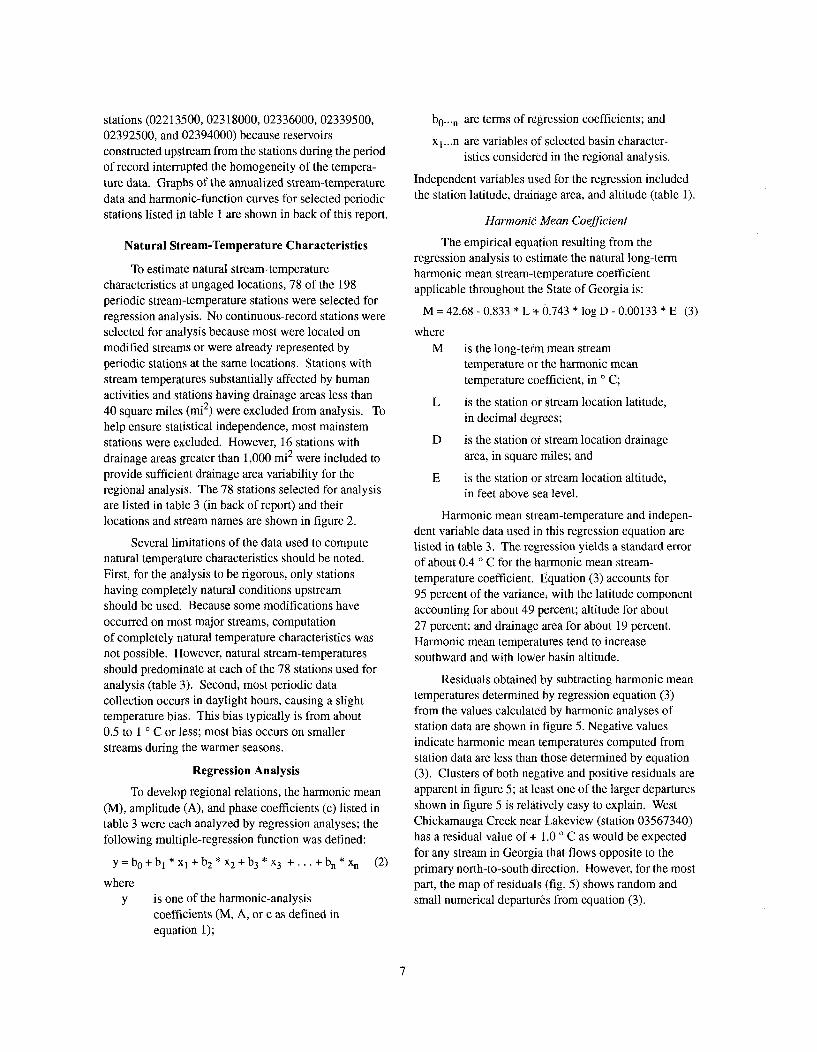
To estimate natural stream-temperaturecharacteristics at ungaged locations, 78 of the 198periodic stream-temperature stations were selected forregression analysis. No continuous-record stations wereselected for analysis because most were located onmodified streams or were already represented byperiodic stations at the same locations. Stations withstream temperatures substantially affected by humanactivities and stations having drainage areas less than40 square miles (mi 2) were excluded from analysis. Tohelp ensure statistical independence, most mainstemstations were excluded. However, 16 stations withdrainage areas greater than 1,000 mi 2 were included toprovide sufficient drainage area variability for theregional analysis. The 78 stations selected for analysisare listed in table 3 (in back of report) and theirlocations and stream names are shown in figure 2.
Several limitations of the data used to computenatural temperature characteristics should be noted.First, for the analysis to be rigorous, only stationshaving completely natural conditions upstreamshould be used. Because some modifications haveoccurred on most major streams, computationof completely natural temperature characteristics wasnot possible. However, natural stream-temperaturesshould predominate at each of the 78 stations used foranalysis (table 3). Second, most periodic datacollection occurs in daylight hours, causing a slighttemperature bias. This bias typically is from about0.5 to I 0 C or less; most bias occurs on smallerstreams during the warmer seasons.
Regression Analysis
To develop regional relations, the harmonic mean(M), amplitude (A), and phase coefficients (c) listed intable 3 were each analyzed by regression analyses; thefollowing multiple-regression function was defined:
y=bo+b 1 *xi+b 2 *x 2 +b 3 *x 3 +...+bn*xn (2)
b0 "... are terms of regression coefficients; and
xl...n are variables of selected basin character-istics considered in the regional analysis.
Independent variables used for the regression includedthe station latitude, drainage area, and altitude (table 1).
Harmonic Mean Coefficient
The empirical equation resulting from theregression analysis to estimate the natural long-termharmonic mean stream-temperature coefficientapplicable throughout the State of Georgia is:
M = 42.68 - 0.833 * L + 0.743 * log D - 0.00133 * E (3)
whereM is the long-term mean stream
temperature or the harmonic meantemperature coefficient, in o C;
L is the station or stream location latitude,in decimal degrees;
D is the station or stream location drainagearea, in square miles; and
E is the station or stream location altitude,in feet above sea level.
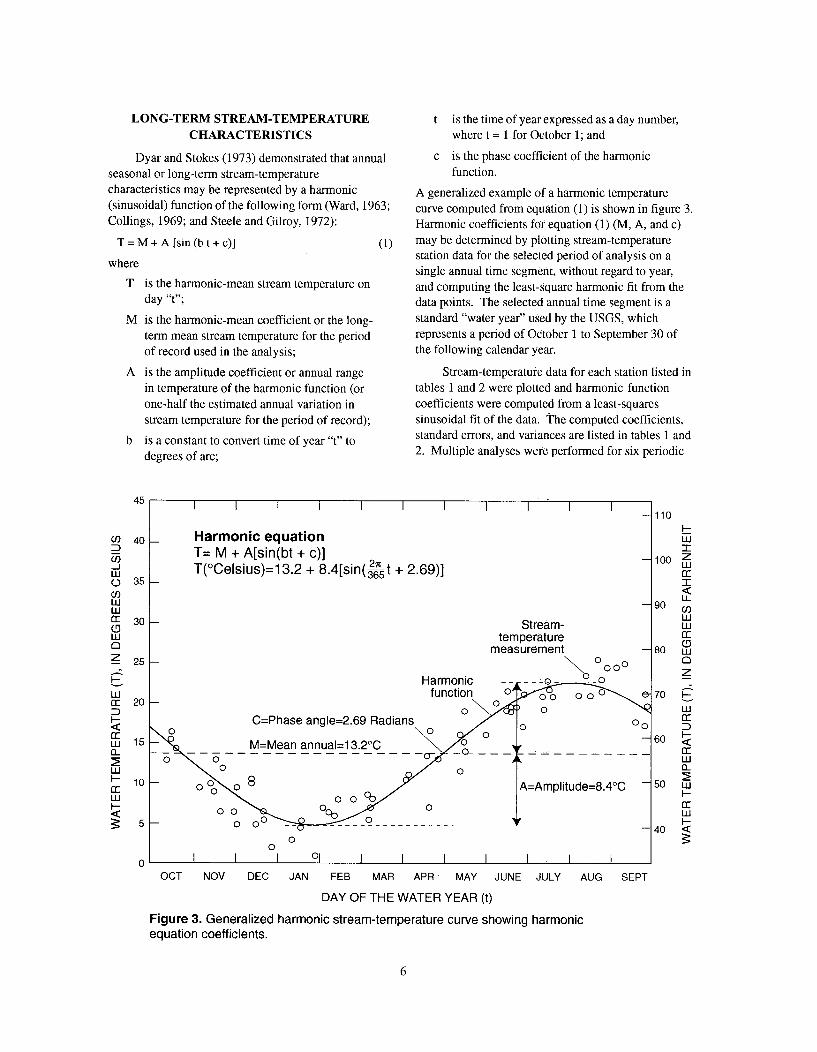
Harmonic mean stream-temperature and indepen-dent variable data used in this regression equation arelisted in table 3. The regression yields a standard errorof about 0.4 0 C for the harmonic mean stream-temperature coefficient. Equation (3) accounts for95 percent of the variance, with the latitude componentaccounting for about 49 percent; altitude for about27 percent; and drainage area for about 19 percent.Harmonic mean temperatures tend to increasesouthward and with lower basin altitude.
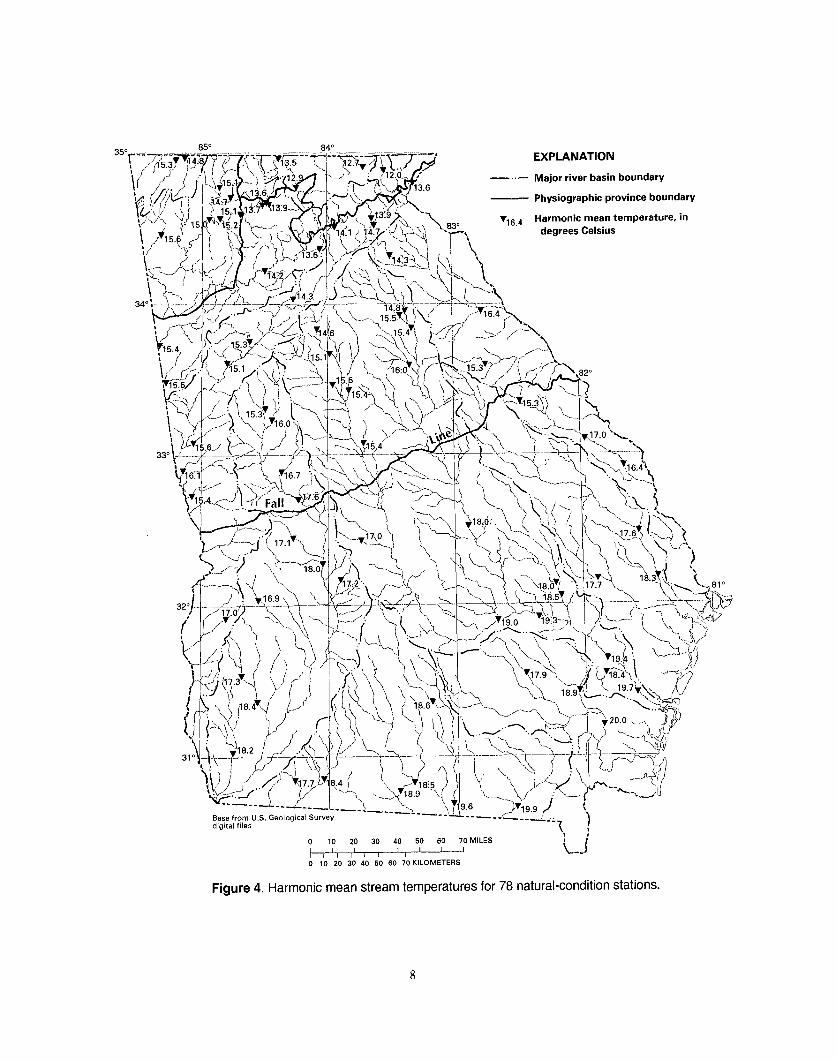
Residuals obtained by subtracting harmonic meantemperatures determined by regression equation (3)from the values calculated by harmonic analyses ofstation data are shown in figure 5. Negative valuesindicate harmonic mean temperatures computed fromstation data are less than those determined by equation(3). Clusters of both negative and positive residuals areapparent in figure 5; at least one of the larger departuresshown in figure 5 is relatively easy to explain. WestChickamauga Creek near Lakeview (station 03567340)has a residual value of + 1.0 0 C as would be expectedfor any stream in Georgia that flows opposite to theprimary north-to-south direction. However, for the mostpart, the map of residuals (fig. 5) shows random andsmall numerical departures from equation (3).
where
y is one of the harmonic-analysiscoefficients (M, A, or c as defined inequation 1);
7
EXPLANATION
.... Major river basin boundary
Physiographic province boundary
V16.4 Harmonic mean temperature, indegrees Celsius
Base from U.S. Geological Survey 1... -digital files
0 10 20 30 40 50 60 70 MILES0I I I 3
010 20 30 40 50 60 70 KILOMETERS
Figure 4. Harmonic mean stream temperatures for 78 natural-condition stations.
9
840EXPLANATION
.... -Major river basin boundary
Physiographic province boundary
Harmonic mean temperatureresidual, in degrees Celsius
340;
33o
11o
31'
Base from U.S. Geological Surveydigital files
0 10 20 30 40 50 60 70MILESI I I I I In II I I I I L J0 10 20 30 40 50 60 70 KILOMETERS
Figure 5. Residuals of harmonic mean stream temperatures for 78 natural-condition stations.
9
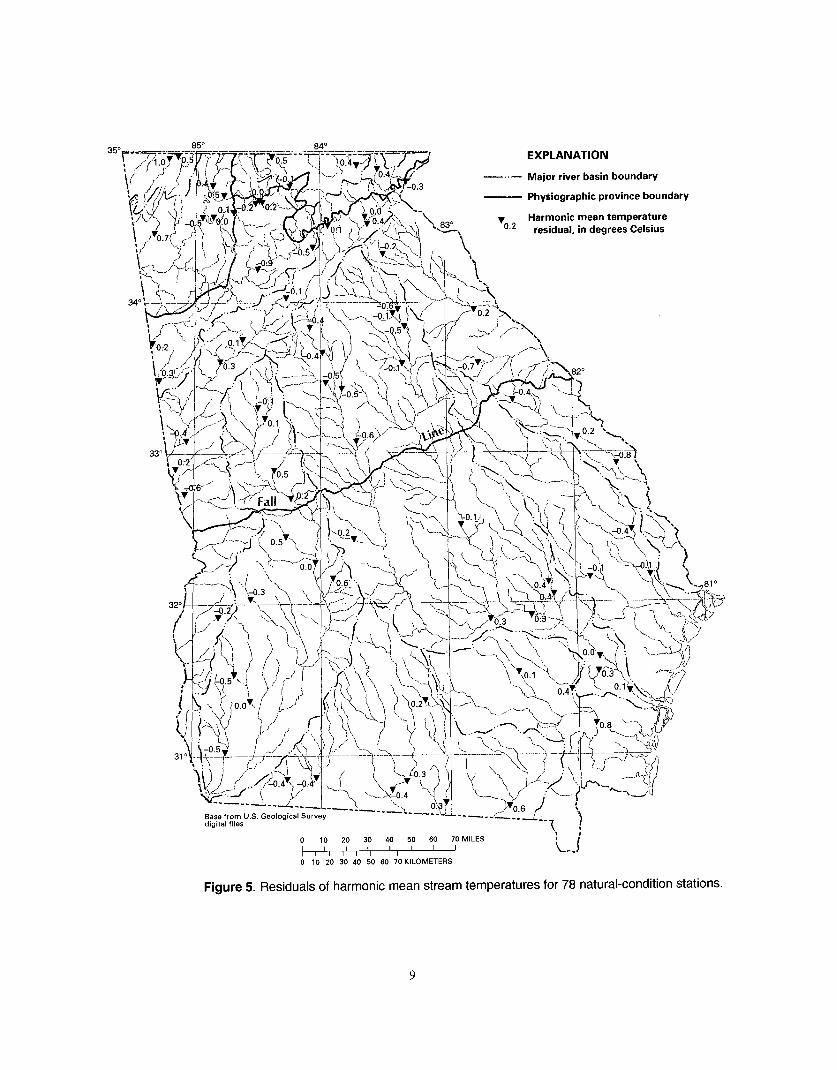
Natural long-term temperature anomalies can beexpected in some locations in Georgia. For example,stream temperatures in and around Warm Springs, likelywould be higher than values predicted by equation (3).Along the coast and in tidal streams (such as stations02203559, 02203566, 02203570, 02203574,02203578, 02203585, and 02203596), data are scarce.Because stations having sea affects are not included,equation (3) should not be applied to tidally affectedstream sites. Stream locations having drainage areassmaller than about 40 mi 2 or having a very highproportion of streamflow derived from ground-waterinflow upstream may show deviations of 1 0 C ormore from values estimated by equation (3).
The empirical equation used to estimate naturallong-term harmonic-mean temperatures in Georgiastreams predict a maximum high value of about20.5 0 C; such values occur at lower latitudes, loweraltitudes, and in larger drainage basins. The minimumpredicted low value is about 12.3 0 C; values in thisrange occur at higher latitudes, higher altitudes, and insmaller drainage basins. Generally, the harmonic meantemperatures computed from data for the 78 stationsanalyzed (table 3) agree well with those estimated byequation (3).
Amplitude Coefficient
The empirical equation resulting from theregression analysis to estimate the natural long-termamplitude stream-temperature coefficient applicablethroughout the State of Georgia is:
A = -7.40 + 0.947 * log D + 0.426 * L - 0.00075 * E (4)
whereA is the amplitude coefficient in 0 C;
D is the station or stream location drainagearea, in square miles;
L is the station or stream location latitude,in decimal degrees; and
E is the station or stream location altitude,in feet.
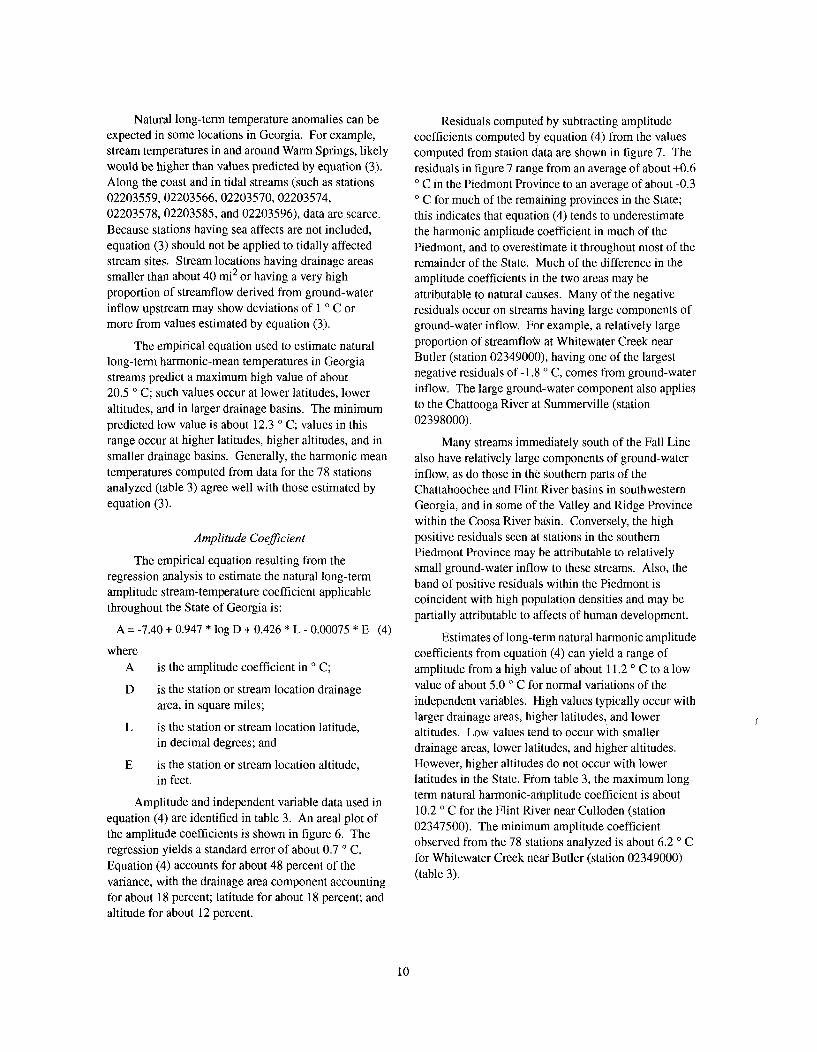
Amplitude and independent variable data used inequation (4) are identified in table 3. An areal plot ofthe amplitude coefficients is shown in figure 6. Theregression yields a standard error of about 0.7 ° C.Equation (4) accounts for about 48 percent of thevariance, with the drainage area component accountingfor about 18 percent; latitude for about 18 percent; andaltitude for about 12 percent.
Residuals computed by subtracting amplitudecoefficients computed by equation (4) from the valuescomputed from station data are shown in figure 7. Theresiduals in figure 7 range from an average of about +0.6O C in the Piedmont Province to an average of about -0.3o C for much of the remaining provinces in the State;this indicates that equation (4) tends to underestimatethe harmonic amplitude coefficient in much of thePiedmont, and to overestimate it throughout most of theremainder of the State. Much of the difference in theamplitude coefficients in the two areas may beattributable to natural causes. Many of the negativeresiduals occur on streams having large components ofground-water inflow. For example, a relatively largeproportion of streamflow at Whitewater Creek nearButler (station 02349000), having one of the largestnegative residuals of-1.8 0 C, comes from ground-waterinflow. The large ground-water component also appliesto the Chattooga River at Summerville (station02398000).
Many streams immediately south of the Fall Linealso have relatively large components of ground-waterinflow, as do those in the southern parts of theChattahoochee and Flint River basins in southwesternGeorgia, and in some of the Valley and Ridge Provincewithin the Coosa River basin. Conversely, the highpositive residuals seen at stations in the southernPiedmont Province may be attributable to relativelysmall ground-water inflow to these streams. Also, theband of positive residuals within the Piedmont iscoincident with high population densities and may bepartially attributable to affects of human development.
Estimates of long-term natural harmonic amplitudecoefficients from equation (4) can yield a range ofamplitude from a high value of about 11.2 0 C to a lowvalue of about 5.0 0 C for normal variations of theindependent variables. High values typically occur withlarger drainage areas, higher latitudes, and loweraltitudes. Low values tend to occur with smallerdrainage areas, lower latitudes, and higher altitudes.However, higher altitudes do not occur with lowerlatitudes in the State. From table 3, the maximum long-term natural harmonic-amplitude coefficient is about10.2 0 C for the Flint River near Culloden (station02347500). The minimum amplitude coefficientobserved from the 78 stations analyzed is about 6.2 0 Cfor Whitewater Creek near Butler (station 02349000)(table 3).
10
350zEXPLANATION
.... Major river basin boundary
Physiographic province boundary
V9.6 Amplitude coefficient, indegrees Celsius
340
32'°
Base from U.S. Geological Surveydigital files
-('I
0 10 20 30 40 50 60 70 MILES II 110 'I II tII I I I
0 20 30 40 50 60 70 KILOMETERS
Figure 6. Amplitude coefficients for 78 natural-condition stations.
11
850
EXPLANATION
.... Major river basin boundary
Physiographic province boundary
V0.2 Residual of amplitude coefficient,in degrees Celsius
.810
Base from U.S. Geological Surveydigital files
0 10 20 30 40 50 60 70MILES! I I I II I I I 1-1 10 10 20 30 40 50 60 70 KILOMETERS
Figure 7. Residuals of amplitude coefficients for 78 natural-condition stations.
12
The amplitude coefficient of the harmonic functionis useful to determine the high and low stream-temperature regimens, as illustrated by figure 3. Graphsand data included in this report show that the addition ofthe amplitude to the harmonic mean temperatureprovides estimates of average annual maximum streamtemperatures. Similarly, subtraction of the amplitudefrom the harmonic mean yields estimates of averageannual minimum temperatures.
Phase Coefficient
Regression analyses were applied to phase-coefficient data in table 3. No basin or hydrologicparameters were found to be helpful in determining thevalue of the phase coefficient. The natural long-termphase coefficient is a constant of about 2.81 radians. Thestandard error of the phase coefficient is about 0.04radians, amounting to about two days. Long-term mean-temperature values are most likely to occur in naturalstreams in Georgia on about October 19 and April 20.Minimum and maximum long-term natural temperaturesare likely to occur on about January 19 and July 20,respectively. Temperatures near the annual maximumand minimum are likely to persist for several weeks. Forexample, temperatures within 1 ° C of the maximumtemperature are likely to occur from about the end ofJune through mid-August. Similarly, temperatureswithin 1 ' C of the minimum value are likely to occurfrom about the end of December through mid-February.The individual phase-coefficient values for each of theselected 78 stations are plotted on figure 8, indicatingthat the phase-coefficient data are adequately describedby the constant of 2.81 radians.
Statewide Harmonic Equation
Long-term stream-temperature characteristicscommonly are estimated for sites when stream-temperature data are not available or are not practicalto obtain. The harmonic equation to estimate long-termnatural stream-temperature characteristics in Georgia isderived by substituting equations (3) and (4) and theconstant of 2.81 radians into equation (1). The resultingequation to estimate long-term natural stream-temperature characteristics is:
T = 42.68 - 0.833 * L + 0.743 * log D - 0.00133 * E +(0.947 * log D + 0.426 * L - 0.00075 * E - 7.40) *
(sin (2 * n * t/365 + 2,81)) (5)
whereT is the estimated long-term mean-daily
stream temperature in 0 C for theselected day of the year;
L is the station or stream location latitude,in decimal degrees-values rangingfrom about 30.5 degrees to 35 degrees;
D is the station or stream location drainagearea, in square miles-values rangingfrom about 40 to 14,000 mi 2,
E is the station or stream location altitude,in feet-values ranging from about 0 to2,000 feet; and
is incremented day-by-day beginningwith "1" for October I to "365" or "366"for Septembef 30 of a given or leap year,respectively.
The insertion of latitude, drainage area, andaltitude values into equation (5) while incrementing "t"day-by-day throughout a year generates a harmoniccurve which tends to provide a good description ofstream-temperature response to solar radiation, seasonby season, throughout the State.
The harmonic mean and amplitude coefficientsthat are generated by equation (5), hereinafter termedthe "statewide harmonic equation," match the individualharmonic stream-temperature coefficients for the 78natural-condition stations to within an average of about0.4 0 C. When equation (5) is applied to the stream-temperature measurements of the 78 regression-analysisstations shown in table 3, the data mostly appear asnormally distributed about each curve. The standarderror or natural temperature scatter averages about 2.2 0
C (table 3) throughout the State. Likewise, the 95percent probability averages about 1.2 0 C above orbelow the applied statewide harmonic curve. Becauseof the uniform scatter of data about the appliedharmonic curve and the large number of datameasurements used in the computation, upper and lowerbounds in these ranges should give the data user anestimate of natural statistical temperature ranges.
The statewide harmonic equation was derived from78 stations having drainage areas greater than about 40mi2, using temperature data collected from about 1955-84 (table 3). Derivations using other periods of analysis,subsequent data, or different stations could causesomewhat different results.
To evaluate the suitability of the statewideharmonic equation for drainage areas less than 40 mi 2,13 stations having drainage areas ranging from 15 to 37mi2 and having mostly natural stream-temperaturecharacteristics were selected from table 1. For the 13selected stations, the statewide harmonic equationyielded average harmonic temperature coefficients
13
850 84'35*%EXPLANATION
.... Major river basin boundary
Physiographic province boundary
V2.82 Phase coeffcient, in radians
33'
10
31
Base from U.S. Geological Surveydigital files
0 10 20 30 40 50 60 70 MILES
I II II I I I I I0 10 20 30 40 50 60 70 KILOMETERS
Figure 8. Phase coefficients for 78 natural-condition stations.
14
within about 0.7 0 C of the coefficients computed fromobserved data. This error of prediction for harmonictemperature coefficients is higher than the 0.4 0 Caverage error computed using the 78 larger drainagearea stations from table 3. Though the statistical sampleof 13 stations is small and confined to central andnorthern Georgia streams, the statewide harmonicequation is expected to generate progressively largererrors of prediction for drainage areas less than about15 mi2 . More discussion of applications and limitationsof the statewide harmonic equation is presented infollowing sections of this report.
Harmonic statistics of the daily stream-temperature records (table 2) show that long-termharmonic curves of daily maximum and minimumstream temperatures, typically range from about 1.0 to1.5 0 C above and below, respectively, the long-termharmonic mean curve for stations having drainage areasof about 100 mi2, and about 0.5 0 C above and belowthe long-term mean curve for stations having drainageareas of about 10,000 mi 2. Addition (or substraction) ofthese values to equation (5) and the analysis ofmaximum or minimum monthly observed values fromnearby data can produce good estimates of expectedmaximum or minimum stream-temperature values forany month of the year.
There are some asymmetrical properties of annualstream-temperature characteristics which the sinusoidalfitting process tends to obscure, such as when minimumtemperatures approach freezing. Stream temperaturesthat approach 0 0 C do not fit a sinusoidal distribution.
Perhaps a more important asymmetrical stream-temperature consideration at a station comes from heatflux proportional to streamflow. The annual heat-fluxdistribution is skewed because runoff typicallyincreases, particularly in natural streams, during thecolder December-April period. Examples of thisphenomenon can be observed in stream reaches belowsome reservoirs. The reservoirs act as heat sinks thattend to moderate and lag downstream temperatures.When reservoir storage is large compared to averageannual stream runoff, downstream stream-temperaturecharacteristics may be markedly changed from naturaltemperature characteristics. For example, the annualmean harmonic-stream temperature downstream ofLake Sidney Lanier (Chattahoochee River near Buford,station 02334500) currently is about 9.2 0 C, which isabout 6 0 C below the natural annual harmonic-meantemperature-calculated from equation (5) for thestation-of about 15.3 0 C. Because near-bottom wateris released from Lake Sidney Lanier, the ChattahoocheeRiver downstream from the lake has temperaturecharacteristics of the cool season throughout the year.
Examples of Estimating NaturalStream-Temperature Characteristics
Four examples illustrating uses of stream-temperature data and regression equations presented inthis report are described below. The stations selectedfor discussion range widely in size and geographiclocation and include (1) Panther Creek, a small streamin the upper reaches of the Savannah River basin in theBlue Ridge Province; (2) West Armuchee Creek in theCoosa River basin in the Valley and Ridge Province;(3) Alcovy River in the Altamaha River basin in thePiedmont Province; and (4) Altamaha River about60 miles upstream from its mouth and in the CoastalPlain Province. Each example depicts how a usermight choose to analyze and estimate natural stream-temperature characteristics at the site of interest.Although each example of estimating natural long-termstream-temperature characteristics described belowwas selected for a stream having available stream-temperature data, similar procedures could be used toestimate temperature characteristics at ungaged sites.Also, it is important to note that each example relies onhistorical data through no later than 1984 that may ormay not accurately reflect current or future stream-temperature conditions.
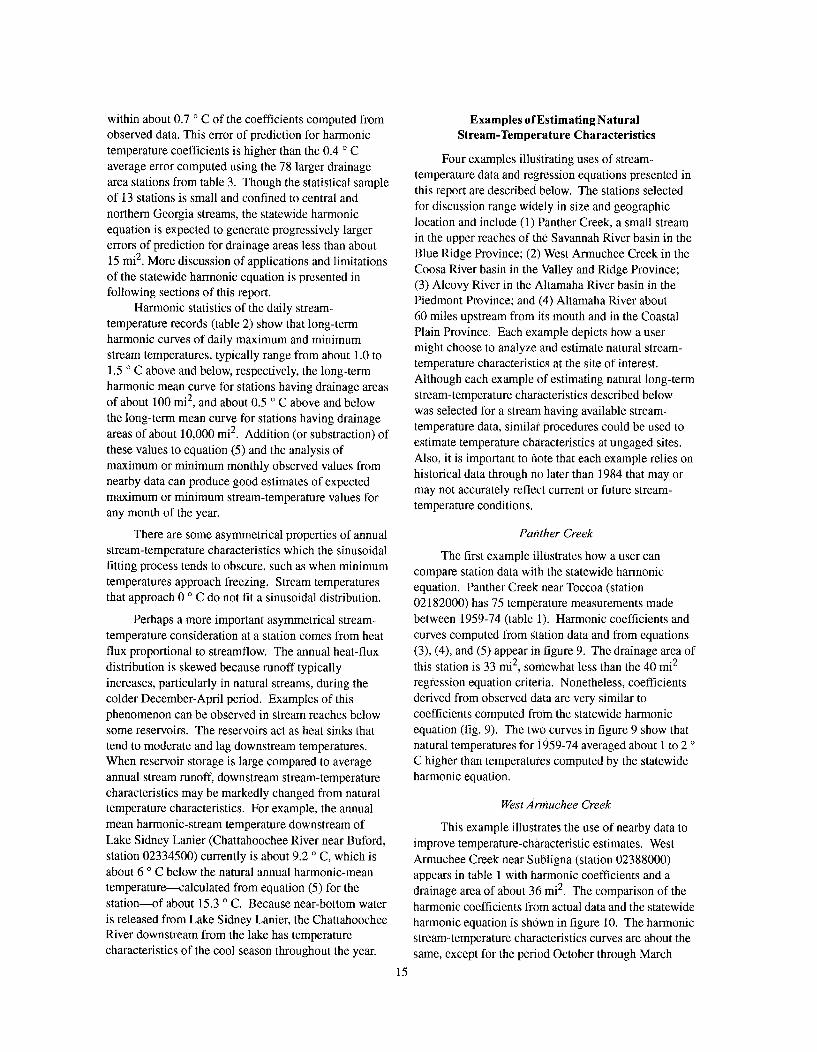
Panther Creek
The first example illustrates how a user cancompare station data with the statewide harmonicequation. Panther Creek near Toccoa (station02182000) has 75 temperature measurements madebetween 1959-74 (table 1). Harmonic coefficients andcurves computed from station data and from equations(3), (4), and (5) appear in figure 9. The drainage area ofthis station is 33 mi2, somewhat less than the 40 mi2
regression equation criteria. Nonetheless, coefficientsderived from observed data are very similar tocoefficients computed from the statewide harmonicequation (fig. 9). The two curves in figure 9 show thatnatural temperatures for i 959-74 averaged about 1 to 2C higher than temperatures computed by the statewideharmonic equation.
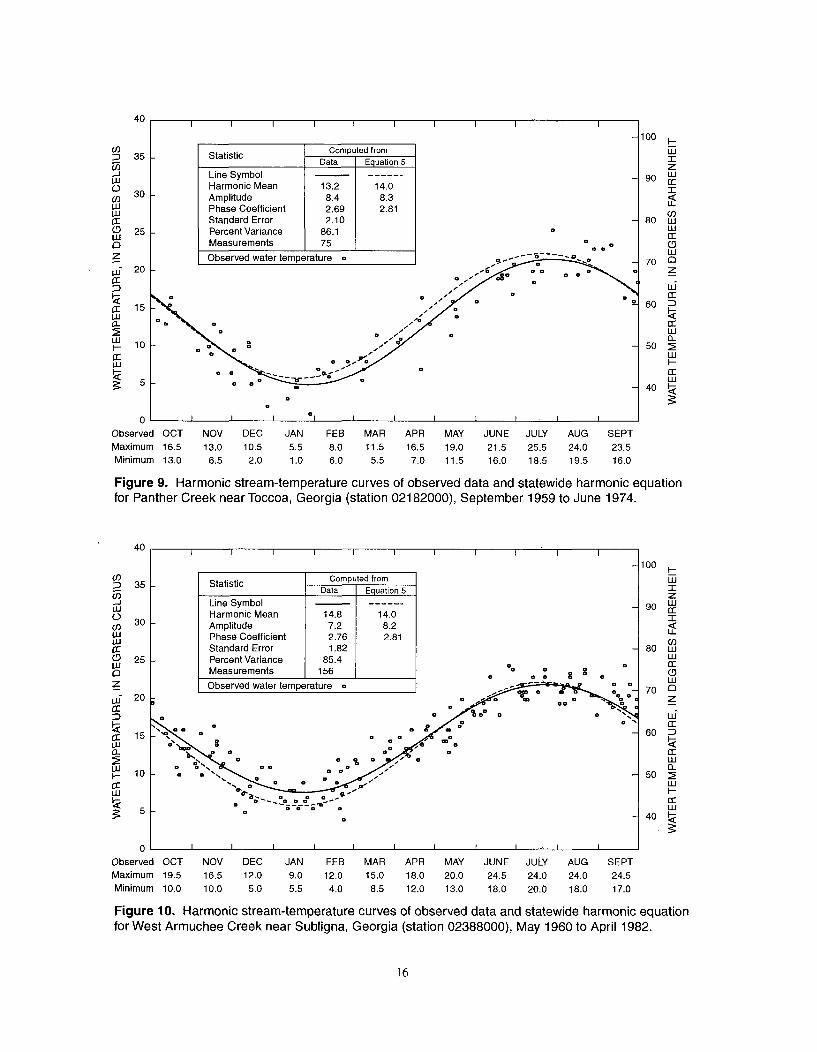
West Armuchee Creek
This example illustrates the use of nearby data toimprove temperature-characteristic estimates. WestArmuchee Creek near Subligna (station 02388000)appears in table 1 with harmonic coefficients and adrainage area of about 36 mi 2. The comparison of theharmonic coefficients from actual data and the statewideharmonic equation is shown in figure 10. The harmonicstream-temperature characteristics curves are about thesame, except for the period October through March
15
Ci)
-j
Ci)LULu
LU
Lu
a:
40
35
30
25
20
15
10
5
100l0I-
z90 LU
80 WLUIrr
7oDLU70 (D
z
Lda:60 )
I-
50 2I--
I440
0i I I 1 1 .. I I I
Observed OCT NOV DEC JAN FEB MAR APR MAY JUNE JULY AUG SEPT
Maximum 16.5 13.0 10.5 5.5 8.0 11.5 16.5 19.0 21.5 25;5 24.0 23.5Minimum 13.0 6.5 2.0 1.0 6.0 5.5 7.0 11.5 16.0 18.5 19.5 16.0
Figure 9. Harmonic stream-temperature curves of observed data and statewide harmonic equationfor Panther Creek near Toccoa, Georgia (station 02182000), September 1959 to June 1974.
LUC)
Lu
LU
0-i
a:Lii
40
35
30
25
20
15
10
5
H
zLU
LLT
Cc)
LU
W
LUa:
.LU
aT
W
LU
L.U
0
Observed OCTMaximum 19.5
Minimum 10.0
NOV DEC JAN FEB MAR APR MAY JUNE JULY AUG SEPT16.5 12.0 9.0 12.0 15.0 18.0 20.0 24.5 24.0 24.0 24.5
10.0 5.0 5.5 4.0 8.5 12.0 13.0 18.0 20.0 18.0 17.0
Figure 10. Harmonic stream-temperature curves of observed data and statewide harmonic equationfor West Armuchee Creek near Subligna, Georgia (station 02388000), May 1960 to April 1982.
16
when the statewide harmonic equation yields about I to2 0 C lower values. Because of differences of severaldegrees in the two characteristic curves during the coldweather months, it is helpful to examine temperaturecharacteristics at other nearby stations. Stations02397500, 02398000, 03566800, and 03567340 arenearby stations within the same Valley and RidgeProvince (figs. 197, 199, 210, and 211), and all show asimilar deviation from the statewide harmonic equationduring the cooler months. Therefore, the data user mayconsider this characteristic to be a local anomaly forstations in nearby streams in the Valley and RidgeProvince. Better estimation of stream-temperaturecharacteristics may require adjusting the coefficientsfrom the statewide harmonic equation to more closelyreflect local conditions.
In general, when using data from nearby stations toimprove estimates of natural stream-temperaturecharacteristics, streams having similar flowcharacteristics should be selected. For example, withinthe Coosa River basin, stations from the Valley andRidge Province in the western part of the basin showdiffering low-flow characteristics than stations typicallyrepresentative of the Piedmont Province to the east.Therefore, some local variations in long-term stream-temperature characteristics within the Coosa River basincan be expected.
A leovy River
This example determines the long-term naturalstream-temperature characteristics for a site in thePiedmont Province-Alcovy River above Covington(station 02208450). A search of the USGS databaseyielded 27 stream-temperature measurements forAlcovy River above Covington from 1972-75.However, because of the short period of record,harmonic computations are not shown in table 1. (Adaily record station was maintained here for about 7years; the information is summarized in table 2.) Forthis station, the input variables for the statewideharmonic equation are as follows-latitude of about33.64 degrees (decimal notation); drainage area of about185 mi 2; and altitude of about 650 ft. Figure 11 showsthe 27 temperature measurements observed from 1972-75, plotted on the annual cycle with the statewideharmonic equation superimposed. The data fit theequation well; and therefore, the data user may bereasonably confident that the data from the short periodof record-about four years-is indicative of long-termnatural stream-temperature characteristics at the station.
Altamaha River
The Altamaha River near Gardi (station 02226010)in the Coastal Plain Province also was selected as anexample to estimate long-term natural stream-temperature characteristics. Following the proceduresoutlined above, the data user will recognize that the sitehas 113 recorded temperature measurements (table 1).To independently estimate the long-term natural stream-temperature characteristics at this station, aninterpolation of harmonic characteristics from a nearbyupstream station, Altamaha River at Doctortown (station02226000) and a nearby downstream station, AltamahaRiver at Everett City (station 02226160) is performedand shown in table 4.
The reach of the Altamaha River from Doctortownto Everett City does not have substantial tributary inflowor modifications that would significantly alter long-termthermal characteristics during the period selected foranalysis. Interpolated and observed values compare wellwith the harmonic mean coefficient, showing the largestdifference of 0.3 0 C between interpolated data(19.6 0 C) and computed from observed data (19.9 0 C)(table 4). The 1970-84 temperature data at thedownstream station, Altamaha River at Everett City(station 02226160), generates a slightly higher harmonicmean temperature than either the statewide harmonicequation for the Gardi station or the observed record atDoctortown. The interpolated harmonic meancoefficients (table 4) were averaged from the upstreamand downstream stations, rather than to more heavilyweight the coefficients from the closer upstream station.
Using the coefficients computed from observeddata as a basis, it appears that the interpolated examplefurnishes better estimates than those obtained from thestatewide harmonic equation. Comments concerningtributary inflow, analysis of the stream reach, andweighing effects of modification were included in theexample because each can be important to stream-temperature estimation within a stream reach.
17
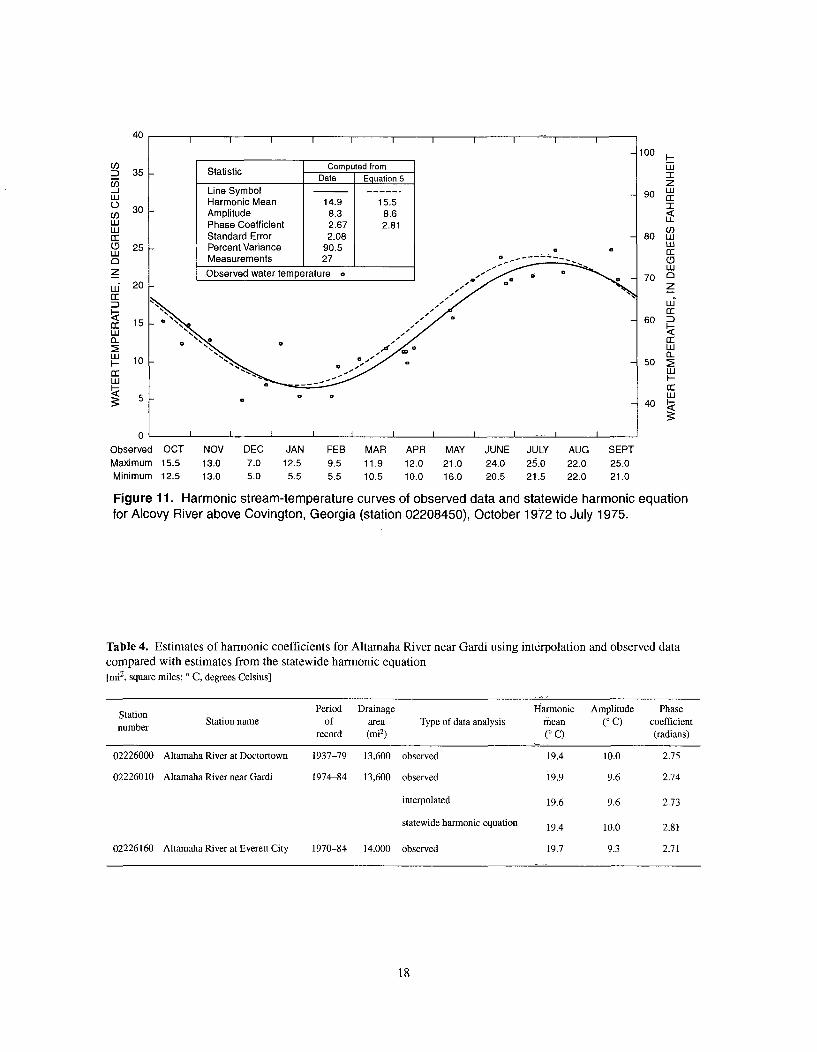
Cl)FnLu0)Cl)Lu
Lu
0zUL
Cl
Lu0-
40
35
30
25
20
15
10
5
- i
Il
z90 W
IE
U-80 W
Lu70 C
zLd
60 DIrLu
50 :Lu.
LuJ40
]innCI
0o
Observed OCTMaximum 15.5Minimum 12.5
NOV DEC JAN FEB MAR APR MAY JUNE JULY AUG SEPT13.0 7.0 12.5 9.5 11.9 12.0 21.0 24.0 25.0 22.0 25.013.0 5.0 5.5 5.5 10.5 10.0 16.0 20.5 21.5 22.0 21.0
Figure 11. Harmonic stream-temperature curves of observed data and statewide harmonic equationfor Alcovy River above Covington, Georgia (station 02208450), October 1972 to July 1975.
Table 4. Estimates of harmonic coefficients for Altamaha River near Gardi using interpolation and observed datacompared with estimates from the statewide harmonic equation[mi2 , square miles; 0 C, degrees Celsius]
Station Period Drainage Harmonic Amplitude Phase
number Station name of area Type of data analysis mean (0 C) coefficientrecord (mi2) (' C) (radians)
02226000 Altamaha River at Doctortown 1937-79 13,600 observed 19.4 10.0 2.75
02226010 Altamaha River near Gardi 1974-84 13,600 observed 19.9 9.6 2.74
interpolated 19.6 9.6 2.73
statewide harmonic equation 19.4 10.0 2.81
02226160 Altamaha River at Everett City 1970-84 14.000 observed 19.7 9.3 2.71
18
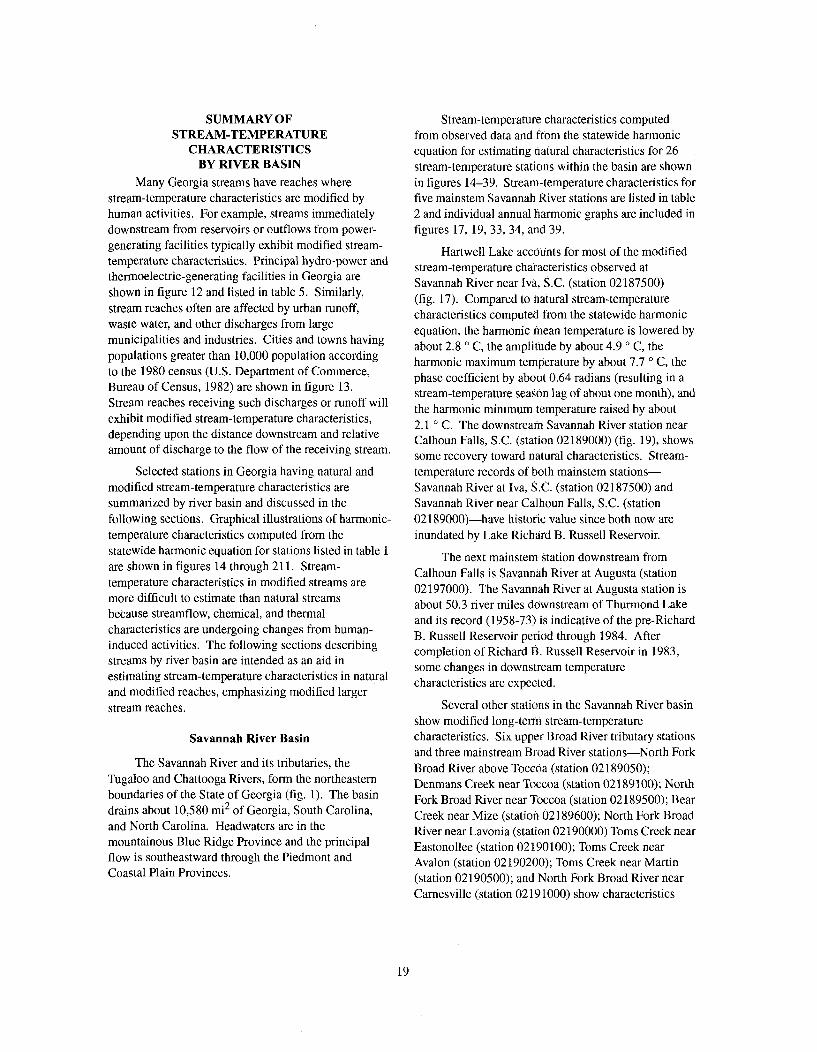
SUMMARY OFSTREAM-TEMPERATURE
CHARACTERISTICSBY RIVER BASIN
Many Georgia streams have reaches wherestream-temperature characteristics are modified byhuman activities. For example, streams immediatelydownstream from reservoirs or outflows from power-generating facilities typically exhibit modified stream-temperature characteristics. Principal hydro-power andthermoelectric-generating facilities in Georgia areshown in figure 12 and listed in table 5. Similarly,stream reaches often are affected by urban runoff,waste water, and other discharges from largemunicipalities and industries. Cities and towns havingpopulations greater than 10,000 population accordingto the 1980 census (U.S. Department of Commerce,Bureau of Census, 1982) are shown in figure 13.Stream reaches receiving such discharges or runoff willexhibit modified stream-temperature characteristics,depending upon the distance downstream and relativeamount of discharge to the flow of the receiving stream.
Selected stations in Georgia having natural andmodified stream-temperature characteristics aresummarized by river basin and discussed in thefollowing sections. Graphical illustrations of harmonic-temperature characteristics computed from thestatewide harmonic equation for stations listed in table 1are shown in figures 14 through 211. Stream-temperature characteristics in modified streams aremore difficult to estimate than natural streamsbecause streamflow, chemical, and thermalcharacteristics are undergoing changes from human-induced activities. The following sections describingstreams by river basin are intended as an aid inestimating stream-temperature characteristics in naturaland modified reaches, emphasizing modified largerstream reaches.
Savannah River Basin
The Savannah River and its tributaries, theTugaloo and Chattooga Rivers, form the northeasternboundaries of the State of Georgia (fig. 1). The basindrains about 10,580 mi2 of Georgia, South Carolina,and North Carolina. Headwaters are in themountainous Blue Ridge Province and the principalflow is southeastward through the Piedmont andCoastal Plain Provinces.
Stream-temperature characteristics computedfrom observed data and from the statewide harmonicequation for estimating natural characteristics for 26stream-temperature stations within the basin are shownin figures 14-39. Stream-temperature characteristics forfive mainstem Savannah River stations are listed in table2 and individual annual harmonic graphs are included infigures 17, 19, 33, 34, and 39.
Hartwell Lake accounts for most of the modifiedstream-temperature characteristics observed atSavannah River near Iva, S.C. (station 02187500)(fig. 17). Compared to natural stream-temperaturecharacteristics computed from the statewide harmonicequation, the harmonic mean temperature is lowered byabout 2.8 0 C, the amplitude by about 4.9 o C, theharmonic maximum temperature by about 7.7 o C, thephase coefficient by about 0.64 radians (resulting in astream-temperature season lag of about one month), andthe harmonic minimum temperature raised by about2.1 0 C. The downstream Savannah River station nearCalhoun Falls, S.C. (station 02189000) (fig. 19), showssome recovery toward natural characteristics. Stream-temperature records of both mainstem stations-Savannah River at Iva, S.C. (station 02187500) andSavannah River near Calhoun Falls, S.C. (station02189000)-have historic value since both now areinundated by Lake Richard B. Russell Reservoir.
The next mainstem station downstream fromCalhoun Falls is Savannah River at Augusta (station02197000). The Savannah River at Augusta station isabout 50.3 river miles downstream of Thurmond Lakeand its record (1958-73) is indicative of the pre-RichardB. Russell Reservoir period through 1984. Aftercompletion of Richard B. Russell Reservoir in 1983,some changes in downstream temperaturecharacteristics are expected.
Several other stations in the Savannah River basinshow modified long-term stream-temperaturecharacteristics. Six upper Broad River tributary stationsand three mainstream Broad River stations-North ForkBroad River above Toccoa (station 02189050);Denmans Creek near Toccoa (station 02189100); NorthFork Broad River near Toccoa (station 02189500); BearCreek near Mize (station 02189600); North Fork BroadRiver near Lavonia (station 02190000) Toms Creek nearEastonollee (station 02190100); Toms Creek nearAvalon (station 02190200); Toms Creek near Martin(station 02190500); and North Fork Broad River nearCarnesville (station 02191000) show characteristics
19
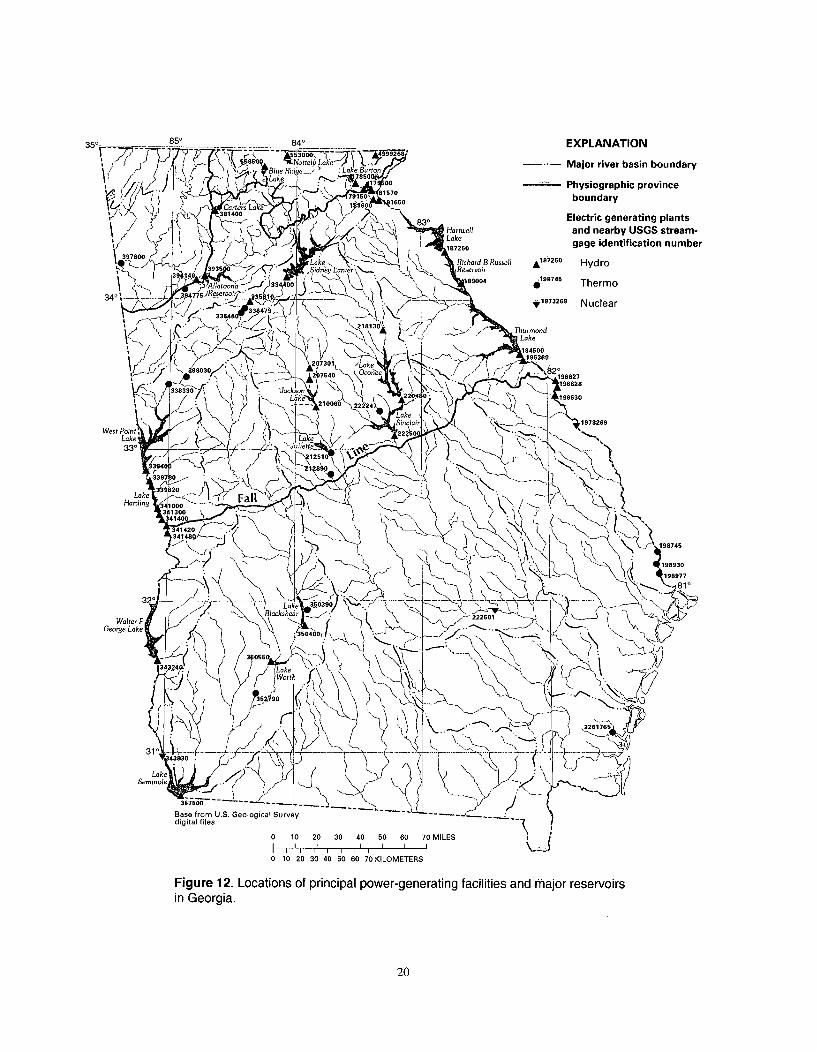
350 850 . .. EXPLANATION
C? mae 'iNcttel Lake r -. Major river basin boundaryI !B lu R id g e _ : L a e B u nto n I
7 00 Physiographic province
Carters50 Lae-~A165o0 boundary830 Electric generating plants
JHartwell and nearby USGS stream-1872e gage identification number
397 Richard B Russell A101 2 6 0
Hydro6Reservoir
39140189004 .198745Allatoona 1380Thermo
3 -. . "-- ..... • 201 1973269 Nuclear
2181'3 j~. Thu rmond
Weal9 Poatkeak
I. ~ 19450
• 1963190
22~Lk 301~9 L I7k I
Wate F100 2224257012
Lake Lake 71973269
34234~~ 26~ 0' ~ I -
310--- 226170
Lake L ak
198274
GereLake "'"(" Fall lk
t
-IHdrdin g tl fles
3 iia~s 1300 eUS eoo ia uvy. . . . . . ./'-• ~- -L .
0 10 20 30 40 50 60 70MILES
i I0 I2 I3 40 5 I I010 20 30 40 50 00 70 KILOMETERS
-IFigure 12. Locations of principal power-generating facilities and major reservoirsin Georgia.
20
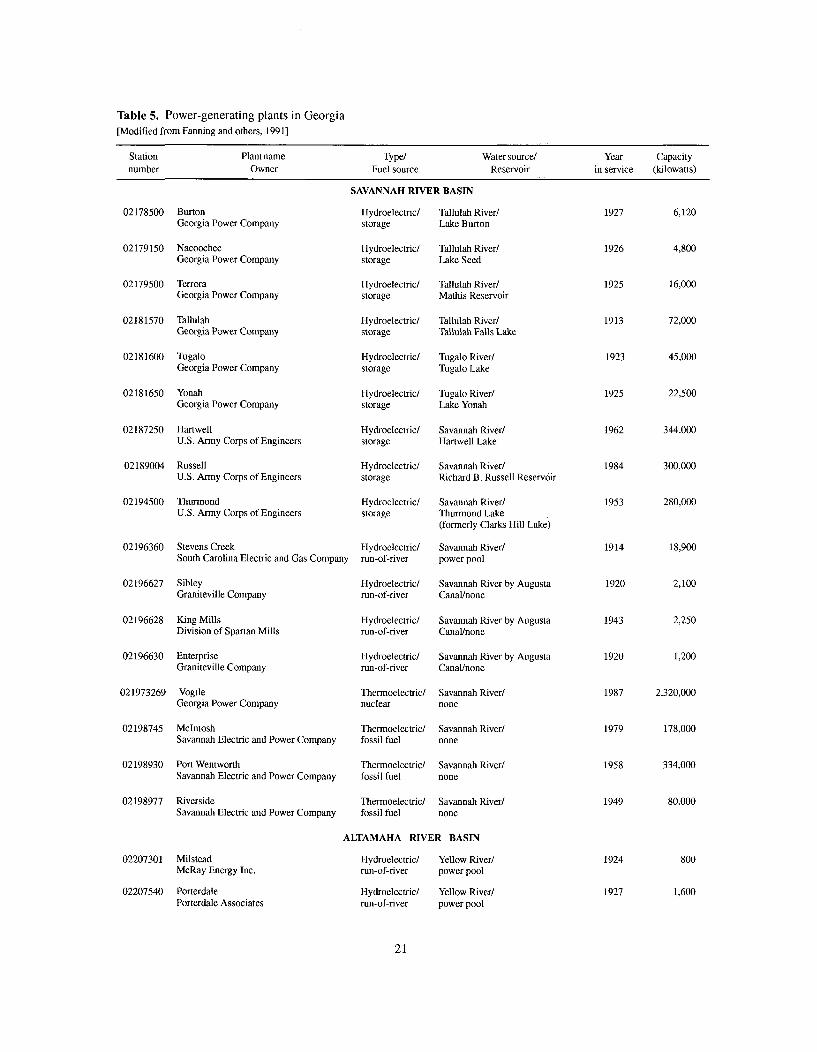
Table 5. Power-generating plants in Georgia[Modified from Fanning and others, 1991]
Station Plant namenumber Owner
02178500
02179150
02179500
02181570
02181600
02181650
02187250
02189004
02194500
02196360
02196627
02196628
02196630
021973269
02198745
02198930
02198977
02207301
02207540
BurtonGeorgia Power Company
NacoocheeGeorgia Power Company
TerroraGeorgia Power Company
TallulahGeorgia Power Company
TugaloGeorgia Power Company
YonahGeorgia Power Company
HartwellU.S. Army Corps of Engineers
RussellU.S. Army Corps of Engineers
ThurmondU.S. Army Corps of Engineers
Stevens CreekSouth Carolina Electric and Gas Company
SibleyGraniteville Company
King MillsDivision of Spartan Mills
EnterpriseGraniteville Company
VogtleGeorgia Power Company
McIntoshSavannah Electric and Power Company
Port WentworthSavannah Electric and Power Company
RiversideSavannah Electric and Power Company
A]
MilsteadMcRay Energy Inc.
PorterdalePorterdale Associates
Type/ Water source!Fuel source Reservoir
SAVANNAH RIVER BASIN
Hydroelectric/ Tallulah River/storage Lake Burton
Hydroelectric/ Tallulah River/storage Lake Seed
Hydroelectric/ Tallulah River/storage Mathis Reservoir
Hydroelectric/ Tallulah River/storage Tallulah Falls Lake
Hydroelectric/ Tugalo River/storage Tugalo Lake
Hydroelectric/ Tugalo River/storage Lake Yonah
Hydroelectric/ Savannah River/storage Hartwell Lake
Hydroelectric/ Savannah River/storage Richard B. Russell Reservoir
Hydroelectric/ Savannah River/storage Thurmond Lake
(formerly Clarks Hill Lake)
Hydroelectric/ Savannah River/run-of-river power pool
Hydroelectric/ Savannah River by Augustarun-of-river Canal/none
Hydroelectric/ Savannah River by Augustarun-of-river Canal/none
Hydroelectric/ Savannah River by Augustarmn-of-river Canal/none
Thermoelectric/ Savannah River/nuclear none
Thermoelectric/ Savannah River/fossil fuel none
Thermoelectric/ Savannah River/fossil fuel none
Thermoelectric/ Savannah River/fossil fuel none
LTAMAHA RIVER BASIN
Hydroelectric/ Yellow River/run-of-river power pool
Hydroelectric/ Yellow River/rmn-of-river power pool
Year Capacityin service (kilowatts)
1927
1926
1925
1913
1923
1925
1962
1984
1953
1914
1920
1943
1920
1987
1979
1958
1949
1924
1927
6.120
4,800
16,000
72,000
45,000
22,500
344.000
300.000
280,000
18,900
2.100
2,250
1,200
2,320,000
178,000
334,000
80,000
800
1,600
21
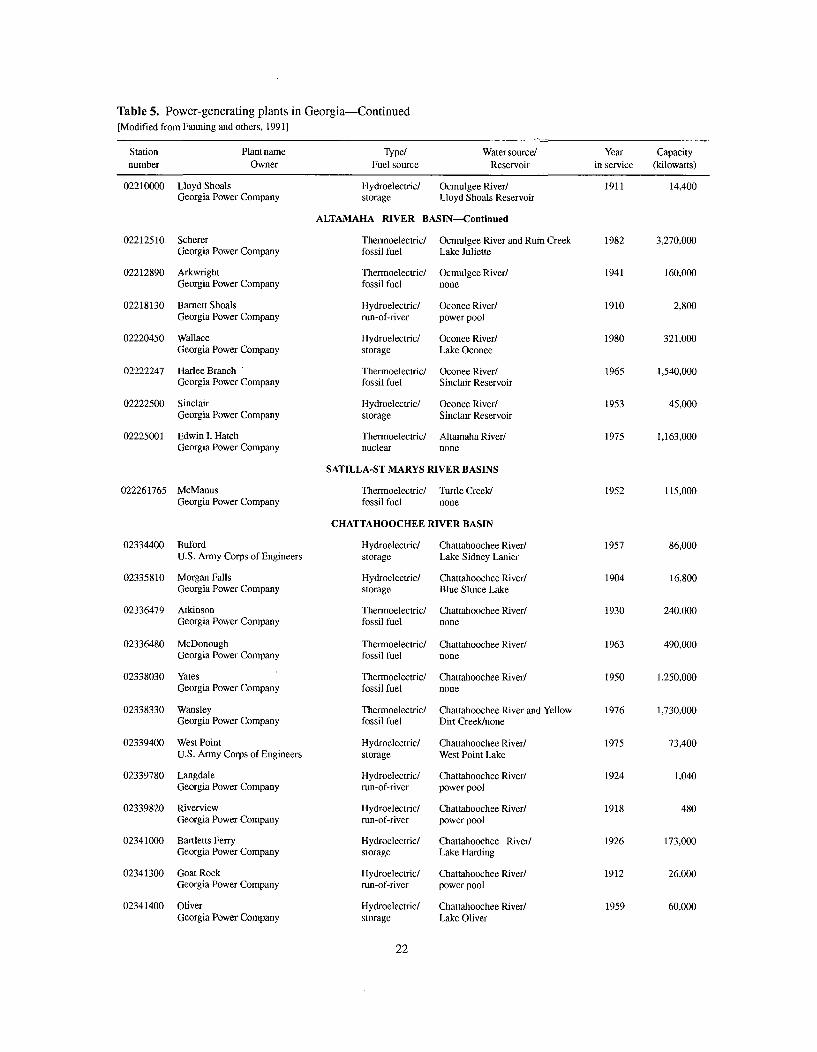
Table 5. Power-generating plants in G[Modified from Fanning and others, 1991]
Station Plant namenumber Owner
02210000 Lloyd ShoalsGeorgia Power Company
eorgia-Continued
02212510
02212890
02218130
02220450
02222247
02222500
02225001
SchererGeorgia Power Company
ArkwrightGeorgia Power Company
Barnett ShoalsGeorgia Power Company
WallaceGeorgia Power Company
Harlee Branch 'Georgia Power Company
SinclairGeorgia Power Company
Edwin I. HatchGeorgia Power Company
022261765 McManusGeorgia Power Company
Type/ Water source/Fuel source Reservoir
Hydroelectric/ Ocmulgee River/storage Lloyd Shoals Reservoir
ALTAMAHA RIVER BASIN-Continued
Thermoelectric/ Ocmulgee River and Rum Creekfossil fuel Lake Juliette
Thermoelectric/ Ocmulgee River/fossil fuel none
Hydroelectric/ Oconee River/run-of-river power pool
Hydroelectric/ Oconee River/storage Lake Oconee
Thermoelectric/ Oconee River/fossil fuel Sinclair Reservoir
Hydroelectric/ Oconee River/storage Sinclair Reservoir
Thermoelectric/ Altamaha River/nuclear none
SATILLA-ST MARYS RIVER BASINS
Thermoelectric/ Turtle Creek/fossil fuel none
CHATTAHOOCHEE RIVER BASIN
Hydroelectric/ Chattahoochee River/storage Lake Sidney Lanier
Hydroelectric/ Chattahoochee River/storage Blue Sluice Lake
Thermoelectric/ Chattahoochee River/fossil fuel none
Thermoelectric/ Chattahoochee River/fossil fuel none
Thermoelectric/ Chattahoochee River/fossil fuel none
Thermoelectric/ Chattahoochee River and Yellowfossil fuel Dirt Creek/none
Hydroelectric/ Chattahoochee River/storage West Point Lake
Hydroelectric/ Chattahoochee River/run-of-river power pool
Hydroelectric/ Chattahoochee River/run-of-river power pool
Hydroelectric/ Chattahoochee River/storage Lake Harding
Hydroelectric/ Chattahoochee River/mun-of-river power pool
Hydroelectric/ Chattahoochee River/storage Lake Oliver
Yearin service
1911
1982
1941
1910
1980
1965
1953
1975
1952
1957
1904
1930
1963
1950
1976
1975
1924
1918
1926
1912
1959
Capacity(kilowatts)
14,400
3,270,000
160,000
2,800
321,000
1,540,000
45,000
1,163,000
115,000
86,000
16,800
240,000
490,000
1.250,000
1,730.000
73,400
1,040
480
173,000
26,000
60,000
02334400
02335810
02336479
02336480
02338030
02338330
02339400
02339780
02339820
02341000
02341300
02341400
BufordU.S. Army Corps of Engineers
Morgan FallsGeorgia Power Company
AtkinsonGeorgia Power Company
McDonoughGeorgia Power Company
YatesGeorgia Power Company
WansleyGeorgia Power Company
West PointU.S. Army Corps of Engineers
LangdaleGeorgia Power Company
RiverviewGeorgia Power Company
Bartletts FerryGeorgia Power Company
Goat RockGeorgia Power Company
OliverGeorgia Power Company
22
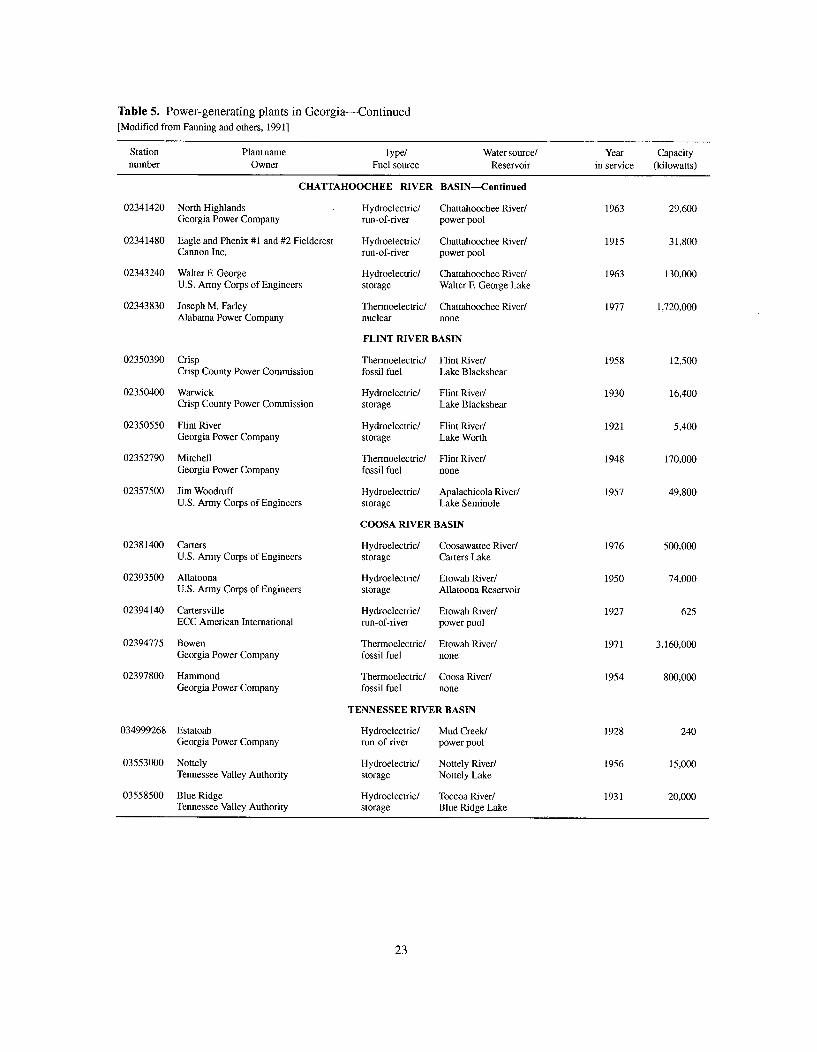
Table 5. Power-generating plants in Georgia-Continued[Modified from Fanning and others, 19911
Station Plant namenumber Owner
02341420
02341480
02343240
02343830
02350390
02350400
02350550
02352790
02357500
02381400
02393500
02394140
02394775
02397800
034999268
03553000
03558500
North HighlandsGeorgia Power Company
Eagle and Phenix #1 and #2Cannon Inc.
Walter F. GeorgeU.S. Army Corps of Engineer
Joseph M. FarleyAlabama Power Company
CrispCrisp County Power Commis
WarwickCrisp County Power Cominis
Flint RiverGeorgia Power Company
MitchellGeorgia Power Company
Jim WoodruffU.S. Army Corps of Engineer
CartersU.S. Army Corps of Engineer
AllatoonaU.S. Army Corps of Engineer
CartersvilleECC American International
BowenGeorgia Power Company
HammondGeorgia Power Company
EstatoabGeorgia Power Company
NottelyTennessee Valley Authority
Blue RidgeTennessee Valley Authority
Type/ Water source/Fuel source Reservoir
CHATTAHOOCHEE RIVER BASIN-Continued
Hydroelectric/ Chattahoochee River/run-of-river power pool
Fieldcrest Hydroelectric/ Chattahoochee River/run-of-river power pool
Hydroelectric/ Chattahoochee River/rs storage Walter E George Lake
Thermoelectric/ Chattahoochee River/nuclear none
FLINT RIVER BASIN
Thermoelectric/ Hint River/sion fossil fuel Lake Blackshear
Hydroelectric/ Flint River/sion storage Lake Blackshear
Hydroelectric/ Flint River/storage Lake Worth
Thermoelectric/ Flint River/fossil fuel none
Hydroelectric/ Apalachicola River/s storage Lake Seminole
COOSA RIVER BASIN
Hydroelectric/ Coosawattee River/s storage Carters Lake
Hydroelectric/ Etowah River/s storage Allatoona Reservoir
Hydroelectric/ Etowah River/run-of-river power pool
Thermoelectric/ Etowah River/fossil fuel none
Thermoelectric/ Coosa River/fossil fuel none
TENNESSEE RIVER BASIN
Hydroelectric/ Mud Creek/run-of-river power pool
Hydroelectric/ Nottely River/storage Nottely Lake
Hydroelectric/ Toccoa River/storage Blue Ridge Lake
Year Capacityin service (kilowatts)
1963
1915
1963
1977
1958
1930
1921
1948
1957
1976
1950
1927
1971
1954
1928
1956
1931
29,600
31,800
130,000
1,720,000
12,500
16,400
5,400
170,000
49,800
500.000
74,000
625
3,160,000
800,000
240
15,000
20,000
23
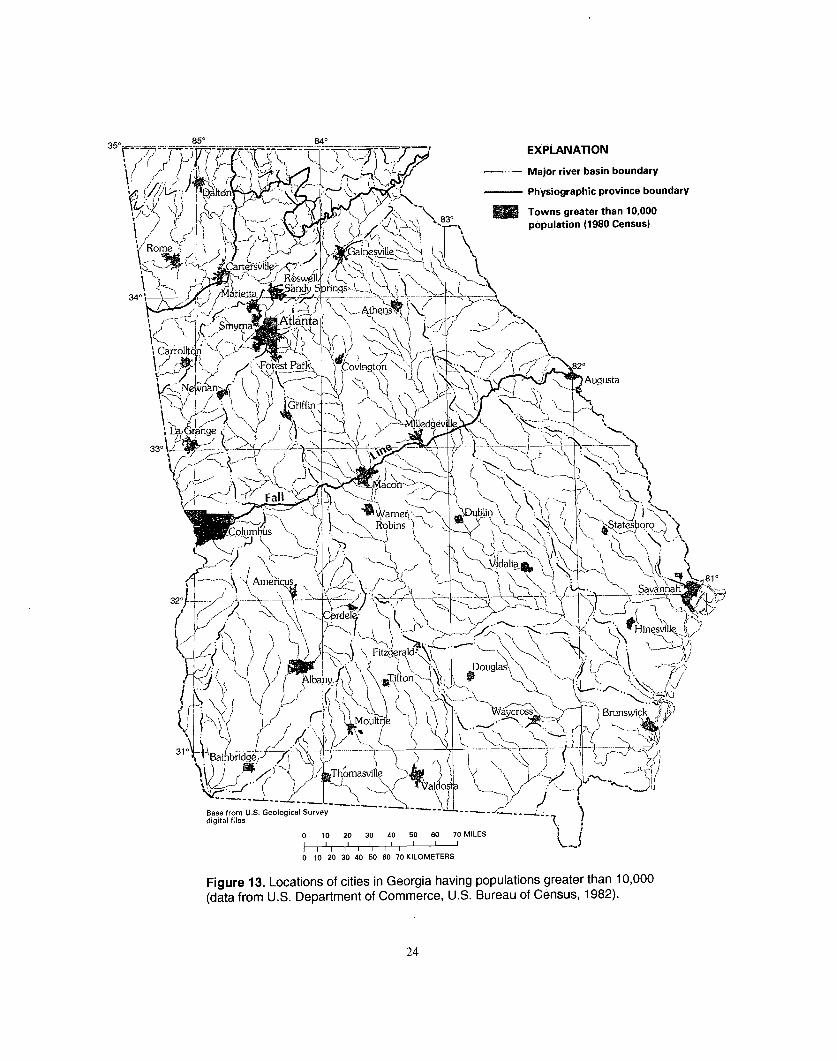
EXPLANATION
. Major river basin boundary
Physiographic province boundary
Towns greater than 10,000population (1980 Census)
330
1.
32°J
310`
Base from U.S. Geological Surveydigital files
- ./-.. -
0 10 20 30 40 50 60 70MILESI i I I i I 1 ,0 10 20 30 40 50 60 70 KILOMETERS
Figure 13. Locations of cities in Georgia having populations greater than 10,000(data from U.S. Department of Commerce, U.S. Bureau of Census, 1982).
24
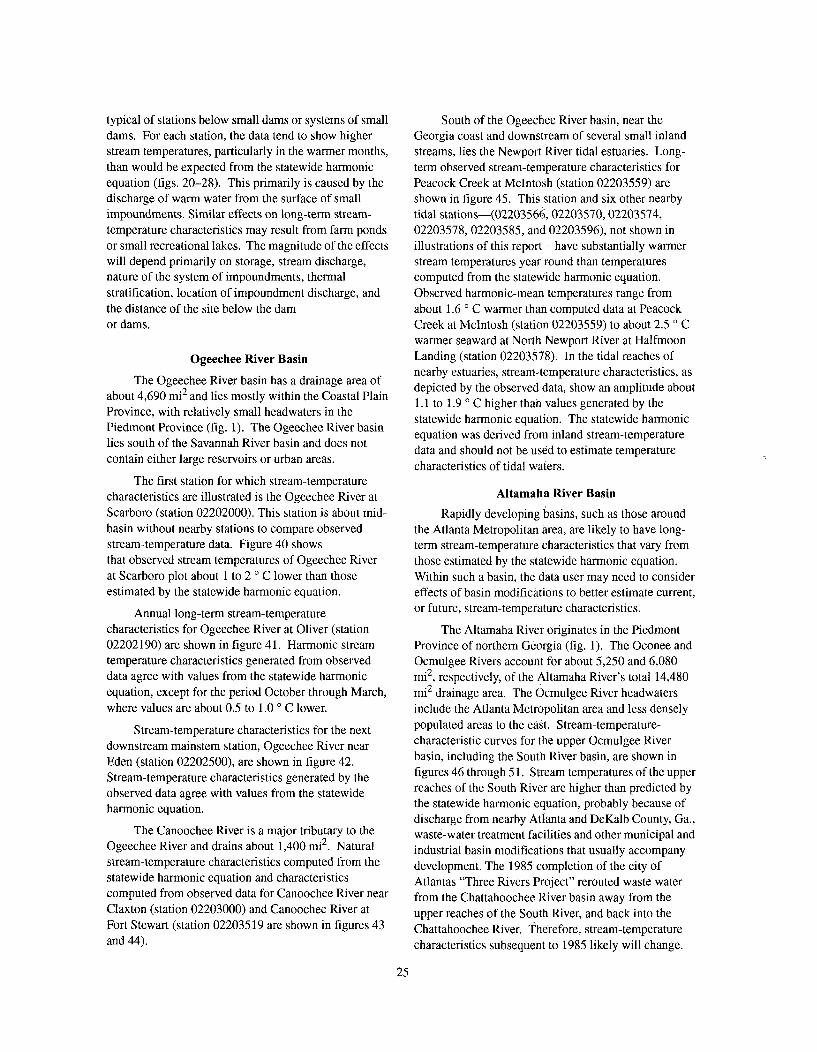
typical of stations below small dams or systems of smalldams. For each station, the data tend to show higherstream temperatures, particularly in the warmer months,than would be expected from the statewide harmonicequation (figs. 20-28). This primarily is caused by thedischarge of warm water from the surface of smallimpoundments. Similar effects on long-term stream-temperature characteristics may result from farm pondsor small recreational lakes. The magnitude of the effectswill depend primarily on storage, stream discharge,nature of the system of impoundments, thermalstratification, location of impoundment discharge, andthe distance of the site below the damor dams.
Ogeechee River Basin
The Ogeechee River basin has a drainage area ofabout 4,690 mi2 and lies mostly within the Coastal PlainProvince, with relatively small headwaters in thePiedmont Province (fig. 1). The Ogeechee River basinlies south of the Savannah River basin and does notcontain either large reservoirs or urban areas.
The first station for which stream-temperaturecharacteristics are illustrated is the Ogeechee River atScarboro (station 02202000). This station is about mid-basin without nearby stations to compare observedstream-temperature data. Figure 40 showsthat observed stream temperatures of Ogeechee Riverat Scarboro plot about 1 to 2 0 C lower than thoseestimated by the statewide harmonic equation.
Annual long-term stream-temperaturecharacteristics for Ogeechee River at Oliver (station02202190) are shown in figure 41. Harmonic stream-temperature characteristics generated from observeddata agree with values from the statewide harmonicequation, except for the period October through March,where values are about 0.5 to 1.0 0 C lower.
Stream-temperature characteristics for the nextdownstream mainstem station, Ogeechee River nearEden (station 02202500), are shown in figure 42.Stream-temperature characteristics generated by theobserved data agree with values from the statewideharmonic equation.
The Canoochee River is a major tributary to theOgeechee River and drains about 1,400 mi 2. Naturalstream-temperature characteristics computed from thestatewide harmonic equation and characteristicscomputed from observed data for Canoochee River nearClaxton (station 02203000) and Canoochee River atFort Stewart (station 02203519 are shown in figures 43and 44).
South of the Ogeechee River basin, near theGeorgia coast and downstream of several small inlandstreams, lies the Newport River tidal estuaries. Long-term observed stream-temperature characteristics forPeacock Creek at McIntosh (station 02203559) areshown in figure 45. This station and six other nearbytidal stations-(02203566, 02203570, 02203574,02203578, 02203585, and 02203596), not shown inillustrations of this report-have substantially warmerstream temperatures year round than temperaturescomputed from the statewide harmonic equation.Observed harmonic-mean temperatures range fromabout 1.6 0 C warmer than computed data at PeacockCreek at McIntosh (station 02203559) to about 2.5 ° Cwarmer seaward at North Newport River at HalfmoonLanding (station 02203578). In the tidal reaches ofnearby estuaries, stream-temperature characteristics, asdepicted by the observed data, show an amplitude about1.1 to 1.9 0 C higher than values generated by thestatewide harmonic equation. The statewide harmonicequation was derived from inland stream-temperaturedata and should not be used to estimate temperaturecharacteristics of tidal waters.
Altamaha River Basin
Rapidly developing basins, such as those aroundthe Atlanta Metropolitan area, are likely to have long-term stream-temperature characteristics that vary fromthose estimated by the statewide harmonic equation.Within such a basin, the data user may need to considereffects of basin modifications to better estimate current,or future, stream-temperature characteristics.
The Altamaha River originates in the PiedmontProvince of northern Georgia (fig. 1). The Oconee andOcmulgee Rivers account for about 5,250 and 6,080mi2, respectively, of the Altamaha River's total 14,480mi2 drainage area. The Ocmulgee River headwatersinclude the Atlanta Metropolitan area and less denselypopulated areas to the east. Stream-temperature-characteristic curves for the upper Ocmulgee Riverbasin, including the South River basin, are shown infigures 46 through 51. Stream temperatures of the upperreaches of the South River are higher than predicted bythe statewide harmonic equation, probably because ofdischarge from nearby Atlanta and DeKalb County, Ga.,waste-water treatment facilities and other municipal andindustrial basin modifications that usually accompanydevelopment. The 1985 completion of the city ofAtlantas "Three Rivers Project" rerouted waste waterfrom the Chattahoochee River basin away from theupper reaches of the South River, and back into theChattahoochee River. Therefore, stream-temperaturecharacteristics subsequent to 1985 likely will change.
25
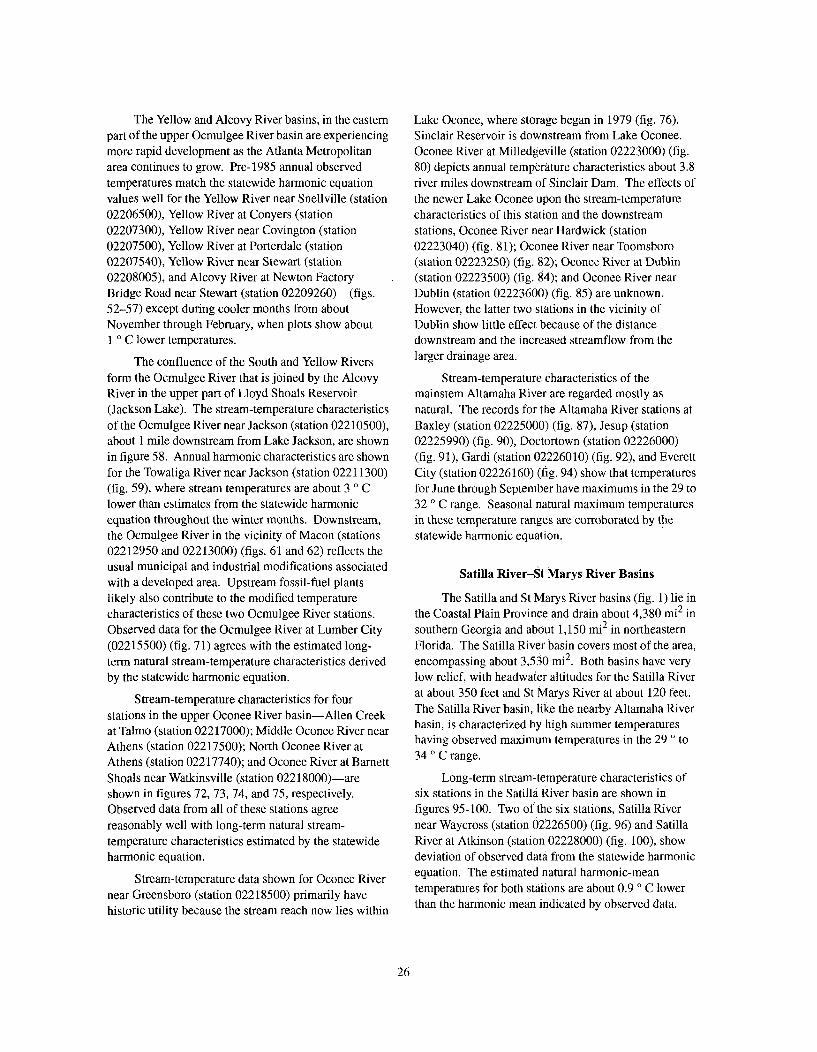
The Yellow and Alcovy River basins, in the easternpart of the upper Ocmulgee River basin are experiencingmore rapid development as the Atlanta Metropolitanarea continues to grow. Pre-1985 annual observedtemperatures match the statewide harmonic equationvalues well for the Yellow River near Snellville (station02206500), Yellow River at Conyers (station02207300), Yellow River near Covington (station02207500), Yellow River at Porterdale (station02207540), Yellow River near Stewart (station02208005), and Alcovy River at Newton FactoryBridge Road near Stewart (station 02209260) (figs.52-57) except during cooler months from aboutNovember through February, when plots show about1 o C lower temperatures.
The confluence of the South and Yellow Riversform the Ocmulgee River that is joined by the AlcovyRiver in the upper part of Lloyd Shoals Reservoir(Jackson Lake). The stream-temperature characteristicsof the Ocmulgee River near Jackson (station 02210500),about 1 mile downstream from Lake Jackson, are shownin figure 58. Annual harmonic characteristics are shownfor the Towaliga River near Jackson (station 02211300)(fig. 59), where stream temperatures are about 3 0 Clower than estimates from the statewide harmonicequation throughout the winter months. Downstream,the Ocmulgee River in the vicinity of Macon (stations02212950 and 02213000) (figs. 61 and 62) reflects theusual municipal and industrial modifications associatedwith a developed area. Upstream fossil-fuel plantslikely also contribute to the modified temperaturecharacteristics of these two Ocmulgee River stations.Observed data for the Ocmulgee River at Lumber City(02215500) (fig. 71) agrees with the estimated long-term natural stream-temperature characteristics derivedby the statewide harmonic equation.
Stream-temperature characteristics for fourstations in the upper Oconee River basin-Allen Creekat Talmo (station 02217000); Middle Oconee River nearAthens (station 02217500); North Oconee River atAthens (station 02217740); and Oconee River at BarnettShoals near Watkinsville (station 02218000)-areshown in figures 72, 73, 74, and 75, respectively.Observed data from all of these stations agreereasonably well with long-term natural stream-temperature characteristics estimated by the statewideharmonic equation.
Stream-temperature data shown for Oconee Rivernear Greensboro (station 02218500) primarily havehistoric utility because the stream reach now lies within
Lake Oconee, where storage began in 1979 (fig. 76).Sinclair Reservoir is downstream from Lake Oconee.Oconee River at Milledgeville (station 02223000) (fig.80) depicts annual temperature characteristics about 3.8river miles downstream of Sinclair Dam. The effects ofthe newer Lake Oconee upon the stream-temperaturecharacteristics of this station and the downstreamstations, Oconee River near Hardwick (station02223040) (fig. 81); Oconee River near Toomsboro(station 02223250) (fig. 82); Oconee River at Dublin(station 02223500) (fig. 84); and Oconee River nearDublin (station 02223600) (fig. 85) are unknown.However, the latter two stations in the vicinity ofDublin show little effect because of the distancedownstream and the increased streamflow from thelarger drainage area.
Stream-temperature characteristics of themainstem Altamaha River are regarded mostly asnatural. The records for the Altamaha River stations atBaxley (station 02225000) (fig. 87), Jesup (station02225990) (fig. 90), Doctortown (station 02226000)(fig. 91), Gardi (station 02226010) (fig. 92), and EverettCity (station 02226160) (fig. 94) show that temperaturesfor June through September have maximums in the 29 to32 0 C range. Seasonal natural maximum temperaturesin these temperature ranges are corroborated by thestatewide harmonic equation.
Satilla River-St Marys River Basins
The Satilla and St Marys River basins (fig. 1) lie inthe Coastal Plain Province and drain about 4,380 mi2 insouthern Georgia and about 1,150 mi2 in northeasternFlorida. The Satilla River basin covers most of the area,encompassing about 3,530 mi 2 . Both basins have verylow relief, with headwater altitudes for the Satilla Riverat about 350 feet and St Marys River at about 120 feet.The Satilla River basin, like the nearby Altamaha Riverbasin, is characterized by high summer temperatureshaving observed maximum temperatures in the 29 0 to34 ° C range.
Long-term stream-temperature characteristics ofsix stations in the Satilla River basin are shown infigures 95-100. Two of the six stations, Satilla Rivernear Waycross (station 02226500) (fig. 96) and SatillaRiver at Atkinson (station 02228000) (fig. 100), showdeviation of observed data from the statewide harmonicequation. The estimated natural harmonic-meantemperatures for both stations are about 0.9 0 C lowerthan the harmonic mean indicated by observed data.
26
Suwannee-Ochlockonee River Basins
Principal streams in the Suwannee River andOchlockonee River basins in Georgia are theWithlacoochee, Alapaha, Suwannee and OchlockoneeRivers (fig. 1). The Suwannee and Ochlockonee Riverbasins cover south-central Georgia and north-centralFlorida and are about equally divided between the twoStates. The Okefenokee Swamp is in the headwaters ofthe Suwannee River and covers about 1,100 mi2 of theeastern end of the basin at an altitude of about 120 feet.The Suwannee River flows southward and thenwestward into the Gulf of Mexico. The headwaters ofboth the Withlacoochee and Alapaha Rivers are in thenorthern end of the basin with altitudes at about 450 ft.
Long-term harmonic characteristics are shownfor 12 stations in the Suwannee River basin (figs. 101-112). The harmonic-mean stream temperaturecomputed from observed data for Suwannee River atFargo (station 02314500) (fig. 101) is about 0.6 0 Chigher than the value computed from the statewideharmonic equation. This station includes the drainageof much of the Okefenokee Swamp which may accountfor the slightly higher stream-temperaturecharacteristics. As in the adjacent Satilla River basin,summer temperatures are high, with observedtemperatures as high as 31 o C, and wintertemperatures vary widely from 4 to 21 o C.
Four Ochlockonee River basin stations-Ochlockonee River near Moultrie (station 02327205);Ochlockonee River near Thomasville (station02327500); Tired Creek near Cairo (station 02328000);and Ochlockonee River near Calvary (station02328200)-are shown in figures 113-116. Theharmonic stream-temperature coefficients computedfrom observed data closely match those from thestatewide harmonic equation except for OchlockoneeRiver near Calvary (station 02328200) (fig. 116), whichplots about 1.4 ° C lower than the curve formed by thestatewide equation. However, the Ochlockonee Rivernear Calvary station data spans only the 1974-84period. Values computed from the statewide harmonicequation agree well with those values computed fromobservations for Ochlockonee River near Thomasville(station 02327500) (fig. 114) with data spanning theyears 1954-84. A reexamination of harmoniccoefficients for the Ochlockonee River nearThomasville station for the 1974-84 period (as was usedfor the Ochlockonee River near Calvary station)indicates that the harmonic mean for the Thomasvillestation also was about 0.9 0 C below the valuescomputed by the statewide harmonic equation.Therefore, observed temperature data for the 1974-84
period plotted below the statewide harmonic equation inboth instances.
Chattaho0chee River Basin
The Chattahoochee River basin extends from theBlue Ridge Province in northern Georgia to thesouthwestern tip of the State at the confluence with theFlint River (fig. 1). The basin drains about 8,770 mi2,
mostly in Georgia. The maximum width of the basin isabout 55 miles.
The Chattahoochee River system is the principalwater supply for about one half of Georgia's population(Marella and others, 1993). In addition, the river systemserves industry; provides recreation and fishing;generates power; assimilates wastes; and in the southernreaches of the river, supports shipping. Populationprojections for the upper Chattahoochee River basin,within the Piedmont Province, predict continuinggrowth (Brown, 1981).
Long-term observed stream-temperaturecharacteristics for stations within the ChattahoocheeRiver basin are shown in figures 117-145. Figures 117through 119 show temperature-characteristic curves forthree stations-Chattaho ochee River near Leaf(station 02331000); Chattahoochee River near Cornelia(station 02331600); and Chestatee River at StateHighway 52 near Dahlonega (station 02333500)-inthe upper part of the basin. Each of these three stationscompare well with curves computed from the statewideharmonic equation and shows mostly natural stream-temperature characteristics.
Stream-temperature characteristics forChattahoochee River near Buford (station 02334500),about 2.3 miles downstream from Lake Sidney Lanierare shown in figure 120. A harmonic-mean observedstream temperature of about 9.2 0 C is 6.1 0 C lowerthan the mean estimated by the statewide harmonicequation. In this reach of the Chattahoochee River,observed year-round temperatures are about the same asminimum winter temperatures estimated by thestatewide harmonic equation. These lower temperaturesoccur because of the dominant impact of storage of largevolumes of winter-season water in the large reservoir,Lake Sidney Lanier near Gainesville, Ga., formed byBuford Dam. Water from Lake Sidney Lanier isdischarged from depth, unlike surface-outlet structurescharacteristic of smaller ponds mentioned earlier. Aphase coefficient lag of 0.64 radians effectively shiftsthe stream-temperature season by about 37 days. Coolerthan natural stream temperatures also were observed atChattahoochee River near Norcross (station 02335000)(fig. 121), about 18 miles downstream from Lake Sidney
27
Lanier. Thirty-five stream-temperature measurementsduring May 1937 to December 1938 for theChattahoochee River at Atlanta (station 02336000) priorto the construction of Lake Sidney Lanier are shown infigure 123. Long-term stream-temperaturecharacteristic curves for Chattahoochee River at Atlanta(station 02336000) for the period after Lake SidneyLanier (1957-79) are shown in figure 124. AtChattahoochee River at Atlanta, summer temperaturesaverage about 6.0 ' C lower than computed naturalvalues. The station is located about 9.5 river milesdownstream from Morgan Falls Dam, a small 16.8kilowatt power-generation and river-regulation facility.
Harmonic stream-temperature characteristiccurves for Peachtree Creek at Atlanta (station02336300), are shown in figure 125. The PeachtreeCreek basin is totally within the Atlanta Metropolitanarea. Stream-temperature measurements at thisstation show summer maximum temperatures in the28 to 31 0 C range. The harmonic maximum for theobserved temperature data is about 26 0 C-about 3 ' Chigher than statewide harmonic equation values.Harmonic maximum stream temperatures of thismagnitude would normally be expected tooccur much farther south, indicating the effects ofurban development.
Stream-temperature characteristics atChattahoochee River at Interstate Highway 285 nearAtlanta (station 02336502) are shown in figure 126.Temperatures show a marked increase over values fromChattahoochee River at Atlanta (station 02336000)which is about 5.3 river miles upstream. The harmonic-mean temperature increase of about 2.6 0 C is caused, inpart, by the return of cooling water from electric-generating plants and from wastewater returns. Summertemperatures show more variability than natural, withsome measured values near 30.0 0 C, which is moretypical of a south Georgia stream. Also, as mentionedearlier, differing analysis periods (1957-79 forChattahoochee River at Atlanta) also could account forsome of the differences between the two stations.
Long-term stream temperatures for four tributarystreams-Sweetwater Creek near Austell (station02337000); North Fork Camp Creek at Atlanta(station 02337100); Dog River near Fairplay (station02337438); and Snake Creek near Whitesburg (station02337500)-are shown in figures 127, 128, 130, and131. Amplitude coefficients determined by observed
data for Sweetwater Creek near Austell (02337000) (fig.127) and Dog River near Fairplay (02337438) (fig. 130)are about 0.8 ° C above values predicted by the
statewide harmonic equation. Stream-temperaturecharacteristics from observed data for North Fork CampCreek at Atlanta (02337100) (fig. 128) show substantialdeparture from values calculated by the statewideharmonic equation. However, the drainage area ofNorth Fork Camp Creek at Atlanta is only 5.3 mi2 ; wellbelow the 20 mi 2 minimum drainage area recommendedfor use with the statewide harmonic equation.
Stream-temperature characteristics forChattahoochee River mainstem stations, ChattahoocheeRiver near Fairbum (station 02337170), Chattahoocheenear Whitesburg (station 02338000), andChattahoochee River at U.S. Highway 27 at Franklin(station 02338500) are shown in figures 129, 132, and133, respectively. Stream-temperature characteristicsfor Chattahoochee River at West Point (station02339500) are shown in figures 136 and 137. Thestation is about 3 miles downstream from West PointLake. Figure 136 depicts pre-West Point Lakeconditions and figure 137 represents post-West PointLake conditions. Stream-temperature characteristicsshow only a slight damping of post-Lake harmonicnatural amplitude from 9.2 to about 9.1 0 C. The mostapparent post-Lake difference is in the phase coefficientwhich changed from about 2.8 to about 2.6 radians or aseasonal lag of about 12 days.
Flint River Basin
The headwaters of the Flint River are located in thePiedmont Province of Georgia in the highly developedarea south of Atlanta (fig. 1). The basin hasa drainage area of about 8,460 mi2 and an averagewidth of about 40 miles.
Long-term annual harmonic stream-temperaturecharacteristics for stations in the Flint River basin areshown in figures 146-167; Harmonic mean andamplitude coefficients from the upper reaches of thebasin typically are about I to 2 0 C above valuescomputed from the statewide harmonic equation.This may be attributable to natural causes and effects ofdevelopment near the stations. Long-term stream-temperature characteristics for Flint River near Culloden(station 02347500) are shown in figure 154. At thisstation, the computed harmonic mean coefficient isabout 0.2 0 C higher and the amplitude coefficient isabout 0.8 0 C higher than values computed from thestatewide harmonic equation. Flint River near Cullodenwas among stations selected as mostly natural and it was
used to compute the statewide harmonic equation.
28
Downstream, Whitewater Creek belowRambulette Creek near Butler (station 02349000)(fig. 155) was selected as a natural stream-temperaturecharacteristics site. However, characteristics for thisstation generated by the statewide harmonic equationdiffer substantially from values shown by the moredamped actual-data curve. This damping primarily isdue to the large ground-water discharge to streamswithin the Whitewater Creek basin. For example,during extended low-flow periods, streamflows ofWhitewater Creek below Rambulette Creek near Butler(drainage area of 94 mi2) approach streamflows of themuch larger drainage area of the Flint River nearCulloden (1,850 mi 2). The data-derived harmonic-meancoefficient of 17.1 0 C is greater than the regionallycomputed harmonic mean of 16.6 ' C. A similar affect,but not as pronounced, of ground-water discharge tostreams also is seen in figure 157 for Turkey Creek atByromville (station 02349900).
Long-term annual harmonic stream-temperaturecharacteristics for the lower Flint River basin tributarystations are shown in figures 159, 163, 164, and 167.Data-derived harmonic curves agree well with thestatewide harmonic equation curves, except for PachitlaCreek near Edison (station 02353400) (fig. 163) andIchawaynochaway Creek at Milford (station 02353500)(fig. 164), where amplitude coefficients are damped byabout 0.9 0 C, possibly because of ground-water inflow.
Figures 162, 165, and 166 show annual harmoniccharacteristics of three lower mainstem Flint Riverstations: Flint River at Newton (station 02353000), FlintRiver at Bainbridge (station 02356000), and Flint Riverbelow State Docks at Bainbridge (station 02336015).The temperature characteristics of the latter two of thesestations may be somewhat affected by backwaters ofLake Seminole.
Coosa River Basin
The Coosa River basin covers about 4,360 mi2 ofValley and Ridge, Blue Ridge, and Piedmont Provincesin northwest Georgia (including a small part of southernTennessee) (fig. 1). The Coosa River is formed by theconfluence of the Oostanaula and Etowah Rivers(fig. 2). Streams in this basin serve many small towns;several hydropower and steam-power facilities; largeindustrial centers, such as the carpet industry at Dalton;and several medium-size towns, such as Rome.
Long-term annual stream-temperaturecharacteristics of headwater streams are shown infigures 168-170. For these stations, the statewideharmonic equation yields amplitudes from about 0.3 to0.9 0 C greater than those derived from data. Furtherdownstream, the records for the period 1965-72 for
Coosawattee River at Carters (station 02382500) (fig.172) and 1957-72 for Coosawattee River near PineChapel (station 02383500) (fig. 174) are prior to theimpoundment of Carters Lake; and therefore, primarilyhave historic utility. Modified stream-temperaturecharacteristics for Coosawattee River near Calhoun(station 02383540) for the post-Carters Lake period of1974-84 are shown in figure 175. Carters Lake and itsre-regulation dam cause a shift in the natural phase co-efficient that amounts to a seasonal lag of about 15 days.Also, the observed-data amplitude value of 8.8 ' C islower than the estimated natural value of about 9.6 ' C.
Stream-temperature characteristics for two smallCoosa River basin tributary streams-Scarecorn Creekat Hinton (station 02382000) and Rock Creek nearFairmont (station 02383000)-are shown in figures 171and 173, respectively. The harmonic-characteristiccurves for both stations average 1.0 to 1.5 0 C above thestatewide harmonic equation.
Annual temperature-characteristic curves forConasauga River near Dalton (station 02384748) andHolly Creek near Chatsworth (station 02385800) areshown in figures 176 and 177. Both stations areconsidered representative of mostly naturalconditions and are included in the stations used for thestatewide regression analyses (table 3). The harmonicmean and amplitude coefficients are about 0.5 0 Chigher than values computed from the statewideharmonic equation.
Annual stream-temperature characteristic curvesfor Conasauga River at Tilton (station 02387000) andConasauga River near Resaca (station 02387050) areshown in figures 178 and 179. Temperatures recorded atthe Tilton station likely are affected by industrial andland-use activities in the Dalton area. Naturaltemperatures for stations having similar basincharacteristics as the Tilton station typically occurfurther south. Downstream, at Conasauga River nearResaca (station 02387050) (fig. 179), harmonic-mean
and amplitude coefficients from observed data are about0.6 and 0.8 0 C higher than respective values generatedby the statewide harmonic equation.
In the vicinity of Resaca, Ga., the Conasauga andCoosawattee Rivers combine to form the OostanaulaRiver. The first Oostanaula River temperature stationdownstream of this confluence is the Oostanaula Riverat Resaca (station 02387500). The data andcharacteristic curves for this station are shown in figure180. The period of observed temperature data analysis(1957-72) preceded the construction of Carters Lake andwas included as one of the 78 statewide harmonicanalysis stations (table 3).
29
Harmonic curves for Oostanaula River at 1-75 atResaca (station 02387502) for the post-Carters Lakeperiod of 1974-84 are shown in figure 181. This stationis only a few miles downstream from the confluence ofthe Conasauga and Coosawattee Rivers. Streamtemperatures at Oostanaula River at 1-75 at Resaca moreclosely resemble the post-Carters Lake temperatures ofthe higher yielding Coosawattee River near Calhoun(fig. 175), with damped harmonic mean and amplitude,than those of the Conasauga River near Resaca(fig. 179).
Harmonic temperature curves computed fromobserved data and the statewide harmonic equation forWest Armuchee Creek near Subligna (station 02388000)are shown in figure 182. West Armuchee Creek nearSubligna has a small 36 mi2 drainage area. Duringwinter months, the observed-data curve is severaldegrees higher than the statewide harmonic equationcurve. This difference likely is attributable tosubstantial ground-water discharge, characteristic ofmany small streams within the Valley andRidge Province.
Figure 183 shows pre-Carters Lake data (1957-73)for Oostanaula River at Rome (station 02388500).Harmonic curves from the statewide harmonic equationand from the observed data are in close agreement withharmonic mean, amplitude, and phase coefficients,differing only by 0.3 0 C, 0.4 0 C, and 0.07 radians,respectively. The harmonic curve from the post-CartersLake period is shown for Oostanaula River (RomeIntake) at Rome (station 02388520) in figure 184.The only harmonic coefficient that shows a noticeabledifference from the statewide harmonic equation forthe period 1974-84 is the phase coefficient, with a lagof about 0.13 radians or about eight days.
Annual harmonic stream-temperaturecharacteristics for Etowah River near Dawsonville(station 02389000) are shown in figure 185. Theharmonic curve from the statewide harmonic equationplots about 1 ' C above the curve derived fromobserved data for January through July. This isconsistent with Etowah River near Canton (station02392000) shown in figure 187. For the Cantonstation, the 1 ° C cooler temperature is evident yearround. Both the Dawsonville and Canton stations areamong those selected to compute the statewideharmonic equation. Figure 186 shows stream-temperature data and characteristics for Shoal Creeknear Dawsonville (station 02389300). The observeddata for the Shoal Creek station shows a harmonicamplitude coefficient about 0.8 0 C lower than the
amplitude from the statewide harmonic equation.Figures 188 and 189 show the temperaturecharacteristics at Little River near Roswell (station02392500) for periods 1959-64 and 1964-75,respectively. The harmonic mean and amplitudecoefficients computed from the 1964-75 data are about1.5 0 C above respective values from 1959-64 and fromthe statewide harmonic equation. These differenceslikely are due to urban development, streamchannelization, and pond construction within the LittleRiver basin.
Computed annual stream-temperaturecharacteristics for Etowah River at Allatoona Damabove Cartersville (station 02394000) for a short pre-Allatoona Reservoir period are shown in figure 190.Allatoona Reservoir was completed in 1949 and islocated about 0.8 miles upstream from station02394000. Because the pre-Allatoona Reservoir record,shown in figure 190, continued only about one year(1938-39), no harmonic curve is shown for the data.Annual stream-temperature characteristics for the post-Allatoona Reservoir period (1958-84) are shown infigure 191. The more current record shows harmonicmean and amplitude coefficients both about 0.4 0 Clower and the phase coefficient about 0.42 radians lowerthan respective values of the statewide harmonicequation. The shift in phase coefficient amounts to aseasonal lag of about 24 days.
Harmonic characteristics for Etowah River aboveKingston (station 02394980), Etowah River nearKingston (station 02395000), and Etowah River atRome (station 02396000) are shown in figures 193, 194,and 195. Harmonic characteristics computed frommeasurements for these reaches of the Etowah Riverreflect the effects of reservoir, industrial, municipal, andfossil-fuel power-generation activities.
The Coosa River is formed by the confluence ofthe Oostanaula and Etowah Rivers in Rome, Ga. Figure196 shows stream-temperature characteristics for CoosaRiver near Rome (station 02397000) for the period1957-84. Harmonic coefficients computed from theperiodic stream-temperature measurements show abouta 0.6 0 C compression and a 0.16 radian (about 10 days)lag for the amplitude and phase coefficients,respectively, when compared with coefficients from thestatewide harmonic equation. Allatoona Dam on theEtowah River may be the principal cause of most ofthese differences.
Harmonic coefficients for tributary Cedar Creeknear Cedartown (station 02397500), Chattooga River atSummerville (station 02398000), and Chattooga River
30
at Chattoogaville (02398037) are shown in figures 197,199, and 200, respectively. The Cedartown,Summerville, and Chattoogaville stations all showhigher harmonic mean and lower amplitude coefficientsthan values estimated from the statewide harmonicequation. This may be caused by larger ground-waterdischarge to these streams.
Annual harmonic stream-temperaturecharacteristics for Coosa River (at the Georgia-AlabamaState line) near Coosa (station 02397530) for the period1974-84 are shown in figure 198. The harmonic curve,generated by the measured data, plots about 2 to 3 ' Chigher than the curve derived from the statewideharmonic equation throughout most of the year.Observed summer stream-temperature maximum andaverage values (harmonic mean values) at Coosa Rivernear Coosa are typical of streams much farther south.Elevated stream temperatures may be attributable toreturn flow from power generation at Plant Hammondand other industrial and municipal activities in thevicinity of Rome, Ga.
Tennessee River Basin
The Tennessee River basin (fig. 1) covers only afew square miles in northern Georgia. In general, theTennessee River basin streams in Georgia flownorthward to Tennessee; whereas, most other streams inthe State flow southward. Harmonic coefficientscomputed from periodic stream-temperaturemeasurements from the Tennessee River basin (fig. 1)are shown in figures 204-211. Tennessee River basinstations used to compute the statewide harmonicequation include Hiawassee River at Presley (station03545000) (fig. 204); Toccoa River near Dial (station03558000) (fig. 207); Fightingtown Creek atMcCaysville (station 0356000) (fig. 209); SouthChickamauga Creek at Graysville (station 03566800)(fig. 210); and West Chickamauga Creek near Lakeview(station 03567340) (fig. 211). Each of these curvesexcept Toccoa River near Dial have harmonic meantemperatures about 0.1 to 1.0 0 C higher and amplitudesabout 0.1 to 1.1 0 C lower than those computed by thestatewide harmonic equation.
Nottely River at Nottely Dam near Ivylog (station03553500) (fig. 206) and Toccoa River near Blue Ridge(03559000) (fig. 208) are immediately downstreamfrom impoundments and stream-temperature dataindicate modified characteristics. Both stations haveannual harmonic mean and amplitude coefficients about1 o C lower than values computed from the statewideharmonic equation. Phase coefficients for both stationsare about 2.1 radians, lagging the natural season byabout 41 days.
SELECTED REFERENCESAagaard, F.C., 1969, Temperature of surface waters in
Montana, prepared for Montana Fish and GameDepartment: U.S. Geological Survey (unnumberedreport), 613 p.
Anderson, W.P., 1971, Temperature of Florida streams:Florida Department of Natural Resources, Bureau ofGeology, map series 43, 1 plate.
Anderson, P.W., and Faust, S.D., 1973, Characteristicsof water quality and stream flow-Passaic Riverbasin above Little Falls, New Jersey: U.S.Geological Survey Water-Supply Paper 2026, 80 p.
Blakely, J.F., 1966, Temperature of surface waters in theconterminous United States: U.S. Geological SurveyHydrologic Investigations Atlas HA-235,8 p., 3 plates.
Blodgett, J.C., 1970, Water temperatures of Californiastreams, Sacramento basin subregion: U.S.Geological Survey Open-File Report (unnumbered).
Brown, C.C., 1981, Metropolitan Atlanta area water-resources management study: Savannah, Ga., U.S.Army Corps of Engineers, Environmental ImpactStatement, final report, appendix A-G, variouslypaged.
Calandro, A.J., 1969, Temperature analysis of a stream:U.S. Geological Survey Professional Paper 650-B, p.B1174-B1179.
Collings, M.R., 1969, Temperature analysis of a stream:U.S. Geological Survey Professional Paper 650-B, p.B174-B179.
Collings, M.R. and Higgins, G.T., 1973, Streamtemperatures in Washington State: U.S. GeologicalSurvey Hydrologic Investigations Atlas HA-385,4 sheets.
Dyar, T.R. and Stokes, W.R., III, 1973, Watertemperatures of Georgia streams: Atlanta, Ga.,Georgia Department of Natural Resources,Environmental Protection Division, unnumberedreport, 317 p.
Fanning, J.L., Doonan, G.A., Trent, V.P., andMcFarlane, R.D., 1991, Power generation andrelated water use in Georgia: Georgia GeologicSurvey Information Circular 87, 37 p.
Gilroy, E.D., and Steele, T.D., 1972, An analysis ofsampling frequency alternatives for fitting a dailystream-temperature model in Proceedings, Inter-national Symposium on Uncertainties in Hydrologicand Water Resource Systems, Tucson, Arizona,December 1972: Proceedings, v. 2, p. 594-608.
31
REFERENCES-Continued
Hawkinson, R.D., Ficke, J.F., and Saindon, L.G., 1977,Quality of rivers of the United States, 1974 wateryear, based on the National Stream QualityAccounting Network (NASQAN): U.S. GeologicalSurvey Open-File Report 77-151, 158 p.
Kothandaraman, V., 1971, Analysis of water-temperature variations in large rivers: AmericanSociety Civil Engineers, Journal SanitaryEngineering Division, v. 97, no. SA1, February1971, p. 19-31.
Kothandaraman, V., and Evans, R.L., 1972, Use of air-water relationships for predicting water temperature:Urbana, Ill., Illinois State Water Survey, Report ofInvestigation 69, 14 p.
Lamar, W.L., 1944, Chemical character of surfacewaters of Georgia: U.S. Geological Survey Water-Supply Paper 889-E, p. 325-334.
Marella, R.L., Fanning, J.L., and Mooty, W.S., 1993,Estimated use of water in the Apalachicola-Chattahoochee-Flint River basin during 1990 withState summaries from 1970 to 1990: U.S.Geological Survey Water-Resources InvestigationsReport 93-4084, 45 p.
McCarthy, L.T., Jr., and Keighton, W.B., 1964, Qualityof Delaware River water at Trenton, New Jersey inContributions to the hydrology of the United States:U.S. Geological Survey Water-Supply Paper 1779,p. X-I-X-51, 1 plate.
Moore, A.M., 1967, Correlation analysis of watertemperature data for Oregon streams: U.S.Geological Survey Water-Supply Paper 1819-K,53 p.
Pluhowski, E.J., 1970, Urbanization and its effect on thetemperature of streams on Long Island, New York:U.S. Geological Survey Professional Paper 627-D,lo0p.
Rawson, Jack, 1970, Reconnaissance of watertemperature of selected streams in southeasternTexas, prepared by U.S. Geological SurveyforTexas Water Development Board: Austin, Tx.,Texas Water Development Board, Report 105, 12 p.
Reheis, H.E, Dozier, J.C., Word, D.M. and Holland,J.R., 1982, Treatment-cost savings through monthlyvariable effluent limits: Journal of the WaterPollution Federation, v. 54, no. 8,p. 1,224-1,230.
Steele. T.D., 1974, Harmonic analysis of streamtemperatures: Springfield, Va., U.S. Dept.Commerce, National Technical Information Service,Computer Contribution, 47 p.
Steele, T.D., and Gilroy, E.J., 1972, Harmonic analysisof stream-temperature data [abs.]: EOS,Transactions of American Geophysical Union,v. 53, no. 4, p. 378.
Steele, T.D., Gilroy, E.J., and Hawkinson, R.O., 1974,An assessment of areal and temporal variations instreamflow quality using selected data from theNational Stream Quality Accounting Network: U.S.Geological Survey Open-File Report 74-217, 210 p.
Stokes, W.R., III, and McFarlane, R.D., 1995, Water-resources data, Georgia, water year 1994: U.S.Geological Survey Data Report GA-94-1, 643 p.
Tasker, G.D., and Bums, A.W., 1974, Mathematicalgeneralization stream temperatures in central NewEngland: American Water Resources Association,Water Resources Bulletin, p. 1,133-1,142.
Thomann, R.V., 1967, Time-series analysis of water-quality data: American Society of Civil Engineers,Journal of the Sanitary Engineering Division.,v. 93, no. SA1, February 1967, p. 1-23.
U.S. Department of Commerce, U.S. Bureau of Census,1982, Census of population and housing, blockstatistics, 1980: Washington, D.C., U.S. Bureau ofCensus, Report PHC801-1,498 p.
Ward, J.C., 1963, Annual variation of stream-watertemperature: American Society of Civil Engineers,Journal of the Sanitary Engineering Division, v. 89,no. SA6, p. 1-16.
Williams, 0.0., 1971, Analysis of stream temperaturevariations in the upper Delaware River Basin, NewYork: U.S. Geological Survey Water-SupplyPaper 1999-K, 45 p.
Woodard, T.H., 1970, Summary of data on temperatureof streams in North Carolina, 1943-67: U.S.Geological Survey Water-Supply Paper 1895-A,39 p.
32
TABULAR DATA
33
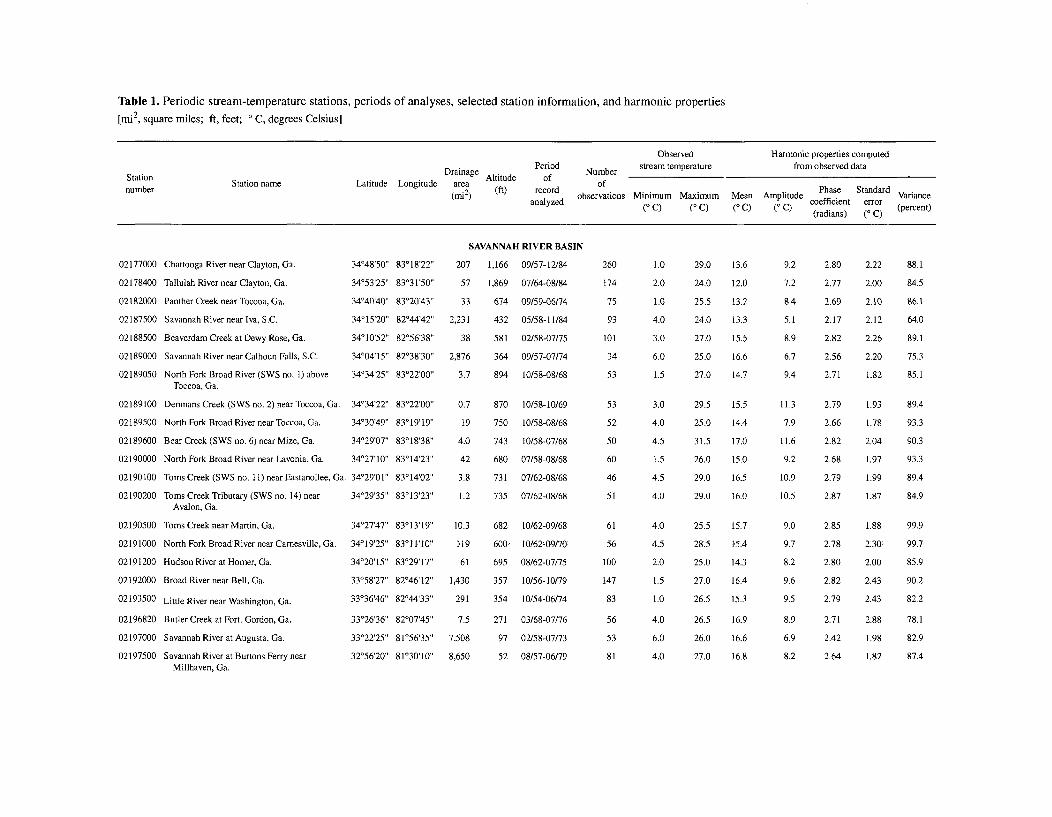
Table 1. Periodic stream-temperature stations, periods of analyses, selected station information, and harmonic properties
[mi 2, square miles; ft, feet; 0 C, degrees Celsius]
Observed Harmonic properties computed
Drainage Period Number stream temperature from observed dataStation DriaeAltitude of onumber Station name Latitude Longitude area Phase Sadofnumber (mi2) (ft) record Phase Standard Variance~~* (f nayzed observations Minimum Maximum Mean Amplitudecofien err
analyzed ( C) (0 C) (0 C) ( C) (efficient error (percent)(radians) (' CQ
02177000 Chattooga River near Clayton, Ga.
02178400 Tallulah River near Clayton, Ga.
02182000 Panther Creek near Toccoa, Ga.
02187500 Savannah River near Iva, S.C.
02188500 Beaverdam Creek at Dewy Rose, Ga.
02189000 Savannah River near Calhoun Falls, S.C.
02189050 North Fork Broad River (SWS no. i) aboveToccoa, Ga.
SAVANNAH RIVER BASIN
34048'50"' 83o18'22' 207 1,166 09/57-12/84
34o53'25" 83o31F50' 57 1,869 07/64-08/84
34040'40' 83Y20'43" 33 674 09/59-06/74
34o15'20'' 82o44'42' 2,231 432 05/58-11/84
34ol0'52'' 82o56'38" 38 581 02/58-07/75
34o04'15' 8203830' 2,876 364 09/57-07/74
34034'25"' 83022'00' 3.7 894 10/58-08/68
02189100 Denmans Creek (SWS no. 2) near Toccoa, Ga. 34o34'22" 83022'00" 0.7 870 10/58-10/69
02189500 North Fork Broad River near Toccoa, Ga. 34o30'49" 83019'19" 19 750 10/58-08/68
02189600 Bear Creek (SWS no. 6) near Mize, Ga. 34029'07' 83018'38' 4.0 743 10/58-07/68
02190000 North Fork Broad River near Lavonia, Ga. 34o27'10" 83014'23' 42 680 07/58-08/68
02190100 Toms Creek (SWS no. 11) near Eastanollee, Ga. 34o29'01" 83014'02' 3.8 731 07/62-08/68
02190200 Toms Creek Tributary (SWS no. 14) near 34o29'35"' 83013'23" 1.2 735 07/62-08/68Avalon, Ga.
02190500 Toms Creek near Martin, Ga. 34027'47'' 83013'19" 10.3 682 10/62-09/68
02191000 North Fork BroadRiver near Camesville, Ga. 34019'25" 83911'10!' 119 600 10/62m09/70
02191200 Hudson River at Homer, Ga. 34o20'15'' 83029'17" 61 695 08/62-07/75
02192000 Broad River near Bell, Ga. 33o58'27"' 82046-12" 1,430 357 10/56-10/79
02193500 Little River near Washington, Ga. 33036'46"' 82044'33" 291 354 10/54-06/74
02196820 Butler Creek at Fort. Gordon, Ga. 33o26'36" 82007'45' 7.5 271 03/68-07/76
02197000 Savannah River at Augusta, Ga. 33022'25" 81056'35" 7,508 97 02/58-07/73
02197500 Savannah River at Burtons Ferry near 32056'20" 81030'10' 8,650 52 08/57-06/79Millhaven, Ga.
260
174
75
93
101
34
53
53
52
50
60
46
51
61
56
100
147
83
56
53
81
1.0
2.0
1.0
4.0
3.0
6.0
1.5
3.0
4.0
4.5
1.5
4.5
4.0
4.0
4.5
2.0
1.5
1.0
4.0
6.0
4.0
29.0 13.6
24.0 12.0
25.5 13.2
24.0 13.3
27.0 15.5
25.0 16.6
27.0 14.7
29.5 15.5
25.0 14.4
31.5 17.0
26.0 15.0
29.0 16.5
29.0 16.0
25.5 15.7
28.5 15.4
25.0 14.3
27.0 16.4
26.5 15.3
26.5 16.9
26.0 16.6
27.0 16.8
9.2
7.2
8.4
5.1
8.9
6.7
9.4
11.3
7.9
11.6
9.2
10.9
10.5
9.0
9.7
8.2
9.6
9.5
8.9
6.9
8.2
2.80 2.22 88.1
2.77 2.00 84.5
2.69 2.10 86.1
2.17 2.12 64.0
2.82 2.26 89.1
2.56 2.20 75.3
2.71 1.82 85.1
2.79 1.93 89.4
2.66 1.78 93.3
2.82 2.04 90.3
2.68 1.97 93.3
2.79 1.99 89.4
2.87 1.87 84.9
2.85 1.88 99.9
2.78 2.30 99.7
2.80 2.00 85.9
2.82 2.43 90.2
2.79 2.43 82.2
2.71 2.88 78.1
2.42 1.98 82.9
2.64 1.82 87.4
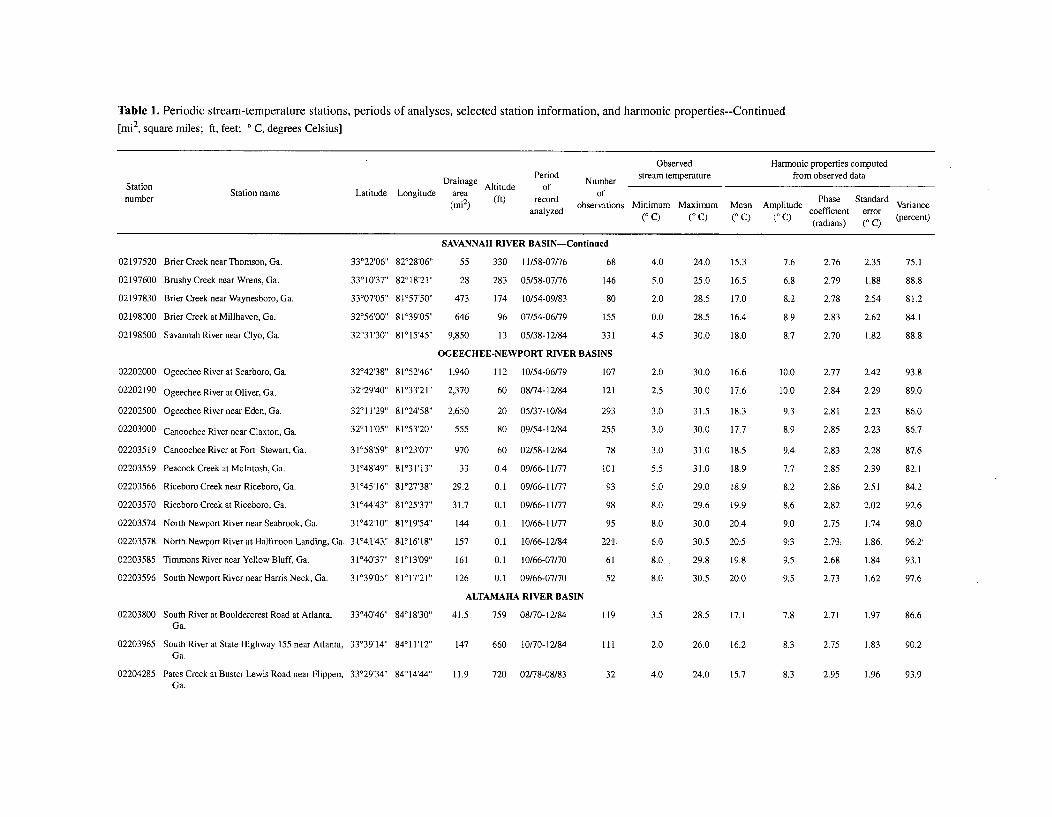
Table 1. Periodic stream-temperature stations, periods of analyses, selected station information, and harmonic properties--Continued
[mi 2, square miles; ft, feet; ° C, degrees Celsius]
Observed Harmonic properties computed
Drainage Period Number stream temperature from observed dataStation DriaeAltitude of Nmenumber Station name Latitude Longitude area Phase Sadofnumer(m2 (ft) record Phsofadr Vracnume(m (d observations Minimum Maximum Mean Amplitude coeff tandardr Variance
analyzed ( (I Q ( ( coefficient error(0 C) ( C) (0 ) (0 C) (radians) (0 C) (eret
02197520 Brier Creek near Thomson, Ga.
02197600 Brushy Creek near Wrens, Ga.
02197830 Brier Creek near Waynesboro, Ga.
02198000 Brier Creek at Millhaven, Ga.
02198500 Savannah River near Clyo, Ga.
02202000 Ogeechee River at Scarboro, Ga.
02202190 Ogeechee River at Oliver, Ga.
02202500 Ogeechee River near Eden, Ga.
SAVANNAH RIVER BASIN-Continued
33022'06" 82028'06" 55 330 11/58-07/76 68
330l0'37" 82018'21' 28 283 05/58-07/76 146
33007'05" 81057'50' 473 174 10/54-09/83 80
32056'00' 81039'05' 646 96 07/54-06/79 155
32031'30' 81015-45" 9,850 13 05/38-12/84 331
OGEECHEE-NEWPORT RIVER BASINS
32042'38' 81052'46' 1,940 112 10/54-06/79 107
32029'40" 81033'21' 2,370 60 08/74-12/84 121
32011'29" 81024-58" 2,650 20 05/37-10/84
02203000 Canoochee River near Claxton, Ga. 3201 1'05" 81o53-20'" 555 80 09/54-12/84
02203519 Canoochee River at Fort Stewart, Ga. 31058'59' 81023'07' 970 60 02/58-12/84
02203559 Peacock Creek at Mclntosh, Ga. 31048'49' 8 1931'13'3 33 0.4 09/66-11/77
02203566 Riceboro Creek near Riceboro, Ga. 31045'16" 81027'38' 29.2 0.1 09/66-11/77
02203570 Riceboro Creek at Riceboro, Ga. 31044'43' 81025'37' 31.7 0.1 09/66-11/77
02203574 North Newport River near Seabrook, Ga. 31042'10" 81019'54' 144 0.1 10/66-11/77
02203578 North Newport Riverat Halfmoon Landing, Ga. 3 °41'43" 81'16'18" 157 0.I 10/66-12/894
02203585 Timmons River near Yellow Bluff, Ga. 31040'37" 8101309" 161 0.1 10/66-07/70
02203596 South Newport River near Harris Neck, Ga. 31039'05' 81017'21" 126 0.1 09/66-07/70
ALTAMAHA RIVER BASIN
02203800 South River at Bouldercrest Road at Atlanta, 33O40'46'' 84018'30" 41.5 759 08/70-12/84Ga.
02203965 South River at State Highway 155 near Atlanta, 33039'14" 84011'12" 147 660 10/70-12/84Ga.
02204285 Pates Creek at Buster Lewis Road near Flippen, 33'29'34" 84014'44' 11.9 720 02/78-08/83Ga.
293
255
78
101
93
98
95
221>
61
52
4.0
5.0
2.0
0.0
4.5
2.0
2.5
3.0
3.0
3.0
5.5
5.0
8.0
8.0
6.0
8.0
8.0
24.0 15.3
25.0 16.5
28.5 17.0
28.5 16.4
30.0 18.0
7.6
6.8
8.2
8.9
8.7
30.0 16.6 10.0
30.0 17.6 10.0
31.5 18.3 9.3
30.0 17.7 8.9
2.76 2.35 75.1
2.79 1.88 88.8
2.78 2.54 81.2
2.83 2.62 84.1
2.70 1.82 88.8
2.77 2.42 93.8
2.84 2.29 89.0
2.81 2.23 86.0
2.85 2.23 86.7
2.83 2.28 87.6
2.85 2.39 82.1
2.86 2.51 84.2
2.82 2.02 92.6
2.75 1.74 98.0
2.73 1.86 96,2
2.68 1.84 93.1
2.73 1.62 97.6
31.0 18.5
31.0 18.9
29.0 18.9
29.6 19.9
30.0 20.4
30;5 20;5
29.8 19.8
30.5 20.0
9.4
7.7
8.2
8.6
9.0
9.3
9.5
9.5
119 3.5 28.5 17.1 7.8 2.71 1.97 86.6
111 2.0 26.0 16.2 8.3 2.75 1.83 90.2
32 4.0 24.0 15.7 8.3 2.95 1.96 93.9
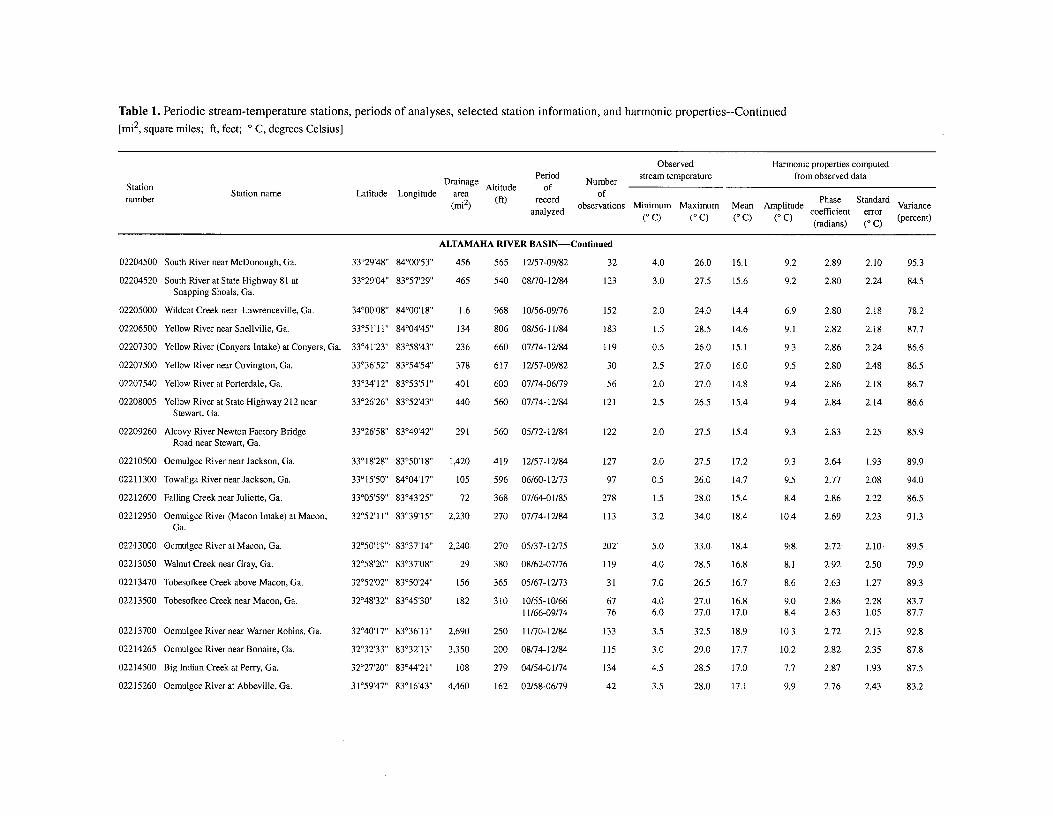
Table 1. Periodic stream-temperature stations, periods of analyses, selected station information, and harmonic properties--Continued
[mi2, square miles; ft, feet; ° C, degrees Celsius]
Observed Harmonic properties computed
Drainage Period Number stream temperature from observed dataStation Station name Latitude Longitude area Altitude of ofnumber m2) (ft) record Phaae Standard Vrac
al(miyed observations Minimum Maximum Mean Amplitude Poeff andr Vaor anceanlzd(0 C) (0 C) (0 C) (0 C)(pretanlzdcoefficient error (pret(radians) (0 C)
ALTAMAHA RIVER BASIN-Continued
02204500 South River near McDonough, Ga. 33029'48' 84°00'53" 456
02204520 South River at State Highway 81 at 33029'04' 83057'29' 465Snapping Shoals, Ga.
02205000 Wildcat Creek near Lawrenceville, Ga. 34o00'08" 84'00'18' 1.6
02206500 Yellow River near Snellville, Ga. 33*5l1' 1t" 84'04'45' 134
02207300 Yellow River (Conyers Intake) at Conyers, Ga. 33041'23" 83058'43' 236
02207500 Yellow River near Covington, Ga. 33036'52"' 83054'54" 378
02207540 Yellow River at Porterdale, Ga. 33034'12"' 83053'51" 401
02208005 Yellow River at State Highway 212 near 33026'26"' 83052'43' 440Stewart, Ga.
02209260 Alcovy River Newton Factory Bridge 33o26'58" 83049'42' 291Road near Stewart, Ga.
02210500 Ocmulgee River near Jackson, Ga. 33018'28" 83050'18' 1,420
02211300 Towaliga River near Jackson, Ga. 33o15'50" 84o04'17' 105
02212600 Falling Creek near Juliette, Ga. 33°05'59' 83o43'25'' 72
02212950 Ocmulgee River (Macon Intake) at Macon, 32052'11" 83039'15' 2,230Ga.
565 12/57-09/82
540 08/70-12/84
968 10/56-09/76
806 08/56-11/84
660 07/74-12/84
617 12/57-09/82
600 07/74-06/79
560 07/74-12/84
560 05/72-12/84
419 12/57-12/84
596 06/60-12/73
368 07/64-01/85
270 07/74-12/84
270 05/37-12/75
380 08/62-07/76
365 05/67-12/73
310 10/55-10/6611/66-09/74
250 11/70-12/84
200 08/74-12/84
279 04/54-01/74
162 02/58-06/79
32
123
152
183
119
30
56
121
4.0
3.0
2.0
1.5
0.5
2.5
2.0
2.5
26.0 16.1 9.2
27.5 15.6 9.2
24.0 14.4
28.5 14.6
26.0 15.1
27.0 16.0
27.0 14.8
26.5 15.4
6.9
9.1
9.3
9.5
9.4
9.4
2.89
2.80
2.80
2.82
2.86
2.80
2.86
2.84
2.10
2.24
2.18
2.18
2.24
2.48
2.18
2.14
95.3
84.5
78.2
87.7
86.6
86.5
86.7
86.6
122 2.0 27.5 15.4 9.3 2.83 2.25 85.9
02213000 Ocmulgee River at Macon, Ga.
02213050 Walnut Creek near Gray, Ga.
02213470 Tobesofkee Creek above Macon, Ga.
02213500 Tobesofkee Creek near Macon, Ga.
02213700 Ocmulgee River near Warner Robins, Ga.
02214265 Ocmulgee River near Bonaire, Ga.
02214500 Big Indian Creek at Perry, Ga.
02215260 Ocmulgee River at Abbeville, Ga.
32'50'19" 83037'14" 2;240
32058'20' 83037'08" 29
32052'02' 83050'24' 156
32048'32" 83045'30" 182
32040'17 830361 1 2,690
32032'33" 8393213" 3,350
32027'20" 83044'21" 108
31059'47" 83016'43' 4,460
127
97
278
113
202
119
31
6776
133
115
134
42
2.0
0.5
1.5
3.2
5.0
4.0
7.0
4.06.0
3.5
3.0
4.5
3.5
27.5 17.2
26.0 14.7
28.0 15.4
34.0 18.4
33.0 18.4
28.5 16.8
26.5 16.7
27.0 16.827.0 17.0
32.5 18.9
29.0 17.7
28.5 17.0
28.0 17.1
9.3
9.5
8.4
10.4
9:8:
8.1
8.6
9.08.4
10.3
10.2
7.7
9.9
2.64
2.77
2.86
2.69
2.72
2.92
2.63
2.862.63
2.72
2.82
2.87
2.76
1.93
2.08
2.22
2.23
2.10
2.50
1.27
2.281.05
2.13
2.35
1.93
2.43
89.9
94.0
86.5
91.3
89.5
79.9
89.3
83.787.7
92.8
87.8
87.5
83.2
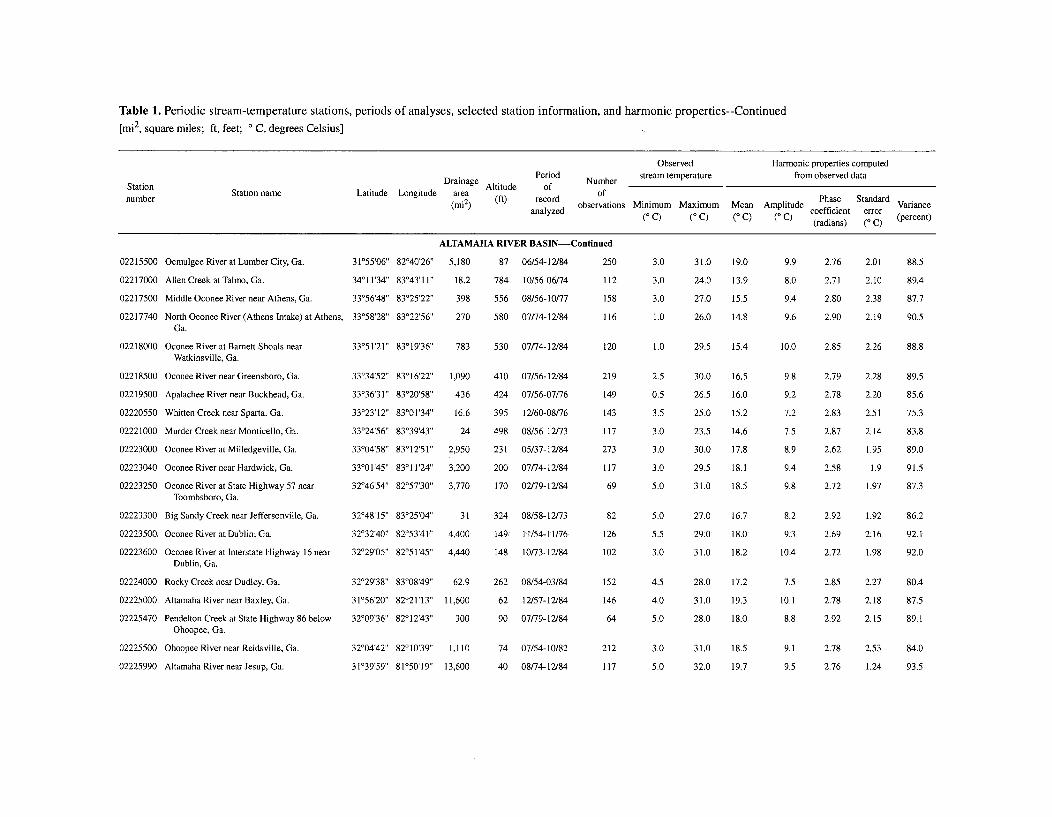
Table 1. Periodic stream-temperature stations, periods of analyses, selected station information, and harmonic properties--Continued
[mi2, square miles; ft, feet; 0 C, degrees Celsius]
Observed Harmonic properties computed
Drainage Period Number stream temperature from observed dataStation DangAliue of Nmenumber Station name Latitude Longitude area Phase Sadofnumber (mi2 ) o bservations Minimum Maximum Mean Amplitude Variance
analyzed o Q (I Q (IpQtQecoefficient error (percent)(0 C) (0 C) (0 C) (0 C) (radians) (0 C)
ALTAMAHA RIVER BASIN-Continued
02215500 Ocmulgee River at Lumber City, Ga. 31055'06' 82040'26' 5,180 87 06/54-12/84
02217000 Allen Creek at Talmo, Ga. 34011'34" 83043'11" 18.2 784 10/56-06/74
02217500 Middle Oconee River near Athens, Ga. 33056'48" 83025'22" 398 556 08/56-10/77
02217740 North Oconee River (Athens Intake) at Athens, 33058'28" 83022'56" 270 580 07/74-12/84Ga.
250
112
158
116
3.0
3.0
3.0
1.0
31.0 19.0
24.0 13.9
27.0 15.5
26.0 14.8
9.9
8.0
9.4
9.6
2.76 2.01 88.5
2.71 2.10 89.4
2.80 2.38 87.7
2.90 2.19 90.5
02218000 Oconee River at Barnett Shoals nearWatkinsville, Ga.
02218500 Oconee River near Greensboro, Ga.
02219500 Apalachee River near Buckhead, Ga.
02220550 Whitten Creek near Sparta. Ga.
02221000 Murder Creek near Monticello, Ga.
02223000 Oconee River at Milledgeville, Ga.
02223040 Oconee River near Hardwick, Ga.
02223250 Oconee River at State Highway 57 nearToombsboro, Ga.
02223300 Big Sandy Creek near Jeffersonville, Ga.
02223-500 Oconee River at Dublin, Ga.
02223600 Oconee River at Interstate Highway 16 nearDublin, Ga.
02224000 Rocky Creek near Dudley, Ga.
02225000 Altamaha River near Baxley, Ga.
02225470 Pendelton Creek at State Highway 86 belowOhoopee, Ga.
02225500 Ohoopee River near Reidsville, Ga.
02225990 Altamaha River near Jesup, Ga.
33°51'21' 83019'36' 783 530 07n14-12/84
33o34'52'' 8301622" 1,090 410 07/56-12/84
33936'31" 83o20'58' 436 424 07/56-07/76
33'23'12'' 83001'34" 16.6 395 12/60-08/76
33o24'56" 8303943" 24 498 08/56-12/73
33°04'58'' 83012'51' 2,950 231 05/37-12/84
3300145" 830 11F24" 3,200 200 07/74-12/84
32046'54" 82057'30" 3,770 170 02/79-12/84
32048'15" 83025'04" 31 324 08/58-12/73
3203240 82053'41' 4,400 149. 11/54-11/76
32029'05" 82051'45' 4,440 148 10/73-12/84
32029'38' 83008'49' 62.9 262 08/54-03/84
31056'20' 82021'13" 11,600 62 12/57-12/84
32009'36' 82012'43' 300 90 07/79-12/84
120 1.0 29.5 15.4 10.0 2.85 2.26 88.8
219
149
143
117
273
117
69
82
126
102
152
146
64
212
117
2.5
0.5
3.5
3.0
3.0
3.0
5.0
5.0
5.5
3.0
4.5
4.0
5.0
3.0
5.0
30.0 16.5
26.5 16.0
25.0 15.2
23.5 14.6
30.0 17.8
29.5 18.1
31.0 18.5
27.0 16.7
29:0 18:0
31.0 18.2
28.0 17.2
31.0 19.3
28.0 18.0
9.8
9.2
7.2
7.5
8.9
9.4
9.8
8.2
9:3
10.4
7.5
10.1
8.8
2.79 2.28 89.5
2.78 2.20 85.6
2.83 2.51 75.3
2.87 2.14 83.8
2.62 1.95 89.0
2.58 1.9 91.5
2.72 1.97 87.3
2.92 1.92 86.2
2.69. 2.16 92.1
2.72 1.98 92.0
2.85 2.27 80.4
2.78 2.18 87.5
2.92 2.15 89.1
2.78 2.53 84.0
2.76 1.24 93.5
32004'42" 82010'39' 1,110
31039'59" 81050'19" 13,600
74 07/54-10/82
40 08/74-12/84
31.0 18.5 9.1
32.0 19.7 9.5
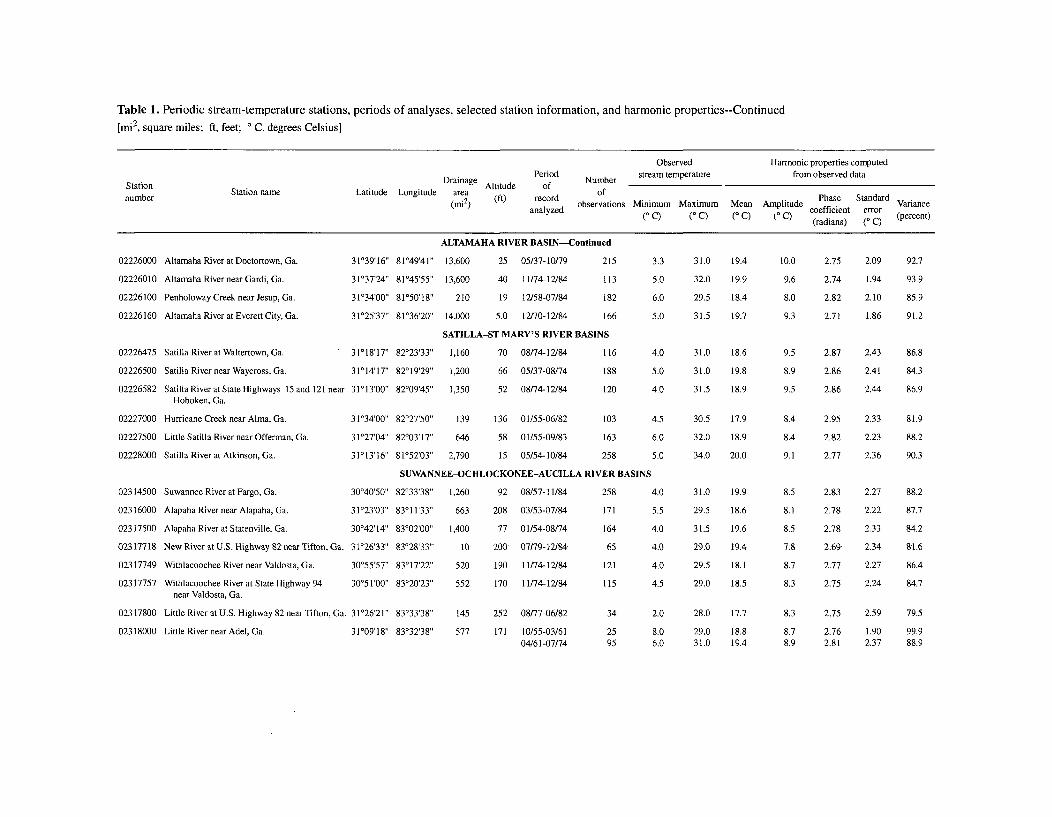
Table 1. Periodic stream-temperature stations, periods of analyses, selected station information, and harmonic properties--Continued
[mi2, square miles; ft, feet; 0 C, degrees Celsius]
Observed Harmonic properties computed
D Period Number stream temperature from observed dataStation Dramnage Altitude ofnumber Station name Latitude Longitude area t ePhase Standard
(mi2) analyzed observations Minimum Maximum Mean Amplitude Varianceanalyzed C (I Q (I Q ( coefficient error (percent)
(radians) (0 C)
02226000 Altamaha River at Doctortown, Ga.
02226010 Altamaha River near Gardi, Ga.
02226100 Penholoway Creek near Jesup, Ga.
02226160 Altamaha River at Everett City, Ga.
ALTAMAHA RIVER BASIN--Continued
31°39'16" 81049'41" 13,600 25 05/37-10/79 215
31037'24' 81045'55" 13,600 40 11/74-12/84 113
31034'00' 81050'18" 210 19 12/58-07/84 182
31025'37" 81036'20" 14,000 5.0 12/70-12/84 166
SATILLA-ST MARY'S RIVER BASINS
3t018'17" 82023'33" 1,160 70 08/74-12/84 116
31014'17' 82019'29" 1,200 66 05/37-08/74 188
31013T00' 8200945' 1,350 52 08/74-12/84 120
3.3
5.0
6.0
5.0
4.0
5.0
4.0
02226475 Satilla River at Waltertown, Ga.
02226500 Satilla River near Waycross, Ga.
02226582 Satilla River at State Highways 15 and 121 nearHoboken, Ga.
02227000 Hurricane Creek near Alma, Ga. 31034'00" 82027'50" 139 136 01/55-06/82 103
02227500 Little Satilla River near Offerman, Ga. 31027'04" 82003'17" 646 58 01/55-09/83 163
02228000 Satilla River at Atkinson, Ga. 31013'16' 81052'03' 2,790 15 05/54-10/84 258
SUWANNEE-OCHLOCKONEE-AUCILLA RIVER BASINS
02314500 Suwannee River at Fargo, Ga. 30o40'50" 82033'38" 1,260 92 08/57-11/84 258
02316000 Alapaha River near Alapaha, Ga. 31 023'03' 8301133' 663 208 03/53-07/84 171
02317500 Alapaha River at Statenville, Ga. 30042'14' 83002'00" 1,400 77 0 1/54-08/74 164
02317718 New River at U.S. Highway 82near Tifton, Ga. 31026'33" 83°28'33" 10 200 07/79-12/84 65
02317749 Withlacoochee River near Valdosta, Ga. 30055'57" 8301722' 520 190 11/74-12/84 121
02317757 Withlacoochee River at State Highway 94 30051'00" 83020'23' 552 170 1 /74-t2/84 115near Valdosta, Ga.
02317800 Little River at U.S. Highway 82 near Tifton, Ga. 3l026'21' 8303338' 145 252 08/77-06/82 34
02318000 Little River near Adel, Ga. 31009'18" 83032'38" 577 171 10/55-03/61 2504/61-07/74 95
4.5
6.0
5.0
4.0
5.5
4.0
4.0
4.0
4.5
2.0
8.06.0
31.0 19.4
32.0 19.9
29.5 18.4
31.5 19.7
31.0 18.6
31.0 19.8
31.5 18.9
30.5 17.9
32.0 18.9
34.0 20.0
31.0 19.9
29.5 18.6
31.5 19.6
29.0 19.4
29.5 18.1
29.0 18.5
28.0 17.7
29.0 18.831.0 19.4
10.0
9.6
8.0
9.3
9.5
8.9
9.5
8.4
8.4
9.1
8.5
8.1
8.5
7.8
8.7
8.3
8.3
8.78.9
2.75 2.09
2.74 1.94
2.82 2.10
2.71 1.86
2.87 2.43
2.86 2.41
2.86 2.44
2.95 2.33
2.82 2.23
2.77 2.36
2.83 2.27
2.78 2.22
2.78 2.33
2.69 234
2.77 2.27
2.75 2.24
2.75 2.59
2.76 1.902.81 2.37
92.7
93.9
85.9
91.2
86.8
84.3
86.9
81.9
88.2
90.3
88.2
87.7
84.2
81.6
86.4
84.7
79.5
99.988.9
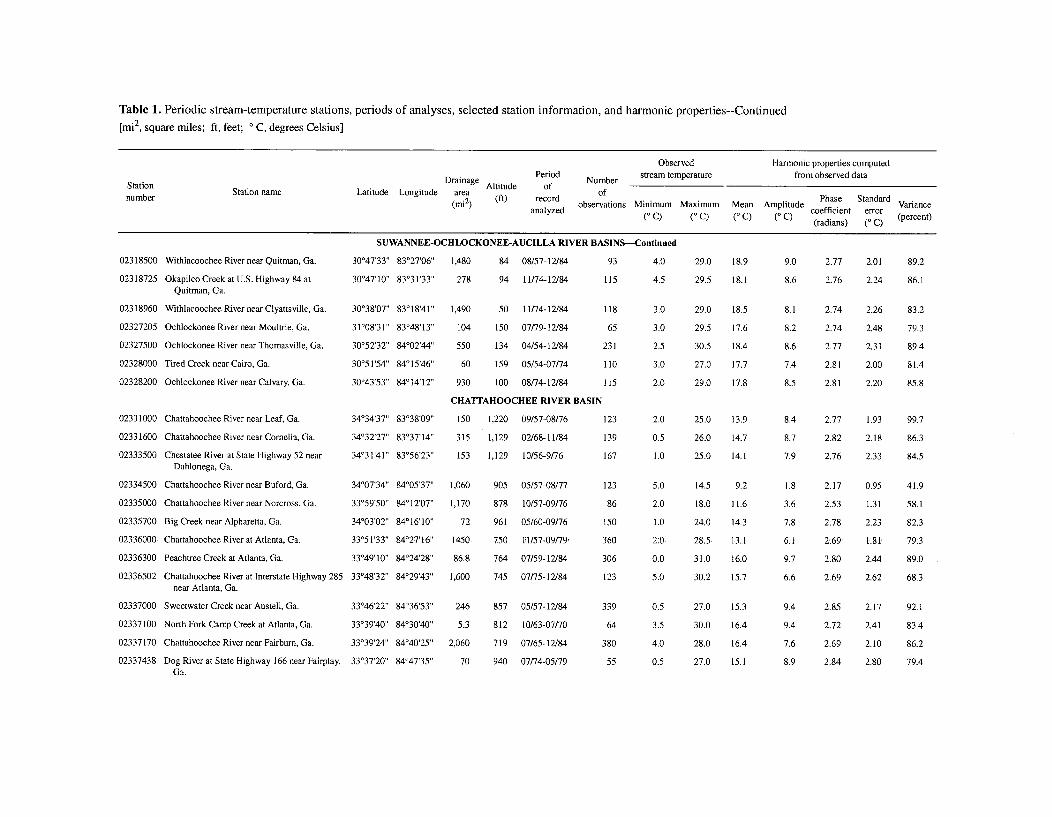
Table 1. Periodic stream-temperature stations, periods of analyses, selected station information, and harmonic properties--Continued
[mi2, square miles; ft, feet; 0 C, degrees Celsius]
Observed Harmonic properties computed
Drainage Period Number stream temperature from observed dataStation Station name Latitude Longitude area ofnumber Stto aeLttueLniue ae (ft) record ofPhase Standard Vrac
(mni2) oft lyzed bservations Minimum Maximum Mean Amplitude coeff tandardr Varianceanalyzed 0(C) (C) (C) IC coefficient error (pret(0 C) (0 C) (0 C) (0 C) (radians) (0 C)
SUWANNEE-OCHLOCKONEE-AUCILLA RIVER BASINS-Continued
02318500 Withlacoochee River near Quitman, Ga.
02318725 Okapilco Creek at U.S. Highway 84 atQuitman, Ga.
02318960 Withlacoochee River near Clyattsville, Ga.
02327205 Ochlockonee River near Moultrie, Ga.
02327500 Ochlockonee River near Thomasville, Ga.
02328000 Tired Creek near Cairo, Ga.
02328200 Ochlockonee River near Calvary, Ga.
30047'33' 83o27'06" 1,480 84 08/57-12/84
30047'10' 83o3l'33" 278 94 11/74-12/84
30038'07" 83018'41' 1,490 50 11/74-12/84
31008'31 83048'13"' 104 150 07/79-12/84
30052'32 84002'44 550 134 04/54-12/84
30051'54' 84015'46" 60 159 05/54-07/74
30043'53" 84014'12" 930 100 08/74-12/84
CHATTAHOOCHEE RIVER BASIN
02331000 Chattahoochee River near Leaf, Ga. 34o34'37'' 83038'09" 150 1,220 09/57-08/76
02331600 Chattahoochee River near Comelia, Ga. 34032'27" 83037'14" 315 1,129 02/68-11/84
02333500 Chestatee River at State Highway 52 near 34931'414" 83056'23" 153 1,129 10/56-9/76Dahlonega, Ga.
02334500 Chattahoochee River near Buford, Ga. 34O07'34'' 8400537 1,060 905 05/57-08/77
02335000 Chattahoochee River near Norcross, Ga. 33o59'50" 84012'07 1,170 878 10/57-09/76
02335700 Big Creek near Alpharetta, Ga. 34'03'02" 84'16'10'' 72 961 05/60-09/76
02336000 Chattahoochee River at Atlanta, Ga:. 33051'33' 84027'16"' 1450 750 1:1/57-09/79.
02336300 Peachtree Creek at Atlanta, Ga. 33049'10'' 84o24'28"' 86.8 764 07/59-12/84
02336502 Chattahoochee River at Interstate Highway 285 33o48'32' 8402943" 1,600 745 07/75-12/84near Atlanta, Ga.
02337000 Sweetwater Creek near Austell, Ga. 33046'22" 84036'53' 246 857 05/57-12/84
02337100 North Fork Camp Creek at Atlanta, Ga. 33o39'40" 8403040' 5.3 812 10/63-07/70
02337170 Chattahoochee River near Fairburn, Ga. 33o39'24"' 84040'25'' 2,060 719 07/65-12/84
02337438 Dog River at State Highway 166 near Fairplay, 33o37'20' 84047'35"' 70 940 07/74-05/79Ga.
3
3
1
3
3
93
115
118
65
231
110
115
123
'39
[67
[23
86
150
160
106
.23
339
64
380
55
4.0
4.5
3.0
3.0
2.5
3.0
2.0
2.0
0.5
1.0
5.0
2.0
1.0
2:0
0.0
5.0
0.5
3.5
4.0
0.5
29.0 18.5
29.5 17.6
30.5 18.4
27.0 17.7
29.0 17.8
25.0 13.9
26.0 14.7
25.0 14.1
14.5 9.2
18.0 11.6
24.0 14.3
28.5 13.1
31.0 16.0
30.2 15.7
27.0 15.3
30.0 16.4
28.0 16.4
27.0 15.1
29.0 18.9 9.0
29.5 18.1 8.6
8.1
8.2
8.6
7.4
8.5
8.4
8.7
7.9
1.8
3.6
7.8
6.1
9.7
6.6
9.4
9.4
7.6
8.9
2.77 2.01 89.2
2.76 2.24 86.1
2.74 2.26 83.2
2.74 2.48 79.3
2.77 2.31 89.4
2.81 2.00 81.4
2.81 2.20 85.8
2.77 1.93 99.7
2.82 2.18 86.3
2.76 2.33 84.5
2.17 0.95 41.9
2.53 1.31 58.1
2.78 2.23 82.3
2.69 1.81 79:3
2.80 2.44 89.0
2.69 2.62 68.3
2.85 2.17 92.1
2.72 2.41 83.4
2.69 2.10 86.2
2.84 2.80 79.4
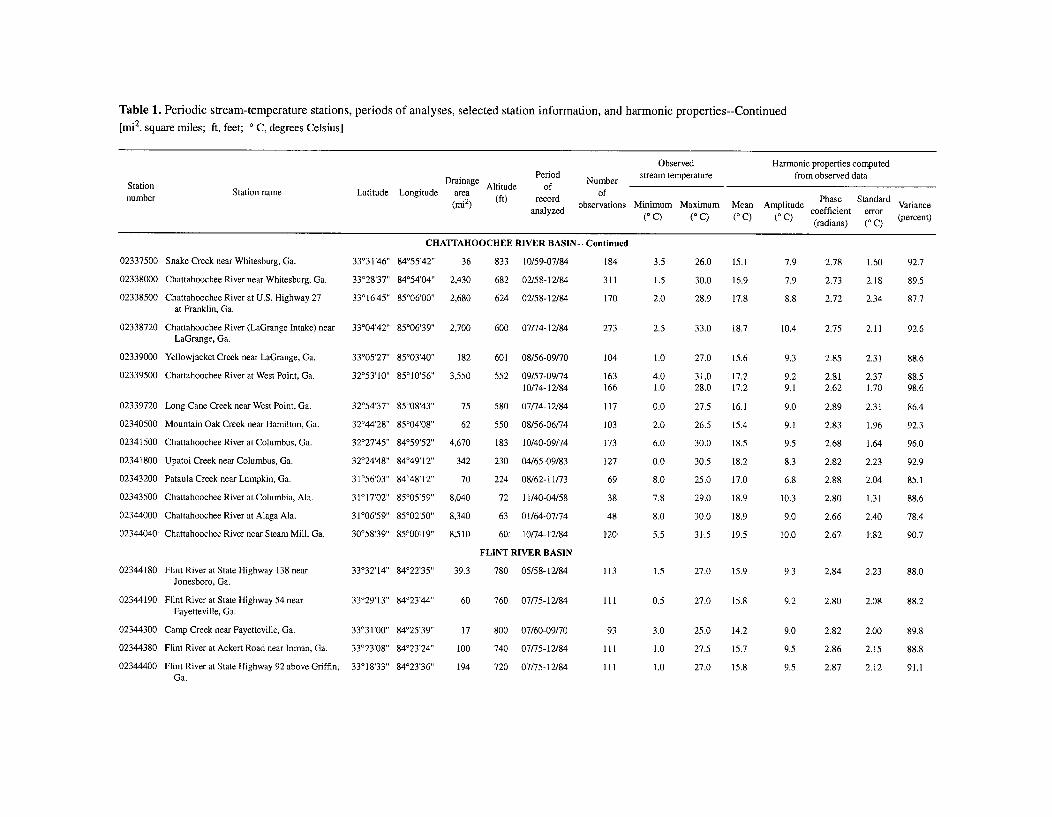
Table 1. Periodic stream-temperature stations, periods of analyses, selected station information, and harmonic properties--Continued
[mi2, square miles; ft, feet; 0 C, degrees Celsius]
Observed Harmonic properties computed
Drainage Period Number stream temperature from observed dataStation Dang Aliue of Nmenumber Station name Latitude Longitude area t ePhase Standard(mi2) (fa)yzed observations Minimum Maximum Mean Amplitude coeff tandardr Variance
analyzed (ICQ (ICQ (IC Q 0 C) coefficient error (percent)(HC)H(CC)RVERBA NCn)i(radians) (n Ce
CHATTAHOOCHEE RIVER BASIN--Continued
02337500 Snake Creek near Whitesburg, Ga. 33031'46" 8455'42" 36 833 10/59-07/84
02338000 Chattahoochee River near Whitesburg, Ga. 33o28'37' 84o54'04" 2,430 682 02/58-12/84
02338500 Chattahoochee River at U.S. Highway 27 33ol6'45' 85006-00 2,680 624 02/58-12/84at Franklin, Ga.
02338720 Chattahoochee River (LaGrange Intake) near 33004'42" 85006'39' 2,700 600 07/74-12/84LaGrange, Ga.
02339000 Yellowjacket Creek near LaGrange, Ga. 33005'27 85003'40 182 601 08/56-09/70
02339500 Chattahoochee River at West Point, Ga. 32053'10" 85010'56" 3,550 552 09/57-09/74
184
311
170
3.5
1.5
2.0
26.0 15.1
30.0 16.9
28.9 17.8
7.9
7.9
8.8
2.78 1.60 92.7
2.73 2.18 89.5
2.72 2.34 87.7
273 2.5 33.0 18.7 10.4 2.75 2.11 92.6
104
163
02339720 Long Cane Creek near West Point, Ga.
02340500 Mountain Oak Creek near Hamilton, Ga.
02341500 Chattahoochee River at Columbus, Ga.
02341800 Upatoi Creek near Columbus, Ga.
02343200 Pataula Creek near Lumpkin, Ga.
02343500 Chattahoochee River at Columbia, Ala.
02344000 Chattahoochee River at Alaga Ala.
02344040 Chattahoochee River near. Steam.Mill, Ga.
10/74-12/84
32054'37 8500843" 75 580 07/74-12/84
32044'28" 85004'08' 62 550 08/56-06/74
32027'45" 84059'52" 4,670 183 10/40-09/74
32024'48' 84049'12" 342 230 04/65-09/83
31056'03' 84048'12' 70 224 08/62-11/73
31017'02 85005'59" 8,040 72 11/40-04/58
31006'59" 85002'50' 8,340 63 01/64-07/74
30058'391 8500019 8,510 60 10/74-12/84
FLINT RIVER BASIN
166
117
103
173
127
69
38
48
120
1.0
4.01.0
0.0
2.0
6.0
0.0
8.0
7.8
8.0
5.5
27.0 15.6
31.0 17.228.0 17.2
27.5 16.1
26.5 15.4
30.0 18.5
30.5 18.2
25.0 17.0
29.0 18.9
30.0 18.9
31.5 19.5
9.3
9.29.1
9.0
9.1
9.5
8.3
6.8
10.3
9.0
10.0
2.85 2.31 88.6
2.81 2.37 88.52.62 1.70 98.6
2.89 2.31 86.4
2.83 1.96 92.3
2.68 1.64 96.0
2.82 2.23 92.9
2.88 2.04 85.1
2.80 1.31 88.6
2.66 2.40 78.4
2167. 1.82 90.7
02344180 Flint River at State Highway 138 near 33o32'14'' 84022'35" 39.3 780 05/58-12/84Jonesboro, Ga.
02344190 Flint River at State Highway 54 near 33029'13"' 84023'44" 60 760 07/75-12/84Fayetteville, Ga.
02344300 Camp Creek near Fayetteville, Ga. 33031'00" 84025'39' 17 800 07/60-09/70
02344380 Flint River at Ackert Road near Inman, Ga. 33023'08" 84023'24" 100 740 07/75-12/84
02344400 Flint River at State Highway 92 above Griffin, 33'18'33'' 84023'36' 194 720 07/75-12/84Ga.
113 1.5 27.0 15.9 9.3 2.84 2.23 88.0
111 0.5 27.0 15.8 9.2 2.80 2.08 88.2
93
Ill
111
3.0
1.0
1.0
25.0 14.2
27.5 15.7
27.0 15.8
9.0
9.5
9.5
2.82 2.00 89.8
2.86 2.15 88.8
2.87 2.12 91.1
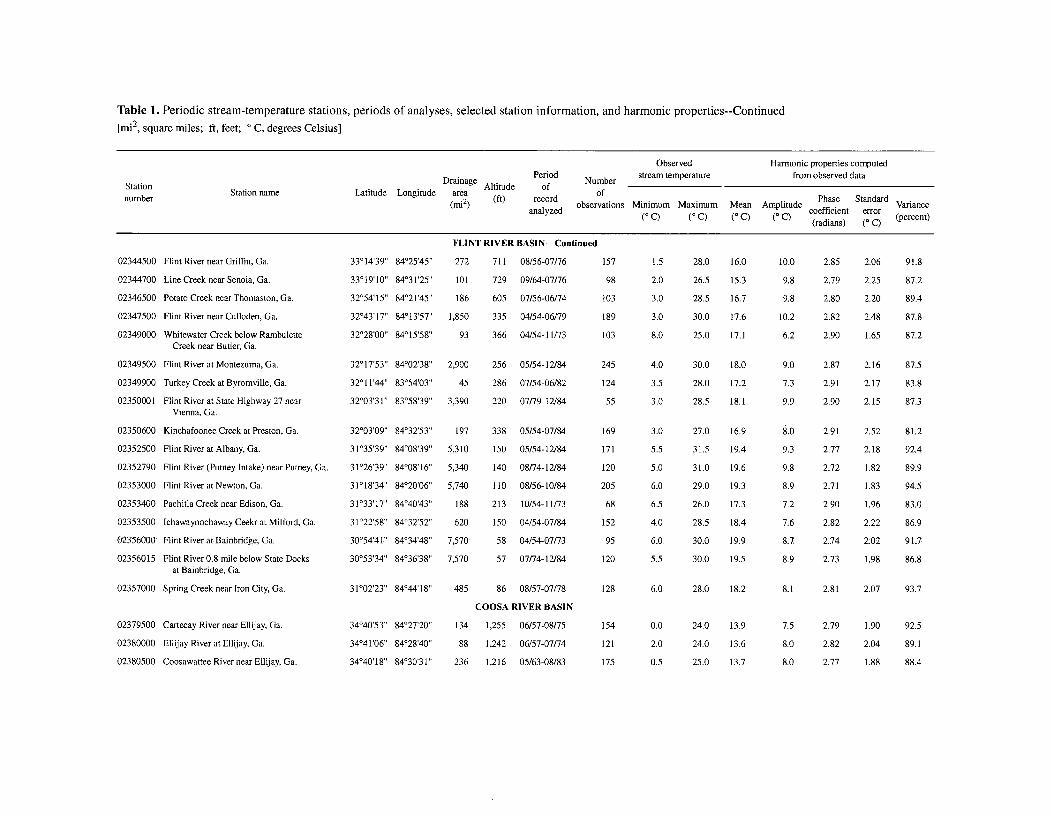
Table 1. Periodic stream-temperature stations, periods of analyses, selected station information, and harmonic properties--Continued
[mi2, square miles; ft, feet; 0 C, degrees Celsius]
Observed Harmonic properties computed
Drainage Period Number stream temperature from observed dataStation Station name Latitude Longitude area Altitude of ofStaionnam Laitue Lngiude are ofPbase Standard Variancenumber (mi2) (ft) record observations Minimum Maximum Mean Amplitude coefficientan (error iance
analyzed (0 C) (0 C) (0 C) (0 C (radcians) ( (percent)
FLINT RIVER BASIN-Continued
02344500 Flint River near Griffin, Ga.
02344700 Line Creek near Senoia, Ga.
02346500 Potato Creek near Thomaston, Ga.
02347500 Flint River near Culloden, Ga.
02349000 Whitewater Creek below RambuletteCreek near Butler, Ga.
02349500 Flint River at Montezuma, Ga.
02349900 Turkey Creek at Byromville, Ga.
02350001 Flint River at State Highway 27 nearVienna, Ga.
02350600 Kinchafoonee Creek at Preston, Ga.
02352500 Flint River at Albany, Ga.
02352790 Flint River (Putney Intake) near Putney, Ga.
02353000 Flint River at Newton, Ga.
02353400 Pachitla Creek near Edison, Ga.
02353500 Ichawaynochaway Ceekr at Milford, Ga.
02356000 Flint River at Bainbridge, Ga.
02356015 Flint River 0.8 mile below State Docksat Bainbridge, Ga.
02357000 Spring Creek near Iron City, Ga.
02379500 Cartecay River near Ellijay, Ga.
02380000 Ellijay River at Ellijay, Ga.
02380500 Coosawattee River near Ellijay, Ga.
33014'39" 84025'45' 272 711 08/56-07/76
33o19'10' 8403t'25' 101 729 09/64-07/76
32054'15' 8402l'45'' 186 605 07/56-06/74
32043'17' 84o13'57' 1,850 335 04/54-06/79
32028'00' 84015'58' 93 366 04/54-11/73
32017'53 84002'38 2,900 256 05/54-12/84
3201144" 83054'03' 45 286 07/54-06/82
32003'31" 83o5839'' 3,390 220 07/79-12/84
32003'09' 84o32'53" 197 338 05/54-07/84
31035'39 84W08'39" 5,310 150 05/54-12/84
31026'39" 84008'16' 5,340 140 08/74-12/84
31018'34 84020'06 5,740 110 08/56-10/84
31033'17" 84040'43'' 188 213 10/54-11/73
31022'58' 84032'52" 620 150 04/54-07/84
30'54'41" 84034'48" 7,570 58 04/54w07/73
30053'34" 84036'38' 7,570 57 07/74-12/84
31002'23' 84044'18" 485 86 08/57-07/78
COOSA RIVER BASIN
34040'53"' 84027'20' 134 1,255 06/57-08/75
34O41'06" 84028'40' 88 1,242 06/57-07/74
34W40'18'' 84030'31" 236 1,216 05/63-08/83
157
98
103
189
103
245
124
55
169
171
120
205
68
152
95
120
1.5
2.0
3.0
3.0
8.0
4.0
3.5
3.0
3.0
5.5
5.0
6.0
6.5
4.0
6.0.
5.5
28.0 16.0
26.5 15.3
28.5 16.7
30.0 17.6
25.0 17.1
30.0 18.0
28.0 17.2
28.5 18.1
27.0 16.9
31.5 19.4
31.0 19.6
29.0 19.3
26.0 17.3
28.5 18.4
30;0 19:9
30.0 19.5
10.0
9.8
9.8
10.2
6.2
9.0
7.3
9.9
8.0
9.3
9.8
8.9
7.2
7.6
8.7
8.9
2.85 2.06 91.8
2.79 2.25 87.2
2.80 2.20 89.4
2.82 2.48 87.8
2.90 1.65 87.2
2.87 2.16 87.5
2.91 2.17 83.8
2.90 2.15 87.3
2.91 2.52 81.2
2.77 2.18 92.4
2.72 1.82 89.9
2.71 1.83 94.5
2.90 1.96 83.0
2.82 2.22 86.9
2.74 2.02 91.7
2.73 1.98 86.8
128 6.0 28.0 18.2 8.1 2.81 2.07 93.7
154
121
175
0.0
2.0
0.5
24.0 13.9
24.0 13.6
25.0 13.7
7.5
8.0
8.0
2.79 1.90 92.5
2.82 2.04 89.1
2.77 1.88 88.4
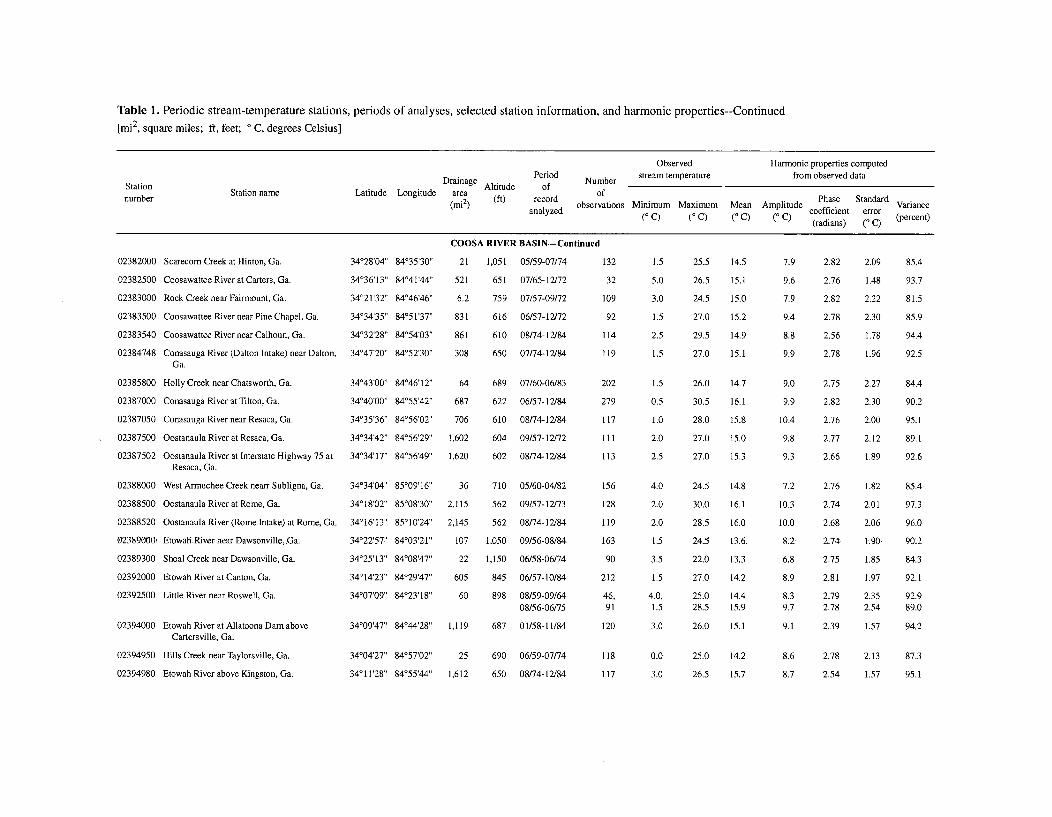
Table 1. Periodic stream-temperature stations, periods of analyses, selected station information, and harmonic properties--Continued
[mi2, square miles; ft, feet; 0 C, degrees Celsius]
Observed Harmonic properties computed
Drainage Period Number stream temperature from observed dataStation DriaeAltitude ofSumber Station name Latitude Longitude area Aftit re of Ptnumber (mi2 ) o bservations Minimum Maximum Mean Amplitude Variance
analyzed o (1 Q (I AmplItuecoefficient error (percent)(0 C) (0 C) (0 C) (0 C) (radians) (0 C)
COOSA RIVER BASIN-Continued
02382000 Scarecorn Creek at Hinton, Ga. 34028'04' 84035'30' 21 1,051 05/59-07/74
02382500 Coosawattee River at Carters, Ga. 34036'13'" 8404144 521 651 07/65-12/72
02383000 Rock Creek near Fairmount, Ga. 34021'32" 84046'46" 6.2 759 07/57-09/72
02383500 Coosawattee River near Pine Chapel, Ga. 34034'35" 84051'37" 831 616 06/57-12/72
02383540 Coosawattee River near Calhoun, Ga. 34032'28' 84054'03' 861 610 08/74-12/84
02384748 Conasauga River (Dalton Intake) near Dalton, 34047'20" 84o52'30"' 308 650 07/74-12/84Ga.
02385800 Holly Creek near Chatsworth, Ga. 34043'00'' 84046'12" 64 689 07/60-06/83
02387000 Conasauga River at Tilton, Ga. 34040'00" 84055'42" 687 622 06/57-12/84
02387050 Conasauga River near Resaca, Ga. 34035'36"' 84056'02" 706 610 08/74-12/84
02387500 Oostanaula River at Resaca, Ga. 34034'42" 84056'29" 1,602 604 09/57-12/72
02387502 Oostanaula River at Interstate Highway 75 at 34034'17' 8405649" 1,620 602 08/74-12/84Resaca, Ga.
02388000 West Armuchee Creek nearr Subligna, Ga. 34034'04"' 85009'16' 36 710 05/60-04/82
02388500 Oostanaula River at Rome, Ga. 34o18'020 85008'30' 2,115 562 09/57-12/73
02388520 Oostanaula River (Rome Intake) at Rome, Ga. 34'16'13"' 85010'24" 2,145 562 08/74-12/84
02389000 EtowahRiver near Dawsonville,,Ga. 34022'57" 8403'21" 107 1,050 09/56-08/84
02389300 Shoal Creek near Dawsonville, Ga. 34025'13'' 84008'47'' 22 1,150 06/58-06/74
02392000 Etowah River at Canton, Ga. 34 14'23" 84029'47" 605 845 06/57-10/84
02392500 Little River near Roswell, Ga. 34007'09' 84023'18'" 60 898 08/59-09/64
132
32
109
92
114
119
202
279
117
Ill
113
1.5
5.0
3.0
1.5
2.5
1.5
1.5
0.5
1.0
2.0
2.5
4.0
2.0
2.0
1.5
3.5
1.5
4.0,1.5
3.0
0.0
3.0
25.5 14.5
26.5 15.1
24.5 15.0
27.0 15.2
29.5 14.9
27.0 15.1
26.0 14.7
30.5 16.1
28.0 15.8
27.0 15.0
27.0 15.3
24.5 14.8
30.0 16.1
28.5 16.0
24.5 13.6.
22.0 13.3
27.0 14.2
25.0 14.428.5 15.9
26.0 15.1
7.9
9.6
7.9
9.4
8.8
9.9
9.0
9.9
10.4
9.8
9.3
7.2
10.3
10.0
812
6.8
8.9
8.39.7
9.1
2.82 2.09 85.4
2.76 1.48 93.7
2.82 2.22 81.5
2.78 2.30 85.9
2.56 1.78 94.4
2.78 1.96 92.5
2.75 2.27 84.4
2.82 2.30 90.2
2.76 2.00 95.1
2.77 2.12 89.1
2.66 1.89 92.6
2.76 1.82 85.4
2.74 2.01 97.3
2.68 2.06 96.0
2.74 1.90 902
2.75 1.85 84.3
2.81 1.97 92.1
2.79 2.35 92.92.78 2.54 89.0
2.39 1.57 94.2
2.78 2.13 87.3
2.54 1.57 95.1
156
128
119
163.
90
212
46,91
12002394000 Etowah River at Allatoona Dam aboveCartersville, Ga.
02394950 Hills Creek near Taylorsville, Ga.
02394980 Etowah River above Kingston, Ga.
08/56-06/75
34009'47'' 84044'28' 1,119 687 01/58-11/84
34004'27'' 84057'02" 25 690 06/59-07/74
34o1I'28" -84055'44' 1,612 650 08/74-12/84
118
117
25.0 14.2 8.6
26.5 15.7 8.7
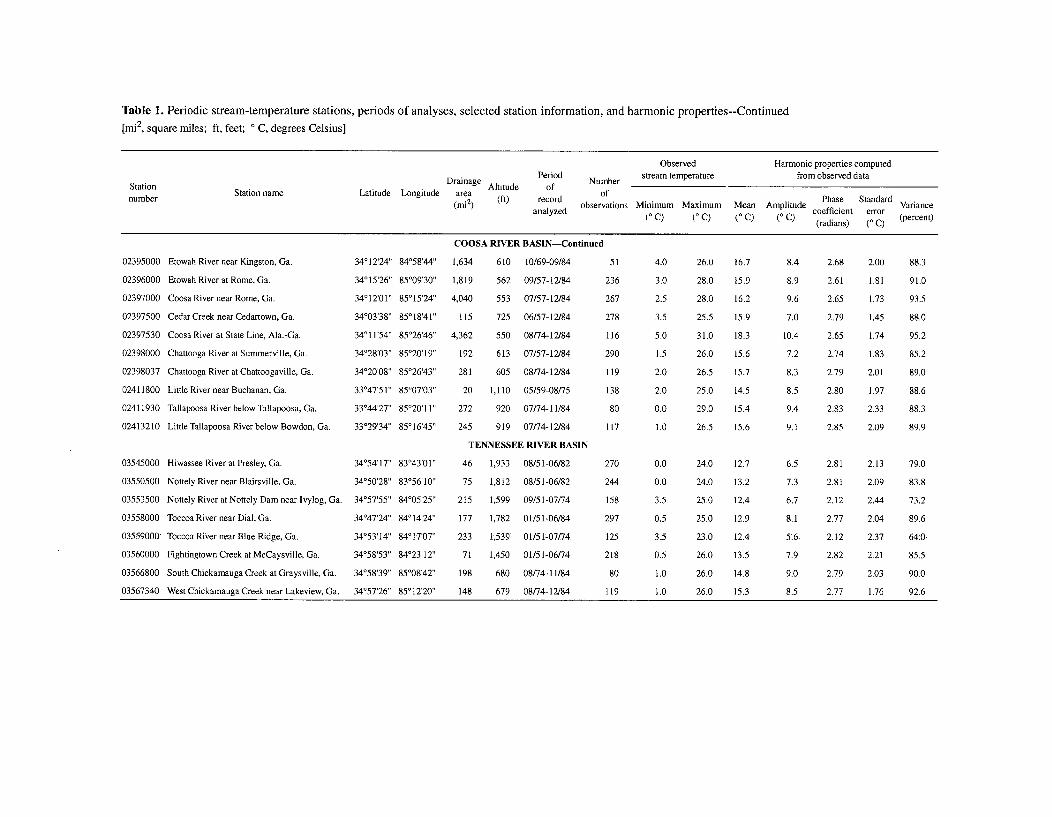
Table 1. Periodic stream-temperature stations, periods of analyses, selected station information, and harmonic properties--Continued
[mi2, square miles; ft, feet; 0 C, degrees Celsius]
Observed Harmonic properties computed
Drainage Period Number stream temperature from observed dataStation DriaeAltitude of NmeStation name Latitude Longitude area of
number (mil) (ft) record observations Minimum Maximum Mean Amplitude coefficientas (errr rceanalyzed 0(0 C) (0 C) (0 C) (0 C) (radfiians) (0rC) (percent)
COOSA RIVER BASIN-Continued
02395000 Etowah River near Kingston, Ga. 34o12'24"' W4O5844 1,634 610 10/69-09/84 51 4.0 26.0 16.7 8.4 2.68 2.00 88.3
02396000 Etowah River at Rome, Ga. 34'15'26"' 85009'30" 1,819 562 09/57-12/84 236 3.0 28.0 15.9 8.9 2.61 1.81 91.0
02397000 Coosa River near Rome, Ga. 34012'01' 85W15'24" 4,040 553 07/57-12/84 267 2.5 28.0 16.2 9.6 2.65 1.73 93.5
02397500 Cedar Creek near Cedartown, Ga. 34003'38" 85'18'41" 115 725 06/57-12/84 278 3.5 25.5 15.9 7.0 2.79 1.45 88.0
02397530 Coosa River at State Line, Ala.-Ga. 34o11F54" 85026'46" 4,362 550 08/74-12/84 116 5.0 31.0 18.3 10.4 2.65 1.74 95.2
02398000 Chattooga River at Summerville, Ga. 34028'03" 85020'19" 192 613 07/57-12/84 290 1.5 26.0 15.6 7.2 2.74 1.83 85.2
02398037 Chattooga River at Chattoogaville, Ga. 34020'08" 85o26'43" 281 605 08/74-12/84 119 2.0 26.5 15.7 8.3 2.79 2.01 89.0
02411800 Little River near Buchanan, Ga. 33047T51" 85°07'03'' 20 1,110 05/59-08/75 138 2.0 25.0 14.5 8.5 2.80 1.97 88.6
02411930 Tallapoosa River below Tallapoosa, Ga. 33o44'27" 85201 1" 272 920 07/74-11/84 80 0.0 29.0 15.4 9.4 2.83 2.33 88.3
02413210 Little Tallapoosa Riverbelow Bowdon, Ga. 33029'34" 85016'45' 245 919 07/74-12/84 117 1.0 26.5 15.6 9.1 2.85 2.09 89.9
TENNESSEE RIVER BASIN
03545000 Hiwassee River at Presley, Ga. 34054'17" 83043'011 46 1,933 08/51-06/82 270 0.0 24.0 12.7 6.5 2.81 2.13 79.0
03550500 Nottely River near Blairsville, Ga. 34050'28'' 83056'10' 75 1,812 08/51-06/82 244 0.0 24.0 13.2 7.3 2.81 2.09 83.8
03553500 Nottely River at Nottely Dam near lvylog, Ga. 34W57'55" 84'05'25" 215 1,599 09/51-07/74 158 3.5 25.0 12.4 6.7 2.12 2.44 73.2
03558000 Toccoa River near Dial, Ga. 34047'24 84W1424" 177 1,782 01/51-06/84 297 0.5 25.0 12.9 8.1 2.77 2.04 89.6
03559000 Toccoa River near Blue Ridge, Ga. 34°53'14' 84o 1707' 233 1.539, 01/51-07/741 125 3.5 23.0 12.4 5.6 2.12 2.37 64.0
03560000 Fightingtown Creek at McCaysville, Ga. 34o58'53"' 84023'12"' 71 1,450 01/51-06/74 218 0.5 26.0 13.5 7.9 2.82 2.21 85.5
03566800 South Chickamauga Creek at Graysville, Ga. 34058'39'' 85008'42" 198 680 08/74-11/84 80 1.0 26.0 14.8 9.0 2.79 2.03 90.0
03567340 West Chickamauga Creek near Lakeview, Ga. 34057'26' 85012'20" 148 679 08/74-12/84 119 1.0 26.0 15.3 8.5 2.77 1.76 92.6
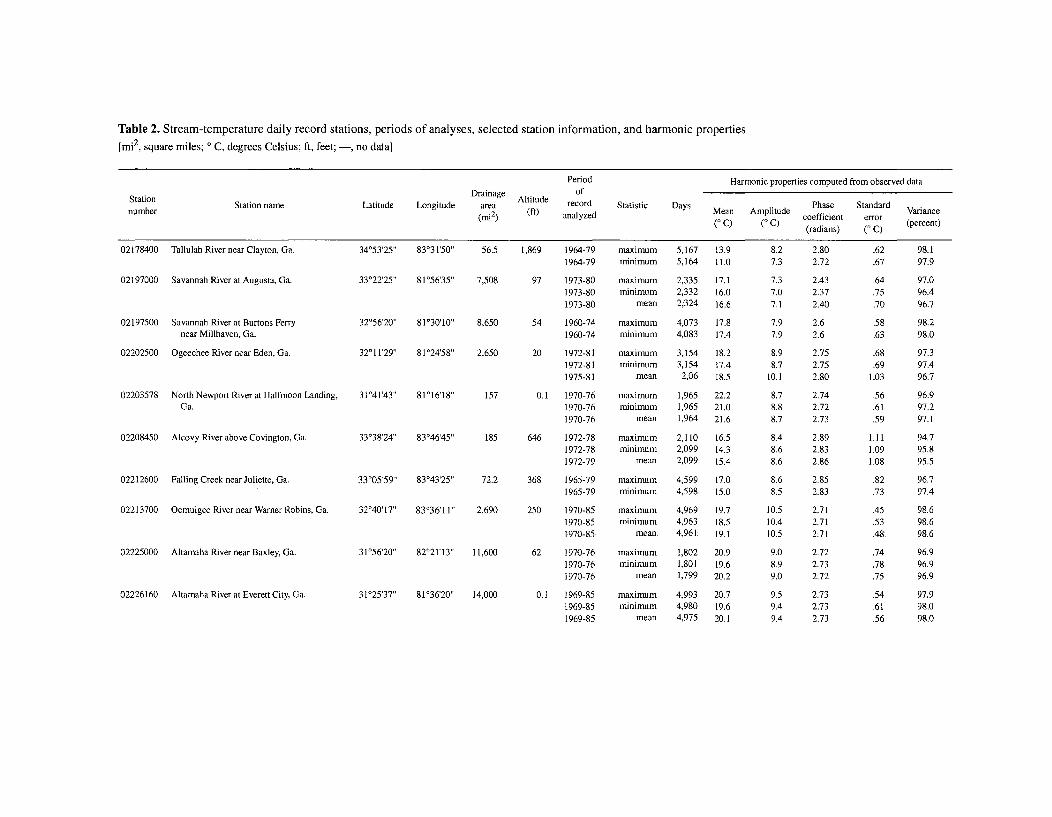
Table 2. Stream-temperature daily record stations, periods of analyses, selected station information, and harmonic properties[mi2, square miles; 0 C, degrees Celsius; ft, feet; -, no data]
Period Harmonic properties computed from observed data
Station Drainage Altitude of
number Station name Latitude Longitude area record Statistic Days Phase Standard Variancenmi2)b(ft) Mean Amplitudeacoefficient error (prce
(I m) (a nalyz (percent)(radians) (0 C)
02178400 Tallulah River near Clayton, Ga. 34O53'25'' 83031'50' 56.5 1,869 1964-79 maximum 5,167 13.9 8.2 2.80 .62 98.1
02197000 Savannah River at Augusta, Ga.
02197500 Savannah River at Burtons Ferrynear Millhaven, Ga.
02202500 Ogeechee River near Eden, Ga.
33O22'25' 8105635"
32056'20' 81030,10'
32011'29' 81024'58'
7,508
8,650
2,650
97
54
20
02203578 North Newport River at Halfmoon Landing, 3104143" 81016'18"Ga.
02208450 Alcovy River above Covington, Ga.
02212600 Falling Creek near Juliette, Ga.
02213700 Ocmulgee River near Warner Robins, Ga.
02225000 Altamaha River near Baxley, Ga.
02226160 Altamaha River at Everett City, Ga.
33038'24" 83046'45"*
33005,59" 83043'25'
32o40'17 83o36,11 "
31056'20' 82o21'13"
31025'37' 81036'20'
157 0.1
185 646
72.2 368
2,690 250
1964-79 minimum 5,164 11.0
1973-80 maximum 2,335 17.11973-80 minimum 2,332 16.01973-80 mean 2,324 16.6
1960-74 maximum 4,073 17.81960-74 minimum 4,083 17.4
1972-81 maximum 3,154 18.21972-81 minimum 3,154 17.41975-81 mean 2,06 18.5
1970-76 maximum 1,965 22.21970-76 minimum 1,965 21.01970-76 mean 1,964 21.6
1972-78 maximum 2,110 16.51972-78 minimum 2,099 14.31972-79 mean 2,099 15.4
1965-79 maximum 4,599 17.01965-79 minimum 4,598 15.0
1970-85 maximum 4,969 19.71970-85 minimum 4,963 18.51970-85 mean 4,961. 19 1
1970-76 maximum 1,802 20.91970-76 minimum 1,801 19.61970-76 mean 1,799 20.2
1969-85 maximum 4,993 20.71969-85 minimum 4,980 19.61969-85 mean 4,975 20.1
7.3
7.37.07.1
7.97.9
8.98.7
10.1
8.78.88.7
8.48.68.6
8.68.5
10.510.410.5
9.08.99.0
9.59.49.4
2.72
2.432.372.40
2.62.6
2.752.752.80
2.742.722.73
2.892.832.86
2.852.83
2.712.712.71:
2.722.732.72
2.732.732.73
.67
.64
.75
.70
.58
.63
.68
.691.03
.56
.61
.59
1.111.091.08
.82
.73
.45
.53
.48
.74
.78
.75
.54.61.56
97.9
97.096.496.7
98.298.0
97.397.496.7
96.997.297.1
94.795.895.5
96.797.4
98.698.69&6
96.996.996.9
97.998.098.0
11,600
14,000
62
0.1
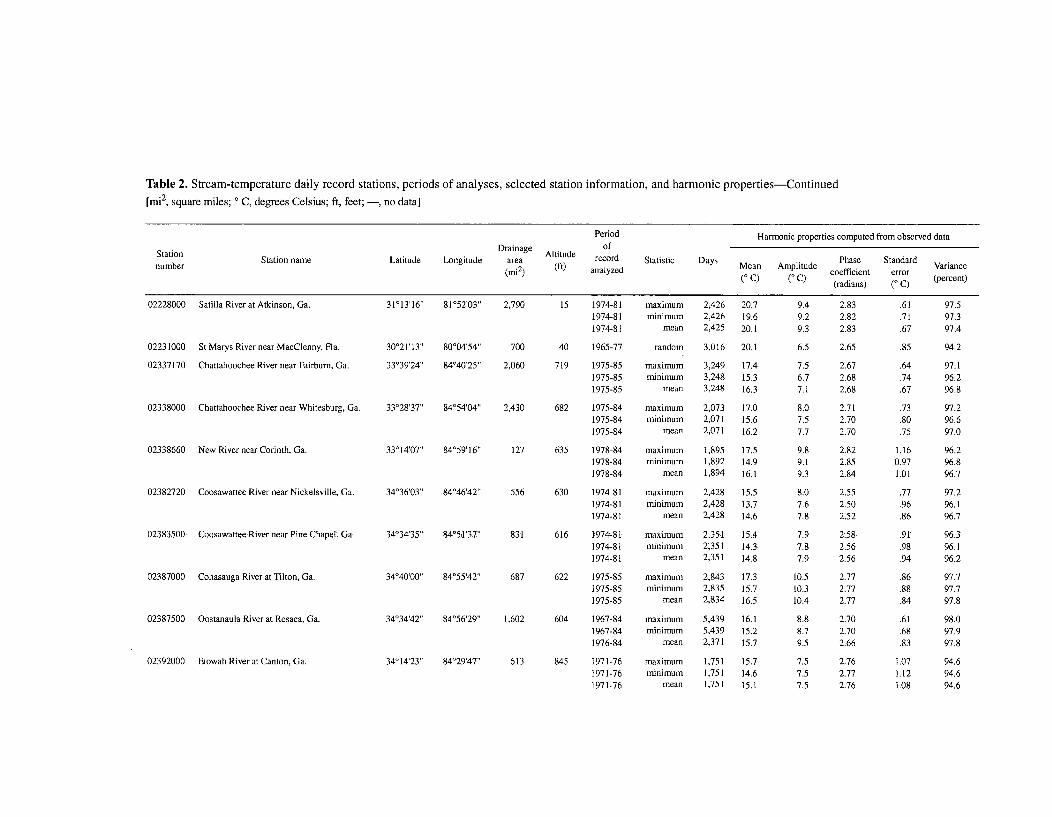
Table 2. Stream-temperature daily record stations, periods of analyses, selected station information, and harmonic properties-Continued
[mi 2, square miles; 0 C, degrees Celsius; ft, feet; -, no data]
Stationnumbern Station namenumber
02228000 Satilla River at Atkinson, Ga.
02231000 St Marys River near MacClenny, Fla.
02337170 Chattahoochee River near Fairburn, Ga.
02338000 Chattahoochee River near Whitesburg, Ga.
02338660 New River near Corinth, Ga.
02382720 Coosawattee River near Nickelsville, Ga.
02383500 CoosawatteeRiver near Pine Chapel, Ga
02387000 Conasauga River at Tilton, Ga.
02387500 Oostanaula River at Resaca, Ga.
02392000 Etowah River at Canton, Ga.
Period Harmonic properties computed from observed data
Drainage Altitude of
Latitude Longitude area record Statistic Days Mean Amplitude Phase Standard Variance2(mi ) analyzed (ftn Q p coefficient error Varce
analyz (0 C) (0 C) (radians) (0 C) (percent)
31013'16" 81052'03' 2,790 15 1974-81 maximum 2,426 20.7 9.4 2.83 .61 97.5
30o21'13 80004'54
33039'24' 84040,25"
33028'37"' 84W54'04"
33o14,07'' 84o59,16"
34036'03" 84046'42"
34034'35'' 84051'370
34040'00" 8405542"
34o34'42" 84056'29"
34014'23' 84029'47'
700
2,060
2,430
127
556
831
687
1,602
613
40
719
682
635
630
616
622
604
845
1974-811974-81
1965-77
1975-851975-851975-85
1975-841975-841975-84
1978-841978-841978-84
1974-811974-811974-81
1974-811974-811974-81
1975-851975-851975-85
1967-841967-841976-84
1971-761971-761971-76
minimum 2,426 19.6mean 2,425 20.1
random 3,016 20.1
maximum 3,249 17.4minimum 3,248 15.3
mean 3,248 16.3
maximum 2,073 17.0minimum 2,071 15.6
mean 2,071 16.2
maximum 1,895 17.5minimum 1,892 14.9
mean 1,894 16.1
maximum 2,428 15.5minimum 2,428 13.7
mean 2,428 14.6
maximum 2,351 15.4minimum 2,351 14.3
mean 2,351 14.8
maximum 2,843 17.3minimum 2,835 15.7
mean 2,834 16.5
maximum 5,439 16.1minimum 5,439 15.2
mean 2,371 15.7
maximum 1,751 15.7minimum 1,751 14.6
mean 1,751 15.1
9.29.3
6.5
7.56.77.1
8.07.57.7
9.89.19.3
8.07.67.8
7.97.87.9
10.510.310.4
8.88.79.5
7.57.57.5
2.822.83
2.65
2.672.682.68
2.712.702.70
2.822.852.84
2.552.502.52
2.582.562.56
2.772.772.77
2.702.702.66
2.762.772.76
.71
.67
.85
.64
.74
.67
.73
.80
.75
1.160.971.01
.77
.96
.86
.91
.98
.94
.86
.88
.84
.61
.68
.83
1.071.121.08
97.397.4
94.2
97.196.296.8
97.296.697.0
96.296.896.7
97.296.196.7
96.396.196.2
97.797.797.8
98.097.997.8
94.694.694.6
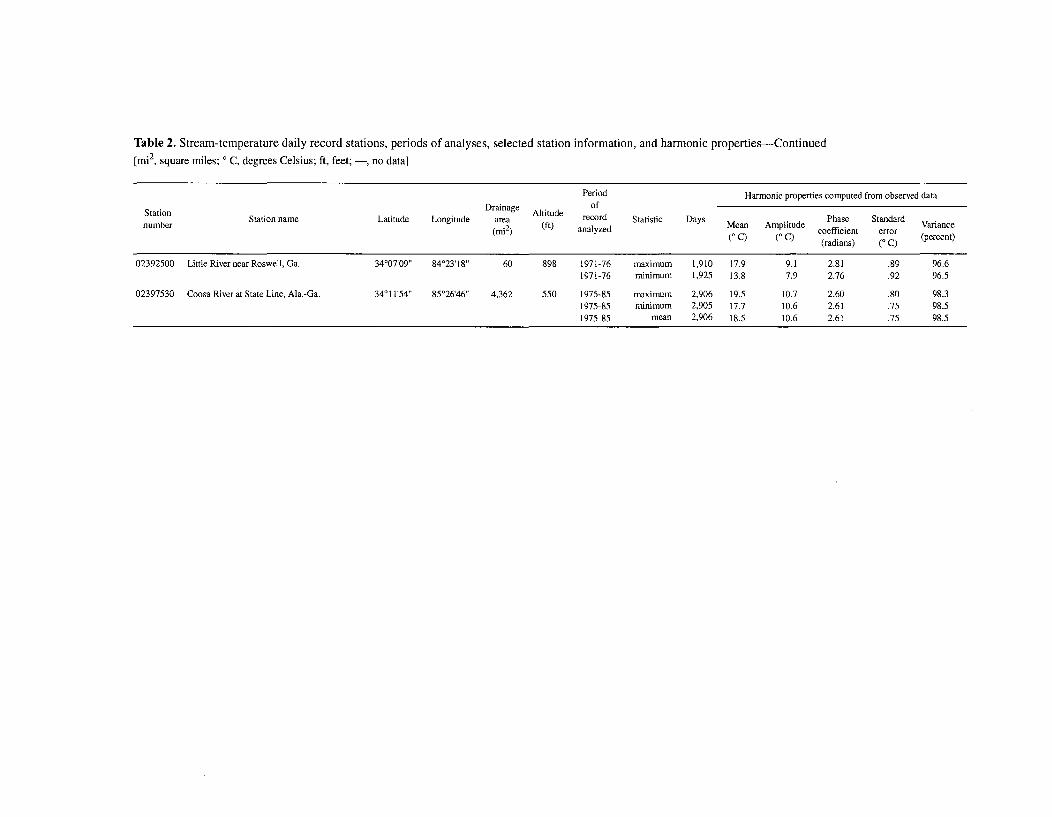
Table 2. Stream-temperature daily record stations, periods of analyses, selected station information, and harmonic properties-Continued
[mi2, square miles; o C, degrees Celsius; ft, feet; -, no data]
Period Harmonic properties computed from observed data
Station Drainage Altitude ofSStation name Latitude Longitude area record Statistic Days Phase Standard
number (mi2) (ft) analyzed Mean Amplitude coefficient error Variance
(I Q C Q (radians) (C ( (percent)
02392500 Little River near Roswell, Ga. 34O07'09'' 84023'18" 60 898 1971-76 maximum 1,910 17.9 9.1 2.81 .89 96.6
1971-76 minimum 1,925 13.8 7.9 2.76 .92 96.5
02397530 Coosa River at State Line, Ala.-Ga. 340 11'54" 85026'46' 4,362 550 1975-85 maximum 2,906 19.5 10.7 2.60 .80 98.3
1975-85 minimum 2,905 17.7 10.6 2.61 .75 98.51975-85 mean 2,906 18.5 10.6 2.61 .75 98.5
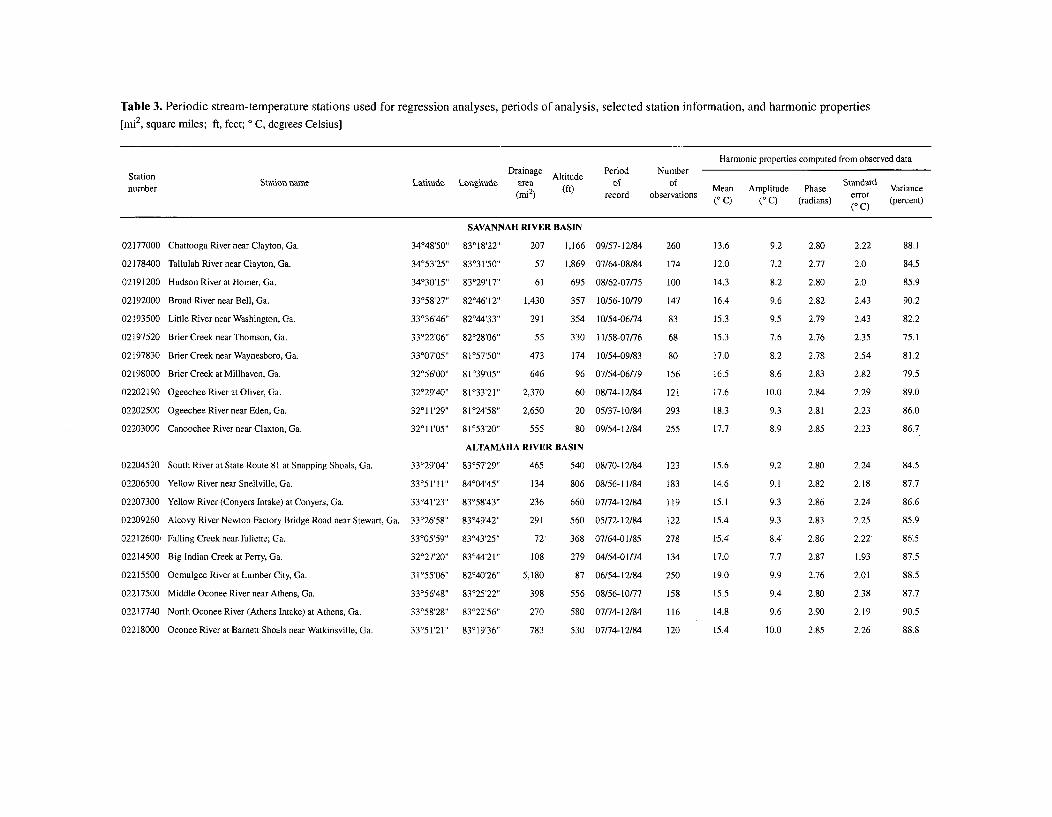
Table 3. Periodic stream-temperature stations used for regression analyses, periods of analysis, selected station information, and harmonic properties
[mi2, square miles; ft, feet; 0 C, degrees Celsius]
Harmonic properties computed from observed data
Station Drainage Altitude Period Numbernumber Station 1ame Latitude Longitude area of of Mean Amplitude Phase Stanad Variance(mi2 ) record observations error Varce(0 C) (0 C) (radians) (percent)
(0 C)
SAVANNAH RIVER BASIN
02177000 Chattooga River near Clayton, Ga. 34048'50" 83018-22" 207 1,166 09/57-12/84 260 13.6 9.2 2.80 2.22 88.1
02178400 Tallulah River near Clayton, Ga. 34053'25'' 83031'50" 57 1,869 07/64-08/84 174 12.0 7.2 2.77 2.0 84.5
02191200 Hudson River at Homer, Ga. 34030'15"' 83029'17" 61 695 08/62-07n75 100 14.3 8.2 2.80 2.0 85.9
02192000 Broad River near Bell, Ga. 33o58'27'' 82046'12' 1,430 357 10/56-10179 147 16.4 9.6 2.82 2.43 90.2
02193500 Little River near Washington, Ga. 33036'46' 82044'33" 291 354 10/54-06/74 83 15.3 9.5 2.79 2.43 82.2
02197520 Brier Creek near Thomson, Ga. 33022'06"' 82028'06' 55 330 11/58-07n76 68 15.3 7.6 2.76 2.35 75.1
02197830 Brier Creek near Waynesboro, Ga. 33007'05' 81057'50" 473 174 10/54-09/83 80 17.0 8.2 2.78 2.54 81.2
02198000 Brier Creek at Millhaven, Ga. 32056'00" 81039'05" 646 96 07/54-06179 156 16.5 8.6 2.83 2.82 79.5
02202190 Ogeechee River at Oliver, Ga. 32029'40' 81033'21 2,370 60 08/74-12/84 121 17.6 10.0 2.84 2.29 89.0
02202500 Ogeechee River near Eden, Ga. 32011'29" 81024'58" 2,650 20 05/37-10/84 293 18.3 9.3 2.81 2.23 86.0
02203000 CanoocheeRivernearClaxton, Ga. 32011'05' 81053'20' 555 80 09/54-12/84 255 17.7 8.9 2.85 2.23 86.7
ALTAMAHA RIVER BASIN
02204520 South River at State Route 81 at Snapping Shoals, Ga. 33029'04"' 83057'29" 465 540 08/70-12/84 123 15.6 9.2 2.80 2.24 84.5
02206500 Yellow River near Snellville, Ga. 33051l11' 84004'45"' 134 806 08/56-11/84 183 14.6 9.1 2.82 2.18 87.7
02207300 Yellow River (Conyers Intake) at Conyers, Ga. 33041'23"' 83058'43' 236 660 07/74-12/84 119 15.1 9.3 2.86 2.24 86.6
02209260 Alcovy River Newton Factory Bridge Road near Stewart, Ga. 33026'58" 83049'42" 291 560 05/72-12/84 122 15.4 9.3 2.83 2.25 85.9
02212600 Falling Creek near.Juliette; Ga. 33'05!59"' 83O43'25" 72 368 07/64-01/85 278 15.4 8.4 2.86 2.22 86.5
02214500 Big Indian Creek at Perry, Ga. 3202720" 83044'21" 108 279 04/54-01174 134 17.0 7.7 2.87 1.93 87.5
02215500 Ocmulgee River at Lumber City, Ga. 31055'06" 82040'26" 5,180 87 06/54-12/84 250 19.0 9.9 2.76 2.01 88.5
02217500 Middle Oconee River near Athens, Ga. 33056'48'' 83025'22' 398 556 08/56-10177 158 15.5 9.4 2.80 2.38 87.7
02217740 North Oconee River (Athens Intake) at Athens, Ga. 33058'28'' 83022'56" 270 580 07/74-12/84 116 14.8 9.6 2.90 2.19 90.5
02218000 Oconee River at Barnett Shoals near Watkinsville, Ga. 33051'21"' 83019'36" 783 530 07/74-12/84 120 15.4 10.0 2.85 2.26 88.8
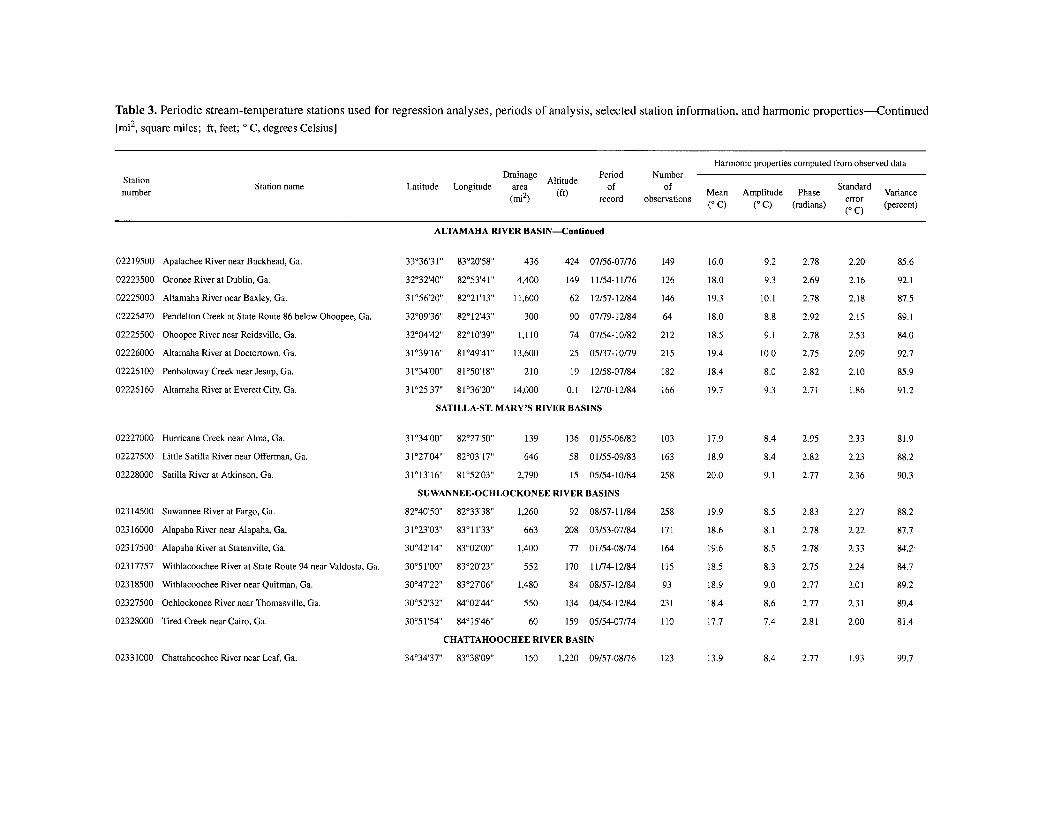
Table 3. Periodic stream-temperature stations used for regression analyses, periods of analysis, selected station information, and harmonic properties-Continued
[mi2, square miles; ft, feet; 0 C, degrees Celsius]
Harmonic properties computed from observed data
Station Drainage Altitude Period Numbernumber Station name Latitude Longitude area (ft) of f Mean Amplitude Phase Standard
(nr2) record observations error Varce(0 C) (0 C) (radians) (0 C) (percent)
ALTAMAHA RIVER BASIN-Continued
02219500 Apalachee River near Buckhead, Ga. 33o36'31I" 83020'58' 436 424 07/56-07n76 149
02223500 Oconee River at Dublin, Ga. 32o32'40' 82053'41" 4,400 149 11/54-11 76 126
02225000 AltamahaRivernearBaxley, Ga. 31056'20' 82021'13' 11,600 62 12/57-12/84 146
02225470 Pendelton Creek at State Route 86 below Ohoopee, Ga. 32009'36" 82012'43' 300 90 07/79-12/84 64
02225500 Ohoopee River near Reidsville, Ga. 32004'42' 82010'39' 1,110 74 07/54-10/82 212
02226000 Altamaha River at Doctortown, Ga. 31039'16' 81049'41 13,600 25 05/37-10179 215
02226100 Penholoway Creek near Jesup, Ga. 31o34'00 8150'18' 210 19 12/58-07/84 182
02226160 Altamaha River at Everett City, Ga. 31025'37' 81o36'20' 14,000 0.1 12/70-12/84 166
SATILLA-ST. MARY'S RIVER BASINS
02227000 Hurricane Creek near Alma, Ga. 31034'00' 82027'50' 139 136 01/55-06/82 103
02227500 Little Satilla River near Offerman, Ga. 31027'04" 82003'17" 646 58 01/55-09/83 163
02228000 Satilla River at Atkinson, Ga. 31013'16" 81052'03" 2,790 15 05/54-10/84 258
SUWANNEE-OCHLOCKONEE RIVER BASINS
02314500 Suwannee River at Fargo, Ga. 82o40'50" 82o33'38" 1,260 92 08/57-11/84 258
02316000 Alapaha River near Alapaha, Ga. 31023'03" 83t1 1'33" 663 208 03/53-07/84 171
02317500 Alapaha River at Statenville, Ga. 30042'14 8302'00" 1,400 77 01154-08/74 164
02317757 Withlacoochee River at State Route 94 near Valdosta, Ga. 30051'00" 83020'23' 552 170 11174-12/84 115
02318500 Withlacoochee River near Quitman, Ga. 30047'22" 83027'06" 1,480 84 08/57-12/84 93
02327500 Ochlockonee River near Thomasville, Ga. 30052'32 84002'44" 550 134 04/54-12/84 231
02328000 Tired Creek near Cairo, Ga. 30051'54 84015'46"' 60 159 05/54-07/74 110
CHATTAHOOCHEE RIVER BASIN
02331000 Chattahoochee River near Leaf, Ga. 34034'37" 83038'09" 150 1,220 09/57-08176 123
16.0
18.0
19.3
18.0
18.5
19.4
18.4
19.7
17.9
18.9
20.0
19.9
18.6
19.6
18.5
18.9
18.4
17.7
9.2 2.78 2.20
9.3 2.69 2.16
10.1 2.78 2.18
8.8 2.92 2.15
9.1 2.78 2.53
10.0 2.75 2.09
8.0 2.82 2.10
9.3 2.71 1.86
8.4 2.95 2.33
8.4 2.82 2.23
9.1 2.77 2.36
8.5 2.83 2.27
8.1 2.78 2.22
8.5 2.78 233
8.3 2.75 2.24
9.0 2.77 2.01
8.6 2.77 2.31
7.4 2.81 2.00
85.6
92.1
87.5
89.1
84.0
92.7
85.9
91.2
81.9
88.2
90.3
88.2
87.7
84.2
84.7
89.2
89.4
81.4
13.9 8.4 2.77 1.93 99.7
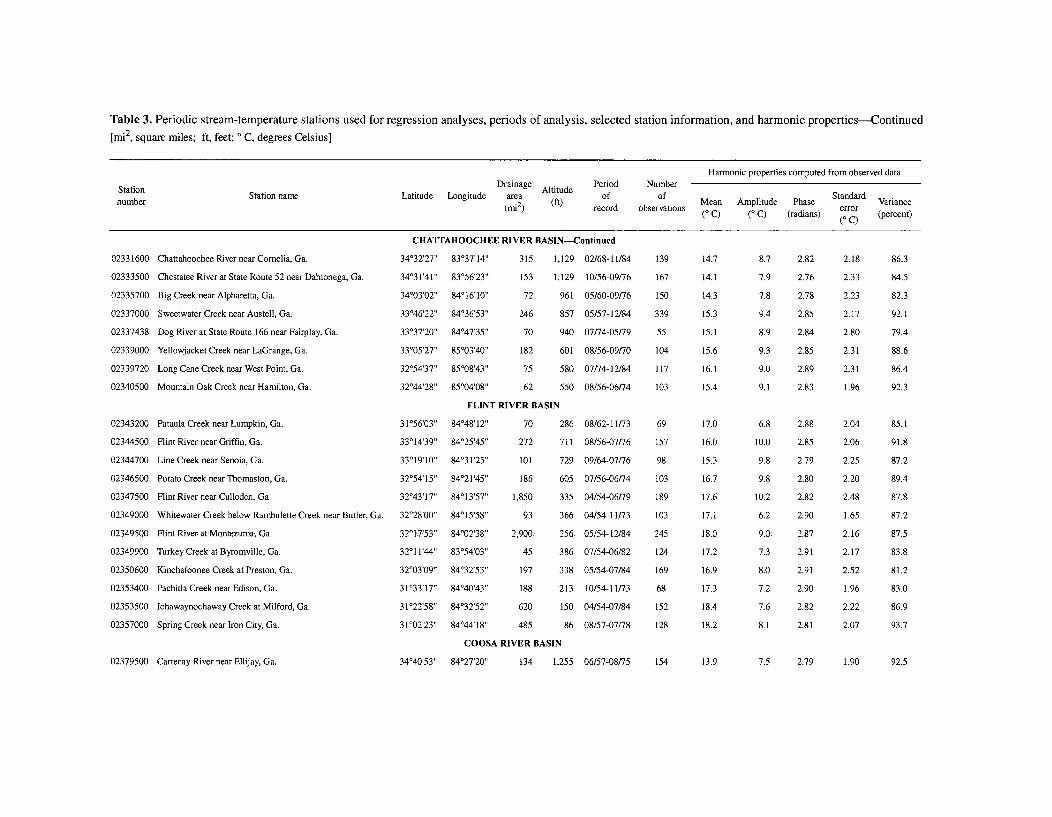
Table 3. Periodic stream-temperature stations used for regression analyses, periods of analysis, selected station information, and harmonic properties-Continued
[mi2, square miles; ft, feet; 0 C, degrees Celsius]
Harmonic properties computed from observed dataStation Drainage Altitude Period Number
Station name Latitude Longitude area Of of Standardnumber (mi2) (ft) record observations Mean Amplitude Phase error Variance
(0 C) (0 C) (radians) (0 C) (percent)
CHA'ITAHOOCHEE RIVER BASIN-Continued
02331600 ChattahoocheeRivernearCornelia, Ga. 34032'27" 83037'14" 315 1,129 02/68-11/84 139 14.7 8.7 2.82 2.18 86.3
02333500 Chestatee River at State Route 52 near Dahlonega, Ga. 34O31F41 " 83056'23" 153 1,129 10/56-09/76 167 14.1 7.9 2.76 2.33 84.5
02335700 Big Creek near Alpharetta, Ga. 34o03'02 8401610" 72 961 05/60-09/76 150 14.3 7.8 2.78 2.23 82.3
02337000 Sweetwater Creek near Austell, Ga. 33046'22"' 8403653' 246 857 05/57-12/84 339 15.3 9.4 2.85 2.17 92.1
02337438 Dog River at State Route 166 near Fairplay, Ga. 33O37'20' 84047'35" 70 940 07/74-05/79 55 15.1 8.9 2.84 2.80 79.4
02339000 Yellowjacket Creek near LaGrange, Ga. 33005'27' 85003'40' 182 601 08/56-09/70 104 15.6 9.3 2.85 2.31 88.6
02339720 Long Cane Creek near West Point, Ga. 32054'37' 85008-43' 75 580 07/74-12/84 117 16.1 9.0 2.89 2.31 86.4
02340500 Mountain Oak Creek near Hamilton, Ga. 32044'28 85004'08 62 550 08/56-06/74 103 15.4 9.1 2.83 1.96 92.3
FLINT RIVER BASIN
02343200 Pataula Creek near Lumpkin, Ga. 31056'03" 84O48'12" 70 286 08/62-11/73 69 17.0 6.8 2.88 2.04 85.1
02344500 Flint River near Griffin, Ga. 33'14'39" 84o25'45' 272 711 08/56-07/76 157 16.0 10.0 2.85 2.06 91.8
02344700 Line Creek near Senoia, Ga. 33019'10" 84O31'25' 101 729 09/64-07/76 98 15.3 9.8 2.79 2.25 87.2
02346500 Potato Creek near Thomaston, Ga. 32054'15" 84021'45' 186 605 07/56-06/74 103 16.7 9.8 2.80 2.20 89.4
02347500 Flint River near Culloden, Ga. 32043'17' 8401357' 1,850 335 04/54-06/79 189 17.6 10.2 2.82 2.48 87.8
02349000 Whitewater Creek below Rambulette Creek near Butler, Ga. 32028'00' 84015'58" 93 366 04/54-11/73 103 17.1 6.2 2.90 1.65 87.2
02349500 Flint River at-Montezunma Ga. 3201753" 84'02'38' 2,900. 256. 05/54-12/84 245 18.0 9.0. 2.87 2.16 87.5.
02349900 Turkey Creek at Byromville, Ga. 32011'44" 83054'03" 45 386 07/54-06/82 124 17.2 7.3 2.91 2.17 83.8
02350600 Kinchafoonee Creek at Preston, Ga. 32003'09" 84032'53" 197 338 05/54-07/84 169 16.9 8.0 2.91 2.52 81.2
02353400 PachitlaCreek near Edison, Ga. 3133'17 84040'43" 188 213 10/54-11/73 68 17.3 7.2 2.90 1.96 83.0
02353500 Ichawaynochaway Creek at Milford, Ga. 31022'58" 84032'52" 620 150 04/54-07/84 152 18.4 7.6 2.82 2.22 86.9
02357000 Spring Creek near lron City, Ga. 3102'23" 84044'18" 485 86 08/57-07/78 128 18.2 8.1 2.81 2.07 93.7
COOSA RIVER BASIN
02379500 Cartecay River near Ellijay, Ga. 34O4O'53*' 84027'20" 134 1,255 06/57-08/75 154 13.9 7.5 2.79 1.90 92.5
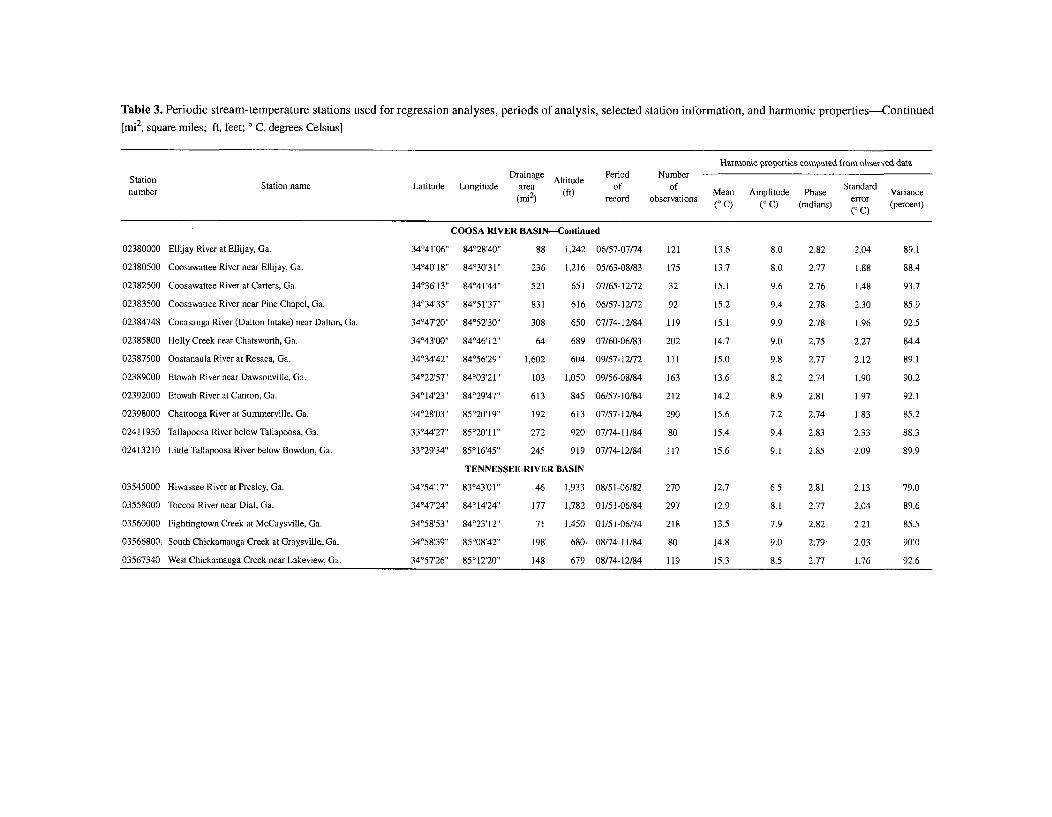
Table 3. Periodic stream-temperature stations used for regression analyses, periods of analysis, selected station information, and harmonic properties-Continued
[mi2, square miles; ft, feet; 0 C, degrees Celsius]
Harrnnvc popuxtsle computed from observed data,
Station Drainage Altitude Period Numbernumber Station name Latitude Longitude area ft) of of Mean Amplitude Phase Standard Variance
(mi2) record observations error(0 C) (0 C) (radians) (0 C) (percent)
02380000 Ellijay River at Ellijay, Ga.
02380500 Coosawattee River near Ellijay, Ga.
02382500 Coosawattee River at Carters, Ga.
02383500 Coosawattee River near Pine Chapel, Ga.
02384748 Conasauga River (Dalton Intake) near Dalton, Ga.
02385800 Holly Creek near Chatsworth, Ga.
02387500 Oostanaula River at Resaca, Ga.
02389000 Etowah River near Dawsonville, Ga.
02392000 Etowah River at Canton, Ga.
02398000 Chattooga River at Summerville, Ga.
02411930 Tallapoosa River below Tallapoosa, Ga.
02413210 Little Tallapoosa River below Bowdon, Ga.
03545000 Hiwassee River at Presley, Ga.
03558000 Toccoa River near Dial, Ga.
03560000 Fightingtown Creek at McCaysville, Ga.
03566800, South Chickamauga Creek at Graysville,,Ga.
03567340 West Chickamauga Creek near Lakeview, Ga.
COOSA RIVER BASIN-Continued
3404l'06'' 84028'40" 88 1,242 06/57-07/74 121 13.6
340'418" 84030'31" 236 1,216 05/63-08/83 175 13.7
34o36'13'' 84041'44" 521 651 07/65-12/72 32 15.1
34034'35'' 84051'37" 831 616 06/57-12/72 92 15.2
34W47'20"' 84052'30'' 308 650 07/74-12/84 119 15.1
34o43'00" 84046'12" 64 689 07/60-06/83 202 14.7
34o34'42" 84056'29' 1,602 604 09/57-12/72 111 15.0
34o22'57" 84W03'21 103 1,050 09/56-08/84 163 13.6
34'14'23" 84029-47"' 613 845 06/57-10/84 212 14.2
34o28'03" 85020'19" 192 613 07/57-12/84 290 15.6
33o44'27" 85020'11 272 920 07/74-11/84 80 15.4
33o29'34"' 85016'45' 245 919 07/74-12/84 117 15.6
TENNESSEE RIVER BASIN
34o54'17" 83043'01' 46 1,933 08/51-06/82 270 12.7
34047'24'' 84014'24*' 177 1,782 01/51-06/84 297 12.9
34o58'53"' 84023'12' 71 1,450 01/51-06/74 218 13.5
34058'39"* 85o08!42' 198 680. 08/74-11/84, 80 14.8
34W57'26"' 85012'20' 148 679 08/74-12/84 119 15.3
8.0 2.82 2.04 89.1
8.0 2.77 1.88 88.4
9.6 2.76 1.48 93.7
9.4 2.78 2.30 85.9
9.9 2.78 1.96 92.5
9.0 2.75 2.27 84.4
9.8 2.77 2.12 89.1
8.2 2.74 1.90 90.2
8.9 2.81 1.97 92.1
7.2 2.74 1.83 85.2
9.4 2.83 2.33 88.3
9.1 2.85 2.09 89.9
6.5 2.81 2.13 79.0
8.1 2.77 2.04 89.6
7.9 2.82 2.21 85.5
9.0 2:79 2.03 90:0
8.5 2.77 1.76 92.6
GRAPHS SHOWING HARMONICSTREAM-TEMPERATURE CURVES OF
OBSERVED DATA AND STATEWIDEHARMONIC EQUATION FOR SELECTED
STATIONS, FIGURES 14-211
51
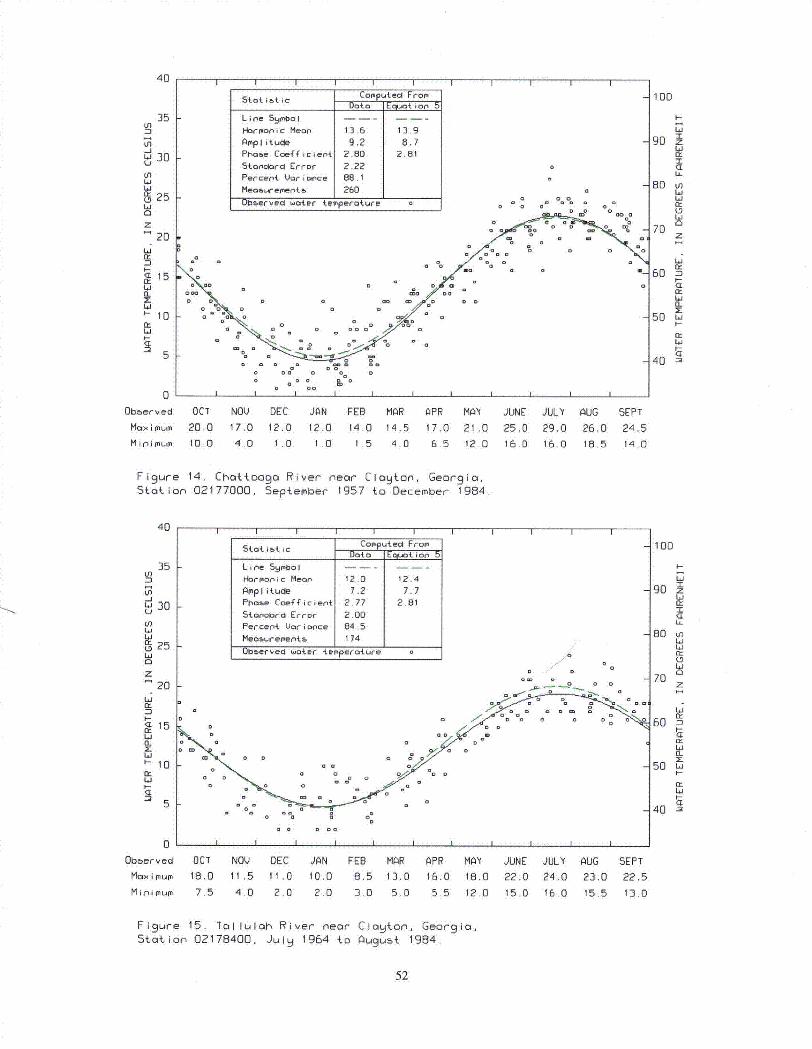
40
35 Iin
in
30
in
'(' 25
0
z20
Li
C15
IL
H10
5
0
Obeer v ed
Maximu
M in ii mum
I I II I I I III
Star it ic COP uteci FromData Eoguot iof, 5
Line Symbo I
Harmonic Mean 13.6 13.9
Amplitude 9.2 8.7Phase Coef icieni 2.80 2.81
otnaura Lrror C.cc I 0
Percent Uori nce 88.1
Measurements 260 0
Observed water temperature 0 o o • 0 00 0 0
I I o I I I
o n oo~~ 6o 0
oo o
o oQ o o
0 oo0 00 i i i i
100
90 zI
U.
80 i
7D Z
Lj
60
50 Lin-"k:
Li
40 •
OCT
20.0
IO.0
NOV DEC JON FEB MAR APR MAY JUNE JULY AUG17.0 12.0 12.0 14.0 14.5 17.0 21 .0 25.0 29.0 26.04.0 1 .0 1 .0 1.5 4.0 6.5 12.0 16.0 16.0 18.5
SEPT
24.5
14.0
Figure 14. Chattoogo River near Clayton, Georgia,Station 02177000, September 1957 to December 1984.
40
35in
Ln
30
(n
Li025
Li
z20
Li
<E 15
(L
H10
5
0Obberved
Max imum
M i n i MUMII
I I I I I IIII
Stat ist ic Computecl From"Dot 0 EClpot ior, 5
Line SymboHorronic Mean 12.0 12.4Amplitude 7.2 7.7Phase Coefficient 2.77 2.81
5tancoard Error 2.00
Percent ,atri ance 84.5
Measurements 174
Observed water temperature o
oo\ °o o a=~~~~ -,0 ••
100
90 z
80 inLin-
70 Z
60 I--
m"
50 Li
40 -
OCT NOV DEC JAN FEB MAR APR MAY JUNE JULY AUG18,0 11.5 11.0 10.0 8.5 13.0 16.0 18.0 22.0 24.0 23.0
7.5 4.0 2.0 2.0 3.0 5.0 5.5 12.0 15.0 16.0 15.5
SEPT
22.5
13.0
Figure 15. Tallulah River near Clayton, Georgia,Station 02178400, July 1964 to August 1984.
52
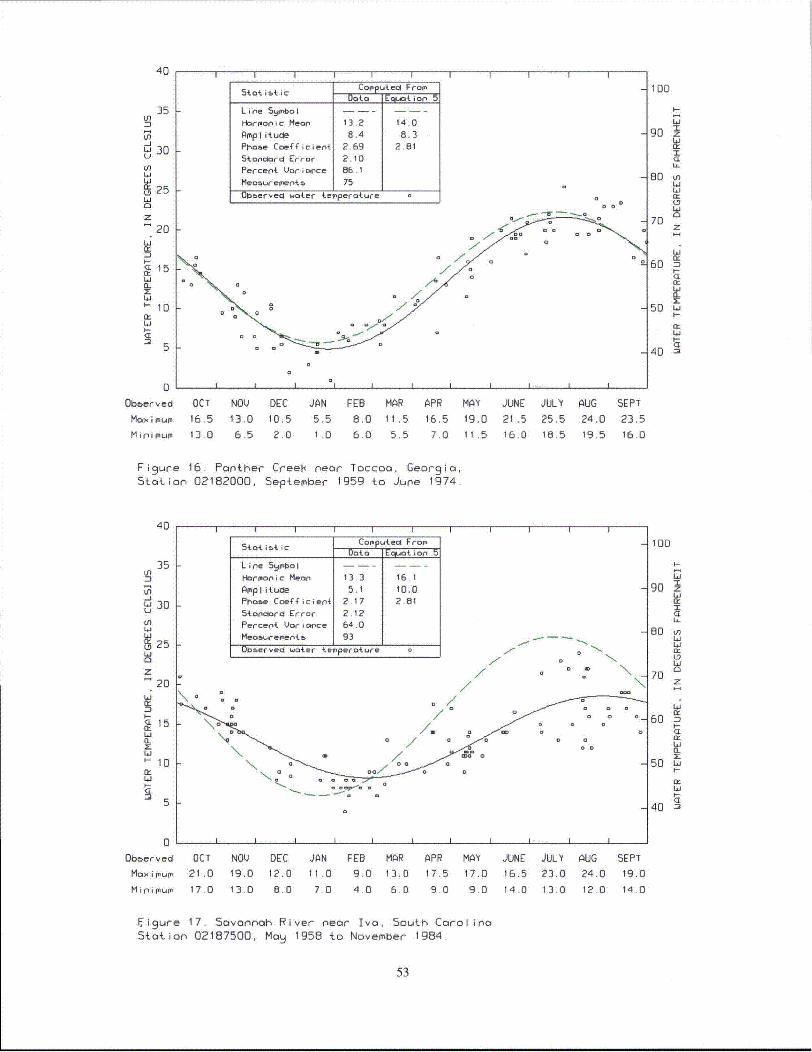
40
35Lf
0W 30U)Ln
N 25Li
20
21
L,zI-
-10cr,
5
L i e Syrobo I --Harmoicop Mean. 13.2 14.0
Amiplitude 8,4 8.3Phas~e Coefficient 2.69 2.61
Stornciordi Error 2.10
Percent. Varian~ce 86.1
MeO&Urer'entb 75 ----
r 07o o
I I I I I
100
go zI
80 mLI-
70 z
60I.-
50 waI-
I-r
40 "•
JtOb~erved
Maximu
Min imvum
I I I I I I I I
OCT NOV DEC16.5 13.0 10.5
13.0 6.5 ?.0
JAN FEB MAR
5.5 8.0 11.51.0 6.0 5.5
APR MAY JUNE16.5 19.0 22 .5
7,0 11.5 16.0
JULY AUG
25,5 24.0
18.5 19.5
SEPT
23.516.0
Figure 16. Panther Creel% near Tocco, Georgia,Station 02182000, Sepltember 1959 to June 1974.
40
35 .U)
-Jw30
U)
-n
S25
20
a_
1 0
I-
• 15La
S20
'- 1
5
stat ~k i Comutecl Fruom
Lin~e Syiobol -- - -
Harmoni~c Mean. 13.3 16.1
Amoplitude 5.1 10.0
Phase Coxfficier.* 2.17 2.81
Stan~ciord Error 2.12
Percent& Vorarn~ce 64.0
Measurvemoents- 93--.-Uboserved water terperoture 0,.N
7 0 0 0
i I II I0
100
I-La
90 z
CI
80 U
L1o:U
70
60CL
50 La
t-
40 La
o
0Obberved
Max mu
M pi nium
OCT NOV DEC JAN FEB MAR
21.0 19.0 12.0 21.0 9.0 13.0
17.0 13.0 8.0 7 0 4.0 6.0
APR MAY JUNE
17.5 17.0 16.5
9.0 9.0 14.0
JULY AUG
23.0 24.0
130 12.0
SEPT
19.0
14.0
Figure 17. Savannab River near Iva, South CarolinaStation 02187500, Maq 1958 ato November 1984.
53
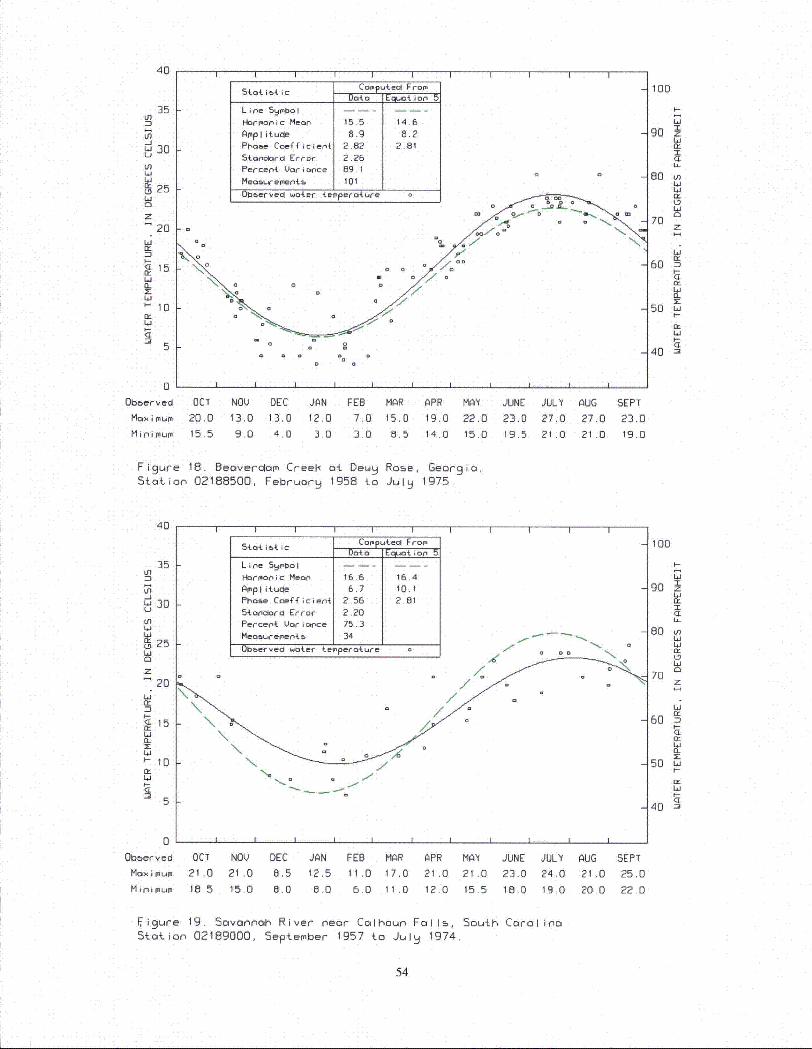
40
35In
-J
230Ln
ND 250
z20
15CL
'-10
5
I I I I I II I I I
iCoputei FromData Equtio
Line Symbol -----
Haronic Mean 15.5 14.6
AmI l itude 8.9 8.2Phase Coeffiien{ 2.62 2.81Sanr-clar Error 2.26
Percent Vori nce 89.1
MeabLrementb- 101
OUbervecl woter temperature o
I Ib
Q0
I a 0 0a a • •a0
100
I-
90 z
80 knLi
70 z
I-
50 w.4-
40 "•
0
Obberved
Maximum
M inimumn
OCT NOV DEC JAN FEB MAR
20.0 13.0 13.0 12.0 7.0 15.015.5 9.0 4.0 3.0 3.0 8.5
APR MAY
19.0 22.0
14.0 15.0
JUNE JULY AUG
23.0 27,0 27.0
19.5 21.0 21.0
SEPT
23.0
19.0
Figure 18. Beaverclom Creek at Dewy Rose, Georgia,Station 02188500, February 1958 to July 1975.
40
35 IInLn-JW 30
.,JO
U
256i
20z
L_M
.I-15
10
5
0
Obouerved
Max i mumM inimum
I I I I I I I
Stotist ic Computed FromData iEquaion 5
Line Symbol ... .
Harmonic Mean 16.6 16.4
Amplituce 6.7 10.1
Phase Coefficient 2,56 2.81
Stranlord Error 2.20
Percent Variance 75.3
Meosuievment- ~34 ..
Obeerved water temperature a a
0 0
I I I I II
100
U-90 z
60
50 flj
L4Li
70
IE
I--
r,-
40 -•
OCT
21.0
18.5
NOV
21 .0
15.0
DEC JAN FEB MAR APR MAY JUNE JULY AUG
8.5 12,5 11,0 17.0 21.0 21.0 23.0 24.0 21.08.0 8.0 6.0 11.0 12.0 15.5 18.0 19.0 20.0
SEPT
25.0
22.0
Figure 19. Savannah River near Calhoun Falls, South CarolinoStation 02189000, September 1957 to July 1974.
54
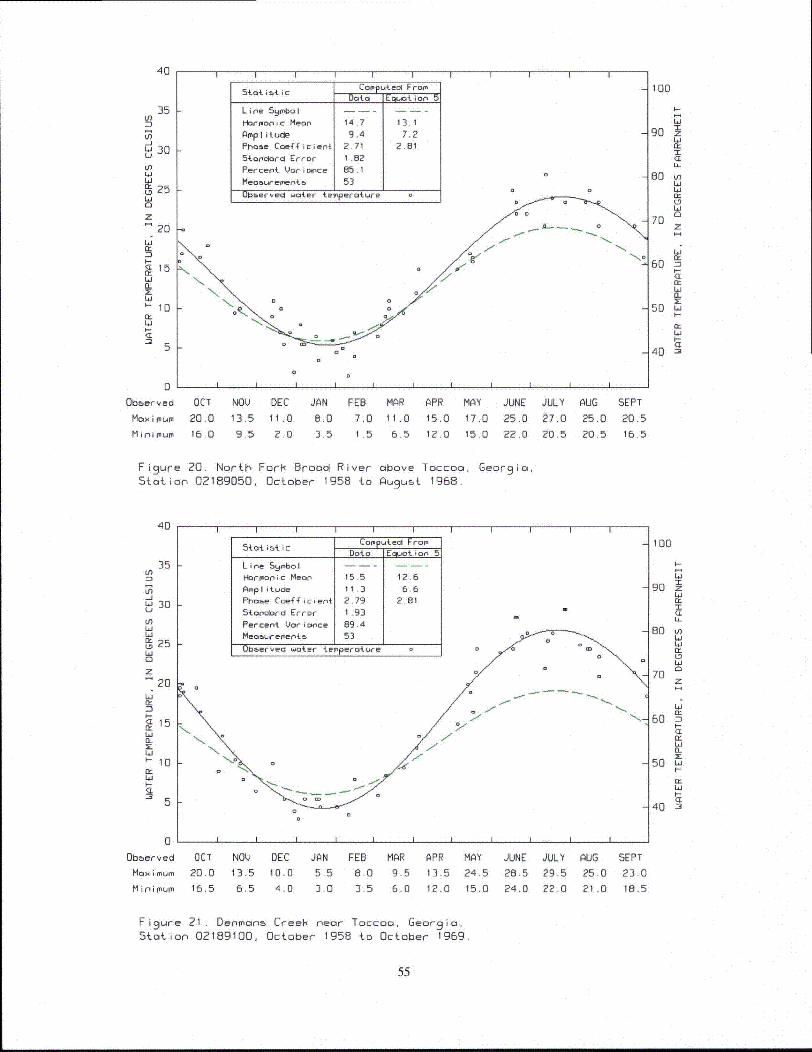
40
35 ktn
Ui-J
JO
cn
25Li0
z20
LiJ
a.ZI
-'ia-
z1i1- 1
n,Li
Stot i ic Computed Fropmtatatiec -ion 5
Line Symbol
H-armonic Mean 14.7 13.1AmplituOe 9.4 7.2Phase Coefficient 2.71 2.81
Stonciard Error 1.82
Percent Variance 85.1
MeorLrementm 53
I I I I I
F-
- Obml~erveci water tesaperoture 0
100
I-
90 zI
80 nLOLia-
70 z
60 -40
50 Li'
40 "•5
0Obaber ved
M>ax mum
M f ni MumIIT
OCT
20.016.0
NOQ DEC
13,5 11.0
9.5 2.0
JAN FEB
8.0 7.0
3.5 1.5
MAR
11,0
6.5
APR
15.0
12.0
MAY
17.0
15.0
JUNE JULY AUG
25.0 27.0 25.0
22.0 20.5 20.5
SEPT
20.5
16.5
Figure 20. North Fork Broad River above Toccoa, Georgia,Station 02189050, October 1958 to August 1968.
40
35 Icp
-JL" 30U
inLiLi
D 25LiaZ
20
ra-
Wn
I-
(< 15LiIL
10
5
0
5t
LiHoAm
Ph
St.
PeMeOb
F
I I I I I I I I I Iit i, i CoPPuted From
Data EQLWt ion 5
ne Symbol
rrlonic Mean 15.5 12.6
plitude 11 .3 6.6s.e Coefficieni 2.79 2.81
onard Error 1.93
rcent Voriance 89.4
o~urementm. 53sOerved water temperoture 0
0
100
LiM90 z
L0
CL
80 inh
60
50
Li
4-Li
70
hi60n
a--Li
50 Li
Observed
Moaximum
M il n iIHLIII
OCT
20.0
16.5
NOV13.5
6.5
DEC1O.0
4.0
JAN5.5
3,0
FEB MAR APR
8.0 9.5 13.5
3.5 6.0 12.0
MAY JUNE JULY
24.5 28.5 29.515,0 24.0 22.0
AUG
25.0
21 .0
SEPT
23.0
18.5
Figure 21. Denmrons Creek near Toccoa, Georgia,Station 02189100, October 1958 to October 1969.
55
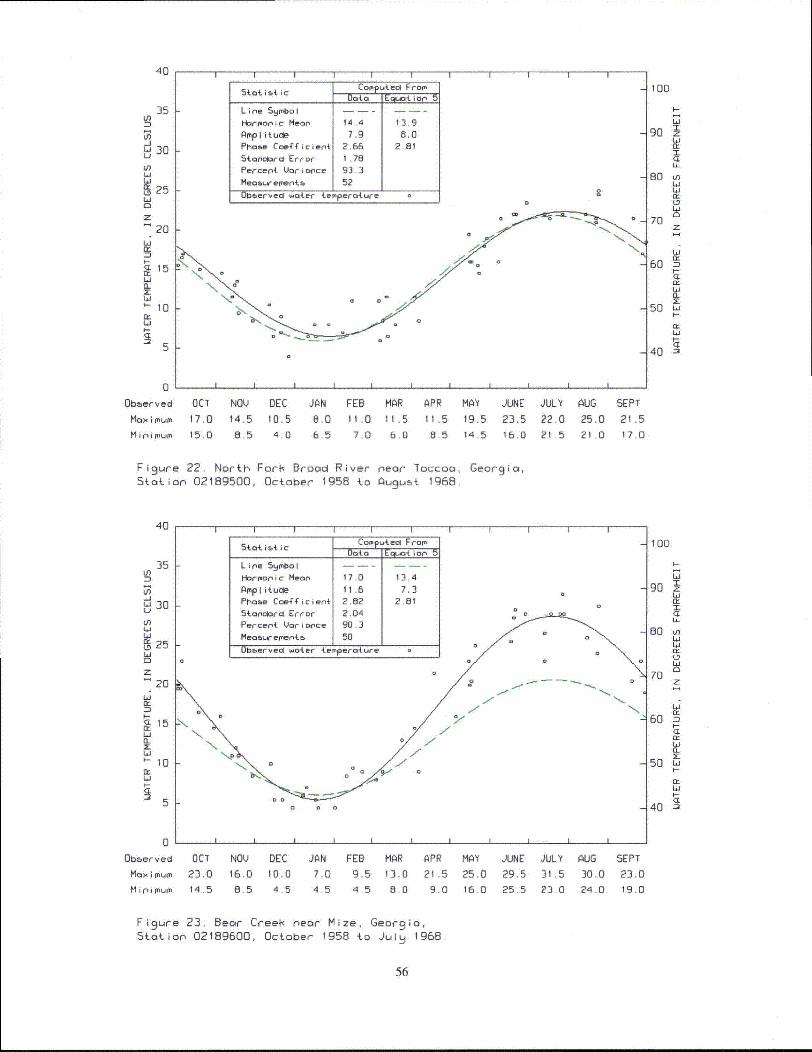
40
35 kLn
-j
30
(nLa
25Li0
20Li
15Liz(L
'-10Li
SttiMti c CorpuPtec From
Data Eatiot '
Line Sqmbol
Harmonic Mean 14.4 13.9Amplitude 7.9 8.0Phase Coefficient 2.66 2.81Sanlord Error 1.78Percent Vari cnce 93.3Meosurements 52
I I I I I
F-
- 0~bserved water terperature o0
100
T-
909Oz
ciLi
U-80 :
inw
70 ZLi-
60
5:
50 L.i
I-
I-
40 35k
0'
Obberved
Maximum
Minimum
OCT NOU DEC JAN FEB
17.0 14.5 10.5 8.0 11.015.0 8.5 4.0 6.5 7.0
MAR APR MAY JUNE
11.5 11.5 19.5 23.5
6.0 8.5 14.5 16.0
JULY AUG
22.0 25.0
21.5 21.0
SEPT
21.517.0
Figure 22. North Forl Broac River near loccoo, Georgia,Station 02189500, October 1958 to Ougust 1968.
40
35Ui
/
2u 0i,
25
w
<L
0
S20
LiI-
15
Li
21:a.
'~10
(L
I I I I I I I
5ta. ist ic Copputet FPromData Ecpt iop
Line Smbl0 cI
Harmonic Mean 17.0 13.4
AmnpI itudle 11.6 7.3 aPhoae Coefficient 2.62 2.81
Stancdrd Error 2.04
Percent Uari nce 90.3
Measuremnents- 50 0
Observed water temperature
0o 0
II I I I IIII
100
l.-
T.
90T"I
80
70
60<E50:
50 LiI---
I-ci
-40 •Z)
0~
bber ved
Maxaimcum
M inim um
OCT23.014.5
NOV DEC JAN FEB
16.0 10.0 7.0 9.5
85 4.5 4,5 45
MAR APR MAY JUNE JULY AUG13.0 21.5 25.0 29.5 31.5 30.0
8.0 9.0 16.0 25.5 23 0 24.0
SEPT
23.019.0
Figure 23. Bear Creel- near Mize, Georgia,Station 02189600, October 1958 to July 1968
56
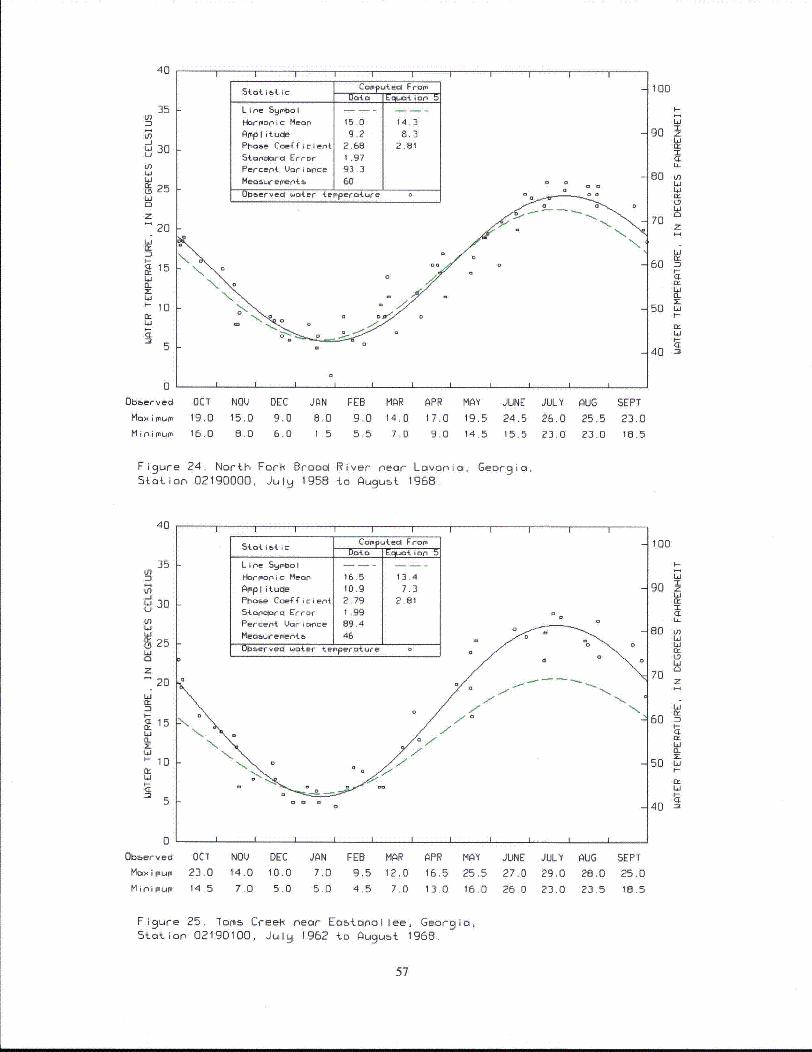
40
nL
30
N 25Li0Z
S20
hiU.1
<115WIL
La'-10
Li
I i I I I I III
St atistic Camput ea Foam -Data Ecpt i o('
Line 59mbol -----Harmonic Mean 15.0 14.3AmIplitude 9.2 8.3Phase Coefficient 2.68 2.81
Sta'clarc Err-or 1.97Percent Uori wce 93.3
Mecaut-empetb 60 o 0
ODberveqc water terperature o 0
I I I I I I II I I I
100
I-
Li90 m
601uLiW
70 z
60 nI-
50 Li
I-40"5
0
Obberved OCT NOV DEC JAN FEB MAR APR MAY JUNE
Maxi mum 19.0 15.0Mini Mum 16.0 8.0
9.0 8.0 9.0 14.0 17.0 19.5 24.5
6.0 1.5 5.5 7.0 9.0 14.5 15.5
JUL'Y
26.023,0
AUG
25.5
23.0
SEPT
23.0
18.5
Figure 24. North For1- Broad River near Lovonia, Georgia,Station 02190000, July 1958 to Ou9 ust 1968
40
35Ui
nt
30
in
25Liz
20
Li
'10n 15
I I I I I I I I I I
Statistic Computed FromData Eot- orian 5
Line S59 l"o . .. . ..
Ha-rmonic Mean 16.5 13.4
AmpIituWe 10.9 7.3Phase Coefficient 2.79 2.815tancird Errar 1.99
Measur ements 46Observed water terperature o
7K 7
"- 7
N.7 N.7 N.
100
h,
Li
90
60 u
50
70z
Li60 n
50 ,.,1-
40 -•
k
0 I I I I I I I I I I I
Oboerved
Maoimum
minimum
OCT NOV DEC
23.0 14.0 10.0
145 7.0 5.0
JAN
7.0
5.0
FEB MAR APR MAY JUNE9.5 12.0 16.5 25.5 27.0
4,5 7.0 13.0 16.0 26.0
JULY AUG
29,0 28.0
23.0 23.5
SEPT
25.0
18.5
Figure 25. Toms Creefý near Eoatonollee, Georgia,Station 02190100, July 1962 to August 1968.
57
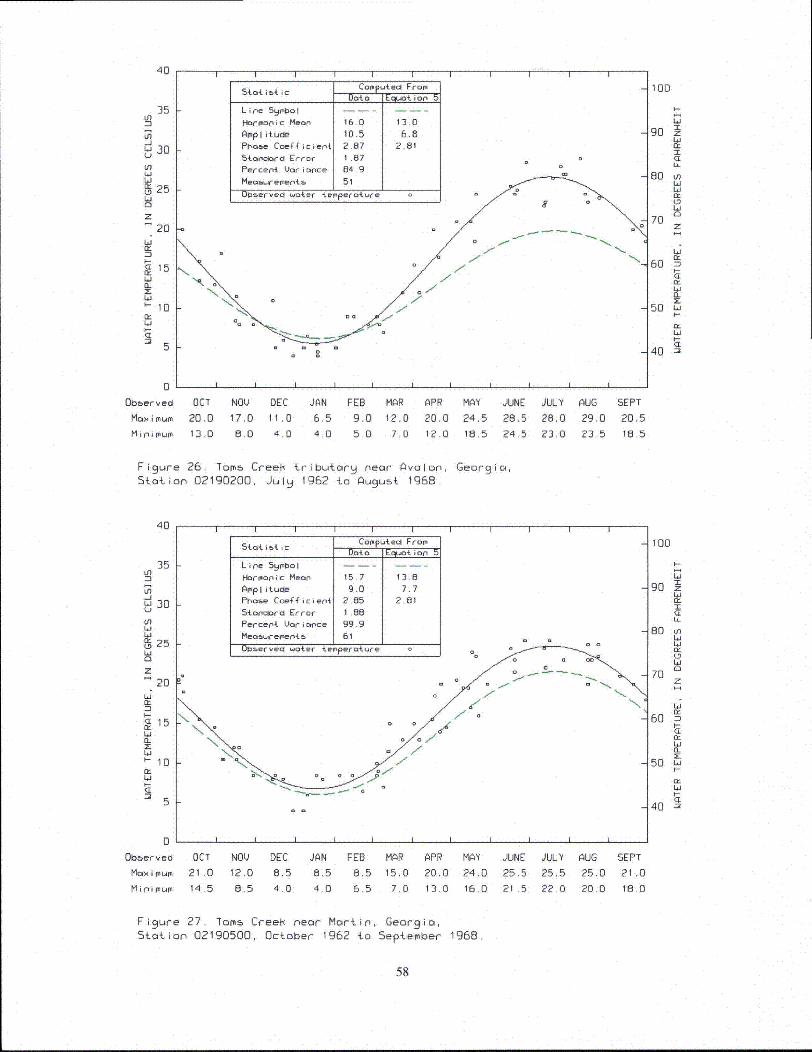
40
35inD
-J
30
125
LO
z
205-
"15L-
L~i
5
Line Syirbol - IHorrmonic Meoan 16 0O 13 0
Amiplitucl 1O.5 6.8Pho~e Coefficient 2.87 j2.8154tonocord Errof 1.B7
Percent Uori wce I84AMeoaurep'entt, 1 51Ob"ervecl water ter'perob..re oI
I I I I I
100
C-
Li
90 z
80 anL6
50Li
4-L~i
70z
60I-
50 L.it,-
C-
40 -=
1-
0
Obberved
Max~imum~C
Minimum
OCT NOV DEC20.0 17.0 11.0
13.0 5.0 4.0
JAN FEB MAR APR MAY
6.5 9.0 12.0 20.0 24.5
4.0 5.0 7.0 12.0 18.5
JUNE
28.5
24.5
JULY AUG
28.0 29.0
23.0 23.5
SEPT
20.5
15.5
Figure 26. Tomr CreefK tributarq near Avalon, Georgia,Station 02190200, Julq 1962 to August 1968
40
35 kLn
-iW 30LiJOU
LnLa
w025Li0
20LjEr
CLI 15
'-10
5
Stat ist i cCamp edlFrom0
Lin'e Symbo I -- --
Harm-onic Mean, 15.7 13.8
lAmplitucle 9.0 7.7
Phone Coefficient 2.85 2.81
Stor-cdard Error- 1 .88
Percent4 Variance 99.9
Meosuremoente, 61
0b~ervedh 4.04ote tepera
4-4.4e
I I 0
100
90 z
I
80 inLiLo
70 z
Li-
60 a4-CLa:
50 Li
I-C-
40 -•
0
Obeerved
Max i mumM i i mum
OCT
21.0
14.5
NOV12.0
8.5
DEC JAN
8.5 8.5
4.0 40
FEB MAR APR MAY JUNE
8.5 15.0 20.0 24.0 25.5
6.5 7.0 13.0 16.0 21.5
JULY AUG
25.5 25.0
22,0 20.0
SEPT
21.0
18.0
Figure 27. Toms Creeiý near Martin, Georgia,Station 02190500, October 1962 to September 1968
58
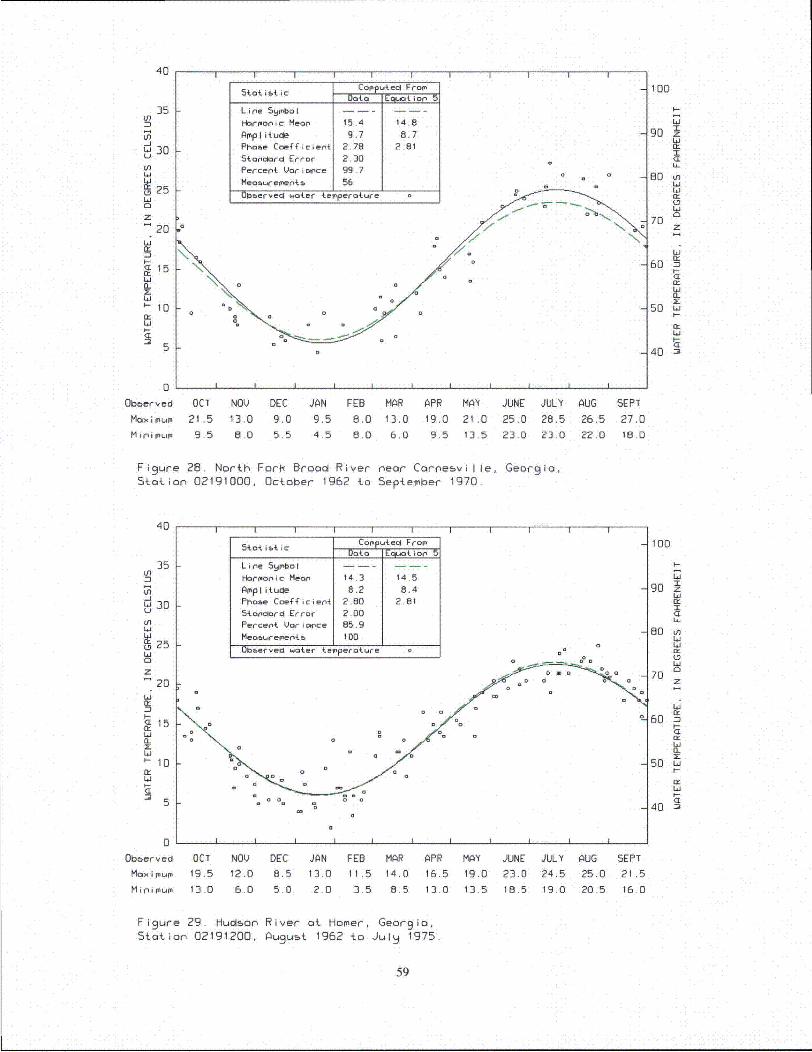
40
35Ut
0930
ND25Li0z-20
Li
150-
H-10
5
S dCofpu ec Froam
LiPe Syrbol
Harmonic Mean 15.4 14,8
AmpIi tude 9.7 8.7Phoae Coefficient 2.78 2.81
Soaotlard Error 2,30
-Meciaureierta4- j 56 J -
~b~erveci water 4terperature
I I I I I
100
g0 zI
80 LiLi
z
60 "n
50 Lih.-
40"
F0
Obbei-ved
Maximu
Minim~umi
L
OCT NOV DEC JAN FEB MAR APR MA'Y
21.5 13.0 9.0 9.5 8.0 13.0 19.0 21.0
9.5 8.0 5.5 4.5 8.0 6.0 9.5 13.5
JUNE JULY AUG
25.0 28.5 26.5
23.0 23.0 22.0
SEPT
27.018.0
Figure 28. North Forft Broao River near Cornebville, Georgio,Station 02191000, October 1962 to Sep{ember 1970.
40
35 -Ln
U.9Lf-jW30
U
w 25LU
20
L,H
10
5
I I I I I IIII
stat.ie'tic Computec FromData Ewi• aon 5
Line 59y bol . . . . . .
Harmonic Meon 14.3 14.5Amplitude 8.2 8.4Phone Coefficient 2.80 2.81Striogord Error 2.0DPercent Vari nce 85.9Meoolremente 100Obeerved water temperciture
I I I I I
100
go z
Li
80 nUiLiW
70
70
z
Li60 n
I-2
50 Li4-
Li
Obberved
Maximum
Minimum
OCT NOV DEC JAN FEB MAR APR MAY JUNE19.5 12.0 8.5 13,0 11,5 14,0 16.5 19.0 23.0
13.0 6 0 5.0 2.0 3.5 8.5 13.0 13.5 18.5
JULY AUG
24.5 25.0
19.0 20.5
SEPT
21 .5
16.0
Figure 29. Hudson River at Homer, Georgia,Station 02191200, August 1962 io Julq 1975.
59
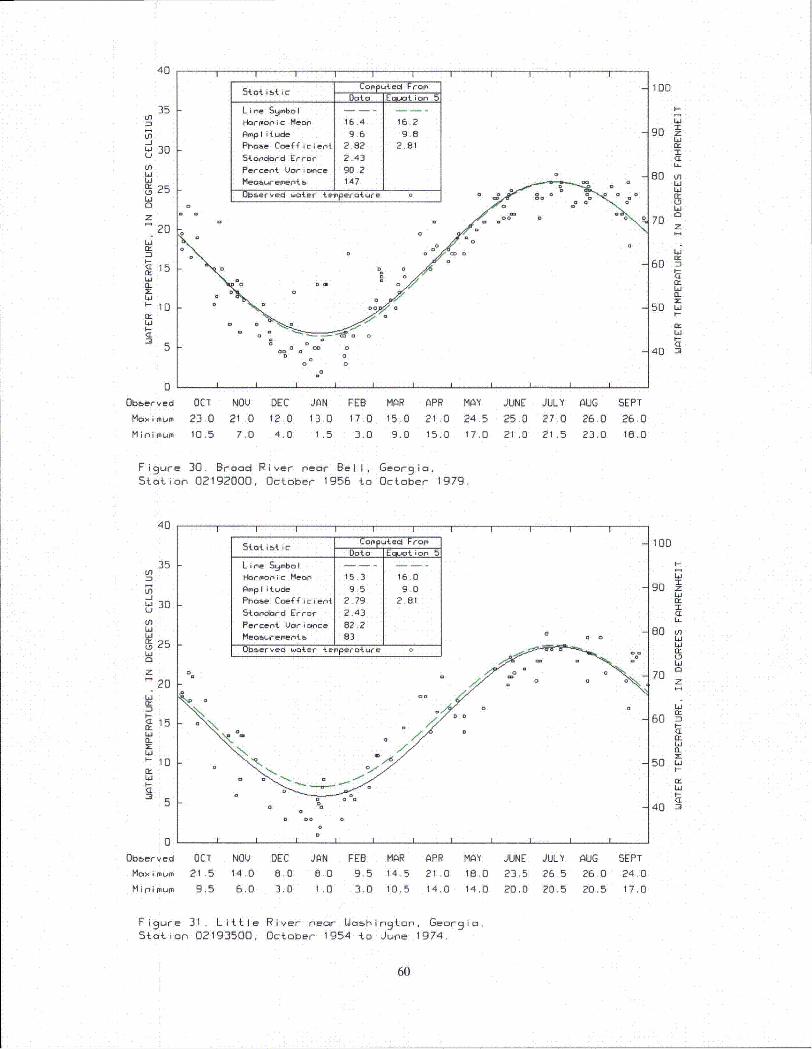
40
35 kUE
Ln-JL 30
UL.1L.1
0 25Li
0z
20
L'i
n
(Li
'-10
5
0
Observed
Maximum
Minimum
Stot ietic Computed _From__________ Data IEcpyt ona,
Line Symbol - - I --
Hairmonic Meano 16.4 16.2
Amplitude 9.6 9.
Phase Coenfficient 2.82 2.81
Standalrd Error 2.43
i i I I i
F
Meo~uema-e nto I. I4
=o Observedl water teimperature o
D 0
=1 o • o
• o o0
100
903 zu-
Li80 iiO
50 Li
740 z
60 -n
I-
a..I
50 Lih-
I.-
413:-
OCT NOV DEC JAN FEB MAR APR MAY JUNE JULY
23.0 21.0 12.0 13.0 17.0 15.0 21.0 24.5 25.0 27.0
10.5 7.0 4.0 1.5 3.0 9.0 15.0 17.0 21.D 21.5
AUG
26.0
23.0
SEPT
26.016.0
Figure 30. Brood River near Bell, Georgia,Saotion 02192000, October 1956 to October 1979.
40
35 IU)
Lfl_JLa 30U
U)L.Li
S25
20W
20
C15
a.
'- 10LJ
k
1-
I I I I II I I I I
5&oti c Colp U.tcl From
5_O_,___, __ Doto ECIwt on 5L i n , e S y m b o l . . . . .Harmonic Mean 15.3 16.0
AmplItude 9.5 9.0
Phase Coefficient 2.79 2.81
Standard Error 2.43
Percent Vor, nce 82.2
Meosrement5- 830 eObberved water temperature 0
I I Ia
0 o
100
90 z
80 in
U
70z
60 S
5-
Ld
50 Li
O
ZDI
0Obberved
Maximum
Minimum
OCT NOV DEC JAN FEB MAR
21.5 14.0 8.0 8.0 9.5 14.5
9.5 6.0 3.0 1.0 3.0 10.5
APR MAY
21.0 18.0
14.0 14.0
JUNE JULY23.5 26.5
20.0 20.5
AUG
26.0
20.5
SEPT24.0
17.0
Figure 31. Little River near Watohington, Georgia,Station 02193500, October 1954 to June 1974,
60
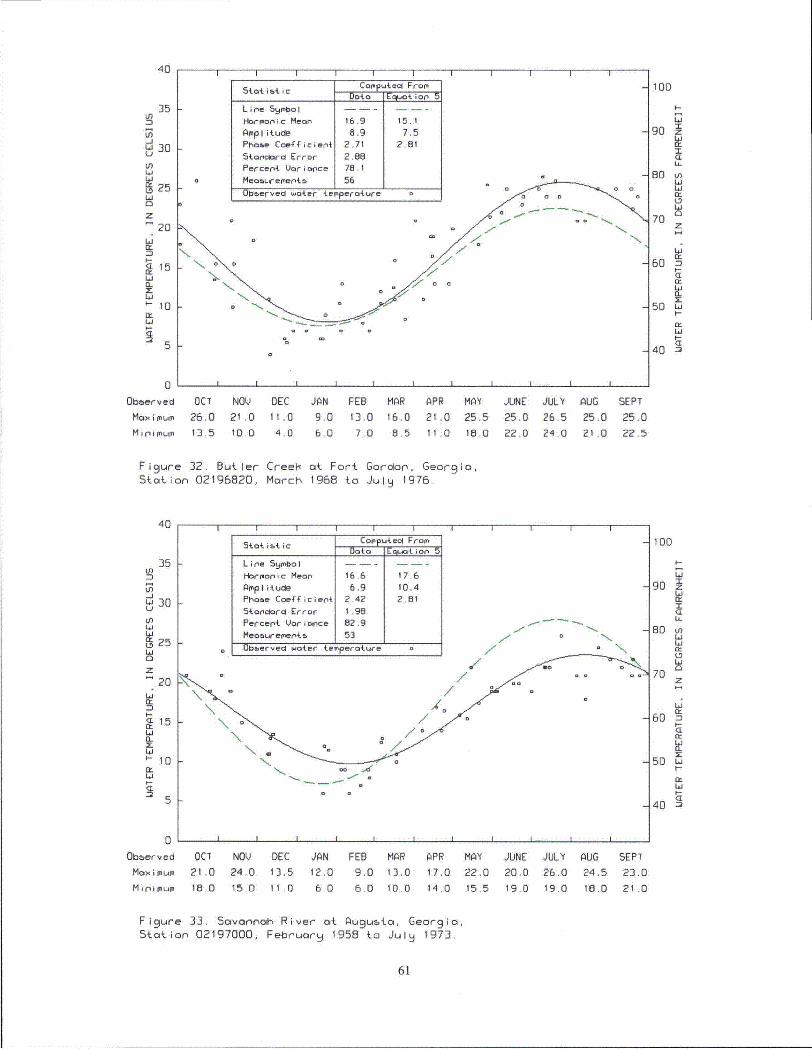
40
35 ILn
-jw4 30U
c, 25
20
15
10
cosutea F am,
Line 59mbocl - -
Harmon'ic Mean 16.9 15.1
Phose, Coeficient 2.71 2.81
Staonord Error 2.88
Percent{ Uari wce 78.1
k-
100
I I I I I
101D~ervecA -a4er terpero~ure
0 0
U-
90
z
760
<1
CL:
40 :2Z)
oLI
0be~erved
Max u
Mpinimum
OCT NOV DEC
26.0 21.0 11.0
13.5 10.0 4.0
JAN FEB MAR APR MAY JUNE JULY
9.0 13.0 16.0 21.0 25.5 25.0 26.5
6.0 7.0 8.5 11.0 18.0 22.0 24.0
AUG
25.0
21 .0
SEPT
25.0
22.5
Figure 32. Butler Cree oat Fort Gordon, Georgia,Station 02196820, March 1968 to July 1976.
40 .
kn-J
w30
25Li
20
15LiCLX
W- 10cr
Sta4. si Aic ComuteoFromo
Lin'e Symbol -- - -
Harm~onic Mean 16.6 17.6
Amplitudle 6.9 10.4
Pr'o&& Coefficient 2.42 2.81
54tor'clrd Error I .98
Percent Vori once 82.9 . -.
Measremoenib 53
Ub~ervecl water terpeerotutre 7
I INo
100
IO14
90 z
I
80 tn1i
70
60 Z
5D Lit-
50144 -
40 TM5I
0
OlbeervedMaxi mum
Minimum
OCT NOV DEC JAN21.0 24.0 13.5 12.0
16.0 15,D 11.0 6.0
FEB MAR APR MAY JUNE JULY9.0 13,0 17.0 22.0 20.0 26.0
6.0 10.0 14.0 15.5 19.0 19.0
AUG
24.5
18.0
SEPT
23.0
21.0
Figure 33. Savannah River at August{, Georgia,Station 02197000, February 1958 to July 1973.
61
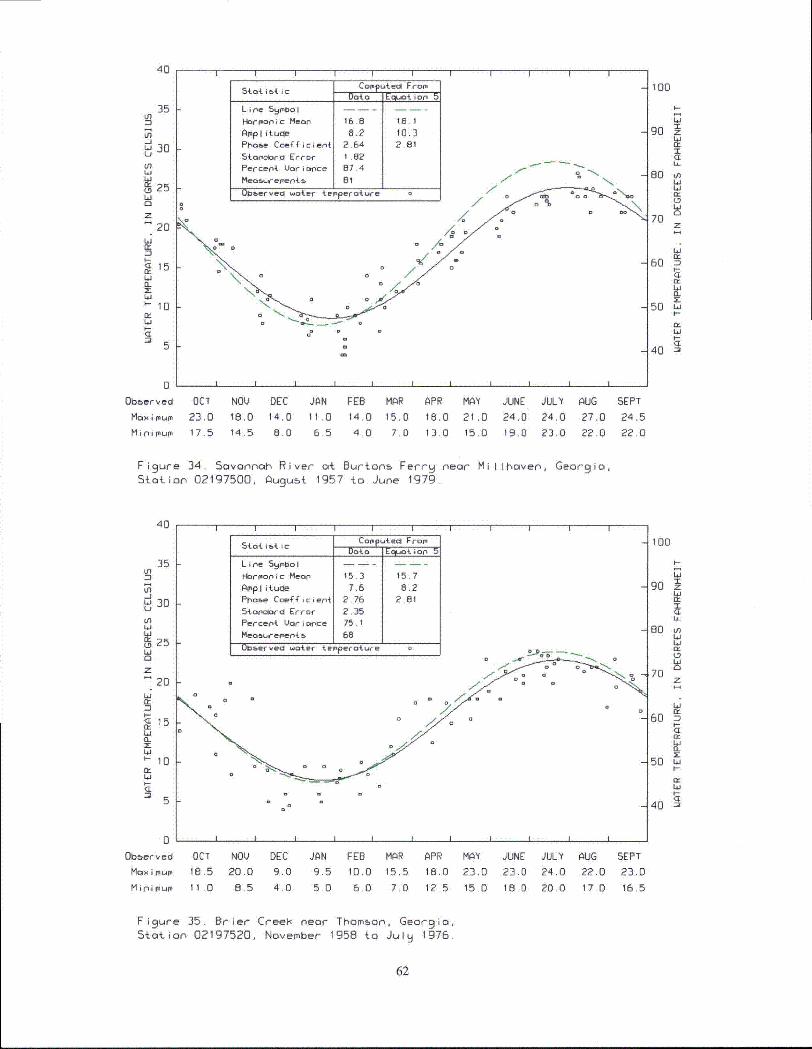
40
Li)
30U
-f1
W
LiW
z
20
I-
15Li
'-10
5
I I I I I I II III
S________ CopputedlFrof.Data Eqal.tion 5
Line Sibol . .. . ..
Harmonic Meon 16.8 18.1
Ampl itule 8.2 10.3Phoae Coefficient 2.64 2.81
Stoanlord Error 1.82
Percent Variance 87.4
Meoaurementb 81 7'Obaerved water terperature o 0'
S a 0•
0
100
go
W
90 M
I
CE
80 n4iLi.
70z
60
50 L.i
I-
0Obberved
Max'i mum
MinIli MiLIM
OCT NOV DEC JAN FEB MAR APR MAY JUNE JULY AUG
23.0 18.0 14.0 11.0 14.0 15.0 18.0 21.0 24.0 24.0 27.017.5 14.5 8.0 6.5 4.0 7.0 13.0 15.0 19.0 23.0 22.0
SEPT
24.5
22,0
Figure 34. Savannah River at Burtons Ferrq near Millhoven, Georgio,Station 02197500, Ouyust 1957 to June 1979.
40
35 -
-1
-Jw 30U
Li25
a.X
10
21
C 5
sta if ic Cop t " F of.i i
Data iEq,.aton5
L i n e S m b o I . . . .
Harmonic Mean 15.3 15.7
Amplitude 7.6 8.2
Phaoe Coefficien{ 2.76 2.81
Stanard Error 2.35Percent Variance 75.1
Meosuremnentt 68
Obiervea water temperature o o
000
o . o o .• -00
o• oo0
D
100
Li
90 z
-r
80 tnLiLO
70 z
Li60
50 LiI--
0:
40 •
0
Obaerved
Moximum
Minimum
OCT NOV DEC18.5 20.0 9.0
11 0 8.5 4.0
JAN FEB MAR APR MAY JUNE JULY AUG
9.5 10.0 15.5 18.0 23.0 23.0 24.0 22.0
5 0 6.0 7.0 12.5 15.0 18.0 20.0 17.0
SEPT
23.0
16.5
Figure 35. Brier CreeH near Thomson, Georgio,Station 02197520, November 1958 to Juiy 1976.
62
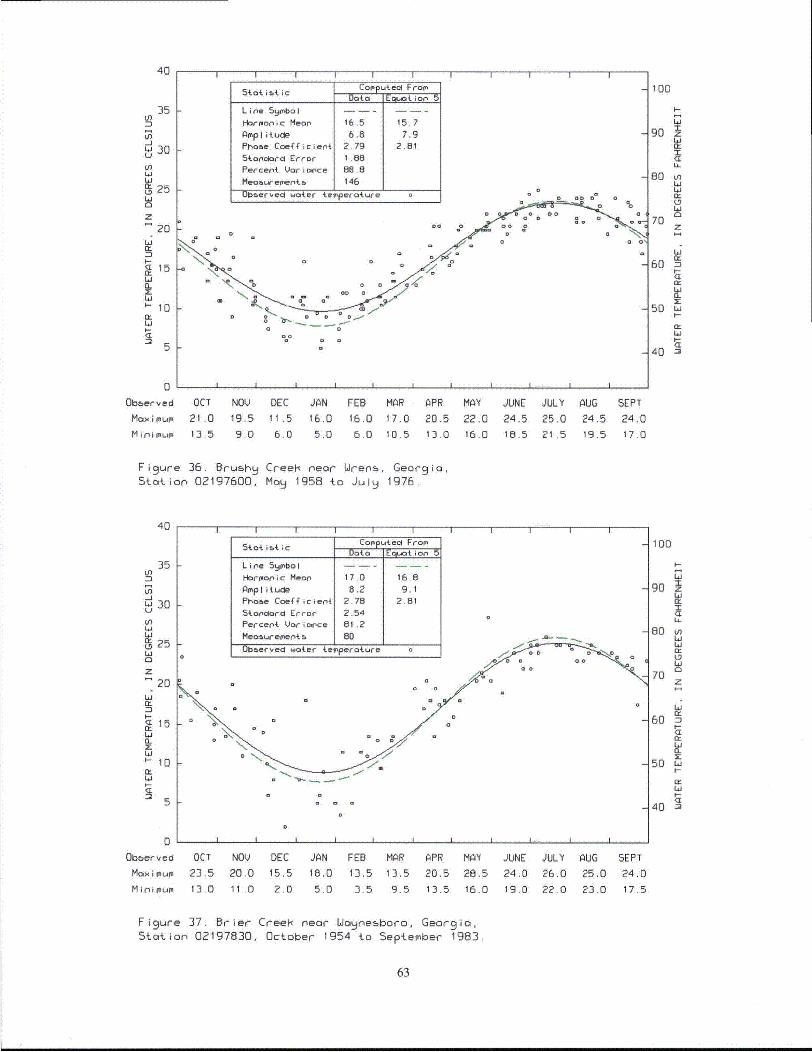
40
In
W30
Ln
ND25
20
Lu
CL15
CL
'-10
tCoS utecl FrOf-Data Ecplt ion 5
L i re Symbo I - - -
l-Ir ,onic Mean 16.5 15.7
AmpI iitucle 6.8 7.9Phase Coefficient 2.79 2.81Stancir-4 Error 1 .88Percent Variance 88.8Meo&Lcw-emento. 146
I-
I I I I I
Ob•erveo water temperature o . . o
0 D 0 0 aa•DO
\~ 0°
o o o~
U _ " o.
100
1-
90 z
tiv
z
60<1a:
IE
50 i.40-2:
40 "•5 F
0Obberved
Max~i mum
M inri MUMII
OCT
21 .0
13.5
NOV
19.5
9.0
DEC JAN FEB MARI1 .5 16.0 16.0 17.0
6.0 5.0 6.0 10.5
APR MAY JUNE JULY AUG
20.5 22.0 24.5 25.0 24.513.0 16.0 18.5 21.5 19.5
SEPT
24.0
17.0
Figure 36, Brushy Creek near Wrenb, Georgia,Station 02197600, May 1958 to July 1976.
40
35In
=1nL
30
(n
25Lia
20iu
23n-
<L 15
CLA
~-10
I I I I III I I I5tat ist ic Computecl F rom
Dota0 Ecllot in5
Line 5ymbo I-Hormaonic Mean 17.0 16.8
Ampl itude 8.2 9.1Phase Coefficien' 2.78 2.81Stoncoiarm Error 2.54Percent Variance 81.2Meo•suements 8o
Ob~erved water temperature o
100
I--
90
z
CELI-
80 knLt
70
60 2
50 LA4 --cc
40 "•5 k
0Oboerved
Maximum
M in i Mmur
OCT
23,5
13.0
NOV DEC JAN FEB MAR APR
20,0 15.5 18.0 13.5 13.5 20.5
11.0 2.0 5.0 3.5 9.5 13.5
MAY JUNE JULY PUG SEPT
28.5 24.0 26.0 25.0 24.0
16.0 19.0 22.0 23.0 17.5
Figure 37. Brier Creek near Wayneboro, Georgia,Station 02197830, October 1954 to September 1983.
63
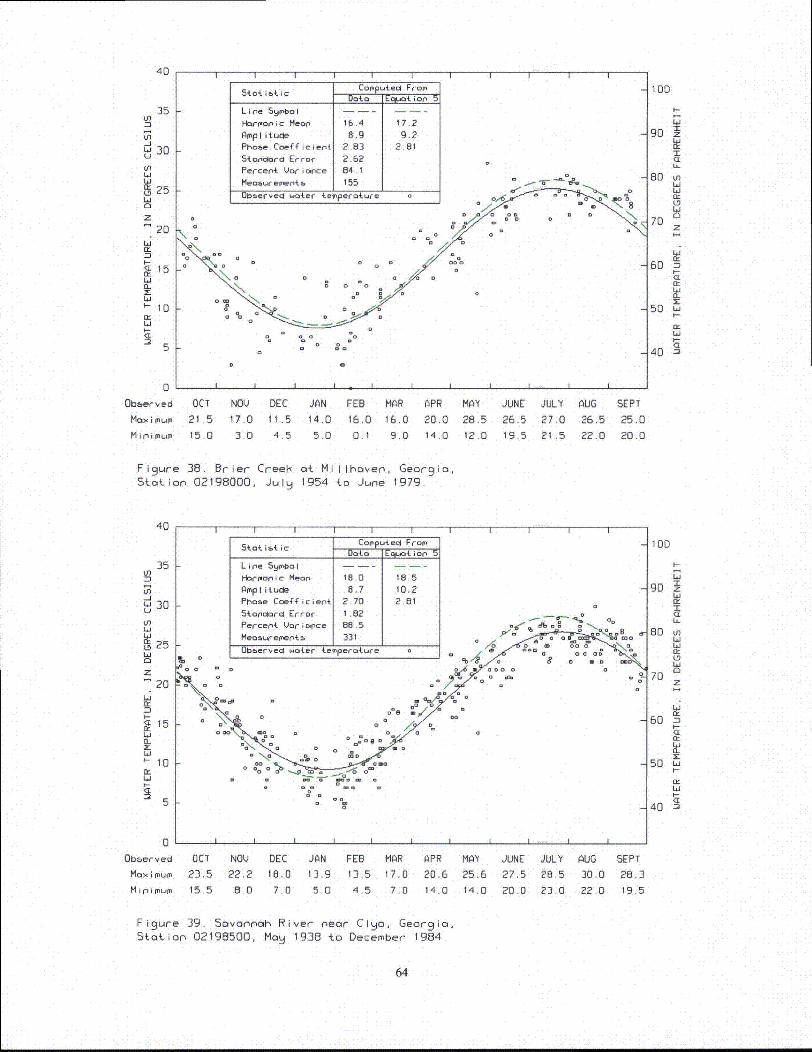
40 I I I I I I I I I
35In
U)
S30
in
iýL,25
Li
20
20Li
C15
0~
Oberemaimu
Min 10M
Stot istic Comp tecl FromData E5toti o.n5
Line Symbol . .. . ..
Harmonic Mean 16.4 17.2
Amplitucle 8.9 9.2Phoae Coefficient 2.83 2.81
Stanoard Error 2.62Percent Voriance 84.1
Meoaremrer 155Observecl water temperature o
a i i I lIiI
100
90 zI
80 tnU.-
70
Lit
6070
50 w
40 -2
OCT
21.5
15.0
NOV DEC JAN FEB MAR APR MAY JUNE JULY AUG17.0 11 .5 14.0 16,0 16.0 20.0 28.5 26.5 27.0 26.5
3.0 4.5 5.0 0.1 9.0 14.0 12.0 19.5 21.5 22.0
SEPT
25.0
20.0
Figure 38. Brier Creek at Millhoven, Georgio,Staoion 02198000, July 1954 to June 1979.
40
35In
Ln-JLi 30U
inLi
025
0z
20i-
.15Li
•-10Li
I I I I I I I I I
Sto4.i~t c Computedl FromData Eqo ion 5
Line Symbol I
Harmonic Mean 18.0 18.5
Amplituole 8.7 10.2Phooe Ccefficient 2.70 2.81
5tandaord Error 1 .82
Percent Vr i ance 88.5- - %
Measurements, 331 ____,. .= a a
Ubaerved water temperature 0.0
a 0
I I I I I I I
100
Li
90 zLhI
60 in
70
60 n
50 Li
40 "Z)
0I
Obberved
Maximum
Minimum
OCT NOV DEC
23.5 22.2 18.0
I5,5 6.0 7.0
JAN FEB
13.9 13.5
5.0 4 5
MAR APR MAY
17.0 20.6 25.6
7.0 14.0 14.0
JUNE JULY AUG
27.5 28.5 30.0
20.0 23.0 22.0
SEPT
28.3
19.5
Figure 39. Savannah River near Clio, Georgio,Station 02198500, Moa 1938 to December 1984.
64
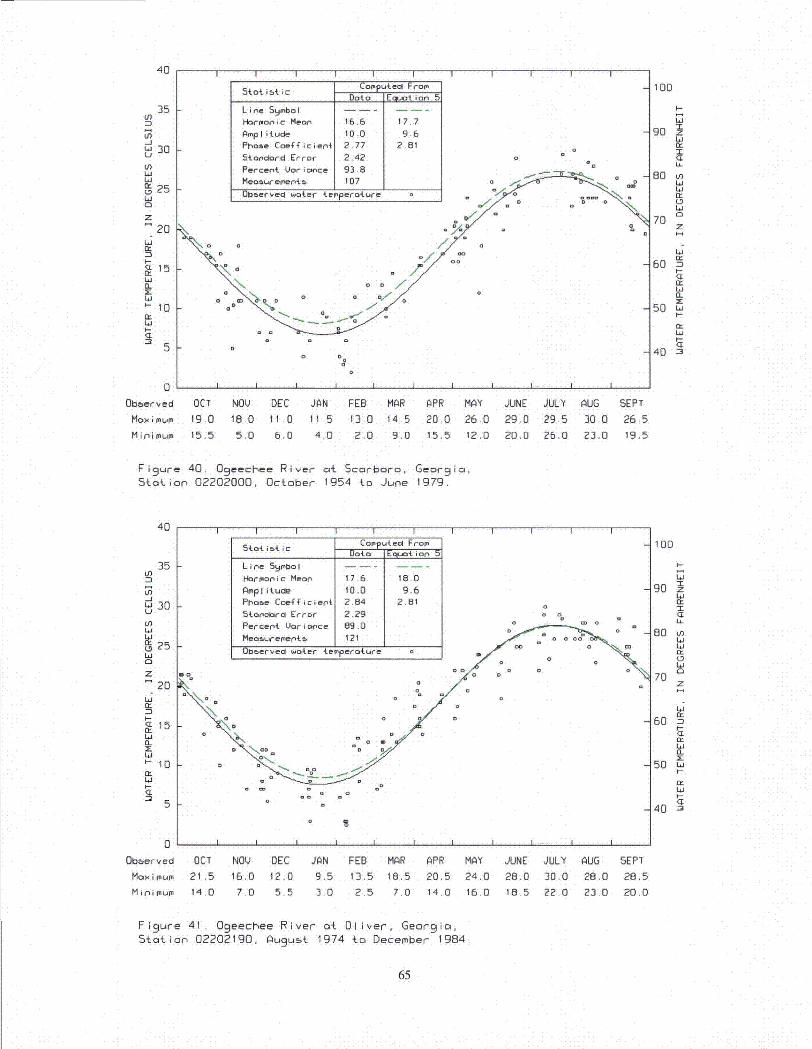
40
35 kin=1U)
30
LnLi61
125Li
z
20
:2
D_a 15a.1.:
0
LO
5:Copu ted From
Data E__ _tion 5
Line Symbol
Harmonic Mean 16.6 17.7Amplitude 10.0 9.6Phase Coefficient 2.77 2.81Standrrd Error 2.42
I 1 I I I
0
Percent Varianrce 93.8Measoreente• 107 o0bserveco water terperature
D o
I I I I I III I I I
100
I--
90 zh,
I0:
80 L
a:70
Ld60 w
Lit--
0J50 L.i
I-
Li
40 "5 k
0Observed
Max imum
Mini mum
OCT NOU DEC JAN FEB MAR APR MAY JUNE JULY
19.0 18.0 11.0 11 5 13.0 14.5 20.0 26.0 29.0 29.5
15.5 5.0 6.0 4.0 2.0 9.0 15.5 12.0 20.0 26.0
AUG
30.0
23.0
SEPT
26.519.5
Fi 9 ure 40. O9eechee River at Scorboro, Georgia,Stoaion 02202000, October 1954 to June 1979.
40
3535
:2u)
-jLi 30U
U)La
L, 25Liaz
20Licr
15Li
a-
:o 1'-101
a:d
I I I 1 I I II III
Stotistic Comp~utel FromData Eopat io5
Line Symbol -
Harmonic Mean 17.6 18.0AmpI ituole 10.,0 9.6
Phaoe Coef'f i c i ent 2.B4 2.81Sanocora Error 2.29 a
Percent VUariance 09.DMeoas.urements 121 1 0 wI bIerved water temperature
0 0
100
90 zhLi
80 LLI
70z
60 00:
50 LiI-n.L,
40 -5
0
Obberved
Maximum
Minimum
OCT NOQ DEC JAN FEB MAR APR MAY JUNE JULY AUG21.5 16.0 12.0 9,5 13.5 18.5 20.5 24.0 28.0 30.0 28.0
14.0 7,0 5.5 3.0 2.5 7.0 14.0 16.0 1 .5 22.0 23.0
SEPT
28.5
20.0
Figure 41. O9eechee River at Oliver, Georgia,Station 02202190, Auqubt 1974 to December 1984
65
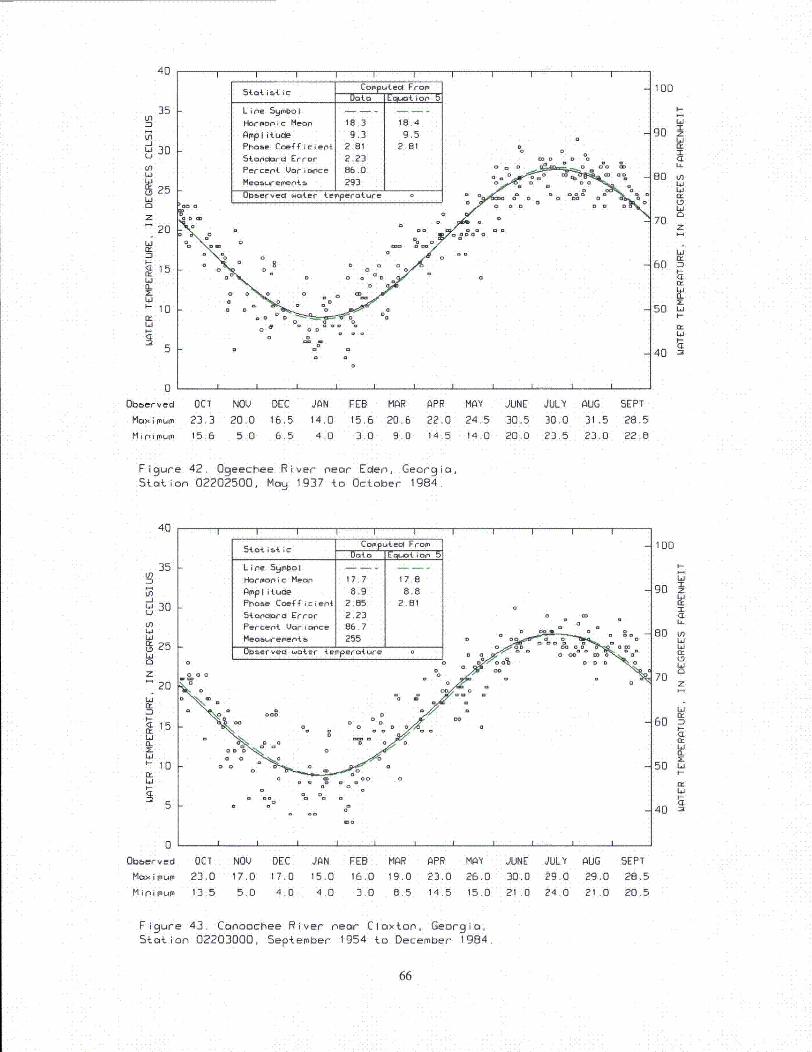
40 I I I I I I
s5{0 is{ ic CofP ec Fr omData EA{ ion 5
L ine 5yIo IHarmoniic Mean 18.3 18.4
Amplitude 9.3 9.5
1 I I I I I I I
w- 30ULn
JO
La
L 25Li
2061n-I-
15
-10
Ld
Phaoe Coefficient 2.81 2.81 0.Stonciord Error 2.23 G o 0
Percent Uorimnce 86,0 a a a €a oo
Meos.4-eientb_ 293
OUeberved water {erperature 0 a G.'Go a
G O
19 a
Go Goo°
a o qa
a~ 0
ao G
0= 0
0
100
I-
90 =T
80 inLa
7a
70
60I-
50 LaI--
4 a-
40 MD
01
Obberved
MaximoumM pi riOi mu
OCT NOV DEC
23.3 20.0 16.515.6 5.0 6.5
JAN FEB
14,0 15.6
4.0 3.0
MAR
20.6
9.0
APR MAY JUNE
22.0 24.5 30.514.5 14.0 20.0
JULY
30.0
23.5
AUG
31.5
23.0
SEPT
28.5
22.6
Figure 42. Ogeechee River near Eden, Georgia,Station 02202500, May 1937 to October 1984.
40
35inn
L 30U3
<La125
Lai
0z•
I I I I I I I I I
Stat ist ic COPPutecd FromData Eat ion 5
Line 59mbolHarmonic Mean 17.7 17.8
Ampl itude 8.9 8.8Phoe Coeaf i c i ent 2.65 2.81
Starndard Error 2.23 a 0
Percent Vor iaonce 86.7 a
Meo=i-epe,,n-, 255
Ubaerved water teperature 0
Go to a0 00 a 00 0
I | I II I I I I I
100
T-
90
z
50 Li
80 inLa
La
70
60 n
•C
50 La'I.-
LaCL
40 -2DZ
0~
Oboerved
Max imrum
M inpim~um
OCT
23.0
13.5
NOV DEC JAN FEB MAR APR MAY JUNE JULY
17.0 17.0 15.0 16.0 19.0 23.0 26.0 30.0 29.0
5.0 4.0 4.0 3.0 8.5 14.5 15.0 21 .0 24.0
AUG
29.0
21 .0
SEPT
28.5
20.5
Figure 43. Canoochee River near Claxton, Georgia,Staoion 02203000, September 1954 to December 1984.
66
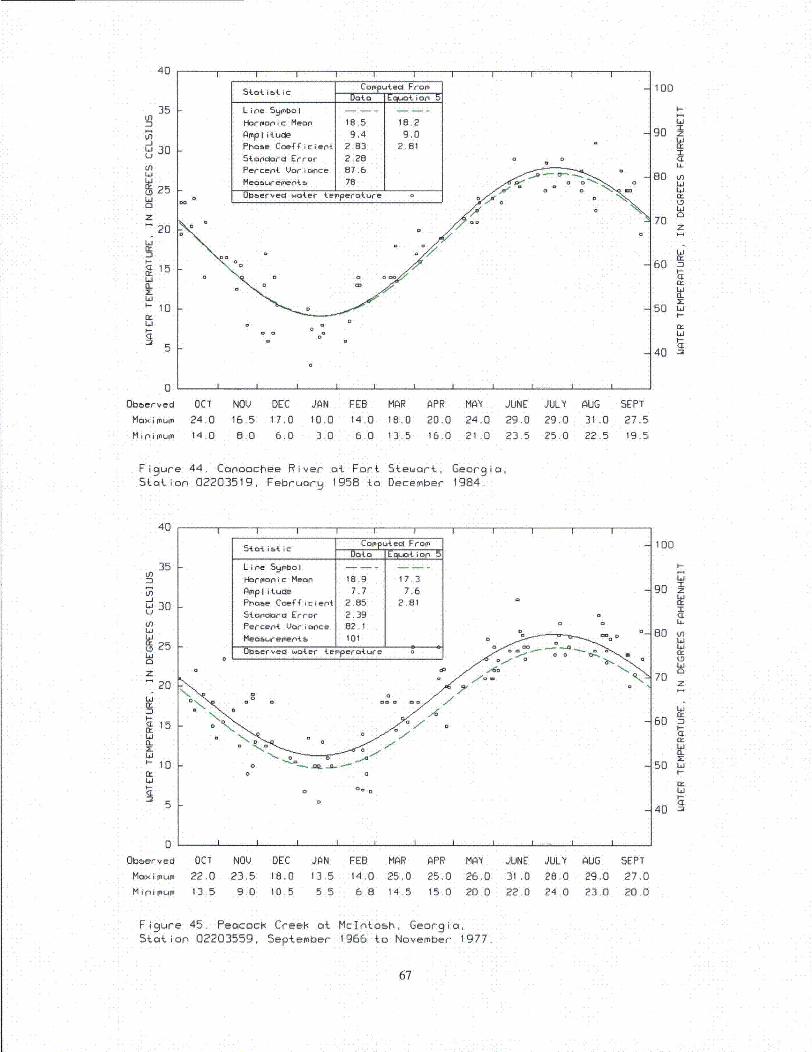
40 40 II I I I I I I I
35 kLn
=1-JW 30UdtnLO
80I25Li
0
WS20
iZ
I-Ctl15
IL
1azo
stot i eti iC Computeel FromData Equoi ior, 5
Line Srm'o1
Harmon ic Mean 18.5 18.2
Amppl it ude 9.4 9.0
Pbrae Coefficient 2.83 2.81FPercent Voriance 87.6
Meoaueier'tb 78
Db~ervecI water terpero~ure o
a
100
90 z
cii60 u-n
70 z
60n
50 Li
40 -
01
Obaerved
Max imIum
MinimI'um
OCT
24,014.0
NOV DEC JAN FEB
16.5 17.0 10.0 14,0
8.0 6.0 3.0 6.0
MAR APR MAY JUNE
18.0 20.0 24.0 29.0
13.5 16.0 21.0 23.5
JULY
29.0
25.0
AUG
31 .0
22.5
SEPT
27.519.5
Figure 44. Canoochee River at Fort Stewort, Georgia,Station 02203519, Februarg 1958 to December 1984.
40
35Ln
In-jW 30U
EnLi
25Li0
20
CrW
g 15ly
a-z
'-10
I I I I I IIII5tat. ist ic Camputecl From
Data Equa ion5
Line Syebo I
H-rIonic Mean 18.9 17.3
AmpI itucde 7.7 7.6Phase Coef ficien 2.85 2.81
Stan5corcl Error 2.39 0
Percent Voricance 82.1 o
Meaorementb_ 101
Ierved water teperature 0 -
I I
I
I
I
100
EI-
go
CL
70
z
60 n
50 L-C-
40 -2Z.)
0'
Obberved
Maximum
Minimum
OCT
22.0
13.5
NOV DEC
23.5 18.09.0 10.5
JAN FEB MAR
13.5 14.0 25.0
5.5 6,8 14.5
APR MAY
25.0 26.0
15.0 20.0
JUNE JULY31.0 28.0
22.0 24.0
AUG
29.0
23.0
SEPT
27.0
20.0
Figure 45. PeacocR CreeR at McIntosh, Georgia,Station 02203559, September 1966 to November 1977
67
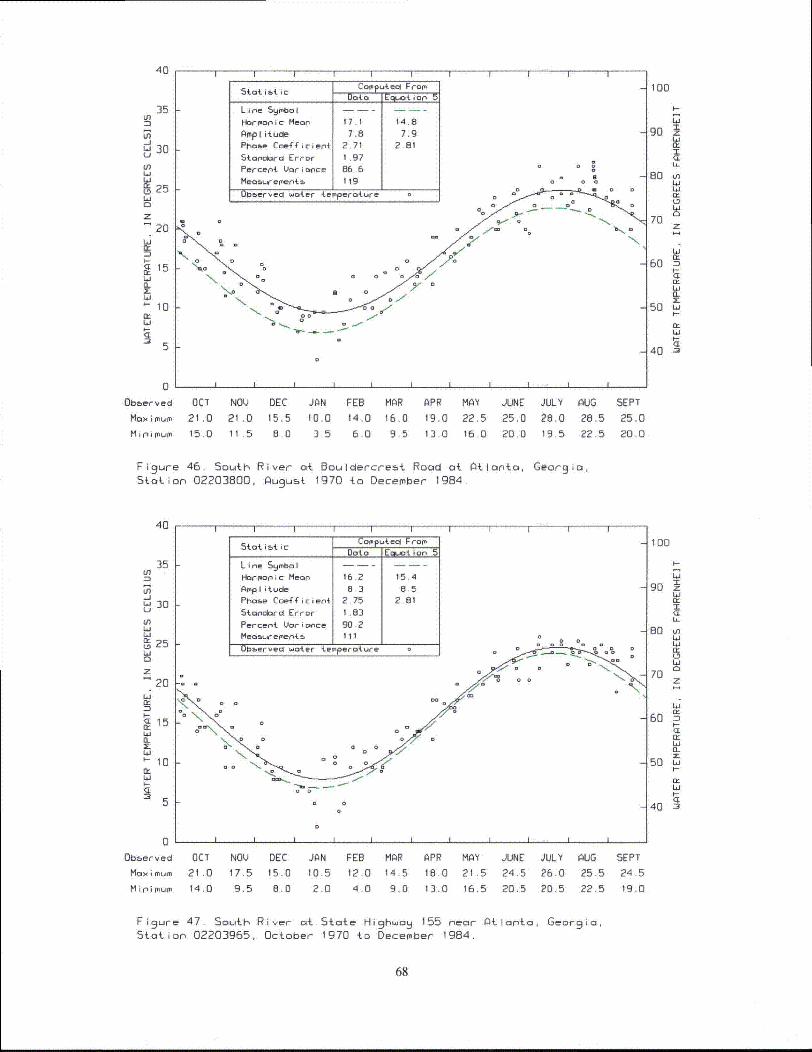
40 40I I I I I I I I I I
35 kLn
-J J oc0
w 3Ln
u25
W
20z
I-
15
EL
1
5
Stat ist ic Compu etc FromData Eqtpo iona
Line Symbol
Hor•onic Mean 17.1 14.8
Amplitude 7.8 7.9
Phase Coefficient 2.71 2.81
Staopnrd Error I .97
Percent Vari nce 86.6
Meaou..r-ement s _ o 9
Observed water temperature -
0.0
100
I-
90 z
<E
80 uLiLi
70 z
60
50 L.
I-
40 "•
0
Observed OCT NOQ DEC JAN FEB MAR APR MAY JUNE JULY
Maximum 21.0 21.0 15.5 10.0 14.0 16.0 19.0 22.5 25,0 28.0
Minimum 15.0 11.5 8.0 3,5 6.0 9.5 13.0 16.0 20.0 19.5
AUG28.5
22.5
SEPT25.0
20.0
Figure 46. South River at Bouldercre~t Road at Atlanta, Georgio,Station 02203800, August 1970 to December 1984
40
35tn
-JU 30U
LOL6
L 25Li
0z
S20
aL 15M
id0_Ig(L
I-10
I-
I I I I I I I
Stot i~t ic Computed FromData Eq..ot ion 5
Line Symbol
lHarmoInic Mean 16.2 15.4
Amplitude a 3 865
Phase Coefficient 2.75 2.81
Standard Error 1.83
Percent Variance 90.2Measur ements I,.• 1 111
Obsaerved water temperature 0
-. 0\- 1
100
Li
90 z
L0I
70
60 n
Li(L
50
405
0I I I
Observed OCT NO) DEC JAN FEB MAR
Maximum 21.0 17.5 15.0 10.5 12 0 14.5
Minimum 14.0 9.5 8.0 2.0 4.0 9.0
I I I i I I
APR MAY JUNE JULY AUG18.0 21.5 24.5 26.0 25.5
13.0 16.5 20.5 20.5 22.5
SEPT24.5
19.0
Figure 47. South River at State Highway 155 near AtStation 02203965, October 1970 to December 1984.
Ionia, Georgio,
68
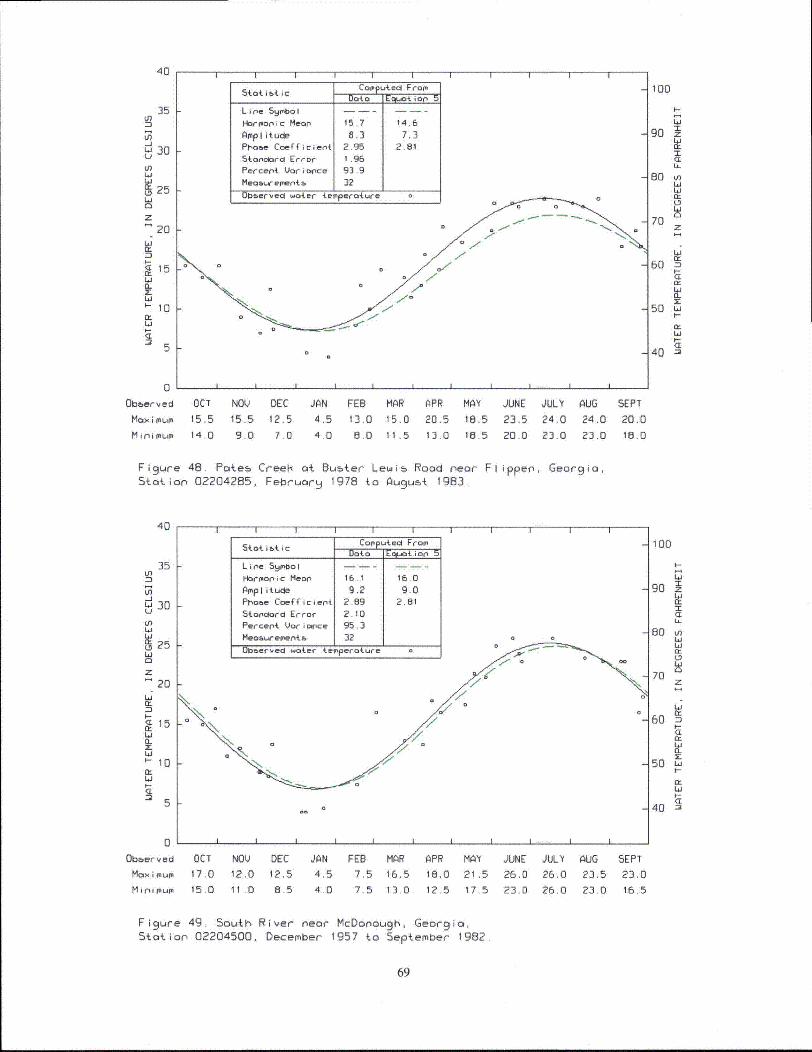
40
35 ILf"n
-J30
U3in
25
z20
-15
(L
H-10ni
I I I I I
5tat istic _______lF a
Line 5yimbol - -
Hovrpopic Mean' 15.7 14.6
AI'plitude 8.3 7.3Phase Coe-fficient 2.95 2.81Sta4'clorc Error 1.96Percent Jari iprc 93.9Measuremets 32
I I I I I
k-I
I ~ ~ ~ r
100
LizI
80
CL
50Li
70z
Li
60
I-
50 L.i
4 -0
40 "=IZý t-
0
0bber ved
Max rmurn
M i nu
OCT NOV DEC JAN FEB MAR15.5 15.5 12.5 4.5 13.0 15.0
14.0 9.0 7.0 4.0 8.0 11.5
APR MAY JUNE JULY AUG
20.5 18.5 23.5 24.0 24.0
13.0 16.5 20.0 23.0 23.0
SEPT
20.0
18.0
Figure 48. Poae5 Cree[i at Buster Lewis Road near Flippen, Georgio,Station 02204285, February 1978 to Au 9 ust 1983
40
35 I-n
30
LO
30z
20
ZILi
20
"1
4< 10
10CL
5
k
Statistic CopputedlFrom4
Harm~onic Meanl 16.1 16.0Amplitud~e 9.2 9.0Phase Coefficient 2.69 2.81
Stot'clor~d Error 2.10Percent Uori ance 95.3MeosueIment5 32
Ub~er,~ed wat.er terperoture
100
H
Liz
U--
80 t.
70
604-
50 Wt-
40
0
Obber-ved
MaN r
M in mlum~
OCT NOV DEC JAN FEB MAR17.0 12.0 12.5 4,5 7.5 16.515.0 11 .0 8.5 4.0 7.5 13.0
APR MAY JUNE JULY AUG
18.0 21 .5 26.0 26.0 23.5
12.5 17.5 23.0 26 0 23.0
SEPT
23.0
16.5
Figure 49. South River near McDonough, Geor 9 ia,Station 02204500, December 1957 to September 1982.
69
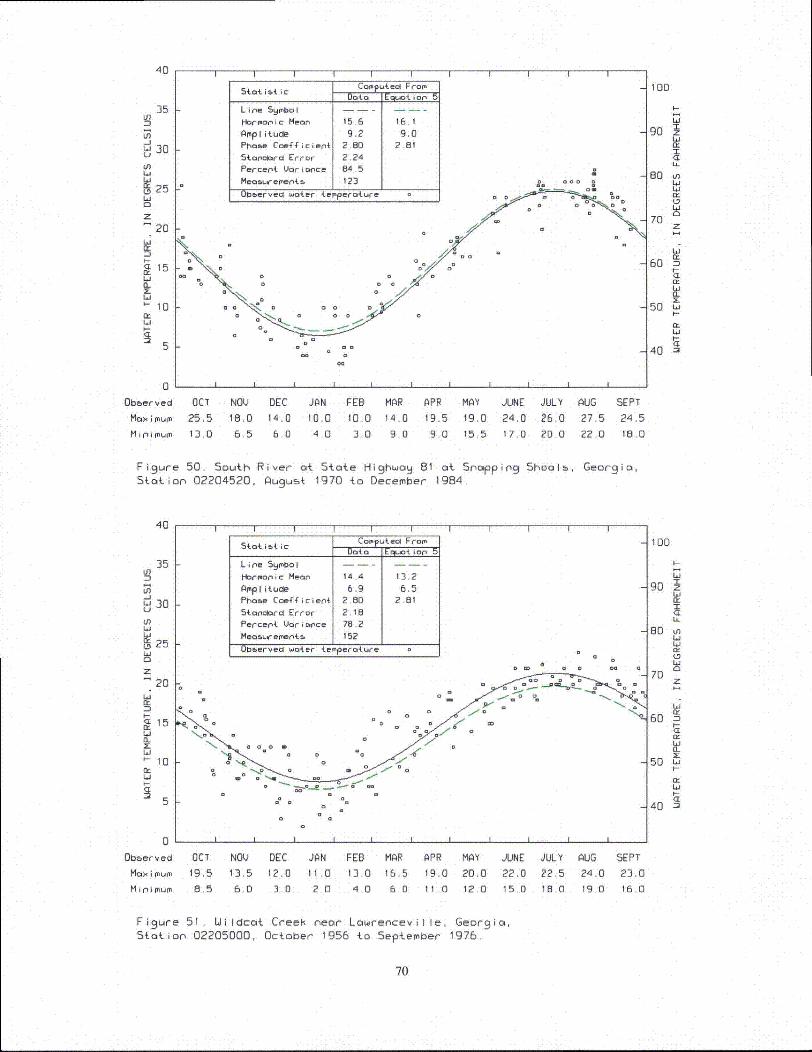
40
35 Fin
Liin
0
z
Li
CL
I-
I I I I I
Computed Frof.__________ Data Eq.uotion
Line Sqmbol
Ha-monic Meon 15.6 16,1
Amplitude 9.2 9,0
Phoae Coefficient 2.80 2.81
Standora Error 2.24
I I I I I
30 I
25 I
20 I
15
vrrecrt Var~iance O. .1 IMeoauepments 123 J____0be~ervecd water terperature
100
90zI.
L,
70 z
60
Ig50 L-'
40 -•
IO0
5
0Obberved OCT NOV DEC JAN FEB MAR APR MAY JUNE JULY AUG SEPT
Moaximum 25.5 18.0 14.0 10.0 10.0 14.0 19.5 19.0 24.0 26.0 27.5 24.5
Minimum 13.0 6.5 6.0 4.0 3.0 9.0 9.0 15.5 17.0 20.0 22.0 18.0
Figure 50. South River ot State Highwao 81 o4 Snoppin9 Shoolb, Georgio,Staoion 02204520, Ou9uLt 1970 to December 1984
40
in
in-J'- 30U
L2
In
20
I-
U.1wa 15EL
10
5
5tot ibt ic Compu.tecd From7
Dot a Epiat io
Line 5y1mbol
Hormonic Meon 14,4 13.2
AmpI itucde 6.9 6.5Phase Coef f i C i ent 2.80 2,81
5toacnord Error 2.18
Percent Vtor i ance 78.2
Meaosu.rements 152
Oiblerved water teinperoture 0 0
0 0 o
0 ,
a
100
90
z
IT
CL
60 I
50L
a:
40
0 i i i i
Obberved
Moximum
Minimum
OCT NOV DEC JAN FEB MAR19.5 13.5 12.0 11,0 13.0 16.5
8.5 6,0 3.0 2.0 4.0 6.0
APR MAY JUNE19.0 20.0 22.0
11.0 12.0 15.0
JULY AUG
22.5 24.0
18.0 19.0
SEPT
23.0
16.0
Figure 51. Uildcot Creek neor Lowrenceville, Georgia,Station 02205000, October 1956 to September 1976.
70
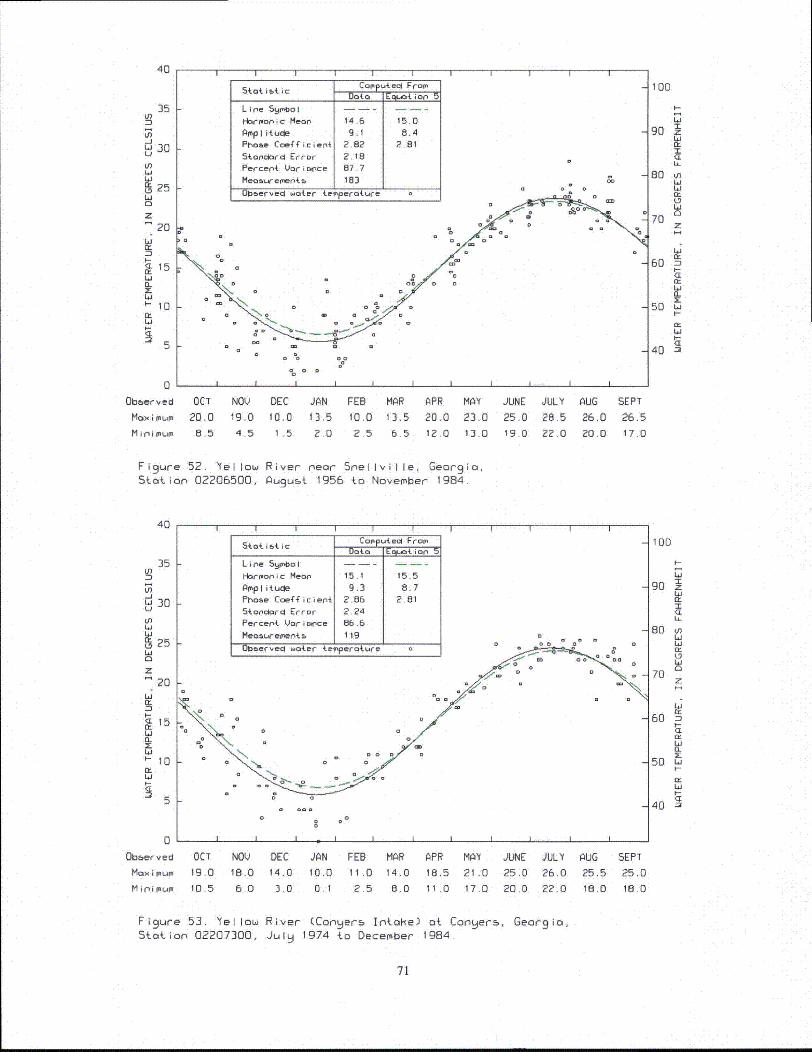
40
u0
-J
W 30U,Ln
ýN256120z20
L.
~L15
61EL
S10
Sttsi Comp uteoI F op
Lin'e Sym'bol
Hakrmon'ic Mean~ W46 15.0
Phoee Coefficienti 2-8? 2.8Stan~dardl Error 2.18Percent Uori wce 87.7
I-
I I I I I
Obbrec ae temperature 0 J -
I I I A0
100
I-
Li
90 z
80 %niDLi
70 z
60 n
50 LiI.-
40D
0Observed
Maximum
Minimum
OCT NOV DEC JAN FEB MAR APR MAY JUNE JULY AUG20,0 19.0 10.0 13.5 10.0 13.5 20.0 23.0 25.0 28.5 26.08.5 4.5 1 .5 2.0 2.5 6.5 12.0 13.0 19.0 22.0 20.0
SEPT
26.5
17.0
Figure 52. 'fellow River near 5neilville, Georgia,Station 02206500, August 1956 {o November 1984.
40
~35LnIn
-jW 30U
c,Li
g 25L10
z20
c-
•- 10
I I I I I I II IIStot i~t ic Copp~utecl F am
004o Equo4 i on 5
Line SymboI- -- -- -
Harmonic Mean 15.1 15.5Ampl it ucle 9.3 8.7Phoae Coefficient 2.86 2.81Son~cord Error 2.24Percent Uori nce 66.6Meosw"emen.bs 119 0
Obe,erved water tegnperature a
o m o
100
I,
Li
90 z
I-
80 n
70
60 DI-
50 L-i
LoIE
40 -2.5
0Obberved
Maximum
M in0i mupn
OCT NOV DEC JAN FEB MAR APR MAY JUNE JULY AUG19.0 18.0 14.0 10.0 11.0 14.0 18.5 21.0 25.0 26.0 25.510.5 6.0 3.0 0 1 2 5 8.0 11.0 17.0 20.0 22.0 18.0
SEPT
25.0
18.0
Figure 53. Yellow River (Congers Intake) at Congers, Georgia,Station 02207300, Julg 1974 to December 1984.
71
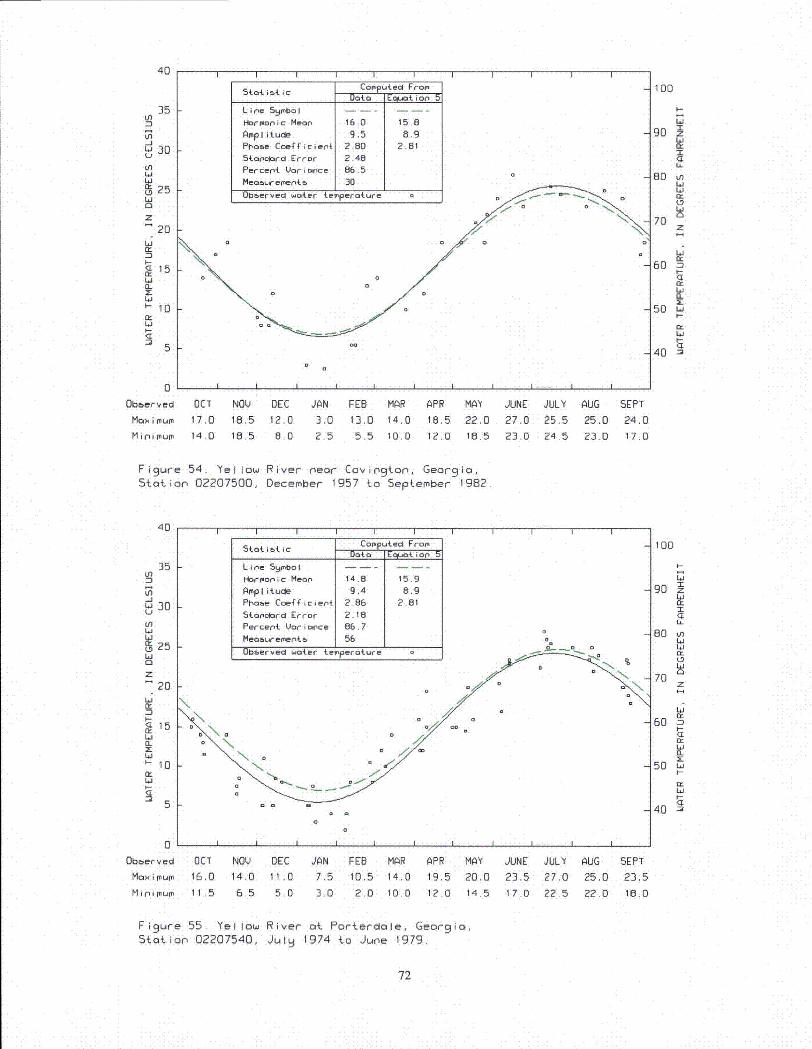
40
35 LLflZI
30
20LiIXz
20
(L
10
j I IS~o~•{icCopputeal From
Statistic Data 5
Line Sylol bol
1-brponic Mean 16,0 15.8Amplitudle 9.5 8.9Phone Coefficiert 2.80 2.81
Stanciard Error 2.48
Percent Uarionce 86.5
I I I I I
k-
I tb~erveo watoer terperature
I ~~~ 0
100
90 zI
ci
80 I
70 z
60
ci
50 L.
40h
0Obberved
Ma>x i mumM In i MUMIII
OCT NOV DEC JAN FEB
17.0 18.5 12.0 3.0 13.0
14.0 18.5 8.0 2.5 5.5
MAR APR MAY JUNE JULY AUG
14.0 18.5 22.0 27.0 25.5 25.0
10.0 12.0 18.5 23.0 24.5 23.0
SEPT
24.0
17.0
Figure 54. 'fellow River near Covington, Georgia,Station 02207500, December 1957 to September 1982
40
35 kUn
in-JL 30
in
Wu 25Liaz
20Li
E15Li
zL.1- 10Cra.1
I I I I I
tot is ic Computed FromData Eqltotio' 5
Line 59mbol
Harm¢onic Mean 14.8 15.9
AmpIlitude 9.4 8.9Phase Coeficient 2.86 2.81
Staoncord Error 2.18Percent Voriwice 86.7
I I I I I
k-
Meoswemet- [ 56 1oObberved water terperature
Io
100
I4<
80 zn
70z
60 "nI-
ci
50 L.iI-
cc
40 •
F
IZ)
0Obeierved
Moxi mum
Mini mum
OCT NOV DEC JAN FEB16.0 14.0 11.0 7.5 10.5
11.5 6.5 5.0 3.0 2.0
MAR APR MAY JUNE JULY AUG
14.0 19.5 20.0 23.5 27,0 25.0
10.0 12.0 14.5 17.0 22.5 22.0
SEPT
23.5
18.0
Figure 55. Yellow River oa Porlerdole, Georgia,Station 02207540, Jul 1974 to June 1979.
72
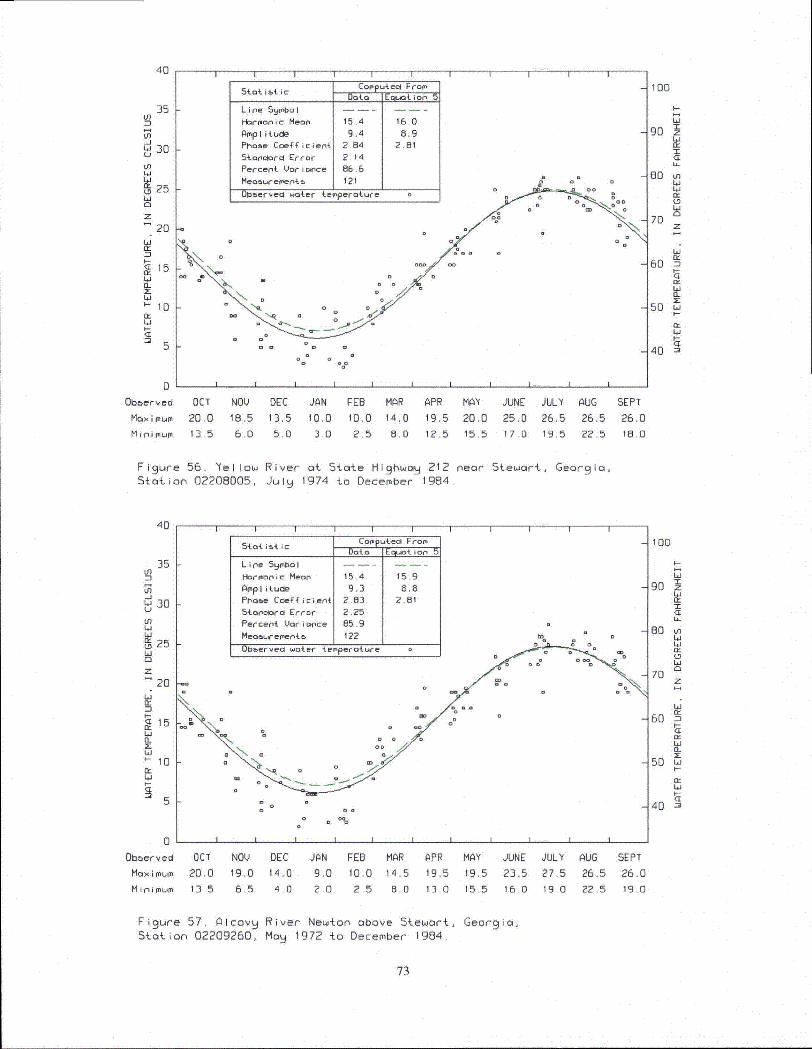
40
35 ILn
41 30
LnLW
25Li
n.z
20
--i
15Li
S10
5
Statistic Computea FromData Eqt
2 {ior 5
Line Syrmbol
1Haronoic Meon 15.4 16.0
Amplitude 9,4 8.9Phone Coefficient 2.84 2.81
Stondard Error 2.14
Percent Voriance 86.6
Measurevoenib 121 j a
UID~ervedl water teperature 0 0 o I.
I I I I I
100
Li
90 z
80 anLiLi
70 z
60
50 ui4-
n-
40 "=
1-
00be~er ved
mox i mum
Mi irainum
OCT
20.0
13.5
NOV
18.5
6.0
DEC
13.5
5.0
JAN FEB MAR
10.0 10.0 14.0
3.0 2.5 8.0
APR MAY
19.5 20.0
12.5 15.5
JUNE
25.0
17.0
JULY AUG
26.5 26.519.5 22.5
SEPT
26.0
18.0
Figure 56. 'fellow River at State Highw9 a 212 near Stewart, Georgia,Station 02208005, Julq 1974 to December 1984
40
35 [In
Lfl
Li30U
In
0 25Ld0
20LJ
I-
15
IL
'-10
Li1
computed FroamData Eoquotio5
Line 59 ol . .I. . .
Harmoioc Mean 15.4 15.9
Amplitu0e 9.3 8.8Phase Coefficient 2.83 2.81
5otndord Error 2.25
Perceat Vari wce 85.9
MeaoUreaaentb 122
0bUerved water temperature
0 00.L0
1 00
g o
60 zD
I-
50Li
90
z
80 anh,Li
h,
70
60 -
50 L.iI.-
I,-
5
0 1-J
Obberved OCT
Max imum 20.0
NOV DEC JAN FEB MAR
19.0 14.0 9.0 10.0 14.5
APR MAY JUNE JULY AUG SEPT
19.5 19.5 23.5 27.5 26.5 26.0
MInioMum 13,5 6.5 4.0 2 0 2 5 8.0 13.0 15.5 16.0 19.0 22.5 19.0
Figure 57. Alcovq River Newton above Stewart, Georgio,Station 02209260, May 1972 to December 1984.
73
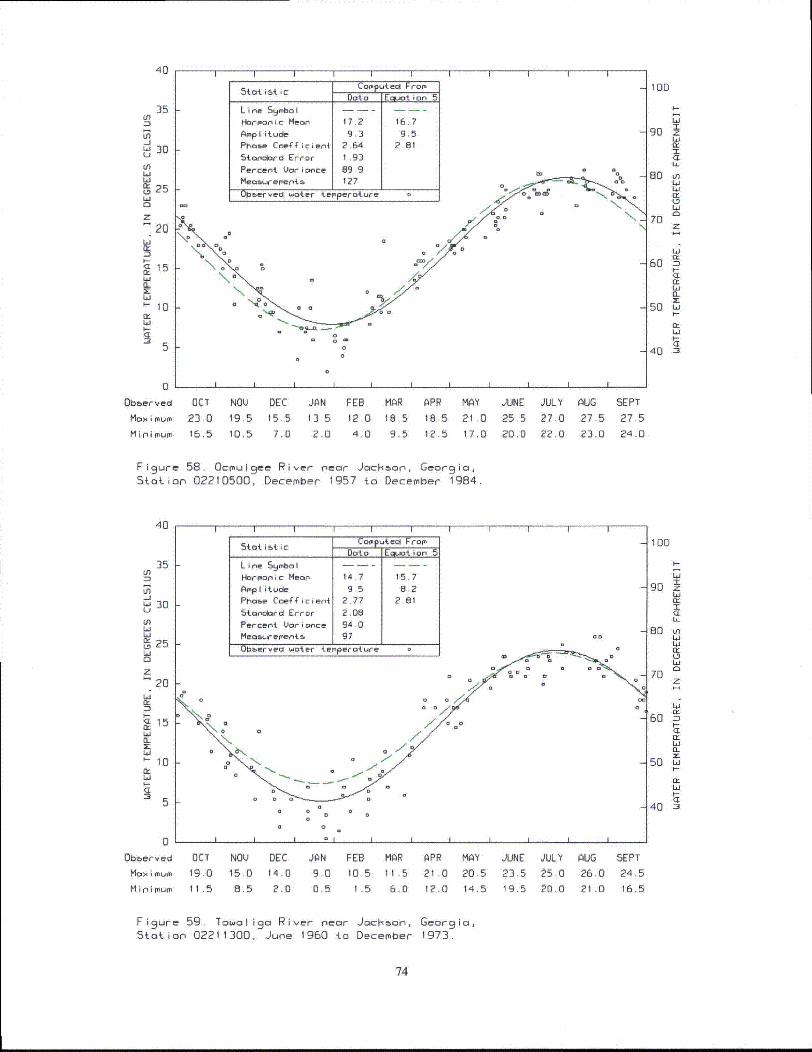
4040I I I I I
rtt~ ic Cam to~ed F am
Dat EUn: n
I I I I I
35 IU)
Ln-J
30
U')La
20z
S20
Lici:
=1
615(L
~-10(It
Amplitude 9.] 9.5Phoam Coefficient 2.64 2.81
Standalrd Error 1 .93
Percent Varia.nce 89-9Meaa~rernentb_ 127
Ubserved water tepero4.ure
00
100
I-
90 z
LiIci
80 u-
700U z
60
Li
70
4tn40
5
0Obterved
Maxci mum
Minimaum
OCT
23.016.5
NOV DEC
19.5 15.5
10,5 7.0
JAN FEB MAR APR MAY
13.5 12 0 18.5 18.5 21.0
2,0 4.0 9.5 12,5 17.0
JUNE JULY AUG
25.5 27.0 27.5
20.0 22.0 23.0
SEPT
27.5
24.0
Figure 58. Ocmulgee River neor JocHson, Georgio,Stotion 02210500, December 1957 to December 1984.
40
35 ktn
-jLi 30U
U)LiLi
• 25Li0
zS20
LiWC15
ELy 10
I-
I-
k
CoSputed From55{0 i~lic DaDoto ]E t ion 5Line Symv bo I
Harmonic Mean 14.7 15.7
Amplitude 9.5 8.2Phoae Coeaf icien 2.77 2.815otcaard Error 2.08Percent Var l•nce 94.0MeQ5LeMren4 5 97 oObmerved water temperature
0/0
,/ 0-•# . 0=oa
100
90 z
Li
80 U)
U,Li
70 z
Li
60
4D -3
I-
50 L.iI-
n-
40 2I
5 k
0'1
Obterved
Moaimum
M i Climum
OCT19.0
11.5
NOV DEC JAN FEB15.0 14.0 9.0 10.5
8.5 2.0 0.5 1.5
MAR APR MAY JUNE JULY AUG11.5 21.0 20.5 23.5 25.0 26.0
6.0 12.0 14.5 19.5 20.0 21.0
SEPT
24.5
16.5
Figure 59. Towaligo River near JacHson, Geor 9 io,Station 02211300, June 1960 to December 1973.
74
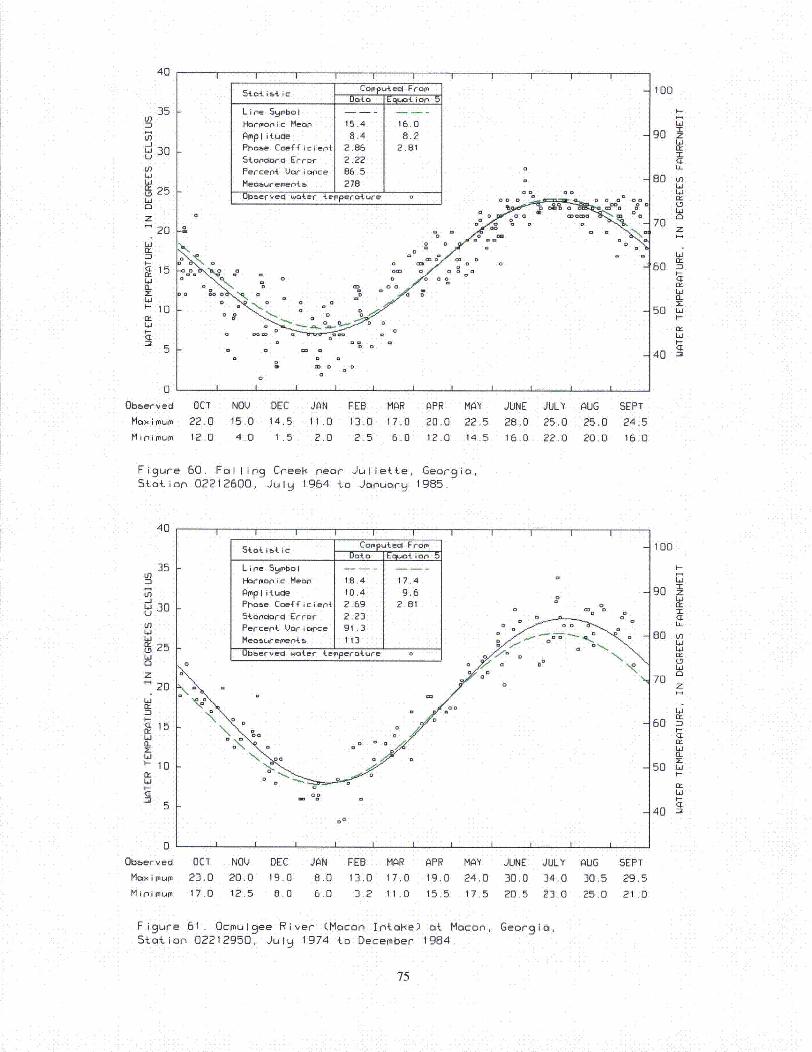
40
35 kin
-JI 30U
in
U 25
z20
L.1
=10
I-
15EL
~-10
5
0Observed
Maximum
Mini mum
I I I I I
5totiitic Co.iuted FromData Eclutio5
Line Symbol
abrmonic Mean 15.4 16.0Amp1 it ucle 8.4 8.2
Phoae Coefficien{ 2.86 2.81
5tandard Error 2.22k-
I I I I I
Percent Var i nce 86.5 0
Meaeu- ement 1 278
0b0erveci waterf temperature oa
D I
.. ° .. V/ 00: 0, °• •m oa•
II~~ ~~ 0
a o 0
0- •oo0
100
T-
80 InLoIa
70
60
I-
50 LiI.-
40 -
OCT NOV DEC JAN FEB MAR APR MAY JUNE JULY AUG22.0 15.0 14.5 11.0 13.0 17.0 20.0 22.5 28.0 25.0 25.012.0 4.0 1.5 2.0 2.5 6.0 12.0 14.5 16.0 22.0 20.0
SEPT
24.5
16.0
Figure 60. Fallin9 Creek near Juliette, Georgia,Station 02212600, July 1964 to January 1985.
40
35cn
30
inLa
ii25W
20
L.
tr
50
~ 5
0~
Obber ve d
Max imum
Minimum
i 4 I I I I
Stoti tic CoCp ueA FromData Eopt in5
Line 5ymbol-
Harmoanic Mean 18.4 17.4
Amplitude 10.4 9.6Phaoe Cofficient 2.69 2.81
5tanalora Error 2.23
Percent Uariance 91.3 o
Meaoeuements 113 o
L O&erved water temperature o -
0N
000
o o 7 o #
I I I I I I I i ID
", N,"
100
I-
La
90 z
-'a
80 inLa
Q:
70
60 D
50 La
t-
1.-
40 a
OCT NOV
23.0 20.0
17.0 12.5
DEC19.0
8.0
JAN FEB MAR
8.0 13.0 17.0
6.0 3.2 11 .0
APR MAY
19.0 24.0
15.5 17.5
JUNE JULY AUG30,0 34.0 30.5
20.5 23.0 25.0
SEPT
29.5
21.0
Figure 61. Ocmulgee River (Macon Intake) at Macon, Georgia,Station 02212950, July 1974 to December 1984.
75
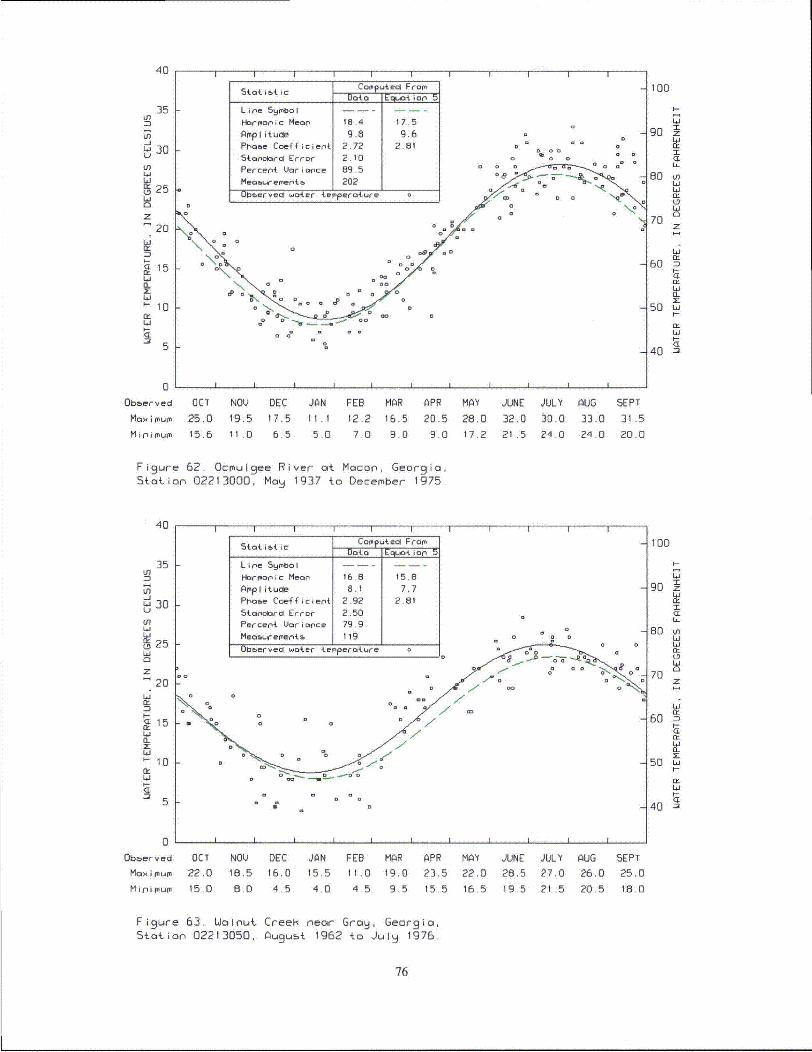
40
siol i~tic orp- t"F omn_________Data_ _____ ot of,5[ Lin~e Symbol~ - I
Hoinooic Meor, 18.41 17.5
I I J I I
35 k1)1n
67i
30
Ln
WN25Li
z
20LiI.--1
ci15
0-
'-10
5
p
k.
Hmlp I it ue 1 .0 0i.
Pr~oao Coeffticient 2.72 2.81
Stooclciar Error 2.100 00
Pertor,+ Variance 89.5
Meaau.rormor,4_ 202 ---0boeer'vecl water terpero
4.ure - 00
0 00
0= 00
0 - 0
100
F-
90 zI
so60 ..
Li
70 z
60 n
CE
50 L-I-
L•
40m
0
Obberved
Max~imu
M i i mourn
OCT
25.015.6
NOV DEC JAN FEB19.5 17.5 11 .1 12.2
11 .0 6.5 5.0 7.0
MAR
16.5
9.0
APR MAY JUNE JULY AUG
20.5 28.0 32.0 30.0 33.09.0 17.2 21 .5 24.0 24.0
SEPT
31 .5
20.0
Figure 62. Ocmulgee River at Macon, Georgia,Station 02213000, May 1937 to December 1975.
40
35 k
Lo30
0 25Ll
20Lj
ci15
'-J 10
I I I I I
stat i A i c Computecl FromData Equt ion
Lin•e 5mbol
Haormon ic Mean 16.8 15.8
Ampl itud 8.1 7.7Phooe Coefficient 2.92 2.81
5ton&lorcl Error 2.50Pi,-.-.- IJ,~r ; -r 7q 0
I I I I I
F
Wmerved water 4
-ei'pero4
ureMoo~~ emert;
100
Li
90z"I
60 •
50
70
60 n.I--
ci0
5
0'1
Obtoeryed
Max'i mum
Mpinimum
OCT
22.0
15.0
NOV DEC JAN FEB MAR APR MAY JUNE JULY18.5 16.0 15.5 11 .0 19.0 23.5 22.0 28.5 27,0
6.0 4.5 4.0 4 5 9.5 15.5 16.5 19.5 21.5
AUG
26.0
20.5
SEPT
25.0
18.0
Figure 63. Walnut Creek near Gray, Georgia,Station 02213050, Augusi 1962 to July 1976.
76
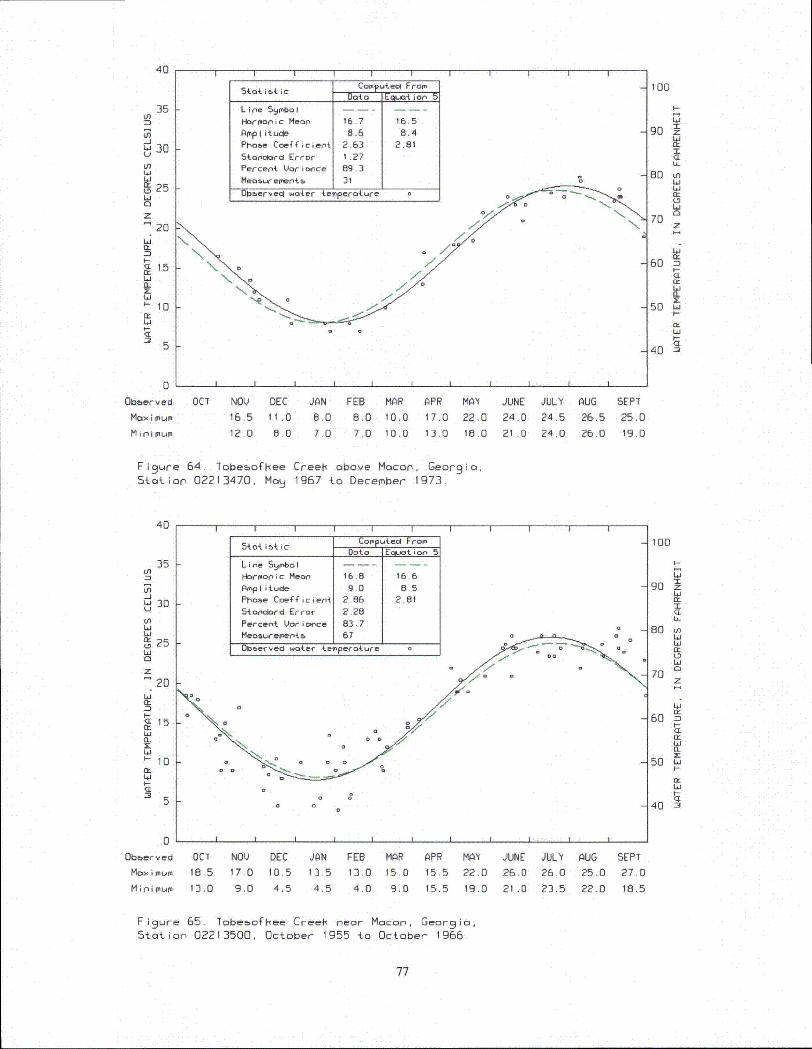
40
35 1Ln
In
Lj30
LnLa
ýN 2 5Li0
z20
61
ci15
IL
10
5
I I I I I I
Line Symbol - - -
Hortmon ic Meano 16.7 16.5
Pthobe Coefficient 2.63 2.81Standlard Error 1.27P~ercepnt Var iance 69.3
I.
I I I I I
Mecauremente. 1 3 O
Okmpervecl water terperature
100
I-
90 z•
LO
I
70 z
60
50 if
40
0
Obberved OCT NOV DEC JAN FEB MAR APR MAY
Maxi mum
Mini mum
16.5 11 .0 8.0 8.0 10.0 17.0 22.012.0 8.0 7.0 7.0 10.0 13.0 18.0
JUNE JULY AUG SEPT
24.0 24.5 26.5 25.0
21 .0 24.0 26.0 19.0
Figure 64. TobebofHee Creeh above Macon, Georgia,Station 02213470, May 1967 to December 1973.
40
35cnLn-JLI 30
In
o 2LI
• 20
<LI1
10
5
I-
15
I I I I I II I I II
5ttiS t ic Copputed FaomData EW.At ion 5
Line Symbol . . . . . .
Har.onic Mean 16.8 16.6Amplitude 9.0 8.5Phone Coeff cien+ 2.86 2.81Standar d Error 2.28Percent Vori once 83.7Meos,-emente, 67 0
obeerved water teperature
o o
I I I I I I.I.
100
F-
90 z
LI
80 Ln
7D
t.-CL
It
50
70z
60 aF,-ci
50 LI'
40 •
k
0
Obberved
Maximum
Mini mum
OCT18 .5
13.0
NOV17.0
9.0
DEC10.5
4.5
JAN13.5
4.5
FEB MAR
13.0 15.0
4.0 9.0
APR15,5
15.5
MAY
22.0
19.0
JUNE
26.0
21.0
JULY AUG26.0 25.0
23.5 22.0
SEPT
27.0
18.5
Figure 65. Tobesofkee Creei• near Macon, Georgia,Station 02213500, October 1955 to October 1966.
77
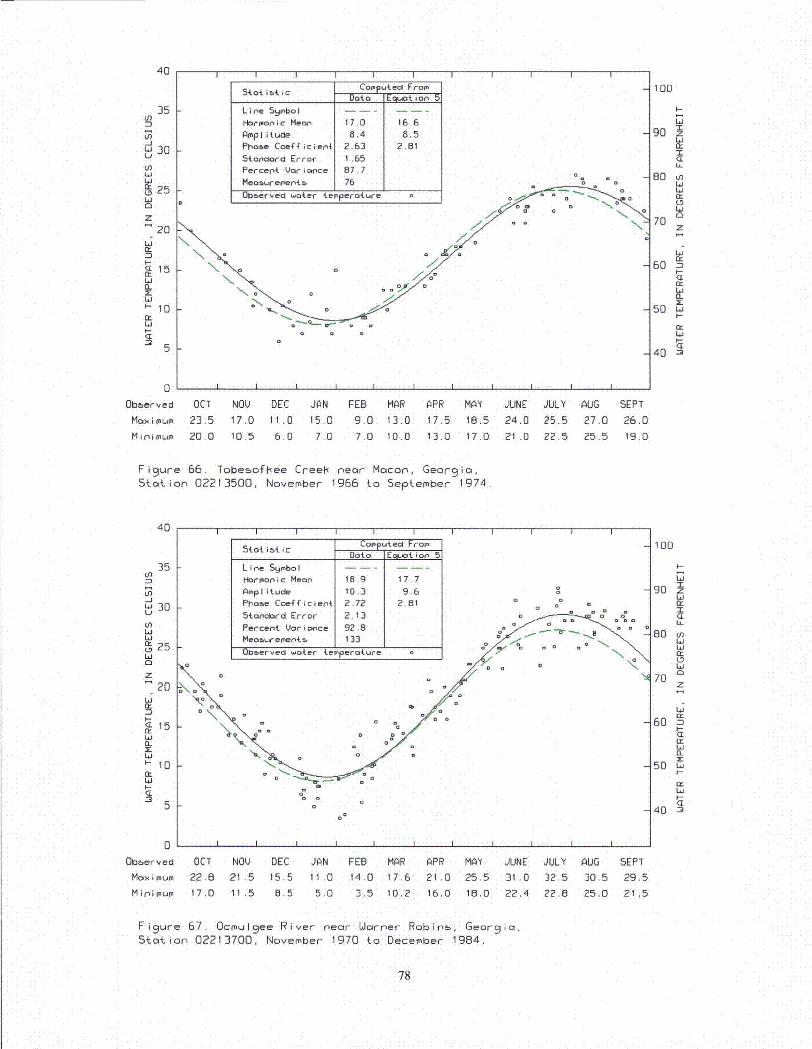
40
35 IIn
-J30
cn
N 25Li
09
a
z
20hi-14
15
a-
41'"10
1,4
40 II IStar i 5- i c computed From
Data Egflot io5
Line Symbo I
Hormonic Meoa 17.0 16.6Amplitude 8.4 8.5Phone Coefficien{ 2.63 2.81Stondclard Error I .65Percent Vor i Wce 87.7
I I I I I
Meo•ereentb j76 j_°__Obmerved water terperature
-Q -
100
U-
90
z
80 t1<
5D
El:
70
60
IE50 L.'
I-
I.,
40 -•5
0Obbervedl
Max imum
M in i mum
OCT NOV DEC JAN FEB MAR APR MAY JUNE JULY
23.5 17.0 11 .0 15.0 9.0 13.0 17.5 18.5 24.0 25.5
20.0 10.5 6.0 7.0 7.0 10.0 13.0 17.0 21 .0 22.5
AUG
27.0
25.5
SEPT
26.0
19.0
Figure 66. Tobe~ofhee Creeh near Macon, Georgia,Station 02213500, November 1966 to September 1974
40
35cn
in
30
(nWiLi, 25Ld
20
Li
<115
~-10
5tot i!'t ic Copputed FFromData EgFoot i on 5
L i ne Symbo I
Harmonic Mean 18.9 17.7Amplitude 10.3 9.6 0
Phose Coefficient 2.72 2.81 0 0
5tancdard Error 2.13
Percent Vor i once 92.8Meosuremente. 133Obberved water temperoture 0 0. . 0 0
D 0
0
100
90 zOWT-CEl
703 I4
IL
14
50
40D
0Obberved
Max imum
Minimum
OCT NOV DEC JAN FEB MAR APR MAY JUNE JULY AUG22.8 21 .5 15.5 11.0 14.0 17.6 21.0 25.5 31 .0 32.5 30.5
17.0 11 .5 8.5 5.0 3,5 10.2 16.0 18.0 22.4 22.8 25.0
SEPT
29.5
21.5
Figure 67. Ocmulgee River near WOarner Robins, Georgia,Station 02213700, November 1970 to December 1984.
78
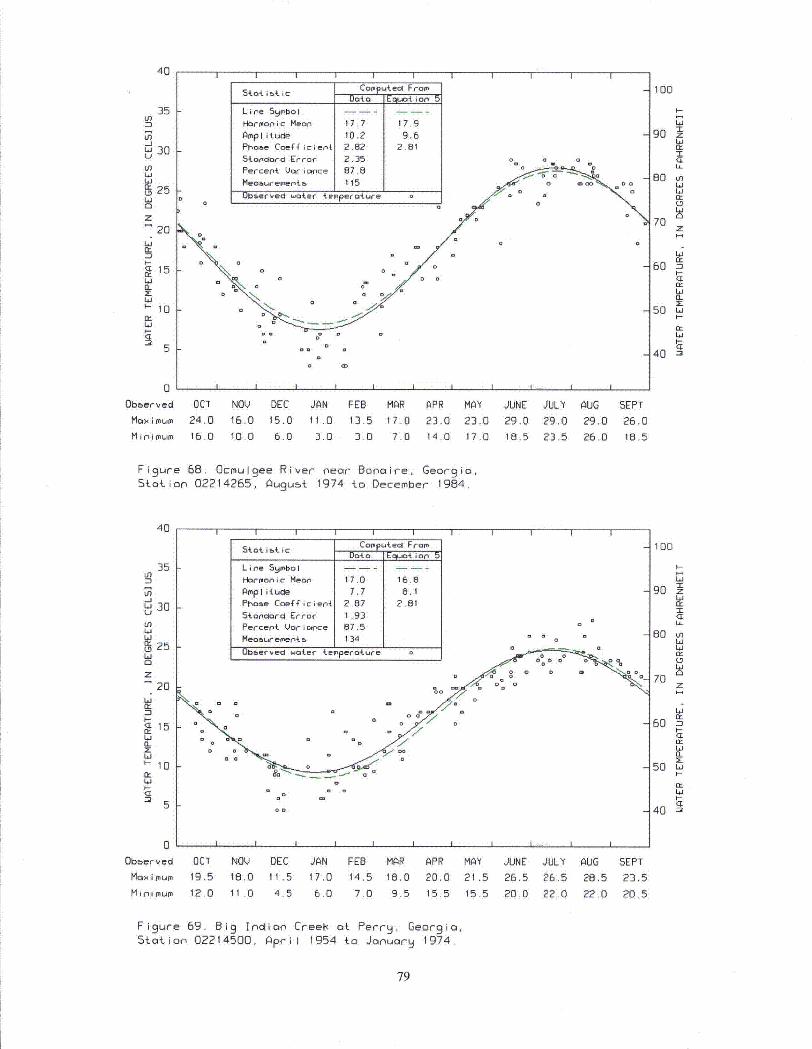
40I I I I I I I I I
In
-J
30
cn
WýLe 25U0
z
20
LjCL
z
La10
5
0
Obberved
Max imum
Minimum
S5tot ie't ic Computec From
Data EciFoio
Lire Symbo I
Hrmornic Mean 17.7 17.9
Ampl ituiue 10.2 9.6
Phase Coefficient 2.82 2.81
5{o•oiard Error 2.35 0 0 0
Percent Oari wce 87.8
Meoauremenbs 115
, O~serveed waoer {einperaoure 0 o 0 =
0o a 0 o -
oo
a0
mo • 0
100
90 z
4L
70
60 n1l-
50 LiiI--
EL
40 "•
OCT NOV DEC JAN FEB MAR APR MAY JUNE JULY AUG
24.0 16.0 15.0 11.0 13.5 17.0 23.0 23.0 29.0 29.0 29.0
16.0 10.0 6.0 3.0 3.0 7.0 14.0 17.0 18.5 23.5 26.0
SEPT
26.0
18.5
Figure 68. Ocmulgee River near Bonaire, Georgia,Station 02214265, August 1974 to December 1984.
40
350n
InJO
La30
U,25Li0L,
ir20
Li
0-
C _15EL
'-10
I I II I I I I
54 'a ib{ ic Cooupted FromDa'ta EqoLtior 5
Line Sqboo I
Hrmornic Meor 17.0 16.8Ampl itude 7.7 8.1Phase Coe:ficient 2.87 2.815Lanclarci Error 1 .93Percept Variarce 67.5 o
Measurements 134 0
Obeerved woaer terperature 0
0. o %
a~ a
I I I I II I I I II
100
I-
La
90 z
80 V)LaLad
70
60 Di-CEc-
2:
50 La.4 -
40 •
I
0
0
Obberved
Maximum
Minimum
OCT NOV DEC JAN FEB MAR APR19.5 18.0 11.5 17.0 14.5 18.0 20.0
12.0 11.0 4.5 6.0 7.0 9.5 15.5
MAY
21 .5
15,5
JUNE JULY
26.5 26.5
20.0 22.0
AUG
28.5
22.0
SEPT
23.5
20.5
Figure 69. Big Indian Creeh at Perry, Georgia,Station 02214500, April 1954 to January 1974.
79
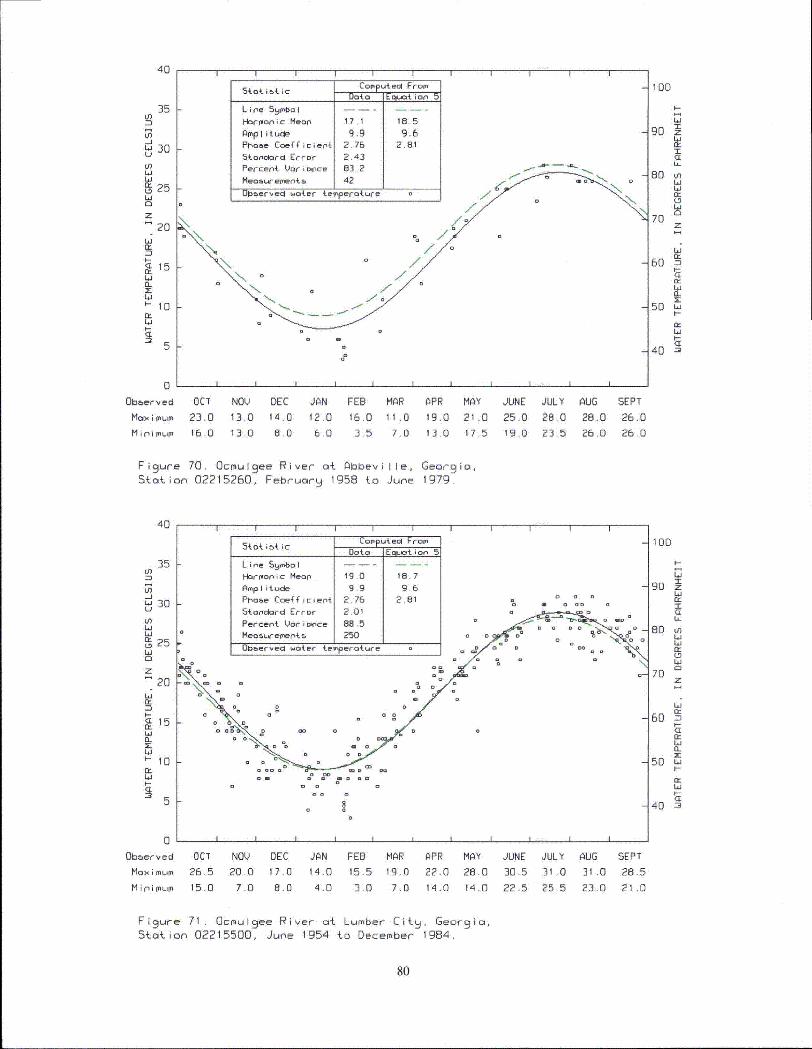
40
35I:35Ln
30
Ln
'N 2 50
z20
Li
CL15
IL
H10
IL
5
I I I I I II IIIS aotiMLic Com u ed From
Data E01t-aoi on
Line 5ymbol
Haoronic Mean 17.1 18.5
Amplitule 9.9 9.6Phase Coefficient 2.76 2.81
Standard Error 2.43
Percent Variance 83.2
Meawemernta 420bberved water temperature o
N e~~k 2"
100
90 zI
kLI
80 v)U
70 z
Li(r60
5-CL
50 L.iI--
Li
a40
k
0Obberved
M (i r-IifnLIM~
OCT NOV DEC JAN FEB MAR APR MAY JUNE JULY AUG
23.0 13.0 14.0 12,0 16.0 11 .0 19.0 21.0 25.0 28.0 28.0
16.0 13.0 8.0 6.0 3.5 7.0 13.0 17.5 19.0 23.5 26.0
SEPT
26.0
26.0
Figure 70. Ocmulgee River at Abbeville, Georgio,Station 02215260, Februory 1958 to June 1979.
40
35En
-JLi 30
EnLiLi
, 25Li0
z"20
n-
10:
Li
I I I I I I I I III
Stot i~t ic Computed_ FromData EQut ion 5
Line Symbol
Harmonic Mean 19.0 18.7
Amplitude 9.9 9.6
Phase Coefficient 2.76 2.81 - o a
Standard Error 2.01
Percent Voria nce 88.50Measuremen'ts 250 0-.
oer ec wate temperature o
o o_
. .. . °ja
I I I a o
100
LO
90
q-.Li
70z
60 n
hi
50 Li
5
0
Obaer ved
Maxi mum
MiniMLm
OCT NOV DEC JAN FEB MAR APR MAY26.5 20.0 17.0 14.0 15.5 19.0 22.0 28.0
15.0 7,0 8.0 4.0 3.0 7.0 14,0 14.0
JUNE JULY AUG30.5 31.0 31.0
22.5 25.5 23.0
SEPT28.5
21.0
Figure 71. Oceulyee River at Lumber City, Georgia,Station 02215500, June 1954 to December 1984.
80
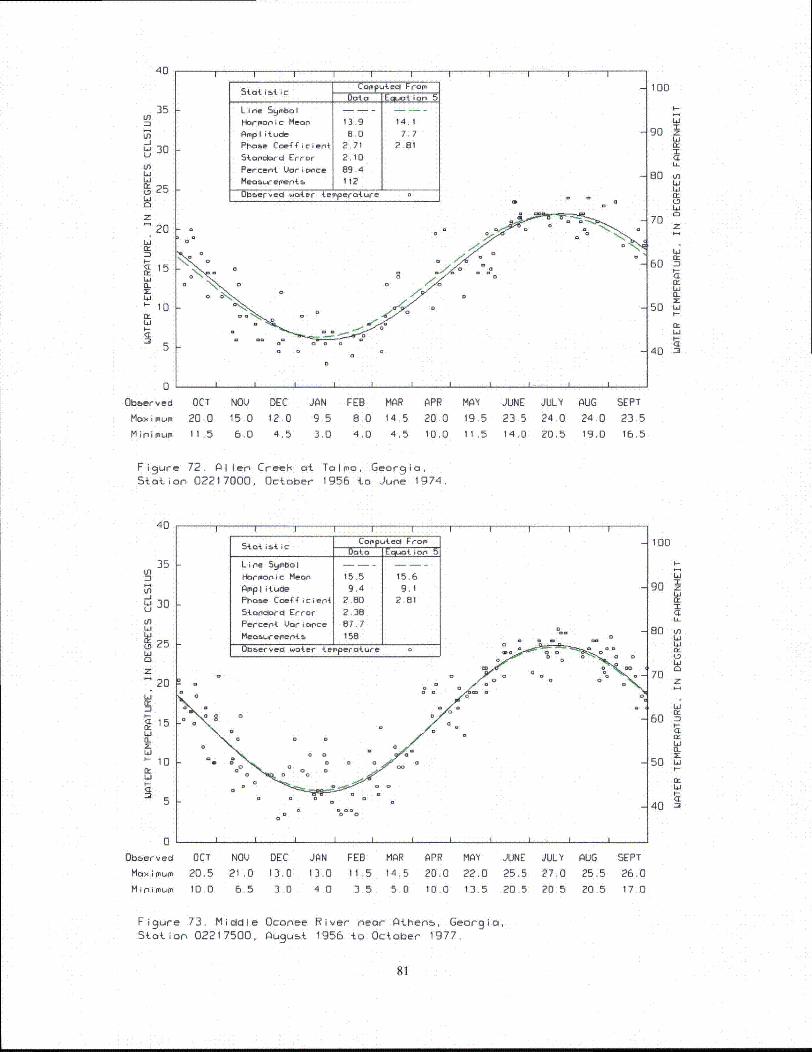
40
35 IEn
-j30
U9
LOLI
S25
20
Li
I-
S15
IL
.10
M
5
0
# i i i i
Copputed Fram5
Data Eqoat ion 5
Line Symbo I
Harmopnic Mean 13.9 14.1
Amplitude B.0 7.7
Phoae Coefficient 2.71 2.81
Standard Error 2.10
Percent Vari mce 89.4
Meas.ec'entb IQ ---2I
i l i i l
k
----- - - - - - -J-.
a o o
100
I.-
90 z-r
80 V)LJ
LaJ
70z
Cr.Li60 -n
I-
(L
50 Lin-
L.J
40 2
Obberved OCT NOU DEC JAN FEB MAR APR
Max imum 20.0 15 0 12.0 9.5 8.0 14.5 20.0
Minimum 11,5 6,0 4.5 3.0 4.0 4.5 10.0
Figure 72. AlIen CreeH at Talmo, Georgia,Station 02217000, October 1956 to June 1974.
MAY19.5
11.5
JUNE
23.514.0
JULY
24 0
20.5
AUG
24.019.0
SEPT
23.5
16.5
40
35 jIn
Ln
d 30U,La
w
u 25
La20
15
z
LO
~10
I I I ~ I I I I I I
Stait i Cofutec FromDoo cpot ion( 5
Line Symbol . . . . . .
Harmonic Mean 15.5 15.6
Ampl itucle 9.4 9.1
Prroae Coef•icient 2.80 2 81
5tondoard Error 2.38
Percent Vor i nce 87.7
Meaosurementbs 158
Ubaerved water temperature
0 0. I
100
La
90 zI
80 V)Lai
70
60 -c
50 LaI-
La
40 a
0Observed
Max i mum
Mini MUMl
OCT NOV
20.5 21 .0
10.0 6.5
DEC13.0
3.0
JAN13.0
4,0
FEB11.5
35
MAR APR MAY JUNE JULY AUG
14,5 20.0 22.0 25.5 27.0 25.5
5.0 10.0 13.5 20.5 20 5 20.5
SEPT
26.0
17.0
Figure 73. Middle Oconee River near Athens, Geor 9 ia,Station 02217500, Aug ust 1956 to October 1977.
81
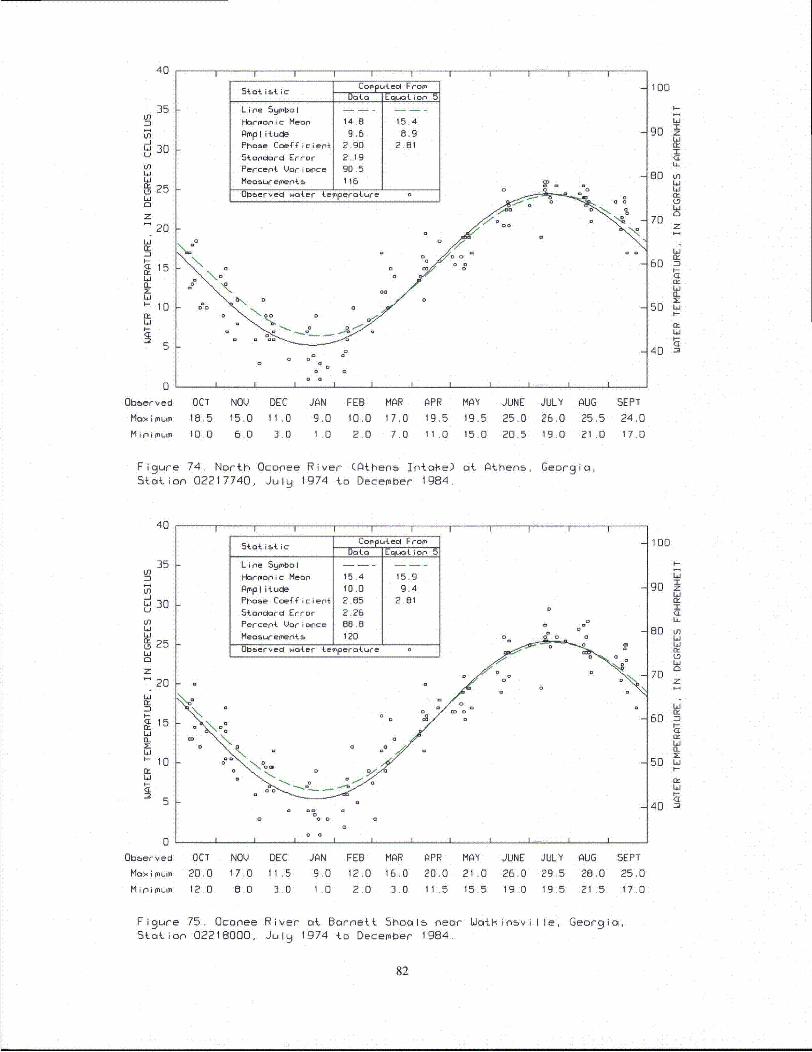
40 I I I I I I I
In
w 30cn
30Li
g 25
151IL
zS20
LO10
F.-Li
5
0
StAt i&tic Computea FraomDot_ a Equotion 5
L ine Syrao I
Horponic Mean 14.8 15.4
Amplitud 9.6 8.9
Phaoe Coefficient 2.90 2.81Standard Error 2.19Percept Variance 90.5Meaourenentb 116 9)Otmerved water terperature 0 0 0
\D I&o °° o0
o 0
100
90 z
W
70 z
60
50 wn40
50 Li
Observed OCT NOU DEC JAN FEB MAR
Maxiomum 18.5 15.0 11.0 9.0 10,0 17.0
MiniimUM 10.0 6.0 3.0 1.0 2.0 7.0
APR MAY JUNE
19.5 19.5 25.0
11.0 15.0 20.5
JULY AUG26.0 25.5
19.0 21.0
SEPT
24.0
17.0
Figure 74. North Oconee River (Athens Iptacte)Station 02217740, July 1974 to December 1984.
at. Athens, Georgia,
40
35In
V)
30InLiU
WS25
20L,
E<L 15
a_zH1 10
5
I I I -l I I IIII5{0{ ~t i•Comlp tecl From
tti4ic Data E t io0-5
Line Symbo I
H-armonic Mean 15.4 15.9
mpliitucle 10.0 9.4Phoae Coefficient 2.85 2.81
Standard Error 2.26
Percent Var i once 88 .8
Meozremeota.. 120
0bferved Water tei~perature
" " I I °
100
80Li
90 z"I
t680 co
L4L-
Li
40
70z
Li60n
50 LiF-
F-
0
Obberved
Max mum
M In i loUmp
OCT
20.0
12.0
NOVL DEC JAN FEB17.0 11 .5 9.0 12.0
B.0 3.0 I '0 2.0
MAR APR MAY JUNE JULY AUG16.0 20.0 21.0 26,0 29.5 28.0
3.0 11.5 15.5 19.0 19.5 21.5
SEPT
25.0
17.0
Figure 75. Oconee River at Barnett 5haals near WatlinsviStation 02218000, July 1974 to December 1984.
lie, Georgia,
82
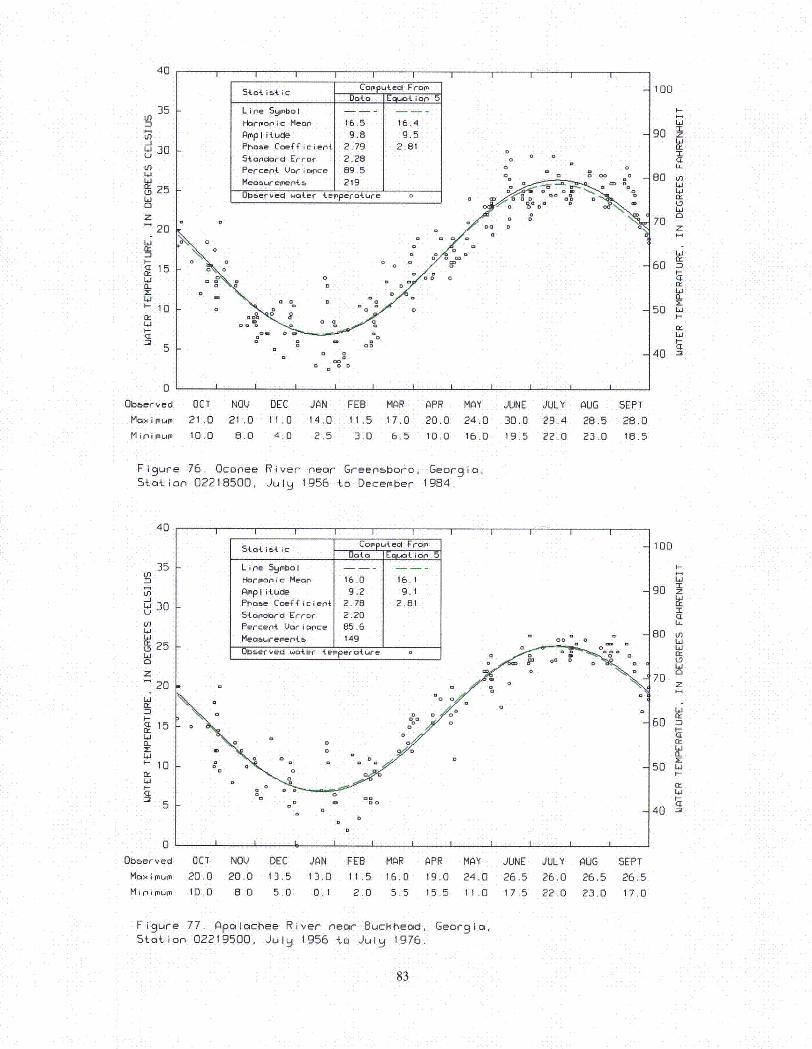
40
35 I
40 II I I IStat i&A. ic Comp tecl IF ro
Data Eqoto '=on77
Line Syobo l
Hoaronic Mean 16.5 16.4Ampl ituce 9.8 9.5Phoae Coefficient 2.79 2.81
LW 3En
LO
0
z20
Id
IL
10
15
0~
ObIre
MQ.imu
M~inimum
I I I I
SLandlard Error 2.28 0 0 0
Percet VarUiance 89.5 [_ _
l0•ervecl water temperature a
0 0
0 0
o0
10D
l--
g0 o
C
80 tnWU
70 z
60
I-
50 w.
40-40 "•
OCT
21.010.0
NOV
21 .08.0
DEC
11.0
4.0
JAN FEB MAR APR14.0 11.5 17.0 20.0
2.5 3.0 6.5 10.0
MAY24.016.0
JUNE JULY
30.0 29.4
19.5 22.0
AUG
28.523.0
SEPT
28.0
18.5
Figure 76. Oconee River near Greensboro, Georgia,Station 02218500, JulI 1956 to December 1984.
40
35
30U9-J
in
25Li
0
2-0
Li
<L15EL
Lo'-10
5
I I I I I I III
5tti•ic o~muteol FromData Equo ion 5
Line Symbol I - - --
Horm •nic Mean 16.0 16. 1AmpI it ude 9.2 9jPhase Coefficient 2.78 2.81
Stonolaro Error 2.20Percent Var i once 85.6
Measurements 1 149 0 o
O 0berfed water temperoture a
.o I I H
Do
I L I I I I I ii i
100
I-
90 z
80 un
70 z
60
50 L.4-
40 -•
0~
Oboerved
Maaimum
M in i MUMI~
OCT
20.0
10.0
NOV DEC
20.0 13.5
890 5.0
JAN FEB MAR APR MAY JUNE JULY AUG13.0 11.5 16.0 19.0 24.0 26.5 26,0 26.5
0.1 2.0 5.5 15.5 11.0 17.5 22.0 23.0
SEPT
26.517.0
Figure 77. Apaolachee River near BucHhiead, Georgio,Station 02219500, July 1956 to July 1976.
R3
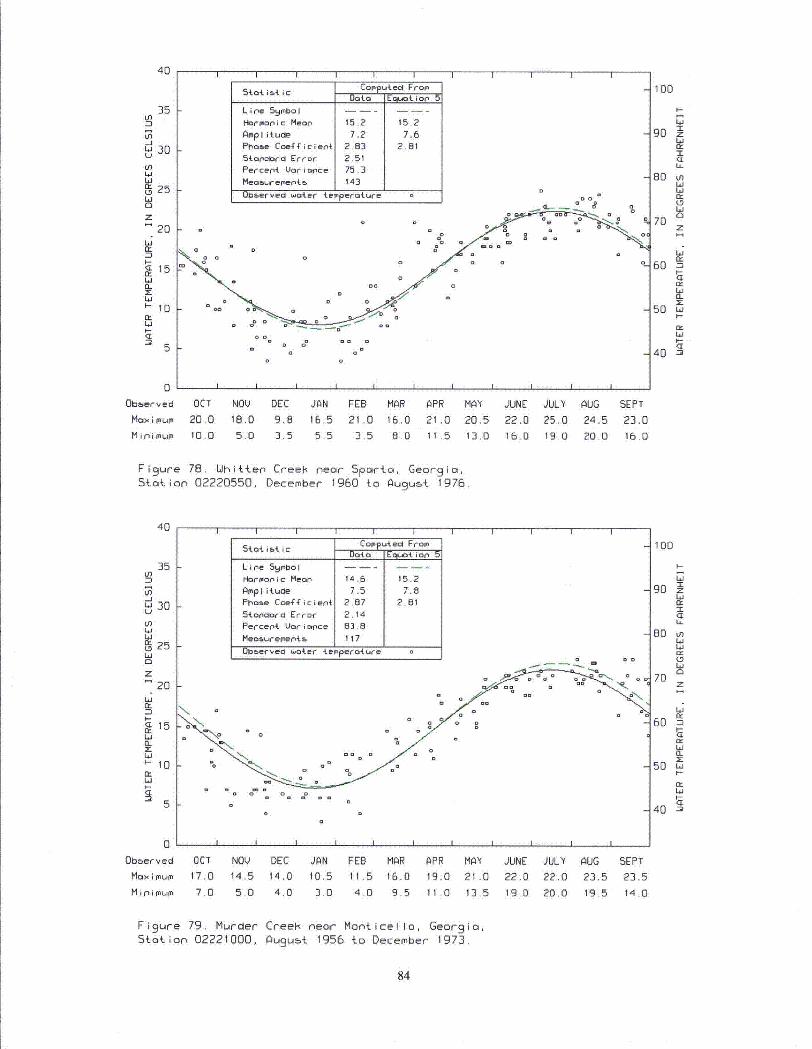
40
-130
hiU
• 0Wz
2061
15CL
'-10
I I I I I
Sta4.•isc COPPbtel FromData Eluat ion5
Line 59mbol o
Harmon ic Meoa 15.2 15.2
AmpIitucle 7.2 7.6Phase Coefficien{ 2.B3 2.81
Sooclardc Error 2.51
Percent Vor i once 75.3
Meoau-rae, nt, 143
k-
I I I I I
Oo3erveci Watef rteperoture .- 0
Do 000
0 0
0 0
o o
100
go zI"I-
80 U-
Li
70
z
60 "n
0L
40D
0
Obberved
Maximum
M ini mum
OCT NOV DEC JAN FEB MAR APR MAY
20.0 18.0 9.8 16,5 21.0 16.0 21.0 20.510.0 5.0 3.5 5.5 3.5 8.0 11.5 13 ,0
JUNE JULY AUG
22.0 25.0 24.5
16.0 19.0 20.0
SEPT
23.0
16.D
Figure 78. Uhit{en Creek neor Sparta, Georgia,Station 02220550, December 1960 to August 1976
40 I
U.
30
20in
qJ
CL
25
z- 20
L'i":
h-
10
L(
I I I I IStatistic Copputecl From
Data eIEo-aion 5
Line 5ymbol
Harmonic Mean 14.6 15.2
Ampl itucle 7.5 7.8Phase Coefficient 2.87 2.81
5tonc*ord Error 2.14
Percent Voriance 83.8
Meoaurements 117
Obmerved woter teinperoture 0
a
I I I I I I t I I
I I I I
100
I-
go
90 knI
CL
80 ~
50Lif-
a:
40
601
I--CL0:
50 Li
Z)
0
Obberved
Maximum
Mpinimum
OCT NOV DEC JAN FEB MAR APR MAY JUNE JULY AUG17.0 14.5 14.0 10.5 11.5 16.0 19.0 21.0 22.0 22.0 23.5
7.0 5.0 4.0 3.0 4.0 9.5 11.0 13.5 19.0 20.0 19.5
SEPT
23.5
14.0
Figure 79, Murder Creek near Monticello, Georgia,Station 02221000, Auguot 1956 to December 1973.
84
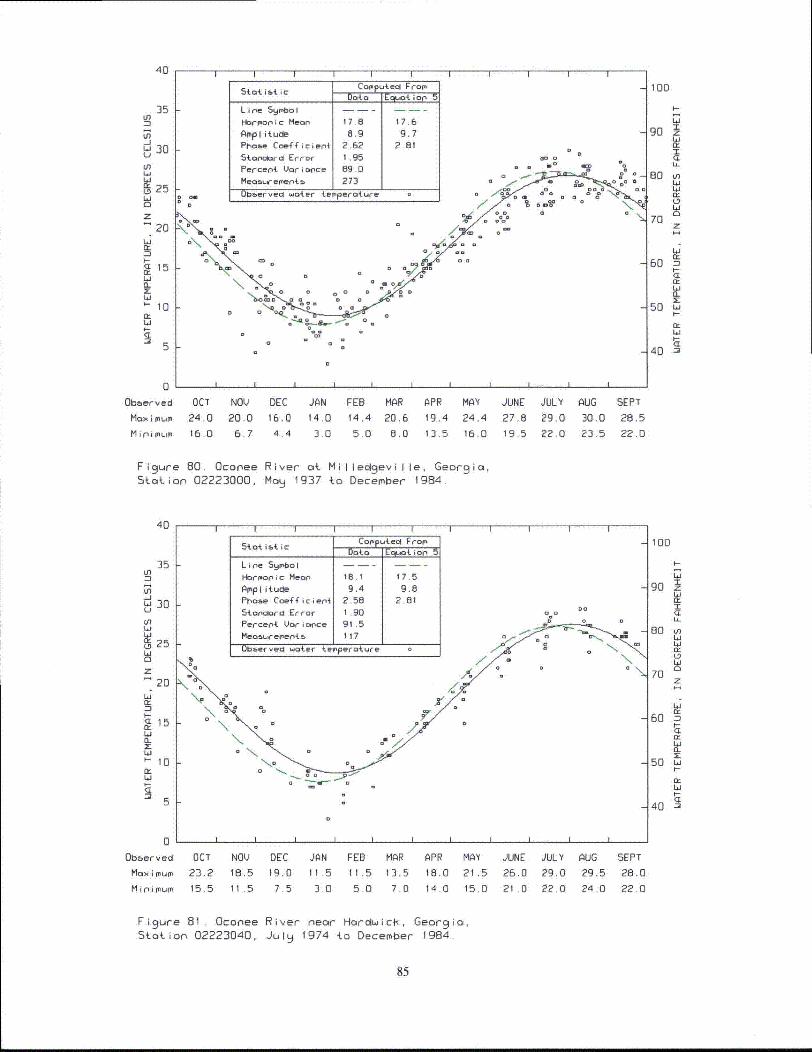
40
stat .. tic COPP ecdF am
L i e Syq.bo I -- --Harmonic Mean 17.8 17.6Amplitude 8.9 9.7
I I I
tn
Wi 30U
Li,wi
2 5
20La
(L
10
15
0~
54taroorrd Error 1 .95 II ~Percent Vor ai ce 89.0 .0D
Meao~uc r'er'p ~ 273 a -Ubtervec4 wat~er teinperature
00 0
100
go Iz-rLdI1
70 z
60 -•
50 La
40 =2
Obaerved OCT NOV DEC JAN FEB MAR APR MAY
Mai mum 24,0 20.0 16.0 14.0 14,4 20.6
MI n iMUIM 16.D 6.7 4.4 3,0 5.D 8.0
19,4 24.4
13.5 16.0
JUNE JULY
27,8 29.019.5 22.0
AUG
30.0
23.5
SEPT
28.5
22.D
Figure 80. Oconee River at Milledgeville, Georgia,Stotion 02223000, Mao 1937 to December 1984.
40
35Ln
30L30U
u25LiaZ
20
Lin-w
15
L 10
W
5
5&a4DOS~ A. al Fromn
Line Sqybol ---I
1-brmooic Mean 18.1 17.5
PAmplitucl 9.4 9.8Ph'ose Coefficient 2.58 2.81
5konclorrd Error I .90 o. Do0
Percent. Variance 91.5
Meosurem4ents_ 117 1
Ubaerved waater 4.einperoture 0
oo 0
0 ;r
N
100
T-
Li.
90 z
70 z60 L,-
50 I.
40
70
I
0
Obberved
MON I MUM
M i r i rp urn
OCT NOV DEC JAN23.2 18.5 19.0 11 .5
15.5 11 5 7.5 3.0
FEB15.55.0
MAR13.5
7.0
APR18.0
14.0
MAY
21 .515.0
JUNE26.0
21 .0
JULY AUG29,0 29.5
22.0 24.0
SEPT
28.0
22,0
Figure 81. Oconee River near Hordwiclý, Georgia,Station 02223040, Julq 1974 to December 1984.
85
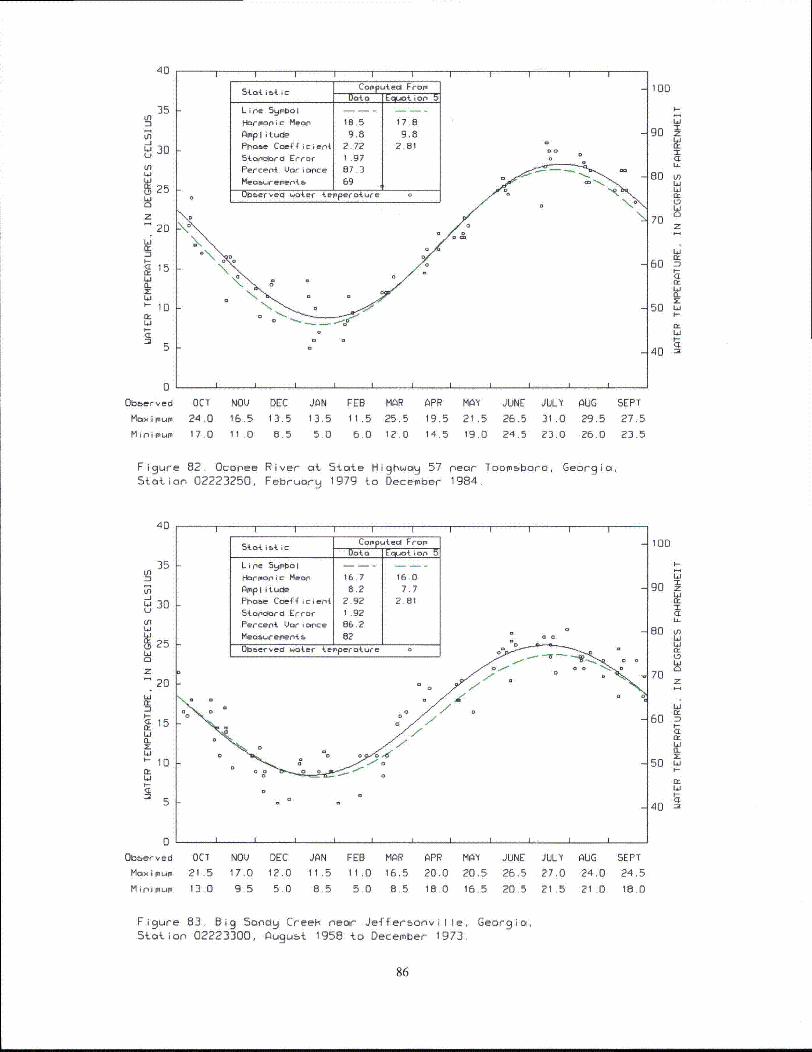
40
35Ln
LflLU 30U9-J
cn
WýLD25
Li0
z
205i
I-
'- 10
nS
i i i istotibic Camputel From
Data _E1uot ion 5Line S9bol . .. . ..
Hormonic Meoa 18.5 17.8
Amplitude 9.8 9.8
Stanclor'do Error 1 .97
Percent Voricrce 87.3Measureinern4- 69 4
0 Uobervea woaer .ePperature 0
°_o
I i I i i
100
I-
CL
zI
80 Ln
70 z
60 m
50 L.i
I-
40 -•
k
0
Oboerved
Maximum
Mipimum
OCT
24,017.0
NOV
16.5
11 .0
DEC JAN13.5 13.5
8.5 5.0
FEB MAR11.5 25.5
6.0 12.0
APR MAY JUNE
19.5 21.5 26.514.5 19.0 24.5
JULY
31 .0
23.0
AUG
29,5
26.0
SEPT
27.5
23.5
Figure 82. Oconee River at State Highway 57 near Toomnboro, Georgia,Station 02223250, February 1979 to December 1984.
40
35 -in
Ln-j
30
in
IN 25Ld
20
Li
Id-
'-10
5
I I I I I
StotiMtic Copputea FromEo o E.Ol•Oiop 5
Lipe 59 bo I . . . . . .
Harmonic Mean 1617 16.0
Ampl itude 8.2 7.7Phase Coeficiet 2.92 2.81Sanciard Error 1.92Percent Vaorcice 86.2
Meourep'er'4m 02aObberved water tenperoiure - s
=0
o0
°O'/z0° o 0 .
Xa
100
90 z
C-
80 in
70 z
Li
60 D
50 L-4-
40 •
m
0Observed
Maximum
Minimum
OCT NOV DEC JAN FEB MAR APR MAY JUNE JULY AUG21.5 17.0 12.0 11.5 11.0 16.5 20.0 20.5 26.5 27.0 24.0
13.0 9.5 5.0 8 5 5 0 8.5 18.0 16.5 20.5 21.5 21.0
SEPT
24.5
18.0
Figure 83. Bi 9 Soand CreeH near Jeffersonville, Georgia,Station 02223300, Augubt 1958 to December 1973.
86
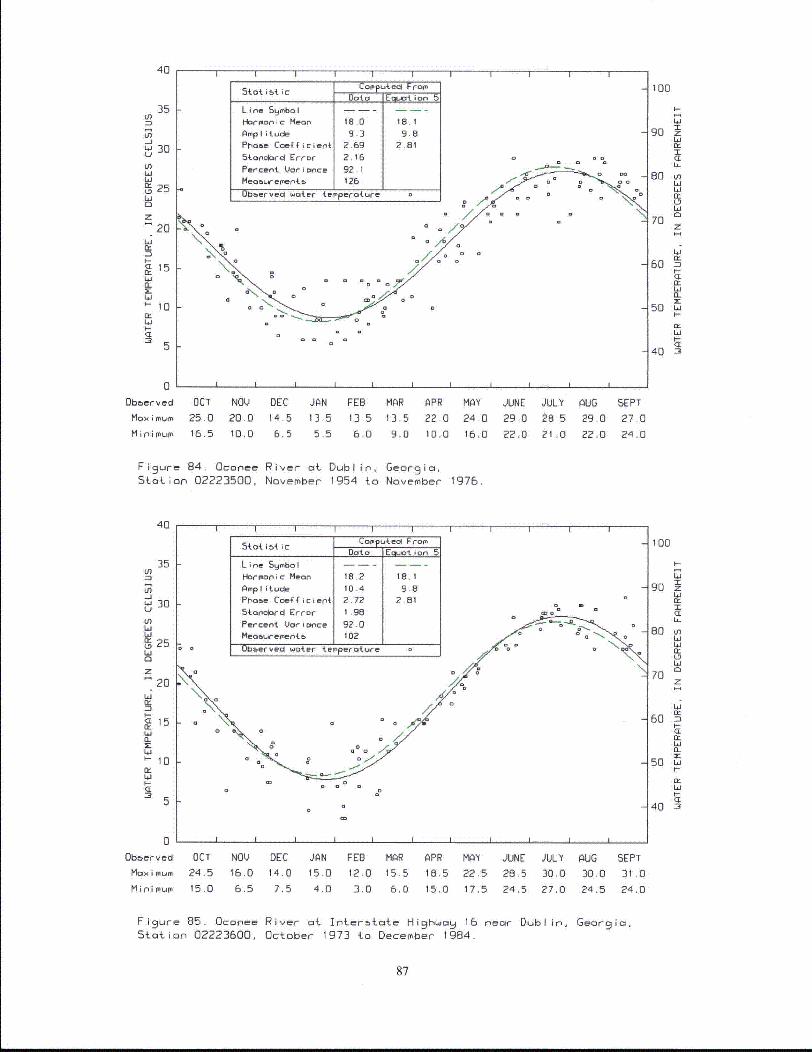
40
35 -
Statst c -CopputedFr-om_________ Da ~ ta jJIuzat ona 5
Line Symbol - - - -I
Harmonic Mean~ 18.0 18 I
Amplitude I. 9.8Phas~e Coefficient 2.691 2.81
cn
-JW 30(n)L.1Li0 25Li0
z
20
0.5a•- 10
5
Stan ard Error 2.16
Percent Lar i nce 92.1
MeabrtL-entt J 126 j____Oloserveal water terperatLure o0
IN I I
100
E-
90 z
80 nLi
70 z
60
50 La4 --a.i
40 •
0
Obberved OCT NOV DEC JAN FEB
Moximum 25.0 20.0 14.5 13.5 13 5
Mi0inMUM 16,5 10.0 6.5 5.5 6.0
MAR
13.5
9.0
APR
22.0
10.0
MAY
24.016.0
JUNE JULY AUG
29.0 28.5 29.0
22.0 21.0 22.0
SEPT
27.0
24.0
Figure 84. Oconee River at Dublin, Georgia,Station 02223500, November 1954 to November 1976.
40 .
35Ln
-j S30U
inLuw
D 25Li0
z"20
n,
61
I-
<115
La
~-10
5tt ist ic Cfopu~ted From
Data E=.4t ion 5
Line Symbol - - -
Harmonic Mearn 18.2 18.1Amplitude 10.4 9,8
Phone Coefficient 2.72 2.81
Standard Error 1.98
Percent Vorsipnce 92.0
Mea6..ementis 102o Observed water temperature o
I I I
100
I0D
T-90 z
-r
80 Vm
7060
LAJ0L
z
LAJ
60 'I-
50 L.u
I-C,
40 •
k
0
Observed
Maximum
Minimnum
OCT
24.5
15.0
NOV16.0
6.5
DEC14.0
7.5
JAN FEB MAR15.0 12.0 15.5
4.0 3.0 6,0
APR MAY JUNE
18.5 22.5 28.5
15.0 17.5 24.5
JULY AUG
30.0 30.0
27.0 24.5
SEPT
31 .0
24.0
Figure 85. Oconee River at Internttte Highwac 16 near Dublin,Station 02223600, October 1973 to December 1984.
Georg ia,
87
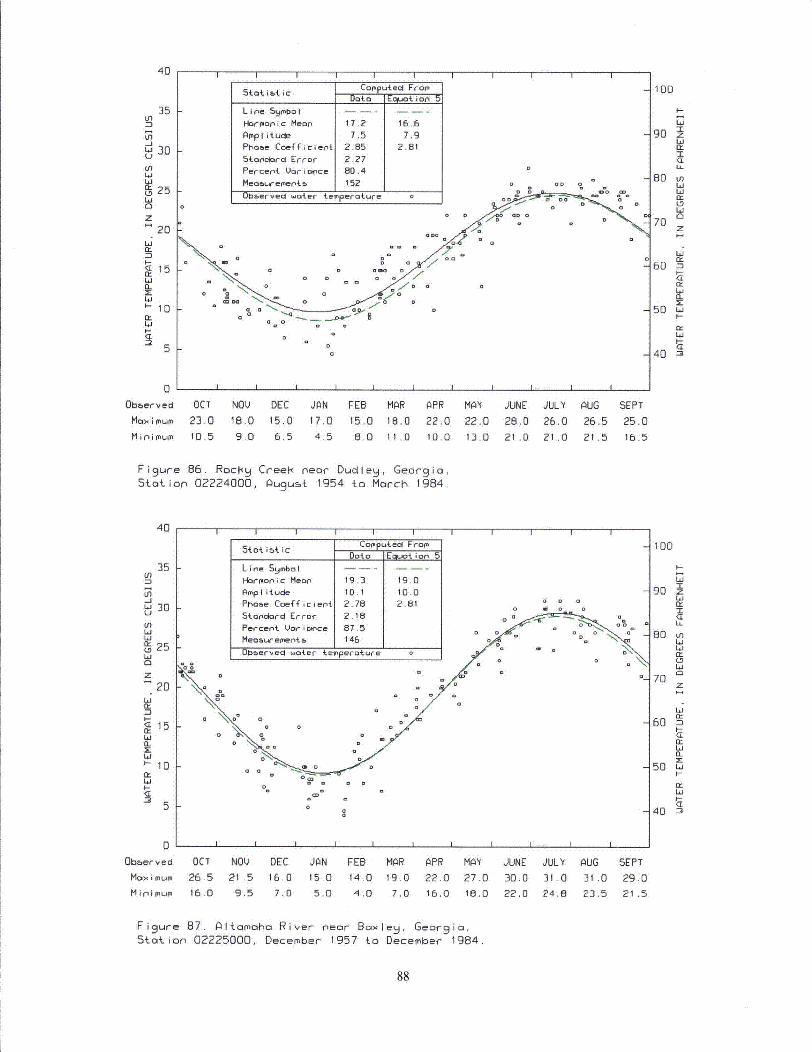
40I I I I I
35 IU")
-J
230UO
25
20IL
z20
IL
I-
-0~
LU
S~a~sti•Comutact FromData Euoatio
Line Symbol
1arpoonic Mean 17.2 16.6Ampl itudle 7.5 7.9
Phame Coefficient 2.85 2.81
5tanc~ord Error 2.27
Percent Varicnce 80.4
k
Meaosuementý 152 o 0 o 0
0b~iervecl wateor teinperature 0
100
Li
90 z
80Li
70 z
60I-
50 Li4-
Li
D
0
Obberved
Max imum
Minimum
OCT NOV DEC JAN FEB MAR
23.0 18,0 15.0 17.0 15.0 18.0
10.5 9.0 6.5 4.5 8.0 11.0
APR MAY JUNE
22.0 22.0 28.0
10.0 13.0 21.0
JULY
26.0
21.0
AUG
26.5
21 .5
SEPT
25.0
16.5
Figure 86. Rocky Creek near Dudleg, Geor g ia,Station 02224000, Auqu5t 1954 {o March 1984.
40
35
100
U 30
nLi ]
25
Li
LiW
<L 1
10
Laz
510
Obaerved
Maximum
Minimum
CE
LILi
U)Laja:10
W
CLMa-
Li
Li
OCT NOV DEC JAN FEB MAR APR MAY JUNE JULY AUG
26.5 21 .5 16.0 15.0 14.0 19.0 22.0 27.0 30.0 31.0 31.016.0 9.5 7.0 5,0 4.0 7.0 16.0 18.0 22.0 24.8 23.5
SEPT
29.0
21 .5
Figure 87. Al{amaha River Pear BaxIeg, Georgia,Station 02225000, December 1957 to December 1984.
88
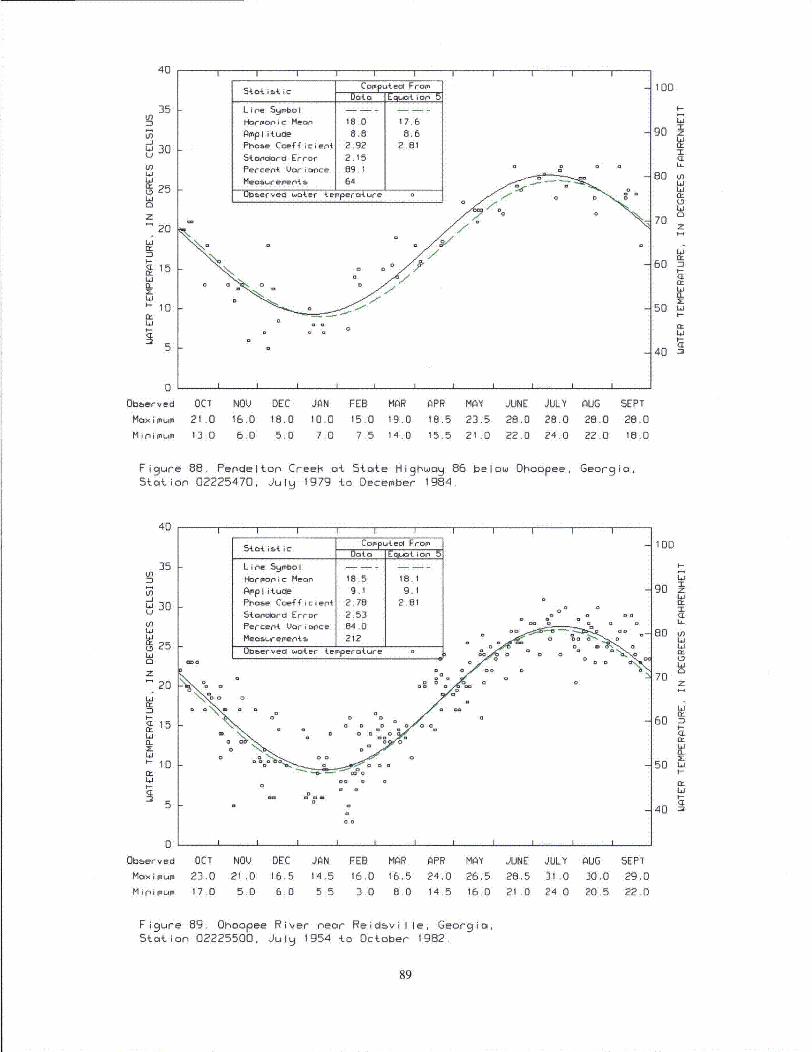
40
3535
30in-3
W 3JoULn
w
Li
20Li
I--
a.i
z
'-10
S I I I i I
Star i~t ic Cofputed Fro(Data Equat or, t5
Line Sq.mbol
Hermonic Mean 18.0 17.6Amplitude 8.8 8.6
Phase Coefficien{ 2.92 2.815tonolord Error 2.15Percent variance 89.1 0 0 0
Meosw.ement& 64
Obaerved water tem'perature
100
I.-
90 zT
80 nL~i
70
60
Cr
50 Li4-
40 •5
0
Obaerved OCTMax imum 21 .0
NOV DEC JAN FEB MAR APR MAY JUNE JULY AUG SEPT
16.0 18.0 10.0 15.0 19.0 18.5 23.5 28.0 28.0 28.0 28.0
Minimum 13.0 6.0 5.0 7.0 7.5 14.0 15.5 21.0 22.0 24.0 22.0 18.0
Figure 88. Pendelton CreeH at State Highwao 86 below Ohoopee, Georgia,Station 02225470, July 1979 to December 1984.
40
35un
-JLiU
Li
0
Li
0
30
25
z
20Li
15Lia_
I-10Li
I I I I I lI III
5tat ist ic Coputeol F or-Data Eogat or, t5
Line Sqynbol . .. . ..
Harronic Mean 18,5 18.1Amplitude 9.1 9,1Phase Coeff cient 2.78 2.81
5tanalord Error 2.53 a a
Percent Variance 84.0 0 a
Meosureement 212
loserved water tepperoture ,a o
w o
o ,,\,• o. o o /o ,
100
I-
90 z
LL
80 InLiLiUaLi
7070
6060 'nI-
50 Li4-
40 •5
0
Observed
Maximum
Minimum
OCT
23,017.0
NOV DEC
21 .0 16.5
5.0 6.0
JAN FEB MAR APR MAY
14.5 16,0 16.5 24.0 26.5
5 5 3.0 8.0 14.5 16.0
JUNE
28.5
21 .0
JULY31.0
24 0
AUG
30.0
20.5
SEPT
29.0
22.0
Figure 89. Ohoopee River near Reidcville, Georgia,Station 02225500, July 1954 to October 1982.
89
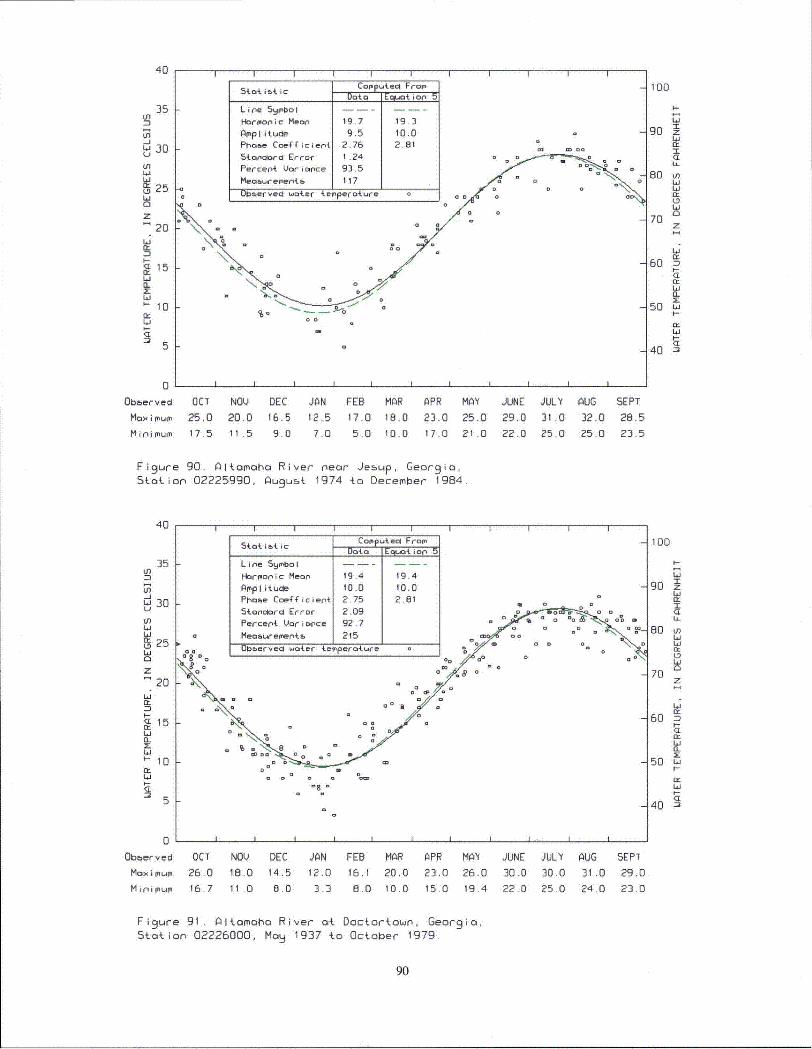
40
Stot iMt c Comp Ieci F of.
Line Syrobol - - --Habrm.onic Mean 19.7 19A~
Amplitudle 9.5 10.0
I I I I !
Ln
S30
S25
z20
15Lia.
~-10
5L
Stoantar Error 1 .24 D
Percent Variance 935i
Meosu.remrA5to 117 ____
0 0baerved water terpero4.ure 0
100
I-
90 zI
60 1/)Li
70z
60 M-1
50 LiI-
Li
40 --
0
Obberved OCT NOV DEC JAN FEB MAR APR MAY JUNE JULY AUG SEPT
Moaxhmum 25.0 20.0
Mini mum 17.5 11.5
16.5
9.0
12.5 17.0 18.0 23.0 25.0 29.0
7.0 5.0 10.0 17.0 21.0 22.0
31.0 32.0 28.5
25.0 25.0 23.5
Figure 90. Altomoho River neor Jesup, Georgio,Station 02225990, August 1974 to December 1984
40
35kU)0
LO3oU
tnLio 25
Li
20
LiEL=-
C 15CLLiELz
'-10
5
I.
Sto i &4 i c Co(putecl From
Dota Eqt ian 5
Line Symbol IHarmonic Mean 19.4 19.4
AmplI itucle I0.0 10.0Phase Coefficient 2.75 2.81
Stoaolord Error 2.09 o ,
Percent Voriance 92.7 0 0 - 00 _
0 Measu.r-ements 215 0o
Observed water temperature 0o 0 0
°- 0 0
S# 8oF -
"\.. o
100
I-
Li.
90 z"I
BD
L9
70z
60 •I-
n-
z50 Li
I--CL
0
Obberved
Maximum
Minimum
OCT
26.0
16.7
NOV18.0
11 .0
DEC JAN14.5 12.0
8.0 3.3
FEB MAR
16,1 20.0
8.0 10.0
APR
23.0
15.0
MAY
26.0
19.4
JUNE
30.0
22.0
JULY AUG30.0 31.0
25,0 24.0
SEPT
29.0
23.0
Figure 91. AItomoha River at Doctortown, Georgia,Station 02226000, MoH 1937 to October 1979.
90
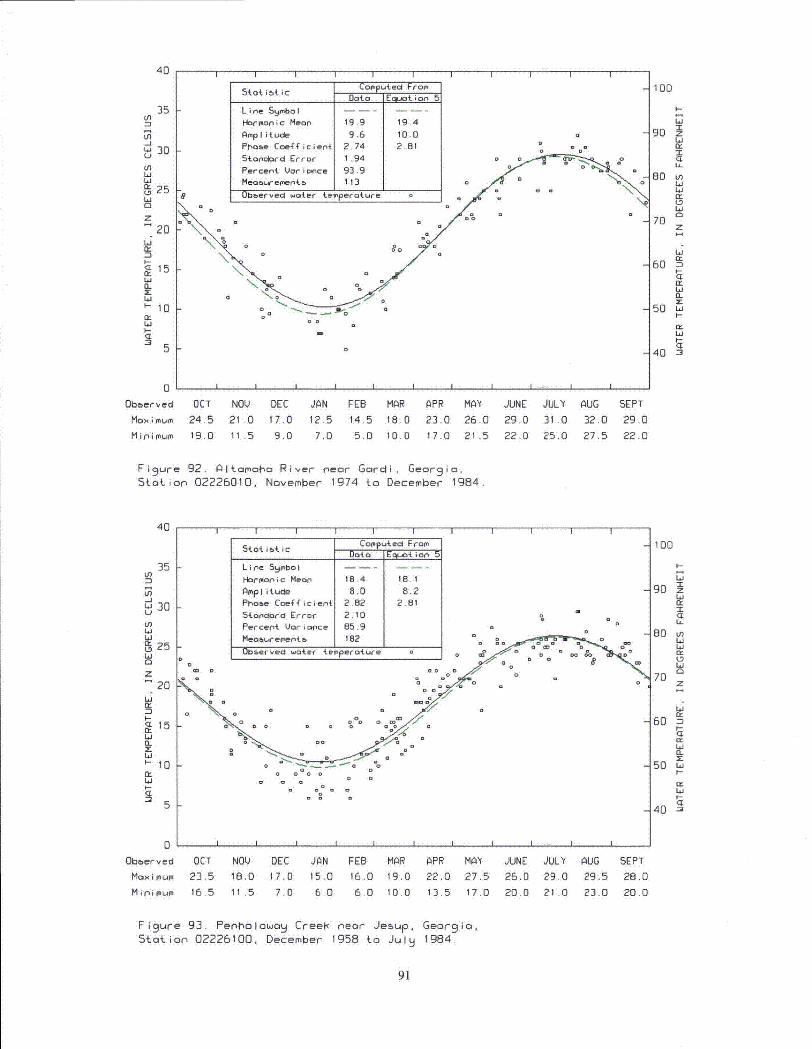
40 I I I I I II I I
st oa i i c Computed FromData Eciyoti on 5
Line Symbol I - -
Haormonic Mean 19.9 19.4Amplitude 9.6 10.0
35 kLn
Li30
Li
S2561
20
Et
LO
Phase Coefficien{ 2.74 2.8154ondard Error I .94 W
Percent Vori ance 93.9Measu~rements- J IIObservecl water tLeperature "
0
O "~0 0 0
0 -/ o9.- o
100
I-
90 Zz
I
80 ULOLi0LJ
70 z
Li
60 S)r-(L
50 Li
40 -0 3
0
Obeerved
Mox;mim
M p i UIm
OCT NOV DEC JAN FEB MAR APR MAY JUNE JULY AUG
24.5 21 .0 17.0 12.5 14 5 18.0 23.0 26.0 29.0 31 .0 32.019.0 11 .5 9.0 7.0 5.0 10.0 17.0 21.5 22.0 25.0 27.5
SEPT
29.0
22.0
Figure 92. Altamaba River near Gcrdli, Georgia,Station 02226010, November 1974 to December 1984.
40
35U)
-J
LO
S25
10Z
S20
I-
L,
-0~
WiSii
I1 I II I
5tao ibt ic Compu~eel FromData Equat io5
Line Symbol
Hormonic Mean 18.4 18.1
Ampl itucle 8.0 8.2Phase Coefficiep{ 2.82 2.815tandlord Error 2.10 0
Percept Vari wce 85.9 0
Measurements. 182
Ubberved water temperature 0 - 0 0
, , ° °° °. 00
0 0m D 0O
Io a% 0 o 0
100
Li90 z
Li
60 kn
70
I-
Cr
60
50
Et
40 aL
L
0
0
Observed
Maximum
Minimum
OCT NOV DEC JAN FEB MAR APR MAY JUNE
23.5 18.0 17,0 15.0 16.0 19.0 22.0 27.5 26.016.5 11.5 7.0 6,0 6.0 10.0 13.5 17.0 20.0
JULY AUG
29.0 29.5
21.0 23.0
SEPT
28.0
20.0
Figure 93. Penholowag Creei. near Jesup, Georgia,Station 02226100, December 1958 to July 1984.
91
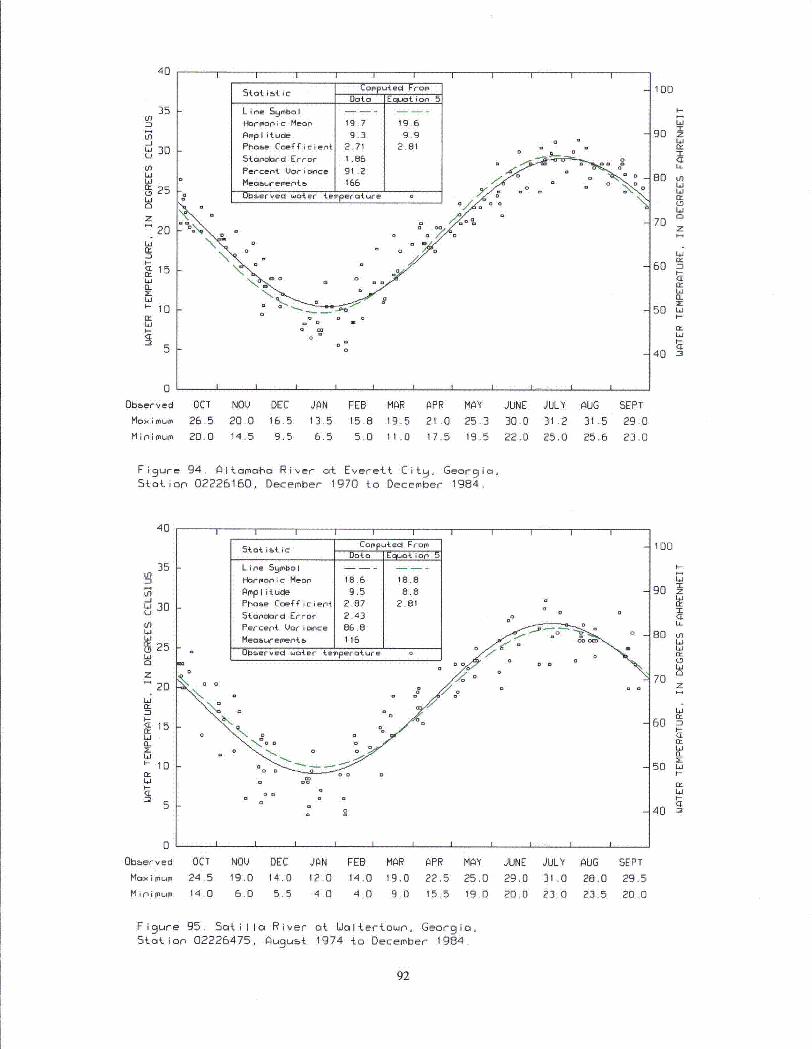
40I I I I I I
5tO&itic Corp-utecFromDoto Ecluotion 5
Line Symbol
Hbrmonic Mean 19.7 19.6Anolitude q. g Iq
I I I I I
35 kCn
U 30(.W6J
• 25Li
0z
S20
w
7-4u
10
5-
15
Phoae Coefficient 2.71 2.81 0
Stonclord Error 1.86
Percent Vori mce 91.2
Meoaoenente 166I ob~erved water terperaoture o
0 0
a =
100
I-
90 z
80 U
70 z
60 -ra-
Lia.
50 wI'-Ert
40
0
Obberved
Maximum
Mini mum
1 I 1 I I I I i
OCT NOV
26.5 20.0
20.0 14,5
DEC JAN16.5 13.5
9.5 6.5
FEB MAR
15.8 19.5
5.0 11.0
APR MAY JUNE JULy AUG
21.0 25.3 30.0 31.2 31.5
17.5 19.5 22.0 25.0 25.6
SEPT
29.0
23.0
Figure 94. Oltamobo River at Everett Cite, Georgio,Station 02226160, December 1970 to December 1984.
40
U)
LO
U)Li
u25Li
20
I-d 15
I-j 10
a5
0a
I II I II5tai~i:CopputecA From
Doto a Equiot bLine Synmboi
H-roonic Meon 18.6 18.8AmplI itue 9.5 8,8Phooe Coefficient 2.87 2.81
Stanolarcl Error 2.43 0 0
Percent Vari oce 86.8
Meaourernent5 116
Obberved water terperature 0 o
NoD oo
o 0 0
0 0
100
90 z
U.
Ir80 ULi
70 z
60
50 L.
4 i-
40 -
0
Obberved
Maximum
Mini mum
OCT
24.5
14.0
NOV DEC JAN FEB MAR19.0 14.0 12.0 14.0 19.0
6.0 5.5 4.0 4.0 9.0
APR M01
22.5 25.0
15.5 19.0
JUNE JULY AUG
29.0 31.0 28.0
20.0 23.0 23.5
SEPT
29.5
20.0
Figure 95. Sotilla River at WUltertown, Georgio,Station 02226475, August 1974 to December 1984.
92
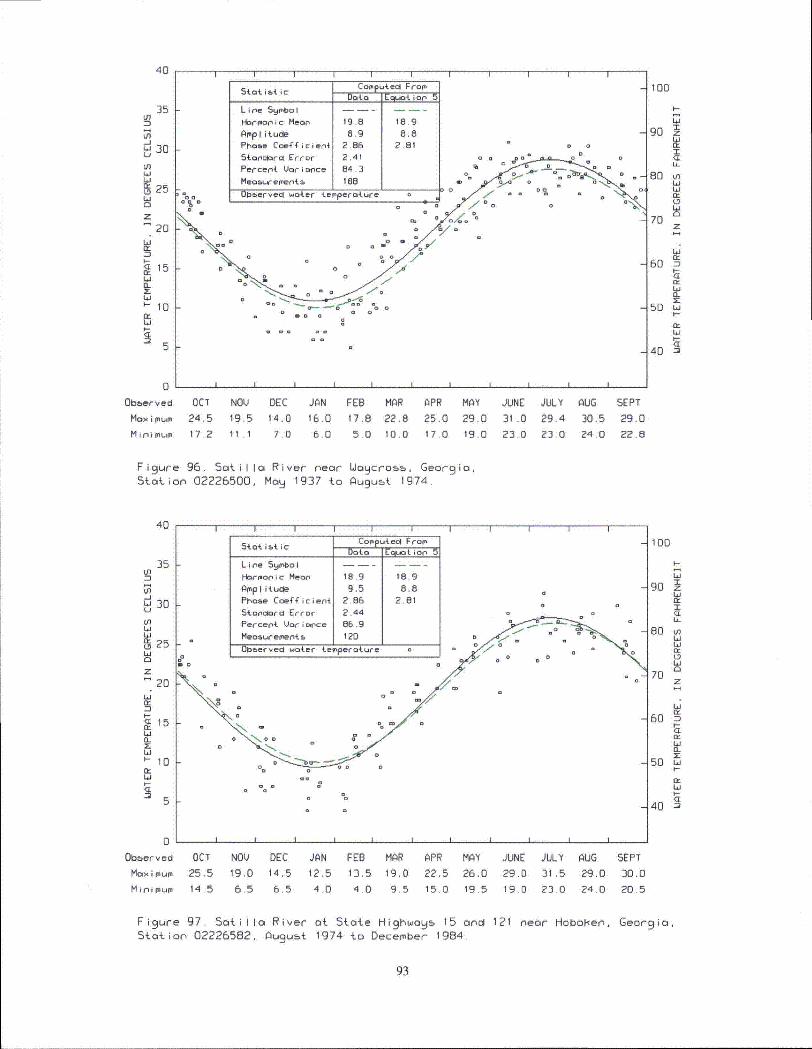
40i i i i i
Stot iet ic Copute FromDatao Eoiuat ion 5
Line SqmbolHarmonic Meon 19.8 18.9
Amplitude 8.9 8.8Phooe Coefficien{ 2.86 2.81
I I I 1 I
Ln
30U
InLJ
N 25
z
20
Li=.a isL~iz41,- 10
a:
5
5-Onciordi Error 2.41 o o -Percent Var ioce 84.3
Meoaireer'ent [ 188 ,,,_______'.00 UOboerved water temperoaure
0 *0 a
100
-90 I
I
LI-
80 tn
70 z
Cr60
50 LiQ-
40 -
0'
Obberved
Maximum
Minimum
OCT
24.517.2
NOV DEC JAN FEB19.5 14.0 16.0 17.8
11.1 7.0 6.0 5.0
MAR
22.8
10.0
APR MAY
25.0 29.017.0 19.0
JUNE JULY
31 .0 29.4
23.0 23.0
AUG
30.5
24.0
SEPT
29.0
22.8
Figure 96. SotilIa River near Woycross, Georgia,Station 02226500, May 1937 to Augurt 1974.
40
35Ln
LJU-tnLa
l 25LiJ
20
210
ij
15a.
10
5
0
Obber ved
Mixi mumMinimum
stot iet ic COPuPtel FroamDotoa EcLot ion5
Line Smbol
Harmonic Meon 18.9 18.9
AmpIitucde 9.5 8.8Phobe Coefficient 2.86 2.815toandcard Error 2.44
Percent Varionce 86.9
Me ur emen4.{ 120
Oboerved water Leinperature 0 0 0
0 0D
100
I-
Li
90 zzT
80 nLi
Li
70 z
CE
60 -r-
50 ,L,I--
40 -•
OCT NOV DEC JAN FEB MAR APR MAY
25.5 19,0 14.5 12.5 13.5 19.0 22.5 26.0
14 5 6.5 6.5 4.0 4 0 9.5 15,0 19.5
JUNE
29.0
19.0
JULY AUG
31.5 29.0
23,0 24,0
SEPT
30.0
20.5
Figure 97. Sotlilla River at State Highways 15 and 121 near Hobolhen. Georgia,Station 02226582, Augubt 1974 to December 1984.
93
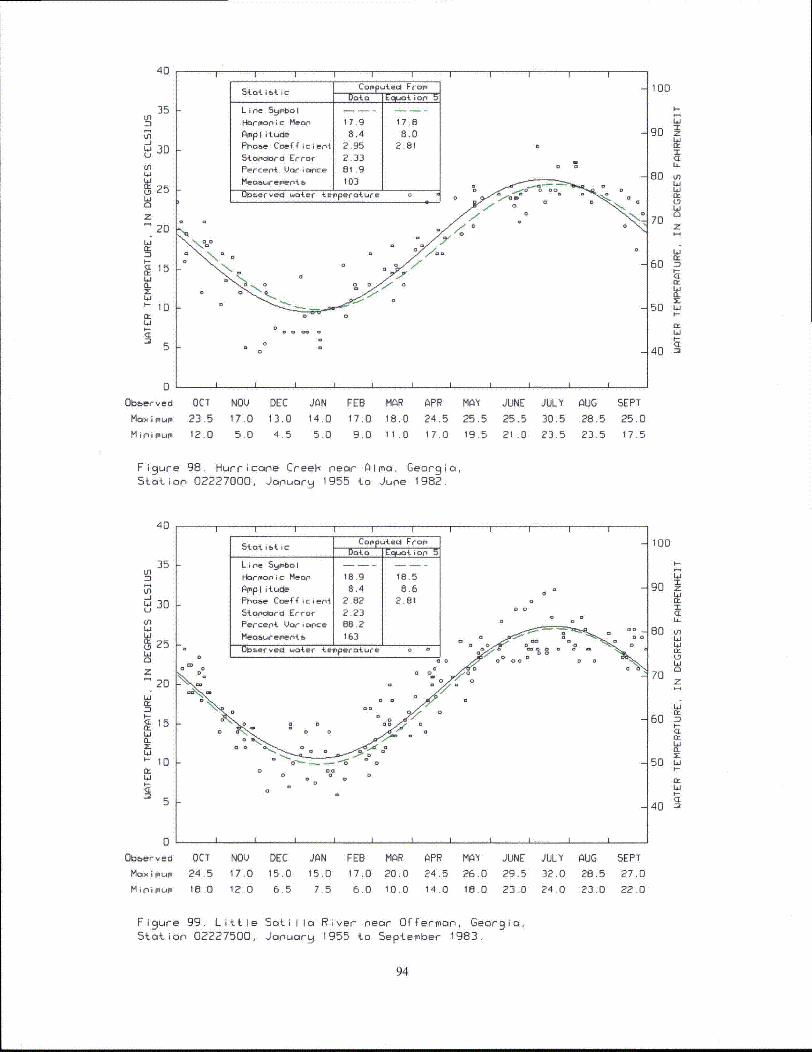
40
35Ln-j-J
w 30U,
LO
N 25Li0
z20
15Li
"10
5
0
i i I i IStat i54o ic Coyp4Aecl From
Dot Q Eef.ot io5
L i ne Symbo I ... ..
Hormonic Mean 17.9 17.8
AmpIlitude 8.4 8.0Phase Coeff"ricie{ 2.95 2.81
StoI'dord Error 2.33
'Na6
I I I I I
Percen't Vari once 81.900Meoo~rementb- 103
Ulobervect water temperatur!I-
0 0. 0.- 0
100
I-
go z•
Li
70z
60 "n
Li
504i
60
50 Li
i i
Obberved
Maximu
M inimnum
OCT
23.512.0
NOV
17.0
5.0
DEC
13.0
4.5
JAN
14.0
5.0
FEB MAR
17.0 18.0
9.0 11.0
APR
24.5
17.0
MAY
25.5
19.5
JUNE JULY AUG
25.5 30.5 28.5
21 .0 23.5 23.5
SEPT
25.0
17.5
Figure 98. Hurricane CreeH neor Alma, Georgia,Station 02227000, January 1955 to June 1982.
40
35UL
_j
U,-J
0LIig
t, 25
Li
0
z10
ri0:
W
C15
I I I I I I I II I
5tot i •t ic C °pp ut ecl Fro.,Data Ecuotiore 5
Lirne 5•mbol I . .. . .
i-rmonoic Mean 18.9 18.5
AmpI itude 8,4 8.6 a
Phoae Coe44•icern 2.82 2.81
Stonciaord Error 2.23 00
Percent Vor¢ oce 88.2
Meou em.erat 5 163
aObberved water teperture o
I I I I I I II , I
100
I-
Li.
90 z
70
z
60 U
Er
50
0n50 Li
0'Ob~erved
Maxgimumo
mi nimum.
OCT NOV DEC JAN FEB MAR APR MAY JUNE
24.5 17.0 15.0 15.0 17.0 20.0 24.5 26.0 29.518.0 12,0 6.5 7 5 6 0 10.0 14.0 18.0 23.0
JULY AUG
32.0 28.5
24.0 23.0
SEPT
27.0
22.0
Figure 99. Little Satille River near Offermon, Georgia,Station 02227500, Januory 1955 to September 1983.
94
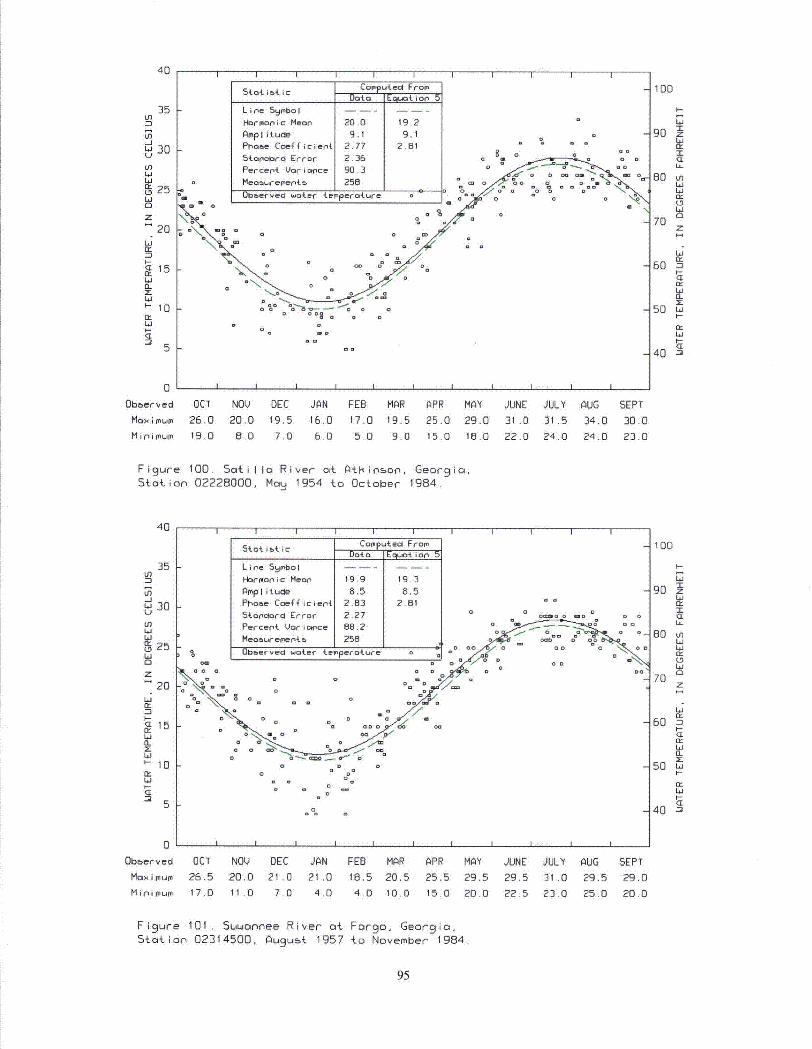
40I I I I I I I I I
U)n6i-JW 30U)
LO
N 25W
20
151
z
Ci
1-
lb
'-10
Li
Stat istic Coppteol FromData Eqo-.L io5
Line Symbol
Horponic Meon 20.0 19.2AmpI ituude 9.1 9.1 o
Phone Coeff{icen{ 2.77 2.81Stoanoord Error 2.36Percent Variance 90.3
0 Measuremnents 5
r owteree o 0
I I I"\N" o 0o 0 D•7 °
100
I-
90 z
CLLI
80 L
70 Z
60 n
5Dw50 L.
40 -•:D
D
Obberved
Maximum
Mini mum
OCT NOV DEC JAN FEB MAR APR MAY JUNE JULY
26.0 20.0 19.5 16.0 17.0 19.5 25.0 29.0 31.0 31.519,0 .0 7.0 6.0 5.0 9.0 15.0 1 .0 22.0 24.0
AUG
34.0
24.0
SEPT
30.0
23.0
Figure 100. Satillo River at Aikinsop, Georgia,Station 02228000, May 1954 to October 1984.
40
35 kLn
-J
W 30U)Li
N 25Li
20z 20
Li
14.
1.0
•- 100:
0
o N
Stat ic Com ftuecl FromData Eqlu{ ot
Line Symbol
Harmonic Mean 19.9 19.3
Amplitudle 8.5 8.5Phase Coefficient 2.83 2.815tandard Error 2.27 , 0
Percent Variance 86.2Meoaeme.entb 258 AObterved water temperature o 0
0 aN. D 0 00
00 0 0 0
00 0 ..- 00I
I I I 1 i I i
100
3:Li
90 z
80 uLj
70W
60 I-
50 Lit-
I-•40
0
Obbervcd
Maximum
Mini mum
OCT NOV
26.5 20.0
17.0 11.0
DEC JAN
21 .0 21 .0
7.0 4.0
FEB MAR
18.5 20.5
4.0 10.0
APR MAY
25.5 29.515.0 20.0
JUNE JULY AUG
29.5 31.0 29.5
22.5 23.0 25.0
SEPT
29.0
20.0
Figure 101. 5uwanoee River at Forgo, Georgio,Station 02314500, August 1957 to November 1984
95
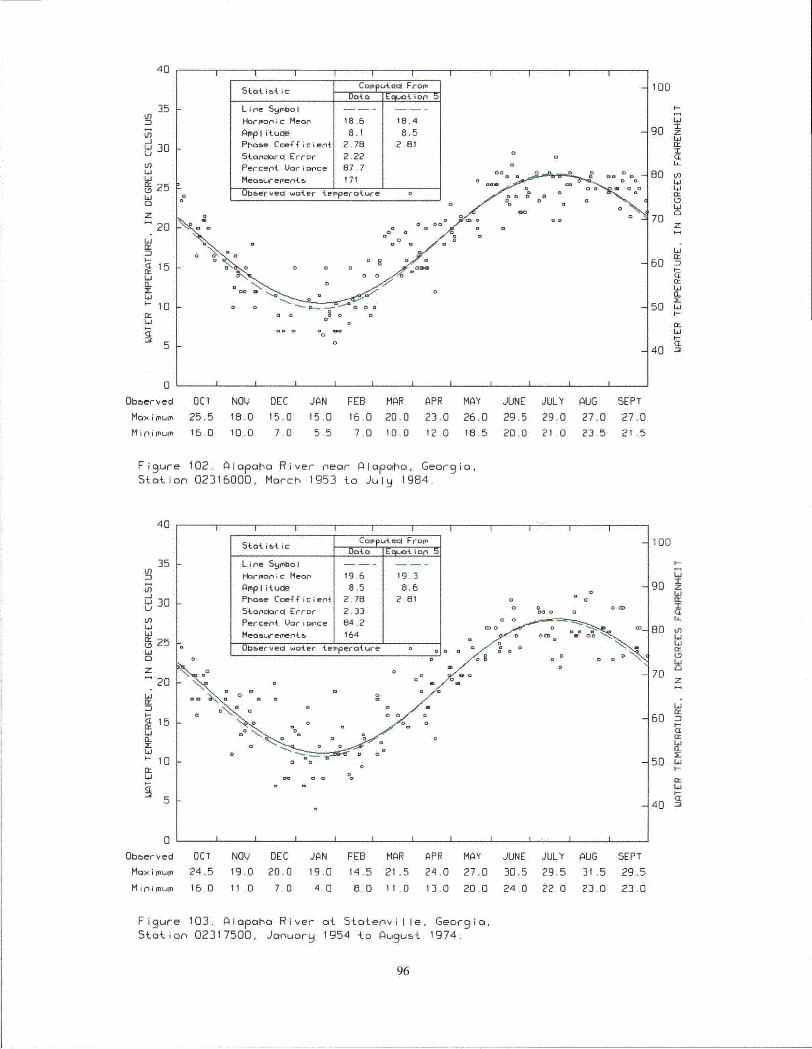
40
35
in
In-J
w30
InLi
25Li,
z20
La
n
Li
z
'-10
5
Sto4. ~ COPP tf4ed Froio
Line Syiobol -- --
Ha~rmonic Mean 18.6 18.4
Arlplitudle- 8.1 8.5Phasse Coefficient 2.78 2.81Stanclard Error 2.22Percent. Variance 87.7Mea~uremr~en.b 171
o 0berved Water teinpei-ature
0 %
100
U-
80in
z
I
80 in40Li
70
60 •
I-t
50 t1-
40 -i
0
Obberved
Maximoum
Miniu
OCT NOV DEC JAN FEB MAR
25,5 18.0 15.0 15.0 16.0 20.016.0 10,0 7.0 5.5 7.0 10.0
APR MAY JUNE JULY AUG
23.0 26.0 29.5 29.0 27.0
12.0 16.5 20.0 21.0 23.5
SEPT
27.0
21.5
Fi 9 ure 102. Alapaha River near Alapaha, Georgia,Station 02316000, March 1953 to July 1984.
40
35 IIn
in-jL 30
U)
La
02W
20L'i
fl.
IJ
15
(L
- 10
Li
S iComutecl Fron5{{ •{i¢Data Eept ion
Line 59mbol ---- -
Hormonic Mean 19.6 19.3Almplitude 8.5 8.6Phsoe Cceficient 2.78 2.81 a
5tonoard Error 2.33 0 0 aPercent Voriance 84.2Meoaurements 164 D o. A
Observed water teinperoture 0 D o a
0 -__0 0
o
100
go
90 zI
U.
70 LJ
70
z
60 -
50 L
40
k-
I-
5 k
0
Obber ved
Maxoimiumo
Minimiumo
OCT NOV DEC JAN FEB MAR
24.5 19.0 20.0 19.0 14.5 21.5
16.0 11,0 7.0 4.0 8.0 11.0
APR MAY JUNE JULY AUG
24.0 27.0 30.5 29.5 31.5
13.0 20.0 24.0 22.0 23.0
SEPT
29.5
23.0
Figure 103. Alopaha River at Stotenville, Georgia,Station 02317500, January 1954 to August 1974.
96
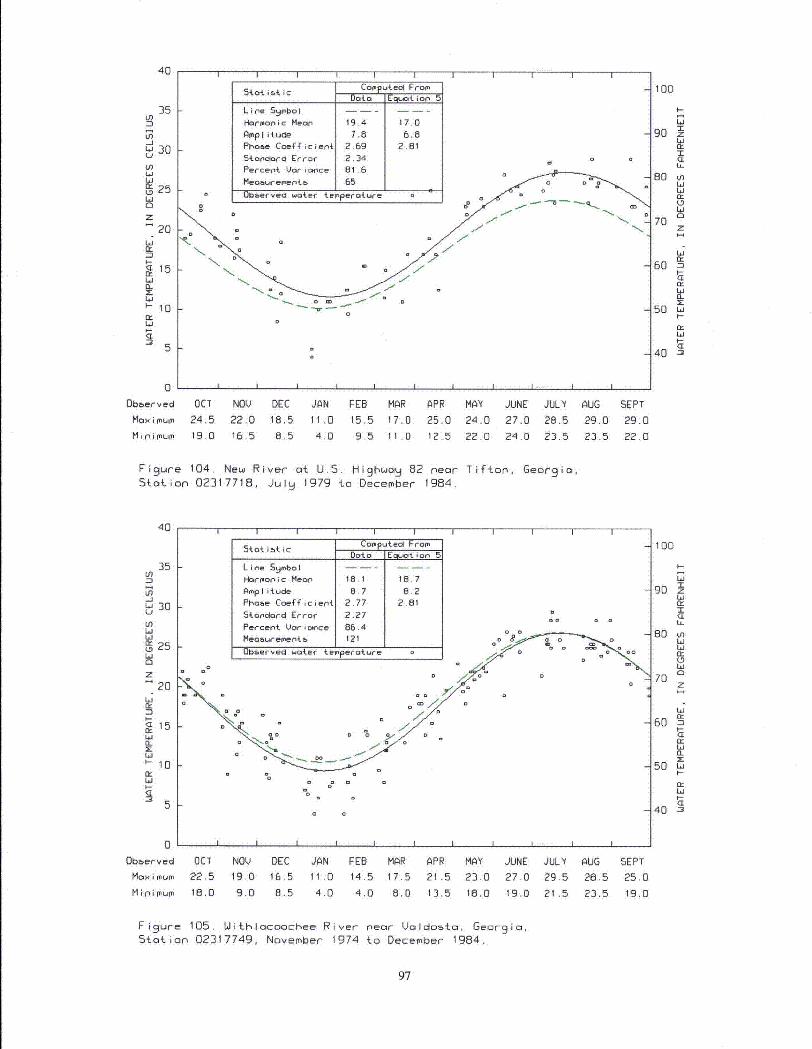
40
35In
Ln
Lo30U)
Li
20Li
z2O 0
ir
Lj
I I I I I II II
St is ic Cof uted FromDotea Eluoti or, 5)
Line Symbol
frlonic Meoa, 19.4 17.0
Amhplitucle 7.8 6.8Phoee Coeff•cien 2.69 2.81
Stan r'ld Error 2.34 a
Percent Uori~oce 81.6
Measurements 65
Ob~ervec! water temperature
I I I I I I I
100
90oI
80 InLii6.1L-
70 z
60
I--
50
40 -Z)
Obberved
Maxixmum
M I n j mumI~
OCT NOU DEC
24.5 22.0 18.5
19.0 16.5 8.5
JAN FEB
11.0 15.5
4.0 9.5
MAR APR MAY JUNE JULY AUG
17.0 25.0 24.0 27.0 28.5 29.0
11.0 12.5 22.0 24.0 23.5 23.5
SEPT
29.0
22.0
Figure 104. New River at U.S. Highwgo 82 nearStation 02317718, Juliq 1979 to December 1984.
Tifton', Georgia,
40
35in-- i-Jw 30U
V)LiLiu 25
20
I-_W<115
•-10
I-
I I II I I I I III
Computeci FromData Evt ion 5
Line Symbol
Hrmonic Mean 18.1 18.7Amplitude 8.7 8.2
Phsoe Coe4ficient 2.77 2.81
Standard Error 2.27
Percent Voriance 86.4
Meoa5urements 121
Observed woter temperature -
I I I I I I I I I
1 00
90z Li
80 S
a_
Li
50
4a
70
60 -nI-
50 Li
D
0
Obberved
maximum
Minimum
OCT NOQ DEC JAN FEB
22.5 19.0 16.5 11.0 14.5
18.0 9.0 8.5 4.0 4.0
MAR APR MAY JUNE JULY AUG
17.5 21.5 23.0 27.0 29.5 28.5
8.0 13.5 18.0 19.0 21.5 23.5
SEPT
25.0
19.0
Figure 105. Withlacoochee River near Uacldoýto, Georgia,Station 02317749, November 1974 to December 1984.
97
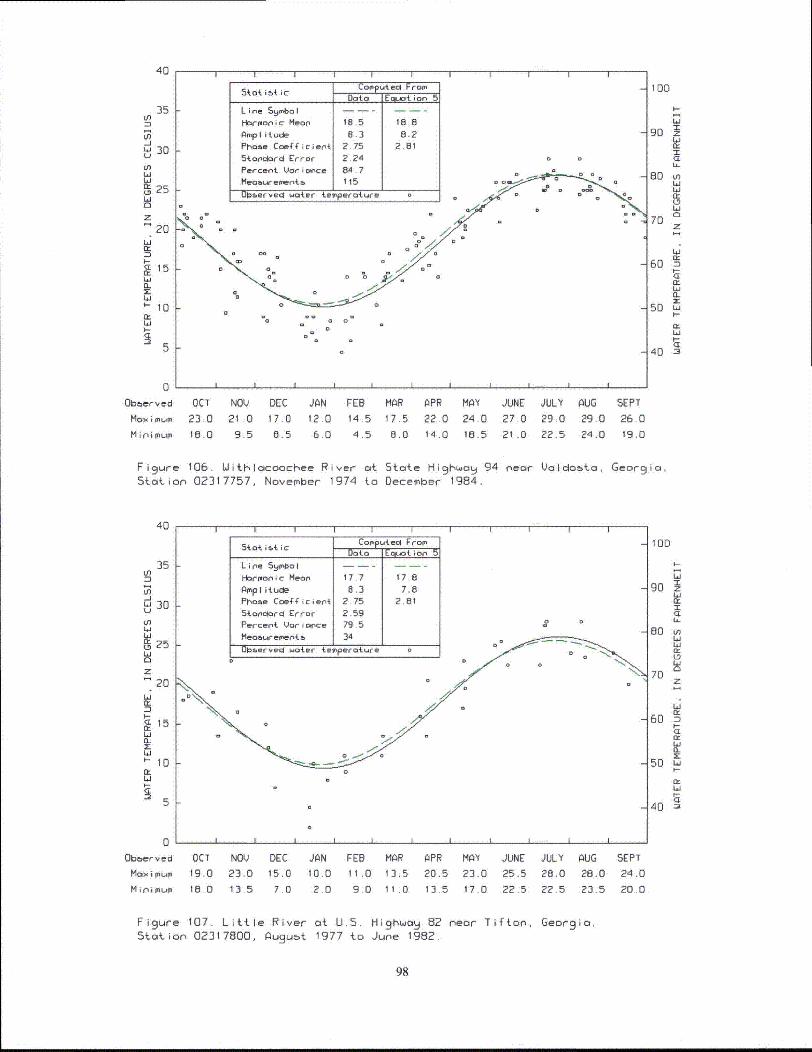
40
F ~.. .~ ~ Computecl From"
I I I I I
35
-J
30
LnLia
w
N 25
LaM
0z
20Li
n
La'- 1
5
0
oXMoib, ,c Data Emuat ion 5
Line Symbol
Horpopic Mean 18.5 18.8
Amplitude 8.3 8.2
Phase Coefficient 2.75 2.81
Stancdard Error 2.24 e a
Percent Vor i once 84.7 D
Meas.remerint, I I5
Otb&ervecl water terperature
10D
I-
La
90 zLaccWT-
80 LnWLaLaccLa
70 z
La60 -c
nI-
n-E
50 -a
40 3
i i i i i i i i i i
0bberved
Maximu
M inifnurn
OCT
23.0
18.0
NOD DEC JAN
21 0 17.0 12.0
9.5 8.5 6.0
FEB
14.5
4,5
MAR APR MAY
17.5 22.0 24.0
5.0 14.0 18.5
JUNE
27.0
21 .D
JULY
29.0
22.5
AUG
29.0
24.0
SEPT
26 019.0
Figure 106. Lithlacoochee River at State Highwag 94 nearStation 02317757, November 1974 to December 1984.
Ualdo~to, Georgia,
40
35
-JL 30U
LnLa
c,250
z20
ccI-
S15
ccLa
10
5
"I
I I I I III
5tao iLt ic Copputect FromData Ekt ion 5
Line Symbol
Harmonic Mean 17.7 17.8
Ampl itude 8.3 7.8
Phoae Coefficient 2.75 2.81
Stanciard Error 2.59Percent Varicnce 79,5 0o
Measuements- 34 ------UOserved water terlperature 0
- o-
I I I I I I I I
100
X
90 z-E
8 n-
70 z
60 "
I£
80 Li
6aLa
4 L-a
0'
Obe~er ved
Maximeum
M i 'i enur
OCT NOY DEC JAN19.0 23.0 15.0 10.0
18.0 13,5 7.0 2.0
FEB MAR
11.0 13.5
9.0 11.0
APR
20.5
13.5
MAY
23.0
17.0
JUNE JULY AUG25.5 28.0 28.0
22.5 22.5 23.5
SEPT
24.0
20.0
Figure 107. Little River at U.S. Highwaq 82 near Tifton,Station 02317800, Augu~t 1977 to June 1982.
Georgia,
98
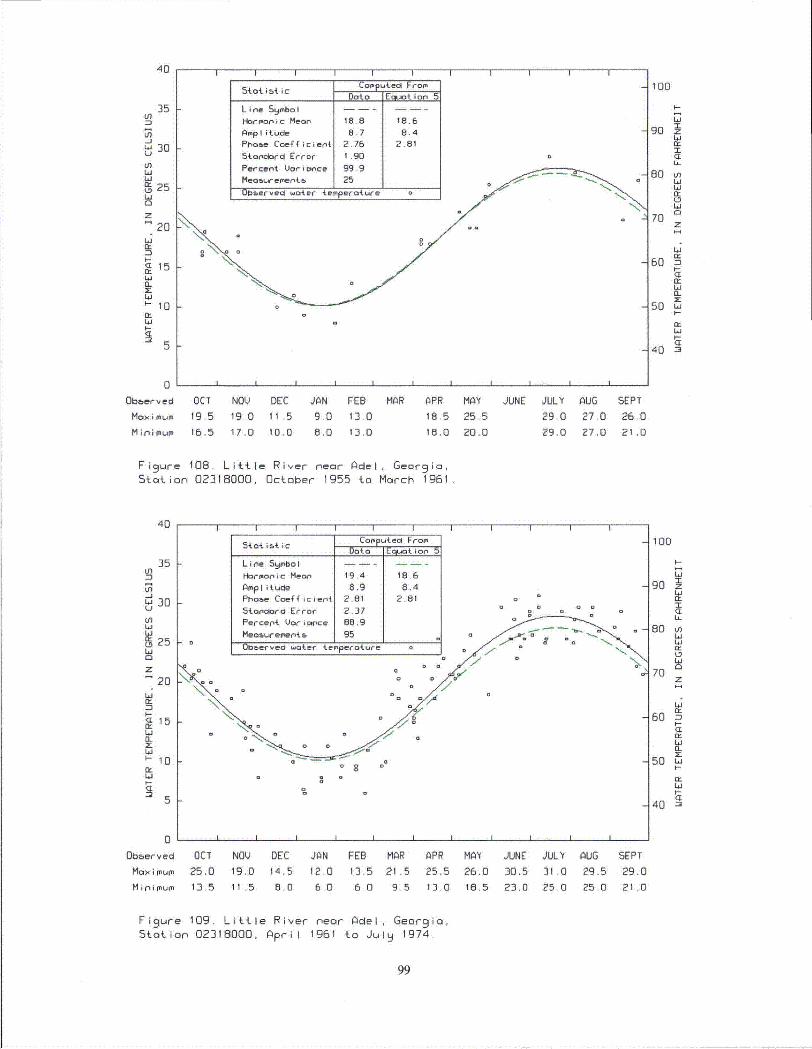
40
35cn
ini-J
30
inLI(L, 25
Lj0
zS20
Lior.
nD-615IL
'-10
LOS-
I
I I I I II I
5tot i5t ic Coop t, c I- FroData lEmiat ion 5
Line S o!-bollHrmonic Mean 18., 18.6Amplitude, 8.7 8.4Phase Coefe icien 2.76 2.815t•rclord Error I .90Percent tloriogmce 99,9
Meoos.,rngent.5 25 1Utbservecl water teIrperature
I
100
i--
Li
90 z
70
80
hi
61
EL
50 z
50 a:
40
D
0
Obberved
Mo>imum
Minimum
OCT NOV DEC JAN FEB
19.5 19 0 11.5 9.0 13.0
16.5 17.0 10.0 6.0 13.0
MAR APR MAYt8.5 25.5
18.0 20.0
JUNE JULY AUG
29.0 27.0
29.0 27.0
SEPT
26.0
21.0
Fi 9 ure 108. Little River Pear Adel, Georgia,Station 02318000, October 1955 to Morch 1961.
40 I I I I I I
Stat i ~ Daia Tcit orueIrg
L i ne at on IHa~rmonic Mean 19.4 18 6
Amnp Iit ude 8.9 8.4
I II I
35 -in
Ln-jw 30UPEnLa
Lo25Li
20
Li
n,
<L15
10
Phoae Coefficient 2.81 2,815tandcard Error 2.37Percent Vari nce 88.9
-Measurem~ents- 9l•berved water terperature o
08 0
100
I-
Li
90 z
U-
70
z
Ir60 n
50
Li
405 .
0
Obberved
maximum
M in0 i mum
I I I I I I I I I I I
OCT NOV DEC JAN FEB MAR APR MAY
25,0 19.0 14.5 12.0 13.5 21.5 25.5 26.013.5 11 5 8.0 6.0 6.0 9.5 13.0 18.5
JUNE JULY AUG
30.5 31.0 29.5
23.0 25.0 25.0
SEPT
29.0
21 .0
Figure 109. Little River near Adel, Georgia,Station 02318000, April 1961 to July 1974.
99
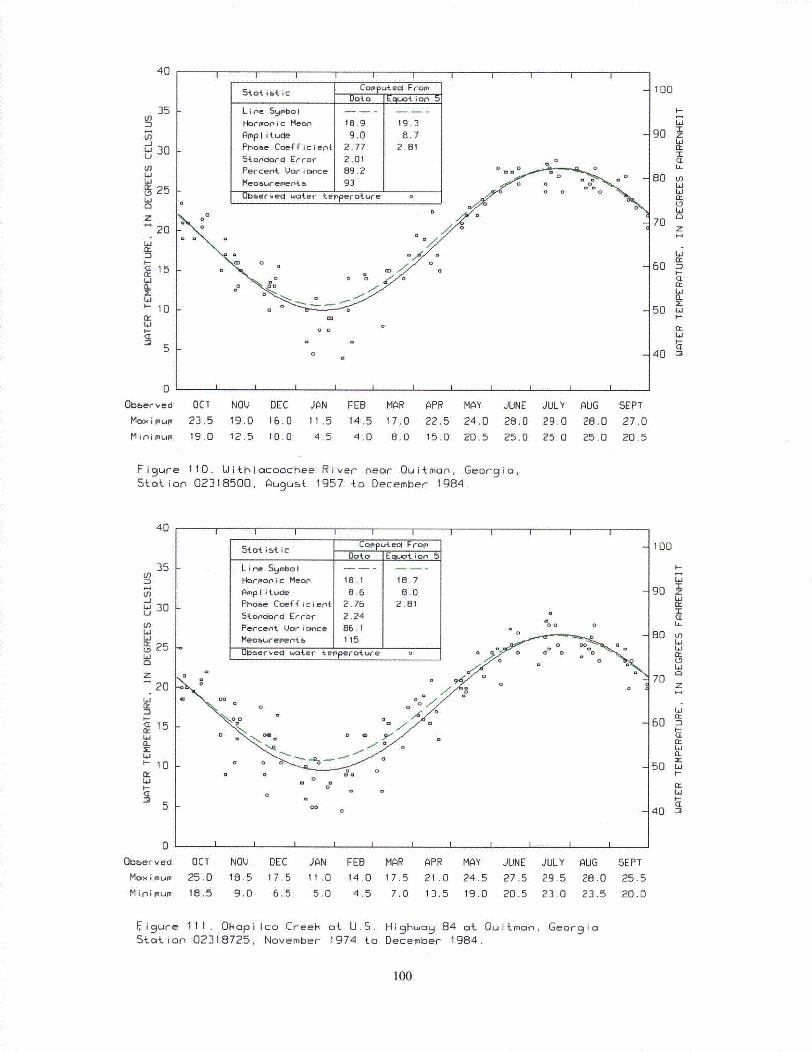
40
35 ILi)
n-jw30
wýu25
Li0
z20
It
D
S15
0-
'-10
5
0
Ob&erved
MaX i (ou,
M i ni lflLIL
I I I I I
54o4. i& ic Copute Fr omData EgLat i on 5
Line S•Fmbol - -Harmonic Mean 18.9 19.3
Applitucie 9.0 8.7Phaoe Coefficient 2.77 2.81
I I I I I
otan lrd trrror 2.01Percent Variance 89.20
Meoawe.rgente 3
I b~er'ved watef 4 .ePperature
I I I I I I D
100
T-
<ELi
90 z•
80 LnLiLi
70 z
Lr
60 "C-
50 Li4 -
40 -•
OCT NOU DEC JAN FEB MAR APR MAY23.5 19,0 16.0 11.5 14,5 17.0 22.5 24.019.0 12.5 10.0 4,5 4.0 8.0 15.0 20.5
JUNE JULY AUG
28.0 29.0 28.0
25.0 25.0 25.0
SEPT
27.0
20.5
Figure 110. Withlocoochee River near Ouitmon, Georgia,Station 02318500, Auqust 1957 to December 1984.
40
35
30
Li)-JLi 30
bl)
' 25Li0
z
20
(LxL-
10
LO1:
I-
I I I I I I I I I I
tot i5tic ECoputed FromData E-Aot ion 5
Line Symbol --- --
Harmonic Mean 18.1 18.7
Amplitude 8.6 8.0Phase Coefficien{ 2.76 2.81Stonolard Error 2,24
Percent Voriic)nce 86.1 00 0
Mea•urement , 115
Observed water temperoture 0 0 0 -
0e
0 m00 0 0 ,
0
100
i-
y070
-r
I
CLI
5DLi
Li
B0
tL70
z
60 -,
40
0
0Obberved
Max mumMi Iii uLI
OCT
25.0
185
NOV DEC JAN FEB MAR APR MAY
1B.5 17.5 11.0 14.0 17.5 21 .0 24.5
9.0 6.5 5.0 4.5 7.0 13.5 19.0
JUNE JULY AUG
27.5 29.5 28.0
20.5 23.0 23.5
SEPT
25.5
20.D
Figure ll1. OHapilco CreeH at U.S. Highwoa 84 at Quitman, GeorgioStation 02318725, November 1974 to December 1984.
100
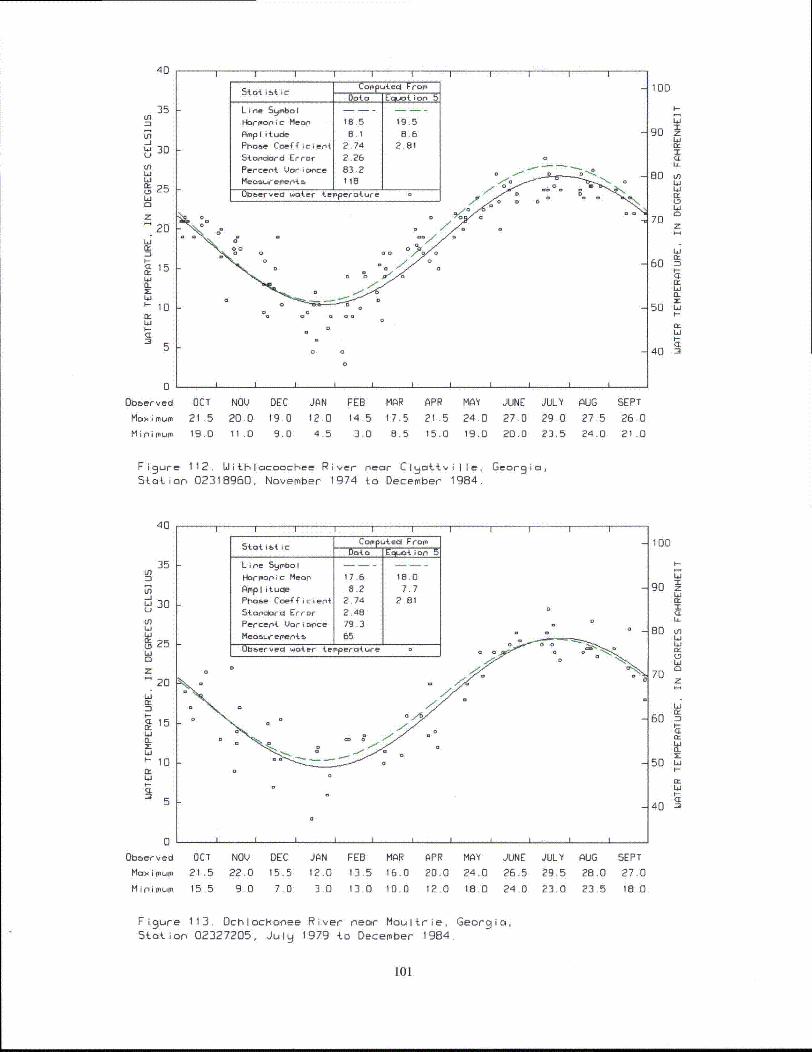
40 40 I I 1 I I I I II I I I I I I I I I I
35in
U.
6jLIJQ
C',
, 25Ld
20
20
a 5
St.o ibt ic Computecl From
Data Ecluot ion 5
L i ne Symbo I
Harmonic Mean 18.5 19.5
Amplitude 8.1 8.6
Phone Coefficient 2.74 2.81
Standard Lrror 2.2
Percent Varicnce 83.Meooa emert, , 118 " ____..
obeervecl water teperoture
a
100
i-.
90 z
80 unL-
LI
70z
60 nCEa:LIWa-
50 L
40 M
0
0bberved
Mox'imum
Mi nimum
OCT NOQ DEC JAN FEB MAR APR MAY JUNE JULY
21.5 20.0 19.0 12.0 14,5 17.5 21 .5 24.0 27.0 29 019.0 11 .0 9.0 4.5 3.0 8.5 15.0 19.0 20.0 23.5
AUG
27.5
24.0
SEPT
26 0
21.0
Fi 9 ure 112. Withlocoochee River near Cljattville, Georgio,Station 02318960, November 1974 to December 1984.
40
35Un-1
-J
30
LI
25cL
20z20
a-
X
10LI
5tat it ic COputecl From
Dote E ior, n5
Line Syambol --l--
Harmonic Mean 17.6 18.0
AMpI itude 8.2 7.7
Pha&e Coefficient 2.74 2.81
5tanolord Error 2.48 0
Percent Variance 79.3
M e as u r e m e n t b - 6 5 0
Ob~erved water terperature o
aeour
0
100
90 z
U-r
80 t
70 z
60 3.LI-.-
40 n5
0Obberved
Maximum
Minimum
OCT NOV
21.5 22.0
155 9.0
DEC15.5
7.0
JAN FEB MAR APR MAY JUNE JULY AUG12.0 13.5 16.0 20.0 24.0 26.5 29.5 28.0
3.0 13 0 10.0 12.0 11.0 24 0 23.0 23.5
SEPT
27.0
18.0
Figure 113. 0chlockonee River near Moultrie, Georgia,Station 02327205, Julq 1979 to December 1984.
101
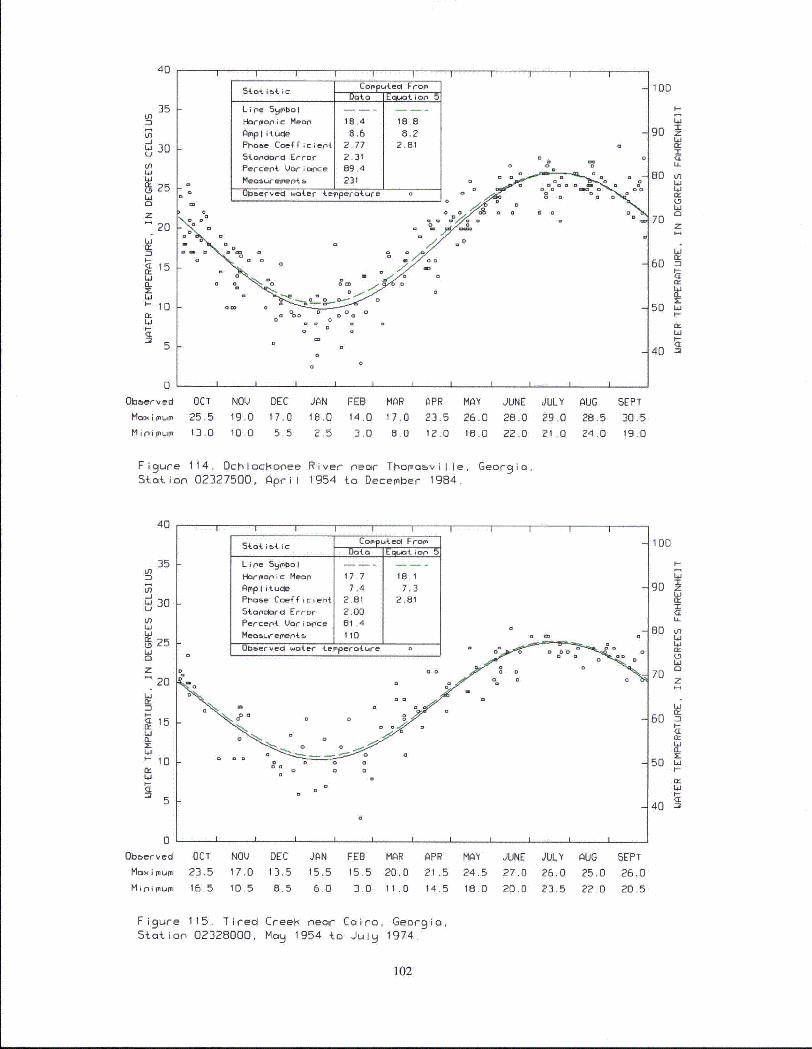
40
3535Ln
in
30
S25Li
20
15
La.
'-10
5
0Obberved
Maximu
Minpimu
I I I
Co t dec From'
Line SymbolHarm~onic Mean~ 18.4 18.8
Atmplitude 8.6 8.2
Ptase Coeff i ciien 2,77 2.81a
Staoar~clr Error 2.31
Percent Vori wce 89.4
Meo~urement'4 231
0b~ervecd water temperature o
-90
-80 in
=70 rz
-60CE
50 U.
L4
70 "
100
OCT NOV DEC
25.5 19,0 17.013.0 10.0 5.5
JAN FEB MAR18.0 14.0 17.0
2.5 3.0 8.0
APR MAY
23.5 26.012.0 18.0
JUNE
28.0
22.0
JULY
29.0
21 .0
AUG
28.524,0
SEPT
30.5
19.0
Figure 114. OchlocKopee River rear Thomasville, Georgia,Station 02327500, April 1954 to December 1984.
40
in0in
U 30
inLI
L 25La0
z
20Li
M
CL15
-10
La
5.
I I I I I II
St.t isA ic Computeco FromDota Equation 5
Line Symbol ---- -
Harmonic Mean 17.7 18.1
AmpIitude 7,4 7.3Phoe Cef•"Ficient 2.81 2.81
5tanwrdc Error 2.00Percent Uaor arce 81.4
Meoswremenrt 110
Oboerved water temperature
I 4 a 0
a
100
90 zz
L..
70
LaI--
50 L.4-
CL
40
0
Obbcrvcd
Max imium
MinimiIumo
OCT NOV DEC JAN FEB MAR
23.5 17.0 13.5 15.5 15.5 20.0
16.5 10.5 8.5 6.0 3.0 11.0
APR MAY JUNE JULY AUG SEPT
21.5 24.5 27.0 26.0 25.0 26.0
14.5 16.0 20.0 23.5 22.0 20.5
Figure 115. Tired CreeH near Cairo, Georgia,Station 02328000, May 1954 to July 1974.
102
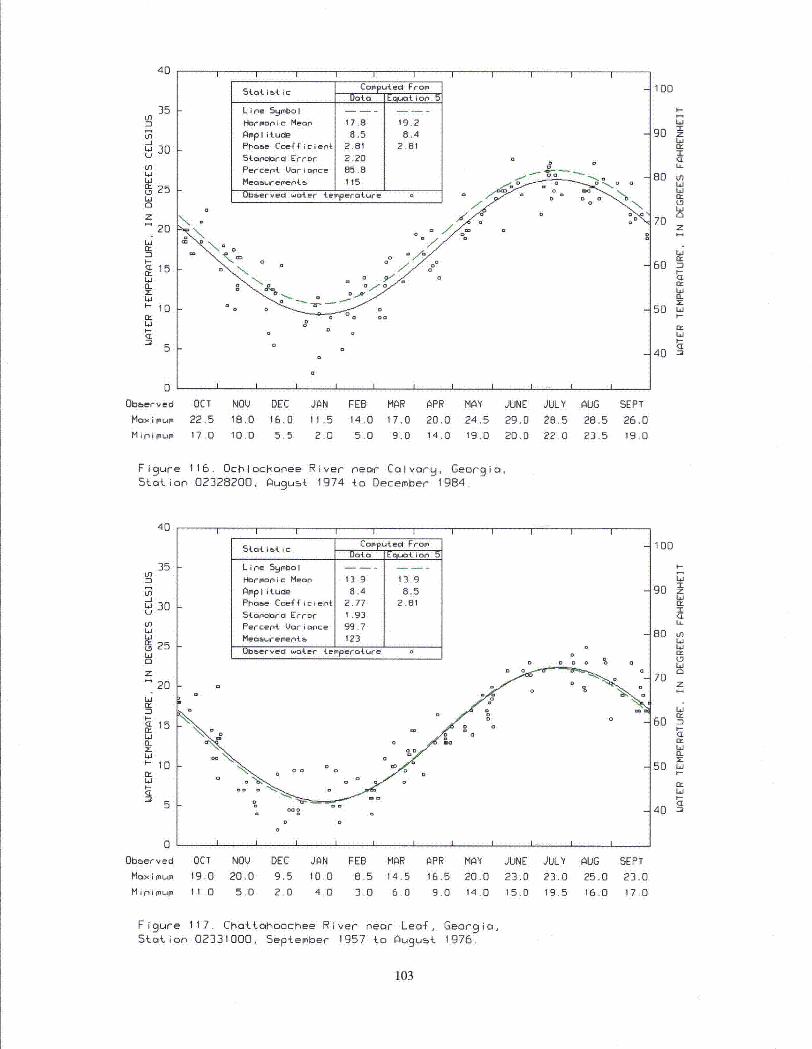
40
Ln0
ýi-j
Lj30
En
025Li0
z
20Li
ci15
'-10
LIC
40 I I I I I
S____________ Comp u ec1 From
Data Eo.o4 ior 5Line Symbol
FlHron ic Mearn 17.8 19.2
Amplitucle 8.5 8.4
Phoae Ce fficien{ 2.81 2.81
I I I I I
ob~ervec1 wo te-r te rperature
I'sA '
I I I I I I I0I-
100
T-
90 z
Ihi
80 V-)Li
70 z
fi
60
,I-
50 Li4-
40 "2D
00bberved
Max imum
Mini mum
OCT NOQ DEC JAN FEB MAR APR MAY
22.5 18.0 16.0 11.5 14.0 17.0 20.0 24.517.0 10.0 5.5 2.0 5.0 9.0 14.0 19.0
JUNE JULY AUG
29.0 28.5 28.5
20.0 22.0 23.5
SEPT
26.019.0
Figure 116. Ochloc4ionee River near Colvarg, Georgia,Station 02328200, Auqust 1974 to December 1984,
40
35
Ln-j
Li O
W30U
tn
25Li0
151
z20
Lin,
(3-
'- 10Li
I I I I I I I I
Stat ist ic Computeol Fror-Data EaaIot ion 5
Line Srno I
Harmonic Mean 13.9 13.9Amplitucle 8.4 8.5
Phaoe Coefficien{ 2.77 2.81
54.onolarcl Error 1.93
Percent Variance 99.7
Meaorement5- 123
Observed woater temperature o 0
I I I I I
100
T-Li
90 z
70zI-
0n70
50 2S
50 Li
Z)
0Oboerved
Mao i mum
M in i mum
OCT NOQ DEC JAN FEB MAR APR MAY JUNE JULY
19.0 20.0 9.5 10.0 8.5 14.5 16.5 20.0 23.0 23.0
11.0 5.0 2.0 4.0 3.0 6.0 9.0 14.0 15.0 19.5
AUG
25.0
16.0
SEPT
23.0
17.0
Figure 117, Chattahoochee River near Leaf, Georgia,Station 02331000, September 1957 to August 1976.
103
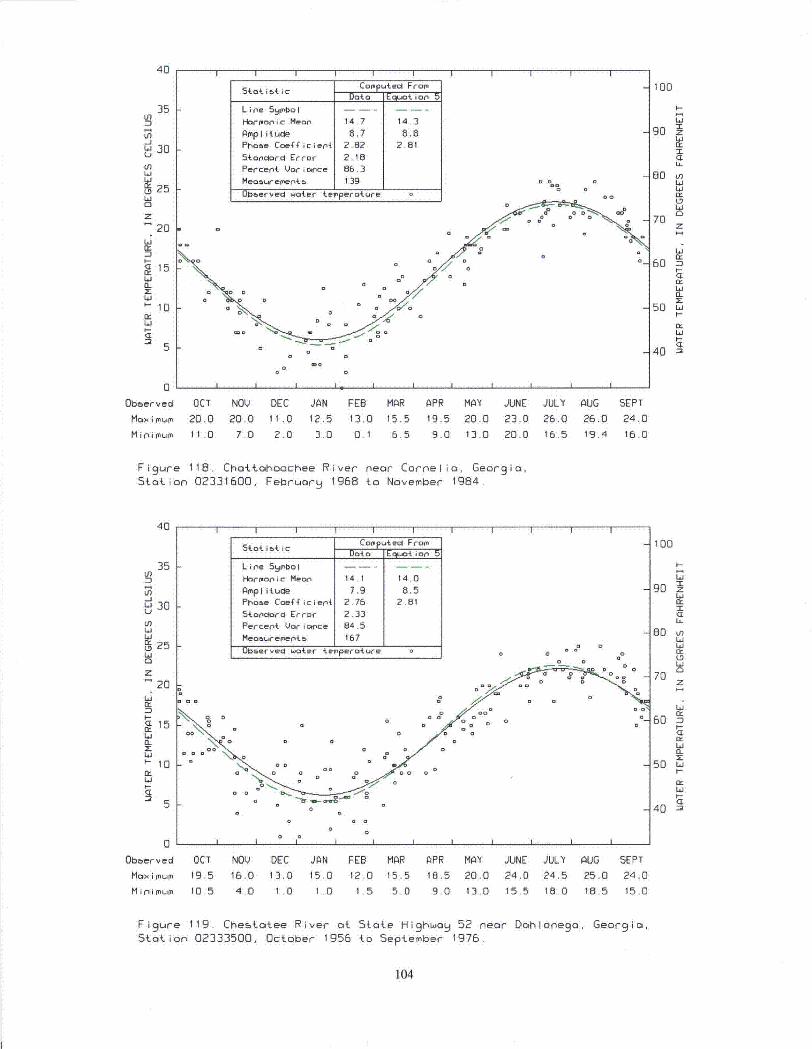
40
35In
U)-1i 30
La
L,25La
20
.15z20
W
L.
n,I-
I II I I II II
5oL i&t i c COPPuted FromData Eqluot i o
Line 5ymbol
Harmonic Mean 14.7 14.3
Amplitude 8.7 8.8Phase Coef•icien{ 2.82 2.81
5tonciora Error 2.18
Percent Uor i nce 86.3
Meoaurementv,_ 139 0 0 0
ObUervecl water temperature o 0
D 0a%. 0 .0 ~0
100
LL.
80 nL
-r
70
60n
a-i
50 LaI-
LaI-
40 mj
0Obberved OCT NOV DEC
Maximum 20.0 20.0 li.0
JAN FEB MAR APR MAY JUNE JULY
12.5 13.0 15.5 19.5 20.0 23.0 26.0AUG SEPT
26.0 24.0
19.4 16.0Minimum 11.0 7.0 2.0 3.0 0.1 6.5 9.0 13.0 20.0 16.5
Figure 118. Chottahoochee River near Cornelia, Georgio,Station 02331600, February 1968 to November 1984.
40
35 [Un
-JL 30
In
0250
20La
a-WMI-
15a_
'-10a-
I I I I I I I I I
Statiti . Comuted Fro-Data E.*. ion- 5
Line Symbol
Harmonic Mean 14.1 14.0
Amplitude 7.9 8.5Phooe Coef icieni 2.76 2.81
5tondard Error 2.33
Percent Vorance 84.5MeaQ5(emento 167Obaerved woter temperature 0 0 0 0 00
. 00 0 0
a 0 0 0 0 0
100
I--
90 z
I
80 wLa
70z
60-
I--
n-
La
50
40 La
5
0Obberved
Maximum
Minimum
OCT NOV DEC JAN FEB MAR APR MAY JUNE JULY19.5 16.0 13.0 15.0 12.0 15.5 18.5 20.0 24.0 24.5
10.5 4.0 1 .0 I.0 1 5 5.0 9.0 13.0 15.5 18.0
AUG25.0
18.5
SEPT
24.0
15.0
Figure 119. Chestatee River at State Highway 52 near Dahlonego, Georgia,Station 02333500, October 1956 to September 1976.
104
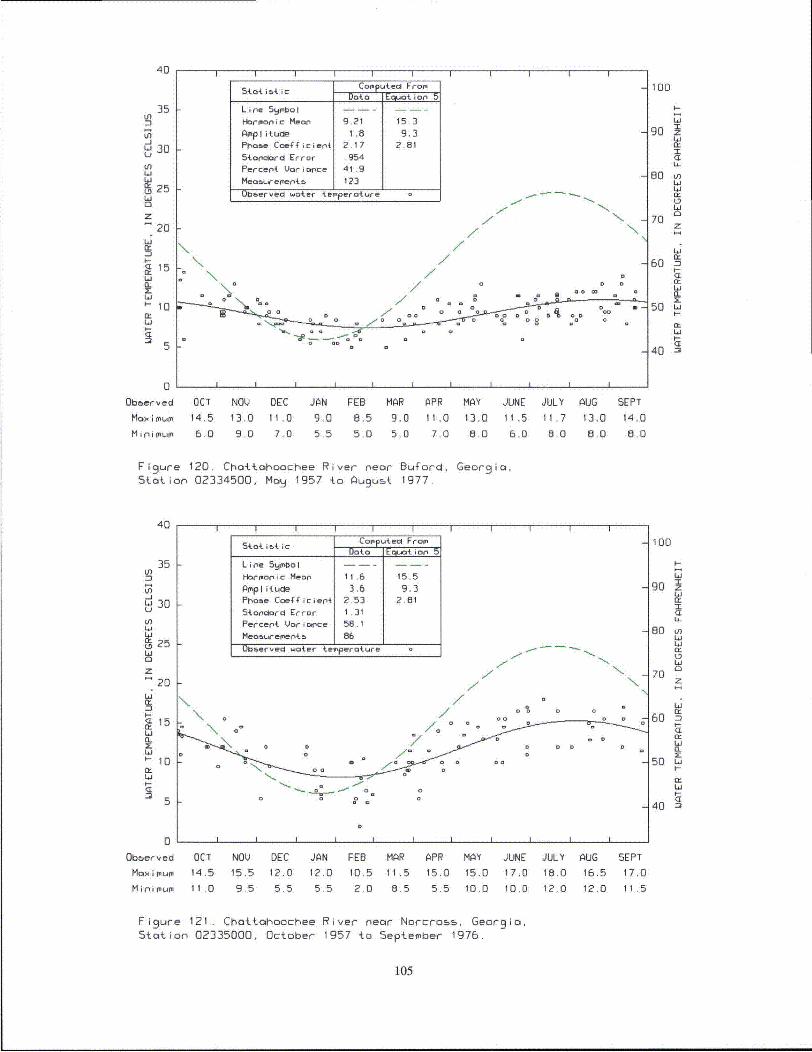
40
35 -In
Ln
_j
LI,L~j
LD25Li
20
Li
S15CL
10
5
0
stat e'ti C Dta EuotiaZi75
Line SymbolHorg'oIic mean 9.21 15.3
Aoplituae 1.8 9.3Pr~ose Coefficient 2.17 2.81
Storciordi Error .954
P'ercent. Vari wce 41.9
Meoaremoent5 123
Utmerved water ter'pero4.ure
x ND D
o /K /- ° \/ 0
I I I I I
100
I-
90 z
80(
70 z
60 na2:
50 wI-
Lii
41 -"
Obberved OCT NOV DEC JAN FEB MAR APR MAY JUNE JULY AUG SEPT
Maximum 14.5 13.0 11.0 9.0 8.5 9.0 11.0 13.0 11.5 11,7 13,0 14.0
Minimum 6.0 9.0 7.0 5.5 5.0 5.0 7.0 8.0 5.0 6.0 8.0 6.0
Figure 120. Chattahoochee River near Buford, Georgia,Station 02334500, May 1957 to Auguw4. 1977.
40
35LI)
Ln
0 25Li0
20
15
IL
10
Lij- 10
I I I I I I I I
Stat ist ic C°opputect Froin
Doto Euti ion 5
Line Symbo I
Harponic Meon 11.6 15.5
AmppI itucle 3.6 9.3Phooe Coefficient 2.53 2.81
5tonrdord Error 1 .31Percent Vari nce 58.1
Meosurementa 86
Obeerved o•oef rteperature o -
/ 0
/ 0S/0
D
100
1-
90 z
LI
80 Ifl
70z
Lit60
I-
50 w.i-
40 -5
0
0bt~er ved
Maximu
Minimumo
OCT NOV DEC14.5 15.5 12.0
11.0 9.5 5.5
JAN FEB MAR APR MAY JUNE12.0 10.5 11.5 15.0 15.0 17.0
5 5 2.0 8.5 5.5 10.0 10.0
JULY AUG18.0 16.5
12.0 12.0
SEPT
17.0
11 .5
Figure 121. Chattahoochee River near Norcross, Georgia,Station 02335000, October 1957 to September 1976.
105
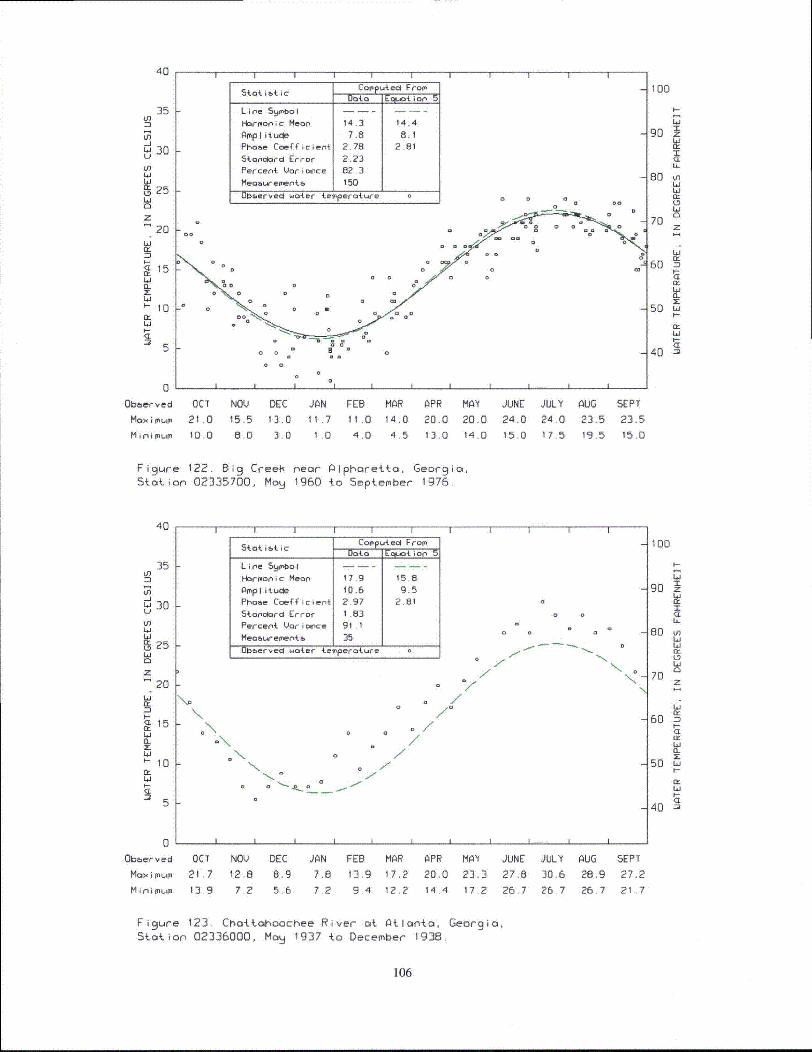
40I I I I
5a _____.______ _ Co__ u _e_ FromData Equ4. io5
I I I I I
35
-J
30
U
ciW
0z
20Wa:Z)
15EL
10
5
0Obberved
Maximum
Minimum
L i ne Sqfrbo I - - - -
Horroar'ic Mean 14.3 14.4
AmpI itucle 7.8 8.1Phsoe Coefficient 2.7B 2.81
5tonelord Error 2.23
Percent Vorionce 82.3
Meosuremerlt& 150
UOlefvecd water te'perature 0
0
00
00
o I I I
%o 0 '0 0
0 0 o
0 o
100
90 zzILL
80 Lnhihi
70
hi-a:
60 D3
50 hi
40 --
OCT
21 .010.0
NO() DEC JAN FEB
15.5 13.0 11.7 11.0
O8O 3.0 1.0 4,0
MAR APR MAY
14.0 20.0 20.0
4.5 13.0 14.0
JUNE JULY
24.0 24.015.0 17.5
AUG
23.519.5
SEPT
23.515.0
Fi 9 ure 122. Bi 9 Creeli near Alpharetta, Georgia,Station 02335700, Maq 1960 to September 1976.
40
35
In:3
L_ 25I 10
hi
~ 5
0
LiIL
15
0~
Obberved
Maximum
M i ni um
I I I I I I I I I
Sotaistic Cotputed FraomData E ption 5
Line 59bot
Hormaonic Mean 17.9 15.8Amplitude 10.6 9.5Phoae Coefficient 2.97 2.81 0
Staroclard Error 1.83 0 0
Percent UVari ance 91.1Mea~ue~e•{ a 35 o
Measurements 3 -Uoberved w.ater terperoture 0
0 0
o /70 0 '".%0o
I
100
90 zz
60
80 Lihi
70z
60)
50 hi'I--
40 •
OCT
21.7
13.9
NOL) DEC
12,8 8.9
7.2 5.6
JAN FEB MAR APR MAY JUNE JULY AUG
7.8 13.9 17.2 20.0 23.3 27.8 30.6 28.9
7 2 9 4 12.2 14.4 17 2 26.7 26.7 26.7
SEPT
27.2
21 7
Figure 123. Chattahoochee River at Atlanta, Georgia,Station 02336000, Maq 1937 to December 1938.
106
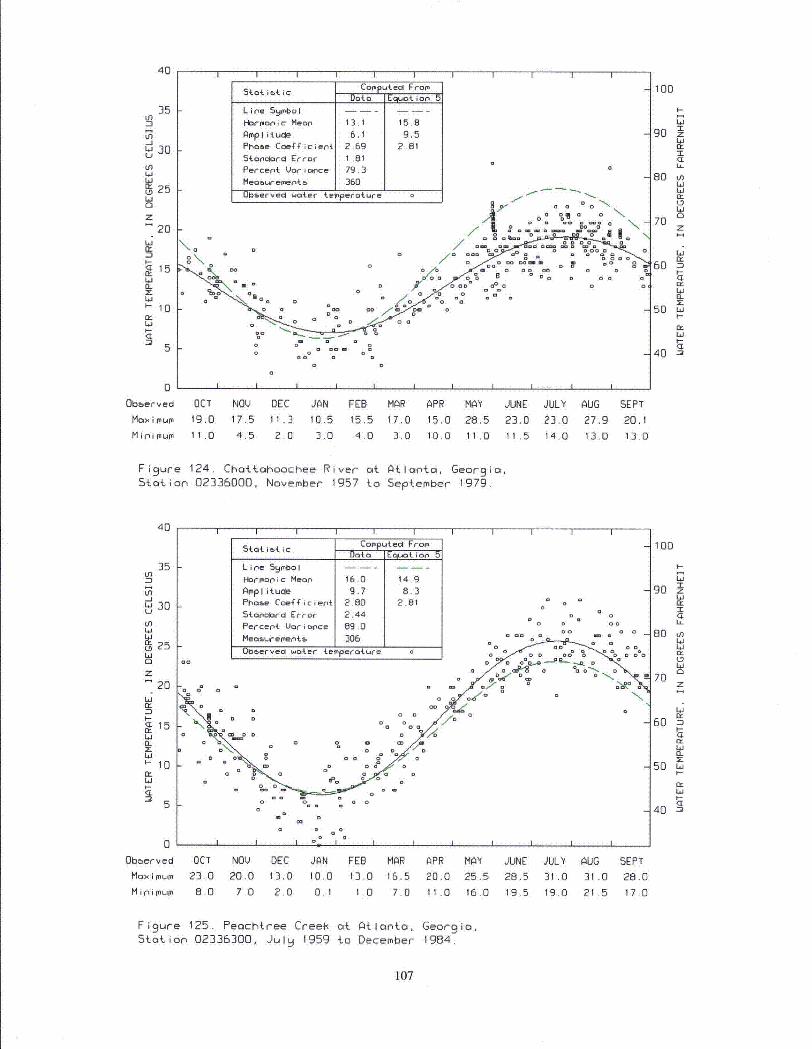
40
35 ktn
cn
Li0z20
Li
15a.
'-100:
I I I I I I
SttiticData E tin
Line 5mboIol
Harmonic Mean 13.1 15.8
Amplitucle 6.1 g.5Phase Coefficient 2.69 2.81
Stan•dord Error 1.81
Percent Variance 79.3
Meou-rernent5 360
I I I I I
k-
- 01ýervedl water temnperature -
A,~ a;'~
I I I I I Ia
100
I--
"i
90 zI<E
80 LnLi
L'i
70 Z
rr'60I-
50 L
Li
40 a3
0Obberved
Min i mumM ni mum
OCT NOV DEC JAN FEB MAR APR MAY JUNE JULY AUG19.0 17.5 I1 .3 10.5 15.5 17.0 15.0 28.5 23.0 23.0 27.911.0 4.5 2.0 3.0 4.0 3.0 10.0 11 .0 11 .5 14.0 13.0
SEPT
20.1
13.0
Figure 124. Chattahoochee River at Atlanta, Georgio,Station 02336000, November 1957 to September 1979.
40
35Ln
U)-V
L525Li0
z20
6icrI-
<L 15MccCL
LO'-10Mc
I I I I II I I I I I
Stat ist ic Co utecl FromD.te2EPlr4.t ion 5
L i ne 5ymbo I
Harmonic Mean 16.0 14.9
Amplitude 9.7 8.3Phase Coefficien{ 2.80 2.81
StanLoard Error 2.44 a o
Percent Voricnce 89.0 oo
Meosurements- 306 oOb•erved ater teinperat-re o - a a
oI.
m~~ Z 'o
p,,,,,
o
100
1"O
90 zH
z
I
80 iLiL-
Ex
70 z
60 -n
50 Li'
40 -•Z)
0Observed
MaxnmumMinriimum
OCT NOV DEC JAN FEB MAR APR MAY JUNE JULY AUG23.0 20.0 13.0 10.0 13.0 16.5 20.0 25.5 28.5 31 .0 31 .0
8.0 7.0 2.0 0.1 1.0 7.0 11.0 16.0 19.5 19.0 21.5
SEPT
28.0
17.0
Figure 125. Peachtree Creet- at Atlanta, Georgio,Stotion 02336300, Julq 1959 to December 1984.
107
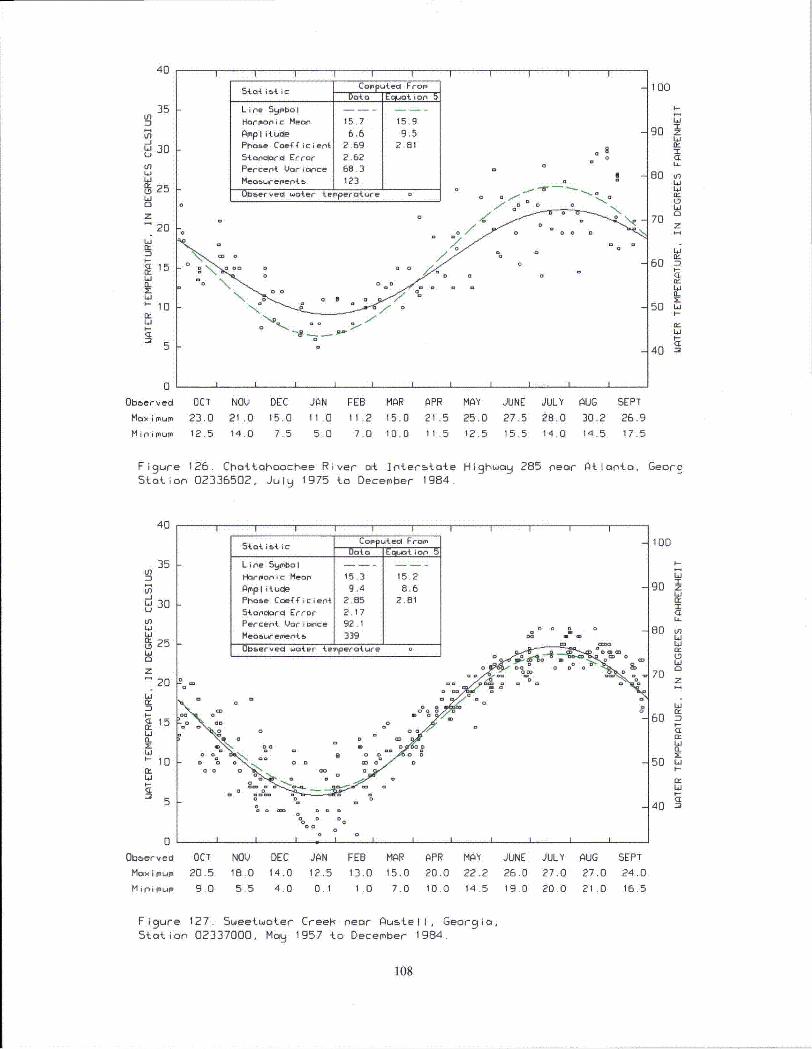
40
35 k
i i i i i5soai ific Corp tect From
Data Eciuotion5
Line Syrbol . .. ....
Harmonic Mean 15,7 15.9
Ampl ituO 6.6 9.5
In
Ln
W 30
cnLa
ýN 2 5Li0
z20
Li
ZrI-•-15
Li
'-10
I I I I I
bnabe car, iclent a. ~i~Stanciard Error j2.62 0
Percent. Variance 68,3a
MeobureerA5_~ 123 o ____
Utmerved water terperature a
o %-~ '
X Do I I
100
1-
90 z
(L
80 uhi
70 z
60 •I-
50 L.I-
Lici
40 35
0
0bberved
Max imum
M i p i u
OCT23.012.5
NOV
21 .014.0
DEC15.0
7.5
JAN FEB MAR11.0 11.2 15.0
5.0 7.0 10.0
APR MAY JUNE
21.5 25.0 27.511.5 12.5 15.5
JULY
28.0
14.0
AUG
30.214.5
SEPT
26.917.5
Figure 126. Chaltahoochee River at ]nterstateStation 02336502, July 1975 to December 1984.
Highwao 285 near Atlanta, Geore
40
35Ln
in
W 30
cnLi
N 25Li
20
Li"-1
15(L
' 10Li
SttOIA is i cputeclFrop
Line Sylobol -- --
Ibrrpanic Mean 15.3 15.2
AlmpIit uce .4 8.6Phasoe Coefficient 2.85 2.81
Stonciord Error 2.17
Percent. Varimnce 92.1 0Meoorwementb- I3 I0 *
UD~ervecl wat.er t.emperature
I I I I ID
100
90 z
70) z
60 ,
50 Li
405
0Obberved
Max imium
minimu
OCT NOV DEC JAN FEB MAR APR MAY JUNE JULY
20.5 18.0 14.0 12.5 13.0 15.0 20.0 22.2 26.0 27.0
9.0 5.5 4.0 0.1 1.0 7.0 10.0 14.5 19.D 20.0
AUG
27.0
21 .0
SEPT
24.0
16.5
Figure 127. Sweetaoter CreeH near Austell, Georgia,Station 02337000, May 1957 to December 1984.
108
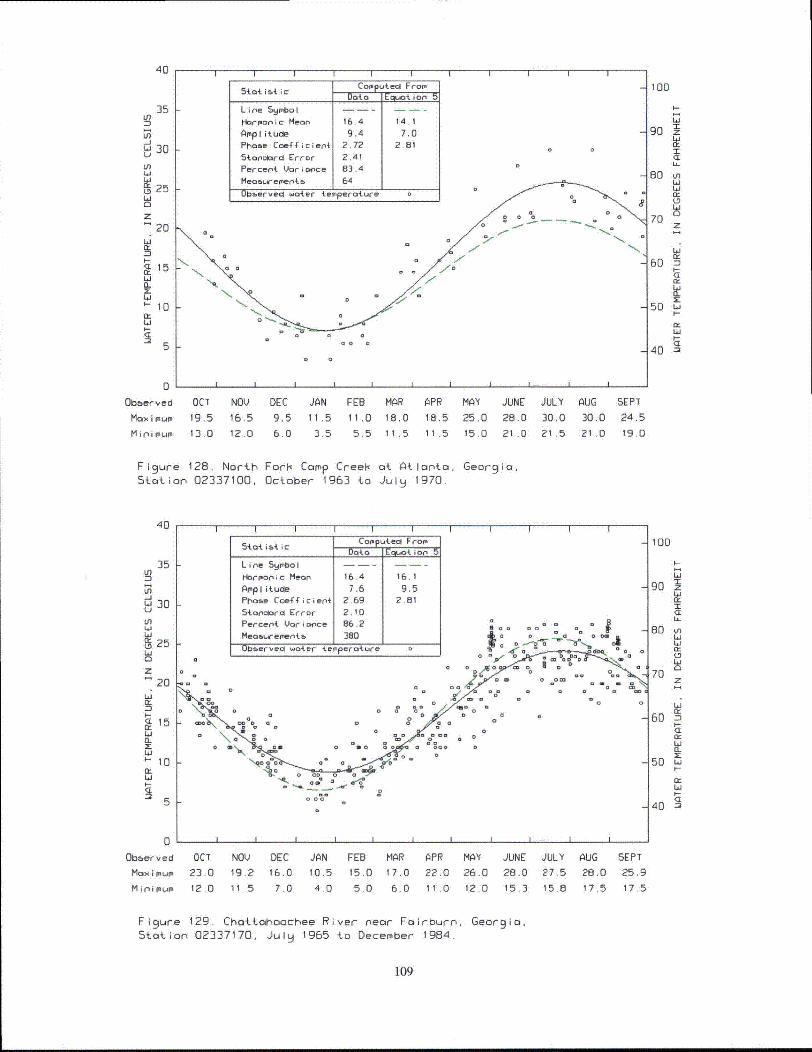
40
LnIn
30
La
ýLD25LI
20
15
I I I I I
uCosputecl FrofData Easuot ion5
Line 59mboI o
Horponic Mean 16,4 14.1
Amplitu*e 9,4 7.0Phobe Coefficient 2.72 2.615tOndcard Error 2.41
Percent Vori ance 03.4
F
I I I I I
Meaeuremroetb 64 _____I Oboerveci water terperature0
1 00
I-
90
z80 I
70
60 •
50 L
40 "
Obberved
Maximu
Minim~umo
OCT NOV DEC JAN FEB MAR
19.5 16.5 9.5 11.5 11.0 18.0
13.0 12.0 6.0 3.5 5.5 11.5
APR MAY JUNE JULY AUG
18.5 25.0 28.0 30.0 30.0
11,5 15.0 21 .0 21.5 21 .0
SEPT
24.5
19.0
Figure 128. North Fork Camp Creek at Atlanta, Georgia,Station 02337100, October 1963 4 o July 1970.
40
35 kLn
J oLi
025
20Li
nC< 15
CL
-10Li.
,i=a• °
Stat iC•t uted Fromstt~tcData Ea{iuot
Line 59mbol .
Haormonic Mean 16.4 16.1AmpI i tude 7.6 9.5Ph~oe Coefficient 2 69 2.81
Stnatorcd Error 2.10C)
Percent Vori once 86.2 o oo 0 0 0 -
Measurement&- 380 a 0 a0 ,
Ibaervec water temperoture o 0 r x
o o* 00 0 o - .ri° 0
+0~~ ~~ . <. . .- + '0a 0 o o a o
i ma = =0.00 o
100
1-
90 z
Lý
80 VLi
.70z
60 •
a:
50 Li
a:4 4
40,5k
0Obberved
Maximum
miim um
OCT NOV DEC JAN FEB MAR APR MAY23.0 19.2 16.0 10.5 15.0 17.0 22.0 26.0
12.0 11 5 7.0 4,0 5.0 6.0 11.0 12.0
JUNE JULY AUG SEPT28.0 27.5 28.0 25.9
15.3 15.8 17.5 17.5
Figure 129. Chottahoochee River near Fairburn, Georgia,Station 02337170, July 1965 to December 1984.
109
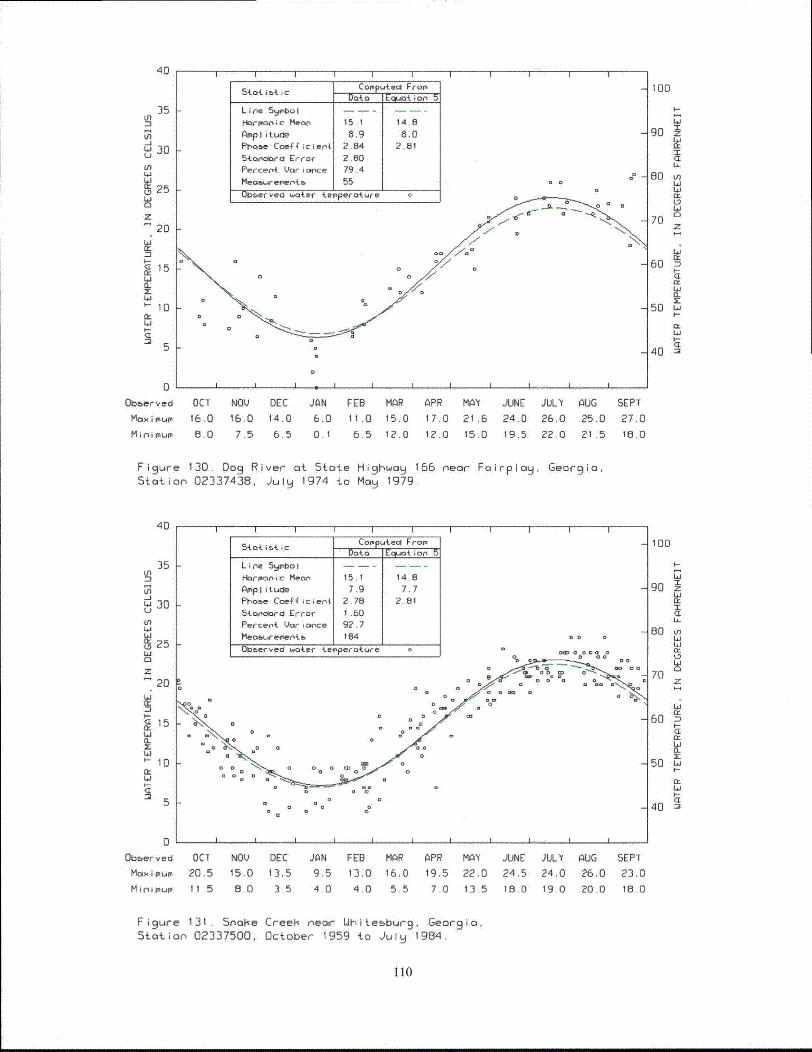
40
35U,
U)-j
w30U,
2 5Ll
20
Li
a.
'-10
5
0Ob&erved
Max imu
M i n1 i mui
Dat I E Ia i of
Line Syebo I - - - -iHa~rmonic Mean 15 I 14,8
Amiplitude 8.9 8.0Phase Coefficient 2.84 2 83Stanclar-d Error 2.80
Measur enent a,[ 0bservecI wat
55
er temperature 0
100
La
90 zI
60 tn6j
70 z
60
50 La'
L0a
40 -
IOCT NOU DEC16.0 16.0 14.0
8.0 7.5 6.5
JAN
6.0
0.1
FEB MAR11.0 15.0
6.5 12.0
APR
17.0
12.0
MAY
21.6
15.0
JUNE
24.0
19.5
JULY AUG
26.0 25.0
22.0 21.5
SEPT
27.0
18.0
Figure 130. Dog River at State Highwoa 166 nearStation 02337438, July 1974 to May 1979.
Fairplay, Georgia.
40
35 IU,
Ln-Jw 30UL
(n
D 25Li0
20
I-Ur
(L 10
IL
5
5tot i54. ic Computecl From
Dat i~pt .0 5•t•I . . .Line 5ymbol - - - - -nHarmonic Mean 15.1 14.8
AmpI itude 7.9 7.7Phase Coefficient 2.78 2.81
Stanldard Error 1 .60
Percent Voricnce 92.7
Measurements 1 184 1 0
Observed water temperoture o
100
I-
90 z
70 z
60 U
CE
50 Li
40
0
0Ob&erved
Maximum
Mini mum
OCT NO DEC JAN FEB MAR APR MAY JUNE
20.5 15.0 13.5 9.5 13.0 16.0 19.5 22.0 24.5
I1 5 8,0 3.5 4 0 4.0 5.5 7.0 13.5 18.0
JULY AUG24.0 26.0
19.0 20.0
SEPT
23.0
18.0
Figure 131. Snoae CreeK near Whitesburg, Georgia,Station 02337500, October 1959 to July 1984.
110
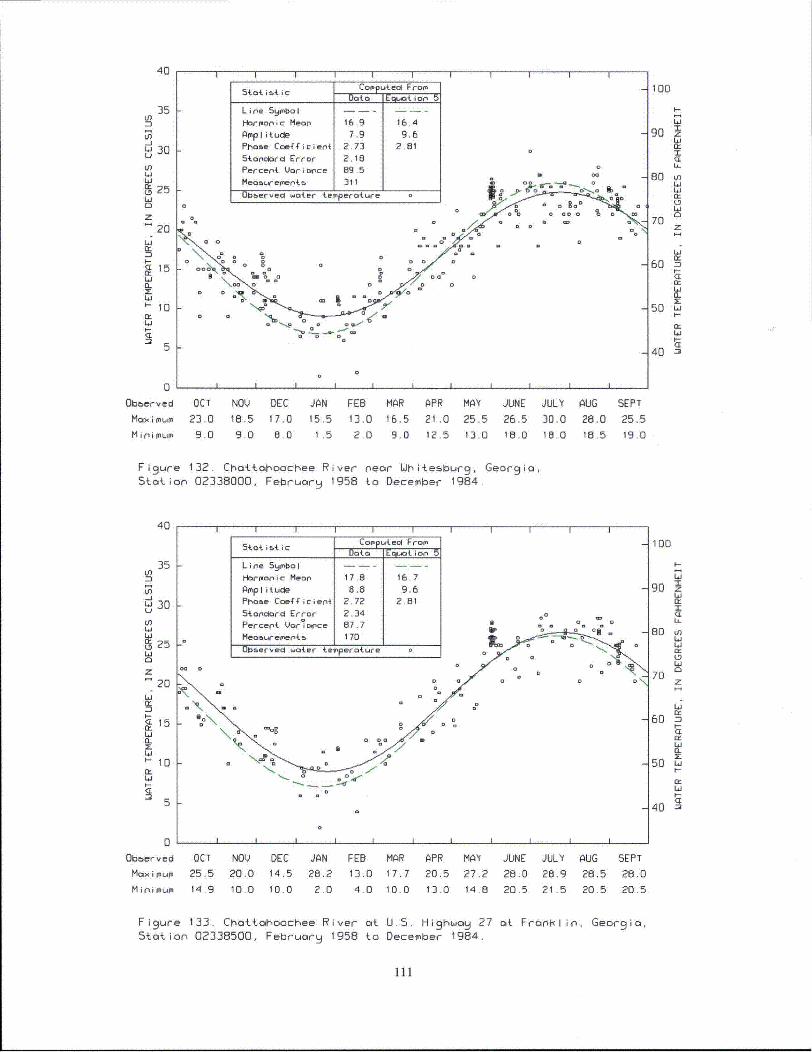
40
35 kLn
-J J0
cnLn
Li
0
z
20Li
I-1
15fLz
'-10n,,
Dot a EqlLat ion5
Line Sy-bol -- -
HorMonic Moan 16.9 16.4Amplitude 7.9 9.6Phoee Coefficient 2.73 2.815tancolrd Error 2.18
I I I I I
Percent Uori nce 89,5
Meo~.vci~ent ~ 1 311- 0..- 0
ub~erveI waoter teinperoture 0 .P0 0 0 SI,
0 0 ~0
0 0 B
100
I-
90 z
70 z
60I-
50 L.i
4-40 -•5
0
Ob~erved
Moa1 mu
Mi IinifInlII
OCT NOV DEC JAN FEB MAR
23.0 18.5 17.0 15.5 13.0 16.5
9.0 9.0 8.0 1.5 2.0 9.0
APR MAY
21.0 25.512.5 13.0
JUNE JULY AUG26.5 30.0 28.016.0 18.0 18.5
SEPT
25.5
19.0
Figure 132. Choatohoochee River near Whitesbur 9 , Georgia,Station 02338000, February 1958 to December 1984.
40
35Ln
in-i
w 30U
20
15
20
LI
CI
01:
Li
L~iI-"10
11:Li
I I I II I I I I I
54.tiCtic Co-ute FrooData Equa4tion5
Line Synbol
Horfoon ic Meop 17.8 16.7Amplitude 8.8 9.6Prose Coefficient 2.72 2.81
5taondrd Error 2.34 0
Percent Vor'ance 87.7
Meourerent5s 170Ob1ered w.ater terperoture 0
I I I I I
100
CL90
80 V-
70 z
60 w
L-
50 6.t-
•0Z)
0
Obberved
Max;mum
Minimum
OCT NOV DEC JAN FEB MAR APR MAY
25.5 20.0 14.5 28.2 13,0 17.7 20.5 27.214.9 10.0 10.0 2 0 4.0 10.0 13.0 14.6
JUNE JULY
28.0 28.9
20.5 21.5
AUG
28.5
20.5
SEPT
2B.0
20.5
Figure 133. Chottahoochee River at U.S. Hiqhway 27Station 02338500, February 1958 to December 1984.
at Franlclio, Georgia,
III
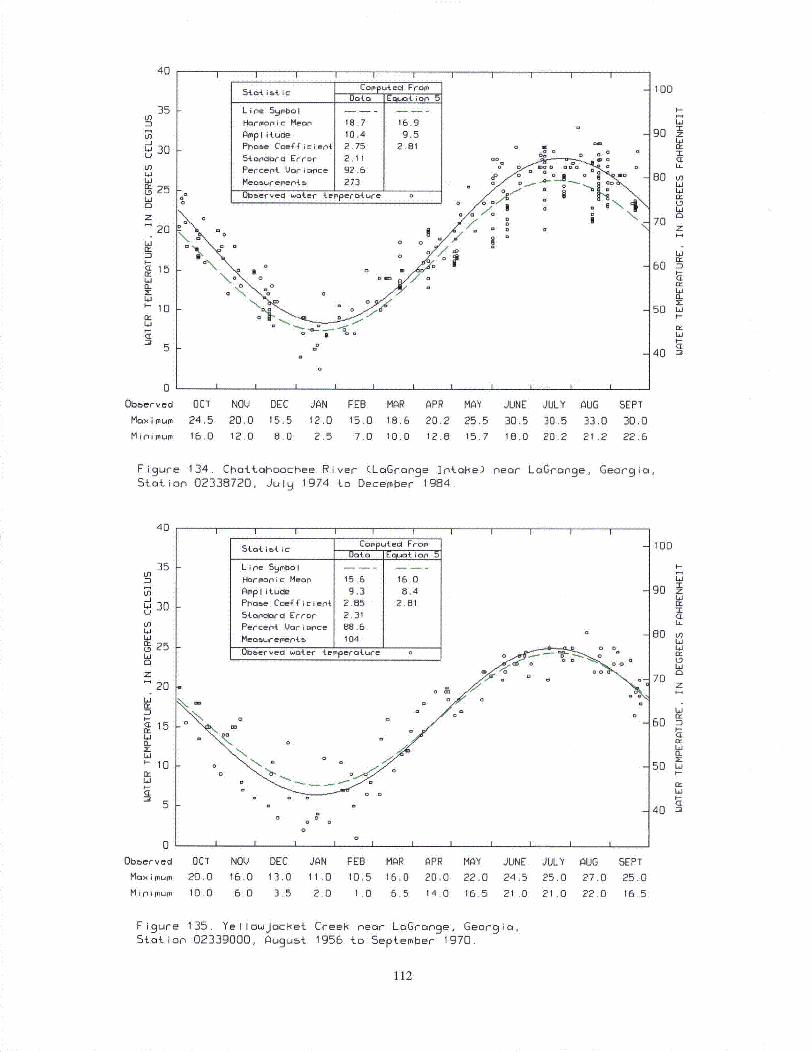
40
35 k
5 ~COPP tec Frogm__________Data_ EqugO it*
Line 5yrmbol
Habrmonic Mean~ 18.7 16.9
Amplitude 10.4 9.5
tn
Wi 30
L)
25LI
20
I-
0~ObereMaimu
Mini10
I I I I I
Phobe Coefficient 2.75 2.81 aStariciard Error 2,11 0Percent Variasnce 92.6 mt
Meoeiurernenit j 273 0.
o O~eerved woterf terpei-oture 0
0'z0
\
100
I-
LO9t0 m
IxL..
70 z
60 •4CE
50 ,ii-
40 "
OCT NOV DEC JAN FEB MAR APR MAY JUNE JULY AUG
24.5 20.0 15.5 12.0 15.0 18.6 20.2 25.5 30.5 30.5 33.016.0 12.0 8.0 2.5 7.0 10.0 12.8 15.7 18.0 20.2 21 .2
SEPT
30.0
22.6
Fi 9 ure 134. Chattahoochee River (LaGronge Intake) near LaGronge, Georgia,Station 02338720, July 1974 to December 1984.
40
U,Ln-i
d30
WU.
Li125
WCL
• 0
zW 10
LYCrI-
St ati bt c Cot ci From"D t 2"'Y i.,- 5
L i re SyrabolI --
Harmronic Mean' 15.6 16,0Amplitude 9.3 8.4Phobe Coefficient 2.85 2.81Stao(.card Errorl 2.31Percent Uoriot'ce 88.6
Meostremer'tb 104Ubter'ved water teraperoture 5-
a
'ba
100
90 z•
I-
B0 LnLi
W90
7D
60
CE
M
Lo
40
5k
0~
Obberved
Max i murn
Mini mum
OCT20.0
10.0
NOV DEC JAN FEB MAR APR MAY JUNE JULY AUG16,0 13.0 11 .0 10.5 16.0 20.0 22.0 24.5 25.0 27.0
6,0 3.5 2.0 I .0 6.5 14.0 16.5 21 .0 21 .0 22.0
SEPT
25.0
16.5
Figure 135. YellouJacret Creek near LaGronge, Georgia,Station 02339000, August 1956 to September 1970.
112
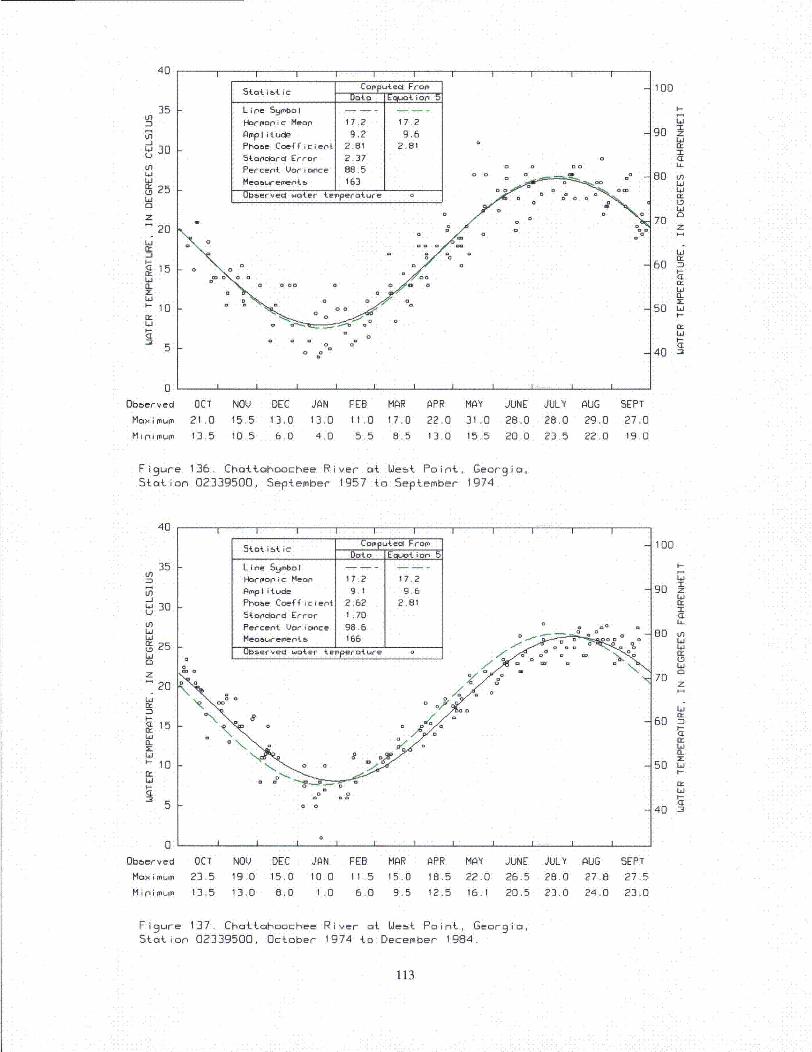
40 I I I I I I I I I I I
35 kIi)
-jLa 30
cn
20
z20
10(r
Statistic Camputel FromData EQIpOt io5
Line Symbol
Hormonic Meon 17.2 17.2Amplitude 9.2 9.6Phoae Coeffiricent 2.B1 2.81Standard Error 2.37
FPercent Vari ance, 88.5 0 o 0 Do
M4easurements- [ 163 Do 0
0baservecI water temperature
I~D I I I
100
I-
90 z
L:
80 IM1.1
70 z
60 -
50 Lii,-
ij
40 -5
01
Obberved
Maxi mum
M ini mumn
OCT NOV) DEC
21.0 15.5 13.013.5 10.5 6.0
JAN FEB
13.0 11.0
4.0 5.5
MAR APR MAY JUNE
17.0 22.0 31.0 28.0
8.5 13.0 15.5 20.0
JULY AUG
28.0 29.0
23.5 22.0
SEPT
27.019.0
Figure 136. Chattohoochee River at Leek PoiPt, Georgio,Station 02339500, September 1957 to September 1974.
40
35En
In-iLi 30U
InLi
S25Li
2015,21
I- 10
4-10
S I I I I I
Stot i& i c ComputedI From
Doto Eofjot ion 5Line Symbol
Harmonic Mean 17.2 17.2
Amplitude 9.1 9.6Phore Coefficient 2.62 2.81
Stondord Error 1.70
Percent Uor i ace 98.6
MeaoLr ement. 166
LIeerved water temperatureo
Do
I I I I I I I I I0
1 DO
90 zL~i
80 InBDLJ
0Li
70
60 'CE
Li
50 Li4-cc
40 -2Z)
0
Obberved
Maximum
Mini mum
OCT
23.5
13.5
NOV DEC JAN FEB MAR APR MAY
19.0 15.0 10.0 11.5 15.0 18.5 22.0
13.0 8.0 1.0 6.0 9.5 12.5 16.1
JUNE JULY
26.5 28.0
20.5 23.0
AUG
27.8
24.0
SEPT
27.5
23.0
Figure 137. Chattahoochee River at Ueet Point, Georgia,Station 02339500, October 1974 to December 1984.
113
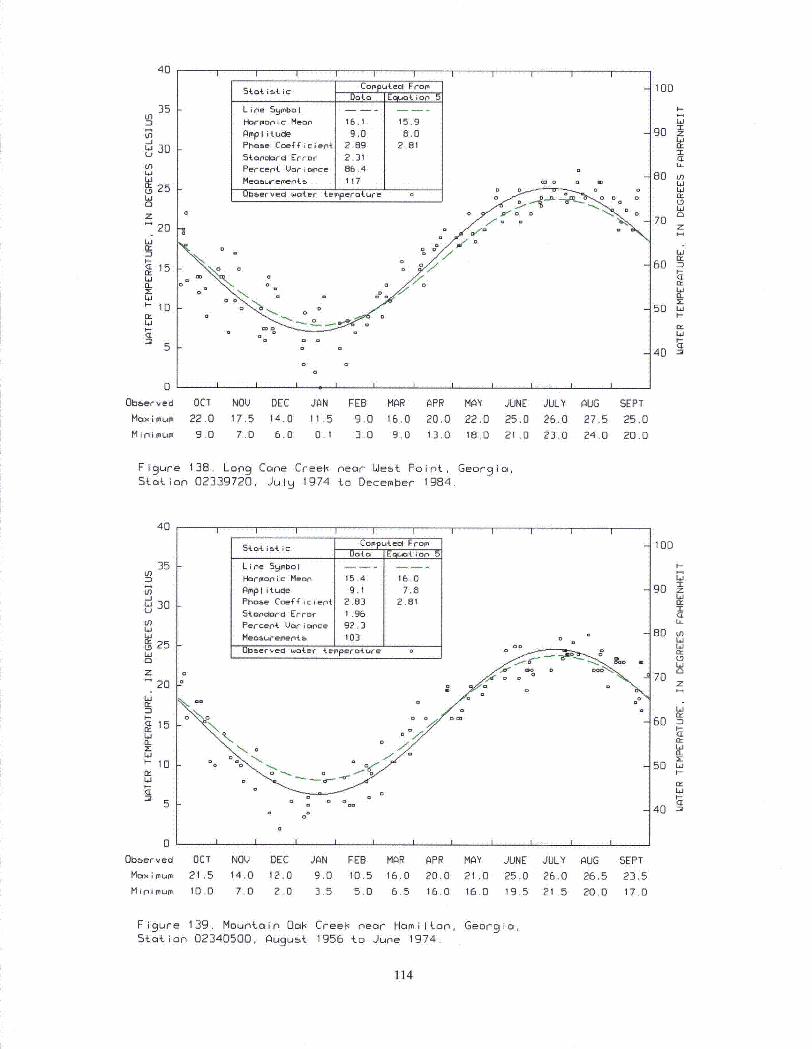
40
Li)
cnLi)
Li
0
z20
LiI-
CL15
IL
L'i'-10
Lia
Stot et ic ComutedlFrom
Lin'e Syimboi -- --Horrponic Mean 16,1 15.9A~mplitude 9.0 6.0Phase Coefficien-t 2.89 2.81
5tatnciard Er,-ai- 2.31Percent Varian'ce 86.4
lleo~urem.er'4ý. 117 W o a -
U0b~erveo water t.emperature bJ oD
I I D
100
I90 z
80 LLOLi
70 z
60CE
(L
50 Lit-
CX
4025
0
Obberved
Mo. imu
M i n' i ICuI
OCT NOV DEC JAN
22.0 17.5 14.0 11.5
9.0 7.0 6.0 0.1
FEB MAR APR MAY JUNE
9.0 16.0 20.0 22.0 25.0
3,0 9.0 13.0 18.0 21 .0
JULY
26.0
23.0
AUG
27.5
24.0
SEPT
25.0
20.0
Figure 138. Long Cone Creefý near West Point, Georgia,Stotion 02339720, July 1974 to December 1984.
40
~3535
Ln_jLi 30
inLi
25Li
a S20
I-
(<L 15(L
F-10a1Li
Lin'e Sy9abol1-brrporic Mean' 15.4 16.0Am'plitude 9.1 7.8Phase Coefficient 2.83 2 81Stonclarcd Errac- 1 .96Percent Variance 92.3Meo~treernt5-.. 1030
Ubaervedl woteCr tecpert~oure
0
100
90 z•U-Li
80 V-
70
z
60 -
I-
0L
40 -n
0Obberved
M iniu
OCT NOV DEC JAN FEB MAR
21.5 14.0 12.0 9.0 10,5 16.0
10.0 7.0 2.0 3.5 5.0 6.5
APR MAY
20.0 21.0
16.0 16.0
JUNE JULY
25.0 26.0
19.5 21.5
AUG
26.5
20.0
SEPT
23.5
17.0
Figure 139. Mountain 0oi Creek near Homilton, Georgia,Station 02340500, August 1956 to June 1974.
114
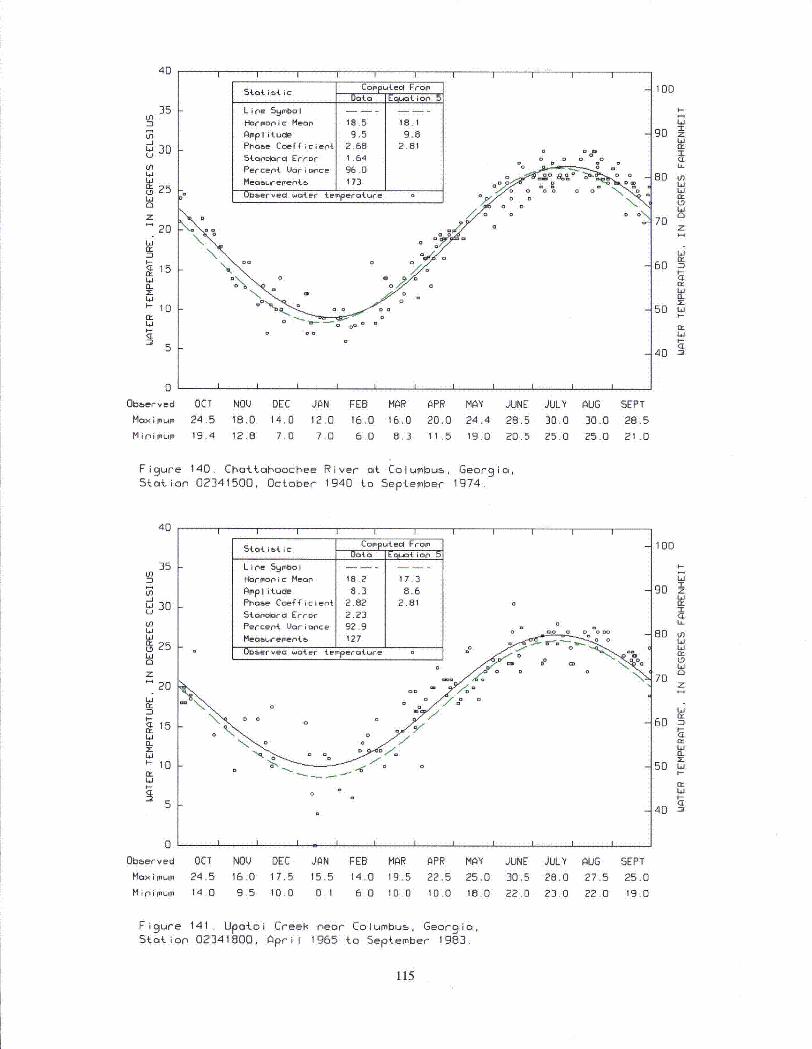
40
35 k
stal. i&A ic COPP utec From
L i e 59mboi IHarmponic Meon 18.5 18.1
Aimplitucle 9.5 9.8
Ln
30
En
S25Li0z
20
15(L
'-10
Er
I I I I I
54tanciord Error 1 .64 oo o
Percent Loia once 96.
Meaaurementb j173o 0Ob~erve4l watef
4terperatum-e
00
100
U-Li
90 •
80 tnw
70 z
60 -
I
50 w.L-
a•
40
Z)
a'Obeberv ed
MaxIIimum
MinrimIum
OCT NOV DEC JAN FEB MAR APR MAY JUNE JULY AUG
24.5 18.0 14.0 12.0 16.0 16.0 20.0 24.4 28.5 30.0 30.019.4 12.8 7.0 7.0 6.0 8.3 11.5 19.0 20.5 25.0 25.0
SEPT
28.5
21 .0
Figure 140. Chottahoochee River at Columbus, Georgia,Station 02341500, October 1940 to September 1974.
40
35In
Ln-J
30inLi
25Li
20
a_I-
CL10ly
L,
L~i
I I I I I I I I I I
Sotatistic Comp~utecl FromDaaa Eiuoti i on 5
Line 59mbo I . . . . .
H-brmonic Mean 18.2 17.3
Amplitude 8.3 8.6Phase Coefficient 2.82 2.81 a
Staonrdcl Error 2.23
Percent Variance 92.9 0
Measurements 127Obberved water 4m"perature a
I_ -
I I I - I I I 4
100
I-
90 z
80 tnLi
70 z
60 a
50 LjI-Exa:
40 LiZ)
0
Obterved
Mai i mum
M ini mum
OCT
24.5
14,0
NOV DEC JAN FEB MAR
16.0 17.5 15.5 14.0 19.5
9.5 10.0 0.1 6.0 10.0
APR MAY JUNE JULY AUG
22.5 25.0 30.5 28.0 27.5
10.0 18.0 22.0 23.0 22.0
SEPT
25.0
19.0
Figure 141. Upotoi Creek near Columbus, Georgio,Station 02341800, April 1965 to September 1983.
115
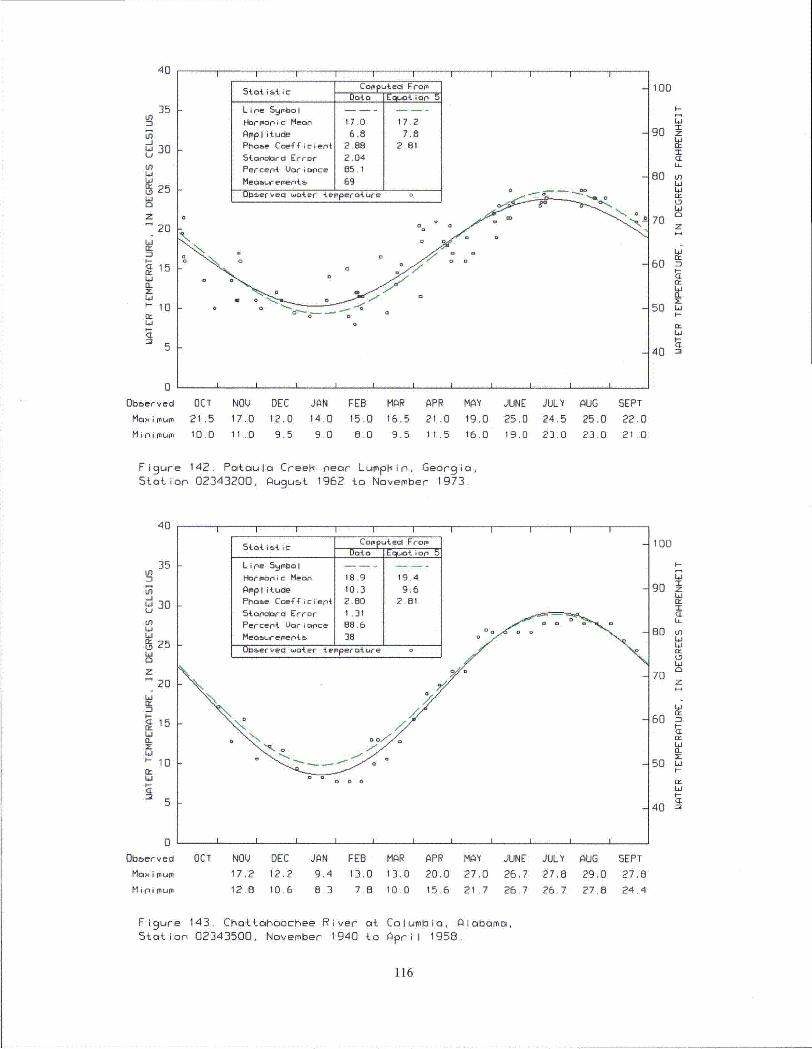
40
35 kLn
-jw 30
,q25
20
Li
~15IL
10(rw-1
3
i i i I iStat it ic Corp-u~ecl From
Data Equaiot 5Line 5mboi
Harmonic Mean 17.0 17.2
AppI itu0l 6.8 7.8Phoe Coefficient 2.88 2.81
Staoc•orcr Error 2.04
Percent Uor i once 85.1
Meoburegent5 69
i I i I I
F-
I uoeer~eol -a'ter terperoture o0
I I I I I0
100
EL
X
80 tn
70 z
60
IE
50 Li
4 "
70
5
0Oboerved
Maxmu
M ini IOLIIO
OCT NOV DEC JAN FEB MAR APR MAY
21.5 17.0 12.0 14.0 15.0 16.5 21.0 19.010.0 11 .0 9.5 9.0 8.0 9.5 11.5 16.0
JUNE JULY
25.0 24.5
19.0 23.0
AUG
25.0
23.0
SEPT
22.0
21.0
Figure 142. Pataula Creek near LumpHin, Georgia,Station 02343200, August 1962 to November 1973.
40
35I0
-J
w 30U
In
u 25a
S20
I--
15
0LiIL~-10
I I I I III I I I
Stati sti cComputeci FromSooo iqs{ ion
Line 59yboIHarmonic Mean 18.9 19.4AMpl it ude 10.3 9.6Phoae Coefficient 2.80 2.81Stanclarcl Error I 1.31
Percent Vari ace I8.6Meao&uegmentb 38 0 D °
Obo.ervecl water teiperoture o
0 0 a
100
Io-
Lo90 z
Li
80 knLi
L0
a:
50 Li
t-
4o
L
0
0
Oboer vedMaxi mum
M iin mum
OCT NOV DEC JAN FEB MAR APR MAY JUNE JULY AUG
17.2 12.2 9,4 13.0 13.0 20.0 27.0 26.7 27.8 29.0
12.8 10.6 8.3 768 10 0 15.6 21.7 26.7 26 7 27.8
SEPT
27.8
24.4
Figure 143. Chattahoochee River at Columbia, Alabama,Station 02343500, November 1940 to April 1958.
116
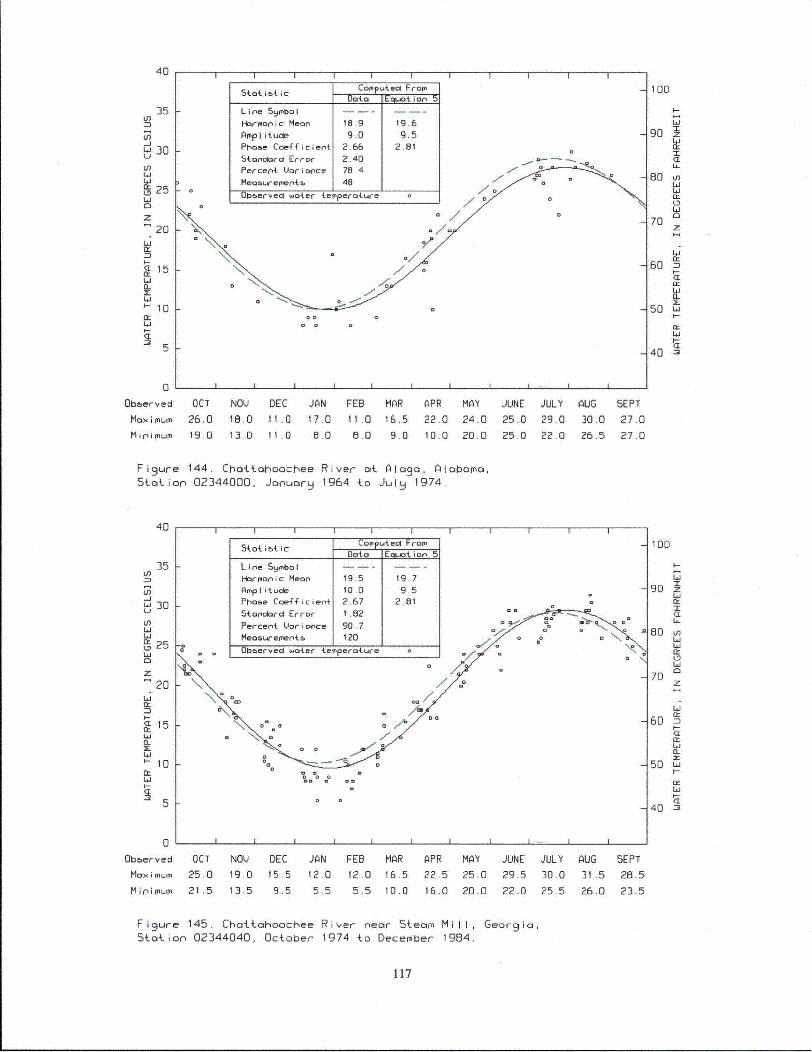
40
Line Syjmbol - -
Harm~onic Mean, 18.9 19.6Amplitucli 9.0 9.5
I I I I I
U)Ln
30Ul-3 ~ 30
Ln
25Li0
z20
EL
<L 15Li
IL
1.. 10
Lj
5
Stand'card Error 2.40
Percent Luri~once 78.4
Meo&o4errer'te 48 _____
- 0 0Ub~ervec4 water terperature 0
1DO
I-
90 z
CL
80 hi14
70 z
60
50 LiI--
L'iI-
40 -•
0'
Obberved
Maximum
Min(imlum
OCT
26.019.0
NOV DEC JAN FEB18.0 11,0 17,0 11.013,0 11 .0 8.0 O.0
MAR APR MAY JUNE JULY
16.5 22.0 24.0 25.0 29.0
9.0 10.0 20.0 25.0 22.0
AUG
30.0
26.5
SEPT
27.0
27.0
Figure 144. Chattahoochee River at AIago, Alobama,Station 02344000, Januorg 1964 to Julq 1974.
40
35I35nE
U)-J
30u)U)Li
• 25
20
z
S20
Li
C 15
0u
I
5
I I I I I I II III
Comf-uteol From5ttstcData [EalCto ion 5
L i ne Symbo I
Hormoic Meao 19.5 19.7Amplitude 10.0 9.5Phase Coefficient 2.67 2.81
5topolord Error 1 .82
Percent Vari iace 90.7 J2
Meosrementsa 120a - I°erveo water tperotue• 0
I I I I I II I I I
100
7-
90 z
<L
80 ULiL-
Li
70z
60 -I-
0..
50 Li
Lr
40 •
I
0
Oboerved
Max imum
Mini mum
OCT25.0
21 .5
NOV DEC JAN FEB19.0 15.5 12.0 12.0
13.5 9.5 5.5 5.5
MAR APR MAY JUNE JULY
16.5 22.5 25.0 29.5 30.0
10.0 16.0 20.0 22.D 25.5
AUG31 .5
26.0
SEPT
28.5
23.5
Figure 145. Chattahoochee River near Steam Mill, Georgia,Station 02344040, October 1974 to December 1984.
117
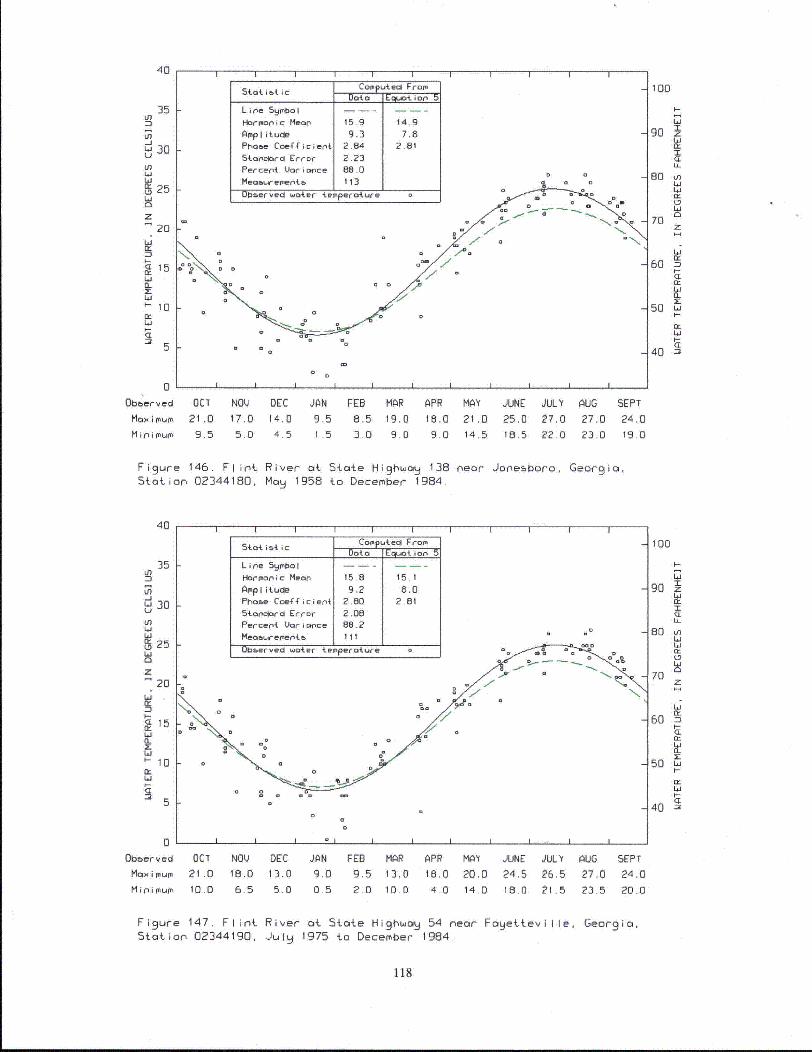
40 ~erIped-o&ure 0
35 kInLn-JW oU)Ln
2 5
,L 1
10
5
20
Obere
MaxiuMiiu
Sto~istc COPP ed FromI
Line Syrbol - - - -
Horrporic Meorn 15.9 14.9
Ameplitudie 9.3 7.8Phasoe Coefficient~ 2.84 2.81
Starocbra Err~f 2.23
I I i i I
Pecn Vor i wc 16 D ____
Ie&rmnb 11 D
100
90 zT
80 U)La
70 z
60 -
50 .
Li
40 "a
OCT NOV DEC
21.0 17.0 14.0
9.5 5.0 4.5
JAN FEB MAR
9.5 8.5 19.01.5 3.0 9.0
APR MAY
18.0 21.0
9.0 14.5
JUNE JULY AUG
25.0 27.0 27.018.5 22.0 23.0
SEPT
24.019.0
Figure 146. Flint River at State Highway 138 nearStation 02344180, Mog 1958 to December 1984.
Jonesboro, Georgia,
40
Ln
Ln-JLa 30
Ln
25La
W
EL
zS20
a.I
H
C10IL 10
5
Io p t c IF I
1Hbrronic Mean, 15.8 15.1Amoplitude 9.2 8.0Ptose Coefficient 2.80 2.819S~a.iono-U Error 2.08Percent. Vor i cipe 88.20I'eiueomenrte. Ili
0bboefvecs water telnperatuI-e o
I 01 II I - I
100
I90 z
80 Lha0cr,
70 z
60 nH
50 La
a.
40 CL
0Obeberved~
Maximumo
M i ni mumIN
OCi NOV DEC
21.0 18.0 13.010.0 6.5 5.0
JAN FEB MAR
9.0 9.5 13.0
0.5 2.0 10.0
APR MAY18.0 20.0
4.0 14.0
JUNE
24.5
18.0
JULY AUG
26.5 27.0
21.5 23.5
SEPT
24.0
20.0
Figure 147. Flint River at State Highwoa 54 near Fayetteville, Georgia,Station 02344190, July 1975 to December 1984.
118
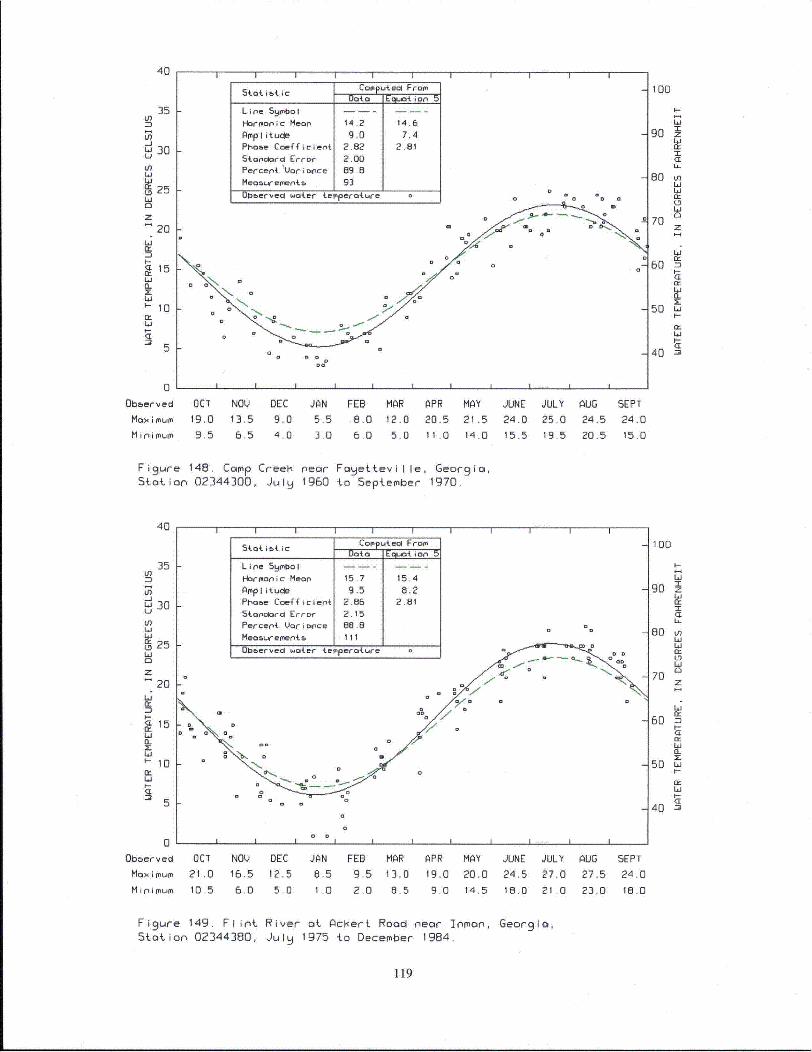
40
In
=3
-130
Uhn
125W
20LlEr0
15a-a.1
LO'-10nr
I I I I I
Stotistic Cofputed FromData Eqlpotion D
Line Sqmbo .
Horponic Mean 14.2 14.6
Amplitude 9.0 7.4Phobe Coefficien{ 2.82 2.81
Stonoard Error 2.00
Percent 'Uor iance 89.8
Measurement& 93
Utmervecl water teperature~ b D
I~ a
I I I I I
100
Ig
La
90
70 z80
50 u"
La
440 M
Z) I-
0Obberved
Maximum
Minimum
OCT NOV DEC JAN FEB MAR19.0 13.5 9.0 5.5 8.0 12.0
9.5 6.5 4.0 3.0 6.0 5.0
APR MAY
20.5 21.511.0 14.0
JUNE JULY
24.0 25.015.5 19.5
AUG
24.5
20.5
SEPT
24.0
15.0
Figure 148. Camp CreeH near Fayetteville, Georgia,Station 02344300, July 1960 to September 1970.
40
135InLn-i
U,S30EJLa
25La
20S20
6L
<E 1
Sis(L
I-10
5
I I I I III I I I
stat il.t ic Cp•uteci Fror-Data Eqlua or, 5
Line SymboI - - -
Harmonic Hean 15.7 15.4
Amplitucle 9.5 8.2Phoae Coefficiient 2.85 2.81
Stanclard Error 2.15Percent Varia'ce 88.8
Meo..rementb Il 1 I
Ubserved water -e.,perature o
I I - I°
10D
I-'90 z
LaEr
80 v-)La
70
60 n
I--50La
40
I-
0Obberved
Maximum
M i i mum
OCT NOV DEC JAN
21.0 16.5 12.5 8.5
10.5 6.0 5.0 1 .0
FEB MAR
9.5 13.0
2.0 .B5
APR MAY
19.0 20.0
9.0 14.5
JUNE JULY AUG SEPT
24.5 27.0 27.5 24.0
18.0 21.0 23.0 18.0
Figure 149. Flint River at Ackert Rood near Inman, Georgia,Station 02344380, July 1975 to December 1984.
119
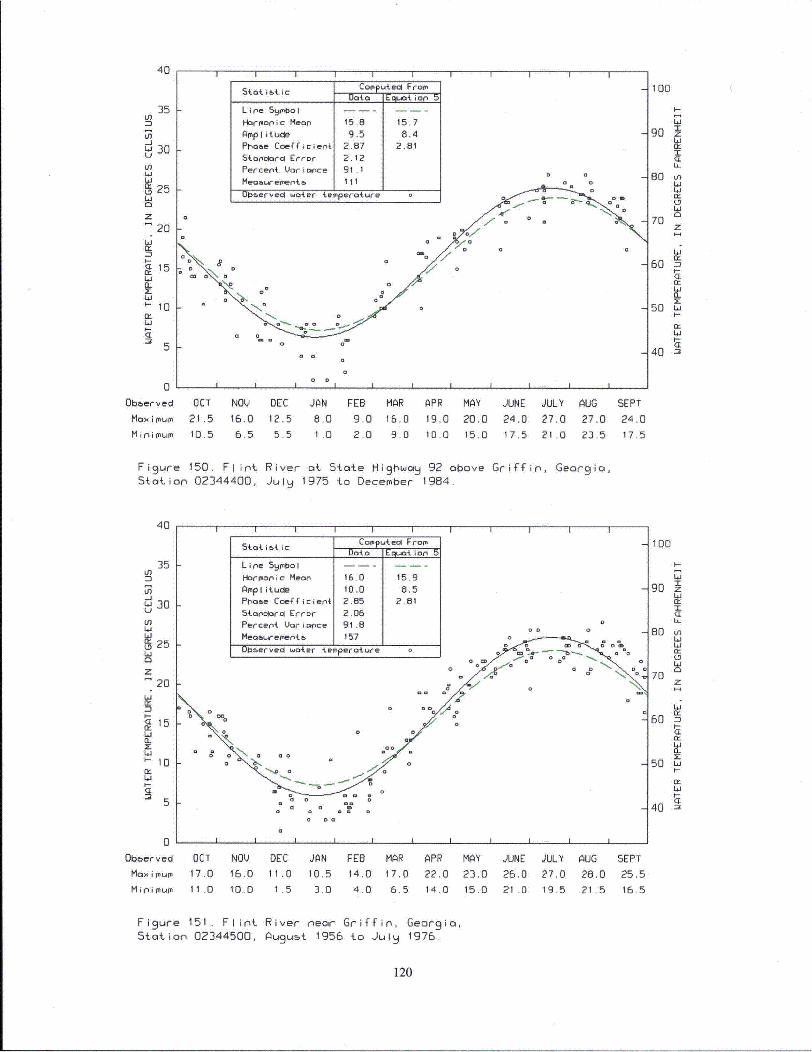
40
V)
-J
U 30Li
• 25La
0
15
a.
10
5
stat.iti.c Comprec FromData Equal ion 5
Line 59mbol --- -
Harmonic Mean 15.8 15.7
Amplituce 9.5 8.4Phase Coefficient 2.87 2.8154onciord Error 2.12
k-
I I I t I
P erc.(I~ent~ e Jr onc 9 10ft~mrvecd i-otr Lerpero*.ure
a 0
100IOD
go
90 kM
70 z
60
50 Li
40 -
0
0bberv.ed
Max imum
Min imum
OCT NOV DEC JAN FEB MAR
21.5 16.0 12.5 8.0 9.0 16.0
10.5 6.5 5.5 1.0 2.0 9.0
APR MAY
19.0 20.0
10.0 15.0
JUNE JULY AUG
24.0 27.0 27.0
17.5 21.0 23.5
Griffin, Georgio,
SEPT
24.0
17.5
Figure 150. Flint River at State HighwoH 92 aboveStation 02344400, July 1975 to December 1984.
40
35Lfl
30Ln-J
w 3
Li
20
Wz
S10
5
20
Obberved
Maximum
Minimum
I I I I I I
5tot. ib ic Colpupted FromData Eouat i op
Line 5ymbol
Harmon•c Mean 16.0 15.9
AmpIituule 10.0 8.5Phase Coefficient 2.85 2.81
Stanciard Error 2.06
Percent Variance 91.8
Meosuremenb 1 157 1
0oberved water temperature
S • 0
I II I
100
90 z
I
70
a
60 n
50 La
40
OCT NOV DEC JAN FEB MAR APR MAY JUNE
17,0 16.0 11.0 10.5 14.0 17.0 22.0 23.0 26.0
11.0 10.0 1.5 3.0 4.0 6.5 14.0 15.0 21.0
JULY AUG
27.0 28.019.5 21.5
SEPT
25.5
16.5
Figure 151. Flint River neor Griffin, Geor 9 io,Station 02344500, Ausust 1956 to July 1976.
120
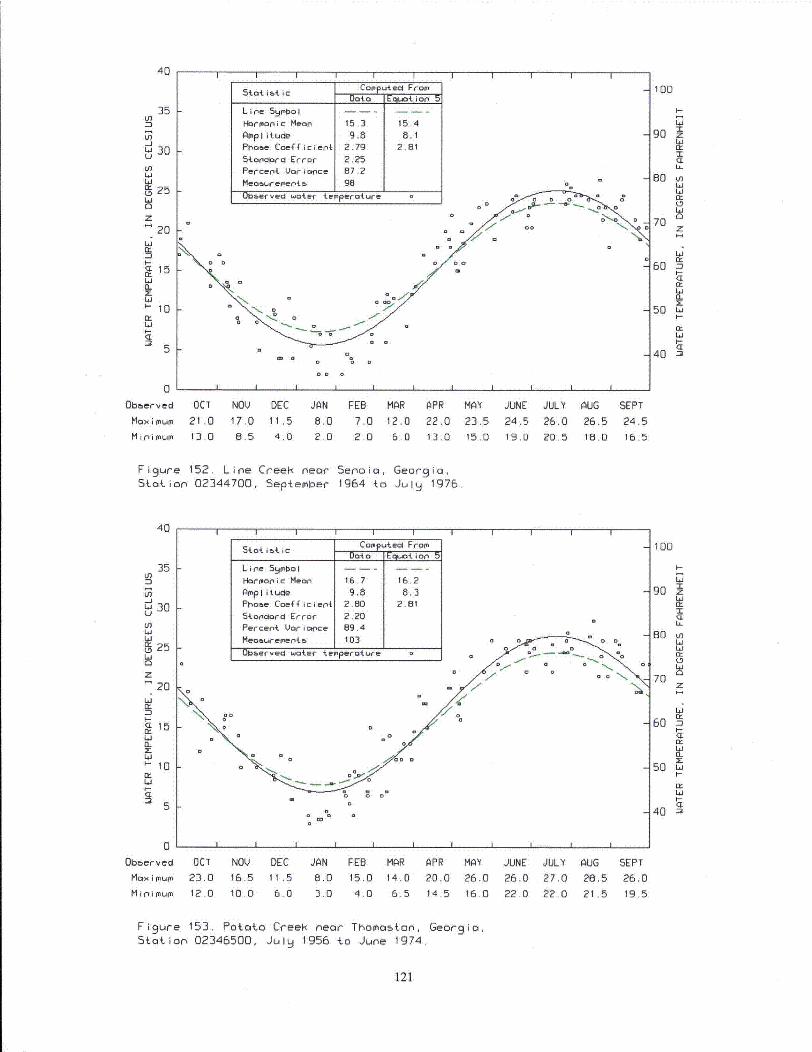
40
35 Iin-1
Lfl-JW 30U3Ln614
25121
20
z
a 15
WIL
10
5
40 II I I
Stat istic CoOputeal Fro mDota Eoion f5
Line Symbol
1Horronic Mean 15.3 15.4
Amplitude 9.8 8.1Phase Coefficient 2.79 2.81
Stapnoord Error 2.25
Percent Variance 87.2
I I I I I
k-
Measurements- 1 98 j_____aUbeervecl water temperature 0 o0
0 o D o
- • m Q 00
100
90 z
80 LnEx14
70 Z
60 D
50 w.4-
40 "•
0
Obberved
Max~imu
MinimIlum
OCT NOU DEC JAN
21,0 17,0 11.5 8.013.0 5.5 4.0 2.0
FEB MAR APR MAY JUNE
7.0 12.0 22.0 23.5 24.5
2.0 6.0 13.0 15.0 19.0
JULY
26.0
20.5
AUG
26.5
18.0
SEPT
24.5
16.5
Figure 152. Line CreeH near Senoia, Georgia,Station 02344700, September 1964 to July 1976.
40
In
in-j
u 25
20
zj
a-z iUj10
5
I I I I I I II II
Stot i{i ~ Cowuteal FromfData EcIwot io5
Line Symbol
Harronic Mean 16.7 16.2AmpI itude 9.8 8.3
Phose Coef•ficient 2.80 2.815tanolara Error 2.20Percent Vor iance 89.4
Meosurement& 103Observed water temperature o
10D
90 z
z
60a4
50 w.
40
0
Obeberv~d
Max i inLurn
M inimum
i - i i i i i
OCT NOV DEC JAN FEB MAR APR MAY JUNE23,0 16,5 11.5 8.0 15,0 14.0 20.0 26.0 26.0
12.0 10.0 6.0 3.0 4.0 6.5 14.5 16.0 22.0
JULY AUG
27,0 28.5
22.0 21.5
SEPT
26.019.5
Figure 153. Potato Creef% near Thom01Oo.n, Georgia,Station 02346500, July 1956 to June 1974.
121
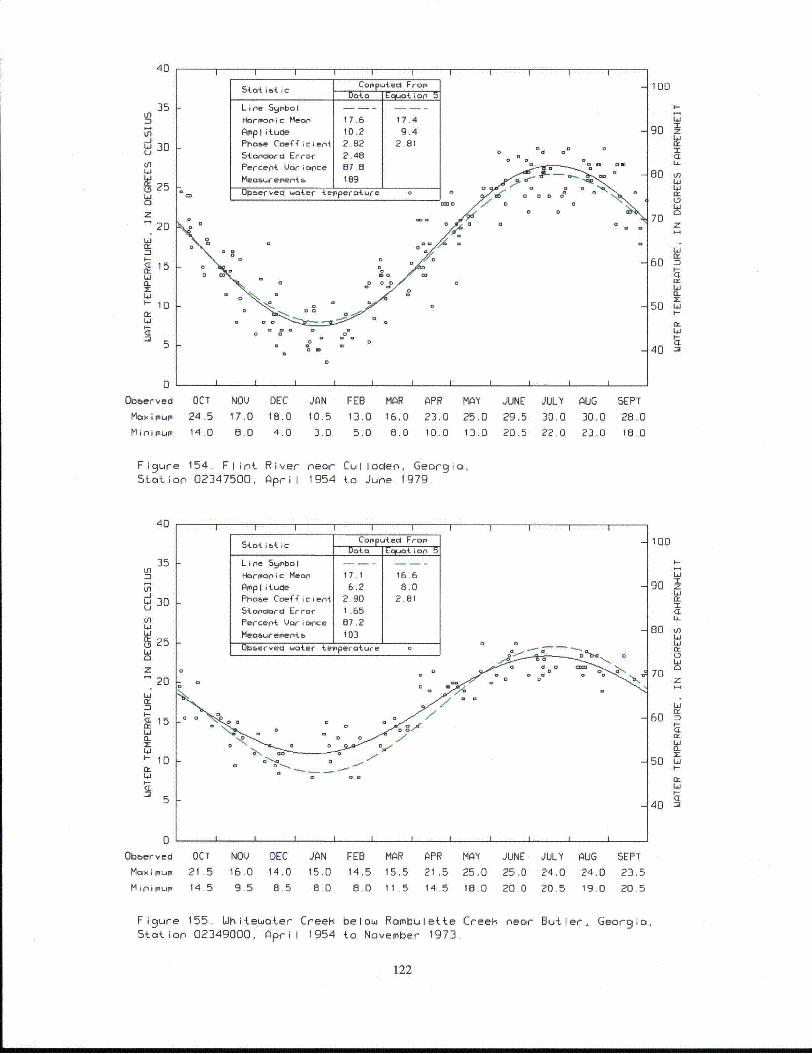
40 4 0I I I I I I I I I I I
35 PLn
U)-Jvu30
La
2•5h,
z
20L a
I-
15
La
'-10
La
Statistic COuteal FramData Eq~t ior, 5
Line S nbol . .. . ..
Harmonic Meon 17.6 17.4
Amplitucle 10.2 9.4PIhone Coefficient 2.8? 2.81
5tonoarci Error 2.48
Percent Voriopce 87.8 °Meowemenets b J 189 _____
- Oberved water temperature b
0 0 0# 0
0
~~0 A
100
90 z
"TL,
80 ULaMLa
70 z
60 -Dct
50 La
403
0~Obberved
Moxi> iNipnimumLi
OCT NOV DEC JAN FEB MAR APR MAY JUNE JULY AUG
24,5 17.0 18.0 10.5 13,0 16.0 23.0 25.0 29.5 30.0 30.014.0 8.0 4.0 3.0 5.0 8.0 10.0 13.0 20.5 22.0 23.0
SEPT
28.0
18.0
Figure 154. Flint River near Culloden, Georgio,Station 02347500, April 1954 to June 1979
40
35
-jL 30in
L! 25
20LaM
M15
IL
X
La~-10
5
0Obberved
Maximum
Minimum
I I I I I I I I I T
Stot ist ic Computed FromData Eq•at io
Line mbnol -. . . . . .
Hiarmopic Mean 17. 1 16.6
Amp I ituCde 6,2 8.0
Phaoe Coef•icien{ 2.90 2.81
5toapolar Error 1 .65
Percent Vor i nce 87.2Measurements 103
°-obervel water temperature
0 a
0 a
100
90 z
"T
80 u,La
70
LaJ
60
50 L.I--
r,-
OCT NOV DEC JAN FEB MAR APR MAY
21,5 16.0 14.0 15.0 14.5 15.5 21.5 25.0
14.5 9,5 8.5 8.0 8,0 11,5 14.5 18.0
JUNE JULY AUG
25.0 24.0 24.0
20.0 20.5 19.0
SEPT
23.5
20.5
Figure 155. Uhiteaoter CreeK below Rambuletie CreeH nearStation 02349000, April 1954 to November 1973.
Butler, Georgio,
122
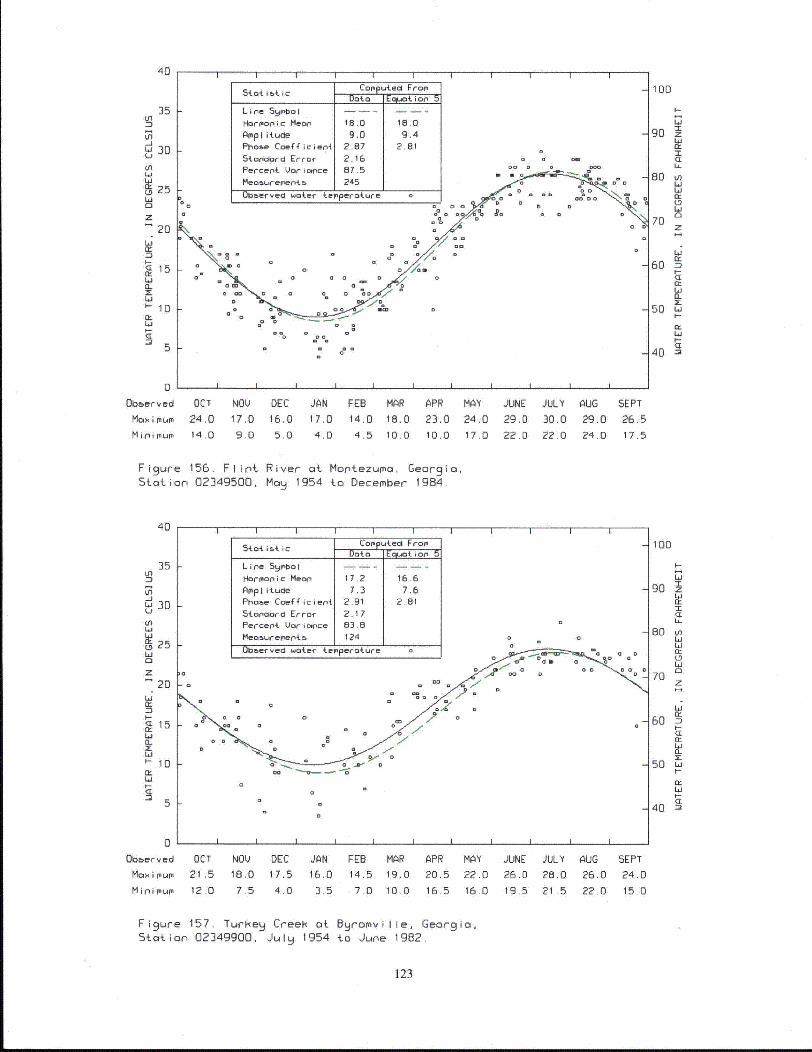
40
35In
Ln-j
LU30
ND 256j
20
IL
10
Line SyrobolHoi-ornic Mean 18.0 18.0Amiplitude 9.0 9.4Ph~ase Coefficient 2.87 2,81
Stanciard Error 2.160 0
Percent Variance 87,5 0
1 e~reet 245
00&erveci water terperature 00 0
I I I'r
100
I-
90 o
I
80 V)
70 z
60
50 L-ii-
405
0
Obberved
Maximum
Minimum
OCT NOV DEC JAN FEB MAR24.0 17.0 16.0 17.0 14.0 18.0
14,0 9.0 5.0 4,0 4.5 10.0
APR MAY JUNE JULY
23.0 24.0 29.0 30.010.0 17.0 22.0 22.0
AUG
29.0
24.0
SEPT
26.5
17.5
Figure 156. Flint River at Montezuma, Georgio,Station 02349500, May 1954 to December 1984
40
35
In
La30
25Li
20
IL
10
I I I II I I I I I I
5Li•,Cic pputeol Fr ofDot.o Eqapot ion, 53
Lin 5e 59bol ...
Harmonic Mean 17.2 16.6
Amplitude 7.3 7.6Phoae Coefficient 2.91 2.81
Stanalorcl ErrDr 2.17Percent Variance 83.8 0
Mea"Lreeentb 124 0 o
Ub~erved water temperoture 0
00 0
00 Do -- A., o .I
100
I-
7O
90 Z
W70
60 I
50
405
0
Obaerved
Maximum
M i n imum
OCT NOV DEC JAN FEB MAR APR MAY JUNE JULY AUG21,5 18.0 17.5 16.0 14,5 19.0 20.5 22.0 26.0 28.0 26.0
12.0 7.5 4.0 3.5 7.0 10.0 16.5 16.0 19.5 21 .5 22.0
SEPT
24.0
15.0
Figure 157. Turcke Creek at Byromville, Georgia,Station 02349900, July 1954 to June 1982.
123
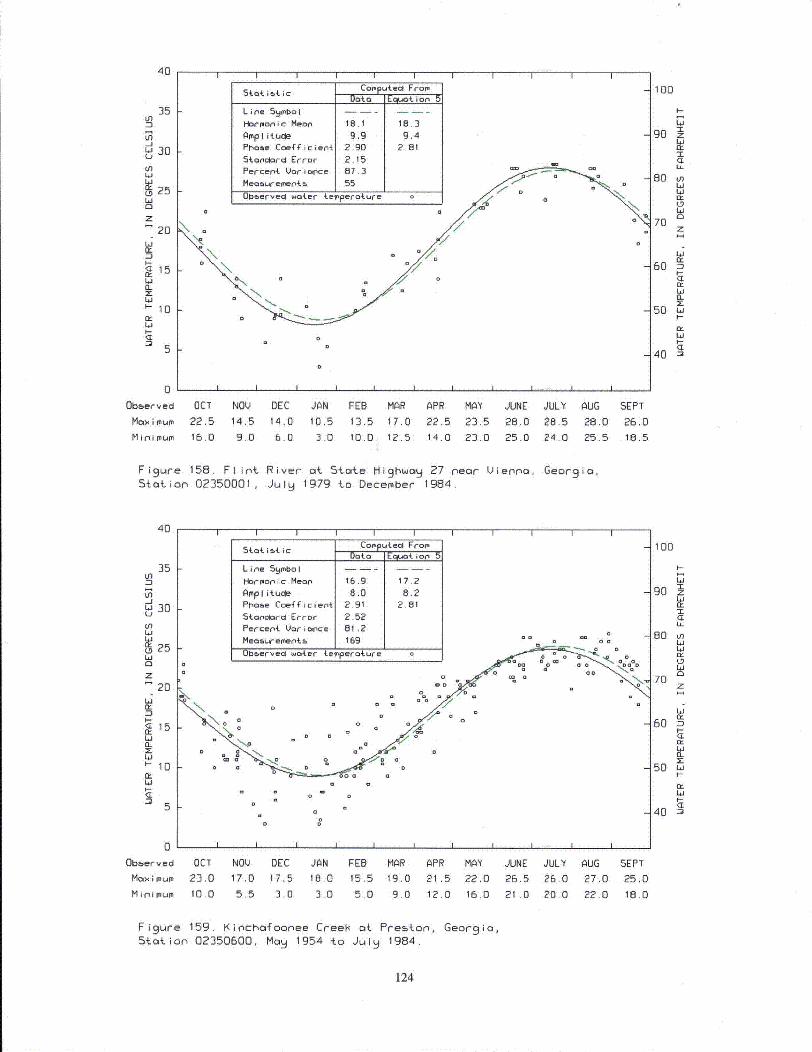
40
35 Itn
ýN 256j0z
20
15
IL
10
I-
St-Li&A.Ai c 2op-p tecoF am~
Line SyI'tol -- --
H-orpornic Mean, 18.1 18.3Amplitudle 9.9 9.4
Phase Coe-f4icier'{ 2.90 2.815torpciora Error 2.15Percent4 Var i nce 87.3
Meosurem.entb 55
Observed waite ter'peroture o
1D00
I-
90 z
80 inW
70 z
60
50 LiP.-
a-
40 -•D
5
0Obberved
Max imium
M in i mumi
OCT NOV DEC JAN FEB MAR APR MAY JUNE JULY AUG
22,5 14.5 14.0 10,5 13,5 17.0 22.5 23.5 28.0 28.5 28.0
16.0 9.0 6.0 3.0 10.0 12.5 14.0 23.0 25.0 24.0 25.5
SEPT
26.018.5
Figure 158. Flint River at State Highway 27 near Vienna,Station 02350001, July 1979 to December 1984.
Geor i a,
40
2535Ln
to-j
U
U 3(0
25
Li01
D-'I-
61
I I I I I I III I I
5"ot is' ic Co•p -ecl FroPmData Epolt io5
Line S59"01 yIr
Harmronic Mean 16.9 17.2Amplituce 8.0 8.2Phose Coef iCient 2.91 2.81
Standcard Error 2.52
Percent Variacnce 81.2
Meosrement.- 169 -° aObserved water temperoture o
So 1 • o I
100
I-
7-90 z
80LW
Li
70z
60
nQ:
50 LiI-
a:
40
F
5
0Observed
Maximum
Mini mum
OCT NOV DEC JAN FEB MAR APR MAY JUNE JULY AUG23.0 17.0 17.5 18.0 15.5 19.0 21.5 22.0 26.5 26.0 27.0
10.0 5.5 3.0 3.0 5.0 9.0 12.0 16.0 21 .0 20.0 22.0
SEPT
25.0
18.0
Figure 159. Kinchoafonee Creelý at Preston, Georgio,Station 02350600, May 1954 to July 1984.
124
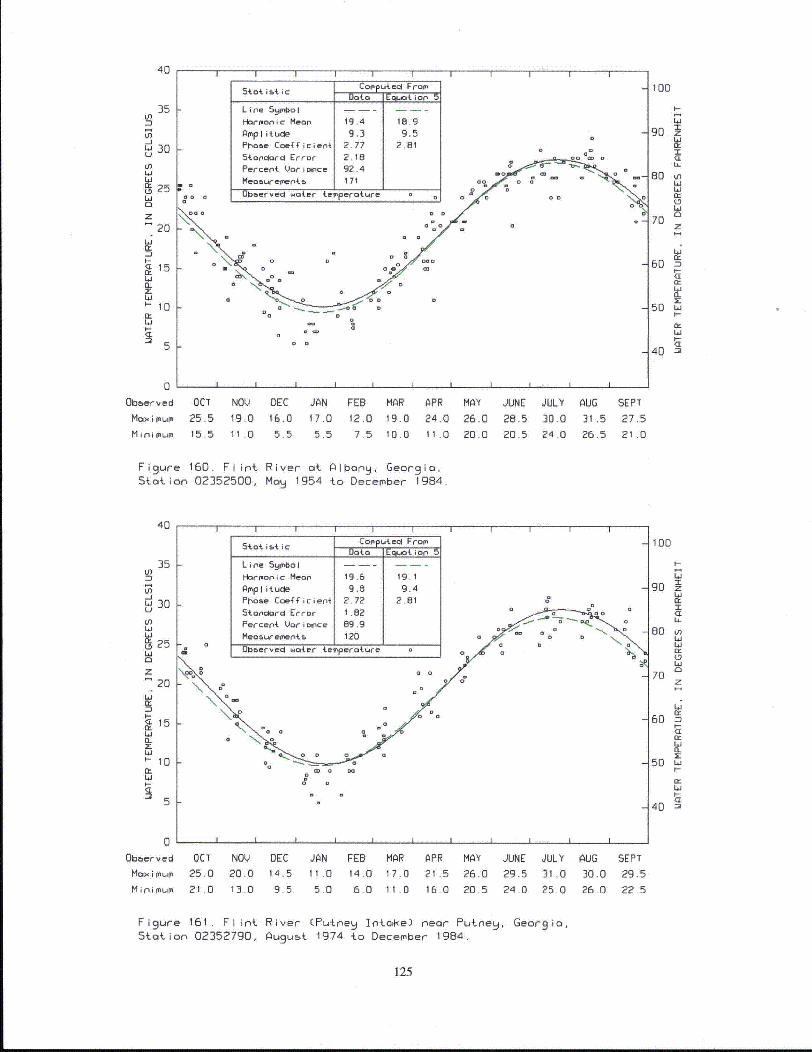
40
23535Ln
U)-JWO
U)LU
ND 25Li
20
20
C15
I I Ir
Stor ibt ic Camp teci From
Data Eauot top 5S
Line Srmbol -----
Harmoonic Mean 19.4 18.9
Ampl ituwe .3 9.5 0
Phase Coe-ffcient 2.77 2.81
Staocnarc Error 2.18
Percent Variance 92.4
Mea~uem'entb 171
00 Obefved water, temoperature 0 0 0 0 0
°°eC no"",'LL"'oe _U•. °•° ---ID a o aD:•
100
90 z
80 .'I:
70z
604Z
Q:
50 L
40 "L
00bberved
Max i moum
M inr'imum
OCT NOV DEC JAN FEB MAR
25.5 19.0 16.0 17.0 12.0 19.015.5 11.0 5.5 5.5 7.5 10.0
APR MAY JUNE JULY AUG
24.0 26.0 28.5 30.0 31.511.0 20.0 20.5 24.0 26.5
SEPT
27.5
21.0
Figure 160. Flint River at Albang, Georgia,Station 02352500, Mao 1954 to December 1984
40
35LU
=3-JLj 30U
LU
g 25Ld
20
(r
151
I-
z20
Mi
I I I r
Strr ist ic Coputec2 From
Data Equ~oti on 5
L i n~e 5!^bo I -- - -
Lin-oroic Mean 19.6 19.1
Ampl itucle 9.8 9.4Phase Coefficient 2.72 2.81 0
Sionclorad Error I .82 o a
Percent Variance 89.9
Measu o.event a 120
Oblerveo water temperature 0
\ooC
I 0 w
I I A
100
90 z
CLI
80 tn411
Ir
70
60 M:
I-CL0:
2r:"
540
0
Obberved
Max.imium
Min imrum
OCT NOV
25.0 20.0
21.0 13.0
DEC JAN
14.5 11.0
9.5 5.0
FEB MAR14.0 17.0
6.0 11 .0
APR MAY
21.5 26.0
16.0 20.5
JUNE JULY AUG
29.5 31.0 30.0
24.0 25.0 26.0
SEPT
29.5
22.5
Figure 161. Flint River (Putneg Intafke) near Putneq, Georgia,Station 02352790, August 1974 to December 1984.
125
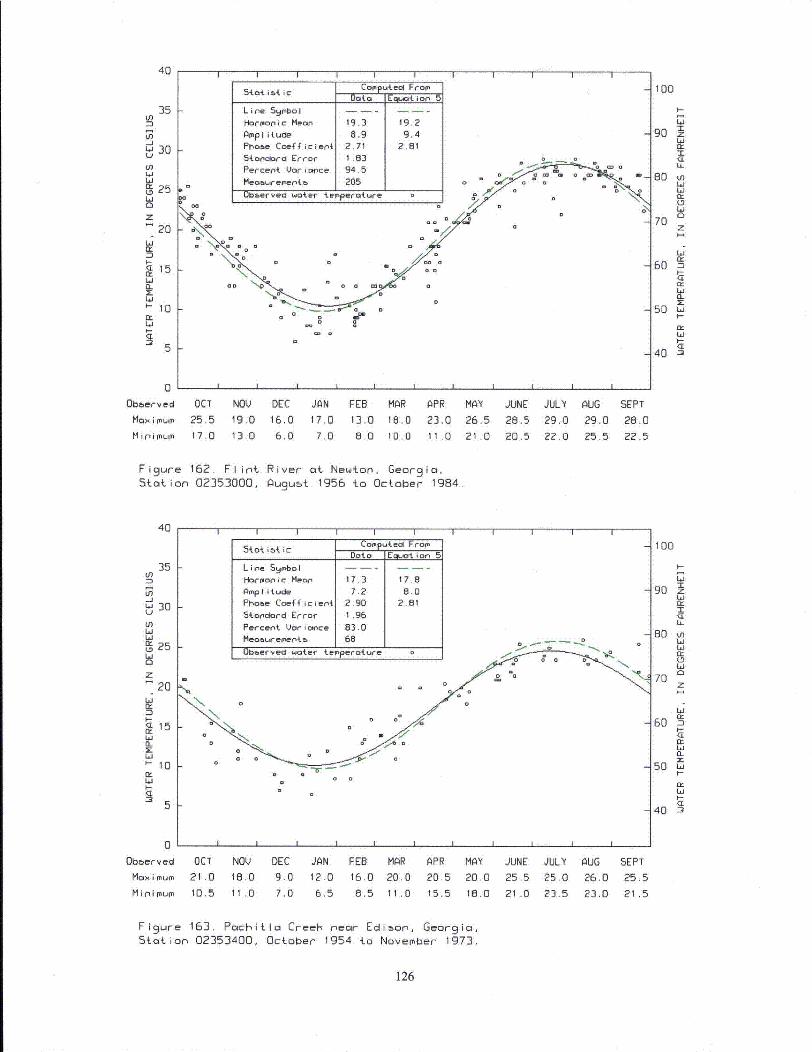
40 40 I I II I I I I I I
35 kLD
L6
30U)Ln
N 25W0
z20
n-I-
15ILz
P-10
la
Stot istic Compteci From
Line SymboI
HaIrmon'ic Mean 19.3 19.2
Amplitude 8.9 9.4Phase Coefficienti 2.71 2.81I-Sonclord1 Lrror I1.83
Percent& Uari wce 94.5
Meosurementb j 205 ]_____Okb~erved water terperature o ~ '0 o'
0 0
100
Ig<L
B0 v)
70z
60 a
Li
La
La40 .I--
I
40 •Z)
0'
0beberved
Maximum
M I ni Mum
OCT
25.517.0
NOV DEC JAN FEB
19.0 16.0 17.0 13.013.0 6.0 7.0 8.0
MAR APR MAY JUNE
18.0 23.0 26.5 28.5
10.0 11.0 21.0 20.5
JULY AUG
29.0 29.0
22.0 25.5
SEPT
28.0
22.5
Figure 162, Flint River ot Newton, Georgia,Station 02353000, Auqust 1956 to October 1984
40 I I I I I
35 kU)
-JLa 30U
LaLaWN 25
20z
S20La
ri-
r(< 15La
ELa
I-10
F-
I
b.
5totibtic Copu.edl FomDoto EwlUOt ion 5
Line $9mbol
Harm.onic Mean 17.3 17.8AmpItiude 7.2 8.0
Phaoe Coefficient 2.90 2.81
5tandard Error 1.96
Percent Vaoriance 83.0
Meooucementb 68 .- - - -.-.
Observed woter temperature o
0 I
100
90 zLL
60 m
La
h,La
70
a-60
I-
Lad
50 Lat-
40 3
J
Z) I
0
Oboerved
Maximum
Minimum
OCT NOV
21.0 IB.0
10.5 11.0
DEC JAN FEB
9.0 12.0 16.0
7.0 6.5 8.5
MAR
20.0
11.0
APR MAY JUNE JULY AUG
20.5 20.0 25.5 25.0 26.0
15.5 18.0 21.0 23.5 23.0
SEPT
25.5
21.5
Figure 163. Pachitla CreeH near Edison, Georgia,Station 02353400, October 1954 to November 1973.
126
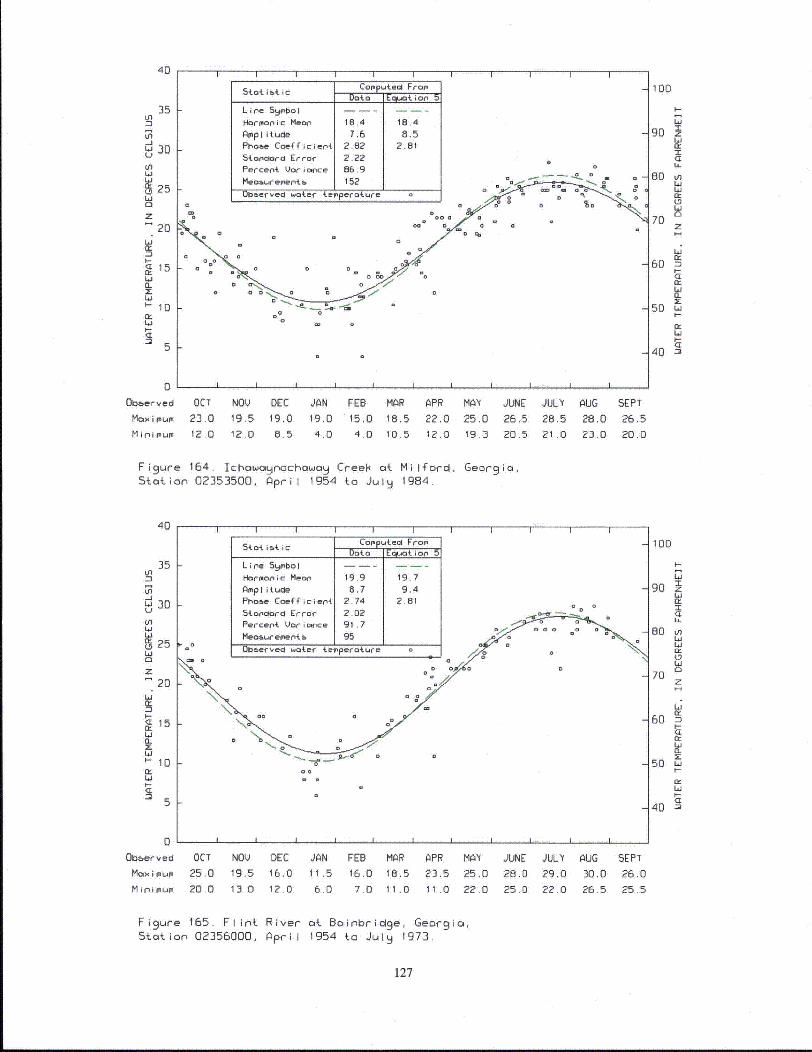
40
35 kInin-.1Lj 30
inLa
ýu 25LI
20
15
Li
1I 10
LI
5~c~i ~ Computed From~
Harponic Meanl 18.4 18.4
Am~pI itude 7.6 8.5Phase Coe
4ffcient 28B2 2.81
Stoniziod Error 2.22
i I I I
kPercent Vari wce 86.9 o
Meobreimentf j 1521 b~erved wat~er temperat.ure
100
I-
6190 z
IU..
80 Vn614
70 z
60
50 6.4-
40 "•5
0
Obberved
MC> mum
Mini pmum
i i i i i A
OCT NOV DEC JAN FEB MAR
23.0 19.5 19.0 19.0 '15,0 18,512.0 12.0 8.5 4.0 4.0 10.5
APR MAY JUNE JULY
22.0 25.0 26.5 28.5
12.0 19.3 20.5 21.0
AUG
28.0
23.0
SEPT
26.5
20.0
Figure 164. Ichawagnochawoa Creek oa Milford, Georgia,Station 02353500, April 1954 to July 1984.
40
35In
LlS30U3,JOI•n
w2 5
20z
S20
I-
S15LI
•-1061
5 ~ ~ Cop P ~ uted F of-
Line Symnbal -- --
Harmronic Mean 19.9 19.7Amoplitud~e 8.7 9.4P1habe Co4~fZicient 2.74 2.815toaolobrc Error 2.02Percent. Var i ce 91.7
0 Meoserement& 95
Obe~erved w.at.er tepera4.ure 0'
100
7-
90oiv
T
80 V)
70
6 1
50 L
50 61
0
Obberved
MaxiimumM in im
OCT NOV DEC JAN FEB MAR
25.0 19.5 16.0 11.5 16.0 18.5
20.0 13.0 12.0 6.0 7.0 11.0
APR MAY
23.5 25.011.0 22.0
JUNE JULY
28.0 29.0
25.0 22.0
AUG
30.0
26.5
SEPT
26.0
25.5
Figure 165. Flint River at Boinbridge, Georgia,Station 02356000, April 1954 to July 1973.
127
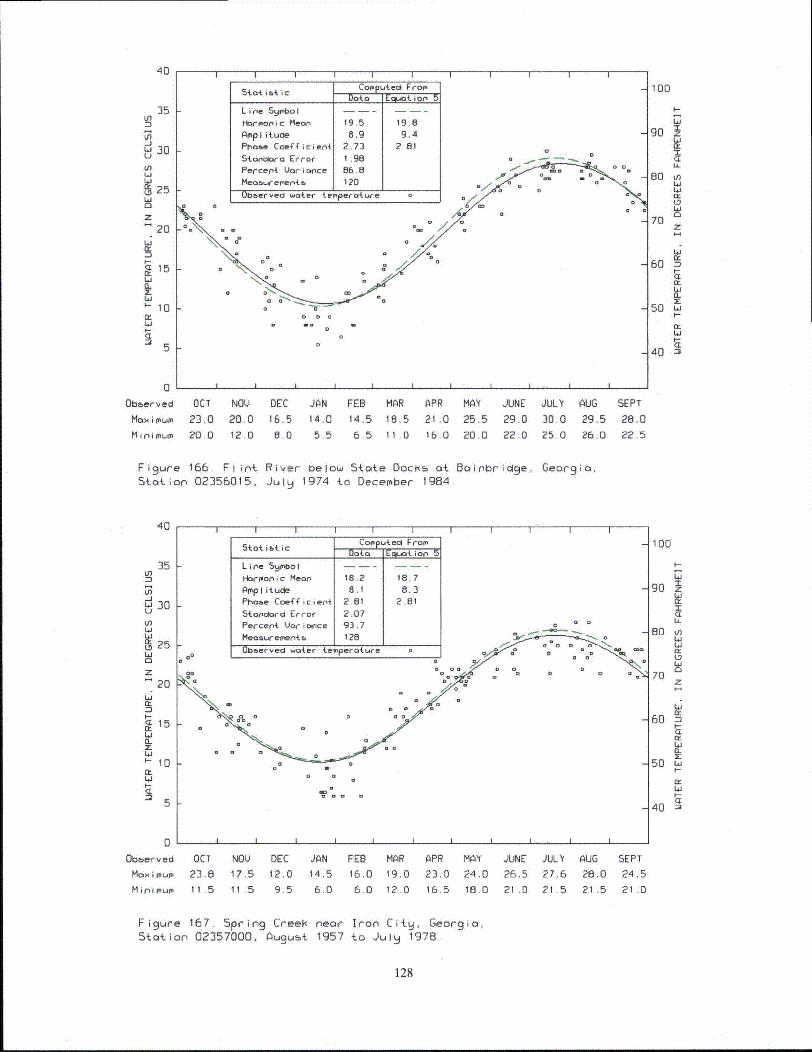
40
35
stot .A. i c Daa aoti--5Lin'e Syiobol
Hacrmonic Mean t9.5 19 6A¶eplituoe 8.9 9.4
tnLn-J
30
UiLi
25
z20
15
I-
10
Li
I I I I I
Stoa.clard Error 1 .96 8Percenti Var ianfce 8 6.06 c
Meaawep'ernte 11¶20U0D0erveI3 water t0?rperature 0
I I I I6
10D
I-
go<LI
80 Ui9Li
70 z
60
1-
50 Li-•Q:
40
00beber.ved
Maximu
Mi n imum
OCT NOV
23.0 20,0
20.0 12.0
DEC JAN16.5 14.0
8.0 5.5
FEB MAR14.5 18.5
6.5 11.0
APR MAY JUNE JULY AUG
21 .0 25.5 29.0 30.0 29.516.0 20.0 22.0 25.0 26.0
5 at Bainbridge, Georgia,1984.
SEPT
28.0
22.5
Figure 166. Fl int River below State DocfStation 02356015, July 1974 to December
40
35 -
Ln-Jw 30UIn
u 25Li
0z
S20
Lia:D
~L15a_
X 10
I- 1
00
5S.ot ibAic Computecl Fram
Line Sqmbol -- -
Ha~rmonic Mean 16.2 18.7
AmplIit ude 8,1 8.2Phofte Coefficient 2.61 2.81Stanclarcd Errar 2.07Percent Vorictnce 93.7
Measu.eenecte 128
0bobervedl water tetrperoture o
I I I
100
I--
I90 z
ILa
80 v)
70
60 a
50 L-
I-
40 a
k-
I-
5 1-
00bt~ervedMax i mumo
Mpinimum
OCT NOV DEC JAN FEB MAR
23.8 17.5 12.0 14.5 16.0 19.0
11.5 11 .5 9.5 6 0 6.0 12.0
APR MAY JUNE JULY
23.0 24.0 26.5 27.6
16.5 18.0 21 .0 21.5
AUG
28.0
21 .5
SEPT
24.5
21 ,O
Figure 167. Spring Creek near Iron City, Georgia,Station 02357000, August 1957 to July 1978.
128
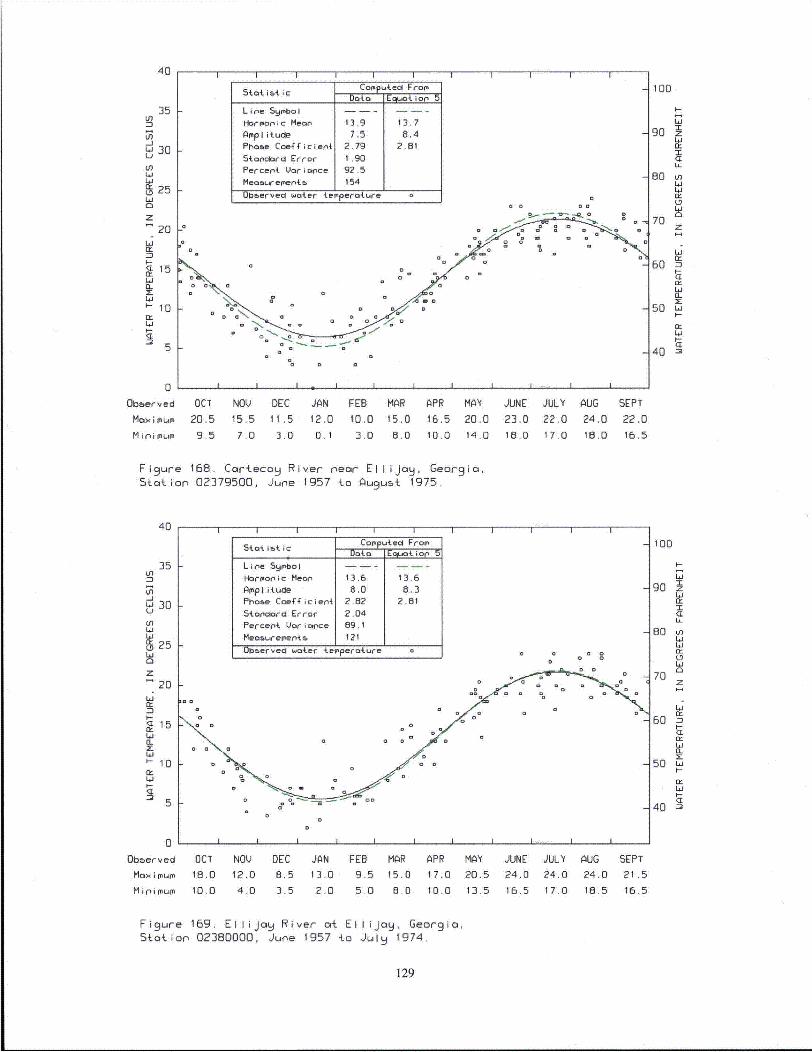
40
35Ln
-JW 30
L,
25Li
z20
ZII--•15
Li
I- in
I I I I I I I I I
5tot ibt ic ComFui.eo FromData Equat ion
L i ne Slrn1o I
Harmonic Mean 13.9 13.7
Amplitude 7.5 8.4Phone Coefficient 2.79 2.81
Stanoclrd Error 1 .90Percent Variance 92.5
Measurements- 154
Observecl water toerperature 0 0
I I, I I P---&
n~ 0 o a €
12 0 a 0
D~ ~ D 0
D 0 0
100
90 z"I
80 I
70 z
60
50 LiI-
•i40 a
a1
5
0'
Obberved
Maxium
M i i MUMII
OCT
20.5
9.5
NOV DEC JAN FEB MAR APR MAY JUNE JULY
15.5 11 .5 12.0 10.0 15.0 16.5 20.0 23.0 22.0
7.0 3.0 0.1 3.0 8.0 10.0 14.0 16.0 17.0
AUG
24.018.0
SEPT
22.0
16.5
Figure 168. Cartecoy River near Ellijay, Georgia,Station 02379500, June 1957 to Ougust 1975.
40
In
_n
'- 30LI
L,
• 25
L-
W
20Li
15IL
~-10
5
I I I I I I II IIIstt sticCOPPe ° From IData Eewoti on
Line 59ybol ---
Horionic Mean 13,6 13.6
AmpIitude 8.0 8.3Phaoe C•:•fficien+ 2.82 2.81
Staonlord Error 2.04
Percent Vorionce 89.1
Measur'ements 121
Observed water terperature o
I I I I III I I I I
100
I-
Lv
z
60 m
Li
Li
a-50
70
60 n
t-
50 L.iI-
40 -•
0
Observed
MaximumMi n imum
OCT NOV DEC JAN FEB MAR APR MAY
18,0 12.0 8.5 13,0 9.5 15.0 17.0 20.5
10.0 4.0 3.5 2.0 5.0 8.0 10.0 13.5
JUNE JULY
24.0 24.0
16.5 17.0
AUG
24.0
18.5
SEPT
21 .5
16.5
Figure 169. Ellijay River at Ellijoy, Georgia,Station 02380000, June 1957 to Julq 1974.
129
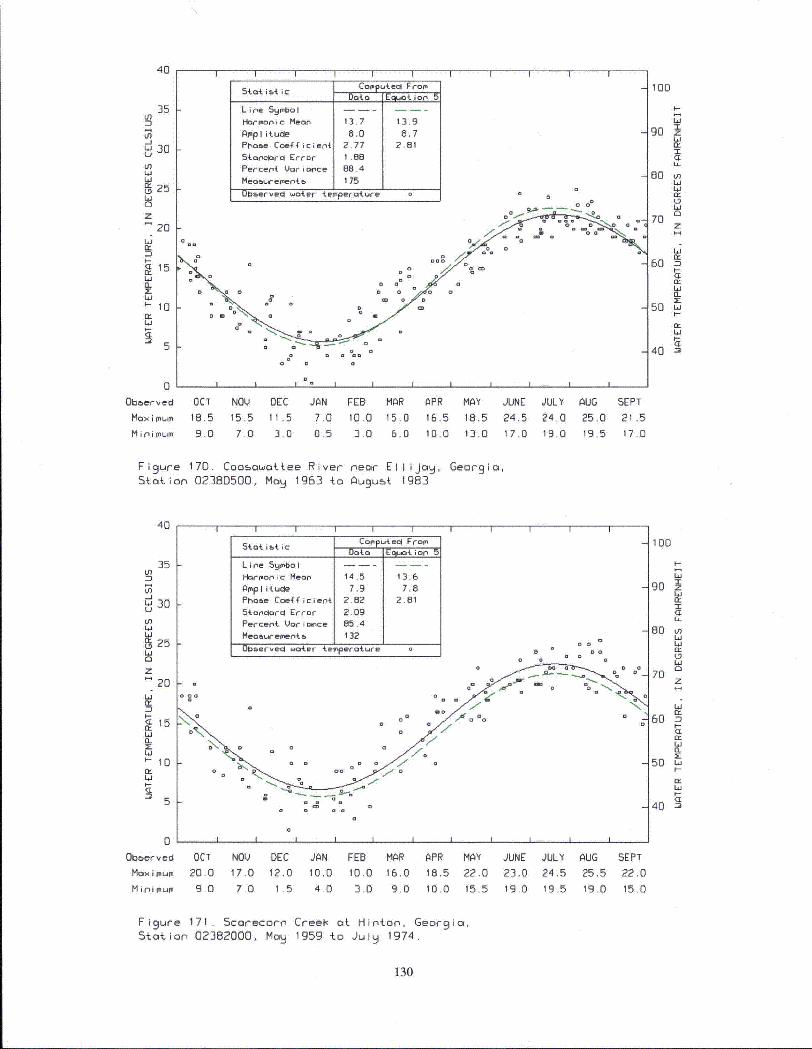
40
35Ln
-JLi 30UL
cn
25Li
0z
S20,5
15Lia-
La'-10
5
0
Stat istic Copputecl From
Data E Iuo ion-5
Line Symbol - -
Harmoni c Mean 13.7 13.9AmpIitude 8.0 8.7Phsoe Coefficient 2.77 2.81
Steo'lra Error 1 .88
Percent Var iance 88.4
Meoa-ements- 175
Observeol water terperature 0
a a 0 0 0 o
100
U-
LL90 zIz
80
I,
50L4
70
60
50 L.iI-
40 "•
0beberved
Max1i mum
Min imum
OCT NOV DEC JAN FEB MAR APR MAY JUNE
18.5 15,5 11 .5 7.0 10,0 15,0 16.5 18.5 24.5
9.0 7.0 3.0 0.5 3.0 6.0 10.0 13.0 17.0
JULY
24.019.0
AUG
25.0
19.5
SEPT
21 .5
17.0
Figure 170. Cooaowattee River near Ellijay, Georgia,Station 02380500, May 1963 to Ou9 uft 1983.
40
35LO
Ln
U,L(
0 25Li
20
n"
=3
a.1
z
10
Li
I I II I I I I I
Stat ist ic Comutee FoData •Ecpotion 5
Line Symbol ---- -
Hrmonic Meon 14.5 13.6
Pmplitu1e 7.9 7.8
Phase Coefficien{ 2.82 2.81
Stoncloro Error 2.09
Percent Vori oce 85.4
Measurements- 132
Oboserved water terperoture 0 00
0 . 0 Io
0° o =
a o= a o0
100
90
80 nLi
Li
70 z
60 nCE
50 Li4-
40 '•Z?
0Oboerved
Maximum
M ipi mum
OCT NOV DEC JAN FEB MAR APR MAY20.0 17.0 12.0 10.0 10.0 16.0 18.5 22.0
9.0 7.0 1 .5 4.0 3.0 9.0 10.0 15.5
JUNE
23.0
19.0
JULY AUG
24.5 25.5
19.5 19.0
SEPT
22.0
15.0
Figure 171. Scarecorn Creeh at Hinton, Georgia,Station 02382000, May 1959 to July 1974.
130
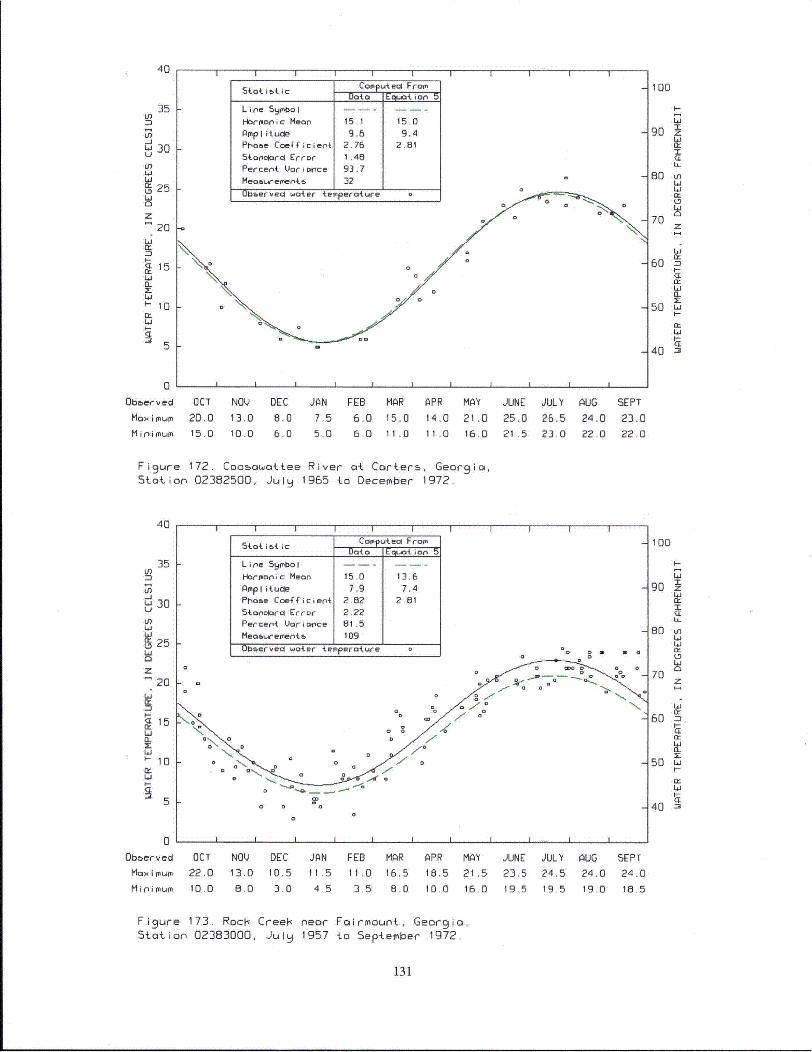
40
35 FIn
W30
InLO
(LD25Li
20
15
L'i'-10
40I I I I I
54.ot ibic CopputeclFroPm
Lin~e Sym~bolHarm~onic Moean 15.1 15.0
Amp Iit ud 9.6 9.4Phone Coeficient{ 2.76 2.81
54.orclord Error 1,.48
Percent. Variance 93.7
Moo orrement& 32
I.-
I I I I I
IoUamervecl woater 4 .orpera4 ure
1 00
g-
80
90zh
80 nLii
70L4
I--
7O
cz
40 -,
0
Obberved OCT NOV DEC JAN FEB MAR APR MAY
Maximum 20.0 13.0 8.0 7.5 6.0 15.0 14.0 21.0
Minimum 15.0 10.0 6.0 5.0 6.0 11.0 11.0 16.0
Figure 172. Coosawattee River at Carters, Georgia,Station 02382500, Julyj 1965 4o December 1972.
JUNE JULY
25.0 26.5
21 .5 23.0
AUG
24.0
22.0
SEPT
23.0
22.0
40
~35:3In
-JW 30
LiWLq25
Li
20
20LiI-0
5
0
I I I I II I I I
dCopputeo FromOnt{o E oE t . i ior 5
Line Symbol . .. ..
Harmonic Mean 15.0 13.6
Ampl itucle 7.9 7.4Praoe Coefficient 2.82 2.81St onrclard Error 2.22Percent Vor im4ce 81.5
Meoo emer'4.b 109Obierved wOater temperoture
I I I I I I II II
100IDO
go90 z
80 c
70 Lz
80w60
50Li
40
Obberved
Max imum
M in~i mum
OCT NOV DEC JAN
22.0 13.0 10.5 11.5
10.0 8.0 3.0 4.5
FEB MAR
11.0 16,5
3.5 8.0
APR MAY
18.5 21.5
10.0 16.0
JUNE JULY AUG
23.5 24.5 24.0
19.5 19.5 19.0
SEPT
24.0
18.5
Figure 173. RocH Creek near Fairmount, Georgia,Station 02383000, Julq 1957 to September 1972.
131
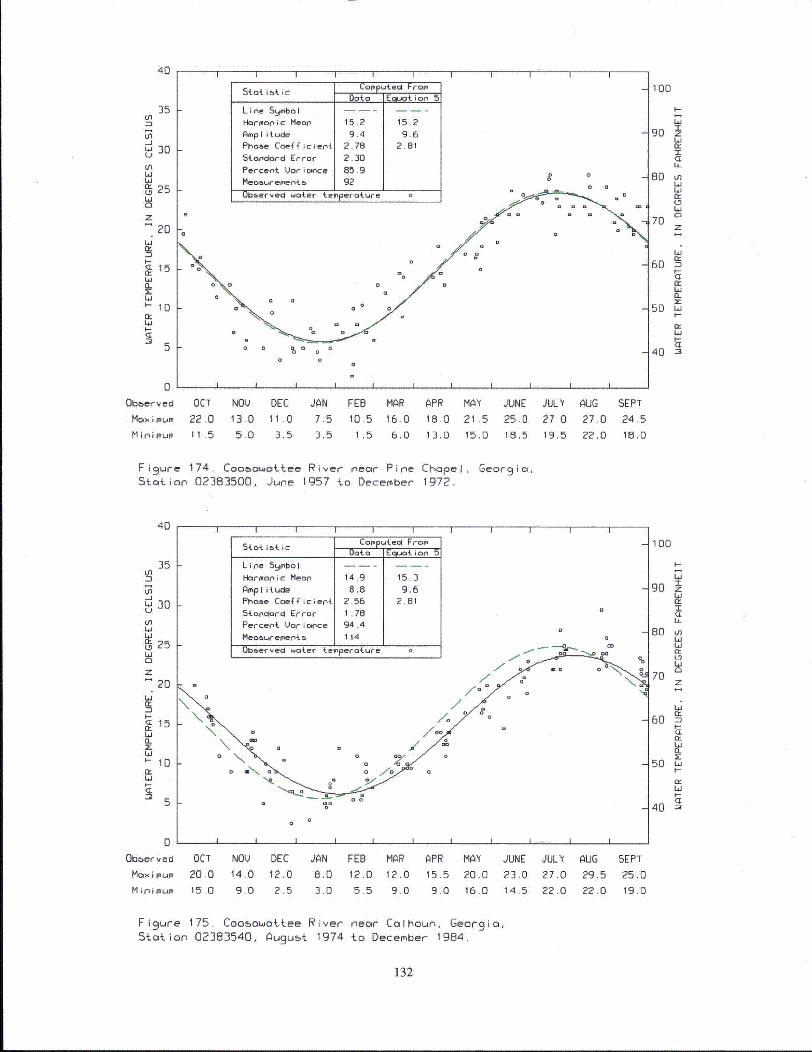
40
350n
-J30
UILaLa
S25U
0z
S20
I-.
15CLa0.
'- 10
oUsc ~ Coputecl FromDaot El..ot ion 5
Line Symbol !
Harmonic Mean 15.2 15.2
Amplitude 9.4 9.6
Phoae Coefficieen 2,78 2.81
Standard Error 2.30
Percent Variance 85.9
Measur ement_ 92
Obmervecl wa4er temperature
0 o o0 o
0
0
0 0 0oo
100
I.-
-a
90 z
"3:Lah
80 InLa
7070
z
W
60 m
a-
50 L
40 235
0Ob&erved
Maximum
Mini mum
OCT NOV DEC JAN FEB MAR
22.0 13.0 11.0 7.5 10.5 16.011.5 5.0 3.5 3.5 1.5 6.0
APR MAY JUNE JULY AUG
18.0 21.5 25.0 27 0 27.0
13.0 15.0 18.5 19.5 22.0
SEPT
24.5
18.0
Figure 174. Cootooattee River near Pine Chapel, Georgia,Station 02383500, June 1957 to December 1972.
40
35in
W30
In
U
In
W
'N 2 5La
20
10
n,
I I I II I I I I I
Stot istic Coppute FromData E_____ ion D
Line SmbolHorionic Mean 14.9 15.3Amplitude 8.8 9.6Por1ae Coefficient 2.56 2.81Staonoard Error 1 .78 0
Percent Varicance 94.4
Measurementb 114 o
Obeerved water temperoture W _-,o W
S I I I II I I I I I
100
T-
90 tn
I_
8t0 In
70
La
60 D1i-
a:
50 La
4:ha
40 -2Z)
0
Obbervad
Maximum
Minimum
OCT NOV DEC JAN FEB MAR APR MAY JUNE JULY
20.0 14.0 12.0 8,0 12.0 12.0 15.5 20.0 23.0 27.015.0 9.0 2.5 3 0 5.5 9.0 9.0 16.0 14.5 22.0
AUG29.5
22.0
SEPT
25.0
19.0
Figure 175. Coosouattee River near Calhoun, Georgia,Station 02383540, Auqu5t 1974 to December 1984.
132
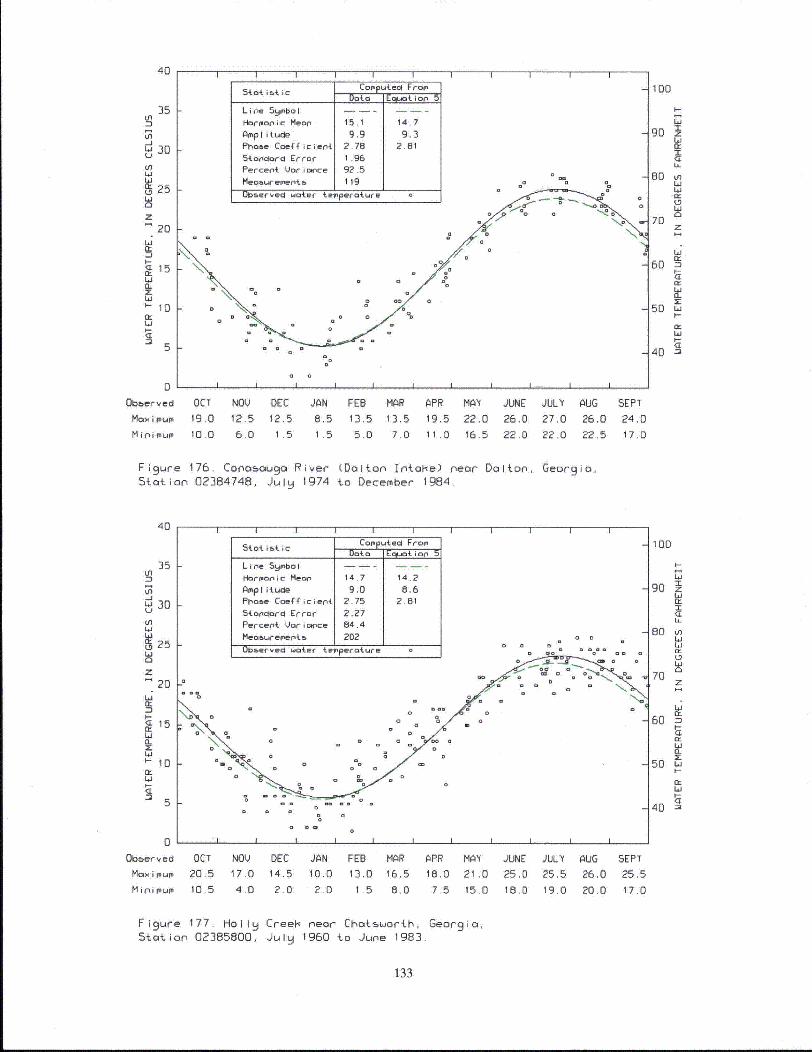
40
35 k
tnLa
30
20
EL
10
5
20Laere
Moimu
Mirl1LI
s5
LiHoAm
PhSk
Pe
Me
-Os
I-
Copputec Fromn
n~e Syjobol - --
rrponic Mean' 15.1 14.7
P Ii tude 9.9 9.3ose Coefficierni 2.78 2-81
or'dard Error 1 .96
rcent4 Vor ionce 92.5oObUreIOtb_.0 119
r~ervec* waterf t.emperature 0
0~ 00
100
I-
90 z
L..
80 tnW
70z
60 Dr-CEQ:
50 w.1-
40 -I@
I I I I I I I .- I
OCT NOV DEC JAN FEB MAR
19.0 12.5 12.5 8.5 13.5 13.5
10.0 6.0 1.5 1.5 5.0 7.0
APR MAY19.5 22.0
11.0 16.5
JUNE JULY AUG
26.0 27.0 26.0
22.0 22.O 22.5
SEPT
24.017.0
Figure 176. Conoaouga River (Dalton Intake) near Dalton, Georgia,Station 02384748, July 1974 to December 1984.
40
Ln
J)
30
U,La
LD25La
20
L-
I-
ci15
CLX10
LaI- 1
I I I I I
S4.o4.i~ c ¢o~u4.ed FromStat st gaDot EqlUa4 ion 59
Lirne 59mybo I
Harmon ic Meon 14.7 14.2
AmpIplitude 9.0 8.6Phasoe Coefficient 2.75 2.81
Staonontard Error 2.27Percent UVar ice 84.4
Meoswrement5 202 0 o
Observed wot4er temperature 0
0I
0 D
100
La
90 z
U-
Lj
70
60-
50 Li
40 -3Z)
0Obber ved
Max impum
Min imrum
OCT NOV DEC JAN FEB MAR
20.5 17.0 14.5 10.0 13,0 16.5
10.5 4.0 2.0 2.0 1.5 8.0
APR MAY JUNE JULY AUG
18.0 21.0 25.0 25.5 26.0
7.5 15.0 18.0 19.0 20.0
SEPT
25.5
17.0
Figure 177. Holly Creek near Chatsworth, Georgia,Station 02385800, July 1960 to June 1983.
133
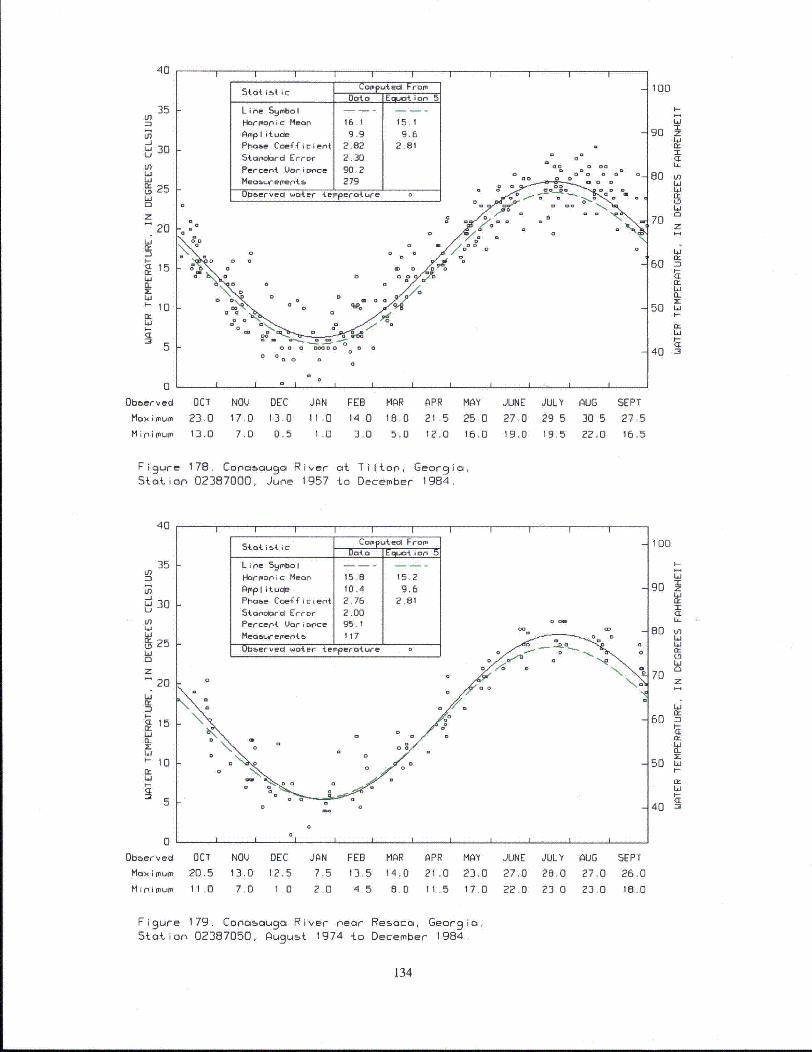
40
35
W
'(D 25-j
20(I-
Uj
<L 1(L
~ 5
20
L,zI-
I I I I i I i I I
statistic ComPuPtedFrom
Dota Equ.Aot ion 5
Line Symbol ----
Hormonic Mean 16.1 15.1
Amplitude 9.9 9.6
Phsoe Coefficient 2.B2 2.81
Standrord Error 2.30 o 00
Percent Uori nce 90-2Measurementes 279 j _____o__
Observed~ water temperature
o~~ ~ D0ao
.0 oo o° o00
mDo
=~~ 0 0
100
I-
9o z
I.
80 U-)LiLi
Li
70 z
60
Li
50 Li4 -
40 m
°\
Obberved OCT NOV DEC JAN FEB MAR APR MAY
Maximum 23.0 17.0 13.0 11.0 14.0 18.0 21.5 25.0
Minimum 13,0 7.0 0.5 1.0 3.0 5.0 12.0 16.0
Figure 178. Conabauga River at Tilton, Georgia,Station 02387000, June 1957 to December 1984.
JUNE JULY AUG
27.0 29.5 30.519.0 19.5 22.0
SEPT
27.516.5
40
35Ln
Ln-JLi 30U,LE
025
(zW
20
n,I-- 2-0
Li
Ob(eL 15
EL
'-10
5
0
0bber wed
Maximum
Mini mnum
K:
I I I I I I I
4 Stitic Copputed FromData Eo/at ior,5
Line Symbol ---- -
Harmonic Mean 15.8 15.2Amplitude 10.4 9.6Phoae Coefficient 2.76 2.81
Staoalord Error 2.00Percent Variance 95.1 0 0
Measurements 117
0baerved water temperatLure
0 o00 0
100
90 zI"
Li-
80 knLiti
70
60
50 Li4-
40 •
OCT NOV DEC JAN FEB MAR APR MAY JUNE JULY AUG20.5 13.0 12.5 7.5 13,5 14.0 21.0 23.0 27.0 28.0 27.0
11.0 7.0 1.0 2.0 4,5 8.0 11.5 17.0 22.0 23.0 23.0
SEPT
26.0
18.0
Figure 179. Conosauga River near Resoco, Georgia,Station 02387050, August 1974 to December 1984.
134
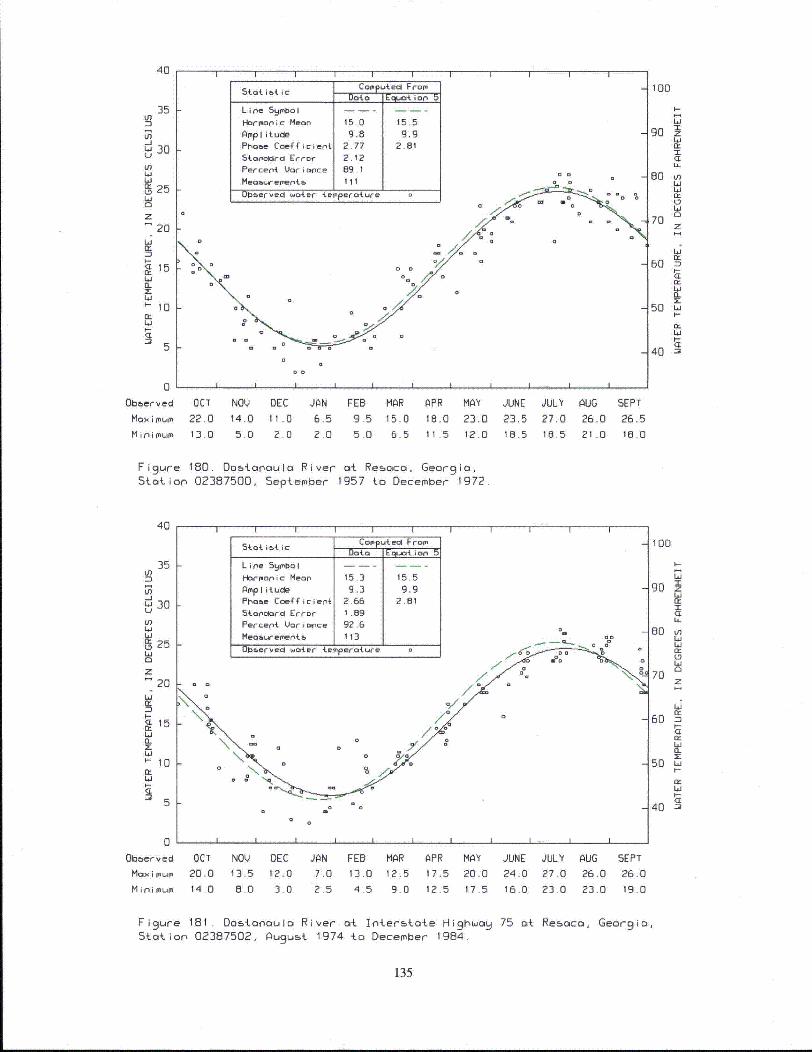
40
35Lf
-jW 30
Li•€25
hiLa
0 20z
20La
n ~15(L0_
10
5
I I I I I II II
sto* ist ic COPPutec4FromData Eclot i-o-n 5
Lin'e 59mbao -- -- -
Harmlon ic Meoa 15.0 15.5
Amplitude 9.8 9.9Phoae Coeficien{ 2.77 2.81
Sonclord Error 2.12
Percent Var iance 89.1Mea:•uwement s 1 1o
0baervedI wtaer terperoture .
0 D
oo
D
100
I-
90 z
,a
,70 z
60 MLi
50
40 Li
0Obberved
Moximum
Miiomum
OCT NOV DEC JAN FEB MAR APR MAY JUNE JULY AUG
22.0 14.0 11.0 6.5 9.5 15.0 18.0 23.0 23.5 27.0 26.013.0 5.0 2.0 2.0 5.0 6.5 11.5 12.0 18.5 18.5 21.0
SEPT
26.518.0
Figure 180. 0o0aonculo River at Rebcco, Georgia,Station 02387500, September 1957 to December 1972
40
U3(J 30
25Lia
O
1-
'10.
t
Statistic CoputeU FromData Ecsa+ i on 5
Line Smbol -- -
Harmonic Mean 15.3 15.5Amplitude 9.3 9.9Phaoe Coefficient 2.66 2.81
5to4niord Error 1.89
Percent Variance 92.6
I'ecauregoenib~ 113 0
0okmervecI wat.er temoperature
I Io
100
I-
L,
go z-
80 W
Li
7O
70
60I-
Q:
50 LiI-
I-
AN •D t
40
0Obberved
Maxi mum
Minimum
OCT NOV DEC JAN FEB MAR APR MAY JUNE JULY
20.0 13.5 12.0 7.0 13.0 12.5 17.5 20.0 24.0 27.0
14.0 6.0 3.0 2.5 4.5 9.0 12,5 17.5 16.0 23.0
AUG
26.0
23.0
SEPT
26,019.0
Figure 181. Oostanoulo River at Interstate Highwag 75 at Resaco, Georgia,Station 02387502, August 1974 to December 1984.
135
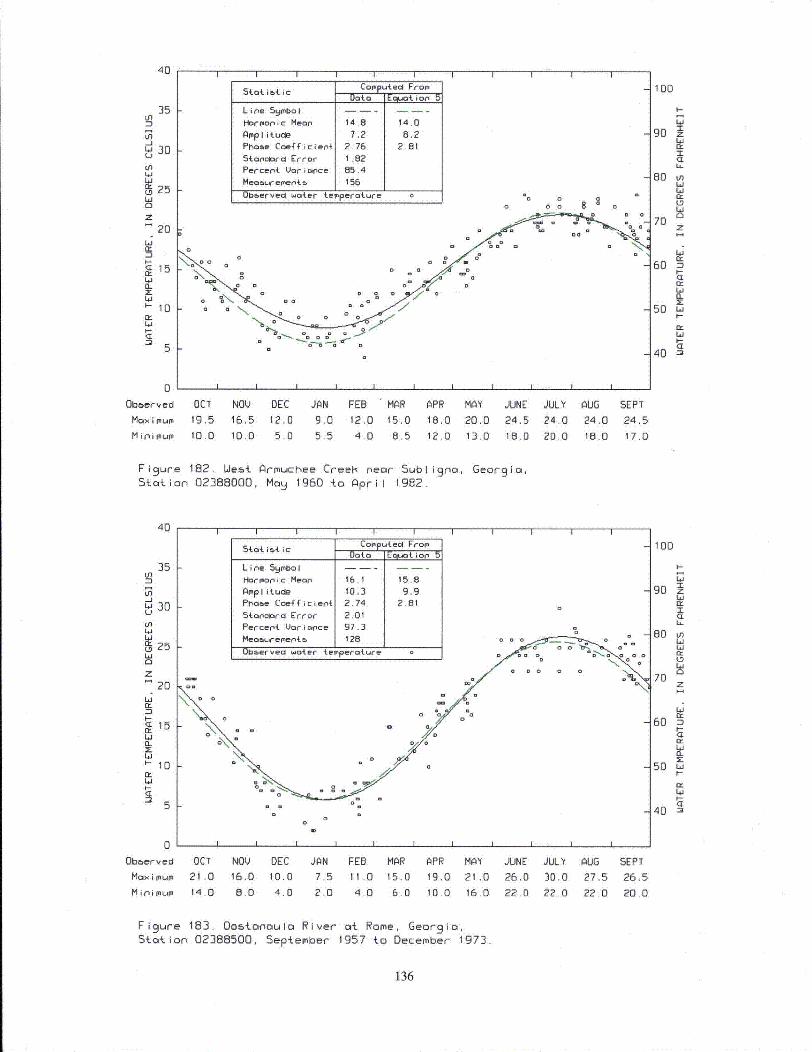
40 4 I I I I I I I I I I
35 kLn
-JW 30Jo
Lia
u25LJ0z
20
Lr
15CL
'-10
IX
L i ne yi.bo I - -
HaoIrmonic Mean, 14.8 14.0
Amplitude 7.2 8.2Phas~e Coefficient, 2.76 2.81
Stncar'dor Error 1 .82Per-cent Uori wce 85.4
Meoweiment't 156
F
UID~ervecl water t.emperature 00
a 0
o Do
D a
100
I-
Li909
z
Ia
80 In
Z)
0
0b~erved
Maximnum
M i ni mum
OCT NOQ DEC JAN FEB MAR
19.5 16.5 12.0 9.0 12.0 15.0
10.0 10.0 5.0 5.5 4.0 8.5
APR MA'
18.0 20.0
12.0 13.0
JUNE JULY AUG
24.5 24.0 24.0
18.0 20.0 15.0
SEPT
24.5
17.0
Figure 182. West Armuchee Creek near Subligno, Georgia,Station 02388000, MaH 1960 0o April 1982.
40
Ul
Ln
Li
LU 30
u 25La
0
I1
CL
H10
Statisti ,Cfpp edFrom'
Lin~e Symobol -
Harmon'ic Mearn 16-1 15.8AmIplituclie 10.3 9.9Phoae Coefficient 2.74 2.81
Stonolarct Error 2.01Percen't Variance 97.3
UID~ervedl water 4r'perature Do
N0
I I I 4
Li
I D
9 zI
80 n40
7i
70
60 n
50 L.iI-
I-:
40 a
0
Obberved
Maximum
M inpi mum'
OCT NOQ DEC JPN FEB MAR APR MAY21.0 16.0 10.0 7.5 11.0 15.0 19.0 21.0
14.0 8.0 4.0 2.0 4.0 6.0 10.0 16.0
JUNE JULY AUG26.0 30.0 27.5
22.0 22.0 22.0
SEPT
26.5
20.0
Figure 183. Oosiopaulo River at Rome, Georgia,Station 02388500, September 1957 to December 1973.
136
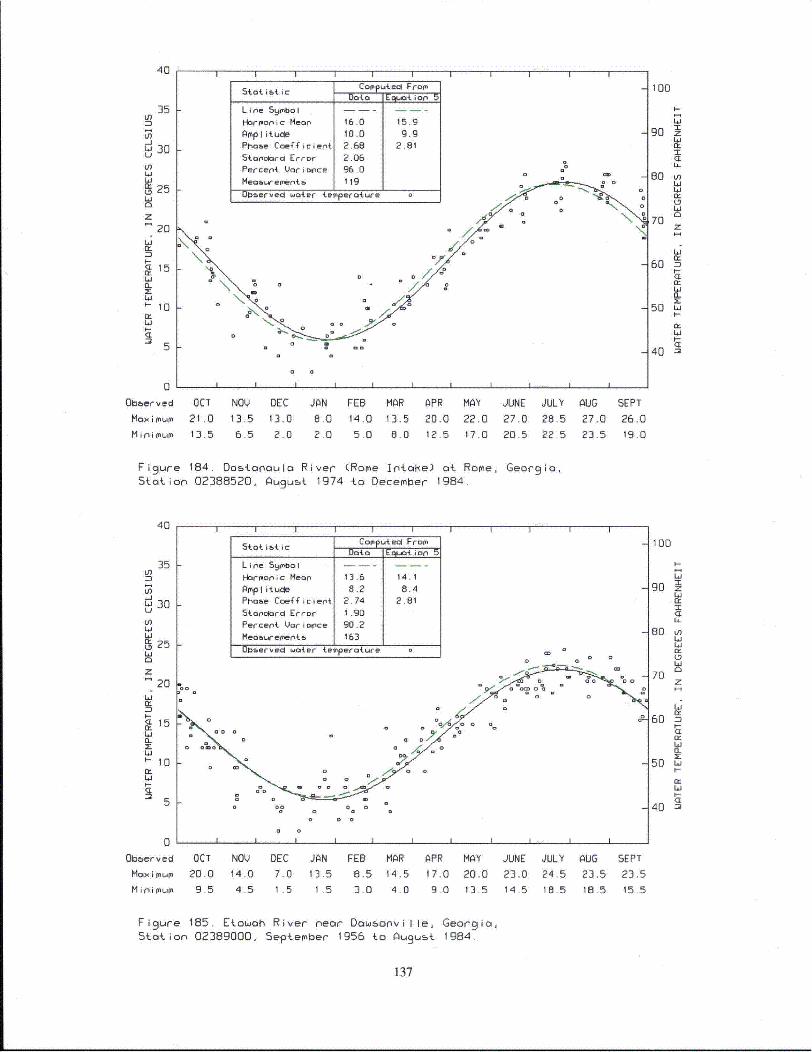
40
in
in
ýLý 25
20
L.1
~15EL
10
0
Obberved
Maximu
Mini mourn
stati~tic CPP ecdFr0f a
Lin~e Syiobol -- - -
Habrm~onic Mean4 16.0 15.9Amnplitucle 10.D 9.9Ptoae Coefficent 2.68 2.81St~andard Error 2.06
Percent& Vori ance 96.0Measureioenz.- I 19
0kmervecl water ternperciture o
0 K0
0 I I
100
90 zI
n,-
ý70z
60Q.
50 1.I-
40 -
OCT NOV DEC JAN FEB MAR APR MAY
21.0 13.5 13,0 8.0 14.0 13.5 20.0 22.013.5 6.5 2.0 2.0 5.0 8.0 12.5 17.0
JUNE JULY
27.0 28.5
20.5 22.5
AUG
27.0
23.5
SEPT
26.0
19.0
Fi 9 ure 184. 0osLanaula River (Rome Intafle) at Rome, Georgio,Stoaion 02388520, August 1974 to December 1984.
40
35in
in
U30in-J
0 25
z
20
I-15
IL
I
{idComutel FromData Eelt {io5
Line Syrnbol -- - -
aormoic Mean 13.6 14.1Amplitule 8.2 8.4Phaoe Coeficient 2.74 2.81
Ston'aard Error 1.90Percent Vori wce 90.2Meo5eernt5 163Obeerved water terperature 0
oo o°a • 0
IG o I I I I
100
90 z
C
L980 Ln
70 z
60 nI-
0E:
50 1.I-
ci
4nl •5,w
0
Obberved
Max i murn
M i ri i mum
OCT NOV DEC JAN FEB MAR APR MAY JUNE JULY
20.0 14.0 7.0 13.5 8.5 14.5 17.0 20.0 23.0 24.59.5 4.5 1.5 1.5 3.0 4.0 9.0 13.5 14.5 18.5
AUG
23.5
18.5
SEPT
23.5
15.5
Figure 185. Etowah River near Dowsonville, Georgia,Station 02389000, September 1956 to August 1984.
137
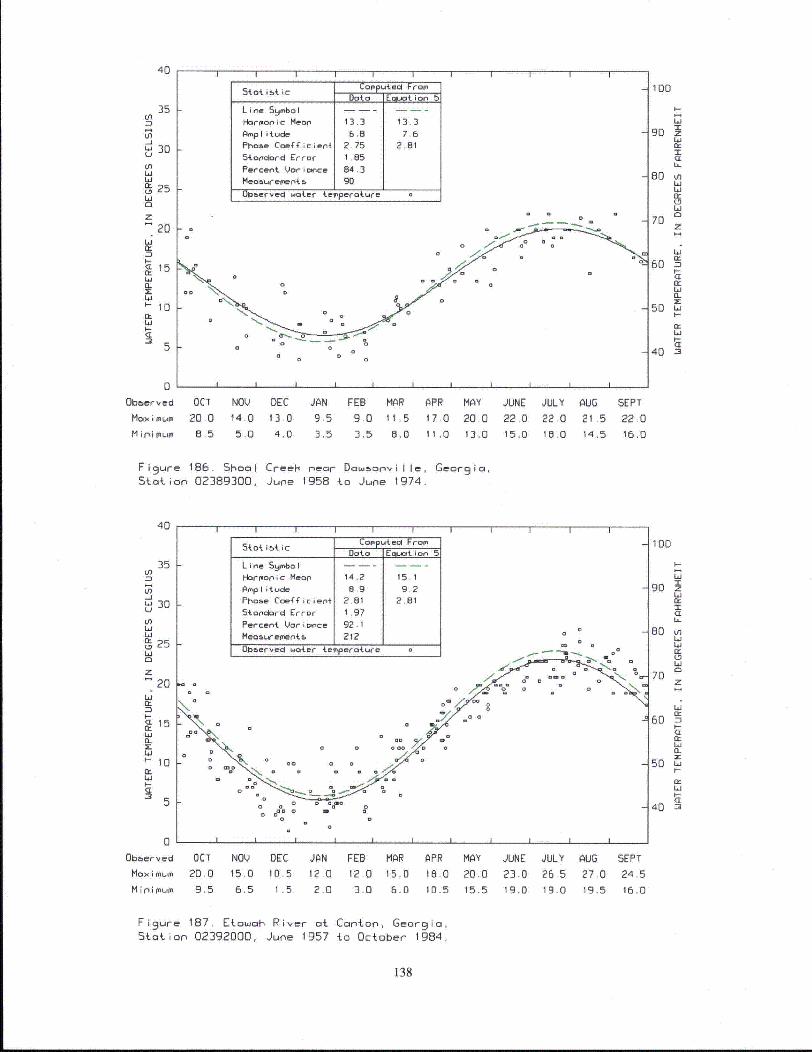
40
3535tn
-J
30UP
LaLiS25
z
20ia
<7 15
•"10La
I I I I I I i
stot it ic COmPuted FromData EF,,ot ion 5
Line Symbol
Harmornic Mean 13.3 13.3
Amplitude 6.8 7.6Phoase Coef•icient 2.75 2.81
Standard Error 1 .85
Percent Uor ionce 84.3Meoair ementb 90
Obtiervecl woter temperature
0 I
100
I-
90 z
La
80 U)
U-8Dt5
La
70 z
La
60 S
X:La
440 La5
0Observed OCT NOV DEC JAN FEB MAR APR MAY
Moximum 20.0 14.0 13.0 9.5 9.0 11.5 17 0 20.0
Minimum 8,5 5.0 4.0 3.5 3.5 1.0 11.0 13.0
Figure 186, Shoal Creek near DOawsonville, Georgia,Station 02389300, June 1958 to June 1974.
JUNE JULY
22.0 22.0
15.0 I1 .0
AUG
21 .514,5
SEPT
22.016.0
40
35En0n
-J30
LIU)
LaLa• 25
20z20
La
a:<L15La
EL
L- 10a:LaI-_
I
I I I I I I I III
5tot is ic Computec FromDato Equat ion 5
Line Symbol - - -
Harmonic Mean 14.2 15.1
Amplitude 8.9 9.2
Phome Coefficient 2.B1 2.81
Standard Error 1 .97
Percent Variance 92.1
Measo4,ements 212
Otnerved waoter temperature a
o o~= =.0m
0 a 00
100
90 z
La
80 V)LaLal:
La
70
60 •
a--
50 LaI-
In-•5
40
0Observed OCT NOV DEC JAN FEB MAR
Ma0ximmum 20.0 15.0 10.5 12.0 12.0 15.0APR MAY JUNE JULY AUG SEPT
18.0 20,0 23.0 26.5 27.0 24.5
Minimum 9,5 6.5 1.5 2.0 3.0 6.0 10.5 15.5 19.0 19.0 19.5 16,0
Figure 187. Etowah River at Canton, Georgia,Station 02392000, June 1957 to October 1984.
138
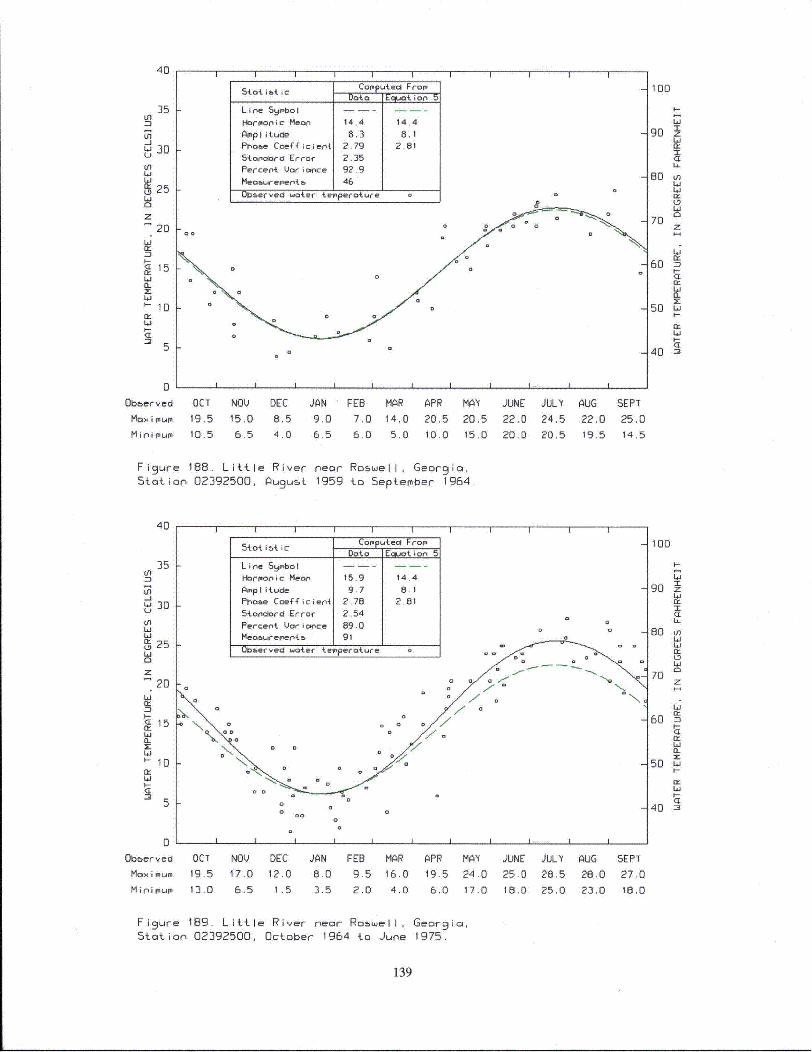
40
-Jw 30U,
25
z20
n-
.15
Li
5
I I I I I I III
COPP ted FromDot.o Eao.t ion' 5
Line Symbol ... ...
Harmon ic Meon 14.4 14.4
Amlplitude 8.3 8.1
Phoae Coefficient 2.79 2.815tondaord Error 2.35
Percent Vaoriance 92.9
Meosernentr, 46
Uoserved .0ter terpe
I-oo
roture
0 0
0
o 0 0 0
100
I-
90
I
60 inLJLi
70 z
60I-
50 LuI-
40
O
I0
Ober ved
MON i mum
M i n i mum
I
OCT NOU DEC
19,5 15.0 8.5
10.5 6.5 4.0
JAN
9.0
6.5
FEB MAR
7.0 14.0
6.0 5.0
APR MAY
20.5 20.510.0 15.0
JUNE JULY AUG
22.0 24,5 22.0
20.0 20.5 19.5
SEPT
25.014.5
Figure 188. Little River neor Ro.well, Georgia,Stoaion 02392500, Augubt 1959 to September 1964
40
35 .Un
in-JL 30U
(1)LiLi0 25L.1
0z
S20
L.1
•15n
I-
Lo 10
5
OL
I I I I II III
5totibtic Computel From.ooEquotion 5
Line Symbol ......
Harmonic Mean 15.9 14.4
Amplitude 9.7 8.1
Phaoe Coefficient 2.78 2.81
Standard Error 2.54
Percent Uarichce 89.0 oMeo&wremento 91
Observed water temperoture
b
a°a
007
100
I-jLi
90 z
80 IfLiLi
Ln
70
60 SI.-a:
50 L.iI-a-
W
40 2
0Obberved
Moximum
Minimum
OCT NOL. DEC19.5 17.0 12.0
13.0 6.5 1.5
JAN FEB MAR APR MAY JUNE JULY AUG
6.0 9.5 16.0 19.5 24.0 25.0 28.5 28.0
3,5 2.0 4.0 6.0 17.0 IB.0 25.0 23.0
SEPT
27.0
18.0
Figure 189. Little River near Ro~well, Georgio,Station 02392500, October 1964 to June 1975.
139
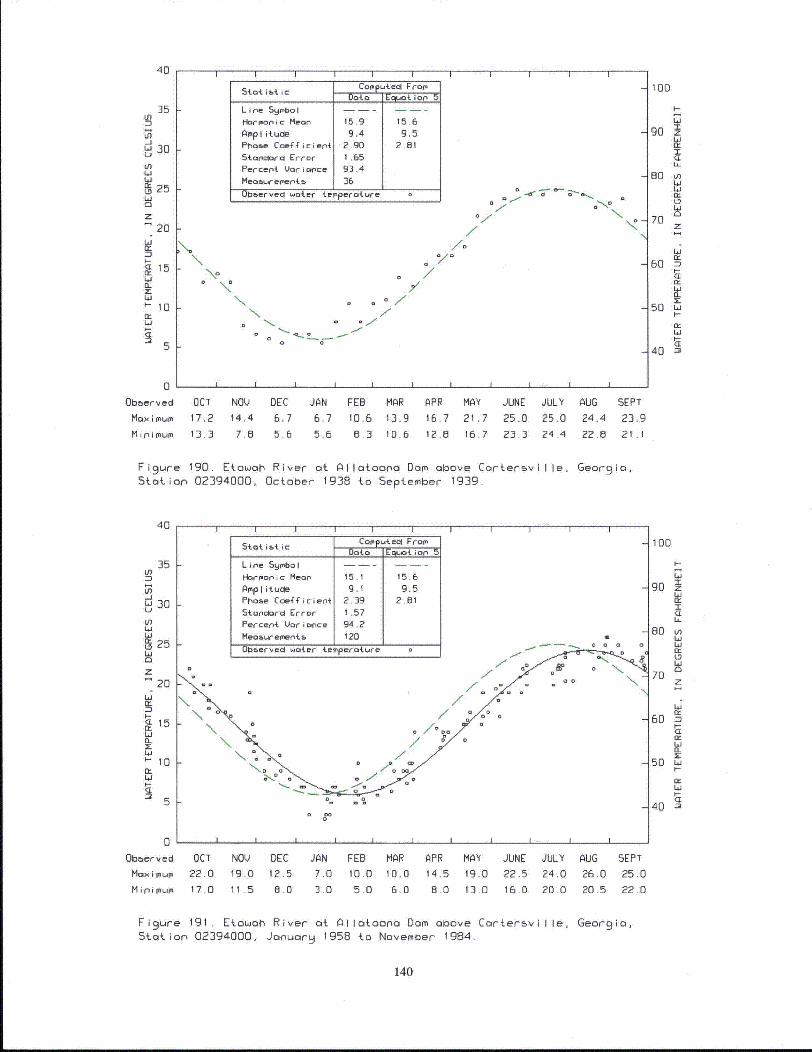
40
35 IIn
30
U3Ln
25Li
0
ILz 20
L50:
~ 5
I I I I I I III I I5to{ ~ ~ OP i i outecl From
Data 1Ealoti aon 5
L ine 59mbo I . . . . . .
Hmon i c Mean 15.9 15.6
AmpIitude 9.4 9.5Pho~e Coefficient 2.90 2.81
Skanriora Error 1 .65
Percent Variance 93.4
Meo.."efentib 36
Obmerveco water temperature 0 a
°\ 0 00/0°
° 70
0 . °o/
100
90
80 kn
70 z
60 u
50 Li
40
0
Obberved OCT NOV DEC JAN FEB MAR APR MAY
Maximum t7,2 14.4 6.7 6.7 10.6 13.9
Mif0i mum 13.3 7.8 5.6 5.6 8.3 10.6
16.7 21.7
12.8 16.7
JUNE
25.0
23.3
JULY
25.024.4
AUG SEPT
24.4 23.9
22.8 21.1
Figure 190. Etowah River at Allatoona Dam above Cartersville, Georgia,5tation 02394000, October 1938 to September 1939.
40
35
Ln-iW 30
ci,LOi,
L 25W
20
WMS20
<L
CL 1
WS10
0:Li
I I I I II I I
Computecl FromData Equal aon
Ligne 5y9oboI - - -
Harmonic Mean 15.1 15.6
Amplitude g,1 9.5PhaF e Coefficient 2.39 2.61
5taonclrd Error I .57
Percent Vaoratce 94.2
Meoaurements 120Obervecd water terperature o° Cr
Ka 0 0
I I I I I I
100
90 z
z
CL
80 aLi
70
601-
50 L.i
I-
40 -•5
0Obberved OCT NOV DEC JAN FEB MAR APR MAY JUNE JULY AUG SEPT
Maximum 22.0 19.0 12.5 7.0 10.0 10.0 14.5 19.0 22.5 24.0 26.0 25.0
Minimum 17.0 11.5 8.0 3.0 5.0 6.0 6.0 13.0 16.0 20.0 20.5 22.0
Figure 191. Etowah River at AIlatoono Dam above Cartersviile, Georgia,Station 02394000, January 1958 to November 1984.
140
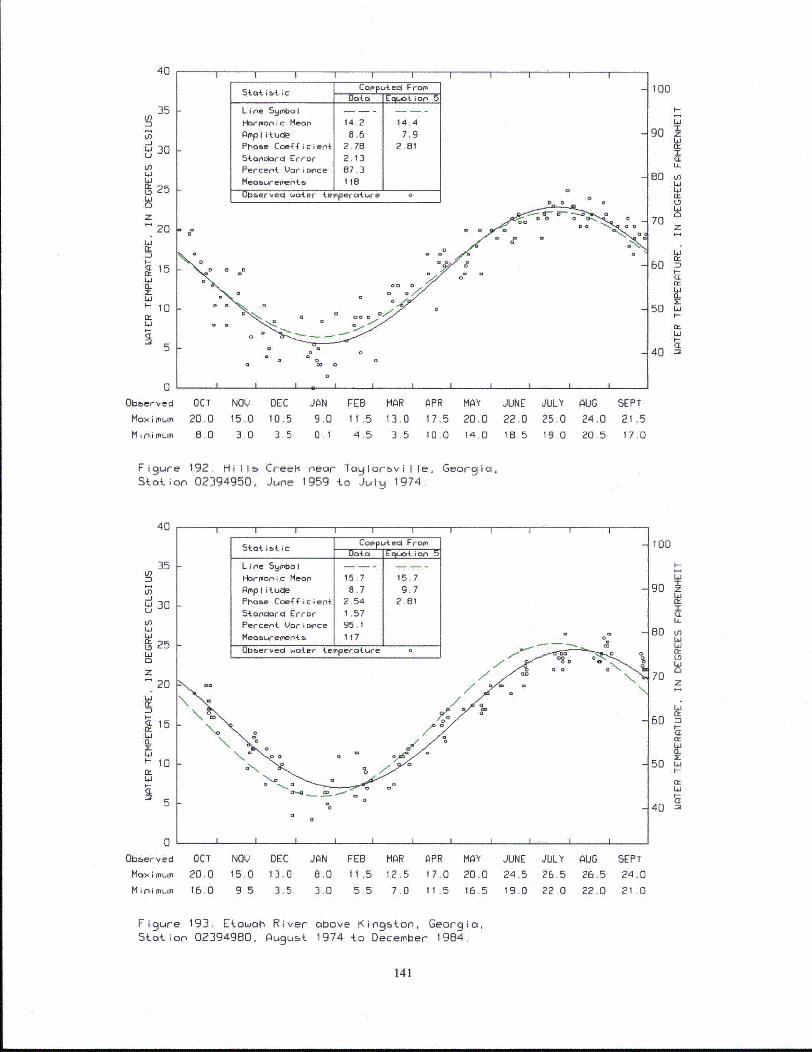
40
35 kLn
-J
JO
30
W 0
LiiU
u25
20
zDS20
I--
15Ci
-10Li
Dat Eoi on 5L ine Syilo I - -
Ha~rmonic Mean' 14.2 14.4
Ph-obe Coefficient 2.78 2.81Stanclar-l Error 2.13Percent Uorionce 87.3Measremener,t lie
I I I I I
0I~efvecwate WO&f 0perature b J
I ~: D
100
go90 •
80 V)
70 z
60
50 Li'i--
5D LiI-
40 3I
5-
0
Obberved
Max~imumo
M ri niOLMum
OCT NOV DEC JAN FEB MAR
20.0 15.0 10.5 9.0 11 .5 13.0
8.0 3'0 3.5 0.1 4.5 3.5
APR MAY
17.5 20.0
10.0 14.0
JUNE JULY AUG
22.0 25.0 24.0
18.5 19.0 20.5
SEPT
21.5
17.0
Figure 192. Hills Creek near Toglorsville, Georgia,Station 02394950, June 1959 to July 1974.
40 I I I I I I I I I I I
35 I
w
n
Lfl
30
(n
W
ID25
20
LO
-10
Li.
5tot ibt ic Computecl FromData Equa io5
Line Smabol - - -Hbrponic Mean 15.7 15.7Ampl ituce 8.7 9.7Phove Coefficient 2.54 2.81Stondordi Errof I .57Percent Vri Bonce 95.1Measurements- 117
Olmervecl water temperoture 0
k-
a0~0
100
I-
90 z
I
80 u
70z
60 Dn
Li
Li
I-2:
40 •
0000 Z0
.0
%O
0
Obt~erved
Max imum
Minimiumo
I I I I I I I I I I I
OCT NOV DEC JAN FEB MAR
20.0 15.0 13.0 8.0 11.5 12.5
16.0 9 5 3.5 3.0 5.5 7.0
APR MAY JUNE JULY
17.0 20.0 24.5 26.5
11.5 16.5 19.0 22.0
AUG
26.5
22.0
SEPT
24.0
21.0
Figure 193. Etowoh River above Kingston, Georgia,Station 02394980, August 1974 to December 1984.
141
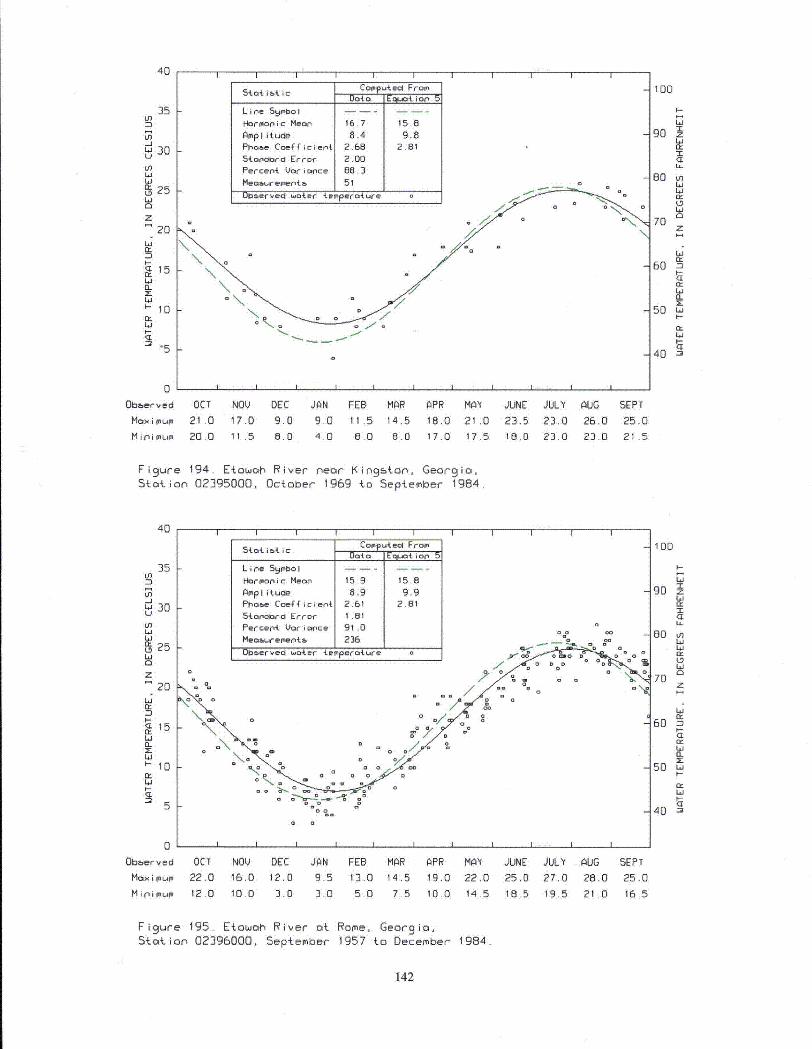
40
35 -
U
(LD25hA
z20
Li
S15
hi
'-10
I I I I I
CoPPu ecl FromData Eqguoio5
Line Symbol - -
Hrr.aonic Mean 16.7 15.8Amplitude 8.4 9.8Phase Coefficient 2.68 2.81
5oandard Error 2.00
Percent Vari ace 88.3
I I I I I
k-
Me~asurements- 1 51 1
DDevI wae terpeatur
100
90 zI
80 nWhihi
70 z
60
50 h.
40 "
L
0Obeberved
Maximum
Mini mium
OCT NOV DEC JAN FEB MAR APR MAY JUNE JULY
21.0 17.0 9.0 9.0 11.5 14,5 18.0 21.0 23.5 23.0
20.0 11.5 6.0 4.0 8.0 8.0 17.0 17.5 18.0 23.0
AUG
26.0
23.0
SEPT
25.0
21.5
Fi 9 ure 194. Etowah River near Kin 9 ston, Georgia,Station 02395000, October 1969 {o September 1984
40
35Ln
03Ln-j
Ln
25
az
20
nI--
-0~21:
5
I I I I II I I I I I
5tot i~t ic COPuPtec FroamData Ec&t ion 5
Line S•mbol
l-armonic Mean 15.9 15.8
Amplitude 8.9 9.9Phoae Coefficient 2.61 2.81
5tanclrd Error 1 .81
Percent Variance 91.0
Measurements 236
Observed water temperoture 0 00 0 0 o
0 0
I I I I I I I I
100
i--
90 z
80 tn
'70
z
60 -)
hi
a:
50 L.
4-50 hi
0
Obberved
Maximum
M in i mum
OCT NOV DEC JAN FEB MAR APR MAY JUNE JULY22.0 16.0 12.0 9.5 13.0 14.5 19.0 22.0 25.0 27.0
12.0 10.0 3.0 3.0 5.0 7.5 10.0 14.5 1865 19.5
AUG
28.0
21 .0
SEPT
25.0
16.5
Figure 195. Etowoh River at Rome, Georgia,Station 02396000, September 1957 to December 1984.
142
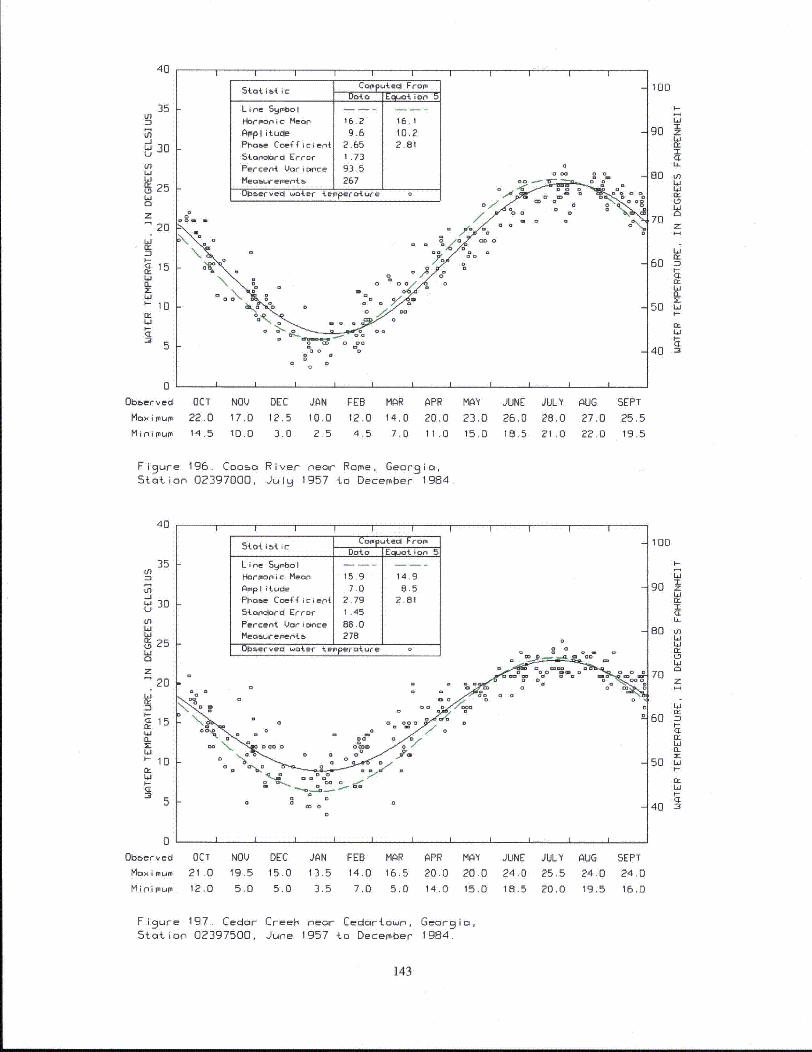
40
35 1-in
2i30
inLi
ID25Lia
20
~15IL
La1.- 10
5
0Obeberved
Maxmu
M it niOLMUM
S4 at io~i jC omutedFromo
Line Symobol - -
Harmonic Meanu 16.2 16.1
Amplitude 9.6 10.2Ph~ose Coef~ficient 2.65 2.81Stooolord Error 1.73
I I I I I
Percent Vor i•ance 935Meo,•rement+. J 267 1 .-.-_-__o
Ubserved water temperature od W
.ooa Go 0
a s Do"ý
i i i 0
100
90 z•Li
80 in6i41
70 z
601-
50 L.I-
Lii
40 "•
OCT NOV DEC JAN FEB MAR APR MAY JUNE JULY AUG
22.0 17.0 12.5 10.0 12.0 14.0 20.0 23,0 26.0 28.0 27.014.5 10.0 3.0 2.5 4.5 7.0 11.0 15,0 18.5 21 .0 22.0
SEPT
25.5
19.5
Figure 196. Cooo River near Rome, Georgia,Station 02397000, July 1957 to December 1984
40
35En
in
L 30
LiLiL, 25Li
a
20Li
15IL
X
'-J 10
5
0Observed
Maximum
Minimum
k-
iCoppute FromDato .:Eroot ion 5
Line Symbol ... ...
Harmonic Mean 15.9 14.9
Amplitude 7.0 8.5
Phoae Coefficient 2.79 2.81
Standard Error I .45
Percent Vari arce 88.0Meas,.rementa._ 278
Obterved water tremperature
Go• .1 oV40. ... -0°00 0
0a 0 a
0 cr-,.•0 .... o
D0.~ =
100
90
70
z
60 S.'Li•L
50
70
i i i i i
OCT
21 .012.0
NOV19.5
5.0
DEC15.0
5.0
JAN FEB MAR APR MAY13.5 14.0 16.5 20.0 20.0
3.5 7.0 5.0 14.0 15.0
JUNE JULY AUG
24.0 25.5 24.0
18.5 20,0 19.5
SEPT
24.0
16.0
Figure 197. Cedar Creek near Cedartown, Georgia,Station 02397500, June 1957 to December 1984.
143
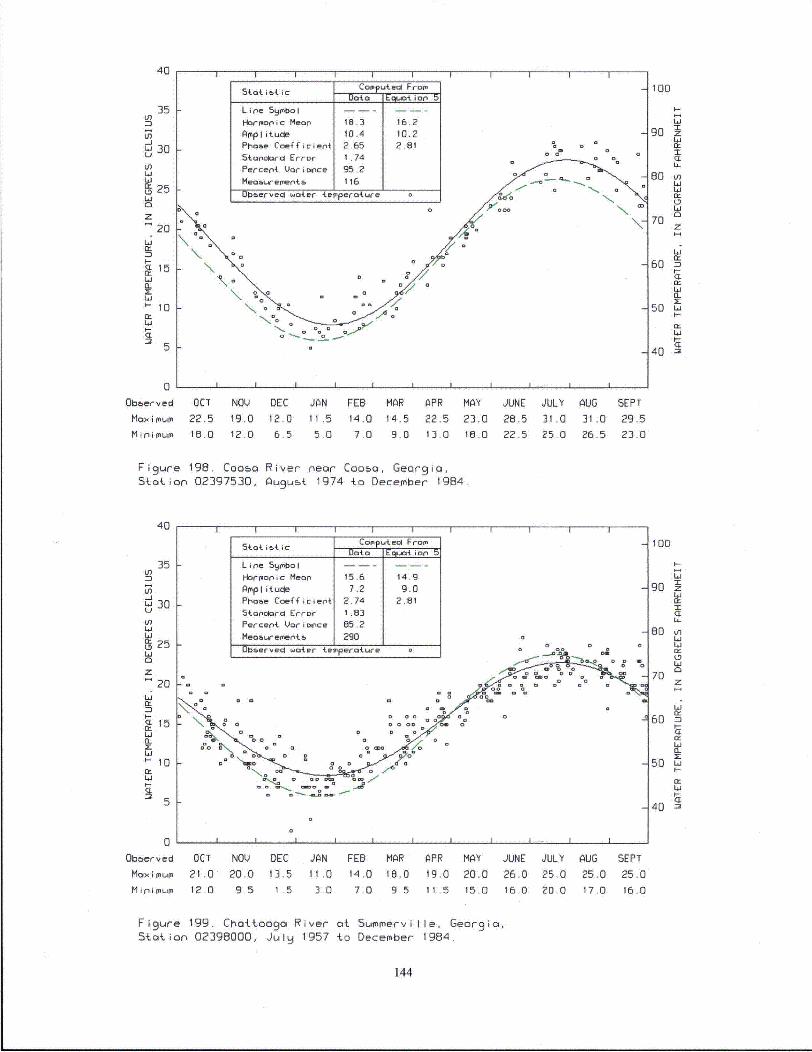
40
st~atistic Co~putea Fropm__________Data_ ______ ton 5
L ine Syio oI-- I -
Harm~onic Mean 18A3 16.2Amplitude 10.4 10.2
I I I I I
Un:2:
W 30InLn
N 25
Li0
z
20Li
n-"
15Lia-
•-10
5
Phase Coeff7icient 2.65 2.810 0
Stan-ciarc Error 1 .74Percenti Vori ance 95.2
Meoa.rementob 116 j____UtmervecI water terperature
0Iom
100
goI
BO
90
zI
60 n
50 Li
L'i4
70
60 -c
50 L.i
cc
0
Obberved
Max mum
Mini mum
i i i i - ---
OCT NOV DEC JAN FEB MAR APR MAY22.5 19,0 12.0 11.5 14.0 14.5 22.5 23.0
18.0 12.0 6.5 5.0 7.0 9.0 13.0 18.0
JUNE JULY AUG
28.5 31.0 31.0
22.5 25.0 26.5
SEPT
29.5
23.0
Figure 198. Coo~a River near Coosa, Georgia,Stotion 02397530, Augut 1974 to December 1984
40
35tn
In-jU3Li 30
LnLi 25
Wiu 25
20Li
Mc.M
• 15
Li
I-10
cy
I I II I I II I I
Data Equaloior 5
L i ne symo I -l- - -
Harmonic Mean 15.6 14.9
Amplitude 7.2 9.0Phoae Coeficien{ 2.74 2.81
5tanvord Error 1.83
Percent Variance 85.2
Meo aueme nt s 290 0
Oboerved water terperature 0
0
J
a a I a
1 00
90
I
50Ex
80 -4h,Li
70z
60 -
50 Li'i-
cc
5
0Obberved
Maximum
Mipimum
OCT NOV
21,0 20.0
12.0 9.5
DEC JAN13.5 11.0
1.5 3.0
FEB MAR
14.0 18.0
7.0 9.5
APR MAY JUNE JULY AUG19.0 20.0 26.0 25.0 25.0
11.5 15.0 16.0 20.0 17.0
SEPT
25.0
16.0
Figure 199. Choitooga River at Summerville, Georgia,Station 02398000, JulI 1957 to December 1984.
144
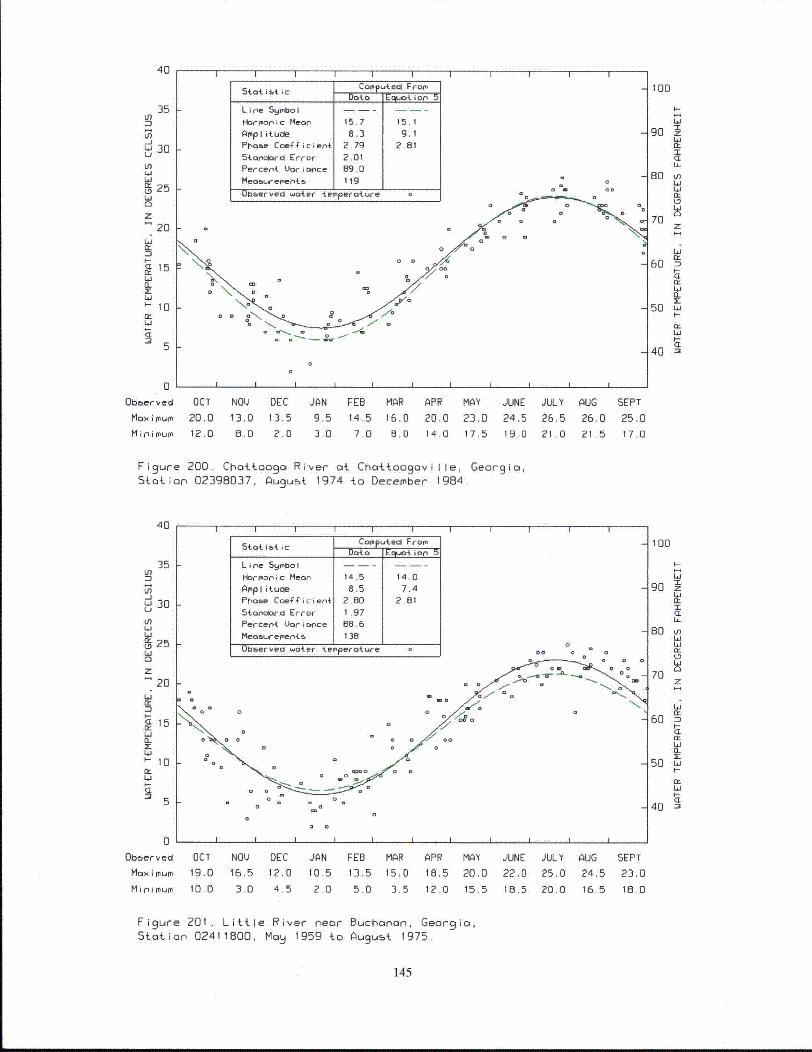
40
35 ILnZl
W30
S25
Li20
z20
15
0~
I I I I I I I III
5tt i_ _ ic COPPu4tco FromData_________ on o
L i ne Sqmbo I --- -
Hormonic Mean 15.7 15. I
Amplitude 8.3 9 1Phsoe Coefficient 2.79 2,81
5tonclor - Error 2.01
Percent Vori ance 89.0
Meog',ucegents J 119 ____
0b~erv.eO water ter'perature
0 0 D
100
I-
90 z
h
80 mnLL
B n
70 zLi-
601-
50 L.
40
Obeerved OCT NOV DEC JAN FEB MAR APR MAY JUNE JULY
Max i mum 20.0 13.0 13.5 9.5 14.5 16.0 20.0 23.0 24.5 26.5
Minirimum 12,0 8.0 2.0 3.0 7.0 8.0 14.0 17.5 19.0 21 .0
Figure 200. Chattooga River at Chattoogaville, Georgia,
Station 02398037, August 1974 to December 1984.
AUG26.0
21 .5
SEPT25.0
17.0
40
35Ln
L6
30
L5 25Li0UJ
15z
S20
ELI-
-10Li
I I I I I III I I I
5tot ibt c Copputel From
Data EqEAot ion 5
Line 59 bol . . . . . .
Harmonic Mean 14.5 14.0
Amplitude 8.5 7,4
Phasoe Coe•"icient 2.80 2.81
Stondlard Error 1 .97
Percent Variance 88.6
Meoaskaements 138
OUbervea water terperature o
I I I I I I III I I
100
I-
LU
90 z
80 unLi
70 z
60 C
nI-j
50 LiI-
,C
40 •
I
5
Observed
MXni Mum
M Ini iMLu
OCT NOV DEC JAN19.0 16.5 12.0 10.5
10.0 3.0 4.5 2.0
FEB MAR13.5 15,0
5.0 3.5
APR MAY JUNE18.5 20.0 22.0
12.0 15.5 18.5
JULY25.0
20 0
AUG SEPT
24.5 23.0
16,5 18.0
Figure 201. Little River near Buchanan, Georgia,Station 02411800, Mao 1959 to August 1975.
145
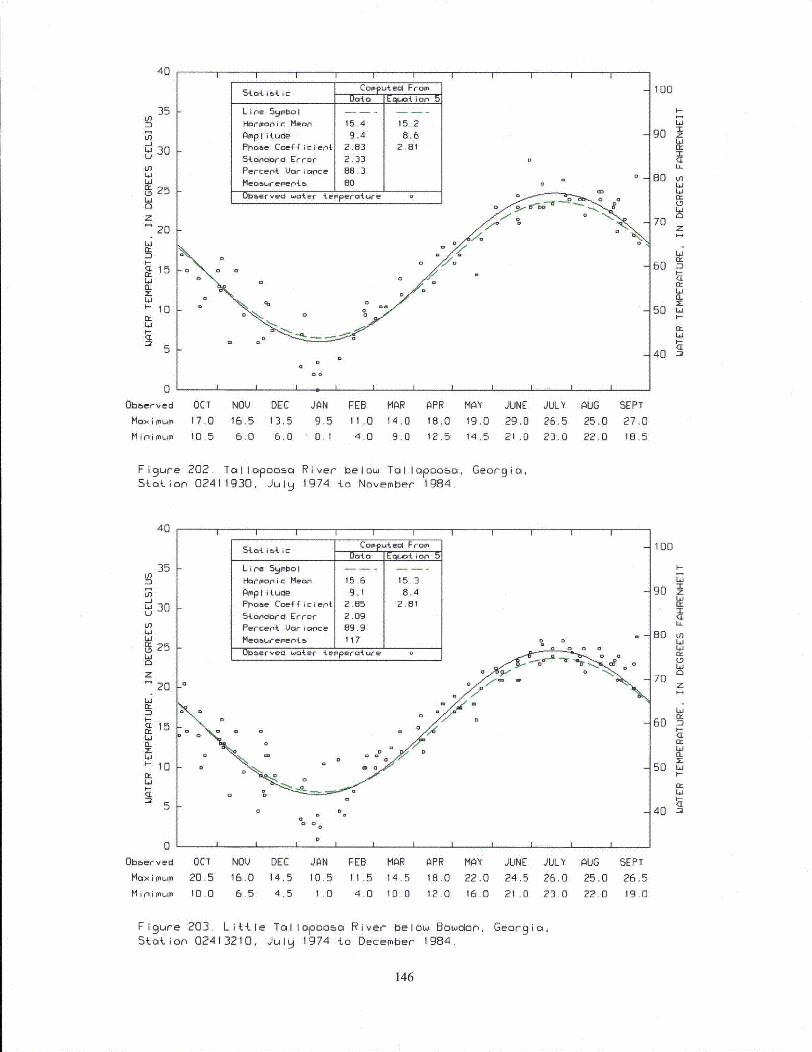
40
35
Lfl
30
tn
0250z
20
I--
15IL
'-10
5
54.a4 & :A i c OPPteclF am~
Line Sym~bol -- --
HaIrm~onic Mean~ 15.4 15.2
Amplitude 9.4 8.6
Phase Coefficienti 2.83 2.81
Staronard Error 2.33
Percent~ Vor cilce, 88.3
MeoauremerA54 800o
O05ervecl waoter 4.erpertur-e ------
0 a 0 I ill.I
100
I.-
90 zI<E
80LiLi
70 z
60 •c-
50 L.I---
40 "•
0Obberved
Max mu
M i i u
OCT NOU DEC JAN FEB MAR APR MAY JUNE17.0 16.5 13.5 9.5 11,0 14,0 18.0 19.0 29.010.5 6.0 6.0 0.1 4.0 9.0 12.5 14.5 21 .0
JULY AUG
26.5 25.0
23.0 22.0
SEPT
27.018.5
Fi9ure 202. Tollopooso River below Tallopooba, Georgio,Station 02411930, JuI 1974 to November 1984.
40
35
L6-J
U 30Ln
25
20
Li
tI-
LA
'10Id
Li
5
Data__ Ecn ion 5
Line Symbtol -- --
Harmon'ic Mean, 15.6 15.3
Amiplitudie 9.1 8.4Phase Coeffic~ient 2.05 2.81
5&opclardl Error 2.09
Percent4 Uori .pce 09.9
IMeasoem*rents- 117 o
0bzerved wat.er tem~perat~ure
I II I
100
I-
90 z•Li
LOUj
70
I
60
50 .
40
00boe,erved
Max imu
M p ni mum~
OCT NOQ DEC JAN FEB MAR
20,5 16,0 14.5 10.5 11.5 14.5
10.0 6.5 4.5 1'0 4.0 10.0
APR MAY JUNE JULY
18.0 22.0 24.5 26.0
12.0 16.0 21 .0 23.0
AUG
25.0
22.0
SEPT
26.5
19.0
Figure 203. Lit{le Tallopoosc River below Bowdon, Georgia,Station 02413210, JuIl 1974 to December 1984.
146
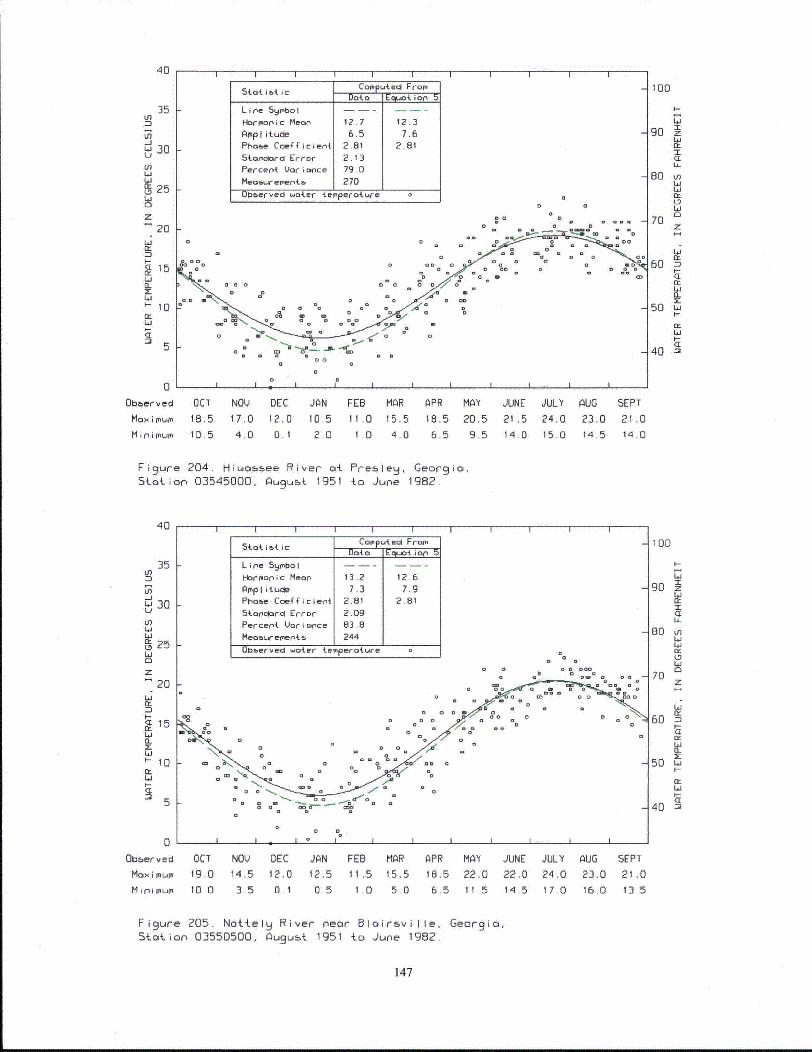
40
35 ktn
30
Li 3
ID25
z20
~15CL
0~
0bber-ved
Maxoimu
M inim~ium
i i i i iStat ibt ic CoyPuteol Froi
Data E1uot ion 5L i ne Syobo IHarmonic Mean 12.7 12.3
Amplitu'le 6.5 7.6Phase Coef ficien{ 2.81 2815torc-oard Error 2.13Percent Uarii nce 79.0Measureienitb 2700Obervecl water terperoture
i i I I I
*o 'KD00
- a 00 Go0a ao o o
0
Go o c I I I
100
i--
go
80 u
70 z
60 i
50 L.40
60,.I-
50 -i
OCT NOV DEC JAN FEB MAR APR MAY18,5 17.0 12.0 10,5 11,0 15.5 18.5 20.5
10.5 4.0 0.I 2.0 1.0 4.0 6.5 9.5
JUNE JULY AUG
21 .5 24.0 23.014.0 15.0 14.5
SEPT
21 .014.0
Figure 204. Hiwaosee River at Presleg, Georgia,Station 03545000, August 1951 to June 1982.
40
35Ln
in-jLi 30U
in
W2 5
20
I-
<L15CL0,J
1:
Stat ict icomData Eopto or5
Line Syfto I -- -- -
Harmonic Mean 13.2 12.6AmpI itucde 7.3 7.9Phase Coefficient 2.81 2.81
Stonoarcl Error 2.09Percent Uorionce 83.8Measurements- 244Observ'ed water teiperature Go
Go o GO OD Go 0
aaoa o
0°- o 0 o,..".Co°0oo
0•,0 Go o °
o G I
o -I I I I I
100
IJ
90zz
11:
70 az
60
50 L.
I--
An
Z)
40
0
0bberved
Max imumo
Mi nimu
OCT NOV DEC JAN FEB MAR
19.0 14.5 12.0 12.5 11.5 15.5
10.0 3.5 0.1 0.5 1.0 5.0
APR MAY18,5 22.0
6.5 11.5
JUNE JULY
22.0 24.0
14.5 17.0
AUG
23.0
16.0
SEPT
21.0
13.5
Figure 205. Nottely River near Blairsville, Georgia,Station 03550500, August 1951 to June 1982.
147
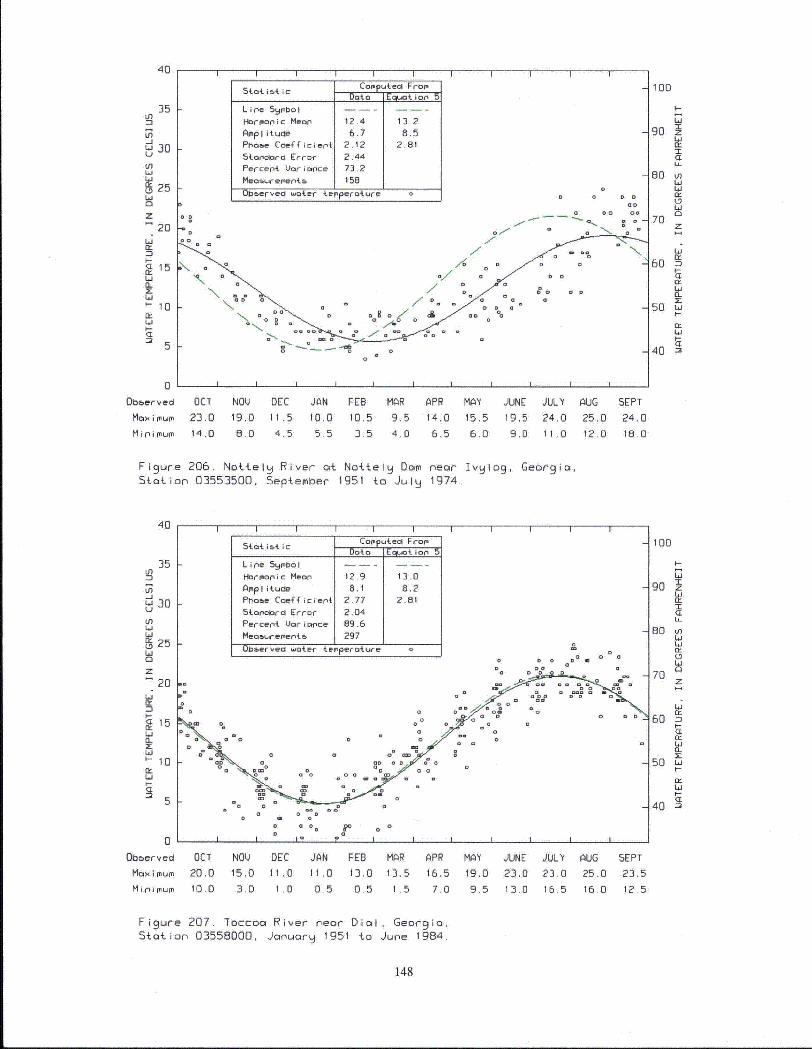
40
35
30Ulin
ID25
20
I-15
a.zLui
'-10
Li
5
StatsticComputecl Fromo
Line 59mbol - - - :Harmoni.c Mean 12.4 13.2
Amoplitude 6.7 .Phaae Coeff i cri et2.12 2.81Star'clorcl Error 2.44Percent Uori nce 73,2meaburegentb ¶58
I.-
100I I I I I
Oleerved wotef epeoture o
0 0 0 00
00 0e00 "o o oo
cl %
I-
-90
z
t-.Cc
40
l
0Otberved OCT NOV DEC JAN FEB MAR APR MAY
Max imum 23.0 19,0 11.5 10.0 10.5 9.5 14.0 15.5
in i PUP 14.0 8.0 4.5 5.5 3.5 4.0 6.5 6.0
Figure 206. Nottei River at Nottely Dam near Ivy]lStation 03553500, September 1951 to July 1974.
JUNE JULY
19.5 24,0
9.0 11.0
o9, Georgia,
AUG SEPT
25.0 24.0
12.0 16.0
40
Lf
in_j-J
wi 30ULnLi
U 25Lha
z
20
Li
I- 15(L
'-10a,:Lu
I I I I I I I I I
5tot i~t ic Comp~utecl From
Data Eclpot io
Line 59bol I
Harmonic Mean 12.9 13.0
Amplitude 8.1 8.2P1oae Coeficien{ 2.77 2.81Stoapcarcl Error 2.04Percent Voriance 89.6Meo5m-emoent5 297
Observed water terperature 0 o
0 0 0 D
J a'.D . 0D o Ja 0"
00l D aD° 0 al 0
•o O a 0 0
€> a 0 o •
O a0, a90 o0
100
U-
Lu90 z
80 tnLi
0:LoW
70a z
60 -c
50 tI-CL
5
0Obberved
Max i imum
Mini mum
OCT NOV DEC JAN FEB MAR APR MAY
20.0 15,0 11.0 11.0 13.0 13.5 16.5 19.0
10.0 3.0 1.0 0.5 0.5 1.5 7.0 9.5
JUNE JULY
23.0 23.0
13.0 16.5
AUG SEPT
25.0 23.5
16.0 12.5
Figure 207. Taccoa River near Dial, Georgia,Station 03558000, January 1951 to June 1984.
148
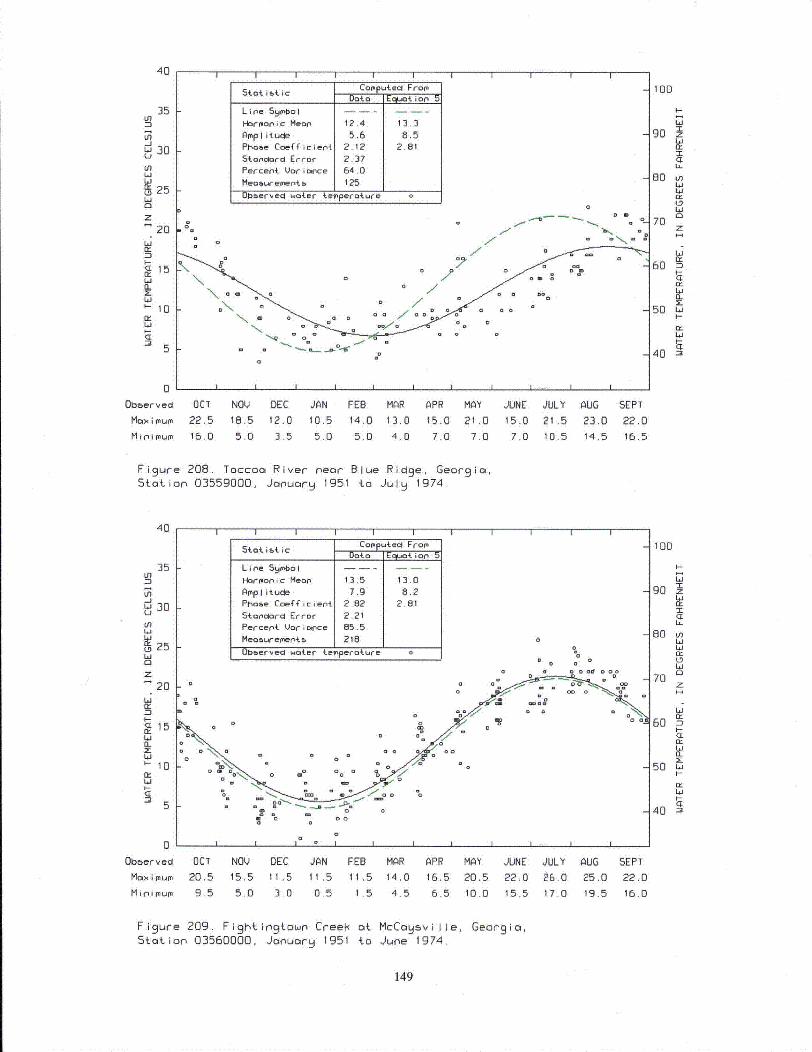
40
35
LnLa)Li30
9 25Lia
z20
•15CL
10
5
0
Observed
Mi mum
40I I I I I
Sal i iC COPPuteal From
Line Symlbol
Harmonic Mean 12.4 13.3
Amplitude 5.6 8.5Phaoe Coefficient 2.12 2.81
Stodcworc Error 2.37Percent Vari nce 64.0
Meofurement5 125
Ob11erved water temperature o
0 ~ ~ 0
\ oo / . o =
o
oB
o\~ om •
D a a o
\ °o o o° o / °
I I I I I
100
g-Lid
80 tnW
70z
60
50 '.'4-
80 -n
OCT NOV DEC JON FEB MAR APR MAY JUNE JULY AUG
22.5 18.5 12.0 10.5 14.0 13.0 15.0 21.0 15.0 21.5 23.016,0 5.0 3.5 5.0 5.0 4.0 7.0 7.0 7.0 10.5 14.5
SEPT
22.0
16.5
Figure 208. Toccoa River near Blue Ridge, Georgia,Station 03559000, January 1951 to July 1974.
40
LI)
U')-j
30La
025Li
20
n1I-
LiQ.
I-10
5
I I I II
5toa ist ic Computed FromDota0 EelIOat- io5
Line 59ubol I
H-lorraonic Meor 13.5 13.0
Amplitude 7.9 8.2Phoase Coeff iciert 2.82 2.81Stancaordc Error 2,21Percent Vari ance 85.5Meoe,,... emento 218
Obberved water te.•perature 0
0~ 0 00000o
D, o -
0 0
0 o
o*0 0
I ~ ~ 0
100
90 z
80 L-Li
h-,
70z
60I-
50 Li4-
n.-
40 -•
0
Observed
Maoimum
M inimum
OCT NOV DEC JAN FEB MAR
20.5 15.5 11.5 11.5 i1.5 14.0
9.5 5.0 3.0 0.5 1.5 4.5
APR MAY
16.5 20.5
6.5 10.0
JUNE JULY
22.0 26.0
15.5 17.0
AUG
25.0
19.5
SEPT
22.0
16.0
Figure 209. Fightingtown Creek at McCoysville, Georgia,Station 03560000, January 1951 to June 1974.
149
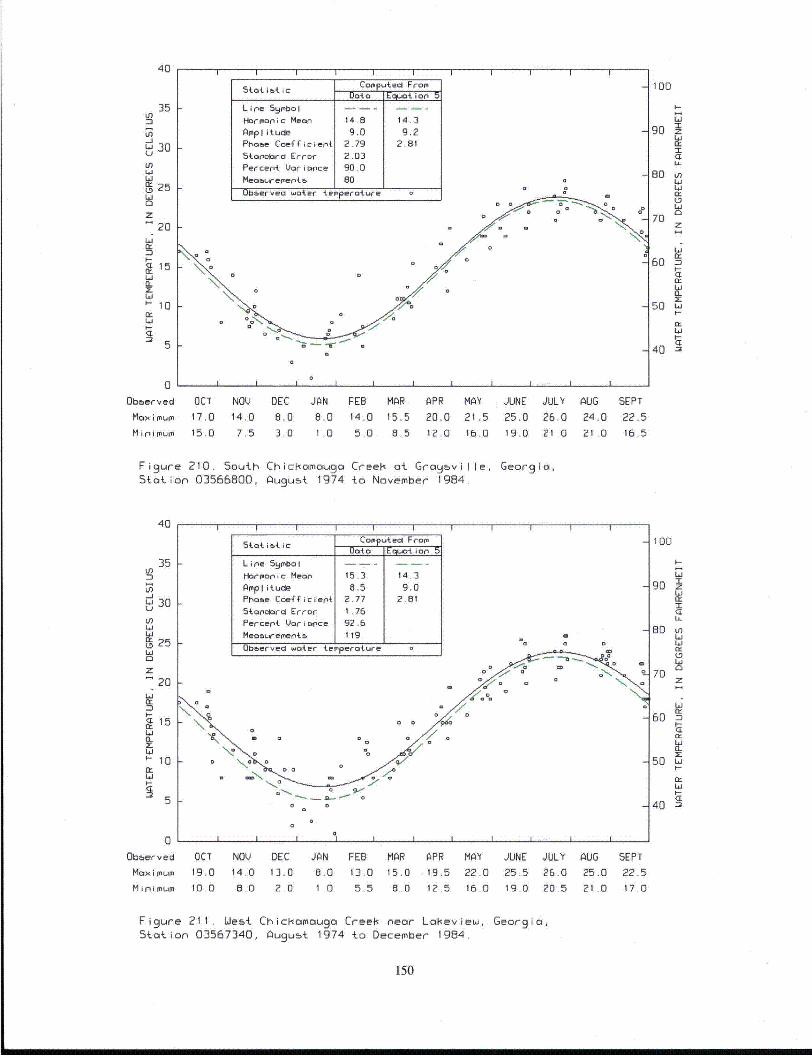
40
35 IIn
tn
Li
20
z10
15
0~
I I I
Sta_ i_ _ i__ COEPute FroamData Eq~ot lon
Line Syo I
Harmoninc Mean 14.6 14.3
Amplitude 9.0 9.2Phase Coefficient 2.79 2.81
Stanoard Error 2.03
Percent Variance 900.
k
I I I I I
Measur"ments- 1 00I 1Observec water temnperature a
100
go
LiLI
80 LiiLi
70 z
60 n
50 L.I--
Li
40
Observed
Ma~imum
Mini MUM
OCT NOV DEC JAN FEB MAR APR MAY JUNE JULY
17.0 14,0 8.0 8.0 14.0 15.5 20.0 21.5 25.0 26.015.0 7.5 3.0 1 .0 5.0 8.5 12.0 16.0 19.0 21 .0
AUG
24.0
21 .0
SEPT
22.516.5
Figure 210. South Chickamougo CreeH at Groaville, Georgla,Staoion 03566800, August 1974 to November 1984.
40
35 kUn
-JL" 30LiInLi
WL, 25
20
10
Li
Lii
Stat i t.i C
Line Symboal
arloMonic Mean
AmplI itudePhoae Coefficieni
Sta5ncard Error
Percent Variance
Meaoarement&
Observed water te,
k
k-
Copputecl FromData Eo I. i~o-n
15.3 14.38.5 9.0
2.77 2.811.7692.6119 1a
oo o _r0 Z
100
I-
90 zICL
80 V)
Li
70 z
60 nCL
50 Li40
40 -•
K'N
• €I
5 ý
0'1
Obberved
Max ium
M n i aium
I I I I I I I I I
OCT NOV DEC JAN FEB MAR APR MAY JUNE JULY
19.0 14.0 13.0 8.0 13.0 15.0 19.5 22.0 25,5 26.0
10.0 8.0 2.0 1.0 5.5 8.0 12.5 16.0 19.0 20.5
AUG
25.0
21 .0
SEPT
22.517.0
Figure 211. West Chiciomougo Creeki neor Lofeview, Georgio,Station 03567340, Au g ust 1974 to December 1984.
150
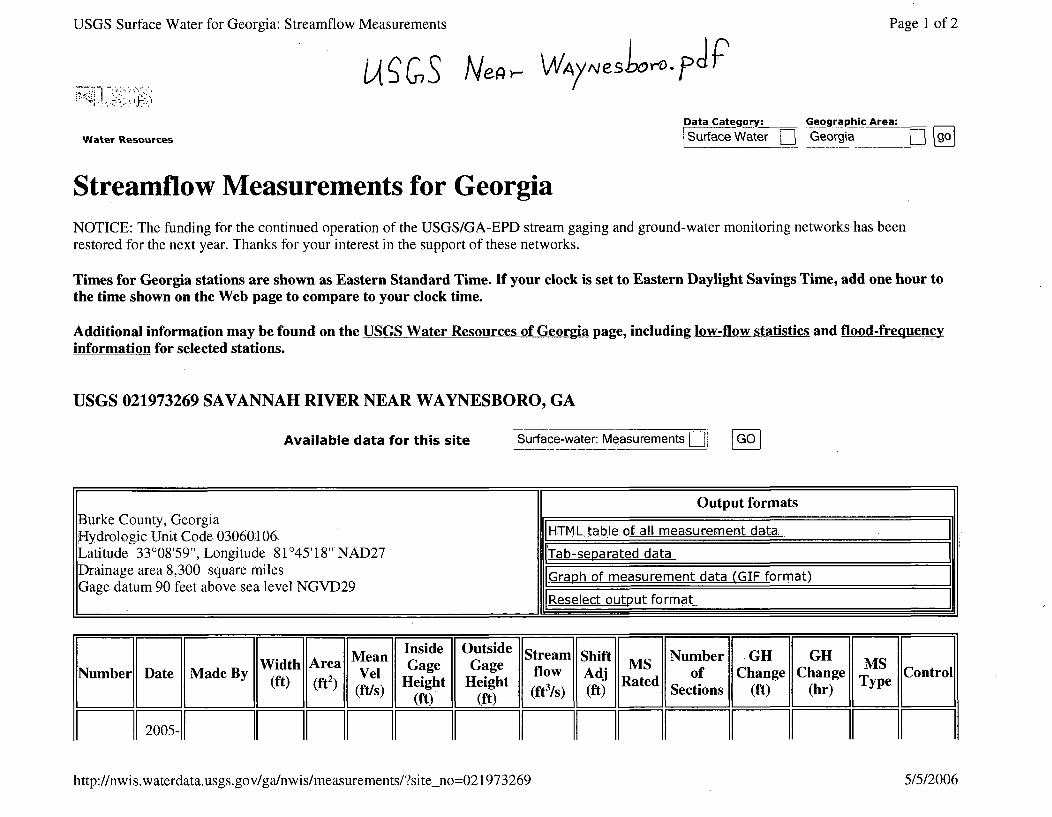
USGS Surface Water for Georgia: Streamflow Measurements Page I of 2
U§ýCnS ANep- WA/Nes~coro? JRData Category: Geographic Area:
Water Resources Surface Water E Georgia Q
Streamflow Measurements for GeorgiaNOTICE: The funding for the continued operation of the USGS/GA-EPD stream gaging and ground-water monitoring networks has beenrestored for the next year. Thanks for your interest in the support of these networks.
Times for Georgia stations are shown as Eastern Standard Time. If your clock is set to Eastern Daylight Savings Time, add one hour tothe time shown on the Web page to compare to your clock time.
Additional information may be found on the USGS Water Resources of Georgia page, including low-flow statistics and flood-frequencYinformation for selected stations.
USGS 021973269 SAVANNAH RIVER NEAR WAYNESBORO, GA
Available data for this site Surface-water: Measurements [ bGO
Output formatsBurke County, GeorgiaHydrologic Unit Code 03060106 THTML table. of all, measurement data
Latitude 33'08'59', Longitude 81'45'18" NAD27 Tab-separated dataDrainage area 8,300 square miles Graph of measurement data (GIF format)-Gage datum 90 feet above sea level NGVD29 I
Rgeselect outptfra
e Width AreaMean Inside Outside Stream Shift MS Numbers- GH GH[Number Date MadelBy (ft) (fV)(l Hegt eih flow Adj ae of Change Chan r' 5CControl]
(f')(f~) eiht Hit) f Sections (C) hr'g TpL .._____________ - _____________ (ft) . (ft) (ft/s) _ft_ -- ftp
2005-1 11http://nwis.waterdata.usgs.gov/ga/nwis/measurements/?siteno=021973269 5/5/2006
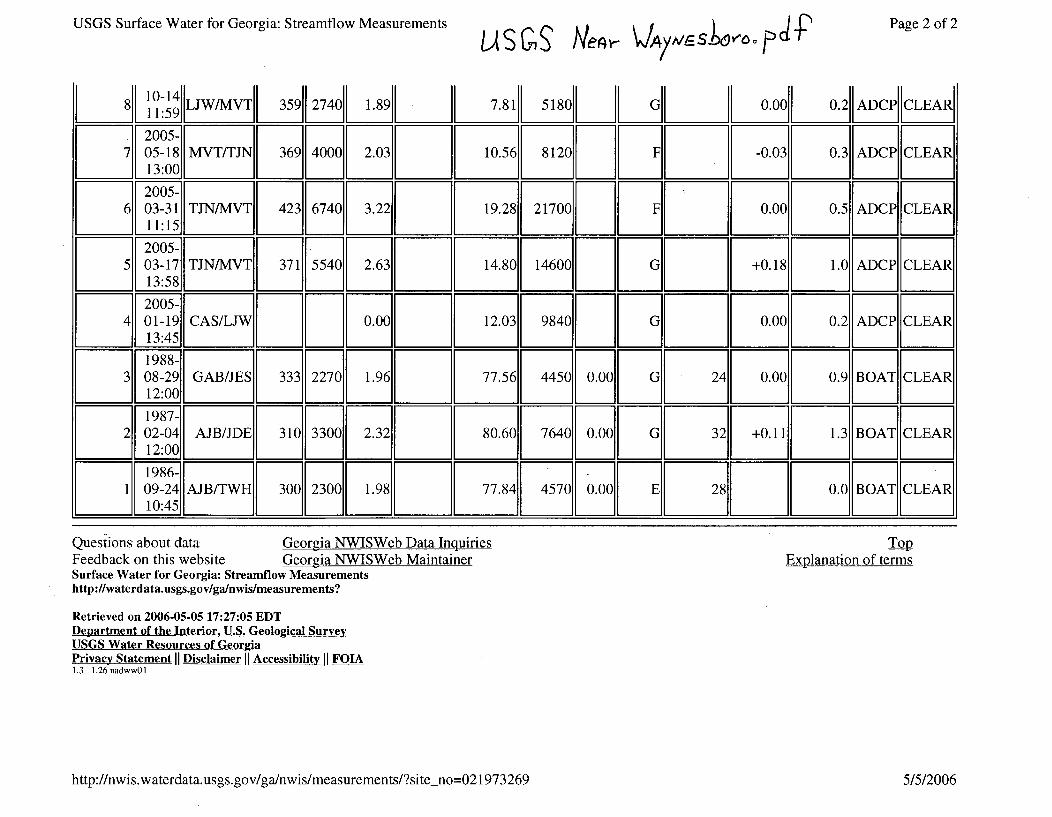
USGS Surface Water for Georgia: Streamflow Measurements
Lý{SGS3 IHea- VAIA/E S.l9Y- - p d - Page 2 of 2
810-1411:59 2740LJW/MVT 359 1.89 7.81 5180 G 0.00 0.2 ADCP CLEAR
2005-7 05-181 MVT/TJN 369 4000 2.03 II 10.561 8120 I F -. 3 03AC LA
13:00
2005-03-31 TJN/MVT 423 6740 3.22 19 .2 8 21700 F 0.0[ 0.5 ADCP CLEAR11:15 1
2005-03-17 TJN/MVT 371 5540 2.63 14.80 1460013:582005-01 0.2 1ADCP CLEA13:454M 0119 EA/J .0I 1.3 80 I G .0 LA1988-08-29 GAB/JES 333 2270 1.96 77.56 4450 0.00 G 24 0.04 0.9 BOAT CLEAR
12:00
1987-02-04 AJB/JDE 310 3300 2.32 80.60 7640 0.00 G 32 +0.11 1.3 BOAT CLEAR12:00
1986- Er *I.09-24 AJB/TWH 300 2300 1.98 77.84 4570 0.00 E 28 0.0 BOAT CLEAR10:45
Questions about dataFeedback on this website
Georgia NWISWeb Data InquiriesGeorgia NWISWeb Maintainer
TopExplanation of terms
Surface Water for Georgia: Streamfilow Measurementshttp://waterdata.usgs.gov/ga/nwis/measurements?
Retrieved on 2006-05-05 17:27:05 EDTDepartment of the Interior, U.S. Geological SurveyUSGS Water Resources of GeorgiPrivacy Statement 11 Disclaimer II Accessibility II FOIA1.3 1.26 nadwwO1
http://nwis.waterdata.usgs.gov/ga/nwis/measurements/?siteno=021973269 5/5/2006
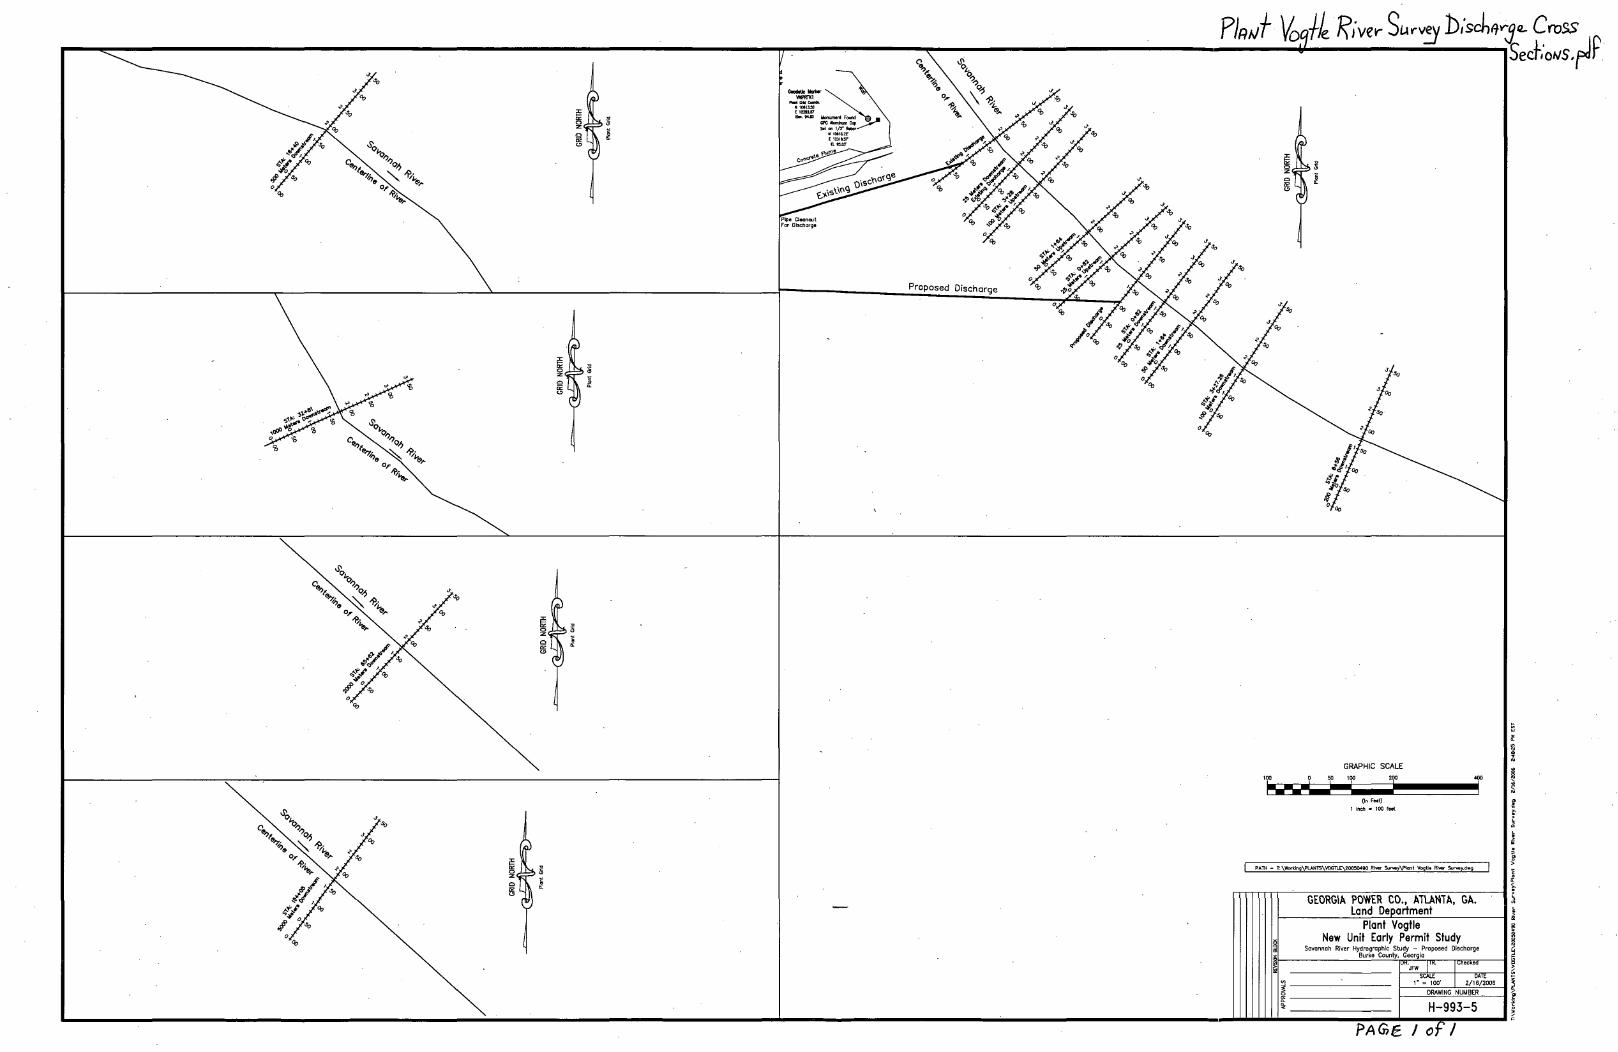
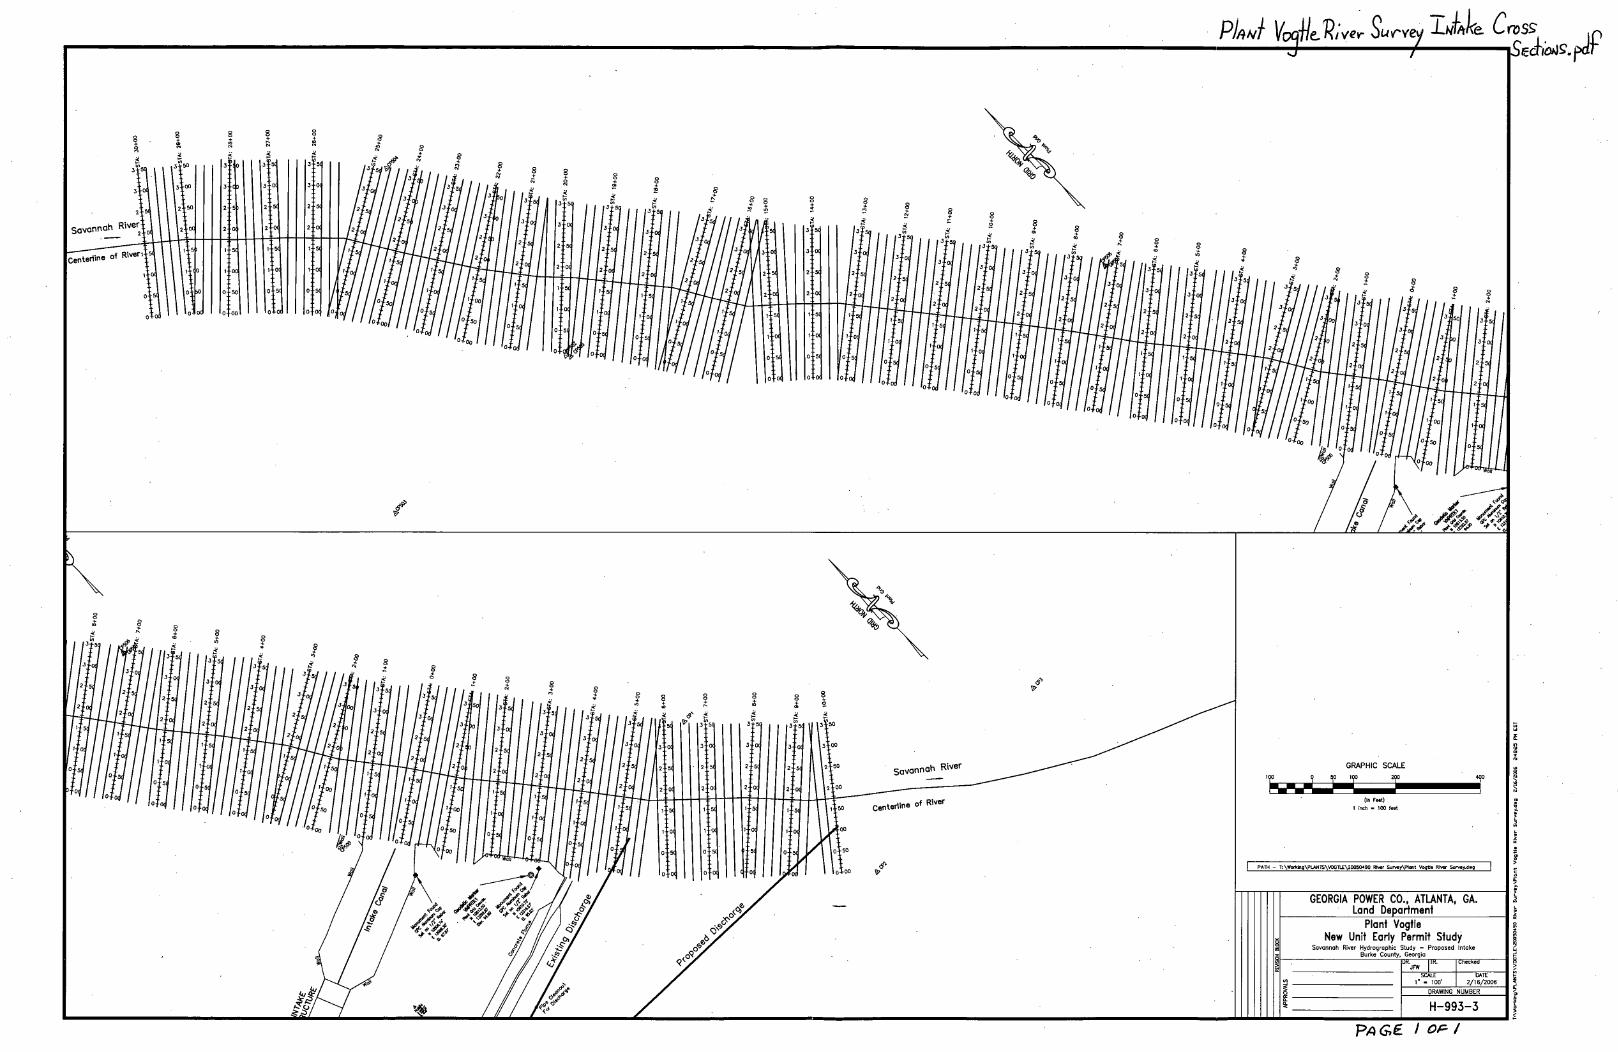
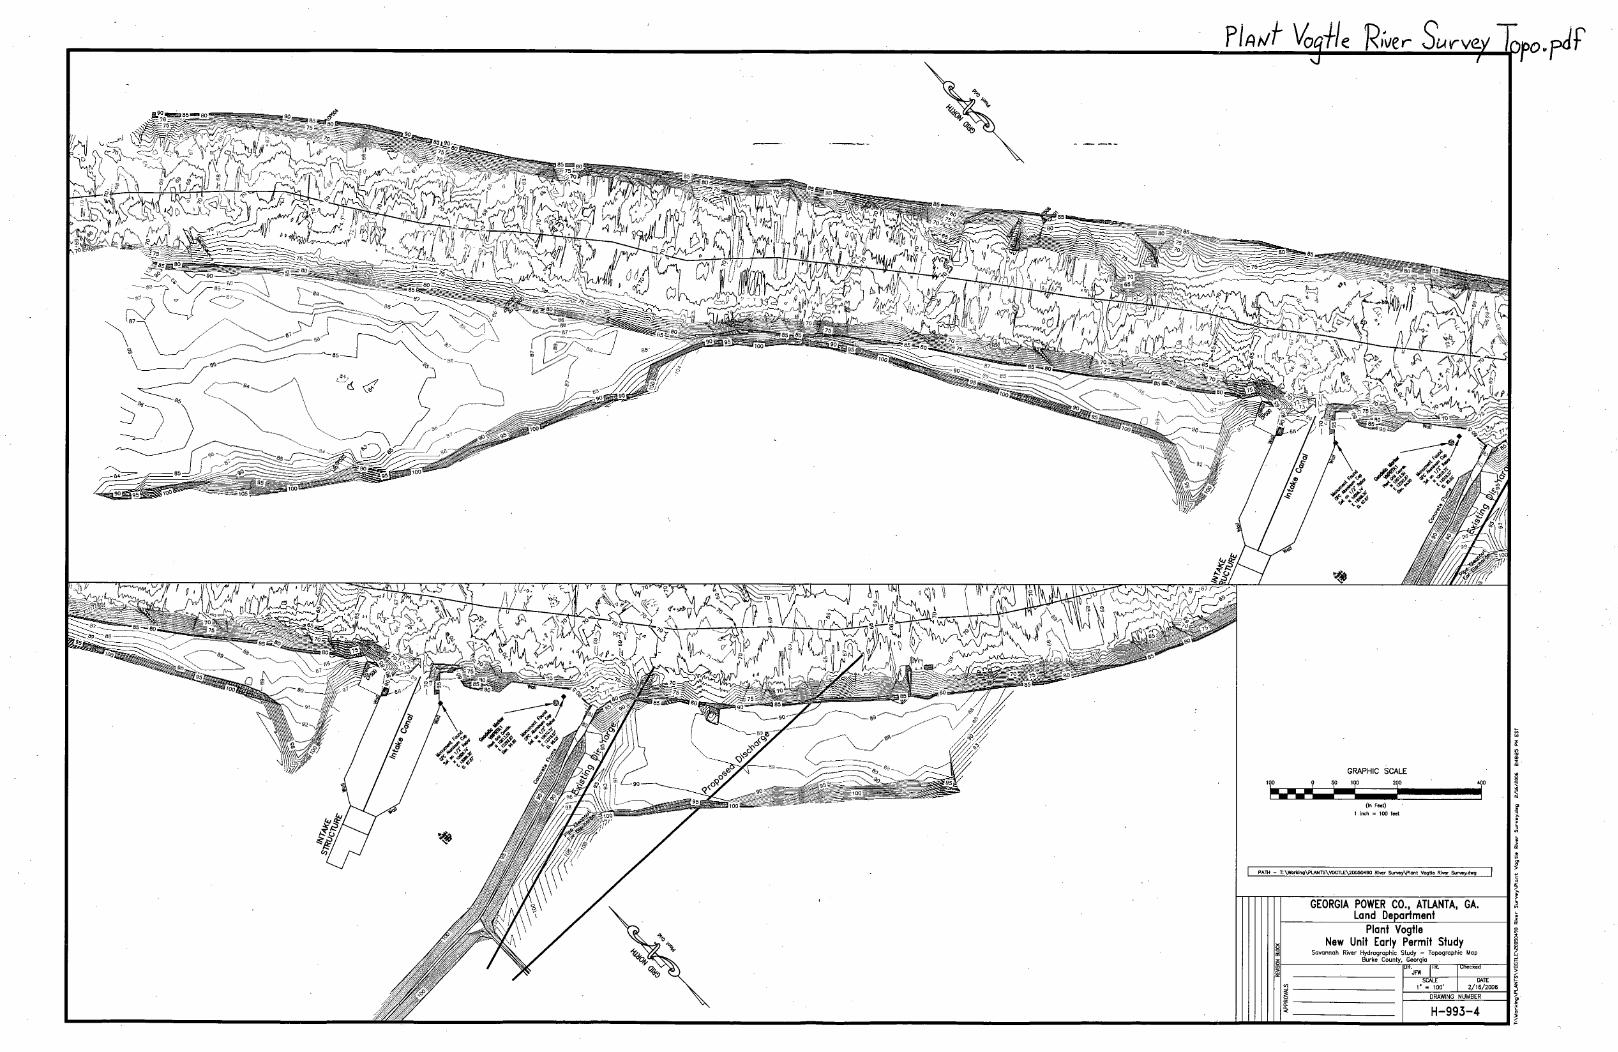
k,,CsoaP/Ai~e3.jp3
PN~e I OP /
buA CSO) ~P/R9Ae 1I
PAý3e I OF I
J41l CsJT-NA/ VSL -Aiws joPI
PAe / o-f/
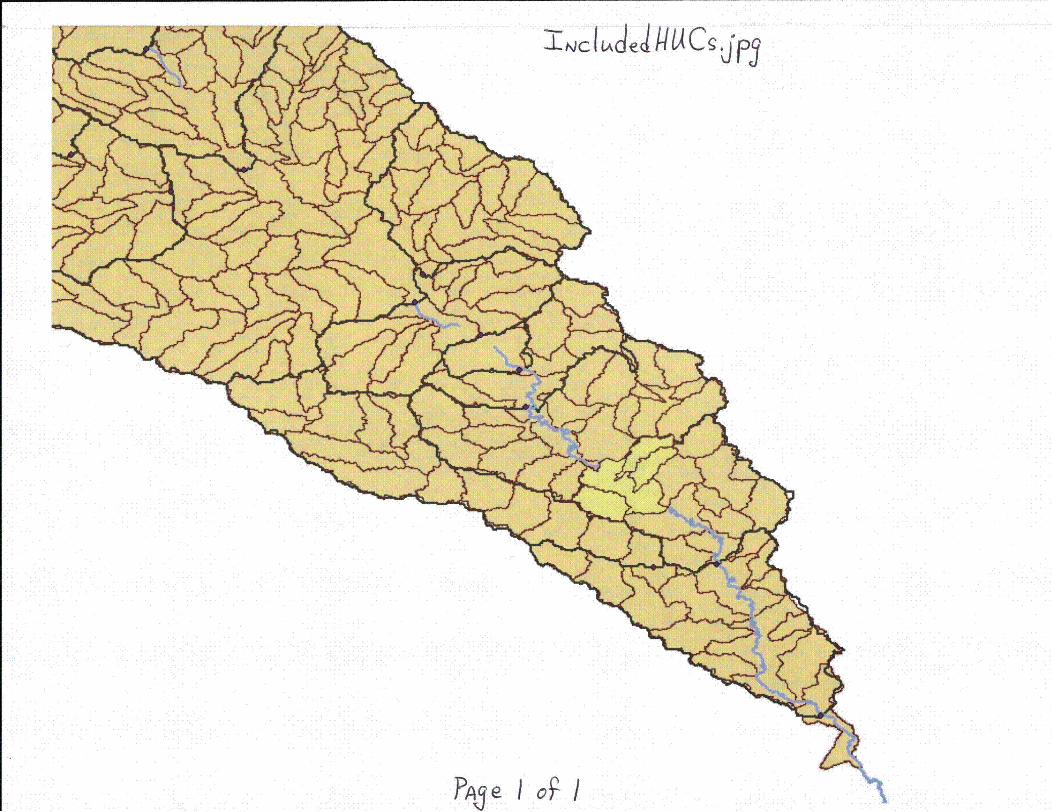
cLc14I4LAC~.jj~
PAj e Io~
NWSRFS documentation.txtFrom: wylie.quillian [[email protected]]Sent: Monday, May 02, 2005 2:52 PMTo: Hui, SamuelSubject: NWSRFS documentation
2:49 pm ET 05/02/2005
From: Wylie Quillian, S.E. River Forecast Center
To: Sam Hui, Bechtel Corp., San Francisco
The URL for documentation for theNWS River Forcst SystemUnit Hydrograph Operation:
http://www.nws.noaa.gov/oh/hrl/nwsrfs/users-manual/part5/_pdf/533unithg.pdf
Hope this helps.
Page 1 of I
Nwsrfs for Savannah Rvr.txt
From: wylie.quillian [[email protected]]Sent: Friday, May 06, 2005 1:01 PMTo: Hui, SamuelCc: John Feldt; Brad Gimmestad; Reggina CabreraSubject: Nwsrfs for Savannah Rvr
12:58 pm ET 05/06/2005From: Wylie Quillian, S.E. River Forecast CenterTo: Sam Hui, Bechtel Corp., San Francisco
NWSRFS is our primary tool.
We do not use dynamic routing in our model of the lower Savannah River.
Hui, Samuel wrote:
> Hi Wylie,
> Thanks for the data on unit hydrographs and the link to the NWSRFS.
> We were comparing the sub-basins in the report we have with the ones> you sent me. It appears that the drainage areas for some of the> sub-basins have changed and the definitions of the sub-basins are> somewhat different. We may have to re-do the PMF analysis for the> project we have on hand. If so, we have to decide if we should do it> with NWSRFS or HEC-HMS. It is also important that because of the> large valley storage in Savannah River below Augusta, we may have to> do dynamic routing in order to account more accurately the storage> effects in those reaches. Is your flood forecasting work for Savannah> River, we presume that the primary tool used is the NWSRFS? Do you> include any dynamic routing at all in the lower reaches where valley storage could be significant?
> Again, thanks for the help.
> Sam Hui
------ Original Message -----> From: wylie.quillian [mailto:[email protected]]> Sent: Monday, May 02, 2005 11:52 AM> To: Hui, Samuel> Subject: NWSRFS documentation
> 2:49 pm ET 05/02/2005
> From: Wylie Quillian, S.E. River Forecast Center
> To: Sam Hui, Bechtel Corp., San Francisco
> The URL for documentation for the
Page 1 of Z

Nwsrfs for Savannah Rvr.txt> NWS River Forcst System> Unit Hydrograph Operation:
> http://www.nws.noaa.gov/oh/hrl/nwsrfs/users-manual/part5/_pdf/533unith> g.pdf
> Hope this helps.
Page 2 Of 2
Savannah River routing parameters.txtFrom: wylie.quillian [[email protected]]Sent: Saturday, April 23, 2005 12:48 AMTo: Hui, SamuelCc: John Feldt; Brad Gimmestad; Christine McgeheeSubject: Savannah River routing parameters
Attachments: srblagk.txt
Please see attached file:srblagk.txt
Hui, Samuel wrote:> Dear Mr. Quillian,
> Thanks very much for the phone conversation yesterday, and in sending> us the unit hydrographs for Savannah River in your flood forecast> model all the way down to RM about 151.
> Upon reading our report again, I realized that I had mis-stated in our> phone conversation yesterday, that the report, we have, indicates that> there are more than 30 unit hydrographs. Actually, there are only 10> sub-basins to the point of interest, near RM 151. Please also send> the routing parameters for the reaches in the Savannah River or in the> tributaries between each of junction points. Thanks.
> Sam Hui
Page 1 oF I
Savannah Rvr Unit Hydrographs.txtFrom: wylie.quillian [[email protected]]Sent: Monday, May 02, 2005 2:10 PMTo: Hui, SamuelSubject: Savannah Rvr Unit Hydrographs
Attachments: srbuhg.txt
2:00 pm ET 05/02/5005
From: Wylie Quillian, S.E. River Forecast Center
To: Sam Hui, Bechtel Corp., San Francisco
Attached are the unit hydrographs currently in use at SERFC for the Savannah River Basin.
These are unit hyrographs for 1-inch of runoff in 6-hours.
The time-step of the ordinates in 6-hours.
The discharge units are cfs.
Page 1 of I
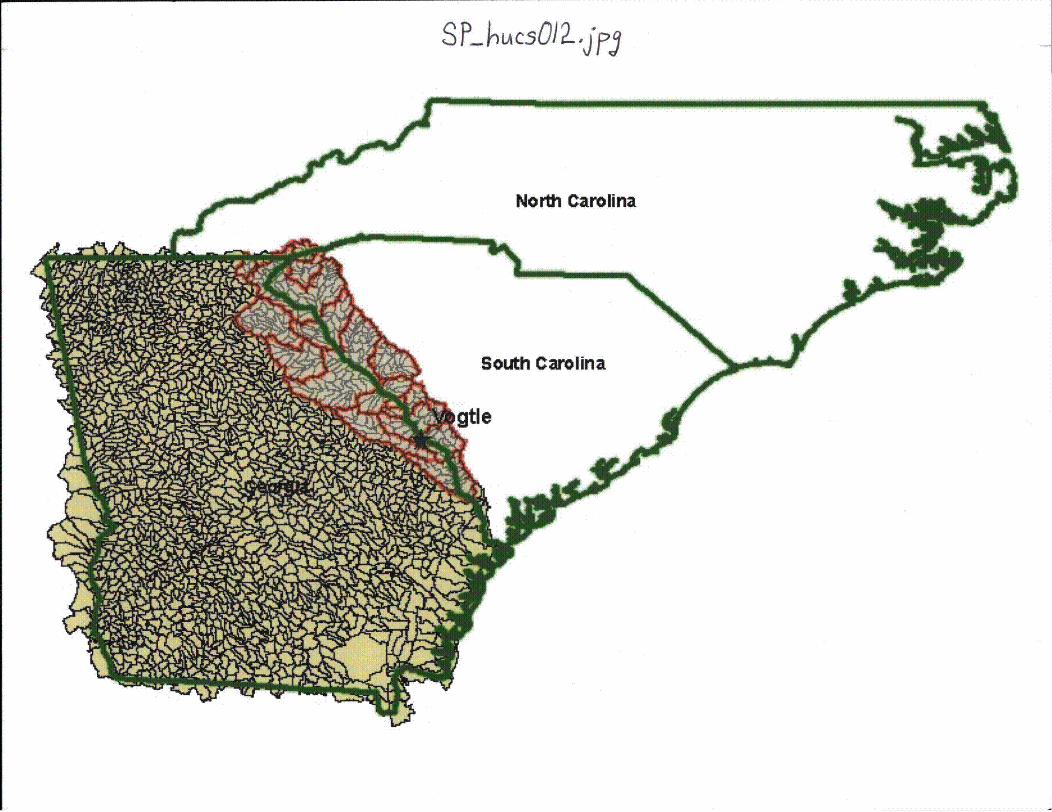
S p -iuACsO/Z ,j,,j
North Carolina
South Carolina
atle
srblagk.txt11:39 pm ET 04/22/2005
Routing Parameters in use at SERFC for Savannah River Basin
SERFC uses "Lag and K" routing.Lag and K routing by graphical methods is described inHydrology for Engineersby Linsley, Kohler, and Paulus2nd EditionChapter 7, Streamflow Routing.
Input to NWSRFS Lag/K Operation is described atwww.nws.noaa.gov/oh/hrl/nwsrfs/users-manual/part5/_pdf/5331agk.pdf
Sometimes we use a constant Lag and Ke.g. in segment HRTGIIN
Sometimes we use Lags and Ks that are afunction of dischargee.g. in segment JACS1.
IDENTIFIER TIGGI 34.80TITLE BURTON DAM, GAHeadwater basin
IDENTIFIER JCSS1 34.95TITLE JOCASSEE DAM, SCHeadwater basin
83.60
82.92
IDENTIFIER KEOS1 34.80 82.88TITLE KEOWEE DAM, SCUPSTREAM JCSS1No routing of JCSS 1 discharge performedi.e. JCSS 1 discharge used in unrouted form.
IDENTIFIER HRTGIIN 34.40 82.80TITLE HARTWELL DAM, GAUPSTREAM TIGGI KEOSILAG/K HRTG1AKEOSI QINE 6 ROUTED SQIN 6 0
1.0003.000
LAG/K HRTG1BTIGGI QINE 6ROUTE1 SQIN 6 0
0.0006.000
IDENTIFIER HRTG1 34.40 82.80TITLE HARTWELL DAM, GAUPSTREAM HRTGIIN
0 ENGL 0.00
0 ENGL 0.00
0.0
0.0
Page 1 0F I
srblagk.txtNo routing performed
IDENTIFIER RBRS1 34.00 82.60TITLE R B RUSSELL DAM, GAUPSTREAM HRTG1LAG/K RBRS 1HRTGI QINE 6 ROUTED SQIN 6 0 0 ENGL 0.00
3.0003.000
IDENTIFIER CARGI 34.10 83.00TITLE CARLTON BRIDGE, GAHeadwater basin
0.0
IDENTIFIER CHDS1UP 34.00 82.80TITLE CLARK HILL UPSTREAM a.k.a.UPSTREAM CARGILAG/K CHDS1UPCARG1 QINE 6 ROUTED SQIN 6 0
12.0006.000
IDENTIFIER CHDSIIN 33.70 82.20TITLE CLARK HILL INFLOWUPSTREAM RBRS1 CHDS1UPLAG/K CHDS1IARBRS1 QINE 6 ROUTED SQIN 6 0
0.0003.000
LAG/K CHDS1IBCHDS1UP SQIN 6ROUTE1 SQIN 6 C
0.0003.000
IDENTIFIER CHDS1 33.70 82.20TITLE CLARK HILL DAM, SCUPSTREAM CHDS IINNo routings performed
Broad River nr Bell GA
0 ENGL 0.00
0 ENGL 0.00
0 0ENGL0.00
0.0
0.0
0.0
IDENTIFIER MODS ITITLE MODOC, SCHeadwater basin
33.70 82.20
IDENTIFIER AGTGI 33.50 82.10TITLE STEVENS CR DAM, GAUPSTREAM CHDS1 MODS1LAG/K AGTG1AMODSI QINE 6ROUTE1 SQIN 6 0
6.00012.000
0 ENGL 0.00 0.0
Page 2 of -I
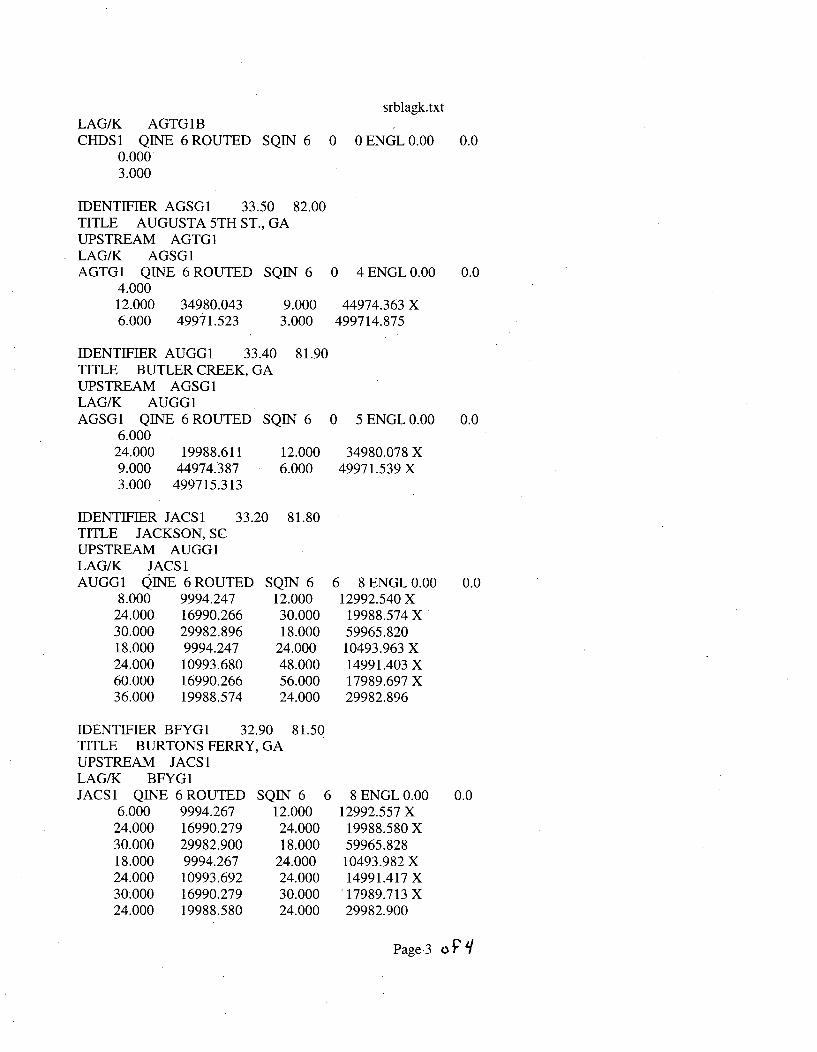
srblagk.txtLAG/K AGTG1BCHDS1 QINE 6ROUTED SQIN 6 0 0ENGL0.00
0.0003.000
IDENTIFIER AGSG1 33.50 82.00TITLE AUGUSTA 5TH ST., GAUPSTREAM AGTG1LAG/K AGSG1AGTG1 QINE 6ROUTED SQIN 6 0 4ENGL0.00
4.00012.000 34980.043 9.000 44974.363 X6.000 49971.523 3.000 499714.875
0.0
0.0
IDENTIFIER AUGGI 33.40 81.90TITLE BUTLER CREEK, GAUPSTREAM AGSG1LAG/K AUGGIAGSG1 QINE 6 ROUTED SQIN 6
6.00024.000 19988.611 12.0009.000 44974.387 6.0003.000 499715.313
0 5 ENGL 0.00
34980.078 X49971.539 X
0.0
IDENTIFIER JACS1 33.20 81.80TITLE JACKSON, SCUPSTREAM AUGGILAG/K JACS1AUGG1 QINE 6 ROUTED
8.000 9994.24724.000 16990.26630.000 29982.89618.000 9994.24724.000 10993.68060.000 16990.26636.000 19988.574
SQIN 612.00030.00018.000
24.00048.00056.00024.000
6 8 ENGL 0.0012992.540 X19988.574 X59965.82010493.963 X14991.403 X17989.697 X29982.896
0.0
IDENTIFIER BFYG1 32.90 81.50TITLE BURTONS FERRY, GAUPSTREAM JACS1LAG/K BFYG1JACS1 QINE 6 ROUTED
6.000 9994.26724.000 16990.27930.000 29982.90018.000 9994.26724.000 10993.69230.000 16990.27924.000 19988.580
SQIN 6 6 8 ENGL0.0012.000 12992.557X24.000 19988.580 X18.000 59965.828
24.000 10493.982 X24.000 14991.417X30.000 17989.713 X24.000 29982.900
0.0
Page,3 o'Fq
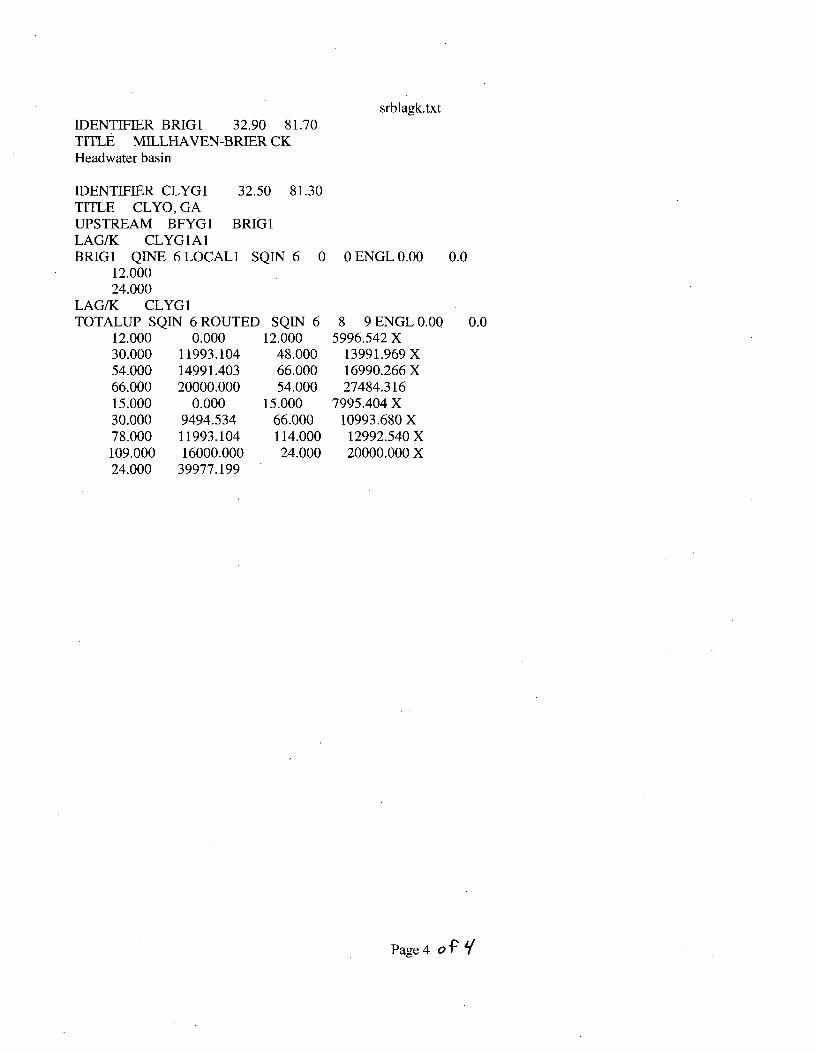
srblagk.txtIDENTIFIER BRIGI 32.90 81.70TITLE MILLHAVEN-BRIER CKHeadwater basin
IDENTIFIER CLYG1 32.50 81.30TITLE CLYO, GAUPSTREAM BFYG1 BRIG1LAG/K CLYG1A1BRIGI QINE 6 LOCALl SQIN 6 0
12.00024.000
LAG/K CLYGITOTALUP SQIN 6 ROUTED SQIN 6
0 ENGL0.00 0.0
12.00030.00054.00066.00015.00030.00078.000109.00024.000
0.00011993.10414991.40320000.000
0.0009494.53411993.10416000.000
39977.199
12.00048.00066.00054.000
15.00066.000114.00024.000
8 9 ENGL 0.00 0.05996.542X
13991.969 X16990.266 X27484.316
7995.404 X10993.680 X
12992.540 X20000.000 X
Page 4 o0 f.t/
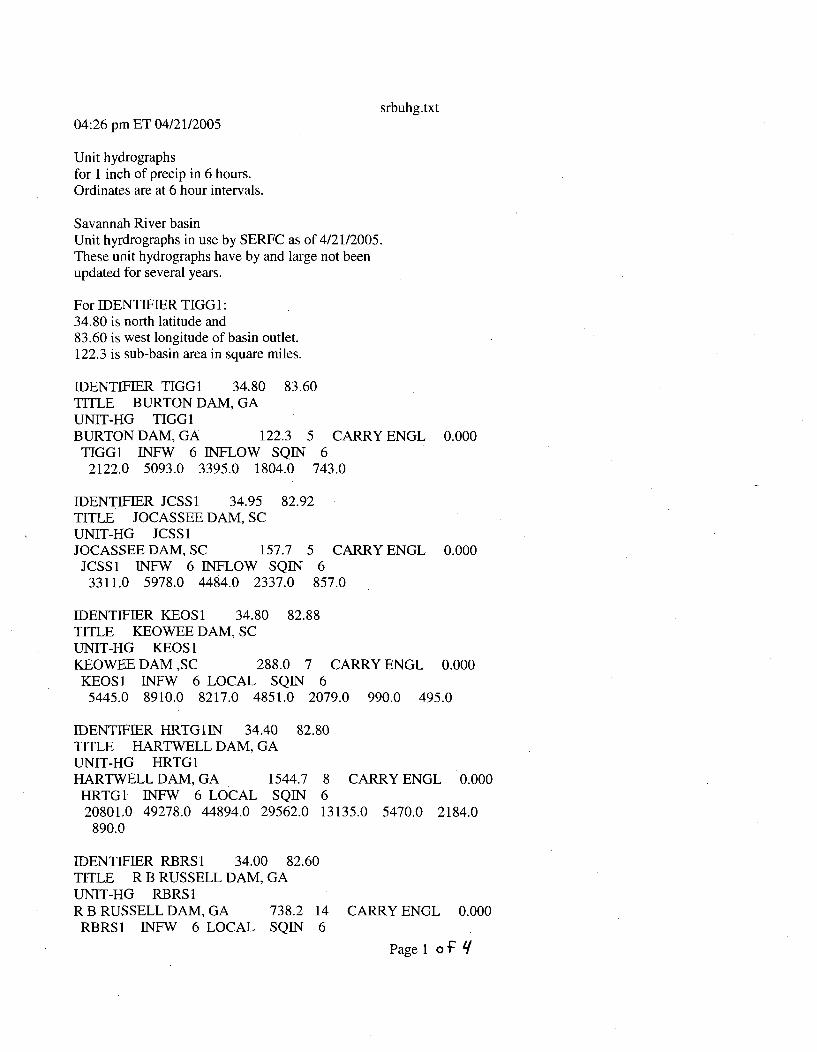
srbuhg.txt04:26 pm ET 04/21/2005
Unit hydrographsfor 1 inch of precip in 6 hours.Ordinates are at 6 hour intervals.
Savannah River basinUnit hyrdrographs in use by SERFC as of 4/21/2005.These unit hydrographs have by and large not beenupdated for several years.
For IDENTIFIER TIGG I:34.80 is north latitude and83.60 is west longitude of basin outlet.122.3 is sub-basin area in square miles.
IDENTIFIER TIGG1 34.80 83.60TITLE BURTON DAM, GAUNIT-HG TIGGIBURTON DAM, GA 122.3 5 CARRY ENGL 0.000TIGGI INFW 6 INFLOW SQIN 6
2122.0 5093.0 3395.0 1804.0 743.0
IDENTIFIER JCSS1 34.95 82.92TITLE JOCASSEE DAM, SCUNIT-HG JCSS1JOCASSEE DAM, SC 157.7 5 CARRY ENGL 0.000JCSS1 INFW 6 INFLOW SQIN 6
3311.0 5978.0 4484.0 2337.0 857.0
IDENTIFIER KEOS1 34.80 82.88TITLE KEOWEE DAM, SCUNIT-HG KEOS IKEOWEE DAM ,SC 288.0 7 CARRY ENGL 0.000KEOSI INFW 6 LOCAL SQIN 6
5445.0 8910.0 8217.0 4851.0 2079.0 990.0 495.0
IDENTIFIER HRTGIIN 34.40 82.80TITLE HARTWELL DAM, GAUNIT-HG HRTG 1HARTWELL DAM, GA 1544.7 8 CARRY ENGL 0.000HRTG1 INFW 6 LOCAL SQIN 620801,0 49278.0 44894.0 29562.0 13135.0 5470.0 2184.0
890.0
IDENTIFIER RBRS1 34.00 82.60TITLE R B RUSSELL DAM, GAUNIT-HG RBRS1R B RUSSELL DAM, GA 738.2 14 CARRY ENGL 0.000
RBRSI INFW 6 LOCAL SQIN 6
Page1 o'F q
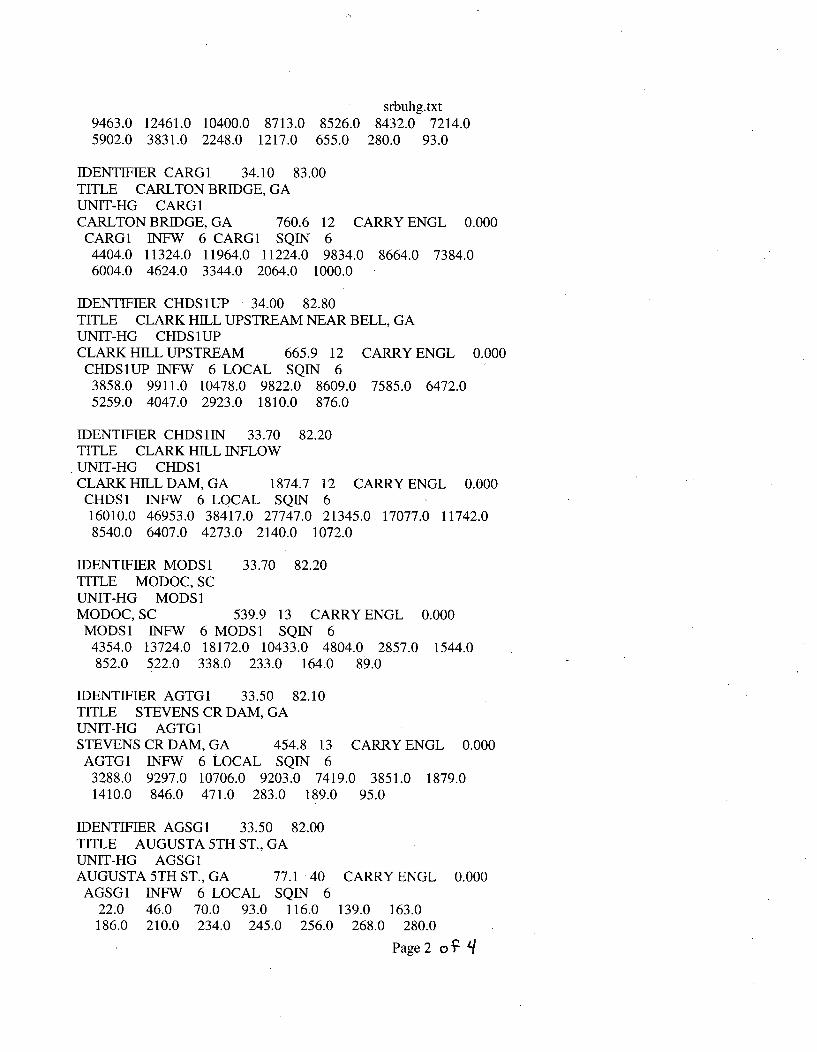
srbuhg.txt9463.0 12461.0 10400.0 8713.0 8526.0 8432.0 7214.05902.0 3831.0 2248.0 1217.0 655.0 280.0 93.0
IDENTIFIER CARG1 34.10 83.00TITLE CARLTON BRIDGE, GAUNIT-HG CARG1CARLTON BRIDGE, GA 760.6 12 CARRY ENGL 0.000
CARG1 INFW 6 CARGI SQIN 64404.0 11324.0 11964.0 11224.0 9834.0 8664.0 7384.06004.0 4624.0 3344.0 2064.0 1000.0
IDENTIFIER CHDS1UP 34.00 82.80TITLE CLARK HILL UPSTREAM NEAR BELL, GAUNIT-HG CHDS1UPCLARK HILL UPSTREAM 665.9 12 CARRY ENGL 0.000
CHDS1UP INFW 6 LOCAL SQIN 63858.0 9911.0 10478.0 9822.0 8609.0 7585.0 6472.05259.0 4047.0 2923.0 1810.0 876.0
IDENTIFIER CHDS1IN 33.70 82.20TITLE CLARK HILL INFLOWUNIT-HG CHDS ICLARK HILL DAM, GA 1874.7 12 CARRY ENGL 0.000
CHDS1 INFW 6 LOCAL SQIN 616010.0 46953.0 38417.0 27747.0 21345.0 17077.0 11742.08540.0 6407.0 4273.0 2140.0 1072.0
IDENTIFIER MODS1 33.70 82.20TITLE MODOC, SCUNIT-HG MODS1MODOC, SC 539.9 13 CARRY ENGL 0.000MODS1 INFW 6 MODS1 SQIN 6
4354.0 13724.0 18172.0 10433.0 4804.0 2857.0 1544.0852.0 522.0 338.0 233.0 164.0 89.0
IDENTIFIER AGTG1 33.50 82.10TITLE STEVENS CR DAM, GAUNIT-HG AGTG1STEVENS CR DAM, GA 454.8 13 CARRY ENGL 0.000AGTG1 INFW 6 LOCAL SQIN 6
3288.0 9297.0 10706.0 9203.0 7419.0 3851.0 1879.01410.0 846.0 471.0 283.0 189.0 95.0
IDENTIFIER AGSG1 33.50 82.00TITLE AUGUSTA 5TH ST., GAUNIT-HG AGSG1AUGUSTA 5TH ST., GA 77.1 40 CARRY ENGL 0.000AGSG1 INFW 6 LOCAL SQIN 6
22.0 46.0 70.0 93.0 116.0 139.0 163.0186.0 210.0 234.0 245.0 256.0 268.0 280.0
Page 2 oz q
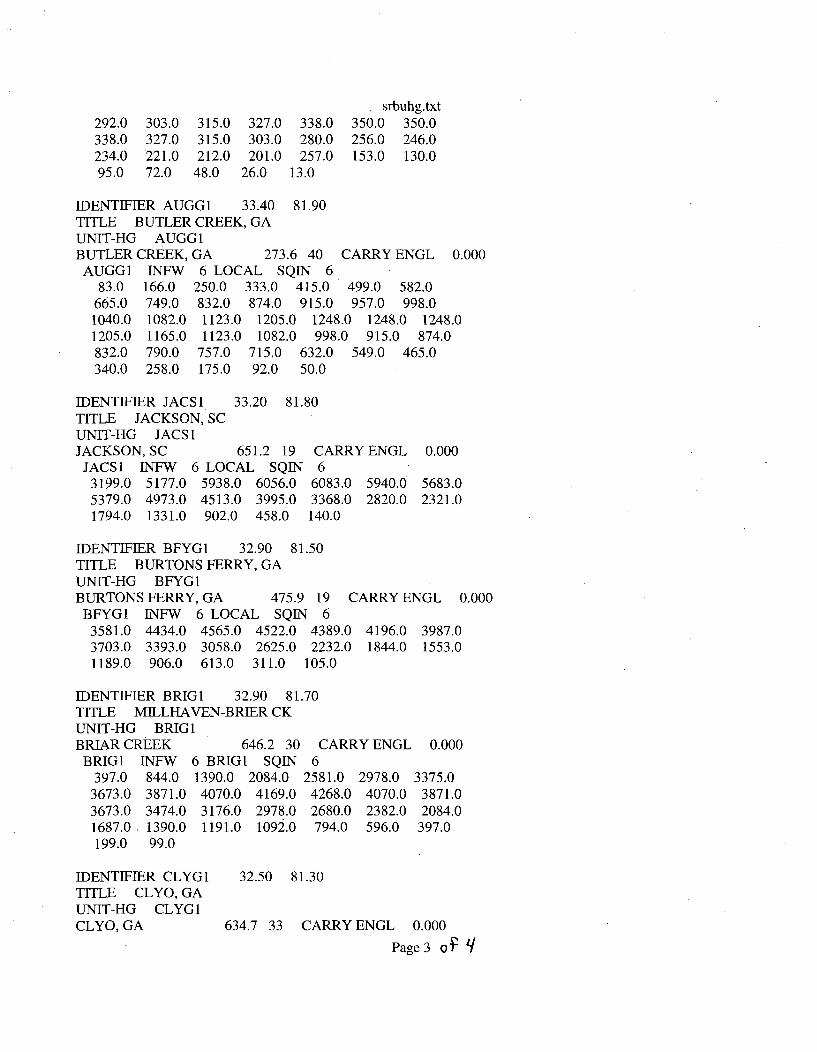
srbuhg.txt292.0 303.0 315.0 327.0 338.0 350.0 350.0338.0 327.0 315.0 303.0 280.0 256.0 246.0234.0 221.0 212.0 201.0 257.0 153.0 130.095.0 72.0 48.0 26.0 13.0
IDENTIFIER AUGG1 33.40 81.90TITLE BUTLER CREEK, GAUNIT-HG AUGG1BUTLER CREEK, GA 273.6 40 CARRY ENGL 0.000
AUGGI INFW 6 LOCAL SQIN 683.0 166.0 250.0 333.0 415.0 499.0 582.0
665.0 749.0 832.0 874.0 915.0 957.0 998.01040.0 1082.0 1123.0 1205.0 1248.0 1248.0 1248.01205.0 1165.0 1123.0 1082.0 998.0 915.0 874.0832.0 790.0 757.0 715.0 632.0 549.0 465.0340.0 258.0 175.0 92.0 50.0
IDENTIFIER JACS1 33.20 81.80TITLE JACKSON, SCUNIT-HG JACS IJACKSON, SC 651.2 19 CARRY ENGL 0.000
JACS1 NFW 6 LOCAL SQIN 63199.0 5177.0 5938.0 6056.0 6083.0 5940.0 5683.05379.0 4973.0 4513.0 3995.0 3368.0 2820.0 2321.01794.0 1331.0 902.0 458.0 140.0
IDENTIFIER BFYG1 32.90 81.50TITLE BURTONS FERRY, GAUNIT-HG BFYG1BURTONS FERRY, GA 475.9 19 CARRY ENGL 0.000
BFYG1 INFW 6 LOCAL SQIN 63581.0 4434.0 4565.0 4522.0 4389.0 4196.0 3987.03703.0 3393.0 3058.0 2625.0 2232.0 1844.0 1553.01189.0 906.0 613.0 311.0 105.0
IDENTIFIER BRIGI 32.90 81.70TITLE MILLHAVEN-BRIER CKUNIT-HG BRIG1BRIAR CREEK 646.2 30 CARRY ENGL 0.000BRIGI INFW 6 BRIGI SQIN 6
397.0 844.0 1390.0 2084.0 2581.0 2978.0 3375.03673.0 3871.0 4070.0 4169.0 4268.0 4070.0 3871.03673.0 3474.0 3176.0 2978.0 2680.0 2382.0 2084.01687.0 1390.0 1191.0 1092.0 794.0 596.0 397.0199.0 99.0
IDENTIFIER CLYGI 32.50 81.30TITLE CLYO, GAUNIT-HG CLYGICLYO, GA 634.7 33 CARRY ENGL 0.000
Page3 op q
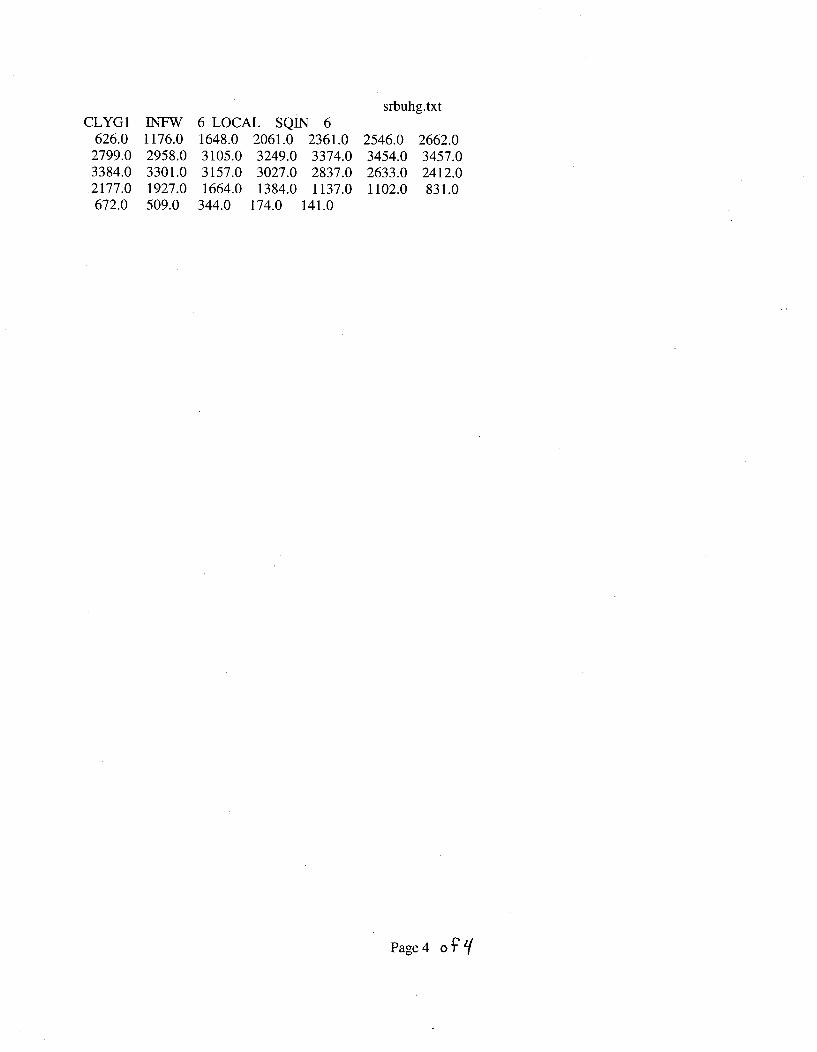
srbuhg.txtCLYGI IRNFW 6 LOCAL SQIN 6
626.0 1176.0 1648.0 2061.0 2361.0 2546.0 2662.02799.0 2958.0 3105.0 3249.0 3374.0 3454.0 3457.03384.0 3301.0 3157.0 3027.0 2837.0 2633.0 2412.0.2177.0 1927.0 1664.0 1384.0 1137.0 1102.0 831.0672.0 509.0 344.0 174.0 141.0
Page4 o~j
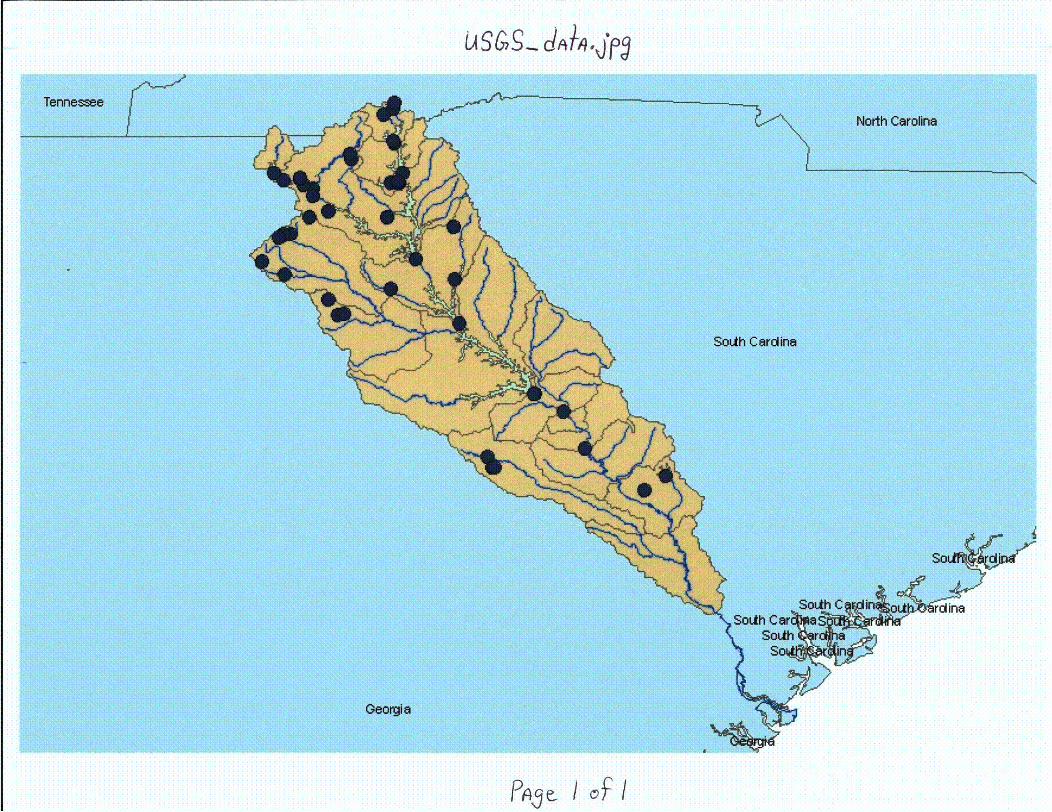
Tennessee
L4~Lg ciA&Je~
North Carolina|
!
SouLh Card ina
Oeorgia
plqj t / o4/
V03ýle- PI-G- L2-q-es&viz-'Vo'-7-2.jPq
Po'g,ge / ot /
ISouthern Nuclear Operating Company
AR-07-0197
Enclosure 3
Converted RAI # 2.4.1-1 Response Data Files
Contact PersonName:Mailing Address:
E-Mail Address:Phone Number:
Jim T. DavisSouthern Nuclear Operating CompanyBin B05640 Inverness Center ParkwayBirmingham, AL [email protected]
Document Components:
Supplemental response electronic data for Hydrology RAI # 2.4.1-1 on Vogtle ESP Application iscontained on one (1) CD-ROM. The CD-ROM is labeled "RAI # 2.4.1-1 Supplemental Response DataFiles - Publicly Available - Vogtle Early Site Permit Application," and contains 12 files as follows:
File File Title No. of Bytes PubliclyNo. Available001 basinsoutlines.pdf 153,269 Yes002 NWScoords Input to CORPCON.pdf 186,272 Yes003 NWSout.pdf 272,751 Yes004 DayQJackson.pdf 227,573 Yes005 QdailyAugusta.pdf 643,293 Yes006 QdailyBurtonsFerry.pdf 363,420 Yes007 QdailyClyo.pdf 515,043 Yes008 USGS mean-daily flow-Augusta 40-03_April21.pdf 458,574 Yes009 USGS mean-daily flow-Augusta 84-39_Apri123.pdf 252,900 Yes010 USGS mean-daily flowBurtonsFerry 40-03_April2O.pdf 363,418 Yes011 USGS mean-daily flow-Jackson 72-02.April2O.pdf 184,320 Yes012 basins.pdf 172,880 Yes
Related Documents