Sedimentology ( 1988) 35,697-7 I5 Stratigraphy and remanence acquisition of a palaeomagnetic reversal in alluvial Siwalik rocks of Pakistan LISA TAUXE Scripps Institution of Oceanography fA-020),La Jolla, California 92093, USA CATHERINE BADGLEY Museum o f Paleontology, University of Michigan, Ann Arbor, Michigan 48109, USA ABSTRACT A high-resolution record of a palaeomagnetic reversal is documented in Miocene alluvial rocks of Pakistan. We examined lateral variability of lithostratigraphy and palaeomagnetic stratigraphy through the same palaeomagnetic reversal in six correlated sections. Each section contains one or more palaeomagnetic sites with directions between fully reversed and fully normal. The position of the reversal illustrates local relief in the study area and the time-transgressive nature of certain stratigraphic units. Variability in the thickness of the transitional interval indicates contemporaneous variability in sediment accumulation rates. Different characteristics of palaeomagnetic remanence are associated with the depositional and post- depositional history of these sediments. Variability in patterns of remanence behaviour is the basis for inferences about post-depositional processes. We discuss two magnetic parameters that express coherency of palaeomagnetic samples-the maximum angle of deviation and the circular standard deviation. Of particular interest are samples with incoherent palaeomagnetic signals. The incoherency of samples is inversely correlated with the thickness of the transitional interval. A low rate of sediment accumulation, suggested by a thin transitional interval, may facilitate a prolonged period of remagnetization through pedogenic or hydrological processes. Alternatively, transition intervals, defined by coherent magnetization, may be thin as a result of pedogenically induced incoherency. DEDICATION We dedicate this paper to our colleague Noye Johnson (1930-1987) whose interest in magnetostratigraphy and time resolution in the stratigraphic record inspired aspects of this research. INTRODUCTION The study of magnetic remanence in sedimentary rocks has made a substantive contribution to stratig- raphy and historical geology in the form of chronolo- gies for relatively thick individual and composite stratigraphic sections. Most research in palaeomag- netic stratigraphy emphasizes the vertical distribution of normal and reversed palaeomagnetic samples, since this distribution is the basis for correlating individual sections to the geomagnetic reversal time-scale. The study of lateral variation in palaeomagnetic stratigra- phy offers different insights. The lateral expression of magnetic polarity zones may indicate the palaeotopog- raphy of individual reversal boundaries (e.g. Behrens- meyer & Tauxe, 1982) and may provide information about lateral variability in sediment accumulation rates (e.g. Johnson & Sheikh, 1985). This study documents lateral variation in palaeo- magnetic stratigraphy at a very fine degree of resolution-that of an individual polarity transition- in Miocene alluvial rocks of the Siwalik Group in 697

Welcome message from author
This document is posted to help you gain knowledge. Please leave a comment to let me know what you think about it! Share it to your friends and learn new things together.
Transcript
Sedimentology ( 1988) 35,697-7 I5
Stratigraphy and remanence acquisition of a palaeomagnetic reversal in alluvial Siwalik rocks of Pakistan
LISA T A U X E
Scripps Institution of Oceanography fA-020), La Jolla, California 92093, USA
C A T H E R I N E B A D G L E Y
Museum o f Paleontology, University of Michigan, Ann Arbor, Michigan 48109, USA
ABSTRACT
A high-resolution record of a palaeomagnetic reversal is documented in Miocene alluvial rocks of Pakistan. We examined lateral variability of lithostratigraphy and palaeomagnetic stratigraphy through the same palaeomagnetic reversal in six correlated sections. Each section contains one or more palaeomagnetic sites with directions between fully reversed and fully normal. The position of the reversal illustrates local relief in the study area and the time-transgressive nature of certain stratigraphic units. Variability in the thickness of the transitional interval indicates contemporaneous variability in sediment accumulation rates.
Different characteristics of palaeomagnetic remanence are associated with the depositional and post- depositional history of these sediments. Variability in patterns of remanence behaviour is the basis for inferences about post-depositional processes. We discuss two magnetic parameters that express coherency of palaeomagnetic samples-the maximum angle of deviation and the circular standard deviation. Of particular interest are samples with incoherent palaeomagnetic signals. The incoherency of samples is inversely correlated with the thickness of the transitional interval. A low rate of sediment accumulation, suggested by a thin transitional interval, may facilitate a prolonged period of remagnetization through pedogenic or hydrological processes. Alternatively, transition intervals, defined by coherent magnetization, may be thin as a result of pedogenically induced incoherency.
DEDICATION
We dedicate this paper to our colleague Noye Johnson (1930-1987) whose interest in magnetostratigraphy and time resolution in the stratigraphic record inspired aspects of this research.
INTRODUCTION
The study of magnetic remanence in sedimentary rocks has made a substantive contribution to stratig- raphy and historical geology in the form of chronolo- gies for relatively thick individual and composite stratigraphic sections. Most research in palaeomag- netic stratigraphy emphasizes the vertical distribution of normal and reversed palaeomagnetic samples, since this distribution is the basis for correlating individual sections to the geomagnetic reversal time-scale. The study of lateral variation in palaeomagnetic stratigra-
phy offers different insights. The lateral expression of magnetic polarity zones may indicate the palaeotopog- raphy of individual reversal boundaries (e.g. Behrens- meyer & Tauxe, 1982) and may provide information about lateral variability in sediment accumulation rates (e.g. Johnson & Sheikh, 1985).
This study documents lateral variation in palaeo- magnetic stratigraphy at a very fine degree of resolution-that of an individual polarity transition- in Miocene alluvial rocks of the Siwalik Group in
697
698 L. Tauxe and C . Badgley
northern Pakistan. Reversals of magnetic polarity occur over relatively short intervals-less than lo4 years (Fuller, Williams & Hoffman, 1979). Although there is debate over whether the directional change occurs smoothly (Clement & Kent, 1984; Valet, Laj & Tucholka, 1986) or in abrupt jumps (Prevot et al., 1985), there is little doubt that reversals are character- ized by a range of intermediate directions. Thus, detailed stratigraphic records of polarity transitions potentially convey information about the complete- ness and continuity of sedimentation at time scales of hundreds to thousands of years. Furthermore, different records of the same transition within a sedimentation system indicate laterally contemporaneous variations in sediment accumulation and post-depositional mod- ification.
Palaeomagnetic records do not act as passive markers of sedimentation events; processes of mag- netic remanence acquisition are intimately involved with depositional and post-depositional processes. Although this characteristic of sedimentary palaeo- magnetism renders it less than ideal as a record of geomagnetic field behaviour, useful information can be obtained from analysis of magnetic properties such as coherency of magnetization and the relative timing of acquisition of different components of magnetic remanence. In this study, we investigate the relation- ship of magnetic coherency to rates of sediment accumulation and to soil formation.
Previously, Tauxe & Opdyke (1982) documented intermediate directions in the study areas between sites with reversed (below) and normal (above) directions; this pattern was interpreted as the record of a polarity transition. We sampled the same stratigraphic sequence again, as well as an additional five correlated sections. Here, we report the strati- graphic and palaeomagnetic data and discuss aspects of sediment accumulation and remanence acquisition during the period of the polarity transition.
BACKGROUND
Geologic setting
The Siwalik Group is a Neogene molasse extending along the southern margin of the Himalayas (Pilbeam et al., 1977; Shah, 1977). Siwalik rocks bear a substantial palaeontological record of continental vertebrates (e.g. Barry, Lindsay & Jacobs, 1982) and stratigraphic record of alluvial processes (e.g. Beh- rensmeyer & Tauxe, 1982) and of Himalayan tectonic
history (e.g. Johnson et al., 1985). The Siwalik sequence of the Potwar Plateau, northern Pakistan, is over 5000m thick (Barry, Behrensmeyer & Mon- aghan, 1980). This area has been a focus of research in vertebrate palaeontology (Barry et a/., 1982; Barry et a/., 1985), palaeoanthropology (Pilbeam, 1982, 1986), sedimentology (Behrensmeyer & Tauxe, 1982; Behrensmeyer, 1987), magnetostratigraphy (Opdyke et al., 1979; Tauxe & Opdyke, 1982; Johnson et al., 1982, 1985), and palaeoecology (Badgley & Behrens- meyer, 1980; Badgley, 1986). In the Potwar Plateau, magnetostratigraphy (Tauxe & Opdyke, 1982; John- son et a/., 1982, 1985) has provided the temporal framework for biostratigraphic and lithostratigraphic studies (Barry e t a / . , 1980, 1982, 1985; Behrensmeyer & Tauxe, 1982).
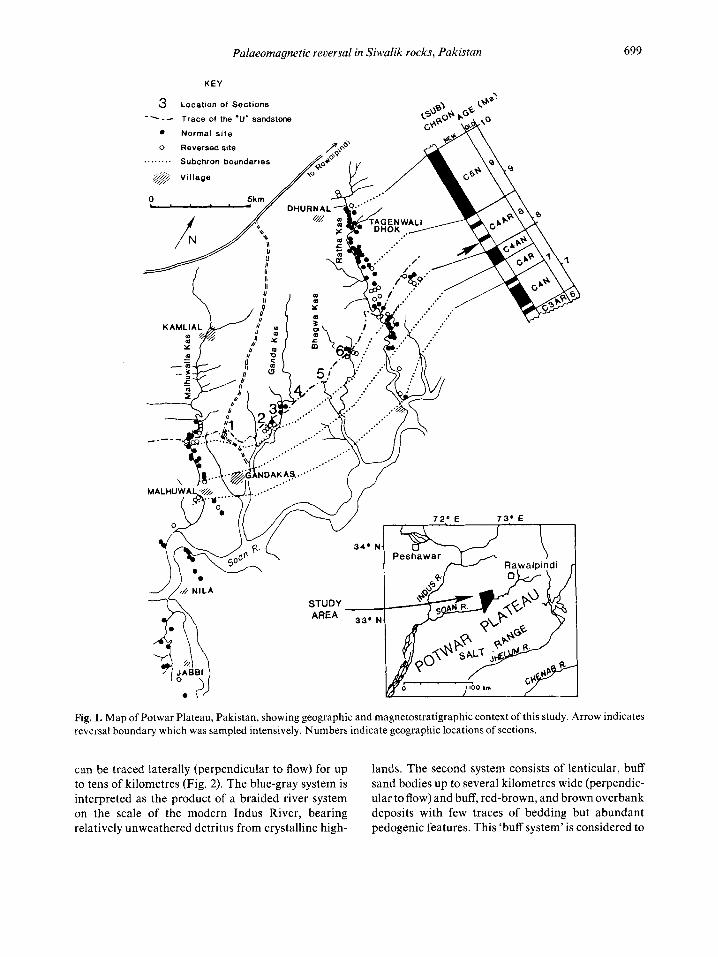
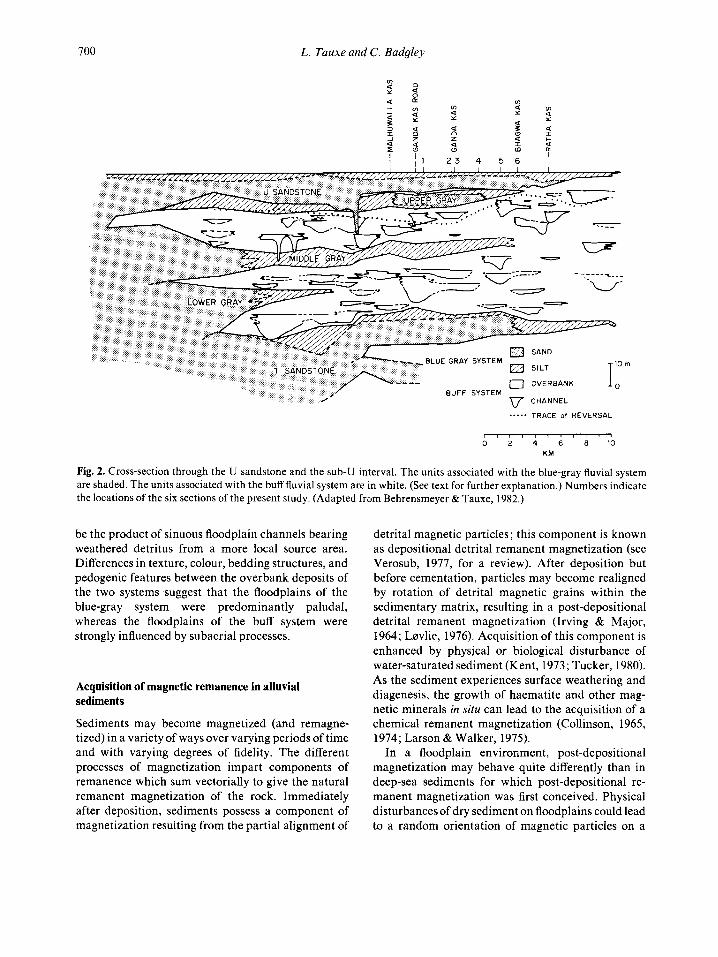
The research presented here stems from earlier magnetostratigraphic and lithostratigraphic studies of a stratigraphic interval of late Miocene age. We term this sedimentary package the ‘sub-U interval,’ named for a prominent marker sandstone, the ‘U’ sandstone, that extends laterally for over 35 km (Figs 1 and 2). Tauxe & Opdyke (1982) documented transitional directions for a magnetic reversal in sub- chron C4AR (formerly Epoch 8) in sediments below the U sandstone (Section GK of Tauxe & Opdyke, 1982). In this study, we document the lateral expres- sion of the same palaeomagnetic transition, located between the ‘Middle Gray’ silt unit and the U sandstone (Figs 2 and 3). This stratigraphic interval corresponds to the upper portion of the palaeomag- netic subchron C4AR (Fig. 1). (The chron terminology is that of LaBrecque et al., 1983). In particular, we focus on the normal-to-reversed transition at the end of the upper normal zone within this subchron (see arrow in Fig. I). The age of this transition is estimated as 8.1 Myr by Mankinen & Dalrymple (1979, Fig. l), and as 8.41 Myr by Berggren eta/ . (1 985). The absolute age is not critical for the present study and we use the time scale of Mankinen and Dalrymple for consistency with earlier work in Siwalik magnetostratigraphy.
Within the sub-U interval, lateral tracing of palaeomagnetic reversal boundaries and stratigraphic units formed the basis for a detailed reconstruction of Miocene fluvial systems (Behrensmeyer & Tauxe, 1982). Two systems were recognized. They are distinguished on the basis of colour, mineralogy, thickness, sedimentary structures, and lateral conti- nuity of both coarse-grained and fine-grained units. The ‘blue-gray system’ consists of extensive, tabular sheets of blue-gray sandstone that pass laterally or vertically into thin-bedded gray siltstones. These units
Palaeomagnetic reversal in Siwalik rocks, Pakistan 699
KEY
Fig. 1. Map of Potwar Plateau, Pakistan, showing geographic and magnetostratigraphic context of this study. Arrow indicates reversal boundary which was sampled intensively. Numbers indicate geographic locations of sections.
can be traced laterally (perpendicular to flow) for up to tens of kilometres (Fig. 2). The blue-gray system is interpreted as the product of a braided river system on the scale of the modern Indus River, bearing relatively unweathered detritus from crystalline high-
lands. The second system consists of lenticular, buff sand bodies up to several kilometres wide (perpendic- ular to flow) and buff, red-brown, and brownoverbank deposits with few traces of bedding but abundant pedogenic features. This ‘buff system’ is considered to
700 L. Tuuxe and C. Budgley
..... TRACE of REVERSAL
1 , , 1 , 1 1 1 , ’ 1
0 2 4 6 8 1 0 KM
Fig. 2. Cross-section through the U sandstone and the sub-U interval. The units associated with the blue-gray fluvial system are shaded. The units associated with the buff fluvial system are in white. (See text for further explanation.) Numbers indicate the locations of the six sections of the present study. (Adapted frsm Behrensmeyer & Tauxe, 1982.)
be the product of sinuous floodplain channels bearing weathered detritus from a more local source area. Differences in texture, colour, bedding structures, and pedogenic features between the overbank deposits of the two systems suggest that the floodplains of the blue-gray system were predominantly paludal, whereas the floodplains of the buff system were strongly influenced by subaerial processes.
Acquisition of magnetic remanence in alluvial sediments
Sediments may become magnetized (and remagne- tized) in a variety of ways over varying periods of time and with varying degrees of fidetity. The different processes of magnetization impart components of remanence which sum vectorially to give the natural remanent magnetization of the rock. Immediately after deposition, sediments possess a component of magnetization resulting from the partial alignment of
detrital magnetic particles ; this component is known as depositional detrital remanent magnetization (see Verosub, 1977, for a review). After deposition but before cementation, particles may become realigned by rotation of detrital magnetic grains within the sedimentary matrix, resulting in a post-depositional detrital remanent magnetization (Irving & Major, 1964; Lervlie, 1976). Acquisition of this component is enhanced by physical or biological disturbance of water-saturated sediment (Kent, 1973; Tucker, 1980). As the sediment experiences surface weathering and diagenesis, the growth of haematite and other mag- netic minerals in situ can lead to the acquisition of a chemical remanent magnetization (Collinson, 1965, 1974; Larson & Walker, 1975).
In a floodplain environment, post-depositional magnetization may behave quite differently than in deep-sea sediments for which post-depositional re- manent magnetization was first conceived. Physical disturbances of dry sediment on floodplains could lead to a random orientation of magnetic particles on a
Palaeomagnetic reversal in Siwalik rocks, Pakistan 70 1
variety of spatial scales. For example, trampling by terrestrial vertebrates may break dry mud drapes into small pieces, thereby randomizing the orientations of the pieces with respect to one another, while coherency within individual fragments is maintained. Realign- ment may also occur by physical or biological agents during soil formation. Mechanical stresses induced by episodic wetting and drying produces the slickensides observed in Siwalik palaeosols. Such disturbances provide a potential opportunity for reorientation during the wet period and randomization during shrinking and cracking in the dry period. Similarly, activities of roots and burrowing animals may play a role in the acquisition of post-depositional components of remanent magnetization. Here, we call incoherent magnetization resulting from randomizing post-dep- ositional processes ‘misaligned remanent magnetiza- tion’.
LITHOSTRATIGRAPHY
Field methods
Six stratigraphic sections, numbered 1-6 from west to east, form the basis for this study. The sections occur in stream cuts north of the Soan River (Fig. 1). The
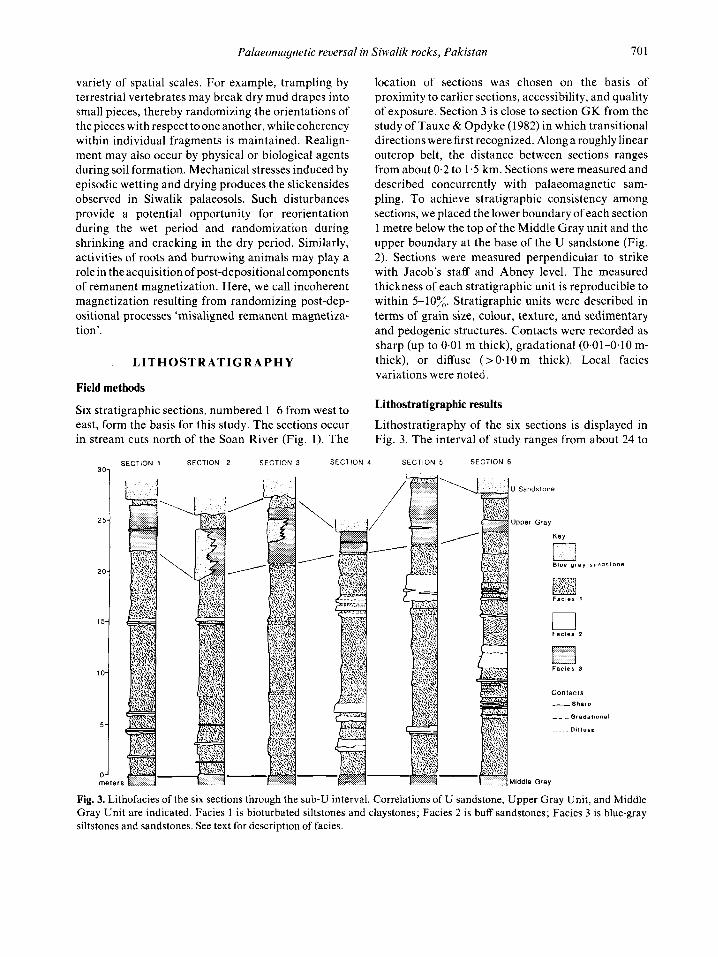
location of sections was chosen on the basis of proximity to earlier sections, accessibility, and quality of exposure. Section 3 is close to section GK from the study of Tauxe & Opdyke (1982) in which transitional directions were first recognized. Along a roughly linear outcrop belt, the distance between sections ranges from about 0.2 to 1.5 km. Sections were measured and described concurrently with palaeomagnetic sam- pling. To achieve stratigraphic consistency among sections, we placed the lower boundary of each section 1 metre below the top of the Middle Gray unit and the upper boundary at the base of the U sandstone (Fig. 2). Sections were measured perpendicular to strike with Jacob’s staff and Abney level. The measured thickness of each stratigraphic unit is reproducible to within 5-10%. Stratigraphic units were described in terms of grain size, colour, texture, and sedimentary and pedogenic structures. Contacts were recorded as sharp (up to 0.01 m thick), gradational (0.01-0.10 m- thick), or diffuse (>0.10 m thick). Local facies variations were noted.
Lithostratigraphic results
Lithostratigraphy of the six sections is displayed in Fig. 3. The interval of study ranges from about 24 to
SECTION 1 SECTION 2 SECTION 3 SECTION 4 SECTION 5 SECTION 6 3c
2:
2c
15
10
5
0 meter5
\
Fig. 3. Lithofacies of the six sections through the sub-U interval. Correlations of U sandstone, Upper Gray Unit, and Middle Gray Unit are indicated. Facies 1 is bioturbated siltstones and claystones; Facies 2 is buff sandstones; Facies 3 is blue-gray siltstones and sandstones. See text for description of facies.
702 L. Tauxe and C. Badgley
29 m in thickness. Using the top of the Middle Gray siltstone as a plausible horizontal datum, the Upper Gray unit and base of the U sandstone display irregular topography, with a rise in palaeoslope from the central sections (2, 3, and 4) toward the west (Section 1) and the east (Sections 5 and 6). Excluding the U sandstone, three facies are present.
Facies 1: Bioturbated siltstones and claystones
The volumetrically predominant facies 1 consists of poorly sorted siltstones and silty claystones with abundant post-depositional structures. Colours in- clude shades of medium brown, yellow-brown, and red-brown. Units range in thickness from 0.15 to 7.5 m. Contacts are mainly gradational or diffuse, and units are distinguished primarily on the basis of changes in texture, colour, and pedogenic structures. Some units can be traced laterally for several kilo- metres, but many cannot be traced even between two sections in the study area, indicating that many units of this facies are laterally restricted to some tens of metres or are highly variable laterally.
Outstanding features of this fine-grained facies are the scarcity of primary bedding structures and the frequency of post-depositional structures. When bed- ding is present in restricted patches, individual beds range from 1 to 50mm in thickness. Secondary structures include disrupted bedding, slickensides, nodules, root and burrow casts, and mottling in bands, networks, streaks, and spots. Nodules are precipitates of variable composition, size, and surface texture. The most abundant and widely distributed nodules are calcareous, smooth, and spherical; these are from 2 to 10 mm in diameter and range from off-white to the colour of the sediment matrix. Calcareous nodules also occur as larger (up to 0.1 m across), irregular lumps with sharply pitted surfaces. Red-brown to black and yellow-brown nodules of manganese and iron oxides are more limited in distribution, although they may be quite abundant locally. These dark nodules are typically spherical and range from 3 to 10mm across. They are usually associated with calcareous nodules. Mottling occurs as a stain, often pale gray-green, that crosses grain-size boundaries. Most of the secondary features in this facies are considered to result from pedogenic overprinting and are broadly similar to other Cenozoic palaeosols (e.g. Retallack, 1983; Brown & Kraus, 1981). This facies constitutes most of the overbank deposits of the buff fluvial system (Behrensmeyer &Tauxe, 1982; Badgley, 1986).
Facies 2: Buff Sandstones
The second facies consists mainly of sandstone and silty sandstone, with thin lenses and bands of red- brown silt as a persistent but minor component. Sandstone colours range between buff and pale red- brown. The coarse-grained units are from 0.2 to several metres thick. Post-depositional features in- clude mottling and root/burrow casts. Two subfacies are present. Thinner coarse-grained units (< 2 m) generally have sharp upper and lower contacts, with the lower contact often displaying irregular relief on the order of 0.05 to 0.1 m and the upper contact often displaying root casts and mottling. Sedimentary structures are often preserved ; they include laminated bedding and small-scale cross-bedding. Thin coarse- grained units extend laterally for tens to hundreds of metres before tapering out. These units are interpreted as crevasse splays derived from the other coarse- grained subfacies. The second subfacies consists of buff sandstone units greater than 2 m thick and laterally extensive for up to several kilometres. These units typically have sharp, erosional lower contacts and are lenticular at some edges, tapering at others. The upper contacts are gradational, fining upwards to silty sandstone, then siltstone or claystone of the first facies. This subfacies represents the fluvial channels of the buff system (Behrensmeyer & Tauxe, 1982; Badgley, 1986).
Intraformational conglomerate lenses occur infre- quently in some sandstone units. Clasts include calcareous nodules, manganese/iron nodules, oncol- ites, silt and clay fragments, and sometimes vertebrate remains (Badgley, 1986).
Facies 3: Blue-gray siltstone and sandstone
This facies consists of interbedded siltstone, fine sandstone, and silty claystone and is represented by the Middle Gray and Upper Gray units (Figs 2 and 3). Colour and bedding structures distinguish this facies. The predominant colours are pale blue-gray, yellow-gray, olive-gray, yellow-brown, and gray- brown. Bedding varies from massive to finely lami- nated; individual beds typically range from 0.01 to 0.20 m thick, sometimes with internal lamination and/or micro-ripples. Mottling, root/burrow casts, and locally disrupted bedding are moderately common. Calcareous nodules and marl layers occur sporadically. The upper part of the Middle Gray is especially modified. The lower contact of the Upper Gray unit ranges from sharp to diffuse; the upper contacts of the
Palaeomagnetic reversal in Siwalik rocks, Pakistan 703
Middle and Upper Gray units are generally sharp. These units extend laterally for over 20 km (Fig. 2). This facies represents marshes and shallow floodplain lakes of the blue-gray fluvial system.
P A L A E O M A G N E T I S M
Methods
Samples were collected as described by Johnson et al. (1975) and shaped into 6-10 cm3 cubes. Palaeomag- netic sites were spaced at intervals of 0.5 to 1.5 m, with an average spacing of about 1 m. Most of the specimens were measured in a magnetically shielded room at Scripps Institution of Oceanography, using a CTF Ltd. cryogenic magnetometer. Some data were collected using the SCT cryogenic magnetometer at Lamont-Doherty Geological Observatory. No signif- icant differences between laboratories were detected.
With a few exceptions, at least one specimen per site was subjected to step-wise thermal demagnetiza- tion in progressively higher temperature steps, includ- ing from five to nine steps. Remaining specimens were subjected to blanket thermal demagnetization, as performed in previous studies of Siwalik magnetos- tratigraphy (e.g. Tauxe & Opdyke, 1982).
Two measures of the consistency of magnetization can be calculated from thermal demagnetization data. The first measure is calculated from the stepwise demagnetization of a single specimen. These data are subjected to principal component analysis to give a best-fit line and a measure of scatter about that line, following Kirschvink (1980). The second measure is based on comparison of directions of three specimens from a site after demagnetization at a single step. For these data, a vector mean and a measure of scatter about the mean direction are calculated using Fisher statistics (Fisher, 1953). For each site, we report four palaeomagnetic parameters : (1) for specimens treated by step-wise thermal demagnetization, the best-fit line (BFL) based on a minimum of three consecutive steps, (2) the maximum angle of deviation (MAD), calcu- lated from the variance about the BFL over the specified temperature interval of demagnetization, (3) the vector mean of the directions of demagnetization at a specified temperature step (SS, for single step), and (4) the circular standard deviation (CSD) of the directions about the mean. Sites are considered non- random if the CSD is less than 35" for three samples (Watson, 1956).
Palaeomagnetic results
Stepwise Demagnetization
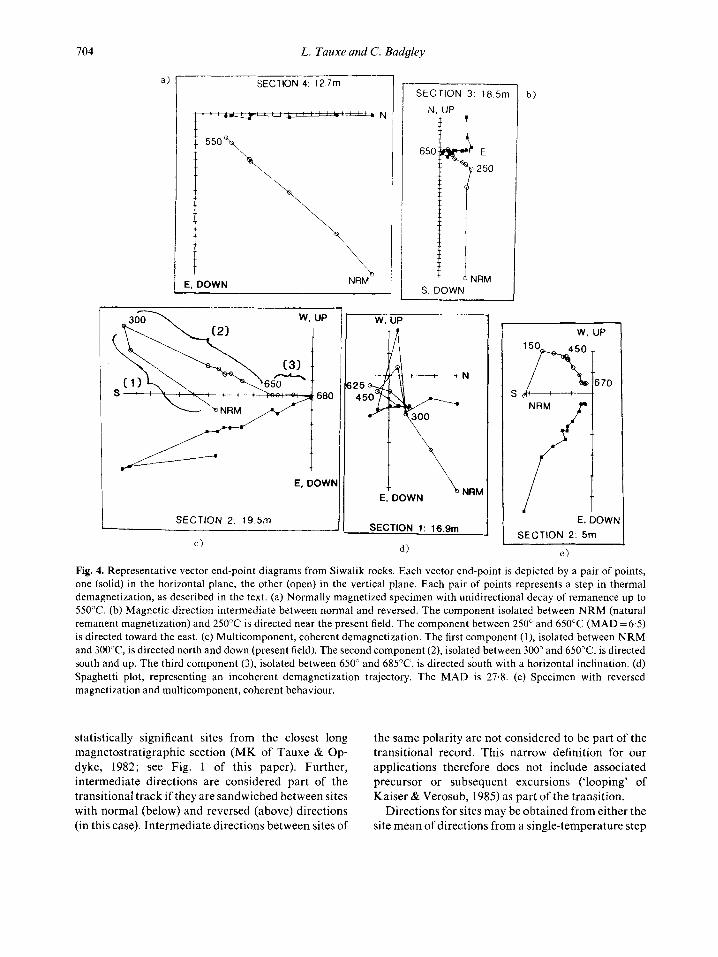
The behaviour of an individual specimen during demagnetization may be characterized by one of the following four trajectories : (1) linear, i.e. nodirectional change during demagnetization, (2) having two or more discrete linear components, ( 3 ) curved, (4) random or incoherent directional changes. For this study, we arbitrarily define a trajectory of demagneti- zation as linear if it has a MAD of less than 15". Examples of trajectories typical in Siwalik samples are shown as vector end-point diagrams in Fig. 4. Fig. 4a illustrates a normally magnetized specimen with a unidirectional decay of remanence up to at least 550" (case 1 above). The highdegreeof linearity is expressed by the low MAD of 1.7" over the entire interval of demagnetization. Fig. 4b illustrates a specimen with adirection intermediate between normal and reversed. This specimen is from a stratigraphic interval between fully normal and fully reversed sites and is considered to record the geomagnetic field transition between polarity states. Fig. 4c depicts multicomponent but coherent behaviour (case 2 above), a common pattern in Siwalik rocks (Tauxe & Badgley, 1984). Three distinct linear components are present. Fig. 4d depicts random or incoherent behaviour (case 4 above). Several components are present but they do not exhibit consistent directions from one temperature step to the next. We call this pattern a 'spaghetti plot'. For comparison, the MAD of this demagnetization trajec- tory is 27.8". Fig. 4e represents a specimen of reversed polarity with multicomponent but coherent behaviour. Correlations between these components and facies, stratigraphic proximity to the palaeomagnetic transi- tion, and estimated sediment accumulation rates are discussed later.
The transitional record
Palaeomagnetic records of polarity reversals are characterized by directions intermediate between normal and reversed directions. Criteria for defining transitional directions vary greatly (see discussion by Clement & Kent, 1984). Since our objective here is not to elucidate the behaviour of the geomagnetic field during transition, but rather to utilize transitional records for stratigraphic purposes, the exact definition is not critical. Hence, we define a direction as 'intermediate' if it falls more than 45" away from the expected normal and reversed directions. The ex- pected direction is estimated by the grand mean of all
704 L. Tauxe and C. Badgley
a' SECTION 4 12 7rn SECTION 3: 18.51~1
N. UP r ?
650
S. DOWN
SECTION 1: 16.9m
d ) C )
b )
w. UP
E, DOWN i SECTION 2: 5m
e )
Fig. 4. Representative vector end-point diagrams from Siwalik rocks. Each vector end-point is depicted by a pair of points, one (solid) in the horizontal plane, the other (open) in the vertical plane. Each pair of points represents a step in thermal demagnetization, as described in the text. (a) Normally magnetized specimen with unidirectional decay of remanence up to 550°C. (b) Magnetic direction intermediate between normal and reversed. The component isolated between NRM (natural remanent magnetization) and 250°C is directed near the present field. The component between 250" and 650°C (MAD =6.5) is directed toward the east. (c) Multicomponent, coherent demagnetization. The first component (l), isolated between NRM and 300"C, is directed north and down (present field). The second component (2), isolated between 300" and 650°C, is directed south and up. The third component (3), isolated between 650" and 685"C, is directed south with a horizontal inclination. (d) Spaghetti plot, representing an incoherent demagnetization trajectory. The MAD is 27.8. (e) Specimen with reversed magnetization and multicomponent, coherent behaviour.
statistically significant sites from the closest long the same polarity are not considered to be part of the magnetostratigraphic section (MK of Tauxe & Op- transitional record. This narrow definition for our dyke, 1982; see Fig. 1 of this paper). Further, applications therefore does not include associated intermediate directions are considered part of the precursor or subsequent excursions ('looping' of transitional track if they are sandwiched between sites Kaiser & Verosub, 1985) as part of the transition. with normal (below) and reversed (above) directions Directions for sites may be obtained from either the (in this case). Intermediate directions between sites of site mean of directions from a single-temperature step
Palaeomagnetic reversal in Siwalik rocks, Pakistan 705
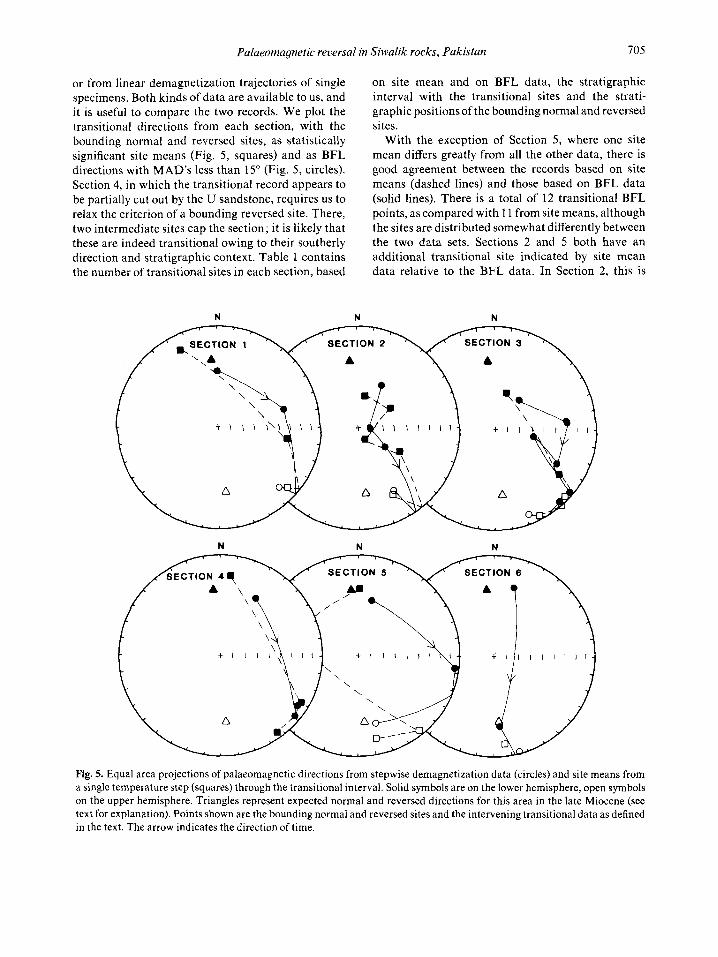
or from linear demagnetization trajectories of single specimens. Both kinds of data are available to us, and it is useful to compare the two records. We plot the transitional directions from each section, with the bounding normal and reversed sites, as statistically significant site means (Fig. 5, squares) and as BFL directions with MAD'S less than 15" (Fig. 5, circles). Section 4, in which the transitional record appears to be partially cut out by the U sandstone, requires us to relax the criterion of a bounding reversed site. There, two intermediate sites cap the section; it is likely that these are indeed transitional owing to their southerly direction and stratigraphic context. Table 1 contains the number of transitional sites in each section, based
on site mean and on BFL data, the stratigraphic interval with the transitional sites and the strati- graphic positions of the bounding normal and reversed sites.
With the exception of Section 5, where one site mean differs greatly from all the other data, there is good agreement between the records based on site means (dashed lines) and those based on BFL data (solid lines). There is a total of 12 transitional BFL points, as compared with 1 1 from site means, although the sites are distributed somewhat differently between the two data sets. Sections 2 and 5 both have an additional transitional site indicated by site mean data relative to the BFL data. In Section 2, this is
N N N
N N N
Fig. 5. Equal area projections of palaeomagnetic directions from stepwise demagnetization data (circles) and site means from a single temperature step (squares) through the transitional interval. Solid symbols are on the lower hemisphere, open symbols on the upper hemisphere. Triangles represent expected normal and rcversed directions for this area in the late Miocene (see text for explanation). Points shown are the bounding normal and reversed sites and the intervening transitional data as defined in the text. The arrow indicates the direction of time.
706 L. Tauxe and C. Badgley
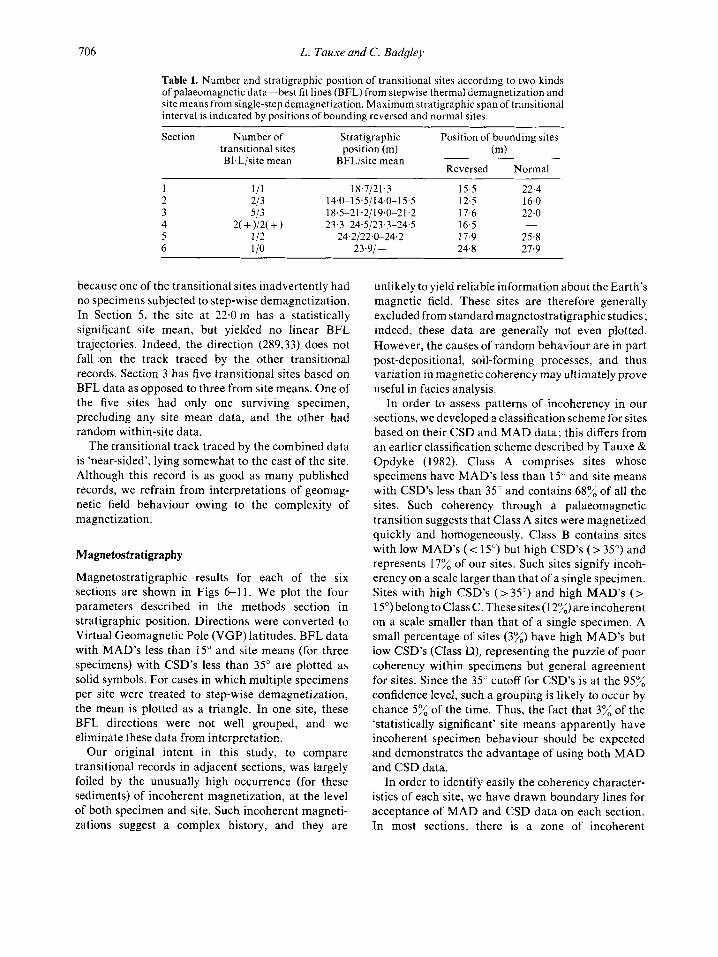
Table 1. Number and Stratigraphic position of transitional sites according to two kinds of palaeomagnetic data-best fit lines (BFL) from stepwise thermal demagnetization and site means from single-step demagnetization. Maximum stratigraphic span of transitional interval is indicated by positions of bounding reversed and normal sites.
Section Number of Stratigraphic Position of bounding sites transitional sites position (m) (m) BFLIsite mean BFLIsite mean
Reversed Normal
1 111 18,7121.3 15.5 22.4 2 213 14.0-1 5.51 14.0-1 5.5 12.5 16.0 3 513 18.5-21.2/19.0-21.2 17.6 22.0 4 2( + )/2( + 1 23.3-24.5123.3-24'5 16.5 5 1 12 24.2122'0-24.2 17.9 25.8 6 1 10 23.91- 24.8 27.9
-
because one of the transitional sites inadvertently had no specimens subjected to step-wise demagnetization. In Section 5, the site at 22.0 m has a statistically significant site mean, but yielded no linear BFL trajectories. Indeed, the direction (289,33) does not fall on the track traced by the other transitional records. Section 3 has five transitional sites based on BFL data as opposed to three from site means. One of the five sites had only one surviving specimen, precluding any site mean data, and the other had random within-site data.
The transitional track traced by the combined data is 'near-sided', lying somewhat to the east of the site. Although this record is as good as many published records, we refrain from interpretations of geomag- netic field behaviour owing to the complexity of magnetization.
Magnetostratigraphy
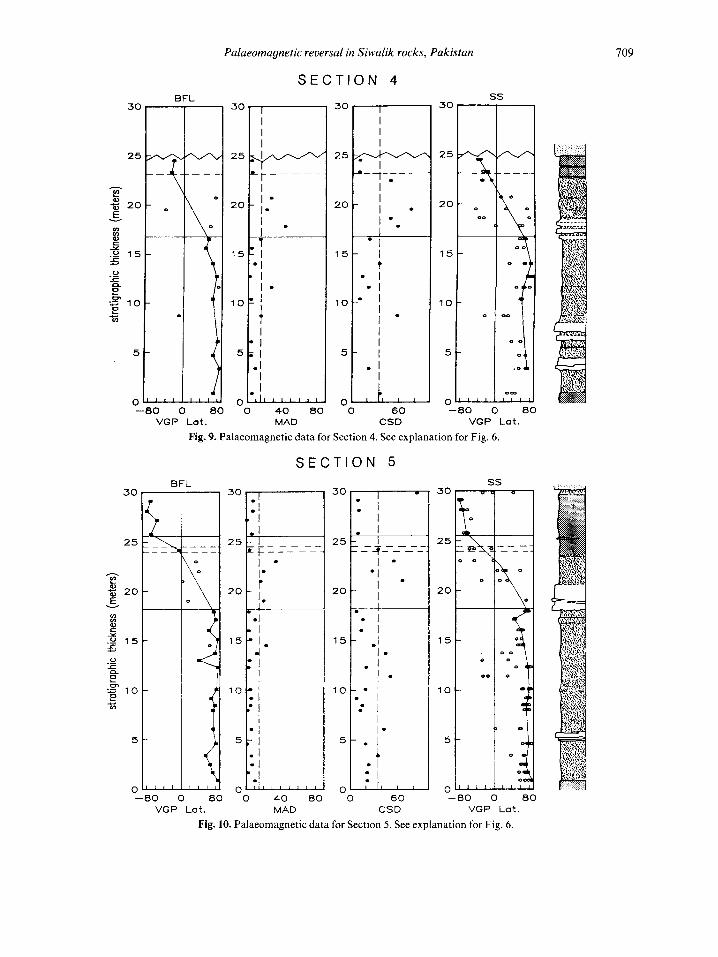
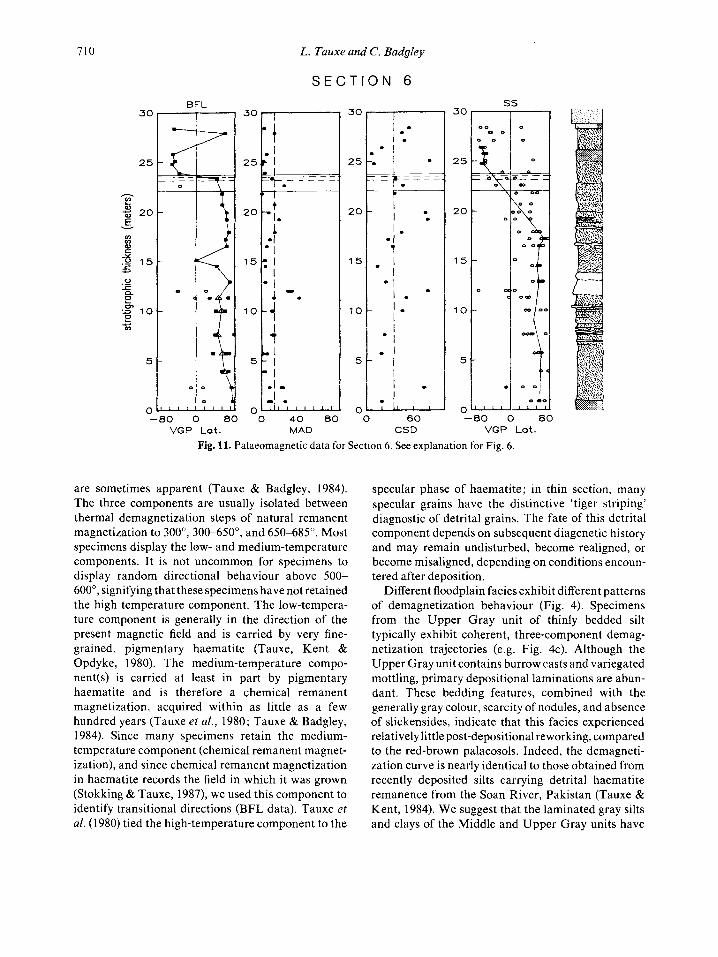
Magnetostratigraphic results for each of the six sections are shown in Figs 6-1 1. We plot the four parameters described in the methods section in stratigraphic position. Directions were converted to Virtual Geomagnetic Pole (VGP) latitudes. BFL data with MAD's less than 15" and site means (for three specimens) with CSD's less than 35" are plotted as solid symbols. For cases in which multiple specimens per site were treated to step-wise demagnetization, the mean is plotted as a triangle. In one site, these BFL directions were not well grouped, and we eliminate these data from interpretation.
Our original intent in this study, to compare transitional records in adjacent sections, was largely foiled by the unusually high occurrence (for these sediments) of incoherent magnetization, at the level of both specimen and site. Such incoherent magneti- zations suggest a complex history, and they are
unlikely to yield reliable information about the Earth's magnetic field. These sites are therefore generally excluded from standard magnetostratigraphic studies ; indeed, these data are generally not even plotted. However, the causes of random behaviour are in part post-depositional, soil-forming processes, and thus variation in magnetic coherency may ultimately prove useful in facies analysis.
In order to assess patterns of incoherency in our sections, we developed a classification scheme for sites based on their CSD and MAD data; this differs from an earlier classification scheme described by Tauxe & Opdyke (1982). Class A comprises sites whose specimens have MAD's less than 15" and site means with CSD's less than 35" and contains 68% of all the sites. Such coherency through a palaeomagnetic transition suggests that Class A sites were magnetized quickly and homogeneously. Class B contains sites with low MAD's (< 15') but high CSD's (> 35") and represents 17% of our sites. Such sites signify incoh- erency on a scale larger than that of a single specimen. Sites with high CSD's (>35") and high MAD's (> 1 So) belong to Class C. These sites (1 2%) are incoherent on a scale smaller than that of a single specimen. A small percentage of sites (3%) have high MAD's but low CSD's (Class D), representing the puzzle of poor coherency within specimens but general agreement for sites. Since the 35" cutoff for CSD's is at the 95% confidence level, such a grouping is likely to occur by chance 5% of the time. Thus, the fact that 3% of the 'statistically significant' site means apparently have incoherent specimen behaviour should be expected and demonstrates the advantage of using both MAD and CSD data.
In order to identify easily the coherency character- istics of each site, we have drawn boundary lines for acceptance of MAD and CSD data on each section. In most sections, there is a zone of incoherent
Palaeomagnetic reversal in Siwalik rocks, Pakistan 707
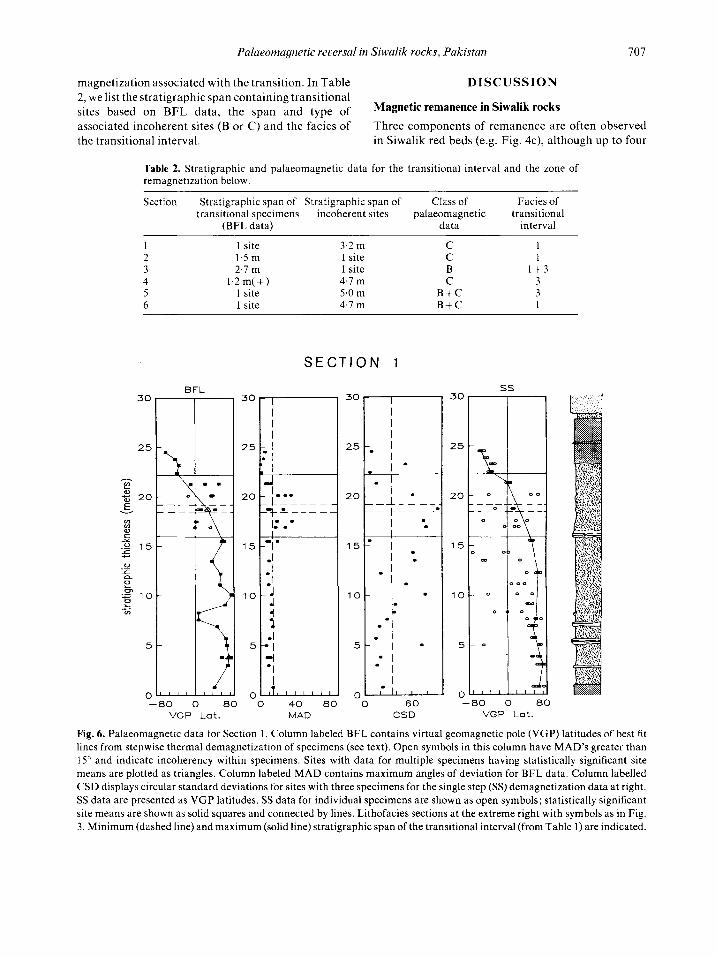
magnetization associated with the transition. In Table 2, we list the stratigraphic span containing transitional
associated incoherent sites (B or C) and the facies of the transitional interval.
DISCUSSION
sites based on BFL data, the span and type of Magnetic remalU?nCe in Siwalik rocks
Three components of remanence are often observed in Siwalik red beds (e.g. Fig. 4c), although up to four
Table 2. Stratigraphic and palaeomagnetic data for the transitional interval and the zone of remagnetization below.
Section Stratigraphic span of Stratigraphic span of transitional specimens incoherent sites
(BFL data)
Class of palaeornagnet ic
data
Facies of transitional
interval
1 1 site 3.2 m 2 1.5 m 1 site 3 2.1 m 1 site 4 1.2m(+) 4.1 m 5 1 site 5.0 m 6 1 site 4.1 m
C C B C
B + C B + C
1 I
1 + 3 3 3 1
30
25
- 2 - 20 al
E v
Y) Y) al c Y .o 15 5
a OL .z7 10 e
0 1 ._
rn
c Y)
5
0
BFL
S E C T I O N 1
30 rl
I . : I .
1 0 1 ' I.
0 L -80 0 80 0 40 80 0 60
VGP Lot. MAD C S D VGP Lot.
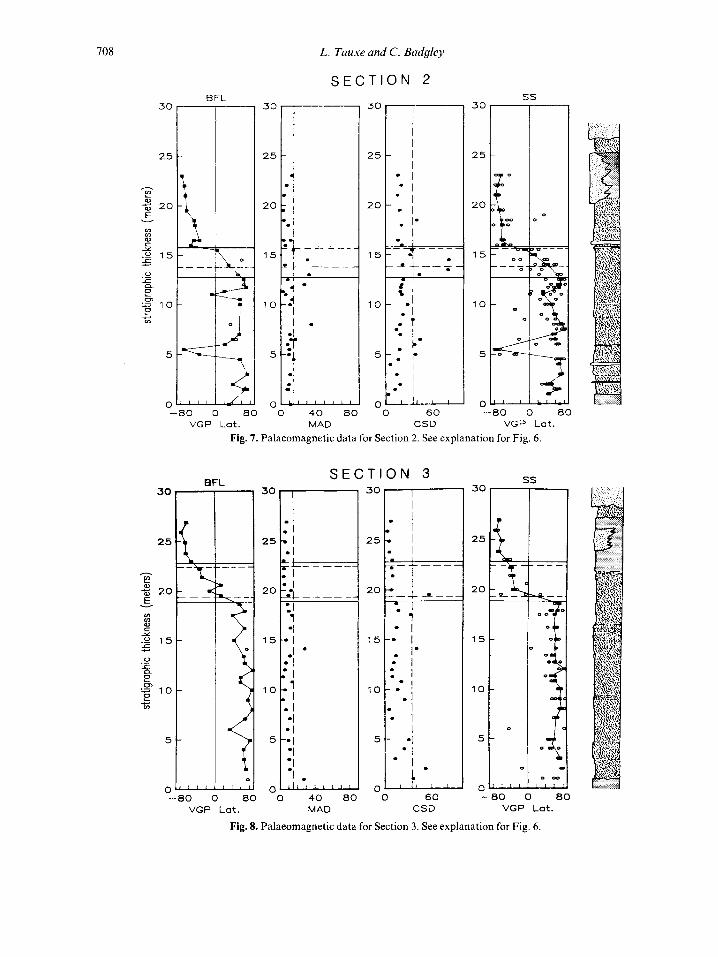
Fig. 6. Palaeomagnetic data for Section I . Column labeled BFL contains virtual geomagnetic pole (VGP) latitudes of best fit lines from stepwise thermal demagnetization of specimens (see text). Open symbols in this column have MAD'S greater than 15" and indicate incoherency within specimens. Sites with data for multiple specimens having statistically significant site means are plotted as triangles. Column labeled MAD contains maximum angles of deviation for BFL data. Column labelled CSD displays circular standard deviations for sites with three specimens for the single step (SS) demagnetization data at right. SS data are presented as VGP latitudes. SS data for individual specimens are shown as open symbols; statistically significant site means are shown as solid squares and connected by lines. Lithofacies sections at the extreme right with symbols as in Fig. 3. Minimum (dashed line) and maximum (solid line) stratigraphic span of the transitional interval (from Table 1) are indicated.
708
e c VI
5 -
L. Tauxe and C. Badgley
S E C T I O N 2
j 5 [ , t x , , , ,
-1 0
BFL ss
=O I 30
25
- r
E
G, 20
v
m m G, c 1 .o 15 5 u c Q
0
.- e ‘Z 10 e c v)
5
0
25
20
15
10
5
i _It - P
D
011111- -80 0 80
VGP Lat. -80 0 80 0 40 80 0 60
VGP Lat. MAD CSD
Fig. 7. Palaeomagnetic data for Section 2. See explanation for Fig. 6.
S E C T I O N 3 ss 30r- 25
30
25
20
15
10
5
30
25
20
15
10
5
30
25
I
4 20
0 -80 0 80
VGP Lat.
Fig. 8. Palaeomagnetic data for Section 3. See explanation for Fig. 6.
Palaeomagnetic reversal in Siwalik rocks, Pakistan
30-
25
20
15
10
5 5
0
S E C T I O N 4
I I I I
y 't-----
I I - -
- -
.
I I I ' ' ' " '
709
a) - 2 0 - E v
v) v)
- -80 0 80 0 40 80 0 60
VGP Lot. MAD CSD
SS
-80 0 80 VGP Lot.
Fig. 9. Palaeomagnetic data for Section 4. See explanation for Fig. 6 .
S E C T I O N 5
30
20
15
00
I I I , , ,
0 -80 0 80
VGP Lat. MAD CSD VGP Lot
Fig. 10. Palaeomagnetic data for Section 5. See explanation for Fig. 6 .
710
30
25.t
2o
15:
70
5 -
L. Tauxe and C. Badgley
S E C T I O N 6
, 't .I
I 1
=T:=- -===I
I t
-1. 1
.I - 1
1 I
- 1 1 - *
I 1
..I I
- 1 .I -
- {
-! * 0'"' " ' I ' ' 0 40 80
BFL 3 0 7
25
h
E E - 20 v
rn rn 0) e Y
.o 15 5
n e z= 10 e
0 c .- m
c rn
5
n -80 0
VGP Lot. 80
MAD CSD
ss
-80 0 80 VGP Lot.
Fig. 11. Palaeomagnetic data for Section 6 . See explanation for Fig. 6 .
are sometimes apparent (Tauxe & Badgley, 1984). The three components are usually isolated between thermal demagnetization steps of natural remanent magnetization to 300°, 300-650", and 650-685". Most specimens display the low- and medium-temperature components. It is not uncommon for specimens to display random directional behaviour above 500- 600°, signifying that these specimens have not retained the high temperature component. The low-tempera- ture component is generally in the direction of the present magnetic field and is carried by very fine- grained, pigmentary haematite (Tauxe, Kent & Opdyke, 1980). The medium-temperature compo- nent(s) is carried at least in part by pigmentary haematite and is therefore a chemical remanent magnetization, acquired within as little as a few hundred years (Tauxe et al., 1980; Tauxe & Badgley, 1984). Since many specimens retain the medium- temperature component (chemical remanent magnet- ization), and since chemical remanent magnetization in haematite records the field in which it was grown (Stokking & Tauxe, 1987), we used this component to identify transitional directions (BFL data). Tauxe et al. (1980) tied the high-temperature component to the
specular phase of haematite; in thin section, many specular grains have the distinctive 'tiger striping' diagnostic of detrital grains. The fate of this detrital component depends on subsequent diagenetic history and may remain undisturbed, become realigned, or become misaligned, depending on conditions encoun- tered after deposition.
Different floodplain facies exhibit different patterns of demagnetization behaviour (Fig. 4). Specimens from the Upper Gray unit of thinly bedded silt typically exhibit coherent, three-component demag- netization trajectories (e.g. Fig. 4c). Although the Upper Gray unit contains burrow casts and variegated mottling, primary depositional laminations are abun- dant. These bedding features, combined with the generally gray colour, scarcity of nodules, and absence of slickensides, indicate that this facies experienced relatively little post-depositional reworking, compared to the red-brown palaeosols. Indeed, the demagneti- zation curve is nearly identical to those obtained from recently deposited silts carrying detrital haematite remanence from the Soan River, Pakistan (Tauxe & Kent, 1984). We suggest that the laminated gray silts and clays of the Middle and Upper Gray units have
Palaeomagnetic reversal in Siwalik rocks, Pakistan 71 1
retained a depositional magnetization carried by detrital specular haematite grains.
Two types of demagnetization behaviour are com- mon for bioturbated siltstones and claystones- random and highly coherent. Spaghetti plots (Fig. 4d) are from this facies. No high-temperature component is retained in Fig. 4d; the incoherent pattern indicates what we have termed misaligned remanent magneti- zation. Spaghetti plots probably result from inhomo- geneous magnetization on scales that are small with respect to the size of the specimen (6-10 cm3). Since the tendency for alignment during deposition and in water-saturated sediment is quite strong, even for haematite (Tauxe & Kent, 1984), and since haematite chemical remanent magnetization is unlikely to be randomly directed (Stokking & Tauxe, 1987), we surmise that misaligned remanent magnetization could result from post-depositional, mechanical dis- ruption of relatively dry sediments.
Coherent trajectories are also common in the overbank facies. Many specimens from heavily bio- turbated units display a high-temperature component presumably carried by specular haematite (Fig. 4e). In thin sections made from this facies, specular haematite is seen to be concentrated in cracks formed during pedogenesis. Possibly, magnetic grains became realigned during repeated wetting and drying which caused cracking of the sediment and allowed heavy- mineral concentration. These grains would then carry a post-depositional detrital remanence acquired dur- ing pedogenesis.
Sediment accumulation during the transition
Variation in expression of the palaeomagnetic transi- tion among the six sections forms the basis for inferences about rates of sediment accumulation and of post-depositional processes. First, with the transi- tional interval as an indicator of approximate contem- poraneity of deposits, the stratigraphic position of that interval indicates the time-transgressive nature of some units in a manner not evident from lithostra- tigraphy alone. In Sections 1 and 2, the transitional interval occurs in pedogenically modified units of Facies 1 below the Upper Gray unit. In Section 3, the interval spans units of both Facies 1 and the Upper Gray unit. In Sections4 and 5, the transitional interval occurs within the Upper Gray unit, although the lower bounding site (Table I ) and the zone of incoherent magnetization (Table 2) extend below the Upper Gray unit into Facies 1. In Section 6, the single transitional site occurs in Facies 1 less than 1 m below the base of
the Upper Gray unit. Here, the Upper Gray unit is thin (pinching out less than 1 km farther east; see Fig. 2) and contains some pedogenic features superimposed on laminated silt. Hence, the stratigraphic position of the transition indicates that the magnetization of the Upper Gray unit is older in Sections 3, 4 and 5 than in the other sections. If so, then the area represented by those three sections was probably topographically lowest during the period of the transition, since facies characteristics of the Upper Gray unit suggest standing water, while Facies 1 implies subaerial pedogenic activities.
Furthermore, since the palaeomagnetic transition represents a discrete interval of time, we may evaluate relative rates of sediment accumulation during this period. We cannot calculate the actual rates, since the duration of the transition is not known. But differences in thickness represent differences in rate over the same interval of time. The stratigraphic span of transitional specimens in Table 2 represents an estimate of the minimum thickness of the transitional interval in each section. With these values, relative sediment accumulation rates vary over five-fold (thickness of -0.5 m minimum, 2.7 m maximum) during the transitional interval. (These values do not take into account compaction, which may have reduced original sediment thickness by as much as 50%.) Variability in sediment accumulation rates over the interval 6-10 Ma and among polarity zones within that interval was quite low (Tauxe & Opdyke, 1982; Badgley, Tauxe & Bookstein, 1986). The observation of higher variability in sediment accumulation rates over much shorter time spans is consistent with Tipper’s (1983) stochastic model of sediment accu- mulation and the re-analysis of Sadler’s (1981) rate data by Anders, Krueger & Sadler 1987).
A final point relates to the rate of palaeosol development. The most detailed record of the transi- tional interval occurs in Section 3 in deposits of Facies 1 and 3. The pedogenic features associated with Facies 1 in this interval include large slickensides, large and small root casts and traces, and carbonate and manganese/iron nodules; primary bedding structures are absent. Within the transitional interval, Facies 1 passes gradationally into the Upper Gray unit (Facies 3) with its laminated bedding and invertebrate burrows. There is no evidence for a long hiatus in deposition associated with the formation of the pedogenic features. Rather, it is likely that pedogenic features were developing continually as sediment was episodically deposited in thin layers. If so, then the time required for the development of pedogenic
712 L. Tauxe and C. Badgley
features in this transitional interval was substantially less than the duration of the transition itself-that is, much less than several thousand years. This proposi- tion is supported by directional characteristics of components of magnetic remanence in Section 3 (Tauxe & Badgley, 1984); namely, in transitional sites, components of chemical remanent magnetization record only a slightly later directional signal than that of the detrital depositional remanent magnetization.
Magnetic coherency and sedimentary environment
Despite the overall high quality of the palaeomagnetic record in Siwalik rocks, an average of 25% of the sites comprise specimens with statistically random within- site directions (high CSD's) after demagnetization to 550"C, in sections studied by Tauxe & Opdyke (1982). Also, some specimens analyzed by stepwise thermal demagnetization exhibit random behaviour during demagnetization. The difference between incoherency within a specimen and incoherency within a site is principally a matter of scale. The specimen is a cube about 25mm on a side; a site comprises three specimens from a volume of rock about 0.3 m on a side. One possible cause of incoherency is mechanical disturbance of dry sediment. Incoherency could also result if the geomagnetic field were changing rapidly relative to the rate of sediment accumulation and processes of post-depositional remagnetization, so that neighbouring packages of sediment were magnet- ized under different field conditions. In addition, the tendency for alignment of magnetic grains is linearly related to the strength of the magnetic field; during periods of low field-strength associated with a polarity transition, it is possible that the misaligning forces could overcome the forces for alignment, resulting in incoherent magnetization. Thus, it is not surprising that misaligned remanence is associated with the transitional zone (Figs 6-1 I).
The stratigraphic significance of the estimates of coherency for a site (CSD) or for a specimen (MAD) may be evaluated by examining their distribution in relation to facies and the palaeomagnetic transition (Figs 6-1 1 and Table 2). All Class C data (high MAD, high CSD) in Section 1 (Fig. 6) fall within a 3-m interval just below the transition. This 3-m interval comprises mainly siltstones and silty claystones, heavily influenced by pedogenic processes (Facies 1). Here, the most incoherent palaeomagnetic samples (Class C data) occur in a stratigraphic interval that would have experienced active pedogenesis during the period of the transition. Hence, we suggest that
the thin stratigraphic interval occupied by the transi- tion (1 site), in combination with the 3-m interval of incoherent data, signify a fairly deep zone open for remagnetization perhaps caused by a low sediment accumulation rate. Class B data (low MAD, high CSD), representing most of the sites in the interval from 5.3 to 14.7 m, may indicate the depth to which selective remagnetization occurred.
In Section 2 (Fig. 7), the transitional interval is stratigraphically lower, relative to the Upper Gray unit, than in all other sections. The interval is composed of Facies 1 and has a somewhat thicker coherent expression (2 sites over 1.5 m minimum). Palaeomag- netic data from within and just below the transition exhibit some incoherency (Class D data), but are generally more coherent than in Section 1 , indicating more homogeneous magnetization and less opportu- nity for remagnetization.
Section 3 contains the thickest coherent transitional interval (5 sites over 2.7 m minimum), consisting of Facies 1 passing upward into Facies 3. The section just below the transition is from Facies 1 , with abundant pedogenic structures. The palaeomagnetic data are largely coherent within and below the transitional interval, with one incoherent site (Class B-low MAD, high CSD) from the transition and one Class C site about 3 m below the transitional interval. We speculate that a relatively rapid rate of sediment accumulation during the transition reduced opportun- ities for remagnetization in the underlying sediments.
Section 4 as a whole is the stratigraphically thinnest of the six. The transitional interval falls within the Upper Gray unit, and the record of the transition (2 sites over 1.2 m minimum) appears to be truncated by the erosional base of the U sandstone. The palaeomag- netic data indicate a highly coherent magnetic record in the Upper Gray unit, but incoherent magnetization of Facies 1 and 2 in the underlying 5 m. The thickness (truncated at 1.2m) and facies of the transitional interval indicate that there was persistent sediment accumulation during the transition. Facies 3 indicates the presence of swamps and shallow floodplain lakes. The high water table implied may have facilitated considerable remagnetization in the underlying sedi- ments of Facies 1 .
In Section 5, the transitional interval occurs in the Upper Gray unit (Facies 3). In Section 6, the transition occurs about 1 m below the base of the thin Upper Gray unit, in rocks of Facies 1. In both sections, the single transitional site is Class B, a result of different magnetizations from neighbouring patches of sedi- ment. In Section 5, an interval below the transition
Palaeomagnetic reversal in Siwalik rocks, Pakistan 713
about 5 m thick, comprising Facies 1 and 2, contains incoherent palaeomagnetic data (Classes C and D). In Section 6, an interval about 4.7 m thick, comprising mainly Facies 1, contains incoherent palaeomagnetic data (Classes B and C). In both sections, there apparently was considerable opportunity for remag- netization immediately below the transitional interval.
The stratigraphic interval containing transitional specimens, the thickness of the zone of remagnetiza- tion, and the facies of the transitional interval, as depicted in Figs 6-11, are given in Table 2. Some trends emerge from these data. First, the thickness of the coherently magnetized transitional interval is inversely correlated with the thickness of the zone of incoherent magnetization. Second, the most incoher- ently magnetized sites (Class C data) all occur in thicker (deeper) zones of magnetization (Sections 1, 4, 5, and 6). Third, although it is plausible to expect a priori that the pedogenic facies would always contain a thick zone of remagnetization, this is not the case. Thicker zones of remagnetization in Sections 1, 4, 5, and 6 occur in sediments of Facies 1 and 2, but thinner zones of remagnetization in Sections 2 and 3 also occur in Facies 1. [There is little opportunity to observe remagnetization in the Upper Gray unit (Facies 3), because it is never below the transitional interval.] Whenever the transitional interval occurred in sedi- ments of Facies 1 (corresponding to episodically emergent surfaces and soils) or in Facies 3 (correspond- ing to swamps and shallow lakes), thick zones of remagnetization developed below thin transitional intervals. Facies 1 and 3 represent, respectively, higher and lower elevations on the Miocene floodplain. In sum, if our definition of a transitional specimen is correct, then low rates of sediment accumulation may have been a precondition to substantial remagnetiza- tion.
The interpretations presented above depend strongly upon our working definition of a transitional site, and this definition (directions more than 45" away from the expected normal or reversed direction and bounded by sites of opposite polarity) is conserv- ative. Alternate interpretations of transitional direc- tions exist and these lead to different stratigraphic interpretations-particularly of the thickness of the transitional interval, the corresponding relative sedi- ment accumulation rates, and constraints on the timing of palaeosol development. For example, if, in addition to our conditions for a transitional direction, palaeomagnetic incoherency in itself signifies a tran- sitional direction (because of low field-intensity during a reversal), then the transitional interval would be
thicker than indicated in Table 2 for all sections except Section 3. Also, relative sediment accumulation rates would be higher (although not more variable than already indicated) and palaeosol development faster than we have suggested. We cannot rule out this alternative interpretation at present. Rather, we have taken a cautious approach-the most direct reading of palaeomagnetic data, because alternatives require speculative inferences about the geomagnetic field and remanence acquisition during polarity reversals. New information may require us to re-evaluate the transitional interval.
CONCLUSIONS
Lateral tracing of a palaeomagnetic isochron, in combination with a high sampling density through the polarity transition, has provided a high-resolution temporal framework for examining the history of sediment accumulation and post-depositional modifi- cation, as well as palaeomagnetic remanence acquisi- tion in different alluvial facies. The major conclusions of this study are summarized below.
( 1 ) The polarity transition crosses a major facies boundary (Facies 1 below to Facies 3 above) through the 8 km-wide study area, indicating that individual facies are time transgressive, probably on the order of hundreds to thousands of years.
(2) In an earlier study at a larger scale, Behrensmeyer
(3)
& Tauxe (1982) concluded that their BW section (our Section 6) occupied a hill at the time of the polarity transition. Lithostratigraphic informa- tion presented here supports their conclusion and further suggests that Sections 2 and 3 were topographically lower than the adjacent sections during the transition. Palaeomagnetic data from Sections 2 and 3 indicate thin zones of incoherent magnetization. Section 3 contains the thickest interval with transitional directions, consistent with the premise of higher sediment accumulation rates than in neighbouring sections. The inferred higher rate is, in turn, consistent with the postulated topographic low. Taken together, lith- ological and palaeomagnetic information imply that the extensive pedogenic features found in Section 3 must have formed over a period of time substantially less than the duration of the polarity transition-perhaps over hundreds to thousands of years. The stratigraphic span of the polarity transition varies greatly among the six sections, suggesting a
714 L. Tauxe and C. Badgley
five-fold range in sediment accumulation rates over this time span. Variability in Siwalik sedi- ment accumulation rates is much lower over longer time-spans (Badgley, Tauxe & Bookstein, 1986). The greater variability in sediment accumulation rates over shorter time-intervals is consistent with Tipper’s (1983) stochastic model of sediment accumulation and with the re-analysis of Sadler’s (1981) rate data by Anders, Krueger & Sadler (1987). Previous work on the properties of magnetic remanence in Siwalik rocks suggested that the magnetic remanence was acquired early (Tauxe, Kent & Opdyke, 1980). Indeed, the close match between the magnetic stratigraphy based on coherently magnetized sites and the geomagnetic reversal time-scale precludes long-term remagne- tization of the sediments studied here (Tauxe & Opdyke, 1982). In this study, we examine magnetic properties of sediments spanning a polarity rever- sal in three alluvial facies. Magnetization may result from depositional, as well as a variety of post-depositional processes, including realign- ment at or near the surface. The depth to which remagnetization is interpreted to occur varies greatly in the sections studied here, from less than one metre to six metres or more and may occur on scales of less than a centimetre to several metres. In each section, a zone of remagnetization occurs below the polarity transition in pedogenically modified sediments of Facies 1. Low rates of sediment accumulation during the polarity tran- sition-expressed as thin transitional intervals- are correlated with thick zones of remagnetization, whereas higher rates of sediment accumulation have thin zones of remagnetization below the transitional interval. Low rates of sediment accu- mulation may have facilitated substantial remag- netization in sediments close to the surface during the transition.
ACKNOWLEDGMENTS
This work has benefitted from discussions with many people over many years. We worked in collaboration with the joint Harvard-Geological Survey of Pakistan project headed by David Pilbeam and Ibrahim Shah, whose support and guidance we acknowledge grate- fully. We thank A. K. Behrensmeyer, John Barry, Marc Monaghan, Greg Retallack, Noye Johnson, Dennis Kent and Neil Opdyke for advice and
discussions at various stages of the project. We thank J-P. Valet, D. Burbank and T. Cross for critically reviewing the manuscript. We thank Laura Stokking for access to thin section photography and discussions thereof. Dave Clark and Doris Lafferty provided valuable laboratory assistance, and Bakt Jamal and Masood Idris of the Geological Survey of Pakistan assisted us in the field. Doris Chilton and Karen Klitz typed the manuscript, Sharpe Davidson and Evelyn Hegemeir drafted some of the figures. This work was supported in part by NSF Grants EAR85-09192 and EAR85-08976 to L.T. and EAR83-05931 to C.B.
REFERENCES
ANDERS, M.H., KRUEGER, S. W. & SADLER, P. M. (1987) A new look at sedimentation rates and the completeness of the stratigraphic record. J . Geol., 95, 1-14.
BADGLEY, C. (1986) Taphonomy of mammalian fossil remains from Siwalik rocks of Pakistan. Paleobiology, 12,
BADGLEY, C. & BEHRENSMEYER, A.K. (1980) Paleoecology of middle Siwalik sediments and faunas, Northern Pakistan. Paleogeogr. Paleoclim., Paleoecol., 30, 133-155.
BADGLEY, C., TAUXE, L. & BOOKSTEIN, F. L. (1986) Estimating the error of age interpolation in sedimentary rocks. Nature, 319, 139-141.
BARRY, J.C., BEHRENSMEYER, A.K. & MONAGHAN, M.C. (1980) A geologic and biostratigraphic framework for Miocene sediments near Khaur Village, Northern Paki- stan. Postilla, 183, 19 pp.
BARRY, J.C., LINDSAY, E.H. & JACOBS, L.L. (1982) A biostratigraphic zonation of the Middle and Upper Siwaliks of the Potwar Plateau of northern Pakistan. Paleogeogr. Paleoclim., Paleoecol., 31,95-130.
BARRY, J.C., JOHNSON, N.M., RAZA, S.M. & JACOBS, L.L. (1985) Neogene mammalian faunal change in southern Asia: Correlations with climatic, tectonic and eustatic events. Geology, 13,637-640.
BEHRENSMEYER, A.K. (1987) Miocene fluvial facies and vertebrate taphonomy in northern Pakistan. In: Recent Developments in Fluvial Sedimentology (Ed. by F. G. Ethridge, R. M. Flores & M. D. Harvey). Spec. Publs SOC. econ. Paleont. Miner., Tulsa, 39, 169-176.
BEHRENSMEYER, A.K. & TAUXE, L. (1982) Isochronousfluvial systems in Miocene deposits of Northern Pakistan. Sedimentology, 29, 33 1-352.
BERGGREN, W.A., KENT, D.V., FLYNN, J.J. & COUVERING, J.A. (1985) Cenozoic geochronology. Bull. geol. SOC. Am.,
BOWN, T.M. & KRAUS, M.J. (1981) Lower Eocene alluvial paleosols (Willwood Formation, northwest Wyoming, USA) and their significance for paleoecology, paleoclima- tology, and basin analysis. Paleogeogr. Paleoclim., Paleoe-
CLEMENT, B.M. & KENT, D.V. (1984) A detailed record of the Lower Jaramillo polarity transition from a southern hemisphere, deep-sea sediment core. J . geophys. Res., 89,
119-142.
96, 1407-1418.
C O ~ . , 34, 1-30.
1049-1 058.
Palaeomagnetic reversal in Siwalik rocks, Pakis tan 715
COLLINSON, D.W. (1965) Origin of remanent magnetization and initial susceptibility of certain red sandstones. Geo-
COLLINSON, D. W. (1974) The role of pigment and specularite in the remanent magnetization of red sandstones. Geophys. J . R. astr. Soc., 38, 253-264.
FISHER, R.A. (1953) Dispersion on a sphere. Proc. R. Soc.,
FULLER, M., WILLIAMS, I. & HOFFMAN, K.A. (1979) Paleomagnetic records of geomagnetic field reversals and the morphology of the transitional fields. Reo. Geophys. Space Phys., 17, 179-203.
IRVING, E. & MAJOR, A. (1964) Post-depositional DRM in a synthetic sediment. Sedimentology, 3, 135-143.
JOHNSON, N.M. &SHEIKH, K.A. (1985) Intrinsic chronostra- tigraphic variability of the type Chinji Formation of Pakistan as determined from the lateral tracing of magnetic reversal time-lines. Unpub. Ms.
JOHNSON, N.M., OPDYKE, N.D., JOHNSON, G.D., LINDSAY, E.H. & TAHIRKHELI, R.A.K. (1982) Magnetic polarity stratigraphy and ages of Siwalik Group rocks of the Potwar Plateau, Pakistan. Paleogeogr. Paleoclim., Paleoe- cot., 37, 17-42,
JOHNSON, N.M., STIX, J., TAUXE, L., CERVENY, P.F. & TAHIRKHELI, R.A.K. (1985) Paleomagnetic chonology, fluvial processes and tectonic implications of the Siwalik deposits near Chinji Village, Pakistan. J . Geol., 93,27740.
KAISER, A.D. & VEROSUB, K.L. (1985) Modelling polarity transitions with radial dipole sources: geomagnetic field behaviour at northern mid-latitudes. Geophys. Res. Lett.,
KENT, D.V. (1973) Post-depositional remanent magnetiza- tion in seep-sea sediment. Nature, 246, 32-34.
KIRSCHVINK, J.L. (1980) The least-squares line and plane and the analysis of paleomagnetic data. Geophys. J . R . astr. SOC., 62,699-718.
LABRECQUE, J.L. el al. (1983) DSDP Leg 73: Contributions to Paleogene stratigraphy in nomenclature, chronology and sedimentation rates. Paleogeogr. Paleoclim. Paleoecol.,
LARSON, E.E. &WALKER, T.R. (1975) Development of CRM during early stages of red-bed formation in Late Cenozoic sediments, Baja California. Bull. geol. Soc. Am., 86, 639- 650.
LOVLIE, R. (1976) The intensity pattern of p-DRM acquired in some marine sediments deposited during a reversal of the external magnetic field. Earth planet. Sci. Lett., 30,
MANKINEN, E.A. & DALRYMPLE, G.B. (1979) Revised geomagnetic polarity time scales for the interval 0-5 my BP. J . geophys. Rex , 84,615-626.
OPDYKE, N.D., LINDSAY, E., JOHNSON, G.D., JOHNSON.
phys. J . , 9,203-217.
217,295-305.
12,777-780.
42,91-125.
209-214.
N.M., TAHIRKHELI, R.A.K. & MIRZA, M.A. (1979) Magnetic polarity stratigraphy and vertebrate paleontol- ogy of the upper Siwalik subgroup of northern Pakistan. Paleogeogr. Paleoclim. Paleoecol., 27, 1-34.
PILBEAM, D. (1982) New hominoid skull material from the Miocene of Pakistan. Nature, 295, 232-234.
PILBEAM, D. (1986) Hominoid evolution and hominoid origins. Am. Anthropologist, 88, 295-3 12.
PILBEAM, D., BARRY, J., MEYER, G., SHAH, S.M.I., PICKFORD, M., BISHOP, N.W., THOMAS, H. & JACOBS, L. (1977) Geology and paleontology of Neogene strata of Pakistan. Nature, 270,684-689.
PR~VOT, M., MANKINEN, E.A., GROMME, C.S. & COE, R.S. (1985) How the geomagnetic field vector reverses polarity. Nature, 316,230-234.
RETALLACK, G.J. (1983)LateEoceneandOligocenepaleosols from Badlands National Park, South Dakota. Spec. Pap., geol. Soc. Am., 193, 82 pp.
SADLER, P.M. (1981) Sediment accumulation rates and the completeness of stratigraphic sections. J . Geol., 89, 569- 584.
SHAH, S.M.I. (1977) Stratigraphy of Pakistan. Mem. geol. Surv. Pakistan, 12, 1-138.
STOKKING, L.B. & TAUXE, L. (1987) Acquisition of CRM in synthetic oxides. Nature, 327,610-612.
TAUXE, L. & BADGLEY, C. (1984) Transition stratigraphy and the problem of remanence lock-in times in the Siwalik red beds. Geophys. Res. Lett., 11,611-613.
TAUXE, L. & KENT, D.V. (1984) Properties of a detrital remanence carried by hematite from study of modern river deposits and laboratory redeposition experiments. Geo- phys. J . R. astr. Soc., 77, 543-561.
TAUXE, L. & OPDYKE, N.D. (1982) A time framework based on magnetostratigraphy for the Siwalik sediments of the Khaur area, Northern Pakistan. Paleogeogr. Paleoclim. Paleoecol., 37,43-61.
TAUXE, L., KENT, D.V. & OPDYKE, N.D. (1980) Magnetic components contributing to the NRM of middle Siwalik red beds. Earth planet Sci. Lett., 47,279-284.
TIPPER, J.C. (1983) Rates of sedimentation and stratigraph- ical completeness. Nature, 302,696-698.
TUCKER, P.A. (1980) A grain mobility model of post- depositional realignment. Geophys. J . R. astr. SOC., 63,
VALET, J.-P., LAJ, C. & TUCHOLKA, P. (1986) High resolution sedimentary record of a geomagnetic reversal. Nature,
VEROSUB, K.L. (1977) Depositional and post-depositional process in the magnetization of sediments. Rev. Geophys. Space Phys., 15, 129-143.
WATSON, G.S. (1956) A test for randomness. Geophys. Suppl., Mon. Not. R. astron. Soc., 7, 160-161.
149-1 63.
322,27-32.
(Manuscript received 5 March 1987: revision received 30 September 1987)
Related Documents