© 2002 Blackwell Science Ltd Stratification and seasonal stability of diverse bacterial communities in a Pinus merkusii (pine) forest soil in central Java, Indonesia enced by drought. In the litter layer, the moisture content was significantly lower than in the fragmen- tation and mineral layers during the dry season. A clone library was made from a litter sample taken during the wet season. Partial sequencing of 74 clones and linking the DGGE banding positions of these clones to bands in the DGGE profile of the sample from which the clone library was derived showed considerable bacterial diversity. Alpha- proteobacteria (40.5% of the clones, of which 57% belonged to the Rhizobium–Agrobacterium group) and high-G+C content, Gram-positive bacteria (36.5%) dominated the clone library. Introduction Because of deforestation, primary tropical rain forest has nearly disappeared from the island of Java, Indonesia. An intensive reforestation programme was initiated in 1963, and pine plantations now comprise ª 50% of the total area of the forest ecosystem. The pine forests consist mainly of Pinus merkusii, a native plant originating from north Sumatra. Most plantations have been established in high elevation areas on marginal or nutrient-poor soils that do not support sustainable growth of crops (Bruijnzeel, 1984). A better understanding of the factors governing nutrient cycling in tropical pine plantations will help to improve management of these plantations, which are of both environmental (e.g. erosion prevention) and eco- nomical (e.g. logging) importance. As Java is subjected to tropical weather conditions with relatively constant, high temperatures (25–30∞C) and high seasonal precipitation, results of studies on pine forests in temperate zones cannot be applied directly. Previous ecological research on pine forests on the island of Java has shown that nitrogen is one of the growth-limiting nutrients (Bruijnzeel, 1984). Litterfall and litter turnover are high (9–10 and 0.5 tonnes ha -1 year -1 respectively) and provide about 60 kg of N ha -1 year -1 to the forest floor (Bruijnzeel, 1985; Gunadi and Verhoef, 1993). The forest floor consists of three layers, from top to bottom, a litter layer (a 3- to 6-cm-thick layer of dead plant material), a fragmentation layer (3–5 cm thick and consist- ing of fragmented litter) and a mineral layer. Bacteria and fungi are directly responsible for the degradation of Environmental Microbiology (2002) 4(6), 361–373 Agna S. Krave, 1,2 Bin Lin, 1 Martin Braster, 1 Anniet M. Laverman, 1 Nico M. van Straalen, 3 Wilfred F. M. Röling 1† and Henk W. van Verseveld 1 * 1 Section Molecular Microbial Ecology, Department of Molecular Cell Physiology, Faculty of Earth and Life Sciences, Research School SENSE, Vrije Universiteit, De Boelelaan 1087, NL-1081 HV Amsterdam, The Netherlands. 2 Universitas Kristen Satya Wacana, Faculty of Biology, Department of Microbiology, Jalan Diponegoro 52–60, 50711 Salatiga, Indonesia. 3 Institute for Ecological Science, Faculty of Earth and Life Sciences, Vrije Universiteit, De Boelelaan 1087, NL-1081 HV Amsterdam, The Netherlands. Summary In Java, Indonesia, many nutrient-poor soils are inten- sively reforested with Pinus merkusii (pine). Informa- tion on nutrient cycles and microorganisms involved in these cycles will benefit the management of these important forests. Here, seasonal effects on the stratification of bacterial community structure in the soil profile of a tropical pine forest are described, and differences in bacterial communities are related to chemical and physical soil parameters. Culture- independent community profiles of litter, fragmented litter and mineral soil layers were made by denatur- ing gradient gel electrophoresis (DGGE) of 16S rDNA- specific polymerase chain reaction (PCR) fragments. The community profiles of the different soil layers clustered separately, correlating with significant dif- ferences in organic matter content between the three layers. The bacterial communities appeared to be stable during the wet season of 1998. The drought in 1997, caused by the El Niño climatic effect, did not influence the bacterial communities in fragmentation and mineral soil, although moisture content and other soil parameters were markedly lower than in the wet season. However, communities in litter were influ- Received 18 February, 2002; revised 4 April, 2002; accepted 4 April, 2002. *For correspondence. E-mail [email protected]; Tel. (+31) 20 444 7193; Fax (+31) 20 444 7229. † Present address: Fossil Fuels and Environmental Geochemistry, University of Newcastle upon Tyne, Newcastle upon Tyne NE1 7RU, UK.

Welcome message from author
This document is posted to help you gain knowledge. Please leave a comment to let me know what you think about it! Share it to your friends and learn new things together.
Transcript
© 2002 Blackwell Science Ltd
Stratification and seasonal stability of diverse bacterial communities in a Pinus merkusii (pine) forest soil in central Java, Indonesia
enced by drought. In the litter layer, the moisturecontent was significantly lower than in the fragmen-tation and mineral layers during the dry season. Aclone library was made from a litter sample takenduring the wet season. Partial sequencing of 74clones and linking the DGGE banding positions ofthese clones to bands in the DGGE profile of thesample from which the clone library was derivedshowed considerable bacterial diversity. Alpha-proteobacteria (40.5% of the clones, of which 57%belonged to the Rhizobium–Agrobacterium group)and high-G+C content, Gram-positive bacteria(36.5%) dominated the clone library.
Introduction
Because of deforestation, primary tropical rain forest hasnearly disappeared from the island of Java, Indonesia. Anintensive reforestation programme was initiated in 1963,and pine plantations now comprise ª 50% of the total areaof the forest ecosystem. The pine forests consist mainlyof Pinus merkusii, a native plant originating from northSumatra. Most plantations have been established in highelevation areas on marginal or nutrient-poor soils that do not support sustainable growth of crops (Bruijnzeel,1984). A better understanding of the factors governingnutrient cycling in tropical pine plantations will help toimprove management of these plantations, which are ofboth environmental (e.g. erosion prevention) and eco-nomical (e.g. logging) importance. As Java is subjected totropical weather conditions with relatively constant, hightemperatures (25–30∞C) and high seasonal precipitation,results of studies on pine forests in temperate zonescannot be applied directly.
Previous ecological research on pine forests on theisland of Java has shown that nitrogen is one of thegrowth-limiting nutrients (Bruijnzeel, 1984). Litterfall andlitter turnover are high (9–10 and 0.5 tonnes ha-1 year-1
respectively) and provide about 60 kg of N ha-1 year-1 tothe forest floor (Bruijnzeel, 1985; Gunadi and Verhoef,1993). The forest floor consists of three layers, from top tobottom, a litter layer (a 3- to 6-cm-thick layer of dead plantmaterial), a fragmentation layer (3–5 cm thick and consist-ing of fragmented litter) and a mineral layer. Bacteria and fungi are directly responsible for the degradation of
Environmental Microbiology (2002) 4(6), 361–373
Agna S. Krave,1,2 Bin Lin,1 Martin Braster,1
Anniet M. Laverman,1 Nico M. van Straalen,3
Wilfred F. M. Röling1† and Henk W. van Verseveld1*1Section Molecular Microbial Ecology, Department ofMolecular Cell Physiology, Faculty of Earth and LifeSciences, Research School SENSE, Vrije Universiteit,De Boelelaan 1087, NL-1081 HV Amsterdam, The Netherlands.2Universitas Kristen Satya Wacana, Faculty of Biology,Department of Microbiology, Jalan Diponegoro 52–60,50711 Salatiga, Indonesia.3Institute for Ecological Science, Faculty of Earth andLife Sciences, Vrije Universiteit, De Boelelaan 1087,NL-1081 HV Amsterdam, The Netherlands.
Summary
In Java, Indonesia, many nutrient-poor soils are inten-sively reforested with Pinus merkusii (pine). Informa-tion on nutrient cycles and microorganisms involvedin these cycles will benefit the management of theseimportant forests. Here, seasonal effects on the stratification of bacterial community structure in thesoil profile of a tropical pine forest are described, anddifferences in bacterial communities are related tochemical and physical soil parameters. Culture-independent community profiles of litter, fragmentedlitter and mineral soil layers were made by denatur-ing gradient gel electrophoresis (DGGE) of 16S rDNA-specific polymerase chain reaction (PCR) fragments.The community profiles of the different soil layersclustered separately, correlating with significant dif-ferences in organic matter content between the threelayers. The bacterial communities appeared to bestable during the wet season of 1998. The drought in1997, caused by the El Niño climatic effect, did notinfluence the bacterial communities in fragmentationand mineral soil, although moisture content and othersoil parameters were markedly lower than in the wetseason. However, communities in litter were influ-
Received 18 February, 2002; revised 4 April, 2002; accepted 4 April,2002. *For correspondence. E-mail [email protected]; Tel. (+31)20 444 7193; Fax (+31) 20 444 7229. †Present address: Fossil Fuelsand Environmental Geochemistry, University of Newcastle uponTyne, Newcastle upon Tyne NE1 7RU, UK.
organic materials present in the forest floor horizon.Gunadi and Verhoef (1993) and Gunadi et al. (1998) foundthat, in the litter layer, a net immobilization of nitrogen tookplace, whereas net mobilization occurred in the fragmen-tation layer. Microbial activity, measured as dehydroge-nase activity, was positively correlated with N content. Thetotal decomposition rate in Javanese pine forest soils wasdriven mainly by seasonal moisture variations (Gunadiet al., 1998). The highest microbial activities occurred inthe litter layer during the tropical wet season (Gunadi et al.,1998). Seasonal variation in the soil inorganic N contentand a correlation with the soil moisture content have beenwell established for many tropical forest ecosystems(Dubey, 1968; Vitousek et al., 1982; Luizao et al., 1992).Changes in the water regime of soil can alter its microbialcomposition (e.g. Bossio et al., 1998).
Thus, microbial activity and nutrient availability areinfluenced by soil stratification and seasonal dynamics.We hypothesized that the microbial community structurediffers in the different soil layers and is influenced by sea-sonal fluctuations in moisture, pH and nutrient content. Totest these hypotheses, the different soil horizons in a pineforest were sampled monthly for one season, the mois-ture, soil pH and nutrient content were determined, andthe bacterial communities were analysed. Denaturing gradient gel electrophoresis (DGGE) of 16S rDNA poly-merase chain reaction (PCR) fragments (Muyzer et al.,1993) was used to profile bacterial communities, as itallows rapid, culturing-independent analysis of largenumbers of samples. Numerical analysis of DGGE pat-terns (e.g. Eichner et al., 1999; Röling et al., 2000) wasused to compare the time series of community fingerprintsof the three soil layers. Community clustering fingerprintswere related to soil chemical variables. To obtain moredetailed insight into the phylogenetic composition of thebacterial communities, and as a measure of biodiversity,a clone library was constructed from a litter sample takenduring the rainy season when the highest activities occur.Seventy-four 16S rDNA clones were partially sequenced.
Results
Seasonal fluctuations in moisture and nutrient contentsof different soil layers
Samples of litter, fragmented litter and mineral soil (first
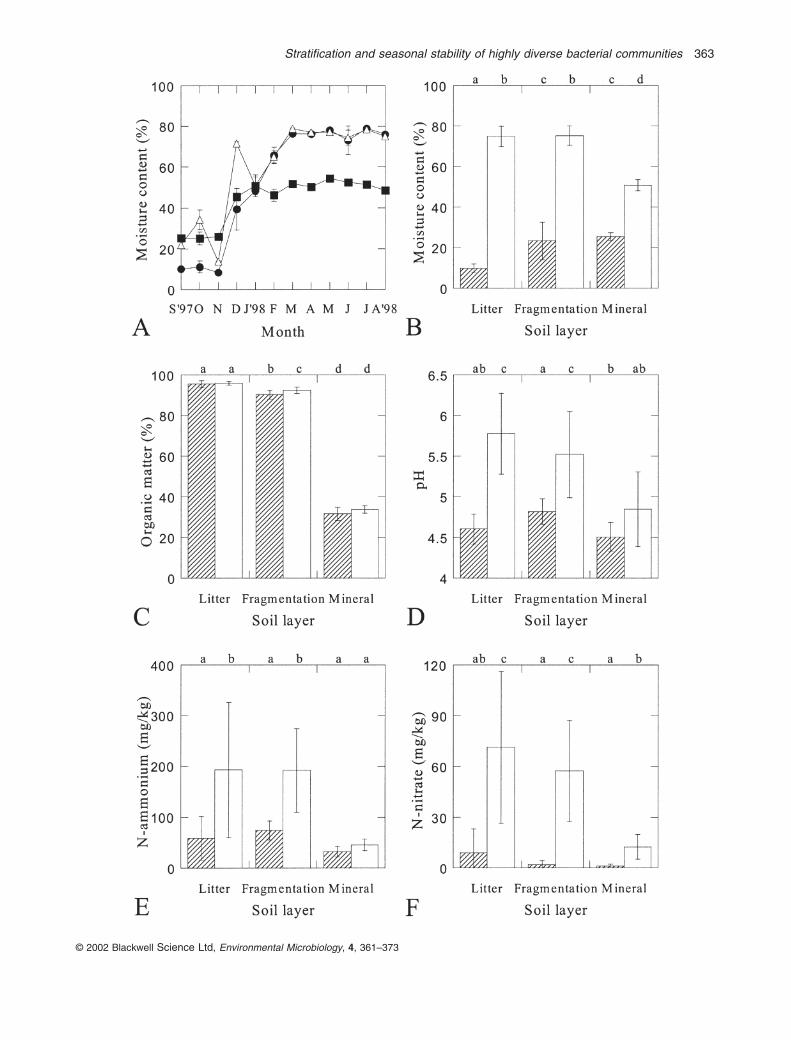
10 cm) were taken from the Pinus merkusii forest at MountUngaran from September 1997 to August 1998. Samplesfrom the first 3 months (September, October and Nov-ember 1997) were extremely dry because no rain fromMay until the first half of November 1997. From mid-November 1997 to August 1998, however, rain fell everymonth at a high level (data not shown) as a result of the La Niña climatic effect. The onset of the rainy season wasclearly reflected in the increase in the moisture content ofthe three soil layers during December 1997 and January1998 to constant values, which were maintained from February until August 1998 (Fig. 1A). To calculate aver-ages for the dry and wet seasons and to make statisticalanalyses, data for moisture, organic matter, ammoniumand nitrate contents and pH were pooled per soil layer forthe periods of September–November 1997 and February–August 1998 (Fig. 1B–F). Mathematically significanteffects (P < 0.01) of layer and season were observed. Thesole exception was the absence of a seasonal effect onorganic matter content (Fig. 1C). The strongest seasonaleffects (increases in the moisture content, pH, ammoniumand nitrate concentrations in the wet season; Fig. 1B andD–F) occurred in the litter layer, whereas the weakestchanges were noted for the mineral soil, in which the pHand ammonium content did not change significantly(Fig. 1D and E). Overall, the litter and fragmentation layers were more comparable than the mineral soil,although a significant difference in the organic matter con-tents (Fig. 1C) was recorded, and the moisture content ofthe litter layer was significantly lower than the fragmenta-tion layer during the dry season (Fig. 1B).
Bacterial community profiles
Reproducibility of DNA extraction, PCR and DGGE was extensively tested. As an example, Fig. 2 shows theclustering of five DGGE tracks (coded ‘Lit0398’), whichcorrespond to the same litter sample (obtained in March1998), which was subjected to five independent DNAextractions and PCRs. The five PCRs were run on twoDGGE gels. Owing to the complexity of the fingerprints,which often showed more than 40 partially overlapping,peaks (see also Figs 3 and 4), Pearson product-momentcorrelation of the densitometric curves (the intensity perpixel in the digitized DGGE tracks) was used for clusteranalysis throughout this study. This band-independent
© 2002 Blackwell Science Ltd, Environmental Microbiology, 4, 361–373
362 A. S. Krave et al.
Fig. 1. Seasonal effects on chemical parameters in the litter, fragmentation and mineral soil layers of a Pinus merkusii (pine) forest at MountUngaran, central Java, Indonesia.A. Changes in moisture contents from September 1997 to August 1998 of the litter (filled circles), fragmentation (open triangles) and mineral(filled squares) soil layers. The error bars indicate the standard deviations, but often these were smaller than the size of the symbol.B–F. Average moisture contents (B), organic matter contents (C), pH (D), ammonium contents (E) and nitrate contents (F) in the litter,fragmentation and mineral layers during the dry (stacked bars; average of data from September–November 1997) and wet (open bars;average of data from February–August 1998) seasons. The error bars indicate standard deviation. The different letters at the top indicatesignificant differences (P < 0.01).
Stratification and seasonal stability of highly diverse bacterial communities 363
© 2002 Blackwell Science Ltd, Environmental Microbiology, 4, 361–373

analysis gives objective results in contrast to methodsbased on band assignment (Rademaker et al., 1999).Numerical analysis using Pearson product-moment cor-relation (Fig. 2) showed that the five tracks clustered at>88% similarity, with an average similarity between thetracks of 92% (standard deviation 4%). The referencemarkers, used in gel analysis and amplified from a standard mixture of 12 clones, clustered at >95% over different gels (data not shown). A second independentDGGE analysis of the soil samples shown in Fig. 3 gavea comparable clustering (data not shown). Thus, themethods used for DNA extraction, PCR and DGGE analy-sis in this study gave reproducible results.
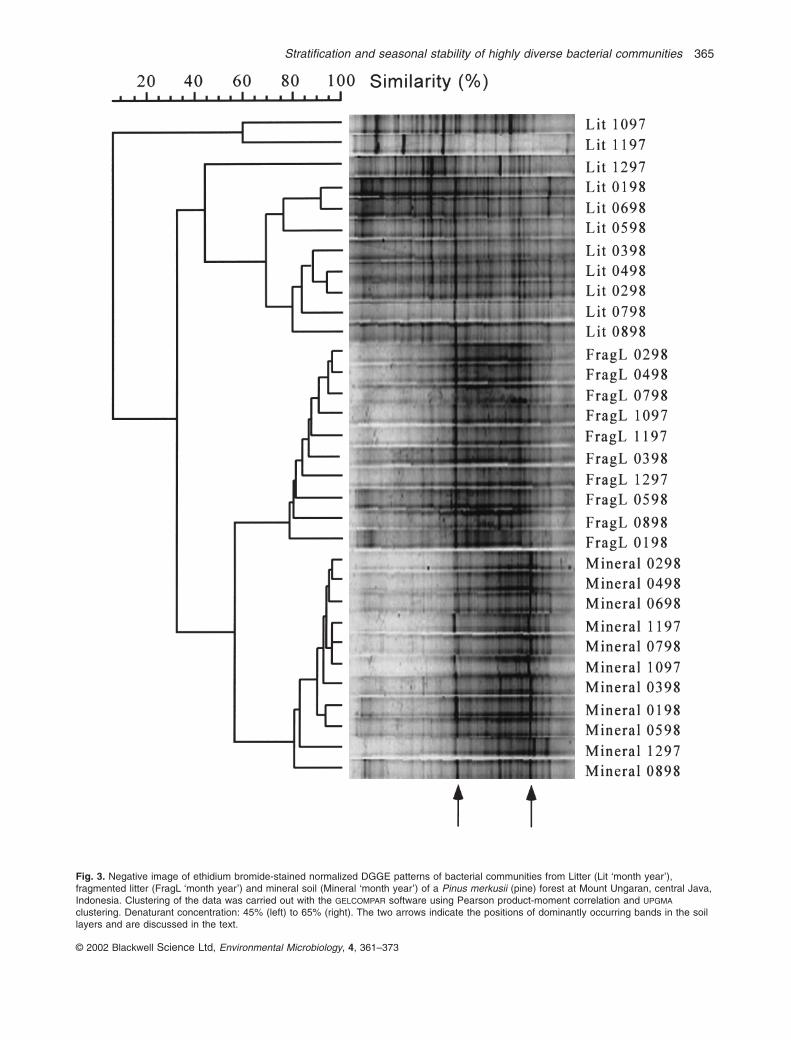
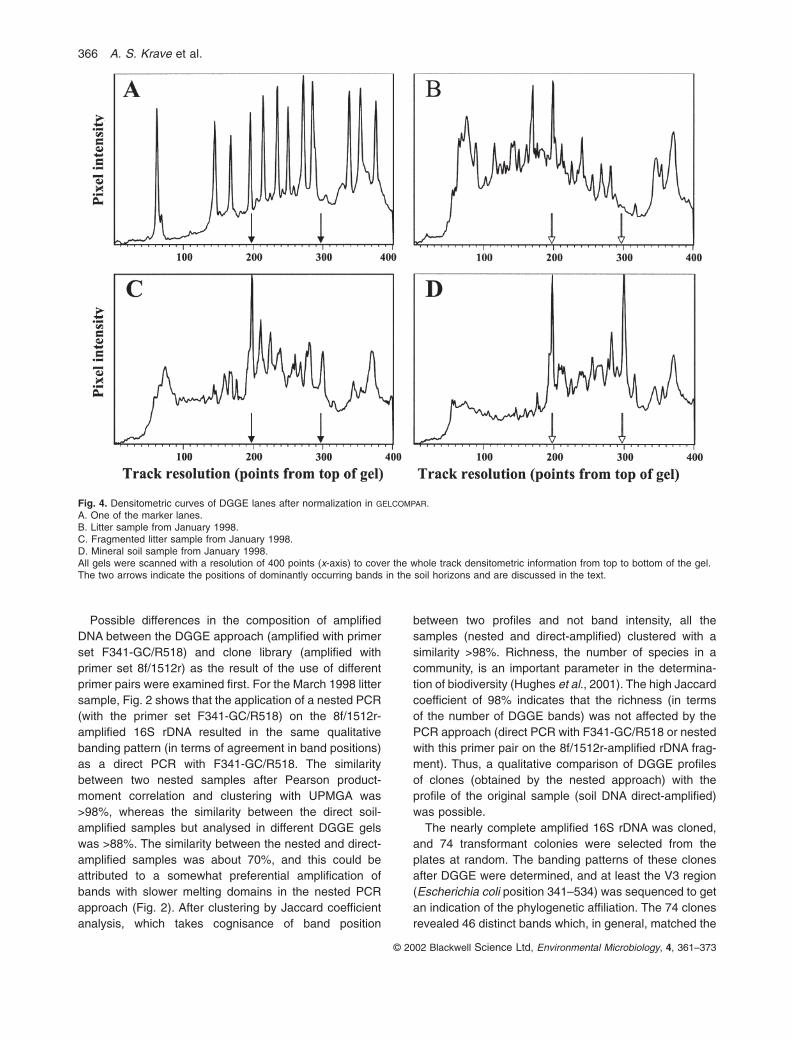
DGGE patterns of the amplified 16S rDNA sequencesof the indigenous bacterial communities are shown inFig. 3. Figure 4B–D shows the densitometric curves of theDGGE tracks of the January 1998 litter, fragmented litterand mineral soil samples respectively. A densitometriccurve of one of the marker lanes is shown in Fig. 4A. Ascan be seen from the individual DGGE tracks in Figs 3and 4, most variations in the profiles were observed forthe litter samples. Compared with these, bands disap-peared at lower denaturant concentrations in the profilesfrom the fragmented litter samples. The mineral soilsamples showed the lowest numbers of bands of ampli-fied 16S rDNA but a higher percentage of bands at higherdenaturant concentrations. Also, two dominant bands(Figs 2– 4, arrows) characterized the mineral soils. Thesebands were also pronounced in the fragmented litter, butwere much less prominent in the litter samples.
Numerical analysis showed that the community profilesof the three horizons clustered separately (Fig. 3). The fin-gerprints of the litter samples clearly separated from thecommunity profiles of the fragmented litter and mineralsoil samples (with a similarity of only 28%). The bacterial
community fingerprints of the fragmented litter andmineral soil clustered together with a similarly of only57%, and two groups were clearly distinguished. AllDGGE profiles of the fragmented litter samples groupedtogether with a similarity of 78%, whereas those ofmineral soil samples clustered with a similarity of 80%. Asindependent DNA extractions and PCRs from a singlesample showed 88% similarity (Fig. 2), no obvious influ-ence of season on the bacterial community structure infragment litter and mineral soil was evident. In contrast, adistinct seasonal effect was recorded for the litter layer(Fig. 3). DGGE profiles of bacterial communities in thelitter samples of October and November 1997, in whichthe moisture content was very low (Fig. 1A), were com-pletely different (<10% similarity) from the other DGGEfingerprints of litter samples. The DGGE profile of the littersample taken early in the rainy season (December 1997),when the moisture content had not yet stabilized (Fig. 1A),was also obviously different from the profiles from the wet season samples (February 1998 to August 1998).Although the January 1998 moisture content of the litterhad not stabilized, its bacterial community profile wasindistinguishable from the wet season profiles (Fig. 3).
Community composition
To obtain insight into the phylogenetic composition, 16SrDNA sequences in the DNA sample from the litter layerof March 1998 were amplified with the primer set 8f/1512r,which covers most of the 16S rRNA gene. This samplewas chosen because the highest microbial activities wereobserved during the wet season in the litter layer (Gunadiet al., 1998), which also showed increases in ammoniumand nitrate concentrations during the wet season (Fig. 1Eand F).
© 2002 Blackwell Science Ltd, Environmental Microbiology, 4, 361–373
364 A. S. Krave et al.
Fig. 2. Negative image of ethidium bromide-stained normalized DGGE patterns of bacterial communities from litter of March 1998 from aPinus merkusii (pine) forest at Mount Ungaran, central Java, Indonesia. Clustering of the data was carried out with the GELCOMPAR softwareusing Pearson product-moment correlation and UPGMA clustering. Nest, nested PCR, first primer set F8/R1521, second primer set F341-GC/R518. The five ‘Lit0398’ lanes were the result of independent DNA extractions and PCRs in order to test the reproducibility of the DNAextraction and DGGE methodology. The nested PCRs, ‘Lit0398 nest’, were performed to examine possible biases between the DGGE andcloning approaches. The two arrows indicate the positions of dominantly occurring bands in the soil layers and are discussed in the text.
Stratification and seasonal stability of highly diverse bacterial communities 365
© 2002 Blackwell Science Ltd, Environmental Microbiology, 4, 361–373
Fig. 3. Negative image of ethidium bromide-stained normalized DGGE patterns of bacterial communities from Litter (Lit ‘month year’),fragmented litter (FragL ‘month year’) and mineral soil (Mineral ‘month year’) of a Pinus merkusii (pine) forest at Mount Ungaran, central Java,Indonesia. Clustering of the data was carried out with the GELCOMPAR software using Pearson product-moment correlation and UPGMA
clustering. Denaturant concentration: 45% (left) to 65% (right). The two arrows indicate the positions of dominantly occurring bands in the soillayers and are discussed in the text.
Possible differences in the composition of amplifiedDNA between the DGGE approach (amplified with primerset F341-GC/R518) and clone library (amplified withprimer set 8f/1512r) as the result of the use of differentprimer pairs were examined first. For the March 1998 littersample, Fig. 2 shows that the application of a nested PCR(with the primer set F341-GC/R518) on the 8f/1512r-amplified 16S rDNA resulted in the same qualitativebanding pattern (in terms of agreement in band positions)as a direct PCR with F341-GC/R518. The similaritybetween two nested samples after Pearson product-moment correlation and clustering with UPMGA was>98%, whereas the similarity between the direct soil-amplified samples but analysed in different DGGE gelswas >88%. The similarity between the nested and direct-amplified samples was about 70%, and this could beattributed to a somewhat preferential amplification ofbands with slower melting domains in the nested PCRapproach (Fig. 2). After clustering by Jaccard coefficientanalysis, which takes cognisance of band position
between two profiles and not band intensity, all thesamples (nested and direct-amplified) clustered with asimilarity >98%. Richness, the number of species in acommunity, is an important parameter in the determina-tion of biodiversity (Hughes et al., 2001). The high Jaccardcoefficient of 98% indicates that the richness (in terms of the number of DGGE bands) was not affected by thePCR approach (direct PCR with F341-GC/R518 or nestedwith this primer pair on the 8f/1512r-amplified rDNA frag-ment). Thus, a qualitative comparison of DGGE profilesof clones (obtained by the nested approach) with theprofile of the original sample (soil DNA direct-amplified)was possible.
The nearly complete amplified 16S rDNA was cloned,and 74 transformant colonies were selected from theplates at random. The banding patterns of these clonesafter DGGE were determined, and at least the V3 region(Escherichia coli position 341–534) was sequenced to getan indication of the phylogenetic affiliation. The 74 clonesrevealed 46 distinct bands which, in general, matched the
© 2002 Blackwell Science Ltd, Environmental Microbiology, 4, 361–373
366 A. S. Krave et al.
Fig. 4. Densitometric curves of DGGE lanes after normalization in GELCOMPAR.A. One of the marker lanes.B. Litter sample from January 1998.C. Fragmented litter sample from January 1998.D. Mineral soil sample from January 1998.All gels were scanned with a resolution of 400 points (x-axis) to cover the whole track densitometric information from top to bottom of the gel.The two arrows indicate the positions of dominantly occurring bands in the soil horizons and are discussed in the text.
Stratification and seasonal stability of highly diverse bacterial communities 367
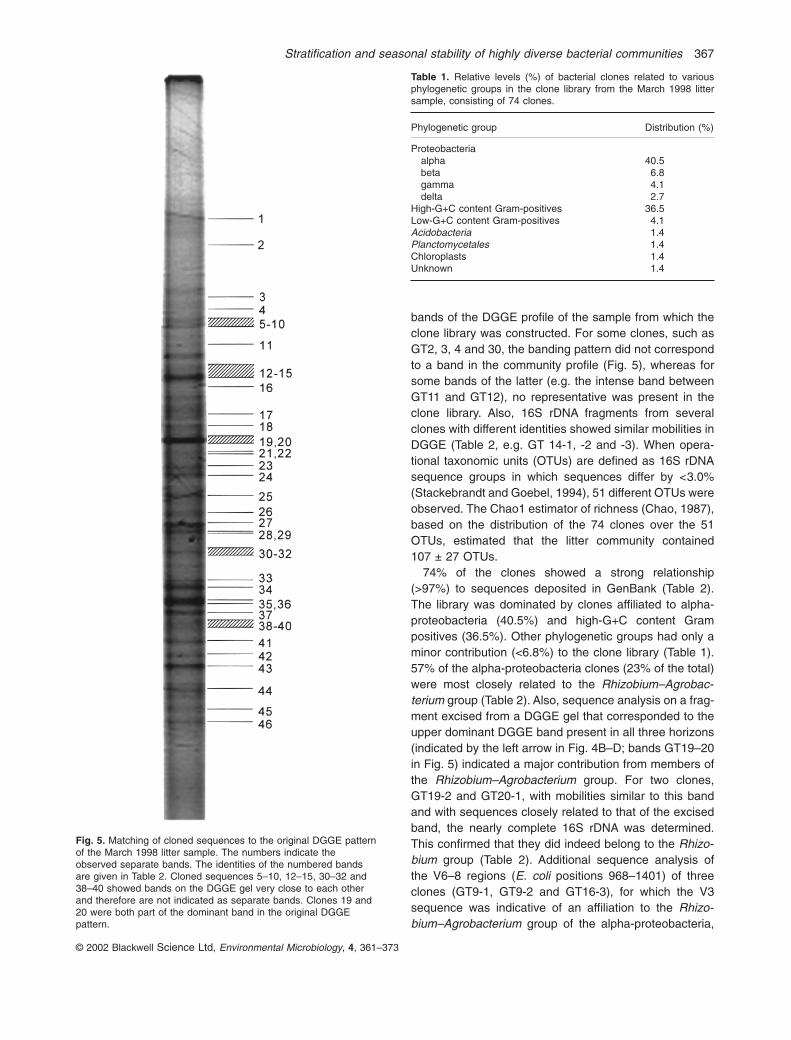
bands of the DGGE profile of the sample from which theclone library was constructed. For some clones, such asGT2, 3, 4 and 30, the banding pattern did not correspondto a band in the community profile (Fig. 5), whereas forsome bands of the latter (e.g. the intense band betweenGT11 and GT12), no representative was present in theclone library. Also, 16S rDNA fragments from severalclones with different identities showed similar mobilities inDGGE (Table 2, e.g. GT 14-1, -2 and -3). When opera-tional taxonomic units (OTUs) are defined as 16S rDNAsequence groups in which sequences differ by <3.0%(Stackebrandt and Goebel, 1994), 51 different OTUs wereobserved. The Chao1 estimator of richness (Chao, 1987),based on the distribution of the 74 clones over the 51OTUs, estimated that the litter community contained107 ± 27 OTUs.
74% of the clones showed a strong relationship (>97%) to sequences deposited in GenBank (Table 2).The library was dominated by clones affiliated to alpha-proteobacteria (40.5%) and high-G+C content Gram positives (36.5%). Other phylogenetic groups had only aminor contribution (<6.8%) to the clone library (Table 1).57% of the alpha-proteobacteria clones (23% of the total)were most closely related to the Rhizobium–Agrobac-terium group (Table 2). Also, sequence analysis on a frag-ment excised from a DGGE gel that corresponded to theupper dominant DGGE band present in all three horizons(indicated by the left arrow in Fig. 4B–D; bands GT19–20in Fig. 5) indicated a major contribution from members ofthe Rhizobium–Agrobacterium group. For two clones,GT19-2 and GT20-1, with mobilities similar to this bandand with sequences closely related to that of the excisedband, the nearly complete 16S rDNA was determined.This confirmed that they did indeed belong to the Rhizo-bium group (Table 2). Additional sequence analysis of the V6–8 regions (E. coli positions 968–1401) of threeclones (GT9-1, GT9-2 and GT16-3), for which the V3sequence was indicative of an affiliation to the Rhizo-bium–Agrobacterium group of the alpha-proteobacteria,
© 2002 Blackwell Science Ltd, Environmental Microbiology, 4, 361–373
Fig. 5. Matching of cloned sequences to the original DGGE patternof the March 1998 litter sample. The numbers indicate theobserved separate bands. The identities of the numbered bandsare given in Table 2. Cloned sequences 5–10, 12–15, 30–32 and38–40 showed bands on the DGGE gel very close to each otherand therefore are not indicated as separate bands. Clones 19 and20 were both part of the dominant band in the original DGGEpattern.
Table 1. Relative levels (%) of bacterial clones related to various phylogenetic groups in the clone library from the March 1998 littersample, consisting of 74 clones.
Phylogenetic group Distribution (%)
Proteobacteriaalpha 40.5beta 6.8gamma 4.1delta 2.7
High-G+C content Gram-positives 36.5Low-G+C content Gram-positives 4.1Acidobacteria 1.4Planctomycetales 1.4Chloroplasts 1.4Unknown 1.4

© 2002 Blackwell Science Ltd, Environmental Microbiology, 4, 361–373
368 A. S. Krave et al.
Table 2. Identity of 74 clones related to bands in Fig. 5.
Clone ID Closest relative in GenBank (accession no.) % similarity Phylogenetic affiliation
GT01 Uncultured bacterium SY6-55 (AF296204) 99.5 beta-ProteobacteriaGT02 Uncultured soil bacterium S097 (AY037617) 92.2 alpha-ProteobacteriaGT03-1 Bradyrhizobium sp. SjSa1 (AF352563) 98.8 alpha-ProteobacteriaGT03-2 Matsuebacter sp. 13 (AB024306) 96.4 beta-ProteobacteriaGT04 Escherichia coli K12 (NC000913) 94.3 gamma-ProteobacteriaGT05 Bradyrhizobium sp. SjSa1 (AF352563) 99.4 alpha-ProteobacteriaGT06 Sphingobium yanoikuyae (AY047219) 98.8 alpha-ProteobacteriaGT07-1 Uncultured bacterium WkB09 (AF257859) 96.9 gamma-ProteobacteriaGT07-2 Chlorella chloroplast (AJ387754) 93.5 ChloroplastsGT08 Chondromyces apiculatus (AJ233938) 96.9 delta-ProteobacteriaGT09-1 Agrobacterium tumefaciens A17 (AF406666) 98.8 alpha-Proteobacteria
-V6-8a Sinorhizobium sp. S009 (AF285965) 94.6 alpha-ProteobacteriaGT09-2 Agrobacterium tumefaciens A17 (AF406666) 98.8 alpha-Proteobacteria
-V6-8a Sinorhizobium sp. S009 (AF285965) 95.6 alpha-ProteobacteriaGT10 Mesorhizobium loti (NC002678) 99.4 alpha-ProteobacteriaGT11 Burkholderia sp. NF100 (AB025790) 99.0 beta-ProteobacteriaGT12 Uncultured soil bacterium S083 (AY037606) 97.6 alpha-ProteobacteriaGT13 Uncultured bacterium #0649-1N15 (AF234121) 93.3 High-G+C content Gram-positivesGT13-2 Pseudomonas andropogonis (X67037) 94.7 beta-ProteobacteriaGT14-1 Agrevia bicolorata (AF159363) 98.9 High-G+C content Gram-positivesGT14-2 Marinobacter sp. Trimyema-1 (AJ292527) 92.6 gamma-ProteobacteriaGT14-3 Uncultured soil bacterium S097 (AY037617) 92.2 alpha-ProteobacteriaGT15 Burkholderia caryophylli (X67039) 97.9 beta-ProteobacteriaGT16-1 Earthworm cast bacterium C10D1 (AY039461) 100.0 High-G+C content Gram-positivesGT16-2 Uncultured soil bacterium S085 (AF128665) 93.5 UnidentifiedGT16-3 Rhizobium leguminosarum (AF417564) 100.0 alpha-Proteobacteria
-V6-8a Rhodopseudomonas palustris DCP3 (AF41663) 95.8 alpha-ProteobacteriaGT16-4 Bartonella sp. Deer 159/660/1 (AF373845) 97.0 alpha-ProteobacteriaGT16-5 Amaricoccus macauensis (U88042) 97.1 alpha-ProteobacteriaGT16-6 Amaricoccus macauensis (U88042) 97.6 alpha-ProteobacteriaGT17-1 Rhizobium leguminosarum (AF417564) 99.4 alpha-ProteobacteriaGT17-2 Rhizobium leguminosarum (AF417564) 100.0 alpha-ProteobacteriaGT18-1 Uncultured bacterium #0649-1N15 (AF234121) 93.3 High-G+C content Gram-positivesGT18-2 Microbacterium sp. VA8728-00 (AF306834) 100.0 High-G+C content Gram-positivesGT19-1 Bacillus sp. GL1 (AB024598) 94.3 Low-G+C content Gram-positivesGT19-2 Rhodopseudomonas palustris (AF416662) 100.0 alpha-Proteobacteria
-compb Bradyrhizobium sp. Tv2a-2 (AF216780) 96.8 alpha-ProteobacteriaGT20-1 Bradyrhizobium elkanii (AF417554) 100.0 alpha-Proteobacteria
-compb Afipia felis (AF338177) 97.1 alpha-ProteobacteriaGT20-2 Grassland soil clone saf3 (AF078294) 99.2 alpha-ProteobacteriaGT20-3 Methylobacterium sp. TJ1 (AF384188) 96.3 alpha-ProteobacteriaGT21 Uncultured earthworm cast bacterium C136 (AY037739) 97.9 High-G+C content Gram-positivesGT22-1 Uncultured earthworm cast bacterium C136 (AY037739) 96.9 High-G+C content Gram-positivesGT22-2 Uncultured earthworm cast bacterium C136 (AY037734) 94.0 High-G+C content Gram-positivesGT23-1 Uncultured bacterium D1 (AF328943) 98.8 alpha-ProteobacteriaGT23-2 Uncultured bacterium D1 (AF328943) 99.4 alpha-ProteobacteriaGT24 Mycobacterium sp. RJGll.135 (U30661) 99.5 High-G+C content Gram-positivesGT25-1 Hyphomicrobium sp. PMC (AF279787) 100.0 alpha-ProteobacteriaGT25-2 Hyphomicrobium sp. PMC (AF279787) 97.1 alpha-ProteobacteriaGT26 Grassland soil clone sl1-208 (AF078346) 96.3 High-G+C content Gram-positivesGT27-1 Uncultured soil bacterium C010 (AF128739) 97.9 High-G+C content Gram-positivesGT27-2 Hyphomicrobium sp. PMC (AF279787) 98.2 alpha-ProteobacteriaGT28 Uncultured bacterium SJA-5 (AJ009449) 97.1 delta-proteobacteriaGT29 Grassland soil clone sl1-017 (AF078323) 95.9 High-G+C content Gram-positivesGT30 Uncultured earthworm cast bacterium C146 (AY037748) 97.4 Low-G+C content Gram-positivesGT31-1 Bacillus sp. GL1 (AB024598) 95.3 Low-G+C content Gram-positivesGT31-2 Agricultural soil bacterium SC-I-8 (AJ252612) 92.8 AcidobacteriaGT32 Uncultured bacterium #0649-1N15 (AF234121) 92.3 High-G+C content Gram-positivesGT33 Uncultured bacterium ARFS-6 (AJ277690) 98.8 High-G+C content Gram-positivesGT34-1 Nocardioides sp. C190 (AF253510) 100.0 High-G+C content Gram-positivesGT34-2 Mycobacterium sp. FI-25796 (AF058299) 99.4 High-G+C content Gram-positivesGT35 Magnetospirillum sp. MSM-6 (Y17391) 97.0 alpha-ProteobacteriaGT36 Soil bacterium S89D1 (AY039505) 99.4 High-G+C content Gram-positivesGT37-1 Mycobacterium sp. MCRO 10 (X93026) 98.9 High-G+C content Gram-positivesGT37-2 Rhodococcus opacus (AF095715) 100.0 High-G+C content Gram-positivesGT37-3 Mycobacterium neoaurum (AF268445) 98.9 High-G+C content Gram-positivesGT38-1 Uncultured earthworm cast bacterium (AY037683) 99.4 alpha-ProteobacteriaGT38-2 Uncultured earthworm cast bacterium (AY037683) 99.4 alpha-Proteobacteria

Stratification and seasonal stability of highly diverse bacterial communities 369
reconfirmed this affiliation (Table 2) and the strong con-tribution of members of the Rhizobium–Agrobacteriumgroup to the clone library.
Discussion
Bacterial community structure
Culture-independent community profiles of litter, frag-mented litter and mineral soil from an Indonesian P.merkusii forest were made to determine the effects ofstratification and season on microbial communities and torelate the profiles to chemical and physical soil parame-ters. The different steps in the applied molecular approach(DNA extraction, PCR and DGGE profiling) have their pitfalls (von Wintzingerode et al., 1997). However, as allsamples were treated similarly, these pitfalls can be con-sidered to be the same for all samples, allowing between-sample comparisons. Analysis of 0.5 g samples wassufficient to obtain reproducible results in agreement withother cultivation-independent, nucleic acid-based studiesof microbial communities in soils (Duarte et al., 1998;Felske et al., 1998; Griffiths et al., 2000).
The moisture content, pH and ammonia and nitrateconcentrations of the three different forest horizons weresignificantly influenced by season. Significant differenceswere also recorded for the three soil horizons for theseparameters and the organic matter content. The chemicaland physical differences between the soil horizons were reflected in the bacterial community structures, asindicated by DGGE clustering. The separate clusteringsrecorded for the litter and fragmented litter suggested thatthe organic matter content was the major determinant, asthis was the only variable measured that differed signifi-cantly between the two layers. In organic matter degra-dation, first labile organic matter, such as carbohydrates,is catabolized, followed (in time and, thus, in depth) by
semi-recalcitrant material, such as lignin. Evidence isarising that the composition of microbial communitiesaffects the degradation rates of soil organic compounds(Berg et al., 1995; Degens, 1998; 1999; Andren et al.,1999). The degradation of lignin and carbohydratesinvolves different bacteria because the degradingenzymes occur in a comparatively limited number ofmicrobial populations (Hammel, 1997; Hu and Vanbruggen, 1997). Hence, the difference in organic mattercontent offers an explanation for the observed stratifica-tion in bacterial community structure. Similar stratificationof communities in forest soils has also been observed formicro- and mesoarthropods (Berg et al., 1998). Theseanimals feed on dead organic matter and the microor-ganisms associated with it. Using cultivation-independent,nucleic acid-based techniques, stratification of microbialcommunities has also been observed in temperate grass-land soils (Felske et al., 1998; Griffiths et al., 2000),although the effects of season on microbial distribution inthe different horizons were not described.
Despite significant seasonal effects on moisturecontent, pH and nutrient content in the three differentforest layers, the DGGE profiles of mineral soil and fragmentation samples revealed no obvious influence ofseason on their microbial community structure. This couldimply that the bacterial communities in these horizons arealso stable through the year. The stability in time and layerhas also been reported for nitrifiers in a temperate, acidforest soil (Laverman et al., 2001). In contrast, the litterlayer communities were strongly influenced by seasonalvariation. The DGGE profiles of the dry season littersamples differed considerably from the wet seasonsamples and differed from each other. Also, the seasonalchanges in soil parameters were the most marked for thelitter layer (Fig. 1). During the atypical dry season of 1997(due to El Niño), the moisture content of the litter layerdropped to only 10% and was significantly lower than in
© 2002 Blackwell Science Ltd, Environmental Microbiology, 4, 361–373
Table 2. cont.
Clone ID Closest relative in GenBank (accession no.) % similarity Phylogenetic affiliation
GT39 Uncultured earthworm cast bacterium (AY037683) 99.4 alpha-ProteobacteriaGT40-1 Uncultured soil bacterium C010 (AF128739) 100.0 High-G+C content Gram-positivesGT40-2 Uncultured eubacterium WR825 (AJ292808) 95.2 alpha-ProteobacteriaGT40-3 Uncultured bacterium GIF7 (AF407198) 98.2 alpha-ProteobacteriaGT41 Soil bacterium S103M1 (AY039481) 99.4 High-G+C content Gram-positivesGT42 Uncultured soil bacterium C010 (AF128739) 99.5 High-G+C content Gram-positivesGT43 Nostocoida limicola III strain Ben223 (AF244750) 95.6 PlanctomycetalesGT44 Uncultured earthworm cast bacterium (AY037716) 98.6 High-G+C content Gram-positivesGT45-1 Actinoplanes penicillatus (AJ277580) 99.4 High-G+C content Gram-positivesGT45-2 Actinoplanes penicillatus (AJ277580) 98.9 High-G+C content Gram-positivesGT46 Microlunatus phosphovorus (Z78207) 99.4 High-G+C content Gram-positives
The clones were obtained from the March 1998 sample of litter layer from the tropical pine forest soil on Mountain Ungaran. At least E. colipositions 341–534 were sequenced.a. E. coli positions 968–1402 were also sequenced.b. Nearly completely sequenced.

the other two layers. Thus, a considerable drought stresswas imposed on the (micro)organisms. Extreme changesin the water regime of soil can alter its microbial compo-sition (e.g. Bossio et al., 1998). Ammonium-forming bacteria are well recognized as sensitive to drought, andtheir numbers decrease with soil drying (Giambiagi et al.,1993). Autotrophic nitrifiers are also among the soilmicrobes most sensitive to drought stress (Dubey, 1968;Killham, 1990). In contrast, some bacteria, including nitri-fiers, are able to grow under hygroscopic humidity (3%)(Berg and Rosswall, 1982; Giambiagi et al., 1993). There-fore, drought periods are likely to effect changes in themicrobial community structure. For tropical pine forests,litter fall is independent of season (Gunadi et al., 1998)and results in a continuous input of microorganisms.These microorganisms contribute to the microbial com-munity of the litter during the dry season but are (partially)displaced by rain.
The microbial community structures differ and reflectdifferences in the chemical and physical parameters. Incontrast, seasonal effects on the community structuresare relatively limited, although they influence the chemi-cal and physical variables significantly.
Community composition
For one sample (March 1998 litter), a clone library wasconstructed. A wet season sample was chosen as previ-ous research showed that the highest activities in the litterlayer occur during this season (Gunadi et al., 1998). Thefact that the highest increases in ammonia and nitratecontents of the litter occurred at the onset of the wetseason supported the findings of Gunadi et al. (1998).Although the fragmented litter recorded comparableincreases in the nitrate and ammonia contents, it shouldbe realized that nitrate and ammonia leaching from thelitter layer would have contributed to the totals.
A total of 74 clones was obtained and partiallysequenced. As in general only 193 nucleotides weresequenced, the affiliations mentioned in Table 2 should be considered as indicative for phylogenetic affiliation, not as definitive assignments. However, (more) completesequencing of five clones never led to assignment toanother phylogenetic group. Partial sequencing indicateda strong dominance of alpha-proteobacteria (especiallymembers of the Rhizobium–Agrobacterium group) andhigh-G+C content, Gram-positive bacteria. The bacterialcommunities of a few other (sub)tropical forest soils havebeen addressed by nucleic acid-based techniques(Liesack and Stackebrandt, 1992; Stackebrandt et al.,1993; Borneman and Triplett, 1997; Nüsslein and Tiedje,1998; 1999). For a subtropical Australian forest, the bacterial community was also strongly dominated byalpha-proteobacteria (50.4%), especially members of
the Rhizobium–Agrobacterium group (Liesack andStackebrandt, 1992; Stackebrandt et al., 1993). Similarly,alpha-proteobacteria also contributed strongly to a clonelibrary based on the 63% G+C fraction of soil DNAisolated from a 200-year-old Hawaiian rainforest. Thisfraction constituted the majority of the soil DNA. The mostdominant clone (13.2%) related to the Rhizobium–Agrobacterium group (Nüsslein and Tiedje, 1998). Theseobservations concur with our results. In contrast, in anAmazonian forest, only two out of 50 clones were relatedto alpha-proteobacteria, and neither belonged to the Rhizobium–Agrobacterium group (Borneman and Triplett,1997). Also, in a clone library from a second Hawaiianrainforest sample, within the Kohala Forest Reserve, noalpha-proteobacteria clones were encountered (Nüssleinand Tiedje, 1999). Although we found a significant contri-bution from high-G+C content, Gram-positive bacteria,this has not been observed for other (sub)tropical forestsoils. Planctomycetales and Acidobacteria were othermajor groups in the Australian forest soil (Liesack andStackebrandt, 1992; Stackebrandt et al., 1993), whereaslow-G+C content, Gram-positive bacteria were the domi-nant group (18%) in the Amazonian rain forest (Bornemanand Triplett, 1997). Acidobacterium sequences also dominated the Hawaiian Kohala Forest Reserve clonelibrary (Nüsslein and Tiedje, 1999). In both Hawaiian rain-forests, no high-G+C content, Gram-positive bacteria-related sequences were encountered. We cannot excludethe possibility that the differences in the phylogeneticcomposition results of our study and those of otherstudies on (sub)tropical forest soils were caused by dif-ferences in experimental conditions (DNA extractionmethods and PCR conditions), rather than true differ-ences. However, screening the primers we used in theRDP database, via PROBE MATCH, revealed that they werenot biased against the dominant phylogenetic groups ofother studies. Also, we extracted DNA by bead-beating,which gives the highest amounts of DNA (Miller et al.,1999). The two Hawaiian rainforest soil studies (Nüssleinand Tiedje, 1998; 1999) used the same DNA extractionmethods and PCR conditions, but recorded considerabledifferences in phylogenetic compositions.
Sequence analysis of the clones, as well as linking theDGGE banding position of the clones to the DGGE profileof the original sample, revealed that the 74 clones far fromcompletely represented all the OTUs in the sample. Fora large number of bands in the DGGE profile for theMarch 1998 litter sample, no representative was presentin the clone library. Based on the definition of operationaltaxonomic units (OTUs) as 16S rDNA sequence groupsin which the sequences differ by <3.0% (Stackebrandtand Goebel, 1994), the Chao1 estimator of richness(Chao, 1987) was calculated as 107 ± 27 OTUs, whereasthe 74 clones represented only 51 OTUs. As the richness
© 2002 Blackwell Science Ltd, Environmental Microbiology, 4, 361–373
370 A. S. Krave et al.
Stratification and seasonal stability of highly diverse bacterial communities 371
may be underestimated with relatively low numbers ofclones (Hughes et al., 2001), and PCR and DNA extrac-tion can be biased (von Wintzingerode et al., 1997), theactual richness can be assumed to be much higher. Com-paring the 33 samples now analysed by DGGE, based onclone libraries, would have required the analysis of atleast several thousand clones and would therefore havebeen very costly and time consuming. Fingerprinting tech-niques, such as DGGE analysis, are far more suitable forcomparing large numbers of samples with high biodiver-sities. A similar conclusion was drawn by Borneman andTriplett (1997), who observed very high bacterial diversityin tropical Amazonian forest and pasture samples.Sequencing is required to obtain detailed information onthe phylogenetic composition of a specific environmentalsample. DGGE analysis before sequencing enables oneto limit the amount of sequencing. For example, thesequencing data obtained for the March 1998 littersample also applied to the other seven litter samples from1998, as shown by the comparable DGGE profiles.
Experimental procedures
Site description
The sampling location was situated in a P. merkusii forest onthe southern slope of Mount Ungaran in the neighbourhoodof the village of Gintungan, central Java, Indonesia. Theforest lies at an altitude of 1200 m above sea level, and thepredominant undergrowth is Eupatorium riparium, whichcovers the forest floor almost completely. The soil type hasbeen classified as brown andosol. A more detailed descrip-tion can be found elsewhere (Vink and Purwanti, 1994; Kraveet al., 2002).
Field sampling and sample conservation
From September 1997 to August 1998, samples of: (i) litter;(ii) fragmentation (equals fragmented litter); and (iii) mineralsoil from the first 10 cm were taken in the first week of everymonth. Normally, the dry and wet seasons occur in April–October and October–April, respectively, but because of El Niño, an extremely dry period extended until the end ofNovember 1997, whereas during the whole of 1998, the soilswere always wet as a result of the La Niña effect.
An area of 30 m by 40 m of the P. merkusii (pine) forestwas used to sample litter, fragmentation and mineral soil at12 randomly chosen locations. Litter was sampled by takingsamples from the top of the ª 3- to 5-cm-deep litter layer,whereas samples from the fragmentation layer were col-lected after removal of the litter layer. After the removal offragmented litter, a core with a diameter of 14 cm and a depthof 15 cm was taken. The collected samples were placed insterile polyethyleneglycol bags and brought to the laboratoryof the Faculty of Biology, Universitas Kristen Satya Wacana,Salatiga, Indonesia, within several hours. There, the 12samples (100 g each) from each layer were mixed, and well-homogenized subsamples (20 g) were freeze-dried and
maintained at 4∞C before transport to The Netherlands formolecular analysis. Soil pH, moisture and nutrient contentwere analysed directly after homogenization. Litter and frag-mentation samples were cut into small fragments with sterilescissors before homogenization.
Analysis of moisture content, organic matter and nutrients
Triplicate 10 g samples from each layer were dried at 100∞Cfor 72 h to determine the soil moisture content. The resultantdry matter was then combusted in a furnace at 600∞C for 2 h to determine the organic matter content. For the analysisof ammonia and nitrate, triplicate 5 g samples of litter andfragmented litter and triplicate 10 g samples of mineral soilwere extracted with 50 ml of KCl (2 M) and shaken at 200 r.p.m. for 1 h, followed by centrifugation at 5000 r.p.m. for15 min. Litter and fragmented litter were cut into small pieceswith sterile scissors before KCl extraction. The clear super-natant was used in chemical analysis. N-NH4
+ and N-NO3-
were determined according to the methods of Keeney andNelson (1982) with ammonium sulphate and potassiumnitrate as standards. pH was measured using a Consort P907 pH meter.
Data were analysed statistically with one-way analysis ofvariance (ANOVA) by the Tukey post hoc test. Percentages ofmoisture and organic matter were arcsine transformed toachieve normal distribution. Statistical computations wereundertaken with SYSTAT 7.0.
DGGE profiling
DNA extractions were initiated by placing about 0.5 g offreeze-dried sample in a bead-beating tube and rewetting itwith 120 mM Na-phosphate buffer (pH 8). After 12 h, the DNAwas extracted from the buffer-saturated material accordingthe method of Laverman et al. (2001). Briefly, this methodconsists of two periods of 1 min each of 4000 r.p.m. beatbeading (Biospec bead beater) in the presence of chloroformand cetyltrimethylammoniumbromide (CTAB). The DNA wascleaned by Sepharose 4B column purification (Jackson et al.,1997). A minimum of two DNA extractions was made for eachsample. DNA was isolated from freeze-dried samples, storedat 4∞C. During freeze drying, all water is removed from frozensamples, leaving no water for enzymatic reactions (e.g.DNase) during subsequent storage at 4∞C, although theprocess does not affect DNA. Indeed, analysis results offreeze-dried samples were the same as those from freshsamples (data not shown). PCR was performed in a totalvolume of 25 µl, which contained 0.4 µM primer F341-GC, 0.4 µM primer R518 (Muyzer et al., 1993), 0.4 mM dNTPs, 10 µg of BSA, Expand buffer (Boehringer Mannheim), 2.6 Uof Expand enzyme and 1 µl of undiluted DNA template. Ampli-fication was performed in a Perkin-Elmer DNA Thermo Cycleras follows: 94∞C for 4 min, after which 35 cycles at 94∞C for0.5 min; 54∞C for 1 min; 72∞C for 1 min; and a final elonga-tion at 72∞C for 5 min. The correct size of the PCR fragmentwas revealed by electrophoresis on a 1.4% agarose gel.DGGE was performed with the Bio-Rad DCode system. ThePCR product was loaded on a 1-mm-thick 8% (w/v) poly-
© 2002 Blackwell Science Ltd, Environmental Microbiology, 4, 361–373

acrylamide (37.5:1 acrylamide:bisacrylamide) gel, which con-tained a 45–65% linear denaturing gradient [100% denatu-rant is defined as 7 M urea and 40% (v/v) formamide]. Thegels were run in 1¥ TAE buffer (40 mM Tris-acetate, 1 mMEDTA, pH 8.0) at 70 V and 60∞C for 16 h. Gels were thenstained in 1¥ TAE buffer containing 1 µg ml-1 ethidiumbromide and recorded with a CCD camera system (TheImager, Appligen). Images were converted, normalized andanalysed in GELCOMPAR 4.0 (Applied Maths), using Pearsonproduct-moment correlation and the unweighted pair groupmethod using arithmetic averages (UPGMA) cluster analysis.To aid the conversion and normalization, a reference (amarker consisting of a mixture of 12 clones from a clonelibrary of the litter sample) was run in the outer lanes of thegel and after every four samples. In GELCOMPAR, the patternsof the environmental samples were aligned using the refer-ence and normalized to the strongest band present. Foranalysis by Jaccard coefficient, a band position tolerance of0.7% was applied. This was the minimum tolerance at whichall marker lanes clustered at 100%. The marker, TIF files ofDGGEs and GELCOMPAR files of analysed DGGEs are avail-able from the corresponding author.
Clone library and sequencing of clones
PCR primers 8f and 1512r (Felske et al., 1998) were used toamplify 16S rRNA sequences from cleaned DNA of the littersamples. After checking the size of the products by 1.4%agarose gel electrophoresis and cleaning with a QiaquickRep purification kit (Qiagen), the products were cloned inpGEM-T linear plasmid vector and Escherichia coli JM109competent cells as specified by the manufacturer (Promega).The presence of an insert with the correct size (1.5 kb) wasdetermined by PCR with primers Sp6 and T7, as specified bythe manufacturer. To determine the banding position of theclones, correctly sized amplicons were reamplified with theprimer set F341-GC/R518, and the products were subjectedto DGGE next to the similarly amplified soil sample DNA fromwhich the clone library was constructed.
As a minimum, E. coli 16S rRNA gene positions 341–534were sequenced in both directions with primers F341 andR518 primers. For five clones, additional sequence data wereobtained by sequencing in both directions with primers 8f,357r, 521f, 928r, 968f and 1401r (Edwards et al., 1988;Felske et al., 1998). Sequencing PCR was carried out withthe ABI Prism Dye Terminator cycle sequencing core kit(Perkin-Elmer), and the products were run on Sequagel-6sequence gels (National Diagnostics) in a 373-A/DNAsequencer (Applied Biosystem). The sequences were com-pared with sequences deposited in GenBank using the BLAST
network service (Altschul et al., 1990) to determine theirapproximate phylogenetic affiliations.
Nucleotide sequence accession numbers
The sequences of the rDNA clones have GenBank accessionnumbers AF255968 to AF256054.
Acknowledgements
We would like to acknowledge the help of Sri Purwanti in
taking the samples at Gunung Ungaran. Professor Dr EricSenior of the University of Natal, South Africa, is cordiallyacknowledged for a critical revision of the manuscript andchecking the English syntax.
References
Altschul, S.F., Gish, W., Miller, W., Myers, E.W., and Lipman,D.J. (1990) Basic local alignment search tool. J Mol Biol215: 403–410.
Andren, O., Brussaard, L., and Clarholm, M. (1999) Soilorganism influence on ecosystem-level process- bypass-ing the ecological hierarchy? Appl Soil Ecol 11: 177–188.
Berg, P., and Rosswall, T. (1982) Seasonal variations inabundance and activity of nitrifiers in four arable croppingsystems. Microb Ecol 13: 75–87.
Berg, B., McClaugherty, C., Virzo De Santo, A., Johansson,M.B., and Ekbohm, G. (1995) Decomposition of litter and soil organic matter – can we distinguish a mechanismfor soil organic matter buildup? Scand J For Res 10:108–119.
Berg, M.P., Kniese, J.P., Bedaux, J.J.M., and Verhoef, H.A.(1998) Dynamics and stratification of functional groups ofmicro- and mesoarthropods in the organic layer of a Scotspine forest. Biol Fertil Soils 26: 268–284.
Borneman, J., and Triplett, E.W. (1997) Molecular microbialdiversity in soils from eastern Amazonia: Evidence forunusual microorganisms and microbial population shiftsassociated with deforestation. Appl Environ Microbiol63: 2647–2653.
Bossio, D.A., Scow, K.M., Gunapala, N., and Graham, K.J.(1998) Determinants of soil microbial communities: effectsof agricultural management, season, and soil type on phospholipid fatty acid profiles. Microb Ecol 36: 1–12.
Bruijnzeel, L.A. (1984) Immobilization of nutrients of planta-tion forest of Pinus merkusii and Agathis dammara growingon volcanic soils in Central Java, Indonesia. In Nutrition of Perrenial Crops. Thajib, A.P. (ed.). Kuala Lumpur:Malaysian Soil Science Society, pp. 19–29.
Bruijnzeel, L.A. (1985) Nutrient content of litterfall in conifer-ous forest plantations in Central Java, Indonesia. J TropEcol 1: 353–372.
Chao, A. (1987) Estimating the population size for capture–recapture data with unequal catchability. Biometrics 30:101–110.
Degens, B.P. (1998) Decreases in microbial functional diver-sity do not result in corresponding changes in decomposi-tion under different moisture conditions. Soil Biol Biochem30: 1989–2000.
Degens, B.P. (1999) Catabolic response profiles differbetween microorganisms grown in soils. Soil Biol Biochem31: 475–477.
Duarte, G.F., Rosado, A.S., Seldin, L., Keijzer-Wolters, A.C.,and van Elsas, J.D. (1998) Extraction of ribosomal RNAand genomic DNA from soil for studying the diversity of the indigenous bacterial community. J Microbiol Methods32: 21–29.
Dubey, H.D. (1968) Effect of soil moisture on nitrification. CanJ Microbiol 14: 1348–1350.
Edwards, U., Rogall, T., Blöcker, H., Emde, M., and Böttger,E.C. (1988) Isolation and complete nucleotide determina-
© 2002 Blackwell Science Ltd, Environmental Microbiology, 4, 361–373
372 A. S. Krave et al.
Stratification and seasonal stability of highly diverse bacterial communities 373
© 2002 Blackwell Science Ltd, Environmental Microbiology, 4, 361–373
tion of entire genes. Characterisation of a gene coding for16S ribosomal RNA. Nucleic Acids Res 17: 7843–7853.
Eichner, C.A., Erb, R.W., Timmis, K.N., and Wagner-Dobler,I. (1999) Thermal gradient gel electrophoresis analysis ofbioprotection from pollutant shocks in the activated sludgemicrobial community. Appl Environ Microbiol 65: 102–109.
Felske, A., Wolterink, A., VanLis, R., and Akkermans, A.D.L.(1998) Phylogeny of the main bacterial 16S rRNAsequences in Drentse A grassland soils (The Netherlands).Appl Environ Microbiol 64: 871–879.
Giambiagi, N., Rimolo, M., and Pirolo, T. (1993) Influence ofdrought on the production of mineral nitrogen in a typicalargiudol of the Pampas. Soil Biol Biochem 25: 101–108.
Griffiths, R.I., Whiteley, A.S., O’Donnell, A.G., and Bailey,M.J. (2000) Rapid method for coextraction of DNA andRNA from natural environments for analysis of ribosomalDNA- and rRNA-based microbial community composition.Appl Environ Microbiol 66: 5488–5491.
Gunadi, B., and Verhoef, H.A. (1993) The flow of nutrients in a Pinus merkusii forest plantation in Central Java. Thecontribution of soil animals. Eur J Soil Biol 29: 133–139.
Gunadi, B., Verhoef, H.A., and Bedaux, J.J.M. (1998) Sea-sonal dynamics of decomposition of coniferous leaf letterin a forest plantation (Pinus merkusii) in Central Java,Indonesia. Soil Biol Biochem 30: 845–852.
Hammel, K.E. (1997) Fungal degradation of lignin. In Drivenby Nature: Plant Litter Quality and Decomposition. Cadish,G., and Giller, K.E. (eds). Wallingford: CAB International,pp. 33–45.
Hu, S., and Van bruggen, A.H.C. (1997) Microbial dynamicsassociated with multiphasic decomposition of 14C-labeledcellulose in soil. Microb Ecol 33: 134–143.
Hughes, J.B., Hellmann, J.J., Ricketts, T.H., and Bohannan,B.J.M. (2001) Counting the uncountable: statistical ap-proaches to estimating microbial diversity. Appl EnvironMicrobiol 67: 4399–4406.
Jackson, C.R., Harper, J.P., Willoughby, D., Roden, E.E., andChurchill, P.F. (1997) A simple, efficient method for the separation of humic substances and DNA from environ-mental samples. Appl Environ Microbiol 63: 4993–4995.
Keeney, D.R., and Nelson, D.W. (1982) Nitrogen-inorganicforms. In Methods of Soil Analysis, Part 2, Chemical and Microbiological Methods. Page, A.L., Miller, D.R., andKeeney, D.R. (eds). Madison, WI: ASA and SSSA, pp.643–698.
Killham, K. (1990) Nitrification in coniferous forest soils. PlantSoil 128: 31–44.
Krave, A.S., Van Straalen, N.M., and Van Verseveld, H.W.(2002) Potential nitrification and factors influencing nitrifi-cation in pine forest and agricultural soils in Central Java,Indonesia. Pedobiologia (in press).
Laverman, A.M., Speksnijder, A.G.C.L., Braster, M.,Kowalchuk, G.A., Verhoef, H.A., and van Verseveld, H.W.(2001) Spatio-temporal stability of an ammonium oxidizingcommunity in a nitrogen-saturated forest soil. Microb Ecol42: 35–45.
Liesack, W., and Stackebrandt, E. (1992) Occurrence ofnovel groups of the domain bacteria as revealed by analy-
sis of genetic material isolated from an Australian terres-trial environment. J Bacteriol 174: 5072–5078.
Luizao, R.C.C., Bonde, T.A., and Rosswall, T. (1992) Seasonal variation of soil microbial biomass – the effectsof clearfelling a tropical rainforest and establishment ofpasture in the central Amazon. Soil Biol Biochem 24:805–813.
Miller, D.N., Bryant, J.E., Madsen, E.L., and Ghiorse, W.C.(1999) Evaluation and optimization of DNA extraction andpurification procedures for soil and sediment samples.Appl Environ Microbiol 65: 4715–4724.
Muyzer, G., Dewaal, E.C., and Uitterlinden, A.G. (1993) Profiling of complex microbial populations by denaturinggradient gel electrophoresis analysis of polymerase chainreaction-amplified genes coding for 16S rRNA. ApplEnviron Microbiol 59: 695–700.
Nüsslein, K., and Tiedje, J.M. (1998) Characterization of thedominant and rare members of a young Hawaiian soil bacterial community with small-subunit ribosomal DNAamplified from DNA fractionated on the basis of its guanine and cytosine composition. Appl Environ Microbiol64: 1283–1289.
Nüsslein, K., and Tiedje, J.M. (1999) Soil bacterial commu-nity shift correlated with change from forest to pasture vegetation in a tropical soil. Appl Environ Microbiol65: 3622–3626.
Rademaker, J.L.W., Louws, F.J., Rossbach, U., Vinuesa, P.,and de Bruijn, F.J. (1999) Computer-assisted patternanalysis of molecular fingerprints and database construc-tion. In Molecular Microbial Ecology Manual. Akkermans,A.D.L., van Elsas, J.D., and de Bruijn, F.J. (eds). Dor-drecht, The Netherlands: Kluwer Academic Publishers, pp. 7.1.3/1–7.1.3/33.
Röling, W.F.M., van Breukelen, B.M., Braster, M., Goeltom,M.T., Groen, J., and van Verseveld, H.W. (2000) Analysisof microbial communities in a landfill leachate pollutedaquifer using a newly developed method for anaerobicphysiological profiling and 16S rDNA based fingerprinting.Microb Ecol 40: 177–188.
Stackebrandt, E., and Goebel, B.M. (1994) A place for DNA–DNA reassociation and 16S ribosomal-RNA sequence-analysis in the present species definition in bacteriology.Int J Syst Bacteriol 44: 846–849.
Stackebrandt, E., Liesack, W., and Goebel, B.M. (1993) Bac-terial diversity in a soil sample from a subtropical Australianenvironment as determined by 16S rDNA Analysis. FASEBJ 7: 232–236.
Vink, K., and Purwanti, E.S. (1994) Population dynamics oftwo sympatric isopod species in a line forest in CentralJava, Indonesia. J Trop Ecol 10: 417–430.
Vitousek, P.M., Gosz, J.R., Grier, C.C., Melillo, J.M., andReiners, W.A. (1982) A comparative analysis of potentialnitrification and nitrate mobility in forest ecosystems. EcolMonog 52: 155–177.
von Wintzingerode, F., Gobel, U.B., and Stackebrandt, E.(1997) Determination of microbial diversity in environmen-tal samples: pitfalls of PCR-based rRNA analysis. FEMSMicrobiol Rev 21: 213–229.
Related Documents