January 2014 STRATEGY Saurabh Mukherjea, CFA, [email protected] Tel: +91 99877 85848 Analyst: Deep dives into five turnaround plays

Welcome message from author
This document is posted to help you gain knowledge. Please leave a comment to let me know what you think about it! Share it to your friends and learn new things together.
Transcript
January 2014
STRATEGY
Saurabh Mukherjea, CFA,[email protected]: +91 99877 85848
Analyst:
Deep dives into five turnaround plays
Strategy
January 15, 2014 Ambit Capital Pvt. Ltd. Page 2
CONTENTS
Deep dives into five “turnaround” plays…………………………………………… 3
Section 1: Turnarounds quantified…………………………………………………. 4
Section 2: A framework for identifying turnarounds…………………………….. 9
Appendix 1: A long list of ‘laggards’………………………………………………15
Section 3: Ashok Leyland……………………………………………………………17
Section 4: Bajaj Electricals…………………………………………………………. 35
Section 5: Britannia…………………………………………………………………. 48
Section 6: Bharti…………………………………………………………………….. 56
Section 7: Wipro…………………………………………………………………….. 65
Ambit Capital and / or its affiliates do and seek to do business including investment banking with companies covered in its research reports. As a result, investors should be aware that Ambit Capital may have a conflict of interest that could affect the objectivity of this report. Investors should not consider this report as the only factor in making their investment decision.
Strategy
THEMATIC January 15, 2014
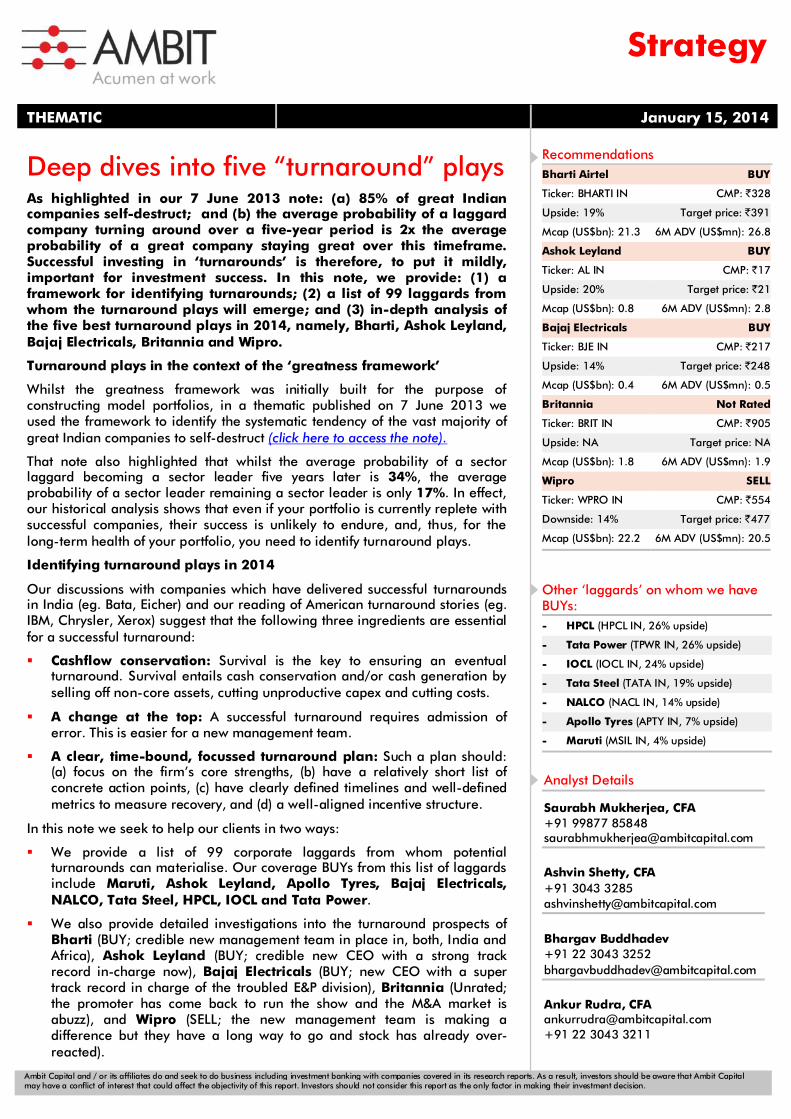
Deep dives into five “turnaround” plays As highlighted in our 7 June 2013 note: (a) 85% of great Indian companies self-destruct; and (b) the average probability of a laggard company turning around over a five-year period is 2x the average probability of a great company staying great over this timeframe. Successful investing in ‘turnarounds’ is therefore, to put it mildly, important for investment success. In this note, we provide: (1) a framework for identifying turnarounds; (2) a list of 99 laggards from whom the turnaround plays will emerge; and (3) in-depth analysis of the five best turnaround plays in 2014, namely, Bharti, Ashok Leyland, Bajaj Electricals, Britannia and Wipro.
Turnaround plays in the context of the ‘greatness framework’
Whilst the greatness framework was initially built for the purpose of constructing model portfolios, in a thematic published on 7 June 2013 we used the framework to identify the systematic tendency of the vast majority of great Indian companies to self-destruct (click here to access the note).
That note also highlighted that whilst the average probability of a sector laggard becoming a sector leader five years later is 34%, the average probability of a sector leader remaining a sector leader is only 17%. In effect, our historical analysis shows that even if your portfolio is currently replete with successful companies, their success is unlikely to endure, and, thus, for the long-term health of your portfolio, you need to identify turnaround plays.
Identifying turnaround plays in 2014
Our discussions with companies which have delivered successful turnarounds in India (eg. Bata, Eicher) and our reading of American turnaround stories (eg. IBM, Chrysler, Xerox) suggest that the following three ingredients are essential for a successful turnaround:
Cashflow conservation: Survival is the key to ensuring an eventual turnaround. Survival entails cash conservation and/or cash generation by selling off non-core assets, cutting unproductive capex and cutting costs.
A change at the top: A successful turnaround requires admission of error. This is easier for a new management team.
A clear, time-bound, focussed turnaround plan: Such a plan should: (a) focus on the firm’s core strengths, (b) have a relatively short list of concrete action points, (c) have clearly defined timelines and well-defined metrics to measure recovery, and (d) a well-aligned incentive structure.
In this note we seek to help our clients in two ways:
We provide a list of 99 corporate laggards from whom potential turnarounds can materialise. Our coverage BUYs from this list of laggards include Maruti, Ashok Leyland, Apollo Tyres, Bajaj Electricals, NALCO, Tata Steel, HPCL, IOCL and Tata Power.
We also provide detailed investigations into the turnaround prospects of Bharti (BUY; credible new management team in place in, both, India and Africa), Ashok Leyland (BUY; credible new CEO with a strong track record in-charge now), Bajaj Electricals (BUY; new CEO with a super track record in charge of the troubled E&P division), Britannia (Unrated; the promoter has come back to run the show and the M&A market is abuzz), and Wipro (SELL; the new management team is making a difference but they have a long way to go and stock has already over-reacted).
Recommendations Bharti Airtel BUY
Ticker: BHARTI IN CMP: ̀ 328
Upside: 19% Target price: ̀ 391
Mcap (US$bn): 21.3 6M ADV (US$mn): 26.8
Ashok Leyland BUY
Ticker: AL IN CMP: ̀ 17
Upside: 20% Target price: ̀ 21
Mcap (US$bn): 0.8 6M ADV (US$mn): 2.8
Bajaj Electricals BUY
Ticker: BJE IN CMP: ̀ 217
Upside: 14% Target price: ̀ 248
Mcap (US$bn): 0.4 6M ADV (US$mn): 0.5
Britannia Not Rated
Ticker: BRIT IN CMP: ̀ 905
Upside: NA Target price: NA
Mcap (US$bn): 1.8 6M ADV (US$mn): 1.9
Wipro SELL
Ticker: WPRO IN CMP: ̀ 554
Downside: 14% Target price: ̀ 477
Mcap (US$bn): 22.2 6M ADV (US$mn): 20.5
Other ‘laggards’ on whom we have BUYs: - HPCL (HPCL IN, 26% upside)
- Tata Power (TPWR IN, 26% upside)
- IOCL (IOCL IN, 24% upside)
- Tata Steel (TATA IN, 19% upside)
- NALCO (NACL IN, 14% upside)
- Apollo Tyres (APTY IN, 7% upside)
- Maruti (MSIL IN, 4% upside)
Analyst Details
Saurabh Mukherjea, CFA +91 99877 85848 [email protected]
Ashvin Shetty, CFA +91 3043 3285 [email protected]
Bhargav Buddhadev +91 22 3043 3252 [email protected]
Ankur Rudra, CFA [email protected] +91 22 3043 3211
Strategy
January 15, 2014 Ambit Capital Pvt. Ltd. Page 4
Section 1: Turnarounds quantified “At the heart of my approach, particularly in the Special Situations Fund, has been buying recovery or turnaround stocks at attractive valuations. These are normally businesses that have been doing poorly, perhaps for some time. Many investors, in my experience, don’t like to be associated with businesses that are not doing well and can miss when a change for the better occurs. This often involves changes in the management team, a restructuring or even a refinancing (or a combination of these)…A great sign often comes when analysts give up on a company…”
-Anthony Bolton, “Investing Against the Tide: Lessons from a Life Running Money” (2009)
The ‘greatness’ framework
Over the last three years, we have used our ‘greatness’ framework (shown in Exhibits 1 and 2) to identify structurally sound businesses in India and these firms have gone on to become parts of our very successful tenbagger portfolios (click here for the latest iteration published on 26 November 2013) and our Good & Clean portfolios (click here for the latest iteration published on 23 September 2013).
The greatness framework essentially hinges on using publicly available historical data to assess which firms have, over a sustained period of time (FY08-13), been able to consistently:
(a) Invest capital; (b) Turn investment into sales; (c) Turn sales into profit; (d) Turn profit into balance sheet strength; (e) Turn all of that into free cash flow; and (f) Invest free cash flows again.
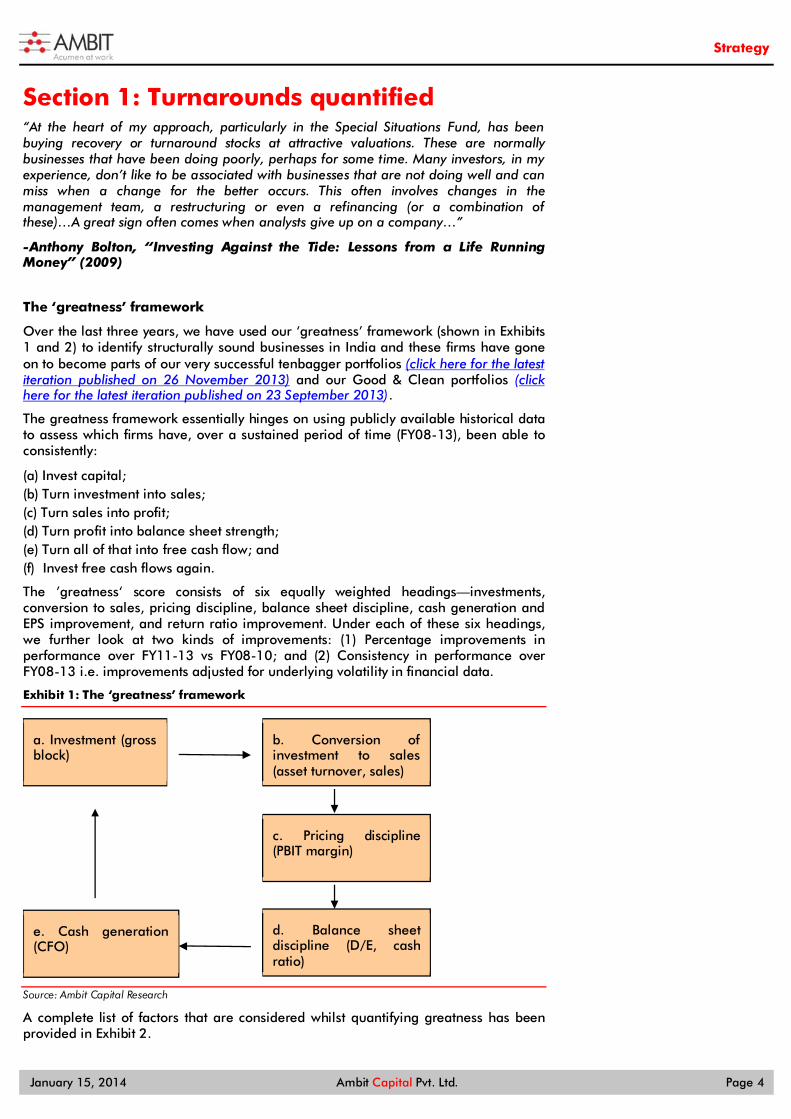
The ’greatness‘ score consists of six equally weighted headings—investments, conversion to sales, pricing discipline, balance sheet discipline, cash generation and EPS improvement, and return ratio improvement. Under each of these six headings, we further look at two kinds of improvements: (1) Percentage improvements in performance over FY11-13 vs FY08-10; and (2) Consistency in performance over FY08-13 i.e. improvements adjusted for underlying volatility in financial data.
Exhibit 1: The ‘greatness’ framework
Source: Ambit Capital Research
A complete list of factors that are considered whilst quantifying greatness has been provided in Exhibit 2.
b. Conversion of investment to sales (asset turnover, sales)
c. Pricing discipline (PBIT margin)
d. Balance sheet discipline (D/E, cash ratio)
a. Investment (gross block)
e. Cash generation (CFO)
Strategy
January 15, 2014 Ambit Capital Pvt. Ltd. Page 5
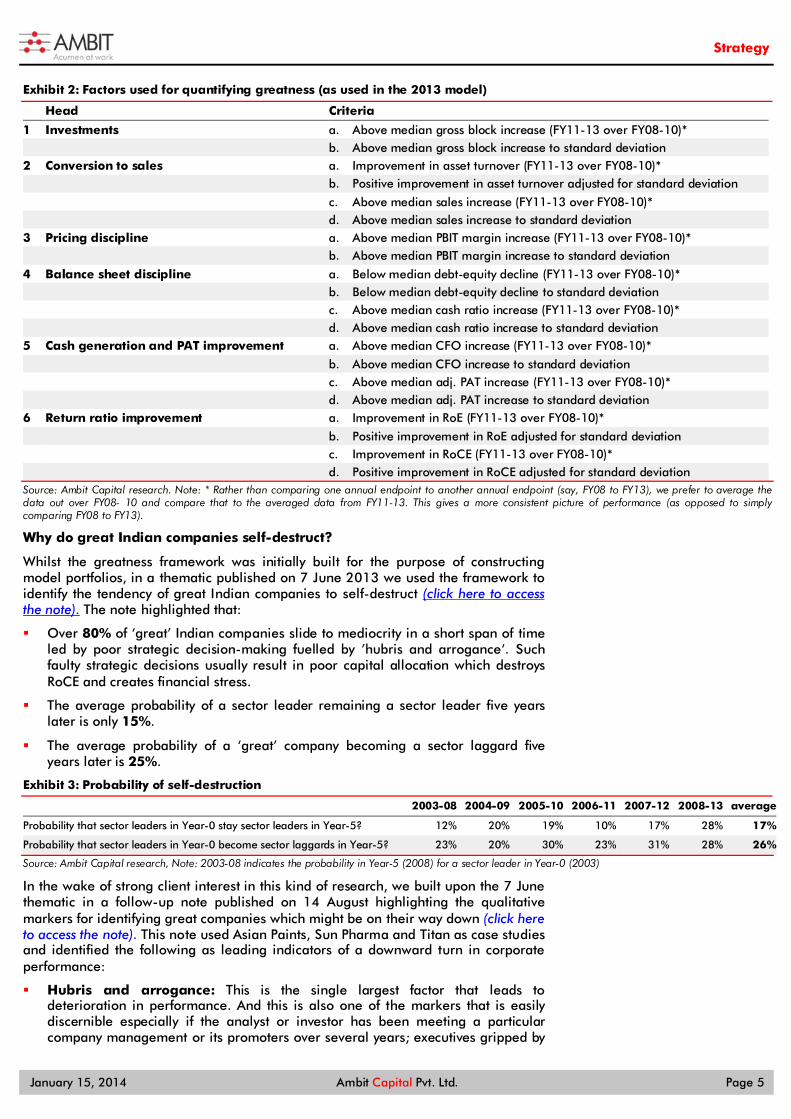
Exhibit 2: Factors used for quantifying greatness (as used in the 2013 model)
Head Criteria
1 Investments a. Above median gross block increase (FY11-13 over FY08-10)* b. Above median gross block increase to standard deviation 2 Conversion to sales a. Improvement in asset turnover (FY11-13 over FY08-10)* b. Positive improvement in asset turnover adjusted for standard deviation
c. Above median sales increase (FY11-13 over FY08-10)* d. Above median sales increase to standard deviation 3 Pricing discipline a. Above median PBIT margin increase (FY11-13 over FY08-10)* b. Above median PBIT margin increase to standard deviation
4 Balance sheet discipline a. Below median debt-equity decline (FY11-13 over FY08-10)* b. Below median debt-equity decline to standard deviation c. Above median cash ratio increase (FY11-13 over FY08-10)* d. Above median cash ratio increase to standard deviation 5 Cash generation and PAT improvement a. Above median CFO increase (FY11-13 over FY08-10)*
b. Above median CFO increase to standard deviation c. Above median adj. PAT increase (FY11-13 over FY08-10)* d. Above median adj. PAT increase to standard deviation 6 Return ratio improvement a. Improvement in RoE (FY11-13 over FY08-10)*
b. Positive improvement in RoE adjusted for standard deviation c. Improvement in RoCE (FY11-13 over FY08-10)* d. Positive improvement in RoCE adjusted for standard deviation Source: Ambit Capital research. Note: * Rather than comparing one annual endpoint to another annual endpoint (say, FY08 to FY13), we prefer to average the data out over FY08- 10 and compare that to the averaged data from FY11-13. This gives a more consistent picture of performance (as opposed to simply comparing FY08 to FY13).
Why do great Indian companies self-destruct?
Whilst the greatness framework was initially built for the purpose of constructing model portfolios, in a thematic published on 7 June 2013 we used the framework to identify the tendency of great Indian companies to self-destruct (click here to access the note). The note highlighted that:
Over 80% of ‘great’ Indian companies slide to mediocrity in a short span of time led by poor strategic decision-making fuelled by ’hubris and arrogance‘. Such faulty strategic decisions usually result in poor capital allocation which destroys RoCE and creates financial stress.
The average probability of a sector leader remaining a sector leader five years later is only 15%.
The average probability of a ‘great’ company becoming a sector laggard five years later is 25%.
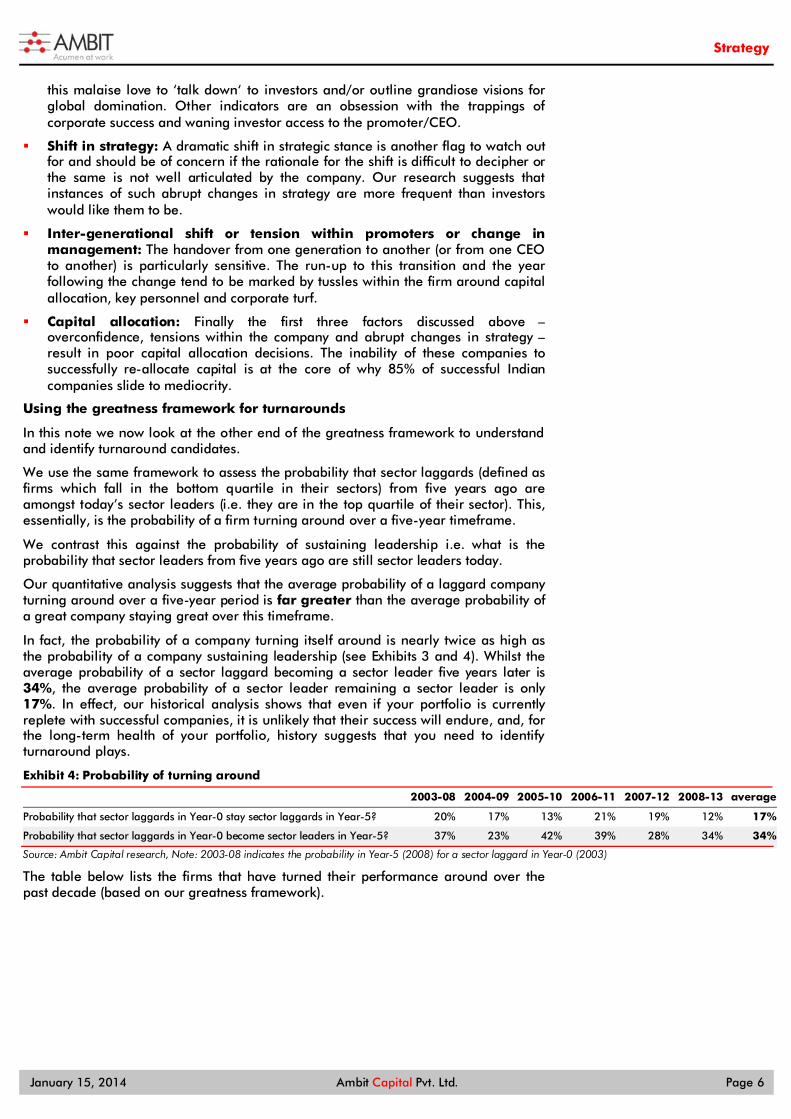
Exhibit 3: Probability of self-destruction
2003-08 2004-09 2005-10 2006-11 2007-12 2008-13 average
Probability that sector leaders in Year-0 stay sector leaders in Year-5? 12% 20% 19% 10% 17% 28% 17%
Probability that sector leaders in Year-0 become sector laggards in Year-5? 23% 20% 30% 23% 31% 28% 26%
Source: Ambit Capital research, Note: 2003-08 indicates the probability in Year-5 (2008) for a sector leader in Year-0 (2003)
In the wake of strong client interest in this kind of research, we built upon the 7 June thematic in a follow-up note published on 14 August highlighting the qualitative markers for identifying great companies which might be on their way down (click here to access the note). This note used Asian Paints, Sun Pharma and Titan as case studies and identified the following as leading indicators of a downward turn in corporate performance:
Hubris and arrogance: This is the single largest factor that leads to deterioration in performance. And this is also one of the markers that is easily discernible especially if the analyst or investor has been meeting a particular company management or its promoters over several years; executives gripped by
Strategy
January 15, 2014 Ambit Capital Pvt. Ltd. Page 6
this malaise love to ‘talk down‘ to investors and/or outline grandiose visions for global domination. Other indicators are an obsession with the trappings of corporate success and waning investor access to the promoter/CEO.
Shift in strategy: A dramatic shift in strategic stance is another flag to watch out for and should be of concern if the rationale for the shift is difficult to decipher or the same is not well articulated by the company. Our research suggests that instances of such abrupt changes in strategy are more frequent than investors would like them to be.
Inter-generational shift or tension within promoters or change in management: The handover from one generation to another (or from one CEO to another) is particularly sensitive. The run-up to this transition and the year following the change tend to be marked by tussles within the firm around capital allocation, key personnel and corporate turf.
Capital allocation: Finally the first three factors discussed above – overconfidence, tensions within the company and abrupt changes in strategy – result in poor capital allocation decisions. The inability of these companies to successfully re-allocate capital is at the core of why 85% of successful Indian companies slide to mediocrity.
Using the greatness framework for turnarounds
In this note we now look at the other end of the greatness framework to understand and identify turnaround candidates.
We use the same framework to assess the probability that sector laggards (defined as firms which fall in the bottom quartile in their sectors) from five years ago are amongst today’s sector leaders (i.e. they are in the top quartile of their sector). This, essentially, is the probability of a firm turning around over a five-year timeframe.
We contrast this against the probability of sustaining leadership i.e. what is the probability that sector leaders from five years ago are still sector leaders today.
Our quantitative analysis suggests that the average probability of a laggard company turning around over a five-year period is far greater than the average probability of a great company staying great over this timeframe.
In fact, the probability of a company turning itself around is nearly twice as high as the probability of a company sustaining leadership (see Exhibits 3 and 4). Whilst the average probability of a sector laggard becoming a sector leader five years later is 34%, the average probability of a sector leader remaining a sector leader is only 17%. In effect, our historical analysis shows that even if your portfolio is currently replete with successful companies, it is unlikely that their success will endure, and, for the long-term health of your portfolio, history suggests that you need to identify turnaround plays.
Exhibit 4: Probability of turning around
2003-08 2004-09 2005-10 2006-11 2007-12 2008-13 average
Probability that sector laggards in Year-0 stay sector laggards in Year-5? 20% 17% 13% 21% 19% 12% 17%
Probability that sector laggards in Year-0 become sector leaders in Year-5? 37% 23% 42% 39% 28% 34% 34%
Source: Ambit Capital research, Note: 2003-08 indicates the probability in Year-5 (2008) for a sector laggard in Year-0 (2003)
The table below lists the firms that have turned their performance around over the past decade (based on our greatness framework).
Strategy
January 15, 2014 Ambit Capital Pvt. Ltd. Page 7
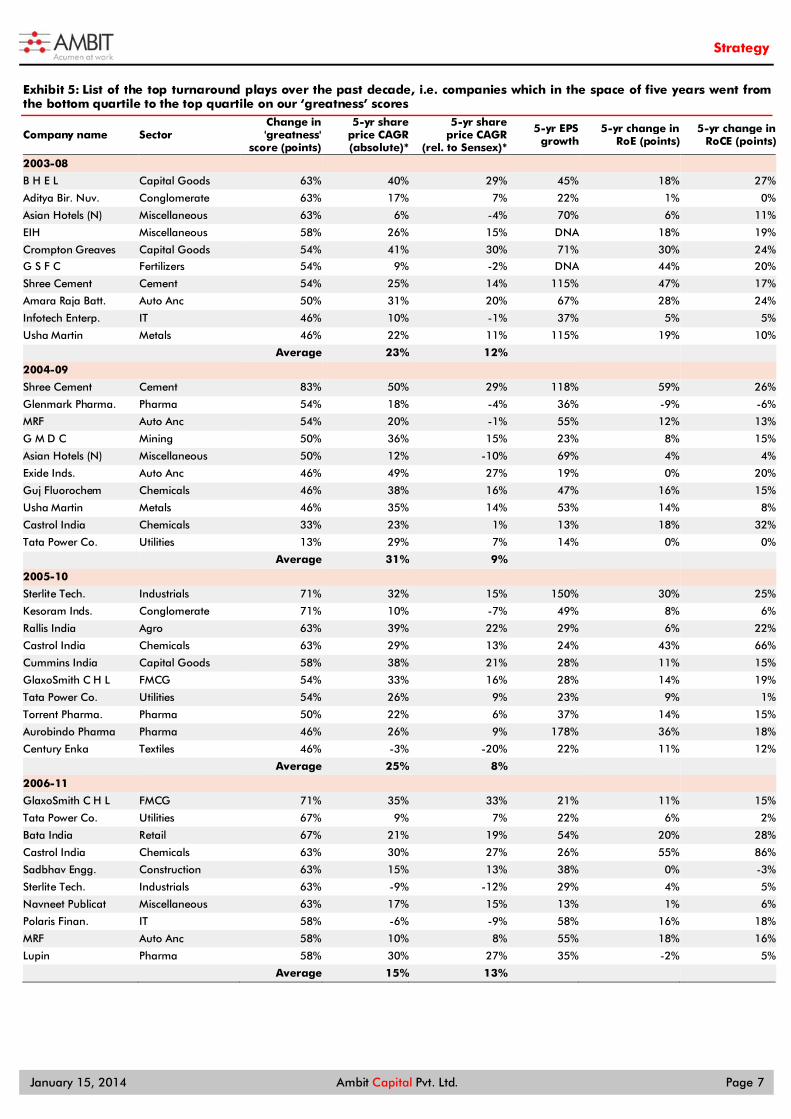
Exhibit 5: List of the top turnaround plays over the past decade, i.e. companies which in the space of five years went from the bottom quartile to the top quartile on our ‘greatness’ scores
Company name Sector Change in 'greatness'
score (points)
5-yr share price CAGR (absolute)*
5-yr share price CAGR
(rel. to Sensex)*
5-yr EPS growth
5-yr change in RoE (points)
5-yr change in RoCE (points)
2003-08 B H E L Capital Goods 63% 40% 29% 45% 18% 27%
Aditya Bir. Nuv. Conglomerate 63% 17% 7% 22% 1% 0%
Asian Hotels (N) Miscellaneous 63% 6% -4% 70% 6% 11%
EIH Miscellaneous 58% 26% 15% DNA 18% 19%
Crompton Greaves Capital Goods 54% 41% 30% 71% 30% 24%
G S F C Fertilizers 54% 9% -2% DNA 44% 20%
Shree Cement Cement 54% 25% 14% 115% 47% 17%
Amara Raja Batt. Auto Anc 50% 31% 20% 67% 28% 24%
Infotech Enterp. IT 46% 10% -1% 37% 5% 5%
Usha Martin Metals 46% 22% 11% 115% 19% 10%
Average 23% 12% 2004-09
Shree Cement Cement 83% 50% 29% 118% 59% 26%
Glenmark Pharma. Pharma 54% 18% -4% 36% -9% -6%
MRF Auto Anc 54% 20% -1% 55% 12% 13%
G M D C Mining 50% 36% 15% 23% 8% 15%
Asian Hotels (N) Miscellaneous 50% 12% -10% 69% 4% 4%
Exide Inds. Auto Anc 46% 49% 27% 19% 0% 20%
Guj Fluorochem Chemicals 46% 38% 16% 47% 16% 15%
Usha Martin Metals 46% 35% 14% 53% 14% 8%
Castrol India Chemicals 33% 23% 1% 13% 18% 32%
Tata Power Co. Utilities 13% 29% 7% 14% 0% 0%
Average 31% 9% 2005-10
Sterlite Tech. Industrials 71% 32% 15% 150% 30% 25%
Kesoram Inds. Conglomerate 71% 10% -7% 49% 8% 6%
Rallis India Agro 63% 39% 22% 29% 6% 22%
Castrol India Chemicals 63% 29% 13% 24% 43% 66%
Cummins India Capital Goods 58% 38% 21% 28% 11% 15%
GlaxoSmith C H L FMCG 54% 33% 16% 28% 14% 19%
Tata Power Co. Utilities 54% 26% 9% 23% 9% 1%
Torrent Pharma. Pharma 50% 22% 6% 37% 14% 15%
Aurobindo Pharma Pharma 46% 26% 9% 178% 36% 18%
Century Enka Textiles 46% -3% -20% 22% 11% 12%
Average 25% 8% 2006-11
GlaxoSmith C H L FMCG 71% 35% 33% 21% 11% 15%
Tata Power Co. Utilities 67% 9% 7% 22% 6% 2%
Bata India Retail 67% 21% 19% 54% 20% 28%
Castrol India Chemicals 63% 30% 27% 26% 55% 86%
Sadbhav Engg. Construction 63% 15% 13% 38% 0% -3%
Sterlite Tech. Industrials 63% -9% -12% 29% 4% 5%
Navneet Publicat Miscellaneous 63% 17% 15% 13% 1% 6%
Polaris Finan. IT 58% -6% -9% 58% 16% 18%
MRF Auto Anc 58% 10% 8% 55% 18% 16%
Lupin Pharma 58% 30% 27% 35% -2% 5%
Average 15% 13%

Strategy
January 15, 2014 Ambit Capital Pvt. Ltd. Page 8
Company name Sector Change in 'greatness'
score (points)
5-yr share price CAGR (absolute)*
5-yr share price CAGR
(rel. to Sensex)*
5-yr EPS growth
5-yr change in RoE (points)
5-yr change in RoCE (points)
2007-12
Cadila Health. Pharma 75% 36% 37% 20% 0% 1%
GlaxoSmith C H L FMCG 75% 39% 40% 22% 9% 13%
Castrol India Chemicals 71% 27% 28% 25% 49% 70%
Guj Gas Company Utilities 71% 12% 13% 22% 12% 11%
Eicher Motors Auto 67% 48% 49% 50% 9% 30%
Bayer Crop Sci. Fertilizers 58% 24% 25% 20% 8% 10%
MRF Auto Anc 50% 12% 13% 51% -1% 1%
ITC FMCG 50% 22% 23% 16% 6% 10%
Polaris Finan. IT 46% -2% -1% 17% 0% 1%
Mahindra Life. Realty 46% -14% -13% 48% 7% 6%
Average 20% 21% 2008-13
Eicher Motors Auto 75% 84% 67% 44% 5% 9%
Bayer Crop Sci.# Fertilizers 75% 51% 34% 39% 8% 13%
Ipca Labs. Pharma 75% 58% 41% 19% -3% 3%
Ranbaxy Labs. Pharma 67% 12% -5% 2% 4% 12%
Radico Khaitan FMCG 42% 15% -2% 16% 2% 2%
Carborundum Uni. Industrials 42% 28% 11% -6% -10% -16%
G M D C Mining 42% 23% 6% 18% -1% 13%
Puravankar.Proj. Realty 38% 10% -7% 1% -20% 0%
Oracle Fin.Serv. IT 38% 48% 31% 21% 0% 6%
Redington India IT 38% 26% 9% 19% 2% 0%
Average 36% 19% Source: Bloomberg, Capitaline, Ambit Capital research. Note: 2003-08 indicates that based on 2003 scores, these firms were in the bottom quartile of their sector whilst based on 2008 scores, they fell in the top quartile of their respective sector. * Share price CAGR has been measured on a calendar-year basis over the five year period. # We have used five-year profit CAGR instead of EPS CAGR for Bayer CropScience due to extra-ordinary profits in 2013.
Strategy
January 15, 2014 Ambit Capital Pvt. Ltd. Page 9
Section 2: A framework for identifying turnarounds "When everything about you or your business gets really complicated and overwhelming, you've got to do three things. First, get yourself or the business out of the ditch (i.e, survival, first and foremost). Second, find out how you or the business got into the ditch (recognise the signs). Third, make sure you do whatever it takes so you or the business don't go into the ditch again (put a long-term plan in place)."
-Anne Mulcahy, former CEO of Xerox
Clearly, everybody loves a good turnaround. Not only do the CEOs at the heart of it become legends, but the employees, the shareholders, the suppliers, and the lenders also win.
Whilst turnarounds find a prominent place in business folklore, to help our clients make money from such situations, we need to understand how laggards turn themselves into leaders. Although business literature does not appear to have an established formula for identifying turnarounds, business leaders have a reasonable amount of consensus about the basic ingredients for a turnaround. Our discussions with companies which have delivered successful turnarounds in India (eg. Bata, Eicher) and our reading of American turnaround stories (eg. IBM, Chrysler, Xerox) suggest that the following three ingredients are essential for a successful turnaround.
Ingredient 1: Cash flow conservation
“The fourth action that we kicked off that summer represented a scramble to sell unproductive assets and raise cash. Only a handful of people understand how precariously close IBM came to running out of cash in 1993. Whether we would have had to file for bankruptcy, I can’t say. There were certainly lots of assets that could be sold to make the company solvent again. The issue was: Could that be done before we turned down that horrible spiral again that companies enter when their cash flow shrinks and their creditors are no longer willing to stand behind them…In July [1993] we announced that we would cut our annual dividend to shareholders from $2.16 to $1.”
– IBM’s ex-CEO, Lou Gerstner, in his biography, “Who says Elephants Can’t Dance?” (2002)
In former IBM CEO Lou Gerstner’s celebrated account of how he turned around IBM, what is striking is just how much of his first year was spent focusing on turning around the cash flow situation (rather than thinking through big hairy audacious goals). Other than cutting the dividend, as mentioned in the quote given above, in 1993 Gerstner:
Sold much of IBM’s corporate airplane fleet;
Sold the corporate headquarters in New York City;
Sold the bulk of the firm’s art collection; and
Sold IBM’s Federal Systems company which did work for the US Government.
Other turnaround narratives penned by legendary CEOs (eg. Lee Iacocca’s fabled account of turning around Chrysler) also focus on solving the cash crunch as a matter of priority in a turnaround situation.
The same point of view is echoed by Anne Mulcahy, the former CEO of Xerox, who is quoted at the beginning of this section. She says that the first step towards turning around a company is ensuring survival.
Such a survival plan, we believe, is one which should capture the following two aspects. Firstly, in order to bring the business out of the ditch, it should focus on cash
Strategy
January 15, 2014 Ambit Capital Pvt. Ltd. Page 10
conservation and/or cash flow generation. And secondly, it should aim at monetising unproductive assets and reducing unjustified capex so that the free cash flows generated can be utilised in reducing the leverage (and thus avoiding unwarranted interest payments on the same).
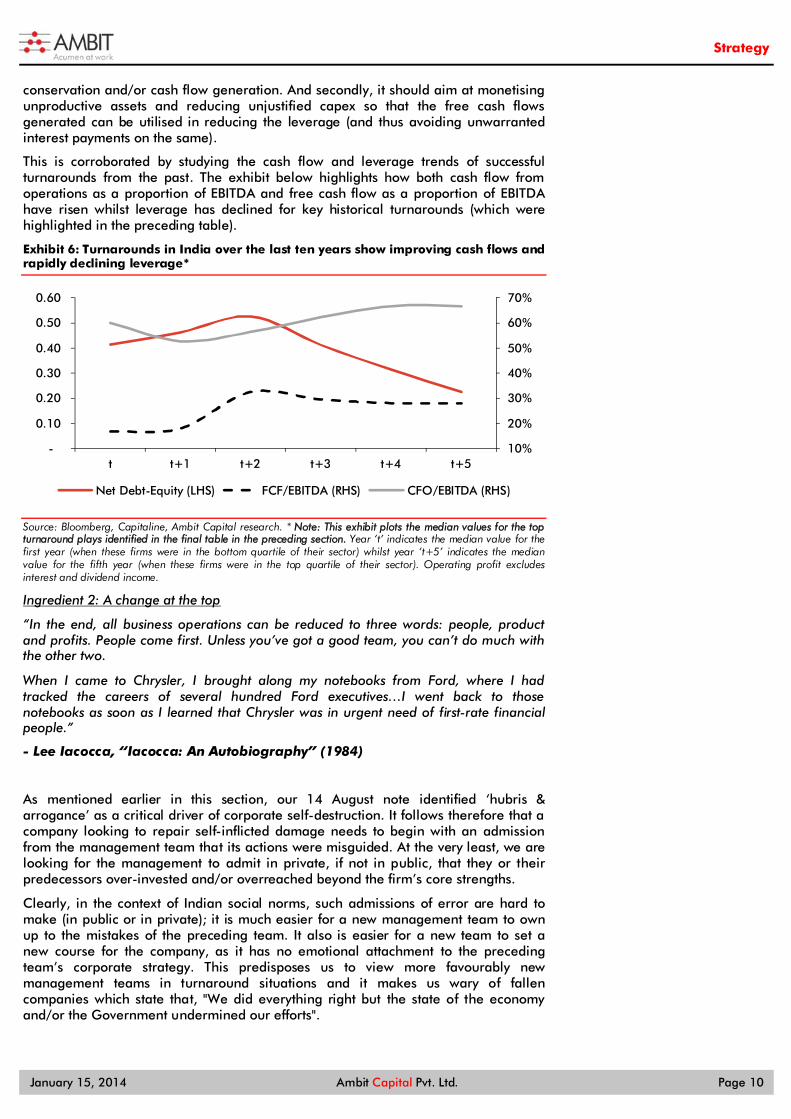
This is corroborated by studying the cash flow and leverage trends of successful turnarounds from the past. The exhibit below highlights how both cash flow from operations as a proportion of EBITDA and free cash flow as a proportion of EBITDA have risen whilst leverage has declined for key historical turnarounds (which were highlighted in the preceding table).
Exhibit 6: Turnarounds in India over the last ten years show improving cash flows and rapidly declining leverage*
Source: Bloomberg, Capitaline, Ambit Capital research. * Note: This exhibit plots the median values for the top turnaround plays identified in the final table in the preceding section. Year ‘t’ indicates the median value for the first year (when these firms were in the bottom quartile of their sector) whilst year ‘t+5’ indicates the median value for the fifth year (when these firms were in the top quartile of their sector). Operating profit excludes interest and dividend income.
Ingredient 2: A change at the top
“In the end, all business operations can be reduced to three words: people, product and profits. People come first. Unless you’ve got a good team, you can’t do much with the other two.
When I came to Chrysler, I brought along my notebooks from Ford, where I had tracked the careers of several hundred Ford executives…I went back to those notebooks as soon as I learned that Chrysler was in urgent need of first-rate financial people.”
- Lee Iacocca, “Iacocca: An Autobiography” (1984)
As mentioned earlier in this section, our 14 August note identified ‘hubris & arrogance’ as a critical driver of corporate self-destruction. It follows therefore that a company looking to repair self-inflicted damage needs to begin with an admission from the management team that its actions were misguided. At the very least, we are looking for the management to admit in private, if not in public, that they or their predecessors over-invested and/or overreached beyond the firm’s core strengths.
Clearly, in the context of Indian social norms, such admissions of error are hard to make (in public or in private); it is much easier for a new management team to own up to the mistakes of the preceding team. It also is easier for a new team to set a new course for the company, as it has no emotional attachment to the preceding team’s corporate strategy. This predisposes us to view more favourably new management teams in turnaround situations and it makes us wary of fallen companies which state that, "We did everything right but the state of the economy and/or the Government undermined our efforts".
10%
20%
30%
40%
50%
60%
70%
-
0.10
0.20
0.30
0.40
0.50
0.60
t t+1 t+2 t+3 t+4 t+5
Net Debt-Equity (LHS) FCF/EBITDA (RHS) CFO/EBITDA (RHS)

Strategy
January 15, 2014 Ambit Capital Pvt. Ltd. Page 11
Ingredient 3: A clear, time-bound turnaround plan focusing on the company’s core strengths
“Truly great companies lay out strategies that are believable and executable. Good strategies are long on detail and short on vision.”
– IBM’s legendary ex-CEO, Lou Gerstner, in his biography, “Who says Elephants Can’t Dance?” (2002)
“The best recovery stocks in my experience are those where the new management comes in who can demonstrate that the company in question lags behind its peers of a number of fronts and they have a clear plan…to return it to performing in-line or better than its competitors. If these factors are measurable so much the better…”
-Anthony Bolton, “Investing Against the Tide: Lessons from a Life Running Money” (2009)
Once you have a new CEO in place and the CEO is willing to discuss with investors his/her strategy, our reading of successful turnarounds suggests that four key elements are worth looking out for in the new CEO’s plan:
Focus on core business: As we have highlighted in our 7 June note, ’How Great Indian Companies Self-Destruct‘, the most common cause of a company wrecking its financials is the pursuit of a wide variety of initiatives (new markets, new geographies, new strategy, etc). Hence, it follows that the path to salvation has to begin with a re-focus on the company’s core business and core strengths.
Clarity: Given that cash is scarce in turnaround situations and time is of the essence (as the cash reserve depletes on a weekly basis), the CEO needs to have a relatively short list of action points with ideally no more than three critical initiatives (eg. selling non-core assets, re-gaining market share in the core product, and reducing manufacturing costs) to drive the turnaround. Beyond the fact that a short list of actions is more tractable to execute, such a list, if reinforced by analysis from the CEO showing how it addresses the firm’s key shortcomings, suggests that he/she has understood and identified the key issues.
Specificity: As is the case with any business plan, there needs to be clearly defined timelines for delivery and well-defined metrics (either financial or operational) which will serve as milestones on the path to recovery. The more specific the management’s diagnosis of the problem at hand, the more specific the KPIs and milestones for improvement (eg. Debt:Equity, CFO, and FCF), and the easier it becomes to have faith in the plan.
Incentive alignment: In the Indian context where promoters usually control most of the equity and the professional CEOs do not begin with large equity stakes, it is important to understand how the CEO and his core team stand to benefit from turning around the company. Beyond profit-linked pay, which is available even in normal circumstances, does the core team have ESOPs to both incentivise them and lock them in for a period of 4-5 years?
So what are the turnaround plays to focus on?
We have provided a list 99 stocks which are the superset of stocks in the BSE500 from which turnaround plays are most likely to emerge. These stocks – shown in Appendix 1 on page 15 – are the laggards in their sectors (i.e. the bottom quartile performers in every sector based on fundamental performance over FY08-13). History tells that from this long list of laggards, around a third of the firms will become sector leaders (i.e. the top quartile firms) five years hence. The question is ‘which ones?’
From the firms mentioned in Appendix 1, we have bottom-up BUY recommendations on:
Maruti Suzuki (TP `1,850, 4% upside): We expect Maruti to largely retain its market share in the domestic passenger vehicle space due to: (a) the company’s sustained competitive edge around brand, cost of ownership, and distribution;

Strategy
January 15, 2014 Ambit Capital Pvt. Ltd. Page 12
and (b) first-mover advantage in the higher-growth rural markets. Despite several new high-profile launches in the last 6-8 months (Honda Amaze, Ford Ecosport and Hyundai Grand i10), Maruti has been able to maintain (and in fact expand) its market share (42.8% in 3QFY14 vs 40.7% in 2QFY14 and 39.3% in 1QFY14). Given Maruti’s rising prominence for Suzuki (26% of revenues and nearly 40% of operating profits), we also expect increasing focus from Suzuki in terms of the number and frequency of launches going forward, which should again help Maruti from a competition perspective.
Apollo Tyres (TP `125, 7% upside): Based on our negative stance of Apollo’s Cooper Tire acquisition, we believe the termination of the deal is significantly positive for Apollo’s shareholders. With rubber prices remaining benign, we believe Apollo Tyres is poised to record strong net earnings growth in the coming quarters. The stock is trading at an attractive valuation of 7.1x FY15 consensus net earnings, at a discount of 5% to the historical average.
Tata Steel (TP `444, 19% upside): We reiterate our BUY stance on Tata Steel due to the rising proportion of the India business in the overall sales mix and increasing comfort over European volumes and margins. Despite flattish domestic steel demand growth in 9MFY14, Tata Steel has reported a volume growth of 17%, as it has gained market share from smaller producers. Our DCF model gives a TP of `444 (15% upside), which implies an FY15 P/B of 0.8x (eight-year average of 1.3x) and EV/EBITDA (adjusted for CWIP and non-core investments of ~`190bn) of 5.9x (eight-year average of 5.7x). The stock is currently trading at an FY15 adjusted EV/EBITDA of 5.5x, at a 9% discount to its historical average of 5.7x.
NALCO (TP `42, 14% upside): Our BUY stance on Nalco is driven by the company’s strategic decision to reduce exposure towards aluminium, its rising exposure towards the high-margin alumina segment and its strong balance sheet (cash/share of `19, 50% of CMP). At CMP, Nalco is trading at FY15 EV/EBITDA of 3.9x, at a sharp discount to its eight-year average of 7.0x. Nalco is trading at an FY15 P/B of 0.8x, which appears to be in line with peers. However, Nalco has a cash/share of `19 and on an ex-cash basis, Nalco is trading at a P/B of 0.6x, cheaper than its peers which are trading at 0.7x.
HPCL (TP `276, 26% upside): The sharp INR weakness has diluted the impact of fuel price reforms, and thus our FY14 fuel under-recovery assumption continues to be high (at `1,346bn vs `1,610bn in FY13) but is likely to start declining during FY15/FY16 (to `836bn/`615bn). Factoring in higher interest costs and forex losses (on foreign currency debt), we expect HPCL’s RoE to continue to be depressed in FY14 (3.7% in FY14 vs 1.3% in FY14) but likely to start improving in FY15/16 (to 7.7%/7.5% respectively).
However, HPCL is trading at trough valuations of FY14 P/B of 0.5x (last five-year average of 0.8x), factoring in bear-case assumptions of INR/USD at `65 and no more fuel price increases in FY14-15. We maintain our BUY stance on HPCL on the back of: (a) HPCL’s stock price factoring in near bear-case valuations, (b) our expectations of fuel price increases, (c) our houseview of `56-58 being INR’s fundamental value, and (d) an unlikely switchover to export parity. Key catalysts: (a) Stabilisation of INR and/or moderation in crude price, (b) non-implementation of export parity pricing, and (c) continued monthly diesel price increase. Key risks: (a) Government stake sale in IOCL at steep discount to the current price, (b) Further INR weakness and/or rise in crude prices, (c) implementation of export parity pricing, and (d) derailment of fuel reforms.
IOCL (TP `255, 24% upside): The sharp INR weakness has diluted the impact of fuel price reforms, and thus our FY14 fuel under-recovery assumption continues to be high (at `1,346bn vs `1,610bn in FY13) but is likely to start declining during FY15/FY16 (to `836bn/`615bn). Factoring in higher interest costs and forex losses (on foreign currency debt), we expect IOCL’s RoE to continue to be depressed in FY14 (6.5% in FY14 vs 5.7% in FY14) but likely to begin improving in FY15/16 (to 11.0%/11.4% respectively).

Strategy
January 15, 2014 Ambit Capital Pvt. Ltd. Page 13
However, IOCL is trading at life-time low valuations of FY14 P/B of 0.7x (last five-year average of 1.2x), factoring in bear-case assumptions of INR at `65 and no more fuel price increases in FY14-15. We reiterate our BUY stance on IOCL given: (a) our house view of the INR’s fundamental value of `56-58, (b) our expectation of fuel price increases, and (c) an unlikely complete switchover to export parity pricing. Key catalysts: (a) Stabilisation of INR and/or moderation in crude price, (b) non-implementation of export parity pricing, and (c) continued monthly diesel price increases. Key risks: (a) Government stake sale in IOCL at steep discount to the current price, (b) Further INR weakness and/or rise in crude prices, (c) implementation of export parity pricing, and (d) derailment of fuel reforms.
Tata Power (TP `98, 26% upside): Tata Power is a combination of superb execution and minimal exposure to merchant power and 100% assured fuel supply. This coupled with least exposure to the weakest SEBs (only 15% of exposure is to weak SEBs) augurs well for the company. Incidentally, Tata Power is the best placed on our competitive matrix which maps the operational and the upcoming projects for IPPs across fuel and offtake. The recent recommendation of the Deepak Parekh Committee of awarding a compensatory tariff to Tata Power over and above the existing PPA tariff is the biggest catalyst for the stock’s re-rating. If these recommendations are accepted, then our target price is likely to increase to `109 per share from 98 per share. At CMP, the stock is trading at 1.3x FY15 P/B which is broadly in line with its peers. However, this seems unjustified given that the firm is the beast placed IPP having 100% fuel linkage, 92% of offtake tied up in long term PPA and stellar execution track record.
Ashok Leyland (TP `21, 20% upside): Although demand for medium and heavy commercial vehicles (MHCVs) would remain weak in the near term (i.e. FY14), we expect a demand recovery in FY15 and 15% volume CAGR over FY14-16E given soft comps in FY13/FY14 (FY14 domestic MHCV industry volumes likely to decline 44% over FY12 levels) and our expectation of an economic recovery in the medium term. These factors should positively affect Ashok Leyland's revenues and margin recovery from FY15 (8.0% vs. 2.5% in FY14). We expect rising competition in MHCVs to have a limited impact on Ashok Leyland. More details on this company are on page 17 of this note.
Bajaj Electricals (TP `248, 14% upside): Bajaj Electricals’ E&P business would likely turn profitable from 4QFY14 onwards, due to better execution of new projects, which have been taken at reasonable margins (~7-8%). The new management under Mr Rakesh Markhedkar has been doing a good job. They have not only strengthened the operational team but also streamlined and institutionalised the monitoring process of each of the new sites on a weekly basis. Emphasis now is on cash collection vs taking new orders and just focussing on booking revenues earlier. Also, pre-qualification norms have been tightened, thereby attracting only serious players. (In the last nine months, KEC, Kalpataru, Jyoti and Bajaj Electricals have won many orders.) Also, some rationality on bidding appears to have dawned given the reducing gap between the L1 and the L2 player.
Assuming a negative `35/share value for the E&P business, BJE’s consumer business is trading at 15.0x FY15 EPS of `17. This is at a 40% discount to Havells’ FY15 P/E despite higher pre-tax RoCE (90% vs Havells’ 50%) and higher EPS CAGR over FY14-16 (18% vs Havells’ 15%). With the E&P business likely to turn around in FY15, we expect BJE’s P/E to be re-rated, as concerns abate over the diversion of cash generated by the consumer business to E&P. We have a target price of `248/share. More details on this company are on page 35 of this note.
Britannia is another firm mentioned in the list of laggards shown in Appendix 1. We will be initiating coverage on this company in the coming months. Whilst Britannia’s recent management changes and margin expansion has excited the stock markets, we believe that the euphoria around Britannia is flattering to deceive, as: (a) the recent margin expansion has been due to temporary input cost factors; (b) the company has been unable to find competent leadership post
Strategy
January 15, 2014 Ambit Capital Pvt. Ltd. Page 14
Sunil Alagh; and (c) the entry of Kraft over the next few months would pose a huge threat. That being said, Britannia does look like a takeover prospect. Page 48 looks at Britannia’s turnaround prospects in greater detail.
The two other turnaround prospects explored in detail in this note are
Bharti (BUY, TP `391, 19% upside): Top-level changes (Gopal Vittal appointed CEO of Indian operations in March 2013 and Christian De Faria appointed the CEO of African business in September 2013) have led to a change in strategy. This coupled with improving business conditions is likely to lead to a turnaround for Bharti both back home and in Africa. Currently, the stock is trading at 5.7x FY15E EV/EBITDA, which is at 13% discount to Idea’s valuations. The stock does not factor in this turnaround. Page 56 looks at Bharti’s turnaround prospects in greater detail.
Wipro (SELL, TP `477, 14% downside): Wipro has developed a leaner organisational structure, it has a stable leadership team in place and it has developed stronger account farming credentials in the top-10 accounts since its restructuring in 2011. It has also expanded Energy and Utilities as its leadership vertical. However, more work has to be done for a complete turnaround; Wipro needs to re-energise its client-hunting (which has slowed down in the last couple of quarters) and smaller client farming. This together with fixing the problems in the Infrastructure Management Services and Europe business could be the potential hurdles to Wipro matching the revenue growth rates of its tier-1 peers (~16-17% average for FY15). Its scope for utilisation improvement and given its successful execution on the industrialisation initiatives, margins are not a large concern. With the turnaround still in process and with the P/E multiple re-rating in the last nine months (from ~15.0x to ~18.0x one-year forward earnings), the stock looks expensive. Page 65 looks at Wipro’s turnaround prospects in greater detail.
Neither of these stocks features in Appendix 1 (consisting of laggard companies) for the following reasons:
Bharti has a mediocre score of 33% but given that the sector average for Telecom stocks itself is 22%, it still appears as the top stock within the sector. This thus is the case of a turnaround in the sector itself within which Bharti, the sector leader, should disproportionately benefit.
Wipro too has a low score of 42% and features amongst the bottom 40% of the IT sector but narrowly misses out on being a part of Appendix 1 because it is not amongst the bottom 25%.
Strategy
January 15, 2014 Ambit Capital Pvt. Ltd. Page 15
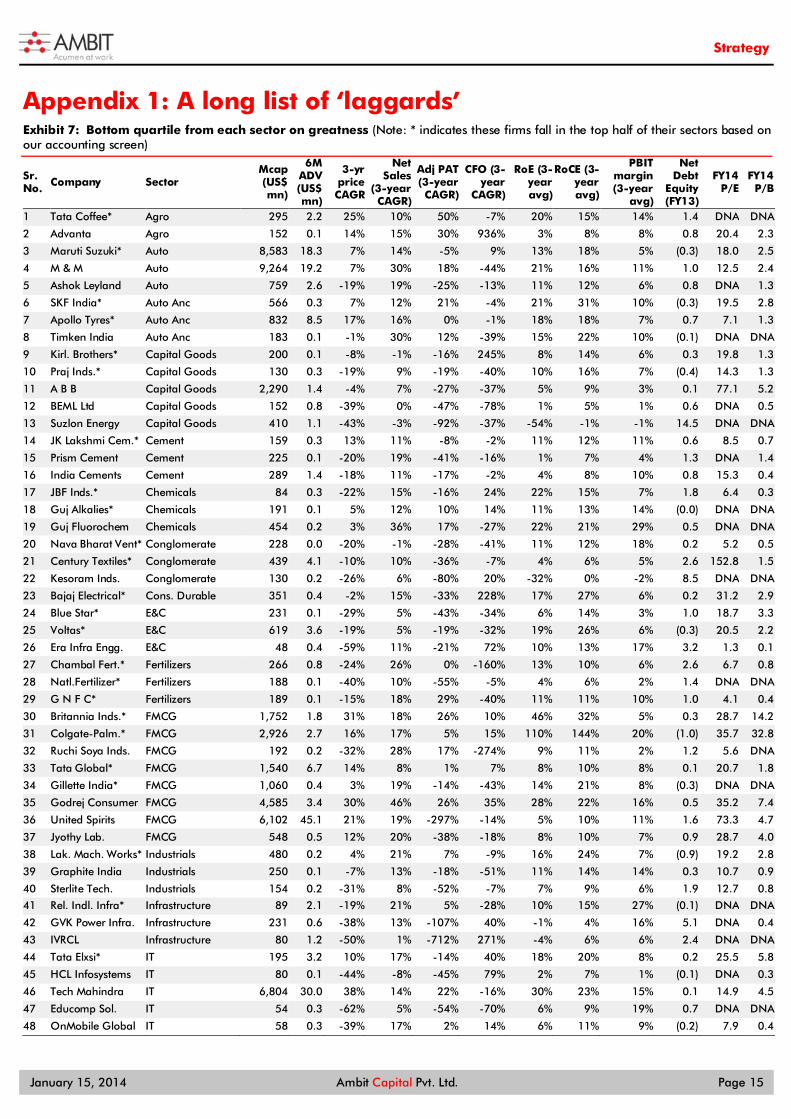
Appendix 1: A long list of ‘laggards’ Exhibit 7: Bottom quartile from each sector on greatness (Note: * indicates these firms fall in the top half of their sectors based on our accounting screen)
Sr. No. Company Sector
Mcap (US$ mn)
6M ADV (US$ mn)
3-yr price CAGR
Net Sales
(3-year CAGR)
Adj PAT (3-year CAGR)
CFO (3-year
CAGR)
RoE (3-year avg)
RoCE (3-year avg)
PBIT margin (3-year
avg)
Net Debt
Equity (FY13)
FY14 P/E
FY14 P/B
1 Tata Coffee* Agro 295 2.2 25% 10% 50% -7% 20% 15% 14% 1.4 DNA DNA
2 Advanta Agro 152 0.1 14% 15% 30% 936% 3% 8% 8% 0.8 20.4 2.3
3 Maruti Suzuki* Auto 8,583 18.3 7% 14% -5% 9% 13% 18% 5% (0.3) 18.0 2.5
4 M & M Auto 9,264 19.2 7% 30% 18% -44% 21% 16% 11% 1.0 12.5 2.4
5 Ashok Leyland Auto 759 2.6 -19% 19% -25% -13% 11% 12% 6% 0.8 DNA 1.3
6 SKF India* Auto Anc 566 0.3 7% 12% 21% -4% 21% 31% 10% (0.3) 19.5 2.8
7 Apollo Tyres* Auto Anc 832 8.5 17% 16% 0% -1% 18% 18% 7% 0.7 7.1 1.3
8 Timken India Auto Anc 183 0.1 -1% 30% 12% -39% 15% 22% 10% (0.1) DNA DNA
9 Kirl. Brothers* Capital Goods 200 0.1 -8% -1% -16% 245% 8% 14% 6% 0.3 19.8 1.3
10 Praj Inds.* Capital Goods 130 0.3 -19% 9% -19% -40% 10% 16% 7% (0.4) 14.3 1.3
11 A B B Capital Goods 2,290 1.4 -4% 7% -27% -37% 5% 9% 3% 0.1 77.1 5.2
12 BEML Ltd Capital Goods 152 0.8 -39% 0% -47% -78% 1% 5% 1% 0.6 DNA 0.5
13 Suzlon Energy Capital Goods 410 1.1 -43% -3% -92% -37% -54% -1% -1% 14.5 DNA DNA
14 JK Lakshmi Cem.* Cement 159 0.3 13% 11% -8% -2% 11% 12% 11% 0.6 8.5 0.7
15 Prism Cement Cement 225 0.1 -20% 19% -41% -16% 1% 7% 4% 1.3 DNA 1.4
16 India Cements Cement 289 1.4 -18% 11% -17% -2% 4% 8% 10% 0.8 15.3 0.4
17 JBF Inds.* Chemicals 84 0.3 -22% 15% -16% 24% 22% 15% 7% 1.8 6.4 0.3
18 Guj Alkalies* Chemicals 191 0.1 5% 12% 10% 14% 11% 13% 14% (0.0) DNA DNA
19 Guj Fluorochem Chemicals 454 0.2 3% 36% 17% -27% 22% 21% 29% 0.5 DNA DNA
20 Nava Bharat Vent* Conglomerate 228 0.0 -20% -1% -28% -41% 11% 12% 18% 0.2 5.2 0.5
21 Century Textiles* Conglomerate 439 4.1 -10% 10% -36% -7% 4% 6% 5% 2.6 152.8 1.5
22 Kesoram Inds. Conglomerate 130 0.2 -26% 6% -80% 20% -32% 0% -2% 8.5 DNA DNA
23 Bajaj Electrical* Cons. Durable 351 0.4 -2% 15% -33% 228% 17% 27% 6% 0.2 31.2 2.9
24 Blue Star* E&C 231 0.1 -29% 5% -43% -34% 6% 14% 3% 1.0 18.7 3.3
25 Voltas* E&C 619 3.6 -19% 5% -19% -32% 19% 26% 6% (0.3) 20.5 2.2
26 Era Infra Engg. E&C 48 0.4 -59% 11% -21% 72% 10% 13% 17% 3.2 1.3 0.1
27 Chambal Fert.* Fertilizers 266 0.8 -24% 26% 0% -160% 13% 10% 6% 2.6 6.7 0.8
28 Natl.Fertilizer* Fertilizers 188 0.1 -40% 10% -55% -5% 4% 6% 2% 1.4 DNA DNA
29 G N F C* Fertilizers 189 0.1 -15% 18% 29% -40% 11% 11% 10% 1.0 4.1 0.4
30 Britannia Inds.* FMCG 1,752 1.8 31% 18% 26% 10% 46% 32% 5% 0.3 28.7 14.2
31 Colgate-Palm.* FMCG 2,926 2.7 16% 17% 5% 15% 110% 144% 20% (1.0) 35.7 32.8
32 Ruchi Soya Inds. FMCG 192 0.2 -32% 28% 17% -274% 9% 11% 2% 1.2 5.6 DNA
33 Tata Global* FMCG 1,540 6.7 14% 8% 1% 7% 8% 10% 8% 0.1 20.7 1.8
34 Gillette India* FMCG 1,060 0.4 3% 19% -14% -43% 14% 21% 8% (0.3) DNA DNA
35 Godrej Consumer FMCG 4,585 3.4 30% 46% 26% 35% 28% 22% 16% 0.5 35.2 7.4
36 United Spirits FMCG 6,102 45.1 21% 19% -297% -14% 5% 10% 11% 1.6 73.3 4.7
37 Jyothy Lab. FMCG 548 0.5 12% 20% -38% -18% 8% 10% 7% 0.9 28.7 4.0
38 Lak. Mach. Works* Industrials 480 0.2 4% 21% 7% -9% 16% 24% 7% (0.9) 19.2 2.8
39 Graphite India Industrials 250 0.1 -7% 13% -18% -51% 11% 14% 14% 0.3 10.7 0.9
40 Sterlite Tech. Industrials 154 0.2 -31% 8% -52% -7% 7% 9% 6% 1.9 12.7 0.8
41 Rel. Indl. Infra* Infrastructure 89 2.1 -19% 21% 5% -28% 10% 15% 27% (0.1) DNA DNA
42 GVK Power Infra. Infrastructure 231 0.6 -38% 13% -107% 40% -1% 4% 16% 5.1 DNA 0.4
43 IVRCL Infrastructure 80 1.2 -50% 1% -712% 271% -4% 6% 6% 2.4 DNA DNA
44 Tata Elxsi* IT 195 3.2 10% 17% -14% 40% 18% 20% 8% 0.2 25.5 5.8
45 HCL Infosystems IT 80 0.1 -44% -8% -45% 79% 2% 7% 1% (0.1) DNA 0.3
46 Tech Mahindra IT 6,804 30.0 38% 14% 22% -16% 30% 23% 15% 0.1 14.9 4.5
47 Educomp Sol. IT 54 0.3 -62% 5% -54% -70% 6% 9% 19% 0.7 DNA DNA
48 OnMobile Global IT 58 0.3 -39% 17% 2% 14% 6% 11% 9% (0.2) 7.9 0.4

Strategy
January 15, 2014 Ambit Capital Pvt. Ltd. Page 16
Sr. No. Company Sector
Mcap (US$ mn)
6M ADV (US$ mn)
3-yr price CAGR
Net Sales
(3-year CAGR)
Adj PAT (3-year CAGR)
CFO (3-year
CAGR)
RoE (3-year avg)
RoCE (3-year avg)
PBIT margin (3-year
avg)
Net Debt
Equity (FY13)
FY14 P/E
FY14 P/B
49 NIIT IT 71 0.2 -20% -7% -17% 32% 11% 10% 2% 0.1 12.6 0.7
50 Container Corpn.* Logistics 2,280 0.7 -5% 6% 6% 13% 17% 22% 21% (0.5) 14.5 1.7
51 Navneet Educat.* Media 220 0.1 -1% 15% 19% 1% 24% 30% 19% 0.4 11.2 2.8
52 Zee Entertainment* Media 4,319 10.0 23% 19% 3% -18% 19% 27% 23% (0.3) 31.1 6.0
53 TV18 Broadcast Media 630 1.4 -32% 41% 25% 82% -8% 2% 0% 0.1 45.8 1.2
54 PVR Media 403 0.7 64% 34% 233% 70% 7% 8% 6% 0.9 32.0 3.5
55 Netwrk.18 Media Media 547 0.2 -36% 23% -27% -34% -25% -1% -9% (0.1) DNA DNA
56 Natl. Aluminium* Metals 1,538 0.3 -27% 11% -10% -9% 7% 12% 14% (0.4) 13.2 0.8
57 Tata Steel* Metals 6,542 36.1 -15% 10% 2% 8% 7% 10% 7% 1.4 11.8 1.1
58 Uttam Galva* Metals 159 0.2 -18% 12% -19% 4100% 7% 11% 7% 2.2 DNA DNA
59 Mah. Seamless* Metals 187 0.1 -25% 3% -24% 9% 9% 14% 16% (0.2) 12.3 0.4
60 S A I L* Metals 4,718 4.3 -27% 3% -29% -18% 10% 11% 11% 0.4 11.5 0.7
61 Jindal Saw Metals 222 0.3 -32% 6% -48% -45% 7% 9% 10% 1.3 6.9 0.4
62 Jindal Stain. Metals 125 0.2 -30% 23% -134% 125% -8% 4% 5% 8.6 DNA DNA
63 MOIL* Mining 633 0.2 -19% 0% -3% -4% 22% 32% 50% (0.8) 9.3 1.3
64 Sesa Sterlite Mining 9,520 23.7 -15% -26% -4% -79% 24% 29% 32% 0.2 8.4 0.8
65 Greenply Inds.* Misc. 143 0.1 24% 28% 44% 13% 18% 14% 8% 1.4 7.0 1.5
66 Indian Hotels* Misc. 767 0.5 -14% 14% 34% 6% 0% 5% 8% 0.8 66.4 1.7
67 Orient Paper* Misc. 43 0.0 -39% -8% -40% -36% 11% 13% 7% 0.6 2.5 0.2
68 MMTC* Misc. 832 1.1 -64% -10% -30% 65% 3% 9% 0% (0.0) DNA DNA
69 Hotel Leela Ven.* Misc. 124 0.1 -28% 13% -389% 67% -16% 0% -1% 3.8 DNA 0.9
70 Opto Circuits Misc. 104 1.6 -49% 31% 14% -60% 29% 20% 23% 0.7 DNA DNA
71 KF Airlines Misc. 58 0.3 -60% -54% -77% 5% -44% -1563% -220% DNA DNA DNA
72 H P C L* Oil & Gas 1,265 4.5 -15% 25% -36% -19% 6% 7% 1% 2.8 8.9 0.6
73 I O C L* Oil & Gas 8,029 1.9 -14% 23% -26% 228% 13% 11% 3% 1.1 9.6 0.7
74 M R P L* Oil & Gas 1,204 0.3 -17% 27% -57% -29% 7% 12% 2% 0.9 20.1 1.1
75 Wyeth* Pharma 281 0.9 -1% 16% 14% 2% 32% 46% 29% (0.8) 19.7 2.9
76 Unichem Labs.* Pharma 282 0.3 -7% 13% -3% 10% 14% 18% 12% (0.1) 13.5 2.1
77 Novartis India* Pharma 235 0.1 -11% 13% 1% -58% 19% 28% 15% (0.0) 11.9 1.4
78 Sanofi India* Pharma 1,036 0.1 12% 17% 4% 28% 16% 25% 14% (0.4) 29.0 4.7
79 Astrazeneca Phar* Pharma 332 0.5 -14% -1% -88% -40% -8% 6% 0% (0.2) DNA DNA
80 Glenmark Pharma. Pharma 2,282 4.9 14% 26% 24% 23% 22% 20% 17% (0.1) 20.3 4.2
81 Dishman Pharma. Pharma 124 1.2 -14% 12% -6% -23% 9% 10% 14% 0.8 6.8 0.7
82 Jubilant Life Pharma 337 0.9 -21% 11% -13% 11% 12% 11% 14% 1.4 7.2 0.8
83 DLF* Realty 4,763 23.6 -17% 2% -41% -38% 3% 7% 30% 0.8 37.8 1.0
84 Kolte Patil Dev.* Realty 108 0.4 21% 70% 48% 69% 8% 12% 31% 0.1 5.2 0.8
85 Peninsula Land* Realty 175 0.3 -14% -2% -12% -18% 12% 13% 32% 0.3 7.1 0.7
86 Sunteck Realty Realty 306 0.1 -18% 2% -37% 39% 0% 2% 13% 0.9 5.5 2.2
87 Anant Raj Realty 276 1.1 -16% 22% -24% -34% 3% 4% 43% 0.2 13.4 0.4
88 Shree Gan.Jew.* Retail 34 0.2 -48% 55% 41% 24% 31% 24% 5% (0.0) 1.0 0.1
89 Goenka Diamond Retail 34 0.5 -7% 16% 5% -111% 15% 11% 5% 0.4 DNA DNA
90 Mercator Shipping 73 0.1 -30% 27% -228% 124% 0% 3% 5% 1.4 DNA DNA
91 M T N L Telecom 153 0.5 -36% -2% -38% -34% -1433% -28% -99% DNA DNA DNA
92 Rel. Comm. Telecom 4,313 28.9 -4% 0% -47% -26% 2% 4% 8% 1.2 21.1 0.8
93 Bombay Rayon Textiles 344 0.2 -2% 22% -7% 709% 7% 8% 15% 1.3 DNA DNA
94 Swan Energy Textiles 228 0.7 1% -20% -27% -24% 17% 14% 19% 2.0 DNA DNA
95 NTPC* Utilities 17,873 10.6 -12% 13% 9% 11% 14% 12% 19% 0.6 10.3 1.3
96 SJVN* Utilities 1,379 0.2 -2% 0% 3% 2% 14% 14% 61% (0.0) 7.6 0.9
97 Tata Power Co.* Utilities 3,331 5.1 -13% 20% -34% 10% 3% 10% 14% 2.4 23.3 1.7
98 Adani Power Utilities 1,714 3.2 -33% 150% -491% 152% -14% 2% 19% 9.2 DNA 2.2
99 KSK Energy Ven. Utilities 383 0.1 -21% 65% -1% 50% 4% 4% 28% 3.8 DNA 0.7
Source: Bloomberg, Capitaline, Ambit Capital Research.

Strategy
January 15, 2014 Ambit Capital Pvt. Ltd. Page 17
Section 3: Ashok Leyland Exhibit 8: Can Ashok Leyland (AL) execute a turnaround?
Criteria Entry
How much has RoCE fallen over the past 10 years? 1,510bps (from 23% in FY04 to 8% in FY13).
Why did RoCE fall? Aggressive capex/investments coupled with an industry slowdown have adversely impacted the firm’s asset turnover and operating margins.
Has there been a change in management?
Yes, whilst Mr Vinod Dasari took over as the MD of AL w.e.f. April 2011, the erstwhile MD, Mr Seshasayee, continued to be the Vice Chairman until March 2013. He has stepped down from this position to a non-executive role w.e.f. April 2013.
Does the current management team have the credibility/credentials to execute a turnaround?
Mr. Dasari has a history of turning around Timken India in the late 1990s. He also played a leading role in helping Cummins India build a market-leading position. He is well known for his business re-engineering and cost-cutting capabilities.
Does the franchise have competitive advantages?
Yes, AL is the second-largest player in the domestic MHCV space with a strong distribution network and brand loyalty. We are also positive about the ability of the company to generate strong cash flow from operations.
Does the team have a specific, measurable, time-bound turnaround plan?
Yes, AL plans to generate `7.5bn-10bn of cash through reduction in working capital and selling of non-core investments. Furthermore, initiatives are in place to reduce the breakeven revenue level, bring more transparency in financial reporting and expand the business through new launches, expansion of network and newer avenues of growth.
Source: Ambit Capital research
Company background/history Ashok Motors was founded by Mr. Raghunandan Saran in 1948 (Ashok being the name of his only son) in collaboration with Austin Motor Company, England, for the assembly of Austin cars. An agreement was reached between Leyland (UK) and Ashok Motors in 1950, wherein Ashok Motors received the sole rights to import, assemble and progressively manufacture Leyland trucks for seven years. In 1955, Leyland Motors (through Leyland International Holdings) acquired a 40% stake in the company and the company’s name was changed to Ashok Leyland (AL).
Over the years, the company achieved several milestones in the commercial vehicle (CV) space (trucks and buses) and became the #2 player in the Indian commercial vehicle (CV) space, after Tata Locomotive & Engineering Company (TELCO), now Tata Motors. In 1987, the Hinduja Group and Iveco (owned by Fiat SpA), Italy, jointly acquired Land Rover Leyland International Holdings Ltd (LRLIH) from the Rover Group, thereby gaining the control of AL. LRLIH’s shareholding in Ashok Leyland increased from 40% in 1987 to 51% in 1994. In July 2006, the Hinduja Group bought out Iveco’s stake (30%) in LRLIH Ltd, UK, thereby becoming the controlling stakeholder with a 51% stake in AL (which continues to date).
AL currently derives around 52% of its revenues from domestic trucks, 16% from domestic bus, 11% from exports and the balance from LCV sales, defence, spare parts and engine sales.

Strategy
January 15, 2014 Ambit Capital Pvt. Ltd. Page 18
Exhibit 9: Timeline of events
Year Key events
1948 Founded by Raghunandan Saran as Ashok Motors, in collaboration with Austin Motor Company, England, for the assembly of Austin cars.
1950 Ashok Motors and Leyland, UK, agree to collaborate in the import, assemble and progressively manufacture Leyland trucks.
1955 The company was renamed ‘Ashok Leyland’ with equity participation from Leyland Motors, Ltd. Enters into the commercial vehicle business.
1987 Equity participation by LRLIH (owned 70% by the Hinduja Group and 30% by Iveco).
2006 Hinduja Group buys Iveco's shares in LRLIH.
2007 Joint venture forged with Nissan Motor Company for manufacture and marketing of LCVs.
2008 Joint venture inked with John Deere for the manufacture of construction equipment.
2010 Pantnagar plant goes on stream with a capacity to touch 75,000 vehicles.
Source: Company, Ambit Capital research
Exhibit 10: Segment-wise revenue slit (FY13) by segments
Source: Company, Ambit Capital research
Evolution of the company over the years Exhibit 11: Ashok Leyland’s RoCE and capital employed turnover since FY98
Source: Company, Ambit Capital research
Exhibit 12: Ashok Leyland’s stock price performance
Source: Bloomberg, Ambit Capital research
Trucks, 52%
Bus, 16%Defence
kits, Spares, 9%
LCV (Dost), 9%
Exports, 11%
Engines, 3%
-
1.0
2.0
3.0
4.0
5.0
6.0
0.0%
10.0%
20.0%
30.0%
40.0%
50.0%
60.0%
FY98
FY99
FY00
FY01
FY02
FY03
FY04
FY05
FY06
FY07
FY08
FY09
FY10
FY11
FY12
FY13
Capital employed turnover - RHS RoCE (post-tax)
Phase 2: Strong industry growth, AL gets aggressive
Phase 3: Industry ups and downs, AL's capex & invts continue to increase
Phase 4: Industry downturn,AL's huge debt bites back
(x)
0
5
10
15
20
25
30
35
40
45
Jan-
98
Jan-
99
Jan-
00
Jan-
01
Jan-
02
Jan-
03
Jan-
04
Jan-
05
Jan-
06
Jan-
07
Jan-
08
Jan-
09
Jan-
10
Jan-
11
Jan-
12
Jan-
13
Jan-
14
Ashok Leyland stock price
Weak CV demand
Improving profitability despite weak volumes
Strong CV demand phase, market share witnesses ups and downs
CV industry volumes shrink in 2009 crisis
Strong bounce back in CV demand
Rising depreciation and interest expense start impacting profitability
High debt and CV demand slowdown create double whammy
Phase I: Industry downturn, belt-tightening measures help AL
Strategy
January 15, 2014 Ambit Capital Pvt. Ltd. Page 19
Phase 1 (FY1998-2002): AL survives the industry downturn and emerges stronger
''The recession made us hasten the process of improvement that we had been working on for some time” – R Seshasayee, Managing Director, Business Today, July 2000
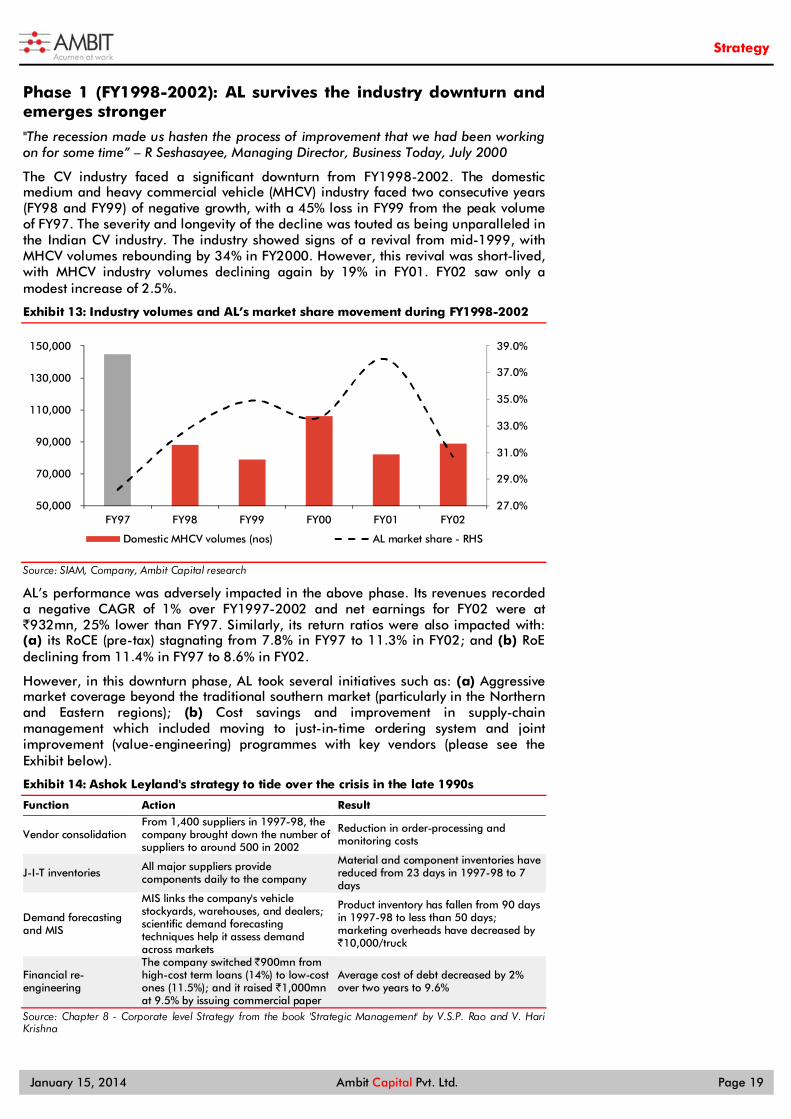
The CV industry faced a significant downturn from FY1998-2002. The domestic medium and heavy commercial vehicle (MHCV) industry faced two consecutive years (FY98 and FY99) of negative growth, with a 45% loss in FY99 from the peak volume of FY97. The severity and longevity of the decline was touted as being unparalleled in the Indian CV industry. The industry showed signs of a revival from mid-1999, with MHCV volumes rebounding by 34% in FY2000. However, this revival was short-lived, with MHCV industry volumes declining again by 19% in FY01. FY02 saw only a modest increase of 2.5%.
Exhibit 13: Industry volumes and AL’s market share movement during FY1998-2002
Source: SIAM, Company, Ambit Capital research
AL’s performance was adversely impacted in the above phase. Its revenues recorded a negative CAGR of 1% over FY1997-2002 and net earnings for FY02 were at `932mn, 25% lower than FY97. Similarly, its return ratios were also impacted with: (a) its RoCE (pre-tax) stagnating from 7.8% in FY97 to 11.3% in FY02; and (b) RoE declining from 11.4% in FY97 to 8.6% in FY02.
However, in this downturn phase, AL took several initiatives such as: (a) Aggressive market coverage beyond the traditional southern market (particularly in the Northern and Eastern regions); (b) Cost savings and improvement in supply-chain management which included moving to just-in-time ordering system and joint improvement (value-engineering) programmes with key vendors (please see the Exhibit below).
Exhibit 14: Ashok Leyland's strategy to tide over the crisis in the late 1990s
Function Action Result
Vendor consolidation From 1,400 suppliers in 1997-98, the company brought down the number of suppliers to around 500 in 2002
Reduction in order-processing and monitoring costs
J-I-T inventories All major suppliers provide components daily to the company
Material and component inventories have reduced from 23 days in 1997-98 to 7 days
Demand forecasting and MIS
MIS links the company's vehicle stockyards, warehouses, and dealers; scientific demand forecasting techniques help it assess demand across markets
Product inventory has fallen from 90 days in 1997-98 to less than 50 days; marketing overheads have decreased by `10,000/truck
Financial re-engineering
The company switched ̀ 900mn from high-cost term loans (14%) to low-cost ones (11.5%); and it raised `1,000mn at 9.5% by issuing commercial paper
Average cost of debt decreased by 2% over two years to 9.6%
Source: Chapter 8 - Corporate level Strategy from the book 'Strategic Management' by V.S.P. Rao and V. Hari Krishna
27.0%
29.0%
31.0%
33.0%
35.0%
37.0%
39.0%
50,000
70,000
90,000
110,000
130,000
150,000
FY97 FY98 FY99 FY00 FY01 FY02
Domestic MHCV volumes (nos) AL market share - RHS

Strategy
January 15, 2014 Ambit Capital Pvt. Ltd. Page 20
These initiatives bore fruits to the company in the form of: (a) increased market share, as the company’s market share in the MHCV category expanded from 28.2% in FY97 to 30.7% in FY02 (the company achieved its highest-ever market share of 38% in FY01); (b) improvement in margin, with EBITDA margin rising from 9.2% in FY97 to 12.5% in FY02 (after declining to a low of 0.6% in FY99) despite a slowdown in revenues (FY02 revenues were 6% lower than FY97). AL’s performance was respectable through these measures despite a severe downturn in the industry from FY98 onwards.
Exhibit 15: Despite the industry slowdown, aggressive initiatives helped improve AL’s margins
Source: Company, Ambit Capital research
Exhibit 16: Margin improvement helped drive AL’s RoIC from FY2000
Source: Company, Ambit Capital research
Phase 2 (FY03-07): Strong industry growth phase; AL becomes aggressive about capex and new ventures
“Ashok Leyland has drawn up aggressive plans to increase annual capacity and sales to over 180,000 vehicles (medium and heavy duty vehicles) in four / five years” - extract from Management Discussion and Analysis Report, FY2007
After a weak demand phase in FY1998-02, MHCV industry volumes bounced back strongly in FY03 by 30% YoY. This continued in the subsequent years, with industry volume CAGR of 25% over FY02-07, due to the strong macro environment (India’s GDP grew at an average rate of 7.6% over FY03-07 vs 6.1% in FY1997-2002). AL’s domestic MHCV volumes, too, grew strongly at 28% CAGR over FY02-07. However, AL’s market share fluctuated significantly during these years. Its market share in domestic MHCVs dropped from 30.7% in FY03 to 24.0% in FY05 due to:
geographical disparity in sales given that AL’s sales are concentrated in southern India – hence years where southern India sales lagged that of other regions, AL’s market share was adversely affected;
capacity constraints; and
labour issues impacting production in some years; eg, in FY05, issues linked to long-term wage settlements in two of the company’s units (Bhandara and Hosur 1) resulted in substantial production loss.
However, AL nearly restore its market share to the FY02 levels by FY07, with: (a) an increase in production capacity from 67,500 units p.a. in FY05 to 84,000 units p.a. in FY07; (b) resolution of labour issues helped by the conclusion of wage settlements and Mission ‘Gemba’ to more closely connect with the employees; and (c) the demand revival in the southern markets.
7.0%
8.0%
9.0%
10.0%
11.0%
12.0%
13.0%
15,000
17,000
19,000
21,000
23,000
25,000
27,000
FY97
FY98
FY99
FY00
FY01
FY02
Revenues (Rs mn) EBITDA margin (%)
-2%
0%
2%
4%
6%
8%
10%
(6,000)
(4,000)
(2,000)
-
2,000
4,000
6,000
FY97
FY98
FY99
FY00
FY01
FY02
CFO (Rs mn) FCF (Rs mn) RoIC - RHS

Strategy
January 15, 2014 Ambit Capital Pvt. Ltd. Page 21
Exhibit 17: Whilst industry volumes grew strongly, AL’s maintained its market share in FY03-07
Source: SIAM, Company, Ambit Capital research
AL’s MHCV exports also grew strongly at 28% CAGR over FY03-07, a growth rate similar to that experienced by its peers (MHCV industry export volumes grew by 41% CAGR over FY03-07). This was driven by improving acceptance of Indian vehicles in the export markets and increased supply of vehicles to Iraq (for reconstruction of the economy) and Iraq (under the UN Oil for Food programme) during this phase. This phase saw the entry of several new players (domestic as well as international) in the Indian CV space (See Exhibit 28 on page 27).
This phase also marked the beginning of an aggressive capex and investment phase for the company. The FY07 annual report discussed the management’s aggressive plans to increase annual capacity and sales to over 180,000 vehicles in 4-5 years (from the sales and capacity levels of 83K and 84K p.a. respectively in FY2007). The company also forayed into new ventures through the acquisition of the truck business of Avia in Czech Republic, the joint venture with Ras Al Khaimah Investment Authority in the UAE for bus body building, and acquisition of testing service provider, Defiance Testing and Engineering Services Inc. (please see detailed discussion on capital allocation on pages 24-28).
Meanwhile, Iveco exited Ashok Leyland through a stake sale to the Hinduja Group in July 2006, though it was widely speculated that Volvo, Scania and Daimler were in the race to acquire Iveco’s stake.
AL’s revenues recorded 26% CAGR over FY02-07. However, the prices of commodities such as steel, aluminium and rubber amongst others also increased during this phase. This had an adverse impact on AL’s operating margin. The EBITDA margin of the company declined from 12.5% in FY02 to 9.2% in FY07. However, higher capital employed turnover (due to robust sales and high capacity utilisation) led to RoCE rising three-fold from 11.3% in FY02 to 31.9% in FY07, despite a decline in margin during this period.
23.0%
24.0%
25.0%
26.0%
27.0%
28.0%
29.0%
30.0%
31.0%
-
50,000
100,000
150,000
200,000
250,000
300,000
FY02 FY03 FY04 FY05 FY06 FY07
Domestic MHCV volumes (nos) AL market share - RHS

Strategy
January 15, 2014 Ambit Capital Pvt. Ltd. Page 22
Exhibit 18: Whilst revenues grew strongly, AL’s operating margin fell in FY03-07
Source: Company, Ambit Capital research
Exhibit 19: Despite the operating margin decline, strong asset turnover helped boost AL’s RoIC
Source: Company, Ambit Capital research
Phase 3 (FY08-12): Industry faces ups and downs whilst AL’s capex, investments and debt go up
“We are going ahead full steam and are poised to take advantage of this market growth, and capacity which used to be a limiting factor so far shouldn’t affect growth anymore” - R Seshasayee, Managing Director, Motorindia, June 2008
This phase was marked by several ups and downs in the industry’s fortunes. On the back of a strong growth phase from FY03-07, FY08 saw a moderation in volumes, with the domestic MHCV industry (trucks and buses) volumes increasing marginally by 1% in FY08. Due to the adverse impact of the global economic crisis on the Indian economy, domestic MHCV industry volumes contracted by a third in FY09. However, the bounce-back of volumes was equally sharp, with FY10 and FY11 industry volumes growing at a rapid 33% and 32% respectively. The growth, albeit a lower pace, continued in FY12, with industry volumes growing at 8%.
AL’s MHCV volumes, too, witnessed ups and downs, in line with the industry, with FY09 volumes dipping by 38% and bouncing back strongly in FY10 and FY11 (CAGR of 33% over FY09-11). However, in FY07-12, the company lost market share of 500bps in the overall domestic MHCV industry (loss of 660bps in the domestic truck segment but a gain of 100bps in the domestic bus segment).
The loss in market share during this period was mainly attributable to: (a) a regional disparity with the southern market volume growth lagging that of other regions; and (b) demand shifting towards lower tonnage vehicle (intermediate commercial vehicles) within MHCVs where AL was a distant third to Tata Motors and Eicher.
Exhibit 20: Industry volumes and AL’s market share movement in FY07-12
Source: SIAM, Company, Ambit Capital research
8.0%8.5%9.0%9.5%10.0%10.5%11.0%11.5%12.0%
12.5%13.0%
15,000
25,000
35,000
45,000
55,000
65,000
75,000
FY02
FY03
FY04
FY05
FY06
FY07
Revenues (Rs mn) EBITDA margin (%)
5%
10%
15%
20%
25%
30%
(2,000)
(1,000)
-
1,000
2,000
3,000
4,000
5,000
6,000
FY02
FY03
FY04
FY05
FY06
FY07
CFO (Rs mn) FCF (Rs mn) RoIC - RHS
22.0%
23.0%
24.0%
25.0%
26.0%
27.0%
28.0%
29.0%
-
50,000
100,000
150,000
200,000
250,000
300,000
350,000
400,000
FY07 FY08 FY09 FY10 FY11 FY12
Domestic MHCV volumes (nos) AL market share - RHS
Strategy
January 15, 2014 Ambit Capital Pvt. Ltd. Page 23
Despite the ups and downs in the market, Ashok Leyland continued to invest heavily in capacity creation and new product development. The capex from FY08 to FY12 was at `32bn (1.3x of FY08-12 average net worth). Furthermore, the company was involved in several new ventures, notably amongst them were:
(a) a joint venture with Nissan (for manufacturing light commercial vehicles);
(b) a joint venture with John Deere (for manufacturing construction equipment); and
(c) Hinduja Leyland Finance which finances purchasing of commercial vehicles.
Besides investments into these new ventures, the company continued to invest in Hinduja Foundries (a promoter group entity). Total fresh investments during this phase amounted to `12bn i.e. 25% of the average capital employed during this phase. (Please see detailed discussion on capital allocation on pages 24-28).
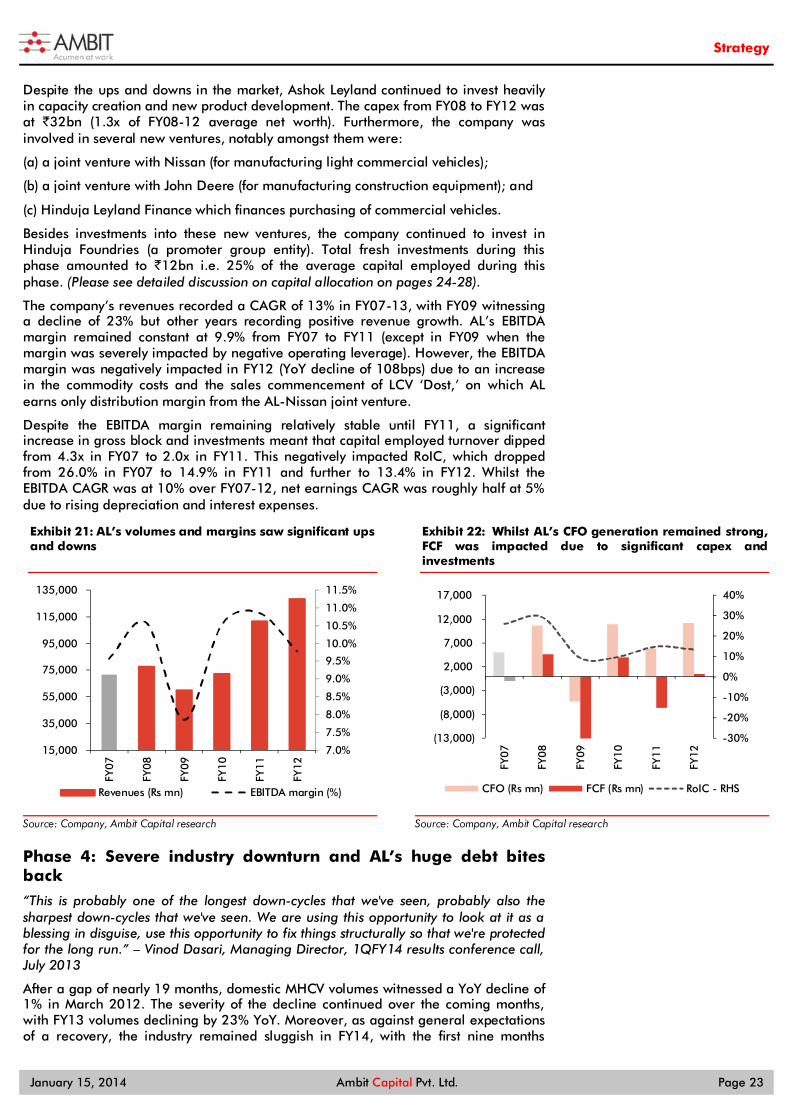
The company’s revenues recorded a CAGR of 13% in FY07-13, with FY09 witnessing a decline of 23% but other years recording positive revenue growth. AL’s EBITDA margin remained constant at 9.9% from FY07 to FY11 (except in FY09 when the margin was severely impacted by negative operating leverage). However, the EBITDA margin was negatively impacted in FY12 (YoY decline of 108bps) due to an increase in the commodity costs and the sales commencement of LCV ‘Dost,’ on which AL earns only distribution margin from the AL-Nissan joint venture.
Despite the EBITDA margin remaining relatively stable until FY11, a significant increase in gross block and investments meant that capital employed turnover dipped from 4.3x in FY07 to 2.0x in FY11. This negatively impacted RoIC, which dropped from 26.0% in FY07 to 14.9% in FY11 and further to 13.4% in FY12. Whilst the EBITDA CAGR was at 10% over FY07-12, net earnings CAGR was roughly half at 5% due to rising depreciation and interest expenses.
Exhibit 21: AL’s volumes and margins saw significant ups and downs
Source: Company, Ambit Capital research
Exhibit 22: Whilst AL’s CFO generation remained strong, FCF was impacted due to significant capex and investments
Source: Company, Ambit Capital research
Phase 4: Severe industry downturn and AL’s huge debt bites back
“This is probably one of the longest down-cycles that we've seen, probably also the sharpest down-cycles that we've seen. We are using this opportunity to look at it as a blessing in disguise, use this opportunity to fix things structurally so that we're protected for the long run.” – Vinod Dasari, Managing Director, 1QFY14 results conference call, July 2013
After a gap of nearly 19 months, domestic MHCV volumes witnessed a YoY decline of 1% in March 2012. The severity of the decline continued over the coming months, with FY13 volumes declining by 23% YoY. Moreover, as against general expectations of a recovery, the industry remained sluggish in FY14, with the first nine months
7.0%
7.5%
8.0%
8.5%
9.0%
9.5%
10.0%
10.5%
11.0%
11.5%
15,000
35,000
55,000
75,000
95,000
115,000
135,000
FY07
FY08
FY09
FY10
FY11
FY12
Revenues (Rs mn) EBITDA margin (%)
-30%
-20%
-10%
0%
10%
20%
30%
40%
(13,000)
(8,000)
(3,000)
2,000
7,000
12,000
17,000
FY07
FY08
FY09
FY10
FY11
FY12
CFO (Rs mn) FCF (Rs mn) RoIC - RHS

Strategy
January 15, 2014 Ambit Capital Pvt. Ltd. Page 24
facing a decline of 27% YoY. A further negative industry trend seen since 2QFY13 has been the rising trend of discounts in the MHCV space. We estimate the level of discounts to have increased by nearly 3x in 2QFY14 vs 1QFY13. Export volumes of MHCVs were also impacted due to the imposition of duties by key export markets like Sri Lanka and the general slowdown in India.
AL’s MHCV volumes witnessed a decline of 13% in FY13 and 32% in the first nine months of FY14. Revenues in FY13 were supported to some extent by a full year of sales of the newly introduced LCV ’Dost’ (in FY13). As a result, the FY13 revenue decline was limited to 3%. With ‘Dost’ also joining the slowdown bandwagon, 1HFY14 revenues declined by 22% YoY. As a result of negative operating leverage and a significant rise in discounts, the impact on the company’s margin was much more severe: AL’s FY13 EBITDA margin at 7.0% was down 276bps YoY, thus recording the lowest margin in almost 20 years (even lower than FY09). With no recovery in sight and with discount rates continuing to rise, the 1HFY14 margin was also an abysmally low 1.6%.
However, AL’s capex and investments remained high in FY13 and its net debt further increased from `31bn as at end-FY12 to `43bn as at end-FY13 and further to `57bn as at September 2013 (the debt levels had gone up to `65bn, or 2.2x equity, in August 2013). With depreciation and interest expenses remaining high amidst the decline in EBITDA, net earnings reduced by two-thirds YoY in FY13 and turned into a loss in FY14.
Exhibit 23: Industry volumes and AL’s market share movement during Phase 4
Source: SIAM, Company, Ambit Capital research
Exhibit 24: The industry slowdown impacted AL’s revenues and margins
Source: Company, Ambit Capital research
Aggressive capex and investments gone awry AL’s aggressive intentions with regards to capacity building and investments were first indicated in the FY07 annual report. The company planned to increase annual capacity and sales to over 180K vehicles (medium and heavy duty vehicles) in 4/5 years (vs the sales/capacity level of ~84K units in FY07). Furthermore, in FY07, the company initiated several new ventures notably amongst them being: (a) joint venture with Nissan (for manufacturing light commercial vehicles); (b) joint venture with John Deere (for manufacturing construction equipments); and (c) Hinduja Leyland Finance.
AL generated CFO (post tax) of `40.7bn from FY08 to FY13. Whilst `45bn went towards fixed assets and `21bn towards investments, given that capital allocations towards fixed assets and investments have exceeded the CFO, this led to negative free cash flow of ` 25bn. The negative FCF together with interest payments on debt (` 12bn) necessitated the increase in debt by `43bn from FY08 to FY13. Note that the
22.5%
23.5%
24.5%
25.5%
26.5%
-
50
100
150
200
250
300
350
400
FY12 FY13 9MFY14
Domestic MHCV volumes ('000s)AL market share - RHS
0%
2%
4%
6%
8%
10%
12%
-
20,000
40,000
60,000
80,000
100,000
120,000
140,000
FY12 FY13 1HFY14
Revenues (Rs mn) EBITDA margin - RHS

Strategy
January 15, 2014 Ambit Capital Pvt. Ltd. Page 25
company paid dividends (including tax on dividends) of `12bn (average payout ratio of 50%) during this period.
Exhibit 25: AL’s capital allocation over FY08-13 much aggressive than…
Source: Company, Ambit Capital research
Exhibit 26: …the capital allocation in FY02-07
Source: Company, Ambit Capital research
With respect to fixed assets, the investments of `45bn was primarily used for: (a) setting up of a greenfield plant at Pantnagar; (b) building next-generation cabs; (c) building a next generation engine; and (d) an increase in capacity at the existing location including development of manufacturing facilities for LCVs at Hosur under the Nissan JV. The installed capacity of the company increased from 77K units as at end-FY07 to 150K units p.a. as at end-FY13.
At the same time, the company’s invested close to `17bn in FY08-13 in various entities. A brief description and amount of investments into various entities are given below in the exhibit below.
Exhibit 27: Ashok Leyland’s standalone investment book
Name of the entity (̀ mn) FY11 FY12 FY13 % of total Inv as at FY13
Nissan J/V (incl powertrain, technologies) 2,565 3,153 3,638 16%
John Deere J/V 424 609 1,104 5%
Hinduja Leyland Finance 1,350 3,394 5,089 22%
Albonair GmBH 1,261 1,261 1,261 5%
Optare UK Plc 503 890 830 4%
Ashley Alteams 350 400 425 2%
Automotive Infrotonics 158 158 158 1%
Hinduja Foundries (inc pref shares) 459 459 3,324 14%
Avia 2,703 126 91 0%
IndusInd Bank 921 1,514 980 4%
Defiance Technologies + Defiance Testing 722 1,030 1,281 5%
Ashok Leyland UAE LLC 462 462 769 3%
Hinduja Energy Limited - - 1,871 8%
Others 715 377 347 1%
TOTAL 12,300 15,345 23,376 100%
Source: Company, Ambit Capital research. Note: Investments above also include that held indirectly by AL through Ashley Investments and Ashley Holdings.
The aggressive investment in capex and entities in FY08-13 (` 56bn) was a marked departure from the investment pattern during the previous six years where only `14bn was invested towards fixed assets and investments. An analysis of the management interviews, management commentary from the annual reports as well our discussions with primary data sources indicate the following reasons which could have driven aggressive capital allocation during FY08-13:
Strategy
January 15, 2014 Ambit Capital Pvt. Ltd. Page 26
(a) Strong sustained industry growth provided management confidence:
“We are going ahead full steam and are poised to take advantage of this market growth, and capacity which used to be a limiting factor so far shouldn’t affect growth anymore” – R Seshasayee, Managing Director, Motorindia, June 2008
After a weak demand phase from FY1998-2002, the MHCV industry witnessed a period of sustained high growth phase from FY03 to FY07 (CAGR of 24%). In line with the industry, AL too performed well during this phase, with its net earnings recording a CAGR of 36% over FY03-07. Demand was robust enough to even result in capacity constraints in some years.
This sustained period of high growth and the buoyant economic mood in 2007 may have guided AL’s decision to opt for significant capex expansion (to 150k units from the then capacity of 84k units). Notably, just a year before, in FY06, the annual report indicated a more conservative capacity expansion to 100k units by FY08 and stated that further expansion beyond that level would depend on the actual growth rate for the CV industry.
(b) Perception of Ashok Leyland as a conservative company:
“We had to address a mindset issue as well. In today’s world, speed is everything. We instantly remember Jamaican, Usain Bolt as the winner of 100 metres at the Beijing Olympics. Does anyone remember the marathon winner? Every employee has been made to realise the importance of speed” – R Seshasayee, Managing Director, Business Today, September 2008
The market perception of AL in the mid- 2000s was that of a conservative south India focused company whilst its peers Tata Motors and Eicher were perceived as more aggressive. Tata Motors which was a pure-play CV focused player until 1997 had a spectacular debut in the passenger vehicle business through the launch of ‘Indica’ in 1998. Furthermore, it had embarked on developing the high-profile small car ‘Nano’. Similarly, Eicher Motors having sold off its core business of tractors to TAFE in June 2005 had entered into the heavy duty vehicle space. This peer pressure could have forced AL to pursue aggressive expansion and look beyond the MCHV business.
Though a little late, the chairman’s (Mr. Dheeraj Hinduja) letter to the shareholders in 2011 outlined the global aspirations of the company as: “Our objective is to become one of the top-10 global manufacturers in commercial vehicles above 7.5-tonne category and one of the global top-5 in the bus segment. In the next five years, the volume should be around 150,000 in trucks and 40,000 in buses.”
(c) Better late than never – foray into LCVs:
“Ashok Leyland is a story of refused opportunities over the last decade in the great marketplace of India where Ace and Scorpio (the SUV from M&M) blazed trails,” says Subir Raha, former independent director on the board of Ashok Leyland, Forbes India, October 2009
Tata Motors debuted its new LCV named ‘Ace’ in May 2005, creating a new sub-1 tonne LCV category and thus offering a good alternative to 3W goods carriers. Ace was an instant success, with nearly 30k units of sales in the first year of launch and volumes more than doubling to 70k units in the second year. This helped Tata Motors to grow its market share in the domestic LCV goods carrier segment from 51.6% in FY05 to 67.6% in F07. This did not impact AL in the LCV goods space (the market share loss was borne was incumbents like Mahindra, Eicher Motors and 3W goods player like Bajaj Auto and Piaggio). However, the fact that the LCV goods segment was growing strongly (30% CAGR over FY05-07) was not lost on market experts who increasingly started to question AL’s absence from the segment. In October 2007, the company announced a JV with Nissan for the manufacture and marketing of LCVs.
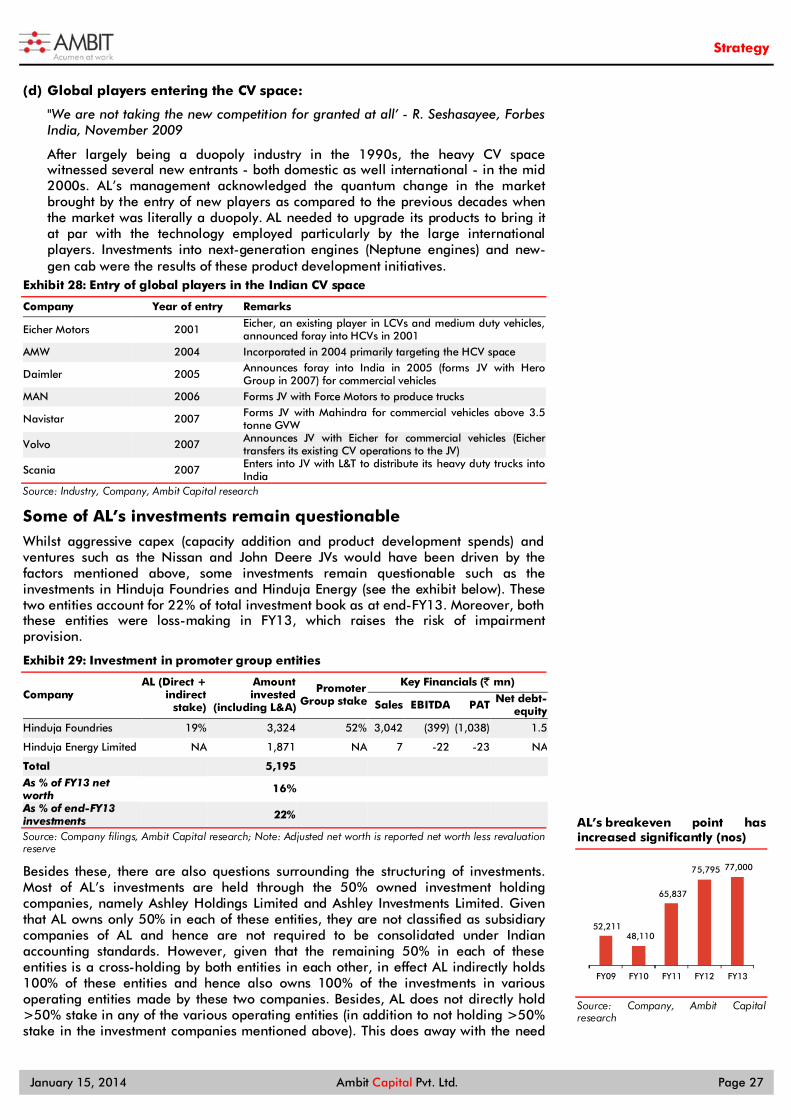
Strategy
January 15, 2014 Ambit Capital Pvt. Ltd. Page 27
(d) Global players entering the CV space:
"We are not taking the new competition for granted at all’ - R. Seshasayee, Forbes India, November 2009
After largely being a duopoly industry in the 1990s, the heavy CV space witnessed several new entrants - both domestic as well international - in the mid 2000s. AL’s management acknowledged the quantum change in the market brought by the entry of new players as compared to the previous decades when the market was literally a duopoly. AL needed to upgrade its products to bring it at par with the technology employed particularly by the large international players. Investments into next-generation engines (Neptune engines) and new-gen cab were the results of these product development initiatives.
Exhibit 28: Entry of global players in the Indian CV space
Company Year of entry Remarks
Eicher Motors 2001 Eicher, an existing player in LCVs and medium duty vehicles, announced foray into HCVs in 2001
AMW 2004 Incorporated in 2004 primarily targeting the HCV space
Daimler 2005 Announces foray into India in 2005 (forms JV with Hero Group in 2007) for commercial vehicles
MAN 2006 Forms JV with Force Motors to produce trucks
Navistar 2007 Forms JV with Mahindra for commercial vehicles above 3.5 tonne GVW
Volvo 2007 Announces JV with Eicher for commercial vehicles (Eicher transfers its existing CV operations to the JV)
Scania 2007 Enters into JV with L&T to distribute its heavy duty trucks into India
Source: Industry, Company, Ambit Capital research
Some of AL’s investments remain questionable
Whilst aggressive capex (capacity addition and product development spends) and ventures such as the Nissan and John Deere JVs would have been driven by the factors mentioned above, some investments remain questionable such as the investments in Hinduja Foundries and Hinduja Energy (see the exhibit below). These two entities account for 22% of total investment book as at end-FY13. Moreover, both these entities were loss-making in FY13, which raises the risk of impairment provision.
Exhibit 29: Investment in promoter group entities
Company AL (Direct +
indirect stake)
Amount invested
(including L&A)
Promoter Group stake
Key Financials (` mn)
Sales EBITDA PAT Net debt-equity
Hinduja Foundries 19% 3,324 52% 3,042 (399) (1,038) 1.5
Hinduja Energy Limited NA 1,871 NA 7 -22 -23 NA
Total 5,195 As % of FY13 net worth 16%
As % of end-FY13 investments 22% Source: Company filings, Ambit Capital research; Note: Adjusted net worth is reported net worth less revaluation reserve
Besides these, there are also questions surrounding the structuring of investments. Most of AL’s investments are held through the 50% owned investment holding companies, namely Ashley Holdings Limited and Ashley Investments Limited. Given that AL owns only 50% in each of these entities, they are not classified as subsidiary companies of AL and hence are not required to be consolidated under Indian accounting standards. However, given that the remaining 50% in each of these entities is a cross-holding by both entities in each other, in effect AL indirectly holds 100% of these entities and hence also owns 100% of the investments in various operating entities made by these two companies. Besides, AL does not directly hold >50% stake in any of the various operating entities (in addition to not holding >50% stake in the investment companies mentioned above). This does away with the need
AL’s breakeven point has increased significantly (nos)
Source: Company, Ambit Capital research
52,211 48,110
65,837
75,795 77,000
FY09 FY10 FY11 FY12 FY13

Strategy
January 15, 2014 Ambit Capital Pvt. Ltd. Page 28
for consolidation of financials of operating entities (JVs and associates) into Ashok Leyland’s accounts/financials.
Significant capex and investments have adversely impacted the financial performance of the company. It has necessitated an increase in borrowings (the net debt:equity of the company has increased from 0.03x as at end-FY08 to 1.37x as at end-FY13 and further to 1.9x as at end-1HFY14). It has also increased the overheads and depreciation expenses of the company (and has raised the breakeven level of the company). The impact has been exacerbated due to the slowdown in the MHCV industry since the beginning of FY13. Hence, earnings as well as return ratios have deteriorated significantly. Exhibit 30: Capex and investments have not only wiped out CFO but have also necessitated additional borrowings and increased net debt:equity (` mn)
(̀ mn) FY08 FY09 FY10 FY11 FY12 FY13 Cumulative FY08-13
Cash flow from operations (post tax) 10,657 (5,256) 10,902 5,914 11,171 7,283 40,670
Capex outflow (6,095) (7,579) (6,911) (3,501) (7,712) (6,492) (38,290)
Investments outflow 101 (171) 47 (9,038) (3,031) (5,136) (17,228)
Free-cash flow 4,663 (13,006) 4,038 (6,625) 427 (4,345) (14,847)
Interest payments (547) (939) (1,458) (1,549) (2,166) (3,628) (10,287) Dividend (incl div tax) payments - (2,335) (1,556) (2,327) (3,092) (3,092) (12,403)
Net Debt 711 18,701 16,850 23,887 30,653 43,415 42,704 Networth (ex- revaluation reserve) 21,266 21,090 23,356 26,567 28,948 31,585
Net debt-equity 0.03 0.89 0.72 0.90 1.06 1.37 EBITDA 8,187 4,694 7,628 12,137 12,561 8,770 Net debt-EBITDA 0.1 4.0 2.2 2.0 2.4 5.0 Source: Company filings, Ambit Capital research; Note: (1) Proceeds from sale of fixed assets not included above; (2) In calculation of net debt-equity above, reported net worth less revaluation reserve is used
The course correction “We see the slowdown as an opportunity to innovate and strategically take many decisions” – Vinod Dasari, Financial Express, December 2013
Whilst the MHCV industry remains subdued with yet no signs of recovery, the management has set a near-term strategy to bring about balance sheet improvement and help increase the profitability of the business. An outline of the management’s near term targets is shown in the exhibit below.
Exhibit 31: AL’s near-term strategy
Source: Company filings, Ambit Capital research
Augment cash (Rs7.5-10bn)
- Reducing working capital
- Divest non-core investments
- Selling off non-core assets
Cash realised would go towards reducing debt
Breakeven reduction(by 20-30% from 75-80k units to 50-55k units)
- Reduce manpower costs
- Reducing other overheads
- Reducing interest costs
Improving transparency
- Restructuring of investment holding
- To present consolidated accounts
Growth strategy
- Launch new products across LCVs, ICVs and HCVs
- Expand network (642 by FY14 end vs 451 in FY13)
- Grow exports and aftermarket services

Strategy
January 15, 2014 Ambit Capital Pvt. Ltd. Page 29
The company has sought to achieve four key targets:
Augment cash
The company plans to generate `7.5bn-10 bn through a combination of:
(a) Reduction in working capital: AL’s working capital is higher as compared to its peers (Tata Motors and Eicher Motors). The key reason for AL’s higher working capital is its higher-than-peer inventory levels. Viewed positively, higher inventory levels provide headroom for reduction.
Exhibit 32: AL’s working capital cycle vs peers
Average inventory days Average debtors days Average trade payable days Net op. working capital days
FY11 FY12 FY13 FY11 FY12 FY13 FY11 FY12 FY13 FY11 FY12 FY13
Ashok Leyland (AL) 63 63 60 36 34 39 82 72 77 17 25 22
VECV 23 25 27 22 21 26 52 61 60 (7) (14) (7)
Tata Motors 26 28 37 19 18 18 84 64 70 (39) (18) (15)
SML Isuzu 76 77 83 52 42 49 62 53 50 66 66 83
Average (ex-AL) 42 43 49 31 27 31 66 59 60 7 11 20
Divergence 21 20 11 5 7 7 16 13 17 10 14 2
Source: Company, Ambit Capital research
(b) Sale of non-core assets: This would include surplus assets including real estate in India as well as overseas entities.
(c) Divest non-core investments: This would include host of entities that the company had made investments over the years. We believe some of the key investments which could be considered for divestments are shown in the exhibit below.
Exhibit 33: Likely investments for divestments
Name of the entity (̀ mn) FY11 FY12 FY13
Hinduja Leyland Finance 1,350 3,394 5,089
Albonair GmBH 1,261 1,261 1,261
IndusInd Bank 921 1,514 980
Total 3,532 6,169 7,329
as % of Adjusted net worth 13% 21% 23%
as % of investments 29% 40% 31%
Source: Company, Ambit Capital research. Note: Investments above also include that held indirectly by AL through Ashley Investments and Ashley Holdings.
The cash so generated from the above measures would be used to reduce debt.
Break-even reduction
The company plans to bring down the break-even point by 20-30% (in other words bring down the break-even volumes from 75-80k units to 50-55k units) through reduction of costs across manpower costs, overheads and interest expenses. Savings in manpower costs would be achieved through reduction in manpower (replacement of temporary workforce with surplus permanent workers, VRS scheme to reduce 10% of the work-force and productivity enhancement) and salary cuts. Savings in interest expenses would be achieved through a combination of reduction in debt levels and interest rates (replacement of high-cost debt). Savings in overheads would be brought down by tightening spends on discretionary spends and closure of unproductive units.
Improving shareholders’ perception
As highlighted in the capital allocation section, the holding structure of the investments lends opaqueness to the consolidated picture for AL. However, this will be addressed through a change in the investment holding structure, as shown in the exhibit below. After the completion of this structuring, AL will have direct investments
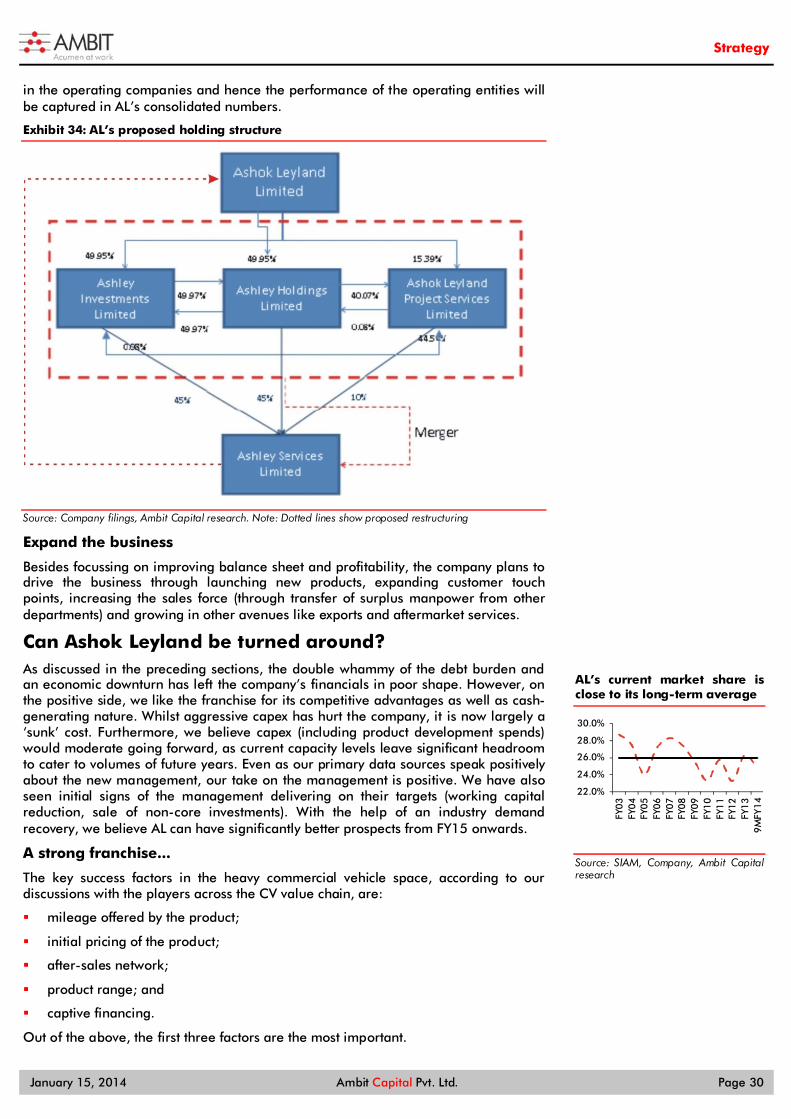
Strategy
January 15, 2014 Ambit Capital Pvt. Ltd. Page 30
in the operating companies and hence the performance of the operating entities will be captured in AL’s consolidated numbers.
Exhibit 34: AL’s proposed holding structure
Source: Company filings, Ambit Capital research. Note: Dotted lines show proposed restructuring
Expand the business
Besides focussing on improving balance sheet and profitability, the company plans to drive the business through launching new products, expanding customer touch points, increasing the sales force (through transfer of surplus manpower from other departments) and growing in other avenues like exports and aftermarket services.
Can Ashok Leyland be turned around? As discussed in the preceding sections, the double whammy of the debt burden and an economic downturn has left the company’s financials in poor shape. However, on the positive side, we like the franchise for its competitive advantages as well as cash-generating nature. Whilst aggressive capex has hurt the company, it is now largely a ‘sunk’ cost. Furthermore, we believe capex (including product development spends) would moderate going forward, as current capacity levels leave significant headroom to cater to volumes of future years. Even as our primary data sources speak positively about the new management, our take on the management is positive. We have also seen initial signs of the management delivering on their targets (working capital reduction, sale of non-core investments). With the help of an industry demand recovery, we believe AL can have significantly better prospects from FY15 onwards.
A strong franchise...
The key success factors in the heavy commercial vehicle space, according to our discussions with the players across the CV value chain, are:
mileage offered by the product;
initial pricing of the product;
after-sales network;
product range; and
captive financing.
Out of the above, the first three factors are the most important.
AL’s current market share is close to its long-term average
Source: SIAM, Company, Ambit Capital research
22.0%
24.0%
26.0%
28.0%
30.0%
FY03
FY04
FY05
FY06
FY07
FY08
FY09
FY10
FY11
FY12
FY13
9M
FY14

Strategy
January 15, 2014 Ambit Capital Pvt. Ltd. Page 31
AL performs well on most of these parameters which has helped the company command a strong franchise in the domestic CV space, particularly the heavy CV space. The company has a credible track record of maintaining its market share. Despite the entry of several players in the last decade, none of the players have been able to significantly dent the market share of these two top players – Tata Motors and AL. Several international renowned players have failed in the CV space.
Exhibit 35: Failures in the HCV space
Entity Remarks
Eicher Motors
Eicher's independent foray into heavy duty trucks space started on a positive note (with company gaining market share of 2.7% in FY05 on the back of aggressive pricing and heavy promotion expenses). However, the company could not sustain the initial success, with sales declining and margin plummeting. The company abandoned its independent foray and formed a JV with Volvo in 2008.
Mahindra-Navistar The JV formed in 2005 could not make inroads into the MHCV space garnering a market share of only 1.4% by FY13. The JV ended in December 2012 with Mahindra buying out the stake of Navistar.
Hero-Daimler The JV announced in 2005 did not take off. With market conditions deteriorating in FY09, the JV was dissolved in April 2009.
Man-Force The JV announced in 2006 failed to meet the expectations, resulting in Force Motors selling its stake to MAN in 2011
Source: Industry, Company
Whilst the duopoly nature of the industry renders itself vulnerable to the threat from new entrants, we believe the non-discretionary and rather highly value-conscious nature of the truck market leaves little room for error. Furthermore, we expect AL’s market share to be protected due to: (a) the opportunity for the company to gain market share in outside of its southern India stronghold; (b) it being the distant second-largest player (24.8% market share in 9MFY14) and hence higher risk of competition lying with the market leader, Tata Motors. Overall, we expect the market share in the HCV space to pan out as shown in the exhibit below.
Exhibit 36: Market share for the domestic MHCV Goods segment
Domestic MHCV Goods FY12 FY13 9MFY14E FY14E FY15E FY16E
Tata Motors 62.2% 56.6% 59.7% 57.5% 56.5% 55.3%
Ashok Leyland 20.2% 23.4% 20.9% 22.5% 22.5% 22.5%
Eicher Motors 11.2% 13.7% 13.2% 13.6% 14.3% 15.3%
Others 6.4% 6.3% 6.1% 6.4% 6.7% 6.9%
Source: SIAM, Ambit Capital research
Whilst defending its turf in the heavy commercial vehicle space, the company’s recent entry in the LCV space (Nissan JV) has been relatively successful. ‘Dost’ the first LCV goods carrier launched by the JV has, within a span of two years, recorded sales of 63k units (till December 2013) and garnered a market share of 7% in the LCV goods space.
…with robust cash generation
Despite having higher than peer group working capital, AL has always been a strong cash-generating company. The company’s CFO (before tax) as a percentage of EBITDA has averaged a strong 80% over the last ten years. (Excluding FY09 when working capital was impacted, due to severe financing crunch, this ratio was as high as 99%.) Thus, the company has a strong CFO (post tax) generation of `59bn. The quantum of CFO generated in the past ten years accounts for nearly 1.3x of the current market capitalisation of the company. We find the cash-generating profile of the company to be attractive.
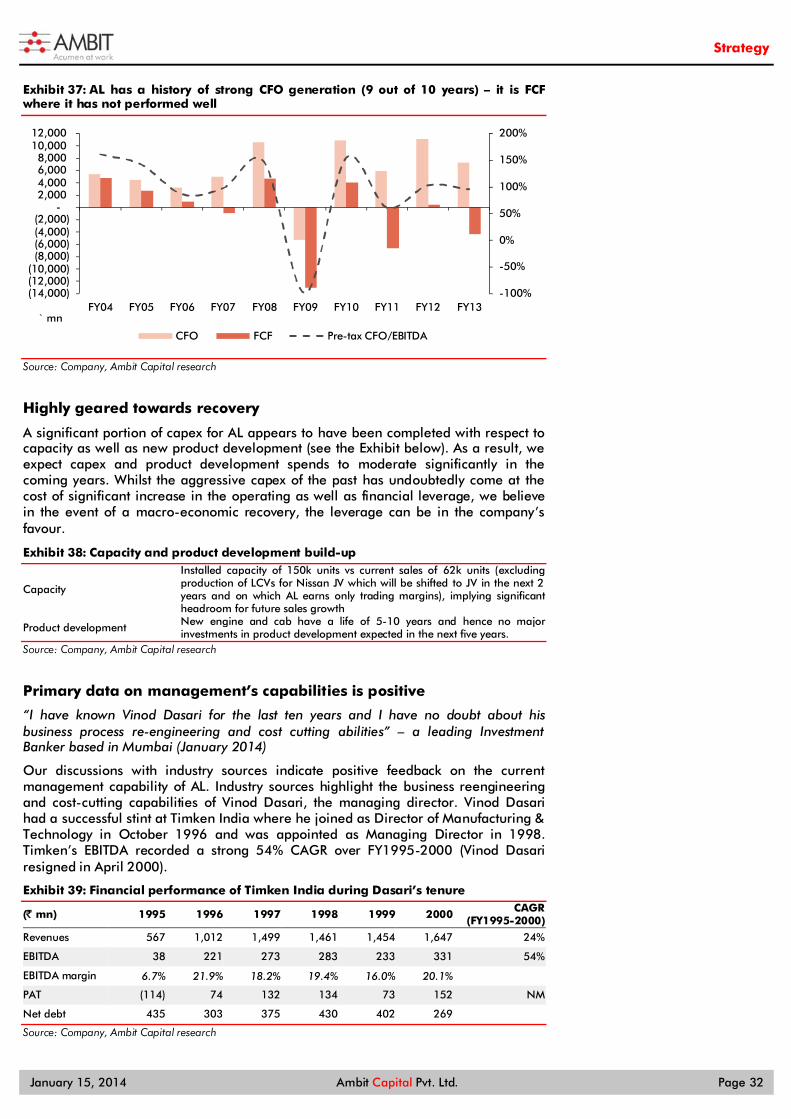
Strategy
January 15, 2014 Ambit Capital Pvt. Ltd. Page 32
Exhibit 37: AL has a history of strong CFO generation (9 out of 10 years) – it is FCF where it has not performed well
Source: Company, Ambit Capital research
Highly geared towards recovery
A significant portion of capex for AL appears to have been completed with respect to capacity as well as new product development (see the Exhibit below). As a result, we expect capex and product development spends to moderate significantly in the coming years. Whilst the aggressive capex of the past has undoubtedly come at the cost of significant increase in the operating as well as financial leverage, we believe in the event of a macro-economic recovery, the leverage can be in the company’s favour.
Exhibit 38: Capacity and product development build-up
Capacity
Installed capacity of 150k units vs current sales of 62k units (excluding production of LCVs for Nissan JV which will be shifted to JV in the next 2 years and on which AL earns only trading margins), implying significant headroom for future sales growth
Product development New engine and cab have a life of 5-10 years and hence no major investments in product development expected in the next five years.
Source: Company, Ambit Capital research
Primary data on management’s capabilities is positive
“I have known Vinod Dasari for the last ten years and I have no doubt about his business process re-engineering and cost cutting abilities” – a leading Investment Banker based in Mumbai (January 2014)
Our discussions with industry sources indicate positive feedback on the current management capability of AL. Industry sources highlight the business reengineering and cost-cutting capabilities of Vinod Dasari, the managing director. Vinod Dasari had a successful stint at Timken India where he joined as Director of Manufacturing & Technology in October 1996 and was appointed as Managing Director in 1998. Timken’s EBITDA recorded a strong 54% CAGR over FY1995-2000 (Vinod Dasari resigned in April 2000).
Exhibit 39: Financial performance of Timken India during Dasari’s tenure
(̀ mn) 1995 1996 1997 1998 1999 2000 CAGR (FY1995-2000)
Revenues 567 1,012 1,499 1,461 1,454 1,647 24%
EBITDA 38 221 273 283 233 331 54%
EBITDA margin 6.7% 21.9% 18.2% 19.4% 16.0% 20.1% PAT (114) 74 132 134 73 152 NM
Net debt 435 303 375 430 402 269 Source: Company, Ambit Capital research
-100%
-50%
0%
50%
100%
150%
200%
(14,000) (12,000) (10,000) (8,000) (6,000) (4,000) (2,000)
- 2,000 4,000 6,000 8,000
10,000 12,000
FY04 FY05 FY06 FY07 FY08 FY09 FY10 FY11 FY12 FY13
CFO FCF Pre-tax CFO/EBITDA
` mn

Strategy
January 15, 2014 Ambit Capital Pvt. Ltd. Page 33
More power to the management
Mr Vinod Dasari was appointed as the Managing Director of the company wef April 1, 2011. We learn that there was a dual reporting structure from April 2011 to March 2013 – reporting to both Mr R Seshasayee and Mr Dasari. However, wef April 1, 2013, the finance department now exclusively reports to Mr Dasari. We believe this gives greater empowerment to the current managing director.
A good beginning for the new management
We find a positive start to the targets set by the management.
Reduction in working capital: The operating working capital levels have come down from `12.9bn as at June 2013 to `9.1bn as at end-October 2013 driven by a significant `5.0bn reduction in inventory and `3.2decline in debtors (offset to some extent by reduction in creditors by `4.3bn).
Sale of non-core investments: In a positive start to its target of selling non-core assets, the company sold Defiance Testing & Engineering Services to US-based Exova. The company has realised a profit of `483mn on this sale. Furthermore, the company sold 0.56% stake in IndusInd Bank’s shares in December 2013 for `1.2bn (post this stake sale, the stake held in IndusInd Bank is 3.2% and worth `670mn at current market value of IndusInd Bank).
Reduction in manpower costs: The company announced a voluntary retirement scheme (VRS) for its executive cadre to reduce manpower costs. By December 20, 2013, the company has reduced its headcount by more than 500 workers (~10% of the executive headcount).
New launches: The company has been launching new products at regular intervals in the last 6-8 months (please refer to the exhibit below for details on their new launches).
Exhibit 40: New launches by AL in the last 6-8 months
Date Remarks
August 2013 Neptune engine launched. The first truck powered by Neptune engine is a 31 tonne multi-axle vehicle.
September 2013 Intermediate commercial vehicle ‘Boss’ launched (with gross vehicle weight of 9.6, 11.9 and 12.9 tonnes).
January 2014 Captain series of new heavy commercial vehicles launched.
Source: Industry, Company, Ambit Capital research
Bringing more transparency to reporting structure: The company has completed the merger of Ashley Holdings and Ashley Investments into Ashley Services Limited in August 2013. As a result, Ashley Services became a 100% subsidiary of AL. Recently in November 2013, the Board of Directors have approved the merger of Ashley Services into AL which is awaiting the approval of the court and other regulatory authorities.
Whilst currently the demand for the MHCV industry remains subdued, we remain positive on the long-term prospects of the industry due to: (a) its strong correlation with the macro-economy; (b) lack of competition (no significant threat of substitution from the railways); (c) improvement in road infrastructure over the long term; and (d) further strengthening of the hub and spoke model. With a moderating base, we expect the rate of decline in MHCV volumes to moderate from January 2014 and 4QFY14 to record a decline of 9%, much lower than the 27% decline seen in the first nine months of FY14. We expect industry volumes to recover in FY15 and witness a CAGR of 15% over FY14-16E.
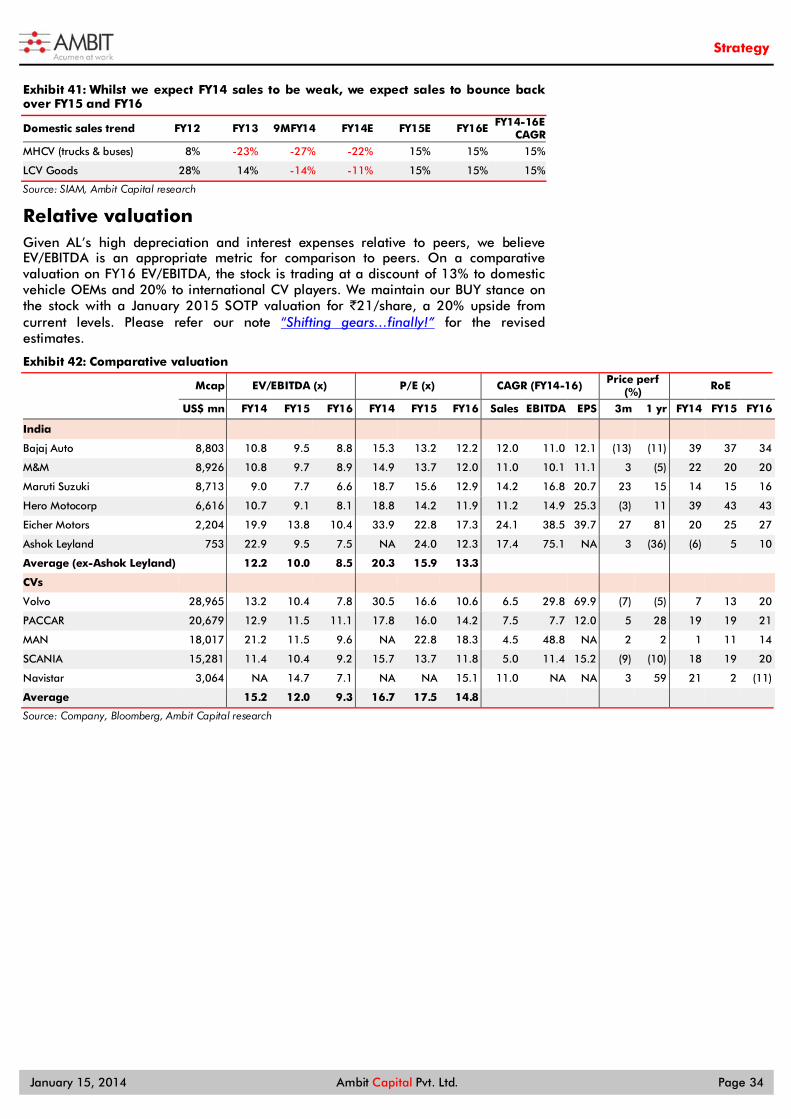
Strategy
January 15, 2014 Ambit Capital Pvt. Ltd. Page 34
Exhibit 41: Whilst we expect FY14 sales to be weak, we expect sales to bounce back over FY15 and FY16
Domestic sales trend FY12 FY13 9MFY14 FY14E FY15E FY16E FY14-16E CAGR
MHCV (trucks & buses) 8% -23% -27% -22% 15% 15% 15%
LCV Goods 28% 14% -14% -11% 15% 15% 15%
Source: SIAM, Ambit Capital research
Relative valuation Given AL’s high depreciation and interest expenses relative to peers, we believe EV/EBITDA is an appropriate metric for comparison to peers. On a comparative valuation on FY16 EV/EBITDA, the stock is trading at a discount of 13% to domestic vehicle OEMs and 20% to international CV players. We maintain our BUY stance on the stock with a January 2015 SOTP valuation for `21/share, a 20% upside from current levels. Please refer our note “Shifting gears…finally!” for the revised estimates.
Exhibit 42: Comparative valuation
Mcap EV/EBITDA (x) P/E (x) CAGR (FY14-16) Price perf
(%) RoE
US$ mn FY14 FY15 FY16 FY14 FY15 FY16 Sales EBITDA EPS 3m 1 yr FY14 FY15 FY16
India Bajaj Auto 8,803 10.8 9.5 8.8 15.3 13.2 12.2 12.0 11.0 12.1 (13) (11) 39 37 34
M&M 8,926 10.8 9.7 8.9 14.9 13.7 12.0 11.0 10.1 11.1 3 (5) 22 20 20
Maruti Suzuki 8,713 9.0 7.7 6.6 18.7 15.6 12.9 14.2 16.8 20.7 23 15 14 15 16
Hero Motocorp 6,616 10.7 9.1 8.1 18.8 14.2 11.9 11.2 14.9 25.3 (3) 11 39 43 43
Eicher Motors 2,204 19.9 13.8 10.4 33.9 22.8 17.3 24.1 38.5 39.7 27 81 20 25 27
Ashok Leyland 753 22.9 9.5 7.5 NA 24.0 12.3 17.4 75.1 NA 3 (36) (6) 5 10
Average (ex-Ashok Leyland) 12.2 10.0 8.5 20.3 15.9 13.3 CVs Volvo 28,965 13.2 10.4 7.8 30.5 16.6 10.6 6.5 29.8 69.9 (7) (5) 7 13 20
PACCAR 20,679 12.9 11.5 11.1 17.8 16.0 14.2 7.5 7.7 12.0 5 28 19 19 21
MAN 18,017 21.2 11.5 9.6 NA 22.8 18.3 4.5 48.8 NA 2 2 1 11 14
SCANIA 15,281 11.4 10.4 9.2 15.7 13.7 11.8 5.0 11.4 15.2 (9) (10) 18 19 20
Navistar 3,064 NA 14.7 7.1 NA NA 15.1 11.0 NA NA 3 59 21 2 (11)
Average 15.2 12.0 9.3 16.7 17.5 14.8 Source: Company, Bloomberg, Ambit Capital research

Strategy
January 15, 2014 Ambit Capital Pvt. Ltd. Page 35
Section 4: Bajaj Electricals Exhibit 43: Can Bajaj Electricals execute a turnaround?
Criteria Entry
How much has ROCE fallen over the past 5 years? RoCE has declined by 1,552bps from 23.9% in FY08 to 7.8% in FY13
Why did RoCE fall? E&P’s declining EBITDA margins (from 14.0% in FY08 to -17.3% in FY13) and falling capital employed turnover (from 12.4x in FY04 to 8.3x in FY13) has been the reason for the decline in RoCE
Has there been a change in management? Yes, Rakesh Markhedkar was appointed as CEO of the E&P business in July 2013, replacing the earlier CEO Lalit Mehta
Does the current management team have the credibility/credentials to execute a turnaround?
Rakesh Markhedkar has a credible track record. He is an alumnus of BITS Pilani and IIM Bangalore. Having worked for 13 years at L&T from (FY1991-FY2004), he later successfully turned around EMCO’s business (in FY06-10) and then KEI’s (in FY11-12).
Does the franchise have competitive advantages? In the consumer business, it is a leader in domestic appliances and among the top-3 across all the other categories. In the E&P business, PGCIL recently awarded BJE as the best company for on-time project completion.
Does the team have a specific, measurable, time bound turnaround plan? Yes; they have a target to achieve revenues of `18bn (vs `6.8bn in FY13) in FY15 and EBIT margin of 7% (vs EBIT loss of `1.2bn in FY13).
Source: Ambit Capital
A strong consumer franchise Incorporated in 1938 as a lighting company, Bajaj Electricals (BJE) today is a full-fledged consumer electrical company. It is a market leader in domestic appliances and a top-3 player across all other product categories like lighting, fans and luminaries. BJE’s competitive advantages in this business are its large distribution network, strong brand recall and accreditation with international brands, all of which is a feat that peers like Havells, Crompton Greaves and V-Guard have not been able to replicate.
Exhibit 44: Market share across product categories
Product Competitors BJE’s FY13 market share
Fans Crompton, Usha, Orient, Havells ~13%
Lightings Philips, Crompton, Surya, Wipro, Havells ~8%
Luminaries Philips, Crompton, Havells ~17%
Domestic Appliances
Lower Segment: Preethi, Prestige Market leader with a
market share of 15% in the organised market Premium Range: Philips, Black &
Decker, Havells, Braun, Kenwood Source: Industry, Ambit Capital research
Exhibit 45: Product offerings in the consumer business
Category Products
Consumer Durables Fans, Domestic Appliances (Mixer-Grinder, Toaster, Irons, etc.), Water Heaters, Induction cooktops, etc.
Lighting and Luminaries CFLs, Bulbs, LEDs, Industrial and Decorative Luminaries, Street Lights.
Source: Company, Ambit Capital research
Strong distribution network
Amongst the major electricals companies in India, BJE has the strongest distribution network with >400,000 retailers for its lighting and appliances products and >2,200 distributors across India. Whilst such a large distribution network has been built over a long period of time (as the company has been in this business for 75 years), its peers, Havells and V-Guard, are catching up by enhancing their own distribution networks.

Strategy
January 15, 2014 Ambit Capital Pvt. Ltd. Page 36
Exhibit 46: BJE has the strongest distribution network
V-Guard Havells Bajaj Electricals
Dealers/Distributors 301 distributors 2,500 dealers 2,200 distributors
Retailers 15,000 retailers and 3,548 channel partners
>100,000 400,000 retail outlets and 4,100 authorised dealers
Branches 28 94 19
In-house Nil 210 Havells “Galaxy” stores 30 “Bajaj World” stores
Source: Ambit Capital research
Accreditation with international brands
Renowned foreign brands like Walt Disney (#1 brand for children in the US) and Morphy Richards (the UK’s leading brand for domestic appliances) have tied up with BJE to distribute their products in India. These tie-ups are for a range of products such as fans, appliances, luminaries/lightings and domestic appliances.
These tie-ups, to some degree, are a reflection of BJE’s strong distribution network, credible brand recall, and superior after-sales service. Note that Morphy Richards had exited the Indian markets in the 1980s after an unsuccessful foray. However, it re-entered India in 2002 through an exclusive strategic tie-up with BJE to market and sell its products in India. Also, BJE manufactures some product categories like mixers and dry irons for Morphy to be sold in India and other markets. In stark contrast, Havells, Crompton Greaves and V-Guard do not have a single international tie-up.
Also, as compared to its peers, BJE has the largest distribution network across India. Apart from its very strong distribution network, the company also has strong brand recall, which is reflected in its strong margins despite minimal advertising spend.
Exhibit 47: Despite BJE’s advertising spends being the lowest amongst peers (figures represent ad spend as % of revenues) …
Source: Company, Ambit Capital research*We have included revenues of the consumer business only.
Exhibit 48: …its EBIT margin is comparable to peers
Source: Company, Ambit Capital research *We have included revenues of the consumer business only.
One of the advantages for BJE is its umbrella brand ‘Bajaj,’ according to several dealers when we asked them why BJE does not spend enough on advertisements. In other words, if Bajaj Auto advertises, the recall for brand ‘Bajaj’ gets a booster which in turn benefits all Bajaj Group companies including BJE. Also, BJE enjoys the first-mover advantage having been in existence since the last 75 years, which is not the case with either Havells or Crompton Greaves or any MNC like Legrand and Schneider. That said, BJE needs to step up its advertisement spend to keep the young generation aware of its brand. Whilst the old generation is quite aware about the brand given BJE’s long existence, BJE needs to keep the young generation interested
0%
1%
2%
3%
4%
5%
6%
7%
FY07 FY08 FY09 FY10 FY11 FY12 FY13
Havells
V-Guard
BJE*
4%
5%
6%
7%
8%
9%
10%
11%
12%
13%
14%
FY07 FY08 FY09 FY10 FY11 FY12 FY13
BJE*
V-Guard
Havells*
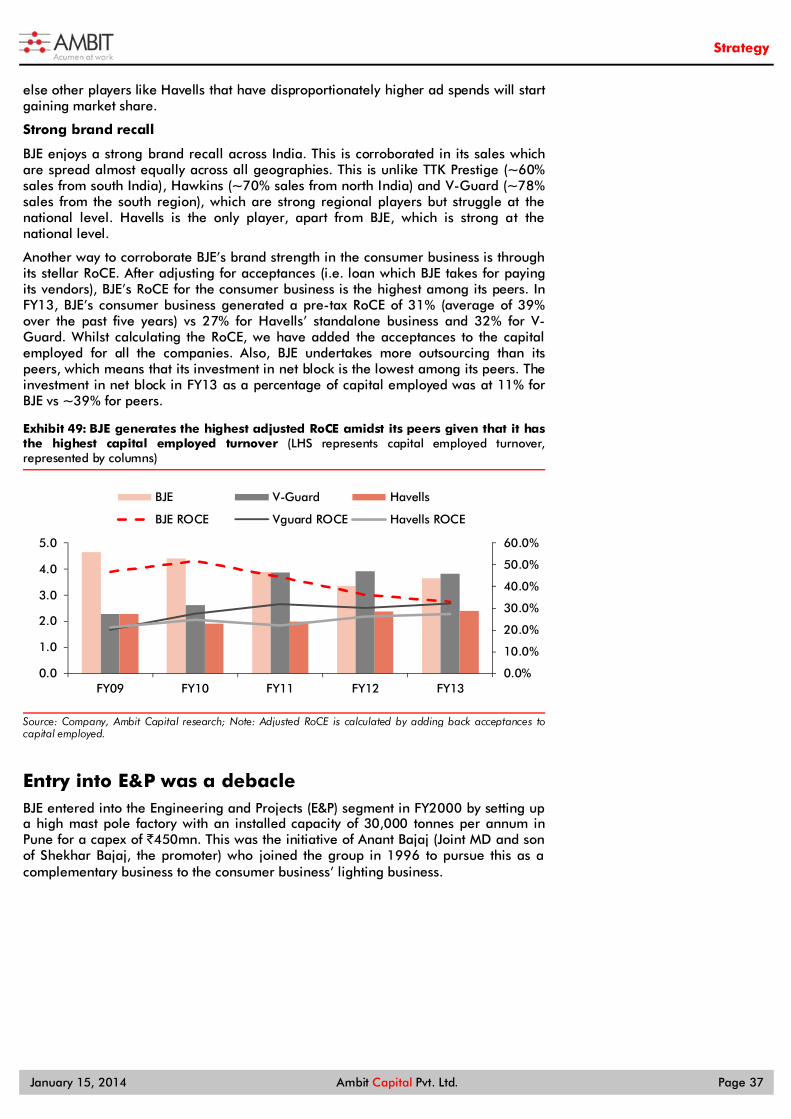
Strategy
January 15, 2014 Ambit Capital Pvt. Ltd. Page 37
else other players like Havells that have disproportionately higher ad spends will start gaining market share.
Strong brand recall
BJE enjoys a strong brand recall across India. This is corroborated in its sales which are spread almost equally across all geographies. This is unlike TTK Prestige (~60% sales from south India), Hawkins (~70% sales from north India) and V-Guard (~78% sales from the south region), which are strong regional players but struggle at the national level. Havells is the only player, apart from BJE, which is strong at the national level.
Another way to corroborate BJE’s brand strength in the consumer business is through its stellar RoCE. After adjusting for acceptances (i.e. loan which BJE takes for paying its vendors), BJE’s RoCE for the consumer business is the highest among its peers. In FY13, BJE’s consumer business generated a pre-tax RoCE of 31% (average of 39% over the past five years) vs 27% for Havells’ standalone business and 32% for V-Guard. Whilst calculating the RoCE, we have added the acceptances to the capital employed for all the companies. Also, BJE undertakes more outsourcing than its peers, which means that its investment in net block is the lowest among its peers. The investment in net block in FY13 as a percentage of capital employed was at 11% for BJE vs ~39% for peers.
Exhibit 49: BJE generates the highest adjusted RoCE amidst its peers given that it has the highest capital employed turnover (LHS represents capital employed turnover, represented by columns)
Source: Company, Ambit Capital research; Note: Adjusted RoCE is calculated by adding back acceptances to capital employed.
Entry into E&P was a debacle BJE entered into the Engineering and Projects (E&P) segment in FY2000 by setting up a high mast pole factory with an installed capacity of 30,000 tonnes per annum in Pune for a capex of `450mn. This was the initiative of Anant Bajaj (Joint MD and son of Shekhar Bajaj, the promoter) who joined the group in 1996 to pursue this as a complementary business to the consumer business’ lighting business.
0.0%
10.0%
20.0%
30.0%
40.0%
50.0%
60.0%
0.0
1.0
2.0
3.0
4.0
5.0
FY09 FY10 FY11 FY12 FY13
BJE V-Guard Havells
BJE ROCE Vguard ROCE Havells ROCE
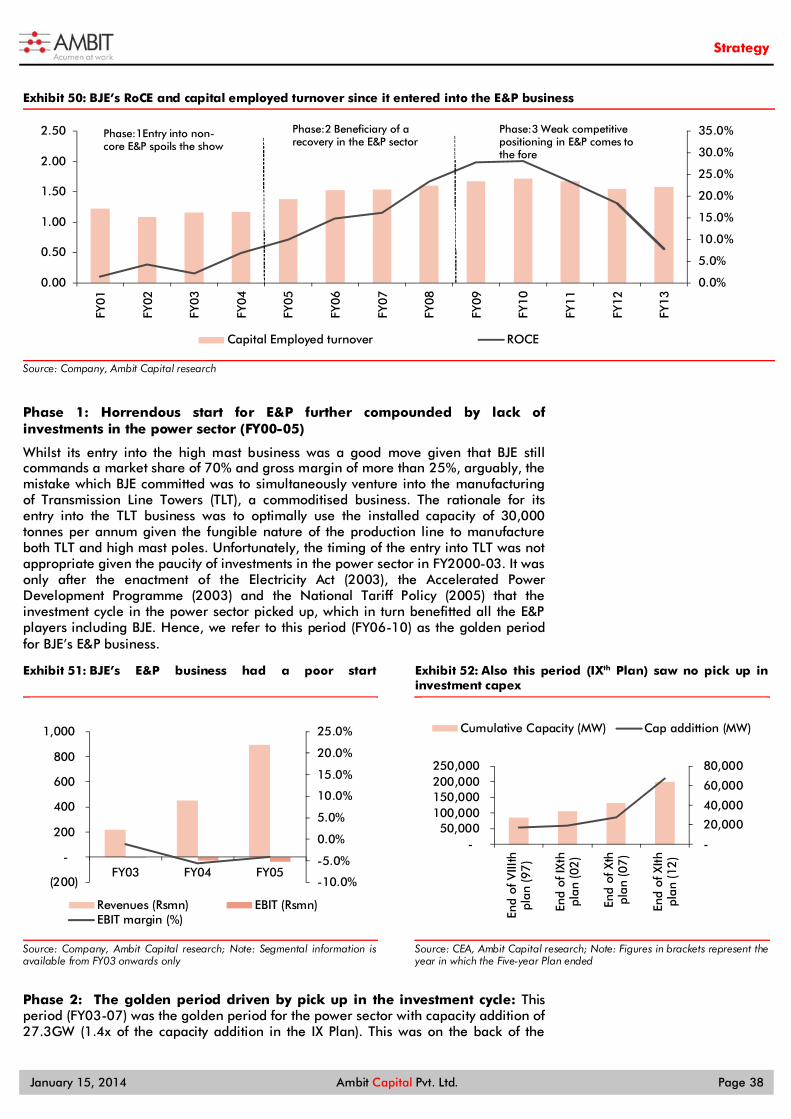
Strategy
January 15, 2014 Ambit Capital Pvt. Ltd. Page 38
Exhibit 50: BJE’s RoCE and capital employed turnover since it entered into the E&P business
Source: Company, Ambit Capital research
Phase 1: Horrendous start for E&P further compounded by lack of investments in the power sector (FY00-05)
Whilst its entry into the high mast business was a good move given that BJE still commands a market share of 70% and gross margin of more than 25%, arguably, the mistake which BJE committed was to simultaneously venture into the manufacturing of Transmission Line Towers (TLT), a commoditised business. The rationale for its entry into the TLT business was to optimally use the installed capacity of 30,000 tonnes per annum given the fungible nature of the production line to manufacture both TLT and high mast poles. Unfortunately, the timing of the entry into TLT was not appropriate given the paucity of investments in the power sector in FY2000-03. It was only after the enactment of the Electricity Act (2003), the Accelerated Power Development Programme (2003) and the National Tariff Policy (2005) that the investment cycle in the power sector picked up, which in turn benefitted all the E&P players including BJE. Hence, we refer to this period (FY06-10) as the golden period for BJE’s E&P business.
Exhibit 51: BJE’s E&P business had a poor start
Source: Company, Ambit Capital research; Note: Segmental information is available from FY03 onwards only
Exhibit 52: Also this period (IXth Plan) saw no pick up in investment capex
Source: CEA, Ambit Capital research; Note: Figures in brackets represent the year in which the Five-year Plan ended
Phase 2: The golden period driven by pick up in the investment cycle: This period (FY03-07) was the golden period for the power sector with capacity addition of 27.3GW (1.4x of the capacity addition in the IX Plan). This was on the back of the
0.0%
5.0%
10.0%
15.0%
20.0%
25.0%
30.0%
35.0%
0.00
0.50
1.00
1.50
2.00
2.50
FY01
FY02
FY03
FY04
FY05
FY06
FY07
FY08
FY09
FY10
FY11
FY12
FY13
Capital Employed turnover ROCE
Phase:1Entry into non-core E&P spoils the show
Phase:2 Beneficiary of a recovery in the E&P sector
Phase:3 Weak competitive positioning in E&P comes to the fore
-10.0%
-5.0%
0.0%
5.0%
10.0%
15.0%
20.0%
25.0%
(200)
-
200
400
600
800
1,000
FY03 FY04 FY05
Revenues (Rsmn) EBIT (Rsmn)EBIT margin (%)
-
20,000
40,000
60,000
80,000
- 50,000
100,000 150,000 200,000 250,000
End
of V
IIIth
plan
(97
)
End
of IX
thpl
an (0
2)
End
of X
thpl
an (0
7)
End
of X
Ithpl
an (1
2)
Cumulative Capacity (MW) Cap addittion (MW)

Strategy
January 15, 2014 Ambit Capital Pvt. Ltd. Page 39
Government announcing the reforms mentioned in the previous paragraph. This also helped BJE’s E&P segment to deliver good results despite the business not having any sustainable competitive advantage. The EBIT margin in the E&P segment improved from -4.4% over FY2002-05 (phase 1; note data is not available for 2000 and 2001; also part of the phase 1 period) to 12% over FY06-10 (phase 2) and consequently the company’s RoCE also improved from 4.6% over FY2002-05 (phase 1; note data is not available for 2000 and 2001; also part of the phase 1 period) to 18.4% over FY06-10 (phase 2).
Exhibit 53: The reforms announced during the Xth Plan…
Reforms Objective Recommendation Results
Electricity Act, 2003 Open up the electricity sector
De-license power generation except hydro. Power generation has been de-licensed since June 2003.
De-license distribution in rural areas. Distribution and generation has been de-licensed in rural areas.
Allow open access to captive generation.
Open access allowed for captive players to carry electricity from generating plant to destination of use since June 2003.
Ahluwalia Committee, FY03 Restructure SEBs Secure payment of State Electricity
Boards (SEB) through bond issuance.
50% of interest payments were waived and the balance of dues including the principle amount was securitised through bonds issued by respective state governments.
Accelerated Power Development Reform Program, FY03
Initiate financial turnaround
Upgradation of transmission and distribution network thereby reducing aggregate technical and commercial (AT&C) losses.
AT&C losses reduced to 28% in FY09 from 33% in FY03.
National Tariff Policy, 2005 Intensify Competition
Introduce competitive bidding. Competitive bidding was introduced in Jan 2005 under section 63 of the Electricity Act, 2003.
Alter tariff structure to remove cap on ROE.
Case 1 bidding (vide Power Purchase Agreement) was introduced under section 63 of the Electricity Act 2003. In this case no escalation is allowed for any increase in fuel prices.
Source: Industry, Ambit Capital research
Exhibit 54: ..which helped ignite the investment cycle in the power sector …
Source: CEA, Ambit Capital research
Exhibit 55: … and this in turn helped BJE’s E&P division deliver stellar results
Source: Company, Ambit Capital research
Phase 3: E&P business slips into the red due to execution issues and cut-throat competition: Post FY10 as the power sector slipped into recession mode, the competitive intensity started rising with E&P players cutting prices to win orders. This resulted in BJE accepting orders at lower margins. However, experienced players like KEC and Kalpataru started diversifying into international markets where margins were relatively better. Consequently, whilst their profitability was hit, they continued to still report profits as opposed to the losses reported by BJE’ E&P division. Another challenge for BJE’s management was faulty project execution. In its greed of aggressive revenue recognition, BJE’s E&P team started dumping raw materials on site. However, when the time came for execution, they were in for a nasty surprise as there were high pilferages and consequent losses. Another problem was aggression
1013
19
33
050,000
100,000150,000200,000250,000300,000350,000
IX Plan X Plan XI Plan E XII Plan E
(MW
)
05101520253035
(%)
Total capacity (LHS) Private sector (LHS)Private sector share (RHS)
-10.0%
-5.0%
0.0%
5.0%
10.0%
15.0%
(2,000)
-
2,000
4,000
6,000
8,000
FY03
FY04
FY05
FY06
FY07
FY08
FY09
FY10
Reveues (Rsmn) EBIT (Rsmn) EBIT margin (%)
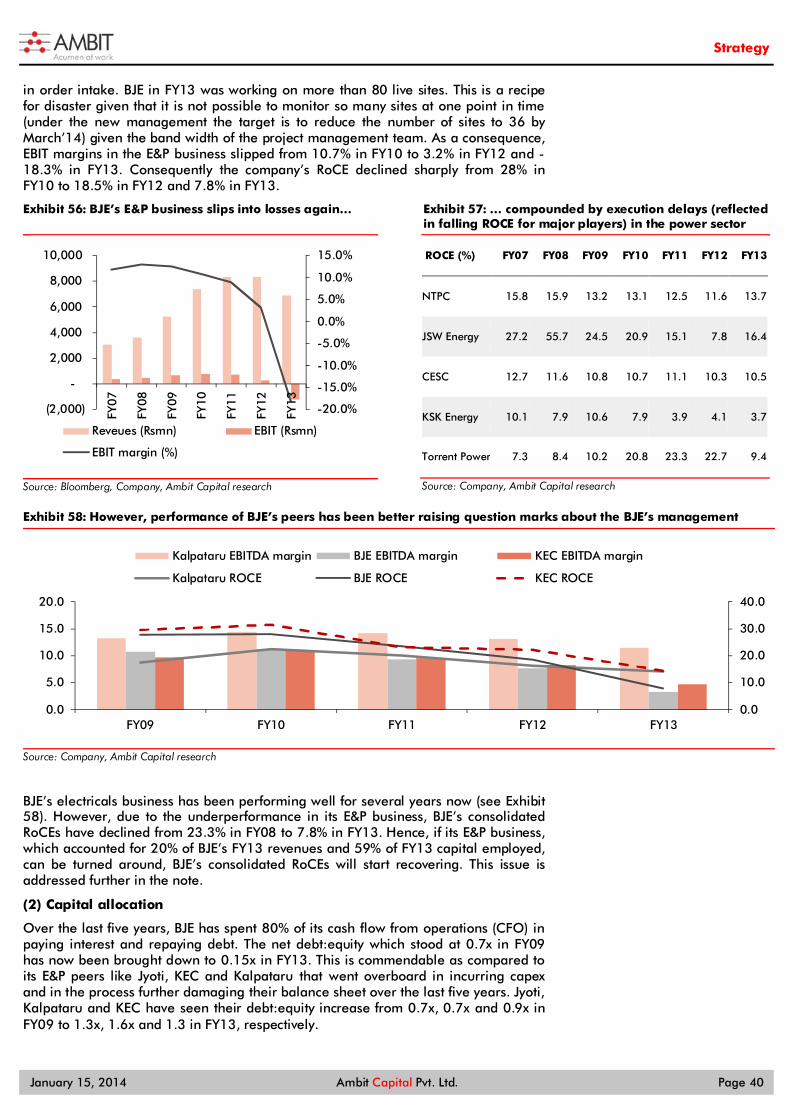
Strategy
January 15, 2014 Ambit Capital Pvt. Ltd. Page 40
in order intake. BJE in FY13 was working on more than 80 live sites. This is a recipe for disaster given that it is not possible to monitor so many sites at one point in time (under the new management the target is to reduce the number of sites to 36 by March’14) given the band width of the project management team. As a consequence, EBIT margins in the E&P business slipped from 10.7% in FY10 to 3.2% in FY12 and -18.3% in FY13. Consequently the company’s RoCE declined sharply from 28% in FY10 to 18.5% in FY12 and 7.8% in FY13.
Exhibit 56: BJE’s E&P business slips into losses again…
Source: Bloomberg, Company, Ambit Capital research
Exhibit 57: … compounded by execution delays (reflected in falling ROCE for major players) in the power sector
ROCE (%) FY07 FY08 FY09 FY10 FY11 FY12 FY13
NTPC 15.8 15.9 13.2 13.1 12.5 11.6 13.7
JSW Energy 27.2 55.7 24.5 20.9 15.1 7.8 16.4
CESC 12.7 11.6 10.8 10.7 11.1 10.3 10.5
KSK Energy 10.1 7.9 10.6 7.9 3.9 4.1 3.7
Torrent Power 7.3 8.4 10.2 20.8 23.3 22.7 9.4
Source: Company, Ambit Capital research
Exhibit 58: However, performance of BJE’s peers has been better raising question marks about the BJE’s management
Source: Company, Ambit Capital research
BJE’s electricals business has been performing well for several years now (see Exhibit 58). However, due to the underperformance in its E&P business, BJE’s consolidated RoCEs have declined from 23.3% in FY08 to 7.8% in FY13. Hence, if its E&P business, which accounted for 20% of BJE’s FY13 revenues and 59% of FY13 capital employed, can be turned around, BJE’s consolidated RoCEs will start recovering. This issue is addressed further in the note.
(2) Capital allocation
Over the last five years, BJE has spent 80% of its cash flow from operations (CFO) in paying interest and repaying debt. The net debt:equity which stood at 0.7x in FY09 has now been brought down to 0.15x in FY13. This is commendable as compared to its E&P peers like Jyoti, KEC and Kalpataru that went overboard in incurring capex and in the process further damaging their balance sheet over the last five years. Jyoti, Kalpataru and KEC have seen their debt:equity increase from 0.7x, 0.7x and 0.9x in FY09 to 1.3x, 1.6x and 1.3 in FY13, respectively.
-20.0%
-15.0%
-10.0%
-5.0%
0.0%
5.0%
10.0%
15.0%
(2,000)
-
2,000
4,000
6,000
8,000
10,000
FY07
FY08
FY09
FY10
FY11
FY12
FY13
Reveues (Rsmn) EBIT (Rsmn)
EBIT margin (%)
0.0
10.0
20.0
30.0
40.0
0.0
5.0
10.0
15.0
20.0
FY09 FY10 FY11 FY12 FY13
Kalpataru EBITDA margin BJE EBITDA margin KEC EBITDA margin
Kalpataru ROCE BJE ROCE KEC ROCE
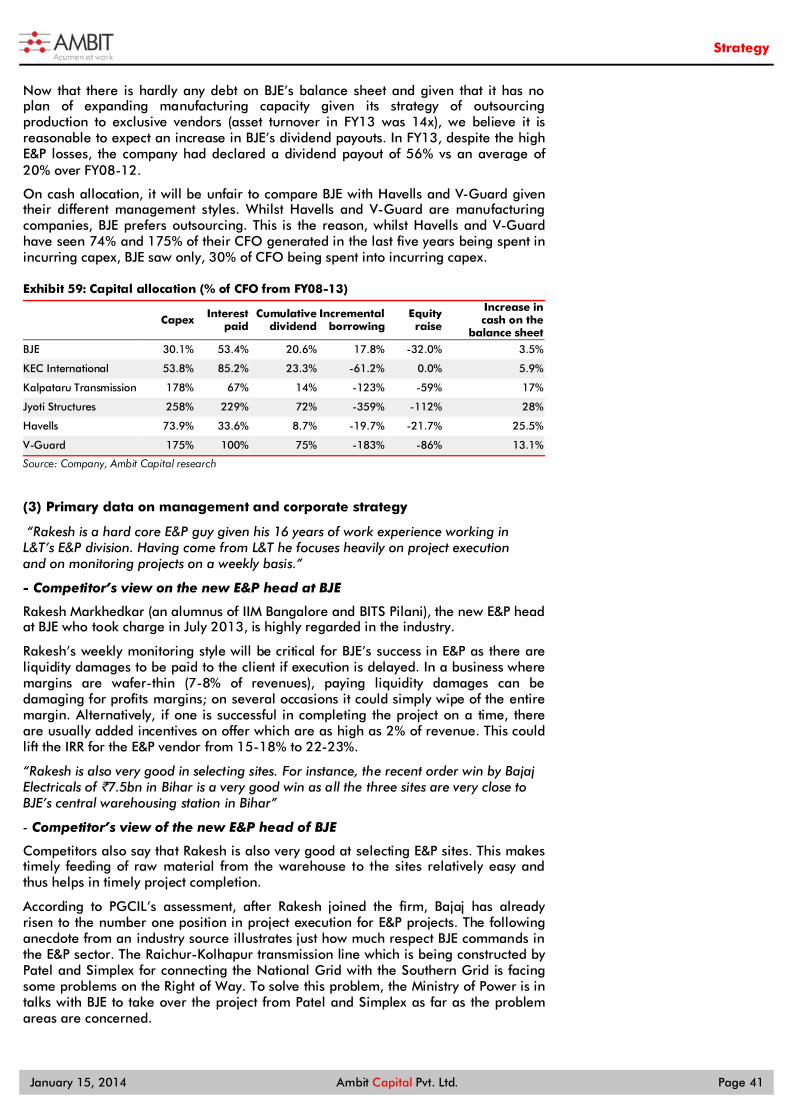
Strategy
January 15, 2014 Ambit Capital Pvt. Ltd. Page 41
Now that there is hardly any debt on BJE’s balance sheet and given that it has no plan of expanding manufacturing capacity given its strategy of outsourcing production to exclusive vendors (asset turnover in FY13 was 14x), we believe it is reasonable to expect an increase in BJE’s dividend payouts. In FY13, despite the high E&P losses, the company had declared a dividend payout of 56% vs an average of 20% over FY08-12.
On cash allocation, it will be unfair to compare BJE with Havells and V-Guard given their different management styles. Whilst Havells and V-Guard are manufacturing companies, BJE prefers outsourcing. This is the reason, whilst Havells and V-Guard have seen 74% and 175% of their CFO generated in the last five years being spent in incurring capex, BJE saw only, 30% of CFO being spent into incurring capex.
Exhibit 59: Capital allocation (% of CFO from FY08-13)
Capex Interest paid
Cumulative dividend
Incremental borrowing
Equity raise
Increase in cash on the
balance sheet
BJE 30.1% 53.4% 20.6% 17.8% -32.0% 3.5%
KEC International 53.8% 85.2% 23.3% -61.2% 0.0% 5.9%
Kalpataru Transmission 178% 67% 14% -123% -59% 17%
Jyoti Structures 258% 229% 72% -359% -112% 28%
Havells 73.9% 33.6% 8.7% -19.7% -21.7% 25.5%
V-Guard 175% 100% 75% -183% -86% 13.1%
Source: Company, Ambit Capital research
(3) Primary data on management and corporate strategy
“Rakesh is a hard core E&P guy given his 16 years of work experience working in L&T’s E&P division. Having come from L&T he focuses heavily on project execution and on monitoring projects on a weekly basis.”
- Competitor’s view on the new E&P head at BJE
Rakesh Markhedkar (an alumnus of IIM Bangalore and BITS Pilani), the new E&P head at BJE who took charge in July 2013, is highly regarded in the industry.
Rakesh’s weekly monitoring style will be critical for BJE’s success in E&P as there are liquidity damages to be paid to the client if execution is delayed. In a business where margins are wafer-thin (7-8% of revenues), paying liquidity damages can be damaging for profits margins; on several occasions it could simply wipe of the entire margin. Alternatively, if one is successful in completing the project on a time, there are usually added incentives on offer which are as high as 2% of revenue. This could lift the IRR for the E&P vendor from 15-18% to 22-23%.
“Rakesh is also very good in selecting sites. For instance, the recent order win by Bajaj Electricals of `7.5bn in Bihar is a very good win as all the three sites are very close to BJE’s central warehousing station in Bihar”
- Competitor’s view of the new E&P head of BJE
Competitors also say that Rakesh is also very good at selecting E&P sites. This makes timely feeding of raw material from the warehouse to the sites relatively easy and thus helps in timely project completion.
According to PGCIL’s assessment, after Rakesh joined the firm, Bajaj has already risen to the number one position in project execution for E&P projects. The following anecdote from an industry source illustrates just how much respect BJE commands in the E&P sector. The Raichur-Kolhapur transmission line which is being constructed by Patel and Simplex for connecting the National Grid with the Southern Grid is facing some problems on the Right of Way. To solve this problem, the Ministry of Power is in talks with BJE to take over the project from Patel and Simplex as far as the problem areas are concerned.
Strategy
January 15, 2014 Ambit Capital Pvt. Ltd. Page 42
“Shekhar Bajaj comes across as very professional with fair business practices. The professionalism has been imposed by Mr. Ramakrishna Bajaj, Shekhar’s father.”
– View of a merchant banker who has dealt with BJE
The level of professionalism of the BJE promoter is personified from the fact that when Mr. Ramakrishnan (the former Executive Director) left the company on less-than-ideal terms, Shekhar Bajaj sent a letter to all the dealers thanking Mr Ramakrishnan for the work which he had done for the company. Mr Ramakrishnan was instrumental in pulling the company out from financial distress in the late 1990s when PAT started eroding from `70.8mn to `13.9mn. He was also instrumental in signing up Morphy Richards, a tie-up which has been a great success for Bajaj.
Compared with Havells, the promoters of Bajaj are far less aggressive when it comes to pursuing growth. This is largely because Shekhar Bajaj is not an aggressive person.
Moreover, the top management never interferes in the day-to-day businesses. All VPs and senior VPs are extremely empowered. This is also corroborated from the fact that when Mr. Ramakrishnan left the company to join Polycab, the business was not impacted. Now the business is run by Mr. Tandon who has been with the company for more than 30 years.
That said, there are question marks around some of Anant Bajaj’s (promoter’s son, who is now the Joint MD) decisions. Other than launching the foray into E&P in the late 1990s, he also seems undecided on whether BJE should keep this business or divest it.
“Bajaj has about 200 vendors. Nearly 70% of these are dedicated vendors and the majority of these vendors are third-generation.”
– A vendor’s view on Bajaj
The BJE vendors that we have met are generally happy with the company as:
Bajaj helps the vendors by facilitating a tie-up with global partners. For example, Konark, a dealer who manufactures luminaries and street lighting was able to a tie-up with GE thanks to BJE’s facilitation.
Bajaj helps vendors during financial stress. For instance, Bajaj infused equity of `75mn into a Nashik-based vendor called Starlite which manufactures CFLs. Subsequently the company performed well, with its turnover increasing from `270mn in FY08 to `1bn in FY11).
Bajaj helps vendors in optimising production cost. A large number of vendors were helped in moving their production base to Himachal Pradesh, Uttarakhand and other similar locations for cost-effective production.
Bajaj funds the capex of vendors and then subsequently recovers the outlay in the form of lease rentals.
“Bajaj is a very professional set-up. The degree of empowerment that Bajaj gives to its middle management is far greater than that given by any other firm in the industry. This is evident from the level of attrition at the senior management level, which is amongst the lowest at Bajaj.”
– A dealer’s view on Bajaj
In comparison to Havells, BJE has more attrition. There have been several instances wherein dealers have been aggrieved with the attrition at the Vice President (VP) level in Havells. This is because the VPs might have promised a particular dealer certain incentives on hitting certain milestones but when that VP resigned, the incentives never came through as the new VP was not aware of the commitments given by his predecessor. Therefore some dealers have now resorted to reaching out to Qimat Rai Gupta’s team to take commitments on the incentives promised.

Strategy
January 15, 2014 Ambit Capital Pvt. Ltd. Page 43
“The strength of Bajaj’s distribution network is corroborated from the success of Morphy Richards which has seen a phenomenal jump in sales since it has tied up with the company. Sales increased from `570mn in FY09 to `1.4bn in FY12.”
– A consultant’s view on Bajaj’s distribution network
As seen in Exhibit 46, BJE’s distribution network is the strongest amongst its Indian electrical peers. Also, the network diversified across geographies. The strength of BJE’s distribution network is corroborated by the success of Morphy Richards which has seen a major jump in its sales since it has tied up with the company (sales increased from `570mn in FY09 to `1.4bn in FY12). In small appliances, Morphy’s sales are now higher in India than in the UK, its home market.
Note that Morphy earlier came to India in the 1980s, and it made losses and subsequently withdrew. However, in November 2002, it re-entered India by tying up with Bajaj. The arrangement was that Bajaj would pay a royalty of 2-2.5% in return for Morphy sharing the technological know-how.
(4) The turnaround strategy
New management to the rescue
BJE’s electricals business has been performing well for several years now (see Exhibit 49). Hence, if its E&P business, which accounts for 20% of its FY13 revenues and 59% of FY13 capital employed, can be turned around, BJE’s consolidated RoCEs will start recovering (consolidated ROCE have declined from 23.3% in FY08 to 7.8% in FY13).
Exhibit 60: BJE’s key financials (in ` mn)
Bajaj Electricals FY11 FY12 FY13 FY14E FY15E
Engineering & Projects
Revenue 8,318 8,320 6,879 9,964 13,746
EBITDA 789 333 -1,178 -423 646
EBIT 740 265 -1,243 -498 550
ROCE 15.8% 5.2% -25.2% -8.8% 7.2%
Consolidated
Revenue 27,413 30,990 33,875 40,856 50,396
EBITDA 2,549 2,371 1,109 2,286 3,841
EBIT 2,441 2,246 965 2,135 3,651
ROCE 23.5% 18.5% 7.8% 14.2% 20.4%
Source: Company, Ambit Capital research; Note: FY14 and FY15 are Ambit estimates
As BJE started making losses in E&P in FY13, the promoter, Shekhar Bajaj, realised that the division faced management challenges. He has been candid about these issues during analyst conference calls and has blamed the company’s execution strategy for the debacle. Executing projects too many sites at one point in time and dumping raw material at site in an endeavour to show more revenues only to realise subsequently that there have been pilferages were some of the mistakes that the management made.
Hence, in CY12, Shekhar Bajaj decided it was now time to announce a change in leadership. This time around he was clear that he wants to hire an industry expert who had a proven track record in project execution. The earlier E&P head, Lalit Mehta, was an internal veteran who started his career as an intern in Bajaj Electricals. After six months of persuasion, Shekhar Bajaj brought Rakesh Markhedkar on board in November 2012. Rakesh became the E&P head in July 2013.
Rakesh has had an illustrious career spanning over 24 years in the E&P sector. In industry circles, Rakesh is referred to as a turnaround specialist given his stint at EMCO and KEI Industries After graduation with an engineering degree from BITS Pilani and then an MBA from IIM Bangalore, Rakesh joined L&T in 1990. He worked there for 13 years (from July 1990- August 2003) as a senior manager executing

Strategy
January 15, 2014 Ambit Capital Pvt. Ltd. Page 44
power and infrastructure projects on EPC basis. From there he joined EMCO as a CEO (August 2005- February 2010) wherein he was responsible for execution of power T&D projects.
When he started in 2005, EMCO had revenues and RoEs of `1.5bn and 3.6% respectively. When he left in 2010, revenues had reached to `9.8bn and RoEs had risen to 8.1%. The average RoE during Rakesh’s stint was 15%, with the highest being 18.8% in FY07.
Rakesh then went to KEI Industries as its CEO (March 2010 – July 2011) wherein he was in charge of EPC Power, projects of EHV cabling, transmission line and substation and power distribution. At KEI too he did a stellar job, lifting the revenues from `9.1bn in FY10 to `18bn in FY12 when he left. Also RoEs doubled from 11% in FY10 to 21.3% in FY12.
Emco, on the other hand, during this (post-Rakesh) period saw flat revenues and declining RoEs (from 8% in FY10 to 1.5% in FY12). From KEI he moved on as CEO of the Era Group (July 2011 - October 2012) wherein he was in charge of power EPC.
Exhibit 61: Rakesh’s stint at EMCO Transformers
Source: Company, Ambit Capital research
Exhibit 62: Rakesh’s stint at KEI Industries
Source: Company, Ambit Capital research
After joining BJE in November 2012 and after officially taking over as CEO of E&P in July 2013, Rakesh has brought his execution team to BJE. The team has realised that they needed to address loop holes in project execution.
-10-50510152025
-
2,000
4,000
6,000
8,000
10,000
12,000
FY03 FY04 FY05 FY06 FY07 FY08 FY09 FY10 FY11 FY12 FY13
Revenues EBITDA ROE (RHS)
Phase1: Before Rakesh joined the company
Phase 2: Rakesh was the CEO of the business
Phase 3: Rakesh left the company
0.05.010.015.020.025.030.035.040.0
-
5,000
10,000
15,000
20,000
FY03 FY04 FY05 FY06 FY07 FY08 FY09 FY10 FY11 FY12 FY13
Revenues EBITDA ROCE
Phase1: Before Rakesh joined the company Phase 2: Rakeshwas the CEO of the business
Phase 3: Rakesh left
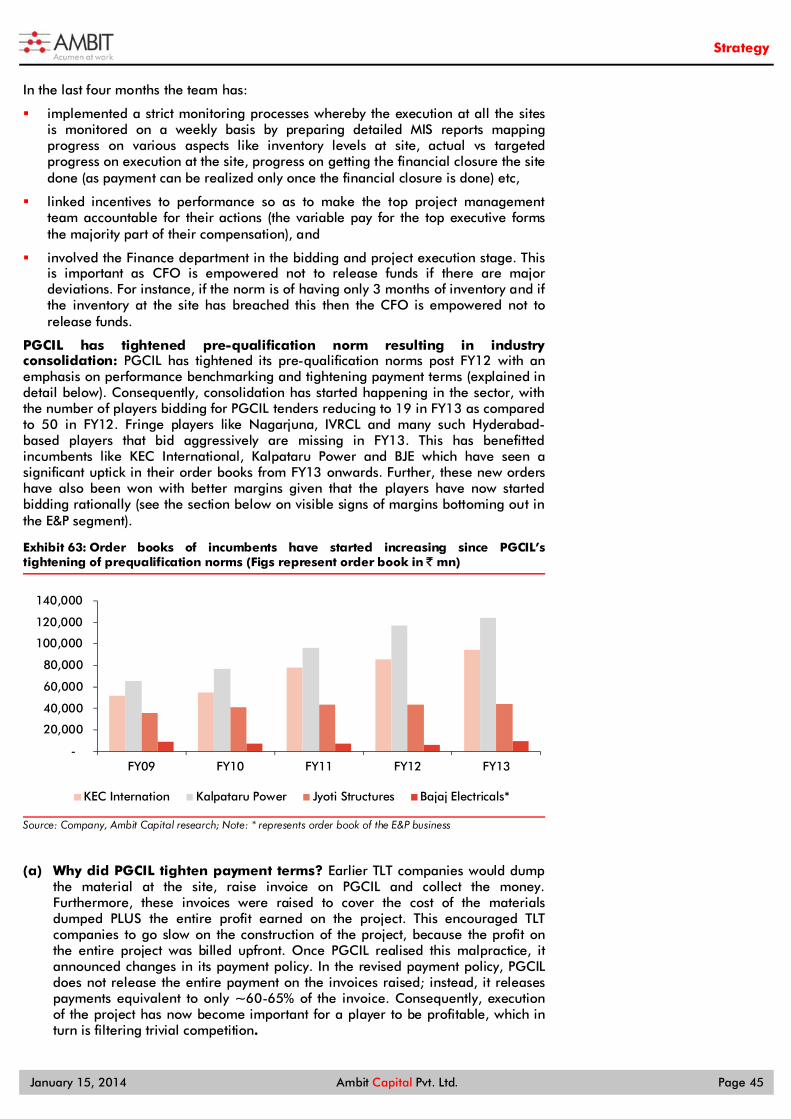
Strategy
January 15, 2014 Ambit Capital Pvt. Ltd. Page 45
In the last four months the team has:
implemented a strict monitoring processes whereby the execution at all the sites is monitored on a weekly basis by preparing detailed MIS reports mapping progress on various aspects like inventory levels at site, actual vs targeted progress on execution at the site, progress on getting the financial closure the site done (as payment can be realized only once the financial closure is done) etc,
linked incentives to performance so as to make the top project management team accountable for their actions (the variable pay for the top executive forms the majority part of their compensation), and
involved the Finance department in the bidding and project execution stage. This is important as CFO is empowered not to release funds if there are major deviations. For instance, if the norm is of having only 3 months of inventory and if the inventory at the site has breached this then the CFO is empowered not to release funds.
PGCIL has tightened pre-qualification norm resulting in industry consolidation: PGCIL has tightened its pre-qualification norms post FY12 with an emphasis on performance benchmarking and tightening payment terms (explained in detail below). Consequently, consolidation has started happening in the sector, with the number of players bidding for PGCIL tenders reducing to 19 in FY13 as compared to 50 in FY12. Fringe players like Nagarjuna, IVRCL and many such Hyderabad-based players that bid aggressively are missing in FY13. This has benefitted incumbents like KEC International, Kalpataru Power and BJE which have seen a significant uptick in their order books from FY13 onwards. Further, these new orders have also been won with better margins given that the players have now started bidding rationally (see the section below on visible signs of margins bottoming out in the E&P segment).
Exhibit 63: Order books of incumbents have started increasing since PGCIL’s tightening of prequalification norms (Figs represent order book in ` mn)
Source: Company, Ambit Capital research; Note: * represents order book of the E&P business
(a) Why did PGCIL tighten payment terms? Earlier TLT companies would dump the material at the site, raise invoice on PGCIL and collect the money. Furthermore, these invoices were raised to cover the cost of the materials dumped PLUS the entire profit earned on the project. This encouraged TLT companies to go slow on the construction of the project, because the profit on the entire project was billed upfront. Once PGCIL realised this malpractice, it announced changes in its payment policy. In the revised payment policy, PGCIL does not release the entire payment on the invoices raised; instead, it releases payments equivalent to only ~60-65% of the invoice. Consequently, execution of the project has now become important for a player to be profitable, which in turn is filtering trivial competition.
-
20,000
40,000
60,000
80,000
100,000
120,000
140,000
FY09 FY10 FY11 FY12 FY13
KEC Internation Kalpataru Power Jyoti Structures Bajaj Electricals*

Strategy
January 15, 2014 Ambit Capital Pvt. Ltd. Page 46
(b) Why did PGCIL start performance benchmarking? Given the slack in project execution, PGCIL has now started to assign a higher weightage to a company’s execution track record. If in the existing order backlog of PGCIL, a company has not executed the project according to the prescribed timelines then that company would not be qualified to bid for new orders. This in turn has gone a long way in filtering trivial competition.
Visible signs of margins bottoming for E&P players: All the listed players in the E&P segment have seen significant erosion to margins over FY09-12 given the slowdown in the infrastructure sector. However, since 2QFY13, margins for all players have more or less started bottoming out. Our discussions with industry participants suggest bottoming out of pricing. This is corroborated from the reducing gap in bid prices between the L1 and L2 bidder.
In order sizes of `2.5bn-3bn, the gap between the L1 and L2 players has now reduced to `0.5mn-10mn as compared to `25mn-30mn in FY12. Also, the recent conference call transcripts of KEC, Kalpataru and Jyoti highlight bottoming out of margins in FY14. Kalpataru’s management in the 2QFY14 results call has guided for EBITDA margins of 11.5% in FY14 and FY15 (after including other income) after reporting 11% in 2QFY14 (peak margins were at 14% in FY12). Jyoti Structure’s management has guided for EBITDA margin of 10-10.5% in FY14 after reporting 10.3% in 1QFY14 (peak margin was 12% in FY12). KEC’s management has guided for margin improvement in FY14 to 8% from the reported 5.5% in 2QFY14 driven by a mix change in the transmission business.
Exhibit 64: EBITDA margins in the last four quarters have bottomed out for E&P companies
Source: Company, Ambit Capital research.
Exhibit 65: Consequently, stock prices for E&P companies have started inching up
Source: Bloomberg, Ambit Capital research; Note: Stock prices rebased to 100 as on 1 July 2013.
(5) Valuations
BJE is trading at 12.0x FY15 EPS. This is a 26% discount relative peers and a 60% discount to Havells’ FY15 P/E despite FY15 RoE of 21.1% (vs Havells’ 26%) and higher EPS CAGR of 163% over FY13-15 (vs Havells’ 14%). With the E&P business likely to turnaround in FY15, we expect BJE’s P/E to be re-rated as concerns abate over the diversion of cash generated by the consumer business to E&P.
2.04.06.08.010.012.014.0
10.0
12.0
14.0
16.0
Q4
FY09
Q2
FY10
Q4
FY10
Q2
FY11
Q4
FY11
Q2
FY12
Q4
FY12
Q2
FY13
Q4
FY13
Q2
FY14
Kalpataru Power Jyoti Structures
KEC International
75.0
95.0
115.0
135.0
155.0
175.0
Jul-
13
Aug
-13
Sep-
13
Oct
-13
Nov
-13
Dec
-13
Jan-
14
BJE Jyoti KEC Kalpataru
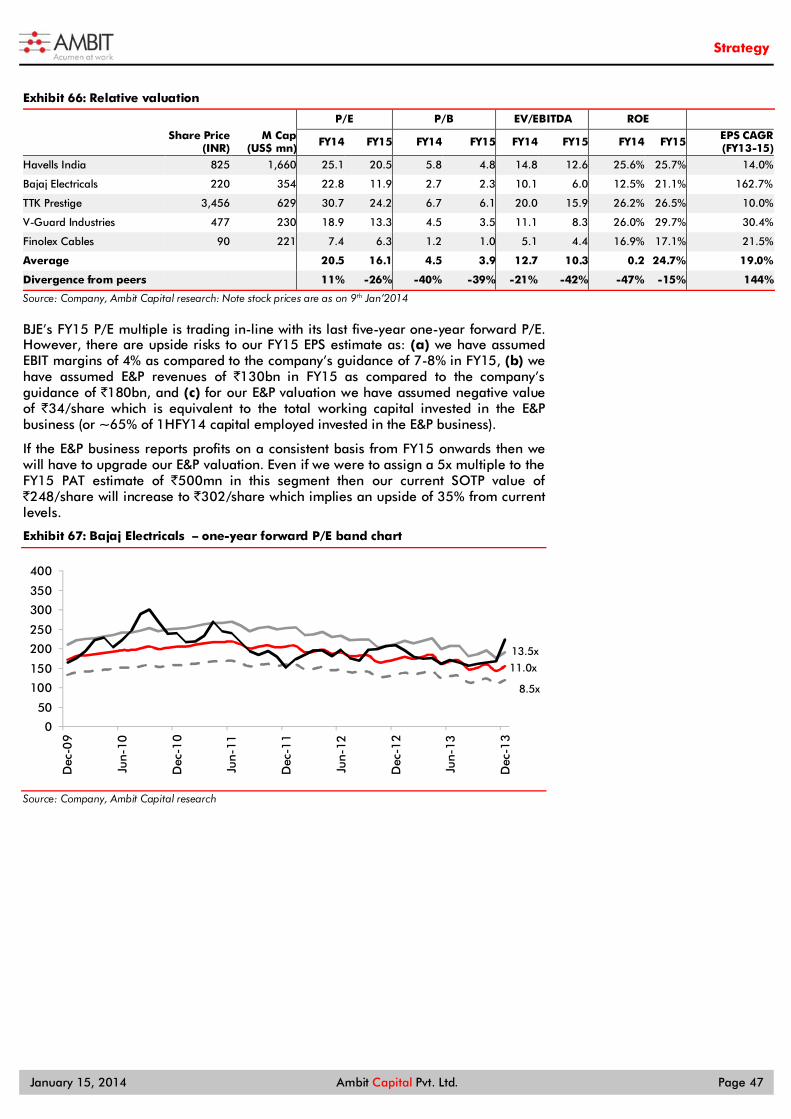
Strategy
January 15, 2014 Ambit Capital Pvt. Ltd. Page 47
Exhibit 66: Relative valuation
P/E P/B EV/EBITDA ROE
Share Price
(INR) M Cap
(US$ mn) FY14 FY15 FY14 FY15 FY14 FY15 FY14 FY15 EPS CAGR (FY13-15)
Havells India 825 1,660 25.1 20.5 5.8 4.8 14.8 12.6 25.6% 25.7% 14.0%
Bajaj Electricals 220 354 22.8 11.9 2.7 2.3 10.1 6.0 12.5% 21.1% 162.7%
TTK Prestige 3,456 629 30.7 24.2 6.7 6.1 20.0 15.9 26.2% 26.5% 10.0%
V-Guard Industries 477 230 18.9 13.3 4.5 3.5 11.1 8.3 26.0% 29.7% 30.4%
Finolex Cables 90 221 7.4 6.3 1.2 1.0 5.1 4.4 16.9% 17.1% 21.5%
Average 20.5 16.1 4.5 3.9 12.7 10.3 0.2 24.7% 19.0%
Divergence from peers 11% -26% -40% -39% -21% -42% -47% -15% 144%
Source: Company, Ambit Capital research: Note stock prices are as on 9th Jan’2014
BJE’s FY15 P/E multiple is trading in-line with its last five-year one-year forward P/E. However, there are upside risks to our FY15 EPS estimate as: (a) we have assumed EBIT margins of 4% as compared to the company’s guidance of 7-8% in FY15, (b) we have assumed E&P revenues of `130bn in FY15 as compared to the company’s guidance of `180bn, and (c) for our E&P valuation we have assumed negative value of `34/share which is equivalent to the total working capital invested in the E&P business (or ~65% of 1HFY14 capital employed invested in the E&P business).
If the E&P business reports profits on a consistent basis from FY15 onwards then we will have to upgrade our E&P valuation. Even if we were to assign a 5x multiple to the FY15 PAT estimate of `500mn in this segment then our current SOTP value of `248/share will increase to `302/share which implies an upside of 35% from current levels.
Exhibit 67: Bajaj Electricals – one-year forward P/E band chart
Source: Company, Ambit Capital research
0
50
100
150
200
250
300
350
400
Dec
-09
Jun-
10
Dec
-10
Jun-
11
Dec
-11
Jun-
12
Dec
-12
Jun-
13
Dec
-13
13.5x
8.5x
11.0x

Strategy
January 15, 2014 Ambit Capital Pvt. Ltd. Page 48
Section 5: Britannia “We are preparing Britannia for high growth in its India operations by catering to the changing food habits of the evolving Indian consumer and pursuing opportunities for growth in the overall food domain, here and abroad.”
– Nusli Wadia, May 2013.
Britannia is India’s second-largest biscuit manufacturer by both value (30% share) and volume (26% share). Over the last 15 years, Britannia has recorded a revenue CAGR of 14% (to `62bn in FY13) and PAT CAGR of 14% (to `2.6bn in FY13). In these 15 years, the company's stock price has recorded a CAGR of 14%, in line with the Sensex return of 14%. Currently, the stock is trading at 25.0x FY15E (Bloomberg consensus). Out of the 30 analysts covering the stock, 23 analysts have a BUY rating, 5 have a HOLD rating and 2 have a SELL rating on the stock.
Exhibit 68: Can Britannia execute a turnaround?
Criteria Entry
How much has RoCE fallen over the past ten years? RoCEs have expanded 11 percentage points from 20%
in FY03 to 31% in FY13 Why did RoCE fall?
Has there been a change in management? Yes, Varun Berry took over from Vinita Bali as CEO in May 2013
Does the current management team have the credibility/credentials to execute a turnaround? Mr Berry did not shoot the lights out at Pepsico
Does the franchise have competitive advantages?
Yes, around established brands and distribution network
Does the team have a specific, measurable, time-bound turnaround plan? No
Source: Ambit Capital research
Chronology of major events and stock price vs event correlation
Exhibit 69: Britannia - 1991-2001 – Building its brand portfolio
Source: Bloomberg, Ambit Capital research
0
50
100
150
200
250
Jan-
91
May
-91
Sep-
91
Jan-
92
May
-92
Sep-
92
Jan-
93
May
-93
Sep-
93
Jan-
94
May
-94
Sep-
94
Jan-
95
May
-95
Sep-
95
Jan-
96
May
-96
Sep-
96
Jan-
97
May
-97
Sep-
97
Jan-
98
May
-98
Sep-
98
Jan-
99
May
-99
Sep-
99
Jan-
00
May
-00
Sep-
00
Jan-
01
May
-01
Sep-
01
JV with JMRPCO to manufacture essence for Coca Cola
Little Hearts biscuits launch
Acquired Kwality biscuits
Entry into namkeens and packaged milk-based drinks
Launch of Tiger and Jim-jam biscuits and entry into butter market
50-50 biscuits launch
Shar
epr
ice
(`)

Strategy
January 15, 2014 Ambit Capital Pvt. Ltd. Page 49
Exhibit 70: Britannia - 2001-2013 – searching for growth drivers whilst defending its own turf
Source: Bloomberg, Ambit Capital research
Capital allocated towards non-core investments failed to generate returns In the pre-Vinita Bali period (before 2005), Britannia’s focus under Sunil Alagh’s leadership was on building and investing in brands and creating market leadership in the segments that Britannia competed in. However, we understand that under Vinita Bali, the focus shifted towards building operational efficiencies and looking at newer sources of growth like dairy, bakery and international operations. The change in focus under Vinita Bali led to investments in new businesses like bakery retail (where Britannia acquired Bangalore-based Daily Bread) and two overseas ventures in the Middle East (a JV with Khimji Ramdas in Dubai called Strategic Food International Co and a 65% stake in Oman-based Al-Sallan Food Industries).
However, note that Britannia’s investments in its international operations as well as its acquisition of Daily Bread have not paid off, as both continue to make losses. The losses at all its international operations were at `58mn in FY13 and Daily Bread posted a loss of `27mn in FY13. Note that Britannia’s FY13 consolidated PAT was `2,599mn and shareholders’ equity was `5,508mn. Press reports suggest that Britannia is now looking to divest its Daily Bread business.
However, whilst Britannia’s non-core investments appear to have delivered sub-par returns, they have formed only 14% of the total capital allocation. The average of non-core investments for Britannia’s peer group is 20%. However, when only its Indian peers are considered, the average is 46% (given that the MNCs do not invest outside the core business). The drag thus created due to the investments in the non-core assets has not been meaningful.
0
100
200
300
400
500
600
700
800
900
1,000
Jan-
02M
ay-0
2
Sep-
02
Jan-
03
May
-03
Sep-
03
Jan-
04
May
-04
Sep-
04
Jan-
05
May
-05
Sep-
05
Jan-
06
May
-06
Sep-
06
Jan-
07M
ay-0
7
Sep-
07
Jan-
08
May
-08
Sep-
08
Jan-
09
May
-09
Sep-
09
Jan-
10
May
-10
Sep-
10
Jan-
11
May
-11
Sep-
11
Jan-
12M
ay-1
2
Sep-
12
Jan-
13
May
-13
Sep-
13
Entered intoJV with Fonterra to enter dairy business
Vinita Bali appointed CEO
Bought 50% stake in Daily Bread
Formed JV withKhimji Ramdas in Dubai; acquired 65% in Oman-based Al-Sallan Food Industries
Acquired Fonterra's 49% stake in dairy JV
Varun Berry joins Britannia
Sunil Alagh sacked as MD
S to
ck
p r
i c
e (
`)
Note: This excludes debt raised and advances given to subsidiaries; to put the above figures into context, Britannia’s FY13 shareholders’ equity was `5,508mn.
Britannia's non-core equity investments as on 31 March 2013
Company Amount (̀ mn)
Daily Bread Gourmet 207
International operations 1,088
Dairy business 700
Source: Company, Ambit Capital research
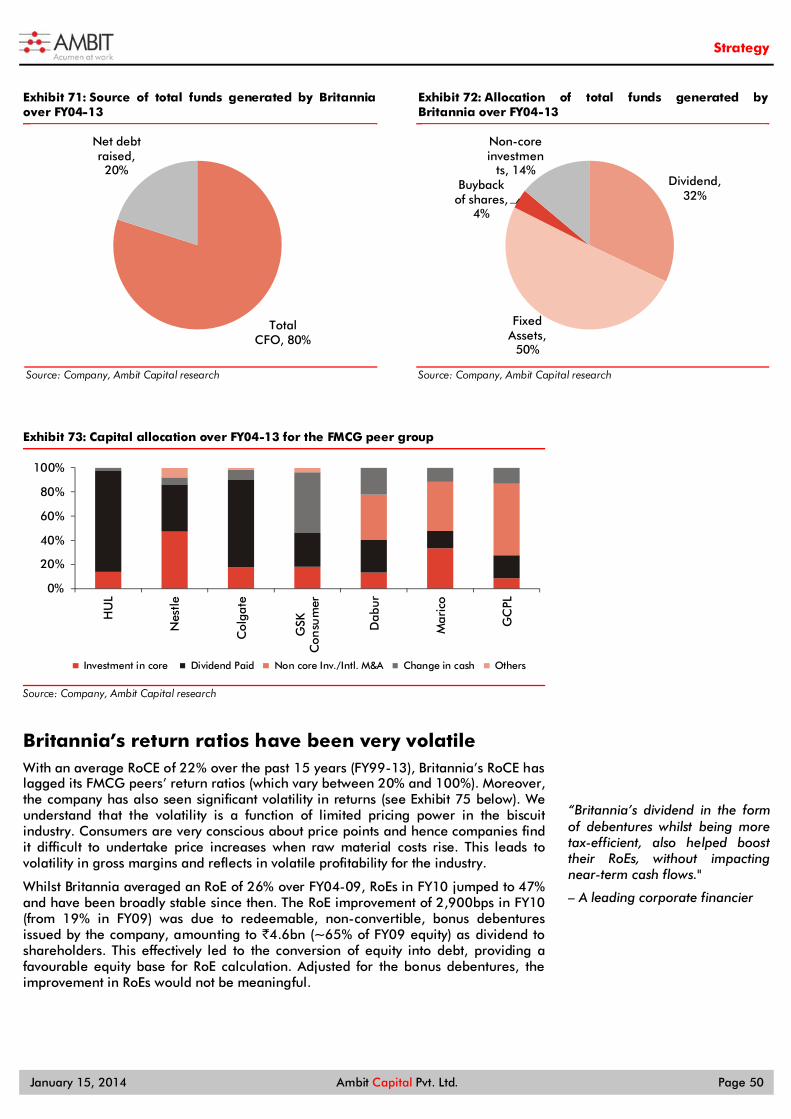
Strategy
January 15, 2014 Ambit Capital Pvt. Ltd. Page 50
Exhibit 71: Source of total funds generated by Britannia over FY04-13
Source: Company, Ambit Capital research
Exhibit 72: Allocation of total funds generated by Britannia over FY04-13
Source: Company, Ambit Capital research
Exhibit 73: Capital allocation over FY04-13 for the FMCG peer group
Source: Company, Ambit Capital research
Britannia’s return ratios have been very volatile With an average RoCE of 22% over the past 15 years (FY99-13), Britannia’s RoCE has lagged its FMCG peers’ return ratios (which vary between 20% and 100%). Moreover, the company has also seen significant volatility in returns (see Exhibit 75 below). We understand that the volatility is a function of limited pricing power in the biscuit industry. Consumers are very conscious about price points and hence companies find it difficult to undertake price increases when raw material costs rise. This leads to volatility in gross margins and reflects in volatile profitability for the industry.
Whilst Britannia averaged an RoE of 26% over FY04-09, RoEs in FY10 jumped to 47% and have been broadly stable since then. The RoE improvement of 2,900bps in FY10 (from 19% in FY09) was due to redeemable, non-convertible, bonus debentures issued by the company, amounting to `4.6bn (~65% of FY09 equity) as dividend to shareholders. This effectively led to the conversion of equity into debt, providing a favourable equity base for RoE calculation. Adjusted for the bonus debentures, the improvement in RoEs would not be meaningful.
Total CFO, 80%
Net debt raised, 20%
Dividend, 32%
Fixed Assets,
50%
Buyback of shares,
4%
Non-core investmen
ts, 14%
0%
20%
40%
60%
80%
100%
HU
L
Nes
tle
Col
gate
GSK
Con
sum
er
Dab
ur
Mar
ico
GC
PL
Investment in core Dividend Paid Non core Inv./Intl. M&A Change in cash Others
“Britannia’s dividend in the form of debentures whilst being more tax-efficient, also helped boost their RoEs, without impacting near-term cash flows."
– A leading corporate financier

Strategy
January 15, 2014 Ambit Capital Pvt. Ltd. Page 51
Exhibit 74: RoCEs expanded FY10 onwards due to gross margin expansion
Source: Ambit Capital research
Exhibit 75: RoEs improved dramatically in FY10 due to the bonus debentures issued
Source: Ambit Capital research
Britannia’s market share has fallen “Parle has built a wall around itself. Nobody wants to compete in the lower end with Parle given their brand strength, size as well as the low margins.”
- A former CEO from the biscuit industry
Over FY09-13, Britannia has lost value market share of 500bps and volume market share of 300bps. ITC was the largest beneficiary of this market share drop, gaining a volume market share of almost 300bps to 11.2% by FY13. With new entrants like Kraft’s Oreo and Unibic entering the premium segment, Britannia’s key premium brands (Pure Magic, Bourbon, Treat, etc) have been challenged and have been unable to suitably defend their turf. However, Britannia’s cash cow, Good Day, still maintains its leadership position in the premium sweet cookie segment.
With ITC, Unibic and Kraft directly competing with Britannia in the higher-margin premium segment, we expect Britannia’s market share to face increasing pressure in the medium term. Parle has, however, gained market share despite increasing competition, as: (a) it draws ~40% of its biscuit revenues from the low-margin glucose segment, a segment most MNCs do not find lucrative enough to compete in; and (b) it entered newer segments in which it did not have a presence in earlier (the premium cream segment and the mass cookie segment).
Exhibit 76: Value market share trends for the industry
Source: Industry, Ambit Capital research.
Exhibit 77: Volume market share trends for the industry
Source: Industry, Ambit Capital research.
10%
15%
20%
25%
30%
35%
40%
FY99
FY00
FY01
FY02
FY03
FY04
FY05
FY06
FY07
FY08
FY09
FY10
FY11
FY12
FY13
ROCE
0%
10%
20%
30%
40%
50%
60%
2,000
3,000
4,000
5,000
6,000
7,000
8,000
FY04
FY05
FY06
FY07
FY08
FY09
FY10
FY11
FY12
FY13
Equity base ROE (%)
Reduced equity base inflated ROEs
30%31%32%33%34%35%36%37%38%
FY09
FY10
FY11
FY12
FY13
Parle Britannia Others
25%
27%
29%31%
33%35%
37%39%
41%
FY09
FY10
FY11
FY12
FY13
Parle Britannia Others
Distribution reach of various biscuit companies
Company Outlets (mn)
Parle 5.5
Britannia 3.6
ITC (biscuits) 2.5
Biscuit Universe 6.0
Source: Ambit Capital research, Industry

Strategy
January 15, 2014 Ambit Capital Pvt. Ltd. Page 52
Over the next few weeks, as we initiate coverage on Britannia, we intend to delve deeper into Britannia’s sustainable competitive advantages, to understand why it struggled to hold on to its market share despite having strong brand recall and strong distribution.
Margin expansion post FY10 is unsustainable “Though there is room for cutting costs at Britannia, especially on the distribution side, I don’t see the company taking any action on the ground.”
– Marketing head of Britannia’s competitor
“Everyone wants a piece of the mid and premium segment. Britannia becomes most prone to attacks from firms with bigger balance sheets like Cadbury, ITC and Danone.”
- A former biscuit industry CEO
As we understand it, Vinita Bali was focused on delivering operational efficiencies. However, Britannia’s EBITDA margin expansion of 450bps over FY10-1HFY14 was entirely driven by gross margin improvement, which in turn was driven by favourable raw material costs, mix change and price increases, rather than operational cost savings. We estimate cost efficiencies of ~120bps to have been generated over FY10-1HFY14. However, this was entirely reinvested in advertisements and promotions, given the changing landscape of the biscuit industry with the entry of new competition with large balance sheets.
Exhibit 78: Gross margins expanded 290bps in 1HFY14
Source: Company, Ambit Capital research
Exhibit 79: EBITDA margins expanded 220bps in 1HFY14
Source: Company, Ambit Capital research
Our discussions with industry participants suggest that any cost savings by Britannia going forward can only come from: (a) distribution costs - reduction of trade offers given by Britannia (Britannia’s trade offers are amongst the most generous in the industry across brands); and (b) manufacturing efficiencies – outsourcing costs for Britannia are higher than those of other large players like Parle.
However, these benefits are unlikely materialise in the near term, as distributors will not take kindly to any reduction in offers and such a step could impact volumes. Further, recent press interviews by Varun Berry suggest that Britannia will be investing in new capacities to reduce its dependence on contract manufacturing. Whilst self-owned capacities give the company more control over production and quality, they also come at a higher cost.
Britannia’s A&P spends have increased by 250bps to 9.1% over FY05-1HFY14. With rising competitive intensity in the high-margin premium biscuit segment from players like ITC, Kraft and Unibic, the intensity of advertising spends would not ease soon. Industry participants suggest that Kraft is likely to introduce more variants in the premium biscuits space over the next few months supported by aggressive marketing.
33%
35%
37%
39%
41%
43%
-
5,000
10,000
15,000
20,000
25,000
FY05
FY06
FY07
FY08
FY09
FY10
FY11
FY12
FY13
1HFY
14
Gross Profit Gross Margin
`m
n
3%
5%
7%
9%
11%
13%
- 500
1,000 1,500 2,000 2,500 3,000 3,500 4,000 4,500
FY05
FY06
FY07
FY08
FY09
FY10
FY11
FY12
FY13
1HFY
14
EBITDA EBITDA Margin
`m
n
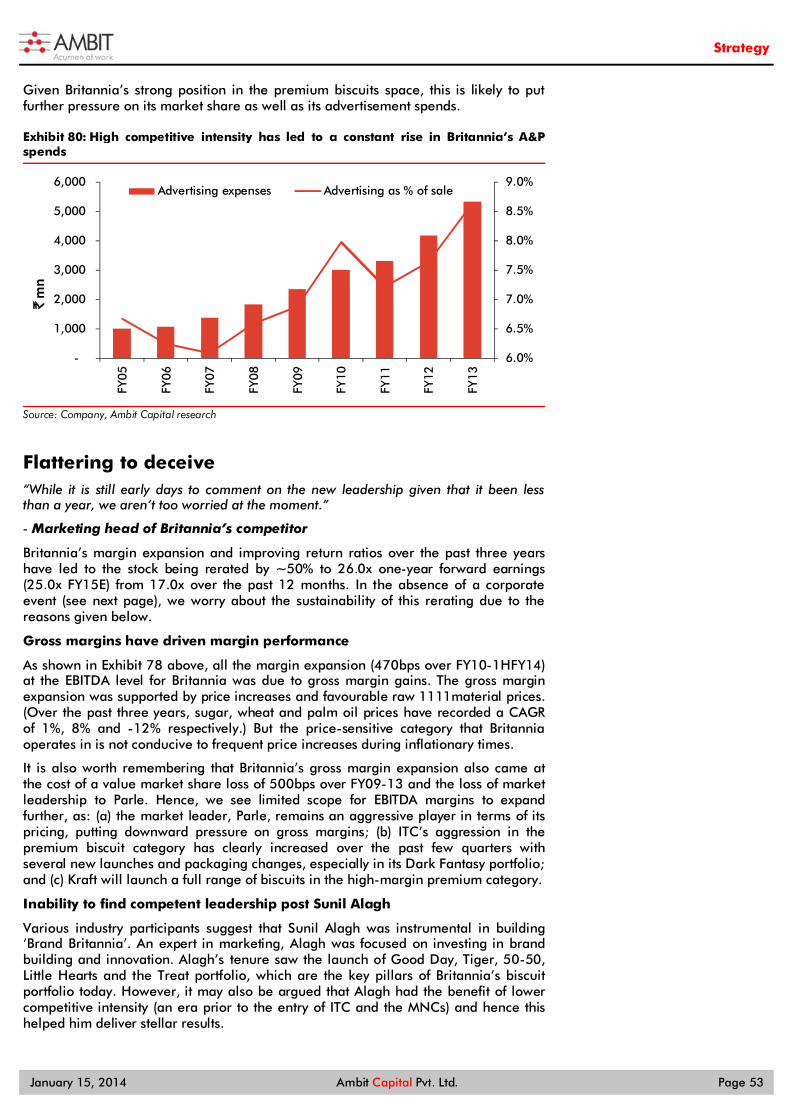
Strategy
January 15, 2014 Ambit Capital Pvt. Ltd. Page 53
Given Britannia’s strong position in the premium biscuits space, this is likely to put further pressure on its market share as well as its advertisement spends.
Exhibit 80: High competitive intensity has led to a constant rise in Britannia’s A&P spends
Source: Company, Ambit Capital research
Flattering to deceive “While it is still early days to comment on the new leadership given that it been less than a year, we aren’t too worried at the moment.”
- Marketing head of Britannia’s competitor
Britannia’s margin expansion and improving return ratios over the past three years have led to the stock being rerated by ~50% to 26.0x one-year forward earnings (25.0x FY15E) from 17.0x over the past 12 months. In the absence of a corporate event (see next page), we worry about the sustainability of this rerating due to the reasons given below.
Gross margins have driven margin performance
As shown in Exhibit 78 above, all the margin expansion (470bps over FY10-1HFY14) at the EBITDA level for Britannia was due to gross margin gains. The gross margin expansion was supported by price increases and favourable raw 1111material prices. (Over the past three years, sugar, wheat and palm oil prices have recorded a CAGR of 1%, 8% and -12% respectively.) But the price-sensitive category that Britannia operates in is not conducive to frequent price increases during inflationary times.
It is also worth remembering that Britannia’s gross margin expansion also came at the cost of a value market share loss of 500bps over FY09-13 and the loss of market leadership to Parle. Hence, we see limited scope for EBITDA margins to expand further, as: (a) the market leader, Parle, remains an aggressive player in terms of its pricing, putting downward pressure on gross margins; (b) ITC’s aggression in the premium biscuit category has clearly increased over the past few quarters with several new launches and packaging changes, especially in its Dark Fantasy portfolio; and (c) Kraft will launch a full range of biscuits in the high-margin premium category.
Inability to find competent leadership post Sunil Alagh
Various industry participants suggest that Sunil Alagh was instrumental in building ‘Brand Britannia’. An expert in marketing, Alagh was focused on investing in brand building and innovation. Alagh’s tenure saw the launch of Good Day, Tiger, 50-50, Little Hearts and the Treat portfolio, which are the key pillars of Britannia’s biscuit portfolio today. However, it may also be argued that Alagh had the benefit of lower competitive intensity (an era prior to the entry of ITC and the MNCs) and hence this helped him deliver stellar results.
6.0%
6.5%
7.0%
7.5%
8.0%
8.5%
9.0%
-
1,000
2,000
3,000
4,000
5,000
6,000
FY05
FY06
FY07
FY08
FY09
FY10
FY11
FY12
FY13
Advertising expenses Advertising as % of sale
`m
n
Strategy
January 15, 2014 Ambit Capital Pvt. Ltd. Page 54
Vinita Bali, according to industry sources, was more focused on building operational efficiencies within the company. Bali shifted the emphasis to cost control from building on its investments in branding and gaining market share. Under Bali’s tenure, Britannia lost its place as the value market leader in biscuits to Parle. Also, its EBITDA margins contracted from 11.4% in FY04 to 4.3% in FY10, before recovering to 6.8% in FY13.
Bali’s move to head the international operations of Britannia in May 2013, as Varun Berry was elevated to head the India business, was an indication by the promoter that Britannia needed new leadership talent. What investors are keen to understand is whether the new leadership at Britannia can help it regain its lost ground.
Our discussions with industry participants suggest that Varun Berry was not regarded as one of star performers at Pepsico (where he headed the foods business). Before heading the foods business, he focused on building the Lehar brand in India which struggled against local competition. Whilst his expertise may be used by Britannia to enter the snack foods category, we remain sceptical about Berry’s ability to help Britannia regain its lost ground. Media reports suggest that Berry’s elevation to CEO also saw several key exits from Britannia, with Neeraj Chandra (VP, Strategy and new business development), K Sreekanth Arimanithaya (Chief of Human Resources), Amit Doshi (Group marketing manager) and Chayya Pratibha (Head of Modern Trade for Dairy) leaving the company.
Entry of Kraft over the next few months poses a huge threat
Britannia’s competitors have indicated their apprehensions about Kraft’s entry in the Indian market after its successful launch of Oreo in 2011. With a strong global product portfolio, a formidable distribution network (from Cadbury’s chocolates business), a strong balance sheet and increasing focus on emerging markets, FMCG industry participants expect Kraft to launch more products from its global portfolio in CY14. Given the marketing support generally handed out to these launches, this will likely strain Britannia’s market share and advertisement spends further. (Britannia’s advertisement spend of 9.1% in 1HFY14 is already its highest in the past decade vs a ten-year average of 7.3%.)
Wadia’s exit could provide an upside for investors We understand that Britannia’s promoter, Nusli Wadia, is faced with dual challenges at Britannia. Firstly, the rising competitive intensity with the entry of MNCs like Kraft, United Biscuits and Unibic as well as corporates with large balance sheets like ITC is making it hard for Britannia to hold on to its market share. Secondly, the lack of clarity regarding a succession plan to run the biscuits empire also posts longer-term challenges for Wadia. A combination of these two factors could influence Wadia’s decision to exit the business. Several players would line up to purchase Britannia, given its lucrative product portfolio and strong distribution network. Thus, an acquisition price at a premium to the current market price is more likely than not. Even more tantalisingly, the prospect of a potential sale of Britannia could also lead to tight controls on costs in the near term to ensure that the books reflect a firmer P&L and balance sheet.
Over the past 12 months, Britannia has been rerated from 17.0x to 25.0x one-year forward earnings (at a ~20% premium to its three-year average multiple). Consensus has upgraded its earnings estimates for FY15 by ~25% over the past six months given the strong operating performance by Britannia in 1HFY14. In 1HFY14, Britannia’s revenues increased by 14% and PAT increased by 78%. The strong PAT growth was driven by gross margin expansion of 320bps YoY to 40.6% and EBITDA margin expansion of 310bps to 9%. We believe that the gross margin expansion was strongly linked to favourable commodity prices and hence is temporary in nature. Given the stock price rally of ~85% over the past 12 months, it would appear that all the positives, except one (i.e. an acquisition), have already been factored in.

Strategy
January 15, 2014 Ambit Capital Pvt. Ltd. Page 55
Exhibit 81: Britannia’s historical P/E multiples units?
Source: Bloomberg, Ambit Capital research
Exhibit 82: Britannia’s historical Price/Sales multiples
Source: Bloomberg, Ambit Capital research
50
150
250
350450
550
650
750
850
950
Apr
-01
Apr
-02
Apr
-03
Apr
-04
Apr
-05
Apr
-06
Apr
-07
Apr
-08
Apr
-09
Apr
-10
Apr
-11
Apr
-12
Apr
-13
10x
30x
25x
20x
15x
50
150
250
350
450
550
650
750
850
950
Apr
-01
Apr
-02
Apr
-03
Apr
-04
Apr
-05
Apr
-06
Apr
-07
Apr
-08
Apr
-09
Apr
-10
Apr
-11
Apr
-12
Apr
-13
0.70x
0.85x
1.00x1.15x
1.30x
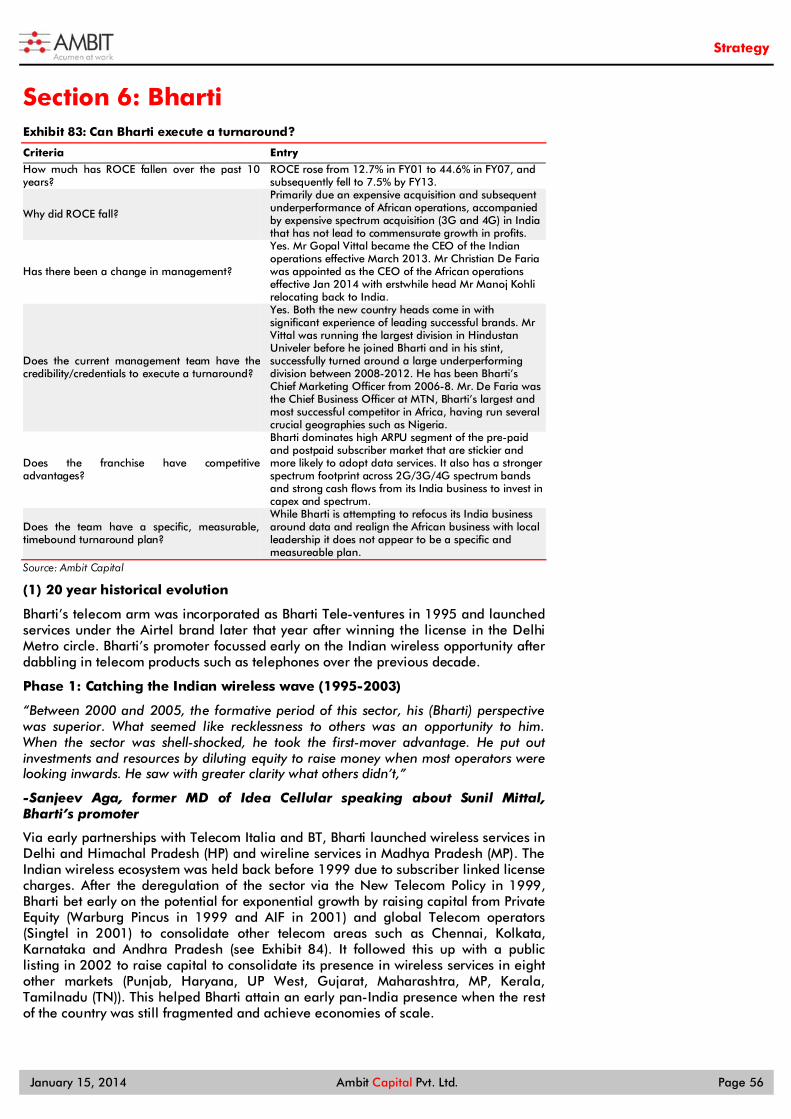
Strategy
January 15, 2014 Ambit Capital Pvt. Ltd. Page 56
Section 6: Bharti Exhibit 83: Can Bharti execute a turnaround?
Criteria Entry
How much has ROCE fallen over the past 10 years?
ROCE rose from 12.7% in FY01 to 44.6% in FY07, and subsequently fell to 7.5% by FY13.
Why did ROCE fall?
Primarily due an expensive acquisition and subsequent underperformance of African operations, accompanied by expensive spectrum acquisition (3G and 4G) in India that has not lead to commensurate growth in profits.
Has there been a change in management?
Yes. Mr Gopal Vittal became the CEO of the Indian operations effective March 2013. Mr Christian De Faria was appointed as the CEO of the African operations effective Jan 2014 with erstwhile head Mr Manoj Kohli relocating back to India.
Does the current management team have the credibility/credentials to execute a turnaround?
Yes. Both the new country heads come in with significant experience of leading successful brands. Mr Vittal was running the largest division in Hindustan Univeler before he joined Bharti and in his stint, successfully turned around a large underperforming division between 2008-2012. He has been Bharti’s Chief Marketing Officer from 2006-8. Mr. De Faria was the Chief Business Officer at MTN, Bharti’s largest and most successful competitor in Africa, having run several crucial geographies such as Nigeria.
Does the franchise have competitive advantages?
Bharti dominates high ARPU segment of the pre-paid and postpaid subscriber market that are stickier and more likely to adopt data services. It also has a stronger spectrum footprint across 2G/3G/4G spectrum bands and strong cash flows from its India business to invest in capex and spectrum.
Does the team have a specific, measurable, timebound turnaround plan?
While Bharti is attempting to refocus its India business around data and realign the African business with local leadership it does not appear to be a specific and measureable plan.
Source: Ambit Capital
(1) 20 year historical evolution
Bharti’s telecom arm was incorporated as Bharti Tele-ventures in 1995 and launched services under the Airtel brand later that year after winning the license in the Delhi Metro circle. Bharti’s promoter focussed early on the Indian wireless opportunity after dabbling in telecom products such as telephones over the previous decade.
Phase 1: Catching the Indian wireless wave (1995-2003)
“Between 2000 and 2005, the formative period of this sector, his (Bharti) perspective was superior. What seemed like recklessness to others was an opportunity to him. When the sector was shell-shocked, he took the first-mover advantage. He put out investments and resources by diluting equity to raise money when most operators were looking inwards. He saw with greater clarity what others didn’t,”
-Sanjeev Aga, former MD of Idea Cellular speaking about Sunil Mittal, Bharti’s promoter
Via early partnerships with Telecom Italia and BT, Bharti launched wireless services in Delhi and Himachal Pradesh (HP) and wireline services in Madhya Pradesh (MP). The Indian wireless ecosystem was held back before 1999 due to subscriber linked license charges. After the deregulation of the sector via the New Telecom Policy in 1999, Bharti bet early on the potential for exponential growth by raising capital from Private Equity (Warburg Pincus in 1999 and AIF in 2001) and global Telecom operators (Singtel in 2001) to consolidate other telecom areas such as Chennai, Kolkata, Karnataka and Andhra Pradesh (see Exhibit 84). It followed this up with a public listing in 2002 to raise capital to consolidate its presence in wireless services in eight other markets (Punjab, Haryana, UP West, Gujarat, Maharashtra, MP, Kerala, Tamilnadu (TN)). This helped Bharti attain an early pan-India presence when the rest of the country was still fragmented and achieve economies of scale.

Strategy
January 15, 2014 Ambit Capital Pvt. Ltd. Page 57
Given Bharti’s consolidated financials including Balance Sheet details are only available from 2001 our analysis is limited to 2001-2013. Over 2001-03, Bharti’s ROCE fell from 12.7% to 0% as investments into consolidating new circles and growing the business ate into profitability and expanded capital employed (See Exhibits 85). Bharti’s shares were flat in the first couple of years since listing, 2002-03 (See Exhibit 88).
Exhibit 84: Bharti's national footprint before its 2002 IPO
Source: Company, Ambit Capital research
Phase 2: Consolidating the country
There is no doubt he came up with a great business model by telling his partners, ‘I will produce the minutes; you supply me with the machines for doing that; but I’ll only pay you if I sell the minutes,’”
-BK Syngal, principal with Dua Consulting, and a four-decade veteran of the Indian telecom sector
As evidenced by the quote given above, Mittal had single-handedly invented the outsourced ‘minutes factory’ business model that allowed low-cost mobile telephony to flourish in India. Bharti exploited its early leadership between FY04-FY08 as it further consolidated from its existing thirteen circles to the first pan-India footprint. It cleverly exploited its newly found scale via marquee outsourcing agreements on IT and network equipment with vendors such as IBM, Ericsson etc. This period saw the creation of Bharti’s now famous “minutes-factory” model that helped it keep startup costs low and helped it evangelise the market for mobile wireless services by progressively rationalising calling costs which led to substantial expansion in minutes of use and exponential revenue growth.
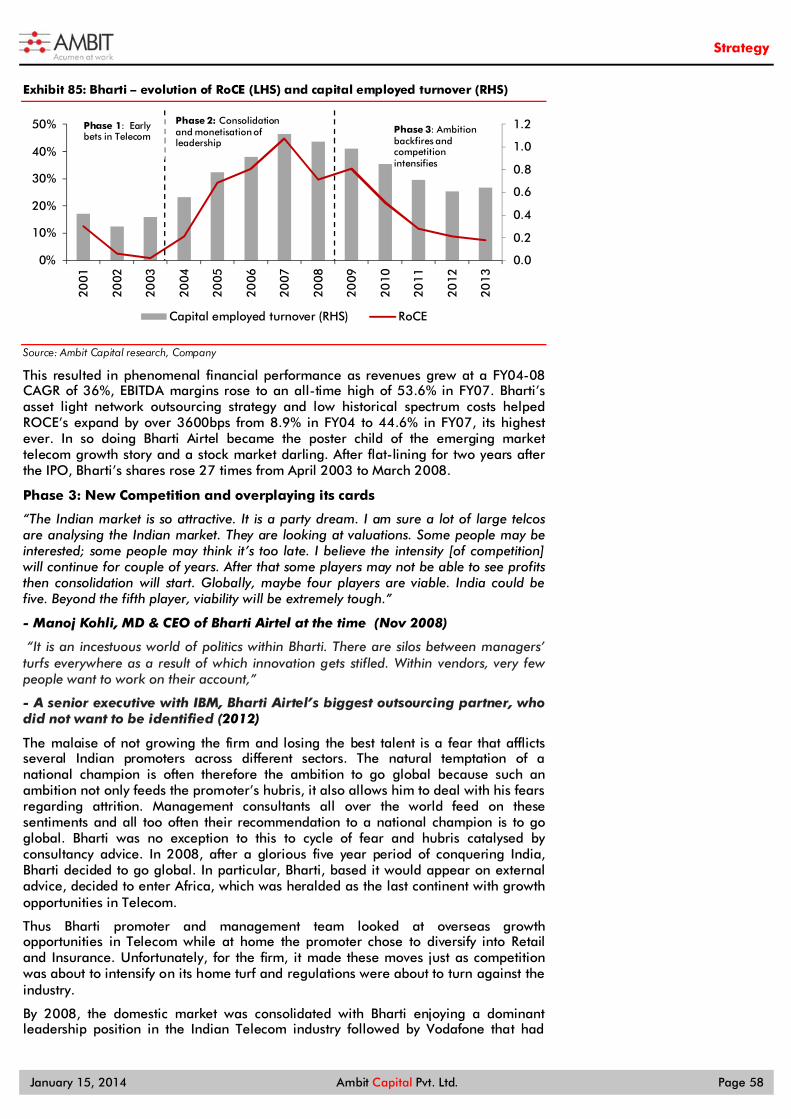
Strategy
January 15, 2014 Ambit Capital Pvt. Ltd. Page 58
Exhibit 85: Bharti – evolution of RoCE (LHS) and capital employed turnover (RHS)
Source: Ambit Capital research, Company
This resulted in phenomenal financial performance as revenues grew at a FY04-08 CAGR of 36%, EBITDA margins rose to an all-time high of 53.6% in FY07. Bharti’s asset light network outsourcing strategy and low historical spectrum costs helped ROCE’s expand by over 3600bps from 8.9% in FY04 to 44.6% in FY07, its highest ever. In so doing Bharti Airtel became the poster child of the emerging market telecom growth story and a stock market darling. After flat-lining for two years after the IPO, Bharti’s shares rose 27 times from April 2003 to March 2008.
Phase 3: New Competition and overplaying its cards
“The Indian market is so attractive. It is a party dream. I am sure a lot of large telcos are analysing the Indian market. They are looking at valuations. Some people may be interested; some people may think it’s too late. I believe the intensity [of competition] will continue for couple of years. After that some players may not be able to see profits then consolidation will start. Globally, maybe four players are viable. India could be five. Beyond the fifth player, viability will be extremely tough.”
- Manoj Kohli, MD & CEO of Bharti Airtel at the time (Nov 2008)
“It is an incestuous world of politics within Bharti. There are silos between managers’ turfs everywhere as a result of which innovation gets stifled. Within vendors, very few people want to work on their account,”
- A senior executive with IBM, Bharti Airtel’s biggest outsourcing partner, who did not want to be identified (2012)
The malaise of not growing the firm and losing the best talent is a fear that afflicts several Indian promoters across different sectors. The natural temptation of a national champion is often therefore the ambition to go global because such an ambition not only feeds the promoter’s hubris, it also allows him to deal with his fears regarding attrition. Management consultants all over the world feed on these sentiments and all too often their recommendation to a national champion is to go global. Bharti was no exception to this to cycle of fear and hubris catalysed by consultancy advice. In 2008, after a glorious five year period of conquering India, Bharti decided to go global. In particular, Bharti, based it would appear on external advice, decided to enter Africa, which was heralded as the last continent with growth opportunities in Telecom.
Thus Bharti promoter and management team looked at overseas growth opportunities in Telecom while at home the promoter chose to diversify into Retail and Insurance. Unfortunately, for the firm, it made these moves just as competition was about to intensify on its home turf and regulations were about to turn against the industry.
By 2008, the domestic market was consolidated with Bharti enjoying a dominant leadership position in the Indian Telecom industry followed by Vodafone that had
0.0
0.2
0.4
0.6
0.8
1.0
1.2
0%
10%
20%
30%
40%
50%
2001
2002
2003
2004
2005
2006
2007
2008
2009
2010
2011
2012
2013
Capital employed turnover (RHS) RoCE
Phase 2: Consolidation and monetisation of leadership
Phase 3: Ambition backfires and competition intensifies
Phase 1: Early bets in Telecom
Strategy
January 15, 2014 Ambit Capital Pvt. Ltd. Page 59
bought Bharti’s closest competitor a year ago (Jan 2007) for $11bn. The year saw the then telecom minister infamously allocating 2G (1800MHz) spectrum to several new entrants that promptly sold stakes to foreign telecom operators for billions of dollars (Telenor, Sistema, Etisalat, Bahrain Telecom company, etc). With fresh spectrum also raised by older newcomers Reliance Communications and Tata DoCoMo, the year saw the beginning of bruising price-wars over 2009-2011. Although Bharti was able to maintain its leadership position, it saw its profitability severely erode over this period. Bharti made three primary strategic errors in this period.
The African adventure - the original sin
“Unlike other industries, in telecom the cell-site is your factory, and your market is limited by the distance travelled by the airwaves. So a telecom company is more like a ‘multi-local’ company than a ‘multi-national’ one. Which is why it doesn’t lend itself to globalisation easily,”
- Sanjeev Aga, ex CEO of Idea Cellular
“Airtel underestimated the complexity of Africa, thinking it was essentially a ‘multi-circle’ play like India. For instance, when they started centralising services across countries, they ran into issues around double taxation, and other issues they’d never thought of,”
- A senior industry expert with a management consulting firm
“Airtel has directly or indirectly disrupted many markets in Africa, in most cases through price competition. Airtel’s ‘factory model’ hasn’t really worked in Africa. Firstly, unlike India, which is under one jurisdiction and a market with mostly one set of regulations, Africa is different countries. Secondly, the population of 16 countries is about a third of the Indian market, making economies of scale much smaller,”
- Dobek Pater, a director with telecoms research firm Africa Analysis (2012)
The first error- acquiring Zain at an eye watering price: Incremental competition in India and promoter aspirations also saw Bharti flirt with tie-ups with African leader MTN several times before buying a relatively weak No.2 Zain for $10.7bn in 2010. Significantly levering up the company and expanding capital employed. Bharti paid an expensive 8x EV/EBITDA for this acquisition that proved expensive in hindsight as Zain had underinvested in its networks in the run up to the sale.
The second error – parachuting Indian leadership into Africa: After overpaying for a questionable African telecoms asset with presence in 17 African countries (see Exhibit 86), Bharti compounded its strategic errors by parachuting its Indian leadership into Africa (Manoj Kohli) with an intention of replicating its famed minutes factory model that involved aggressive outsourcing of equipment and price aggression in a bid to gain market share. However, this backfired given Bharti’s assumptions on price elasticity was optimistic the African businesses comprised of very different markets with different tax and regulatory regimes.

Strategy
January 15, 2014 Ambit Capital Pvt. Ltd. Page 60
Exhibit 86: Bharti bit more than it could chew in Africa
Source: Ambit Capital research, Company
We have discussed Bharti’s African performance in greater detail in our series of Deep Dive reports at FY14 begins with consolidation (Nigeria), City Slickers (Central Africa Francophone markets - DRC, Congo B, Gabon), Frontiers to the fore (East African Anglophone markets - Zambia, Tanzania, Kenya etc), Are the networks overstretched? (summarizing African regulatory changes), Gatecrashers (We find Bharti has been unable to outperform pan-Africna peers).
Taking their eyes off the ball in India
“As Bharti enters its next phase of growth, we have a new vision to make it India’s finest conglomerate by 2020.” .. “Apart from telecom the future growth engines would be retail, financial services, and agriculture.”
– Sunil Bharti Mittal in November 2008 as Bharti launched its new brand identity and corporate vision.
“This has been the most destructive period of regulatory environment I have seen in 16 years.”
- Sunil Bharti Mittal in 2012
“I don’t see why you should attempt excessive diversification in today’s age. Trying to become a Tata or a Birla, which are over a hundred-year-old groups, is impossible. In fact, as capitalism evolves in India, the concept of a ‘promoter’ will disappear over time just like it did from the Western markets. The concept of a promoter group is a relic from the 1950s industrial licensing,”
Strategy
January 15, 2014 Ambit Capital Pvt. Ltd. Page 61
- Sanjeev Aga ex CEO of Idea Cellular
Leadership vacuum in India: With its best lieutenant (Manoj Kohli) sent to manage Africa, and the promoter (Sunil Mittal) focussed on expanding presence in Retail (partnering with Walmart) and Insurance ventures (partnering with Axa) Bharti faced a leadership vacuum for running the India business. Bharti old hands highlight that the next CEO Sanjay Kapoor lost focus on ground realities (distribution, product, sales) that were Bharti’s traditional sources of strength, focussing on the “Airtel” brand, maintaining status quo and upward management more than competition. In the ensuing period, Bharti ceded marketshare not just to new entrants - Telenor and Sistema - but more worryingly to long time competitors Idea and Vodafone that executed on basic industry drivers with nimbleness that Bharti once had.
“On hindsight, it appears that the preparation that was required for 3G never happened. If some amount of awareness existed around non-voice or GPRS [the earliest form of data transfer on GSM networks] services, it would have helped 3G too. But the focus of the GSM incumbents was to expand the SIM base, reflecting a lack of strategic thinking,”
- Mahesh Uppal, veteran telecom consultant and policy expert (2012)
“Frankly speaking, Sunil Mittal has never seemed to get the regulatory piece right. From WLL to CDMA to dual-technology to spectrum auctions, Airtel has, by and large, ended up on the receiving end. Someone else takes up an aggressive stance and Bharti ends up reacting. It’s almost as if the others look farther ahead to what’s going on and take advantage of it,”
- Kunal Bajaj, erstwhile India head of telecom strategy firm Analysys Mason
Participating in the expensive 3G/4G auctions: Concomitantly, Bharti participated in the 2010 auctions for 2.1GHz 3G airwaves and 2.3GHz TD-LTE (4G) airwaves. Aggressive competition saw the price of spectrum across key circles bid up substantially ahead of fair value and destroyed balance sheets across the sector. Bharti underinvested in 3G rollouts and scathingly rolled out fewer towers than smaller competitor Idea. It also misjudged the value of the 2.3GHz TD LTE spectrum needlessly following Reliance Jio into a spectrally inefficient and commercially sub-optimal footprint. Long term Bharti watchers point to the fact that Bharti missed the point that Vodafone chose to stay away from the 4G auctions learning from its global experience.
Besides these strategic missteps, Bharti suffered from a combination of hubris born out of its stupendous success in 2003-2008 that led management take its eye out of performance in India over 2008-12 when incumbents Idea and Vodafone outperformed it over the price war years, ambitiously bet on expensive spectrum over 2010 in India and make a debilitating acquisition in Africa.
Over this period, an increase in price competition lead to EBITDA margins collapse from a multi-year high at 53.6% in FY07 by 2300bps to 31% in FY13. A maturing market for voice services and delayed growth led to moderation in revenue growth from >40% CAGR in FY04-08 to mid-single digit in FY13/14 (constant currency). Heavy competition led margin erosion, a maturing market in India and an expensive African foray and India spectrum acquisition led to ROCE falling from ~30% in FY08 to 7.5% in FY13. Bharti’s share price underperformed the broader markets and listed peer Idea over this period.

Strategy
January 15, 2014 Ambit Capital Pvt. Ltd. Page 62
Exhibit 87: Bharti- Revenue and margins over 99-13
Source: Ambit Capital research, Company
Exhibit 88: Bharti’s share price performance since IPO
Source: Ambit Capital research, Company
Post these strategic errors and a period of hyper competition and inimical regulation, the business and regulatory landscape in India had begun to turnaround as elaborated in August 2013 note Are the stars aligning? . Bharti has begun to benefit from a consolidating market for voice services as its new management realigns the business for future growth in data.
Exhibit 89: Bharti has begun to benefit from a consolidation in favour of incumbents
Source: Ambit Capital research, Company
0.0%
10.0%
20.0%
30.0%
40.0%
50.0%
60.0%
0%
20%
40%
60%
80%
100%
120%
1999
2000
2001
2002
2003
2004
2005
2006
2007
2008
2009
2010
2011
2012
2013
Revenue growth EBIT margin (RHS)
EBITDA margin (RHS)
0
100
200
300
400
500
600
Aug
-02
Aug
-03
Aug
-04
Aug
-05
Aug
-06
Aug
-07
Aug
-08
Aug
-09
Aug
-10
Aug
-11
Aug
-12
Aug
-13
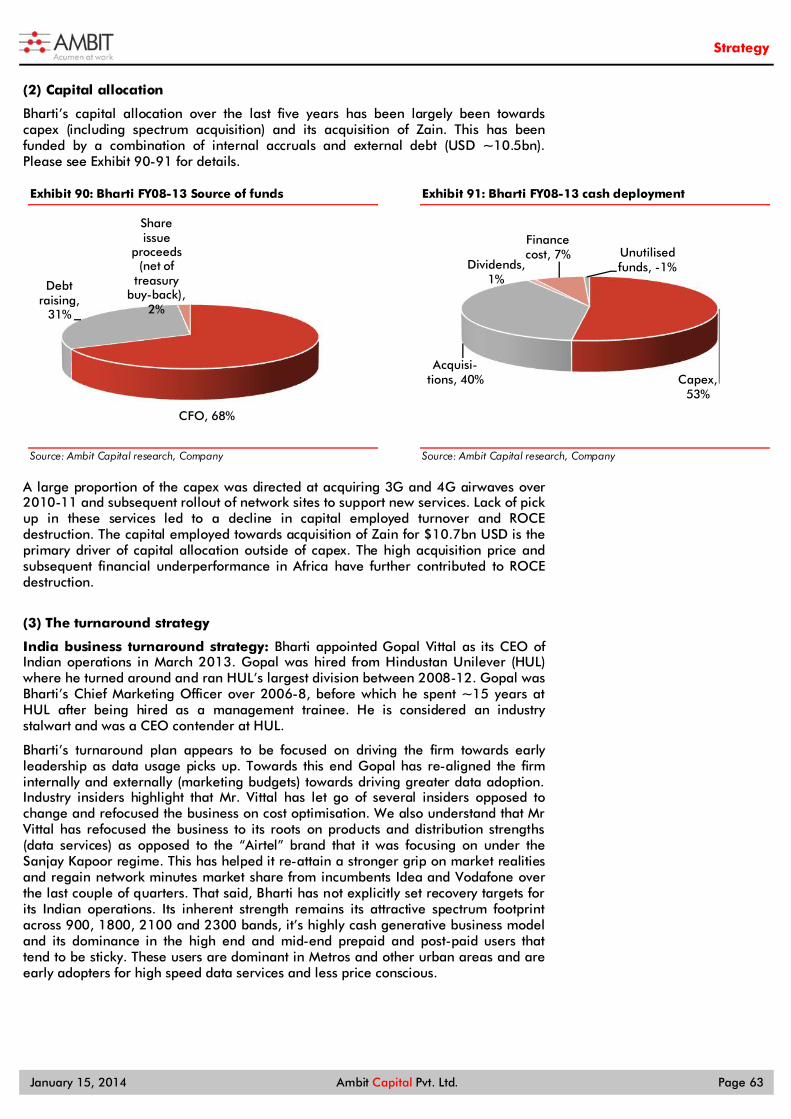
Strategy
January 15, 2014 Ambit Capital Pvt. Ltd. Page 63
(2) Capital allocation
Bharti’s capital allocation over the last five years has been largely been towards capex (including spectrum acquisition) and its acquisition of Zain. This has been funded by a combination of internal accruals and external debt (USD ~10.5bn). Please see Exhibit 90-91 for details.
Exhibit 90: Bharti FY08-13 Source of funds
Source: Ambit Capital research, Company
Exhibit 91: Bharti FY08-13 cash deployment
Source: Ambit Capital research, Company
A large proportion of the capex was directed at acquiring 3G and 4G airwaves over 2010-11 and subsequent rollout of network sites to support new services. Lack of pick up in these services led to a decline in capital employed turnover and ROCE destruction. The capital employed towards acquisition of Zain for $10.7bn USD is the primary driver of capital allocation outside of capex. The high acquisition price and subsequent financial underperformance in Africa have further contributed to ROCE destruction.
(3) The turnaround strategy
India business turnaround strategy: Bharti appointed Gopal Vittal as its CEO of Indian operations in March 2013. Gopal was hired from Hindustan Unilever (HUL) where he turned around and ran HUL’s largest division between 2008-12. Gopal was Bharti’s Chief Marketing Officer over 2006-8, before which he spent ~15 years at HUL after being hired as a management trainee. He is considered an industry stalwart and was a CEO contender at HUL.
Bharti’s turnaround plan appears to be focused on driving the firm towards early leadership as data usage picks up. Towards this end Gopal has re-aligned the firm internally and externally (marketing budgets) towards driving greater data adoption. Industry insiders highlight that Mr. Vittal has let go of several insiders opposed to change and refocused the business on cost optimisation. We also understand that Mr Vittal has refocused the business to its roots on products and distribution strengths (data services) as opposed to the “Airtel” brand that it was focusing on under the Sanjay Kapoor regime. This has helped it re-attain a stronger grip on market realities and regain network minutes market share from incumbents Idea and Vodafone over the last couple of quarters. That said, Bharti has not explicitly set recovery targets for its Indian operations. Its inherent strength remains its attractive spectrum footprint across 900, 1800, 2100 and 2300 bands, it’s highly cash generative business model and its dominance in the high end and mid-end prepaid and post-paid users that tend to be sticky. These users are dominant in Metros and other urban areas and are early adopters for high speed data services and less price conscious.
CFO, 68%
Debt raising,
31%
Share issue
proceeds (net of
treasury buy-back),
2%
Capex, 53%
Acquisi-tions, 40%
Dividends, 1%
Finance cost, 7% Unutilised
funds, -1%
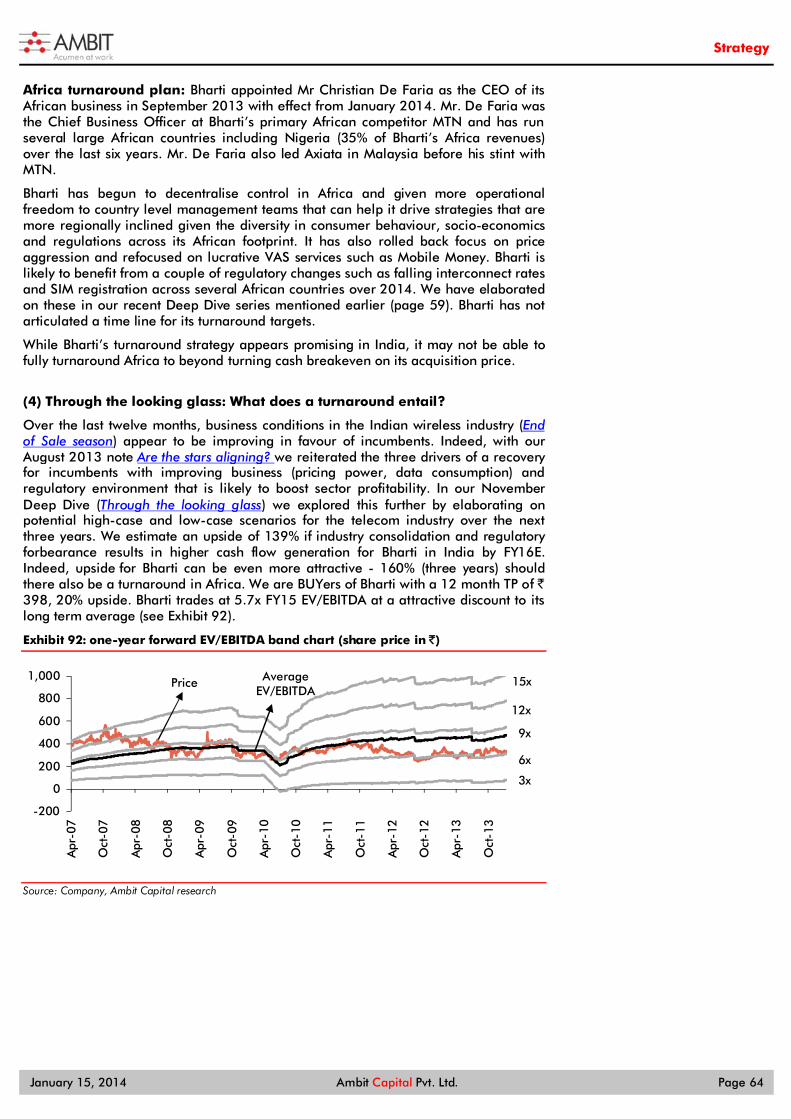
Strategy
January 15, 2014 Ambit Capital Pvt. Ltd. Page 64
Africa turnaround plan: Bharti appointed Mr Christian De Faria as the CEO of its African business in September 2013 with effect from January 2014. Mr. De Faria was the Chief Business Officer at Bharti’s primary African competitor MTN and has run several large African countries including Nigeria (35% of Bharti’s Africa revenues) over the last six years. Mr. De Faria also led Axiata in Malaysia before his stint with MTN.
Bharti has begun to decentralise control in Africa and given more operational freedom to country level management teams that can help it drive strategies that are more regionally inclined given the diversity in consumer behaviour, socio-economics and regulations across its African footprint. It has also rolled back focus on price aggression and refocused on lucrative VAS services such as Mobile Money. Bharti is likely to benefit from a couple of regulatory changes such as falling interconnect rates and SIM registration across several African countries over 2014. We have elaborated on these in our recent Deep Dive series mentioned earlier (page 59). Bharti has not articulated a time line for its turnaround targets.
While Bharti’s turnaround strategy appears promising in India, it may not be able to fully turnaround Africa to beyond turning cash breakeven on its acquisition price.
(4) Through the looking glass: What does a turnaround entail?
Over the last twelve months, business conditions in the Indian wireless industry (End of Sale season) appear to be improving in favour of incumbents. Indeed, with our August 2013 note Are the stars aligning? we reiterated the three drivers of a recovery for incumbents with improving business (pricing power, data consumption) and regulatory environment that is likely to boost sector profitability. In our November Deep Dive (Through the looking glass) we explored this further by elaborating on potential high-case and low-case scenarios for the telecom industry over the next three years. We estimate an upside of 139% if industry consolidation and regulatory forbearance results in higher cash flow generation for Bharti in India by FY16E. Indeed, upside for Bharti can be even more attractive - 160% (three years) should there also be a turnaround in Africa. We are BUYers of Bharti with a 12 month TP of ` 398, 20% upside. Bharti trades at 5.7x FY15 EV/EBITDA at a attractive discount to its long term average (see Exhibit 92).
Exhibit 92: one-year forward EV/EBITDA band chart (share price in ̀ )
Source: Company, Ambit Capital research
-200
0
200
400
600
800
1,000
Apr
-07
Oct
-07
Apr
-08
Oct
-08
Apr
-09
Oct
-09
Apr
-10
Oct
-10
Apr
-11
Oct
-11
Apr
-12
Oct
-12
Apr
-13
Oct
-13
Average EV/EBITDA
15x
12x
9x
6x
3x
Price
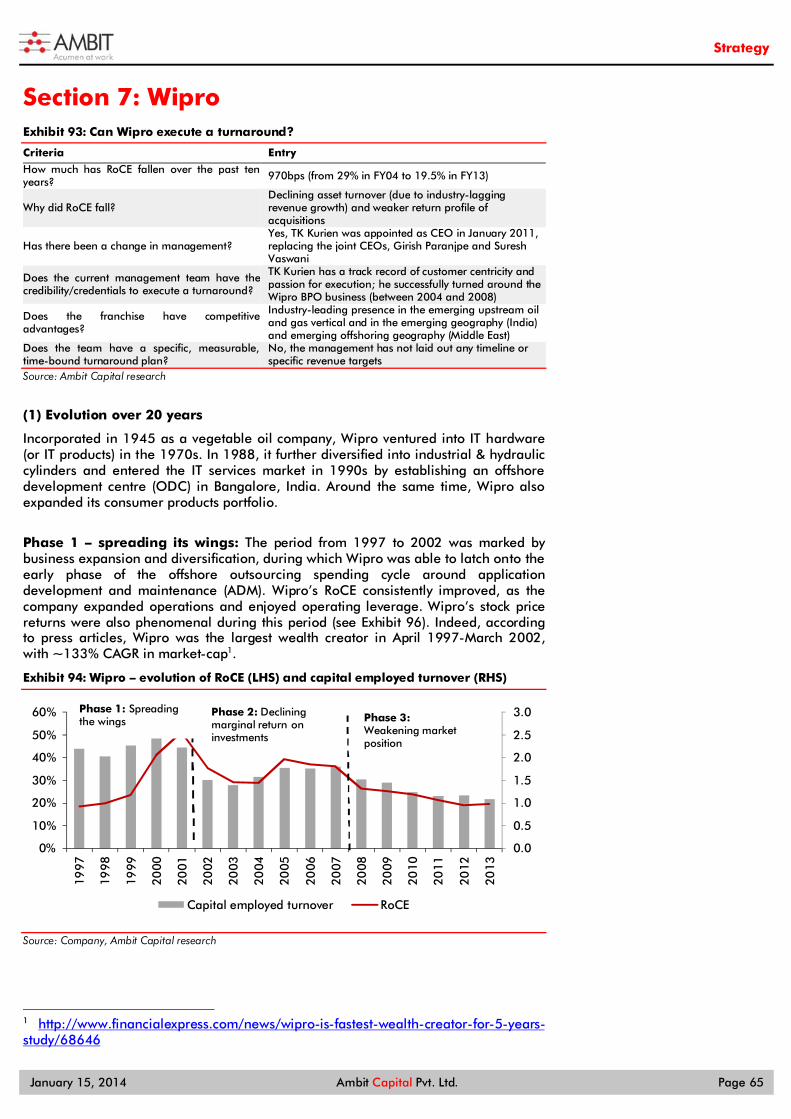
Strategy
January 15, 2014 Ambit Capital Pvt. Ltd. Page 65
Section 7: Wipro Exhibit 93: Can Wipro execute a turnaround?
Criteria Entry
How much has RoCE fallen over the past ten years? 970bps (from 29% in FY04 to 19.5% in FY13)
Why did RoCE fall? Declining asset turnover (due to industry-lagging revenue growth) and weaker return profile of acquisitions
Has there been a change in management? Yes, TK Kurien was appointed as CEO in January 2011, replacing the joint CEOs, Girish Paranjpe and Suresh Vaswani
Does the current management team have the credibility/credentials to execute a turnaround?
TK Kurien has a track record of customer centricity and passion for execution; he successfully turned around the Wipro BPO business (between 2004 and 2008)
Does the franchise have competitive advantages?
Industry-leading presence in the emerging upstream oil and gas vertical and in the emerging geography (India) and emerging offshoring geography (Middle East)
Does the team have a specific, measurable, time-bound turnaround plan?
No, the management has not laid out any timeline or specific revenue targets
Source: Ambit Capital research
(1) Evolution over 20 years
Incorporated in 1945 as a vegetable oil company, Wipro ventured into IT hardware (or IT products) in the 1970s. In 1988, it further diversified into industrial & hydraulic cylinders and entered the IT services market in 1990s by establishing an offshore development centre (ODC) in Bangalore, India. Around the same time, Wipro also expanded its consumer products portfolio.
Phase 1 – spreading its wings: The period from 1997 to 2002 was marked by business expansion and diversification, during which Wipro was able to latch onto the early phase of the offshore outsourcing spending cycle around application development and maintenance (ADM). Wipro’s RoCE consistently improved, as the company expanded operations and enjoyed operating leverage. Wipro’s stock price returns were also phenomenal during this period (see Exhibit 96). Indeed, according to press articles, Wipro was the largest wealth creator in April 1997-March 2002, with ~133% CAGR in market-cap1.
Exhibit 94: Wipro – evolution of RoCE (LHS) and capital employed turnover (RHS)
Source: Company, Ambit Capital research
1 http://www.financialexpress.com/news/wipro-is-fastest-wealth-creator-for-5-years-study/68646
0.0
0.5
1.0
1.5
2.0
2.5
3.0
0%
10%
20%
30%
40%
50%
60%
1997
1998
1999
2000
2001
2002
2003
2004
2005
2006
2007
2008
2009
2010
2011
2012
2013
Capital employed turnover RoCE
Phase 2: Declining marginal return on investments
Phase 3:Weakening market position
Phase 1: Spreading the wings

Strategy
January 15, 2014 Ambit Capital Pvt. Ltd. Page 66
Phase 2 – declining marginal returns on investments: Whilst Wipro’s growth was largely organic until FY02, the firm executed a flurry of acquisitions over FY03-08 in a bid to further diversify. The company began its acquisition spree with Spectramind (a BPO firm) for ~US$100mn in 2002-03, NerveWire Inc (a US-based financial services focussed IT services firm) for ~US$19mn in 2003, cMango (an infrastructure consulting firm) in 2006 for US$20mn, Unza Holdings (a Singapore-based FMCG company) for ~US$246mn in 2007 and Infocrossing (a datacentre-focussed IT infrastructure specialist) for US$600mn in 2007. Whilst these acquisitions were aimed at expanding the service offerings/product portfolio/geographical presence, most of them were RoCE-dilutive at best and value-destructive at worst. Wipro’s RoCE peaked at ~51% in FY01 and averaged ~34% over FY02-07. Note that Wipro’s IT services revenues were still increasing above the industry average (Indian offshore IT services firms as measured by NASSCOM) during this period (see Exhibit 97). The stock price recorded a moderate 17% CAGR over FY02-07.
Phase 3 – weakening market positioning
With increasing competition in the IT services market, led by lower spending by US clients and the expanding offshoring scale of the MNC service providers, Wipro was caught off-guard. As highlighted in our note dated 14 January 2011, ‘Humpty Dumpty sat on a wall….’ Wipro lacked a clear strategy of either moving up the value chain or gaining scale. Its lower presence in the BFSI vertical made it miss the cyclical recovery. On an average, Wipro lagged the industry growth rate over FY08-13. At the same time, it made a large acquisition in 2007 in Infocrosssing (for US$600mn, 30% of FY07 net worth), which under-performed. Although later acquisitions such as SAIC (oil and gas IT consulting business) in 2011 for ~US$150mn and Promax (Australia-based analytics company) for ~US$35mn have been more successful, their positive impact was more than offset by the weakness in the other business verticals and service lines. During this period, Wipro ceded market share to peers such as Cognizant, TCS and HCL Tech. Its RoCE averaged 23% during the period and its stock price increased by a meagre 5% in FY08-13.
Exhibit 95: Wipro’s revenue growth has suffered; margins have sustained
Source: Company, Bloomberg, Ambit Capital research
Exhibit 96: Muted stock price returns from Wipro over the last three years
Source: Company, Bloomberg, Ambit Capital research
0%5%
10%15%20%25%30%35%40%45%
1997
1998
1999
2000
2001
2002
2003
2004
2005
2006
2007
2008
2009
2010
2011
2012
2013
Revenue growth EBIT margin -200%
-100%
0%
100%
200%
300%
400%
500%
600%
700%
1997
1999
2001
2003
2005
2007
2009
2011
2013
YoY
sto
ck p
rice
re
turn
(e
xclu
din
g d
vid
en
d)

Strategy
January 15, 2014 Ambit Capital Pvt. Ltd. Page 67
Exhibit 97: Wipro – IT services - loss of competitiveness over the last five years
Source: Company, Ambit Capital research
(2) Capital allocation
Over the last five years, Wipro spent 30% of its cash flow from operations (CFO) on capital expenditure. As highlighted above, over the same period, it made a couple of large acquisitions—Infocrossing for ~US$600mn and SAIC for ~US$150mn. The Infocrossing acquisition involved the purchase of five data centres in the US. Whilst Wipro’s intention for the acquisition was to provide end-to-end infrastructure to its clients using its data centres, the outsourcing model underwent a significant change. Over the last five years, IT services firms began partnering with local pure-play data centre providers, rendering Wipro’s expected competitive advantage ineffective.
On the other hand, the SAIC acquisition provided significant synergies to Wipro’s existing energy and utilities practice. It provided consulting capabilities in the fast-growing upstream oil and gas sector. Indeed, Wipro now has the largest energy and utilities practice (US$992mn on TTM basis, 2x that of TCS). The company has also been growing the fastest among its tier-1 peers (see Exhibit 99).
Exhibit 98: Cash deployment over FY08-13
Source: Company, Ambit Capital research
Exhibit 99: Energy and Utilities is Wipro’s emerging leadership vertical
Source: Company, Ambit Capital research
As highlighted in our note dated 6 June 2013, ‘Capital allocation – the silent RoE killer’, Wipro is ranked third in terms of aggressive capital allocation among tier-1 firms (including Cognizant). Out of the cash flow from operations generated over FY08-13, Wipro has retained 38.5% on its balance sheet, better than Infosys (44.4%) and Cognizant (40.8%) but worse than HCL Tech (22.9%) and TCS (23.8%). Whilst Wipro’s dividend payout has historically been comparable to its peers, its higher capex and acquisitions have been the primary sources of capital deployment.
0%
5%
10%
15%
20%
25%
30%
0%
10%
20%
30%
40%
50%
60%
2004 2005 2006 2007 2008 2009 2010 2011 2012 2013IT services EBIT margin (RHS) IT services revenue growthNASSCOM growth
Loss of competitive positioning in the market
Capex, 30%
Acquisitions, 24%
Dividends, 29%
Cash accumulation, 16%
15.8%8.0%
3.7%5.1%
7.0%
5.1%6.0%
1.9%
0.0%
1.0%
2.0%
3.0%
4.0%
5.0%
6.0%
7.0%
8.0%
0%2%4%6%8%
10%12%14%16%18%
Wipro HCL Tech TCS Infosys
% of revenues CQGR (Jun'10- Sep'13) - RHS
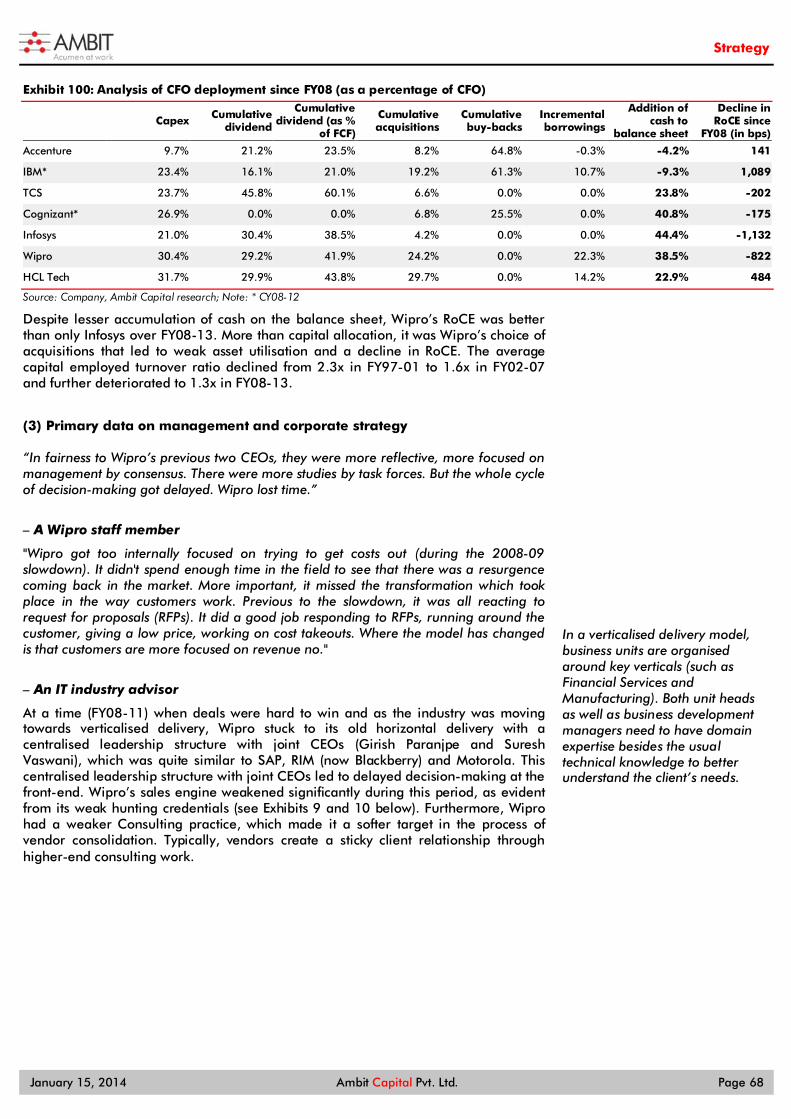
Strategy
January 15, 2014 Ambit Capital Pvt. Ltd. Page 68
Exhibit 100: Analysis of CFO deployment since FY08 (as a percentage of CFO)
Capex Cumulative dividend
Cumulative dividend (as %
of FCF)
Cumulative acquisitions
Cumulative buy-backs
Incremental borrowings
Addition of cash to
balance sheet
Decline in RoCE since
FY08 (in bps)
Accenture 9.7% 21.2% 23.5% 8.2% 64.8% -0.3% -4.2% 141
IBM* 23.4% 16.1% 21.0% 19.2% 61.3% 10.7% -9.3% 1,089
TCS 23.7% 45.8% 60.1% 6.6% 0.0% 0.0% 23.8% -202
Cognizant* 26.9% 0.0% 0.0% 6.8% 25.5% 0.0% 40.8% -175
Infosys 21.0% 30.4% 38.5% 4.2% 0.0% 0.0% 44.4% -1,132
Wipro 30.4% 29.2% 41.9% 24.2% 0.0% 22.3% 38.5% -822
HCL Tech 31.7% 29.9% 43.8% 29.7% 0.0% 14.2% 22.9% 484
Source: Company, Ambit Capital research; Note: * CY08-12
Despite lesser accumulation of cash on the balance sheet, Wipro’s RoCE was better than only Infosys over FY08-13. More than capital allocation, it was Wipro’s choice of acquisitions that led to weak asset utilisation and a decline in RoCE. The average capital employed turnover ratio declined from 2.3x in FY97-01 to 1.6x in FY02-07 and further deteriorated to 1.3x in FY08-13.
(3) Primary data on management and corporate strategy
“In fairness to Wipro’s previous two CEOs, they were more reflective, more focused on management by consensus. There were more studies by task forces. But the whole cycle of decision-making got delayed. Wipro lost time.”
– A Wipro staff member
"Wipro got too internally focused on trying to get costs out (during the 2008-09 slowdown). It didn't spend enough time in the field to see that there was a resurgence coming back in the market. More important, it missed the transformation which took place in the way customers work. Previous to the slowdown, it was all reacting to request for proposals (RFPs). It did a good job responding to RFPs, running around the customer, giving a low price, working on cost takeouts. Where the model has changed is that customers are more focused on revenue no."
– An IT industry advisor
At a time (FY08-11) when deals were hard to win and as the industry was moving towards verticalised delivery, Wipro stuck to its old horizontal delivery with a centralised leadership structure with joint CEOs (Girish Paranjpe and Suresh Vaswani), which was quite similar to SAP, RIM (now Blackberry) and Motorola. This centralised leadership structure with joint CEOs led to delayed decision-making at the front-end. Wipro’s sales engine weakened significantly during this period, as evident from its weak hunting credentials (see Exhibits 9 and 10 below). Furthermore, Wipro had a weaker Consulting practice, which made it a softer target in the process of vendor consolidation. Typically, vendors create a sticky client relationship through higher-end consulting work.
In a verticalised delivery model, business units are organised around key verticals (such as Financial Services and Manufacturing). Both unit heads as well as business development managers need to have domain expertise besides the usual technical knowledge to better understand the client’s needs.
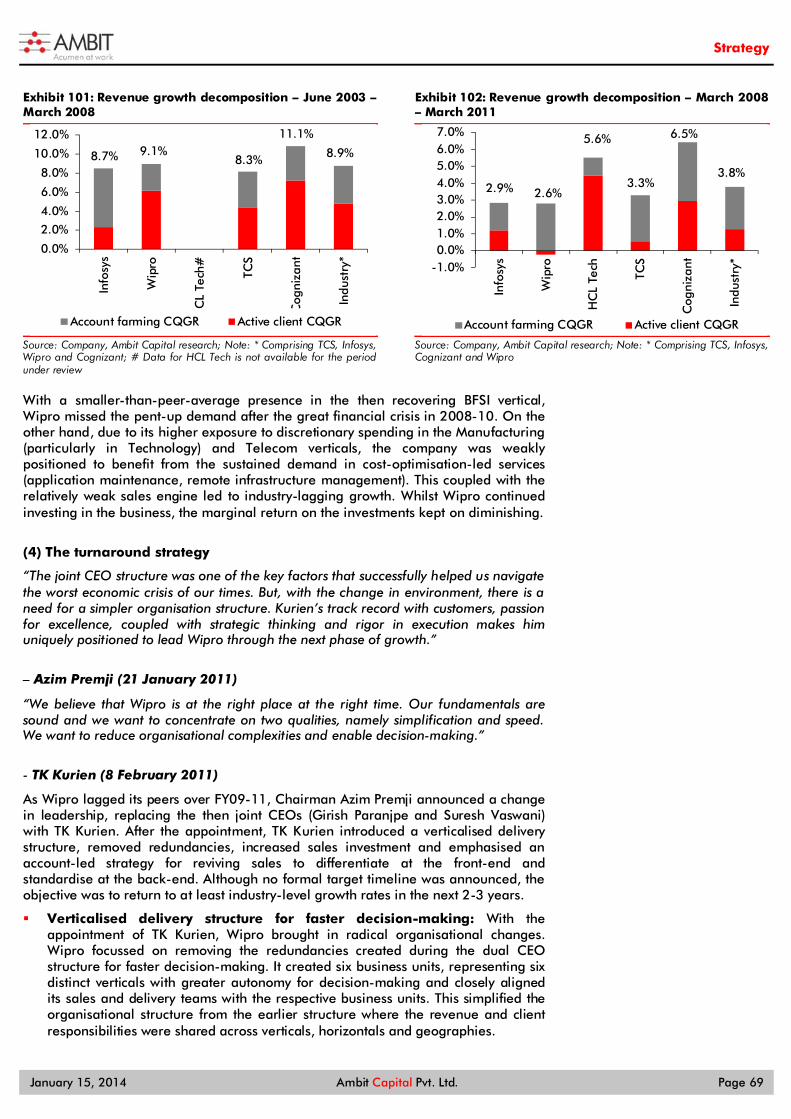
Strategy
January 15, 2014 Ambit Capital Pvt. Ltd. Page 69
Exhibit 101: Revenue growth decomposition – June 2003 –March 2008
Source: Company, Ambit Capital research; Note: * Comprising TCS, Infosys, Wipro and Cognizant; # Data for HCL Tech is not available for the period under review
Exhibit 102: Revenue growth decomposition – March 2008 – March 2011
Source: Company, Ambit Capital research; Note: * Comprising TCS, Infosys, Cognizant and Wipro
With a smaller-than-peer-average presence in the then recovering BFSI vertical, Wipro missed the pent-up demand after the great financial crisis in 2008-10. On the other hand, due to its higher exposure to discretionary spending in the Manufacturing (particularly in Technology) and Telecom verticals, the company was weakly positioned to benefit from the sustained demand in cost-optimisation-led services (application maintenance, remote infrastructure management). This coupled with the relatively weak sales engine led to industry-lagging growth. Whilst Wipro continued investing in the business, the marginal return on the investments kept on diminishing.
(4) The turnaround strategy
“The joint CEO structure was one of the key factors that successfully helped us navigate the worst economic crisis of our times. But, with the change in environment, there is a need for a simpler organisation structure. Kurien’s track record with customers, passion for excellence, coupled with strategic thinking and rigor in execution makes him uniquely positioned to lead Wipro through the next phase of growth.”
– Azim Premji (21 January 2011)
“We believe that Wipro is at the right place at the right time. Our fundamentals are sound and we want to concentrate on two qualities, namely simplification and speed. We want to reduce organisational complexities and enable decision-making.”
- TK Kurien (8 February 2011)
As Wipro lagged its peers over FY09-11, Chairman Azim Premji announced a change in leadership, replacing the then joint CEOs (Girish Paranjpe and Suresh Vaswani) with TK Kurien. After the appointment, TK Kurien introduced a verticalised delivery structure, removed redundancies, increased sales investment and emphasised an account-led strategy for reviving sales to differentiate at the front-end and standardise at the back-end. Although no formal target timeline was announced, the objective was to return to at least industry-level growth rates in the next 2-3 years.
Verticalised delivery structure for faster decision-making: With the appointment of TK Kurien, Wipro brought in radical organisational changes. Wipro focussed on removing the redundancies created during the dual CEO structure for faster decision-making. It created six business units, representing six distinct verticals with greater autonomy for decision-making and closely aligned its sales and delivery teams with the respective business units. This simplified the organisational structure from the earlier structure where the revenue and client responsibilities were shared across verticals, horizontals and geographies.
8.7% 9.1%8.3%
11.1%
8.9%
0.0%
2.0%
4.0%
6.0%
8.0%
10.0%
12.0%
Info
sys
Wip
ro
HC
L Te
ch#
TCS
Cog
niza
nt
Indu
stry
*
Account farming CQGR Active client CQGR
2.9% 2.6%
5.6%
3.3%
6.5%
3.8%
-1.0%0.0%1.0%2.0%3.0%4.0%5.0%6.0%7.0%
Info
sys
Wip
ro
HC
L Te
ch
TCS
Cog
niza
nt
Indu
stry
*
Account farming CQGR Active client CQGR

Strategy
January 15, 2014 Ambit Capital Pvt. Ltd. Page 70
Trimming the hierarchy and poaching talent: These initiatives led to the elimination of several overlapping managerial functions and brought in several changes in responsibilities. Mr Kurien took underperformers to task, which led to several senior- and mid-level management exits from the firm, both voluntary as well as involuntary. Recognising the capability issues, Wipro brought in talent from outside; for example, it poached quality senior talent from rivals such as TCS (delivery organisation), Cognizant (sales) and Infosys (BFSI leadership).
Increased focus on sales and efficiency improvement: TK Kurien laid out the objective of ‘standardising the back-end whilst differentiating the front-end’. Wipro focused on delinking revenue from headcount through standardisation and automation processes to achieve operational efficiencies. For differentiation at the front-end, Wipro hired several domain and consulting experts (including poaching people from rivals such as TCS, Infosys and Cognizant) and increased sales and marketing spends.
Large account-led strategy: Wipro also followed a large-account-led strategy, identifying mega/gamma accounts for deeper penetration. This played out well for the top-10 accounts, although the benefits beyond the non-top-10 accounts have not yet come through.
Many of these initiatives started yielding results during FY13. With the number of clients with TTM (trailing 12-month) revenues of >US$100mn increasing from 1 in 3QFY11 to 10 in 3QFY13, largely reflective of the large-account-led strategy, the ability to hunt successfully for promising accounts is yet to improve significantly. Wipro continues to struggle to match industry-level growth rates in infrastructure services whilst its European business too lags the industry growth rates. The final turnaround of the business still has some caveats:
Stagnation in client additions after 3QFY13: By focussing on the top-10 accounts, Wipro effectively mined these customers, increasing the size of these relationships. (Wipro now has 10 clients with TTM revenues of >US$100mn from 1 in 3QFY11). However, in this process, the smaller accounts escaped the management’s attention. In fact, hardly any account additions were seen at the lower end of the client pyramid. The decline in clients in the US$1mn-20mn revenue bucket is understandable, given the company’s strategy of discontinuing non-strategic relationships. (These accounts in which Wipro is not a strategic service provider, declined from ~87 at the start of the restructuring process to ~20 in 4QFY14 and are eventually likely to decline to zero). However, softer client additions in the US$20mn-50mn and US$50mn-100mn revenue bucket are a cause for concern. Furthermore, the client count in the >US$100mn bucket has stagnated over the last three quarters.
Exhibit 103: Need to re-energise the sales engine
Source: Company, Ambit Capital research
Exhibit 104: Moderation in tail accounts as well
Source: Company, Ambit Capital research
0102030405060
Jun-
09
Oct
-09
Feb-
10
Jun-
10
Oct
-10
Feb-
11
Jun-
11
Oct
-11
Feb-
12
Jun-
12
Oct
-12
Feb-
13
Jun-
13
Num
ber o
f cl
ient
s
Clients with TTM revenues between USD20 to 50mn
Clients with TTM revenues between USD50 to 100mn
Clients with TTM revenues >100mn
0200400600800
10001200
Jun-
09
Oct
-09
Feb-
10
Jun-
10
Oct
-10
Feb-
11
Jun-
11
Oct
-11
Feb-
12
Jun-
12
Oct
-12
Feb-
13
Jun-
13Num
ber o
f cl
ient
s
No of active clients
Clients with TTM revenues between USD1 to 20mn

Strategy
January 15, 2014 Ambit Capital Pvt. Ltd. Page 71
Farming credentials are weak outside the top-10 accounts: Wipro’s smaller accounts not only suffered from a weaker hunting focus but the farming has also not been too encouraging in these accounts. Worryingly, Wipro’s revenue per active client is significantly below that of the late entrants, Cognizant and HCL Tech.
Exhibit 105: Tail accounts still lack Wipro’s sales attention
Source: Company, Ambit Capital research
Exhibit 106: Wipro derives the lowest revenue per active customer (for quarter-ending September 2013)
Source: Company, Ambit Capital research
Largest growth driver – IMS still lags industry growth; need to re-consider the business model: Whilst Infrastructure Management Services (IMS) have historically been considered as an area of competitive advantage for Wipro, the ground realities are quite stark. Whilst in absolute terms, Wipro has the largest IMS practice (US$1,541mn on TTM basis), around 25% of this comes from the lower-margin India and Middle-East business and another 25% comes from the datacentre-heavy Infocrosssing business. Wipro’s IMS revenues expanded at the lowest rate among its tier-1 peers over the last ten quarters.
Exhibit 107: Traditional strength in IMS is not reflected in numbers
Source: Company, Ambit Capital research; *our estimates
Missing the Europe-led growth (lagging behind peers) and no material acquisition: Whilst Europe has been the growth engine for Indian IT services firms, Wipro appears to have missed the growth opportunity, given its investment bank-heavy European practice. As shown in Exhibit 16 below, Wipro has lagged its peers in the European business over the last four years. Another reason for the weaker positioning is a lack of inorganic initiatives. The European market requires a local front-end presence, which can be gained through acquisitions. Wipro will need to make material acquisitions to strengthen its market position against tier-1 peers that have been quite aggressive in Europe (such as TCS and Cognizant).
2.03.04.05.06.07.08.0
Jun-
09Se
p-0
9D
ec-0
9M
ar-1
0Ju
n-10
Sep-
10
Dec
-10
Mar
-11
Jun-
11Se
p-1
1D
ec-1
1M
ar-1
2Ju
n-12
Sep-
12
Dec
-12
Mar
-13
Jun-
13Se
p-1
3
USD
mn
Revenue per active client
Revenue per non top 10 account
456789
101112
TCS
Cog
niza
nt
Info
sys
Wip
ro
HC
L Te
ch
USD
mn
31.5%
24.2%
12.2% 11.9%7.0%
0%1%2%3%4%5%6%7%8%
0%5%
10%15%20%25%30%35%
HCL Tech Wipro Wipro (ExclIndia/ME andInfocrossing)*
TCS Infosys
IMS
reve
nu
e C
QG
R (
Ma
r'11
-Se
p'1
3)
IMS
reve
nu
es
as
% o
f to
tal
reve
nu
es
IMS revenues as % of total
IMS revenues CQGR (Mar'11 - Sep'13) - RHS

Strategy
January 15, 2014 Ambit Capital Pvt. Ltd. Page 72
Exhibit 108: Weaker positioning in Europe
Source: Company, Ambit Capital research
Nonetheless, besides fixing the above-mentioned problems, some of Wipro’s recent initiatives are encouraging. Wipro’s approach to expand inorganically through partnerships and strategic investments appears to be more prudent to gain capabilities in emerging technologies. Wipro has acquired minority stakes in a couple of emerging technology companies in the last few months, such as: (1) Opera Solutions (A big data analytics company) for US$30mn in May 2013 and (2) Axeda (a cloud-based service provider for managing connected products and implementing machine-to-machine applications) for US$5mn in June 2013.
Furthermore, with the demerger of the non-IT business and potential sale of IT products manufacturing, the capital intensity is likely to reduce, thus driving up asset turn and RoCE. That said, the potential cyclical spending recovery in India and the Middle East (collectively ~8% of Wipro’s revenues) could provide upside to Wipro’s revenues. (Only TCS among the tier-1 firms has such a large presence in these markets).
(5) Still a few hurdles to cross for the turnaround
As TK Kurien stated in a media interview2 on 24 October 2013, “For us, turnaround means consistency in performance”. Hence, we would look for more concrete evidence before believing that the turnaround is over. Wipro needs to re-energise its client-hunting and smaller client farming to return to the industry growth rate (current estimate of 12-14% for FY14 by NASSCOM). This appears unlikely at least in FY14 and difficult in FY15. This together with fixing the problems in the IMS and Europe business could be the potential hurdles to Wipro returning to the industry growth rate. Given that Wipro is currently operating at below historical levels of utilisation and given its successful execution on industrialisation initiatives, margins are not a big concern.
Due to its simpler business structure (through the demerger of the non-IT business and the likely closure of the IT products manufacturing), Wipro’s business is now more comparable to pure-play IT services firms. This, together with the recent euphoria about the US demand recovery, has led to stock price rally of >50% YTD. With the turnaround still in process and with the P/E multiple re-rating in the last nine months (from ~15.0x to ~18.0x one-year forward earnings), the stock looks expensive. Indeed, the stock in now trading at a premium to the last five-year average P/E multiple. Our target price of `476 implies 13% downside from CMP. Although valuations are expensive, Wipro remains an interesting turnaround story to watch out for.
2 http://www.business-standard.com/article/companies/for-us-turnaround-means-consistency-in-performance-t-k-kurien-113102300897_1.html
100
150
200
250
300
350Ju
n-09
Sep-
09
Dec
-09
Mar
-10
Jun-
10
Sep-
10
Dec
-10
Mar
-11
Jun-
11
Sep-
11
Dec
-11
Mar
-12
Jun-
12
Sep-
12
Dec
-12
Mar
-13
Jun-
13
Sep-
13Qu
art
erl
y re
ven
ue
s in
de
xed
to
Ju
ne
20
09 TCS
Infosys
Wipro
HCL Tech
Cognizant
Wipro IT – revenue and margins
USD revenue
growth
EBIT margins
FY12 13.4% 20.8%
FY13 5.0% 20.7%
FY14E 6.6% 22.1%
FY15E 13.8% 21.8%
FY16E 13.1% 20.8%
Source: Company, Ambit Capital research
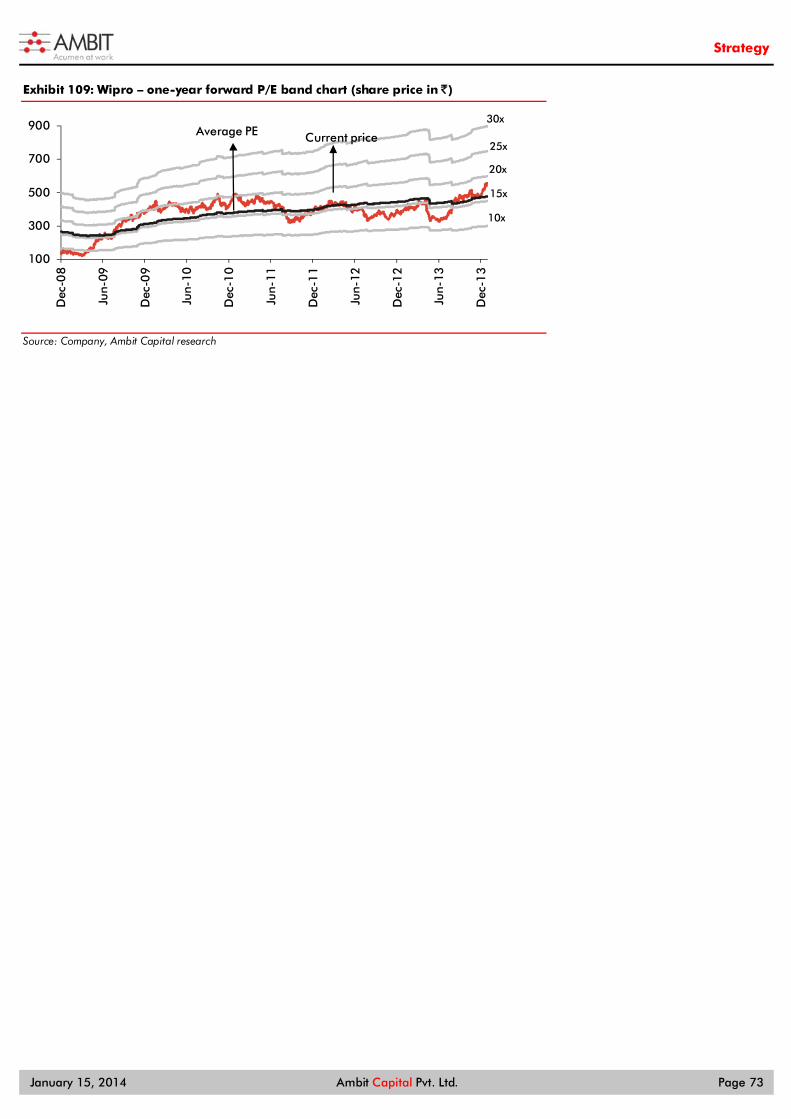
Strategy
January 15, 2014 Ambit Capital Pvt. Ltd. Page 73
Exhibit 109: Wipro – one-year forward P/E band chart (share price in ̀ )
Source: Company, Ambit Capital research
100
300
500
700
900
Dec
-08
Jun-
09
Dec
-09
Jun-
10
Dec
-10
Jun-
11
Dec
-11
Jun-
12
Dec
-12
Jun-
13
Dec
-13
Average PE Current price
30x
25x 20x 15x 10x

Strategy
January 15, 2014 Ambit Capital Pvt. Ltd. Page 74
Notes:

Strategy
January 15, 2014 Ambit Capital Pvt. Ltd. Page 75
Institutional Equities Team
SaurabhMukherjea, CFA CEO, Institutional Equities (022) 30433174 [email protected]
Research
Analysts Industry Sectors Desk-Phone E-mail
Aadesh Mehta Banking & Financial Services (022) 30433239 [email protected]
Achint Bhagat Cement / Infrastructure (022) 30433178 [email protected]
Ankur Rudra, CFA Technology / Telecom / Media (022) 30433211 [email protected]
Ashvin Shetty, CFA Automobile (022) 30433285 [email protected]
Bhargav Buddhadev Power / Capital Goods (022) 30433252 [email protected]
Dayanand Mittal, CFA Oil & Gas / Metals & Mining (022) 30433202 [email protected]
Gaurav Mehta, CFA Strategy / Derivatives Research (022) 30433255 [email protected]
Karan Khanna Strategy (022) 30433251 [email protected]
Krishnan ASV Banking & Financial Services (022) 30433205 [email protected]
Nitin Bhasin E&C / Infrastructure / Cement (022) 30433241 [email protected]
Nitin Jain Technology (022) 30433291 [email protected]
Pankaj Agarwal, CFA Banking & Financial Services (022) 30433206 [email protected]
Pratik Singhania Real Estate / Retail (022) 30433264 [email protected]
Parita Ashar Metals & Mining / Oil & Gas (022) 30433223 [email protected]
Rakshit Ranjan, CFA Consumer / Real Estate (022) 30433201 [email protected]
Ravi Singh Banking & Financial Services (022) 30433181 [email protected]
Ritika Mankar Mukherjee, CFA Economy / Strategy (022) 30433175 [email protected]
Ritu Modi Automobile / Healthcare (022) 30433292 [email protected]
Shariq Merchant Consumer (022) 30433246 [email protected]
Tanuj Mukhija, CFA E&C / Infrastructure (022) 30433203 [email protected]
Sales
Name Regions Desk-Phone E-mail
Deepak Sawhney India / Asia (022) 30433295 [email protected]
Dharmen Shah India / Asia (022) 30433289 [email protected]
Dipti Mehta India / USA (022) 30433053 [email protected]
Nityam Shah, CFA USA / Europe (022) 30433259 [email protected]
Parees Purohit, CFA UK / USA (022) 30433169 [email protected]
Praveena Pattabiraman India / Asia (022) 30433268 [email protected]
Sarojini Ramachandran UK +44 (0) 20 7614 8374 [email protected]
Production
Sajid Merchant Production (022) 30433247 [email protected]
Sharoz G Hussain Production (022) 30433183 [email protected]
Joel Pereira Editor (022) 30433284 [email protected]
Nikhil Pillai Database (022) 30433265 [email protected]
E&C = Engineering & Construction

Strategy
January 15, 2014 Ambit Capital Pvt. Ltd. Page 76
Explanation of Investment Rating Investment Rating Expected return
(over 12-month period from date of initial rating)
Buy >5%
Sell <5%
Disclaimer
This report or any portion hereof may not be reprinted, sold or redistributed without the written consent of Ambit Capital. AMBIT Capital Research is disseminated and available primarily electronically, and, in some cases, in printed form.
Additional information on recommended securities is available on request.
Disclaimer 1. AMBIT Capital Private Limited (“AMBIT Capital”) and its affiliates are a full service, integrated investment banking, investment advisory and brokerage group. AMBIT Capital is a Stock
Broker, Portfolio Manager and Depository Participant registered with Securities and Exchange Board of India Limited (SEBI) and is regulated by SEBI 2. The recommendations, opinions and views contained in this Research Report reflect the views of the research analyst named on the Research Report and are based upon publicly
available information and rates of taxation at the time of publication, which are subject to change from time to time without any prior notice. 3. AMBIT Capital makes best endeavours to ensure that the research analyst(s) use current, reliable, comprehensive information and obtain such information from sources which the
analyst(s) believes to be reliable. However, such information has not been independently verified by AMBIT Capital and/or the analyst(s) and no representation or warranty, express or implied, is made as to the accuracy or completeness of any information obtained from third parties. The information or opinions are provided as at the date of this Research Report and are subject to change without notice.
4. If you are dissatisfied with the contents of this complimentary Research Report or with the terms of this Disclaimer, your sole and exclusive remedy is to stop using this Research Report and AMBIT Capital shall not be responsible and/ or liable in any manner.
5. If this Research Report is received by any client of AMBIT Capital or its affiliate, the relationship of AMBIT Capital/its affiliate with such client will continue to be governed by the terms and conditions in place between AMBIT Capital/ such affiliate and the client.
6. This Research Report is issued for information only and should not be construed as an investment advice to any recipient to acquire, subscribe, purchase, sell, dispose of, retain any securities. Recipients should consider this Research Report as only a single factor in making any investment decisions. This Research Report is not an offer to sell or the solicitation of an offer to purchase or subscribe for any investment or as an official endorsement of any investment.
7. If 'Buy', 'Sell', or 'Hold' recommendation is made in this Research Report such recommendation or view or opinion expressed on investments in this Research Report is not intended to constitute investment advice and should not be intended or treated as a substitute for necessary review or validation or any professional advice. The views expressed in this Research Report are those of the research analyst which are subject to change and do not represent to be an authority on the subject. AMBIT Capital may or may not subscribe to any and/ or all the views expressed herein.
8. AMBIT Capital makes no guarantee, representation or warranty, express or implied; and accepts no responsibility or liability as to the accuracy or completeness or currentess of the information in this Research Report. AMBIT Capital or its affiliates do not accept any liability whatsoever for any direct or consequential loss howsoever arising, directly or indirectly, from any use of this Research Report.
9. Past performance is not necessarily a guide to evaluate future performance. 10. AMBIT Capital and/or its affiliates (as principal or on behalf of its/their clients) and their respective officers directors and employees may hold positions in any securities mentioned in this
Research Report (or in any related investment) and may from time to time add to or dispose of any such securities (or investment). Such positions in securities may be contrary to or inconsistent with this Research Report.
11. This Research Report should be read and relied upon at the sole discretion and risk of the recipient. 12. The value of any investment made at your discretion based on this Research Report or income therefrom may be affected by changes in economic, financial and/ or political factors and
may go down as well as up and you may not get back the full or the expected amount invested. Some securities and/ or investments involve substantial risk and are not suitable for all investors.
13. This Research Report is being supplied to you solely for your information and may not be reproduced, redistributed or passed on, directly or indirectly, to any other person or published, copied in whole or in part, for any purpose. Neither this Research Report nor any copy of it may be taken or transmitted or distributed, directly or indirectly within India or into any other country including United States (to US Persons), Canada or Japan or to any resident thereof. The distribution of this Research Report in other jurisdictions may be strictly restricted and/ or prohibited by law or contract, and persons into whose possession this Research Report comes should inform themselves about such restriction and/ or prohibition, and observe any such restrictions and/ or prohibition.
14. Neither AMBIT Capital nor its affiliates or their respective directors, employees, agents or representatives, shall be responsible or liable in any manner, directly or indirectly, for views or opinions expressed in this Report or the contents or any errors or discrepancies herein or for any decisions or actions taken in reliance on the Report or inability to use or access our service or this Research Report or for any loss or damages whether direct or indirect, incidental, special or consequential including without limitation loss of revenue or profits that may arise from or in connection with the use of or reliance on this Research Report or inability to use or access our service or this Research Report.
Conflict of Interests
15. In the normal course of AMBIT Capital’s business circumstances may arise that could result in the interests of AMBIT Capital conflicting with the interests of clients or one client’s interests conflicting with the interest of another client. AMBIT Capital makes best efforts to ensure that conflicts are identified and managed and that clients’ interests are protected. AMBIT Capital has policies and procedures in place to control the flow and use of non-public, price sensitive information and employees’ personal account trading. Where appropriate and reasonably achievable, AMBIT Capital segregates the activities of staff working in areas where conflicts of interest may arise. However, clients/potential clients of AMBIT Capital should be aware of these possible conflicts of interests and should make informed decisions in relation to AMBIT Capital’s services.
16. AMBIT Capital and/or its affiliates may from time to time have investment banking, investment advisory and other business relationships with companies covered in this Research Report and may receive compensation for the same. Research analysts provide important inputs into AMBIT Capital’s investment banking and other business selection processes.
17. AMBIT Capital and/or its affiliates may seek investment banking or other businesses from the companies covered in this Research Report and research analysts involved in preparing this Research Report may participate in the solicitation of such business.
18. In addition to the foregoing, the companies covered in this Research Report may be clients of AMBIT Capital where AMBIT Capital may be required, inter alia, to prepare and publish research reports covering such companies and AMBIT Capital may receive compensation from such companies in relation to such services. However, the views reflected in this Research Report are objective views, independent of AMBIT Capital’s relationship with such company.
19. In addition, AMBIT Capital may also act as a market maker or risk arbitrator or liquidity provider or may have assumed an underwriting commitment in the securities of companies covered in this Research Report (or in related investments) and may also be represented in the supervisory board or on any other committee of those companies.
Additional Disclaimer for U.S. Persons
20. The research report is solely a product of AMBIT Capital 21. AMBIT Capital is the employer of the research analyst(s) who has prepared the research report 22. Any subsequent transactions in securities discussed in the research reports should be effected through J.P.P. Euro-Securities, Inc. (“JPP”). 23. JPP does not accept or receive any compensation of any kind for the dissemination of the AMBIT Capital research reports. 24. The research analyst(s) preparing the research report is resident outside the United States and is/are not associated persons of any U.S. regulated broker-dealer and that therefore the
analyst(s) is/are not subject to supervision by a U.S. broker-dealer, and is/are not required to satisfy the regulatory licensing requirements of FINRA or required to otherwise comply with U.S. rules or regulations regarding, among other things, communications with a subject company, public appearances and trading securities held by a research analyst account.
© Copyright 2014 AMBIT Capital Private Limited. All rights reserved.
Ambit Capital Pvt. Ltd. Ambit House, 3rd Floor 449, Senapati Bapat Marg, Lower Parel, Mumbai 400 013, India. Phone: +91-22-3043 3000 Fax: +91-22-3043 3100
Related Documents


