Newfoundland and Labrador’s Debt Management Strategy: Kicking the Can Down the Road While Waiting for a Saviour Wade Locke and Doug May Department of Economics, MUN A Presentation to the CARE Speaker Series November 13, 2019 MUN Campus 1

Welcome message from author
This document is posted to help you gain knowledge. Please leave a comment to let me know what you think about it! Share it to your friends and learn new things together.
Transcript

Newfoundland and Labrador’s Debt Management Strategy: Kicking the Can Down the Road While
Waiting for a Saviour
Wade Locke and Doug May
Department of Economics, MUN
A Presentation to the CARE Speaker Series
November 13, 2019MUN Campus
1

Not All Debt is Bad• Budgetary deficits government explicit and implicit
expenditures outstrip its revenues
• Deficits, not counterbalanced through the acquisition of financial assets or by budgetary surpluses in other years, accumulate as government debt obligations
• public sector debt accumulation may be good public policy if it is designed to fund needed public infrastructure
• public sector debt accumulation may a tangible demonstration of a fiscal crisis, which requires immediate and drastic fiscal action.
• or, debt finance may simply reflect a short-term fiscal problem, requiring a deliberate plan that is executed within a reasonable timeframe
2

How to Tell if Debt Reflects a Fiscal Crisis
• there is not one universally accepted indicator of a fiscal crisis.
• Indicators may include net debt per capita, net debt as a percent of GDP, debt as a percent of total revenue
• there is no general agreement as to the precise threshold for any of these indicators at which a particular debt profile transforms from good public policy to full-blown a fiscal crisis.
• it is important to appreciate that there is substantial subjectivity and interpretation associated with these types of analyses
3

Provincial Government Revenues and Expenditures, NL, 1994-95 to 2019-20
Sources: Public Accounts (2006-2018) and GNL Estimates 2019 (2019-20)
4
The accrual based revenue from the 2019 Atlantic Accord transfer tend to distort the true picture 2020, the adjusted revenue might be better to utilize in this current discussion
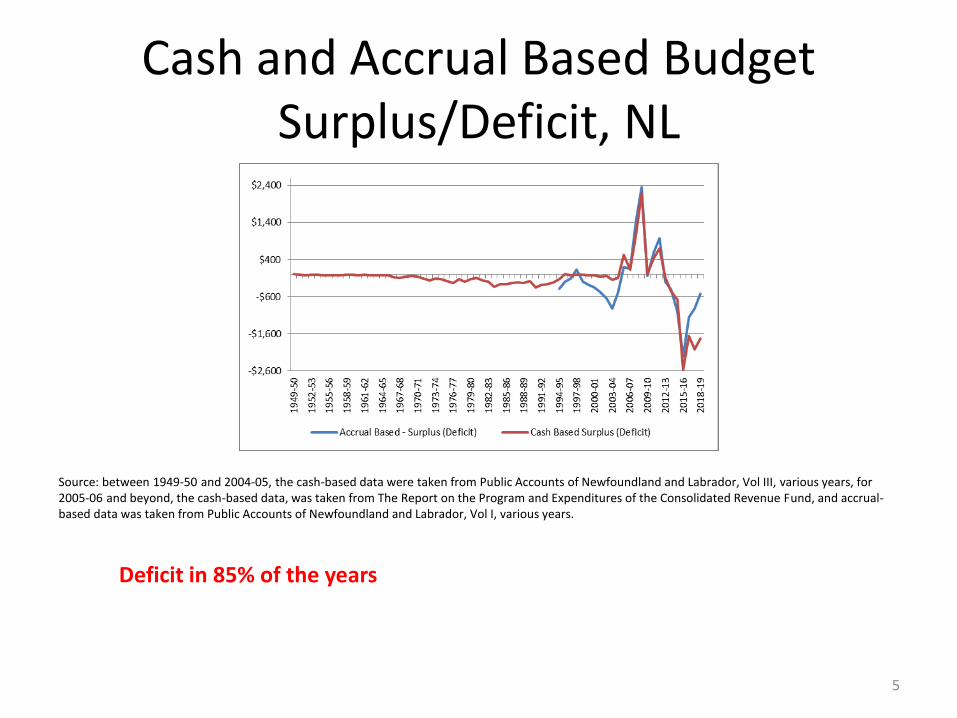
Cash and Accrual Based Budget Surplus/Deficit, NL
Source: between 1949-50 and 2004-05, the cash-based data were taken from Public Accounts of Newfoundland and Labrador, Vol III, various years, for 2005-06 and beyond, the cash-based data, was taken from The Report on the Program and Expenditures of the Consolidated Revenue Fund, and accrual-based data was taken from Public Accounts of Newfoundland and Labrador, Vol I, various years.
5
Deficit in 85% of the years
The Fiscal Background• Seven Years of Abundance • 2005-06 to 2011-12 ($5.1 B in accumulated surpluses)
• Rising Oil Prices• Rising Oil Production• Rising Oil-related revenues• Rising Gov’t Expenditures
• Expanding public sector• Rising public sector wages and other benefits (health, pensions)
• Seven Years of Famine• 2012-13 to 2018-19 (-$9.2 B in accumulated deficits)
• Falling Oil Prices• Falling Oil Production• Falling Oil-related Revenues• Slowly Rising Government Expenditures• Rising Deficits and Debts
6

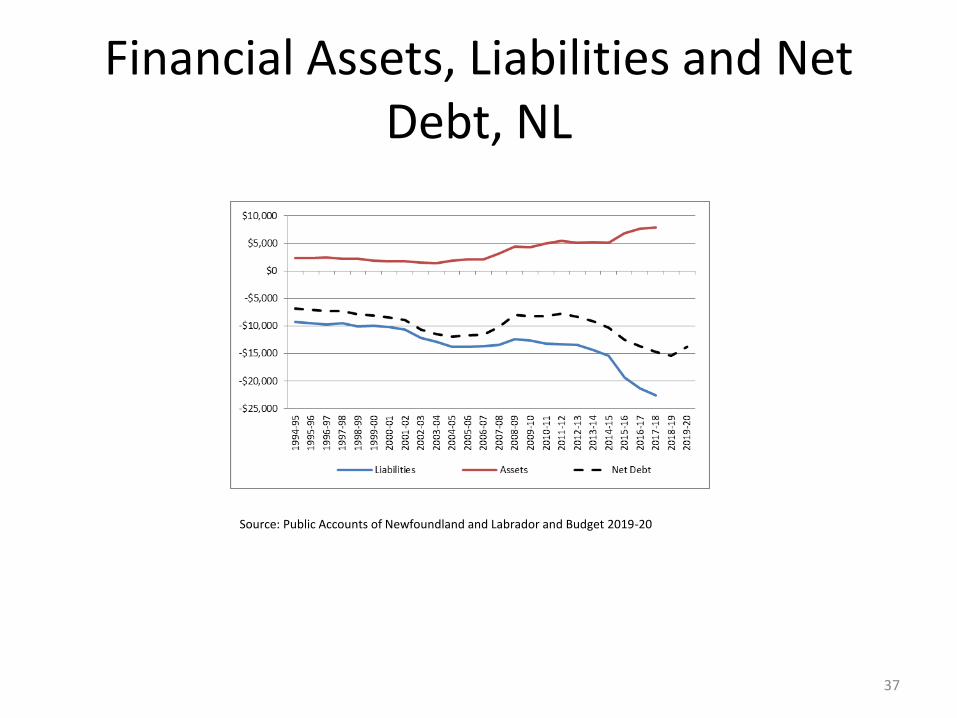
Financial Assets, Liabilities and Net Debt, NL
Source: Public Accounts of Newfoundland and Labrador and Budget 2019-20
7
Net debt in 2018-19 is $15.4 B

How Are We Doing Relative to Other Provinces
8

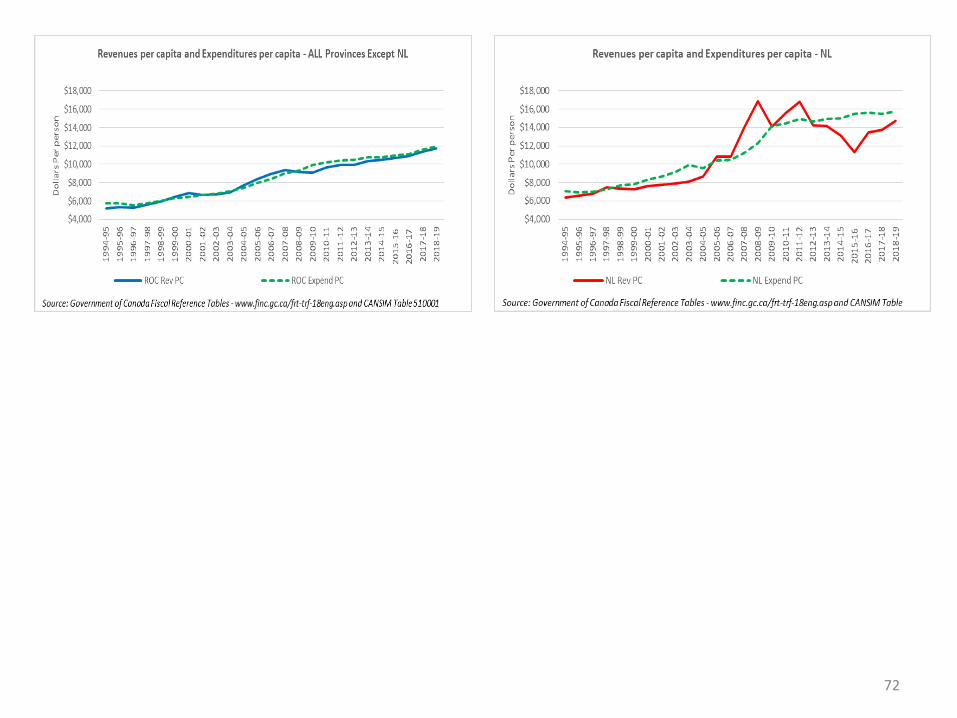
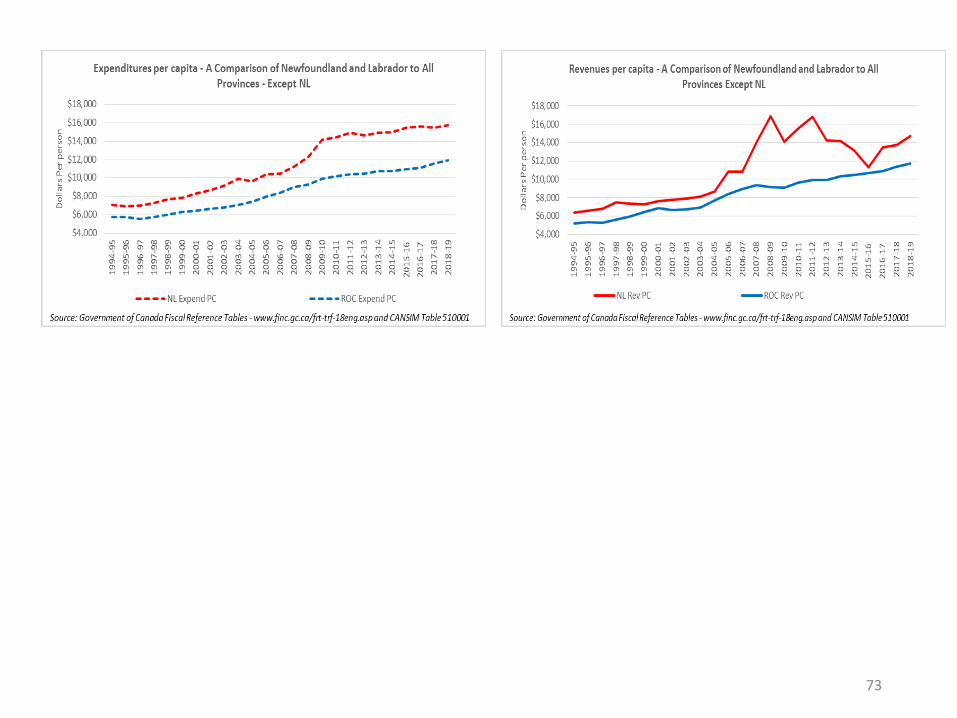
Comparison of Revenue and Expenditures
9
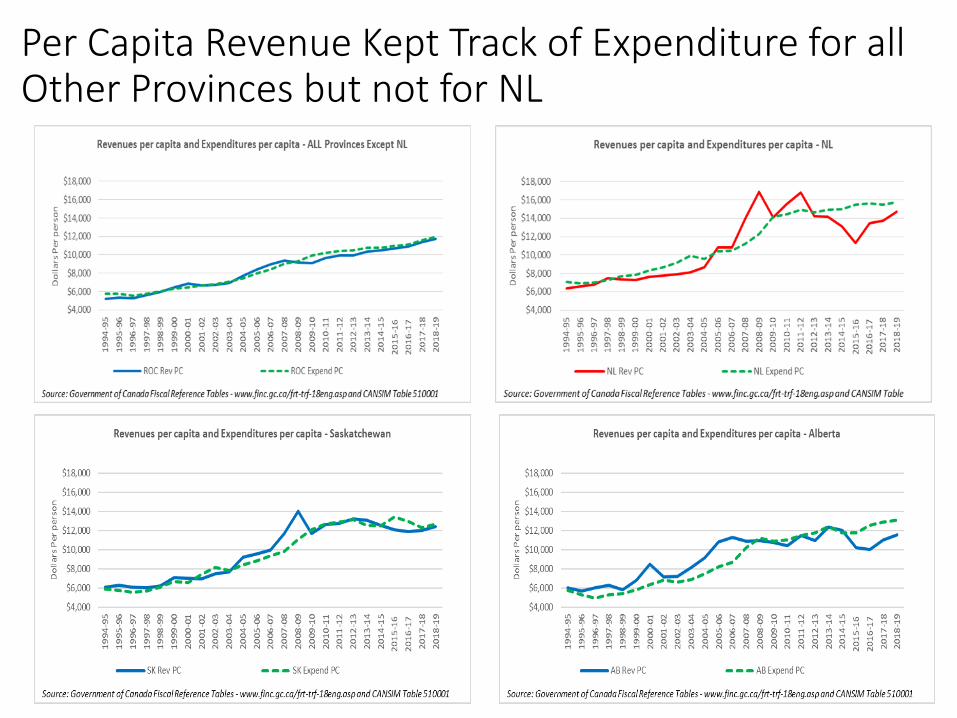
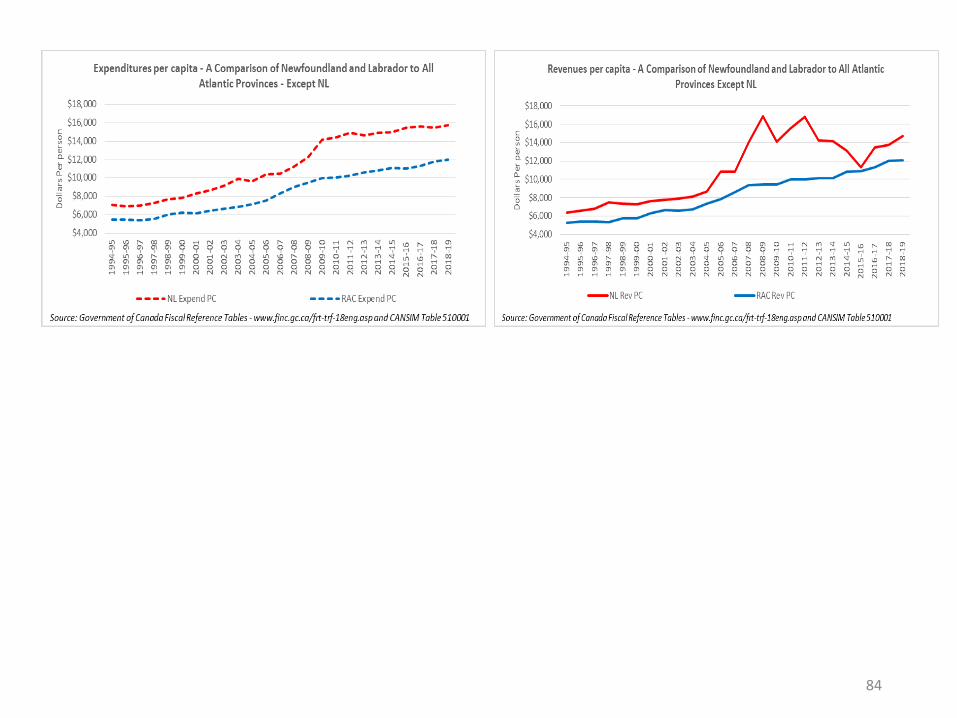
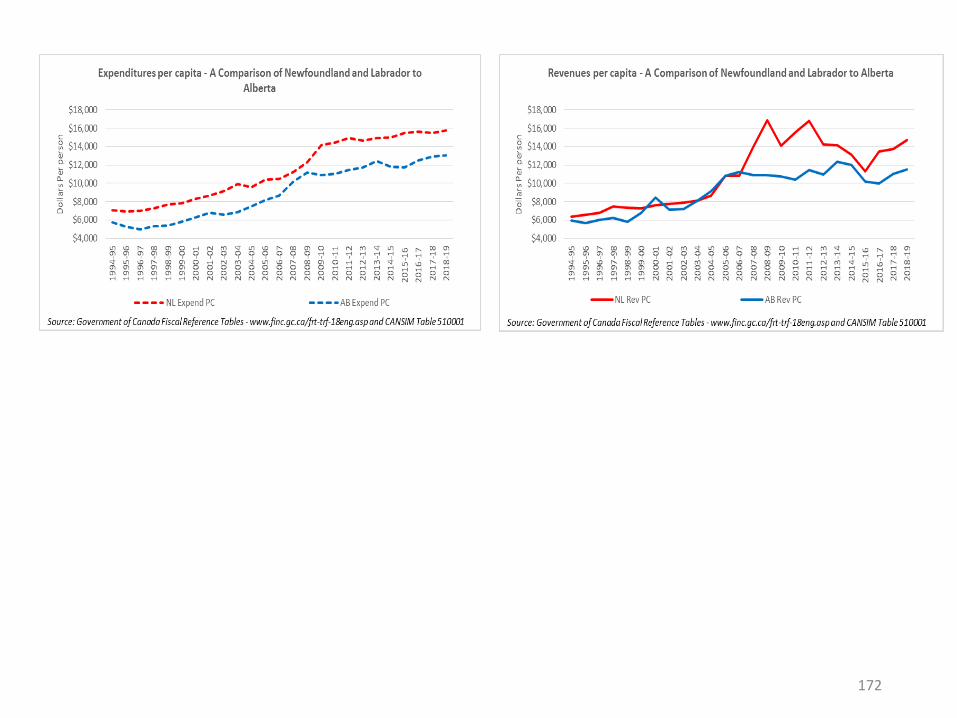
Per Capita Revenue Kept Track of Expenditure for all Other Provinces but not for NL
10
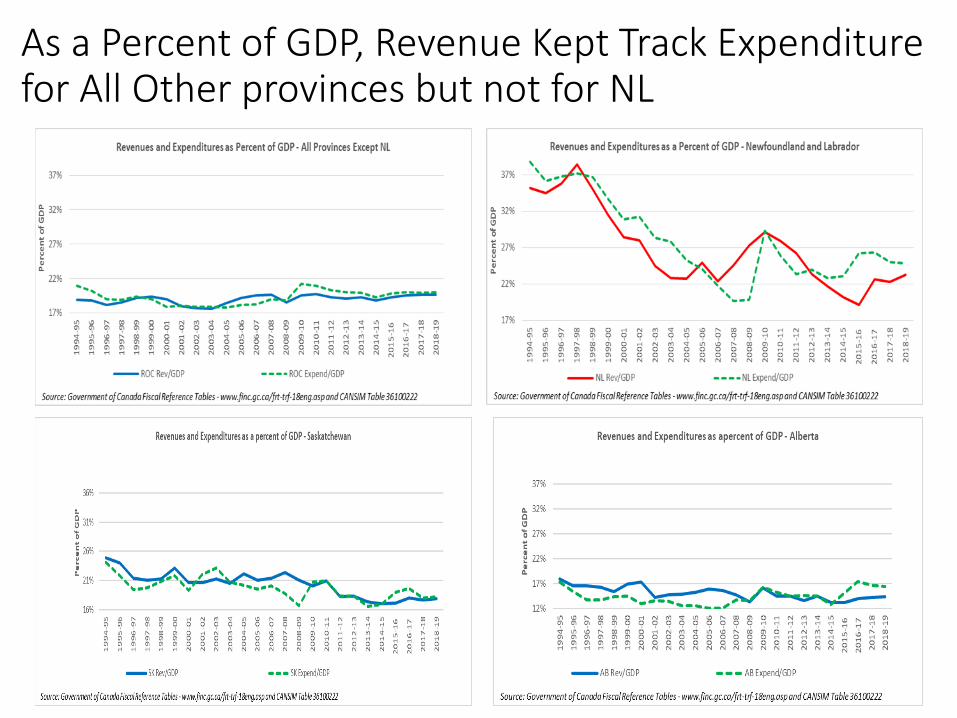
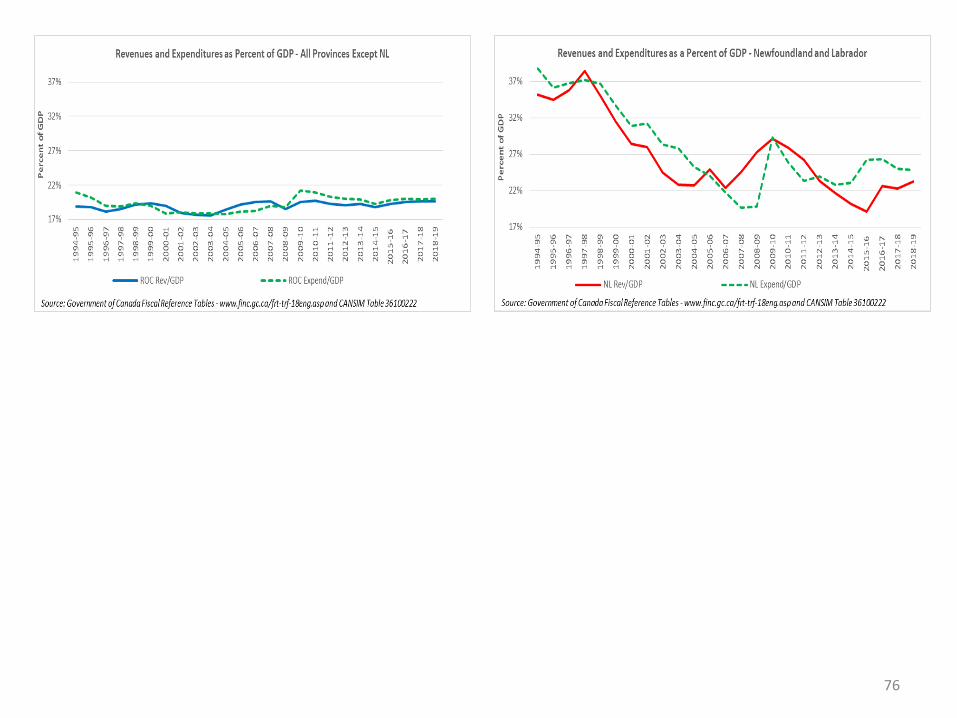
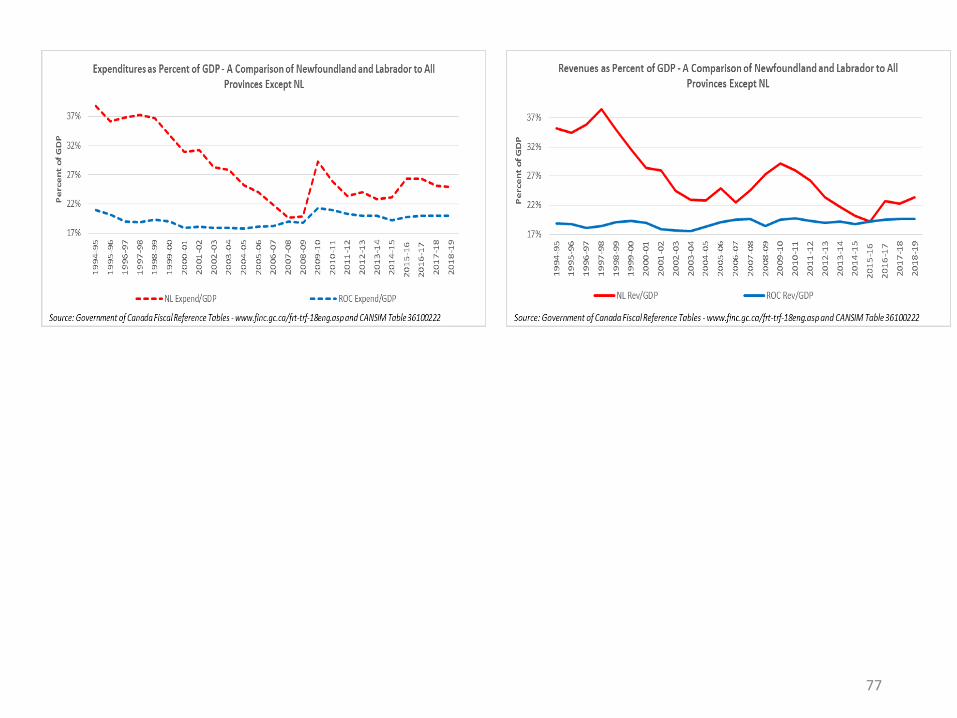
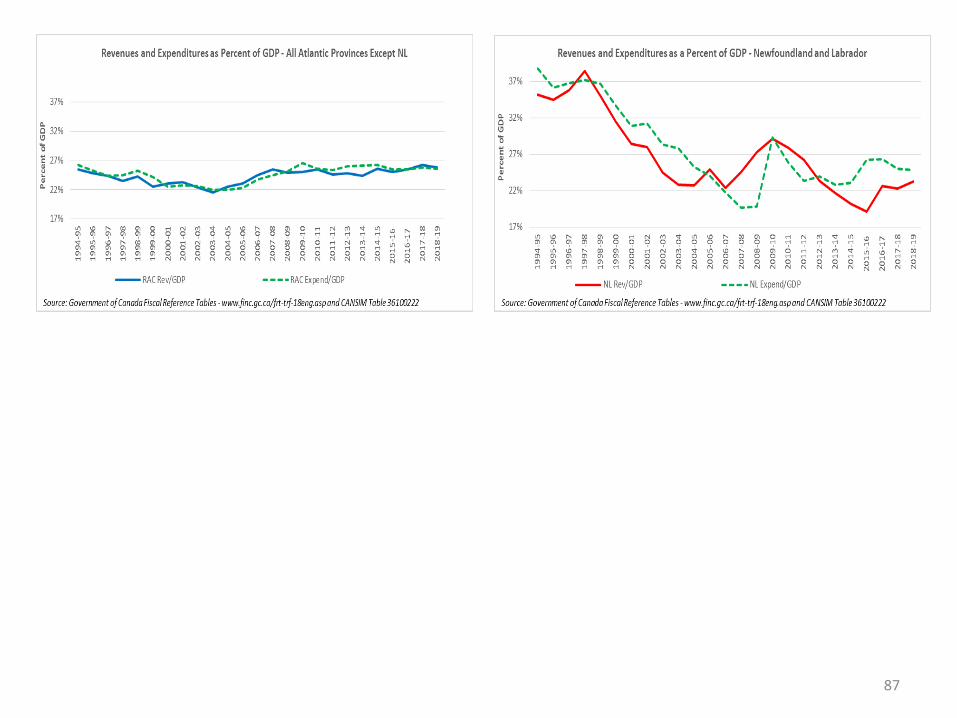
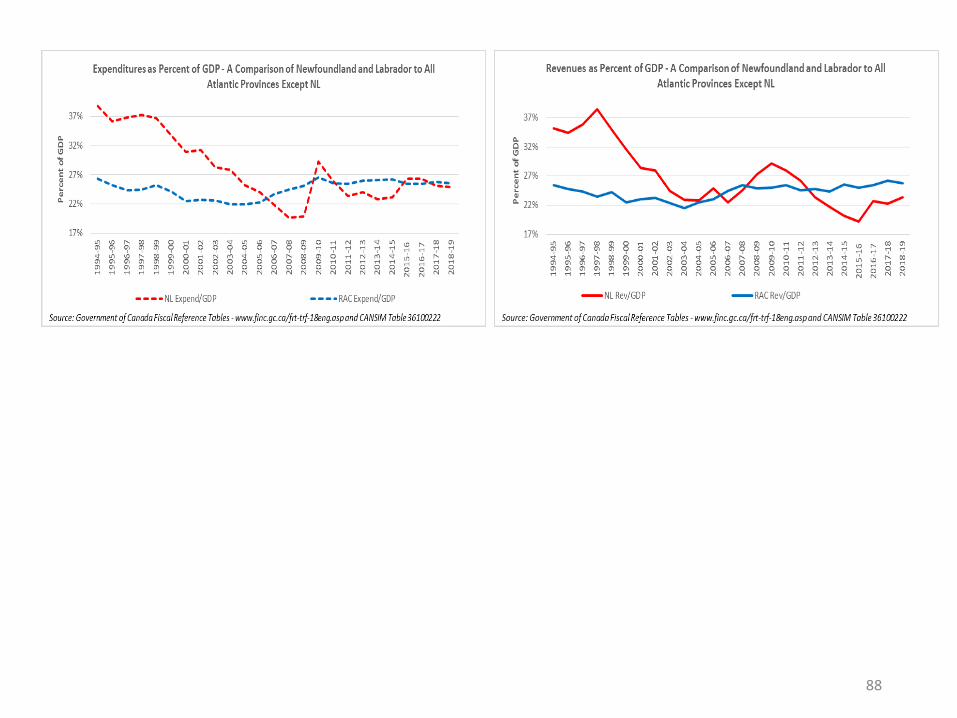
As a Percent of GDP, Revenue Kept Track Expenditure for All Other provinces but not for NL
11

NL had higher expenditure and higher per capital expenditures than all other provinces
12

Comparison of Deficits
13

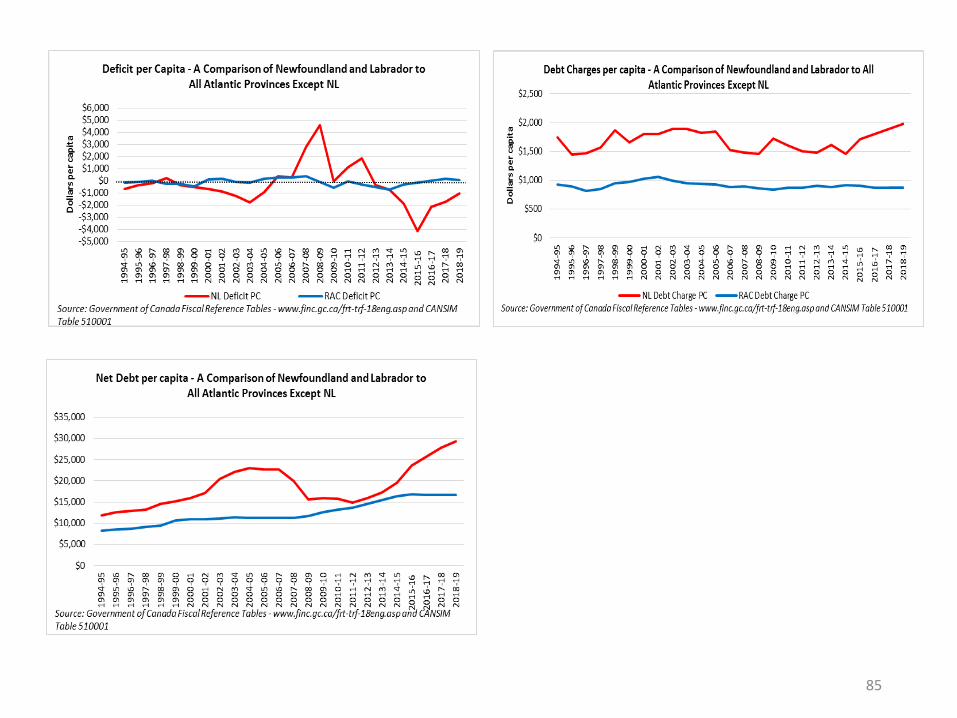
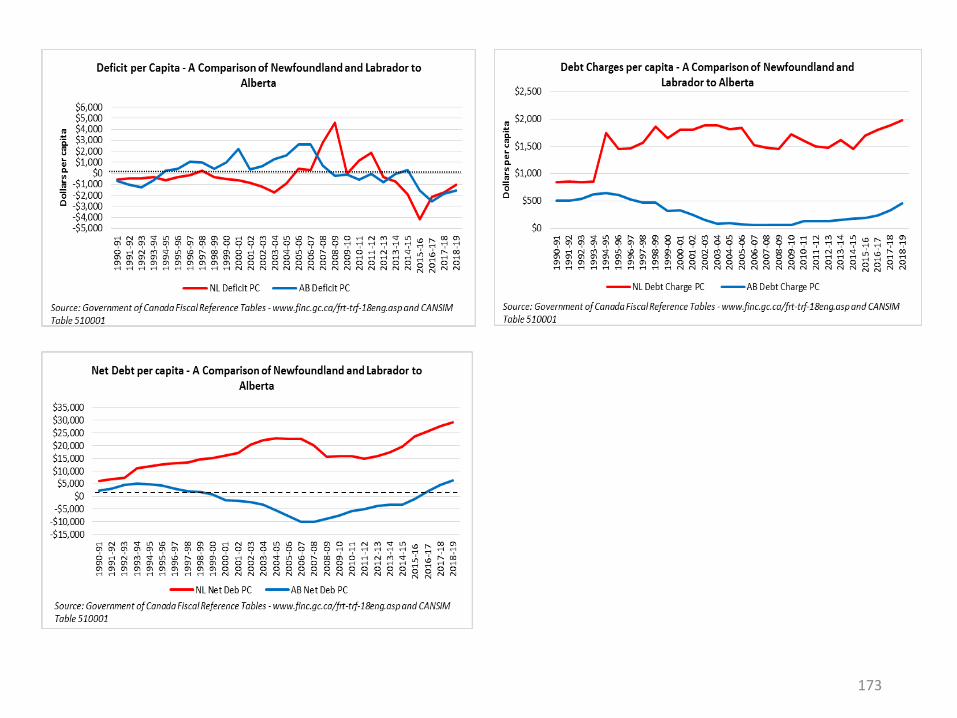
Deficits Per Capita -NL versus all other Provinces
14

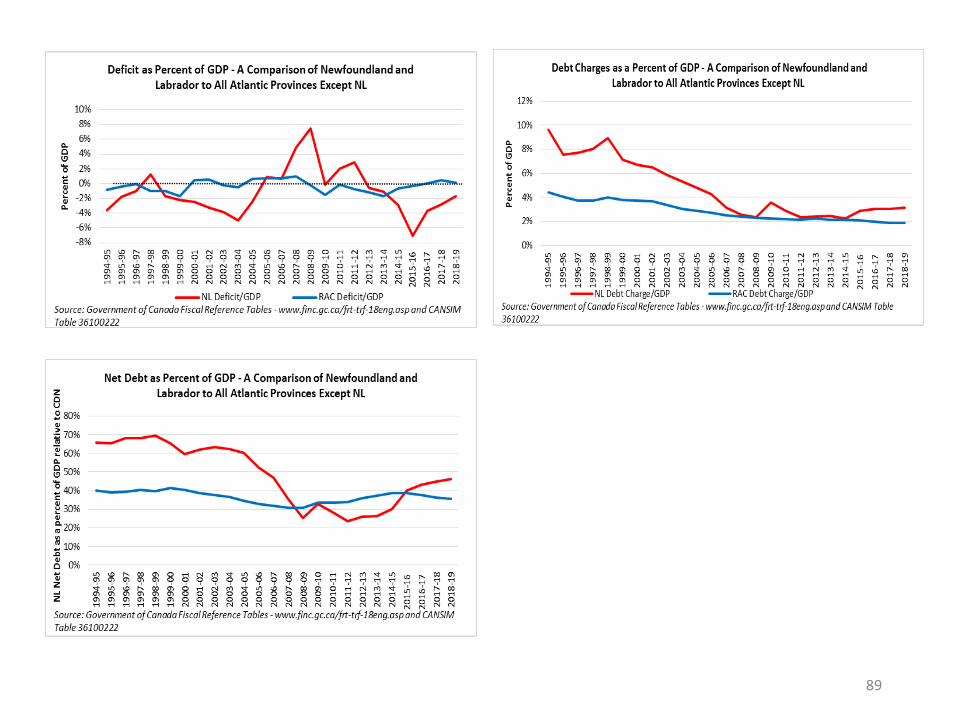
Deficits as a Percent of GDP - NL versus all other Provinces
15

Comparison of Debt Costs
16
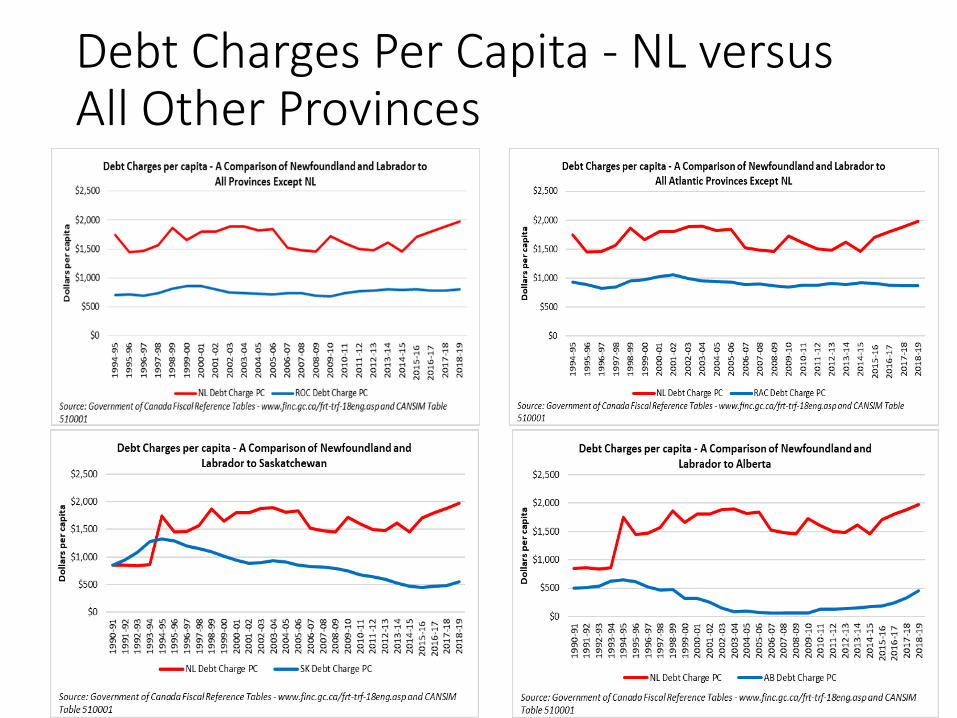
Debt Charges Per Capita - NL versus All Other Provinces
17

Debt Charges as Percent of GDP - NL versus All Other Provinces
18

Comparison of Net Debt
19

Net Debt Per Capita - NL versus All Other Provinces
20
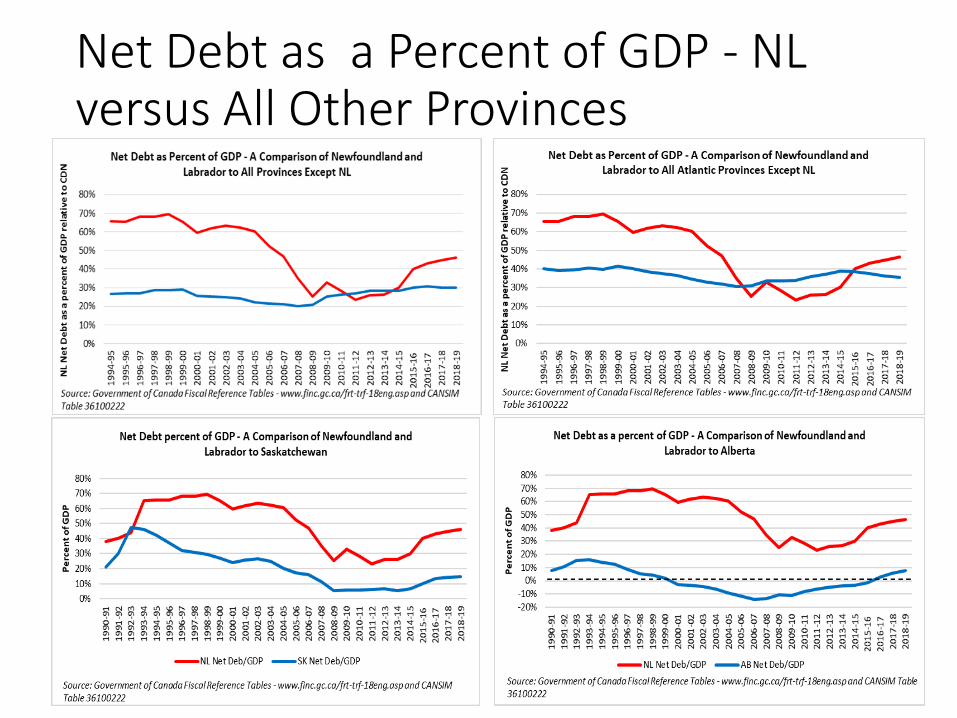
Net Debt as a Percent of GDP - NL versus All Other Provinces
21

Comparison of Revenue Needed to Retire Net Debt
22

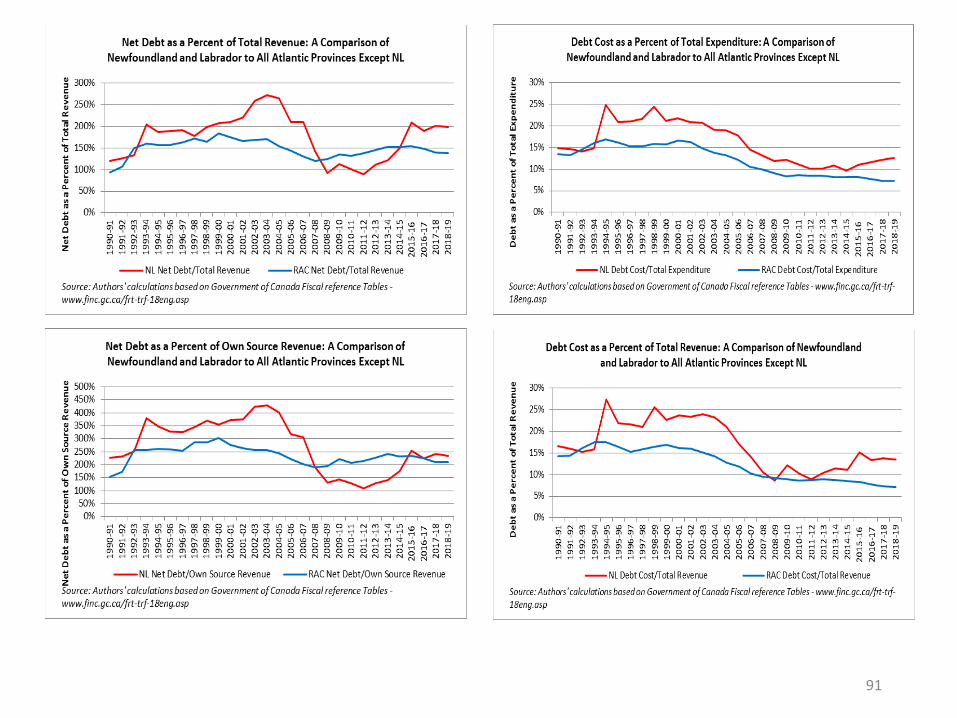
Revenue Needed to Retired Debt - NL Versus All Other Provinces
23

Comparison of Debt Bite
24
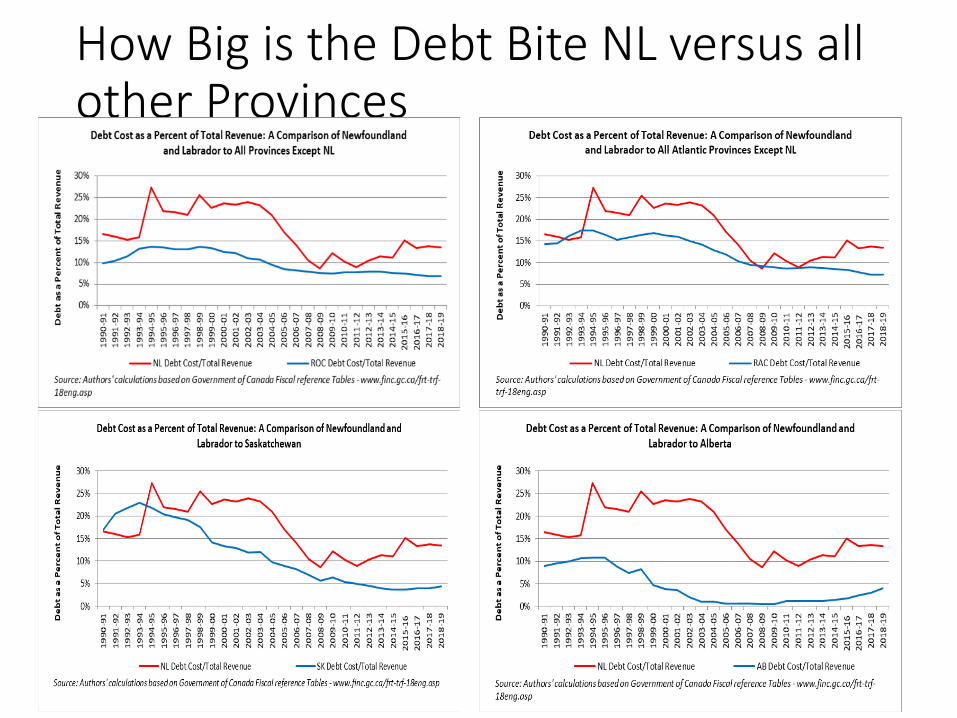
How Big is the Debt Bite NL versus all other Provinces
25

Awakening Fiscal Realities• Dec 22, 2015, the 2015-16 forecasted deficit could be $2B almost
double the $1.1B in the Conservative Government’s Budget.
• Reason for problem: 2008 Brent $144 USD/bbl to <$40 USD/bbl
• Increased spending
• Falling oil production levels but no decrease in spending
• On April 14th 2016, new deficit estimate was $2.2B for 2015-2016
• 2016-2017 up to $2.7B deficit if no action taken.
• Immediate Action: hiring restrictions, limited discretionary travel, limited use of consultants and eliminating on non-essential spending.
• Revised Budget deficit estimate of $1.8B for 2016-17
• Estimated net debt of $16.5 as of March 21, 2023 and balance for the 2021-22 fiscal year.
26
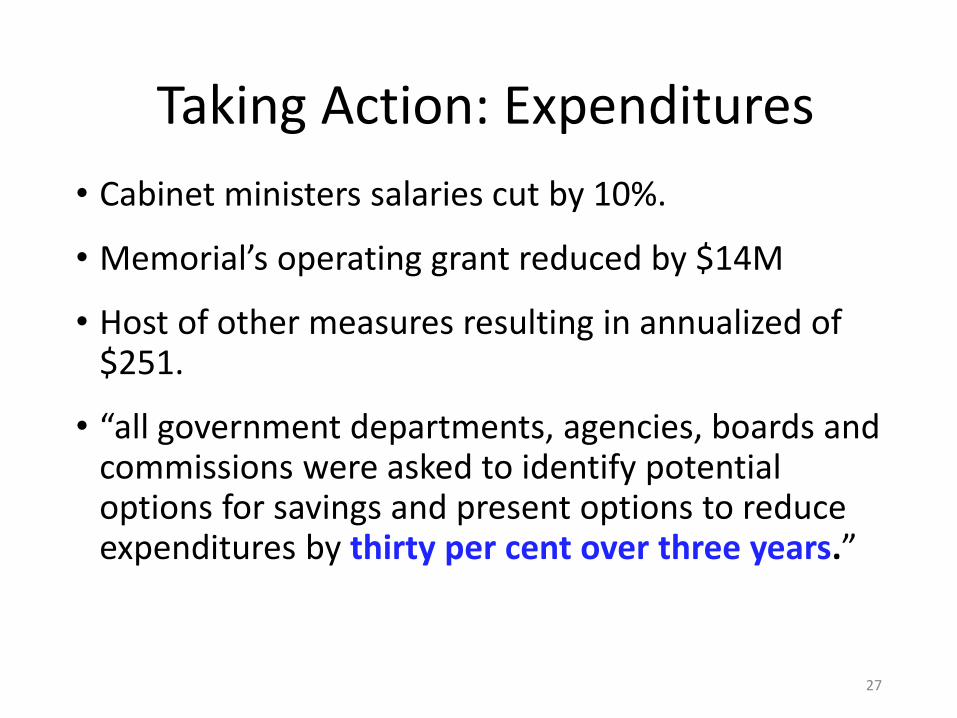
Taking Action: Expenditures
• Cabinet ministers salaries cut by 10%.
• Memorial’s operating grant reduced by $14M
• Host of other measures resulting in annualized of $251.
• “all government departments, agencies, boards and commissions were asked to identify potential options for savings and present options to reduce expenditures by thirty per cent over three years.”
27
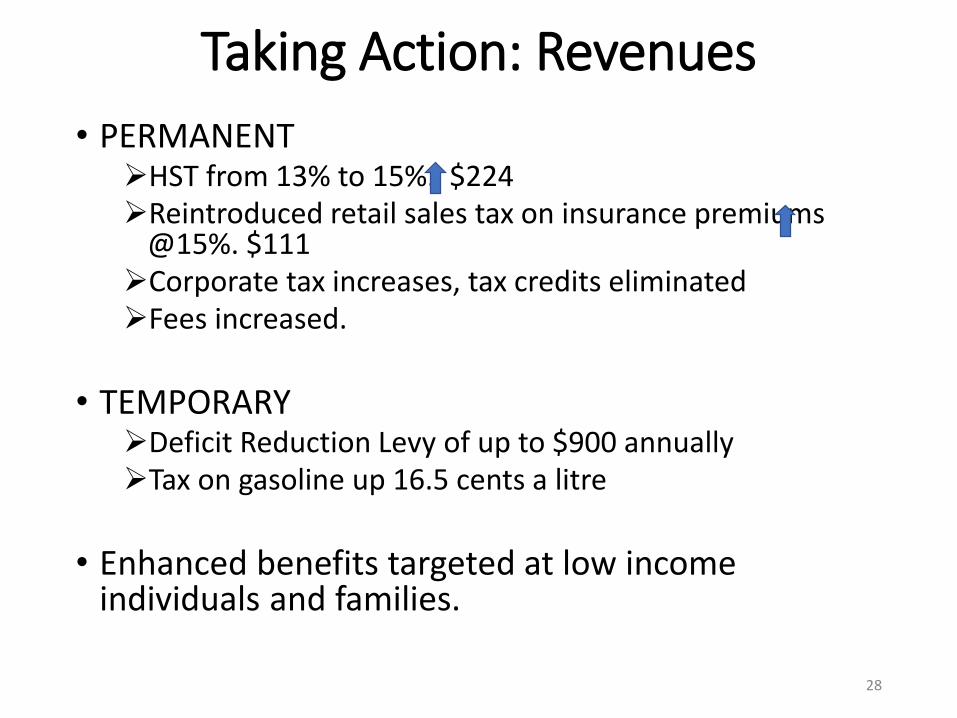
Taking Action: Revenues
• PERMANENTHST from 13% to 15%. $224 Reintroduced retail sales tax on insurance premiums
@15%. $111Corporate tax increases, tax credits eliminatedFees increased.
• TEMPORARYDeficit Reduction Levy of up to $900 annuallyTax on gasoline up 16.5 cents a litre
• Enhanced benefits targeted at low income individuals and families.
28
29
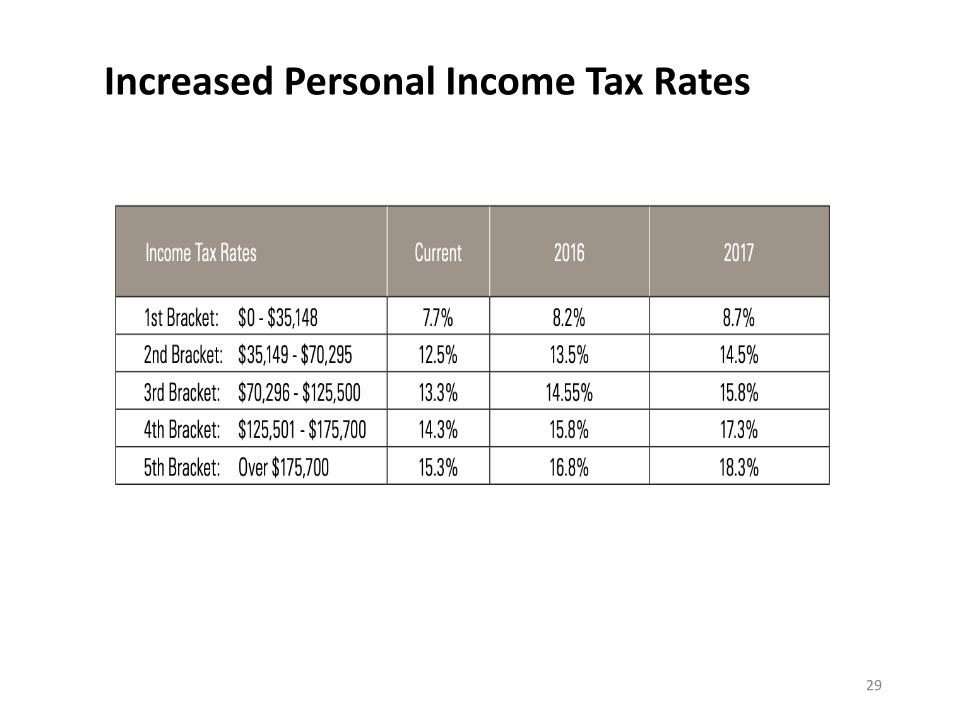
Increased Personal Income Tax Rates
30
Budget 2017, April 6th
• Revised deficit estimate for 2016-17 to $1.1B from est. $1.8 B
• No new taxes
• Temporary Gas Tax reduced by 8.5 cents June 1 and then by 4 cents on Dec. 1
• Wage freeze for non-union employees and managers.
• Still expected surplus in 2022-23
31

What Was Not Said.
• Major expenditure reductions over the next couple of fiscal years through attrition and laying off employees. This had begun with DM’s, ADM’s and some Directors BUT unionized workers were still up for negotiation.
• Cathy Bennett resigned as Minister on July 31, 2017, but continued on as a MHA until August 2018 engaging in discussion on bullying and harassment.
• In June 2017, Doug May gave a talk at the CEA meetings in NS on Newfoundland’s Economic Future? As the Ungovernable Staples Colony.
32
The Ungovernable Staples Colony
• In June 2017, Doug May gave a talk at the CEA meetings in NS on Newfoundland’s Economic Future? As the Ungovernable Staples Colony.
• Ungovernable: 1-2 degrees of separation uncontrollable political resistance led by local elites to any reduction in local spending and/or delivery of services.
33
New Strategy: “Kicking the can down the road”
• Unions protected their members. New contract with general levels frozen until 2020 AND no layoffs. Bonus: No general attrition!
• Rolling back of some of the lesser tax increases but PIT and HST increases remain.
34

Result
• The Way Forward: Liberal Government re-elected in 2019 but with a minority
• Larger deficits than expected.
• Falling credit rating.
• Expecting an external saviour: Oil or Ottawa or O2
• Older generation (including us) are winners!
35

Debt Composition
36
Financial Assets, Liabilities and Net Debt, NL
Source: Public Accounts of Newfoundland and Labrador and Budget 2019-20
37
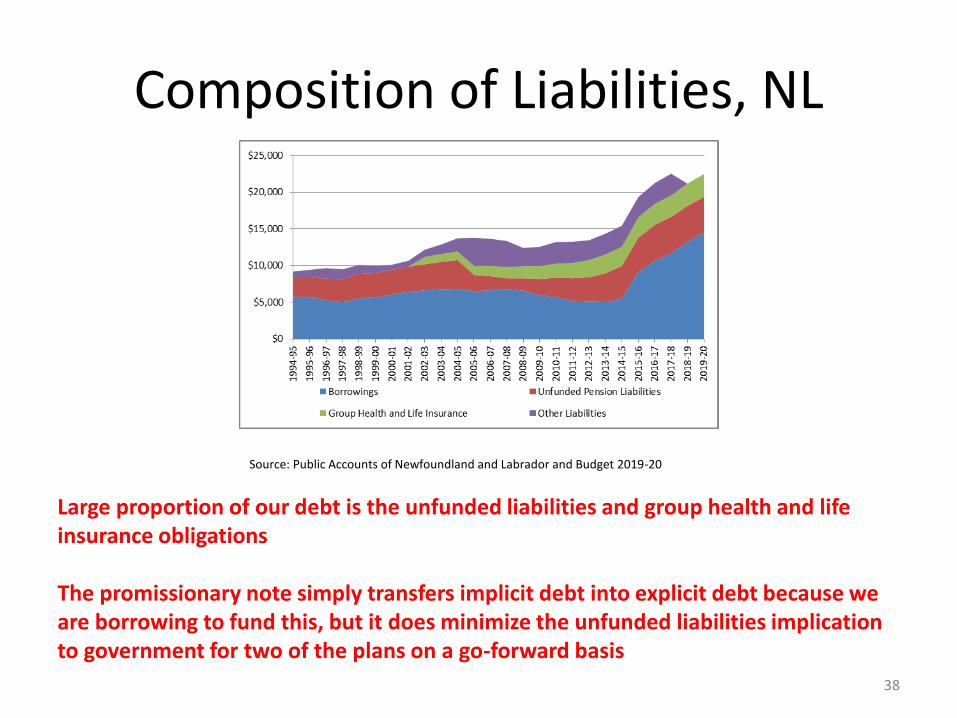
Composition of Liabilities, NL
Source: Public Accounts of Newfoundland and Labrador and Budget 2019-20
38
Large proportion of our debt is the unfunded liabilities and group health and life insurance obligations
The promissionary note simply transfers implicit debt into explicit debt because we are borrowing to fund this, but it does minimize the unfunded liabilities implication to government for two of the plans on a go-forward basis
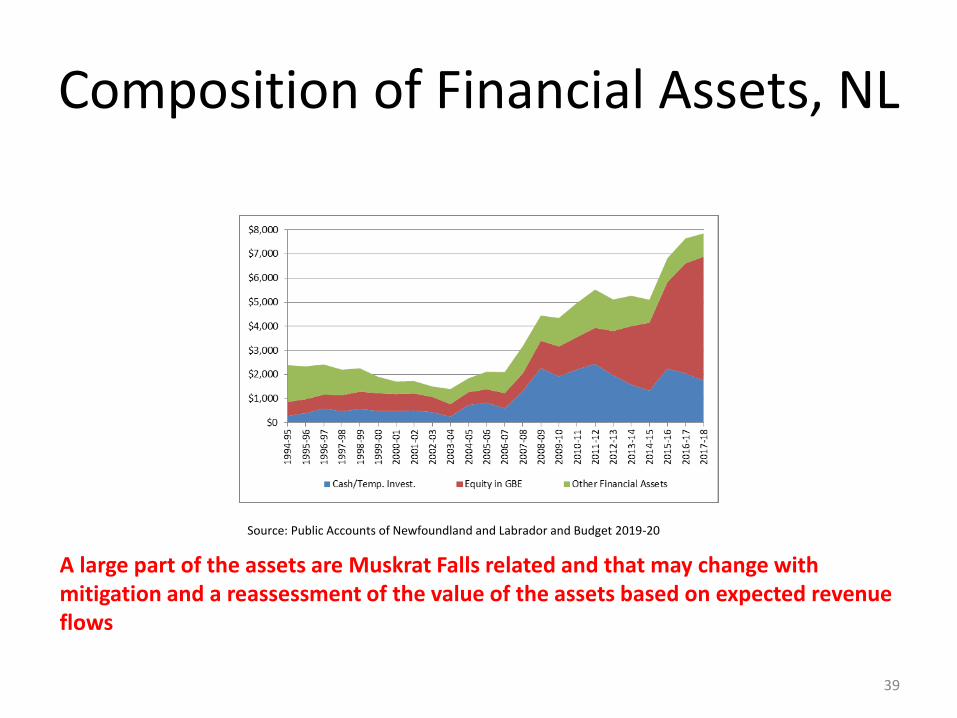
Composition of Financial Assets, NL
Source: Public Accounts of Newfoundland and Labrador and Budget 2019-20
39
A large part of the assets are Muskrat Falls related and that may change with mitigation and a reassessment of the value of the assets based on expected revenue flows
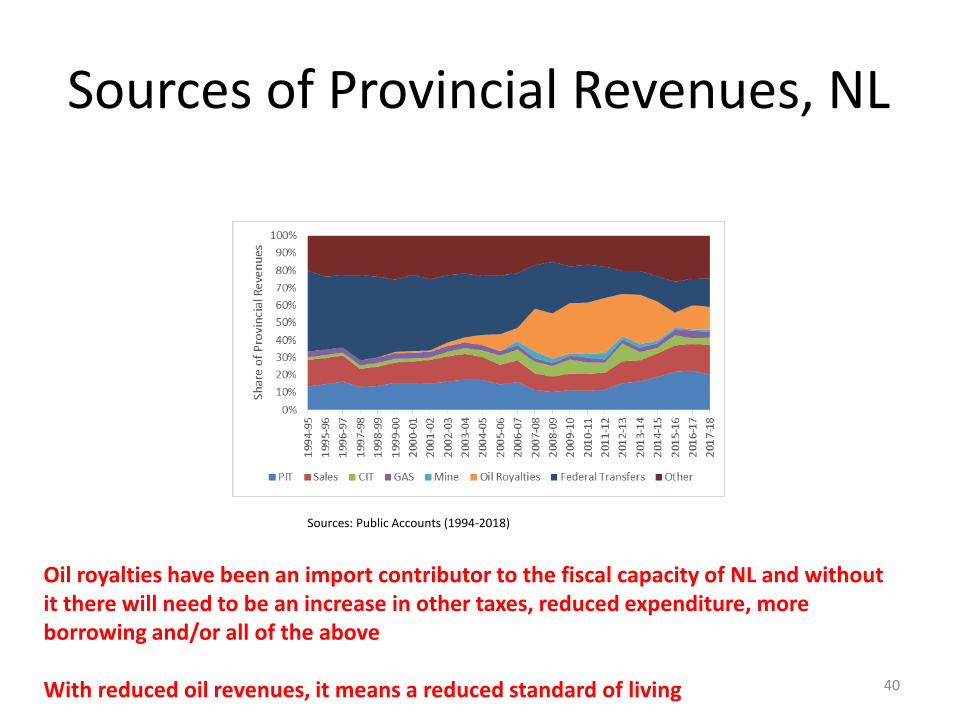
Sources of Provincial Revenues, NL
Sources: Public Accounts (1994-2018)
40
Oil royalties have been an import contributor to the fiscal capacity of NL and without it there will need to be an increase in other taxes, reduced expenditure, more borrowing and/or all of the above
With reduced oil revenues, it means a reduced standard of living
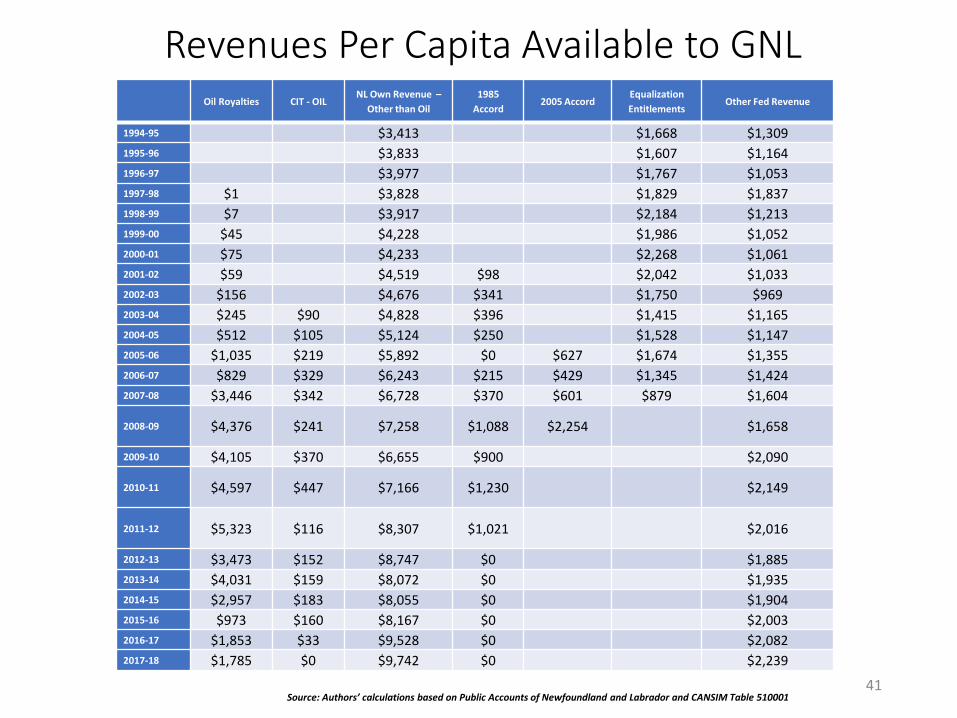
Revenues Per Capita Available to GNL
41
Oil Royalties CIT - OILNL Own Revenue –
Other than Oil
1985
Accord2005 Accord
Equalization
EntitlementsOther Fed Revenue
1994-95 $3,413 $1,668 $1,309
1995-96 $3,833 $1,607 $1,164
1996-97 $3,977 $1,767 $1,053
1997-98 $1 $3,828 $1,829 $1,837
1998-99 $7 $3,917 $2,184 $1,213
1999-00 $45 $4,228 $1,986 $1,052
2000-01 $75 $4,233 $2,268 $1,061
2001-02 $59 $4,519 $98 $2,042 $1,033
2002-03 $156 $4,676 $341 $1,750 $969
2003-04 $245 $90 $4,828 $396 $1,415 $1,165
2004-05 $512 $105 $5,124 $250 $1,528 $1,147
2005-06 $1,035 $219 $5,892 $0 $627 $1,674 $1,355
2006-07 $829 $329 $6,243 $215 $429 $1,345 $1,424
2007-08 $3,446 $342 $6,728 $370 $601 $879 $1,604
2008-09 $4,376 $241 $7,258 $1,088 $2,254 $1,658
2009-10 $4,105 $370 $6,655 $900 $2,090
2010-11 $4,597 $447 $7,166 $1,230 $2,149
2011-12 $5,323 $116 $8,307 $1,021 $2,016
2012-13 $3,473 $152 $8,747 $0 $1,885
2013-14 $4,031 $159 $8,072 $0 $1,935
2014-15 $2,957 $183 $8,055 $0 $1,904
2015-16 $973 $160 $8,167 $0 $2,003
2016-17 $1,853 $33 $9,528 $0 $2,082
2017-18 $1,785 $0 $9,742 $0 $2,239
Source: Authors’ calculations based on Public Accounts of Newfoundland and Labrador and CANSIM Table 510001
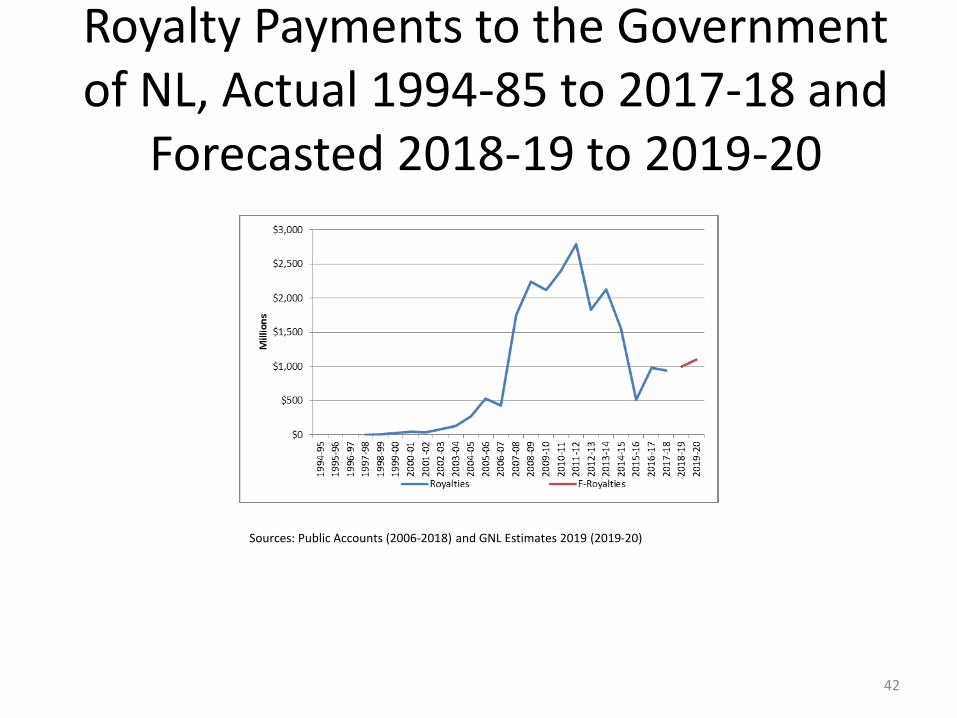
Royalty Payments to the Government of NL, Actual 1994-85 to 2017-18 and
Forecasted 2018-19 to 2019-20
Sources: Public Accounts (2006-2018) and GNL Estimates 2019 (2019-20)
42
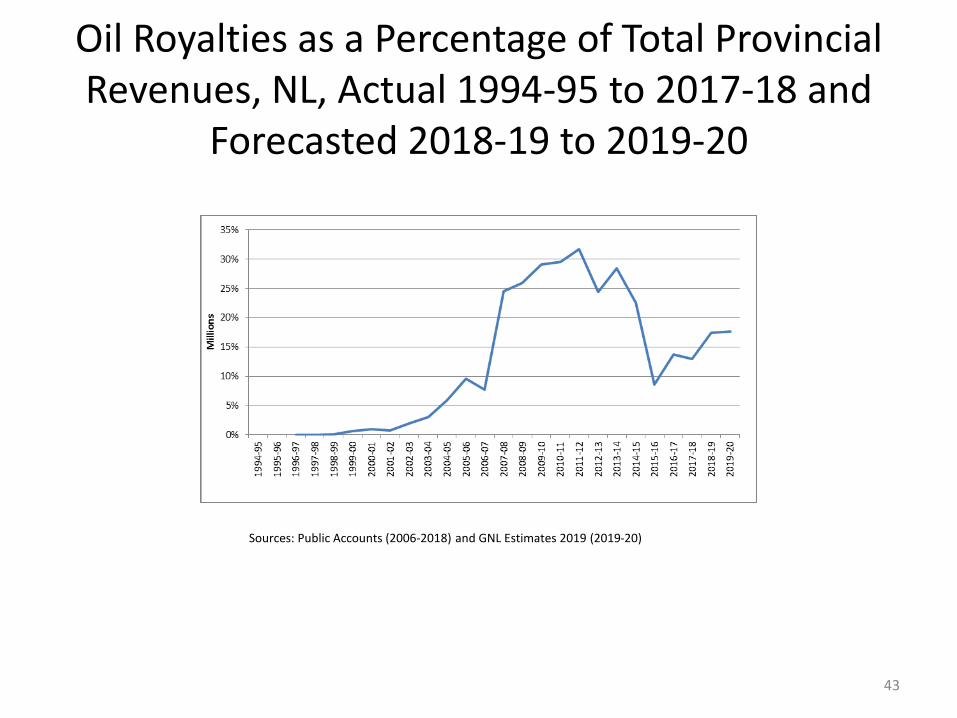
Oil Royalties as a Percentage of Total Provincial Revenues, NL, Actual 1994-95 to 2017-18 and
Forecasted 2018-19 to 2019-20
Sources: Public Accounts (2006-2018) and GNL Estimates 2019 (2019-20)
43
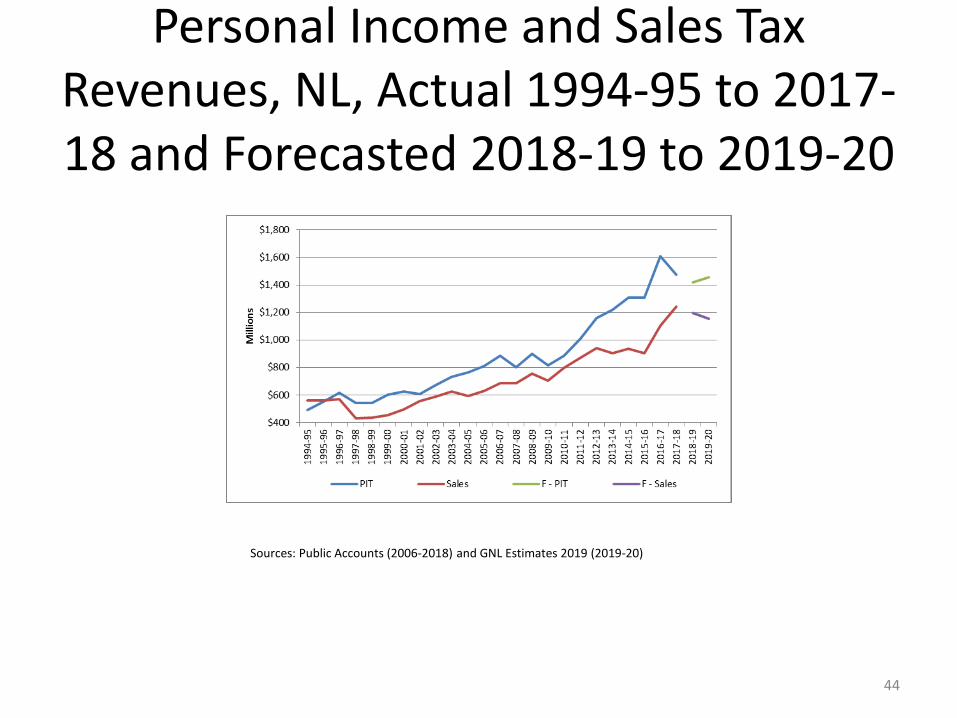
Personal Income and Sales Tax Revenues, NL, Actual 1994-95 to 2017-18 and Forecasted 2018-19 to 2019-20
Sources: Public Accounts (2006-2018) and GNL Estimates 2019 (2019-20)
44

What are the Challenges
45
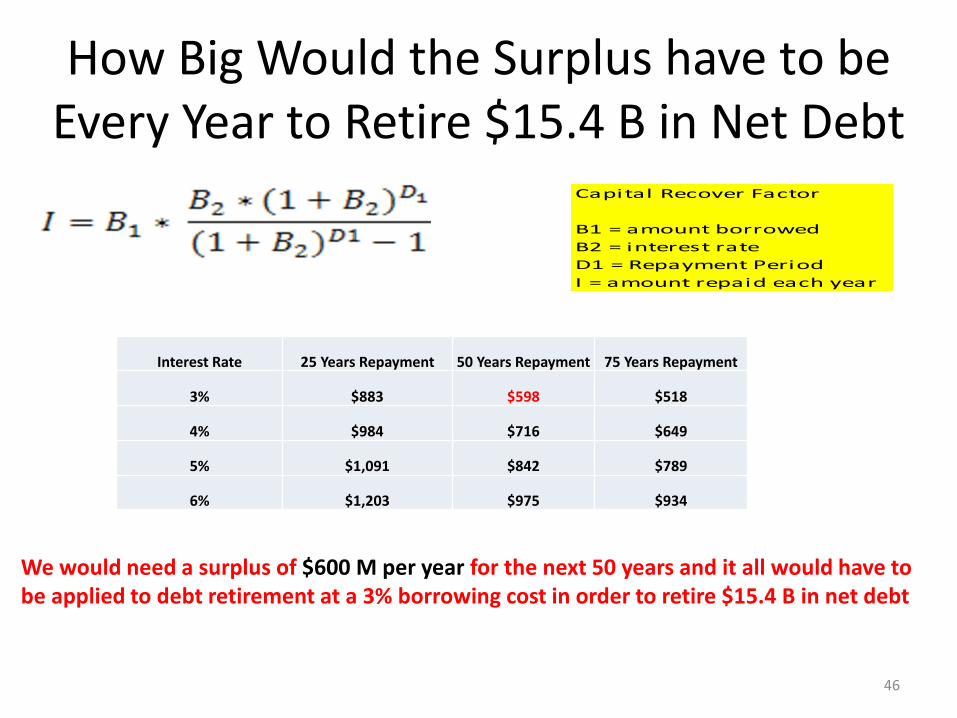
How Big Would the Surplus have to be Every Year to Retire $15.4 B in Net Debt
Capital Recover Factor
B1 = amount borrowed
B2 = interest rate
D1 = Repayment Period
I = amount repaid each year
Interest Rate 25 Years Repayment 50 Years Repayment 75 Years Repayment
3% $883 $598 $518
4% $984 $716 $649
5% $1,091 $842 $789
6% $1,203 $975 $934
We would need a surplus of $600 M per year for the next 50 years and it all would have to be applied to debt retirement at a 3% borrowing cost in order to retire $15.4 B in net debt
46
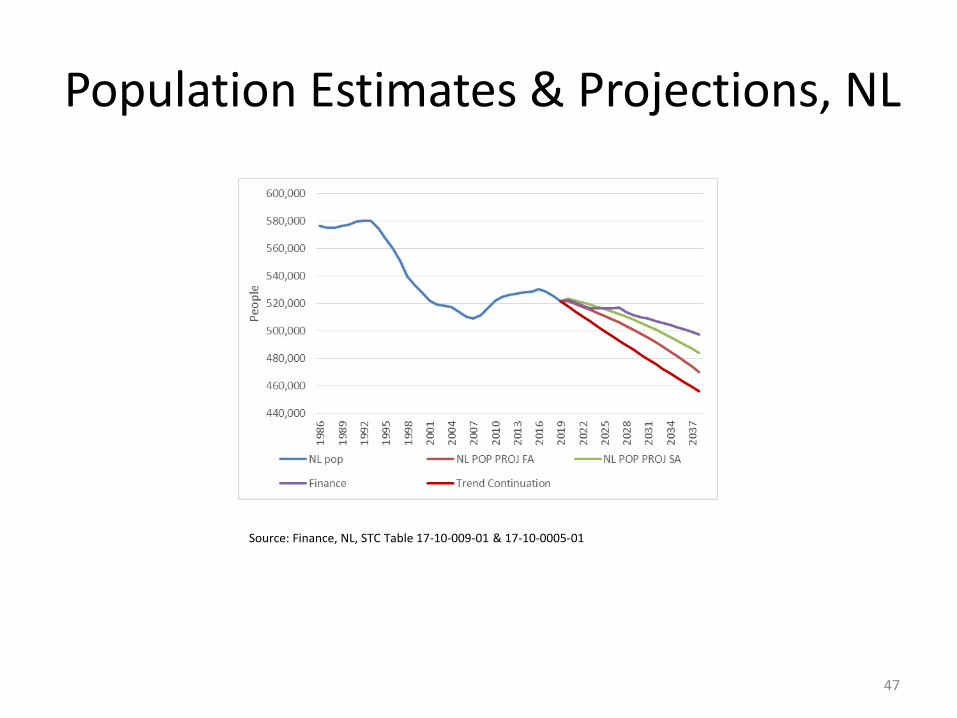
Population Estimates & Projections, NL
Source: Finance, NL, STC Table 17-10-009-01 & 17-10-0005-01
47

Age Cohorts by Gender, NL
Source: Compiled by the Community Accounts Unit, Department of Finance, Government of Newfoundland and Labrador based on information provided from the Census of Population 2016 Statistics Canada.
48

Aging Population
Authors’ calculations based on CANSIM TABLE 17100005 and 17100057
Currently, 21.5% of NL’s population and 17.5% of CDN’s population is over 65 years of age
By 2043, 30.9% of NL’s population and 21.1% of CDN’s population is expected to be over 65 years of age
49
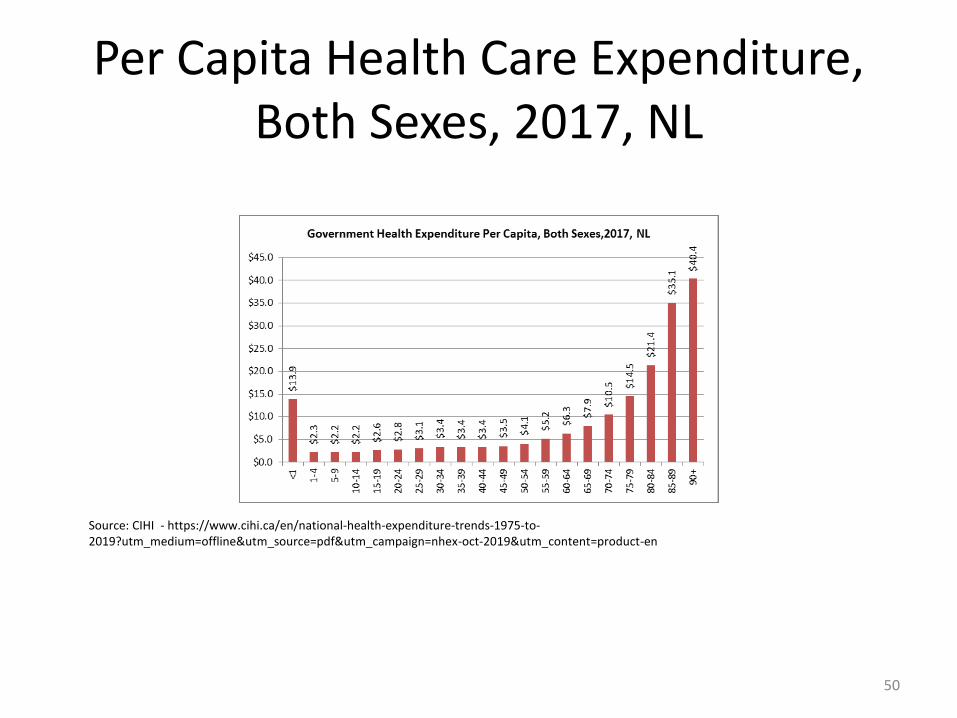
Per Capita Health Care Expenditure, Both Sexes, 2017, NL
Source: CIHI - https://www.cihi.ca/en/national-health-expenditure-trends-1975-to-2019?utm_medium=offline&utm_source=pdf&utm_campaign=nhex-oct-2019&utm_content=product-en
50

Implications for Health Care Costs of an Aging Population
Authors’ calculations based on CANSIM TABLE 17100005 and 17100057 (slow aging population projection) and CIHI -https://www.cihi.ca/en/national-health-expenditure-trends-1975-to-2019?utm_medium=offline&utm_source=pdf&utm_campaign=nhex-oct-2019&utm_content=product-en
By 2030, with no assumed inflation or other relevant factors, health care costs could be 13.6% higher in 2030 than in 2019 and this would require an additional $420 million
51
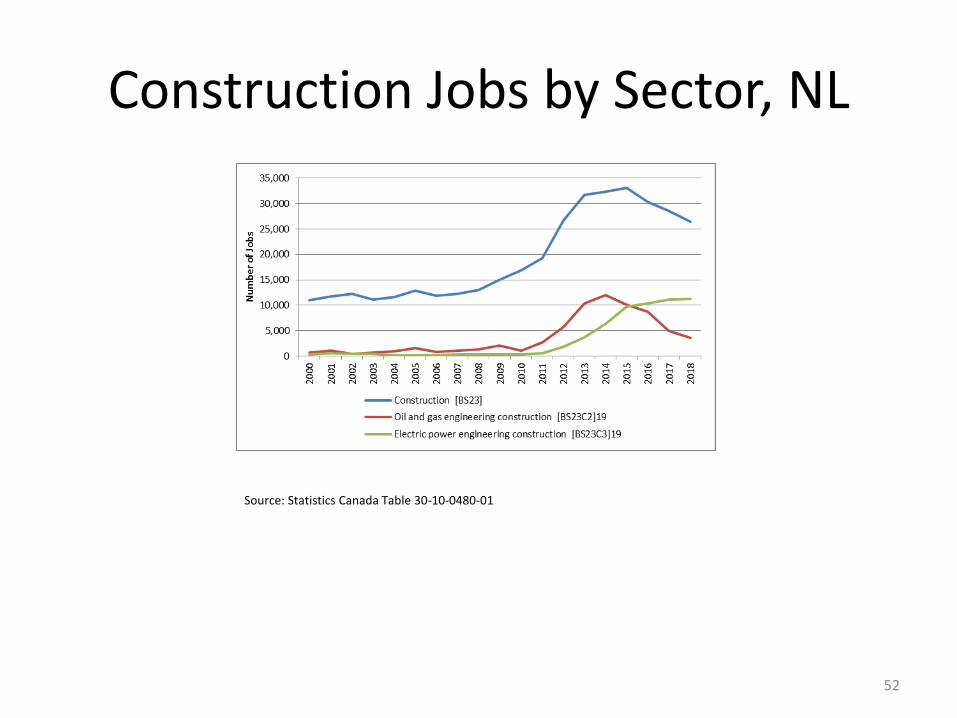
Construction Jobs by Sector, NL
Source: Statistics Canada Table 30-10-0480-01
52
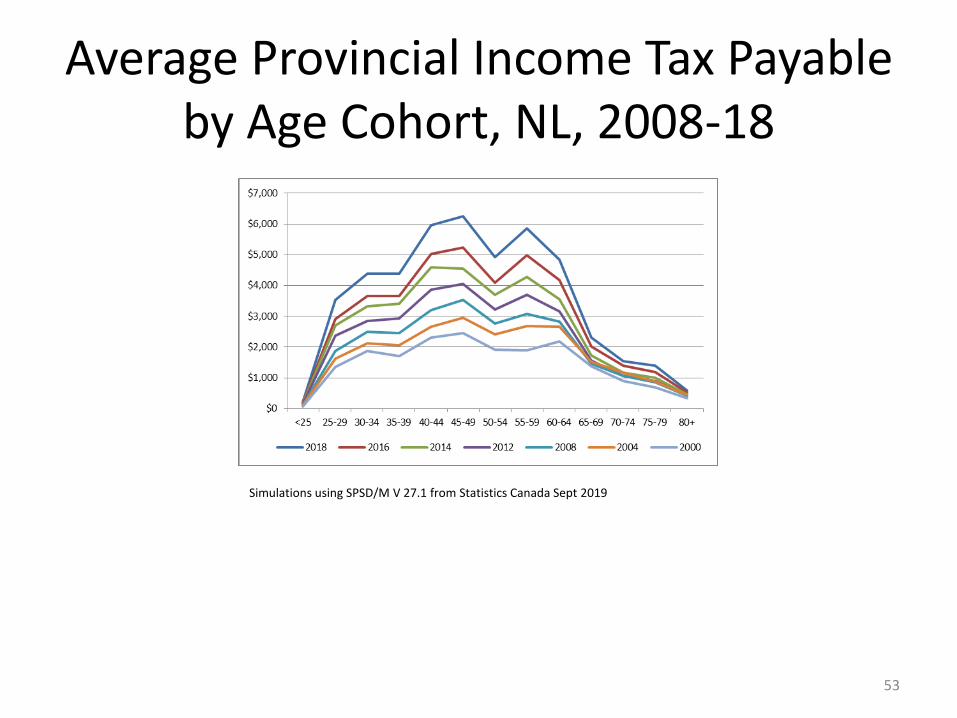
Average Provincial Income Tax Payable by Age Cohort, NL, 2008-18
Simulations using SPSD/M V 27.1 from Statistics Canada Sept 2019
53

Distribution of Labour Force by Age Cohort, NL, 2008-18
Simulations using SPSD/M V 27.1 from Statistics Canada Sept 2019
54
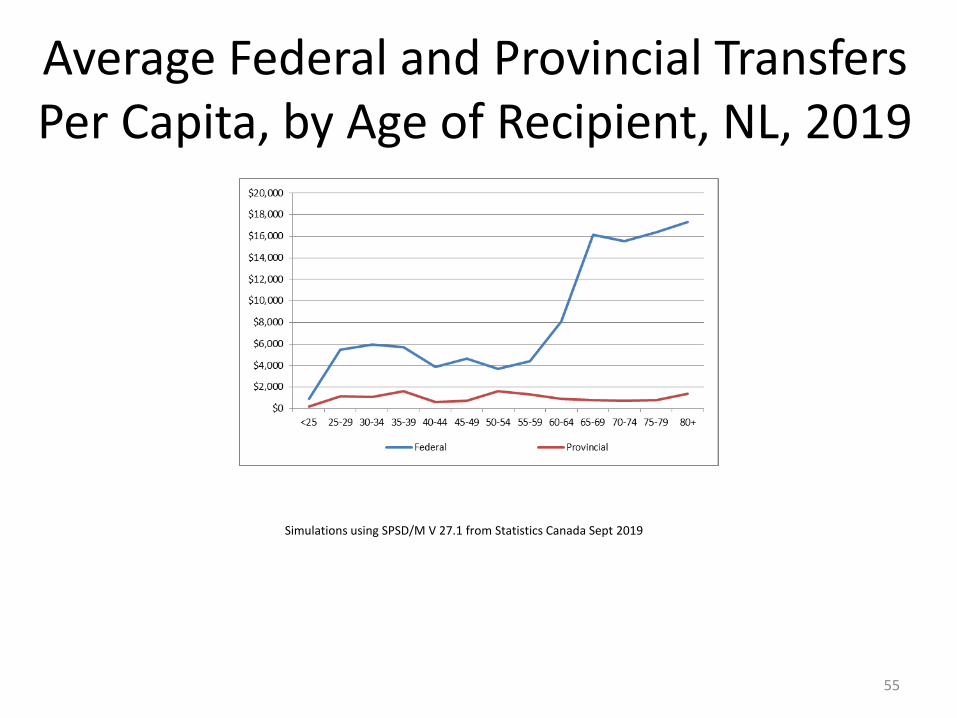
Average Federal and Provincial Transfers Per Capita, by Age of Recipient, NL, 2019
Simulations using SPSD/M V 27.1 from Statistics Canada Sept 2019
55

Long-Term Government of Canada Bond Yields
56

Relative Cost of Borrowing
Source: Bloomberg L.P.
57
The increase in yield spreads can be tied directly to the deficit being run and the amount of money that is being borrowed

Can we Tax Our Way Out of This by Taxing the Rich
(1) Individuals included in higher tax brackets are also counted in all lower tax brackets since an individual who pays taxes in a higher tax bracket necessarily also pays taxes in all lower tax brackets.(2) Excludes individuals with no income. Also see note 1 above.(3) Includes only individuals with provincial income tax payable > $0. Also see note 1 above.(4) Represents computed amount based on total taxable income before adjustments (non-refundable tax credits and Temporary Deficit Reduction Levy).
Source: Social Policy Simulation Database & Model (SPSD/M) Version 27.1: Special Tabulation by Newfoundland and Labrador Statistics Agency.
Provincial Income Tax Rates1 Provincial Income Tax Brackets
Total Number of Tax Filers2
Tax Filers that Pay No Tax2
Provincial Income Tax Before Adjustments4
($ Million)
Provincial IncomeTax Payable($ Million)
Change from Base Case in Provincial IncomeTax Payable($ Million)
Base Case Simulation
$1,582.2
8.70% up to $36,926 418,500 142,600 $907.5
14.50% $36,927 to $73,852 169,100 0 $568.8
15.80% $73,853 to $131,850 63,300 0 $295.2
17.30% $131,851 to $184,590 15,100 0 $84.6
18.30% $184,591 and over 5,600 0 $150.9
Add 1% to Top Two Income Brackets - Tax Rich
$1,595.4
8.70% up to $36,926 418,500 142,600 $907.5
14.50% $36,927 to $73,852 169,100 0 $568.8 $13.2
15.80% $73,853 to $131,850 63,300 0 $295.2
18.30% $131,851 to $184,590 15,100 0 $89.5
19.30% $184,591 and over 5,600 0 $159.2
Add 2% to Top Two Income Brackets - Tax Rich
$1,608.5
8.70% up to $36,926 418,500 142,600 $907.5
14.50% $36,927 to $73,852 169,100 0 $568.8 $26.3
15.80% $73,853 to $131,850 63,300 0 $295.2
19.30% $131,851 to $184,590 15,100 0 $94.3
20.30% $184,591 and over 5,600 0 $167.4
58
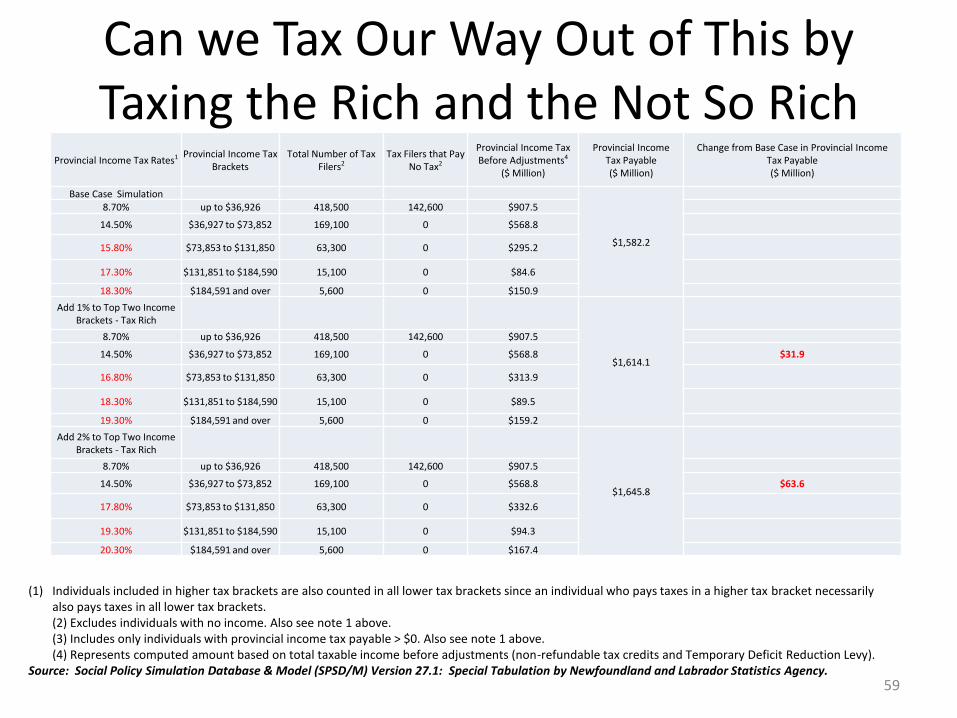
Can we Tax Our Way Out of This by Taxing the Rich and the Not So Rich
(1) Individuals included in higher tax brackets are also counted in all lower tax brackets since an individual who pays taxes in a higher tax bracket necessarily also pays taxes in all lower tax brackets.(2) Excludes individuals with no income. Also see note 1 above.(3) Includes only individuals with provincial income tax payable > $0. Also see note 1 above.(4) Represents computed amount based on total taxable income before adjustments (non-refundable tax credits and Temporary Deficit Reduction Levy).
Source: Social Policy Simulation Database & Model (SPSD/M) Version 27.1: Special Tabulation by Newfoundland and Labrador Statistics Agency.
Provincial Income Tax Rates1 Provincial Income Tax Brackets
Total Number of Tax Filers2
Tax Filers that Pay No Tax2
Provincial Income Tax Before Adjustments4
($ Million)
Provincial IncomeTax Payable($ Million)
Change from Base Case in Provincial IncomeTax Payable($ Million)
Base Case Simulation
$1,582.2
8.70% up to $36,926 418,500 142,600 $907.5
14.50% $36,927 to $73,852 169,100 0 $568.8
15.80% $73,853 to $131,850 63,300 0 $295.2
17.30% $131,851 to $184,590 15,100 0 $84.6
18.30% $184,591 and over 5,600 0 $150.9
Add 1% to Top Two Income Brackets - Tax Rich
$1,614.1
8.70% up to $36,926 418,500 142,600 $907.5
14.50% $36,927 to $73,852 169,100 0 $568.8 $31.9
16.80% $73,853 to $131,850 63,300 0 $313.9
18.30% $131,851 to $184,590 15,100 0 $89.5
19.30% $184,591 and over 5,600 0 $159.2
Add 2% to Top Two Income Brackets - Tax Rich
$1,645.8
8.70% up to $36,926 418,500 142,600 $907.5
14.50% $36,927 to $73,852 169,100 0 $568.8 $63.6
17.80% $73,853 to $131,850 63,300 0 $332.6
19.30% $131,851 to $184,590 15,100 0 $94.3
20.30% $184,591 and over 5,600 0 $167.4
59

Taxing the Rich - Summary
Tax Rate Utilized
Provincial Tax Payable ($M)
Extra Tax Revenue
up to $36,926$36,927 to
$73,852$73,853 to $131,850
$131,851 to $184,590
$184,591 and over
Base Case $1,582.2 8.70% 14.50% 15.80% 17.30% 18.30%
Increase Rates on Top Two Brackets by 1%
$1,595.4 $13.2 8.70% 14.50% 15.80% 18.30% 19.30%
Increase Rates on Top Two Brackets by 1%
$1,608.5 $26.3 8.70% 14.50% 15.80% 19.30% 20.30%
Increase Rates on Top Three Brackets by 1%
$1,614.1 $31.9 8.70% 14.50% 16.80% 18.30% 19.30%
Increase Rates on Top Three Brackets by 1%
$1,645.8 $63.6 8.70% 14.50% 17.80% 19.30% 20.30%
Assuming no adjustments to protect income or to move, an increase of 12.7% in the middle bracket tax rate, an increase of 11.6% in the second highest bracket tax rate, and an increase of 10.9% in the highest brackets tax rate, with yield only $64 million
60

Source: https://www.gov.nl.ca/fin/budget/pre-budget-consults/prebudget2019/
61
It is not clear where we can cut, but expenditure has to be controlled

Source: https://www.gov.nl.ca/fin/budget/pre-budget-consults/prebudget2019/
62
It is not clear where the additional revenue is going come from, we are all going to have to pay more and expect a lower material standard of living
We Need Want Equalization
63

64
65

66

Muskrat Falls
67
Muskrat Falls, Mitigation and Net Debt
• Prior to first energy being generated and sold, the asset value of Muskrat Fall will be based on historic costs and assuming that the price charged will generate sufficient revenue to cost debt and equity costs
• If that does not happen, then either the asset value will fall or and net debt will rise or the tax payers will subsidize and that will increase the accrual based commitments and raise provincial net debt
• Either ratepayers pay, taxpayers pay or some combination of the two
• Depending upon how this gets resolved, it can have significant implications for net debt
68
Conclusion• Current (2018-19), net debt at $15.4 B and will fall next year because transfer due to the Atlantic Accord
negotiations
• NL has the highest revenue per capita, the highest debt per capita and the highest net debt per capita
• Normalizing by GDP does not change the relative position
• We have to get expenditure under control (this can be spending smarter or with improved efficiency)
• We are not going bankrupt
– There is nothing in the constitution or current legislation that requires the federal government to bail us out yet again, but the implication for the Canadian bond market of a province going bankrupt would be more significant that helping fix NL’s fiscal problem
• We have a serious fiscal problem and we will have to find realistic ways of dealing with it
– Shifting the burden to our children and grandchildren is not ideal;
– Hoping for another federal bailout or some other savior is probably not a good strategy;We cannot tax our way out of this.
– However, a 5% increase in HST would help bring the problem home on a personal level.
• Let hope that empathy and understanding dominates in the rest of Canada to afford us one more chance
• Enhanced oil revenue will have to be part of the solution
69
Appendix A1
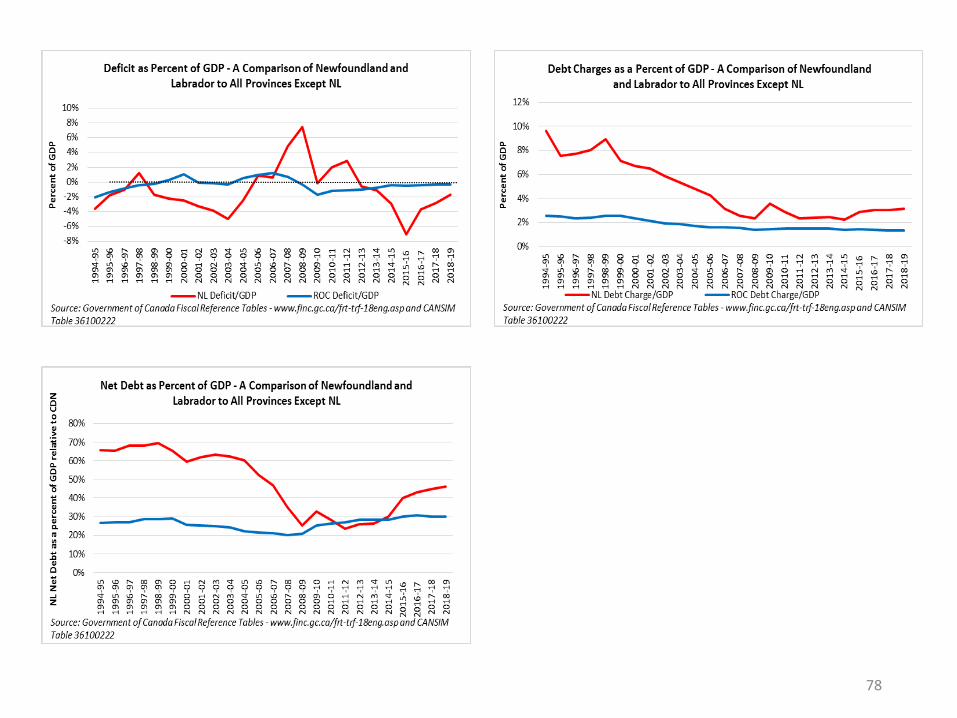
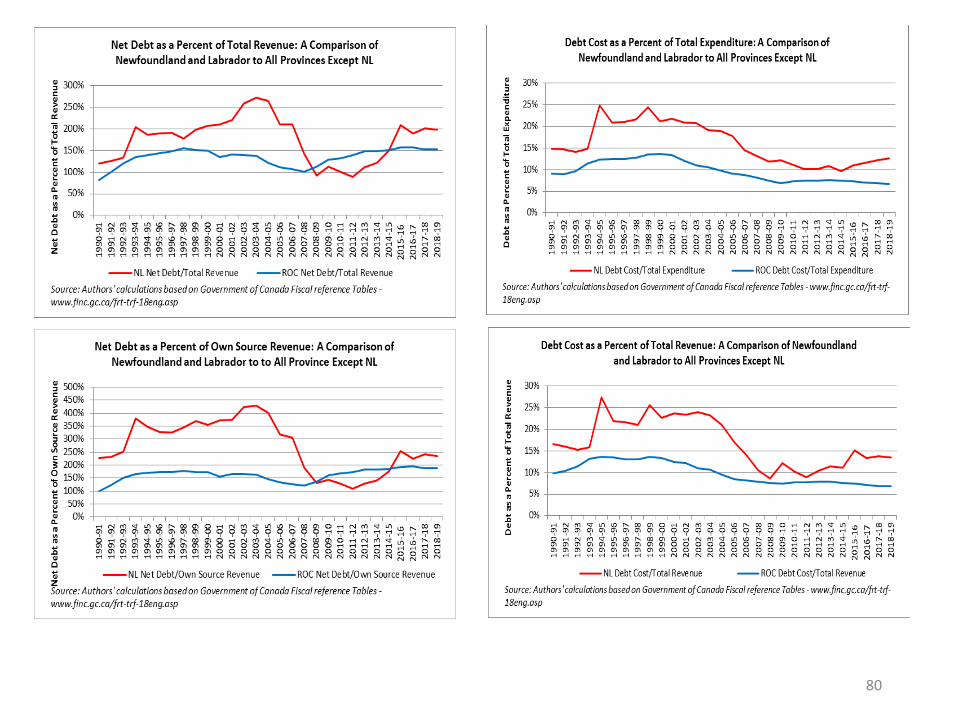
A Detailed Comparison of Fiscal Indicators for NL and All Other Provinces
Data Source for Graphs: Authors Calculation Using Government of Canada Fiscal Reference Tables - https://www.fin.gc.ca/frt-trf/2019/frt-trf-19-eng.asp and
CANSIM Tables 510001 and 36100325
70
Per Capita(NL versus All Other Provinces)
71
72
73

74

Relative to GDP(NL versus All Other Provinces)
75
76
77
78

Relative to Revenue and Expenditure(NL versus All Other Provinces)
79
80
Appendix A2
A Detailed Comparison of Fiscal Indicators for NL and All Other Atlantic
Canadian ProvincesData Source for Graphs:
Authors Calculation Using Government of Canada Fiscal Reference Tables - https://www.fin.gc.ca/frt-trf/2019/frt-trf-19-eng.asp and CANSIM Tables 510001 and 36100325
81
Per Capita(NL versus All Other Atlantic Provinces)
82

83
84
85
Relative to GDP(NL versus All Other Atlantic Provinces)
86
87
88
89

Relative to Revenue and Expenditure(NL versus All Other Atlantic Provinces)
90
91

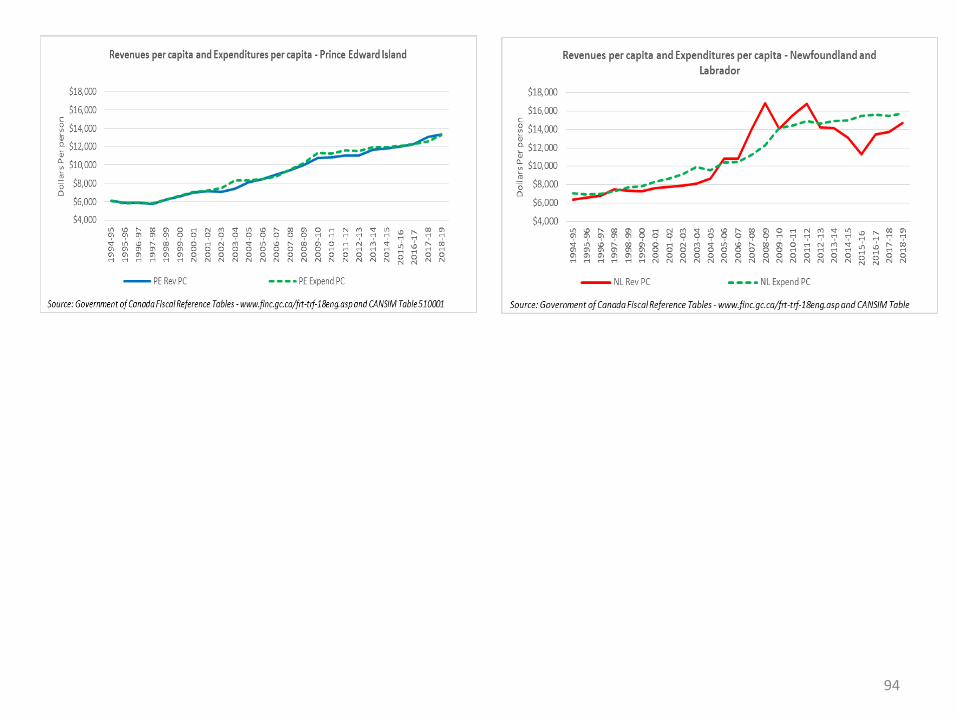
Appendix A3
A Detailed Comparison of Fiscal Indicators for NL and PE
Data Source for Graphs: Authors Calculation Using Government of Canada Fiscal Reference Tables - https://www.fin.gc.ca/frt-trf/2019/frt-trf-19-eng.asp and
CANSIM Tables 510001 and 36100325
92
Per Capita(NL versus PE)
93
94

95

96

Relative to GDP(NL versus PE)
97
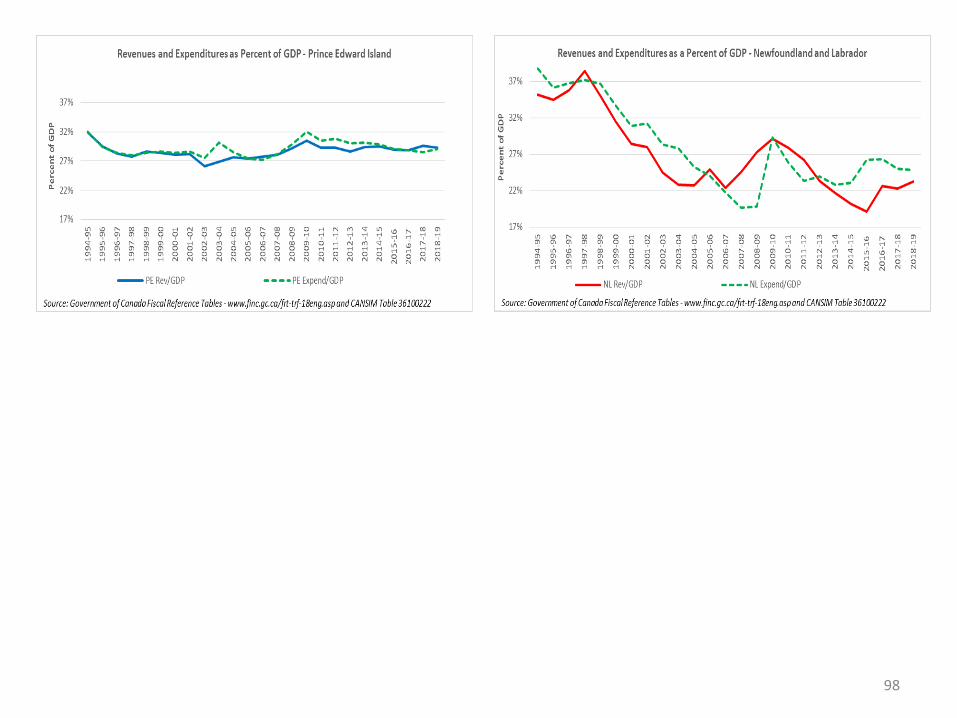
98

99

100

Relative to Revenue and Expenditure(NL versus PE)
101

102

Appendix A4
A Detailed Comparison of Fiscal Indicators for NL and NS
Data Source for Graphs: Authors Calculation Using Government of Canada Fiscal Reference Tables - https://www.fin.gc.ca/frt-trf/2019/frt-trf-19-eng.asp and
CANSIM Tables 510001 and 36100325
103

Per Capita(NL versus NS)
104
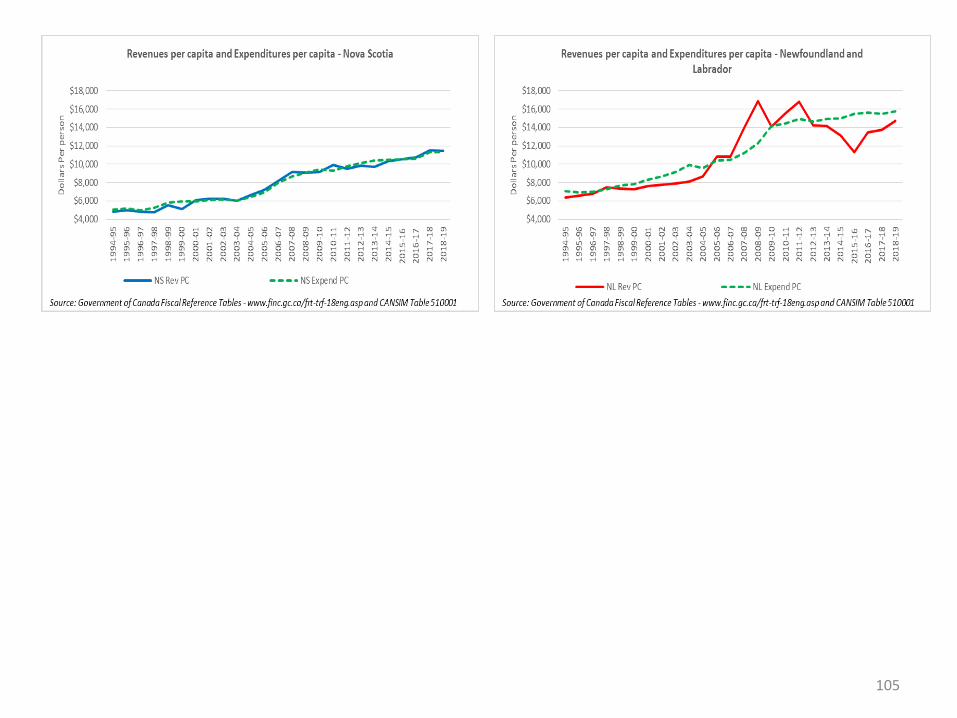
105

106

107

Relative to GDP(NL versus NS)
108
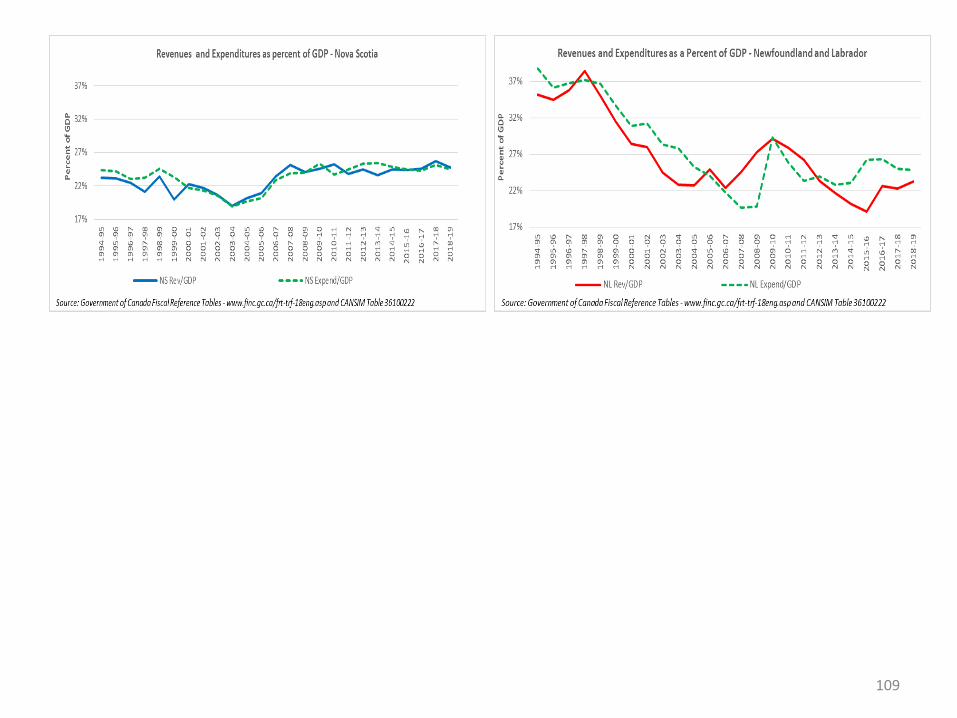
109

110

111

Relative to Revenue and Expenditure(NL versus NS)
112

113

Appendix A5
A Detailed Comparison of Fiscal Indicators for NL and NB
Data Source for Graphs: Authors Calculation Using Government of Canada Fiscal Reference Tables - https://www.fin.gc.ca/frt-trf/2019/frt-trf-19-eng.asp and
CANSIM Tables 510001 and 36100325
114
Per Capita(NL versus NB)
115

116
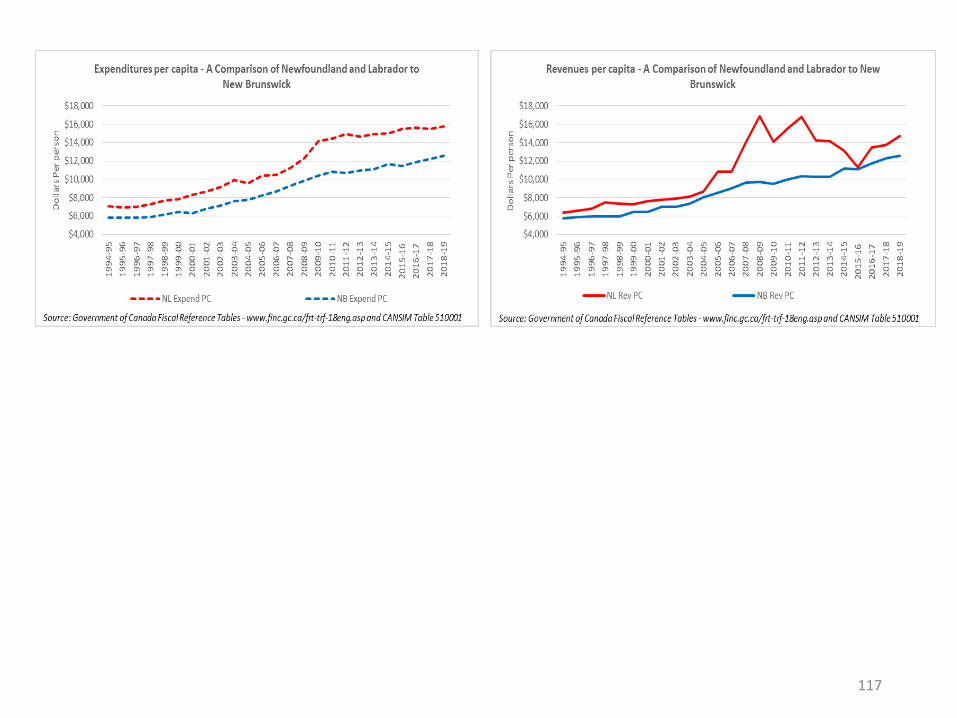
117
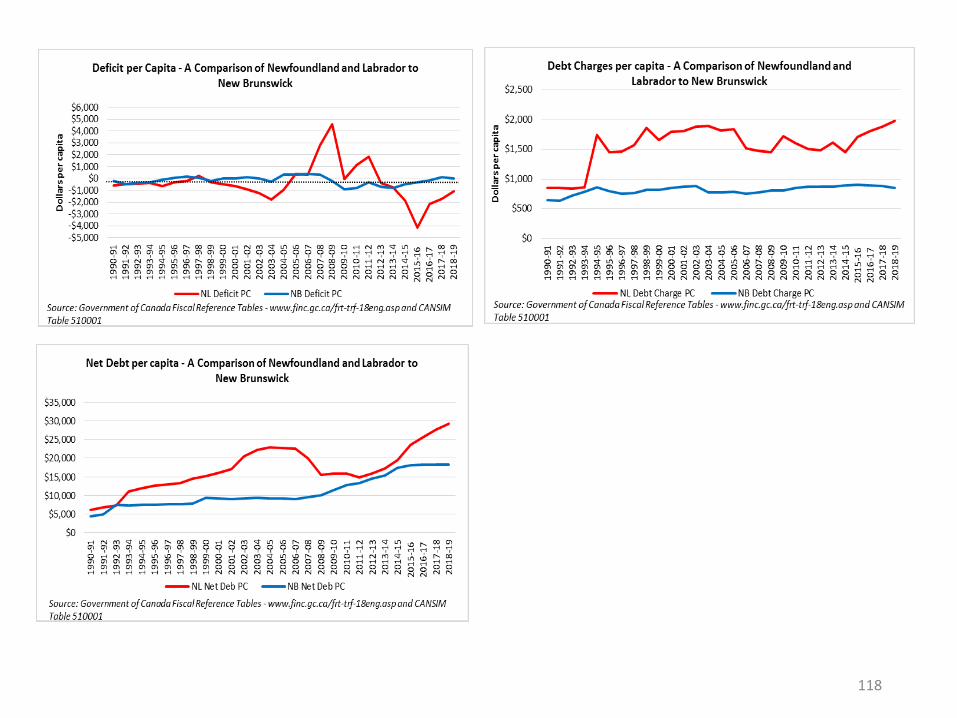
118

Relative to GDP(NL versus NB)
119

120
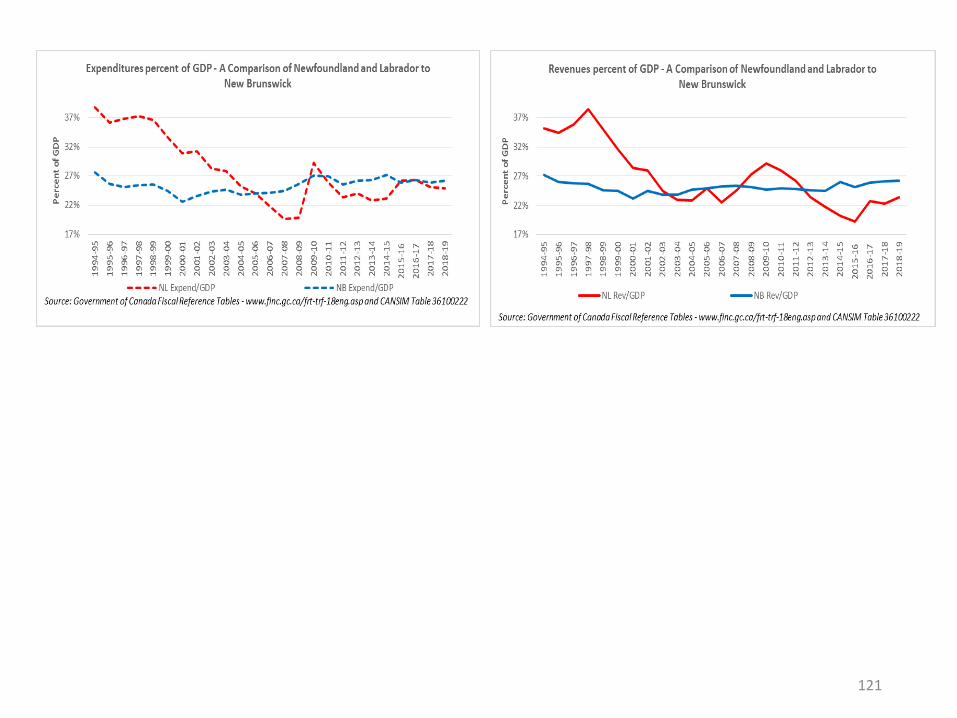
121
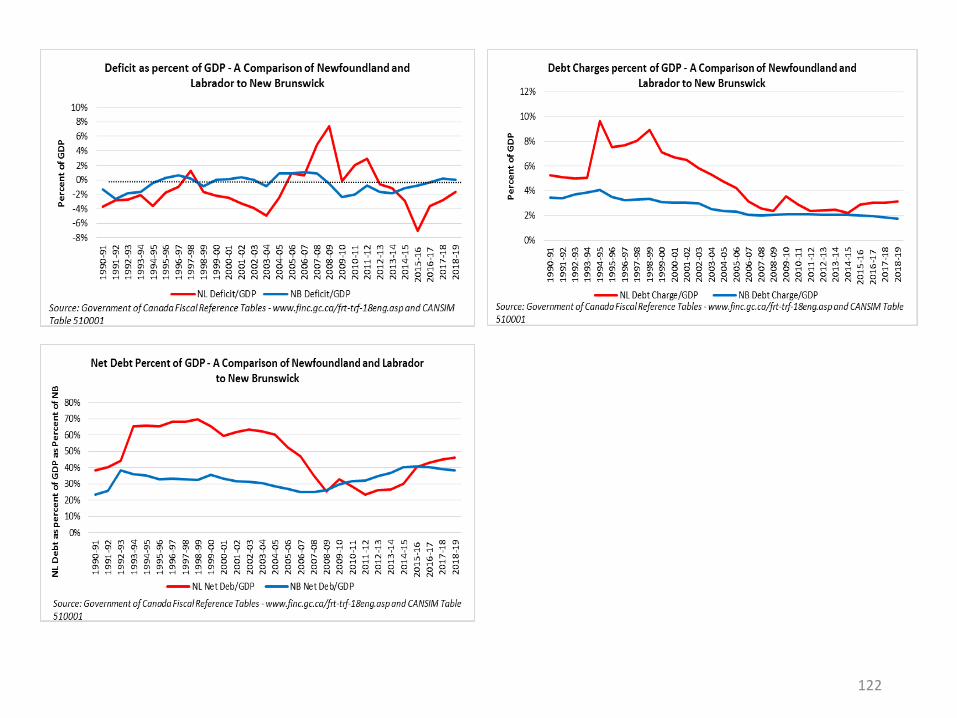
122

Relative to Revenue and Expenditure(NL versus NB)
123

124
Appendix A6
A Detailed Comparison of Fiscal Indicators for NL and QU
Data Source for Graphs: Authors Calculation Using Government of Canada Fiscal Reference Tables - https://www.fin.gc.ca/frt-trf/2019/frt-trf-19-eng.asp and
CANSIM Tables 510001 and 36100325
125

Per Capita(NL versus QU)
126

127
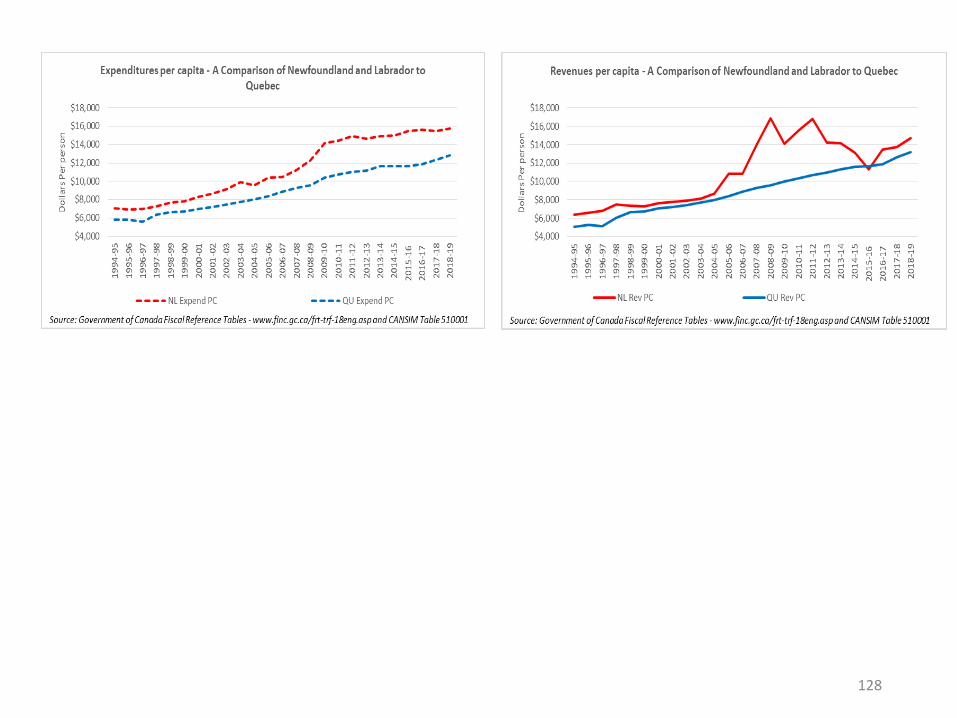
128

129
Relative to GDP(NL versus QU)
130
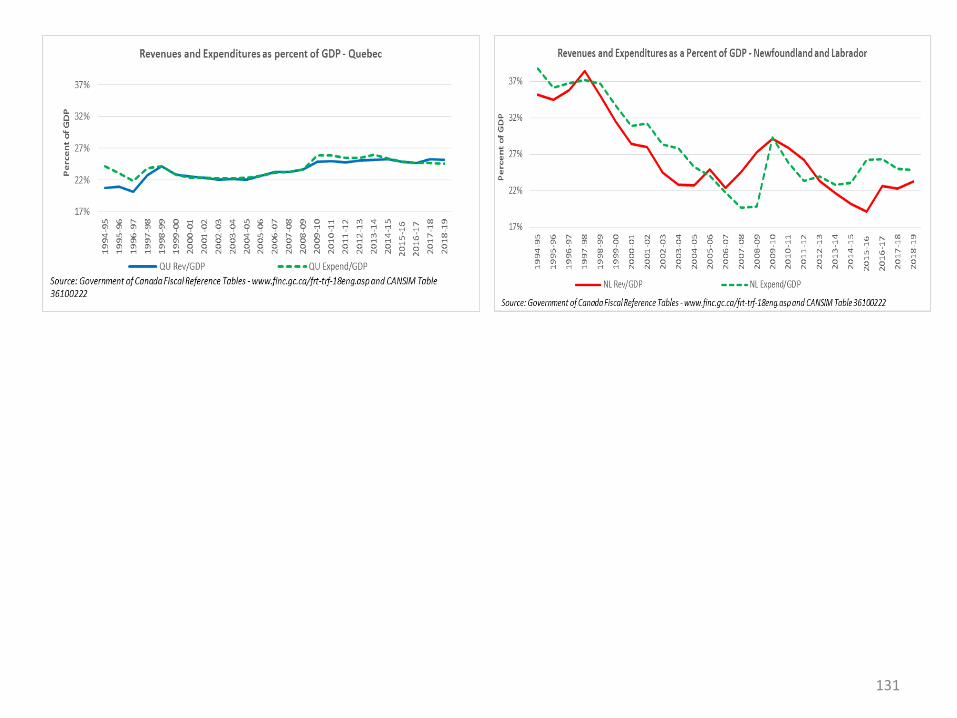
131
132
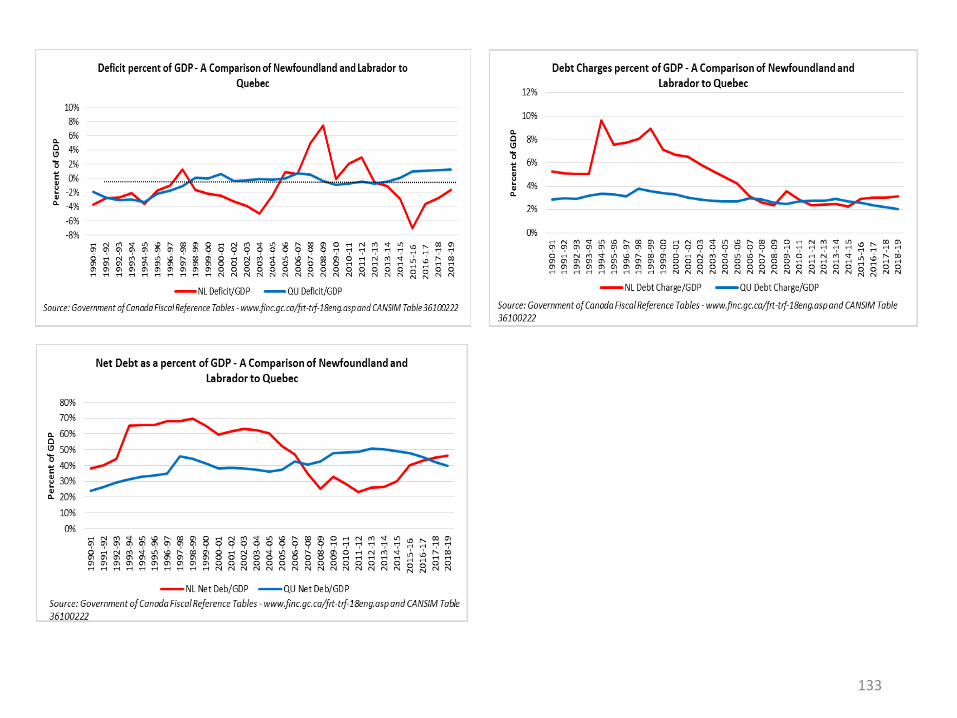
133
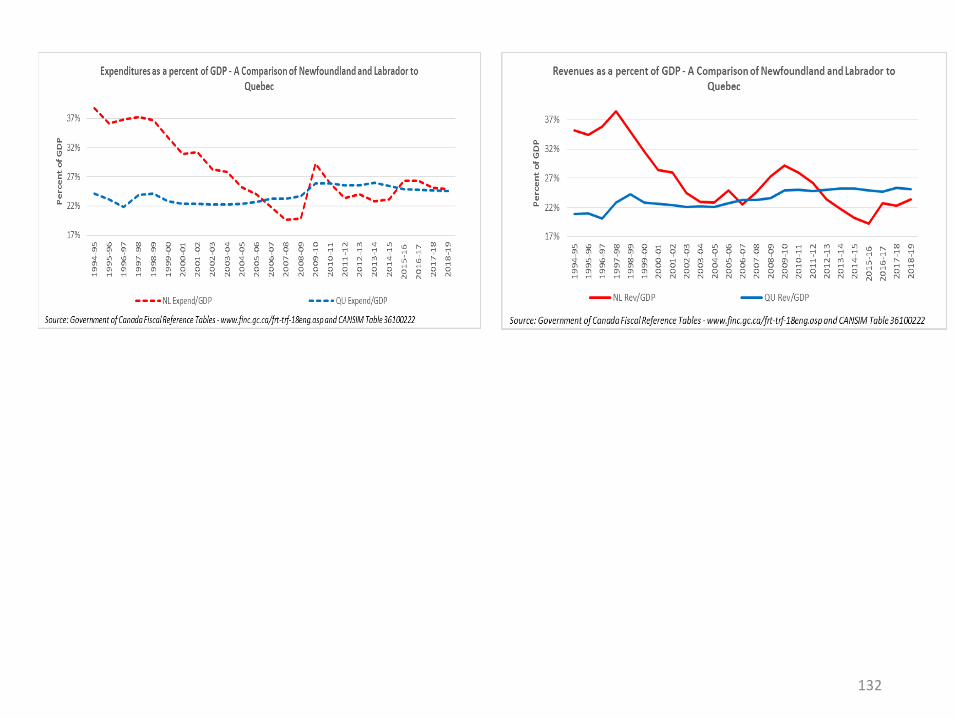
Relative to Revenue and Expenditure(NL versus QU)
134

135

Appendix A7
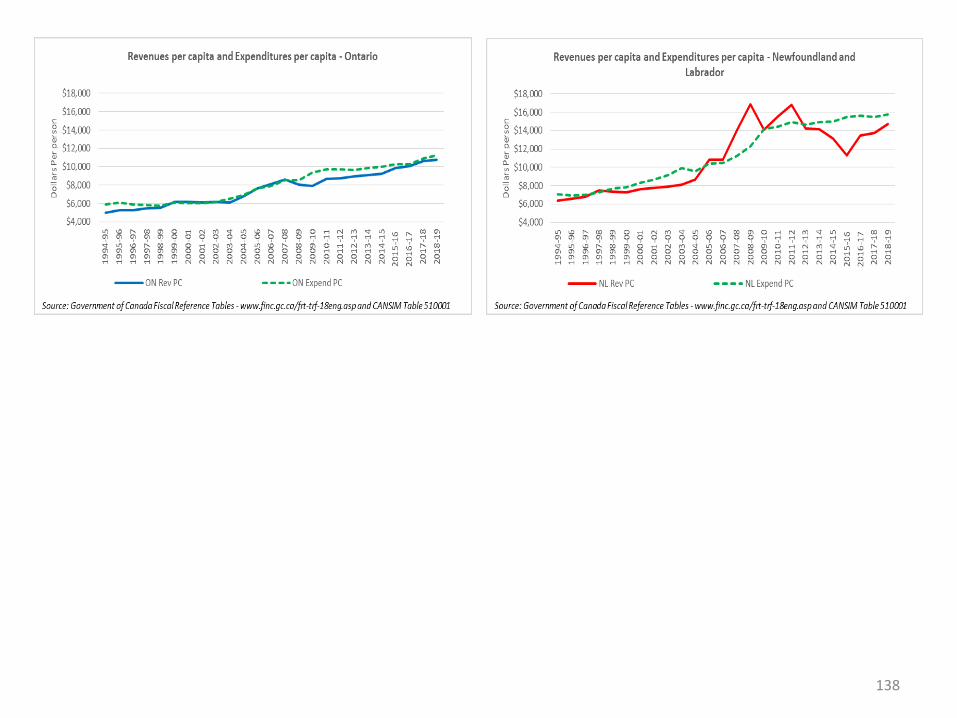
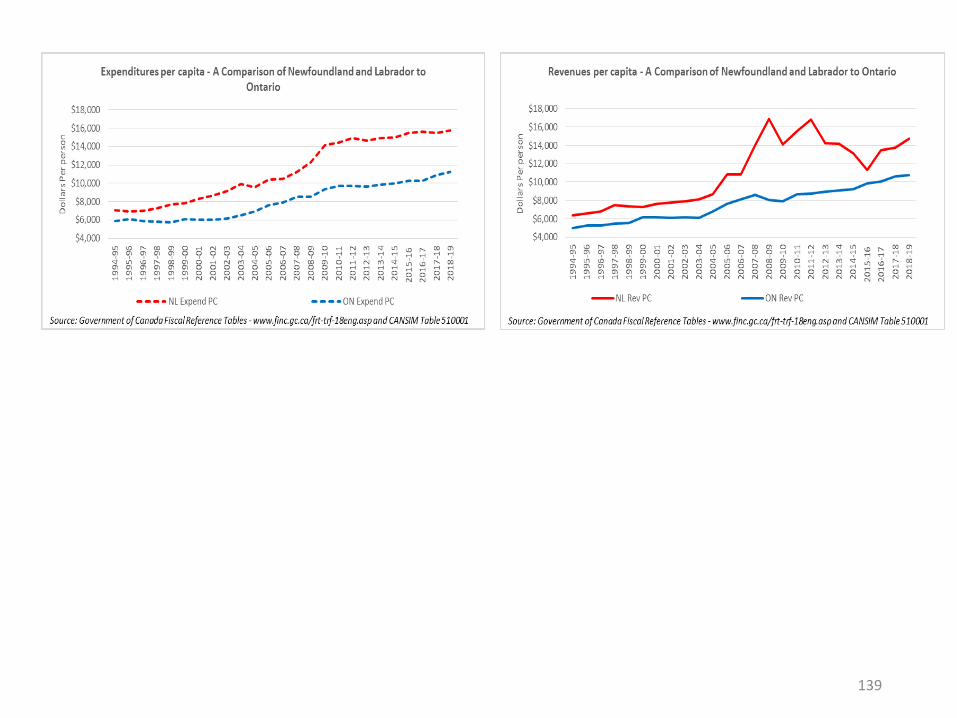
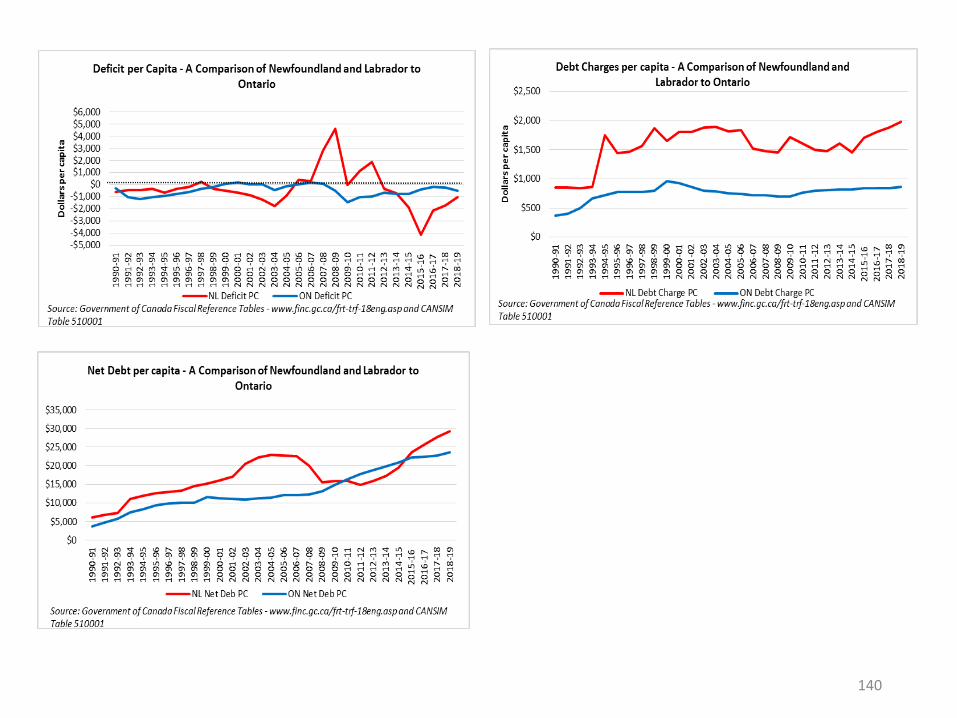
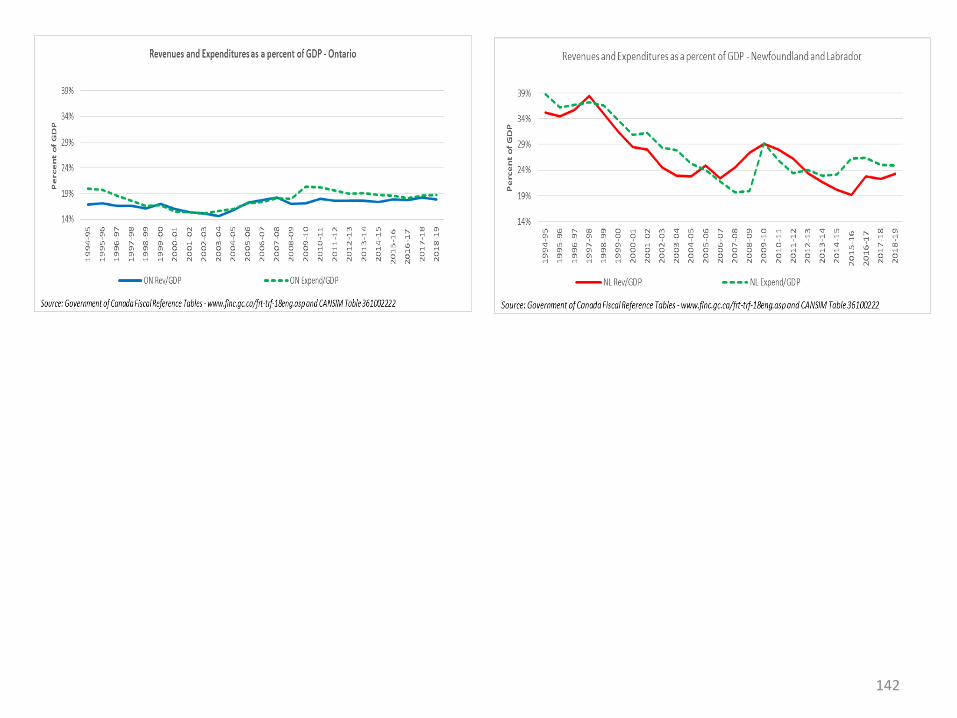
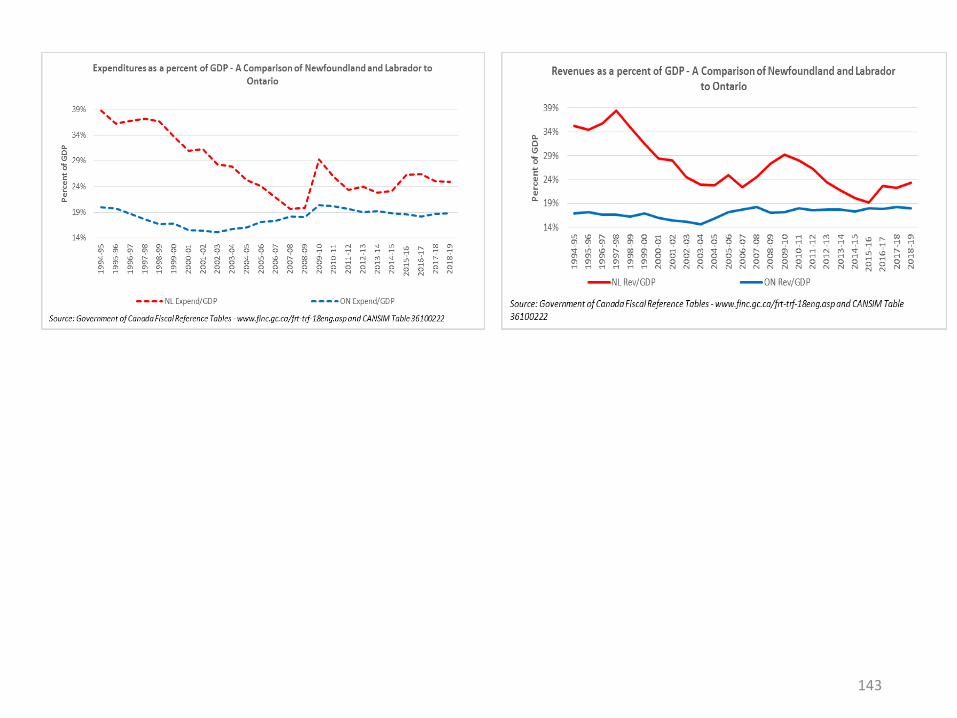
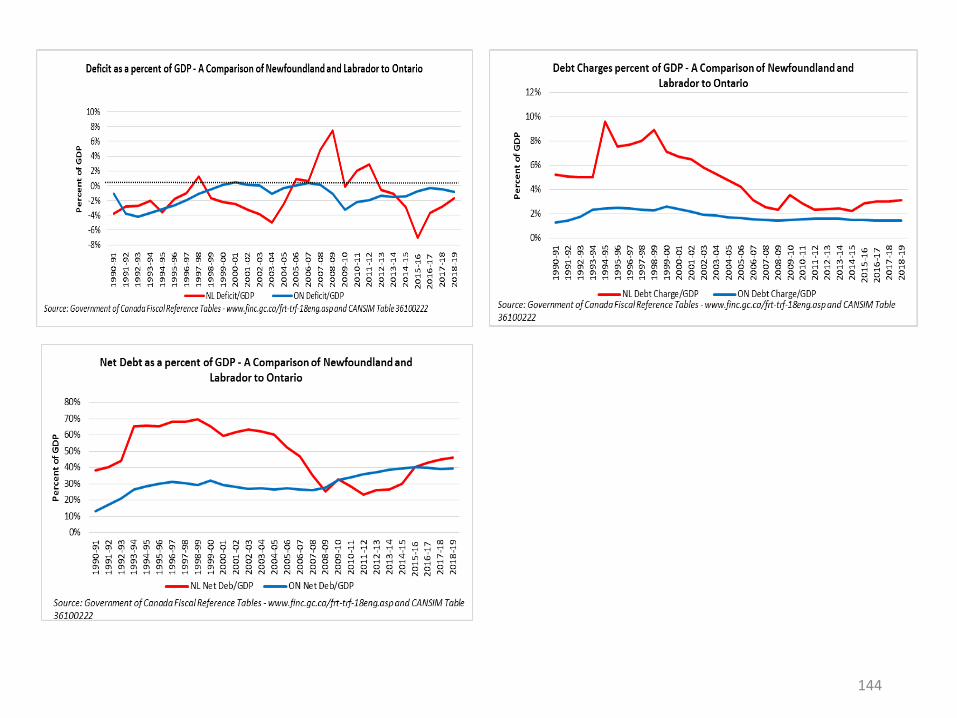
A Detailed Comparison of Fiscal Indicators for NL and ON
Data Source for Graphs: Authors Calculation Using Government of Canada Fiscal Reference Tables - https://www.fin.gc.ca/frt-trf/2019/frt-trf-19-eng.asp and
CANSIM Tables 510001 and 36100325
136
Per Capita(NL versus ON)
137
138
139
140
Relative to GDP(NL versus ON)
141
142
143
144

Relative to Revenue and Expenditure(NL versus ON)
145

146

Appendix A8
A Detailed Comparison of Fiscal Indicators for NL and MN
Data Source for Graphs: Authors Calculation Using Government of Canada Fiscal Reference Tables - https://www.fin.gc.ca/frt-trf/2019/frt-trf-19-eng.asp and
CANSIM Tables 510001 and 36100325
147

Per Capita(NL versus MN)
148

149
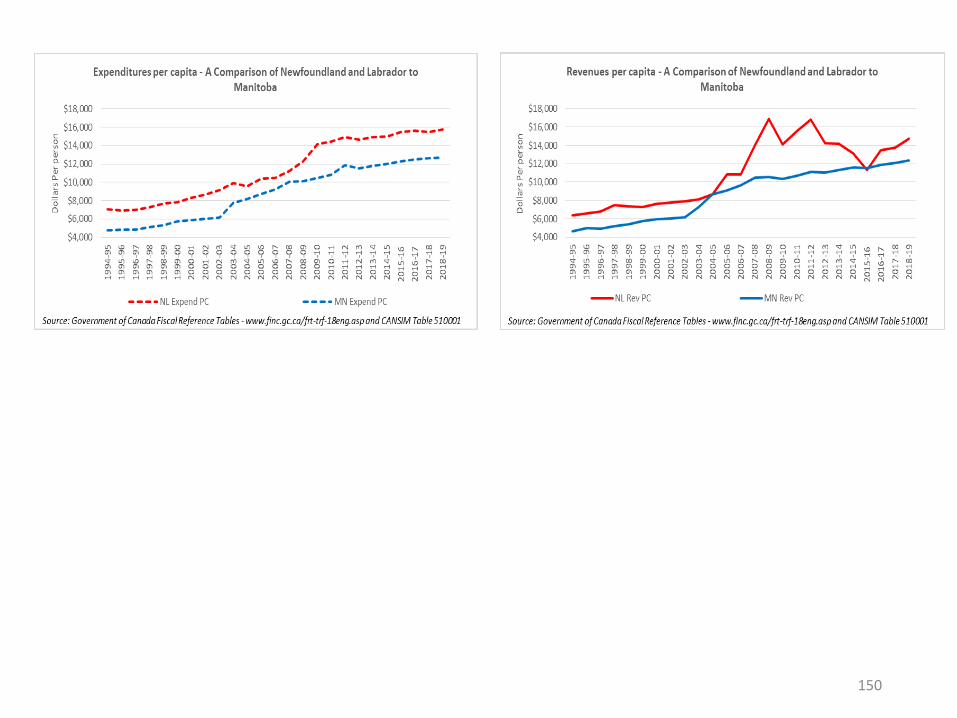
150

151
Relative to GDP(NL versus MN)
152

153
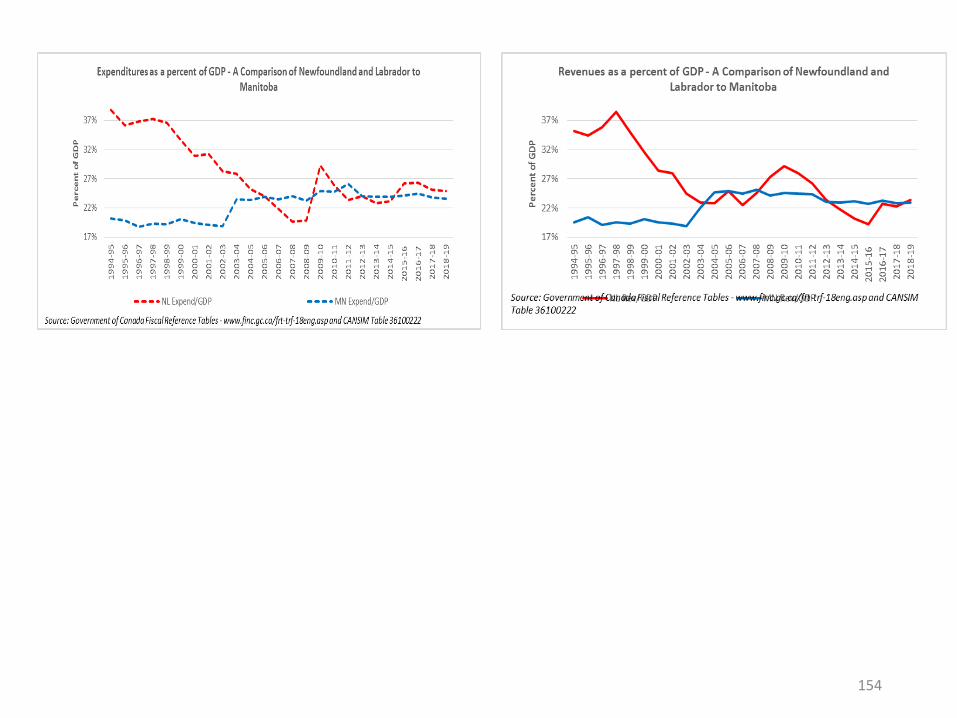
154
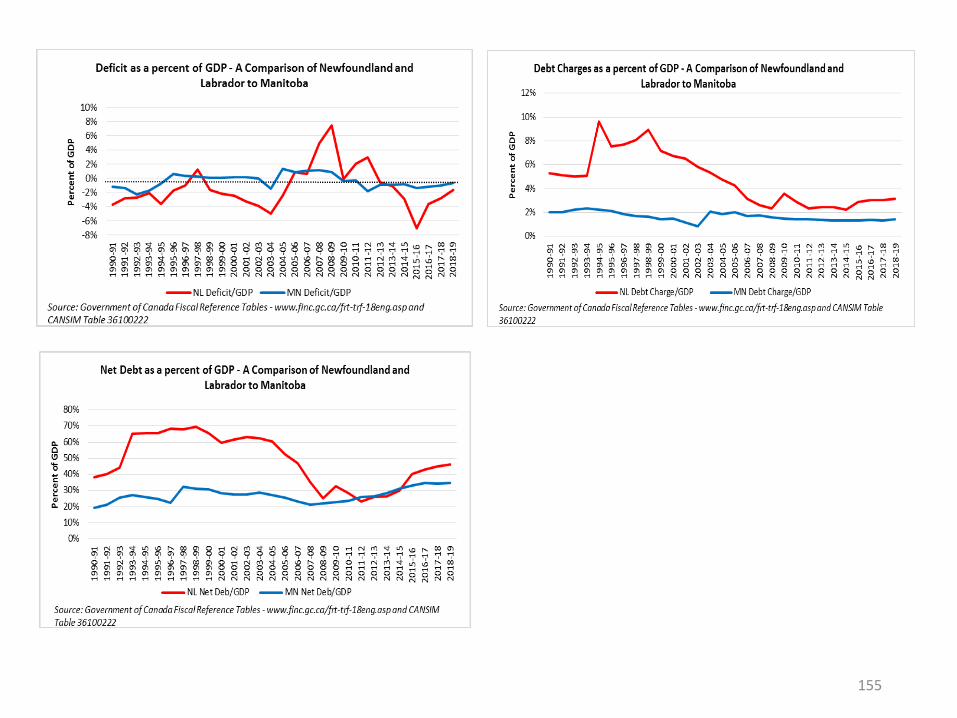
155

Relative to Revenue and Expenditure(NL versus MN)
156

157

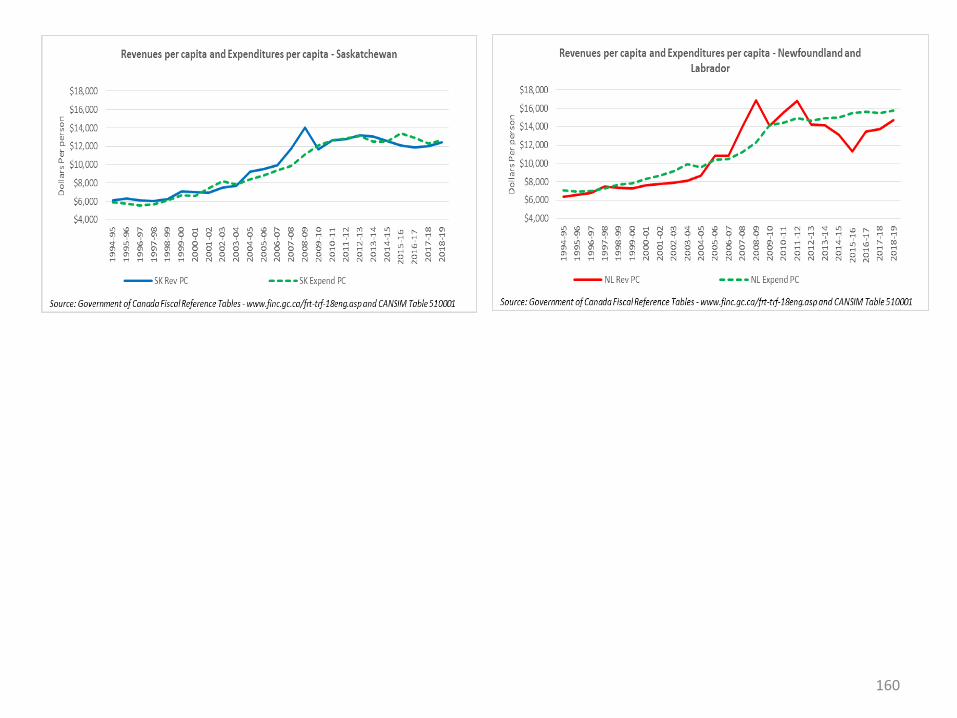
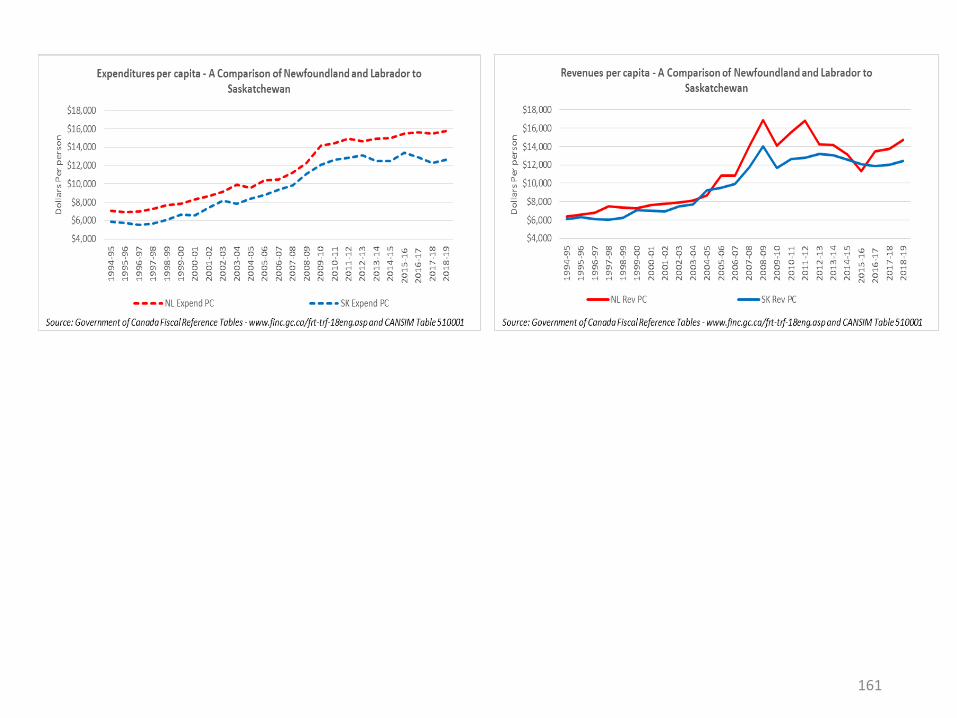
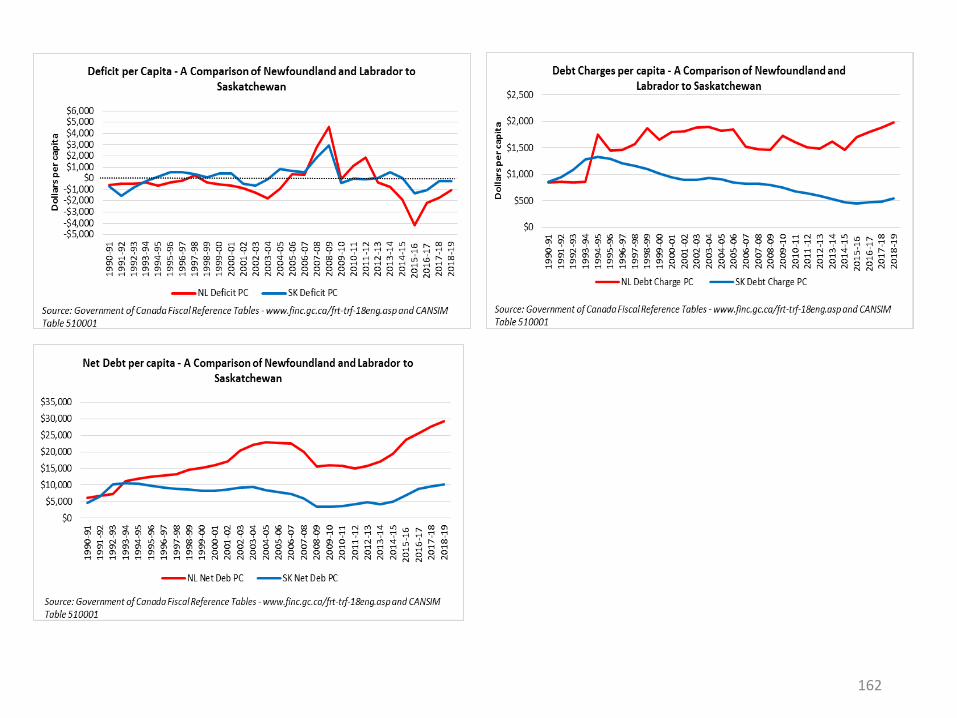
Appendix A9
A Detailed Comparison of Fiscal Indicators for NL and SK
Data Source for Graphs: Authors Calculation Using Government of Canada Fiscal Reference Tables - https://www.fin.gc.ca/frt-trf/2019/frt-trf-19-eng.asp and
CANSIM Tables 510001 and 36100325
158
Per Capita(NL versus SK)
159
160
161
162
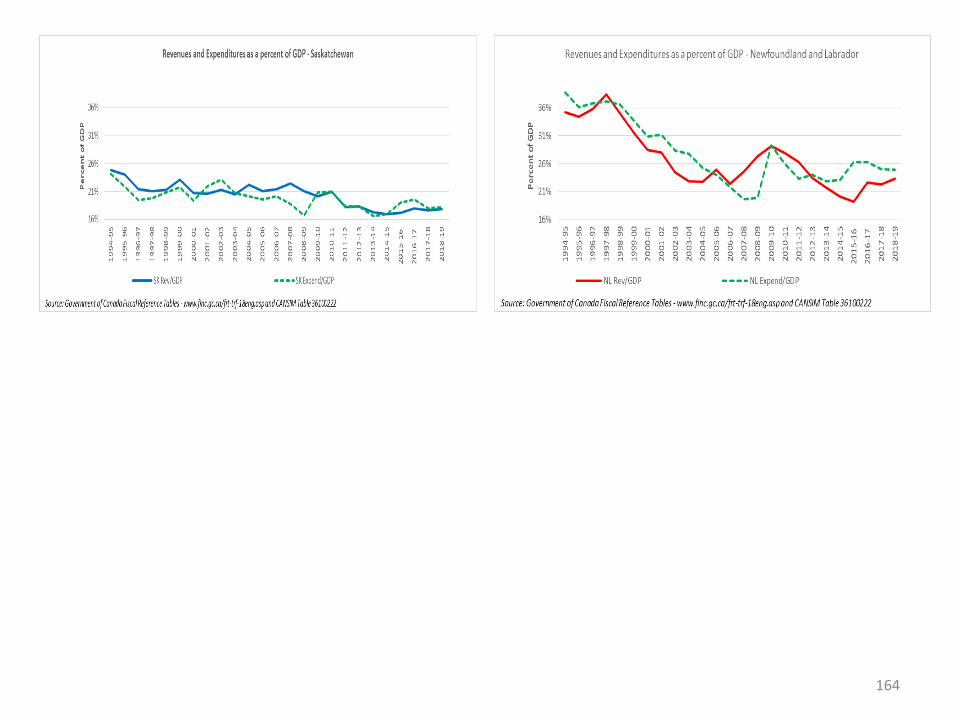
Relative to GDP(NL versus SK)
163
164

165
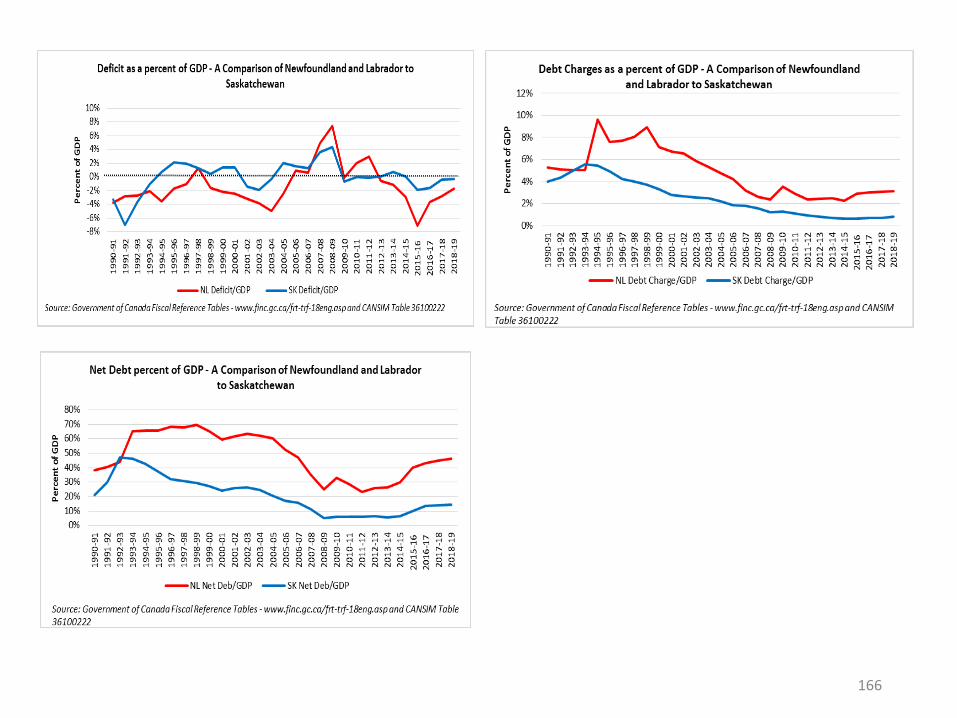
166

Relative to Revenue and Expenditure(NL versus SK)
167

168
Appendix A10
A Detailed Comparison of Fiscal Indicators for NL and AB
Data Source for Graphs: Authors Calculation Using Government of Canada Fiscal Reference Tables - https://www.fin.gc.ca/frt-trf/2019/frt-trf-19-eng.asp and
CANSIM Tables 510001 and 36100325
169

Per Capita(NL versus AB)
170

171
172
173

Relative to GDP(NL versus AB)
174

175
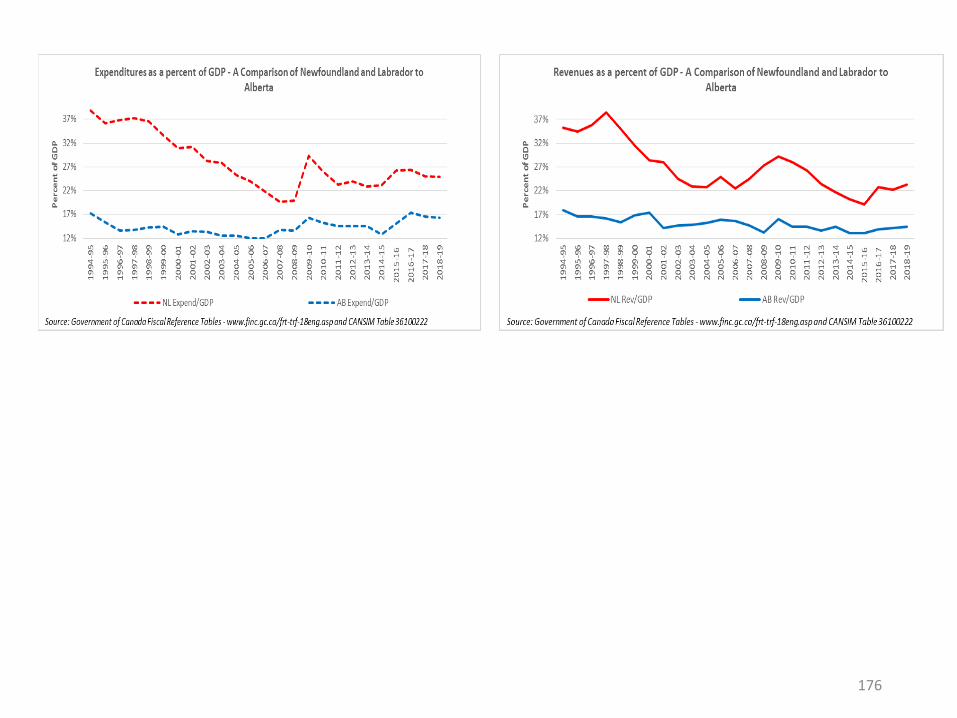
176
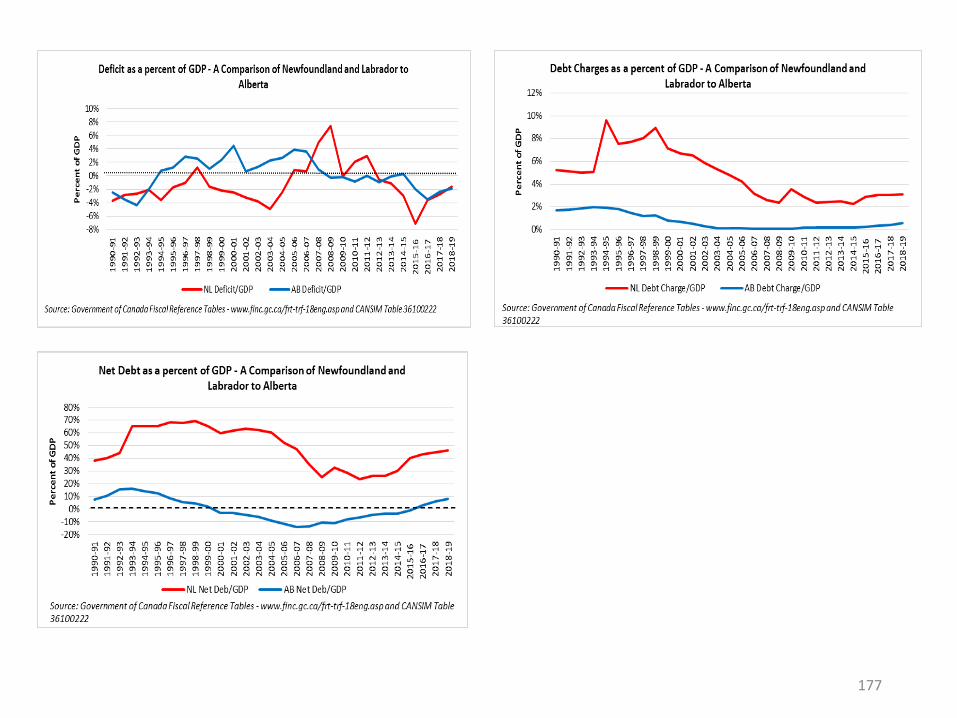
177
Relative to Revenue and Expenditure(NL versus AB)
178

179
Appendix A11
A Detailed Comparison of Fiscal Indicators for NL and BC
Data Source for Graphs: Authors Calculation Using Government of Canada Fiscal Reference Tables - https://www.fin.gc.ca/frt-trf/2019/frt-trf-19-eng.asp and
CANSIM Tables 510001 and 36100325
180

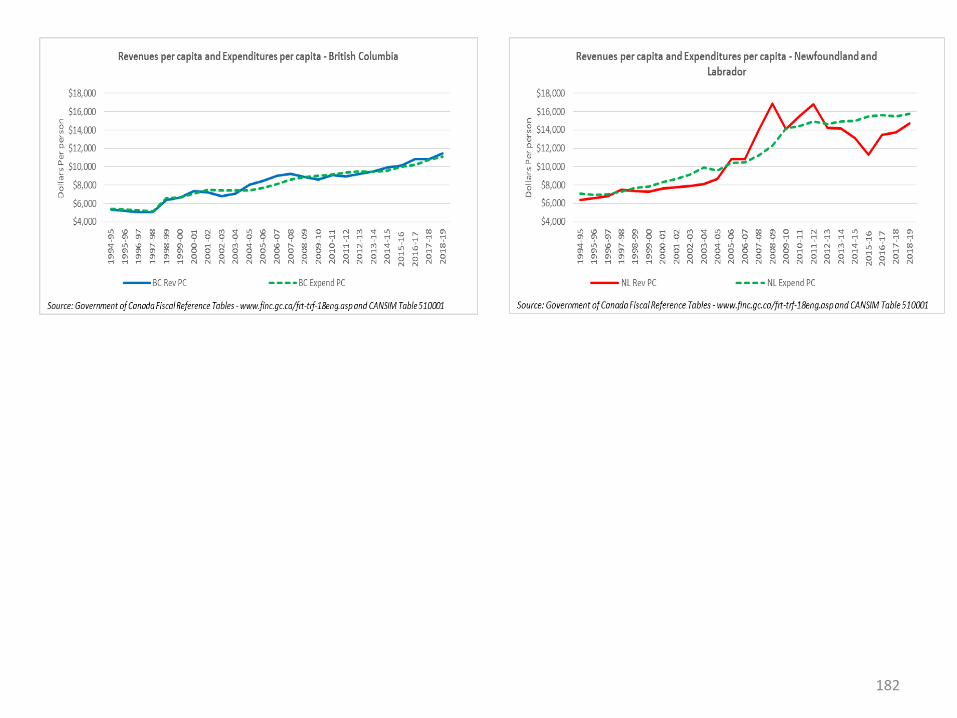
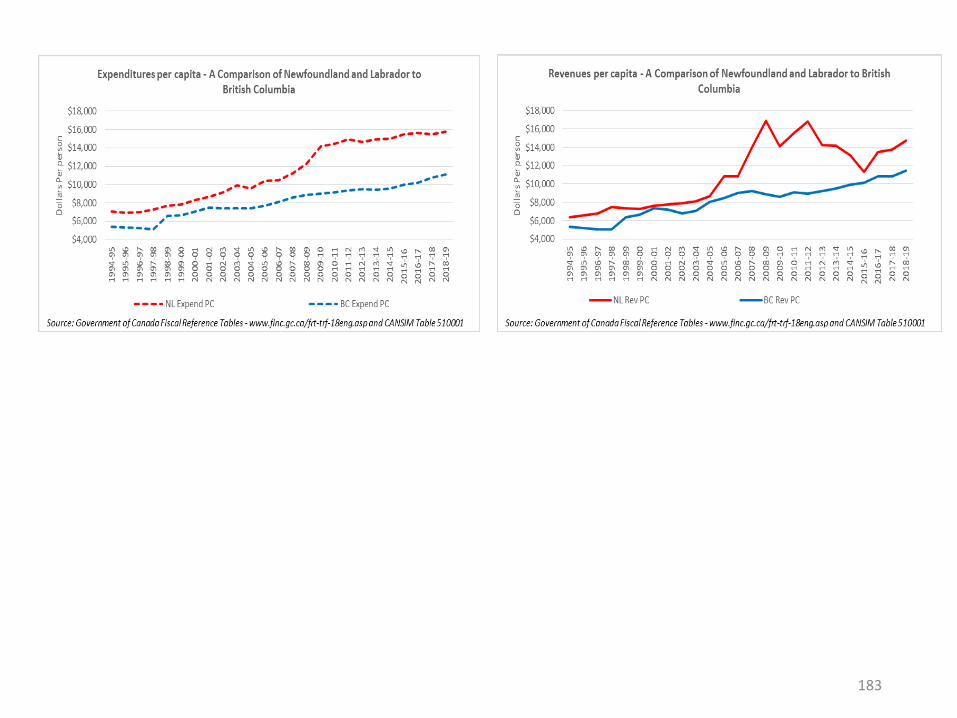
Per Capita(NL versus BC)
181
182
183
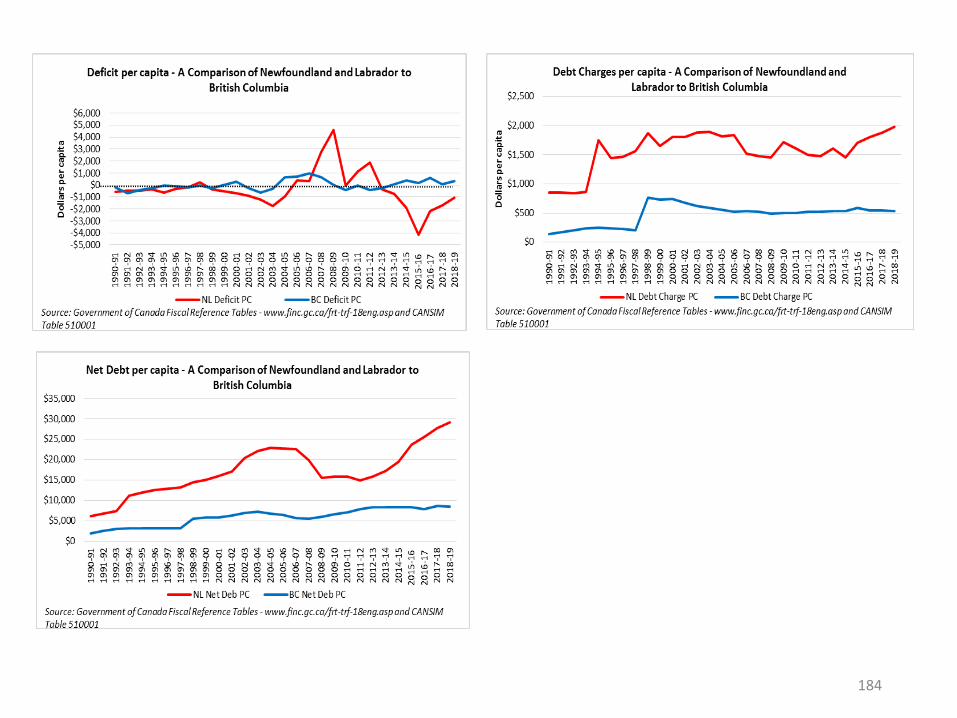
184
Relative to GDP(NL versus BC)
185
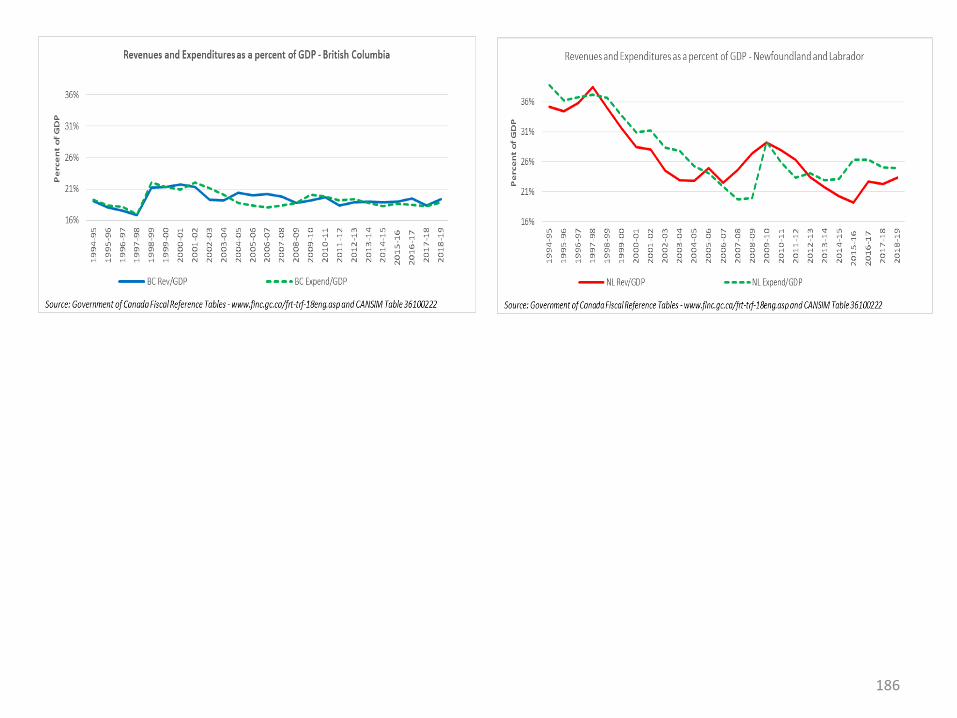
186

187

188
Relative to Revenue and Expenditure(NL versus BC)
189
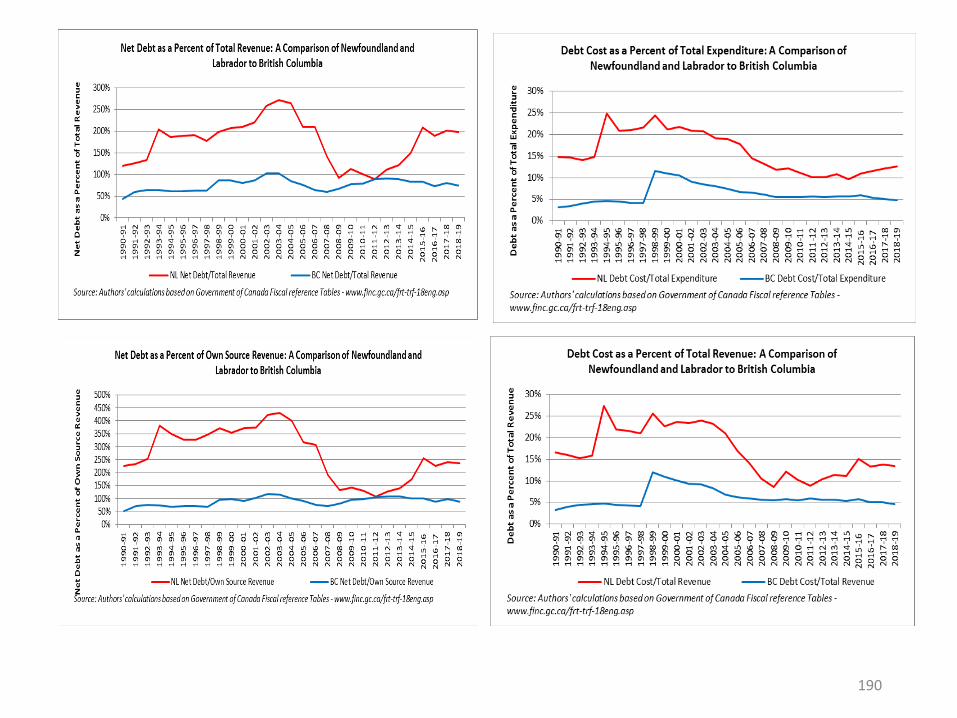
190

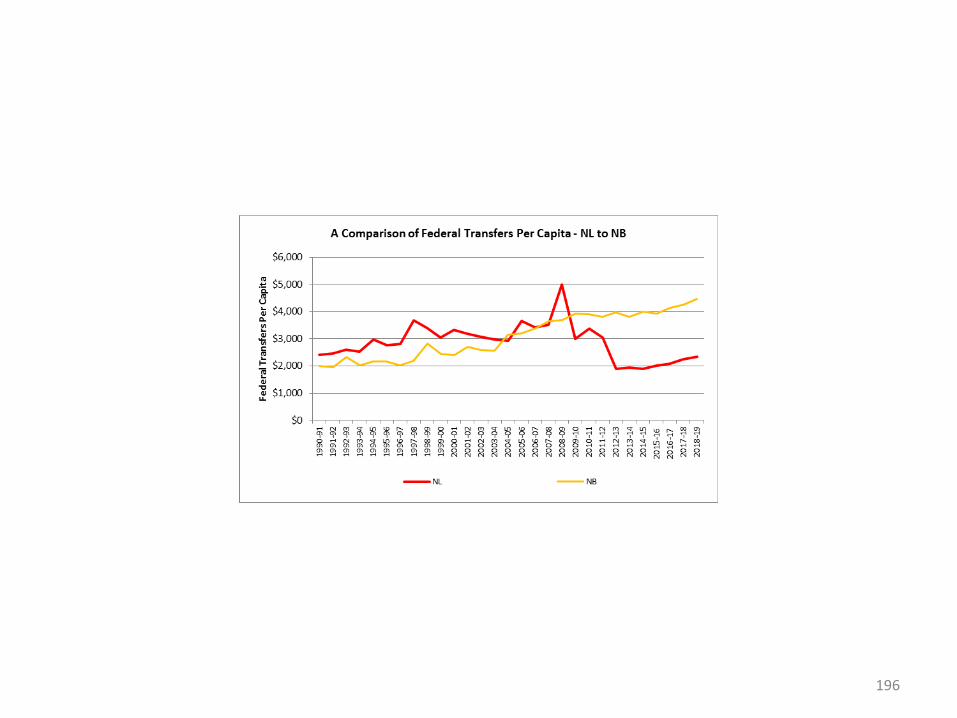
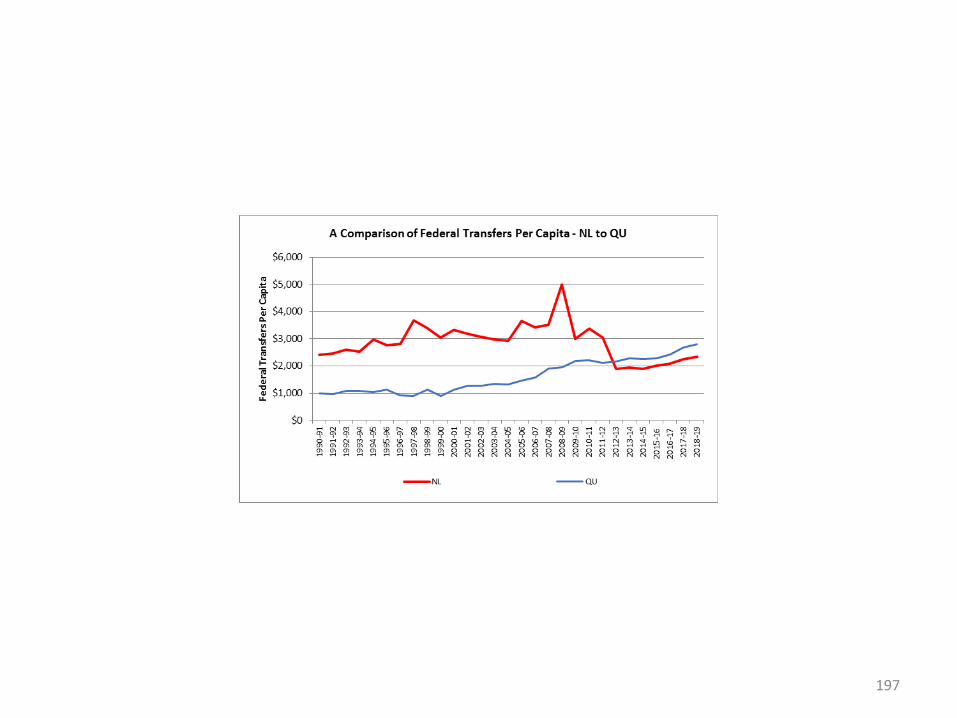
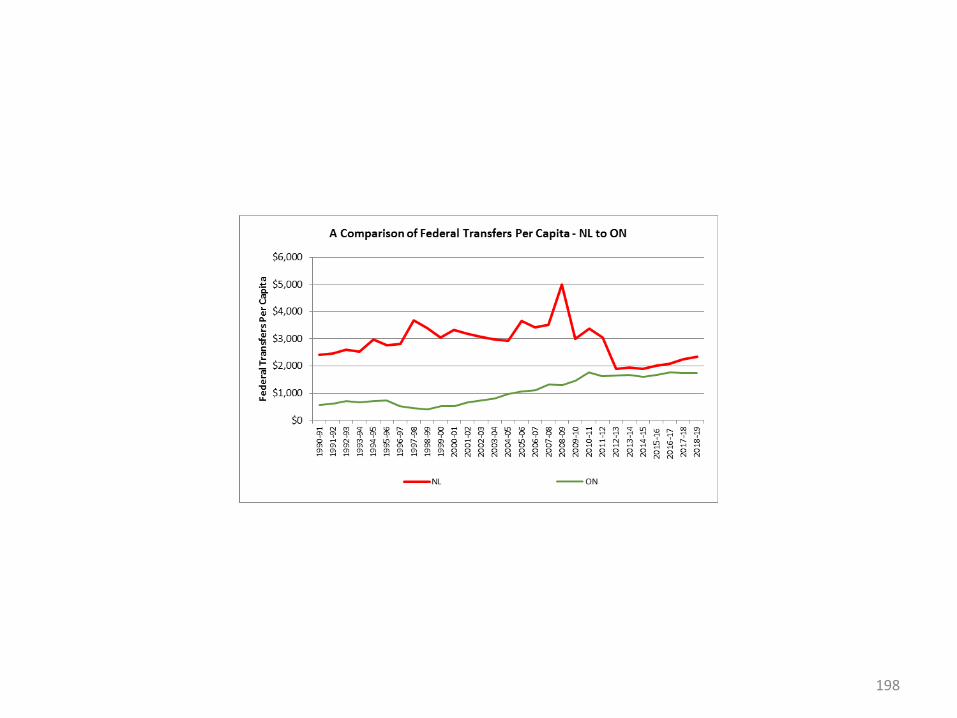
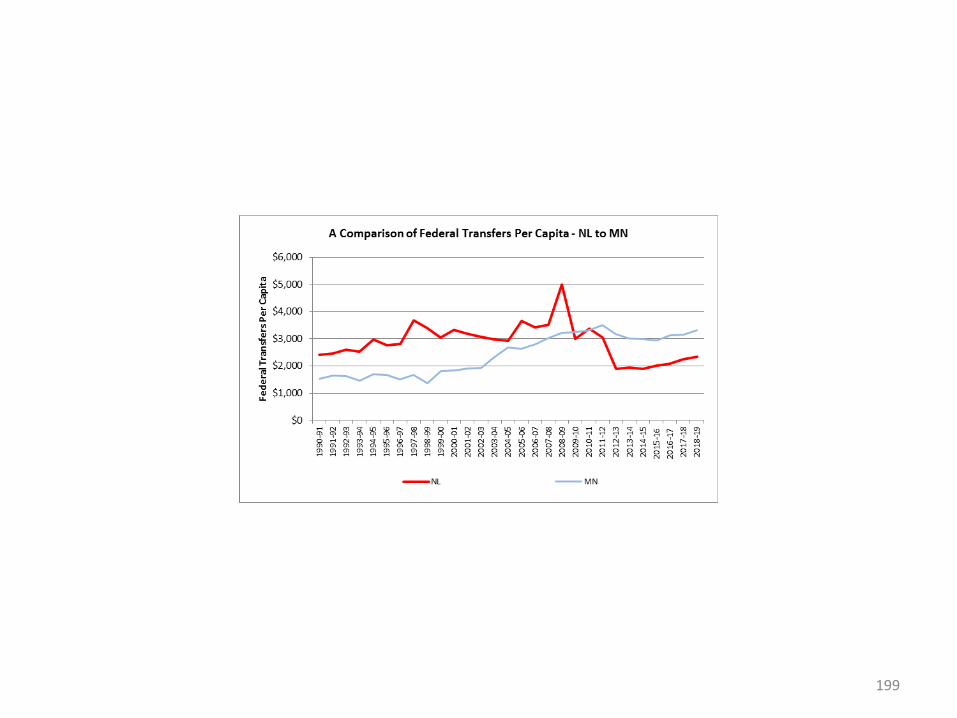
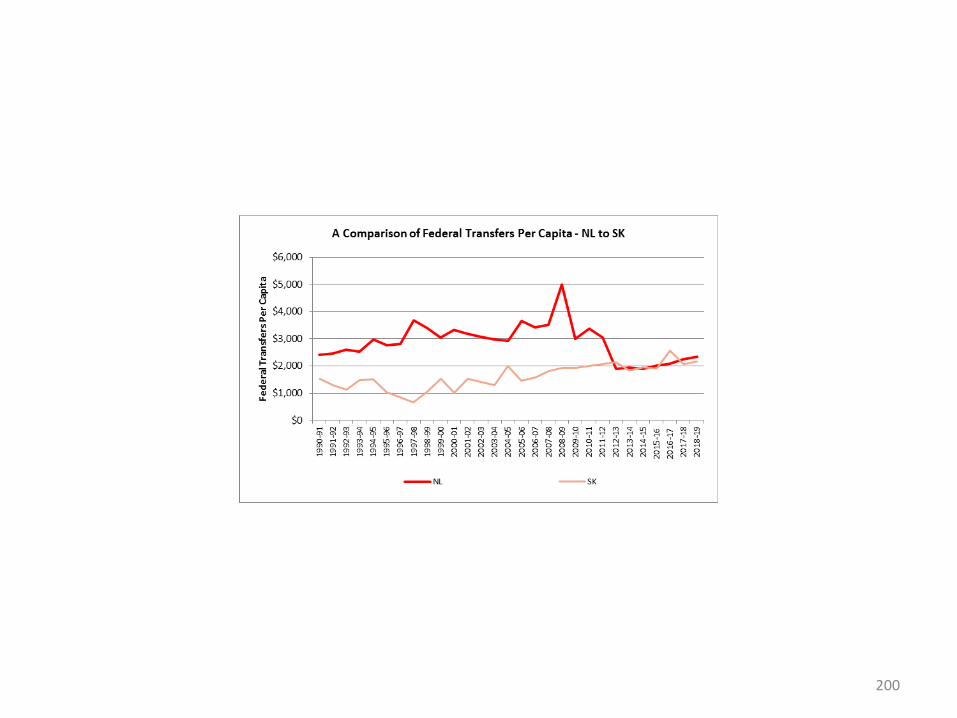
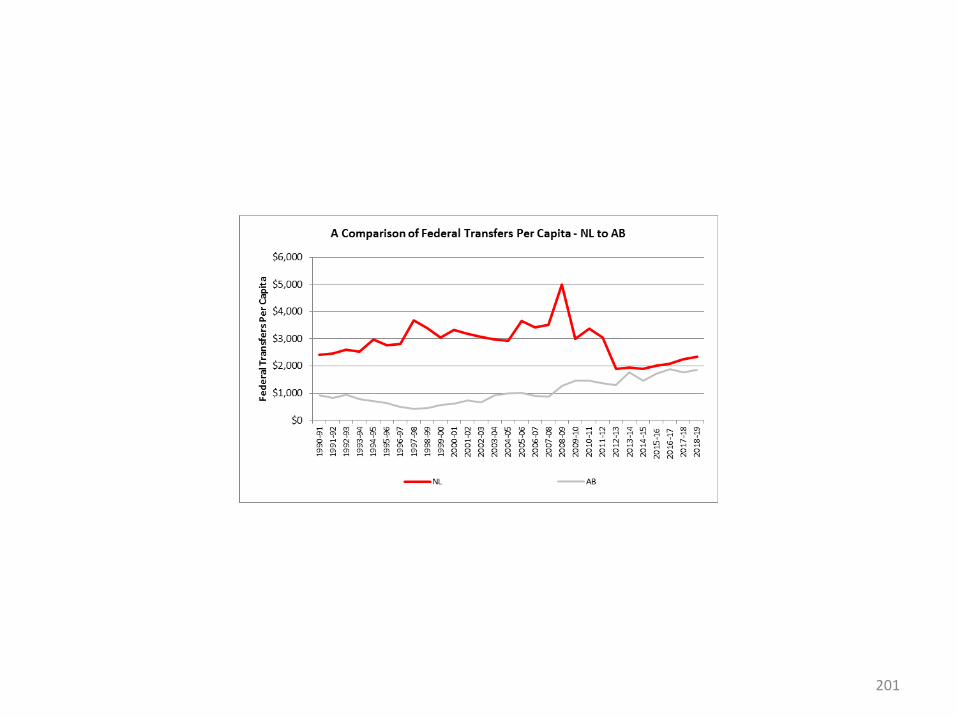
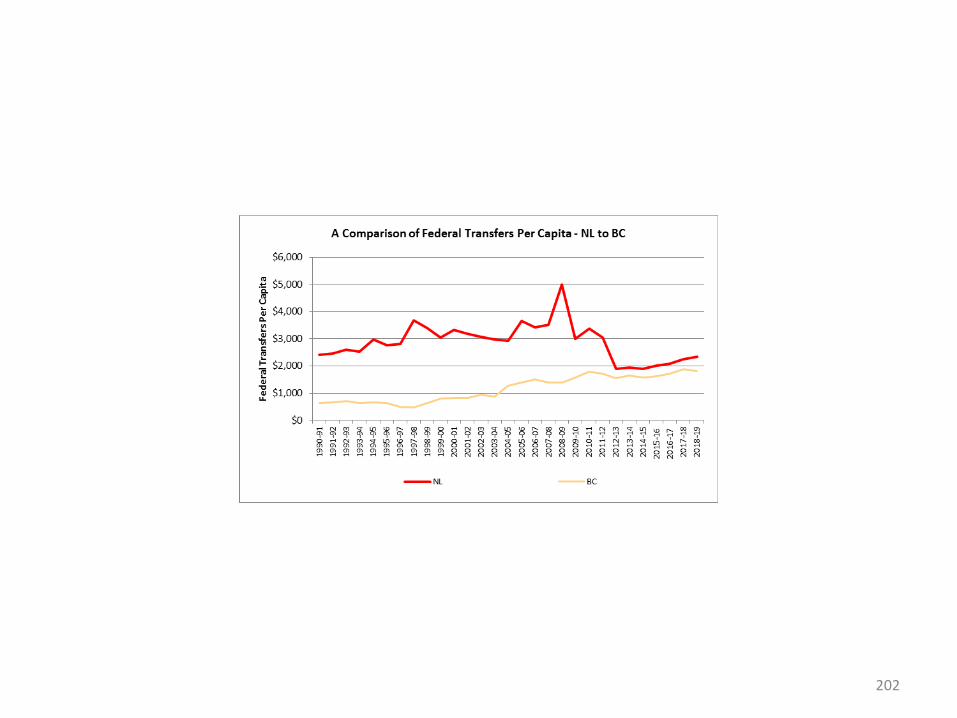
Appendix A12
A Detailed Interprovincial Comparison of Federal Transfers Per Capita
Data Source for Graphs: Authors Calculation Using Government of Canada Fiscal Reference Tables - https://www.fin.gc.ca/frt-trf/2019/frt-trf-19-eng.asp and
CANSIM Tables 510001 and 36100325
191

192

193

194

195
196
197
198
199
200
201
202

Appendix A13
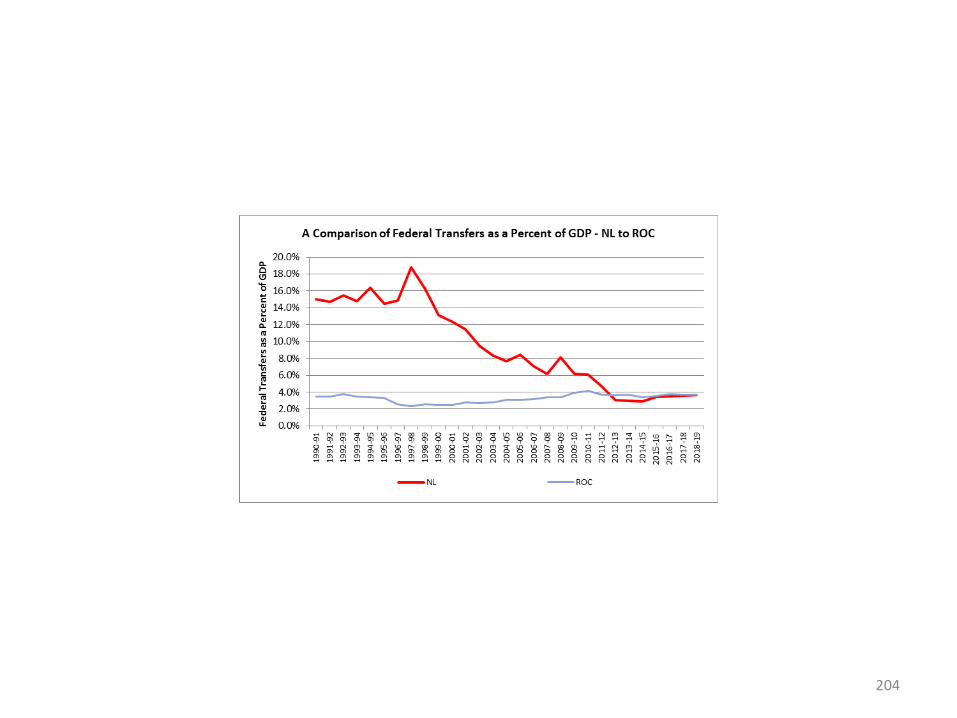
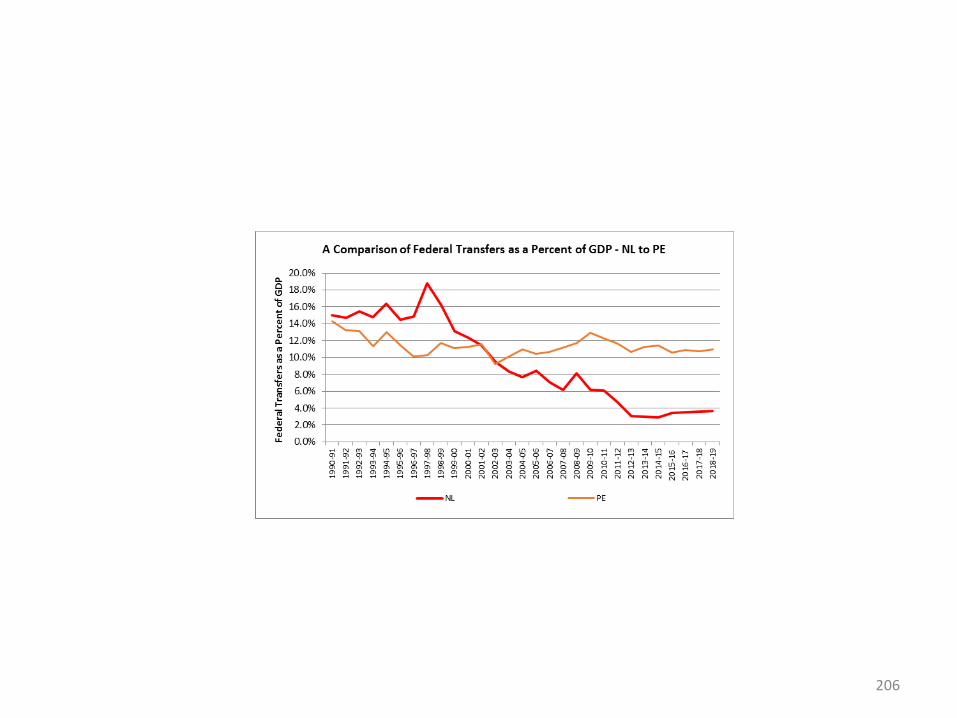
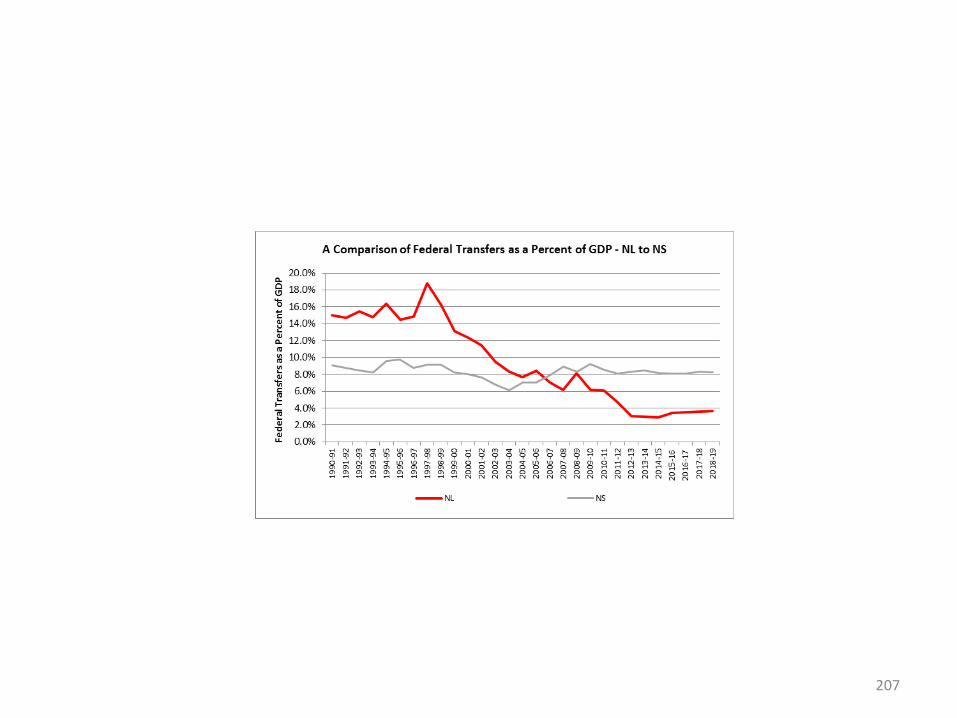
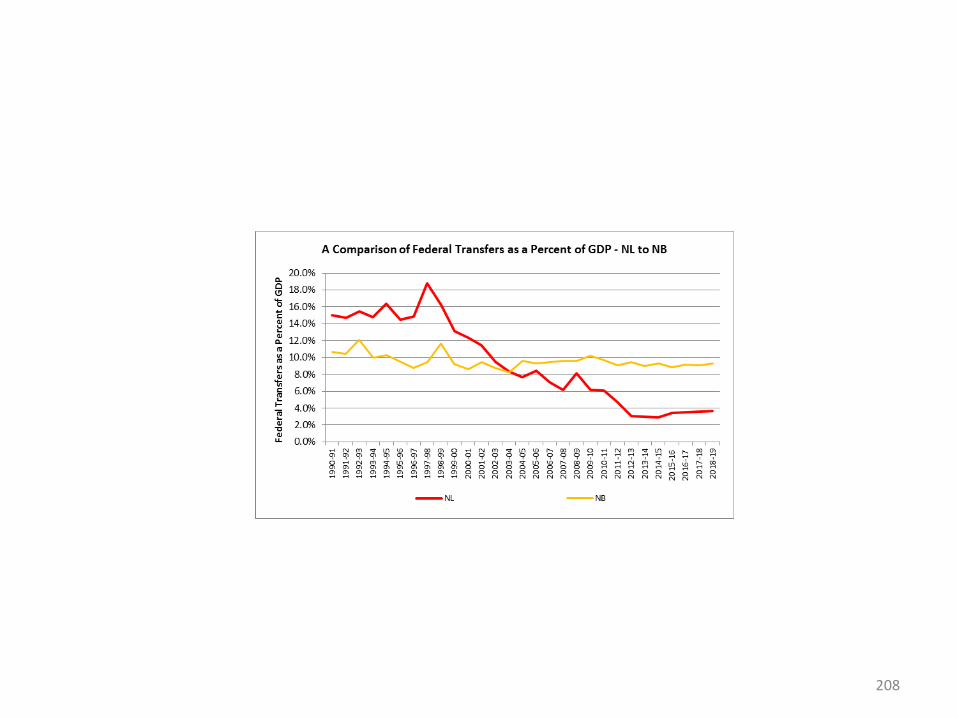
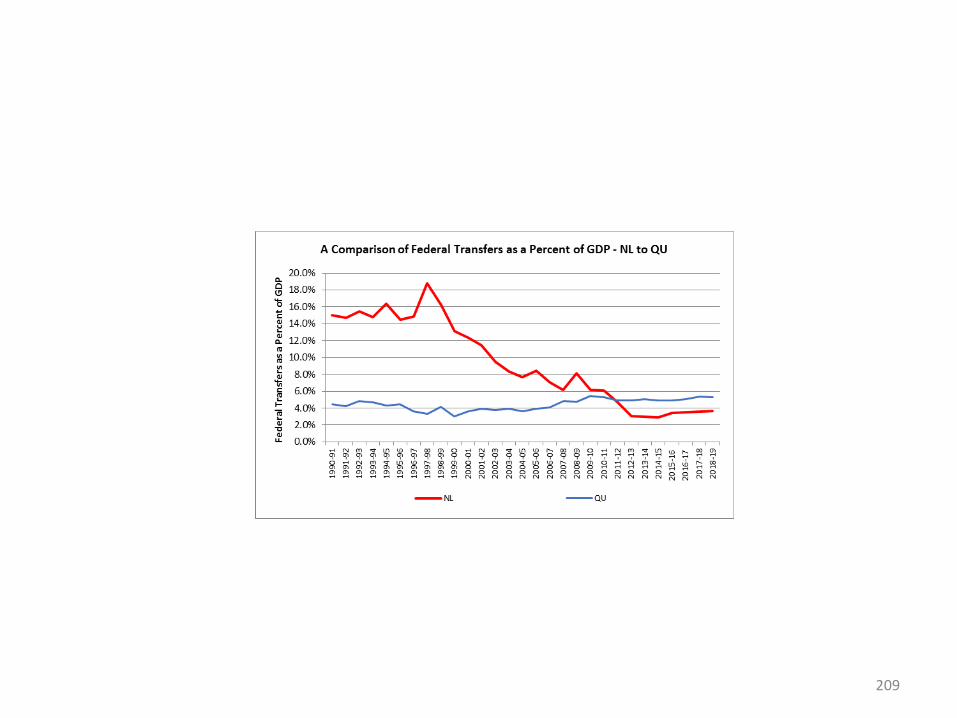
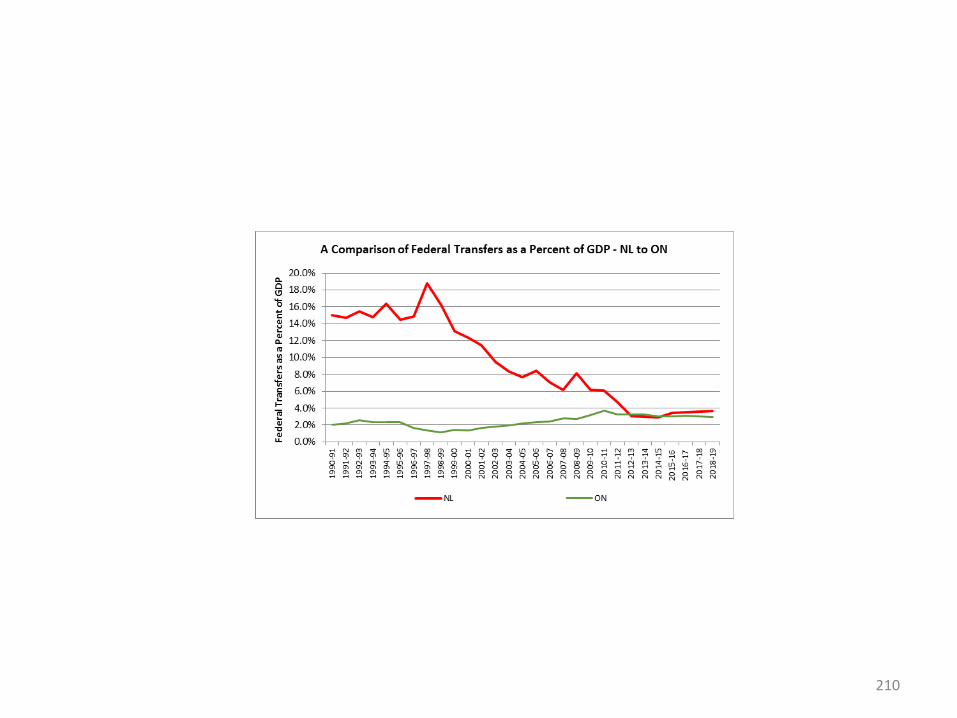
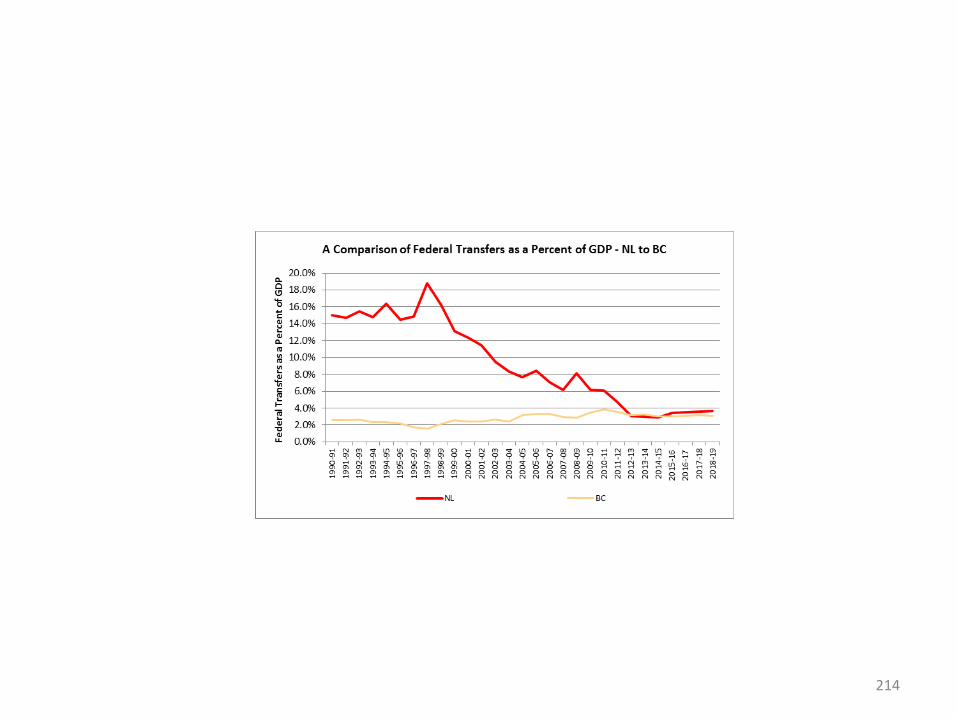
A Detailed Interprovincial Comparison of Federal Transfers as a Percent of
GDPData Source for Graphs:
Authors Calculation Using Government of Canada Fiscal Reference Tables - https://www.fin.gc.ca/frt-trf/2019/frt-trf-19-eng.asp and CANSIM Table 36100325
203
204

205
206
207
208
209
210

211

212

213
214
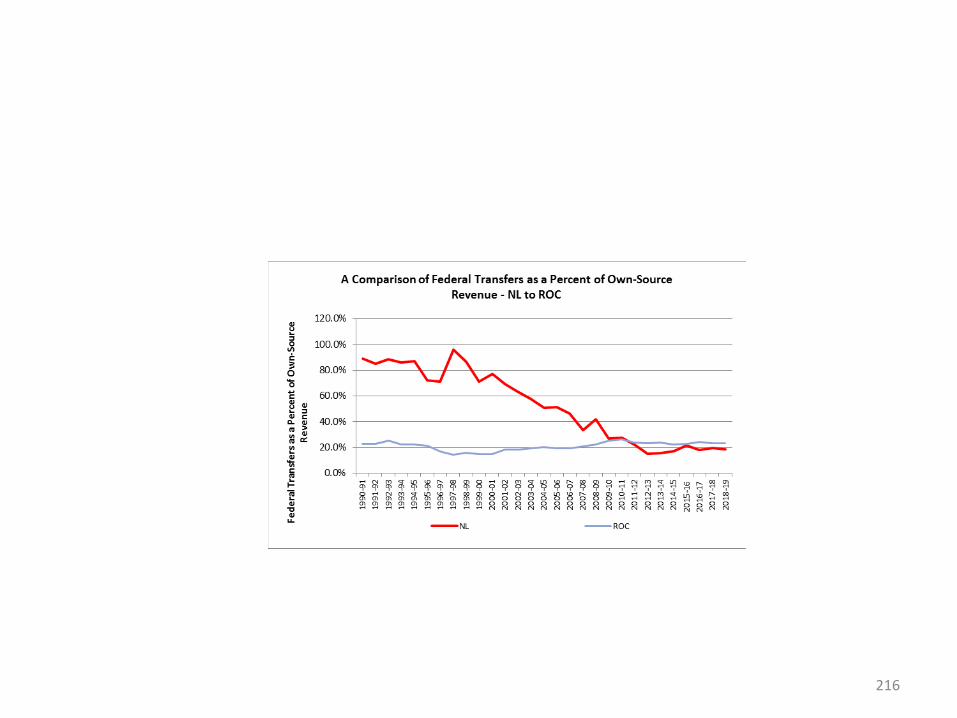
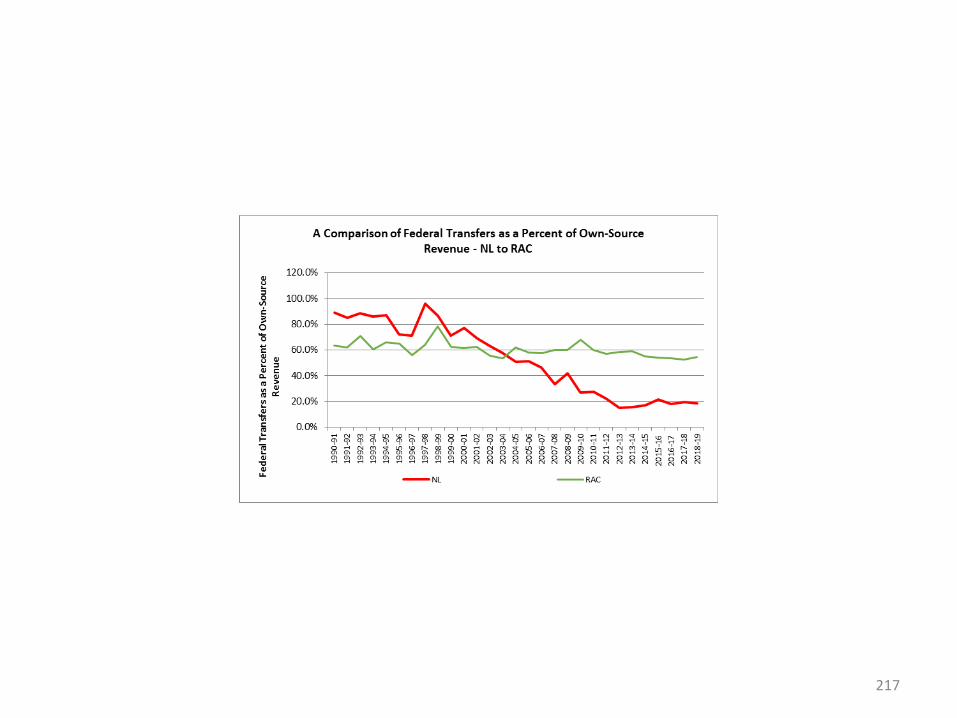
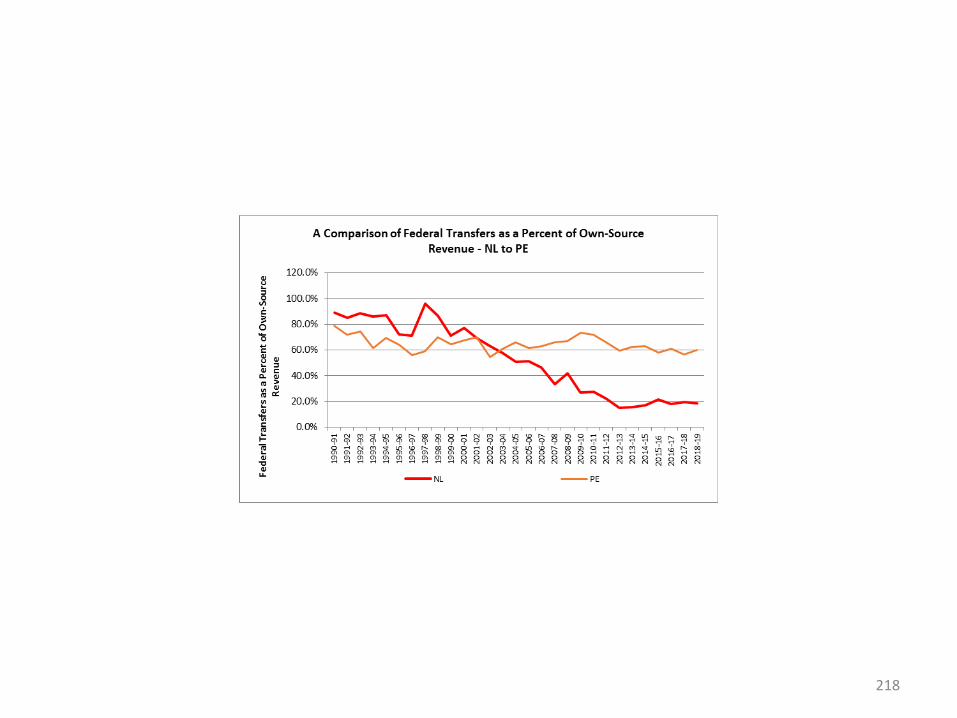
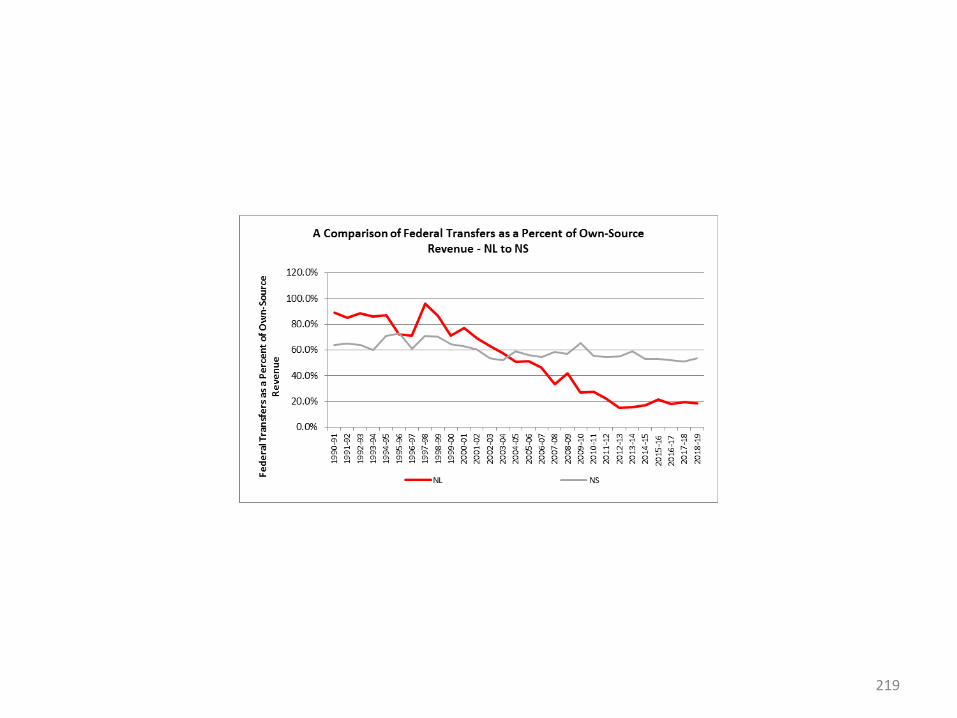
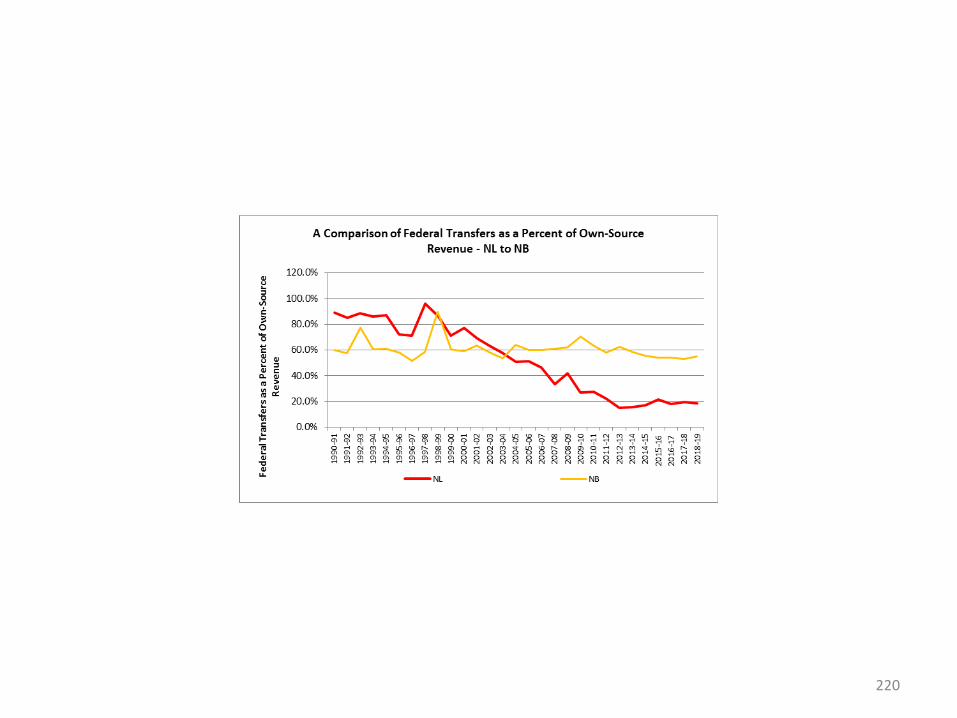
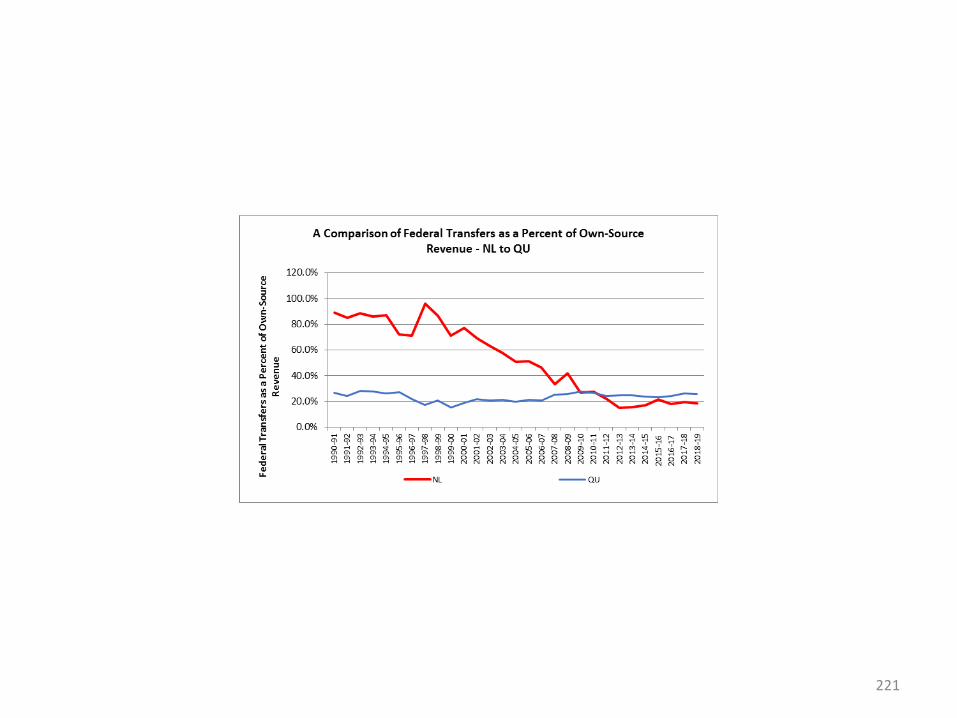
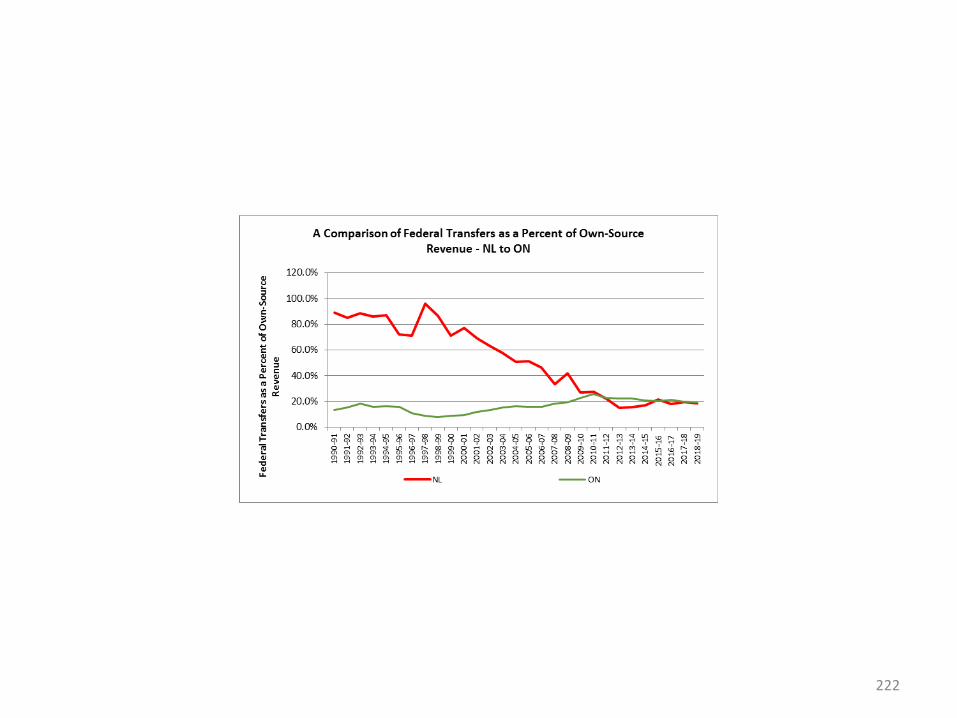
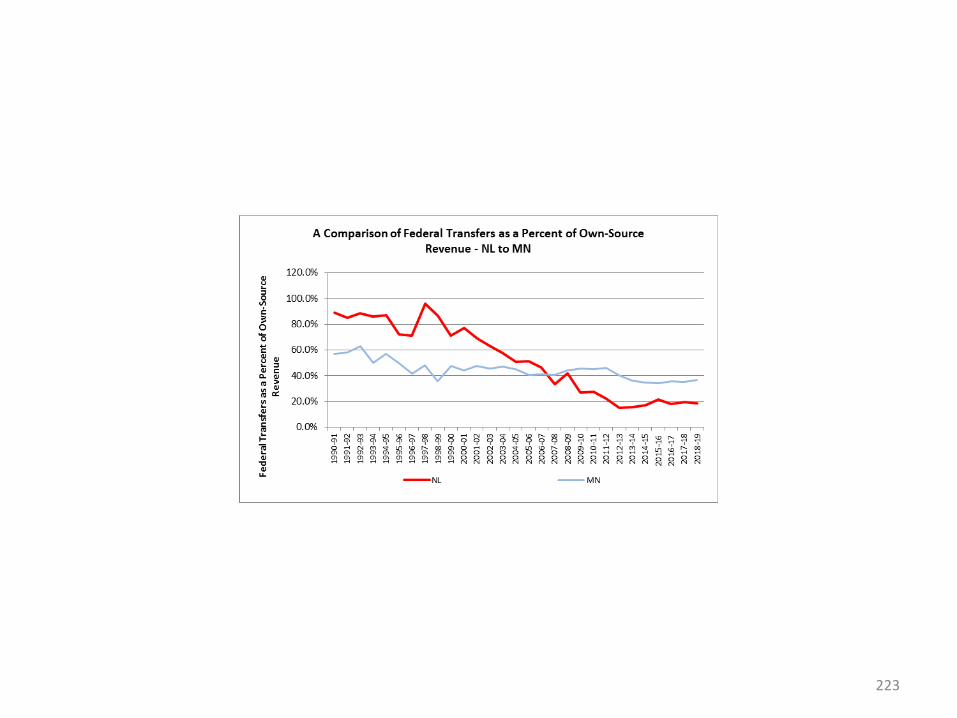
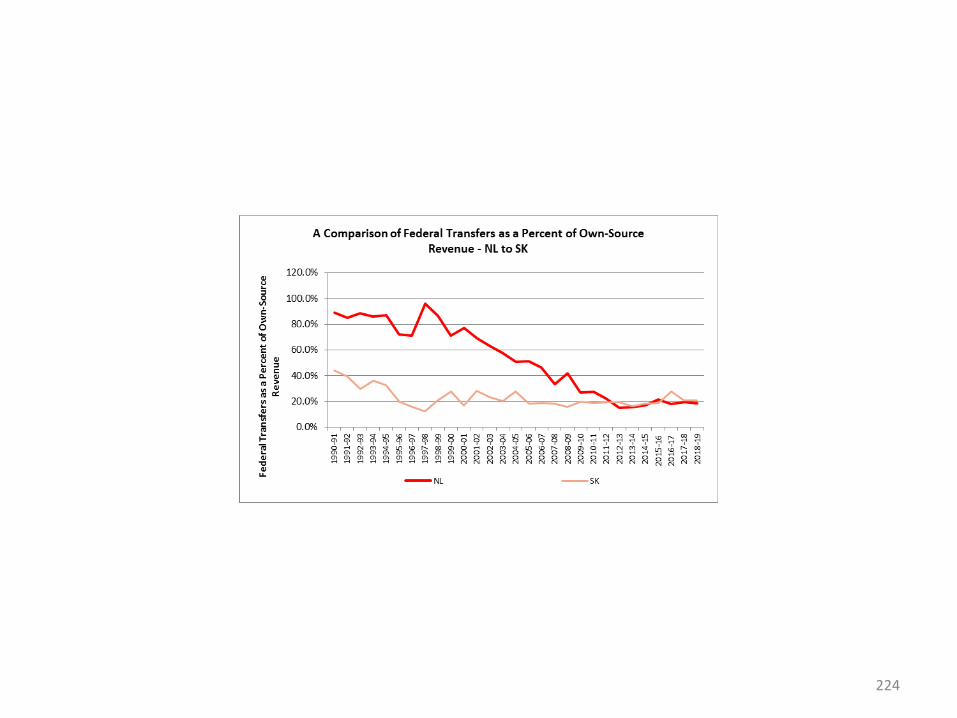
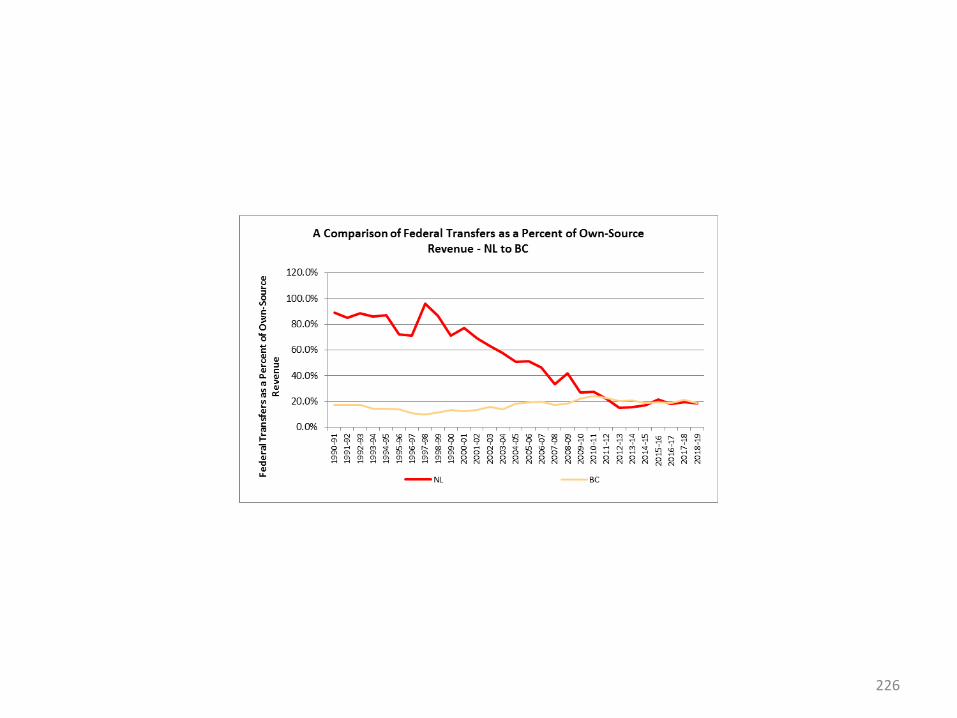
Appendix A14
A Detailed Interprovincial Comparison of Federal Transfers as a Percent of
Own-Source Revenue
Data Source for Graphs: Authors Calculation Using Government of Canada Fiscal Reference Tables - https://www.fin.gc.ca/frt-trf/2019/frt-trf-19-eng.asp
215
216
217
218
219
220
221
222
223
224

225
226
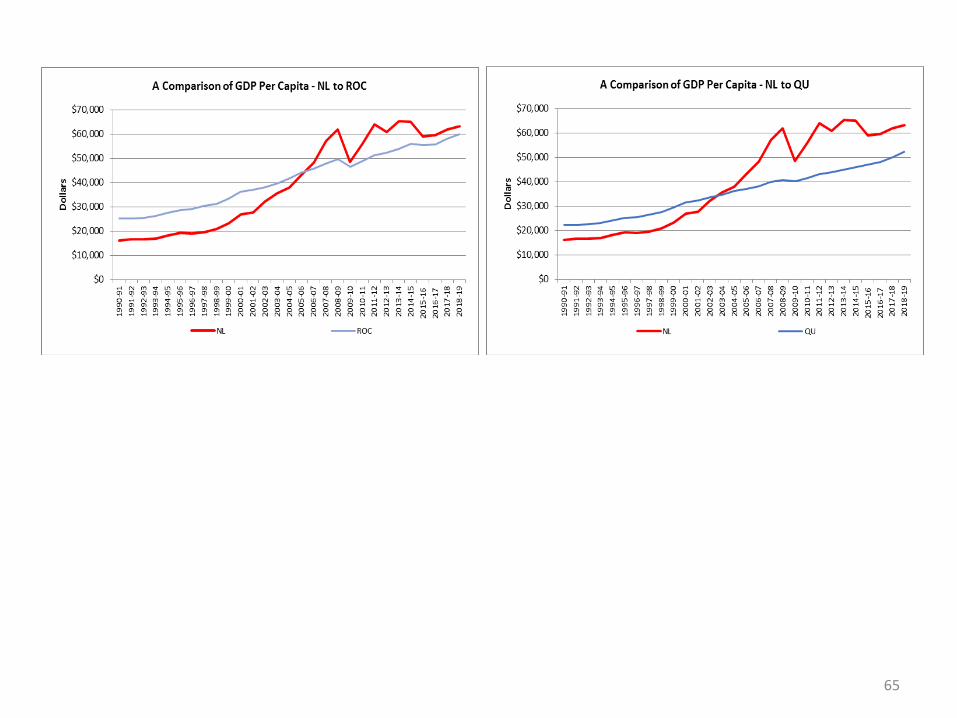
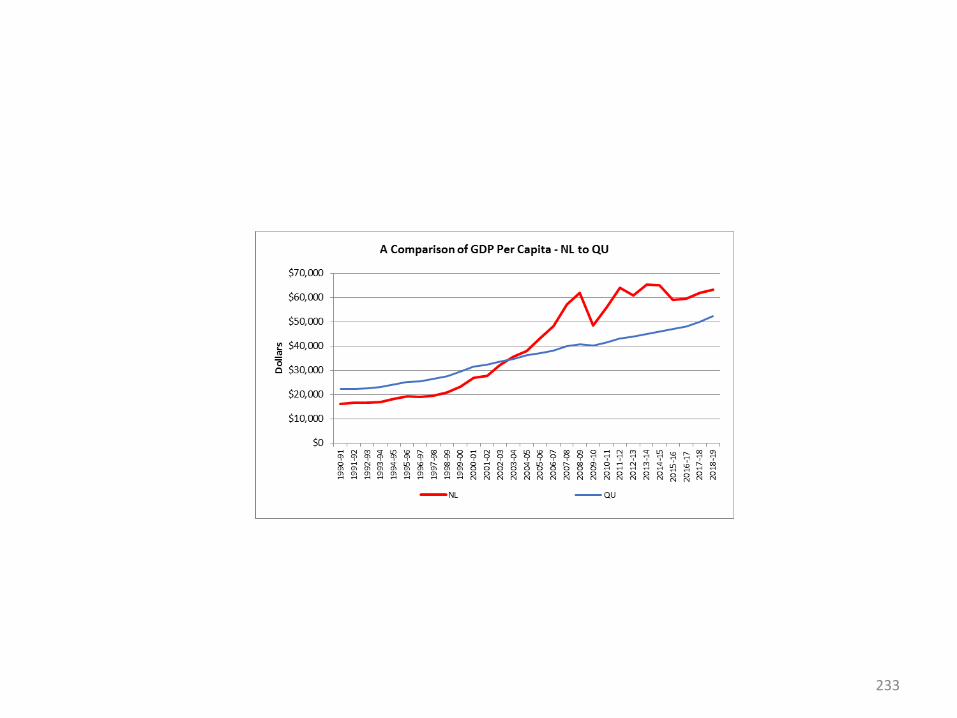
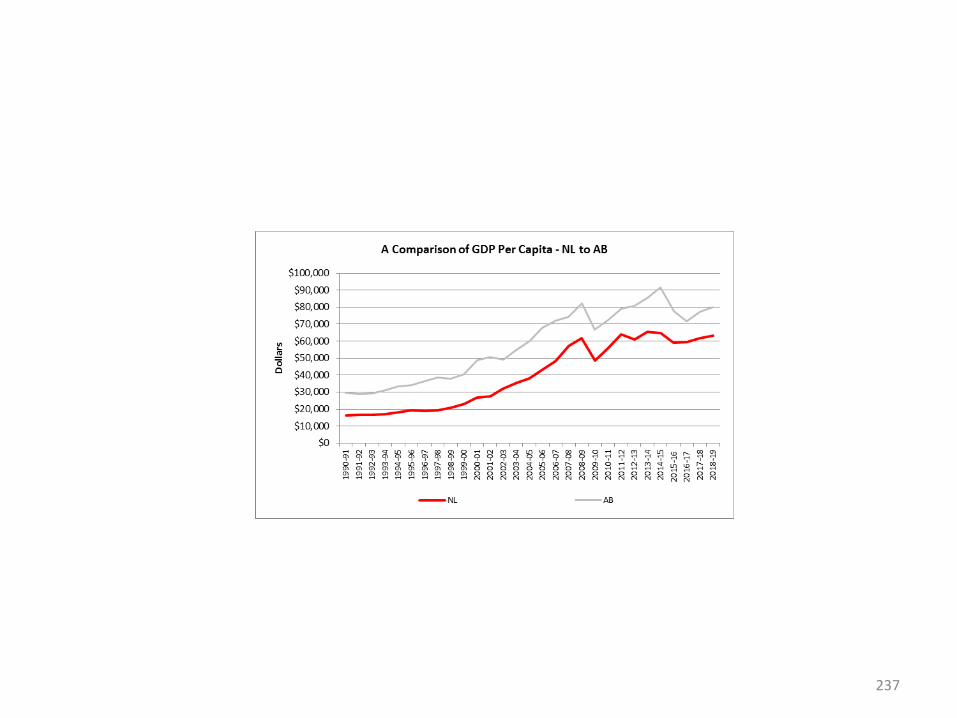
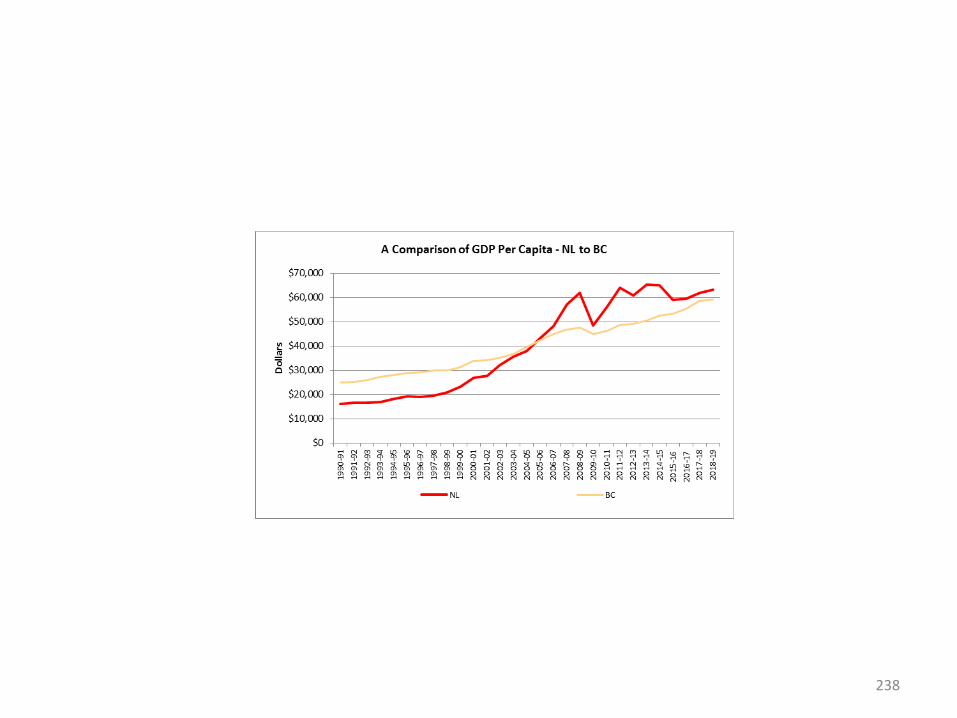
Appendix A15
A Detailed Interprovincial Comparison of GDP Per Capita
Data Source for Graphs: Authors Calculation Using CANSIM Tables 36100325 and 510001
227

228

229

230

231

232
233

234

235

236
237
238
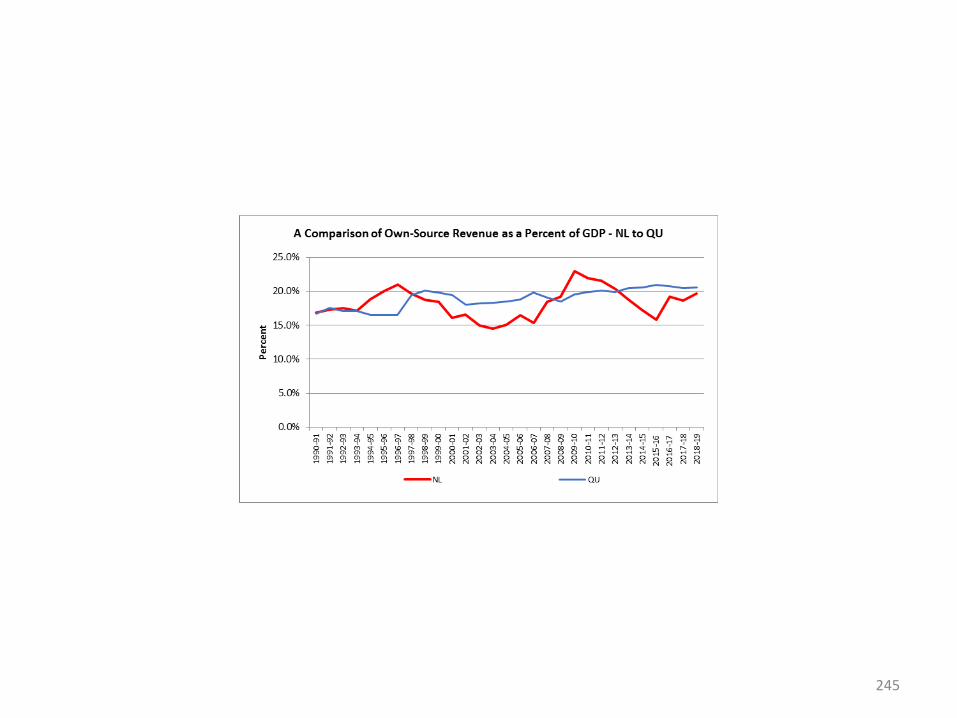
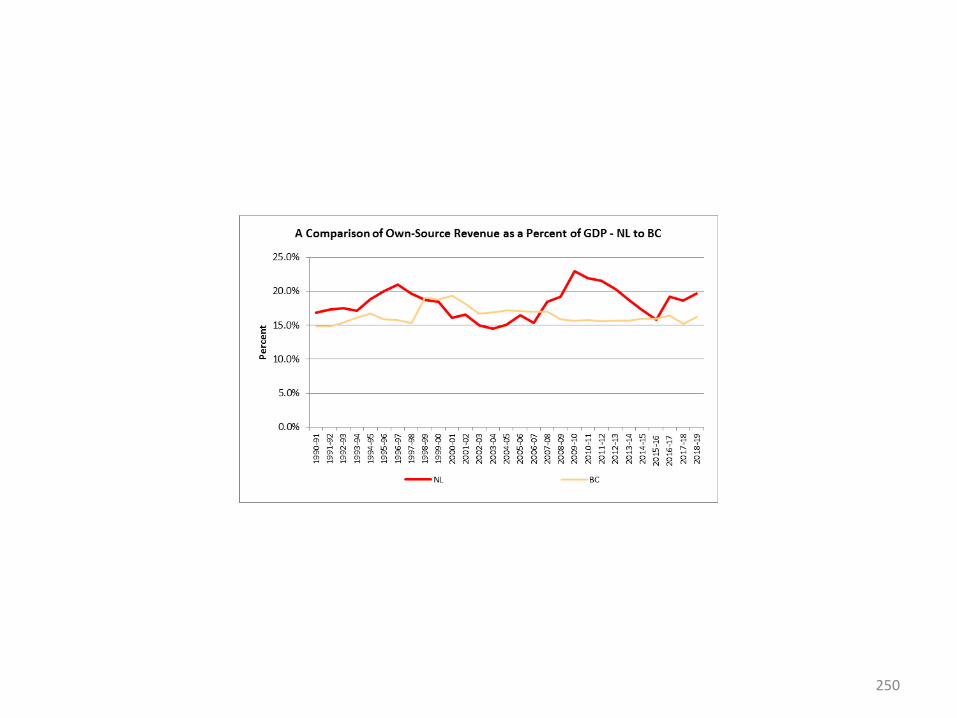
Appendix A16
A Detailed Interprovincial Comparison of Own-Source Revenue as a Percent
of GDPData Source for Graphs:
Authors Calculation Using Government of Canada Fiscal Reference Tables - https://www.fin.gc.ca/frt-trf/2019/frt-trf-19-eng.asp and CANSIM Table 36100325
239

240

241

242

243

244
245

246

247

248

249
250
Related Documents