Strategy for the Application of Novel Characterization Methods for Biomass Fuels: Case Study of Straw Ingwald Obernberger* ,†,‡,§ † BIOS BIOENERGIESYSTEME GmbH, Inffeldgasse 21b, 8010 Graz, Austria ‡ BIOENERGY 2020+ GmbH, Inffeldgasse 21b, 8010 Graz, Austria § Institute for Process and Particle Engineering, Graz University of Technology, Inffeldgasse 13, 8010 Graz, Austria ABSTRACT: Because of an increasing interest in the utilization of new and in terms of combustion-related properties rather unknown biomass fuels in heat and power production, advanced fuel characterization tools are gaining rising interest. Currently, ongoing research and development (R&D) focuses on a better and more precise description of the combustion properties of specific biomass fuels by applying new/advanced analysis methods and modeling tools. These novel characterization methods cover combustion tests in specially designed lab reactors, special fuel indices for biomass fuels, and the dedicated application of high-temperature equilibrium calculations. In this paper, a strategy is presented how the information gained from different advanced fuel characterization methods can be combined to characterize a fuel regarding its combustion behavior in a novel way. By means of this strategy, relevant qualitative and quantitative information regarding the ash-melting behavior, aerosol, SO x , HCl, and NO x emissions to be expected, and high-temperature corrosion risks can be gained. In addition, the approach can also be used for the evaluation of additives and fuel blending as measures to improve specific combustion properties. The results show that a much better and clearer picture about the combustion properties of a specific biomass fuel can be provided than by conventional approaches (such as wet chemical analysis or other standardized methods). The results can be used for the preliminary design of plants as well as for evaluation of the applicability of a specific technology for a certain biomass fuel or fuel spectrum. Moreover, they can be applied in combination with computational fluid dynamics (CFD) simulations for the detailed design and evaluation of furnaces and boilers. 1. INTRODUCTION AND OBJECTIVES In recent years, the thermal utilization of solid biomass for heat and electricity production has gained great importance. Within the European Union (EU), in particular, biomass is seen as the most relevant renewable energy source besides hydropower and is, thus, expected to substantially contribute to the CO 2 emission reduction targets defined. Additionally, there is a broad international consensus that the utilization of renewable energy sources should be globally further enforced to reduce greenhouse gas emissions. Moreover, the increase of fossil fuel prices because of increasing energy demand and limited resources is also a major driving force toward renewable energy. On the basis of market data for 2008, 1-4 the primary energy consumption and total turnover of biomass combustion plants (small-, medium-, and large-capacity ranges) in the EU was estimated to about 3711 petajoule/year and 6423 million €/a, respectively. In the EU, several political measures have been initiated with the aim of supporting the utilization of renewable energies, including, for instance, the Res-e Directive (2001), the EU Biomass Action Plan (2005), the Energy and Climate Change Package (March 2007), and the Renewable Energy Directive (June 2009). Against the background of these targets, a compound annual market growth rate of approximately 8.3% is expected. The market volume should grow up to 260% (of the 2008 data), and the primary energy consumption from biomass should be more than doubled until 2020. Consequently, also, the demand for biomass feedstocks is increasing accordingly, and therefore, the number and diversity of different biomass sources applied in combustion systems will also increase. Typical examples for fuels with remarkable future market potentials are (i) fuels from short-rotation forestry (e.g., poplar and willow), (ii) agricultural biomass fuels (Miscanthus, grasses, and maize cobs), (iii) residues from food production and agricultural industries, (iv) residues from new biomass conversion technologies, and (v) second-generation biomass fuels (e.g., torrefied biomass, pyrolysis char, and hydrolytic lignin). Generally, most of these “new” biomass fuels are not yet well-explored regarding their combustion-related properties. Therefore, the development of new and advanced fuel characterization tools is presently gaining rising relevance, and related research and development (R&D) already shows the first promising results. These novel characterization methods cover special fuel indices for biomass fuels, combustion tests in specially designed lab-scale reactors equipped with innovative measurement equipment, and the dedicated application of high-temperature equilibrium calcu- lations. Moreover, they provide basic input data for the application of new computational fluid dynamics (CFD) models for detailed NO x and aerosol formation simulations, which can be applied for plant design. To evaluate and validate these new methods, a comparison to measurement data from real-scale plants is of great relevance. Received: March 29, 2013 Revised: January 22, 2014 Published: January 23, 2014 Article pubs.acs.org/EF © 2014 American Chemical Society 1041 dx.doi.org/10.1021/ef402249x | Energy Fuels 2014, 28, 1041-1052

Welcome message from author
This document is posted to help you gain knowledge. Please leave a comment to let me know what you think about it! Share it to your friends and learn new things together.
Transcript

Strategy for the Application of Novel Characterization Methods forBiomass Fuels: Case Study of StrawIngwald Obernberger*,†,‡,§
†BIOS BIOENERGIESYSTEME GmbH, Inffeldgasse 21b, 8010 Graz, Austria‡BIOENERGY 2020+ GmbH, Inffeldgasse 21b, 8010 Graz, Austria§Institute for Process and Particle Engineering, Graz University of Technology, Inffeldgasse 13, 8010 Graz, Austria
ABSTRACT: Because of an increasing interest in the utilization of new and in terms of combustion-related properties ratherunknown biomass fuels in heat and power production, advanced fuel characterization tools are gaining rising interest. Currently,ongoing research and development (R&D) focuses on a better and more precise description of the combustion properties ofspecific biomass fuels by applying new/advanced analysis methods and modeling tools. These novel characterization methodscover combustion tests in specially designed lab reactors, special fuel indices for biomass fuels, and the dedicated application ofhigh-temperature equilibrium calculations. In this paper, a strategy is presented how the information gained from differentadvanced fuel characterization methods can be combined to characterize a fuel regarding its combustion behavior in a novel way.By means of this strategy, relevant qualitative and quantitative information regarding the ash-melting behavior, aerosol, SOx, HCl,and NOx emissions to be expected, and high-temperature corrosion risks can be gained. In addition, the approach can also beused for the evaluation of additives and fuel blending as measures to improve specific combustion properties. The results showthat a much better and clearer picture about the combustion properties of a specific biomass fuel can be provided than byconventional approaches (such as wet chemical analysis or other standardized methods). The results can be used for thepreliminary design of plants as well as for evaluation of the applicability of a specific technology for a certain biomass fuel or fuelspectrum. Moreover, they can be applied in combination with computational fluid dynamics (CFD) simulations for the detaileddesign and evaluation of furnaces and boilers.
1. INTRODUCTION AND OBJECTIVES
In recent years, the thermal utilization of solid biomass for heatand electricity production has gained great importance. Withinthe European Union (EU), in particular, biomass is seen as themost relevant renewable energy source besides hydropower andis, thus, expected to substantially contribute to the CO2emission reduction targets defined. Additionally, there is abroad international consensus that the utilization of renewableenergy sources should be globally further enforced to reducegreenhouse gas emissions. Moreover, the increase of fossil fuelprices because of increasing energy demand and limitedresources is also a major driving force toward renewable energy.On the basis of market data for 2008,1−4 the primary energy
consumption and total turnover of biomass combustion plants(small-, medium-, and large-capacity ranges) in the EU wasestimated to about 3711 petajoule/year and 6423 million €/a,respectively. In the EU, several political measures have beeninitiated with the aim of supporting the utilization of renewableenergies, including, for instance, the Res-e Directive (2001), theEU Biomass Action Plan (2005), the Energy and ClimateChange Package (March 2007), and the Renewable EnergyDirective (June 2009). Against the background of these targets,a compound annual market growth rate of approximately 8.3%is expected. The market volume should grow up to 260% (ofthe 2008 data), and the primary energy consumption frombiomass should be more than doubled until 2020.Consequently, also, the demand for biomass feedstocks is
increasing accordingly, and therefore, the number and diversityof different biomass sources applied in combustion systems will
also increase. Typical examples for fuels with remarkable futuremarket potentials are (i) fuels from short-rotation forestry (e.g.,poplar and willow), (ii) agricultural biomass fuels (Miscanthus,grasses, and maize cobs), (iii) residues from food productionand agricultural industries, (iv) residues from new biomassconversion technologies, and (v) second-generation biomassfuels (e.g., torrefied biomass, pyrolysis char, and hydrolyticlignin).Generally, most of these “new” biomass fuels are not yet
well-explored regarding their combustion-related properties.Therefore, the development of new and advanced fuelcharacterization tools is presently gaining rising relevance,and related research and development (R&D) already showsthe first promising results. These novel characterizationmethods cover special fuel indices for biomass fuels,combustion tests in specially designed lab-scale reactorsequipped with innovative measurement equipment, and thededicated application of high-temperature equilibrium calcu-lations. Moreover, they provide basic input data for theapplication of new computational fluid dynamics (CFD)models for detailed NOx and aerosol formation simulations,which can be applied for plant design. To evaluate and validatethese new methods, a comparison to measurement data fromreal-scale plants is of great relevance.
Received: March 29, 2013Revised: January 22, 2014Published: January 23, 2014
Article
pubs.acs.org/EF
© 2014 American Chemical Society 1041 dx.doi.org/10.1021/ef402249x | Energy Fuels 2014, 28, 1041−1052

Because most of the new biomass fuels mentioned above aresuspected and already known to be rather difficult incombustion processes, also, comprehensive R&D workregarding fuel blending as well as the utilization of additivesto influence relevant combustion-related fuel properties isongoing.5−8 The reduction of the release of inorganic elements,especially K, from the fuel to the gas phase during combustionas well as influencing the ash-melting behavior are the mainaims of this research. In this respect, the new and advancedcharacterization tools mentioned above can also be applied as abasis for a better understanding and evaluation of the effects offuel blending and additive utilization on the fuel properties.Moreover, R&D trends concerning biomass combustion
technologies focus on next-generation systems with ultralowemissions and increased efficiencies. In addition, CFD modeldevelopment for overall biomass combustion plants, includingemission formation and ash-related problems, is ongoing.Especially for these models, advanced combustion-related fuelcharacterization data, such as the release of NOx precursors aswell as aerosol-forming species from the fuel to the gas phase,represent essential input data. An enhanced fuel character-ization, therefore, also supports these R&D trends considerably.Traditional fuel characterization methods are mainly based
on the evaluation of ultimate and proximate fuel analyses aswell as thermogravimetric methods. Plant design is often basedon the experience of the manufacturers with comparable fuelsand not on a scientifically developed fuel evaluation-relateddesign strategy. Especially for new biomass fuels with ratherunknown behavior regarding the formation of NOx, HCl, SOx,and particulate emissions as well as deposit formation, slagging,and corrosion, this strategy may fail. This may lead to notoptimally designed flue-gas-cleaning measures causing in-creased operation costs as well as increased ash-relatedproblems, which reduce the availability of the plants and mayalso result in reconstructions.Against this background, this paper aims at the presentation
and discussion of a target-oriented application strategy fornovel fuel characterization methods, taking the combustion ofstraw in fixed-bed systems as an example. It should bedemonstrated how these new methods with their differentinformation depths can be applied and combined to gainestimations and predictions of the ash-melting behavior,
aerosol, SOx, HCl, and NOx emission formation as well ashigh-temperature corrosion risks. This evaluation of combus-tion-related fuel properties can subsequently support thepreliminary design of an appropriate combustion plant.Moreover, the utilization of data gained (e.g., release profiles)in CFD simulation models can additionally support the detailedfurnace and boiler design phase.Because most of the fuel characterization tools applied have
been developed for fixed-bed combustion systems, the casestudy is also restricted to this combustion technology.However, the general approach presented may, in principle,also be applied for fluidized-bed combustion systems. However,because of the different time−temperature profile of the fluegas in a fluidized-bed combustion plant, the different bedbehavior, and the influence of the bed material on ashformation, the indices as well as the lab-scale reactor design willhave to be adapted.
2. EXPERIMENTAL SECTIONWithin this paper, a strategy for the application of novel and advancedfuel characterization tools for combustion-related fuel characterizationis presented. In Figure 1, an overview is given. The diagram shows thedifferent characterization tools presented and discussed in thefollowing, the kind of information that can be gained from eachspecific tool as well as proposals of how this information can be usedwithin the fuel characterization strategy presented for practicalapplications, such as preliminary plant design. In the following, first,the methods applied within the different characterization tools aredescribed, and then their application is discussed by means of thecharacterization of wheat straw as a case study.
2.1. Wet Chemical Fuel Analyses. Wet chemical fuel analysesalways represent the first step of fuel characterization. They providethe basic data for all subsequent methods, and therefore, only well-proven fuel analysis methods should be applied. It is stronglyrecommended to generally follow the best practice guidelines workedout within the EU project BIONORM9,10 and subsequentlyimplemented in various European Committee for Standardization(CEN) standards for biomass fuels. In the following, the methodsapplied for the analyses presented in this paper are listed and relevantissues are highlighted.
2.1.1. Moisture Content. The moisture content of fuel samples hasbeen determined according to EN 14774-1 (2009) (determination ofthe weight loss during drying at 105 °C until a constant weight isreached).
Figure 1. Strategy for the application of fuel characterization tools and their application: overview.
Energy & Fuels Article
dx.doi.org/10.1021/ef402249x | Energy Fuels 2014, 28, 1041−10521042

2.1.2. Fuel Sampling and Fuel Sample Preparation. It is ofrelevance that a representative fuel sample is analyzed. This isespecially crucial if agricultural fuels are investigated, where the sharesof, e.g., stems and leaves can vary substantially. Therefore, samplinghas been performed according to EN 14778 (2011 06). Samplepreparation has been carried out according to EN 14780 (2011 06):the samples are homogenized and milled in a cutting mill to a particlesize of <4 mm. Then, the sample size is reduced and milled in anultracentrifugal mill equipped with a titanium rotor and screen to aparticle size of <0.2 mm to obtain the analysis sample.2.1.3. Determination of the Ash Content. The ash content is
determined according to EN 14775 (2009 11) by determination of theloss of ignition at 550 °C. With this method, it has to be taken intoaccount that especially Ca-rich fuels form considerable amounts ofcarbonates at the proposed treatment temperature. In real-scaleapplications, on the other side, almost no carbonates and preferablyoxides are formed because of the significantly higher processtemperatures. Consequently, the ash content is overestimated incomparison to the amount of ashes formed in a real process.Therefore, in deviation from EN 14775 (2009 11), it is recommendedto determine the inorganic carbon content of the ashed fuel sampleadditionally and to correct the ash content by subtracting CO2 boundin carbonates to gain an ash content that is based on oxide formation.2.1.4. Determination of C, H, N, and Cl Contents. The
determination of C, H, and N contents of biomass fuels is carriedout according to EN 15104 (2011 02) by combustion and subsequentgas-phase chromatographical separation and measurement in anelemental analyzer. The determination of Cl is performed accordingto EN 15289 (2011 02), applying a digestion step based on bombcombustion in oxygen and absorption in NaOH (0.05 M), followed byion chromatography measurements.2.1.5. Determination of Major and Minor Ash-Forming Elements
and S. It is recommended to perform these analyses by digesting thefuel and not by analyzing ashed fuel samples to minimize losses duringpretreatment. Following this approach, multi-step pressurizeddigestion of the fuel with HNO3 (65%)/HF (40%)/H3BO3, followedby measurement by inductively coupled plasma−optical emissionspectroscopy (ICP−OES) or inductively coupled plasma−massemission spectroscopy (ICP−MS), is performed. The digestionmethod is of great importance to ensure a complete dissolution ofthe ash matrix, which is a basic requirement for correct elementdetection.2.1.6. Determination of the Ash-Melting Behavior. The
determination of the ash-melting behavior has been performedaccording to CEN/TS 15370-1. The fuel samples are ashed at atemperature of 550 °C, and the remaining ash is pressed intocylindrical molds. These samples are then heated in an oven underoxidizing conditions, and characteristic melting temperatures (shrink-age starting temperature, deformation temperature, hemispheretemperature, and flow temperature) are determined. This method ofcourse is questionable because it does not take the fractionation ofelements in the different ash fractions occurring in a real combustionprocess into account. However, it provides good indications, andbecause there is no better standard method presently available, mostdata sets available rely on this method.2.2. Fuel Indices. Fuel indices are calculated from the biomass fuel
analysis data. Thereby, the physical behavior, chemical reactionpathways, and interactions between different elements and groups ofelements during combustion are taken into account. In recent years,some groups have developed different fuel indices, especially for theprediction of corrosion-related risks as well as the slagging behavior ofbiomass fuels.11−15 The sum of K, Na, Zn, and Pb, which are the mostrelevant aerosol-forming species in biomass combustion, for instance,can be used to estimate the potential for aerosol formation.15
Moreover, the molar 2S/Cl ratio has been proven as an appropriateindex to assess the risk for high-temperature Cl corrosion.11,15 Themolar ratio of (K + Na)/(2S + Cl) has been reported to be a usefulindex for the evaluation of gaseous HCl and SOx emissions, becauseduring biomass combustion, S and Cl are preferably bound by alkalinemetals.12 In ref 15, this index has been further developed to (K + Na)/
[x(2S + Cl)], where the newly introduced parameter x allows for aconsideration of the differing release ratios of S, Cl, K, and Na fromthe fuel to the gas phase during combustion. Finally, the molar ratio ofSi/(Ca + Mg) can provide information about slagging tendencies.14 Inref 15, this index has been modified to (Si + K + P)/(Ca + Mg), whichled to an increased prediction preciseness. Besides literature data,correlations and experiences gained from pilot- and real-scalecombustion tests have been used to validate the fuel indicesmentioned. More detailed information concerning fuel indices forbiomass fuels as well as their evaluation is provided in ref 15.
The fuel indices mentioned above are designed to provide firstindications regarding relevant combustion-related properties ofbiomass fuels. However, the results of these evaluations must beregarded as qualitative and not quantitative.
2.3. Lab-Scale Reactor Tests. At the Institute for Process andParticle Engineering, Graz University of Technology, a special lab-scalereactor for the investigation of the combustion behavior of biomassfuels in packed beds has been developed. This lab-scale reactorconsists of a cylindrical electrically heated retort made of siliconcarbide. The fuel (100−400 g depending upon the fuel density) is putin a cylindrical sample holder, which is placed on a balance andinserted into the preheated reactor. Preheating is usually set to 450 °Cin the lower part (which surrounds the sample holder) and 750 °C inthe upper part (above the sample holder). Combustion air andreaction gas are then injected through the fuel bed. During fueldecomposition, the sample mass loss and the temperatures in andabove the fuel bed are recorded online. Moreover, downstream of thereactor, the composition of the flue gases produced is measured usinganalysers based on Fourier transform infrared (FTIR) spectroscopy(Ansyco, CO2, H2O, CO, CH4, NO, NH3, HCN, NO2, N2O, and basichydrocarbons), paramagnetism (Emerson NGA 2000, O2), non-dispersive infrared (NDIR) analysis (Emerson NGA 2000, CO2 andCO), heat conductivity (Emerson NGA 2000, H2), flame ionizationdetection (FID) (Bernath Atomic 3005, OGC), and chemilumines-cence detection (CLD) (ECO Physics CLD 700 EL ht, NO and NOx).A more detailed description of the reactor setup is provided in ref 16.
For the performance of tests with this reactor, the fuel is first driedto a moisture content of about 10 wt %, wet basis. Then, it is placed inthe sample holder and inserted into the preheated reactor, and acombustion air flow of typically 30 L/min (at 20 °C) is initiated, whichis kept constant during the whole test run. First, a drying phaseprevails, during which the fuel temperature slowly increases and themoisture is released. After this phase, a rapid heating of the upper fuellayer (about 1000 K/min) accompanied by volatile release underreducing conditions takes place. With increasing test run duration, thisreaction front moves downward in the fuel bed. After the release ofvolatiles, char coal combustion takes place (hyperstoichiometricconditions prevail).
When the mass decrease of the fuel, the temperatures at differentpositions in the fuel bed and the concentrations of the main flue gasspecies and N species are continuously measured, comprehensiveinformation about the thermal decomposition process, and the releaseof NOx precursors can be gained. Moreover, when the fuel and theresidual ash are analyzed, information about the release of ash-formingelements can be achieved. Test runs with this reactor also provide firstindications regarding the slagging behavior of a fuel (by visualobservation).
Because the sample is introduced into the preheated reactor, rapidheating conditions, which are well-comparable to the heating in realcombustion/gasification processes, can be achieved. The arrangementof the heating elements and the air/gas flow through the fuel bedprovides that, under the consideration that the fuel transport along thegrate can be compared to a plug flow, the time-dependent results ofthe lab-scale reactor can be correlated to the local burning conditionson a grate, i.e., drying phase, pyrolysis/gasification, and charcoalburnout. Consequently, the utilization of the results gained isrestricted to fixed-bed systems and cannot be directly applied tofluidized-bed systems. It should also be mentioned that other groupshave already applied different reactor setups, such as single-particle orwire-mesh reactors, for the investigation of the release of inorganic
Energy & Fuels Article
dx.doi.org/10.1021/ef402249x | Energy Fuels 2014, 28, 1041−10521043

elements and NOx formation-related issues.17,18 In principle, also,results from these studies may be implemented into the strategypresented.2.4. Thermodynamic Equilibrium Calculations (TECs). TECs
can be applied for the prediction of multi-phase equilibria and theidentification and quantification of the liquid and solid phases ofinterest for a multi-component thermodynamic system in apredetermined gas atmosphere. In several previous studies, TECshave been successfully used for the prediction of different coal andbiomass ash properties.19−22 Therefore, TECs provide the possibilityto investigate the release behavior of inorganic compounds as well asthe ash-melting behavior in biomass combustion/gasification processesunder the assumption that chemical equilibrium can be achieved forthe system investigated. With regard to TEC studies presented in thispaper, the thermochemical software package FactSage 6.2 has beenapplied. This package consists of a series of calculation modules as wellas databases and uses the image component method in Gibbs freeenergy minimization concerning thermodynamic equilibrium. Thecurrently accessed databases are “solution databases” containing theoptimized parameters for a wide range of solution phases and “purecompound” databases containing the data for over 4500 stoichiometriccompounds. For the work presented, the component database Fact 53as well as the solution databases FToxid (slags and other oxidemixtures) and FTsalt (liquid and solid salt phases) have been applied.More than 1000 components and nine solutions (which have beenshown to be stable and thermodynamically relevant) were considered;the selection has been performed application-oriented for biomassfuels and ashes. More detailed information on the model applied isgiven in ref 22.2.5. Online Corrosion Probe Measurements. The application
of online corrosion probes is well-known regarding the investigation ofcorrosion processes in coal and waste combustion.23,24 Recentlyperformed R&D and further development of the probes have madethis technology also applicable for biomass combustion processes,where in comparison to, e.g., waste combustion, rather low corrosionrates occur.25 Therefore, online corrosion probes can now also beapplied in lab- and real-scale reactors to investigate corrosionpotentials of different biomass fuels.In the studies from which the data presented in this paper are taken,
a corrosion probe manufactured by the German company Corrmoranhas been applied. The system is designed to simulate a superheatertube in the flue gas of a combustion system. A temperature-controlledair-cooled sensor is placed on the top of a water-cooled carrier lance.When exposed to the flue gas, a layer consisting of deposits andcorrosion products is formed on the sensor surface. This layerrepresents an electrolyte and allows for the measurement of thecorrosion rate. The system is based on the measurement of a linearpolarization resistance. After completion of the measurement, theprobe rings themselves can be investigated by scanning electronmicroscopy (SEM)/energy-dispersive X-ray (EDX) analysis toevaluate the structure and chemical composition of the corrosionfront in the deposit layer. A more detailed description of this probe, itsapplication, and the evaluation of measurement results is provided inrefs 26 and 27.2.6. Real-Scale Test Runs. To validate the fuel characterization
methods presented, results from real-scale test runs are needed. In thispaper, several results from combustion tests at grate-fired combustionplants in the fuel capacity range between 200 and 100 000 kWNCV arepresented. These test runs have been performed by BIOSBIOENERGIESYSTEME GmbH, the Institute for Process andParticle Engineering, Graz University of Technology, and BIOEN-ERGY 2020+ GmbH, all located in Graz, Austria.All test runs were designed in a way that, besides gaseous and
particulate emission measurements and also mass, energy, and elementbalances (regarding relevant ash-forming elements), could beperformed. Only data from elements that showed a reasonable closureof the element balances have been used for the evaluations. Recoveryrates between 70 and 130% have therefore been used as a criterion thatis in a reasonable range when taking measurement and analysis errorranges, the inhomogeneity of the fuel, and ash losses by furnace and
boiler depositions into account. Moreover, it must be mentioned that,during all tests, stable representative combustion conditions (withrespect to load, furnace temperatures, excess air ratios, and air-stagingsettings) prevailed, which is also an important basic prerequisite togain representative data.
3. APPLICATION OF ADVANCED FUELCHARACTERIZATION TOOLS FOR WHEAT STRAW:AN EXEMPLARY CASE STUDY
In this section, the strategy regarding the application ofadvanced fuel characterization methods for preliminary plantdesign is presented, taking wheat straw as a case study. Thestrategy can generally be structured into two main steps. Thefirst step covers the evaluation of wet chemical fuel analyses aswell as fuel indices. From these evaluations, a generalcategorization of a biomass fuel as well as first indicationsregarding combustion-related issues, such as HCl, SOx, NOx,and particulate emissions, ash-melting properties, and corrosionrisks, can be gained. The second step demands for further tests(lab-scale reactor tests) as well as thermodynamic equilibriumcalculations. By applying these tools, deeper insight regardingthe parameters mentioned above can be gained and moreprecise predictions can be made, which can also be applied forplant design.
3.1. Wet Chemical Fuel Analyses. In Table 1, thechemical composition of the straw sample investigated is
summarized and compared to database values for wheat strawgained from the IEA Task 32 biomass fuel database28 as well asfrom the internal database of BIOS BIOENERGIESYSTEMEGmbH.As a first step within a comprehensive fuel evaluation, it
should be checked whether the fuel composition generally
Table 1. Chemical Composition of the Straw Investigatedand Comparison to Database Valuesa
straw database values
wheatstraw mean s number
ash content wt % 5.2 6.6 1.47 19ash content corrected wt % 4.7 naC wt % 46.6 44.9 2.7 15H wt % 5.9 5.6 0.36 15N wt % 0.53 0.58 0.16 15S mg/kg 1000 1485 527 19Cl mg/kg 1900 3046 1859 19Si mg/kg 12400 17618 4917 19Ca mg/kg 3930 3785 1614 19Mg mg/kg 787 945 662 19K mg/kg 9010 6629 4149 19Na mg/kg 126 282 228 19P mg/kg 857 442.0 148.2 19Al mg/kg 42.8 237.9 244.9 18Fe mg/kg 74.7 250.3 205.5 18Mn mg/kg 22.1 16.0 6.2 5Cu mg/kg 2.1 naZn mg/kg 5.6 9.9 3.4 6Pb mg/kg 0.17 0.32 0.20 6aData were on dry basis. Database values were taken from ref 28 andthe internal fuel database of BIOS BIOENERGIESYSTEME GmbH.Ash content corrected, ash content without total inorganic carbon(TIC); s, standard deviation; and na, no data available.
Energy & Fuels Article
dx.doi.org/10.1021/ef402249x | Energy Fuels 2014, 28, 1041−10521044

complies with the typical ranges of element concentrations of acertain fuel category (if such data are available). For the actualexample, this is the case for all elements, except P (above therange of the database values). In general, the straw investigatedcan be categorized as a typical wheat straw.Table 1 also shows that straw fuels typically are comparably
rich in ash, N, S, and Cl as well as K and Si, while the heavymetal contents are rather low (in comparison to wood fuels).Consequently, gaseous NOx, SOx, and HCl emissions, fineparticulate emissions (because of the high K and ash contents),corrosion (because of the high Cl content), and ash melting(because of the high Si and K contents) might be issues thatdemand more detailed investigations.3.2. Evaluation of Fuel Indices. The evaluation of fuel
indices can provide first important indications regardingcombustion-related issues. The big advantage of a fuel-index-based evaluation is that, besides the fuel analyses, no additionaltests are needed, and therefore, a quick first estimation ofcombustion-related fuel properties can be achieved. In Table 2,
relevant fuel indices, which have been calculated on the basis ofthe analyses listed in Table 1, are presented. In Figure 2,database values for the fuel indices mentioned in Table 2 forthe biomass fuel categories, wood chips, bark, straw, and wastewood, are compared. Detailed information regarding thedefinition and calculation of fuel indices can be taken fromref 15.The fuel index K + Na + Zn + Pb indicates the potential for
the formation of fine particulate emissions. Figure 2 shows thatthis potential generally increases from chemically untreatedwood fuels over bark and waste wood to straw fuels. Increasedparticulate emissions typically also result in enhanced depositformation tendencies. A more detailed discussion is given insection 3.4.The molar ratio of (K + Na)/x(2S + Cl) is an indicator to
which extent S and Cl will be embedded in the ashes and, thus,concerning HCl and SOx emissions. In this index, the factor xconsiders the different average release ratios of K, Na, S, and Clfrom the fuel to the gas phase. Lower values of this indexindicate rising HCl and SOx emissions. More detailedinformation concerning this index is provided in section 3.6.The molar ratio of 2S/Cl is used as an indicator for high-
temperature corrosion risks. With decreasing values, corrosionrisks increase, from chemically untreated wood chips over barkand waste wood to straw. Straw shows high risks for high-temperature chlorine corrosion (see also section 3.5).Finally, the molar ratio of (Si + P + K)/(Ca + Mg) can be
used as an indicator for ash-melting properties. Increasingvalues mean decreasing ash-melting temperatures. As a rule ofthumb, the shrinkage-starting temperature drops below 1200°C at values above 1. Figure 2 clearly shows decreasing ash-melting temperatures from wood chips over bark and wastewood to straw. For straw, very low ash-melting temperaturescan be expected; for more details, also see section 3.3.
In summary, the pre-evaluation of the straw sampleinvestigated shows that, when burning this fuel, special carehas to be taken regarding fine particulate emissions and depositformation, high-temperature corrosion, and low ash-meltingtemperatures. For all of these parameters, the fuel sampleinvestigated shows disadvantageous properties compared toconventional chemically untreated wood fuels and bark. This
Table 2. Fuel Indices of the Straw Sample Investigateda
wheat straw
K + Na + Zn + Pb mg/kg, db 91422S/Cl mol/mol 1.16(K + Na)/[x(2S + Cl)] mol/mol 0.45(Si + P + K)/(Ca + Mg) mol/mol 5.36
adb = dry basis.
Figure 2. Relevant fuel indices for the fuel categories, straw, woodchips, bark, and waste wood. Waste wood of the classes A1 and A2 isaccording to German regulations, and waste wood of the classes Q1−Q4 is according to Austrian regulations. db, dry basis; factor x, see alsosection 3.6.
Energy & Fuels Article
dx.doi.org/10.1021/ef402249x | Energy Fuels 2014, 28, 1041−10521045

basic information can, for instance, be used to support initialdecisions if a specific fuel could be of interest for a certainapplication or not. To gain more detailed information,additional evaluations and fuel characterization tools aspresented in the following sections can be applied.3.3. Evaluation of the Ash-Melting Behavior. Low ash-
melting temperatures can significantly affect the operation ofgrate combustion systems because ash melting on gratesdisturbs the combustion air flow through the fuel bed and canalso cause problems in the de-ashing system. Moreover,increased risks regarding the formation of hard deposits onfurnace walls and heat exchanger surfaces may occur.Therefore, knowledge about the ash-melting behavior is ofgreat relevance for the design and operation of biomasscombustion systems.As a first evaluation tool, as already mentioned, the fuel index
(Si + P + K)/(Ca + Mg) can be applied. In Figure 3, this indexis plotted against the shrinkage-starting temperature deter-mined with the standard ash-melting test according to CEN/TS15370-1. The correlation presented is statistically significant. Asalready mentioned, the high value of the index (5.36) for thestraw sample investigated is associated with a very lowshrinkage-starting temperature of about 850 °C. This is alsoconfirmed by the results of lab-scale reactor tests, which showconsiderable amounts of sintered and molten particles in theash residue.A deeper insight into the ash-melting behavior can be
achieved by the application of high-temperature TECs. InFigure 4, results from TECs based on the chemical compositionof an ashed straw sample (ashed at 550 °C) under oxidizingconditions are presented. In the figure, the phases resultingfrom TECs are summarized into three categories, i.e., solid
phases, solid solutions, and liquid solutions. Moreover, thetrend of the share of the liquid solutions on the total ash overtime is indicated as the molten fraction. T15, T30, and T70
indicate characteristic temperatures at which 15, 30, and 70 wt% of the molten fraction occur, respectively. T30 (770 °C) canbe used as an indicator for the shrinkage-starting temperature.A good agreement with the standard ash-melting test isachieved (850 °C). Moreover, the T70 temperature calculated(1150 °C) is a good indicator for the fluid temperature (1160°C). Furthermore, additional valuable information can begained from TECs. The diagram in Figure 4, for instance,shows that the share of molten phases on the whole ash rapidlyincreases between 750 and 800 °C, which underlines the needfor an efficient temperature control of the fuel bed to avoidsevere ash-melting problems. Moreover, from detailed analysesof the compositions of the molten phases, trends regarding theinfluence of deviations of the fuel composition on the ash-melting behavior can be derived (also see section 3.7). Finally,TECs allow for the evaluation of ash-melting trends fordifferent ash fractions, which makes this method even moreattractive.
3.4. Fine Particulate Emissions and Release of Ash-Forming Elements from the Fuel to the Gas Phase. Insection 3.2, the fuel index K + Na + Zn + Pb has beenintroduced as an indicator regarding the potential for theformation of fine particulate emissions and the potential fordeposit buildup. Figure 5 clearly shows a trend of increasingaerosol emissions with increasing values of this index, whereasstraw is located at the upper end of the data. However, the errorbars are remarkably high, and therefore, a more preciseprediction tool would be of advantage. The trend displayed ismainly influenced by the K concentration in the fuel or, more
Figure 3. Shrinkage-starting temperature (SST) versus the molar ratio of (Si + P + K)/(Ca + Mg) and a picture of sintered ash particles from lab-reactor test runs with straw pellets. Straw is marked with a red cycle.
Figure 4. Ash-melting behavior of straw determined by TECs. Characteristic ash-melting temperatures are according to CEN/TS 15370-1. db, drybasis; TEC, thermodynamic equilibrium calculation; and temp, temperature.
Energy & Fuels Article
dx.doi.org/10.1021/ef402249x | Energy Fuels 2014, 28, 1041−10521046

precisely, the K release from the fuel to the gas phase, andtherefore, various attempts have been made to gain a universalfuel index that is able to describe the K release as a function of,for instance, the Si/K ratio. However, thus far, no satisfactorilygood predictions could be achieved.Therefore, other advanced fuel characterization methods
have to be applied to gain more detailed information on thepotential for aerosol formation. Two feasible options are theperformance of TECs and the performance of lab-scale reactortests. In Figure 6, results regarding the release of relevant ash-
forming elements (K, Na, Zn, S, and Cl) achieved with thesetwo methods are presented. The results from TECs presentedhave been achieved by calculations for reducing conditions(gasification mode) and oxidizing conditions because theyprevail at different sections of a biomass grate. Obviously, agood agreement for K, Na, S, and Cl could be achieved. For Zn,the gas atmosphere prevailing has a dominating influence onthe release behavior, and the comparison of TEC and lab-scalereactor results indicate that Zn release takes place partly under
reducing and oxidizing conditions. However, it has to bementioned that, with the models presently available, goodagreement for Si- and K-rich fuels is achieved, while the modelstill needs some improvements for an application to wood fuelsregarding the K release.Assuming that K and Na form sulfates and chlorides and Zn
forms ZnO, a maximum potential for aerosol emissions ofabout 300 mg/Nm3 (related to dry flue gas and 13 vol % O2)can be calculated from the data presented in Figure 6. Thismaximum potential does not consider particle losses as a resultof deposit formation on heat exchanger tubes because of directcondensation and thermophoresis, which are expected toamount to 10−20 wt %. However, these data are in goodagreement with aerosol emissions of, on average, 323 mg/Nm3
(standard deviation of 74.6 mg/Nm3) measured downstreamfrom a large-scale boiler using straw with comparable chemicalcomposition.A possibility to also consider deposit formation in these
calculations can be provided by CFD simulations. Thereby, therelease data gained from TEC or lab-scale reactor tests are usedas input data for a specially developed CFD-based model. Themodel, which has been developed at BIOENERGY 2020+GmbH in cooperation with the Institute for Process andParticle Engineering, Graz University of Technology, considersthermodynamic equilibrium of ash-forming species, particleformation and growth mechanisms, such as nucleation andcondensation, a special kinetic approach for SO3 formation, anddifferent mechanisms describing particle deposition on heatexchanger surfaces and furnace walls.29 The present version ofthis model thereby considers K, Na, S, and Cl as aerosol-forming elements, 220 gas species and 382 solid and liquidphases, and alkaline metal chlorides, sulfates, and carbonates aspossible aerosol-forming vapors. Results from simulationsperformed with this model for a small-scale residential biomassboiler fired with wood pellets showed PM1 emissions of 9.9mg/Nm3 (related to dry flue gas and 13 vol % O2).Measurements during test runs at the boiler simulated showedan average aerosol emission of 7.7 mg/Nm3, which indicates areasonably good agreement. The aerosols formed aredominated by K2SO4 and KCl.
3.5. High-Temperature Corrosion. As already mentionedin section 3.2, the molar ratio of 2S/Cl can be applied as anindicator for high-temperature corrosion risks. As Figure 6indicates, during straw combustion, more than 90% of S and Clare released from the fuel to the gas phase. Database valuesavailable show about the same release rates for S and Cl for agreat majority of other biomass fuels.15 Assuming comparabletime−temperature profiles in furnaces and boilers, which arerelevant for the sulfation of chlorides (mainly of KCl), adependency of the molar 2S/Cl ratio of the aerosol particlesformed and the fuel prevails. Moreover, deposits on boiler tubesurfaces tend to show compositions, which are well-comparableto the aerosol compositions. Consequently, the fuel index 2S/Cl directly affects the composition of the boiler tube depositsand, therefore, can be used to describe their potential for high-temperature corrosion. It can generally be stated that, for 2S/Clratios of more than 8, no significant corrosion risks exist.30
With decreasing values of the index, corrosion risks increase,and for values below 4, significant corrosion risks have to beexpected. In Figure 7, the molar 2S/Cl ratios of differentbiomass fuels are plotted against the same index related to theaerosol emissions, and moreover, the areas for high, medium,
Figure 5. PM1 emissions versus the concentration of aerosol-formingspecies (K + Na + Zn + Pb) in the fuel.
Figure 6. Inorganic element release during straw combustion: resultsfrom TEC and lab-scale reactor tests. TEC evaluations were performedfor the maximum fuel-bed temperature during the lab-scale reactor testof 1244 °C. TEC fuel red and TEC fuel ox, TECs performed based onthe fuel composition and oxidizing and reducing conditions,respectively.
Energy & Fuels Article
dx.doi.org/10.1021/ef402249x | Energy Fuels 2014, 28, 1041−10521047
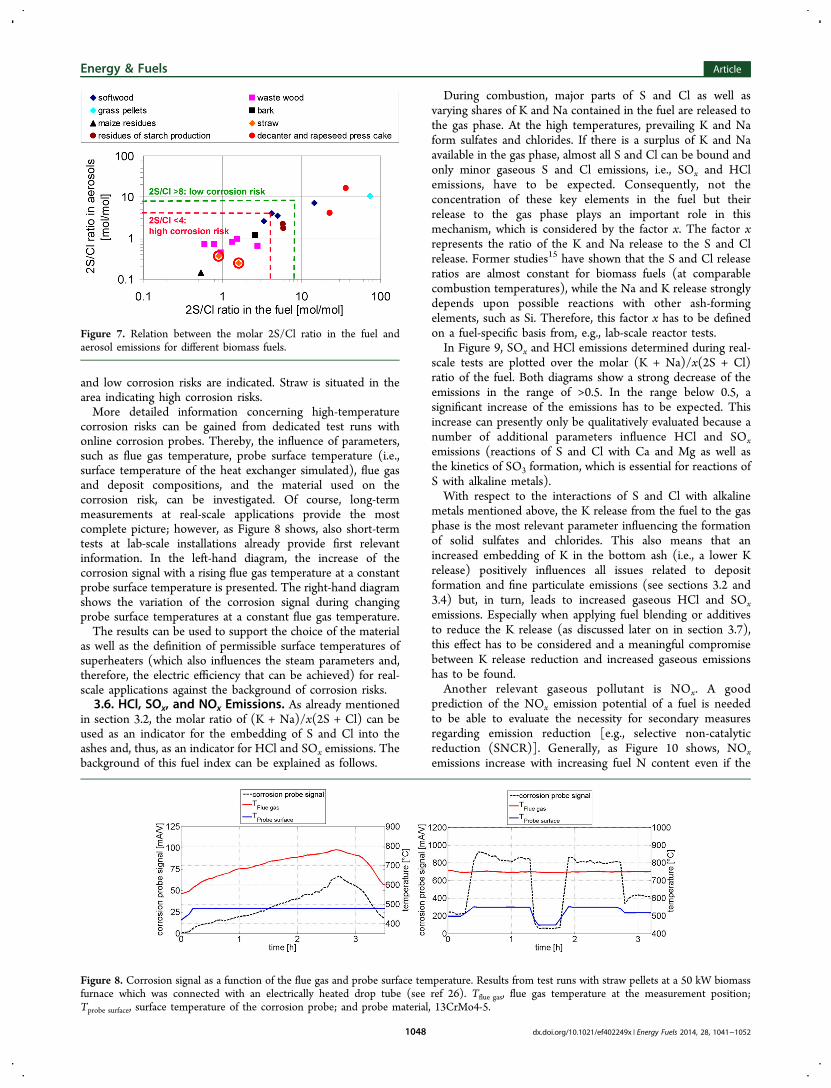
and low corrosion risks are indicated. Straw is situated in thearea indicating high corrosion risks.More detailed information concerning high-temperature
corrosion risks can be gained from dedicated test runs withonline corrosion probes. Thereby, the influence of parameters,such as flue gas temperature, probe surface temperature (i.e.,surface temperature of the heat exchanger simulated), flue gasand deposit compositions, and the material used on thecorrosion risk, can be investigated. Of course, long-termmeasurements at real-scale applications provide the mostcomplete picture; however, as Figure 8 shows, also short-termtests at lab-scale installations already provide first relevantinformation. In the left-hand diagram, the increase of thecorrosion signal with a rising flue gas temperature at a constantprobe surface temperature is presented. The right-hand diagramshows the variation of the corrosion signal during changingprobe surface temperatures at a constant flue gas temperature.The results can be used to support the choice of the material
as well as the definition of permissible surface temperatures ofsuperheaters (which also influences the steam parameters and,therefore, the electric efficiency that can be achieved) for real-scale applications against the background of corrosion risks.3.6. HCl, SOx, and NOx Emissions. As already mentioned
in section 3.2, the molar ratio of (K + Na)/x(2S + Cl) can beused as an indicator for the embedding of S and Cl into theashes and, thus, as an indicator for HCl and SOx emissions. Thebackground of this fuel index can be explained as follows.
During combustion, major parts of S and Cl as well asvarying shares of K and Na contained in the fuel are released tothe gas phase. At the high temperatures, prevailing K and Naform sulfates and chlorides. If there is a surplus of K and Naavailable in the gas phase, almost all S and Cl can be bound andonly minor gaseous S and Cl emissions, i.e., SOx and HClemissions, have to be expected. Consequently, not theconcentration of these key elements in the fuel but theirrelease to the gas phase plays an important role in thismechanism, which is considered by the factor x. The factor xrepresents the ratio of the K and Na release to the S and Clrelease. Former studies15 have shown that the S and Cl releaseratios are almost constant for biomass fuels (at comparablecombustion temperatures), while the Na and K release stronglydepends upon possible reactions with other ash-formingelements, such as Si. Therefore, this factor x has to be definedon a fuel-specific basis from, e.g., lab-scale reactor tests.In Figure 9, SOx and HCl emissions determined during real-
scale tests are plotted over the molar (K + Na)/x(2S + Cl)ratio of the fuel. Both diagrams show a strong decrease of theemissions in the range of >0.5. In the range below 0.5, asignificant increase of the emissions has to be expected. Thisincrease can presently only be qualitatively evaluated because anumber of additional parameters influence HCl and SOxemissions (reactions of S and Cl with Ca and Mg as well asthe kinetics of SO3 formation, which is essential for reactions ofS with alkaline metals).With respect to the interactions of S and Cl with alkaline
metals mentioned above, the K release from the fuel to the gasphase is the most relevant parameter influencing the formationof solid sulfates and chlorides. This also means that anincreased embedding of K in the bottom ash (i.e., a lower Krelease) positively influences all issues related to depositformation and fine particulate emissions (see sections 3.2 and3.4) but, in turn, leads to increased gaseous HCl and SOxemissions. Especially when applying fuel blending or additivesto reduce the K release (as discussed later on in section 3.7),this effect has to be considered and a meaningful compromisebetween K release reduction and increased gaseous emissionshas to be found.Another relevant gaseous pollutant is NOx. A good
prediction of the NOx emission potential of a fuel is neededto be able to evaluate the necessity for secondary measuresregarding emission reduction [e.g., selective non-catalyticreduction (SNCR)]. Generally, as Figure 10 shows, NOxemissions increase with increasing fuel N content even if the
Figure 7. Relation between the molar 2S/Cl ratio in the fuel andaerosol emissions for different biomass fuels.
Figure 8. Corrosion signal as a function of the flue gas and probe surface temperature. Results from test runs with straw pellets at a 50 kW biomassfurnace which was connected with an electrically heated drop tube (see ref 26). Tflue gas, flue gas temperature at the measurement position;Tprobe surface, surface temperature of the corrosion probe; and probe material, 13CrMo4-5.
Energy & Fuels Article
dx.doi.org/10.1021/ef402249x | Energy Fuels 2014, 28, 1041−10521048

conversion of fuel N to NOx decreases. These graphs allow fora good approximation of the NOx emissions to be expected fora certain fuel, if grate combustion equipped with air staging isapplied. Air staging means that the stoichiometric air ratio inthe primary combustion zone is kept slightly below 1 and thatappropriate residence time (at least 0.5 s) of the flue gas in theprimary combustion zone at temperatures above 800 °C isachieved before secondary air injection takes place. Thepotential for NOx emission reduction by primary measures(air staging) is thereby in the range of 30−60%.31,32A deeper insight into NOx formation is achieved by lab-scale
reactor tests, which provide information about the release ofcertain NOx precursors during the combustion process. InFigure 11, the respective results of test runs with straw as well
as a comparison to results from test runs with softwood pelletsare presented. During straw combustion, NH3 is thedominating NOx precursor, while during wood combustion,HCN, NH3, and NO play a relevant role. The conversion of Nin the fuel to N in total fixed nitrogen (TFN) considerablydecreases with an increasing N content (which means thatmore fuel N is converted into N2).
Figure 9. SOx and HCl emissions versus the molar (K + Na)/x(2S +Cl) ratio. Results from test runs are at real-scale plants. Results forstraw combustion are marked.
Figure 10. NOx emissions and N conversion related to the N content of the fuel. Results from test runs are at real-scale plants equipped with air-staging technology. Results for straw combustion are marked. NOx is calculated as NO2.
Figure 11. Release of NOx precursors during straw and softwoodpellet combustion according to lab-scale test runs. TFN, total fixednitrogen (species NO, NH3, HCN, NO2, and N2O); xN, N content ofthe fuel (wt %, db).
Energy & Fuels Article
dx.doi.org/10.1021/ef402249x | Energy Fuels 2014, 28, 1041−10521049
This information about the release of NOx precursors canfurther be used as an input for CFD simulations of NOx
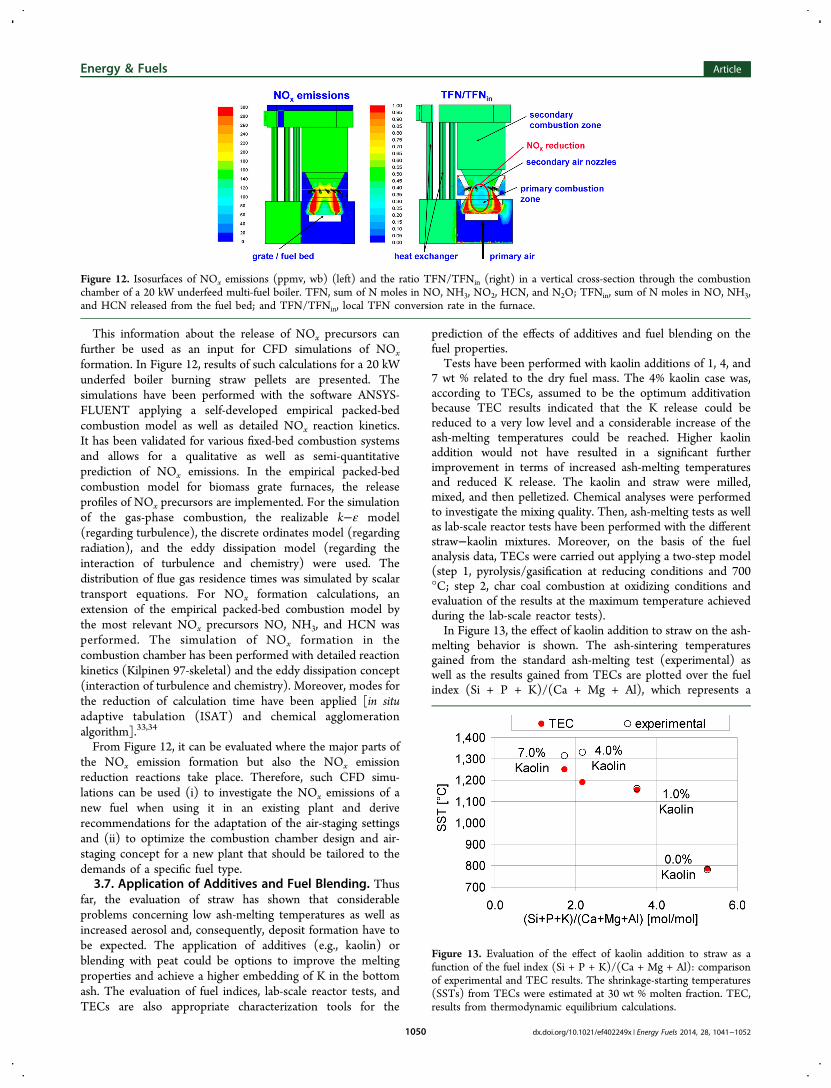
formation. In Figure 12, results of such calculations for a 20 kWunderfed boiler burning straw pellets are presented. Thesimulations have been performed with the software ANSYS-FLUENT applying a self-developed empirical packed-bedcombustion model as well as detailed NOx reaction kinetics.It has been validated for various fixed-bed combustion systemsand allows for a qualitative as well as semi-quantitativeprediction of NOx emissions. In the empirical packed-bedcombustion model for biomass grate furnaces, the releaseprofiles of NOx precursors are implemented. For the simulationof the gas-phase combustion, the realizable k−ε model(regarding turbulence), the discrete ordinates model (regardingradiation), and the eddy dissipation model (regarding theinteraction of turbulence and chemistry) were used. Thedistribution of flue gas residence times was simulated by scalartransport equations. For NOx formation calculations, anextension of the empirical packed-bed combustion model bythe most relevant NOx precursors NO, NH3, and HCN wasperformed. The simulation of NOx formation in thecombustion chamber has been performed with detailed reactionkinetics (Kilpinen 97-skeletal) and the eddy dissipation concept(interaction of turbulence and chemistry). Moreover, modes forthe reduction of calculation time have been applied [in situadaptive tabulation (ISAT) and chemical agglomerationalgorithm].33,34
From Figure 12, it can be evaluated where the major parts ofthe NOx emission formation but also the NOx emissionreduction reactions take place. Therefore, such CFD simu-lations can be used (i) to investigate the NOx emissions of anew fuel when using it in an existing plant and deriverecommendations for the adaptation of the air-staging settingsand (ii) to optimize the combustion chamber design and air-staging concept for a new plant that should be tailored to thedemands of a specific fuel type.3.7. Application of Additives and Fuel Blending. Thus
far, the evaluation of straw has shown that considerableproblems concerning low ash-melting temperatures as well asincreased aerosol and, consequently, deposit formation have tobe expected. The application of additives (e.g., kaolin) orblending with peat could be options to improve the meltingproperties and achieve a higher embedding of K in the bottomash. The evaluation of fuel indices, lab-scale reactor tests, andTECs are also appropriate characterization tools for the
prediction of the effects of additives and fuel blending on thefuel properties.Tests have been performed with kaolin additions of 1, 4, and
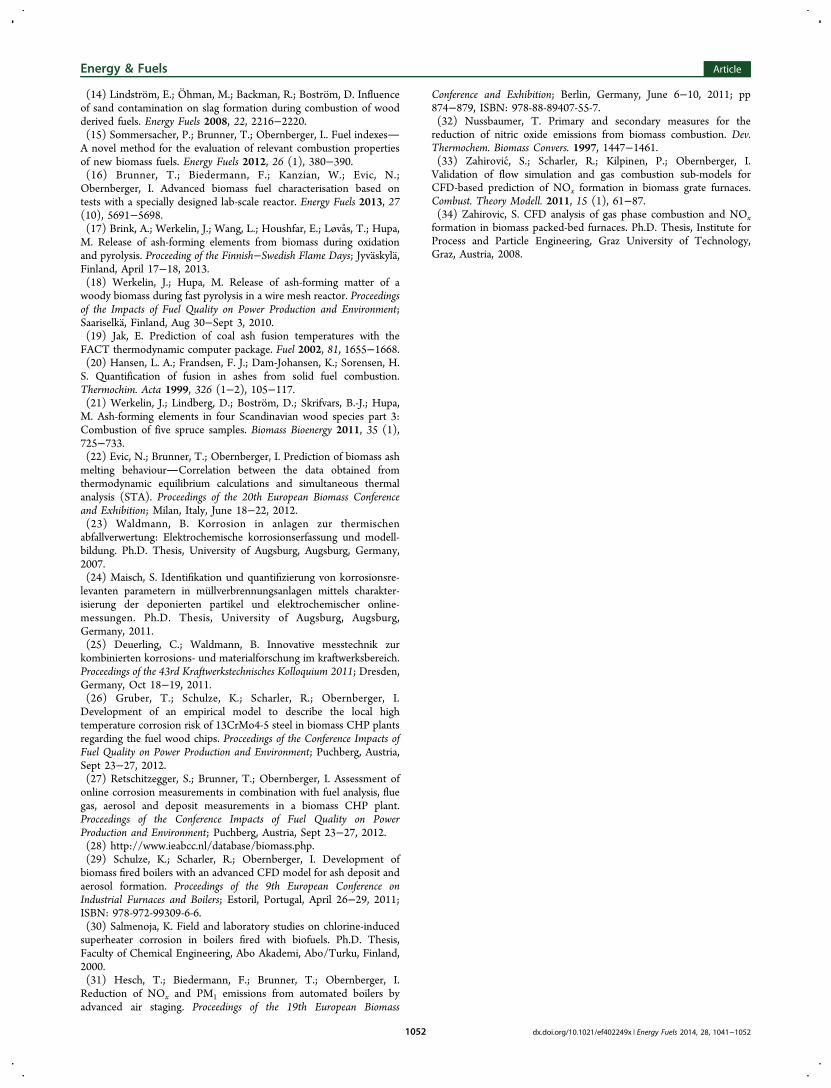
7 wt % related to the dry fuel mass. The 4% kaolin case was,according to TECs, assumed to be the optimum additivationbecause TEC results indicated that the K release could bereduced to a very low level and a considerable increase of theash-melting temperatures could be reached. Higher kaolinaddition would not have resulted in a significant furtherimprovement in terms of increased ash-melting temperaturesand reduced K release. The kaolin and straw were milled,mixed, and then pelletized. Chemical analyses were performedto investigate the mixing quality. Then, ash-melting tests as wellas lab-scale reactor tests have been performed with the differentstraw−kaolin mixtures. Moreover, on the basis of the fuelanalysis data, TECs were carried out applying a two-step model(step 1, pyrolysis/gasification at reducing conditions and 700°C; step 2, char coal combustion at oxidizing conditions andevaluation of the results at the maximum temperature achievedduring the lab-scale reactor tests).In Figure 13, the effect of kaolin addition to straw on the ash-
melting behavior is shown. The ash-sintering temperaturesgained from the standard ash-melting test (experimental) aswell as the results gained from TECs are plotted over the fuelindex (Si + P + K)/(Ca + Mg + Al), which represents a
Figure 12. Isosurfaces of NOx emissions (ppmv, wb) (left) and the ratio TFN/TFNin (right) in a vertical cross-section through the combustionchamber of a 20 kW underfeed multi-fuel boiler. TFN, sum of N moles in NO, NH3, NO2, HCN, and N2O; TFNin, sum of N moles in NO, NH3,and HCN released from the fuel bed; and TFN/TFNin, local TFN conversion rate in the furnace.
Figure 13. Evaluation of the effect of kaolin addition to straw as afunction of the fuel index (Si + P + K)/(Ca + Mg + Al): comparisonof experimental and TEC results. The shrinkage-starting temperatures(SSTs) from TECs were estimated at 30 wt % molten fraction. TEC,results from thermodynamic equilibrium calculations.
Energy & Fuels Article
dx.doi.org/10.1021/ef402249x | Energy Fuels 2014, 28, 1041−10521050

modification of the fuel index (Si + P + K)/(Ca + Mg) takingthe high Al content of kaolin into account. The diagram clearlyshows the increasing melting temperatures with increasingkaolin addition. Overall, the trend fits well with the datapresented in Figure 3. Moreover, a good agreement betweenTEC and experimental data exists.Figure 14 shows results regarding the K release gained from
TEC and lab-scale reactor test runs. The data nicely
demonstrate how kaolin addition can reduce the K releaseconsiderably. Again, a good agreement between lab-scalereactor tests and TECs exists. Concluding, for straw, theaddition of 4% kaolin can result in considerably reduced aerosoland deposit formation as well as an increase of the shrinkage-starting temperature by about 500 °C.
4. CONCLUSIONNew and advanced methods for biomass fuel characterizationare available, which are fuel indices, dedicated lab-scale reactortests, and TECs, specially adapted for biomass fuels and ashes.If appropriately applied and combined, they can providerelevant information regarding fuel application and plantdesign, with special focus on some of the most crucialcombustion-related issues, which are (i) the release of ash-forming species, (ii) fine particle formation and emissions, (iii)ash-melting behavior, (iv) expected NOx, SOx, and HClemissions, and (v) corrosion behavior prediction.Moreover, the new and advanced fuel characterization
methods can also be used as a basis for the evaluation of theeffects of additive utilization and fuel blending on the fuelcharacteristics, especially regarding ash-related problems.As the case study of straw shows, the results achievable with
these advanced fuel characterization tools are verifiable inpractice, and therefore, a fuel evaluation strategy based on thesetools can provide valuable information for preliminary plantdesign. Moreover, the integration of results concerning therelease of ash vapors and NOx precursors into CFD simulationroutines enables a detailed evaluation as well as prediction ofinfluencing parameters on aerosol and deposit formation as wellas NOx emissions, which can support the detailed design offurnaces and boilers.New biomass fuel databases considering the results of
advanced fuel characterization methods are under development.Additionally, R&D is ongoing regarding the further improve-
ment of these methods to enhance their prediction preciseness.In conclusion, the new fuel evaluation strategy presented can bea powerful tool in future plant design.
■ AUTHOR INFORMATIONCorresponding Author*Telephone: +43-316-48130012. Fax: +43-316-4813004. E-mail: [email protected] authors declare no competing financial interest.
■ ACKNOWLEDGMENTSThe author gratefully acknowledges the support of the FFG,Austrian Research Promotion Agency, within the ERANETBioenergy Project SciToBiCom (Scientific Tools for FuelCharacterization for Clean and Efficient Biomass Combustion;Project Number 825790) as well as the Austrian COMETProgramme, which is funded by the Republic of Austria as wellas the federal provinces of Styria, Lower Austria, andBurgenland.
■ REFERENCES(1) Furtner, H.; Haneder, K. BiomasseHeizungserhebung 2007, NOLandes-Landwirtschaftskammer; Abteilung Betriebswirtschaft undTechnik: St. Polten, Austria, 2008.(2) Kopetz, H.; et al. 34 Prozent Erneuerbare Machbar, Broschu re;Osterreichischer Biomasse-Verband: Vienna, Austria, 2008.(3) Obernberger, I.; Thek, G. Herstellung und Energetische Nutzungvon PelletsProduktionsprozess, Eigenschaften, Feuerungstechnik, Okolo-gie und Wirtschaftlichkeit; BIOS BIOENERGIESYSTEME GmbH:Graz, Austria, 2009; Vol. 5, Book Series “Thermal BiomassUtilization”, ISBN: 978-3-9501980-5-8.(4) Herynkova, H. The perspectives of the European heating market.Proceedings of the European Pellets Conference 2007; O.O. Energies-parverband: Linz, Austria, 2007.(5) Ohman, M.; Bostrom, D.; Nordin, A. Effect of kaolin andlimestone addition on slag formation during combustion of woodfuels. Energy Fuels 2004, 18, 1370−1376.(6) Xiong, S.; Burvall, J.; Orberg, H.; Kalen, G.; Thyrel, M.; Ohman,M.; Bostrom, D. Slagging characteristics during combustion of cornstovers with and without kaolin and calcite. Energy Fuels 2008, 22,3465−3470.(7) Bafver, L.; Ronnback, M.; Leckner, B.; Claesson, F.; Tullin, C.Particle emission from combustion of oat grain and its potentialreduction by addition of limestone or kaolin. Fuel Process. Technol.2009, 353−359.(8) Bostrom, D.; Grimm, A.; Boman, C.; Bjornbom, E.; Ohman, M.Influence of kaolin and calcite additives on ash transformations insmall-scale combustion of oat. Energy Fuels 2009, 23, 5184−5190.(9) Barnthaler, G.; Zischka, M.; Haroldson, C.; Obernberger, I.Determination of major and minor ash-forming elements in solidbiomass fuels. Biomass Bioenergy 2006, 30, 983−997.(10) Pre-normative Research on Solid Biofuels for Improved EuropeanStandards; Kaltschmitt, M., Ed.; European Commission DG Research:Brussels, Belgium, 2009; EU Project Number 038644 BIONORM II.(11) Salmenoja K. Field and laboratory studies on chlorine-inducedsuperheater corrosion in boilers fired with biofuels. Ph.D. Thesis,Faculty of Chemical Engineering, Abo Akademi, Abo/Turku, Finland,2000.(12) Visser, H. J. M. The Influence of Fuel Composition onAgglomeration Behaviour in Fluidised-Bed Combustion; Energy ResearchCentre of the Netherlands (ECN): Petten, Netherlands, 2004; ECN-C-04-054.(13) Gilbe, C.; Ohman, M.; Lindstrom, E.; Bostrom, D.; Backman,R.; Samuelsson, R.; Burval, J. Slagging characteristics during residentialcombustion of biomass pellets. Energy Fuels 2008, 22, 3536−3543.
Figure 14. Effect of kaolin addition on the K release. The TEC releaseis calculated at 1250 °C, which was the maximum fuel-bed temperatureduring the lab-scale reactor tests. LR, results from lab-scale reactortests; TEC, results from thermodynamic equilibrium calculations.
Energy & Fuels Article
dx.doi.org/10.1021/ef402249x | Energy Fuels 2014, 28, 1041−10521051
(14) Lindstrom, E.; Ohman, M.; Backman, R.; Bostrom, D. Influenceof sand contamination on slag formation during combustion of woodderived fuels. Energy Fuels 2008, 22, 2216−2220.(15) Sommersacher, P.; Brunner, T.; Obernberger, I.. Fuel indexesA novel method for the evaluation of relevant combustion propertiesof new biomass fuels. Energy Fuels 2012, 26 (1), 380−390.(16) Brunner, T.; Biedermann, F.; Kanzian, W.; Evic, N.;Obernberger, I. Advanced biomass fuel characterisation based ontests with a specially designed lab-scale reactor. Energy Fuels 2013, 27(10), 5691−5698.(17) Brink, A.; Werkelin, J.; Wang, L.; Houshfar, E.; Løvas, T.; Hupa,M. Release of ash-forming elements from biomass during oxidationand pyrolysis. Proceeding of the Finnish−Swedish Flame Days; Jyvaskyla,Finland, April 17−18, 2013.(18) Werkelin, J.; Hupa, M. Release of ash-forming matter of awoody biomass during fast pyrolysis in a wire mesh reactor. Proceedingsof the Impacts of Fuel Quality on Power Production and Environment;Saariselka, Finland, Aug 30−Sept 3, 2010.(19) Jak, E. Prediction of coal ash fusion temperatures with theFACT thermodynamic computer package. Fuel 2002, 81, 1655−1668.(20) Hansen, L. A.; Frandsen, F. J.; Dam-Johansen, K.; Sorensen, H.S. Quantification of fusion in ashes from solid fuel combustion.Thermochim. Acta 1999, 326 (1−2), 105−117.(21) Werkelin, J.; Lindberg, D.; Bostrom, D.; Skrifvars, B.-J.; Hupa,M. Ash-forming elements in four Scandinavian wood species part 3:Combustion of five spruce samples. Biomass Bioenergy 2011, 35 (1),725−733.(22) Evic, N.; Brunner, T.; Obernberger, I. Prediction of biomass ashmelting behaviourCorrelation between the data obtained fromthermodynamic equilibrium calculations and simultaneous thermalanalysis (STA). Proceedings of the 20th European Biomass Conferenceand Exhibition; Milan, Italy, June 18−22, 2012.(23) Waldmann, B. Korrosion in anlagen zur thermischenabfallverwertung: Elektrochemische korrosionserfassung und modell-bildung. Ph.D. Thesis, University of Augsburg, Augsburg, Germany,2007.(24) Maisch, S. Identifikation und quantifizierung von korrosionsre-levanten parametern in mullverbrennungsanlagen mittels charakter-isierung der deponierten partikel und elektrochemischer online-messungen. Ph.D. Thesis, University of Augsburg, Augsburg,Germany, 2011.(25) Deuerling, C.; Waldmann, B. Innovative messtechnik zurkombinierten korrosions- und materialforschung im kraftwerksbereich.Proceedings of the 43rd Kraftwerkstechnisches Kolloquium 2011; Dresden,Germany, Oct 18−19, 2011.(26) Gruber, T.; Schulze, K.; Scharler, R.; Obernberger, I.Development of an empirical model to describe the local hightemperature corrosion risk of 13CrMo4-5 steel in biomass CHP plantsregarding the fuel wood chips. Proceedings of the Conference Impacts ofFuel Quality on Power Production and Environment; Puchberg, Austria,Sept 23−27, 2012.(27) Retschitzegger, S.; Brunner, T.; Obernberger, I. Assessment ofonline corrosion measurements in combination with fuel analysis, fluegas, aerosol and deposit measurements in a biomass CHP plant.Proceedings of the Conference Impacts of Fuel Quality on PowerProduction and Environment; Puchberg, Austria, Sept 23−27, 2012.(28) http://www.ieabcc.nl/database/biomass.php.(29) Schulze, K.; Scharler, R.; Obernberger, I. Development ofbiomass fired boilers with an advanced CFD model for ash deposit andaerosol formation. Proceedings of the 9th European Conference onIndustrial Furnaces and Boilers; Estoril, Portugal, April 26−29, 2011;ISBN: 978-972-99309-6-6.(30) Salmenoja, K. Field and laboratory studies on chlorine-inducedsuperheater corrosion in boilers fired with biofuels. Ph.D. Thesis,Faculty of Chemical Engineering, Abo Akademi, Abo/Turku, Finland,2000.(31) Hesch, T.; Biedermann, F.; Brunner, T.; Obernberger, I.Reduction of NOx and PM1 emissions from automated boilers byadvanced air staging. Proceedings of the 19th European Biomass
Conference and Exhibition; Berlin, Germany, June 6−10, 2011; pp874−879, ISBN: 978-88-89407-55-7.(32) Nussbaumer, T. Primary and secondary measures for thereduction of nitric oxide emissions from biomass combustion. Dev.Thermochem. Biomass Convers. 1997, 1447−1461.(33) Zahirovic, S.; Scharler, R.; Kilpinen, P.; Obernberger, I.Validation of flow simulation and gas combustion sub-models forCFD-based prediction of NOx formation in biomass grate furnaces.Combust. Theory Modell. 2011, 15 (1), 61−87.(34) Zahirovic, S. CFD analysis of gas phase combustion and NOxformation in biomass packed-bed furnaces. Ph.D. Thesis, Institute forProcess and Particle Engineering, Graz University of Technology,Graz, Austria, 2008.
Energy & Fuels Article
dx.doi.org/10.1021/ef402249x | Energy Fuels 2014, 28, 1041−10521052
Related Documents


![Groundwater Investigation and Characterization · Groundwater Investigation and Characterization ... manual for environmental site characterization [2] ... through drilling, well](https://static.cupdf.com/doc/110x72/5b4001557f8b9a5e528ccc77/groundwater-investigation-and-characterization-groundwater-investigation-and.jpg)