
Welcome message from author
This document is posted to help you gain knowledge. Please leave a comment to let me know what you think about it! Share it to your friends and learn new things together.
Transcript


SpringerBriefs in Business
For further volumes:http://www.springer.com/series/8860

Giorgio Gandellini • Alberto PezziDaniela Venanzi
Strategy for Action—I
The Logic and Contextof Strategic Management
123

Giorgio GandelliniDepartment of Business and LawUniversity of Rome IIIRome, Italy
Alberto PezziDepartment of Business and LawUniversity of Rome IIIRome, Italy
Daniela VenanziDepartment of Business and LawUniversity of Rome IIIRome, Italy
ISSN 2191-5482 e-ISSN 2191-5490ISBN 978-88-470-2486-1 e-ISBN 978-88-470-2487-8DOI 10.1007/978-88-470-2487-8Springer Milan Heidelberg New York Dordrecht London
Library of Congress Control Number: 2011942911
� The Author(s) 2012This work is subject to copyright. All rights are reserved by the Publisher, whether the whole or part ofthe material is concerned, specifically the rights of translation, reprinting, reuse of illustrations,recitation, broadcasting, reproduction on microfilms or in any other physical way, and transmission orinformation storage and retrieval, electronic adaptation, computer software, or by similar or dissimilarmethodology now known or hereafter developed. Exempted from this legal reservation are briefexcerpts in connection with reviews or scholarly analysis or material supplied specifically for thepurpose of being entered and executed on a computer system, for exclusive use by the purchaser of thework. Duplication of this publication or parts thereof is permitted only under the provisions ofthe Copyright Law of the Publisher’s location, in its current version, and permission for use must alwaysbe obtained from Springer. Permissions for use may be obtained through RightsLink at the CopyrightClearance Center. Violations are liable to prosecution under the respective Copyright Law.The use of general descriptive names, registered names, trademarks, service marks, etc. in thispublication does not imply, even in the absence of a specific statement, that such names are exemptfrom the relevant protective laws and regulations and therefore free for general use.While the advice and information in this book are believed to be true and accurate at the date ofpublication, neither the authors nor the editors nor the publisher can accept any legal responsibility forany errors or omissions that may be made. The publisher makes no warranty, express or implied, withrespect to the material contained herein.
Printed on acid-free paper
Springer is part of Springer Science+Business Media (www.springer.com)

To my daughters Eva and Maria, andstep-daughter Lucia,and to my grand-daughters Cristiana,Sofia, and Irma,and step-grand-son and daughtersLeonardo, Viola, and Ginevra
G. Gandellini
To my parentsA. Pezzi
To Paolo and AliceD. Venanzi

Contents
1 Defining and Understanding Strategic Management . . . . . . . . . . . 11.1 What is Strategy?. . . . . . . . . . . . . . . . . . . . . . . . . . . . . . . . . 11.2 The Source of the Company’s Wealth . . . . . . . . . . . . . . . . . . 21.3 The Importance of a Strategic Plan . . . . . . . . . . . . . . . . . . . . 31.4 The Usefulness of Modeling . . . . . . . . . . . . . . . . . . . . . . . . . 71.5 A Simplified Conceptual Model. . . . . . . . . . . . . . . . . . . . . . . 91.6 The S-Shaped Curve and the Opportunity Costs . . . . . . . . . . . 121.7 The Relationship Between Investments and Value:
Direct and Indirect Tools, and Professional Resources . . . . . . . 141.8 Highlights on Pricing Strategies. . . . . . . . . . . . . . . . . . . . . . . 161.9 Translation of the Above Concepts into Spreadsheet Models. . . 19
1.9.1 Relationships Among pcpV, Priceand Market Share. . . . . . . . . . . . . . . . . . . . . . . . . . . 20
1.9.2 Relationship Between Investments (‘‘Costs’’)and pcpV . . . . . . . . . . . . . . . . . . . . . . . . . . . . . . . . 24
1.9.3 Could We Do Better Than That, withthe Same Budget? . . . . . . . . . . . . . . . . . . . . . . . . . . 30
1.9.4 Closing the Circle Among Investments, pcpV,Value/Price Ratios, Market Share, Marketand Contribution . . . . . . . . . . . . . . . . . . . . . . . . . . . 31
1.9.5 Impact of the Professional Profiles on the Efficiencyin the Use of Resources . . . . . . . . . . . . . . . . . . . . . . 35
1.10 Strategic Management in Multiple Businessesand Related Models . . . . . . . . . . . . . . . . . . . . . . . . . . . . . . . 381.10.1 Evaluating the Performance
of the Various Businesses . . . . . . . . . . . . . . . . . . . . . 391.10.2 How to Manage the ‘‘Portfolio’’ of Businesses . . . . . . 39
References . . . . . . . . . . . . . . . . . . . . . . . . . . . . . . . . . . . . . . . . . . 43
vii

2 External and Internal Analysis of the Environment. . . . . . . . . . . . 452.1 Introduction. . . . . . . . . . . . . . . . . . . . . . . . . . . . . . . . . . . . . 452.2 External Macro-Environment. . . . . . . . . . . . . . . . . . . . . . . . . 462.3 Industry and Competitive Environment. . . . . . . . . . . . . . . . . . 52
2.3.1 Structural Factors . . . . . . . . . . . . . . . . . . . . . . . . . . . 522.3.2 Extended Competition . . . . . . . . . . . . . . . . . . . . . . . 552.3.3 The Critical Role of Other Stakeholders . . . . . . . . . . . 602.3.4 Putting it all Together . . . . . . . . . . . . . . . . . . . . . . . 612.3.5 The Process of Scanning the Business Landscape . . . . 63
2.4 Internal Environment . . . . . . . . . . . . . . . . . . . . . . . . . . . . . . 682.4.1 Resources . . . . . . . . . . . . . . . . . . . . . . . . . . . . . . . . 692.4.2 Capabilities and Competencies . . . . . . . . . . . . . . . . . 702.4.3 Resources, Capabilities and Competencies
to Gain a Competitive Advantage . . . . . . . . . . . . . . . 752.4.4 Strategy Selection and Gaps Identification . . . . . . . . . 77
2.5 SWOT Analysis: A Simple Framework for Assessingthe Firm’s Position Against the Environment . . . . . . . . . . . . . 782.5.1 The Importance of Distinguishing
Among Businesses . . . . . . . . . . . . . . . . . . . . . . . . . . 782.5.2 How to Identify Relevant Options
and Courses of Action . . . . . . . . . . . . . . . . . . . . . . . 82References . . . . . . . . . . . . . . . . . . . . . . . . . . . . . . . . . . . . . . . . . . 82
viii Contents

Overview of the Series
The innovative and unique feature of this short series on strategic management(two conceptually related, but independent volumes), which sets it apart from themyriad of books on the subject, is that it does not contain one single theoreticalconcept that cannot be translated into practice. Its aim is providing universitystudents and practitioners with a practical, decision-making, and action-orientedoverview, sometimes iconoclastic, of the strategic management process.
The objective is reached through the adoption, in most parts of this work, of aset of logical and judgmental models, which show the operational interrelation-ships among the relevant factors that have an impact on firms’ competitiveness andthat are or can be translated, where appropriate, into spreadsheet templates.
The model which introduces this first volume sets the stage for addressing theissue of value creation for the market, and the major phases of the strategicmanagement process: environmental analysis, strategy formulation and develop-ment, strategy evaluation and control. Its conceptual and operational structure isdescribed in the first part, together with a practically oriented definition of strategy,and a discussion of both the importance of strategic planning and of the logic andbenefits of the judgmental modeling approach to decision making.
The second part addresses the classical approaches to the analysis of theexternal and internal environmental factors, which have an impact on the‘‘functioning’’ of the basic model, i.e. the structural characteristics of the industrycontext, and the companies’ technical, organizational, financial, and humanresources, including the translation into operational models of otherwise rathertheoretical concepts.
The first part of the second volume expands the analysis of the strategicdecisions, emphasizing the importance of a sustainable competitive advantage, andproposing an integrated conceptual and operational framework (the ‘‘StratecoDashboard’’), that complements and significantly improves the recent and well-known Blue Ocean approach to strategy development.
ix

Finally, the second volume addresses the measurement of the performance ofstrategy in terms of value creation for the shareholders, highlighting differencesand similarities, as well as strengths and weaknesses, of the main metrics. Fur-thermore, it proposes a comprehensive and operational framework for theassessment of the financial feasibility of strategy, through the measurement of theimpact of the planned strategic moves on financial needs and the evaluation oftheir financial sustainability.
x Overview of the Series

Introduction to the First Volume
Contrary to the approach adopted by most textbooks on strategy, that start with thediscussion of strategic management in multiple businesses, suggesting variousconceptual models for managing the so-called ‘‘portfolio’’ of the firm’s activities,and devoting the largest part of their attention to these issues, the first part of thisfirst volume will be mainly focused on strategically managing a single business.
Actually, the firm’s competitive success and wealth are the result of a sum ofindividual transactions with the market, and the logic and profitability of eachtransaction depend on the type of relationship between the firm and an individualcustomer, within the context of a well defined and very specific ‘‘strategic businessunit’’ (SBU) or product/market combination: how can we address the issue ofmanaging strategically the firm’s presence in multiple SBUs, discussed at the endof the first part, if we do not understand in depth, first of all, the logic of the mono-business interaction that represents the basic ‘‘brick’’ of the entire firm’sconstruction?
Obviously, doing business will also imply a number of interactions with manyother players and stakeholders, and will be affected by numerous factors, bothexternal and internal: however, most of these aspects, discussed in the second partof this volume, will inevitably be seen from the perspective of a relativelyhomogeneous industry and company context.
xi

Chapter 1Defining and Understanding StrategicManagement
Abstract After a short ‘‘operational’’ definition of strategy, we will focus ourattention on the mechanism that creates a company’s wealth, and on the criticalrelevance of a market orientation, including the creation of value for thecustomers, for triggering this mechanism. We will then emphasize the importanceof formalizing the strategic decisions into an explicit strategic plan, and supportingthe plan with appropriate conceptual and operational decision models. We willtherefore discuss the basic concepts and models that link together the firm’s marketand economic performance, including an overview of pricing strategies, andprovide a concrete translation of these models into several spreadsheet templates.Finally, we will extend the modeling approach to the issue of strategic managingmultiple businesses, providing a number of conceptual frameworks that could betranslated into operational decision support systems.
Keywords Strategic management � Strategic planning � Strategic business unit �Marketing strategy � Market share � Pricing strategy � Value/price ratio � Criticalmass � Demand curve � Judgmental modeling � Decision support systems �Portfolio analysis
1.1 What is Strategy?
Among the various definitions found in the literature, we think that, from thepractical and managerial perspective that inspires this book, the following com-bination of concepts best conveys the nature and purpose of strategy:
• set of decisions;• related to the allocation of resources;• over the medium-long term;• to one or more product/market combinations;
G. Gandellini et al., Strategy for Action—I, SpringerBriefs in Business,DOI: 10.1007/978-88-470-2487-8_1, � The Author(s) 2012
1

• in view of specific objectives;• considering external opportunities and threats;• and internal capabilities and constraints;• definition of the related action plans.
This definition is applicable to any business context. For the sake of simplicityand conciseness, we will focus our attention on profit-oriented organizations, forwhich the ability to create wealth is, by definition, one of the major objectives.However, most of the concepts discussed here can be applied also to non-profitorganizations, which institutionally have other objectives, but could not surviveand prosper without funding.
In the following pages, after having reminded an obvious and basic concept(which is, unfortunately, frequently forgotten), emphasized the essentiality of astrategic plan (which is rarely mentioned in most textbooks), and highlighted theusefulness of judgmental modeling (which is totally neglected by most authors),we propose a simple conceptual and operational model that briefly describes therelationships between the resource allocation decisions and the profitabilityobjectives within an hypothetical business (i.e. a specific product/market combi-nation), postponing to the subsequent chapters a more in-depth discussion of themajor phases of the strategic planning process: environmental analysis, strategyformulation and development, strategy evaluation and control.
1.2 The Source of the Company’s Wealth
Everybody understands that the only true source of wealth for any profit-orientedorganization is the market, which purchases the company’s products or services:without sales, the company would not produce any revenues, and all the otherpotential providers of funds and resources (shareholders, banks, suppliers) would,sooner or later (probably, sooner) stop feeding it.
At the heart of any business strategy and plan we therefore need to have asound marketing strategy and plan: all the other company’s functional areas(R&D, manufacturing, HR, finance, logistics) are just ‘‘ancillary’’ to the marketingfunction, and would not survive without the company’s ability to profitably satisfythe market (see McKenna 1991).
If we agree on these interrelated objectives, i.e. reaching profitability throughmarket satisfaction, we should also agree on the need for estimating, measuringand controlling their achievement, and understanding their relationships, in orderto make strategic decisions that could positively influence their behavior over time.
The synthetic and elementary indicators we are suggesting for measuring thesetwo factors are, respectively, the following:
1. contribution margins, which represent the most appropriate variable forassessing the actual contribution (revenues less variable and direct fixed costs)of a given and specific business to the overall company’s profitability,
2 1 Defining and Understanding Strategic Management

particularly if the company operates in more than one business unit, which isthe most frequent case:
– it would be totally senseless to relate profitability to market share withoutreferring to a specific market and competitive context;
– the overall firm’s profitability (profit or loss) will therefore be the net result ofcombining the contributions of various business units, and paying with thesecontributions the costs that are not the direct responsibility of any of theseunits (for example, the CEO’s salary or the headquarters’ rent).
2. market share, which represents the portion of the market’s purchases satisfiedby a given company, with reference to a specific and well defined industrysector or segment, within a given time horizon:
– this indicator is critical also for small and medium enterprises (SMEs), pro-vided that the market in which they compete is correctly identified anddelimited (the so-called ‘‘pertinent’’ or reachable market);
– again, it would be senseless to measure the market share, i.e. the company’sability to compete, in relation to a market (defined, for example, in geo-graphical terms) that the company is not ‘‘physically’’ able to reach.
As far as this last point is concerned, a totally different indicator is the ratiobetween the market that the company is ‘‘able’’ to reach and the market that it‘‘could’’ possibly reach (the ‘‘actual’’ market, a subset of the so-called ‘‘theoretical’’and ‘‘available’’ market, normally defined in geographical terms) with a largermarketing organization: this indicator, that is even more important from aninternational perspective, just measures the relative size of the company, not itsability to satisfy the market better than the competitors.
More will be said below about the relationships between these factors and,specifically, their relative importance: however, saying that ‘‘market share is notanymore fashionable …’’ as some authors do in the attempt of being perceived as‘‘original’’ (Simon et al. 2006), is either trivial (if they mean that market shareshould not be pursued at the expense of profitability) or a nonsense (if they meanthat market share is unimportant): without a market position (precisely, ‘‘some’’market share) it would be impossible to generate any profit.
1.3 The Importance of a Strategic Plan
Coherently with the action-oriented approach of this book, we already said that animportant and final point to address in the development of strategic choices is thedefinition of an action plan, i.e. which specific actions must be performed,by whom, within which deadlines, and at which costs, in order to reach the chosenobjectives. This definition is essential also for assessing the practical feasibility ofthe strategic choices.
1.2 The Source of the Company’s Wealth 3

An obvious prerequisite of the action plan is therefore a description of thereasoning behind these choices in the so-called strategic plan, that shouldexplicitly address, more or less in depth, depending on the complexity of thecontext in which the firm operates, and on the size and complexity of the firm’sorganization, the following major points:
• clear definition of the business(es) in which the firm operates or wants tooperate: products and/or services addressed to specific target users, product/market segmentation;
• environmental and industry analysis (external environment, market, infra-structures, channels, competition, suppliers) within this or these businesses, inrelation both to the past and to the estimated future trends: in particular, explicitprojection of the market potentials in the businesses and segments of interest,opportunities that could be exploited and threats that should be faced;
• company profile (organizational structure, resources and skills), past behaviorand strategic choices, and obtained results (if applicable), interpretation of thereasons of these results, identification of strengths and weaknesses in relation tothe environmental and industry opportunities and threats;
• identification of specific objectives (market position, profitability, etc., overalland by segment) and definition of the most relevant strategic choices, i.e. typeand amount of resources to be allocated to specific businesses and overall,in order to reach the objectives;
• definition of the organizational setting that will be needed for implementingthe strategies: structure and major assets, human resources, roles and respon-sibilities, management systems;
• projection of the economic and financial results that will depend on theimplementation of the above choices.
We should re-emphasize that the heart of a good strategic plan is themarketing plan, that supports the major and most difficult part of any plan, i.e. theprojection of revenues, based on an assessment of the market potentials, and onestimates of the reachable market shares, depending on both the planned strategiesand the expected competitive profiles and behavior.
In turn, the strategic plan is the heart of the so-called business plan, thatcomplements the strategic projections with additional details about the ownership,governance, financial, and organizational aspects.
The usefulness of a plan and of an explicit and formalized description of thefirm’s intentions and activities, over an appropriate period of time (at least 3years), looks obvious if we consider the following:
• the firm’s investments (whichever they are) normally have an impact that isdiluted over time: the outcomes of these investments do not happen instantly,and it is therefore important to estimate their evolution in order to keep it undercontrol;
• once a resource has been allocated, it is rarely easy to backtrack: it is thereforebetter to estimate in advance and as explicitly as possible the impact of that
4 1 Defining and Understanding Strategic Management

allocation against possible alternatives, especially considering the significantopportunity costs that are intrinsic to any decision, systematically neglected inthe business practice;
• the environmental and market system (including the company within it)evolves over time, and it therefore makes sense to prevent unexpected events:it is clear that not everything can be anticipated, but a serious forecasting effortcan greatly reduce the level of uncertainty and the risks;
• the customers’ behavior is significantly affected by previous experiences, andthe market positions gained by the competitors can represent importantstrengths: it is therefore critical to interpret the market scenario from a dynamicperspective, with the forward-looking view that can only be developed by agood planning practice.
All this is even more true in case of new ventures or significant changes in thefirm’s life, and in the absence of appropriate information about the likely evolutionof the industry.
The major and numerous benefits provided by a good strategic plan should bequite obvious, but it is worth listing them, classified in the following categories:
1. analysis, interpretation and information management:
– a plan forces the identification and description of the industry characteristics,and of the related opportunities and threats;
– consequently, it allows the identification of the firm’s potential strengthsand weaknesses in relation to these characteristics;
– it therefore facilitates the identification of the information needs, and a checkof completeness of the analysis;
– over time, it allows the creation, development, and consolidation of aninvaluable knowledge base and a hardly copyable know-how, that are easilyaccessible anytime and by anybody (qualified and interested in contributing tothem), instead of being randomly stored and dispersed in the brains of fewpeople, with all the attached risks of being lost;
– not to mention the often neglected fact that a plan facilitates planning, i.e.helps at developing, over time, the ability to capitalize experiences and know-how, to look forward, and to formulate realistic and quantifiable projections,based on explicit, systematic, and thoughtful assumptions.
2. guidance, direction and control:
– a plan forces the definition of specific and measurable objectives: withoutthese, we would just have generic statements of intent, hardly translatable intoconcrete guidelines for action;
– in view of these objectives, it requires the development of medium and long-term forecasts and projections;
– especially if the projections are supported by simple software tools such as anelectronic spreadsheet, it will be easy to conduct sensitivity analyses of the
1.3 The Importance of a Strategic Plan 5

estimated results, based on changes in the assumptions, and compare therelative attractiveness of alternative courses of action;
– in practice, the plan represents an explicit guide to action, i.e. a sort ofcompass that allows an easier identification of the route to be followed forreaching the objectives;
– thanks to this compass, it will therefore be easier to focus the firm’s efforts,improving the effectiveness of the planned moves;
– it will also be easier to translate the strategic guidelines into operationalplans, with the identification of roles, responsibilities, activities, deadlinesand the possibility of controlling both the attainment of the stated objectivesand the correct implementation of the planned activities.
3. consistency and resources:
– with a written plan, it is much easier to assess the soundness and coherenceof both the decisions and the underlying estimates;
– in particular, it is easier to check the coherence between the stated objectivesand the necessary financial, technological, and human resources forreaching them;
– not to mention the fact that a good and credible plan facilitates the access tofinancial resources and/or better conditions in using them, irrespective oftheir source (banks, shareholders, private investors, venture capitalists);
– furthermore, the plan facilitates an integrated and balanced view of thefirm’s portfolio of activities allowing the identification of the appropriateresponsibilities and the assignment of specific objectives to the various levelsof the corporate structure and facilitating the reconciliation of potentiallyconflicting objectives among the various functional areas (e.g. sales vs.manufacturing or finance).
4. savings and risk management:
– thanks also to the above advantages, a plan allows a reduction of theuncertainty, and a corresponding abatement of risks;
– a better focalization of the efforts reduces waste and, therefore, increases theoperational efficiency;
– not to mention that the savings can be diverted into more promising uses,facilitating the attainment of the critical mass that is necessary to compete inthe various market contexts.
5. communication and motivation:
– strictly connected to the accessibility of the know-how crystallized in theplan, is the possibility of communicating its contents and logic to all thepeople that, within the company or systematically in contact with it (forexample, sales agents), could or should contribute to its implementation intheir respective areas of competence;
6 1 Defining and Understanding Strategic Management

– communicating facilitates a better understanding and sharing, not just of theinformation, but also of the firm’s objectives and constraints, which furtherreinforces their reconciliation with the individual expectations;
– communicating and sharing are the best ingredients of motivation, since theygive everybody an explicit sense of mission and belonging;
– stimulating also a better awareness of the need for a coherent integration ofeverybody’s efforts towards common goals, and of the importance ofteamwork;
– obviously, the existence of an explicit plan also allows a better communi-cation with the outside world, facilitating, for example and with all thenecessary precautions for protecting confidentiality, the development ofalliances with other firms and potential partners;
– not to mention the possibility of supporting and improving, with appropriatelyselected information on an ongoing basis, the relationships with the pressand the development of public relations initiatives;
– finally, the availability of a good strategic plan, if correctly communicated, isa good symptom of advanced managerial culture, and this could more easilyattract key professional resources, which could otherwise be reluctant toembark on a boat without any compass.
Considering all the above advantages of an appropriate strategic planningactivity, it is rather incredible to see that a large majority of companies (especiallysmall firms, but not just them) does not have a real strategic or marketing plan.
An explanation of this apparently strange phenomenon, in addition to the lackof managerial culture in most countries, is that planning is not easy, strains thebrain, takes a lot of time, and, sometimes, a lot of money.
One of the few ways of reducing the impact of these constraints and facilitatingat least an embryonic planning activity, is that of simplifying and automating(although with some inevitable initial investment, especially in terms of time), thestrategic planning process: this is exactly the purpose of the judgmental modelingapproach that will be discussed and exemplified in the following pages.
1.4 The Usefulness of Modeling
The industry and market phenomena that need to be taken into consideration inorder to estimate the indicators suggested under Sect. 1.2, present—in relation, forexample, to those typical of manufacturing—a series of interrelated characteristicsthat make the estimates particularly difficult and complex:
• non linearity, such as the relationship between investments and results (seeSect. 1.6 under Fig. 1.2 ‘‘The S-shaped curve’’);
• carry-over and lags: the response to this period’s investments will occur in futureperiods (lag) and could depend on a cumulative effect of the same investments overtime (carryover): for example, the investments in communication can produce
1.3 The Importance of a Strategic Plan 7

results that are rarely immediate, and, on the other hand, the market’s reactions in 1year could be triggered both by the investments in that year and by the ‘‘memory’’of the previous investments in the mind of the consumers;
• decay of the responses with time in the absence of further stimulation: even verywell-known brands like Coke would lose sales without continuous and signifi-cant communication investments;
• multiplicity of causal factors: for example, sales will depend on the combinedeffects of a series of investments (R&D that improves the quality of products,advertising, sales force, distribution channels, etc.);
• interactivity of these factors: for example, brand image strongly depends on thecompany’s performance on the ‘‘key success factors’’, but could also affect theperception of such performance (e.g. reducing the demand’s sensitivity to price);
• variability and instability of market reactions and competitors’ moves: forexample, an economic crisis could significantly reduce the overall sales ofexpensive products, but, at the same time, contribute to the expansion of acompany’s market share in the same industry, due to the bankruptcy of othercompetitors;
• multiplicity of casual factors, that could strongly contribute to the variabilityof market’s and competitors’ behavior: for example, a totally unexpected eco-logical disaster in a country could destroy, at least for a while, the production ofspecific fresh foods;
• specificity and diversity of the various industry and geographic contexts, thatmake particularly difficult, if not impossible, the generalization of specificstrategic or organizational solutions: let us just consider, for example, the majordifferences, from industry to industry, in terms of sensitivity to price or ratiobetween fixed and variable costs;
• qualitative culture of most managers, who are more comfortable with verbaland debatable analyses and assessments than with systematic and rigorousquantitative approaches.
The use of logical models, i.e. of synthetic, abstract and simplified represen-tations of the reality, could significantly reduce the complexity of the analysis viaan explicit identification of the most relevant variables that could have an impacton the company’s results, their behavior and interrelationships.
Obviously, the more simplified are the models, the less accurate is theirinterpretative and predictive power. However, even a very simple model, if welldesigned, could offer a series of important benefits:
• it helps at clarifying managers’ ideas about the behavior of the reality and thenature of problems, promoting a systematic and structured reasoning, even ifexhaustive and reliable data are not easily available;
• it is explicit and ‘‘transparent’’ (especially if developed on an electronicspreadsheet), and can be shared, discussed and negotiated, in view of potentialadaptations and improvements;
• in particular, when translated into mathematical functions (in an electronicspreadsheet), it allows to conduct easy sensitivity analyses and ‘‘what-if’’
8 1 Defining and Understanding Strategic Management

simulations, in order to see the extent to which the results projected by themodel can be positively or negatively affected by different inputs (values of theendogenous or exogenous variables);
• it represents a permanent and accessible knowledge base, that can be movedover time and space, instead of being confined in the brains of few experts;
• it does not get ‘‘sick’’, nor it suffers managers’ psychological or emotionalproblems;
• it allows the identification and control of aspects and variables that require morein-depth analyses, for example pointing out the need for more specific andcritical data;
• it provides a logical basis for quantifying and measuring industry and marketphenomena;
• it is an almost unique tool for comparing the actual outcomes of the managerialdecisions to the expected results, for designing appropriate decision supportsystems, and for a continuous updating of the logic behind the decisions;
• if used consistently and systematically, it allows a continuous enrichment, overtime, of the knowledge base, the production of statistics, the identification oftrends, benchmarks and best practices;
• finally, if combined and integrated with other connected models, it can consti-tute the backbone of a planning system, that, once designed, just needs to befed over time with new inputs, with limited additional efforts.
Overall, the adoption of models and estimates makes the decision making,forecasting, and planning processes more systematic and explicit, usefully com-plementing managers’ intuition, feelings and experience.
1.5 A Simplified Conceptual Model
The simplified conceptual model depicted in Fig. 1.1 (Gandellini et al. 2005)represents the type of relationship between contribution margins and market share,and identifies the major factors that positively or negatively affect the com-pany’s ability to produce wealth:
• some of these factors (market size and behavior, and competitors’ moves) arerelatively outside the company’s control and must be estimated;
• others (the strategic decisions) can be managed in order to optimize the balancebetween market position and profitability.
We should emphasize, at this point, that all the relationships described in thefigure are meaningful only if they are viewed within the context of a specificproduct/market combination or ‘‘strategic business unit’’ (SBU: a homoge-neous area of business in terms of user characteristics and needs that can besatisfied by a specific type of product or service): otherwise, it would be totallysenseless to relate the firm’s market performance to its economic results.
1.4 The Usefulness of Modeling 9

The model only represents ‘‘actual’’, objective and causal relationships amongthe relevant factors, and does not take into consideration other possible relation-ships that could only depend on subjective managerial decisions: for example, adirect connection (in a dynamic perspective) between contribution and investments(costs) or the frequent (and totally absurd) connection between costs and price.
The top part of the figure represents relationships that are obvious by definition:
• the contribution is the difference between revenues and direct costs;• the revenues are the product of the unit price times the quantities sold.
It should also be obvious that the quantities sold are the product of the marketsize times the market share (i.e. the company’s ability to satisfy a portion of themarket and ‘‘win’’ a number of individual purchases against the competitors), butthis evident relationship is often neglected and misunderstood, probably due to theingrained use, borrowed from the economists, of directly relating quantities toprices, without the intermediation of the variables that actually and directly affectvolumes (market size and market share), in the ‘‘infamous’’ demand curve (seealso Sect. 1.8 about pricing strategies).
We should also say that the frequent practice of measuring market shares inmonetary terms, often justified by the heterogeneity of the goods sold in terms ofquality and price, is not very useful from a strategic standpoint, unless it iscomplemented by an estimate of the corresponding indicator in terms of quantities:
• first of all, the SBU or product/market segment within which the share is beingmeasured must be as homogeneous as possible, otherwise we would incur therisk of comparing apples to oranges, and the entire notion of ‘‘share’’ would bemeaningless;
• secondly, the market needs are satisfied with the purchase of individual units ofconcrete goods or services (i.e. quantities), the prices paid (the money) beingjust the compensation of the suppliers that, having been chosen by the market
Fig. 1.1 The ‘‘engine’’ of an organization’s wealth
10 1 Defining and Understanding Strategic Management

and having gained their share of it, deliver these goods or services: in otherwords, people buy a ‘‘real thing’’, not a monetary value, and the market size ismade of a sum of real things.
In conclusion, if we really want to understand how profits are generated, weneed to identify the causal relationships among the relevant factors that affectthem: from the perspective of an individual company, causally relating prices andquantities is rather misleading, since the actual causal relationship is betweenmarket share and company’s sales (quantities), in the context of a givenmarket demand, no matter how this demand is generated.
From the figure, it should also be evident that, other things equal, there is adirect and positive relationship between market share and profitability, interme-diated by quantities sold and revenues.
The problem is that ‘‘things’’ are rarely ‘‘equal’’, since, in order to generatemarket share, we need to consider the factors that affect it:
1. price, which is inversely correlated to market share (broken arrow in the fig-ure): always other things equal, the lower the price the higher the share, that iswhy the acquisition of market share via reductions in prices could be costly,since the additional quantities sold could not necessarily make up, in terms oftotal contribution, for the loss in unit margins;
2. the ‘‘perceived [by the market] competitive profile [of the company] in termsof value’’ (pcpV); this critical factor, directly correlated to market share,represents the (perceived) value that the company is able to offer to the marketat a given price:
– this overall value is the result of the company’s competitive performance inrelation to the criteria adopted by the market in making the purchasedecision (the so-called ‘‘key success factors’’ in a strict sense, e.g.: brand,quality, customization, service, etc.), and obviously depends on the relativeimportance assigned by the market to these criteria;
– it should be noted that even a high price level could contribute, at least tosome extent and with varying degrees depending on the type business(especially, but not only, with ‘‘status symbol’’ products or services), to theperception of value (arrow price?value in the figure): that is why it could berather difficult to manage the contradictory effects of price (it reduces thewillingness to buy while raising the perception of value);
– furthermore, in a dynamic perspective, also the acquired market positioncould reinforce the perception of value and positively or negatively affect thecompany’s performance in relation to the ‘‘brand’’ factor (for the sake of sim-plicity, this potential ‘‘recursive’’ relationship is not depicted in the figure).
The company’s value/price ratio, more or less explicitly and consciouslycompared (by the market) to analogous ratios proposed by other competing sup-pliers, is what determines the customer’s willingness to buy from a company oranother.
1.5 A Simplified Conceptual Model 11

It is obvious that, in order to improve this ratio via an improvement of theperception of value by the market (and not only via price reductions), thecompany must invest resources (arrow costs?value in the figure), and theinvestment could not necessarily be ‘‘paid’’ by the additional contribution gener-ated by a larger market share.
In a short-term perspective, depending on the competitive situation, it istherefore normal that the acquisition of market shares could be more costlythan profitable: however, if resources are correctly allocated to the appropriatetools and the levels of investment tend to increase, over time, less than propor-tionally in relation to the increase in market share, a ‘‘virtuous’’ cycle can takeplace: appropriate investments produce an increase in market share, that triggersmore revenues and contribution, and part of this contribution could be used to feedadditional investments, and so on. In any event, it is clear that, in a medium-longterm perspective, and other things equal, a larger market share should bepositively correlated to a better financial performance, due to several obviousfactors: better market knowledge and experience, due to more extensive (and,probably, longer) presence, better visibility, better ability to exploit economies ofscale, more bargaining power with the suppliers and lower unit costs, etc.
By the way, the positive correlation between market share and profitability(ROI) was empirically tested and documented by Buzzell and Bradley (1987), withhis famous ‘‘PIMS’’ Project (see an update in Farris and Moore 2006).
It should be noted that the company’s investments could also positivelycontribute to the market expansion (arrow costs?market in the figure), via theacquisition of new users that formerly were not part of the target market: thispossibility (i.e. increase in company’s sales without a corresponding reduction incompetitors’ sales) is particularly relevant in growing businesses, but does notundermine the concept of market share acquisition, since the company‘‘occupies’’ the position with the new users to the detriment of potential intrusionsby any competitor.
Finally, the broken line that divides the figure into two parts separates what wecall ‘‘the visibility area’’ from the rest: companies normally ‘‘see’’ very well allthe variables above the line (including, evidently, the two factors which summa-rize their strategic decisions), but rarely control those below the line, which,unfortunately, directly affect the economic and financial performance. In partic-ular, they do not even attempt to estimate the critical ‘‘pcpV’’, nor they bother toassess their market position.
1.6 The S-Shaped Curve and the Opportunity Costs
With the above comments, we are not necessarily saying that ‘‘the higher theshare the better’’: any conclusion mostly depends on the specific competitivesituation in the business, since it is obvious that, beyond a certain point andespecially in mature and low-growth industries, further increases in market share
12 1 Defining and Understanding Strategic Management

will imply the reduction of the competitors’ shares, and it is very likely that thesecompetitors will retaliate (for example, with significant price reductions) in orderto maintain and protect their market position. The end result, via reciprocalretaliations, will probably be that all the competitors in the industry will make lessmoney and, therefore, also the investments of the company that initiated themarket escalation will not be any more profitable as before.
The most important guideline, from a strategic perspective, will therefore bethat of reaching a good balance, or an acceptable compromise, among thefollowing factors:
• relative market position (share);• type and size of the investments needed to produce and maintain that market
position;• amount of contribution or ‘‘return’’ generated by that market position.
The typical relationship between investments (in this case, marketing invest-ments) and results (in this case, market share) is depicted in Fig. 1.2.
This curve, called also ‘‘logistic curve’’, describes the relationship betweeninvestments in specific resources and specific results obtainable with theseinvestments, a critical concept in strategic planning, which can be applied to anytype of resource able to produce some results (e.g.: exposure produced byadvertising investments, orders produced by the sales force, quality improvementsproduced by R&D, etc.):
• up to a certain ‘‘minimum level’’ of investment (normally called ‘‘threshold’’ or‘‘critical mass’’), results do not show significant increases and, therefore, thecompany does not obtain visible and significant results;
• beyond this level, results grow at an exponential rate up to another point(a reasonably ‘‘maximum’’ level of investment called ‘‘ceiling’’);
• beyond this ceiling, results could continue growing, but at a diminishing rate,and therefore additional investments would not be convenient.
Obviously, the ‘‘critical mass’’ necessary to compete, and the correspondingshape and width of the S-shaped curve, vary greatly, depending on the specificbusiness, the type of resources and results taken into consideration, and the marketand competitive context.
Fig. 1.2 The S-shaped curve
1.6 The S-Shaped Curve and the Opportunity Costs 13

As a concluding remark, we should point out that a ‘‘single’’ version of theabove mentioned model, that synthesizes a given strategy in a given businesscontext (investments and price), can only take into explicit consideration ‘‘out-of-pocket’’ costs: however, in a real life situation, it would also be important tocompare multiple and alternative strategies, in order to estimate the opportunitycosts that could depend on the choice of one of them in relation to the others.
This is something that managers rarely do, totally underestimating the risks andthreats of using scarce resources in just a specific direction, without consideringalternative, and potentially more promising, uses of the same resources.
1.7 The Relationship Between Investments and Value: Directand Indirect Tools, and Professional Resources
In addition to the critical relationship between value and price, which has a directimpact on the firm’s market position, within a specific business and market context,the most relevant relationship from a strategic standpoint (i.e. from a resource allo-cation perspective) is that between investments (all translatable into costs) and value.
In fact, this is the relationship that, together with the choices about price,summarizes the actual ‘‘strategy’’ of the firm: as far as the value/price ratio isconcerned, while price is an independent variable, since it is determined exoge-nously in relation to the above model (see also below, under Sect. 1.8), the valueperceived by the market is directly affected by the decisions about the use of thefirm’s resources, that, in the above model, are summarized under the label ‘‘costs’’.
Assuming, for the sake of simplicity, that the value perceived by the market isthe result of a combination of just three aspects (brand, quality, and service), therelationship is exemplified in the right part of Fig. 1.3.
In the headings of the three columns we can see the hypothetical components ofvalue, i.e. the criteria adopted by the market in making a choice among alternativesuppliers or ‘‘Key competitive Success Factors’’.
In the rows are listed several tools or resources in which the company can invest inorder to satisfy the market’s expectations: we call these tools ‘‘direct’’, since they canhave an immediate impact on the perceived firm’s performance in relation to thecomponents of value. As we can see from the highlighted intersections in the matrix:
• on the one side, the same tool can affect multiple components of value;• on the other side, the same component of value can be affected by multiple tools.
Obviously, the relative importance of each tool for the affected component ofvalue will vary depending on the specific business of interest. This aspect will beconcretely exemplified under Sect. 1.9 (in particular, Fig. 1.9).
In the upper left part of the figure we listed other resources or tools that we call‘‘indirect’’, since their impact on the components of value cannot be perceived bythe market, being, in a certain sense, ‘‘behind the scene’’. However, these tools can
14 1 Defining and Understanding Strategic Management

significantly affect the way in which the direct tools are managed, i.e. the man-agement’s ability to perform their tasks.
The reasoning is that, the better is the management’s professional profile (thanksalso to appropriate investments in the ‘‘indirect’’ tools), the more effective andefficient will be the investment in the managed ‘‘direct’’ tools: for example, and otherthings equal, a given investment in R&D could be partially wasted if the professionalprofile of the manager in charge of managing it is not sufficiently good. This lastaspect will be concretely exemplified under Sect. 1.9 (in particular, Fig. 1.18).
Conceptually, the idea of distinguishing between direct and indirect tools issimilar to that of distinguishing between primary and support activities in the‘‘value chain’’ (Porter 1985) that will be discussed in the second chapter: however,we think that the first approach is more suitable for translating the concept into aspreadsheet model.
Simplifying, we can now summarize, in the Fig. 1.4, the logic of the conceptualmodel that relates the company’s decisions to its market and competitiveperformance.
Starting from the bottom left corner of the figure, we can see the logicalconnections among the various parts of the model, which replicates, although in asimplified way, what happens in a real-life situation:
1. the investments in the so-called ‘‘indirect tools’’ can have a positive impact onthe managers’ professional profiles;
2. thanks to an improvement in their professional profiles, managers can bettercontrol the tools and resources which have a direct impact on the company’scompetitiveness;
3. thanks to the improved control, all the investments made in these ‘‘direct’’ toolsor resources can be much more effective in terms of impact on the componentsof the value perceived by the market, and therefore on the company’s perceivedcompetitive profile and, finally, on the Value/Price ratio.
Fig. 1.3 Relationship between investments (resources employed = costs) and value
1.7 The Relationship Between Investments and Value 15

1.8 Highlights on Pricing Strategies
If we agree about the logic summarized in Fig. 1.1 above, we can hardly challengethe view that setting the price is a major and ‘‘central’’ (not just in graphical terms)strategic choice, since it directly affects the relative value/price ratio perceivedby the market (compared to alternative value/price ratios offered by the competi-tors), and, therefore, the market’s willingness to buy from a supplier or another.
Since this ‘‘willingness to buy’’ is nothing less than the major trigger of anycompany’s wealth, it is therefore quite strange to see that the issue of pricing islargely ignored by most writers on strategy (luckily, not by all of them), probablybecause they assume that this topic should only be addressed in marketing books(evidently forgetting that marketing is at the heart of any successful businessstrategy) and/or that discussing such an issue is too ‘‘prosaic’’ for a book onstrategy.
Being among those who firmly believe that the pricing strategy is a major issuein strategic management, we will therefore address at least its most relevant aspects.
The findings of a survey conducted by a major Italian business school (Guerini2002) show that about 70% of the interviewed companies decide their prices, as apolicy, and at least initially (i.e. before realizing that the policy doesn’t work),based on the unit full cost of their products, therefore adding to the variable costthe so-called unit fixed cost (total fixed costs divided by the number of unitsproduced), which is obviously an entity that does not exist in real terms, since itdepends on a ratio between an actual figure (fixed costs) and a largely uncorrelated(or arbitrarily set) denominator (units produced or planned).
Fig. 1.4 The logic of the firms’ strategic behavior (investments in the available tools)
16 1 Defining and Understanding Strategic Management

As a matter of fact, the unit full cost could just represent a conventional indicatorof a firm’s ‘‘efficiency’’ compared to its competitors (i.e. ability to produce morewith lower overall costs), but it is totally wrong to use it as a benchmark for settingprices, at least in 99.999% of the cases, since it is very likely that this approachwill produce either a loss of sales or reduced margins: unfortunately, a majorconsulting firm became famous for having endorsed and rationalized this practice,despite its applicability by only 0.001% of the companies (Henderson 1984).
We will not spend additional words on the absurdity of the cost-plus approach,which can be easily dismantled by any good marketing book, but we willemphasize, instead, the logical and practical method for setting a strategicallyappropriate price.
Other things equal, given a specific product/market combination, specificcompetitive profiles (i.e. the firm’s perceived profile in terms of value offered tothe market in relation to other offers), and within a given range of variability ofprice (which will be determined considering several factors, including the com-petitors’ current and expected behavior, the managers’ and salesmen’s opinions,an estimate of the potentially positive impact of price on the perception of value,and, if possible, appropriate market surveys), the market’s willingness to buyfrom a specific company (i.e. to award to it a ‘‘slice’’ of the overall market ‘‘pie’’)is inversely related to its prices.
This type of relationship is normally summarized in the famous ‘‘demandcurve’’ described in Fig. 1.5.
As you can see, in a normal competitive context (we are not talking aboutcommodities), the price is the independent variable that has an impact on thedependent variable (see the right-angle broken arrow in the figure). However,contrary to what the economists say, in a real life situation the actual ‘‘directrelationship’’ is not between price and quantities, but between price and share thatthe company is able to gain, given a certain market size (see also what we saidunder Sect. 1.5). If we really want to understand what is going on in the market, wemust realize that the relationship between price and quantities is just indirect(i.e. intermediated), since quantities are affected by the product of market sizetimes market share, no matter how the market size was generated.
As you can also see, the ‘‘wall’’ that prevents the curve from moving up, meansthat the demand’s behavior is something objective, absolutely real, and concrete,against which we incur the risk of breaking our head if we are not able to see it:
• the market ‘‘sees’’ our price (given a certain perceived value and the competingvalue/price offerings): other things equal, if we lower it, our share will increase,if we increase it, our share will diminish, unless price is a major component ofthe perceived value (in this case, we should consider, and choose from, multipledemand curves, depending on different price ranges);
• the market could not care less about our costs: that is why considering our costsfor setting prices could be totally misleading; obviously, the lower limit will berepresented by the unit variable cost, unless we want to lose money and/or get
1.8 Highlights on Pricing Strategies 17

rid of some competitors with a lower staying power than ours from a financialstandpoint.
Having said that, and assuming that the estimate of the demand behavior israther accurate, and that the curve is constantly bent downwards as in the abovefigure, setting the price is a totally straightforward operation, depending on thefirm’s specific objectives. We can hypothesize at least two different situations:
• if our objective is covering as quickly as possible the largest part of the targetmarket, we will obviously select the lowest price;
• if our objective is optimizing either the revenues or the contribution, we willneed to figure out the demand function (preferably, using a polynomial form),and use a linear programming routine (specifying the objective and the pricerange constraints): both operations can easily and immediately be performedwith any good electronic spreadsheet.
Summing up, we can represent in Fig. 1.6 the major logical steps that should beundertaken for correctly setting appropriate prices.
As you can see, we are not suggesting a specific starting point, since this shouldbe a sort of ‘‘iterative’’ activity, depending on possible changes, either in theindustry environment or in the firm’s overall strategy. Furthermore, we do notpresent specific approaches for estimating the possible competitive reactions to thecompany’s decision (middle-bottom part of the figure): you can better study thisissue in any good book on pricing.
Fig. 1.5 The demand curve of a company
18 1 Defining and Understanding Strategic Management

1.9 Translation of the Above Conceptsinto Spreadsheet Models
Managerial decisions (including strategic decisions) are made by individuals, andindividuals often base their choices on experience, contingent opportunities, intu-ition and feelings, instead of looking for the appropriate information, and/orcomplementing the poor quality of the available information (in terms of relevance,specificity, reliability, precision, exhaustiveness, and timeliness) with adequateassumptions and estimates.
What is even worse, they do not make explicit their decision making process: itis therefore difficult, if not impossible, to capitalize on previous decisions, nor is itpossible to share, discuss and improve their underlying logic.
The spreadsheet models discussed here do not have a ‘‘scientific’’ foundation:they only have the purpose of supporting, and making explicit and systematic,the logical process adopted by the decision maker in analyzing a given industrycontext and making the related decisions.
No matter how bad are the available data in a real life situation, the importanceof a systematic process in addressing a managerial problem remains intact:the lack of appropriate data that could ‘‘feed’’ the process will be complementedby reasonable assumptions and estimates, subject to verification and improve-ments based on future experience of the actual outcomes of the decisions.
Particularly for this reason, most of the inputs suggested for the followingspreadsheet models, basically represent estimates or reasonable ‘‘guesses’’,unless the decision maker can count on specific and appropriate data based onaccurate industry and market research (something that rarely happens in the real life).
However, even in this last case, the estimates will be replaced by the researchfindings only if the purpose of the analysis is to interpret the current or past
Fig. 1.6 A logical approach to price setting
1.9 Translation of the Above Concepts into Spreadsheet Models 19

industry or market behavior. Otherwise, if the findings describe an ‘‘expected’’future behavior, in view of a strategic or tactical decision, they will inevitablyremain ‘‘estimates’’: decisions are made for the future, and precise and reliabledata about the future do not exist by definition, especially in business. In fact, itshould be noted that, even in more ‘‘scientific’’ domains, such as mechanics andelectronics, the future behaviour of an object (e.g. the horsepower actually sup-plied by a Formula 1 engine) cannot be projected with total certainty.
1.9.1 Relationships Among pcpV, Price and Market Share
This first part of the model is more ‘‘descriptive’’ than ‘‘prescriptive’’, since itattempts a ‘‘snapshot’’ of a current or past market situation: however, it could beused for ‘‘predicting’’ a future situation, assuming significant changes in the inputvariables.
Let us look at the bottom right part of Fig. 1.1 above: we see that market shareis affected by the pcpV (a direct and positive relationship) and by price (inverserelationship), and that, at the same time, price could also positively affect the pcpV.
We also know that the pcpV, i.e. the suppliers’ competitive profile perceived bythe market, is the overall result of their performance on the so-called ‘‘key successfactors’’ (KSFs), that, in practice, are the criteria adopted by buyers in choosingamong suppliers and making the purchase decision: these criteria could obviouslyvary, in terms of both content and relative importance, depending on businessesand industry sectors.
In this (very) simplified spreadsheet model (Fig. 1.7), we translate these conceptsand relationships (with the only addition of the variable ‘‘elasticity indicator’’) intoconcrete and ‘‘operational’’ mathematical functions, assuming that we are in thebusiness of ‘‘small wheels for special applications in the office furniture industry’’.
This model (the yellow or light-shaded cells contain numerical inputs) attemptsto show how the performance of three hypothetical competitors (A, B, and C) inthis business, in relation to the criteria adopted by the market in making thepurchase decision, can affect their ‘‘probability’’ of gaining a share of a givenmarket (we should note that this is a ‘‘static’’ model, since it does not take intoconsideration the potential impact on future market shares of the market positionsor competitive profiles acquired in the past: however, this limitation could easilybe removed with the inclusion of ‘‘past market shares’’ or ‘‘past competitiveprofiles’’ as components of value, and linking together multiple models, each onerepresenting the results obtained at the end of a given planning period):
• in the top left part of the figure we see the list of the KSFs, and their estimatedrelative importance for the buyers; another simplifying assumption is that allthese KSFs are independent from each other: this means that potential synergiesamong the various factors do not exist, and that a competitor’s performance onone of them does not affect its performance on another factor; this is not
20 1 Defining and Understanding Strategic Management

necessarily true in a real life situation (for example, a good level of servicecould positively affect the company’s brand image), but this restriction could beremoved in a relatively more sophisticated model; ‘‘price’’ is included in this listas a positive contributor to the value perceived by the market;
• the matrix in the top right part of the figure contains a numerical assessment, on ascale from 0 to 10, of the competitors’ performance on these factors: as we can see,all the figures are entered as inputs, except for the performance on ‘‘price’’ (as apositive contributor to the perceived value), which is the result of a standardiza-tion, always on a scale from 0 to 10, of the actual prices ($) charged by thecompetitors and listed in the second row below the matrix; the standardization isnecessary, in order to calculate an overall weighted ‘‘perceived value’’ that couldinclude price as a component: for this purpose, the actual price levels must beexpressed with the same unit of measurement adopted for the other components ofvalue: the ‘‘trick’’ is comparing the actual price levels of the competitors to theprice range found in the business (bottom right rows in the figure), and making theminimum price equal to 0 and the maximum price equal to 10; a more detailedexplanation of the standardization procedure is presented below;
• based on these assessments (KSFs’ weight and competitors’ performance) wecan calculate the overall perceived value (pcpV) of each competitor (see thesecond row below the matrix), which is just the weighted average of its per-formance on the various factors:
pcpV ¼½ f 1 � w1ð Þ þ f 2 � w2ð Þ þ � � � þ fn � wnð Þ�=ðw1þ w2
þ � � � þ wnÞ þ � � � þ wnÞ
Fig. 1.7 Relationship between value/price ratio and market share (neutral ‘‘elasticity’’ to price)
1.9 Translation of the Above Concepts into Spreadsheet Models 21

where the symbols f1, f2, fn…, fn represent the scores of each competitor on thevarious factors, and w1, w2,…, wn the weights of the same factors (in thisspecific case, the division by the sum of the weights is redundant, since theseweights are expressed in percentages, but it could be necessary when their sumis different from 100);
• based on the (reasonable) assumption that the market chooses a supplier basedon a comparison among the value/price ratios offered by the available andreachable suppliers, we then calculate this ratio for the three competitors (seethe first row in the bottom part of the figure: the ratio is multiplied by 100 inorder to get rid of the decimals): in practice, the meaning of this ratio can beinterpreted as ‘‘the amount of value offered by each supplier for one dollar’’;
• it could therefore be reasonable to assume that the proportion between the value/price ratio offered by any supplier and the sum of the price/value ratios offered byall the suppliers in the business would represent the probability, for any supplier, ofgaining a corresponding share of the market demand (second row in the bottompart of the figure): had the market ‘‘perfect information’’ about the availableofferings, its rational choice would obviously be that of selecting only the best one(supplier C, in our case), assuming also comparable transaction costs for reachingthe suppliers: however, these conditions (perfect information, rationality, andcomparability or absence of transaction costs) do not apply in a real life situation.
However, this reasoning implicitly assumes that the market is equally sensitive to valueand price (an increase in price could be compensated by a ‘‘proportional’’ increase in value,and vice versa), but this could not be the case in most market situations:
• in ‘‘cost conscious’’ industry sectors, the market could not be willing to pay ahigh price, even if the value offered is proportionally adequate;
• in ‘‘status symbol’’ or luxury industry sectors, the market could not be willing toaccept a low value, even if the price is very competitive.
In order to take care of this problem, we therefore include, in the value/priceratio, the consideration of a sort of ‘‘price elasticity indicator’’, just adding, for thesake of simplicity, this indicator (e) to the denominator of the ratio, as a power ofprice (in this way, an indicator higher than 1 will more than proportionally increasethe value of the denominator and decrease the V/P ratio):
V
Pe
It is well known that a true indicator of ‘‘demand elasticity to price’’ could varyacross competitors and depending on the initial price levels considered. However,in order to show that price could be more or less important than value in specificmarket contexts, and that some competitors could profit from (or be penalized by)this aspect, we think that the use of this simple indicator could make the point,without too many analytical sophistications.
In Fig. 1.7, e is equal to 1 (neutral indicator), and we implicitly assume that themarket is equally sensitive to value and price.
22 1 Defining and Understanding Strategic Management
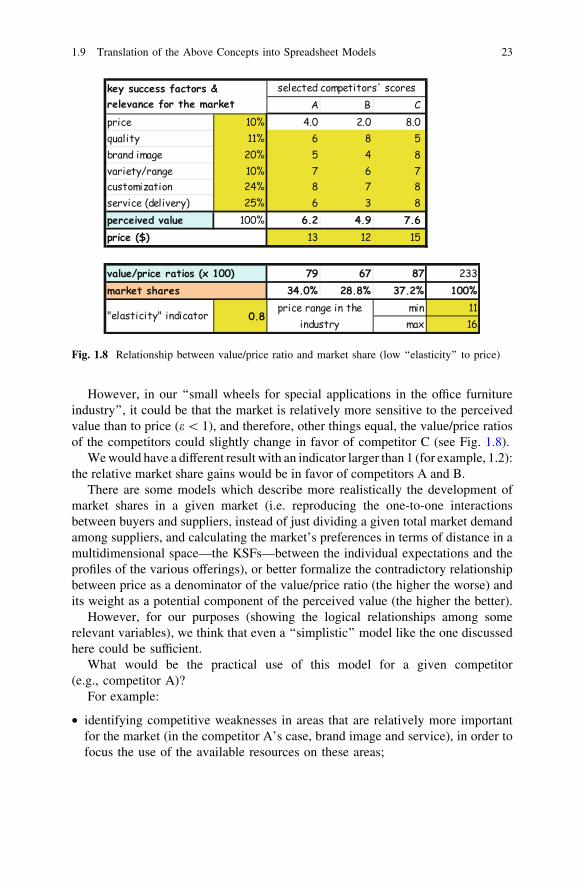
However, in our ‘‘small wheels for special applications in the office furnitureindustry’’, it could be that the market is relatively more sensitive to the perceivedvalue than to price (e\ 1), and therefore, other things equal, the value/price ratiosof the competitors could slightly change in favor of competitor C (see Fig. 1.8).
We would have a different result with an indicator larger than 1 (for example, 1.2):the relative market share gains would be in favor of competitors A and B.
There are some models which describe more realistically the development ofmarket shares in a given market (i.e. reproducing the one-to-one interactionsbetween buyers and suppliers, instead of just dividing a given total market demandamong suppliers, and calculating the market’s preferences in terms of distance in amultidimensional space—the KSFs—between the individual expectations and theprofiles of the various offerings), or better formalize the contradictory relationshipbetween price as a denominator of the value/price ratio (the higher the worse) andits weight as a potential component of the perceived value (the higher the better).
However, for our purposes (showing the logical relationships among somerelevant variables), we think that even a ‘‘simplistic’’ model like the one discussedhere could be sufficient.
What would be the practical use of this model for a given competitor(e.g., competitor A)?
For example:
• identifying competitive weaknesses in areas that are relatively more importantfor the market (in the competitor A’s case, brand image and service), in order tofocus the use of the available resources on these areas;
Fig. 1.8 Relationship between value/price ratio and market share (low ‘‘elasticity’’ to price)
1.9 Translation of the Above Concepts into Spreadsheet Models 23

• assessing the extent to which an improvement of the company’s scores in theseareas could improve the overall competitive performance.
This will be the subject of the following discussion.
1.9.2 Relationship Between Investments (‘‘Costs’’) and pcpV
In the above pages we described the relationships among pcpV, price and marketshare, entering the ‘‘scores’’ of three hypothetical competitors’ on the KSFs,together with their price levels, as an input to the model (the intermediate outputbeing the pcpV, and the final output the market share).
Let us look now at a possible way of describing how the scores and, therefore,the pcpV of a given competitor ‘‘A’’ can be affected by its strategic decisions interms of investments (identified as ‘‘costs’’ in Fig. 1.1 above): in this case, theinputs will be represented by estimates and investment decisions, and thecompetitor’s ‘‘scores’’ in relation to the various KSFs and overall (the pcpV) willbe the output.
The objective of this part of the model is therefore more ‘‘prescriptive’’ than‘‘descriptive’’, since it attempts to identify alternative investment choices, in orderto support the selection of the best alternative.
Logically speaking, the investment decisions (level and distribution ofresources) should be made in order to reach a given objective (in our case, a givenlevel of pcpV): however, our main purpose here is to address specifically the‘‘allocation’’ issue, i.e. how to best allocate a given amount of limited resourcesamong various tools in order to maximize the pcpV objective.
Once understood the reasoning and criteria behind the allocation decision,nothing will prevent us from addressing the problem the other way around,i.e. setting an overall objective (a given level of pcpV) and deciding both theamount and the distribution of resources accordingly.
1st stepLet us assume, for the sake of simplicity, that:
• the only components of the pcpV, contrary to what discussed in the previous partof the model, are ‘‘quality, image, and service’’, and their relative importance is,respectively, 20, 35 and 45%: these weights are an input to the model(estimates), already considered (even though in relation to a different mix ofKSFs) in the first part of the model;
• the only available tools for improving the company’s performance on theseKSFs are those listed in Fig. 1.9: R&D, advertising, sales force, raw materialsand components, logistics and channels’ margins;
• both the KSFs and the tools are ‘‘independent’’ variables, i.e. they are notinfluencing each other, and synergistic effects among them do not exist.
24 1 Defining and Understanding Strategic Management

The first two restrictions could easily be removed just adding other KSFs andtools, the third one could be removed with a relatively simple integration of themodel, but the basic criteria and methodology for addressing the resource allo-cation problem would not change.
Other simplifying restrictions will be introduced later.We think that, again in the absence of objective data, it is reasonable to expect
that a manager could (and should) make an explicit assessment of the relativeimpact of the various tools listed in the figure on each KSF: the percentageweights entered in the columns on the right part of the figure therefore representnew inputs to the model (estimates), and, for each column, their sum is 100%since, by definition, we do not have other tools available.
We can easily see that, as in a real life situation, an individual tool can have animpact on multiple KSFs, and, at the same time, an individual KSF can bemanaged with (or affected by) multiple tools. It is also obvious that, for a giventool, the same amount of investment can affect, at the same time, multiple KSFs (i.e.it is not necessary to ‘‘multiply’’ the investment by the number of KSFs affected).
In the simplified example provided here, we see that quality and image are bothaffected by two different tools, while service is affected by four different tools (twoof them are also affecting image).
Once again, we emphasize the fact that this type of models does not have a‘‘scientific’’ foundation: it only has the purpose of supporting, and making explicitand systematic, the logical process adopted by the decision maker in analyzing agiven industry context and making the related decisions.
2nd stepBefore deciding the amount of resources that ‘‘should’’ be allocated to each
different tool in order to maximize the company’s competitive profile on quality,image, and service, given certain constraints in terms of resource availability, weneed to identify, at least in principle, how many resources ‘‘could’’ be assignedto each tool.
Fig. 1.9 Estimated relevance of various tools for managing the components of value
1.9 Translation of the Above Concepts into Spreadsheet Models 25

Our suggestion is to identify, for each tool (e.g. R&D), the ‘‘critical mass’’ orthreshold below which we would not attain significant and ‘‘visible’’ results (e.g. interms of quality), and the ‘‘ceiling’’ beyond which results would improve at adiminishing rate (see the S-shaped curve).
Here, again, we think that knowledgeable managers should be able to make thistype of assessment, based on their experience in managing the tools, theirknowledge of the business and the competition, and just plain common sense.
The assessments made by a hypothetical manager in our ‘‘industrial compo-nents’’ case, about the minimum and maximum ‘‘reasonable investments’’ (from astrategic perspective, we call the amount of resources assigned to these tools‘‘investments’’, even though they actually represent ‘‘costs’’ for the period) in thebusiness, are presented in the right part of Fig. 1.10: these are the last inputs tothis part of the model that represent estimates made by the decision maker.
We can see that these ‘‘investments’’ can be grouped into two categories:
• variable and ‘‘virtual’’ (or ‘‘opportunity’’) costs, which will obviously be paidby sales: the % commissions paid to the sales force, the raw materials andcomponents ($ per kilogram: for the sake of simplicity, we assume that theproduct variable costs are limited to raw material and components, butobviously this is not true in the real life), and the % margins granted to thedistribution channels on the end-user price (these are, in fact, opportunity costs,since they are not subtracted from the revenues, but only reduce the amount ofrevenues that could have been realized with direct sales to the end-users, i.e. theso-called ‘‘virtual revenues’’);
• fixed costs (thousands of dollars: K$), which will be paid upfront or during theyear, no matter how much will be sold, by a given budget (always for sim-plicity, we assume that also these costs will be paid, by the budget, during theplanning period, e.g. the year, so that we will not need to bother about depre-ciation of assets: however, the logic underlying the resource allocation decisionsdoes not change): R&D (e.g., maintenance, upgrading, and salaries), advertising(fairs and exhibitions, trade magazines, catalogs and technical literature, andlogistics (rent of warehouses, salaries, maintenance of trucks).
3rd stepNow we need to decide how much to ‘‘spend’’ in each different tool in order to
maximize the company’s competitive profile on quality, image, and service (and,therefore, on its overall pcpV), given the analysis conducted above and a specificconstraint in terms of budget.
It is easier to address this issue if we focus the allocation problem on the fixedcosts paid by the budget, assuming that we could spend the maximum amount ofmoney (repaid by sales) in the variable costs. These restrictions will be easilyremoved later.
Furthermore, in order to make the reasoning more clear, let us assume, for now,that the only component of the perceived value for the market is quality: from theabove figures we know that the only available tools for improving quality are R&D(weighting 60%), and raw materials and components (weighting 40%).
26 1 Defining and Understanding Strategic Management

Having assumed that we could spend the maximum amount in raw materials andcomponents (the variable cost), we just need to decide how much to spend in R&D.
What will be the impact of our decision on our performance on quality?Obviously, if we could spend the maximum amount of money also in R&D, our
performance would be the highest, based on our own assumptions about theeffectiveness of these tools and given the assumed availability of just these toolsfor improving quality.
However, how to estimate the combined impact on quality of raw material andcomponents, and R&D, if, for budget reasons, we could not spend the maximum inR&D (we will easily see that this problem is significant when we consider all theother KSFs and tools)?
Since the investment in R&D is expressed in K$ and the cost of raw material ismeasured in $ per kilogram, in order to assess the ‘‘combined’’ impact of these‘‘investments’’ depending on their respective importance for quality, we need touse an homogeneous unit of measurement. Note that, even with values expressedwith the same units of measurement (e.g. K$), the range of variation of these valuesand their scales could be significantly different: in our example, $ 100,000 spent inlogistics (the ‘‘maximum’’ reasonable amount in the business) would not be thesame as $ 100,000 spent in advertising (close to the ‘‘minimum’’ amount).
The ‘‘trick’’ is therefore to translate and standardize all the investment levelsinto an homogeneous scale or index: for example, conventionally assigning thevalue of 1 (that would allow to obtain the minimum possible result on the relatedKSF) to the minimum level of investment in each tool, and the value of 10 (thatwould allow to reach the maximum performance on the KSF of interest) to themaximum level of investment in the various tools. Any type of numerical scalecould be used (1–5, 10–100, etc.) but, at least for now, we would need to assign apositive value also to the minimum investment, since, otherwise, it would notmake sense to spend even that minimum amount of money: however, also this
Fig. 1.10 Estimated ‘‘investment ranges’’ for the various tools
1.9 Translation of the Above Concepts into Spreadsheet Models 27

restriction could be removed in relatively more complex versions of our model (inwhich the decision maker could decide not to invest altogether in given tools andfocus only on other selected tools).
If we take, as an example, the investments in R&D, the simple algorithm thatstandardizes these investments into a 1–10 scale, is graphically represented inFig. 1.11.
The curve from the bottom left (intersection of the axes) to the top right in thefigure represents a hypothetical S-shaped curve, which describes the relationshipbetween the R&D actual investments and their corresponding level on the stan-dardized scale. Given the difficulty of estimating the parameters of a ‘‘real’’S-shaped curve, our suggestion is to approximate any curve that we could figureout in the real life with a straight line (the solid line in our figure).
Actually, were we able to find the parameters of the curve (instead of justestimating the minimum and maximum values, which is a reasonable approach inmost cases), this line should be drawn between its two inflection points (i.e. at thecoordinates 1,000;1 and 2,500:9 in the figure), but here we further approximated,for better legibility, with the two points (A and B) that correspond, respectively, tothe minimum and maximum values of the investments (X-axis) and of the stan-dardized scale (Y-axis): A (500; 1) and B (3,000; 10).
In any case, we will therefore have a linear relationship, and it will be mucheasier to standardize on an homogeneous scale all the amounts invested in thevarious tools.
In practice, in the R&D example described in the figure, the range of variabilityof the investment between the ‘‘reasonable’’ minimum and maximum is 2,500(3,000–500), while the amount of money above the minimum spent in R&D, beingthe decided investment 1,730, is 1,230 (1,730–500): since 500 corresponds to a
Fig. 1.11 Standardization of the amount of investment into a scale from 1 to 10
28 1 Defining and Understanding Strategic Management

level of 1 in the standardized scale, the corresponding level of investment in R&Don the same scale is around 5.4:
• the ratio between the money spent above the minimum and the range betweenmaximum and minimum (1,230/2,500), is about 49%;
• multiplying this percentage by 9 (the corresponding range between 1 and 10 inthe standardized scale), we get about 4.4;
• to this we should add 1, that is the minimum score on the standardized scaleobtained with the minimum investment of 500: 4.4 ? 1 = 5.4.
If we call ‘‘X’’ the amount of money spent in a given tool (or any other resourceinvested in a given tool, such as a salesmen’s commission), its standardized valuewill be calculated (by the spreadsheet) with the following easy formula:
xstd ¼ x� xminð Þ= xmax � xminð Þ � 9þ 1
Going back to the estimate of the combined impact on quality of our invest-ments in raw material and components, and R&D, having spent the maximum inthe first tool (based on our conventions, an index of 10 on the standardized scale),but only k$ 1,730 in the second (an index of 5.4), we will be able to weight theseindices depending on their relative importance (respectively, 40 and 60%) forimproving quality.
The weighted index of effectiveness of our investments in quality (Qi), and,therefore, our performance on this KSF, will therefore be calculated as follows(figures are rounded):
Qi ¼ 10 � 0:4þ 5:4 � 0:6 ¼ 7:3
At this point, the same approach can be shown for all the other tools and KSFs(see Fig. 1.12), under the assumption that the overall maximum budget that can bespent in fixed costs is only K$ 2,160 (we maintain the assumption that we canspend the maximum amount in all the variable costs).
As we can see, in the column at the far right of the figure, all the decisions (‘‘actualinvestments’’) entered in the adjacent column are translated into indices on a 1–10scale: these decisions (not, anymore, estimates) are the final inputs to the model,together with the decision about the budget constraint (bottom right of the figure).
It is easy to identify the indices of 5.4 and 10 that correspond to the decisions onR&D and raw material and components, and produce a performance (score) of 7.3under the quality column (row at the bottom of the figure): as a matter of fact, thespreadsheet multiplies all the indices in the related column by all the weights in thecolumn under quality, but obviously only the weights of the two just mentionedtools are taken into consideration, since the other tools are not relevant (at least inthis simplified example) for affecting the perceived quality.
Exactly the same calculations are performed for the other KSFs (image andservice): the ‘‘indices’’ column is multiplied by their corresponding ‘‘weights’’columns, giving a weighted score for each KSF (respectively, 7.9 and 8.5 forimage and service).
1.9 Translation of the Above Concepts into Spreadsheet Models 29

Having now the estimated scores on the three relevant components of the valueperceived by the market, we can calculate the overall pcpV of the company, basedon the relative importance of the three components for the same market (row at thetop of the figure): in this case, the weighted average pcpV is therefore 8.0.
1.9.3 Could We Do Better Than That, with the Same Budget?
Always assuming that we can spend the maximum on all the variable costs(but this assumption could obviously be incompatible with a possible objective ofprofitability, as we will see very soon), we could try to identify other combinationsof fixed costs (within the given budget) that could improve the pcpV.
Here we have two options:
• either adopting the ‘‘trial & error’’ approach, i.e. attempting many combina-tions until we find that one of them is best since, apparently, cannot be furtherimproved with additional attempts: this is feasible when the number of possiblecombinations is relatively limited, like in the case discussed above, but could bepractically impossible in more complex cases;
• or using ‘‘linear programming’’, an operations research tool that specificallyaddresses optimization problems when there are explicit objectives andconstraints, and the alternative uses of limited resources are related to theobjective with linear functions (like in our case). The Excel spreadsheet easilyperforms the linear programming routine with the so-called ‘‘solver’’ tool:
Fig. 1.12 Calculation of the pcpV, based on the investment decisions
30 1 Defining and Understanding Strategic Management

– we specify the cell that displays the objective that should be maximized(in our case, the pcpV index): obviously, this cell will contain the formula thatcalculates the value of the objective;
– we specify the cell (or the range of cells) that will contain the inputs (in ourcase, the decisions about how much to invest in the various tools);
– we finally specify the constraints that need to be observed (in our case, theminimum and maximum amount of investment for each tool, and the avail-able budget), and the ‘‘solver’’ immediately calculates the best combination ofinvestments that maximizes the objective.
In other cases, the linear programming routine could be used to minimize anobjective (i.e., costs) or to attain a given value as an objective: for example,in our case, instead of maximizing the pcpV objective within a given budgetconstraint, we could want to see how much money, spent in each tool, wouldbe needed to reach a given pcpV value, considering our estimates of thepossible ranges of investment for the various tools: this would be, in principle,the most appropriate way of addressing the problem (see our comments above),but we could discover that the needed overall investment would be muchbeyond the available resources.
Anyway, since the ‘‘solver’’ tool is available, let us see if we can improve thepcpV using the same budget as before. The ‘‘impressive’’ result of this approach ispresented in Fig. 1.13 (see the right part of the figures that include the descriptionof the investment levels).
We can easily see that the new pcpV is very close to the theoretical maximumof 10, and that, in order to obtain this result in comparison to the previous one,it was sufficient to raise the investments in advertising and logistics (which have asignificant impact on important components of value) and correspondingly reduce(but to a lesser extent, relatively speaking) the investment in R&D (which has asignificant impact on a component of value that, however, is relatively lessimportant for the market).
In fact, we see that, with the same money, the company obtains the highestpossible scores on image and service (10.0 vs. 7.9 and 8.5, respectively), and aslightly lower score than before on quality (6.9 vs. 7.3): given the clear marketpreference for image and service (a combined weight of 80%), this performancetranslates into a projected pcpV score significantly better than before (+18%).
1.9.4 Closing the Circle Among Investments, pcpV, Value/PriceRatios, Market Share, Market and Contribution
Until now, we have been considering that we could spend the maximum amount ofmoney in all the variable costs, using in the best possible way the available budgetfor fixed costs, with the objective of maximizing the pcpV, and therefore, otherthings equal (especially, price), our market share.
1.9 Translation of the Above Concepts into Spreadsheet Models 31

But are we sure that this is the most appropriate approachfor making money?
If the objective is ‘‘making money’’ (in the short term), instead of gainingmarket share, we should probably reconsider, at least to some extent, the invest-ment decisions described above.
Let us go back to the situation in which three competitors are operating(Fig. 1.8), and assume for now, and again for the sake of simplicity, that:
• competitor A, investing as described in Fig. 1.13, was able to reach a pcpV of 9.4;• also competitors B and C were able to improve their pcpV to 7.5 and 8.0
respectively;• all the competitors’ prices are kept constant;• the market size is 8,000,000 units, and will not be significantly affected by the
competitors’ performance in terms of value (arrow pcpV?market in Fig. 1.1).
Based on these assumptions, and on the data provided above, we will thereforebe able to consider the final impact of competitor A’s decisions on its ‘‘bottomline’’ (i.e. the contribution).
This situation is described in Fig. 1.14, in which we can easily see that, with apcpV of 9.4, the competitor A’s market share is 38.4% and its contribution isaround $ 1,807,000 (bottom right corner of the figure).
However, if the competitor’s objective is to maximize the contribution, with the‘‘solver’’ (or even with few manual what-if simulations) he could find out that, otherthings equal, the reduction of the pcpV to 7.2 and the corresponding diminution ofmarket share to 32.3% could produce a contribution of $ 17,386,000 (Fig. 1.15),about ten times that obtainable with the maximization of market share (thanks to a
Fig. 1.13 Optimization of the pcpV, based on new investment decisions
32 1 Defining and Understanding Strategic Management

drastic reduction of the ‘‘investments’’ in R&D—saving $ 1,060,000, channels’margins, and raw materials, but maintaining the highest investment in sales force).
In practice, and going back to Fig. 1.14, the possible objective of maximizingthe market share (and going from 32.3 to 38.4%) would ‘‘cost’’ the company morethan $ 2,500,000 for each point of share: (17,386-1,807)/(38.4-32.3).
Obviously, as anticipated above, this model suffers some serious limitations:
• it does not take into consideration the potential synergies and interactionsamong tools: for example, high channels’ margins could facilitate the job(i.e. the effectiveness) of the sales force, and vice versa in the opposite case(however, this limitation could easily be avoided with an algorithm that wouldconsider the positive interactions among tools: in this case, we could see that aminimum investment in some of them would not be reasonable);
• being a ‘‘static’’ model, it does not take into consideration the ‘‘cumulative’’effects of the investments over time, nor it considers the potential accelerationof market results thanks to the previous periods’ market share;
• it does not consider the dynamics of changes in pricing, and is based on linear(simplified) relationships;
• etc.
Fig. 1.14 Impact on contribution of the optimized pcpV
1.9 Translation of the Above Concepts into Spreadsheet Models 33

However, our purpose here was mainly to support, in practical terms, thefollowing conclusions:
• there are strong interrelationships between the economic/financial performanceof a company and its market position: both must be taken into consideration;
• we cannot maximize, at the same time, profitability and market share, sincethe market positions must be ‘‘purchased’’, although we know, as said at thebeginning of this part, that on the medium-long term (and other things equal)market share and profitability are strongly and positively correlated;
• in conclusion, results depend on an appropriate identification of the objectives,and an even more appropriate and selective allocation of resources in view ofthese objectives.
Fig. 1.15 Optimization of contribution, at the expense of pcpV
34 1 Defining and Understanding Strategic Management

1.9.5 Impact of the Professional Profiles on the Efficiencyin the Use of Resources
Until now, we assumed that the entire amount of resources employed in thevarious tools could have an impact on the components of value. However, as wesaid under Sect. 1.7, this impact could be reduced if the professional profile of thepeople in charge of managing these tools is not sufficiently adequate.
For ease of presentation, we replicate in Fig. 1.16 the model supporting theinvestment decisions shown in Fig. 1.13, in which we had estimated that the‘‘investment’’ decisions (expressed as fixed and variable costs) could allow a veryhigh performance in terms of value perceived by the market (9.4/10) and, there-fore, in terms of competitive profile.
However, that estimate implicitly assumed that the resources were managed, bythe people in charge of them, in the best possible way: in practice, we had notconsidered possible organizational inefficiencies due to a gap between ‘‘ideal’’professional profiles and ‘‘actual’’ professional profile (which could be expressedin terms of knowledge, skills, and attitudes, and summarized with an overallindex).
If, instead, we introduce the consideration of possible inefficiencies, it is easy tosee that a potential gap could also exist between the amount of resourcesemployed and the actual effectiveness of their use in the market. Obviously, theinefficiencies could be generated by many other factors beyond the professionalprofiles, such as inappropriate equipment or technology, inadequate procedures,physical distances, etc.
For example, and for the sake of simplicity, we can now assume that theresources described above are exclusively managed by three managers (General,Product, and Sales Manager), and that their professional profiles can be assessed,overall, with an index on a scale from 0 to 10.
To the extent to which each manager is responsible of the various resources, wecan see from Fig. 1.17 that there is a discrepancy between the ‘‘ideal’’ level ofefficiency (equal to 100%, corresponding to optimal profiles of 10/10) and the‘‘actual’’ level (variable, depending on the specific tools managed, and corre-sponding to the actual profiles of the three managers: respectively, 8.1, 9.7, and 7.8).The percentages on the right side of the figure, for each tool, correspond to theweighted average of the profiles (ideal and actual), based on the relative ‘‘weight’’of the three organizational positions in managing the tool.
If we therefore complement the previous model (Fig. 1.16) with these newassessments, we can see that the efficiency gap reduces proportionally the impactof the investment decisions in each tool: in conclusion, as we can see in Fig. 1.18,the ‘‘actual’’ investment indices (obtained multiplying the theoretical indices bythe percentages of actual efficiency) reduce the estimated performance on thecomponents of value (5.6, 8.8 and 8.7, instead of 6.9, 10 and 10, respectively forquality, brand, and service), correspondingly reducing the overall competitiveprofile (8.1 instead of 9.4).
1.9 Translation of the Above Concepts into Spreadsheet Models 35

In practice, we can assume that, due to the sub-optimal professional profiles ofthe three managers, there is an overall waste of resources of about 13% (differencebetween 8.1. and 9.4): this is like saying that the company, instead of investing $2,160 in fixed costs, invested just $ 1,851 (-14%). We can calculate the corre-sponding waste of resources in variable costs (about 12%), considering the weightsof the related tools, versus those of the tools represented by fixed costs, in man-aging the components of value (see the left part of Fig. 1.16).
It is interesting to note that this waste or ‘‘dissipation’’ of resources can rep-resent a concrete example of what Ghemawat (2010) calls ‘‘slack’’: his consid-erations about the threats to the sustainability of strategy will be better analyzed inthe second volume.
Obviously, also this model, as some of the others discussed before, could seemrather theoretical and hardly applicable in the business practice, unless the com-pany can count on an analytic system for assessing the professional profiles, and ona strategic control system of the results of its investments.
However, the model’s objective is mainly that of showing concretely howcritical can be the human resources in managing investments, and, therefore,the importance of having appropriate recruiting, management education, andreward systems for developing levels of knowledge, skills, and attitudes aligned tothe degree of complexity of the scenario in which the firm operates.
This is even more true, if we consider the difficulty of overcoming the ‘‘criticalmass’’ necessary for competing successfully, and, therefore, the need of notwasting even a single ‘‘drop’’ of our scarce resources.
We think that what we discussed in the above pages is sufficient in view of theobjectives of the first part of this volume (i.e. defining and understanding strategic
Fig. 1.16 Impact of the ‘‘investment’’ decisions on the competitive profile
36 1 Defining and Understanding Strategic Management

management), together with what we will say below about strategic managementin multiple businesses.
In the second volume we will address the issue of strategic and economic-financial control, together with a critical assessment and an integration of recentdevelopments in the analysis, formulation, and control of competitive strategies.
Fig. 1.17 Estimated efficiency in managing resources of three organizational positions
Fig. 1.18 Estimated impact of the inefficiencies on the competitive profile
1.9 Translation of the Above Concepts into Spreadsheet Models 37

Likewise, the issue of strategic management in multiple businesses will beaddressed more in depth in the second volume, from the perspective of evaluatingalternative diversification options.
1.10 Strategic Management in Multiple Businessesand Related Models
We already pointed out that the elementary mechanism at the heart of the firm’swealth consists in the very simple physical event of the exchange of a good orservice between a supplier and a user, against a corresponding exchange of moneyin the opposite direction, within a very specific product/market context.
Understanding and being able to influence such a mechanism is thereforecritical for strategically managing any company in any possible market, and this isthe reason why we spent the largest part of this book discussing this issue.
On the other hand, it is rather unusual that a company could be satisfied enoughof serving just one type of user or customer with just one type of product orservice, for one or more of the following reasons:
• the growth opportunities in that context are limited, because of either ademand’s stagnation or decrement, or an increase of the competitive pressure, ora combination of these factors;
• the overheads necessary to operate in that context could more easily coveredwith contribution margins generated by additional businesses;
• many firm’s resources could be easily allocated to multiple businesses withoutexcessively reducing their usefulness for the original one: for example, becauseclients are willing to buy multiple products from the same company, or becausethe same type of product or service could be of interest to various clients’segments;
• an excessive concentration of these resources in one single direction couldpossibly generate decreasing returns (see the S-shaped curve), i.e. an inefficientuse of the same resources.
It is therefore normal that a very large majority of companies operate in mul-tiple businesses, even when they manufacture a single type of product which issold to different types of users, or when they sell different types of products to thesame type of users.
Postponing to the second volume further considerations about the diversifica-tion strategies (i.e. how to identify the most appropriate related or unrelatedbusinesses in which to expand the firm’s activities), we will focus here ourattention on the following aspects:
• how to assess the performance of the various businesses;• how to manage the ‘‘portfolio’’ of businesses.
38 1 Defining and Understanding Strategic Management

1.10.1 Evaluating the Performance of the Various Businesses
The logic and the objective of generating sufficient contribution margins forcovering costs that cannot be directly attributable to individual businesses issummarized in the following simplified example (Fig. 1.19), in which we assumethat the company is using distribution channels in order to reach its final users (wetherefore identify the so-called ‘‘virtual revenues’’—i.e. revenues that the companywould make if it could sell directly to the end users—in order to assess also theopportunity cost of using the channels). Furthermore, we include the considerationof the firm’s position in the market (as usual, the yellow or light-shaded cellscontain inputs to the model).
In the case described in Fig. 1.19, we see that, for example, business C is the bestperformer in terms of market share (although within the smallest market), but theworst in terms of relative contribution (at all levels within each business and acrossbusinesses) and return on the gross assets managed (especially from a marketingperspective: accounts receivables and inventories), while business B is the best fromthese last viewpoints. We should note that by ‘‘traceable common costs’’ we meanfixed common costs that can be reasonably attributed to the businesses, for examplebased on the relative portion of time systematically allocated to each business by amanufacturing or a sales manager (and not according to the absurd accountingpractice of allocating these costs based, respectively, on manufacturing outputs orsales): in practice, this allocation represents the opportunity cost of using theseresources in a specific direction (business) instead of another.
Obviously, this picture should be also seen from a dynamic perspective, i.e.over time, and considering the possible market trends.
For example, and taking into account just the market environment, we can seefrom Fig. 1.20 that the company is constantly maintaining its market shares in fourdifferent product/market combinations over 3 years (top part of the figure), while itis losing market share, on average, from the second to the third year, if we considertogether either the two business (bottom left part of the figure) or the two markets(bottom right):
This could only be explained by the different ‘‘relative’’ market trends over the3 years: apparently, the company maintained the largest market shares in relativelydeclining markets versus others in which it has the smallest shares: the company’sweighted average share is therefore declining from the second to the third year.
1.10.2 How to Manage the ‘‘Portfolio’’ of Businesses
Many authors have been addressing the issue of ‘‘portfolio analysis’’ or ‘‘portfolioplanning’’, i.e. the criteria and guidelines for allocating resources to the variousbusinesses in which a firm operates, similarly to the idea of allocating funds withina portfolio of stocks.
1.10 Strategic Management in Multiple Businesses and Related Models 39

If we consider the following obvious factors:
• very large number of available alternatives in terms of potential businesses;• need for critical mass in order to succeed in any of these businesses;• limited resources for successfully pursuing multiple options at the same time …
… the need for selectivity, focus, and timeliness in allocating resources to thecompany’s businesses is equally obvious.
The most famous (and least useful) conceptual framework for managing theproduct portfolio is that proposed by the Boston Consulting Group (Hofer andSchendel 1978), that graphically describes the positioning of the various businesses(each one represented by a circle proportional to its turnover) based on two dimen-sions: relative market share versus that of the largest competitor, and market growthrate. The intersection of the two dimensions (low or high share vs. low or highgrowth), generates four quadrants, identified with the following labels: dogs (lowshare/low growth), cash cows (high/low), question marks (low/high), and stars (high/high). Based on its position in the matrix, each business is more or less able toproduce or use cash, the assumptions being that the higher the share the larger will bethe generation of cash, and the higher the growth the larger will be the need for cash:the idea is to reach the best possible balance among the various positions, in order togenerate sufficient cash for exploiting the growth opportunities.
Despite its appealing and imaginative simplicity, and the fact that the matrix isbased on two relevant dimensions, this model provoked a significant number ofcritiques, the most obvious ones being the following:
• the above assumptions are not necessarily correct in most cases: in particular,firms can lose money while holding large market shares, and low-share busi-nesses can also be profitable;
Fig. 1.19 A framework for assessing the businesses’ contribution to the firm’s profitability
40 1 Defining and Understanding Strategic Management

• the definition of the market boundaries within which market shares are calcu-lated is often arbitrary;
• the identification of the relevant competitors against which to measure therelative shares could also be arbitrary;
• the definition of the threshold that discriminates between high and low marketgrowth (originally set by the BCG at 10%) could be totally inappropriate inmany cases, especially considering the significant changes, over time, in themacroeconomic environment;
• the model only considers the relationship between the company and the marketleader, while others are ignored: what about small competitors with fast-growing market shares?
• overall, the choice of just two dimensions makes the entire model totally sim-plistic, and hardly applicable to many specific and diversified business contexts:in particular, market share is only one aspect of competitiveness, and themarket’s growth rate is only one aspect of the industry attractiveness (just look,for example, at the variables described in the previous two figures).
Our view is therefore that a more adaptable, flexible, and judgmental approachcould be much better suited to the diversity of business and company situations.For example, the approach suggested by the so-called ‘‘GE-McKinsey businessscreen’’ (Hofer and Schendel 1978) combines into two major factors (marketattractiveness and competitive position) a number of relevant dimensions, such as(we adapted and complemented the following lists):
• for market attractiveness: market size (number of potential users, per-capitausage), market growth, competitive intensity, typical contribution margins,demand seasonality, environmental factors, etc.
Fig. 1.20 Firm’s market performance, over time, in four different product/market combinations
1.10 Strategic Management in Multiple Businesses and Related Models 41

• for competitive position: market coverage, market penetration, brand equity,access to distribution channels, R&D capabilities, managerial skills and pro-fessional profiles, etc.
Based on the specific industry contexts, and on the objectives, assumptions andpreferences (therefore, on inevitably subjective factors) of those who will need tomake the resource allocation decisions, each dimension will be weighted, and ascore (for example, on a scale from 0 to 10) will be assigned to the businesses ofinterest in relation to these dimensions: each business will therefore obtain twoweighted average indices in terms of both market attractiveness and competitiveposition, and will be positioned on a two-dimensional matrix similar to thatdepicted in the right part of Fig. 1.21 (adapted from the original GE/McKinseymatrix: the areas of the circles could represent a third dimension, such as revenuesor contribution).
We incorporated in the figure (see the left part of it) additional diagnosticframeworks related to what we said about ways of strategically addressing a mono-business context: the relative importance of the various resources used for man-aging the KSFs, and the competitive position of the firm, based on its investmentsin these resources.
The overall approach described here explicitly recognizes the high degree ofsubjectivity inherent in all the management decisions: as most of the other modelspresented in this book, it does not pretend to be prescriptive, but it suggests acoherent conceptual framework for systematically addressing the decision makingprocess in the area of strategy.
Fig. 1.21 A possible ‘‘multibusiness strategic management dashboard’’
42 1 Defining and Understanding Strategic Management

The models discussed above did not take into consideration the interrelation-ships among businesses. However, once we understand the logic that relates theresource allocation decisions to the market and economic results, in both amonobusiness and a multibusiness scenario, it is relatively easy to figure out theextent to which a strong or a weak position in any given business can positively ornegatively affect the firm’s position in others.
The potential synergies among businesses can be analyzed at least from twodifferent, but normally interrelated, perspectives:
• on the one side, the positions gained in one business, in terms of market share,coverage, presence in the distribution channels, brand equity, etc., could be partof the competitive success factors (i.e. the criteria adopted by the users inchoosing among competing suppliers) that are relevant in another business;
• on the other side, the same resources, skills, capabilities, activities and know-how used in one business for managing its key competitive success factors,could be shared among other businesses, and contribute to the attainment of thecritical mass necessary to succeed.
More will be said about this last point in the final part of this book.
References
Buzzell RD, Bradley GT (1987) The PIMS principles—linking strategy to performance. The FreePress, New York
Farris PW, Moore MJ (2006) The profit impact of marketing strategy project: retrospect andprospects. Cambridge University Press, Boston
Gandellini G, Possati D, Pace A (2005) Il nuovo marketing strategico. Franco Angeli, MilanoGhemawat P (2010) Strategy and the business landscape. Prentice Hall, Upper Saddle RiverGuerini C (2002) Export Marketing. Egea, MilanHenderson B (1984) The application and misapplication of the experience curve. J Bus Strategy
4:3–9Hofer CW, Schendel D (1978) Strategy formulation: analytical concepts. West Group, St. PaulMcKenna R (1991) Marketing is everything. Harvard Bus Rev 69:65–79Porter ME (1985) Competitive advantage: creating and sustaining superior performance, Free
Press, New YorkSimon H, Bilstein FF, Luby F (2006) Manage for profit, not for market share: a guide to greater
profits in highly contested markets. Harvard Business School Press, Boston
1.10 Strategic Management in Multiple Businesses and Related Models 43

Chapter 2External and Internal Analysisof the Environment
Abstract The environmental analysis is a precondition for the formulation of aneffective strategy that can generate a competitive advantage. Its purpose is toidentify strategic forces that may determine the present and future success of acompany. In this chapter we present the basic concepts and tools for the study ofthe firm’s external and internal environment, with particular regard to the macro-economic environmental factors, the industry’s competitive forces and the firm’sinternal strategic resources, capabilities and competencies.
Keywords: Environmental analysis � Competitive environment � Porter’s fiveforces � Resource based view � Capabilities � Core competencies � SWOT analysis
2.1 Introduction
The formulation of a strategy is an organizational process that begins with theidentification of possible opportunities and threats within a company’s externalenvironment, and the evaluation of strengths and weaknesses within its internalenvironment. After a careful analysis of these environments, firms can carry out aproper estimation of strategic alternatives, from the formulation of a genericstrategy to the creation of a business model and the implementation of specificchoices for individual businesses.
Environmental analysis and information gathering are the first steps in orga-nizational adaptation (Hambrick 1982). Their purpose is to identify and analyzestrategic factors that may determine the present and future success of the company.Figure 2.1 shows the principal external forces of the macro and competitiveenvironment that influence the strategic decision process. The core of the diagramcorresponds to the internal environment. The strategic internal forces—resources,
G. Gandellini et al., Strategy for Action—I, SpringerBriefs in Business,DOI: 10.1007/978-88-470-2487-8_2, � The Author(s) 2012
45

capabilities and competencies—represent strengths and weaknesses that a firmmay use to gain a competitive advantage.
2.2 External Macro-Environment
Strategic decisions are strongly influenced by a firm’s macro-economic environ-ment. The firm’s ability to monitor and interpret the information coming from theoutside, even if not directly related to its competitive environment, can allow it toexplore better opportunities or threats for the future that may have an impact onits long-term business performance. The analysis and monitoring of macro-environmental factors that influence strategic decisions is not an easy task. Thisis true especially for companies that operate in multiple markets which aredifferent in nature in terms of culture, legislation, role of business in society andeconomic trends.
The pioneering research of Aguilar (1967) analyzed the tools and techniques for‘Scanning the Business Environment’, introducing the first taxonomy of theenvironmental factors: Economic, Technical, Political and Social. Several otherauthors included variations of the taxonomy in a variety of orders, introducingother factors such as ecological, socio-cultural, legislative, etc. For our purposes,we utilize a taxonomy that emphasizes the economic, technological, political,socio-cultural and ecological factors, and helps teams and individuals who areundertaking the environmental scan.
Economic factors can have an understandable impact on strategic decision.Factors such as high interest rates, instability of host countries’ currencies,government intervention in the free market, and high inflation rates, may deterinvestments in a country instead of another. Over the last few years, the recent
Fig. 2.1 Environmental scanning, i.e. internal and external environmental analysis
46 2 External and Internal Analysis of the Environment

global crisis and the rapid economic development of emerging countries havechanged the world economic trends. China, India and Brazil have become theprimary location for outsourcing services and delocalizing productive activities,essentially to obtain more favourable costs. Other economic factors that can affecta firm’s decisions are: the quality of the infrastructures, the level of skill of theworkforce, the financial market efficiency, the business life cycle (e.g. prosperity,recovery, recession) or the disposable income.
The template below contains examples, obviously not exhaustive, of economicfactors that a firm might choose to analyze (Fig. 2.2). The purpose of the templateis to collect information in a unique tool in order to help mangers to predict futurestates from current trends. The template shows the current/future trends related toan economic factor; the trends’ impact and their implications for a firm, togetherwith their probability of occurrence. Lastly, it provides room for some notes thatmay help a firm to decide which factor might prove to be an opportunity or athreat: the outcome of this type of analysis could feed, in particular, the SWOTframework presented at the end of this chapter.
Technological factors may have a rapid impact on a firm’s performance andcan influence the reorientation of the firm’s strategic thinking. For example, dig-itization of cinematic products has amplified versioning, giving customers differentoptions for enjoying a movie and different levels of quality to choose from.
Fig. 2.2 Macro-environmental economic factors
2.2 External Macro-Environment 47

Multiplex cinemas, DVDs, digital decoders and cable TV offer superior repro-duction quality vs. traditional movies, VHS or analog television. Internet andVideo-on-Demand allow movies to be available instantly. On the other hand, thesedevelopments imply the disappearance of most video rental shops and thereduction of free-on-air TVs’ contractual power.
A scientific breakthrough has an immediate impact in its specific field, but mayalso produce a transformation in unrelated industries. For example, nylon fiber wasinitially utilized, for commercial purposes, to produce the bristles of the tooth-brush. After a few years, nylon was primarily utilized to produce ladies’ stockings.During World War II, the production of ladies’ stockings was reduced to allow theuse of this fiber to reinforce parachutes.
The template below contains examples, again not exhaustive, of technologicalfactors that a firm might choose to analyze (Fig. 2.3).
Political factors may influence the level of competition within an industry andthe firm’s strategic decisions, through government’s interventions in the economy.Antitrust rules, labor laws, tariffs, trade restrictions, special incentives for specificindustries and tax policies are a few examples of factors that have a significantimpact on strategy formulation. In a globalized world, firms consider governmentbureaucracy, regulations and other political/legal factors essential variablesfor assessing strategic alternatives such as: business location, entry modes in anew market, outsourcing choices, marketing actions, etc. For example, consumer
Fig. 2.3 Macro-environmental technological factors
48 2 External and Internal Analysis of the Environment

protection and the increase in the regulation of an industry might be considered amotivation for preferring one emerging country to another. In the case of intel-lectual property rights, the legal protection is an imitation barrier that is difficult toovercome in the short term for competitors; it produces a condition of a temporarymonopoly for the owner (Rumelt 1984). The lack of a formal mechanism ofisolation makes companies very vulnerable from the outside and can affect theappropriation of the entire value generated by intellectual property (Mizik andJacobson 2003). However, it is the complicity of the government that sometimeslimits the ability of firms to see their rights protected locally. The lack of pro-tection depends more on the lack of enforcement, rather than on the absence ofnorms or rules.
The template below contains examples, again not exhaustive, of political fac-tors that a firm might choose to analyze (Fig. 2.4).
Socio-cultural factors refer, in particular, to the population growth and trends(of course, at different rates from country to country) and to their implications forthe companies. Health care, tourism or financial services firms even try to takeadvantage of the aging of the European and US populations, due to the largerdisposable income of people over 50 in these countries. For example, in the case ofanti-wrinkle cream, firms make efforts to reach new customers with emotionallyappealing names or promotions. These ‘‘mature’’ consumers are not particularlysensitive to price, if a firm is able to convince them that time will not affect them,thanks to its products.
Fig. 2.4 Macro-environmental political factors
2.2 External Macro-Environment 49

It is important to relate the demographic trends with the educational levels andlife expectations. Higher levels of education may allow higher salaries or earningsand, therefore, new opportunities for firms to satisfy new customers’ needs.
Nowadays, especially firms in consumer goods industries are attracted to the‘‘new rich’’, which live in emerging countries and have different norms, cultureand values compared to traditional customers. For this reason, in the recent eco-nomic crisis firms have shifted investments from the advanced to the emergingcountries. Usually, in emerging markets multinationals aim at a leadership positionin the segments of expensive consumer goods and high-performance industrialproducts, while local companies operate in inexpensive and low performancesegments. However, the evolution of customers’ expectations and competitiveprofiles can change this pattern: both multinational and local firms have toanticipate the emerging trends to gain or maintain a competitive advantage.
The template below contains examples, again not exhaustive, of socio-culturalfactors that a firm might choose to analyze (Fig. 2.5).
Ecological factors refer to the physical characteristics of the environment,which could favor or constrain the industrial development: for example, with theglobal warming and the decrease in snow-fall, several ski resorts either failed orhad to reshape their core business. These factors include physical resources,wildlife, climate and everything related to the ecosystem in which a firm isembedded. It is not enough for a firm to be merely compliant with the
Fig. 2.5 Macro-environmental socio-cultural factors
50 2 External and Internal Analysis of the Environment

environmental laws: the demonstration of its environmental awareness, in responseto the customers’ and other stakeholders’ increasing sensitivity to ecologicalissues, can represent an important asset in many countries.
The template below contains examples, again not exhaustive, of ecologicalfactors that a firm might choose to analyze (Fig. 2.6).
Compared to the stable environmental conditions of the past, the currentdynamic context brings with it some dramatic changes in the conditions in whichfirms operate. To better adapt their strategies to the macro-economic transfor-mations, firms must continuously monitor the environment and evaluate the cur-rent and predictable opportunities and threats. It may still be useful for companiesto ask themselves the following questions (adapted from Andrews 1980):
1. what are the most relevant economic, technological, political, socio-culturaland ecological factors of the macro-environment in which the companyparticipates?
2. which trends suggesting likely changes in the economic, technological,political, socio-cultural and ecological factors are apparent?
3. given the economic, technological, political, socio-cultural and ecologicaldevelopments that most directly affect a given industry, what is the range ofstrategies available to any company in that industry?
Once opportunities and risks have been identified, it is necessary to undertake aqualitative and quantitative analysis to assess the potential severity of their impact,and estimate the probability of their occurrence: opportunities and risks are thereforeprioritized, based on a combined consideration of these aspects. The process ofquantifying these factors is obviously subjective, but the assessment of opportunitiesand threats in terms of probability and impact can help firms at focusing their timeand resources on the most urgent strategic actions. The logical framework repre-sented in Fig. 2.7 could therefore be helpful for classifying the environmental factorsthat should be scanned, monitored or managed with immediate action.
Fig. 2.6 Macro-environmental ecological factors
2.2 External Macro-Environment 51

This framework can also be useful for screening the external factors that will beconsidered in the SWOT analysis discussed under Sect. 2.5.
2.3 Industry and Competitive Environment
In order to obtain a complete understanding of an industry and its competitiveenvironment, firms have to invest time and financial resources to collect, process,analyze and then monitor a large amount of data and information. The complexityof a clear definition of the boundaries of a industry, the presence in the competitiveenvironment of diversified firms and the rapid transformation of many sectors havemade it particularly difficult to identify the common features that characterize thefirms in an industry and those that differentiate them from one another.
Four main questions must be answered to properly interpret the industry and thecompetitive environment:
• What is the nature of competition in the industry and across industries?• What are the conditions for success in the competitive arena?• What are the roots of an industry’s current profitability?• How is it possible to anticipate and influence competition (and profitability)
over time?
2.3.1 Structural Factors
The analysis of distinctive structural factors of an industry allows companies tounderstand the strategic actions that competitors will tend to adopt. Competition isaffected by the presence of several structural factors:
1. Industrial concentration. It is a function of the number of firms in an industryand of their market shares. Industrial concentration was traditionally summarized
Fig. 2.7 Probability ofoccurrence and expectedimpact matrix
52 2 External and Internal Analysis of the Environment

by the concentration ratio, which simply adds up the market shares of an indus-try’s four, ten, twenty, or fifty largest companies. The Herfindahl index is a morecomplete measure of concentration, which weights the firms’ market shares in anindustry by their market shares themselves, eliminating some pitfalls of theconcentration ratio. It is a widely applied indicator of competiveness in anindustry. It measures the industrial concentration ratio through the sum of thesquares of the market shares of a certain (large enough) number offirms within theindustry. In formula:
H =Xn
k¼0
S2i
where Si is the market share offirm i and n is the number offirms in the market.Theindustry is concentrated if it is dominated by only a few large firms and the index isabove 0.25. The industry is fragmented if there are many small-medium sizedfirms and either none or very few are able to influence the industry’s direction. Inthis case, an Herfindahl index below 0.15 indicates an unconcentrated industry.This index has several limitations. First, it is important to analyze the resultsconsidering a firm’s geographic scope. For example, firms may have a 10%market share each, but may occupy ten different geographic areas of the country inwhich they are monopolists. Nowadays, a firm needs to examine if the industryconcentration is local, national or international in order to be able to understandthe role offoreign firms in the local market, to anticipate possible new entrants andto discover opportunities in new markets. Secondly, in many cases, multinationaland local companies coexist in the same competitive arena, offering differentiatedproducts to consumers (e.g. industrial ice-cream vs. homemade ice-cream).Differentiation is another typical problem in defining the market concentration.For example, firms may have a 10% market share each and the industry wouldappear highly competitive. However, if one of those firms has 90% of the marketshare with a single product, it has a huge bargaining power over its buyers. Finally,the market dominance may be analyzed considering the distribution channels. In asmall town in which there is only one supermarket, this supermarket doesn’tnecessarily have dominance over every product. People can also buy a beer in apub, a cinema or an off-license.
2. Rate of industry growth. In the case of a slow-growth rate, a firm that wants toexpand its sales should try to formulate a strategy to gain market share fromcompetitors. In rapid-growth industries, the demand’s variability may allowfirms to expand following the natural growth of the market. For example, therapid development of emerging economies such as China and India allowscompanies to adopt marketing strategies that are based on the acquisition ofcustomers who have never purchased the product before, instead of trying topersuade customers to change their supplier.
3. Diversity. Competitors have different origins, corporate governance, size,objectives and strategies. Often, they are unable to know and understand needs,strategies or positions of other firms or consumers located in other countries.
2.3 Industry and Competitive Environment 53

Strategic alternatives that are adequate for one firm may be wrong for another.For example, ethnocentrism played a prominent role in the creation and loca-tion of EuroDisney (now Disneyland Paris). Disney’s executives refused tobelieve that the Disney characters could not be loved everywhere and that theAmericans’ lifestyles could not be appreciated by the French and the Europeans.They wanted to replicate the success of Disney Tokyo in Europe, but the culturalpatterns and habits of people in these locations are extremely different. Thefailure of EuroDisney, in the early years, is easily explained by the followingfacts: European people did not have great affection for Disney idea, preferringlocal characters; the European economy was headed into a recession in the earlynineties; and, more simply, Europeans are accustomed to drinking alcohol intheme parks and having lunch with local food, at 12.30 p.m. instead of between11 a.m. and 14 p.m.
4. Amount of fixed costs. If fixed costs are high, capacity must be expanded forbetter efficiency. This may disrupt the supply/demand balance and lead to aperiod of overcapacity and price cuts. Many basic-materials businesses sufferfrom this problem, especially when demand decreases (e.g. aluminum, paper).This also happens in service industries: airlines, for example, offer lower faresto recover fixed costs whenever a plane has empty seats, since the costs of theflight are almost the same if a plane is full or departs with empty seats.
5. Product or service characteristics. A product or a service can be distinctive orsimilar to others. Product differentiation is a barrier against competitors’initiatives and a lock-in for buyers. Differentiation aims at creating brandloyalty and convincing consumers of the uniqueness of the product or service.As a result, customers will be less sensitive to price and more sensitive toproduct characteristics. This is the case of products for babies, where thespecificity of the product and the company’s brand image create an entry barrierthat is difficult to overcome for competitors or new entrants.
6. Product and technological innovation. In the face of fast product innovation,companies must invest in R&D and demonstrate a strong capacity for contin-uous improvements in order to survive in a constantly changing competitivelandscape (e.g. pharmaceuticals, biotech or videogames). However, a highgrowth industry rate will not guarantee profitability if substitutes are attractive.Industries such as software and internet attract competitors but are often lessprofitable than low technology industries characterized by high entry barriers,scale economies and high switching costs. In that sense, industry attractivenessis not structurally dependent on technological innovation but technologicalinnovation can reshape rivalry (Porter 2001).
7. Exit barriers. The exit barriers keep companies, with low or negative returns,in the market, even though they may prefer to leave as soon as possible. Thesebarriers could depend on highly specialized assets with high switching costsand low market values, strategic interdependence between business units,management’s devotion to a particular business or socio-political issues thatconstrain strategic decision (e.g. government rules to preserve employment in ageographical area).
54 2 External and Internal Analysis of the Environment

8. Experience curve. Several activities are strongly affected by experienceeffects, whereby the cost of many products declines in proportion to theincrease in the companies’ experience in producing and selling them. Techni-cally, experience is defined as the constant and predictable percentage of costreduction that accompanies each doubling of a firm’s cumulative output (Abelland Hammond 1979). A somewhat related concept, applied to people, is that of‘‘learning curve’’, which measures how much additional knowledge is gainedby an individual on a specific theme. Experience is affected by a variety offactors, such as labour efficiency, work specialization, process innovations,improvements in the use of production equipment, changes in the mix ofresources, product standardization and redesign.
2.3.2 Extended Competition
Porter’s five forces framework (1980), presented in Fig. 2.8, focuses on extendedcompetition rather than just competition among existing rivals. In this sense, as wecan see, rivalry is only one of the five forces that determine industry attractiveness.
The five competitive forces affect industry competition and profitability in themedium and long term. Other factors, such as technology, business cycles,legislation, etc., have an impact on the short term profitability. In that sense, inorder to anticipate and influence competition over time, it is necessary to under-stand the current competitive forces and the company’s own strategic position. Thestrongest competitive force determines the profitability of an industry and becomesthe most important factor in strategy formulation: it differs from industry toindustry and is not always simple to identify.
We will analyze each force in the following sections.
2.3.2.1 Rivalry Among the Existing Firms
Obviously, Porter considers responding strategically to the existing rivals essen-tial, if a firm wants to sustain long-term profitability. However, high rivalry amongthe existing competitors can limit the profitability of an industry. In the case ofprice discounting actions, for example, rivalry erodes profitability because theprice battle transfers margins from the firms to their customers. On the other hand,rivalry can increase an industry’s potential profitability, if each competitor is ableto satisfy different market segments (assuming that they exist) with different mixesof price, products or brand identities. Obviously, most depends on how theindustry borders are defined (either in a broad or a narrow sense): this aspect willbe specifically addressed under Sect. 2.3.4.
2.3 Industry and Competitive Environment 55

More frequently, the intensity of a rivalry increases naturally, together with adecrease in its overall profitability. This is the case of mature industries, wherecustomers’ tastes converge, firms’ strategies become similar and the sameresources and technologies are accessible by everybody. An intense competitioncan be reduced simply with horizontal merger and acquisitions strategies (as wewill see in the second volume of this series), but often these strategies are unable toincrease a firm’s profitability. One of the main reasons lies in the fact that reducingthe number of competitors may attract new entrants or have a negative impact onthe relationship with suppliers and/or buyers.
2.3.2.2 Threat of Entry
The threat of entry in an industry depends on its entry barriers and the incumbents’possible reactions, which may influence the potential entrants’ willingness tochallenge the existing competitors. The threat of entry, not necessarily the entrance,can put pressure on prices, costs and the amount of investment necessary to com-pete, reducing the potential profitability of an industry. Low entry barriers denote alow probability of retaliation from the incumbents, high threats of entry andmoderate industry profitability. Entry barriers are normally classified as follows:
1. Economies of scale. The supply-side economies of scale are obtained when anincrease in the production scale and output reduces the overall (full) costs per unit,obviously provided that all the units produced can be sold (otherwise, the firmwould just incur additional fixed costs, and the so-called ‘‘economy’’ would bejust on paper). In this case, a firm can spread fixed costs over more units or, more
Fig. 2.8 Forces drivingindustry competition. SourcePorter (1985)
56 2 External and Internal Analysis of the Environment

precisely, can recover the fixed costs more easily, thanks to a higher overallcontribution generated by the larger volumes of sales. For example, in the case ofthe automotive industry, the larger the number of cars produced, the lower the unitcost of production, since the fixed costs (machinery, factories and utilities) growmore slowly than volumes, but we have seen cases of bankruptcies, due also to thecompanies’ inability to sell the larger quantities. In the information goods andentertainment industries, from movies and music to digital newspapers or soft-ware code, the cost structure of a firm is characterized by high production costs forthe first copy and low cost of reproduction (near zero) that can amplify economiesof scale: the reproduction is very fast and can be theoretically limitless. However,the costs of the first copy are often sunk. For example, if a company invests in amovie production, it incurs casting and shooting costs: deciding to stop the pro-duction in the early phases means incurring costs that are not recoverable, due tothe lack of market value of the produced part. In any case, for new entrants, theeconomies of scale of the incumbents can be a barrier to entry that is difficult toovercome. The potential entrants should face a market with high productionvolumes, with the risk of not being able to obtain the same benefits in terms ofcosts, due to their inevitable lower outputs and sales, at least initially.
2. Network effects. Demand-side economies of scale are called network effects. It ispossible to reach a network effect if the buyer’s willingness to pay for a company’sproduct increases when the product is sold to a larger number of customers.Several products and software applications are able to generate network effectssuch as e-mail, operating systems, instant messaging, on-line auctions andchat-lines. When these applications trigger demand-side economies of scale, thebarriers to entry become higher for new entrants. For instance, social networkparticipants are attracted to Facebook because it offers the largest base ofcustomers.
3. Capital requirements. A significant entry barrier is the necessity to investlarge financial resources for fixed facilities, for advertising or research anddevelopment. Even if capital and financial markets are efficient and industryreturns are attractive, new entrants assume a higher risk than the incumbents:that is why they expect to have higher returns.
4. Switching costs. Switching costs are costs that buyers incur when they decideto change suppliers. The new entrants have to offer a significantly better ormore convenient products to the customers to persuade them to buy theirproduct and change supplier: for example, customers who decide to changetheir computer, face switching costs if they move from the Microsoft operatingsystem to Linux, while they might find lower switching costs if they want tomove from an Intel processor to an AMD. Types of lock-in between buyer andsupplier which generate switching costs are contractual commitments, trainingexperience, compatibility or product specificity (Shapiro and Varian 1999).A supply contract locks-in both supplier and client for the entire duration of thecontract: the switching costs are both the penalty to pay if one part wants tobreach the contract and the cost of finding a new supplier. The acquisition of aspecific technological experience, beyond representing an additional value for
2.3 Industry and Competitive Environment 57

the firm, discourages it from looking for alternatives, since it generates out-of-pocket and organizational costs. The option of moving to an alternative tech-nology is, particularly for software and coded data, linked to the compatibilityof the old and the new systems. Users who have information encoded in oneformat will be in a position of weakness when they switch to another softwareor hardware: the information may be non-transferable and the recovery cost ofthe databases very high. More in general, dependence on one source creates alock-in especially when it comes to specific assets: searching for a new supplierthat can better satisfy the specific needs of a company requires time andinvestment. Furthermore, releasing a new and advanced product to convinceconsumers to leave their supplier is often not enough: the available options forthe buyers are reduced when complementary purchases are made from the samesupplier. Firms might maintain an alternative strategic choice (dual sourcing) orcreate an interdependence that can, at the same time, lock-in the supplier, orthey can overcome the lock-in through an internalization strategy. In any case,the acquisition of new clients for a newcomer is normally rather difficult inmany industries (especially in business-to-business sectors) characterized byhigh switching costs for the prospective buyers.
5. Incumbents’ advantages independent of size. Incumbents may enjoy specificadvantages that are not available to potential rivals: these advantages coulddepend on resources or competencies such as proprietary technology, prefer-ential access to raw material sources, geographic locations, experience, brandimage and customer loyalty (see also Sect. 2.4).
6. Unequal access to distribution channels. Firms may have established rela-tionships with distributors, especially if based on exclusivity agreements. Whenthe access to distribution channels is limited due to the ‘‘occupation’’ of thesame channels by other businesses, the new entrant will incur additional costsfor being accepted by distributors and replace incumbents. For example,it could be very hard and expensive to introduce a new product in a supermarketor a department store, even if the firm is already present in that channel withother products: the limited space on the shelves prevents the buyers fromaccepting new offers without careful scrutiny, especially if the acceptanceimplies the replacement of existing suppliers.
7. Government policy. Government policies can limit the access to local marketsthrough licensing requirements or restrictions on foreign investment. Regulatedindustries like mobile telecommunication services, taxi services and oil drilling,are examples of sectors in which governments create entry barriers that protectestablished firms.
2.3.2.3 The Power of Suppliers
Suppliers can capture more of the value of an industry when they have the powerto raise prices, reduce quality or services, and transfer costs to buyers. Companies
58 2 External and Internal Analysis of the Environment

depend on a wide range of different supplier groups for inputs (raw materials,components, machinery and equipment, consumables, etc.). Suppliers can gainpower especially in the following situations:
1. The supplier industry is concentrated and sells to a fragmented market: forexample, Microsoft sells its operating systems to a large number of PCassemblers.
2. The suppliers serve many industries and their revenues do not depend on thehealth of one or few of them.
3. High switching costs limit the option to change suppliers. For example, themere proximity to the supplier can create a strong lock-in between buyer andsupplier: a firm could incur high switching costs when it decides to develop arelationship with a supplier that operates outside its own district, instead ofmaintaining an existing relationship with a firm inside it. Such switching costsare not only related to the research needed to find a new supplier, but are relatedto any increase in distance between the manufacturing plant and the supplier,that could increase the transportation costs.
4. Substitutes are not available: for example, in the case of electricity, it is difficultto find a substitute with the same performance and price.
5. The suppliers offer differentiated products: for example, Nikon have morepower offering reflex and compact cameras than companies offering onlycompact cameras.
6. The suppliers are able to compete directly with their current customers, if thecustomers’ margins increase over time. We will discuss more in-depth thisforward integration option in the second volume of this series.
2.3.2.4 The Power of Buyers
Buyers influence competition through their ability to bargain for lower prices,better quality or more services for the same prices. Buyers can gain power espe-cially in the following situations:
1. The buyer can purchase a large quantity of a single vendor’s production. Thedependency on a buyer is higher in the case of industries with high fixed costs:for example, companies that produce components for the automotive industryare greatly dependent on a major auto maker, since there are usually few largebuyers for these suppliers.
2. In industries in which products are standardized or undifferentiated, buyers tendto stimulate competition among suppliers to force down prices, since they canalways find similar products from alternative sources. High competitionbetween suppliers favors buyers, as in the case of the battle between Nutra-Sweet and HSC in the aspartame industry: the winners of this battle were not
2.3 Industry and Competitive Environment 59

the suppliers but the buyers such as Coca Cola and Pepsi, that were able toobtain much lower prices.
3. Switching costs are low: for example, it is easy to find a new supplier that sellsstationery, without incurring relevant out-of-pocket or organizational costs.
4. The buyers can integrate themselves backward and produce the industry’sproduct, especially if vendors are too profitable: in the automotive industry, forexample, firms can decide to internalize some phases of the supply chain thatwere previously outsourced to manufacturers of car components.
5. The buyers are particularly price sensitive, since the purchased product repre-sents a significant percentage of their cost structure and/or they have low mar-gins. This is an incentive to find a lower price supplier: industrial customers andconsumers are more inclined to be price sensitive if the product is undifferen-tiated and its quality does not represent a major choice criterion. Intermediatecustomers, who purchase the product to re-sell it, gain significant bargainingpower when they can influence the purchasing decisions of the end user: con-sumer electronics retailers are a good example, in terms of both volume ofpurchases and ability to influence the end users’ purchasing decisions.
2.3.2.5 The Threat of Substitutes
A substitute product can have a similar function and satisfy the same needs as anindustry’s product. Substitutes may appear to be very different from the industry’sproduct and sometimes the threat of substitution is indirect (e.g. the use of plasticmaterials instead of steel in the automotive industry). The threat of substituteslimits the industry’s profitability and its potential growth. Technology hasamplified the threat of substitution: for example, e-mail became a substitute forexpress mail or fax messages, travel websites substitute travel agencies, video-conferencing or conference calls are substitutes for business trips. The threat ishigher in the case of low switching costs, like moving from a long distance phoneoperator to an internet phone operator (e.g. Skype). Switching costs can be null, forexample, for consumers who decide to have a mobile phone as a first phone lineand for internet access: in this case, the threat of substitution can also be anopportunity for firms that sell bundled offers (TV, internet and phone services).
2.3.3 The Critical Role of Other Stakeholders
Stakeholders can play a critical role in the success or failure of a business. Theyare persons or groups with legitimate interests in participating in a firm in view ofpotential benefits. At the same time, a firm can have a specific interest in
60 2 External and Internal Analysis of the Environment

stakeholders’ decisions (Donaldson and Preston 1995; Mitchel et al. 1997;Friedman and Miles 2001). In addition to the stakeholders already analyzed above(Porter’s five forces), there are other entities that can affect strategy formulationsuch as:
• Financial institutions. The role and the power of the financial stakeholdersdepend both on the nature and level of the firm’s debt, and on its size andreputation. The power of a financial institution is obviously higher when itworks for firms with a high debt ratio and more difficulties at finding financialresources: in this case, a firm’s size and reputation have a central function inmitigating the financial institution’s power. In general, the relationship betweenlarge firms and financial institutions is based on long-term agreements, and theinfluence of the latter can be reduced if the firm is able to access additionalfinancial resources from the financial market. Many studies (see, for a briefreview, Venanzi 2010) show that the hold-up power of banks and other financialintermediaries depends on the following relevant characteristics of the debt-relationship: the degree of concentration of the firm’s debt, the stability of therelationship and its intensity in terms of number and variety of financial productsand services supplied, and the term of the debt relationship. The empiricalevidence shows puzzling implications of this hold-up power on the firm’scompetitiveness.
• Special interests groups. The idea that companies should have a social role(Freeman 1984) has increased the need for permanent relationships with interestgroups such as trade associations, non-profit players, unions and local com-munities. For example, paying attention to environmental issues can affect thefirm’s reputation and competitiveness, through better relationships with itscustomers (Buysse and Verbeke 2003).
• Complementors and influencers. Complementors are stakeholders from whomcustomers buy complementary goods or services, or to whom suppliers sellcomplementary resources (Brandenburger and Nalebuff 1996). Complementorsincrease the buyers’ willingness to pay or, on the supply side, they decrease theprice that suppliers require for their products or services. Another important roleis that of the influencers, who cooperate with suppliers or buyers: for example,in the pharmaceutical industry, doctors who prescribe drugs can greatly influ-ence the success of a medication (especially, the so-called ethical drugs).
2.3.4 Putting it all Together
How to put together all the above aspects in order to make strategic decisions?The perspectives from which to analyze them and diagnose their future
behavior could greatly vary depending on the characteristics, objectives, andvalues of the decision makers. For example:
2.3 Industry and Competitive Environment 61

• a financial investor could consider that high barriers to entry in a given industrycould protect the profitability of the stocks of a company operating in thatindustry, and therefore buy more stocks of the same company;
• a small entrepreneur willing to diversify his company’s business will probablyconsider more favorably industries with relatively low barriers;
• a large company with significant financial resources, willing and able to over-come the most relevant obstacles, will probably prefer to diversify into indus-tries with relatively high barriers, in order to be more protected after the entry.
Furthermore, and taking the perspective of a company that wants to diversify itsbusiness, the relevance of the different factors could vary greatly, depending on themacro industry in which it operates and on the country contexts considered: forexample, the power of buyers could be less relevant in the food industry (considerBarilla, that decided to diversify its pasta business into biscuits, after having con-sidered the high-quality wine industry, due to higher synergies in terms of distributionchannels and sales force) than in the automotive components industry (e.g. diversi-fication into bundled breaking systems of a company that manufactures brake pads).
That is why the conceptual and operational framework exemplified in Fig. 2.9for the assessment of the relative attractiveness of two alternative industries (A andB) from the perspective of an entrepreneur, in view of a potential diversification,considers the following aspects (as usual, the colored or light-shaded cells in thefigure contain the numerical inputs to the model):
• 1st: an evaluation of the relevance (in percentage) of each individual factor,within the related category;
• 2nd: the expected ‘‘direction’’ of its impact, if the relevance is larger than zero(1 = positive/direct, -1 = negative/inverse);
• 3rd: an assessment of the extent to which each factor characterizes the twoindustries, no matter what are its relevance and direction, using for example ascale from 1 to 5, that could be interpreted as follows, depending on the chosenperspective:
a. independent on the industry in which the entrepreneur currently operates:1 = very low; 2 = low; 3 = fair; 4 = high; 5 = very high;
b. dependent on the industry in which the entrepreneur currently operates:1 = much lower; 2 = lower; 3 = comparable; 4 = higher; 5 = muchhigher.
Based on the above considerations, the model calculates an overall weightedaverage score for each category of factors, after having checked the relevance andthe expected direction of each factor’s impact: in case of inverse relationshipbetween the factor and the attractiveness, it takes the complement to 5 of thescores assigned by the decision maker in the assessment.
In the example of Fig. 2.9, we rearranged, to some extent, both the factors andthe categories discussed above, considering also some ‘‘internal’’ aspects that willbe analyzed in Sect. 2.4.
62 2 External and Internal Analysis of the Environment

Finally, the overall scores calculated for the two industries and for each cate-gory or dimension, could produce a final score for each industry, based on anadditional assessment of the relative importance of each dimension for the deci-sion maker, and the profiles of the two industries could be compared as exem-plified in Fig. 2.10 (we suggest, for drawing the graph, the sequence of dimensionslisted on the left side of the figure).
Obviously, the decision maker in a real life situation will adjust the entiremodel according to his/her preferences, and depending on the specific context inwhich he/she operates.
2.3.5 The Process of Scanning the Business Landscape
As we can easily imagine from the above discussions, the ability to identify factorsand forces that influence the macro and competitive environment, interpret their
Fig. 2.9 Suggested framework for the assessment the attractiveness of alternative industries
2.3 Industry and Competitive Environment 63

behavior, and predict their possible evolution, is a major skill for the developmentof successful strategic plans.
The process of scanning the business landscape in view of a better under-standing of the competitive context (Ghemawat 2010), can be articulated asfollows:
• collecting information;• drawing the boundaries of an industry;• identifying groups of players with bargaining power;• thinking dynamically and responding to the evolution of the business landscape.
We will analyze each step in the following pages.
2.3.5.1 Collecting Information
Collecting information for industry and competitive analysis used to be a long andexpensive process, and still represents a major undertaking. The increasinginvestments in personnel and information systems, especially if based on the newweb technologies, are making relatively easier and faster the gathering of envi-ronmental information: however, managers must develop strategic processes thatcan translate this large amount of data into effective information useful for strategyformulation.
Firms can find secondary information about an industry through several publicand private sources. The use of these sources depends on the firm’s abilityto identify the appropriate information and its willingness to pay for it.
Fig. 2.10 Profiles and overall attractiveness scores of two alternative industries
64 2 External and Internal Analysis of the Environment

Reports, books, market research published by trade associations, consultingcompanies, universities and other institutions provide different contents, at variouslevels of quality and price. This information can (and should) be complemented byad hoc surveys from primary sources, such as customers, suppliers, consultants,and competitors.
In-depth information on businesses or industries which are less familiar can alsobe gathered, at least in principle, through significant investments in joint venturesor the acquisition of minority stakes, for example in the so-called ‘‘educational’’entities such as small high-tech firms that can provide hardly obtainable know-howfrom other sources (Roberts and Berry 1985), although these options are rarelyadopted by smaller firms. A joint venture could be a good way to gain synergiesfrom the complementarity of the partners’ contributions and know-how. Theacquisition of minority stakes can be particularly useful for unrelated diversifi-cation strategies in industries characterized by high uncertainty, in which theinterested firm has a little familiarity: it could be a way of reducing risks through arelatively limited investment in human and financial resources.
The perspective from which the information on the external environment will becollected, possibly based on systematic and coherent conceptual frameworks likethat suggested in the previous section, will obviously be influenced by the firm’scharacteristics, resources, and values: these aspect will be addressed in Sect. 2.4.
2.3.5.2 Drawing the Boundaries of an Industry
Drawing the boundaries of an industry has always been difficult (see the famousand fundamental contribution of Abell 1980, on defining the business): however,this critical task has become even harder in recent years, due to the increasingnumber of differentiating factors that characterize most industry sectors. Variationsin products offered by competitors, differences in business size and lengths ofproduction cycles, and presence of many firms in multiple markets and industries,make particularly difficult the identification of common and homogeneous char-acteristics that are typical of specific sectors and differentiate them from oneanother. In order to facilitate the definition of the industry borders within which thecompany is competing, the following factors can be considered:
• segments of the market served (‘‘customer groups’’ in Abell’s definition);• specific functions performed or needs satisfied by the product or service (defined
by Abell as ‘‘customer functions’’);• technologies, materials and processes used in production cycles;• distribution channels;• geographic locations.
The most relevant factor that can characterize a business is certainly repre-sented by the type of target users, grouped and classified, where appropriate,in various segments, according to their potentially different needs and on the type
2.3 Industry and Competitive Environment 65

of products and functions that can better satisfy these needs (see also what we saidin Chap. 1). For example, Ferrari’s market should be viewed as a niche of theautomotive market, since in the customers’ mind a Ferrari can only be comparedwith other luxury sport cars: in this sense, the relevant boundaries of the Ferrariindustry are defined by the luxury sport cars manufacturers rather than by all theplayers in the automotive market. However, Ferrari may, at least in principle,enlarge its boundaries with the production of smaller and less powerful cars,probably with a different brand name, and thus compete in the automotive marketas a whole: in this case, the firm should re-think its organizational and productionprocesses and utilize procurement, manufacturing plants and distribution channelsmore similar to those typical of the automotive industry in general.
Instead of narrowing down the business definition like in the case of luxurysport cars versus autos in general, we could have the opposite situation, in whichthe business definition is too narrow to be helpful for identifying the pertinentcompetitors. For example, we can remind the famous case of ‘‘marketing myopia’’mentioned by Levitt (1975): the manufacturers in the US railroad industry in theearly 1970s of the last century, assuming themselves to be in the railroad ratherthan in the transportation business, lost huge numbers of clients to the benefit ofairplane and car manufacturers.
It is also important to verify the level of vertical integration that characterizesthe industry. Vertical integration is the extent to which a firm replaces its upstreamsuppliers and/or its downstream buyers. If most firms in an industry participate inseveral phases of the supply chain, the competition should be analyzed in relationto all the integrated phases. For example, oil multinationals usually use an inte-grated structure along the entire supply chain: they locate crude oil, drill, extractand refine it into petroleum products, distribute and sell fuel to consumers. In thiscases, a competitive analysis of a single phase is unable to make explicit the stronginterdependence between phases of the entire supply chain, and could produce abiased assessment of the business landscape.
Finally, the business landscape is also affected by geographic locations.Multinational and local firms normally adopt different strategies within differentboundaries, but also among multinationals local considerations affect specificdecisions about market approaches, sales force, and government relationships. Inthe pharmaceutical industry, the high degree of market integration implies theconsideration of most phases of the production chain: however, decisions such asthe price of a medication are made locally, due to the different amounts thatconsumers are willing to pay and the different threats from the existingcompetitors.
2.3.5.3 Identifying Groups of Players with Bargaining Power
The major groups of players—competitors, suppliers, customers, substitutes,potential entrants, complementors, and other stakeholders—were discussed in theprevious sections: all these players must be analyzed from the perspective of the
66 2 External and Internal Analysis of the Environment

business or businesses of interest. Diversified firms can consider a player influ-ential in one business and irrelevant in another. For this reason, it is useful to lookat the bargaining power of players in a single business without underestimatingtheir possible interactions with other businesses. For example, firms can operate inbusinesses in which a specific type of supplier represents a large percentage oftheir cost structure, and in other businesses in which the same type of supplier isalmost powerless: the influence of the supplier’s bargaining power in a singlebusiness can therefore be mitigated considering its role on the entire firm’soperations. To some extent, the identification of the relative roles of various groupsof players with different bargaining power can help at better identifying com-monalities and differences that characterize various industry contexts and, there-fore, at better defining their respective boundaries.
2.3.5.4 Thinking Dynamically and Responding to the Evolutionof the Business Landscape
Thinking dynamically means understanding the current business landscape andtrying to anticipate its changes and the related consequences. The ability tounderstand and anticipate the effects of the complex dynamic interaction betweena firm and its evolving business environment, is a critical skill that must bedeveloped and improved in order to reduce as much as possible the probability ofnegative long-term consequences (Teece et al. 1997).
Dynamic thinking skills are honed by drawing patterns of behavior that changeover time and by thinking through processes that cyclically produce particularevents (Petersen and Strongin 1996). For example, industry cycles are related tolags in the commercialization of new generations of products: the growth of the flatpanel industry is affected by the possibility of incorporating the display into tele-vision sets and, subsequently, into computers and other consumer electronic goods.
The impact of the economy-wide business cycles varies greatly within differentindustries: the sensitivity to the general state of the economy tends to be high inmining, construction and high tech industries, but is low in counter-cyclicalindustries such as agriculture. Other environmental factors that can affect strategicthinking have already been discussed in the previous sections.
In conclusion, in order to understand the dynamics that shape the evolution ofindustries and markets, firms should carefully monitor the current behavior of themost relevant players and forces, trying to infer from that behavior the likely futurescenarios and developments. To some extent, the same firms can also contribute tothese developments if they are able to conceive innovative approaches for satis-fying the expected evolution of the market needs in their respective industries.
In any case, considering the complexity of the current and projected economiccontexts, it will be difficult to improve the planning skills and competencies of anyfirm without the support of appropriate conceptual and operational frameworksand models that could help at simplifying and speeding up the analyses and thedecision making processes.
2.3 Industry and Competitive Environment 67

2.4 Internal Environment
The internal analysis identifies the resources, capabilities and competencies of anorganization and makes more explicit its strengths and weaknesses. Every firm hascurrent and potential strengths and weaknesses, and tries to maximize the formerand minimize the latter. Understanding how to organize a firm’s resources,capabilities and competencies—in terms of identifying factors that can make aneffective contribution to strategic planning—is a crucial challenge for managerswho are called to make strategic decisions. The continuing search for new sourcesof competitive advantage in an increasingly complex and competitive world,highlights the importance of seeking new combinations of resources and compe-tencies that can help companies at developing and maintaining their competi-tiveness over time.
In the managerial literature, the resource-based view has focused on the firm’sresources and capabilities, and on the related strengths that could facilitate acompetitive advantage (Wernerfelt 1984, 1995; Barney 1986a, b, 1991; Grant1991; Peterlaf 1993; Priem and Butler 2001; Collis and Montgomery 1995).Following this view, differences in performance between two firms with the sameexperience are attributed to inside organizational aspects. The resource-based viewcomplements Porter’s five forces framework, which emphasizes the importance ofthe industry structure. In Porter’s view, the more or less implicit assumption aboutthe homogenous nature of the industry constrains managers to focus their attentionon the minimization of costs and/or look for monopolistic or quasi-monopolisticpositions that could generate extra-profits. On the contrary, the resource-basedview takes an inside-out approach, in which a firm plays an active role in achievinga competitive advantage in its market or industry through the deployment of itsinternal resources. Inter-firm differences in performance are affected by the het-erogeneity of the firms’ resources. This heterogeneity is the result of resource-based barriers (Wernerfelt 1984) and of the extent to which competitors are able orunable to replicate the firm’s peculiar resources. The imperfections in the marketstrategic factors (Barney 1986b) and the speed of imitation are therefore criticalissues that can affect the sustainability of a competitive advantage.
In the following sections, we analyze the internal environment with reference toan adaptation of Grant’s framework (1991) for strategy formulation, composed offive steps:
1. Identification and classification of resources in terms of strengths andweaknesses.
2. Identification of capabilities and competencies in terms of what a firm can dobetter than its rivals.
3. Appraisal of the rent-generating potential of resources, capabilities andcompetencies in terms of ability to sustain a competitive advantage and theappropriability of its returns.
4. Definition of a strategy which exploits the resources, capabilities and compe-tencies, in relation to the external opportunities.
68 2 External and Internal Analysis of the Environment

5. Identification of gaps in resources, capabilities and competencies, and replen-ishment of these gaps or augmentation of these assets through appropriateinvestments.
2.4.1 Resources
Resources are productive assets that a firm can utilize and control. FollowingBarney (1991), resources can be divided into three categories: physical, human,and organizational capital resources:
• Physical capital resources refer to the technology used in a firm, its geographiclocation and its access to raw materials.
• Human capital resources include training, experience, judgment, relationships,and know-how of the firm’s workers.
• Organizational capital resources include a firm’s formal reporting structure, itsformal or informal planning, controlling and coordinating systems, and itsinformal relationships with the environment.
Other classifications simply divide resources into tangible and intangible assets.Tangible assets include plants, equipment, land, inventories and other assets thathave a physical form. Although manufacturing assets are generally tangible, theycan be complemented by processes that incorporate intangible attributes such asquality, knowledge and experience. These intangible attributes make the supplychain processes unique and support the creation of a competitive advantage. Otherintangible assets are, for example, patents, trademarks, copyrights, goodwill,culture and reputation. In general, intangible resources are more valuable thantangible resources, especially from a competitive perspective. However, rarely themarket value of intangible resources is recorded in the company’s financialstatements: if it is recorded, it is often underestimated. Items which show adivergence between balance sheet valuations and market value are, for example:R&D expenditures, brand names, trademarks, reputation and culture.
R&D expenditures can help firms to accumulate experience and knowledge ona particular technology or technique. The R&D process transforms tacit andcomplex knowledge (the tacit knowledge is deeply embedded in the employees’experience and in the firm’s culture) into codified knowledge (explicit) that pro-duces outputs like patents, copyrights or products. In order to assess the relevanceand intensity of R&D expenditures, it is important to understand that while thevalue of past R&D expenditures is known and reflected, at least to some extent,in a firm’s market value, future returns are strictly dependent on knowledge that isstill tacit.
Brand names, trademarks and reputation are also intangible assets that affect theprice premium that customers are willing to pay. Brand awareness can help acompany to increase its profits also in unrelated businesses. For example, the Hello
2.4 Internal Environment 69

Kitty’s brand has allowed the company to command a premium price in itsindustry (comics and cartoons), and especially to license its name to the manu-facturers of gadgets, clothing, candies and toys. Figure 2.11 shows the brand valueof the top 20 firms ranked by Interbrand, that compares brands in terms of portionof the firm’s economic value that is attributable to its brand. This entity is mea-sured multiplying the firm’s value (both the economic value added—EVA—streams on a 5-year forecasting period, and the terminal value) by the role of thebrand, which is estimated in terms of portion of the consumers’ purchase decisionsthat is attributable to it. The metrics more frequently used to measure the valuecreated by a strategy (and by its levers) will be described in the second volume ofthis series (see, for an in-depth analysis, Venanzi 2011). In any case, we should saythat the brand value listed in the figure is not that evident from most companies’balance sheets.
Another intangible resource with great strategic importance is the corporateculture. Corporate culture is the collection of values, beliefs, traditions and socialnorms shared and transmitted from one generation of employees to another. Thecultural integration depends not only on the employees’ ability to harmonize theirefforts and integrate their separate skills, but also on the organization’s ability to givethem a sense of identity (Kotter and Heskett 1992; Schein 1985; Hofstede 2001).
Obviously, not all the resources of a firm can be considered as relevant from astrategic perspective. On top of this, one resource alone is not sufficient for gaininga competitive advantage which is, in fact, the result of a unique combination ofvarious resources. In any case, a firm can create additional value from itsresources, following two paths:
• Economize the use of a resource: the firm may exploit the opportunity to usefewer resources to support the same level of activity, or to use the existingresources to support a larger volume of business. The ability to maximizeproductivity and process efficiencies, and to exploit potential economies ofscale, is particularly important in the case of tangible resources such as plant,machinery, finance and people.
• Employ the existing assets more profitably: for example, resources can be put tomore profitable use through their reallocation to the different strategic tools (seealso what we said in Sect. 1.9.3).
2.4.2 Capabilities and Competencies
The managerial literature defines ‘‘capability’’ as the ability to exploit and com-bine the firm’s resources. Individual resources must work together to createorganizational capability, which consists of processes and routines that allow forthe combination of resources and the implementation of the business activities.
In order to identify a firm’s capabilities in its various functional areas it is nec-essary to disaggregate its activities. For example, flexibility, speed of response, and
70 2 External and Internal Analysis of the Environment

efficiency in production volumes are capabilities related to the operations function.Efficiency of order processing, speed of distribution and sales promotion are capa-bilities related to the sales and distribution function. A famous way of disaggregatingthe firm’s activities is that suggested by the value chain analysis (Porter 1985). Porterseparates the individual activities of the firm into a sequential chain, and classifiesthem into two major groups: primary and support activities (Fig. 2.12).
The primary activities directly transform, commercialize and distribute theproduct. Support activities create and provide the necessary support that facilitatesthe realization of the primary activities. Specifically, the primary activities areclassified as follows:
• Inbound Logistics. These activities are required to receive, store and dissem-inate inputs such as raw materials, semi-finished or finished products andcomponents which are used in the production process. Also for service indus-tries, inbound logistics involve relationships with suppliers and include all thenecessary activities for collecting data, information and knowledge.
• Operations. These activities are associated with the transformation of inputsinto outputs.
• Outbound logistics. These activities are required for collecting, storing anddistributing products or delivering services.
Fig. 2.11 Top 20 brands in 2011 ($m). Source Interbrand (2011)
2.4 Internal Environment 71

• Marketing and sales. These activities are necessary for identifying andreaching potential customers, providing them with the necessary informationabout the value of the firm’s products or services, and convincing them to buy.
• Services. These activities increase or maintain the value of the product after thesale: repair, installation, upgrading, training and customers support are someexamples of services included in this category.
On the other hand, the support activities are classified as follows:
• Procurement. These activities consist in the acquisition of inputs and resourcesrequired for the production process and the other activities in the value chain.
• Human resources management. These activities consist in recruiting, hiring,guiding, training, compensating and motivating personnel.
• Technological development. It supports the value chain activities, such asresearch and development, process automation, etc.
• Infrastructures. These activities support all the firm’s functions and includedepartments such as administration, planning and control, finance, governmentrelations, legal, public affairs, etc.
Primary and support activities contribute to the final value of a firm’s product.The margin is the difference between the total value and the collective cost ofperforming the value activities. The objective of the value chain analysis is tounderstand the ability of a firm to add value through its activities, to define thelinkages between internal and external activities, and to identify where the value iscurrently added, and where it is possible to create value in the future.
Porter’s value chain is therefore a tool for identifying strategically relevantinternal activities and understanding how these activities add value to a firm. Theproblem is to put this idea into practice. First, a firm has to look at a lot of detailsand decide how to apply the idea of value chain to specific situations in order toperform the activities in a cost-effective way or better than its competitors.The value chain theory is designed for businesses such as those in the automotiveindustry, in which there are a number of sequential steps involved in producing a
Fig. 2.12 The corporate value chain. Source Porter (1985)
72 2 External and Internal Analysis of the Environment

product that can be performed by a number of companies, each one with its owninbound and outbound logistics and manufacturing. The application of the physicalvalue chain model in some industries gives the impression of being out-of-date andinefficient in a rapid change environment. In contrast, many firms have a con-stellation business model (e.g. internet business models) in which each firm usesthe others for specific business activities (Norman and Ramirez 1994). In this case,the various activities are not necessarily conducted in a sequence, but in a way thatcould best reach maximum efficiency and effectiveness. For example, in a com-puter production, the microprocessor’s producer works in an autonomous waywithout interaction with software producers or assemblers. In cases like this thevalue added is generated by a network of activities that work in parallel, some-times with a strong level of integration and other times with tenuous forms ofcoordination.
Secondly, the analysis of structures and locations of costs and revenues isaffected by the environmental uncertainties on the configuration of the value chain.There may be a shift from ownership to rental of resources, from fixed to variablecosts. Optimizing and coordinating linked activities may lead to more optimalmake or buy decisions (Hergert and Morris 1989). Particularly for small-sizedfirms, the analysis for calculating a value for intermediate products, isolating thekey cost drivers, identifying linkages across activities, and estimating suppliers’and customers’ margins, can be extremely complex.
Thirdly, if a firm has an integrated value chain across geographical and politicalboundaries, many players are involved in its international operations. A globalstrategy tends to create a more complex way of doing business. In order to gain aglobal competitive advantage, a firm must configure and coordinate its value chainacross national boundaries, deciding where and in how many nations each activityis to be performed, and how to coordinate international activities that are geo-graphically distant. A firm should carefully estimate different value elements suchas customer preferences, distribution systems, promotion strategies that may bedifferent from country to country. At the same time, a firm can gain cost advan-tages by configuring its value chain so that each activity is located in the countrywhere the factors’ costs are lower. However, value creating activities are linked toeach other, and one activity affects the others. In this sense, in order to achieve acompetitive advantage, it is necessary to optimize the coordination of the linkedactivities instead of viewing them as independent revenue or cost centers.
Finally, the analysis becomes more difficult when a firm makes several productsor services. In this case, the firm has a different value chain for each product line,especially in relation to the primary activities. It is therefore important to under-stand the potential connections among activities of different product lines orbusiness units. Economies of scale or scope (that can be defined as the possibilityof reducing the average cost of multiple products, thanks to the synergies createdby sharing common resources) might be reached by combining two or moreproduct lines in activities such as distribution (for example, using common logisticsystems) marketing (for example, using the same advertising campaign and dis-tribution channels) or production (for example, exploiting shared manufacturing
2.4 Internal Environment 73

facilities). In order to gain these advantages, a firm must be able to integrate theskills of the individuals with its tangible and intangible resources: this cannot berealized without specific guidelines, procedures, and organizational routines thatcreate regular and predictable patterns of activities for all the concerned parties(Nelson and Winter 1982).
The methodical analysis of these value activities can help a firm to betterunderstand its capabilities and evaluate its strengths and weaknesses. Creatingroutines is an essential step in translating directions and operating practices intocapabilities. The value chain activities are normally disaggregated into morespecific actions performed by individuals. For example, McDonald’s gives precisedirections and advice for making a hamburger: in each restaurant, the operatingmanuals provide the same directions for performing tasks such as removing meat,cheese, sauce, bread and vegetables from the refrigerator, assembling the ingre-dients (with an estimate of the time required for each sub-activity), grilling thehamburger, placing it in its package, and serving it to the customer. If McDonald’sutilizes a high number of routines, other firms may prefer a flexible structure torespond to changes in their environment. The relevance of the trade-off betweenefficiency and flexibility is strictly dependent on the value chain that characterizesthe industry of interest. Flexibility corresponds to the fluid process of continuousadjustment required to react quickly to novel situations, compared to standardi-zation, formalization, specialization, hierarchy and routines that characterizeefficiency. Firms should adopt a bureaucratic form if the tasks to be performed aresimple and stable and the goal is efficiency, and adopt a flexible approach if thetasks are complex and changing (Burns and Stalker 1961). Several researchershave analyzed the trade-off between efficiency and flexibility and the choicebetween machine bureaucracy vs. the so-called adhocracy (Mintzberg 1979) or, inother words, the choice between ‘‘adaptive’’ learning based on formal rules andhierarchical controls, and ‘‘generative’’ learning relying on shared values, team-work and lateral communication (McGill et al. 1992). In any case, from a strategicperspective, firms must decide between a strategy of dynamic effectivenessthrough flexibility and a more static efficiency through a more rigid discipline.Ghemawat and Costa (1993) argue that if a firm wants to follow both goalssimultaneously, it may lose the benefit of the complementarities that characterizethe two different types of organization, due to the need for mixing the organiza-tional elements appropriate to each strategy.
Teece et al. (1997) introduced the concept of dynamic capabilities to emphasizethe key role of strategic management in adapting, integrating and renewing internaland external organizational skills, resources and functional competencies to matchthe requirements of a changing environment. The competitive advantage depends ondistinctive processes and on the ability to adopt dynamic capabilities to create newdistinct competencies, new organizational routines and new specific assets.
Competence is a more complex concept than resource. Firms might have thesame set of resources but these resources may be managed in different ways tomeet different objectives. From this perspective, firms might develop uniquepatterns of resource and skill deployment to distinguish themselves from their
74 2 External and Internal Analysis of the Environment
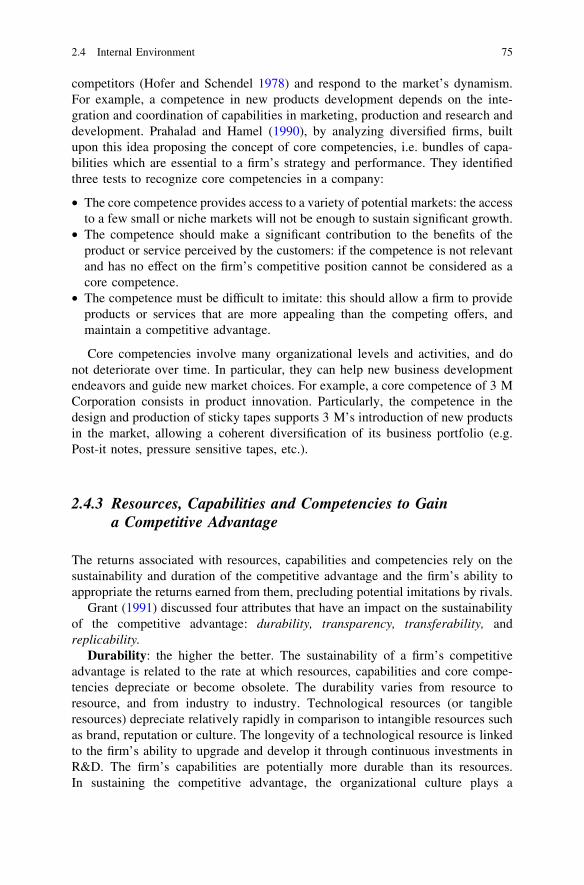
competitors (Hofer and Schendel 1978) and respond to the market’s dynamism.For example, a competence in new products development depends on the inte-gration and coordination of capabilities in marketing, production and research anddevelopment. Prahalad and Hamel (1990), by analyzing diversified firms, builtupon this idea proposing the concept of core competencies, i.e. bundles of capa-bilities which are essential to a firm’s strategy and performance. They identifiedthree tests to recognize core competencies in a company:
• The core competence provides access to a variety of potential markets: the accessto a few small or niche markets will not be enough to sustain significant growth.
• The competence should make a significant contribution to the benefits of theproduct or service perceived by the customers: if the competence is not relevantand has no effect on the firm’s competitive position cannot be considered as acore competence.
• The competence must be difficult to imitate: this should allow a firm to provideproducts or services that are more appealing than the competing offers, andmaintain a competitive advantage.
Core competencies involve many organizational levels and activities, and donot deteriorate over time. In particular, they can help new business developmentendeavors and guide new market choices. For example, a core competence of 3 MCorporation consists in product innovation. Particularly, the competence in thedesign and production of sticky tapes supports 3 M’s introduction of new productsin the market, allowing a coherent diversification of its business portfolio (e.g.Post-it notes, pressure sensitive tapes, etc.).
2.4.3 Resources, Capabilities and Competencies to Gaina Competitive Advantage
The returns associated with resources, capabilities and competencies rely on thesustainability and duration of the competitive advantage and the firm’s ability toappropriate the returns earned from them, precluding potential imitations by rivals.
Grant (1991) discussed four attributes that have an impact on the sustainabilityof the competitive advantage: durability, transparency, transferability, andreplicability.
Durability: the higher the better. The sustainability of a firm’s competitiveadvantage is related to the rate at which resources, capabilities and core compe-tencies depreciate or become obsolete. The durability varies from resource toresource, and from industry to industry. Technological resources (or tangibleresources) depreciate relatively rapidly in comparison to intangible resources suchas brand, reputation or culture. The longevity of a technological resource is linkedto the firm’s ability to upgrade and develop it through continuous investments inR&D. The firm’s capabilities are potentially more durable than its resources.In sustaining the competitive advantage, the organizational culture plays a
2.4 Internal Environment 75

strategic role in maintaining and renewing capabilities through the aggregation andsocialization of new employees. 3M’s capability in new product introduction,McDonald’s capability in training employees and Ferrari’s capability in the pro-duction of luxury sport cars have all been maintained over several generations ofemployees.
Transparency: the lower the better. The sustainability of a firm’s competitiveadvantage is related to the rate at which resources, capabilities and core compe-tencies can be imitated by rivals. Imitation depends on the rivals’ ability tounderstand which the nature of the competitive advantage is and how it isachievable (see Barney 1991), not to mention the problem of duplicating resour-ces, capabilities or core competencies, once the nature of the competitiveadvantage has been discovered. Michael Dell, founder of Dell Inc., said ‘‘Otherscan understand what we do, but they can’t do it’’: if a firm wants to imitate Dell’sstrategy, it must identify the capabilities that permit Dell to gain a competitiveadvantage and then determine which resources are required to replicate thesecapabilities. Today (2012), Google’s superior performance is multidimensionaland is more difficult to understand than when the company was simply a searchengine. Amazon.com is another example of firm’s capabilities which require acomplex pattern of coordination of a large numbers of diverse resources andcapabilities, from order processing and sales promotion to delivery: this coordi-nated system is more difficult to understand than a capability which rests upon theexploitation of a single dominant resource.
Transferability: the lower the better. If firms can easily acquire the resourcesrequired to obtain a competitive advantage in the market, the established firms’competitive advantage will be short lived due to a high imitation rate. The imperfectmobility of resources depends on their high specificity and the difficulty of recreatingthe same value in contexts that are different from those in which the value was initiallycreated and the resources were accumulated (Dierickx and Cool 1989). For thisreason, when resources become available in the market, they lose their ability tosupport a sustainable competitive advantage. Obstacles to the transferability ofresources depend on one or more of the following factors (Grant 1991):
• Geographical immobility. The costs of relocating large items of capital equip-ment and highly specialized employees represent a significant barrier for firmsthat want to gain a competitive advantage through relocation: for example, it isalmost impossible to replicate the Parmigiano Reggiano cheese, if a firm haslimited access to resources such as land and climate that are typical of theregion.
• Imperfect information. The heterogeneity of resources and the imperfectknowledge of the potential productivity of individual resources are difficultiesthat the purchaser of the resources often finds out only after having acquiredthem (overestimation of performance and/or underestimation of costs).
• Firm-specific resources. The value of a resource may decrease due to its transfer.Mergers and acquisitions, for examples, aim at generating higher shareholderswealth from the aggregation of two or more entities, but often the synergies
76 2 External and Internal Analysis of the Environment

remain only on paper. Savings can be achieved when two companies can pro-duce and distribute their products more efficiently than when they were apart.However, in the case of the Daimler-Chrysler merger, the different companies’cultures and a poorly integrated management structure eroded the potentialsynergies and consequently the firm’s value. In fact, a strategic resource used bya company can produce superior results as part of a very specific context: thecomplexity involved in the process that generated its superiority (Reed and DeFillippi 1990) and the presence of causal ambiguity (Rumelt 1984; Dierickx andCool 1989) are barriers to imitation that are difficult to overcome. In otherwords, it is difficult to understand which factors are the reason of a givencompany’s competitive success (i.e. the links between cause and effect). In thiscase, resources can only be transferred by acquiring the company as a whole.
• The immobility of capabilities. Capabilities require the interaction betweenresources and individuals. In order to acquire the same capabilities, it is oftennecessary to transfer the whole team that managed the resources: however, evenif the resources are transferred together with the team, the recreation of capa-bilities in a new context is uncertain, due to the difficulty of sharing tacitknowledge and unconscious coordination systems.
Replicability: the lower the better. A sustainable competitive advantagedepends on a low level of imitability and replicability, which inhibits potentialmarket entrants and maintains a higher level of profit for the established firms(Lippman and Rumelt 1982).
Replicability is the competitors’ ability to duplicate resources and capabilities.In the telecommunication industry, a new mobile tariff can be easily copied bycompetitors. In retailing, opening hours or loyalty cards are strategic choiceswhich are easy to imitate. On the other hand, some capabilities are difficult toreplicate because they depend on complex organizational routines or corporatecultures. For example, American and European firms have introduced the just-in-time processes in their manufacturing practices but with modest results if com-pared to those obtained by Japanese firms. These processes do not necessarilyrequire sophisticated knowledge or complex operating systems, but a culturalattitude in cooperation among all the interested parties that is difficult to imitate.
2.4.4 Strategy Selection and Gaps Identification
After having analyzed the potential competitive advantage of resources, capabil-ities and competencies, a firm should select the strategy that best exploits them inrelation to the external opportunities and constraints. Coherently with the strategyand its competitive position, the firm will invest in reducing the most relevant gapsin resources, capabilities and competencies in comparison with its rivals. If thereare resources, capabilities and competencies which are durable, difficult to identifyand understand by the competitors, imperfectly transferable and not easily
2.4 Internal Environment 77

replicable, it will be imperative to protect them in order to maintain the relatedcompetitive advantage. Even if it is difficult to estimate the potential performanceof different resources and capabilities and predict the consequences of unexpectedcompetitive reactions that may interfere with the strategic choices, without anestimate of the various potential outcomes of the selected strategy, the strategicplanning process will be very similar to a game of pure luck.
The planning process and the most relevant types of strategic options will bedescribed in more detail in the second volume of this series.The plan usuallyincludes the provision of replacement investments to preserve and augment thefirm’s stock of resources in order to better exploit the firm’s strategic opportuni-ties. Harmonizing the exploitation of the existing resources, capabilities andcompetencies with the investments aimed at developing them in a medium-longterm perspective, is a central task in strategy formulation.
2.5 SWOT Analysis: A Simple Framework for Assessingthe Firm’s Position Against the Environment
‘‘SWOT’’ is the acronym that refers to the Strengths and/or Weaknesses of a an organi-zation (internal aspects), in relation to the potential Opportunities and/or Threats presentedby the context (external environment, industry, market) in which it operates.
A systematic analysis and interpretation of these aspects, based also on what wesaid in the previous pages, can certainly be helpful for identifying courses of actionsthat exploit the strengths or overcome the weaknesses of the interested entities:profit or nonprofit organizations, institutions, associations, or even individuals.
However, among the incredible number of books, articles, and papers that havedescribed and discussed this famous analytical ‘‘tool’’, it is practically impossibleto find anything that goes beyond simple checklists, or provides ‘‘actionable’’suggestions: we will therefore attempt to fill this gap, with particular reference tothe logical and methodological approach that, in our view, should be adopted inaddressing the issue from a strategic perspective, with particular reference to acompany that competes in any given industry.
2.5.1 The Importance of Distinguishing Among Businesses
First of all, nobody seems to acknowledge the fact that the type and theimportance of strengths, weaknesses, opportunities, and threats, could changesignificantly depending on the various businesses in which the firm operates:all the examples of SWOT analysis provided in the literature apparently assumethat the exercise should be conducted in relation to the overall firm’s character-istics and activities.
78 2 External and Internal Analysis of the Environment

If we look at the list of items in Figs. 2.13 and 2.14, we immediately see thatsome of them could be relevant for a specific business, and less relevant foranother, within the same business portfolio of a company.
For example:
• an easy access to specific components could be a strength for manufacturingstandardized equipment, and less relevant or totally irrelevant for the productionof customized machinery, by the same company, that requires original designand custom-made components;
• new demographic trends in the consumption of corn flakes for breakfast couldbe a threat for a company that produces biscuits, but totally irrelevant for itsproduction of pasta.
On the other hand, some strengths or weaknesses such as, respectively, anexperienced sales force or slow decision making processes, could be relevant formultiple businesses, but to a different extent, depending on these businesses’characteristics and competitive environments. In fact, also the opportunities andthreats presented by the external environment can be either relevant in general, forall the company’s activities, or business specific, i.e. applicable only to welldefined market contexts.
It is also obvious that the same factor could represent a strength or a weakness,an opportunity or a threat, depending on the perspective from which it is beingconsidered and on the competitive context. For example:
• an Export Manager who speaks several languages, except Chinese, will prob-ably be a strength in most cases, but if the company wants to enter China, andother foreign competitors have mother tongue Resident Area Managers inShanghai and Beijing, this will certainly be a weakness;
• a new technology could be an opportunity for a company that is very alert to newdevelopments and willing to invest in them with the appropriate equipment, know-how, and professional resources, but could be a major threat even for large com-panies that do not react promptly: think of Kodak with the digital photography!
2.5.1.1 How to Identify the Relevant Factors
Also in the area of potential guidelines for identifying the relevant factors for aSWOT analysis, the literature is rather vague.
While it is relatively easy to identify categories of opportunities and threatsrelated to the external and the industry environment (see, in particular, what wesaid about the macro-environmental factors and Porter’s competitive forces,including the framework presented in Figs. 2.2, 2.3, 2.4, 2.5, 2.6, little systematicattention is paid to ways of identifying all the possible factors that could representstrengths and weaknesses.
In Fig. 2.15 we attempt a systematization of these factors, summing up as muchas possible what we have been saying in this book about the relevant
2.5 SWOT Analysis 79

characteristics of a firm in a competitive environment (in particular: resources,capabilities, competencies), and their interrelationships.
The three categories of factors in the upper right part of the figure are mainlyrelated to the overall corporate characteristics of the firm, while the others nor-mally refer to its activities and performance in specific businesses.
Each factor will need to be broken down in its major components, depending onthe context. For example:
• the performance in managing the direct tools or the primary activities could bearticulated in terms of ability to manage the sales force or the distributionchannels (e.g. dealers), if these aspects are particularly relevant for satisfying themarket needs in terms of service in a B2B industry;
• the performance in terms of value could be articulated looking at the ability todeliver the best level of service or the best functional quality;
• the performance in terms of market results could be articulated based on adistinction between coverage (how many clients are being served out of thosethat the company is able to reach) or penetration (the ratio between the averagesales per client and his average purchase potential in the specific business ofinterest);
• and so on …
Fig. 2.13 Selected examples of strengths and weaknesses
Fig. 2.14 Selected examples of opportunities and threats
80 2 External and Internal Analysis of the Environment

Fig. 2.15 The virtuous (or vicious!) circle for identifying strengths and weaknesses
Fig. 2.16 An example of ‘‘focused’’ SWOT analysis
2.5 SWOT Analysis 81

Obviously, the linkages among factors are not necessarily sequential in a reallife situation, but the arrows in the figure have the purpose of showing some oftheir unquestionable (and inevitable) interrelationships.
2.5.2 How to Identify Relevant Optionsand Courses of Action
In any case, limiting the analysis to a checklist of items, without explicitly con-sidering the intersections between specific strengths or weaknesses and theopportunities and threats to which they are directly related (as we can see in mostSWOT exercises), does not make any sense.
If the purpose of the analysis is to identify courses of action for improving thecompany’s ability to compete (otherwise, why bother?), each individual strengthor weakness must be explicitly connected to a single opportunity or threat, andthis connection must be able to suggest something to do: otherwise, the entireexercise is a total waste of time.
In other words, the conditio sine qua non for the identification of an opportunityor threat is the existence of a strength or weakness directly related to it, and viceversa.
This concept is exemplified in Fig. 2.16, in which all the ‘‘actionable’’ inter-sections are identified with numbers representing, for example, priorities, and thebroken lines identify possible connections and synergies between the courses ofaction, while all the other intersections are rather irrelevant.
This example is a simplified and adapted excerpt of an actual SWOT analysisconducted for a multinational non-profit institution: it is evident that the sameconceptual and methodological approach can be adopted for any type of organi-zation, and that the identification of specific courses of action can represent anappropriate test of its usefulness.
References
Abell DF (1980) Defining the business: the starting point of strategic planning. Prentice-Hall,Englewood Cliffs
Abell DF, Hammond JB (1979) Strategic market planning: problem and analytical approaches.Prentice-Hall, Englewood Cliffs
Aguilar FJ (1967) Scanning the business environment. Macmillan, New YorkAndrews K (1980) The concept of corporate strategy. Dow-Jones Irwin, HomewoodBarney JB (1991) Firm resources and sustained competitive advantage. J Manag 17:99–120Barney JB (1986a) Organizational culture: can it be a source of sustained competitive advantage?
Acad Manag Rev 11:656–665Barney JB (1986b) Strategic factor markets: expectations, luck and business strategy. Manag Sci
32:1231–1241Brandenburger AM, Nalebuff BJ (1996) Co-opetition. HarperCollins, London
82 2 External and Internal Analysis of the Environment

Burns T, Stalker GM (1961) The management of innovation. Tavistock, LondonBuysse K, Verbeke A (2003) Proactive environmental strategies: a stakeholder management
perspective. Strateg Manag J 24:453–470Collis D, Montgomery C (1995) Competing on resources: strategy in the 1990s. Harvard Bus Rev
73:119–128Dierickx I, Cool K (1989) Asset stock accumulation and sustainability of competitive advantage.
Manage Sci 35:1504–1513Donaldson T, Preston LE (1995) The stakeholder theory of the corporation: Concepts, evidence,
and implications. Acad Manag Rev 20:65–91Freeman RE (1984) Strategic management: a stakeholder approach. Pitman, BostonFriedman AL, Miles S (2001) Developing a stakeholder theory. J Manag Stud 39:1–21Ghemawat P (2010) Strategy and the business landscape. Prentice Hall, Upper Saddle RiverGhemawat P, Costa JR (1993) The organizational tension between static and dynamic efficiency.
Strateg Manag J 14:59–73Grant RM (1991) The Resource-based theory of competitive advantage: Implications for strategy
formulation. California Manag Rev 33:114–135Hambrick D (1982) Environmental scanning and organizational strategy. Strateg Manag J 3:
159–174Hergert M, Morris D (1989) Accounting data for value chain analysis. Strateg Manag J 10:
175–188Hofer CW, Schendel D (1978) Strategy formulation: analytical concepts. West Group, St. PaulHofstede G (2001) Culture’s consequences. Sage, Thousand OaksInterbrand (2011) Best Global brands 2011. www.bestglobalbrands.comKotter JP, Heskett JL (1992) Culture and performance. Free Press, New YorkLevitt T (1975) Marketing myopia. Harvard Bus Rev 53:26–48Lippman SA, Rumelt DP (1982) Uncertain imitability: an analysis of interfirm differences in
efficiency under competition. Bell J Econ 13:418–438McGill ME, Slocum JW, Lei D (1992) Management practices in learning organizations.
Organization Dynamics. Summer, pp 5–17Mintzberg H (1979) The structuring of organizations. PrenticeHall, Englewood CliffsMitchel RK, Wood JD, Agle BR (1997) Towards a theory of stakeholders identification and
salience: defining the principle of who and what really counts. Acad Manag Rev 22:853–887Mizik N, Jacobson R (2003) Trading off between value creation and value appropriation: The
financial implications of shifts in strategic emphasis. Journal Mark 67:63–76Nelson RR, Winter SJ (1982) An evolutionary theory of economic change. Harvard University
Press, BostonNorman R, Ramirez R (1994) Designing interactive strategy: from value chain to value
constellation. John Wiley & Sons, ChichesterPeterlaf MA (1993) The cornerstones of competitive advantage: a resource-based view. Strateg
Manag J 14:179–192Petersen B, Strongin S (1996) Why are some industries more cyclical than others?’’. J Bus Econ
Stat 14:189–198Porter ME (1985) Competitive advantage: creating and sustaining superior performance. Free
Press, New YorkPorter ME (2001) Strategy and the internet. Harvard Bus Rev 79:63–78Prahalad CK, Hamel G (1990) The core competence of the corporation. Harvard Bus Rev 68:
79–91Priem RL, Butler JE (2001) Is the resource-based theory a useful perspective for strategic
management research? Acad Manag Rev 26:22–40Reed R, De Fillippi RJ (1990) Causal ambiguity, barriers to imitation, and sustainable
competitive advantage. Acad Manag Rev 15:88–102Roberts EB, Berry CA (1985) Entering new businesses—selecting strategies for success. Sloan
Manag Rev 26:3–17
References 83

Rumelt RP (1984) Towards a strategic theory of the firm. In: Lamb RB (ed) Competitive strategicmanagement. Prentice Hall, Englewood Cliffs
Schein EH (1985) Organizational culture and leadership. Jossey-Bass, San FranciscoShapiro C, Varian HR (1999) Information rules: a strategic guide to the network economy.
Harvard Business School Press, BostonTeece DJ, Pisano G, Shuen A (1997) Dynamic capabilities and strategic management. Strateg
Manag J 18:509–533Venanzi D (2011) Financial performance measures and value creation: the state of the art.
Springer Briefs in Business, Springer, NewYorkWernerfelt B (1984) The Resource-based view of the firm. Strateg Manag J 5:171–180Wernerfelt B (1995) The resource-based view of the firm: ten years after. Strateg Manag J
16:171–174
84 2 External and Internal Analysis of the Environment
Related Documents


