1

Welcome message from author
This document is posted to help you gain knowledge. Please leave a comment to let me know what you think about it! Share it to your friends and learn new things together.
Transcript

1

2
Strategy 4 Table of Contents Introduction and Strategy 4 Learning Objectives……………………………………………………...3 Key TPM Terms and Definitions……………………………………………………............................4 Unit 4.1 The Role of Talent Flow Analysis in Talent Pipeline Management………………………..6 Exercise 1: Talent Flow Employer Collaborative Case Study Unit 4.2 Identifying the Tiers and Roles of Talent Providers in Talent Pipelines…………………14 Exercise 2: Analyzing Talent Pipelines Case Study Unit 4.3 Conducting Back Mapping with Employer Collaboratives………………………………...16 Unit 4.4 Conducting Talent Flow Analysis with Other Data Partners……………………………...20 Ready for Next Steps?.....................……………………………………………..............................24

3
Introduction
So far we have covered how employer collaboratives organize and
communicate their demand. More specifically, we covered how
collaboratives identify their focus areas and critical business functions
and jobs (Strategy 1), and how they communicate projected job
openings (Strategy 2) and the hiring requirements for filling those jobs
(Strategy 3). Producing this information not only has been critical for
better, more granular data that employers can use to close their skills
gap, but it has also helped build trust among employer collaborative
members and proved that they can work together to produce
actionable results.
Strategy 4 is an important step employer collaboratives must take
before building talent supply chain solutions. Talent Flow Analysis
seeks to aggregate and share data among collaborative members that
addresses the following critical questions: As a collaborative, where
have we traditionally found talent, and do we have the necessary flows
of talent from those partners to meet our projected demand? What is
the potential capacity of this pipeline to maintain and increase these
flows now and into the future?
We start by using data currently held by employer collaborative
members to identify and analyze their existing and potential talent
provider networks. Whereas previous strategies concentrated on how
to focus and communicate demand, back mapping and talent flow
analysis focuses on supply. In Strategy 4, we will introduce ways to
identify current and prospective education and workforce providers
that will be critical in helping employers fill open jobs. Strategy 4
provides value to employers because it encourages them to use their
own data to improve their talent-sourcing strategies based on leading
business practices.
In addition, this is the first strategy where employer collaboratives
more directly engage current and future talent providers and
government partners in gathering information about talent flows and
talent pipeline capacity. This strategy encourages employer
collaboratives to compile and share information with their provider
partners to promote a shared understanding of where they are in
developing a talent pipeline that is capable of addressing employer
needs now and into the future.
Strategy 4 Learning Objectives
1. Explain the role of back mapping and talent flow analysis in Talent Pipeline Management (TPM) and how it differs from traditional government approaches to talent supply analysis.
2. Identify the tiers and
roles of talent providers within a talent provider network.
3. Explain how to conduct
back mapping and talent flow analysis using employer data and other data sources.
4. Create tables,
graphics, and other visualization tools that help map talent provider networks.

4
Key TPM Terms and Definitions
Back Mapping: A TPM process that helps employer collaboratives identify the major sources of
qualified talent by analyzing performance and applicant tracking data and identifying direct (Tier
1) and indirect (Tiers 2 and higher) sources that provided the education and training for the most
critical competencies and credentials for target positions.
Talent Flow Analysis: A TPM process for helping employer collaboratives work with
government agencies and other data providers to analyze talent in-flows and out-flows (includes
all existing and potential sources of talent where data are available) to use to improve their
talent pipelines.
Talent In-Flows: The number and characteristics of people hired by an employer, an employer
collaborative, employers within the same industry or industry sector of the collaborative, and/or
within the major geographic area defined by the employer collaborative for recruiting talent.
Talent Out-Flows: The number and characteristics of people previously hired but no longer
working for an employer, an employer collaborative, employers within the same industry or
industry sector of the collaborative, and/or within the major geographic area defined by the
employer collaborative for recruiting talent.
Capture Rate: The percentage of talent coming from the talent pipeline (identified providers)
that is hired and retained by employers from the employer collaborative or employers within the
same industry or geographic area over a designated time period.
Leakage Rate: The percentage of talent coming from the talent pipeline (identified providers)
that is not hired and/or hired but not retained by employers from the employer collaborative or
employers within the same industry or geographic area over a designated time period.
Human Resource Information System (HRIS): An information technology (IT) system that
captures all aspects of human resources data in a centralized place and supports employee
recruitment, hiring, performance, and benefits management.
Applicant Tracking System (ATS): A software application that manages employee recruitment
activities, including job postings, resume application screening and warehousing, interview
management, and hiring decisions.
Provider Roles: The types of services provided by talent providers within the employer
collaborative value stream, from career awareness and exploration to employee advancement
and retention. Partners can play one or more roles in one or more tiers, although most play a
predominate role in a single tier.

5
Provider Tiers: The position of partners within talent pipelines in relationship to the employer
end-customer. Tier 1 partners provide talent directly to employers (e.g., colleges, staffing
agencies), and Tier 2 and higher provide talent to lower-tier partners (e.g., high schools,
vocational schools).
Value Stream: The process that a product or service goes through from beginning to end, with
each step adding incremental value until the product reaches the end-customer.

6
Unit 4.1 The Role of Talent Flow Analysis in Talent Pipeline Management
Talent flow analysis is the critical starting point that leads to building and managing talent
pipelines (Strategy 5) that have the capacity and performance needed to address projected
demand. The process plays two essential roles: baseline talent pipeline analysis and talent
pipeline performance tracking.
Baseline Talent Pipeline Analysis. Talent flow analysis identifies and maps the
existing and potential talent provider networks for providing the qualified talent to fill job
openings. This analysis includes all major sources of talent, including other employers.
Talent flow analysis starts with a baseline analysis of the existing sources of hires or all
qualified applicants—called “back mapping.”
This analysis focuses on the sources of talent rather than the talent sourcing strategies
used to recruit and hire qualified talent from these sources. For example, many
employers identify and hire qualified talent based on employee referrals and recruiters.
These are two different strategies that might not tap the same sources of talent coming
from other employers or education and workforce providers. In addition, this analysis can
also be applied to people who are experienced workers currently in the labor force and
newly trained entrants, as well as experienced workers who have been out of the labor
force for a while.
Back mapping helps identify the relative position of the provider in the network, from the
most direct connection to employers (Tier 1) to more indirect roles (Tiers 2 and higher),
plus the role it plays based on the services it provides (e.g., pre-employment training).
These tiers and roles are explained in more depth in Unit 4.2. The process can then
expand to a more comprehensive talent flow analysis that shows flows of talent both into
and out of the employers in your collaborative.1
This larger talent flow analysis also addresses the capacity of existing providers (e.g.,
actual or potential enrollments in training programs) and identifies other potential
providers that should be explored in developing a talent pipeline that meets the needs of
the employer collaborative.
1 This unit is based on a U.S. Chamber Foundation publication and is provided as a background resource on the TPM website: Andrew Reamer, Robert Sheets, and David Stevens, Analyzing Talent Flow: Identifying Opportunities for Improvement (Washington, D.C.: U.S. Chamber of Commerce Foundation, 2015).

7
Because other employers also are talent sources, this baseline analysis provides
information on whether employer collaboratives have a sufficient supply of qualified
talent to address the needs of all employers in the collaborative.
Talent Pipeline Performance Tracking establishes the data systems that can be used
in Strategy 5 (Build Talent Supply Chains) for measuring and tracking talent pipeline
performance over time.
The performance tracking addresses (1) the “bandwidth” of the pipeline in terms of the
number of qualified people completing and enrolling in programs from existing and
potential talent provider partners and their potential enrollment capacity, and (2) the
effective utilization of this pipeline, such as capture and leakage rates of qualified talent
coming from these talent-provider partners.
Figure 4.1: Example Talent Supply Chain Network

8
Back Mapping: Building on Leading Industry Practices
Some employers, such as Boeing and Alcoa, are improving their recruitment of talent by
analyzing where they get their best talent, especially high performers who are most likely to be
retained. These employers are doing this primarily by analyzing employee job performance data
against hiring and applicant tracking data, both of which can be found in human resource
information systems (HRIS) and applicant tracking systems (ATS). TPM builds on these leading
practices by providing employers with guidelines on how best to analyze performance and
applicant tracking data to identify the best sources of talent as well as new and untapped
sources of talent.
Talent Flow Analysis: New Employer-Driven Approach to Demand-Supply Analysis
Employer collaboratives can build on existing back mapping practices and develop a more
sophisticated approach to analyzing the flows of talent. This includes the flow of talent into and
out of the collaborative’s employer members.
This more advanced practice uses data held by both employers and government to map overall
flows into and out of collaboratives and larger regions for both existing and potential talent
providers. It provides insight into the capacity of existing and potential providers to meet the
projected demand for talent.
Combined with Strategies 2 (Engage in Demand Planning) and 3 (Communicate Competencies
and Credential Requirements), talent flow analysis provides the basis for a new employer-driven
approach to demand-supply analysis. As you will recall, just as Strategies 2 and 3 provided a
new approach to communicating demand, talent flow analysis provides the basis for a new
approach to analyzing the talent supply.
What makes this approach different is that it focuses only on the supply of talent (e.g., number
of graduates or program completers) that employers themselves identify as existing or potential
sources of talent for their most critical positions, rather than the total supply of talent from
providers compiled by government (see Table 4.1: Comparing Government Supply Analysis to
Talent Flow Analysis on page 11 for a side-by-side comparison).
9
In contrast, providers on government lists are assumed to be suppliers because they (1) have
related education and training programs based on government crosswalks between government
occupational classification systems (e.g., Standard Occupational Classification, or SOC, as
discussed in Strategy 2) and provider/program coding systems (e.g., Classification of
Instructional Programs, or CIP), and (2) have physical locations within the geographic area that
government assumes to be the labor market area within which employers hire. But these
assumptions often don’t prove to be useful in terms of actual talent supply.
Talent flow analysis is more focused on determining the actual supply of talent by using data to
determine real and projected flows to employers within or outside of the collaborative and
region.
As a result, talent flow analysis may provide very different estimates of actual supply of qualified
talent within a region compared with traditional government supply estimates.
For example, talent flow analysis may determine that only a few of the many providers within the
geographic area defined by government actually provide qualified talent to the employer
collaborative. This could be because some providers are not addressing the positions identified
by the employer collaborative or addressing the competencies and credentials required by
employers. It also could be that some providers are physically located near employers but most
students are from other regions and return home after graduation.
Talent flow analysis can also identify actual providers outside of the geographic area defined by
government supply estimates, providing a more accurate depiction of where employers get their
most qualified talent.
For example, some health care providers may not recruit nurses from all nursing programs
within a metropolitan area defined as a labor market area for government supply data. Instead,
they might recruit from one or more nursing programs in another metropolitan area, where they
get nurses who are a better fit and have higher rates of retention. The nursing programs from
this metropolitan area would not be counted in government supply estimates for the
metropolitan area where these health care providers are located.

10
Advanced practices in talent flow analysis can also help in identifying potential sources of talent
from outside a state or region when the available labor force is insufficient to enroll more talent
in the programs of state and regional education and workforce partners. This is common in
some regions of the country and in rural areas with declining labor pools and low unemployment
rates. Advanced practices also can help identify alternative, nontraditional sources of talent,
including nonprofit organizations that provide services to adult populations. Many times
employer collaboratives assume that high schools are the major sources of future talent.
However, declining school-age populations in many states and regions require employers to
focus more attention on adult populations as well.
Because of these important differences, employer collaboratives should use talent flow analysis
as the final determination of actual and potential supply of talent in managing talent pipelines.
11
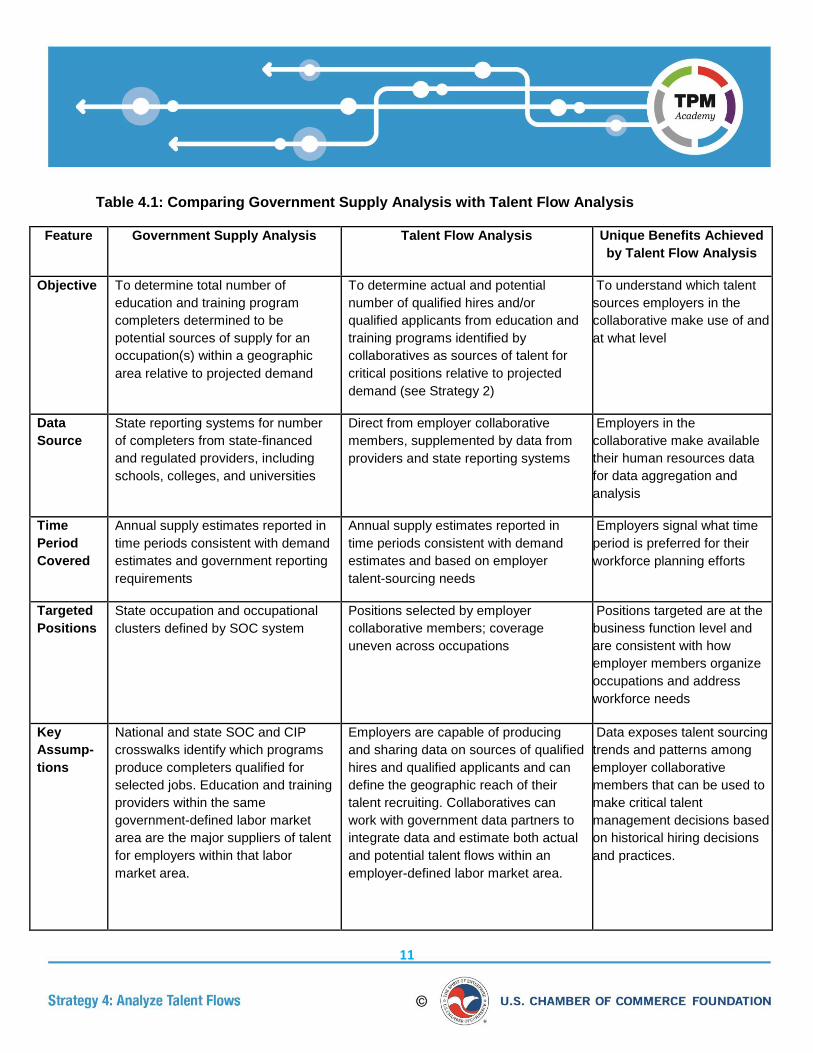
Table 4.1: Comparing Government Supply Analysis with Talent Flow Analysis
Feature Government Supply Analysis Talent Flow Analysis Unique Benefits Achieved
by Talent Flow Analysis
Objective To determine total number of
education and training program
completers determined to be
potential sources of supply for an
occupation(s) within a geographic
area relative to projected demand
To determine actual and potential
number of qualified hires and/or
qualified applicants from education and
training programs identified by
collaboratives as sources of talent for
critical positions relative to projected
demand (see Strategy 2)
To understand which talent
sources employers in the
collaborative make use of and
at what level
Data
Source
State reporting systems for number
of completers from state-financed
and regulated providers, including
schools, colleges, and universities
Direct from employer collaborative
members, supplemented by data from
providers and state reporting systems
Employers in the
collaborative make available
their human resources data
for data aggregation and
analysis
Time
Period
Covered
Annual supply estimates reported in
time periods consistent with demand
estimates and government reporting
requirements
Annual supply estimates reported in
time periods consistent with demand
estimates and based on employer
talent-sourcing needs
Employers signal what time
period is preferred for their
workforce planning efforts
Targeted
Positions
State occupation and occupational
clusters defined by SOC system
Positions selected by employer
collaborative members; coverage
uneven across occupations
Positions targeted are at the
business function level and
are consistent with how
employer members organize
occupations and address
workforce needs
Key
Assump-
tions
National and state SOC and CIP
crosswalks identify which programs
produce completers qualified for
selected jobs. Education and training
providers within the same
government-defined labor market
area are the major suppliers of talent
for employers within that labor
market area.
Employers are capable of producing
and sharing data on sources of qualified
hires and qualified applicants and can
define the geographic reach of their
talent recruiting. Collaboratives can
work with government data partners to
integrate data and estimate both actual
and potential talent flows within an
employer-defined labor market area.
Data exposes talent sourcing
trends and patterns among
employer collaborative
members that can be used to
make critical talent
management decisions based
on historical hiring decisions
and practices.

12
Exercise 1: Talent Flow Employer Collaborative Case Study
The example below illustrates how employer collaboratives can use talent flow analysis in
managing the talent pipeline and why talent flow analysis may provide different insights from
traditional government demand-supply analysis.
A health care collaborative identified nursing as a critical business function, with a focus on
registered nurses, a position requiring a Bachelor of Science in nursing (BSN). The host
organization convening the collaborative surveyed employer members to determine where they
sourced their recent qualified hires to get a better understanding of the collaborative’s talent-
sourcing patterns. Member employers were asked to identify the nursing programs that were the
sources of their nursing hires over the past two years. They were also asked to include any
major Associate of Science in nursing (ASN) feeder programs at community colleges that led to
BSN completion.
Each employer reviewed its HRIS records and provided information on the total number of hires
for each nursing program and any feeder program that the hires completed. The employer
collaborative host organization then compiled the data, resulting in a list of five BSN providers
and two ASN feeder programs. Three BSN programs and their ASN feeder programs were
within the metropolitan area, but two were from outside the area. The employer collaborative
then requested information on the total number of graduates, enrollees, and course-takers in
these programs and in other BSN programs not identified by the collaborative.
The host organization compiled the results of the survey and shared the findings with its
employer members. As a collaborative, members decided to focus on the three BSN programs
and their ASN feeder programs within the metropolitan region and one from outside the region
that provided the best hires. These programs stood out in part because talent from these
sources were more likely to be retained with the employers and the region.
Next, the members estimated the total number of hires that they could expect to get from these
providers over two years and determined that projected demand will exceed expected supply for
the next two years. They also noted that the supply of talent was substantially less than the
supply that they reviewed in government demand-supply reports for their region.
As a result of this analysis, they decided to explore partnering with another BSN program from
outside the region that they did not currently source from but had the potential to be included in
their talent pipeline in the future. This additional program had the added advantage of providing
more diversity in nursing talent that more closely reflected the diversity of their growing patient
populations.
SEE NEXT PAGE FOR EXERCISE QUESTIONS

13
After reviewing the case study on the previous page, discuss the following:
1. Based on the scenario above, how do back mapping and talent flow analysis help employers and collaboratives make important decisions in building talent pipelines? What types of decisions can employers make guided by this new information? Provide examples from the case study.
2. What are some ways in which the supply numbers from employer collaboratives differ from government supply estimates?
14
Unit 4.2 Identifying the Tiers and Roles of Talent Providers in Talent Pipelines
Talent pipelines are best understood in terms of provider roles and provider tiers. In supply
chain management, Tier 1 suppliers are those that provide products and services directly to the
end-use customer in the supply chain. Tier 2 suppliers provide products and services to Tier 1
suppliers that then add additional value before providing the product or service to the end-use
customer (see Figure 4.1: Example Talent Supply Chain Network on page 7 for visual
representation).
These roles and tiers can be extended back across a value stream all the way to its beginning,
which for products is usually the supplier of raw materials. Suppliers can play both Tier 1 and
Tier 2 roles with different products and services for different end-use customers (see Academy
Introduction page 7 for illustration of supply chain management and TPM).
In TPM, Tier 1 providers are those that provide qualified workers directly to employers. Tier 1
providers could be job boards, staffing agencies, or education and training programs that
provide direct placement to employers. Tier 1 can also be other employers. Tier 2 providers
provide talent to Tier 1 providers, forming a value chain with education and training services,
adding incremental value at each stage of development. For example, a Tier 2 education and
training provider such as a high school or community college may refer or transition students to
other colleges, universities, and employment and staffing agencies for additional value-adding
services before they reach employers through Tier 1 providers.
Defining Roles
Roles refer to the specific services that add value to employers. For example, some providers
can provide employment services that recruit, screen, and refer qualified workers to employers,
whereas others could provide education, training, and credentialing services. Still other
providers offer career awareness and exploration services without providing education and
training or recruitment services directly tied to employment, but feed into programs that do. In
some cases, providers can provide several services and play multiple roles.
Back mapping and talent flow analysis help identify the various roles that existing or potential
partners play at different tiers of the talent pipeline. These processes provide the necessary
starting point for building future talent pipelines that have the capacity to meet the needs
projected in demand planning. They provide an important baseline analysis that can help:
Identify the key roles and tiers of the major existing talent sourcing partners and their
relative impact on talent pipelines; and
Identify other talent sourcing partners and their potential roles in future efforts to diversify
and expand talent pipelines.
15
Exercise 2: Analyzing Talent Pipelines Case Study
The Southcentral Manufacturing Consortium back mapped where members got their
qualified CNC machining talent. It found that collectively, members hired 70 qualified
employees over the past three years.
The survey responses provided the following information:
30% came directly from the DEF employment agency; 20% directly from other
regional manufacturers; and another 35% came directly from the Southcentral
Community College CNC Machining Program;
70% of the DEF-sourced employees received their CNC training and credentials from
Southcentral Community College’s CNC Machining Program, as did 40% of the
employees who were sourced directly from other regional employers;
About half of those employees who received training from the community college
program entered the program directly from manufacturing technology programs
offered by two of the four regional high schools; and
One-fourth entered the college directly from the Southcentral community-based
agency program that provides a manufacturing boot camp for low-income adult
residents.
.
After reviewing the case study, discuss the following:
1. Identify the Tier 1 and Tier 2 providers in the case study and what roles they
play.
2. In your community, name examples of Tier 1 and Tier 2 providers for an
employer or employer collaborative and identify the roles they play.

16
Unit 4.3 Conducting Back Mapping with Employer Collaboratives With an understanding of the tiers and roles that make up talent pipelines, we now turn to conducting basic and advanced levels of back mapping using employer data. We begin with reviewing four important decisions that will determine the scope of any back mapping survey:
1. Population: The first decision is the talent population to be analyzed, which can include (1) the highest-performing (top talent) qualified hires who were successfully retained, (2) all qualified hires who were successfully retained, or (3) all qualified applicants who met hiring requirements. All three approaches can provide a different view of where talent is and could be coming from. This information can be broken down further by subgroups, such as women, minorities, veterans, and individuals with disabilities.
2. Talent Sources: The second decision is which sources of talent are analyzed. Employer collaboratives could choose to analyze one or more of the following: (1) incumbent workers hired from different jobs within the firm (e.g., promotions); (2) experienced outside workers; or (3) newly trained and credentialed workers with limited work experience hired from schools, colleges, universities, and other training providers.
3. Time Period: The third decision is the time period for analysis. This should be between one and five years. The time period should be sufficient to know whether qualified hires were productive and were retained by employers for a normal or expected length of employment.
4. Number of Tiers: The fourth decision is how far back to map in the talent pipeline. The simplest approach is to identify only Tier 1 sources and where workers from those sources received their most recent training and credentials that made them qualified applicants. An advanced approach would identify additional tiers, including feeder schools and programs.
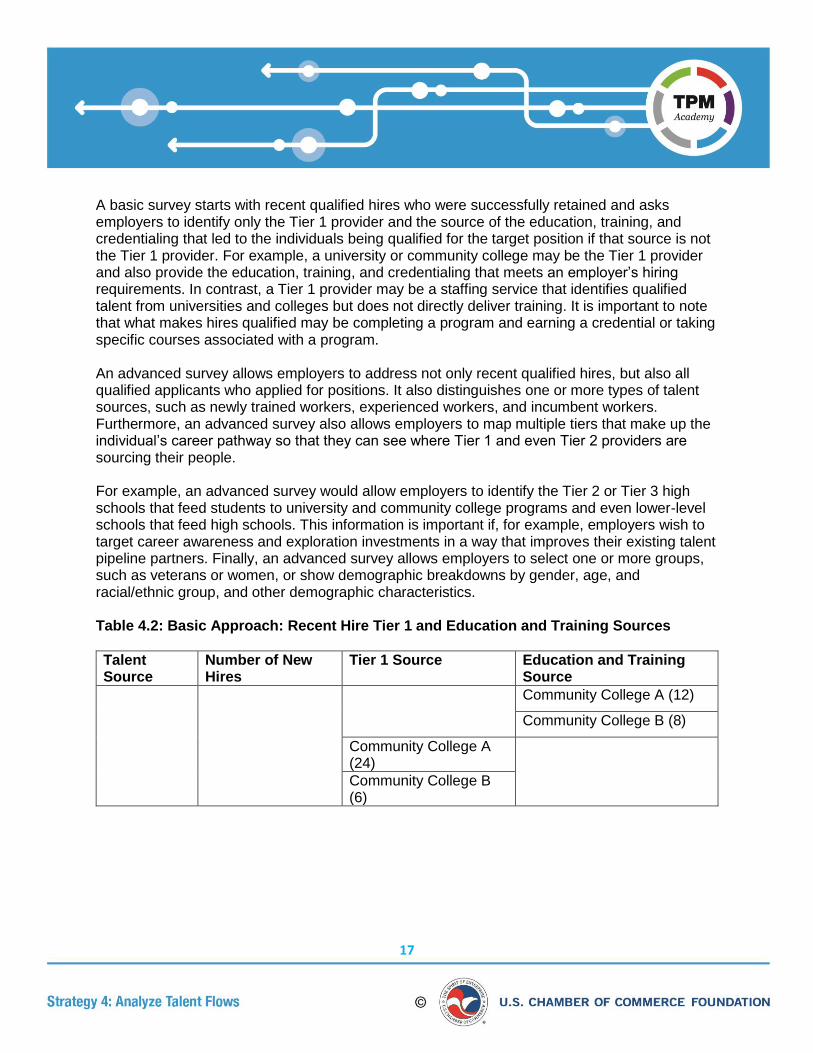
Basic versus Advanced Surveys Because most employers have never done back mapping of their talent sources and don’t have HRIS systems that do this for them, employer collaboratives should start with a basic approach and then move to more advanced practices later (see Table 4.2: Basic Approach: Recent Hire Tier 1 and Education and Training Sources and Table 4.3: Advanced Approach: Hire and Applicant Sources and More Tiers on pages 17 and 18 for examples of each approach).
17
A basic survey starts with recent qualified hires who were successfully retained and asks employers to identify only the Tier 1 provider and the source of the education, training, and credentialing that led to the individuals being qualified for the target position if that source is not the Tier 1 provider. For example, a university or community college may be the Tier 1 provider and also provide the education, training, and credentialing that meets an employer’s hiring requirements. In contrast, a Tier 1 provider may be a staffing service that identifies qualified talent from universities and colleges but does not directly deliver training. It is important to note that what makes hires qualified may be completing a program and earning a credential or taking specific courses associated with a program. An advanced survey allows employers to address not only recent qualified hires, but also all qualified applicants who applied for positions. It also distinguishes one or more types of talent sources, such as newly trained workers, experienced workers, and incumbent workers. Furthermore, an advanced survey also allows employers to map multiple tiers that make up the individual’s career pathway so that they can see where Tier 1 and even Tier 2 providers are sourcing their people. For example, an advanced survey would allow employers to identify the Tier 2 or Tier 3 high schools that feed students to university and community college programs and even lower-level schools that feed high schools. This information is important if, for example, employers wish to target career awareness and exploration investments in a way that improves their existing talent pipeline partners. Finally, an advanced survey allows employers to select one or more groups, such as veterans or women, or show demographic breakdowns by gender, age, and racial/ethnic group, and other demographic characteristics. Table 4.2: Basic Approach: Recent Hire Tier 1 and Education and Training Sources
Talent Source
Number of New Hires
Tier 1 Source Education and Training Source
Community College A (12)
Community College B (8)
Community College A (24)
Community College B (6)

18
Table 4.3: Advanced Approach: Hire and Applicant Sources and More Tiers
Talent Source Number of New Hires
Tier 1 Source
Tier 2 Source Tier 3 Source
High School A (6)
High School B (6)
Community College B (8)
Boot camp (8)
Middle School A (10)
Middle School B (6)
High School B (8) Middle School C (8)
Community College B (6)
High School C (6) Middle School D (6)
Back Mapping Steps With these key decisions made about the scope of your survey, we can begin the three-step back mapping process:
1. Employers Analyze Their Data: Each employer in the collaborative analyzes its individual-level data on where it sources qualified talent based on either a basic or advanced survey. These data should cover a baseline period of one to five years. Employers can collect these data from their HRIS, ATS, or other types of data sources. Employers also can interview or survey qualified workers recently hired into the targeted positions or analyze their resumes in their personnel files.
2. Employer Collaboratives Aggregate the Data: Employers then provide data to the host organization managing the collaborative so they can be aggregated further and shared with other collaborative members in a manner that protects proprietary information. The data can be formatted in summary tables and figures for the baseline time period. As with any information, back mapping data on recent hires and qualified applicants should be treated as confidential, and proprietary data that should never be shared with other employers and partners.

19
3. Talent Flows Are Analyzed: The employer collaborative then analyzes the employer back mapping data to identify opportunities for improving talent flows. This step can include identifying the most widely used talent providers and those that are underutilized or not used at all by members of the collaborative. They can be included as potential future providers that can help address the need for more capacity in the talent pipeline or to accomplish other objectives, such as diversifying the talent pool. This analysis provides the basis for moving to advanced levels of back mapping and more comprehensive talent flow analysis.
Employer collaboratives can choose to conduct needs assessment surveys for Strategies 2 and 3 and back mapping and talent flow analysis surveys for Strategy 4 at the same time or separately. Employer collaboratives may want to conduct these surveys separately at first and then combine them later as employers become more experienced in completing and using these surveys and becoming more focused on the targeted occupations and providers they are addressing.

20
Unit 4.4 Conducting Talent Flow Analysis with Other Data Partners Back mapping is designed to help improve how employers source talent by strengthening partnerships with talent sources that have proved to provide qualified talent. However, it does not provide data on the bandwidth or capacity of the existing sources of talent that might not be fully utilized by the employer collaborative. It also does not capture data on providers that are not identified by employers and may provide alternative sources of talent in the future. Finally, it does not address where qualified talent goes after leaving employer partners and whether talent is retained in the region. As employer collaboratives gain experience and benefits in working together on back mapping, they should explore opportunities to execute a more advanced talent flow analysis that combines employer data with other data sources, including the government and talent providers. As with back mapping surveys, employer collaboratives should start with a basic approach and then move to advanced practices. Basic Approach: Analyzing Talent Pipeline Capacity The basic approach conducts an analysis of the bandwidth of the pipeline in terms of the number of people completing and enrolling in programs as well as taking courses associated with the program. This is important because employer collaboratives should initially focus on programs that have historically provided qualified hires and that have the potential capacity to meet projected demand. Providers should include both existing and potential talent-provider partners and their possible enrollment capacity. This basic approach involves three major steps:
1. Employer Collaboratives Gather Data from State Agencies. Members of the employer collaborative compile a list of talent-provider partners and their programs based on the back mapping results. Specifically, this process identified the sources that provided the education, training, and credentials for candidates to be considered qualified for openings for the targeted position. This list should include physical locations of the sources. The collaborative sends this information to the state higher education agency that is responsible for producing supply data and asks the agency to work with other education and workforce agencies to provide data on the number of completers from both credit and noncredit programs for (1) these identified providers and programs and (2) other providers and programs that have the same or similar programs as defined by government program classification systems (e.g., CIP codes).

21
The employer collaborative should ask for a minimum of three to five years of data to better understand trends. The employer collaborative should request data on (1) the number of graduates or completers receiving credentials, (2) the number of program enrollees, and (3) the number of people taking courses within the program to better estimate the potential capacity of programs to produce more completers. Take note, the number of course-takers will include duplicated counts because they could be enrolled in courses that are part of more than one program.
2. Employer Collaboratives Gather Data from Talent-Provider Partners: The employer collaborative then sends these data to selected talent providers to validate or confirm the information provided by state agencies for the selected time period and to ask them for supplemental data where needed on program enrollees and those taking courses related to the programs. This will be necessary in many states that do not have complete information on all types of talent providers and all types of programs offered by these providers, such as noncredit programs offered by universities and community colleges. These talent providers also should be encouraged to provide data on additional programs that they feel might be related to the targeted positions. This program-level data is very important because employers recruit from specific programs that are related to specific jobs, in most cases. One alternative is to collect all program information from talent-provider partners directly if available without engaging state agencies.
3. Employer Collaboratives Analyze the Data and Produce Supply Reports: The employer collaborative then analyzes the bandwidth of the existing or potential pipeline and compares it with projected demand over the same time period. This analysis should focus on completers but also look into the potential capacity resulting from leveraging more enrollees and course-takers and identify trends for incorporation into the performance measures in Strategy 5.
Table 4.4 Talent Pipeline Capacity Analysis offers a visual representation of communicating data to collaborative members. Table 4.4: Talent Pipeline Capacity Analysis

22
Advanced Practice: Analyzing Talent In-Flows and Out-Flows After analyzing talent pipeline capacity, some employer collaboratives might want to move to advanced practice in using state longitudinal data systems (SLDS) to analyze talent in-flows and out-flows. Over the past 10 years, most states have built SLDS that link individual-level data from publicly funded and approved education and training programs with employment data from their state unemployment insurance wage record systems. These additional data sources add two important pieces of information:
Talent Leakages from Tier 1 Providers: Back mapping captures flows of talent only from Tier 1 partners to collaborative members. It does not, however, provide information on talent in-flows that were captured by other employers within or outside the region.
Talent Leakages from Collaborative Employers: Employers’ data might not provide information on where qualified talent goes after leaving them. Talent flow analysis can capture this information and shed light on whether talent is retained by other members of the collaborative or region.
This advanced level of talent flow analysis provides the foundation for the remaining strategies in TPM that focus on managing performance, providing incentives, and continuously improving talent supply chains. It might require working with more than one state when collaboratives source talent from multiple states. This is especially important in metropolitan areas or larger rural regions that span more than one state. See Table 4.5: Talent Source Capture Rate for an example of additional data to include. Table 4.5: Talent Source Capture Rate
Talent Provider Number of Graduates with Required Credentials in Past Three Years
Employed by Collaborative Employers in
Region
Employed in Region but Not
by Collaborative Employers
Employed Outside of
Region
Not Employed/ Unknown
University A, Program A
53 5 25 2
College A, Program A
45 10 5 5
College B, Program A
14 6 2 0
Vocational School A, Program A
10 19 10 5

23
Advanced practices can be extended even further to identify potential recruitment sources from outside the state or region, particularly when there is an insufficient labor pool available within an employer’s state or region. This could involve identifying outside states and regions where talent providers have been successful in recruiting students. It also could involve analyzing working-age population migration patterns to identify potential recruitment states and regions and then identifying potential providers that have related programs in these states and regions.

24
Ready for Next Steps? Before you move to the next strategy, make sure you have achieved the learning objectives necessary to move forward. Ensure that when you go back to your community, you will be able to:
Explain why talent flow analysis is integral to managing a talent supply chain; Identify Tier 1 and Tier 2 providers and their relationship to one another; Conduct back mapping with your collaborative members; Request and use data from state data partners for talent pipeline capacity analysis and
talent flow analysis. Optional: For those using the TPM web-based tool, develop reports and generate
visualization tools depicting the flow of talent from providers to your collaborative members.
Related Documents