STRATEGIES TO IMPROVE MATERNAL AND NEW-BORN CARE REFERRAL SYSTEMS by BINYAM FEKADU DESTA submitted in accordance with the requirements for the degree of DOCTOR OF LITERATURE AND PHILOSOPHY in the subject HEALTH STUDIES at the UNIVERSITY OF SOUTH AFRICA SUPERVISOR: PROF BL DOLAMO NOVEMBER 2019

Welcome message from author
This document is posted to help you gain knowledge. Please leave a comment to let me know what you think about it! Share it to your friends and learn new things together.
Transcript

STRATEGIES TO IMPROVE MATERNAL AND NEW-BORN CARE REFERRAL SYSTEMS
by
BINYAM FEKADU DESTA
submitted in accordance with the requirements
for the degree of
DOCTOR OF LITERATURE AND PHILOSOPHY
in the subject
HEALTH STUDIES
at the
UNIVERSITY OF SOUTH AFRICA
SUPERVISOR: PROF BL DOLAMO
NOVEMBER 2019

Student number: 42619963
DECLARATION
I declare that the thesis entitled “STRATEGIES TO IMPROVE MATERNAL AND NEW-
BORN CARE REFERRAL SYSTEMS” is my own work and that all the sources that I
have used or quoted have been indicated and acknowledged by means of complete
references.
I further declare that I submitted the dissertation to originality checking software and that
it falls within the accepted requirements for originality.
I further declare that I have not previously submitted this work, or part of it, for
examination at Unisa for another qualification or at any other higher education
institution.
30 November 2019
SIGNATURE DATE
BINYAM FEKADU DESTA

STRATEGIES TO IMPROVE MATERNAL AND NEW-BORN CARE REFERRAL SYSTEMS
STUDENT NUMBER: 42619963
STUDENT: BINYAM FEKADU DESTA
DEGREE: DOCTOR OF LITERATURE AND PHILOSOPHY
DEPARTMENT: HEALTH STUDIES, UNIVERSITY OF SOUTH AFRICA
SUPERVISOR: PROF BL DOLAMO
ABSTRACT
Maternal and newborn health is one of the main indicators of a good health system. The
study wished to develop a strategy to improve the referral system for maternal and
newborn care. To identify issues for improvement, the researcher explored the
appropriateness of referrals, referral pathways and challenges, and provider costs for
maternal and newborn care at health centres and hospitals levels. The researcher
selected a sequential explanatory mixed method research design. Two primary
hospitals and six health centres were purposively selected for participation.
The first phase collected quantitative data by reviewing the health facilities’ medical
records for services provided and health service costing, respectively. Data collection
covered one Ethiopian fiscal year (8 July 2017 to 7 July 2018). Based on the existing
human resource arrangement and care needs, the health service costing found that a
single midwife at health centre level spent half of the expected time for delivery care.
The cost estimates of various types of care delivery care indicated that delivery care at
health centre and hospital levels cost $27.5 to $30.2, and $34.7 to $37.8, respectively.
The primary hospitals incurred four times the cost for newborn intensive care units and
Caesarean sections compared to normal delivery care.
In the second phase, the researcher collected qualitative data from 26 purposively
selected key informants in interviews. The findings indicated that the selected hospitals
and health centres had a referral system, but several factors impeded its effective
implementation. Knowledge of referral pathways determined the referral practices at the
lower level of the system. The number of inappropriate referrals to primary hospitals
indicated a need to mobilize and educate the community on the services available and
protocols of care. In general, most referrals could have been managed at health centre
level.
Emergency medical transportation is a critical component of the referral system; delays
in transportation determine the outcome of care at hospital level. Ambulance
management was generally poor, lacked a tracking system, and was negatively affected
by confusion and lack of coordination between facilities. The available ambulances were
not well equipped or well-staffed for emergency management. Moreover, there were
frequent breakdowns due to limited budget for maintenance and running costs.
The quality of maternal care depends on the quality of the labour monitoring. However,
partograph utilization was not consistently practised. Admitted cases were not properly
monitored because of the high caseload and limited supervision support. In many
cases, healthcare professionals tended to “treat charts” rather than promote evidence-
based practice while providing care. The quality of practice was challenged by insecurity
in the working environment but strengthened by good teamwork and available
consultation support. The implementation of the existing referral system depended on
the people involved; the use of performance indicators; follow up by management, and
an accountability framework.
The findings of the two phases of the study and review of other countries’ experiences
on the identified problems, led to the development of draft strategy and then a
consultation with relevant experts produced the final strategy. The strategy includes
interventions to improve the practices at the sending and receiving facilities as well as
suggestions to improve the communication, transportation and overall governance
system. Then, taking into consideration all the phases of the study, the researcher
makes recommendations for practice and further research.
KEY CONCEPTS
Emergency obstetrics; newborn care; quality of care; referral system; strategies to
improve referral system; health service cost; referral governance.

ACKNOWLEDGEMENTS
It is said that no feast comes to the table on its own feet. Likewise, no dissertation is the
work of one person, therefore my heartfelt thanks and appreciation to all the following
without whose support and contribution this study would not be what it is:
• Prof BL Dolamo, my supervisor, for her guidance, support and encouragement
throughout the study.
• The Department of Health Studies Higher Degrees Committee of the University
of South Africa, for permission to conduct the study.
• The Southern Nations and Nationalities Peoples Region’s Health Bureau, the
Zone Health Departments, and the management of the selected hospitals and
facilities, for permission to conduct the study in their facilities.
• Selam Seyoum, for her support, understanding and taking the huge family
responsibility during this course of journey, and Yohana and Nahom, our
children, for their love, obedience and laughter.
• Fekadu Desta and Yehuwalawork Eshete, my parents, for their example,
encouragement, continued follow up and confidence in me.
• My Colleagues at office, Zergu Tafesse, Agegneghu Sendeku, Tadelech Sinamo,
Ermias Lerebo, Mulushewa Lemma, Habtamu Abdissa, Mesele Damte,
Hailemariam Segni, and Eden Assefa, for their invaluable input and sharing their
extra time, experience in the data collection, analysis and strategy development.
• The respondents, for sharing their time, experience, frustrations and perceptions.
• Abdulfetha Ali and Desalegn Lamiso, for their assistance with data collection.
• Bekele Belayhun and Ismael Ali for making data management and analysis seem
so easy.
• Rina Coetzer, for professionally and patiently formatting and finalising the
dissertation.
• Iauma Cooper, for professionally and critically editing the dissertation.

Dedication
To all the family educating, transporting, scrubs wearing,
foetal monitoring, cervix checking, contraction timing,
labour coaching, baby catching, life delivering health
work force.

i
TABLE OF CONTENTS
CHAPTER 1 ............................................................................................................................... 1
ORIENTATION TO THE STUDY ................................................................................................ 1
1.1 INTRODUCTION ...................................................................................................... 1
1.2 BACKGROUND TO THE RESEARCH PROBLEM ................................................... 2
1.3 STATEMENT OF THE PROBLEM ........................................................................... 4
1.4 PURPOSE OF THE STUDY ..................................................................................... 5
1.4.1 Research objectives ................................................................................................. 5
1.4.2 Research questions ................................................................................................. 5
1.5 SIGNIFICANCE OF THE STUDY ............................................................................. 6
1.6 THEORETICAL FOUNDATIONS OF THE STUDY .................................................. 6
1.6.1 Donabedian’s (1988) model ..................................................................................... 6
1.6.2 Referral chain model ................................................................................................ 7
1.7 RESEARCH METHODOLOGY ................................................................................ 7
1.7.1 Research design ...................................................................................................... 7
1.7.2 Research methodology ............................................................................................ 8
1.7.2.1 Study setting ............................................................................................................ 8
1.7.2.2 Population ................................................................................................................ 8
1.7.3 Sample and sampling ............................................................................................... 9
1.7.3.1 Site sampling ........................................................................................................... 9
1.7.3.2 Data source sampling............................................................................................... 9
1.7.4 Data collection........................................................................................................ 10
1.8 VALIDITY AND RELIABILITY ................................................................................. 11
1.8.1 Validity and reliability in the quantitative phase (medical record review and health
service costing) ...................................................................................................... 12
1.8.2 Validity and reliability in the qualitative phase ......................................................... 12
1.9 DATA ORGANISATION AND ANALYSIS ............................................................... 13
1.9.1 Cleaning of the data sets ........................................................................................ 13
1.9.2 Quantitative data analysis ...................................................................................... 13
1.9.3 Qualitative data analysis ........................................................................................ 13
1.10 STRATEGY FORMULATION ................................................................................. 14
1.11 ETHICAL CONSIDERATIONS ............................................................................... 14
1.12 DEFINITION OF KEY CONCEPTS ........................................................................ 15
1.13 STRUCTURE OF THE DISSERTATION ................................................................ 16
1.14 CONCLUSION ....................................................................................................... 17
CHAPTER 2 ............................................................................................................................. 19
LITERATURE REVIEW ........................................................................................................... 19
2.1 INTRODUCTION .................................................................................................... 19
ii
2.2 GLOBAL SITUATION OF MATERNAL AND NEWBORN HEALTH ........................ 19
2.3 MAJOR CAUSES OF MATERNAL AND NEWBORN ILL-HEALTH ........................ 20
2.4 MAJOR INTERVENTIONS TO ADDRESS MATERNAL AND NEWBORN HEALTH-
RELATED PROBLEMS .......................................................................................... 22
2.4.1 Institution-based childbirth ...................................................................................... 23
2.4.2 Emergency obstetric and newborn care ................................................................. 24
2.4.3 Labour monitoring .................................................................................................. 24
2.5 QUALITY OF MATERNAL AND NEWBORN CARE ............................................... 25
2.5.1 Donabedian’s (1988) model ................................................................................... 25
2.5.2 Institution-based delivery and quality of care .......................................................... 25
2.5.3 Human resources and quality of care ..................................................................... 26
2.5.4 Respectful maternity care ....................................................................................... 27
2.5.5 Quality of care and service utilisation ..................................................................... 28
2.6 COORDINATION BETWEEN FACILITIES – REFERRAL SYSTEM ....................... 28
2.6.1 Referral chain model .............................................................................................. 29
2.6.2 Referral system ...................................................................................................... 29
2.6.3 Common indications for referrals ............................................................................ 29
2.6.4 Inappropriate referral .............................................................................................. 30
2.6.5 Health workers’ competence in sender facility ........................................................ 30
2.6.6 Communication in the referral system .................................................................... 30
2.6.7 Factors in delay in travel ........................................................................................ 31
2.6.8 Causes of adverse outcomes at receiving facility ................................................... 31
2.7 MATERNAL AND NEWBORN HEALTH IN ETHIOPIA ........................................... 31
2.7.1 Health care delivery system ................................................................................... 31
2.7.2 Maternal and newborn health status ....................................................................... 32
2.7.3 Interventions to improve maternal and newborn health .......................................... 33
2.8 CONCLUSION ....................................................................................................... 34
CHAPTER 3 ............................................................................................................................. 35
RESEARCH DESIGN AND METHODOLOGY ......................................................................... 35
3.1 INTRODUCTION .................................................................................................... 35
3.2 RESEARCH DESIGN ............................................................................................ 35
3.2.1 Mixed methods ....................................................................................................... 35
3.2.2 Quantitative ............................................................................................................ 36
3.2.3 Qualitative .............................................................................................................. 37
3.3 RESEARCH METHODOLOGY .............................................................................. 37
3.3.1 STUDY SETTING .................................................................................................. 37
3.3.2 Population .............................................................................................................. 38
3.3.3 Sample and sampling ............................................................................................. 38
iii
3.3.3.1 Site sampling ......................................................................................................... 39
3.3.3.2 Data source sampling............................................................................................. 39
3.3.3.3 Health services costing .......................................................................................... 40
3.3.3.4 Key informant interviews ........................................................................................ 40
3.3.4 Quantitative data collection .................................................................................... 40
3.3.4.1 Medical records ...................................................................................................... 40
3.3.4.2 Health service costing ............................................................................................ 40
3.3.4.3 Quantitative data-collection instruments and administration ................................... 41
3.3.5 Quantitative data analysis ...................................................................................... 43
3.3.6 Qualitative data collection ...................................................................................... 45
3.3.6.1 Data-collection instrument and administration ........................................................ 45
3.3.6.2 Data analysis ......................................................................................................... 45
3.4 VALIDITY AND RELIABILITY ................................................................................. 47
3.4.1 Quantitative phase ................................................................................................. 48
3.4.2 Qualitative phase ................................................................................................... 48
3.5 ETHICAL CONSIDERATIONS ............................................................................... 50
3.6 STRATEGY DEVELOPMENT ................................................................................ 51
3.7 CONCLUSION ....................................................................................................... 52
CHAPTER 4 ............................................................................................................................. 53
QUANTITATIVE DATA ANALYSIS AND INTERPRETATION, AND FINDINGS ....................... 53
4.1 INTRODUCTION .................................................................................................... 53
4.2 FLOW OF CASE REVIEWS ................................................................................... 53
4.3 DATA MANAGEMENT AND ANALYSIS ................................................................ 54
4.3.1 Data management .................................................................................................. 55
4.3.1.1 Data coding ............................................................................................................ 55
4.3.1.2 Data entry .............................................................................................................. 55
4.3.1.3 Data cleaning ......................................................................................................... 55
4.3.1.4 Missing data ........................................................................................................... 56
4.3.2 Data analysis ......................................................................................................... 56
4.3.2.1 Computer-based data analysis ............................................................................... 56
4.3.2.2 Descriptive statistics ............................................................................................... 56
4.3.2.3 Measures of comparison ........................................................................................ 57
4.4 FINDINGS FROM MEDICAL RECORD REVIEW ................................................... 57
4.4.1 Description of the reviewed cases .......................................................................... 57
4.4.2 Referral for health service care .............................................................................. 59
4.4.2.1 Distance from referring facility ................................................................................ 60
4.4.2.2 Referral communication ......................................................................................... 60
4.4.2.3 Reasons for referrals .............................................................................................. 62
iv
4.4.2.4 Transportation for referral ....................................................................................... 63
4.4.3 Delivery care at receiving facility ............................................................................ 64
4.4.3.1 Care at admission .................................................................................................. 64
4.4.3.1.1 Vital signs at admission .......................................................................................... 64
4.4.3.1.2 Measurements at admission ................................................................................... 66
4.4.3.1.3 Abdominal examinations at admission ................................................................... 67
4.4.3.1.4 Pelvic examinations at admission ........................................................................... 67
4.4.3.1.5 Physical examinations at admission ....................................................................... 68
4.4.3.1.6 Laboratory investigations at admission ................................................................... 69
4.4.3.2 Use of partograph for labour monitoring ................................................................. 70
4.4.3.2.1 Documentation of partograph ................................................................................. 71
4.4.3.2.2 When to start record? ............................................................................................. 72
4.4.3.2.3 Completeness of the partograph ............................................................................ 72
4.4.3.2.3.1 Maternal vital signs ................................................................................................ 73
4.4.3.3 Outcome of labour .................................................................................................. 77
4.4.4 Experience of care at neonatal intensive care unit (NICU) ..................................... 78
4.4.4.1 Chief complaints for admission ............................................................................... 79
4.4.4.2 Patients characteristics at admission ...................................................................... 79
4.4.4.3 Intrapartum history ................................................................................................. 82
4.4.4.4 Main causes of newborn illness and admission to NICU ........................................ 84
4.4.4.5 Length of stay in NICU ........................................................................................... 85
4.4.5 Appropriateness of referral ..................................................................................... 86
4.4.6 Overview of main findings from the medical record review ..................................... 87
4.5 FINDINGS FROM HEALTH SERVICE COSTING .................................................. 90
4.5.1 Description of facilities ............................................................................................ 90
4.5.1.1 Staffing ................................................................................................................... 90
4.5.2 Cost elements ........................................................................................................ 92
4.5.2.1 Human resources-related expenses ....................................................................... 92
4.5.2.2 Common administrative costs ................................................................................ 93
4.5.2.3 Direct clinical care costs ......................................................................................... 93
4.5.2.3.1 Direct delivery and essential newborn care costs at health centre level ................. 93
4.5.2.3.2 Direct delivery and newborn care costs at primary hospital level ............................ 94
4.5.3 Service statistics .................................................................................................... 96
4.5.4 Case load ............................................................................................................... 97
4.5.4.1 Case load estimated by number of cases visited .................................................... 97
4.5.4.2 Caseload estimated by expected care packages .................................................... 98
4.5.5 Cost of services .................................................................................................... 100
4.5.5.1 Health centre level ............................................................................................... 101

v
4.5.5.2 Primary hospital level ........................................................................................... 101
4.5.6 Overview of findings from health service costing .................................................. 103
4.6 CONCLUSION ..................................................................................................... 104
CHAPTER 5 ........................................................................................................................... 105
QUALITATIVE DATA ANALYSIS AND INTERPRETATION, AND FINDINGS ........................ 105
5.1 INTRODUCTION .................................................................................................. 105
5.2 DATA COLLECTION ............................................................................................ 105
5.3 DATA ANALYSIS ................................................................................................. 106
5.4 FINDINGS ............................................................................................................ 107
5.4.1 Respondents’ gender and qualification ................................................................. 107
5.4.2 Theme 1: Capability of identifying appropriate cases for referral .......................... 108
5.4.2.1 Category 1: Prior relationship with the health centre ............................................ 108
5.4.2.2 Category 2: High caseload at health centre level .................................................. 109
5.4.2.3 Category 3: Competent health workforce ............................................................. 109
5.4.2.4 Category 4: Prevalence of severe and complicated cases ................................... 110
5.4.2.5 Category 5: Logistical limitations led to referrals ................................................... 111
5.4.2.6 Category 6: Motivated health workforce ............................................................... 112
5.4.3 Theme 2: Proper initiation of the referral process determines the outcome .......... 114
5.4.3.1 Category 1: Knowledge of referral pathways ........................................................ 114
5.4.3.2 Category 2: Referral communication between facilities ........................................ 115
5.4.3.3 Category 3: Preparation for referral ...................................................................... 116
5.4.4 Theme 3: Emergency medical transportation ....................................................... 118
5.4.4.1 Category 1: Ambulance availability ....................................................................... 118
5.4.4.2 Category 2: Alternative for ambulance ................................................................. 119
5.4.4.3 Category 3: Equipped ambulance ........................................................................ 119
5.4.4.4 Category 4: Communication between users and ambulance drivers .................... 121
5.4.4.5 Category 5: Tracking the ambulance .................................................................... 122
5.4.5 Theme 4: Services availability at receiving facility determines the functionality of the
referral system ..................................................................................................... 122
5.4.5.1 Category 1: Service availability at hospital level ................................................... 122
5.4.5.2 Category 2: Increased service utilisation at hospital level ..................................... 123
5.4.5.3 Category 3: Proper reception at the hospital level ................................................ 124
5.4.5.4 Category 4: Labour monitoring ............................................................................. 125
5.4.5.5 Category 5: Work environment at hospital level .................................................... 126
5.5.5 Theme 5: Functional cross-facility support platforms for better collaboration and
coordination between facilities .............................................................................. 128
5.5.5.1 Category 1: Feedback on referral ......................................................................... 128
5.5.5.2 Category 2: Consultation and mentorship support ................................................ 129

vi
5.5.5.3 Category 3: Functional service management committees .................................... 130
5.6 OVERVIEW OF MAIN QUALITATITVE FINDINGS .............................................. 131
5.7 CONCLUSION ..................................................................................................... 133
CHAPTER 6 ........................................................................................................................... 134
STRATEGIES TO IMPROVE MATERNAL AND NEWBORN REFERRAL SYSTEM .............. 134
6.1 INTRODUCTION .................................................................................................. 134
6.2 STRATEGY DEVELOPMENT .............................................................................. 134
6.3 SCOPE OF THE PROPOSED STRATEGIES ...................................................... 135
6.4 AIM OF THE STRATEGY .................................................................................... 135
6.5 STRATEGIES TO IMPROVE THE REFERRAL SYSTEM .................................... 135
6.5.1 Strategies for sending facilities ............................................................................. 137
6.5.2 Strategies for communication and transportation .................................................. 139
6.5.3 Strategies for receiving facility .............................................................................. 141
6.5.4 Strategies aiming at referral governance, monitoring and accountability .............. 144
6.6 CONCLUSION ..................................................................................................... 147
CHAPTER 7 ........................................................................................................................... 148
FINDINGS, LIMITATIONS AND RECOMMENDATIONS ........................................................ 148
7.1 INTRODUCTION .................................................................................................. 148
7.2 FINDINGS ............................................................................................................ 149
7.2.1 Sending facility ..................................................................................................... 149
7.2.2 Transportation ...................................................................................................... 150
7.2.3 Receiving facility .................................................................................................. 151
7.2.4 Referral control and accountability ....................................................................... 152
7.3 LIMITATIONS OF THE STUDY ............................................................................ 152
7.4 RECOMMENDATIONS ........................................................................................ 152
7.4.1 Practice ................................................................................................................ 152
7.4.1.1 Sending facility ..................................................................................................... 153
7.4.1.2 Transportation ...................................................................................................... 154
7.4.1.3 Receiving facility .................................................................................................. 155
7.4.1.4 Control and accountability framework ................................................................... 156
7.4.2 Further research ................................................................................................... 157
7.5 CONCLUSION ..................................................................................................... 157
LIST OF REFERENCES ........................................................................................................ 158

vii
ANNEXURES ......................................................................................................................... 176
ANNEXURE 1: ETHICAL CLEARANCE CERTIFICATE FROM UNISA .................................. 177
ANNEXURE 2: SUPPORT LETTER FOR THE STUDY ......................................................... 179
ANNEXURE 3: CASE REGISTRATION SHEET..................................................................... 180
ANNEXURE 4: MEDICAL RECORD EXTRACTING SHEET .................................................. 181
ANNEXURE 5: HEALTH SERVICE COSTING TOOL – NUMBER OF VISITS ....................... 185
ANNEXURE 6: HEALTH SERVICE COSTING TOOL – COMMON ADMINISTRATIVE
EXPENSES ............................................................................................................................ 190
ANNEXURE 7: HEALTH SERVICE COSTING TOOL – MONTHLY PAYMENTS TO STAFF . 192
ANNEXURE 8: HEALTH SERVICE COSTING TOOL – SERVICE DELIVERY STAFF TIME . 193
ANNEXURE 9: HEALTH SERVICE COSTING TOOL – DRUGS, SUPPLIES AND
LABORATORY TESTS .......................................................................................................... 194
ANNEXURE 10: QUALITATIVE – KEY INFORMANT INTERVIEW GUIDE ............................ 195
ANNEXURE 11: LETTER FROM THE LANGUAGE EDITOR ................................................. 198

viii
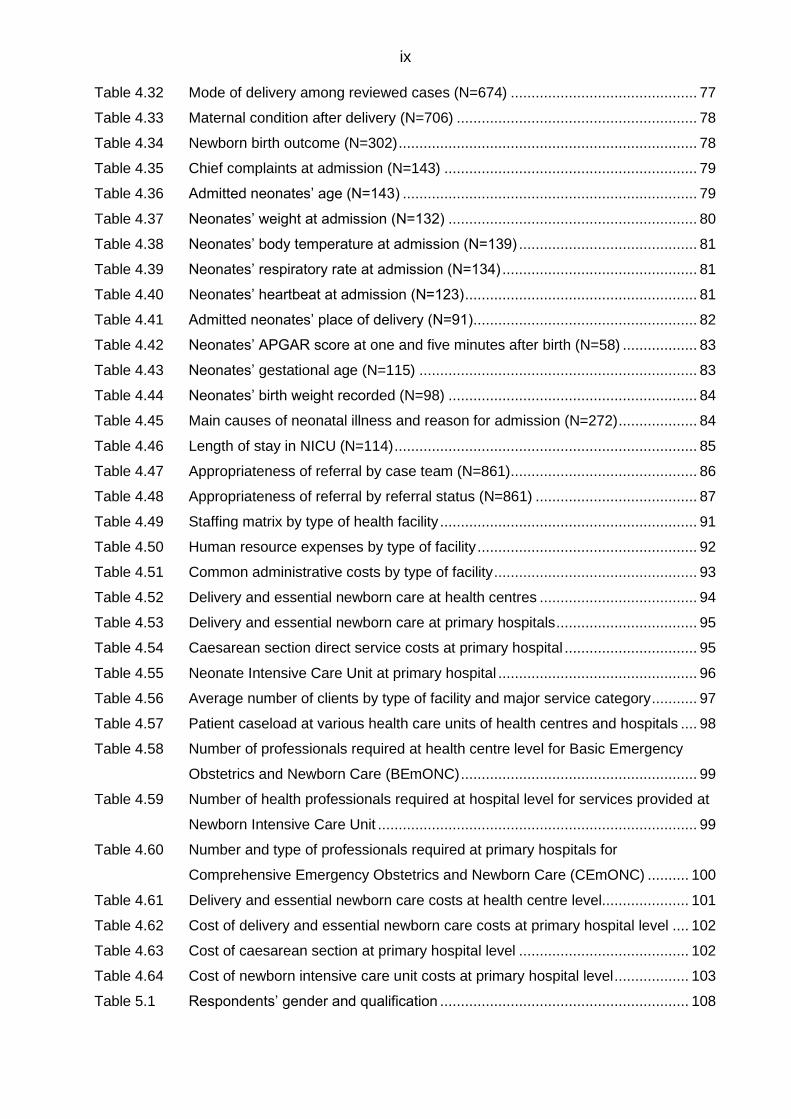
LIST OF TABLES
Table 3.1 Assumptions for services provided at the selected hospitals and health centres 44
Table 4.1 Number of cases reviewed (N=869)................................................................... 57
Table 4.2 Age distribution of reviewed cases (N=716) ....................................................... 58
Table 4.3 Gravidity of reviewed cases (N=702) ................................................................. 58
Table 4.4 Parity of reviewed cases (N=700) ...................................................................... 58
Table 4.5 Gestational age of the reviewed cases (N=574) ................................................ 59
Table 4.6 Referrals among reviewed cases (N=869) ......................................................... 60
Table 4.7 Estimated travel time to the primary hospital (N=338) ........................................ 60
Table 4.8 Availability of referral slips in the patient file (N=338) ......................................... 61
Table 4.9 Lab investigations done at referring facility written on the referral slip (N=215) .. 61
Table 4.10 Treatment given at referring facility written on the referral slip (N=215) ............. 61
Table 4.11 Proportion of cases sent with probable cause identified (N=177) ....................... 62
Table 4.12 Main reasons for maternal referral (N=56) ......................................................... 62
Table 4.13 Main reasons for neonatal referral (N=23) ......................................................... 63
Table 4.14 Use of ambulance for transportation (N=145) .................................................... 63
Table 4.15 Referral accompanied by health professional from the sending facility (N=95) .. 64
Table 4.16 Association between referral status and vital signs (N=725) .............................. 65
Table 4.17 Association between maternal physical measurements and referral status
(N=724) ............................................................................................................. 66
Table 4.18 Association between referral status and physical examinations at admission
(N=726) ............................................................................................................. 68
Table 4.19 Physical examinations for Pallor between referred and non-referred cases
(N=423) ............................................................................................................. 69
Table 4.20 Physical examinations for Jaundice between referred and non-referred cases
(N=424) ............................................................................................................. 69
Table 4.21 Association of referral status and laboratory tests at hospital level (N=726)....... 70
Table 4.22 Documentation of partograph in the medical record (N=711) ............................. 71
Table 4.23 Starting time of partograph record (N=527)........................................................ 72
Table 4.24 Number of maternal blood pressure recorded as expected (N=514) .................. 73
Table 4.25 Number of maternal temperatures recorded as expected (N=254) .................... 73
Table 4.26 Laboratory tests recorded on a partograph (N=544) .......................................... 74
Table 4.27 Number of cases examined for cervical dilatation appropriately (N=525) ........... 75
Table 4.28 Number of cases examined for foetal skulls moulding appropriately (N=189) .... 75
Table 4.29 Number of cases examined for Foetal decent appropriately (N=402)................. 75
Table 4.30 Practice of abdominal examinations for Foetal health beat (N=523) .................. 76
Table 4.31 Practice of abdominal examinations for uterine contractions (N=485) ................ 76
ix
Table 4.32 Mode of delivery among reviewed cases (N=674) ............................................. 77
Table 4.33 Maternal condition after delivery (N=706) .......................................................... 78
Table 4.34 Newborn birth outcome (N=302) ........................................................................ 78
Table 4.35 Chief complaints at admission (N=143) ............................................................. 79
Table 4.36 Admitted neonates’ age (N=143) ....................................................................... 79
Table 4.37 Neonates’ weight at admission (N=132) ............................................................ 80
Table 4.38 Neonates’ body temperature at admission (N=139) ........................................... 81
Table 4.39 Neonates’ respiratory rate at admission (N=134) ............................................... 81
Table 4.40 Neonates’ heartbeat at admission (N=123) ........................................................ 81
Table 4.41 Admitted neonates’ place of delivery (N=91) ...................................................... 82
Table 4.42 Neonates’ APGAR score at one and five minutes after birth (N=58) .................. 83
Table 4.43 Neonates’ gestational age (N=115) ................................................................... 83
Table 4.44 Neonates’ birth weight recorded (N=98) ............................................................ 84
Table 4.45 Main causes of neonatal illness and reason for admission (N=272) ................... 84
Table 4.46 Length of stay in NICU (N=114) ......................................................................... 85
Table 4.47 Appropriateness of referral by case team (N=861) ............................................. 86
Table 4.48 Appropriateness of referral by referral status (N=861) ....................................... 87
Table 4.49 Staffing matrix by type of health facility .............................................................. 91
Table 4.50 Human resource expenses by type of facility ..................................................... 92
Table 4.51 Common administrative costs by type of facility ................................................. 93
Table 4.52 Delivery and essential newborn care at health centres ...................................... 94
Table 4.53 Delivery and essential newborn care at primary hospitals .................................. 95
Table 4.54 Caesarean section direct service costs at primary hospital ................................ 95
Table 4.55 Neonate Intensive Care Unit at primary hospital ................................................ 96
Table 4.56 Average number of clients by type of facility and major service category ........... 97
Table 4.57 Patient caseload at various health care units of health centres and hospitals .... 98
Table 4.58 Number of professionals required at health centre level for Basic Emergency
Obstetrics and Newborn Care (BEmONC) ......................................................... 99
Table 4.59 Number of health professionals required at hospital level for services provided at
Newborn Intensive Care Unit ............................................................................. 99
Table 4.60 Number and type of professionals required at primary hospitals for
Comprehensive Emergency Obstetrics and Newborn Care (CEmONC) .......... 100
Table 4.61 Delivery and essential newborn care costs at health centre level..................... 101
Table 4.62 Cost of delivery and essential newborn care costs at primary hospital level .... 102
Table 4.63 Cost of caesarean section at primary hospital level ......................................... 102
Table 4.64 Cost of newborn intensive care unit costs at primary hospital level .................. 103
Table 5.1 Respondents’ gender and qualification ............................................................ 108

x
LIST OF FIGURES Figure 2.1 Ethiopian health system tiers ............................................................................. 32
Figure 2.2 Trends in mortality rates in Ethiopia ................................................................... 33
Figure 3.1 Qualitative data analysis .................................................................................... 47
Figure 4.1 Flow of case review ........................................................................................... 54
Figure 6.1 Elements of the strategy to improve the referral system .................................. 136
xi
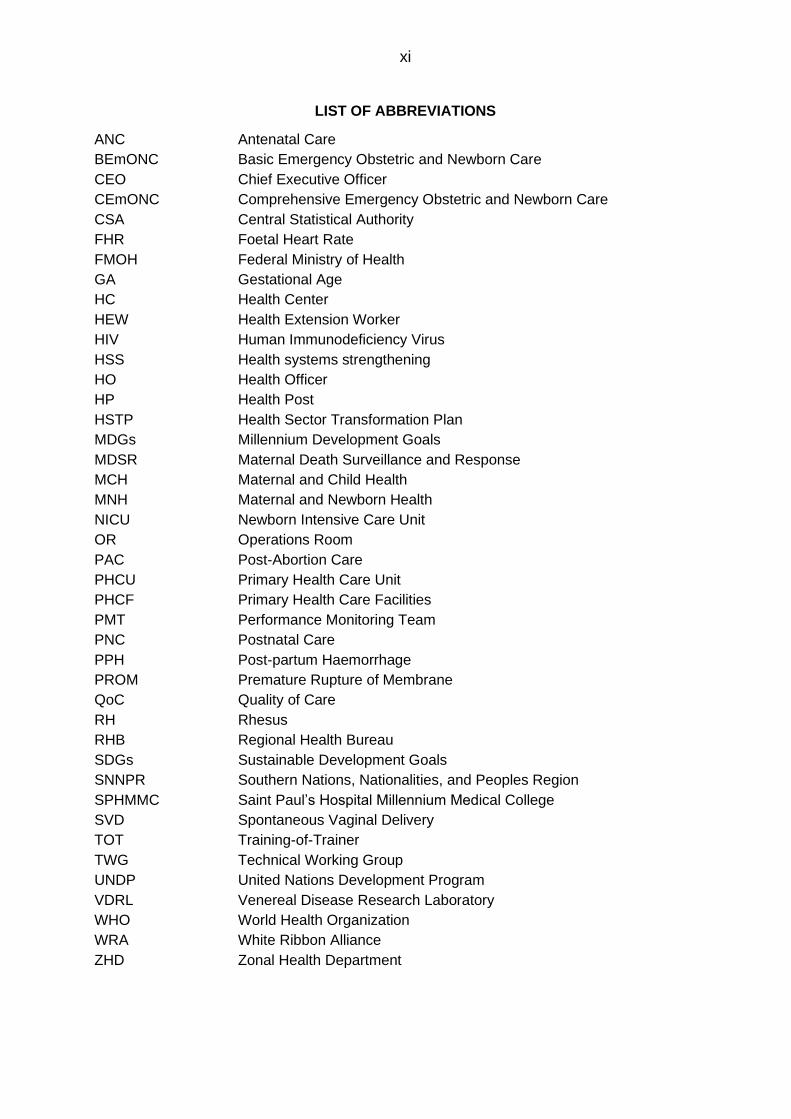
LIST OF ABBREVIATIONS
ANC Antenatal Care
BEmONC Basic Emergency Obstetric and Newborn Care
CEO Chief Executive Officer
CEmONC Comprehensive Emergency Obstetric and Newborn Care
CSA Central Statistical Authority
FHR Foetal Heart Rate
FMOH Federal Ministry of Health
GA Gestational Age
HC Health Center
HEW Health Extension Worker
HIV Human Immunodeficiency Virus
HSS Health systems strengthening
HO Health Officer
HP Health Post
HSTP Health Sector Transformation Plan
MDGs Millennium Development Goals
MDSR Maternal Death Surveillance and Response
MCH Maternal and Child Health
MNH Maternal and Newborn Health
NICU Newborn Intensive Care Unit
OR Operations Room
PAC Post-Abortion Care
PHCU Primary Health Care Unit
PHCF Primary Health Care Facilities
PMT Performance Monitoring Team
PNC Postnatal Care
PPH Post-partum Haemorrhage
PROM Premature Rupture of Membrane
QoC Quality of Care
RH Rhesus
RHB Regional Health Bureau
SDGs Sustainable Development Goals
SNNPR Southern Nations, Nationalities, and Peoples Region
SPHMMC Saint Paul’s Hospital Millennium Medical College
SVD Spontaneous Vaginal Delivery
TOT Training-of-Trainer
TWG Technical Working Group
UNDP United Nations Development Program
VDRL Venereal Disease Research Laboratory
WHO World Health Organization
WRA White Ribbon Alliance
ZHD Zonal Health Department

1
CHAPTER 1
ORIENTATION TO THE STUDY
1.1 INTRODUCTION
Every year approximately 303,000 maternal deaths occur globally, with a
disproportionate burden of these in Sub-Saharan Africa and Asia (Moran, Jolivet, Chou,
Dalglish, Hill, Ramsey, Rawlins & Say 2016:2). A 45% and 24% reduction in maternal
and neonatal mortality was achieved between 1990 and 2013, respectively (Campbell,
Sochas, Cometto & Matthews 2016:126). However, this significant decline in maternal
and newborn mortality was uneven among various social strata (Baker, Peterson,
Marchant, Mbaruku, Temu, Manzi & Hanson 2015:380) and did not achieve the
Millennium Development Goals (MDGs) target of a reduction of the maternal mortality
ratio (MMR) by 75% by 2015 (Moran et al 2016:2).
The eight MDGs (2005-2015) were replaced with the 17 sustainable development goals
(SDGs) at the United Nations Conference on Sustainable Development in Rio de
Janeiro in 2012. The SDGs are based on the principle of ‘leaving no one behind’ and
designed to achieve a better and more sustainable future for all, with no poverty and
hunger, good health and well-being, quality education, clean water and sanitation, clean
energy, and climate action, amongst other goals. Sustainable development goal (SDG)
3: good health and well-being includes working towards the reduction of the global
maternal and neonatal mortality rate (NMR) to achieve an MMR of less than 70 per
100,000 live births, and an NMR of less than 12 per 1,000 live births by 2030 (UNDP
2012).
Globally, half of all maternal deaths, one-third of stillbirths and one quarter of neonatal
deaths are due to delivery-related complications (Pasha, Saleem, Ali, Goudar, Garces,
Esamai, Patel, Chomba, Althabe, F, Moore, Harrison, Berrueta, Hambidge, Krebs,
Hibbberd, Carlo, Kodkany, Derman, Liechty, Koso-Thomas, McClure & Goldenberg
2015:8). In sub-Saharan Africa, where the majority of maternal and newborn problems
exist and healthcare systems are weak, reducing the burden of the problems has been
2
difficult as the availability and quality of care are heterogeneous and often inadequate
(Huchon, Arsenault, Tourigny, Coulibaly, Traore, Dumont & Fournier 2014:50). In
Tanzania, weak health systems were not able to enhance effective coverage to reach
all mothers and newborns with key interventions (Baker et al 2015:380). In Sri Lanka,
mothers and neonates accessing the health service, especially in low-resource settings,
received poor quality care and were thus exposed to preventable childbirth-related
harm (Patabendige & Senanayake 2015:12).
In Malawi, poor quality clinical care affected health service utilisation and other
problems by discouraging women from institutional delivery, encouraging mothers to
bypass facilities with a bad reputation or delay seeking care and then arriving in critical
condition (Bradley, Kamwendo, Chipeta, Chimwaza, De Pinho & McAuliffe 2015:67).
Poor quality care eroded community trust and confidence and delayed the decision to
seek care when complications arose (Bradley et al 2015:66).
An effective referral system is a critical component of the health system for the
reduction of maternal mortality and morbidity due to obstetric complications (Chaturvedi,
Randive, Diwan & De Costa 2014:1). The actions of lower-level health facilities with
limited capacity affect the time required to complete the referral process for emergency
case management. A study in Nigeria found that four-fifths (81%) of near misses were
in serious condition upon arrival at the hospital (Adeoye, Ijarotimi & Fatusi 2015:83). An
effective referral system should have formal communication and transport systems,
capable receiving facilities, protocols for sending and receiving facilities, and take
accountability for providers’ performance (Tiruneh, Karim, Avan, Zemichael, Wereta,
Wickremasinghe, Keweti, Kebede & Betemariaml 2018:4). Suboptimal primary care
referrals negatively impact patients and the system itself (Bosch, Escoda, Nicolás,
Coloma, Fernández, Coca & López-Soto 2014:76).
1.2 BACKGROUND TO THE RESEARCH PROBLEM
Ethiopia has high maternal and neonatal mortality rates, with a maternal mortality ratio
of 412 per 100,000 live births and a neonatal mortality of 29/1000 live births (CSA
[Ethiopia] & ICF 2017:124, 252). Maternal complications and death significantly affect
the ability of newborns to survive and thrive (Austin, Langer, Salam, Lassi, Das & Bhutta
2014:S1). The reduction of maternal mortality is beneficial for both mother and newborn
3
and depends on the availability of high-quality delivery care and a functioning referral
system (Dewana, Gebremariam, Abdulahi, Fikadu & Facha 2017:31).
Austin et al (2014: S3) describe maternal and newborn care as care that is safe,
effective, patient-centred, timely, efficient and equitable. In addition, health services
need to be provided at different levels depending on the type of intervention patients
require, and an effective referral system should be in place to ensure a close
relationship between all levels of the health system (Ajwant 2013:713; WHO 2008a:1).
The WHO (2008a:2) defines a referral as “a process in which a health worker at a one
level of the health system, having insufficient resources (drugs, equipment, skills) to
manage a clinical condition, seeks the assistance of a better or differently resourced
facility at the same or higher level to assist in, or take over the management of the
client’s case”. The health system determinants and general determinants influence the
design and functioning of a referral system. Health system determinants include but are
not limited to capabilities of lower levels; availability of specialised personnel or trained
providers, and organisational arrangements. General determinants include population
size and density; terrain and distances between facilities; pattern and burden of
disease; demand for and ability to pay for referral care (WHO 2008a:1).
Little or no coordination between different types of health facilities with consequent
poorly developed referral linkages results in negative consequences for mothers and
newborns (Hodgins 2013:149). In Mozambique, Chavane, Bailey, Loquiha, Dgedge,
Aerts and Temmerman (2018:6) found that investment was required to strengthen
referral linkages and build the capacity of facilities to rapidly diagnose and manage
pregnancy-related complications. In remote rural areas in Uganda, Accorsi, Somigliana,
Solomon, Ademe, Woldegebriel, Almaz, Zemedu, Manenti, Tibebe, Farese, Seifu,
Menozzi and Putoto (2017:6) found strong communication and an ambulance-based
referral system for EmONC highly cost effective.
In 2016, the institutional birth rate in Ethiopia was 26%, which was an improvement on
previous years, but still ranked among the lowest in the world (Windsma, Vermeiden,
Braat, Tsegaye, Gaym, Van den Akker & Stekelenburg 2017:1). Several factors
contributed to low service utilisation including sociodemographic, cultural and communal

4
factors, limited access to health facilities, and poor quality of care in health facilities
(Windsma et al 2017:1).
In 2017, the overall quality of delivery service was found to have fallen far below the
recommended standards in some settings (Dewana et al 2017:35). Shortages of skilled
human resources, infrastructure, drugs, supplies, equipment, and infection prevention
materials were found in most health facilities. In addition, unrecorded and low correct
partograph recordings were observed (Dewana et al 2017:35). The perception that
services delivered at health centres were of poor quality led mothers to bypass primary
health care centres and seek care from hospitals. Bypassing a midlevel facility resulted
in higher costs and subsequent underutilisation of lower level health care facilities. The
importance of strengthening the health care system to provide BEmONC at lower levels,
even though the functionality differed, led the Ethiopian Government to upgrade the
capacities of rural health centres to provide the required services (Tiruneh et al 2018:3).
1.3 STATEMENT OF THE PROBLEM
The Federal Ministry of Health (FMOH) of Ethiopia has expanded health facilities across
the country. A lack of coordination between facilities, however, has negatively affected
communities’ trust and the efficiency of health service delivery (FMOH 2015a:41). The
following factors impact negatively on the existing referral systems:
• Many primary hospitals’ budgets are depleted before the end of each fiscal year
and some request high running costs.
• Limited and varied utilisation of services provided at health centre level within the
catchment areas of hospitals, which could also be linked to inefficient use of
available resources (e.g. drugs, skilled health care providers).
• High client volumes at hospitals, which should have been managed at health
centres, which could result in staff demotivation and burnout, and ultimately poor-
quality service.
• High transportation and other direct and indirect costs and poor treatment at
hospital level could affect future service seeking.
• Lack of or untimely communication between facilities is an important factor in
saving maternal and newborn lives.

5
The above factors motivated the researcher to conduct the study to describe and
explore factors responsible for inappropriate referrals and develop a strategy to improve
effective coordination among health facilities.
1.4 PURPOSE OF THE STUDY
The purpose of the study was to formulate strategies to improve maternal and newborn
health care referrals in the health system in Ethiopia.
1.4.1 Research objectives
In order to achieve the purpose, the objectives of the study were to:
• Map out a path, procedures and reasons for maternal and newborn care referrals
among various levels of facilities.
• Estimate the proportion of inappropriate referrals within the primary level care
facilities.
• Cost maternal and newborn care related services at various levels of the health
system.
• Analyse the effects of current referral practices in the health system.
• Identify and reach consensus on key strategies to improve referrals in the health
system.
1.4.2 Research questions
The study wished to answer the following questions:
• What is the route of referral services for maternal and newborn care?
• What proportion of mothers or newborns is referred to other facilities for
appropriate reasons?
• What is the cost of material and newborn care related services at various levels
of the health system – primary hospital and health centres?
• What problems do primary hospitals face due to referrals in the health system?
6
• What strategies can be introduced in the system to improve the referral system
for maternal and newborn care?
1.5 SIGNIFICANCE OF THE STUDY
The expansion of primary health care facilities (PHCFs) and increasing numbers of
cases presenting for care have made quality of services a major issue in Ethiopia. The
quality of care at lower levels and communication between health facilities and
professionals and interaction with clients emphasise the need to observe normal referral
procedures at all levels. A breach of procedure at any stage has implications for
providers and patients.
Identifying issues at various levels of care highlighted key focal areas. The developed
referral improvement strategy should assist programme managers and service
providers to respond to patients’ needs, improve quality of care and promote efficient
use of human and financial resources at lower levels of the PHC provision.
1.6 THEORETICAL FOUNDATIONS OF THE STUDY
A conceptual framework deepens understanding of the phenomenon under study and is
crucial for knowledge on the phenomenon (Polit & Beck 2017:264; Grove, Burns & Gray
2013:117). A theory is a set of defined and interrelated concepts about a phenomenon
and developed from abstract thoughts, findings, and lived experiences (Grove, Burns &
Gray 2013:117). This study was based on Donabedian’s (1988) model and Jahn and De
Brouwere’s (2001) referral chain model.
1.6.1 Donabedian’s (1988) model
Quality of health care is becoming ever more important as access to institutional
services, particularly antenatal and delivery care has significantly increased (Austin et al
2014:S3). As services are not provided at only one level or type of health facility, an
appropriate referral service is part of quality health care. Quality of care can also be
analysed using the Donabedian’s (1988) conceptual model. The model has three
categories: structure, process, and outcomes. Structure describes the context in which
care is delivered, including hospital buildings, staff, financing, and equipment. Process
7
encompasses the transactions between patients and providers throughout the delivery
of health care. Outcomes embody the effects of healthcare on the health status of
patients and populations (Donabedian 1988:1745). This study used a modified version
of Donabedian’s model, which focused on the structure, including the role of multiple
factors in the structure, namely community, facility and districts (Austin et al 2014:S4).
1.6.2 Referral chain model
The referral chain model has three components, namely sender, transport and receiver
(Jahn & De Brouwere 2001:229). At the sender facilities, risk assessment, availability of
referral guideline, quality of care, clinical judgement and availability of transportation
were important factors. At the receiver facilities, quality of care, financial accessibility
and preferential treatment were important factors to consider in the referral chain model
(Chaturvedi et al 2014:2).
1.7 RESEARCH METHODOLOGY
This section briefly describes the research design and methodology used in the study.
Chapter 3 describes the research design and methodology in detail.
1.7.1 Research design
A research design is the “overall plan for addressing a research question, including the
specifications for enhancing the integrity of the study” (Polit & Beck 2017:12). The
researcher used a mixed methods design for the study. Mixed method studies use a
combination of qualitative and quantitative methods (Creswell & Creswell 2018:14;
Parahoo 2014:81). The researcher conducted the study in two phases. Quantitative
data was collected in phase 1 and qualitative data in phase 2. The researcher then
developed the strategies to improve mother and neonatal referrals in the health system
based on the quantitative and qualitative findings.

8
1.7.2 Research methodology
Research methodology is the plan for conducting the specific steps of a study (Groves
et al 2013:230). The methodology includes the setting, population, sampling and
sample, and data collection and analysis.
1.7.2.1 Study setting
A setting refers to the “physical site or location used to conduct a study and in which
data collection takes place” (Polit & Beck 2017:743). The study was conducted in Addis
Ababa, the capital city of Ethiopia. The health sector in Ethiopia is a three-tier health
care delivery system. The first tier or level is a woreda or district health system
comprising a primary hospital (with a population coverage of 60,000-100,000 people),
health centres (PHC facilities serving a population of 15,000-25,000) and their satellite
health posts (serving 3,000-5,000) that are connected to each other by a referral system
(FMoH 2010:4). This study focused on first level health care delivery, especially
maternal and newborn services.
1.7.2.2 Population
A population is “the entire aggregate of cases in which a researcher is interested” (Polit
& Beck 2017:273). The researcher used two populations, namely records and
participants.
• Quantitative phase – Medical record review and health service costing
In the quantitative phase, the population consisted of the primary hospital and health
centre maternal and newborn records. With regards to health service costing, the
maternal and newborn related services provided in the selected sites were costed.
• Qualitative phase – Key informant interviews
In the qualitative phase, the population consisted of health care workers providing direct
MNH care at delivery and newborn intensive care units (NICUs) in sites.

9
1.7.3 Sample and sampling
A sample refers to a subset of a population (individuals, elements or objects) or a group
selected to act as representatives of the population (Polit & Beck 2017:275). Sampling
is the process of selecting participants, events, behaviours, or other elements that
represent the population being studied (Grove et al 2013:357). In this study, the
researcher selected a sample of sites, records and participants (informants).
1.7.3.1 Site sampling
The researcher used multistage sampling, a form of cluster sampling, to select the sites
(Bordens & Abbott 2011:285). The researcher randomly selected the Southern Nations
and Nationalities People’s Region from the four clusters of regional states in Ethiopia.
After selecting the region, based on the last Ethiopian Fiscal Year’s instructional
delivery performance, the researcher listed the primary hospitals in the region. Taking
the median of performance, the primary hospitals formed two strata – high performing
(above the median) and low performing (below the median). Two primary hospitals were
randomly selected for the study. Based on the projected catchment population size, the
two hospitals were expected to serve a population of 446,102 residing in two selected
woredas in 2017.
Each of the primary hospitals had six (6) health centres in their catchment area. To
select health centres, kebeles (villages) were divided into urban/city and rural, and two
sites and one from urban and two from rural were randomly selected. Two hospitals and
six health centres were included for facility level in phase 2 and phase 3 of the study.
1.7.3.2 Data source sampling
The researcher selected a sample of medical records for review and financial records
for costing, and health care professionals for interviews.
• Medical record review
Using a case extraction sheet, all mothers and sick neonates who visited the selected
facilities at delivery and NICU rooms from 8 July 2017 to 7 July 2018 were recorded.
10
Then, in consultation with the facility management, hospital catchment kebeles
(villages) were identified. Cases who visited the facility from those kebeles (villages)
were considered for detailed case reviews.
The sample size was determined by means of a single population proportion formula,
using the following assumptions: hospital level delivery as 26.2% (p=0.262) (CSA
[Ethiopia] & ICF 2017:149), level of significance as 5% (a=0.05), Z a/2=1.96 and margin
of error as 4% (d=0.04). Adding the design effect of 1.5 made the total sample size and
10% of non-response rate, the total size was 766 (Bruce, Pope & Stanistreet 2018:160).
For the delivery case review, this number was proportionally distributed between the
two selected facilities. For the sick neonates, all the sick neonates admitted in the NICU
who fulfilled the inclusion criteria were considered for the study.
• Health services costing
Financial records and professionals working in the finance department of the selected
primary hospitals and health centres were consulted to collect information on service
costs during the last Ethiopian fiscal year.
• Key informant interviews
The researcher used purposive sampling to select the health workers working in the
MCH department and management team of the selected hospitals and health centres
and involved in the referral process.
1.7.4 Data collection
Data collection is the process of collecting information (data) related to research
questions in a systematic way to address a research problem (Polit & Beck 2017:725).
Three data-collection instruments were developed in English for data collection:
• Quantitative – Medical record review
• Quantitative – Health service costing
• Qualitative – Interviews with health workers

11
Data was collected as follows:
• Medical record review
The data extraction sheet contained pre-identified variables to be extracted from the
medical records.
• Service costing
The researcher used a customised instrument based on the Federal Ministry of Health’s
Management Science for Health (MSH) core plus tool and National Health Accounts
tool. This instrument captured all the costs related to service provision as well as
common costs, such as staff salaries and benefits and other indirect costs, including
equipment. The instrument included the number of cases that visited the facilities and
demographic characteristics of the catchment population. The information assisted the
researcher to divide common costs between MNH-related and other services.
• Key informant interview guide
The researcher developed the interview guide based on the Donabedian and referral
chain models and the literature review. The guide collected information from the health
workers working at the selected health centres and primary hospitals.
1.8 VALIDITY AND RELIABILITY
The quality of a research instrument is determined by its validity and reliability. Validity
refers to the degree to which an instrument accurately measures what it is intended to
measure (Goodman & Thompson 2017:142; Polit & Beck 2017:582). Reliability refers to
“the likelihood that the instrument will obtain the same results time after time” (Goodman
& Thompson 2017:142). Reliability refers to the degree of consistency or dependability
with which the instrument measures the attributes it is designed to measure (Burns et al
2013:389).

12
1.8.1 Validity and reliability in the quantitative phase (medical record review and
health service costing)
In the quantitative phase, the researcher ensured internal and external validity. Internal
validity refers to how well a study is conducted, and confounding factors are controlled.
External validity refers to the generalisability of the findings of the study to a larger
population (Goodman & Thompson 2017:201). The researcher developed the
instruments to generate valid information on the topic under study (Bordens & Abbott
2011:276-277).
The reliability of a data-collection instrument is concerned with stability and consistency.
The stability of a questionnaire is the degree to which it produces similar results on
being administered twice. If the same variable is measured under the same conditions,
a reliable instrument will produce identical measurements and the measuring instrument
will yield consistent numerical results each time it is applied (Polit & Beck 2017:331-
332).
The researcher developed the quantitative and qualitative data-collection instruments
based on the two models and the literature review. The researcher trained two data
collectors in administering the questionnaires (Bordens & Abbott 2011:276).
1.8.2 Validity and reliability in the qualitative phase
In qualitative studies, the purpose of validity is to gain a deeper understanding of the
phenomenon under study (Polit & Beck 2017:219). Internal and external validity in this
case ensured the trustworthiness of the study. Trustworthiness refers to the confidence
that qualitative researchers have in their data, using the strategies of credibility,
dependability, confirmability, and transferability (Creswell & Creswell 2018:199). In
addition, triangulation increased fidelity of the data interpretation by using multiple data-
collection methods and sources (Kolb 2012:85).
13
1.9 DATA ORGANISATION AND ANALYSIS
Data analysis is the systematic organisation and synthesis of data to establish order,
structure and meaning to qualitative data collected (Polit & Beck 2017:725; Botma et al
2010:220). Data analysis started during data collection.
1.9.1 Cleaning of the data sets
The researcher prepared a code book for the first phase – medical record review. The
code book is a master copy of the questionnaire, with the question number, the
question, the full range of valid codes including missing and 'do not apply' values written
in it. Data cleaning was done at two levels: data entry level (controlled data entry), and
simple frequency running and comparing findings. Based on the findings of the
frequency tables, errors that occurred during data collection, coding and input were
eliminated. In addition, missing values, skips, range checks and checks for
inconsistency were made. There are two types of missing values: first, when a question
is deliberately blank because it did not apply to the individual respondent (the
respondent legitimately skipped it and was 'routed' round it); second, when a reply was
expected but not given, which is known as an 'inadequate' response (Bowling 2014:372-
379).
1.9.2 Quantitative data analysis
Once the data had been cleaned, using Stata version 11, the first step was to produce
descriptive statistics, which helped to describe the findings and assess any skewness.
Based on the distribution, data was further decoded, and measures of comparison
made as required (Bowling 2014:381).
1.9.3 Qualitative data analysis
The qualitative data analysis commenced with reading and re-reading the transcribed
interviews to identify contents and partners. Emerging themes and categories were
identified, and a coding structure then prepared. The researcher used ATLAS.ti
computer program for data organisation (Creswell & Creswell 2018:192). The
14
researcher identified themes, sub-themes and categories in order to map relationships
between them (Tolley, Ulin, Mack, Robinson & Succop 2016:205).
1.10 STRATEGY FORMULATION
The researcher following a step wise approach developed and formulated key strategies
to improve referrals in the health care system. The first step was understanding the
issues around the existing practices with regards to referral system. During the second
phases of the study, participants of the study were requested to provide suggestions for
the problems they face. Based on the findings, the researcher further explored
experiences at various countries and drafted a strategy to address the identified issues.
Then, comments from service providers and programme managers were considered to
refine the strategies.
1.11 ETHICAL CONSIDERATIONS
Ethics deals with matters of right and wrong. When humans are used as study
participants, care must be taken in ensuring that their rights are protected (Polit & Beck
2017:748). Accordingly, the researcher obtained permission to conduct the study,
obtained informed consent from the participants, and observed the ethical principles of
beneficence, respect for human dignity, and justice (Polit & Beck 2017:748).
• Permission
The researcher obtained ethical approval and permission to conduct the study from the
Department of Health Studies Higher Degrees Committee of the University of South
Africa. Permission to conduct the study was also obtained from the Southern Nations
and Nationalities Peoples Region’s Health Bureau, the Zone Health Departments, and
the management of the selected hospitals and facilities (Annexures 1 and 2).
• Beneficence
The principle of beneficence states that one should do good and, above all, do no harm
(Grove et al 2016:98). The researcher assured the participants of the benefit of the
findings and strategies to health care service.
15
• Respect for human dignity
Respect for human dignity refers to the right to self-determination and full disclosure
(Polit & Beck 2017:173). The researcher explained the purpose, nature and significance
of the study to the participants in the languages familiar to them. The participants were
informed that participation was voluntary and that they could withdraw from the study at
any time if they wished to do so. The participants were given the opportunity to ask any
questions, and an information leaflet and informed consent form to sign. Once
participants verbally agreed to participate, they were asked to sign the informed consent
form.
• Justice
The principle of justice refers to the right to privacy and the right to fair treatment (Polit &
Beck 2012:174). The researcher assured the participants of privacy, confidentiality and
anonymity, and treated all the participants with respect and fairly. The researcher
assured the participants that all the data would be treated with strict confidentiality and
kept under lock and key, accessible only to the researcher.
1.12 DEFINITION OF KEY CONCEPTS
For the purposes of this study, the following key terms were used as defined below.
Health system. A health system consists of all organisations, people and actions
whose primary intent is to promote, restore or maintain health (WHO 2011). In this
study, the health system referred to the selected health care facilities and participants.
Referral. Referral is a process by which a health worker transfers the responsibility of
care temporarily or permanently to another health professional or social worker or to the
community in response to its inability or limitation to provide the necessary care (FMOH
2010:1).
Appropriateness of referral. The appropriateness of referrals can be defined by their
distinct attributes, namely referral necessity, destination and quality (Blundell, Clarke &
Mays 2010:184):

16
• Referral necessity refers to whether a patient with given characteristics is
believed to be suitable for referral.
• Referral destination (or level) is associated with where or to whom the patient
should be referred.
• Referral quality (or process) refers to aspects of how a referral is carried out,
including factors such as whether investigations had been undertaken before
referral, or information exchanged, and the level of patient involvement in the
referral decision.
Fulfilling three of the attributes makes the referral appropriate but missing one of the
elements makes the referral inappropriate.
Self-referral. Self-referral referred to ones made by patients themselves. Self-referrals
meant presentation to the referral facilities by individual patients (Walter & Ajwant
2013:713).
Maternal and newborn (neonatal) care. This referred to care provided to the mother
and newborn during delivery and neonatal period (birth to 28 days of life).
Health workers. This referred to the health professionals and non-health professionals
(E.g. ambulance drivers) who do have contacts with the patient while implementing the
referral system.
1.13 STRUCTURE OF THE DISSERTATION
The dissertation consists of seven chapters.
Chapter 1: Orientation to the study
This chapter introduces the background to and purpose of the study as well as the
theoretical framework, research design and methodology and ethical considerations of
the study.

17
Chapter 2: Literature review
This chapter discusses the literature review conducted for the study on maternal and
newborn health issues and service delivery to mothers and newborns; coordination of
health service delivery points, and the theoretical framework of the study.
Chapter 3: Research design and methodology
This chapter discusses the research design and methodology used in the study.
Chapter 4: Quantitative data analysis and interpretation and findings
This chapter discusses the quantitative data analysis and findings.
Chapter 5: Qualitative data analysis and interpretation and findings
This chapter discusses the qualitative data analysis and presents the findings.
Chapter 6: Development of strategy to improve referral system
This chapter describes the development of a strategy to improve referral systems at
primary health care level.
Chapter 7: Conclusion and recommendations
This chapter summarises the findings and conclusions of the study and makes
recommendations for further research.
1.14 CONCLUSION
This chapter described the research problem, purpose, research design and
methodology, and ethical considerations of the study and defined key terms. As
described in this chapter, the maternal and new-born care requires coordination of care
between various levels of health care facilities as some of the problems are not
predictable as well as the lower facilities are not capable of providing all the required

18
care. The chapter also outlined how mixed method study design was used to explore
the situations and identify factors affecting coordination of care between facilities. Then,
this chapter described the process of strategy development to respond to the problems
identified.
Chapter 2 discusses the literature review conducted for the study.
19
CHAPTER 2
LITERATURE REVIEW
2.1 INTRODUCTION
Chapter 1 introduced the study and outlined the problem, purpose, research design and
methodology of the study. This chapter discusses the literature review conducted for the
study. A literature review is a source of information to develop study protocol and
analysis of the findings (Grave et al 2013:608). The literature review covered the global
maternal and newborn health status; major causes of maternal and newborn ill-health;
quality of maternal and newborn care; referral systems; common indicators for referrals;
causes of adverse outcomes at referral facilities; health care delivery systems, and
maternal and newborn health in Ethiopia.
2.2 GLOBAL SITUATION OF MATERNAL AND NEWBORN HEALTH
A positive pregnancy experience encompasses a series of steps for maintaining
physical and sociocultural normality, maintaining a healthy pregnancy for mother and
baby, having an effective transition to positive labour and birth, and achieving positive
motherhood (WHO 2016a::20). Maternal mortality remains unacceptably high, however,
with approximately 303,000 maternal deaths occurring each year (Moran et al 2016:2).
Although maternal and newborn mortality has been substantially reduced worldwide in
recent years, progress has been uneven (Baker et al 2015:380). Moreover, sustainable
development goal (SDG) 3: good health and well-being includes working towards the
reduction of the global maternal and neonatal mortality rate to achieve an MMR of less
than 70 per 100,000 live births, and an NMR of less than 12 per 1,000 live births by
2030 (UNDP 2012). Maternal mortality and maternal morbidity are serious health
problems. In Malawi and Pakistan, for every woman who died, an estimated 20 or 30
women suffered non life-threatening maternal morbidity related to pregnancy and
childbirth (Zafar, Jean-Baptiste, Rahman, Neilson & Van den Broek 2015:2).
In 2015, an estimated 2.6 million babies were stillborn (WHO 2016a:19). A stillbirth is
defined as “a birth without signs of life (heartbeat, respiration or movement), with the
20
lower gestational age limit generally from 20 to 28 weeks” (Goldenberg, Saleem, Pasha,
Harrison & McClure 2016:135). Most stillbirths occur in low- and middle-income
countries (LMICs). Low socio-economic status, less education, women with a history of
pregnancy losses or with complicated pregnancies, including multiple gestations, were
identified as factors contributing to still birth. In addition, the quality of care at or near to
the time of delivery is an important factor (McClure, Saleem, Goudar, Moore, Garces,
Esamai, Patel, Patel, Chomba, Althabe, Pasha, Kodkany, Bose, Berreuta, Liechty,
Hambidge, Krebs, Derman, Hibberd, Buekens, Manasyan, Carlo, Wallace, Koso-Thoma
& Goldenberg 2015:2).
Low birth weight is another adverse effect of pregnancy. The WHO (2016a:1) defines
low birth weight as “the weight at birth of less than 2500 grams”. Low birth weight
infants are approximately 20 times more likely to die than heavier babies (Jacobs, Judd
& Bhutta 2016:2). In 2010, 11.1% of all live births globally were preterm. Preterm birth
contributes significantly to perinatal death and other neonatal adverse outcomes
(Miyazaki, Garcia, Ota, Swa, Oladapo & Mori 2016:1).
2.3 MAJOR CAUSES OF MATERNAL AND NEWBORN ILL-HEALTH
Over 75% of maternal deaths are due to direct obstetric causes, such as severe
bleeding, infection, complications of unsafe abortion, eclampsia, and obstructed labour
(Lassi & Bhutta 2015:6). More than 40% of maternal deaths occur during the
intrapartum period, and 45% of all maternal deaths during the postpartum period occur
within the first 24 hours after delivery (Brenner, De Allegri, Gabrysch, Chinkhumba,
Sarker & Muula 2015:2). These direct causes are preventable yet intrapartum care
remains suboptimal in providing timely and appropriate administration of effective
interventions to prevent and manage complications (Oladapo, Souza, Bohren, Tunçalp,
Vogel, Fawole, Mugerwa & Gülmezoglu 2015:2).
Stillbirth is another problem in relation to maternal and newborn health. In low-middle
income countries, the risk of stillbirth is related to lack of access to antenatal care and to
quality obstetric care (McClure et al 2015:2). Since different conditions cause stillbirth,
there is no single intervention to substantially reduce stillbirths. During antenatal care,
some interventions prevent the occurrence of stillbirth but the biggest reductions occur
through interventions while providing intrapartum care (Goldenberg et al 2016:135).
21
The majority of early neonatal deaths in LMICs were due to birth asphyxia (i.e.,
newborns’ failure to initiate or maintain regular breathing at birth from various causes),
prematurity, and septic infections (Brenner et al 2015:2). Major conditions contributing
to infections include sepsis, pneumonia, meningitis and diarrhoea (Opiyo & English
2015:8). Between 25% and 45% of neonatal deaths occur within the first 24 hours, and
close to 90% of deaths occur within the first 48 hours of newborn life (Brenner et al
2015:2). In Pakistan and other LMICs, delivery complications are responsible for 50% of
all maternal deaths, 34% of stillbirths and 25% of neonatal deaths (Pasha et al 2015:8).
In developing countries, most maternal, perinatal and neonatal deaths and morbidities
occur at home because the majority of women give birth at home without the presence
of skilled birth attendance (Lassi & Bhutta 2015:6).
Reducing maternal mortality and morbidity remains a major challenge in Sub-Saharan
Africa as the availability and quality of care are heterogeneous and often inadequate
(Huchon et al 2014:56). The high burden is attributable to patient and health system
factors, including inability to recognise an impending complication, failure to reach an
appropriate level of care in a timely manner, lack of appropriate care provision at the
facility or to iatrogenic causes, such as from unsafe labour augmentation or unhygienic
care practices (Pasha et al 2015:8). In addition, the availability of skilled health workers
determines the provision of appropriate care (Opiyo & English 2015:8).
In many lower-income countries, limited access to safe and timely caesarean section is
a major barrier to improving delivery outcomes (Vogel et al 2015: e260). Often health
workers are compelled to practise evidence-based labour management in overcrowded
and under-resourced health facilities (Oladapo et al 2015:2).
Caesarean delivery rates increased globally between 2004 and 2011, consequently the
proportion of individuals with scarred uteri also increased (Vogel et al 2015: e267). In a
study with 2,478 patients in a referral hospital in Dar es Salaam, Tanzania, Litorp,
Rööst, Kidanto, Nyström and Essén (2016:183-187) found that previous caesarean
delivery was not a risk factor for severe maternal outcomes or adverse perinatal
outcomes. However, the participating individuals may have constituted a healthy group.
Litorp et al (2016:187) stress that there could have been differences in terms of
healthcare-seeking behaviour, referral mechanisms, extra partum monitoring and

22
clinical decision-making. Repeat caesarean deliveries are often more complicated than
the first caesarean delivery, and have been associated with adhesion development,
long operation times, injuries to the bladder and bowel, and blood transfusions. Avoiding
medically unnecessary caesarean sections, unnecessary labour augmentation and
encouraging a trial of vaginal birth after first caesarean sections may help reduce the
increased rate of caesarean sections (Vogel, Moore, Timmins, Khan, Defar, Hadush,
Terefe, Ba-Thike, Than, Makuwani, Mbaruku, Mrisho, Mugerwa, Ritchie, Rashid,
Straus, GuÈlmezoglu, 2016a:8).
There is slow progress in preventing stillbirths and perinatal deaths. In order to identify
the cause of perinatal deaths there is a need for a unifying global system (Allanson,
Tunçalp, Gardosi, Pattinson, Erwich, Flenady, Frøen, Neilson, Chou, Mathai, Saya &
Gülmezoglua 2016:79). To achieve the SDG targets, it is important to increase the
coverage of quality essential services and simultaneously address the underlying social,
political and economic determinants of maternal health across all settings (Moran et al
2016:2). The planning of interventions to improve maternal and perinatal health should
consider local factors (Litorp et al 2016:187).
2.4 MAJOR INTERVENTIONS TO ADDRESS MATERNAL AND NEWBORN
HEALTH-RELATED PROBLEMS
Maternal and newborn health (MNH) care includes activities whose primary purpose is
to restore, improve and maintain the health of women and their newborns (Ebener,
Guerra-Arias, Campbell, Tatem, Moran, Johnson, Fogstad, Stenberg, Neal, Bailey,
Porter & Matthews 2015:19). Attaining these goals requires intensive interventions
among various cycles of human life. The time around delivery and the postnatal period
are the most critical period for both mother and newborn (Pasha et al 2015:8).
Availability of services is important and services need to be accessible to women,
acceptable to them and their families, and of good quality (Ebener et al 2015:20). Poor
quality care is one of the factors that discourage women from utilising care (Campbell
et al 2016:126). Campbell et al (2016:126) stress embracing the Global Strategy on
Human Resources for Health and urgent action across high- and low-income countries
together with a responsible accountability framework with measurable indicators.

23
2.4.1 Institution-based childbirth
Institution-based childbirth is a key strategy to reduce maternal and perinatal morbidity
and mortality. However, poor quality of care at health facilities is a barrier to pregnant
women and their families accessing skilled care. Rosen, Lynam, Carr, Reis, Ricca,
Bazant, Bartlett et al (2015:306) point out that without improved quality of care
provision, efforts to increase use of facility-based maternity care in low income countries
will not succeed. Bartlett, Weissman, Gubin, Patton-Molitors and Friberg (2014:e98550)
conducted a simulation of possible maternal, foetal, and newborn lives and costs saved
by scaling up midwifery and obstetrics services, including family planning, in 58 LMICs.
The study found that scaling up midwifery and obstetric interventions together could
achieve a 79% decrease in maternal deaths, particularly when family planning services
were included (Bartlett et al 2014).
Clinical care, from the start of labour to the early post-natal period, can be provided as
routine or emergency care. Routine care includes identification, monitoring and
management of non-complicated pregnancies and deliverers. Emergency care includes
stabilising and life-saving clinical interventions, and the timely arrangement for effective
referral of mother or newborn to higher levels of care (Brenner et al 2015:3). Both care
processes have two preconditions: seeking skilled care from facilities and delivering
high quality care to prevent and address complications that may arise (Rosen et al
2015:307).
In 2015, the WHO proposed the use of the Robson 10-group classification as a global
standard for assessing, monitoring and comparing caesarean section rates within and
between health care facilities. Robson's system classifies all women into one of 10
groups on the basis of five parameters: obstetric history (parity and previous caesarean
section), onset of labour (spontaneous, induced, or caesarean section before onset of
labour), foetal presentation or lie (cephalic, breech, or transverse), number of neonates,
and gestational age (preterm or term) (Vogel et al 2015: e261). Depending on the
nature of the pregnancy, BEmONC and CEmONC services might be needed. Globally,
about 15% of expected births result in life-threatening complications (Otolorin, Gomez,
Currie, Thapa & Dao 2015:S46).
24
2.4.2 Emergency obstetric and newborn care
There is general consensus on the need to include universally available and
accessible good quality emergency obstetric care (EmOC) in health systems, and the
presence of a professional skilled birth attendant at all births (Groppi, Somigliana,
Pisani, Ika, Mabor, Akec, Nhial & Mading 2015:58). Signal functions of emergency
obstetric and neonatal care (EmONC) provide information about life-saving
interventions during labour management (Owens, Semrau, Mbewe, Musokotwane,
Grogan, Maine & Hamer 2015:53). The concept of emergency obstetric and neonatal
care provides a framework for the delivery of evidence-based clinical services (Otolorin
et al 2015:S47).
There is a need to expand the original seven signal functions to encompass activities
related to routine care for mothers and newborns. Routine care helps providers to
predict, prevent and intervene early to mitigate life-threatening complications. The
functions include infection prevention and management for both mother and infant;
monitoring and management of labour using the partograph; active management of the
third stage of labour, and infant thermal protection, feeding, and HIV prevention
(Otolorin et al 2015:1S46-S53). Universal access to EmONC is considered essential to
reduce maternal mortality, but the health system should also ensure that all pregnant
women and newborns with complications have rapid access to well-functioning facilities
that include a broad range of services and settings (Otolorin et al 2015:S48).
2.4.3 Labour monitoring
There is general agreement that the identification and appropriate management of
women at high risk of labour complications require cautious monitoring of progress
throughout labour and childbirth, and timely application of effective maternal and
newborn interventions. The partograph, a tool for this purpose, is poorly utilised in most
low and middle-income countries (Bohren, Oladapo, Tunçalp, Wendland, Vogel,
Tikkanen, Fawole, Mugerwa, Souza, Bahl, Gulmezoglu & WHO BOLD Research Group
2015:2). In LMICs the effective use of a partograph requires a supportive culture,
adequate staffing and supplies (Ollerhead & Osrin 2014:285).

25
2.5 QUALITY OF MATERNAL AND NEWBORN CARE
This section discusses quality of maternal and newborn care under Donabedian’s
(1988) model; institution-based delivery and quality of care; human resources and
quality of care; respectful maternal care, and quality of care and service utilisation.
2.5.1 Donabedian’s (1988) model
Donabedian’s model defines quality of care (QoC) in three categories: structure,
process, and outcomes. Structure describes the context in which care is delivered,
including hospital buildings, staff, financing, and equipment. Process encompasses the
transactions between patients and providers throughout the delivery of health care.
Outcomes embody the effects of healthcare on the health status of patients and
populations (Donabedian 1988:1745).
In their study on the quality of facility-based labour and delivery care processes in Sub-
Saharan Africa, Tripathi, Stanton, Strobino and Bartlett (2015:3) included medicines,
equipment and provider training as part of structure; delivery of clinical procedures and
treatment and client-provider interpersonal relationships as process, and changes in
health status and patient satisfaction as outcomes. Triparthi, Stanton, Strobino and
Bartlett (2015:4) found that process factors (provider and intervention) were associated
with an 80-fold increase in risk of avoidable perinatal death, but structure factors (facility
and context) increased the risk by 11-fold. Substandard practices by health workers in
low resource settings required urgent attention to decrease maternal and perinatal
deaths (Merali, Lipsitz, Hevelone, Gawande, Lashoher, Agrawal & Spector 2014:280).
Oladapo et al (2015:2) emphasise that improving the quality of care during labour and
childbirth is the most cost-effective strategy to save lives.
2.5.2 Institution-based delivery and quality of care
In Sri Lanka, a developing country, poor quality care during institutional births was one
of the main contributing factors to the high rate of preventable maternal and neonatal
morbidity and mortality (Patabendige & Senanayake 2015:12). Addressing the barrier of
poor-quality care at health facilities is crucial to reduce the rates of maternal and
perinatal mortality (Oladapo et al 2015:2; Campbell et al 2016:127). Improving quality of

26
care further requires appropriate use of effective clinical and non-clinical interventions
that are sensitive to women's values and preferences, strengthened health
infrastructure, and respectful attitudes of health providers (Vogel, Bohren, Tuncalp
Oladapo & Gülmezoglu 2016a:672).
2.5.3 Human resources and quality of care
The human resource aspect of the health system is critical because quality, respectful
care or clinical practice is channelled through health workers. Quality health care is
dependent on skilled health care workers (Campbell et al 2016:127). To increase
service utilisation requires improved quality service delivery. In a rural district of Kenya,
healthcare workers in 21 public health facilities formed improvement teams to examine
performance gaps in service delivery, identify the causes of the gaps and develop and
implement changes to address the gaps (Mwaniki, Vaid, Chome, Amolo, Tawfik &
Kwale Improvement Coaches 2014:18). The study found that quality care required the
availability of health care workers with the necessary knowledge and skills to diagnose
and treat the presenting illness; appropriate resources to attend to the situation, and
efficient facilities to ensure clients received consistent care. Most importantly, health
care workers at the facilities had to have the right behavioural attributes to offer
empathetic and culturally sensitive care with respect (Mwaniki et al 2014:18).
Critical shortages of skilled staff are a major bottleneck in the provision of timely and
quality obstetric and neonatal care. In a study of the impact of staff shortages on
obstetric health care workers and quality of care in Malawi, Bradley et al (2015:65-71)
found that staff shortages contributed to the persistently high maternal mortality rates.
Obstetric staff found the shortage of staff and of time to perform their work stressful and
demotivating, resulting in sub-standard care and poor attitudes towards patients. The
use of less trained staff to cover shortages and reduced staff on night shift further
exacerbated the problem. Staffing establishments were not linked to demand per health
facility (number of cases coming to a facility), but allocated staff according to health
facility type (Bradley et al 2015:66-71). In Mali, Huchon et al (2014:50) found that
contextual factors such as the skills of surrounding co-workers, workload, access to
clinical guidelines, feedback, and leadership also influenced workers’ level of knowledge
and skills.
27
2.5.4 Respectful maternity care
In a cross-sectional study, Rosen et al (2015:306) assessed quality of care, especially
respectful maternity care of health facilities in Ethiopia, Kenya, Madagascar, Rwanda
and Tanzania. Quality of care encompassed structure, processes of care, and
outcomes. Structure included necessary medicines, equipment, and provider training
while outcomes were changes in health status and patient satisfaction. Processes of
care included delivery of clinical procedures and treatments, and client-provider
interpersonal relationship.
Poor client-provider interpersonal communication during maternity care at health
facilities in low resource settings was a barrier to accessing skilled care. Women and
their families indicated rude and uncaring provider attitudes, lack of privacy, delays in
care, abandonment and neglect as forms of disrespect (Rosen et al 2015:307). The
study concluded that failure to adopt a patient-centred approach and a lack of health
system resources were barriers for effective interventions to promote respectful care
and health facility utilisation (Rosen et al 2015:307).
The White Ribbon Alliance (WRA) (2011) published the Respectful Maternity Care
Charter, which listed the rights of childbearing women, including the right to information;
privacy and confidentiality; to be treated with dignity and respect, and equitable care.
Many women experience disrespectful, abusive or neglectful treatment during childbirth
in facilities. This can deter women from seeking and using maternal health care services
and can have implication for their health and well-bring. The WHO is committed to
promoting the rights of women and to promoting access to safe, timely and respectful
care during childbirth (WHO 2014:1). Vogel et al (2016b:1) examined barriers,
facilitators and priorities for implementation of the WHO maternal and perinatal health
guidelines in four lower-income countries and emphasise the need for a patient-centred
approach and adequate resources.
Disrespect and abuse may occur throughout maternity care, but women are more
vulnerable during childbirth. Newborns are also vulnerable to neglect and disrespect
and the needs of families who experience stillbirth require attention (Sacks & Kinney
2015:2). There are several types and categories of disrespect and abuse in childbirth,
including physical abuse, non-consented care, non-confidential care, non-dignified care,
28
discrimination, abandonment of care, and detention in facilities (Sheferaw, Mengesha &
Wase 2016:68).
2.5.5 Quality of care and service utilisation
Service utilisation and prevention of maternal and neonatal morbidity and mortality are
dependent on the quality of care provided during childbirth. In secondary level public
health facilities in Uttar Pradesh, India, the focus of health care leaders was to increase
service availability. However, maintaining the quality of care is critical to enhance
effective service utilisation and improved health service outcomes (Bhattacharyya,
Issac, Rajbangshi, Srivastava & Avan 2015:422).
In Malawi, poor quality clinical care and disrespect discouraged women from facility-
based delivery, encouraged them to bypass facilities with a bad reputation, or to delay
seeking care and then arrive in critical condition. In addition, it eroded community trust
and confidence in the health system, and delayed the decision to seek care when
complications arose (Bradley et al 2015:66-67).
2.6 COORDINATION BETWEEN FACILITIES – REFERRAL SYSTEM
The reduction of maternal mortality depends on the availability of quality delivery care
and a functioning referral system (Dewana et al 2017:31). Health services need to be
provided at different levels, depending on the type of intervention patients require, and
an effective referral system should be in place to ensure a close relationship between all
levels of the health system (WHO 2008a). Little or no coordination between different
types of health facilities with consequent poorly developed referral linkages results in
negative consequences for mothers and newborns (Hodgins 2013:149).
This section discusses Jahn and De Brouwere’s (2001) referral chain model; referral
system; common indicators for referrals; inappropriate referral; health workers’
competence in sender facilities; communication in the referral system; factors for delay
in travel and causes of adverse outcomes at receiver facilities.

29
2.6.1 Referral chain model
Jahn and de Brouwere’s (2001) referral chain model has three main components:
sender, transport and receiver. At the sender facility, risk assessment, availability of
referral guideline, quality of care, clinical judgement, and availability of transportation
are important factors. At the receiver facility, quality of care, financial accessibility, and
preferential treatment are important factors (Chaturvedi et al 2014:2).
2.6.2 Referral system
Health systems strengthening (HSS) is an important interventional approach for
strengthening the referral system (Adeoye et al 2015:86). The term “referral” indicates
health workers’ recommendation that patients or clients seek care at higher-level
facilities. Given the nature of the emergency care system, reductions in maternal
mortality and morbidity are not possible without an effective referral system (Chaturvedi
et al 2014:1-2).
In Uttar Pradesh, India, Bhattacharyya et al (2015:421) found coordination between
lower and higher-level facilities for appropriate care was weak. According to standard
care procedure, clients need to be examined and provided immediate management at
the primary level facility (sender) before being sent to another facility (receiver).
However, these procedures were not followed. Clients were either just examined or tried
normal delivery and were sent to referral facilities without any management. In addition,
clients usually approached the facility directly due to proximity, familiarity with the facility
or on others’ advice (Bhattacharyya et al 2015:424).
2.6.3 Common indications for referrals
In their study in Madhya Pradesh Province, India, Chaturvedi et al (2014:4) found that at
primary health care level only 9.4% of mothers came from other facilities and the rest
were self-referred. Of the referred in mothers, 60% belonged to families living below the
poverty line; 4% were grand multiparas, and 35% had had a caesarean section delivery.
The reasons for referral included prolonged labour due to obstruction or malposition
(39%); rupture of membrane (13%); haemorrhage (8%), and pre/eclampsia (7%). A
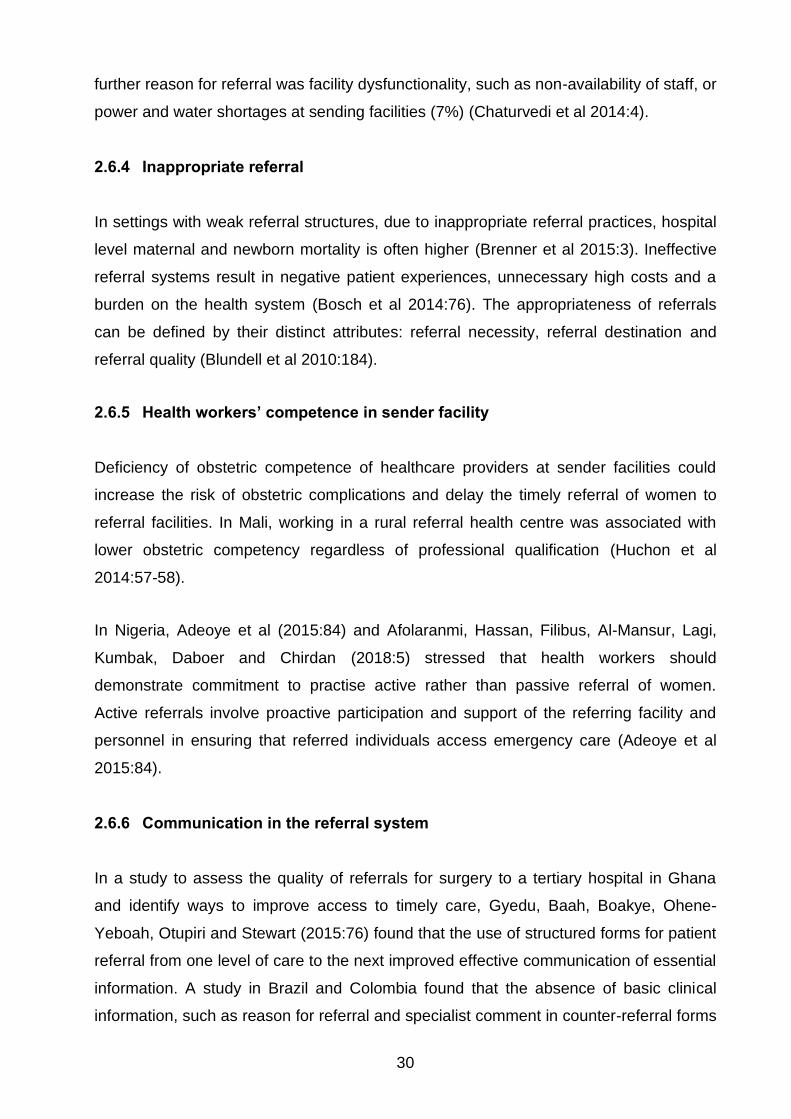
30
further reason for referral was facility dysfunctionality, such as non-availability of staff, or
power and water shortages at sending facilities (7%) (Chaturvedi et al 2014:4).
2.6.4 Inappropriate referral
In settings with weak referral structures, due to inappropriate referral practices, hospital
level maternal and newborn mortality is often higher (Brenner et al 2015:3). Ineffective
referral systems result in negative patient experiences, unnecessary high costs and a
burden on the health system (Bosch et al 2014:76). The appropriateness of referrals
can be defined by their distinct attributes: referral necessity, referral destination and
referral quality (Blundell et al 2010:184).
2.6.5 Health workers’ competence in sender facility
Deficiency of obstetric competence of healthcare providers at sender facilities could
increase the risk of obstetric complications and delay the timely referral of women to
referral facilities. In Mali, working in a rural referral health centre was associated with
lower obstetric competency regardless of professional qualification (Huchon et al
2014:57-58).
In Nigeria, Adeoye et al (2015:84) and Afolaranmi, Hassan, Filibus, Al-Mansur, Lagi,
Kumbak, Daboer and Chirdan (2018:5) stressed that health workers should
demonstrate commitment to practise active rather than passive referral of women.
Active referrals involve proactive participation and support of the referring facility and
personnel in ensuring that referred individuals access emergency care (Adeoye et al
2015:84).
2.6.6 Communication in the referral system
In a study to assess the quality of referrals for surgery to a tertiary hospital in Ghana
and identify ways to improve access to timely care, Gyedu, Baah, Boakye, Ohene-
Yeboah, Otupiri and Stewart (2015:76) found that the use of structured forms for patient
referral from one level of care to the next improved effective communication of essential
information. A study in Brazil and Colombia found that the absence of basic clinical
information, such as reason for referral and specialist comment in counter-referral forms
31
was a serious problem (Vargas, Mogollón-Pérez, De Paepe, Da Silva, Unger &
Vázquez 2015:5). In Gyedu, et als’ (2015:76) study, only 39% to 58% patients had
complete documentation especially patient's medical history or treatment received for
the condition being referred.
2.6.7 Factors in delay in travel
In Herat, Afghanistan Hirose, Borchert, Cox, Alkozai and Filippi (2015:7) compared
reported travel time against expected travel time to reach the nearby facility. The study
found that women residing in urban areas, difficulty in obtaining transportation or a
community’s lack of a vehicle, husband’s participation in community activities, having
people to rely on in case of long-term emergency, lower wealth quartile and ANC
attendance were associated with delay in health care. In addition, women with rupture
of the uterus and severe infection were delayed by between 4 and 12 hours compared
to women with PPH, respectively (Hirose et al 2015:7).
2.6.8 Causes of adverse outcomes at receiving facility
In Madhya Pradesh Province, India, Chaturvedi et al (2014) found obstructed labour
was the most common indication for referral, but the most common causes of death
among the referred cases were haemorrhage and eclampsia. This indicated a likelihood
of inefficiencies in emergency management in these cases (Chaturvedi et al 2014:6).
2.7 MATERNAL AND NEWBORN HEALTH IN ETHIOPIA
This section discusses Ethiopia’s health care system.
2.7.1 Health care delivery system
The health care delivery system in Ethiopia is a three-tier system. The primary level
health care delivery system in rural settings includes five health posts linked to one
health centre and then a primary hospital. The health centres are considered primary
contacts of care. Secondary level health care includes general hospitals, and tertiary
level health care includes tertiary hospitals. Figure 2.1 illustrates Ethiopia’s health care
system.
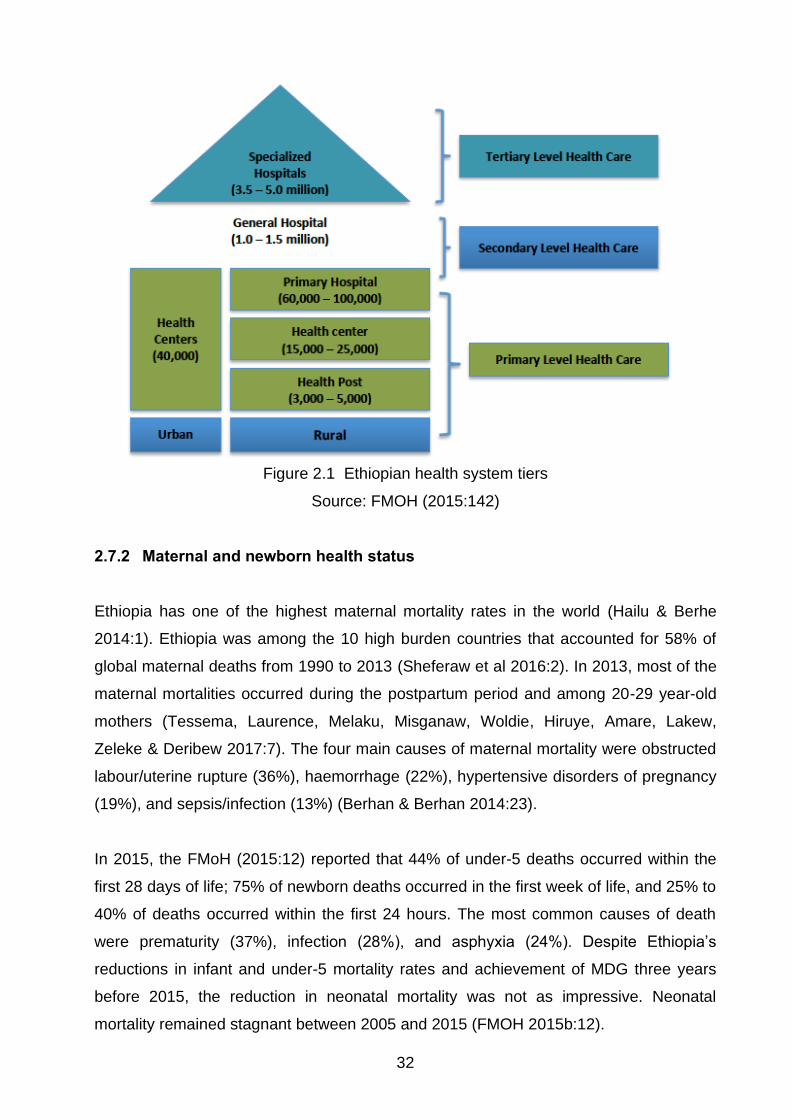
32
Figure 2.1 Ethiopian health system tiers
Source: FMOH (2015:142)
2.7.2 Maternal and newborn health status
Ethiopia has one of the highest maternal mortality rates in the world (Hailu & Berhe
2014:1). Ethiopia was among the 10 high burden countries that accounted for 58% of
global maternal deaths from 1990 to 2013 (Sheferaw et al 2016:2). In 2013, most of the
maternal mortalities occurred during the postpartum period and among 20-29 year-old
mothers (Tessema, Laurence, Melaku, Misganaw, Woldie, Hiruye, Amare, Lakew,
Zeleke & Deribew 2017:7). The four main causes of maternal mortality were obstructed
labour/uterine rupture (36%), haemorrhage (22%), hypertensive disorders of pregnancy
(19%), and sepsis/infection (13%) (Berhan & Berhan 2014:23).
In 2015, the FMoH (2015:12) reported that 44% of under-5 deaths occurred within the
first 28 days of life; 75% of newborn deaths occurred in the first week of life, and 25% to
40% of deaths occurred within the first 24 hours. The most common causes of death
were prematurity (37%), infection (28%), and asphyxia (24%). Despite Ethiopia’s
reductions in infant and under-5 mortality rates and achievement of MDG three years
before 2015, the reduction in neonatal mortality was not as impressive. Neonatal
mortality remained stagnant between 2005 and 2015 (FMOH 2015b:12).
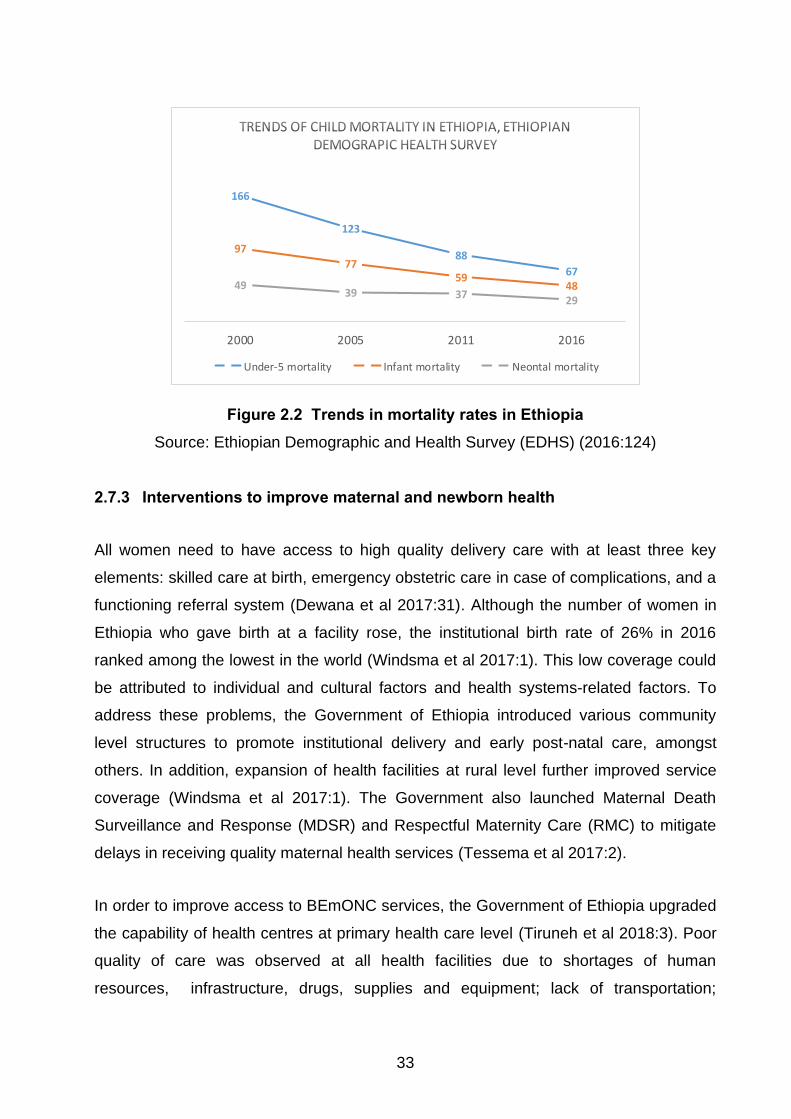
33
Figure 2.2 Trends in mortality rates in Ethiopia
Source: Ethiopian Demographic and Health Survey (EDHS) (2016:124)
2.7.3 Interventions to improve maternal and newborn health
All women need to have access to high quality delivery care with at least three key
elements: skilled care at birth, emergency obstetric care in case of complications, and a
functioning referral system (Dewana et al 2017:31). Although the number of women in
Ethiopia who gave birth at a facility rose, the institutional birth rate of 26% in 2016
ranked among the lowest in the world (Windsma et al 2017:1). This low coverage could
be attributed to individual and cultural factors and health systems-related factors. To
address these problems, the Government of Ethiopia introduced various community
level structures to promote institutional delivery and early post-natal care, amongst
others. In addition, expansion of health facilities at rural level further improved service
coverage (Windsma et al 2017:1). The Government also launched Maternal Death
Surveillance and Response (MDSR) and Respectful Maternity Care (RMC) to mitigate
delays in receiving quality maternal health services (Tessema et al 2017:2).
In order to improve access to BEmONC services, the Government of Ethiopia upgraded
the capability of health centres at primary health care level (Tiruneh et al 2018:3). Poor
quality of care was observed at all health facilities due to shortages of human
resources, infrastructure, drugs, supplies and equipment; lack of transportation;
166
123
88
67
97
7759
484939 37
29
2000 2005 2011 2016
Under-5 mortality Infant mortality Neontal mortality

34
unrecorded and low correct partograph recording, and lower infection prevention
practices (Dewana et al 2017:35).
In Mozambique, Chavane et al (2018:6) found that investment was needed to
strengthen referral linkages and secure hospital and health centre readiness to rapidly
diagnose and manage pregnancy-related complications. This is also true for Ethiopia.
2.8 CONCLUSION
This chapter discussed the literature review conducted for the study. The literature
review outlined the global trends with regards to the maternal and new-born health
situation, major causes of ill health and proven strategies to improve the situation. Then,
it described the meaning of quality of care, a model to better understand the
components of quality of care, and the health system and patient perspectives with
regards to quality of care. It also included situations with regards to coordination of care
and a model to outline major components of the referral system. Later, the chapter
described the maternal and new-born care situation, the health care tier system and the
major MNH care related efforts in Ethiopia.
Chapter 3 discusses the research design and methodology of the study.

35
CHAPTER 3
RESEARCH DESIGN AND METHODOLOGY
3.1 INTRODUCTION
Chapter 2 discussed the literature review conducted for the study. This chapter
discusses the research design and methodology of the study. The research design and
method chapter outline the type of the research approach and methods, the phases of
the study in which the population, sampling and data collection methods are clearly
described, and data cleaning and analysis techniques are included.
3.2 RESEARCH DESIGN
A research design is a set of logical steps taken by the researcher to answer the
research questions (Brink et al 2012:217). Burns et al (2013:195) refer to a research
design as a blueprint for conducting a study with maximum control over factors that may
interfere with the validity of the findings. Polit and Beck (2017:273) describe a research
design as “the overall plan for addressing a research question, including the
specifications for enhancing the integrity of the study”.
The three main research designs are qualitative, quantitative, and mixed method. The
three are not discrete and thus should not be considered mutually exclusive with rigid
boundaries (Creswell & Creswell 2018:3). The researcher used a sequential
explanatory mixed methods design for the study (Creswell & Creswell 2018:14; Parahoo
2014:81).
3.2.1 Mixed methods
Mixed method studies use a combination of qualitative and quantitative methods
(Creswell & Creswell 2018:14; Parahoo 2014:81). Mixed methods research combines
qualitative and quantitative approaches to complement each other to provide
comprehensive data (Bowling 2014:419). The researcher conducted the study in two
phases and collected quantitative data in phase 1 and qualitative data in phase 2
36
(Creswell & Creswell 2018:14; Parahoo 2014:81). The researcher then developed the
strategies to improve mother and neonatal referrals in the health system based on the
quantitative and qualitative findings. Using the two methods provided different
perspectives and allowed the researcher to explore the complex issues in the health
system more deeply.
3.2.2 Quantitative
Polit and Beck (2017:76) describe quantitative research as a “set of orderly and
disciplined procedures used to gain knowledge”. Quantitative studies use deductive
reasoning to test assumptions in the real world. The findings are thus grounded in
reality rather than the researcher’s personal views (Polit & Beck 2017:76). Quantitative
research uses methods employing measurement to record and investigate aspects of
social reality. Quantitative research, also referred to as “empirical research”, uses
numerical data whereby the information is statistically analysed (Polit & Beck 2012:76).
It aims at establishing the relationship between observations in the data collected using
mathematical and statistical operations. The approach is appropriate in situations in
which there is pre-existing knowledge and aims at documenting prevalence or testing
hypotheses (Bowling 2014:235). Quantitative research can employ experimental or
survey designs. This study used a survey design.
A survey design describes a population’s trends, attitudes and opinions or tests the
relationship between variables or predictive relationship between variables over time by
studying a sample of the target population (Creswell & Creswell 2018:147). A survey
design can be longitudinal/analytical or cross-sectional/descriptive (Creswell & Creswell
2018:149). A descriptive survey wishes to describe populations, to study associations
between variables, and to establish trends. Accordingly, it is designed to measure
certain events and behaviours in the population of interest and descriptive measures
are calculated from the collected data (Creswell & Creswell 2018:149; Bowling
2014:237). In this study, the researcher employed retrospective descriptive measures.
Retrospective studies examine past behaviour, attitudes and events. Most cross-
sectional studies are retrospective and also use secondary data from existing sources
of data, such as routinely collected statistics in hospital and disease registers, such as
medical records (Bowling 2014:236-239).

37
In phase 1 of the study, the researcher collected data from two sources of secondary
data from the selected primary hospitals and health centres, namely medical records
and costing records.
3.2.3 Qualitative
Qualitative research is the investigation of phenomena, typically in an in-depth and
holistic fashion, through the collection of rich narrative materials using a flexible
research design (Polit & Beck 2017:739). Qualitative research is “a systematic,
subjective methodological approach used to describe life experiences and give them
meaning” (Burns et al 2013:57).
Qualitative research is a means of exploring and understanding the meaning individuals
and groups ascribe to social problems (Creswell & Creswell 2018:147; Merriam &
Tisdell 2016:24). According to Burns et al (2013:57), qualitative research is a systematic
subjective approach used to describe life experiences and situations to give them
meaning. Qualitative studies examine participants’ knowledge and practices and
consider their perceptions and practices in the field.
In phase 2 of the study, the researcher collected qualitative data from the participants
by means of key informant interviews (Leavy 2017:135).
3.3 RESEARCH METHODOLOGY
Polit and Beck (2017:271) describe research methodology as the “steps, procedures
and strategies taken to investigate the problem being studied and to analyse the
collected data”. Research methods are “the techniques researchers use to structure a
study and to gather and analyse information relevant to the research question” (Polit &
Beck 2017:271). The methodology included the study setting, population, sample, and
data collection and analysis.
3.3.1 Study setting
A setting refers to the “physical site or location used to conduct a study and in which
data collection takes place” (Polit & Beck 2017:743). The study was conducted in
38
selected zones of Southern Nations and Nationalities Peoples regional state of Ethiopia.
The health sector in Ethiopia is a three-tier health care delivery system. The first tier or
level is a woreda or district health system comprising a primary hospital (with a
population coverage of 60,000-100,000 people), health centres (PHC facilities serving a
population of 15,000-25,000) and their satellite health posts (serving 3,000-5,000) that
are connected to each other by a referral system (FMoH 2010:4). Convenience, cost,
ethical considerations, research questions and other factors affect the selection of study
settings (Creswell & Creswell 2018:121; Bordens & Abbott 2018:169). This study
focused on first level health care delivery, especially maternal and newborn services.
3.3.2 Population
A population is “the entire aggregate of cases in which a researcher is interested” (Polit
& Beck 2017:273). The researcher used two populations, namely records and
participants.
In the quantitative phase, the population consisted of the maternal and newborn records
of the selected primary hospitals and health centres. Regarding health service costing,
the costs of maternal and newborn-related services provided in the selected sites were
examined. The study population was drawn from the selected primary hospitals’ and
health centres’ records. To answer the research questions, recently delivered mothers
and sick neonates’ medical records were the target population of interest (Saks & Allsop
2013:173). A list of mothers and sick neonates who visited the selected primary
hospitals and health centres between 8 July 2017 and 7 July 2018 were entered in the
case extraction sheet. Two service delivery points, namely delivery and newborn
intensive care units (NICUs), were considered in preparing a list of cases. In the
qualitative phase, the population consisted of health care workers providing direct MNH
care at delivery and newborn intensive care units (NICUs) in the selected sites.
3.3.3 Sample and sampling
A sample refers to a subset of a population (individuals, elements or objects) or a group
selected to act as representatives of the population (Polit & Beck 2017:275). Sampling
is the process of selecting participants, events, behaviours, or other elements that
39
represent the population being studied (Burns et al 2013:357). In this study, the
researcher selected a sample of sites, records and participants (informants).
3.3.3.1 Site sampling
The researcher used multistage sampling, a form of cluster sampling, to select the sites
(Bordens & Abbott 2018:293). The researcher randomly selected the Southern Nations
and Nationalities People’s Region from the four clusters of regional states in Ethiopia.
After selecting the region, the researcher listed the primary hospitals in the region.
Taking the median of performance, the primary hospitals formed two strata – high
performing (above the median) and low performing (below the median). Then the
hospitals in each stratum were listed and one primary hospital from each stratum was
randomly selected. Two primary hospitals were randomly selected for the study. Based
on the projected catchment population size, the two hospitals were expected to serve a
population of 446,102 residing in two selected woredas in 2017.
Each of the primary hospitals had six (6) health centres in their catchment area. To
select health centres, kebeles (villages) were divided into urban/city and rural, and two
sites and one from urban and two from rural were randomly selected. Two hospitals and
six health centres were included for facility level study.
3.3.3.2 Data source sampling
A list of mothers and sick neonates who visited delivery and newborn intensive care
units (NICUs) units of the selected primary hospitals within the period from 8 July 2017
to 7 July 2018 were registered in the case extraction sheet. Then, in consultation with
the facility management, hospital catchment kebeles (villages) were identified. Cases
who visited the facility from those kebeles (villages) were considered for detailed case
reviews.
The sample size was determined by means of a single population proportion formula,
using the following assumptions: hospital level delivery as 26.2% (p=0.262) (CSA
[Ethiopia] & ICF 2017:149), level of significance as 5% (a=0.05), Z a/2=1.96 and margin
of error as 4% (d=0.04). Adding the design effect of 1.5 made the total sample size and
10% of non-response rate, the total size was 766 (Bruce et al 2018:160). For the
40
delivery case review, this number was proportionally distributed between the two
selected facilities. For the sick neonates, all the sick neonates admitted in the NICU,
who met the inclusion criteria, were considered for the study.
3.3.3.3 Health services costing
Financial records and professionals working in the finance department of the selected
primary hospitals and health centres were consulted to collect information on service
costs during the last Ethiopian fiscal year.
3.3.3.4 Key informant interviews
The researcher used purposive sampling to select health workers working in the MCH
department and NICU who provided MNH-related care at the selected hospitals and
health centres and involved in referral process.
3.3.4 Quantitative data collection
Data collection is the process of collecting information (data) related to research
questions in a systematic way to address a research problem (Polit & Beck 2017:725).
The researcher collected quantitative data from the medical records and health service
costing records, and qualitative data from the health workers.
3.3.4.1 Medical records
A medical record contains patient information, including age, condition, care, medication
and other data. The researcher reviewed the registers available at the primary hospitals
and health centres to document the patients’ backgrounds, care elements and
outcomes of the services provided at delivery, and newborn intensive care units
(NICUs).
3.3.4.2 Health service costing
Cost is an integral aspect of any economic evaluation. Consequently, it is necessary to
consider what costs or expenses should be examined. All the information tools should
41
be customised to collect information on relevant costs (Franklin, Lomas, Walker &
Young 2019:631-634). Costing is rarely straightforward and thus requires accurate and
comprehensive data elements and explicit cost categorisations (Bowling 2014:143).
Costing in a developing country, like Ethiopia, is not an easy task and the researcher
followed a step-by-step approach to estimate the cost of MNH-related service delivery
expenses (Hendriks, Kundu, Boers, Bolarinwa, Te Pas, Akande, Agbede, Gomez,
Redekop, Schultsz & Tan 2014:2).
Cost refers to expenditure required to manage facilities and provide direct patient care
and involves variable and fixed expenses (Hendriks et al 2014:4; Adler, Yi, Li,
McBroom, Hauck, Sammer, Jones, Shaw & Claassen 2018:68). Fixed costs are all
expenses that do not change with business volumes (e.g., management salaries and
benefits as well as depreciation of equipment and buildings). Variable costs refer to all
expenditure that depends on the volume of patient flow for health facility cases (e.g.,
nursing and other direct patient care salaries, benefits, supplies, and drugs) (Adler et al
2018:68). In this study, the researcher considered variable costs from the providers’
perspective at the primary hospitals and health centre levels. In addition, the researcher
considered a bottom-up approach where the number of cases for each type of care led
to the estimation (Hendriks et al 2014:4).
3.3.4.3 Quantitative data-collection instruments and administration
The researcher developed two data-collection instruments in English to collect data
from the medical records and the health service costing records. The researcher
adapted a customised instrument based on the FMoH’s examination cards and registry
book for medical record review and National Health Accounts tool and Management
Science for Health (MSH) core plus tool for the health service costing. The instruments
contained pre-identified variables. The medical records instrument captured a summary
of referral information, description of the cases presented, diagnosis of cases, and
outcomes of care from the facility registers. The costing instrument captured all the
costs related to service provision as well as common costs, such as staff salaries and
benefits and other indirect costs. The number of cases that visited the facilities and
demographic characteristics of the catchment population were also included. The
information assisted the researcher to divide common costs between MNH-related and
other services.
42
To be included in the study, the following inclusion criteria applied:
• Mothers and newborns residing in the woreda
• Units: Delivery and NICU
• Mothers and newborns admitted for any maternal and newborn care services
delivered in the selected hospitals and health centres
The following exclusion criteria applied:
• Mothers and newborns residing in kebeles without catchment health centres
• Mothers and newborns with no record of kebele/village
• No patient chart attached to the record
The researcher selected and trained data collectors who had completed a bachelor’s
degree in health studies to assist with data collection and explained the components of
the data-collection sheets to them. The trained data collectors, then, reviewed patient
records and patient cards which fulfilled the inclusion criteria and filled the information in
the extraction sheets. For the health service costing, the trained data collectors
collected the cost data from the selected facilities. In addition, the researcher collected
data on the costs of some internationally procured programme drugs. The researcher
supervised the data-collection process and provided required support. In addition, for
responding to the question of referral appropriateness, two health workers, who are
BEmONC trainers, reviewed the collected data and decided whether the specific case
could be managed at health centres or not.
Using an access-based data entry sheet, the researcher stored the collected data. The
researcher checked the data entry regularly and provided on-site support to improve the
quality of data entry. The researcher took samples from the entered data and checked
for consistency. The researcher performed data cleaning before data analysis. Data
entry was controlled with sufficient conditions (Stewart 2016:55). A codebook was used
for controlled data entry from the medical records. The codebook included the question
number, the question, the full range of valid codes including missing and 'do not apply'
values (Bowling 2014:372).
43
A simple frequency running, and comparison of findings was used as the second data
quality check. The data check revealed the accuracy of data entry (any typing errors),
missing data (non-response), and outlier figures (Stewart 2016:56-57). Based on the
findings of the frequency tables, errors in data collection and entry were eliminated. In
addition, missing values were checked for accuracy and treated appropriately (Bowling
2014:372-379). Two options were considered in this stage: analysing the remaining
data (when the missing data was minimal), and excluding the incomplete variable (when
the variable was not important for answering the research question) (Stewart 2016:56).
3.3.5 Quantitative data analysis
After cleaning, a step-by-step approach to test the hypothesis was employed using the
Stata version 11 program (Bruce et al 2018:508). The researcher with the help of
statistician summarised the data and presented the results in a contingency table,
stated the null hypothesis and alternate hypothesis for the sample estimate, tested the
hypothesis for comparison using either Chi-square or Fisher exact test, assessed the
probability (P-value) and decided whether to accept or reject the null hypothesis.

44
Table 3.1 Assumptions for services provided at the selected hospitals and health centres
Cost
assumptions
Service types Common administration
costs Direct – Technical Common – Technical
Delivery Newborn
corner NICU
Laboratory
and Imaging Pharmacy OR
Facility types Health centres
and hospitals Health centres Hospitals
Health
centres and
hospitals
Health
centres and
hospitals
Hospitals Health centres and hospitals
Personnel
costs
Share of staff
at MCH
departments
Share of staff
at MCH
departments
NICU
team
Share of time
of
professionals
Share of time
of
professionals
Share of time
of
professionals
Share of time of
professionals
Other cost
items
considered
Lab reagents,
drugs and
supplies used
Lab reagents,
drugs and
supplies used
Lab
reagents,
drugs
and
supplies
used
NA NA NA
Share of general costs
(Facility running costs,
training, travel, services,
maintenance costs,
temporary staff, clothes and
sheets, miscellaneous
payments)
Basis for cost
share
Number
contact
minutes for
delivery care
out of the total
MCH contact
minutes
Number
contact
minutes for
delivery care
out of the total
MCH contact
minutes
NA
Proportion of
MNH-related
cases out of
the total
cases
Proportion of
MNH-related
cases out of
the total
cases
Proportion of
MNH-related
cases out of
the total
cases
Number contact minutes for
MNH care out of the total
contact minutes
Analysis
result
Total costs for
the service
Total costs for
the service
Total
costs for
the
service
Share of
MNH care
from the total
cost
Share of
MNH care
from the total
cost
Share of
MNH care
from the total
cost
Share of MNH care from the
total cost
NA = Not applicable. Contact minutes = Number of cases multiplied by average stay at the facility for the service
MNH-related cases = Delivery and newborn care
45
3.3.6 Qualitative data collection
In the qualitative phase, the population consisted of health care workers providing direct
MNH care at delivery and NICUs in the selected sites. The researcher obtained staff
lists at the selected sites and purposively selected the participants from the lists.
Purposive sampling was used to select participants who could provide information-rich
data (Merriam & Tisdell 2016:96; Saks & Allsop 2013:173). The researcher selected 34
health workers providing MNH care at delivery and in NICUs as participants (Polit &
Beck 2017:705). Due to information saturation, a total of 26 individuals were interviewed
in this study.
3.3.6.1 Data-collection instrument and administration
The researcher developed a semi-structured interview guide (questionnaire) based on
the Donabedian and referral chain models and the literature review (Creswell &
Creswell 2018:191; Merriam & Tisdell 2016:106). The interview guide collected
information from the participants and covered the respondents’ demographic
information; competency of the workforce; prevalence of severe and complicated cases;
adequacy of supplies and equipment; referrals; communication; emergency medical
transportation, and service. The interview guide was translated into Amharic, a local
language spoken and understood by most people in Ethiopia, for the interview. The
Amharic version was translated back to English to check whether the concepts were
kept in translation.
The actual data collection followed similar steps to entry for the first phase. Approvals of
entry were sought form the facility managers and woreda health office heads. The
researcher conducted interviews and audio recorded the interviews with the
participants’ permission. In addition, the interviewer took notes during the interviews
(Polit & Beck 2017:716). On average, each interview took 32 minutes.
3.3.6.2 Data analysis
Qualitative research is interpretative and involves researchers in a close relationship
with the participants (Creswell & Creswell 2018:183). Qualitative data analysis
commences with data collection and involves specific to general steps (Merriam &
46
Tisdell 2016:197; Creswell & Creswell 2018:193). The researcher organised and
prepared the data. First, the researcher transcribed the interviews verbatim and
compared the transcriptions with the recordings. The researcher read all the
transcriptions carefully to get an overall picture and jotted down ideas as they came to
mind in order to develop codes (Creswell & Creswell 2018:196). Coding is a process of
organising data by bracketing chunks and writing a word representing a category in the
margin. It requires breaking sentences into segments and labelling them using
participants’ actual language (Tracy 2013:189).
The researcher identified topics and themes that emerged from the data in the
transcriptions. Topics that related to each other were grouped together and themes
identified. The researcher wrote topics next to appropriate segments of text, checking to
see whether new themes emerged. The topics were turned into categories by finding
descriptive wording, final abbreviations for categories, and arranging them
alphabetically. Codes were formulated for each theme developed. The researcher used
the computer software program ATLAS ti to code the data (Tracy 2013:188).
The researcher used inductive and deductive data analysis techniques for the
qualitative data analysis. A bottom-up approach was used to build patterns, categories
and themes to organise abstract units of information (Creswell & Creswell 2018:181).
The researcher used deductive analysis to decide on the need to collect additional data
and to review categories and themes for comparison and relationships (Polit & Beck
2017:757). Figure 3.1 depicts the qualitative data analysis process.

47
Figure 3.1 Qualitative data analysis
Source: Creswell & Creswell (2018:194)
Chapters 4 and 5 discuss the quantitative and qualitative data analysis and
interpretation, and results.
3.4 VALIDITY AND RELIABILITY
The quality of a research instrument is determined by its validity and reliability. Validity
refers to the degree to which an instrument accurately measures what it is intended to
measure (Goodman & Thompson 2017:142; Polit & Beck 2017:582). Reliability refers to
“the likelihood that the instrument will obtain the same results time after time” (Goodman
& Thompson 2017:142). Reliability refers to the degree of consistency or dependability
with which the instrument measures the attributes it is designed to measure (Burns et al
2013:389). In this study, the researcher developed the quantitative and qualitative data-
collection instruments based on models and the literature review.
Raw data (Transcripts)
Organize and prepare data for analysis
Read through all data
Code data using ATLAS ti
Themes
Interrelating themes
Interpret the meaning of themes
Descriptions
48
3.4.1 Quantitative phase
In the quantitative phase, the researcher ensured internal and external validity. Internal
validity refers to how well a study is conducted, and confounding factors are controlled.
External validity refers to the generalisability of the findings of the study to a larger
population (Goodman & Thompson 2017:201). The researcher developed the data-
collection instruments to generate valid information on the topic under study (Bordens &
Abbott 2018:276-277). For this purpose, the researcher adapted a customised
instrument based on the FMoH’s records and tools and Management Science for Health
(MSH) core plus tool and National Health Accounts tool. The instruments contained pre-
identified variables. The medical records instrument captured a summary of referral
information, description of the cases presented, diagnosis of cases, and outcomes of
care. The researcher trained two data collectors in administering the instruments.
Construct validity refers to the degree to which a study measures all the characteristics
of a concept. Construct validity depends on the proficiency of the researcher to
conceptually define and then operationally define the study variables (Burns et al
2013:674).
The reliability of a data-collection instrument is concerned with stability and consistency
(Polit & Beck 2017:331-332). The stability of a questionnaire is the degree to which it
produces similar results on being administered twice. If the same variable is measured
under the same conditions, a reliable instrument will produce identical measurements
and the measuring instrument will yield consistent numerical results each time it is
applied (Burns & Grove 2007:396).
3.4.2 Qualitative phase
In qualitative studies, the purpose of validity is to gain a deeper understanding of the
phenomenon under study (Polit & Beck 2017:219). Internal and external validity in this
case ensured the trustworthiness of the study. Trustworthiness refers to the confidence
that qualitative researchers have in their data, using the strategies of credibility,
dependability, confirmability, and transferability (Polit & Beck 2014:220; Creswell &
Creswell 2018:199). In addition, triangulation increased the fidelity of the data
interpretation by using multiple data-collection methods and sources (Kolb 2012:85).

49
Internal validity refers to how well a study is conducted, and confounding factors are
controlled (Goodman & Thompson 2017:201). Moreover, the instruments were
developed to generate valid information (Bordens & Abbott 2018:276). External validity
signifies the generalisability of the findings of the study to a larger population (Goodman
& Thompson 2017:201). Meticulous steps were taken to identify the participants to
reflect the reality on the ground. The internal validity of a study is critical to the level of
confidence in its conclusion and applicability to similar samples or populations (Bordens
& Abbott 2018:276). For content and construct validity, the researcher developed the
data-collection instruments based on existing instruments, two models and the literature
review. For establishing the criterion-related validity of the data-collection instruments,
the results were compared to other studies and results were triangulated using various
methods. Content validity refers to whether the items or questions measure what the
instrument is supposed to measure (Polit & Beck 2017:450). Content validity refers to
the extent to which the instrument represents the factors of the study.
Reliability refers to “the degree of consistency or dependability with which the
instrument measures the attribute it is designed to measure. If the instrument is reliable,
the results will be the same each time the test is repeated” (Polit & Beck 2017:194).
Reliability refers to the reproducibility and consistency of the research instruments
(Bowling 2014:170).
Trustworthiness refers to the confidence that qualitative researchers have in their data,
using the strategies of credibility, dependability, confirmability, and transferability (Polit
& Beck 2014:220; Kumar 2011:184).
Credibility refers to the believability of the results from the participants’ perspective.
Accordingly, the researcher ensured that the results reflected the participants’
experiences and views (Polit & Beck 2017:787). Dependability refers to the
achievement of similar results if the study were conducted again (Kumar 2011:184).
Triangulation ensured the dependability and transferability of the study findings
(Merriam & Tisdell 2016:252). Transferability refers to the degree to which the results of
qualitative research can be generalised or transferred to other contexts or settings
(Kumar 2011:184). The scope and detailed descriptions of the steps of the study
ensured the generalisability of the results to other settings (Merriam & Tisdell
50
2016:254). Confirmability refers to the degree to which the results could be confirmed
by other independent reviewers (Polit & Beck 2017:788; Kumar 2011:184). The
interview transcriptions and audio recordings served as evidence of the participants’
views.
Triangulation, the researcher-participant interaction and clear presentation of the
findings ensured the trustworthiness of the study (Kolb 2012:85; Creswell & Creswell
2018:200-201).
3.5 ETHICAL CONSIDERATIONS
Ethics deals with matters of right and wrong. When humans are used as study
participants, care must be taken in ensuring that their rights are protected (Polit & Beck
2017:748). Accordingly, the researcher obtained permission to conduct the study,
obtained informed consent from the participants, and observed the ethical principles of
beneficence, respect for human dignity, and justice (Polit & Beck 2017:748; Bowling
2014:183).
• Permission
The researcher obtained ethical approval and permission to conduct the study from the
Department of Health Studies Higher Degrees Committee of the University of South
Africa. Permission to conduct the study was also obtained from the Southern Nations
and Nationalities Peoples Region’s Health Bureau, the zone health departments, and
the management of the selected hospitals and facilities (see Annexures 1 and 2).
• Beneficence
The principle of beneficence states that one should do good and, above all, do no harm
(Burns & Grove 2007:165). The researcher assured the participants of the benefit of the
findings and strategies to health care service.

51
• Respect for human dignity
Respect for human dignity refers to the right to self-determination and full disclosure
(Polit & Beck 2017:173). The researcher explained the purpose, nature and significance
of the study to the participants in the languages familiar to them. The participants were
informed that participation was voluntary and that they could withdraw from the study at
any time if they wished to do so. The participants were given the opportunity to ask any
questions, and an information leaflet and informed consent form to sign. Once
participants verbally agreed to participate, they were asked to sign the informed consent
form.
• Justice
The principle of justice refers to the right to privacy and the right to fair treatment (Polit &
Beck 2017:174). The researcher assured the participants of privacy, confidentiality and
anonymity, and treated all the participants with respect and fairly. The researcher
assured the participants that all the data would be treated with strict confidentiality and
kept under lock and key, accessible only to the researcher.
3.6 STRATEGY DEVELOPMENT
In today’s constantly changing environment, any organisation should continuously
review strategic choices and decisions (Weissenberger-Eibl, Almeida & Seuss
2019:16). The expansion of primary health care facilities and increasing numbers of
cases presenting for care have made quality of services a major issue in Ethiopia. The
quality of care at lower levels and communication between health facilities and
professionals and interaction with clients emphasise the need for optimal referral
procedures at all levels. Accordingly, the purpose of the study was to formulate
strategies to improve maternal and newborn health care referrals in the health system in
Ethiopia.
Developing strategies to improve referrals in the health system in Ethiopia required
several steps. After identifying problems, barriers and issues that required attention in
the current referral system, the researcher conducted a literature review to examine the
situation and experiences of other countries and their solutions. The researcher
52
interviewed selected health workers in the hospitals and health centres included in the
study to obtain their experiences and perceptions of the situation and suggestions on
possible solutions and strategies. The drafted referral improvement strategy was
checked whether it assist programme managers and service providers to respond to
patients’ needs, improve quality of care and promote efficient use of human and
financial resources at lower levels of the PHC provision. In addition, the improvement
ideas were reorganized to fit into the Donabedian’s model of quality and Jahn and De
Brouwere’s (2001) referral chain model. Donabedian’s model has three components:
structure, process, and outcomes, and the referral chain model’s three components are
sender, transport and receiver.
The first draft of the strategies showed the importance of the interplay among the
components of the referral chain model (sender, communication and receiver) and
quality framework (input, process and outcomes) and the required support structures
and processes to govern the referral system. The researcher consulted selected health
workers on the draft strategies. Based on the feedback received, the researcher then
finalised the strategies.
3.7 CONCLUSION
This chapter described the research design and methodology of the study. The chapter
started by defining the research design used – Mixed method. The chapter clearly
outlined the two phases of the study. In the first phase of the study, 869 medical record
reviews, and health service costing in relation to maternal and new-born care were
done. In the second phase of the study, 26 health workers were interviewed as key
informants. Following a step wise approach of data analysis, both the first and the
second phases of the study, utilized computer-based data analysis software. The
chapter also described ethical considerations made and steps followed to develop the
strategies.
Chapter 4 discusses the quantitative data analysis and interpretation, and results.
53
CHAPTER 4
QUANTITATIVE DATA ANALYSIS AND INTERPRETATION, AND
FINDINGS
4.1 INTRODUCTION
This chapter describes the results from the quantitative data analysis and interpretation
in line with the overall purpose and objectives of the study. The purpose of the study
was to formulate strategies to improve maternal and newborn health care referrals in
the health system in Ethiopia. In order to achieve the purpose, the objectives of the
study were to:
• Map out a path, procedures and reasons for maternal and newborn care referrals
among various levels of facilities.
• Estimate the proportion of inappropriate referrals within the primary level care
facilities.
• Cost maternal and newborn care related services at various levels of the health
system.
• Analyse the effects of current referral practices in the health system.
• Identify and reach consensus on key strategies to improve referrals in the health
system.
4.2 FLOW OF CASE REVIEWS
The total number of cases was divided between the two hospitals based on the previous
year’s reported number of institution-based deliveries. The number of reviewed cases
covered 95% of the calculated sample size of the study. Figure 4.1 presents the number
of reviewed cases from the two selected hospitals.
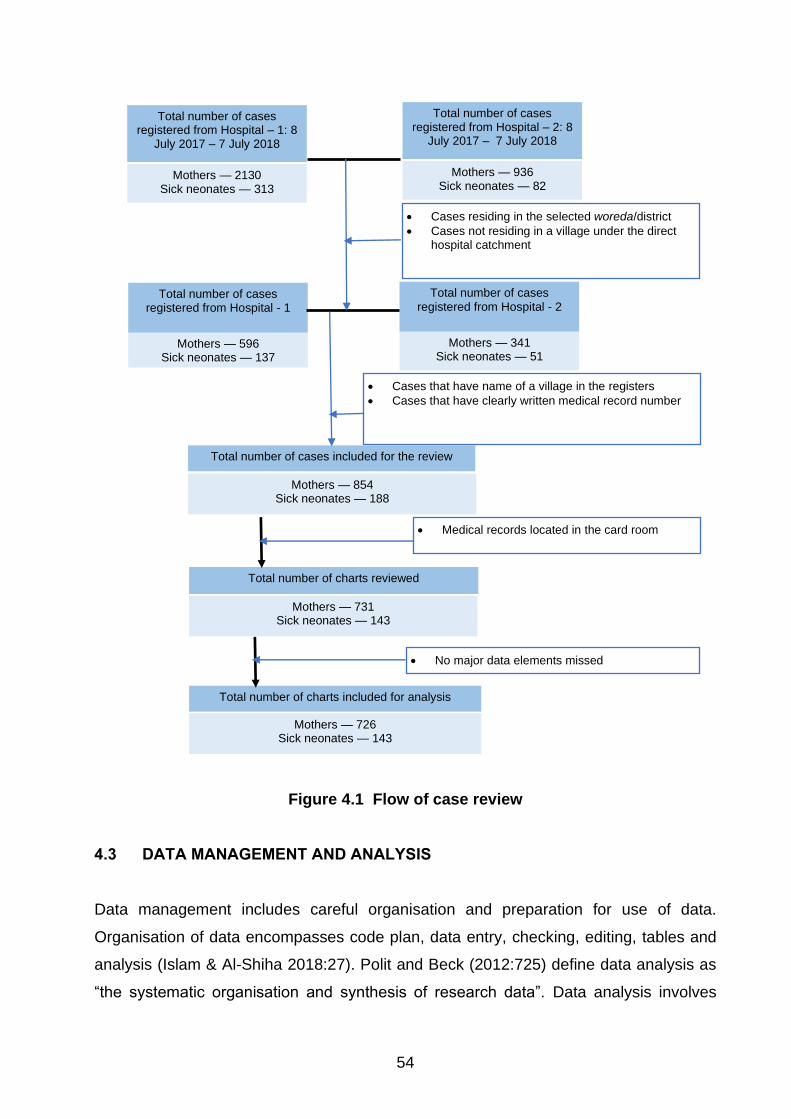
54
Figure 4.1 Flow of case review
4.3 DATA MANAGEMENT AND ANALYSIS
Data management includes careful organisation and preparation for use of data.
Organisation of data encompasses code plan, data entry, checking, editing, tables and
analysis (Islam & Al-Shiha 2018:27). Polit and Beck (2012:725) define data analysis as
“the systematic organisation and synthesis of research data”. Data analysis involves
• Medical records located in the card room
Mothers — 596 Sick neonates — 137
Total number of cases registered from Hospital - 1
Mothers — 854 Sick neonates — 188
Total number of cases included for the review
Mothers — 731 Sick neonates — 143
Total number of charts reviewed
Mothers — 341 Sick neonates — 51
Total number of cases
registered from Hospital - 2
Mothers — 936 Sick neonates — 82
Total number of cases registered from Hospital – 2: 8
July 2017 – 7 July 2018
• Cases residing in the selected woreda/district
• Cases not residing in a village under the direct hospital catchment
Mothers — 726 Sick neonates — 143
Total number of charts included for analysis
• No major data elements missed
Mothers — 2130 Sick neonates — 313
Total number of cases registered from Hospital – 1: 8
July 2017 – 7 July 2018
• Cases that have name of a village in the registers
• Cases that have clearly written medical record number
55
classifying, organising, summarising and describing the data in meaningful terms to
provide information.
4.3.1 Data management
The first step in data management was the development of a codebook. The book
provided a list of all the variables, including the exact wording of each question for easy
reference (Curtis & Drennan 2013:380). The extracted data sheets were checked for
accuracy and stored in a safe place for easy retrieval and use. The data management
consisted of four steps: coding, entry, cleaning and identifying missing data.
4.3.1.1 Data coding
A three-digit number code was assigned to each extracted data sheet and the code
together with the name of facility and woreda served as a unique identifier of the case.
The unique identifier facilitated tracking the data and identifying the facility where the
data was collected. In addition, a Stata syntax file was created to track any recoding of
variables and addition of codes (Curtis & Drennan 2013:380).
4.3.1.2 Data entry
The data collected were entered into a spreadsheet. The data from the spreadsheet
was transferred to the Stata statistical software program – version 14. An experienced
data entry clerk entered data every day. A backup file was retained periodically when
the data entry was done (Bordens & Abbott 2018:397).
4.3.1.3 Data cleaning
Data cleaning started while entering the data into the data entry form. Simple
descriptive frequencies were run after data entry to check quality and completeness.
Cross-tabulation of variables was done to check for logical errors (Curtis & Drennan
2013:380).
56
4.3.1.4 Missing data
The review of cases and case entry frequently reveals missing information. There are
three kinds of missing variables: no records in the registers; not properly entered, and
not ascertained. The groups could be further divided into “not ascertained information”
and “not applicable information” (Floyd & Fowler 2014:128). The missing data in all the
variables were analysed to determine whether they adversely impacted the results or
not (Curtis & Drennan 2013:380). In most cases, the missing information did not
adversely affect the result and was significant in only few cases. Missing data that had
no impact were excluded from the analysis, and minimally significant data were dropped
from the analysis.
4.3.2 Data analysis
Data coding was followed by data analysis to generate estimates and arrive at
conclusions (Whaley 2014:129). Statistical analysis of both primary and secondary data
generated results using descriptive and inferential statistics (Curtis & Drennan
2013:382; Whaley 2014:156).
4.3.2.1 Computer-based data analysis
A statistician analysed the data using the Stata software program version 14 and
descriptive and inferential statistics and presented the results in frequency tables, cross-
tabulation and x2 test results between the dependent and independent variables. The P-
value was used to determine the probability that observed differences between the two
groups might be due to chance. The most frequently used significance level (P-value)
was equal to 0.05 or 5%. A P-value of less than or equal to 0.05 at 95% confidence
interval for this study had statistically significant difference (Bordens & Abbott
2018:439).
4.3.2.2 Descriptive statistics
Descriptive statistics use numbers to summarise the properties of the entire distribution
and discover patterns in the data (Bordens & Abbott 2018:397). The results from the
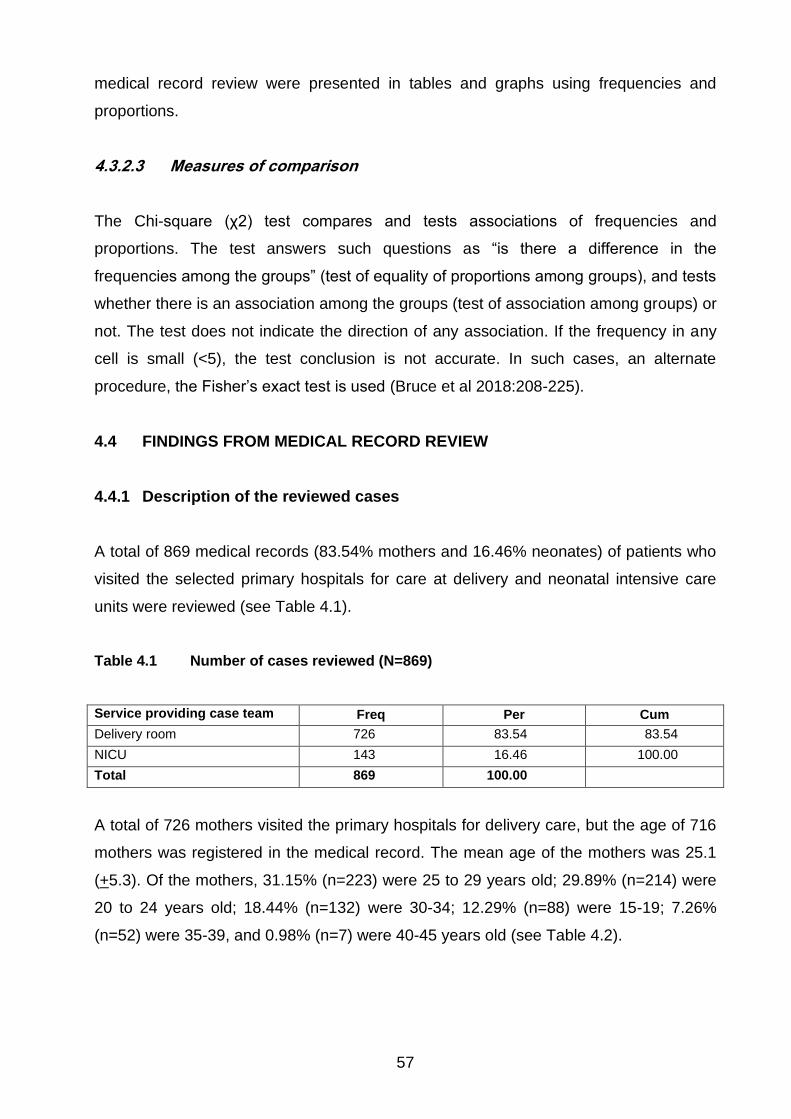
57
medical record review were presented in tables and graphs using frequencies and
proportions.
4.3.2.3 Measures of comparison
The Chi-square (χ2) test compares and tests associations of frequencies and
proportions. The test answers such questions as “is there a difference in the
frequencies among the groups” (test of equality of proportions among groups), and tests
whether there is an association among the groups (test of association among groups) or
not. The test does not indicate the direction of any association. If the frequency in any
cell is small (<5), the test conclusion is not accurate. In such cases, an alternate
procedure, the Fisher’s exact test is used (Bruce et al 2018:208-225).
4.4 FINDINGS FROM MEDICAL RECORD REVIEW
4.4.1 Description of the reviewed cases
A total of 869 medical records (83.54% mothers and 16.46% neonates) of patients who
visited the selected primary hospitals for care at delivery and neonatal intensive care
units were reviewed (see Table 4.1).
Table 4.1 Number of cases reviewed (N=869)
Service providing case team Freq Per Cum
Delivery room 726 83.54 83.54
NICU 143 16.46 100.00
Total 869 100.00
A total of 726 mothers visited the primary hospitals for delivery care, but the age of 716
mothers was registered in the medical record. The mean age of the mothers was 25.1
(+5.3). Of the mothers, 31.15% (n=223) were 25 to 29 years old; 29.89% (n=214) were
20 to 24 years old; 18.44% (n=132) were 30-34; 12.29% (n=88) were 15-19; 7.26%
(n=52) were 35-39, and 0.98% (n=7) were 40-45 years old (see Table 4.2).
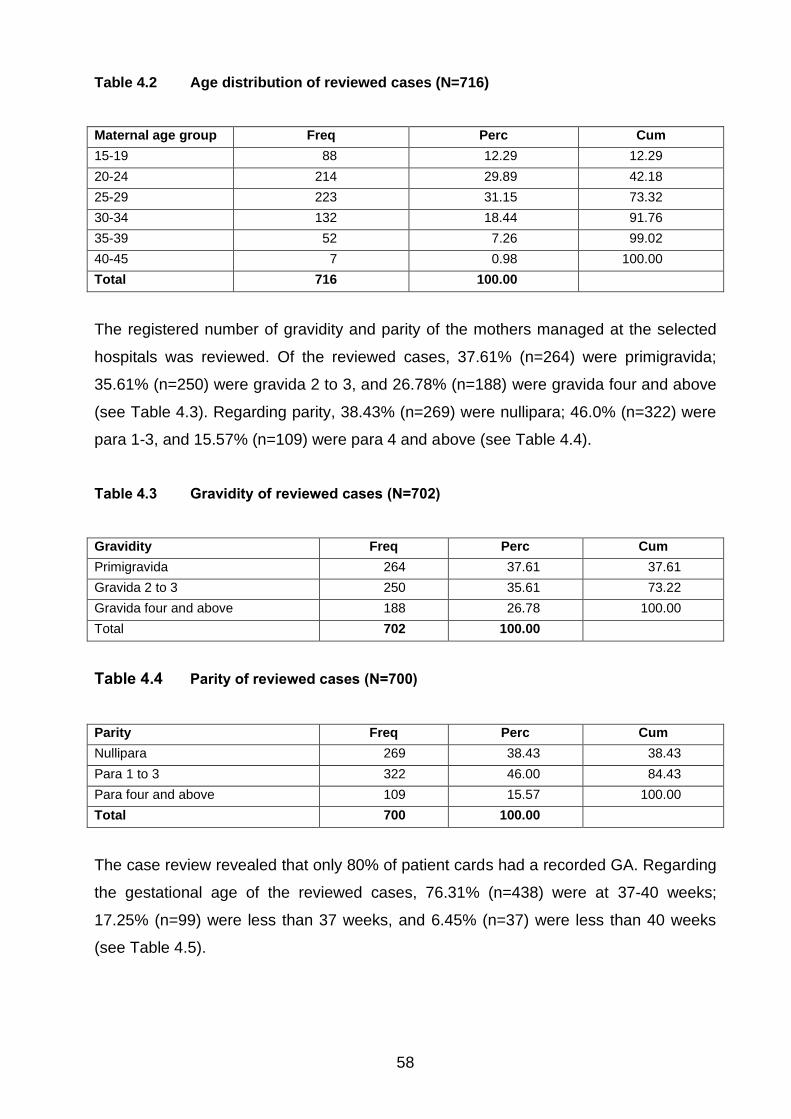
58
Table 4.2 Age distribution of reviewed cases (N=716)
Maternal age group Freq Perc Cum
15-19 88 12.29 12.29
20-24 214 29.89 42.18
25-29 223 31.15 73.32
30-34 132 18.44 91.76
35-39 52 7.26 99.02
40-45 7 0.98 100.00
Total 716 100.00
The registered number of gravidity and parity of the mothers managed at the selected
hospitals was reviewed. Of the reviewed cases, 37.61% (n=264) were primigravida;
35.61% (n=250) were gravida 2 to 3, and 26.78% (n=188) were gravida four and above
(see Table 4.3). Regarding parity, 38.43% (n=269) were nullipara; 46.0% (n=322) were
para 1-3, and 15.57% (n=109) were para 4 and above (see Table 4.4).
Table 4.3 Gravidity of reviewed cases (N=702)
Gravidity Freq Perc Cum
Primigravida 264 37.61 37.61
Gravida 2 to 3 250 35.61 73.22
Gravida four and above 188 26.78 100.00
Total 702 100.00
Table 4.4 Parity of reviewed cases (N=700)
Parity Freq Perc Cum
Nullipara 269 38.43 38.43
Para 1 to 3 322 46.00 84.43
Para four and above 109 15.57 100.00
Total 700 100.00
The case review revealed that only 80% of patient cards had a recorded GA. Regarding
the gestational age of the reviewed cases, 76.31% (n=438) were at 37-40 weeks;
17.25% (n=99) were less than 37 weeks, and 6.45% (n=37) were less than 40 weeks
(see Table 4.5).
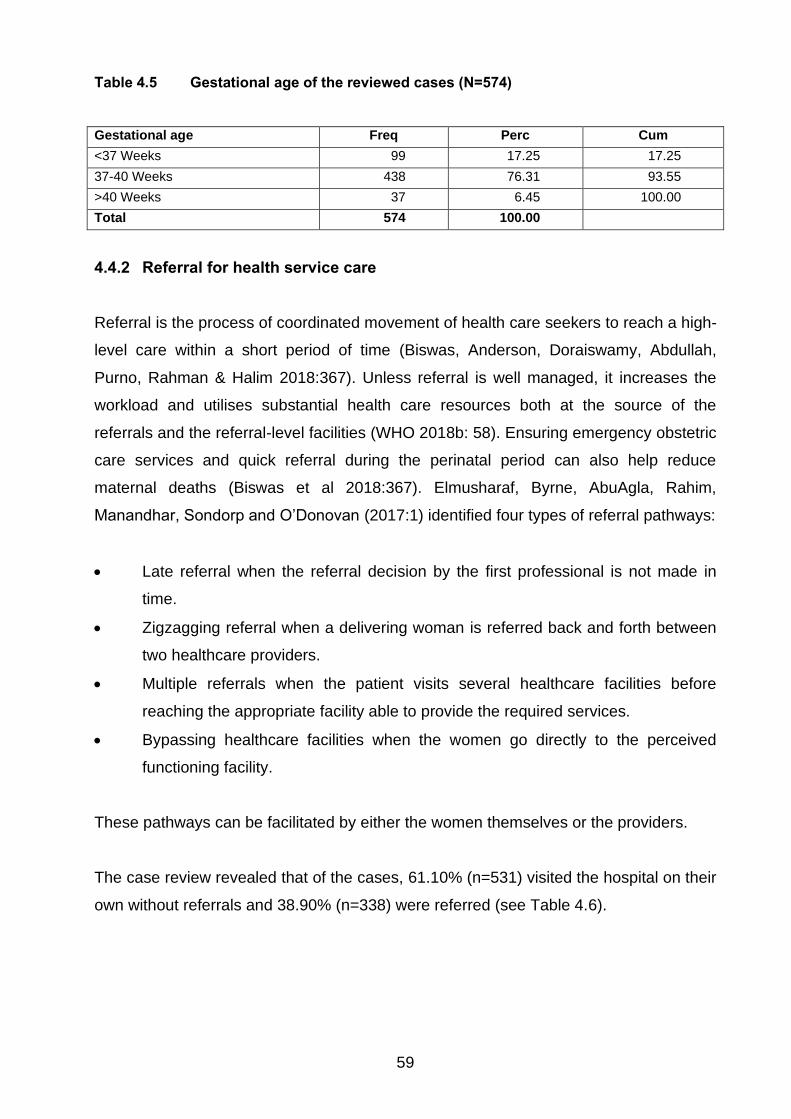
59
Table 4.5 Gestational age of the reviewed cases (N=574)
Gestational age Freq Perc Cum
<37 Weeks 99 17.25 17.25
37-40 Weeks 438 76.31 93.55
>40 Weeks 37 6.45 100.00
Total 574 100.00
4.4.2 Referral for health service care
Referral is the process of coordinated movement of health care seekers to reach a high-
level care within a short period of time (Biswas, Anderson, Doraiswamy, Abdullah,
Purno, Rahman & Halim 2018:367). Unless referral is well managed, it increases the
workload and utilises substantial health care resources both at the source of the
referrals and the referral-level facilities (WHO 2018b: 58). Ensuring emergency obstetric
care services and quick referral during the perinatal period can also help reduce
maternal deaths (Biswas et al 2018:367). Elmusharaf, Byrne, AbuAgla, Rahim,
Manandhar, Sondorp and O’Donovan (2017:1) identified four types of referral pathways:
• Late referral when the referral decision by the first professional is not made in
time.
• Zigzagging referral when a delivering woman is referred back and forth between
two healthcare providers.
• Multiple referrals when the patient visits several healthcare facilities before
reaching the appropriate facility able to provide the required services.
• Bypassing healthcare facilities when the women go directly to the perceived
functioning facility.
These pathways can be facilitated by either the women themselves or the providers.
The case review revealed that of the cases, 61.10% (n=531) visited the hospital on their
own without referrals and 38.90% (n=338) were referred (see Table 4.6).
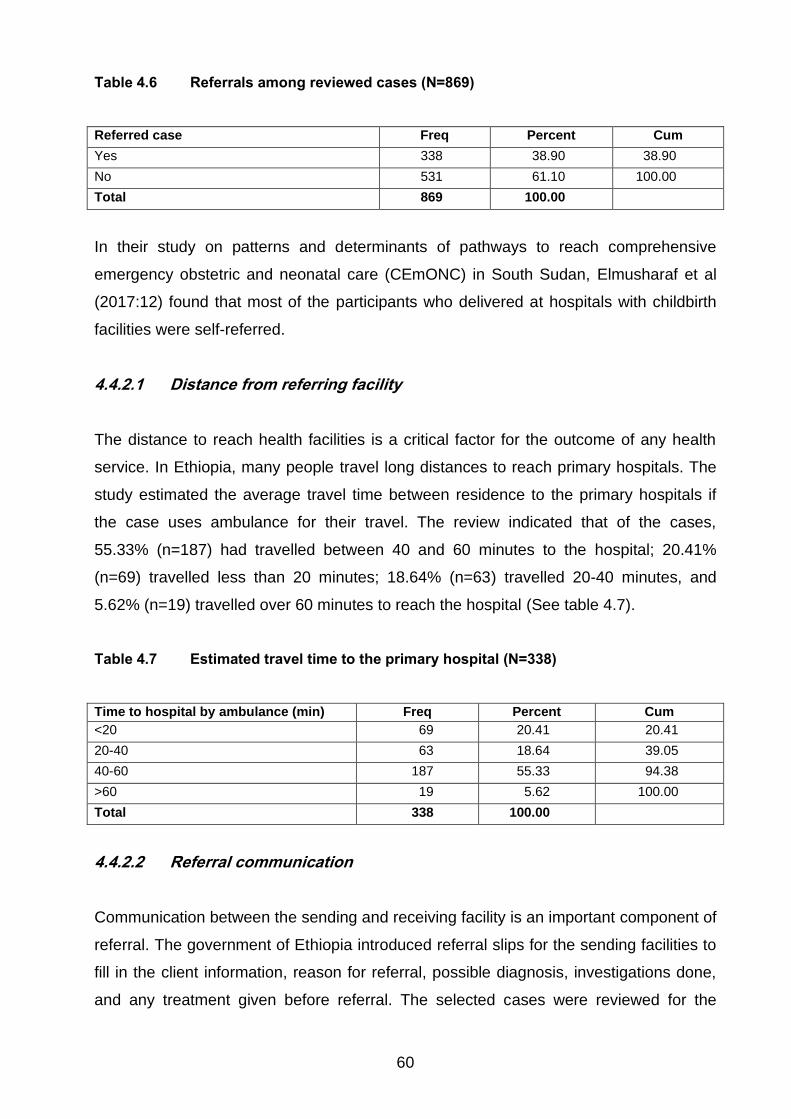
60
Table 4.6 Referrals among reviewed cases (N=869)
Referred case Freq Percent Cum
Yes 338 38.90 38.90
No 531 61.10 100.00
Total 869 100.00
In their study on patterns and determinants of pathways to reach comprehensive
emergency obstetric and neonatal care (CEmONC) in South Sudan, Elmusharaf et al
(2017:12) found that most of the participants who delivered at hospitals with childbirth
facilities were self-referred.
4.4.2.1 Distance from referring facility
The distance to reach health facilities is a critical factor for the outcome of any health
service. In Ethiopia, many people travel long distances to reach primary hospitals. The
study estimated the average travel time between residence to the primary hospitals if
the case uses ambulance for their travel. The review indicated that of the cases,
55.33% (n=187) had travelled between 40 and 60 minutes to the hospital; 20.41%
(n=69) travelled less than 20 minutes; 18.64% (n=63) travelled 20-40 minutes, and
5.62% (n=19) travelled over 60 minutes to reach the hospital (See table 4.7).
Table 4.7 Estimated travel time to the primary hospital (N=338)
Time to hospital by ambulance (min) Freq Percent Cum
<20 69 20.41 20.41
20-40 63 18.64 39.05
40-60 187 55.33 94.38
>60 19 5.62 100.00
Total 338 100.00
4.4.2.2 Referral communication
Communication between the sending and receiving facility is an important component of
referral. The government of Ethiopia introduced referral slips for the sending facilities to
fill in the client information, reason for referral, possible diagnosis, investigations done,
and any treatment given before referral. The selected cases were reviewed for the
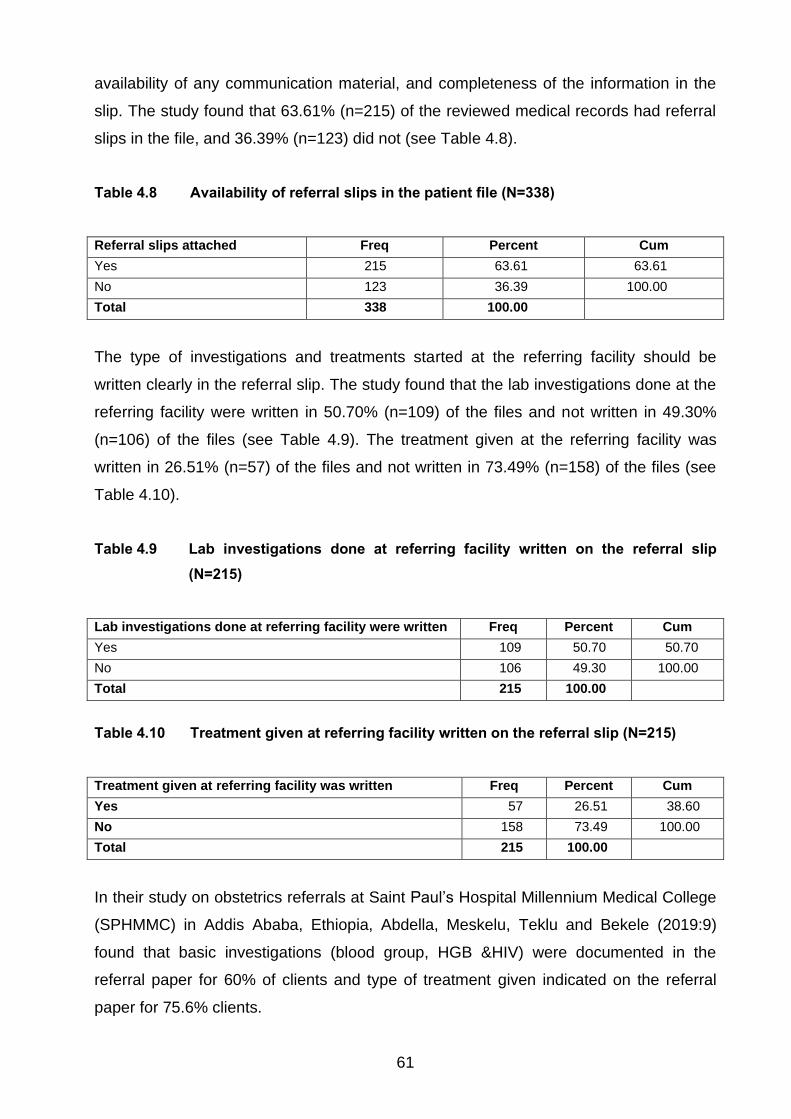
61
availability of any communication material, and completeness of the information in the
slip. The study found that 63.61% (n=215) of the reviewed medical records had referral
slips in the file, and 36.39% (n=123) did not (see Table 4.8).
Table 4.8 Availability of referral slips in the patient file (N=338)
Referral slips attached Freq Percent Cum
Yes 215 63.61 63.61
No 123 36.39 100.00
Total 338 100.00
The type of investigations and treatments started at the referring facility should be
written clearly in the referral slip. The study found that the lab investigations done at the
referring facility were written in 50.70% (n=109) of the files and not written in 49.30%
(n=106) of the files (see Table 4.9). The treatment given at the referring facility was
written in 26.51% (n=57) of the files and not written in 73.49% (n=158) of the files (see
Table 4.10).
Table 4.9 Lab investigations done at referring facility written on the referral slip
(N=215)
Lab investigations done at referring facility were written Freq Percent Cum
Yes 109 50.70 50.70
No 106 49.30 100.00
Total 215 100.00
Table 4.10 Treatment given at referring facility written on the referral slip (N=215)
Treatment given at referring facility was written Freq Percent Cum
Yes 57 26.51 38.60
No 158 73.49 100.00
Total 215 100.00
In their study on obstetrics referrals at Saint Paul’s Hospital Millennium Medical College
(SPHMMC) in Addis Ababa, Ethiopia, Abdella, Meskelu, Teklu and Bekele (2019:9)
found that basic investigations (blood group, HGB &HIV) were documented in the
referral paper for 60% of clients and type of treatment given indicated on the referral
paper for 75.6% clients.
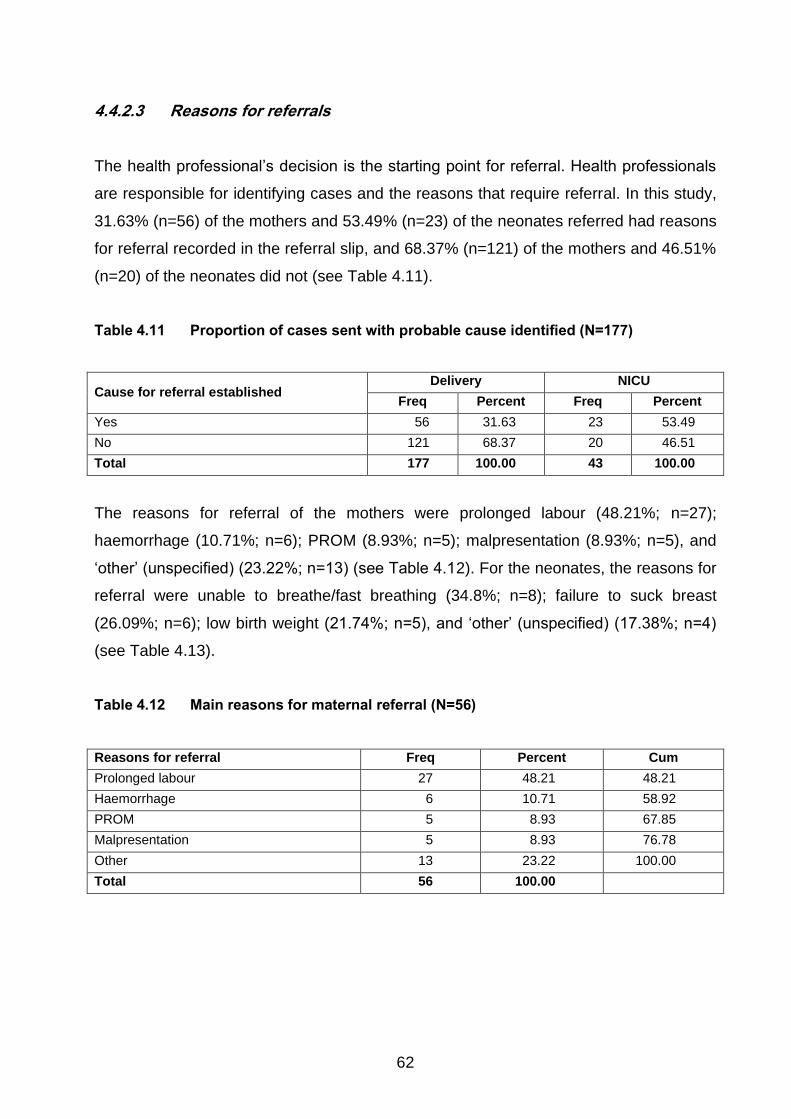
62
4.4.2.3 Reasons for referrals
The health professional’s decision is the starting point for referral. Health professionals
are responsible for identifying cases and the reasons that require referral. In this study,
31.63% (n=56) of the mothers and 53.49% (n=23) of the neonates referred had reasons
for referral recorded in the referral slip, and 68.37% (n=121) of the mothers and 46.51%
(n=20) of the neonates did not (see Table 4.11).
Table 4.11 Proportion of cases sent with probable cause identified (N=177)
Cause for referral established Delivery NICU
Freq Percent Freq Percent
Yes 56 31.63 23 53.49
No 121 68.37 20 46.51
Total 177 100.00 43 100.00
The reasons for referral of the mothers were prolonged labour (48.21%; n=27);
haemorrhage (10.71%; n=6); PROM (8.93%; n=5); malpresentation (8.93%; n=5), and
‘other’ (unspecified) (23.22%; n=13) (see Table 4.12). For the neonates, the reasons for
referral were unable to breathe/fast breathing (34.8%; n=8); failure to suck breast
(26.09%; n=6); low birth weight (21.74%; n=5), and ‘other’ (unspecified) (17.38%; n=4)
(see Table 4.13).
Table 4.12 Main reasons for maternal referral (N=56)
Reasons for referral Freq Percent Cum
Prolonged labour 27 48.21 48.21
Haemorrhage 6 10.71 58.92
PROM 5 8.93 67.85
Malpresentation 5 8.93 76.78
Other 13 23.22 100.00
Total 56 100.00
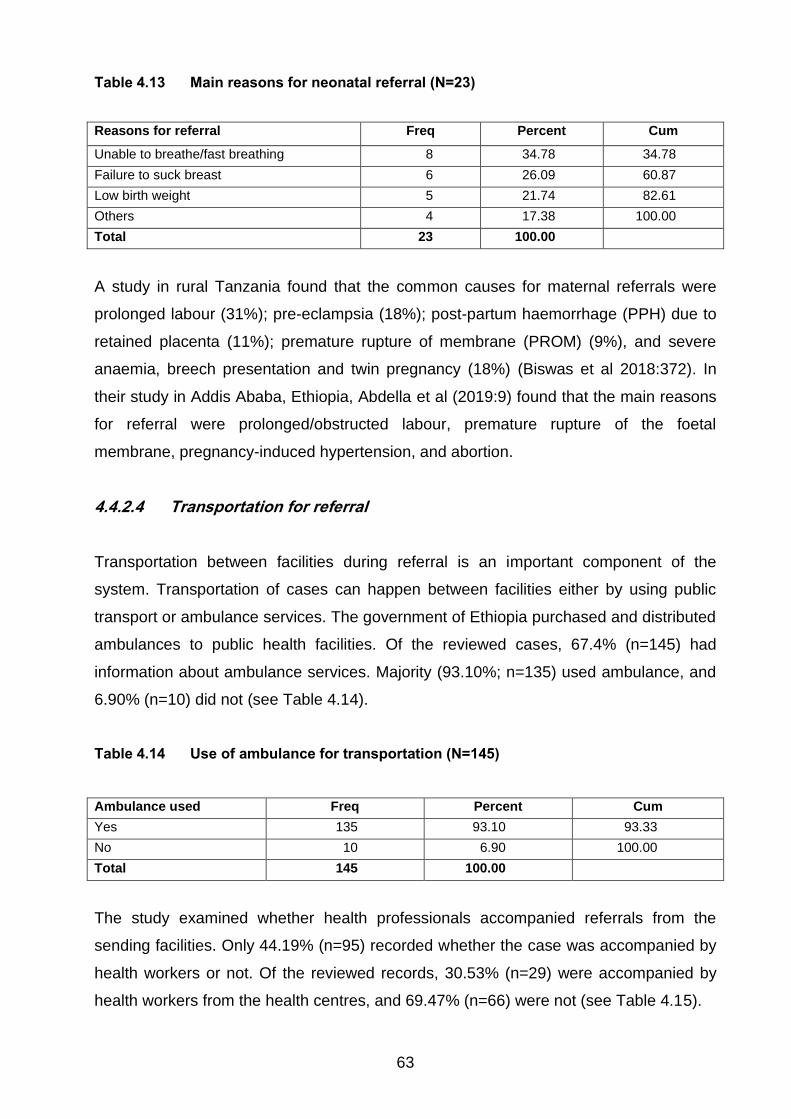
63
Table 4.13 Main reasons for neonatal referral (N=23)
Reasons for referral Freq Percent Cum
Unable to breathe/fast breathing 8 34.78 34.78
Failure to suck breast 6 26.09 60.87
Low birth weight 5 21.74 82.61
Others 4 17.38 100.00
Total 23 100.00
A study in rural Tanzania found that the common causes for maternal referrals were
prolonged labour (31%); pre-eclampsia (18%); post-partum haemorrhage (PPH) due to
retained placenta (11%); premature rupture of membrane (PROM) (9%), and severe
anaemia, breech presentation and twin pregnancy (18%) (Biswas et al 2018:372). In
their study in Addis Ababa, Ethiopia, Abdella et al (2019:9) found that the main reasons
for referral were prolonged/obstructed labour, premature rupture of the foetal
membrane, pregnancy-induced hypertension, and abortion.
4.4.2.4 Transportation for referral
Transportation between facilities during referral is an important component of the
system. Transportation of cases can happen between facilities either by using public
transport or ambulance services. The government of Ethiopia purchased and distributed
ambulances to public health facilities. Of the reviewed cases, 67.4% (n=145) had
information about ambulance services. Majority (93.10%; n=135) used ambulance, and
6.90% (n=10) did not (see Table 4.14).
Table 4.14 Use of ambulance for transportation (N=145)
Ambulance used Freq Percent Cum
Yes 135 93.10 93.33
No 10 6.90 100.00
Total 145 100.00
The study examined whether health professionals accompanied referrals from the
sending facilities. Only 44.19% (n=95) recorded whether the case was accompanied by
health workers or not. Of the reviewed records, 30.53% (n=29) were accompanied by
health workers from the health centres, and 69.47% (n=66) were not (see Table 4.15).

64
Table 4.15 Referral accompanied by health professional from the sending facility
(N=95)
Referral accompanied by health professional Freq Percent Cum
Yes 29 30.53 30.53
No 66 69.47 100.00
Total 95 100.00
4.4.3 Delivery care at receiving facility
Referred cases require extra attention when they reach the receiving facility. Quality of
care includes the completeness of care, which could be affected by the availability of
resources. Thus, when there is a shortage of resources, referred cases, which can be
serious cases compared to walk-in clients, require priority for complete care. The
differences in care between referred and non-referred clients are discussed next.
4.4.3.1 Care at admission
4.4.3.1.1 Vital signs at admission
The first step before taking any history is taking the required vital signs and registering
them in the patient card, namely measuring temperature, respiratory rate, pulse rate
and blood pressure. These measurements should be taken on admission of all cases
visiting a physician. The study examined whether the four necessary vital signs were
taken and/or recorded properly among the referred and non-referred cases (see Table
4.16).
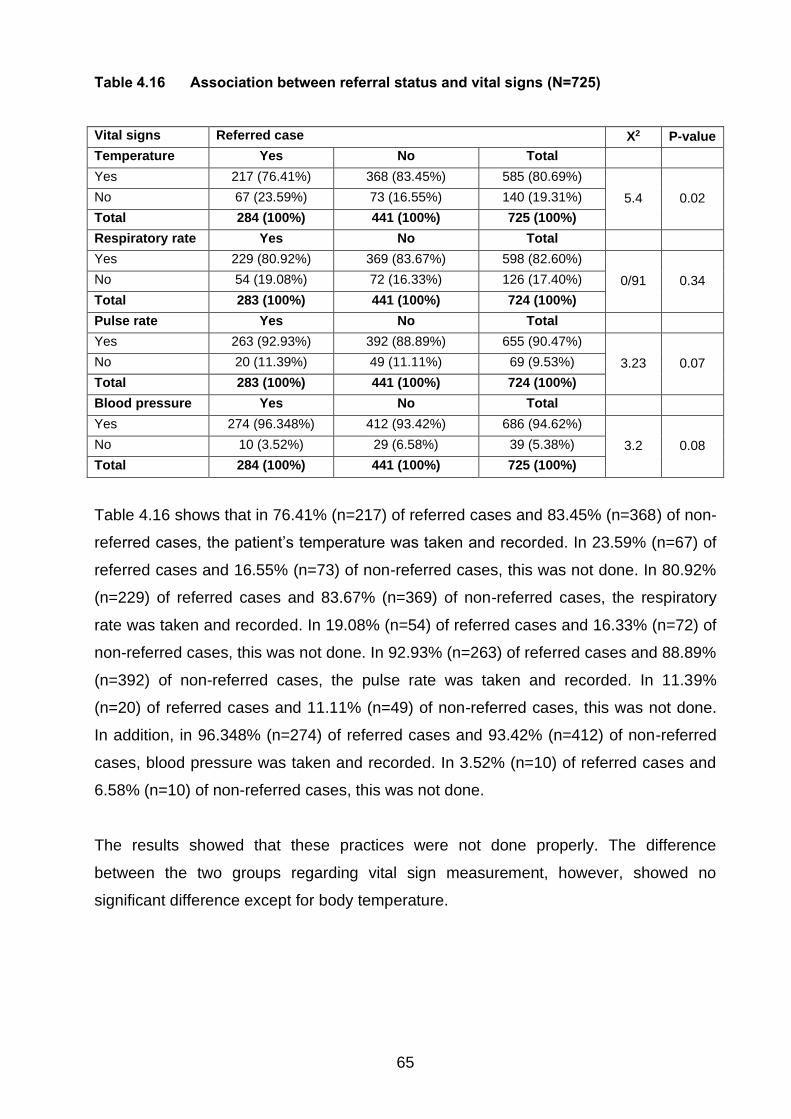
65
Table 4.16 Association between referral status and vital signs (N=725)
Vital signs Referred case X2 P-value
Temperature Yes No Total
Yes 217 (76.41%) 368 (83.45%) 585 (80.69%)
5.4 0.02 No 67 (23.59%) 73 (16.55%) 140 (19.31%)
Total 284 (100%) 441 (100%) 725 (100%)
Respiratory rate Yes No Total
Yes 229 (80.92%) 369 (83.67%) 598 (82.60%)
0/91 0.34 No 54 (19.08%) 72 (16.33%) 126 (17.40%)
Total 283 (100%) 441 (100%) 724 (100%)
Pulse rate Yes No Total
Yes 263 (92.93%) 392 (88.89%) 655 (90.47%)
3.23 0.07 No 20 (11.39%) 49 (11.11%) 69 (9.53%)
Total 283 (100%) 441 (100%) 724 (100%)
Blood pressure Yes No Total
Yes 274 (96.348%) 412 (93.42%) 686 (94.62%)
3.2 0.08 No 10 (3.52%) 29 (6.58%) 39 (5.38%)
Total 284 (100%) 441 (100%) 725 (100%)
Table 4.16 shows that in 76.41% (n=217) of referred cases and 83.45% (n=368) of non-
referred cases, the patient’s temperature was taken and recorded. In 23.59% (n=67) of
referred cases and 16.55% (n=73) of non-referred cases, this was not done. In 80.92%
(n=229) of referred cases and 83.67% (n=369) of non-referred cases, the respiratory
rate was taken and recorded. In 19.08% (n=54) of referred cases and 16.33% (n=72) of
non-referred cases, this was not done. In 92.93% (n=263) of referred cases and 88.89%
(n=392) of non-referred cases, the pulse rate was taken and recorded. In 11.39%
(n=20) of referred cases and 11.11% (n=49) of non-referred cases, this was not done.
In addition, in 96.348% (n=274) of referred cases and 93.42% (n=412) of non-referred
cases, blood pressure was taken and recorded. In 3.52% (n=10) of referred cases and
6.58% (n=10) of non-referred cases, this was not done.
The results showed that these practices were not done properly. The difference
between the two groups regarding vital sign measurement, however, showed no
significant difference except for body temperature.
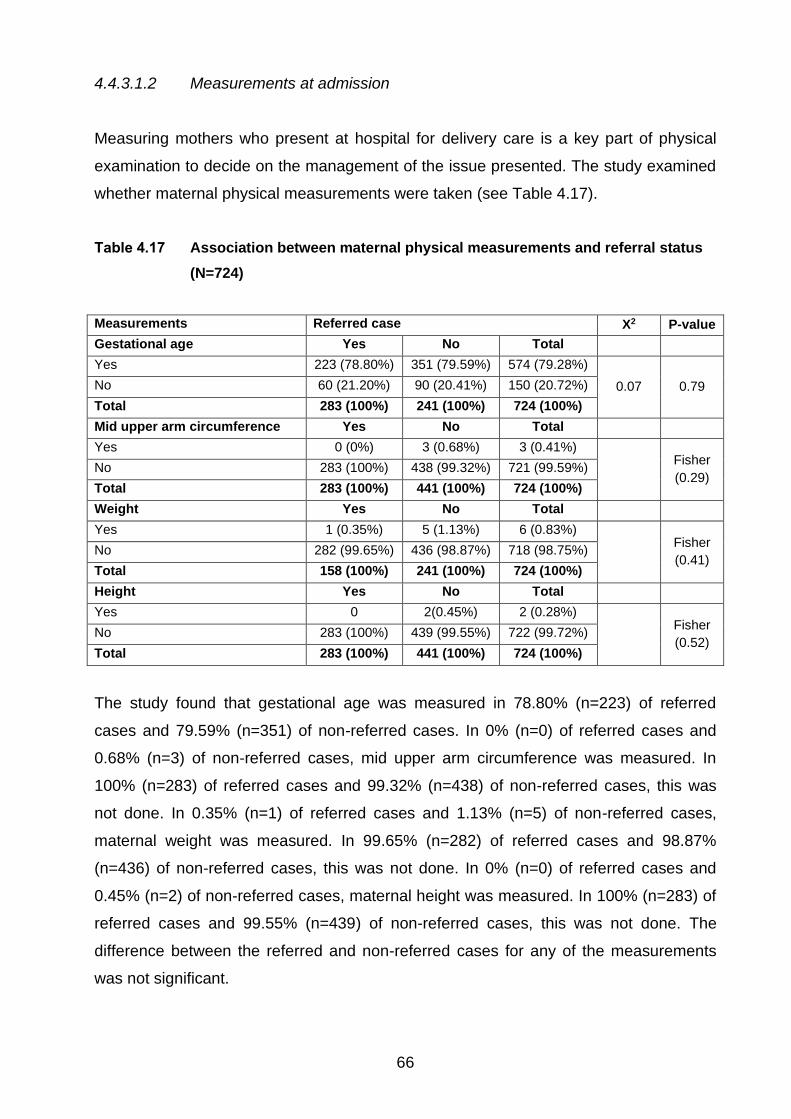
66
4.4.3.1.2 Measurements at admission
Measuring mothers who present at hospital for delivery care is a key part of physical
examination to decide on the management of the issue presented. The study examined
whether maternal physical measurements were taken (see Table 4.17).
Table 4.17 Association between maternal physical measurements and referral status
(N=724)
Measurements Referred case X2 P-value
Gestational age Yes No Total
Yes 223 (78.80%) 351 (79.59%) 574 (79.28%)
0.07 0.79 No 60 (21.20%) 90 (20.41%) 150 (20.72%)
Total 283 (100%) 241 (100%) 724 (100%)
Mid upper arm circumference Yes No Total
Yes 0 (0%) 3 (0.68%) 3 (0.41%)
Fisher
(0.29) No 283 (100%) 438 (99.32%) 721 (99.59%)
Total 283 (100%) 441 (100%) 724 (100%)
Weight Yes No Total
Yes 1 (0.35%) 5 (1.13%) 6 (0.83%)
Fisher
(0.41) No 282 (99.65%) 436 (98.87%) 718 (98.75%)
Total 158 (100%) 241 (100%) 724 (100%)
Height Yes No Total
Yes 0 2(0.45%) 2 (0.28%)
Fisher
(0.52) No 283 (100%) 439 (99.55%) 722 (99.72%)
Total 283 (100%) 441 (100%) 724 (100%)
The study found that gestational age was measured in 78.80% (n=223) of referred
cases and 79.59% (n=351) of non-referred cases. In 0% (n=0) of referred cases and
0.68% (n=3) of non-referred cases, mid upper arm circumference was measured. In
100% (n=283) of referred cases and 99.32% (n=438) of non-referred cases, this was
not done. In 0.35% (n=1) of referred cases and 1.13% (n=5) of non-referred cases,
maternal weight was measured. In 99.65% (n=282) of referred cases and 98.87%
(n=436) of non-referred cases, this was not done. In 0% (n=0) of referred cases and
0.45% (n=2) of non-referred cases, maternal height was measured. In 100% (n=283) of
referred cases and 99.55% (n=439) of non-referred cases, this was not done. The
difference between the referred and non-referred cases for any of the measurements
was not significant.

67
4.4.3.1.3 Abdominal examinations at admission
The abdominal examination presents opportunities to identify the lie of the foetus, which
is an important predictor to decide on possible management of the case. In this study, in
most cases lie was done and recorded in the patient card. There was no significant
difference between referred and non-referred cases at X2=3.6 and P-value=0.059.
Regarding presentation, most cases were checked for presentation. However, there
was a significant difference between the referred cases and non-referred cases at
X2=7.6 and P-value=0.006.
4.4.3.1.4 Pelvic examinations at admission Pelvic examination is a critical step to further understand the case presented for delivery
care. As presented in Table 4.18, significant proportion of reviewed records have
information about all the examination, except vaginal discharge. Only 80.6% of records
had information about vaginal discharge. The result shows that there was a clear
difference between referred and non-referred cases for pelvic examinations for cervical
dilatation, descent, and moulding.

68
Table 4.18 Association between referral status and physical examinations at
admission (N=726)
Check for Referred case X2 P-value
Vaginal discharge Yes No Total
Yes 115 (48.32%) 63 (18.16%) 178 (30.43%)
60.67 0.0000 No 123 (51.68%) 284 (81.84%) 407 (69.57%)
Total 238 (100%) 347 (100%) 585 (100%)
Ruptured membrane Yes No Total
Yes 213 (75.00%) 306 (69.39%) 519 (71.59%)
2.68 0.102 No 71 (25.00%) 135 (30.61%) 206 (28.41%)
Total 284 (100%) 441 (100%) 725 (100%)
Cervical dilatation Yes No Total
Yes 225 (79.23%) 300 (67.87%) 525 (72.31%)
11.13 0.001 No 59 (20.77%) 142 (32.13%) 201 (27.69%)
Total 284 (100%) 442 (100%) 726 (100%)
Descent Yes No Total
Yes 184 (64.79%) 218 (49.32%) 402 (55.37%)
16.74 0.000 No 100 (35.21%) 224 (50.68%) 324 (44.63%)
Total 284 (100%) 442 (100%) 726 (100%)
Moulding Yes No Total
Yes 83 (30.18%) 82 (19.20%) 165 (23.50%)
11.21 0.001 No 192 (69.82%) 345 (80.80%) 537 (76.58%)
Total 275 (100%) 427 (100%) 702 (100%)
Presentation Yes No Total
Yes 273 (96.13 %) 401 (90.72%) 674 (92.84%)
7.59 0.006 No 11 (3.87 %) 41 (9.28%) 52 (7.16%)
Total 284 (100%) 242 (100%) 726 (100%)
Lie Yes No Total
Yes 267 (94.01%) 397 (90.02%) 664 (91.59%)
3.57 0.059 No 17 (5.99%) 44 (9.98%) 61 (8.41%)
Total 284 (100%) 441 (100%) 725 (100%)
4.4.3.1.5 Physical examinations at admission
Pallor and jaundice are two common checks during physical examinations. The results
indicated that pallor was checked in 12.05% (n=20) of referred cases and 30.35%
(n=78) of non-referred cases. In 87.95% (n=146) of referred cases and 69.65% (n=179)
non-referred cases, pallor was not checked (see Table 4.19). In 12.65% (n=21) of
referred cases and 30.23% (n=78) of non-referred cases, jaundice was checked. In
87.35% (n=145) of referred cases and 69.77% (n=180) of non-referred cases, jaundice
was not checked (see Table 4.20). The study found that the difference between referred
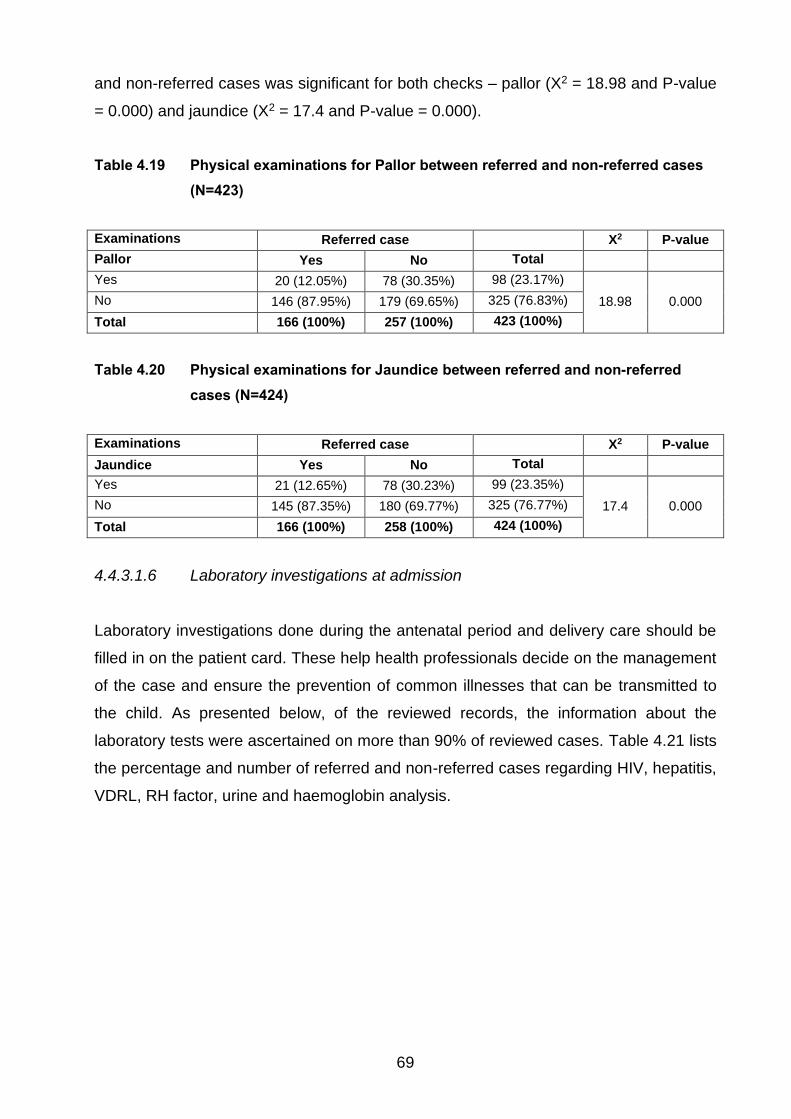
69
and non-referred cases was significant for both checks – pallor (X2 = 18.98 and P-value
= 0.000) and jaundice (X2 = 17.4 and P-value = 0.000).
Table 4.19 Physical examinations for Pallor between referred and non-referred cases
(N=423)
Examinations Referred case X2 P-value
Pallor Yes No Total
Yes 20 (12.05%) 78 (30.35%) 98 (23.17%)
18.98 0.000 No 146 (87.95%) 179 (69.65%) 325 (76.83%)
Total 166 (100%) 257 (100%) 423 (100%)
Table 4.20 Physical examinations for Jaundice between referred and non-referred
cases (N=424)
Examinations Referred case X2 P-value
Jaundice Yes No Total
Yes 21 (12.65%) 78 (30.23%) 99 (23.35%)
17.4 0.000 No 145 (87.35%) 180 (69.77%) 325 (76.77%)
Total 166 (100%) 258 (100%) 424 (100%)
4.4.3.1.6 Laboratory investigations at admission
Laboratory investigations done during the antenatal period and delivery care should be
filled in on the patient card. These help health professionals decide on the management
of the case and ensure the prevention of common illnesses that can be transmitted to
the child. As presented below, of the reviewed records, the information about the
laboratory tests were ascertained on more than 90% of reviewed cases. Table 4.21 lists
the percentage and number of referred and non-referred cases regarding HIV, hepatitis,
VDRL, RH factor, urine and haemoglobin analysis.

70
Table 4.21 Association of referral status and laboratory tests at hospital level (N=726)
Laboratory test types Referred case X2
P-
value
HIV Yes No Total
Test was done 184 (71.32%) 300 (72.99%) 484 (72.35%)
0.22 0.64 Test was not done 74 (28.68%) 111 (27.01%) 185 (27.65%)
Total 258 (100%) 411 (100%) 669 (100%)
Hepatitis Yes No Total
Test was done 166 (64.34%) 252 (61.31%) 418 (62.48%)
0.62 0.43 Test was not done 92 (35.66%) 159 (38.69%) 251 (37.52%)
Total 258 (100%) 411 (100%) 669 (100%)
VDRL Yes No Total
Test was done 156 (60.47%) 237 (57.66%) 393 (58.74%)
0.51 0.47 Test was not done 102 (39.53%) 174 (42.34%) 276 (41.26%)
Total 258 (100%) 441 (100%) 669 (100%)
RH factor Yes No Total
Test was done 174 (67.44%) 256 (62.29%) 430 (64.28%)
1.83 0.18 Test was not done 84 (32.56%) 55 (37.71%) 239 (35.72%)
Total 258 (100%) 411 (100%) 669 (100%)
Urine analysis Yes No Total
Test was done 172 (66.41%) 277 (67.23%) 449 (66.92%)
0.05 0.84 Test was not done 87 (33.59%) 135 (32.77%) 222 (33.08%)
Total 259 (100%) 412 (100%) 671 (100%)
Haemoglobin Yes No Total
Test was done 124 (47.15%) 197 (47.82%) 321 (47.56%)
0.03 0.87 Test was not done 139 (52.85%) 215 (52.18%) 354 (52.44%)
Total 263 (100%) 412 (100%) 675 (100%)
Haemoglobin test is an important marker, given the high prevalence of haemorrhage
during labour and post-partum, and the high level of anaemia among pregnant women
in Ethiopia (CSA [Ethiopia] & ICF 2016:199). Urine analysis, HIV and RH factor tests
were performed in most cases. The study found no significant differences between
referred and non-referred cases in respect of the laboratory tests.
4.4.3.2 Use of partograph for labour monitoring
A partograph is a simple, low-cost monitoring tool for intrapartum care (WHO 2018a: 50;
Markos & Bogale 2015:2). Utilisation of a partograph is vital to guide health workers to
identify abnormal labour and to implement the appropriate management and improve
the quality of intrapartum care, maternal health and birth outcomes (Khan, Billah,
Mannan, Mannan, Begum, Khan, Islam, Ahasan, Rahman, George, Arifeen, Meena,
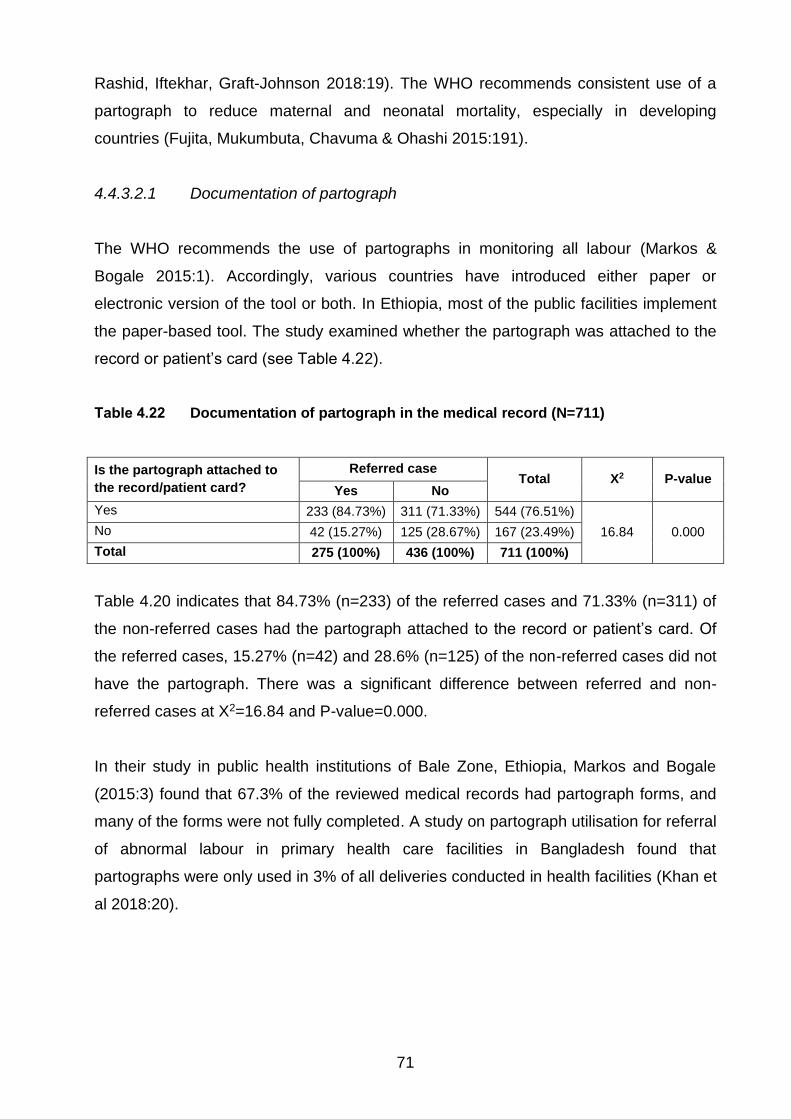
71
Rashid, Iftekhar, Graft-Johnson 2018:19). The WHO recommends consistent use of a
partograph to reduce maternal and neonatal mortality, especially in developing
countries (Fujita, Mukumbuta, Chavuma & Ohashi 2015:191).
4.4.3.2.1 Documentation of partograph
The WHO recommends the use of partographs in monitoring all labour (Markos &
Bogale 2015:1). Accordingly, various countries have introduced either paper or
electronic version of the tool or both. In Ethiopia, most of the public facilities implement
the paper-based tool. The study examined whether the partograph was attached to the
record or patient’s card (see Table 4.22).
Table 4.22 Documentation of partograph in the medical record (N=711)
Is the partograph attached to
the record/patient card?
Referred case Total X2 P-value
Yes No
Yes 233 (84.73%) 311 (71.33%) 544 (76.51%)
16.84 0.000 No 42 (15.27%) 125 (28.67%) 167 (23.49%)
Total 275 (100%) 436 (100%) 711 (100%)
Table 4.20 indicates that 84.73% (n=233) of the referred cases and 71.33% (n=311) of
the non-referred cases had the partograph attached to the record or patient’s card. Of
the referred cases, 15.27% (n=42) and 28.6% (n=125) of the non-referred cases did not
have the partograph. There was a significant difference between referred and non-
referred cases at X2=16.84 and P-value=0.000.
In their study in public health institutions of Bale Zone, Ethiopia, Markos and Bogale
(2015:3) found that 67.3% of the reviewed medical records had partograph forms, and
many of the forms were not fully completed. A study on partograph utilisation for referral
of abnormal labour in primary health care facilities in Bangladesh found that
partographs were only used in 3% of all deliveries conducted in health facilities (Khan et
al 2018:20).

72
4.4.3.2.2 When to start record?
Partograph recording should be started during the active stage of labour. The WHO
(2016a: 66) defines the active stage of labour as “when the mother has a cervical
dilatation of greater or equal to 4 cm”. In this study, partograph recording started in the
active phase in 53.10% (n=120) of referred cases and 59.80% (n=80) of non-referred
cases; in near to full dilatation in 44.69% (n=101) in referred cases and 38.21% (n=115)
of non-referred cases, and in the latent phase in 2.21% (n=5) of referred cases and
1.99% (n=6) of non-referred cases (see Table 4.23). There was no significant difference
between referred and non-referred cases as to when the partograph was started at P-
value 0.31.
Table 4.23 Starting time of partograph record (N=527)
First cervical dilatation record Referred case Total X2 P-value
Yes No
Latent phase (<4 cms) 5 (2.21%) 6 (1.99%) 11 (2.09%)
2.37 0.31 Active phase (4-8 cms) 120 (53.10%) 80 (59.80%) 300 (56.93%)
Near to full dilatation (>8 cms) 101 (44.69%) 115 (38.21%) 216 (40.99%)
Total 226 (100%) 301 (100%) 527 (100%)
4.4.3.2.3 Completeness of the partograph
The WHO recommends appropriate intervals for monitoring vital signs and labour
progress on the partograph: foetal heart rate (FHR) and uterine contraction (every thirty
minutes), monitoring of temperature and urine output (every two hours), and monitoring
of state of liquor/amniotic fluid, moulding of foetal skull, cervical dilatation, descent of
foetal head, and maternal blood pressure (every four hours) (Khan et al 2018:24).
This study analysed the practice of monitoring of vital signs and labour progress signs.
The time between the start of the partograph and delivery was calculated as length of
stay and the number of records was checked against the standard measurement for
each type of vital or labour progress monitoring sign. The study examined the proportion
of appropriate records and the practice between referred and non-referred cases.
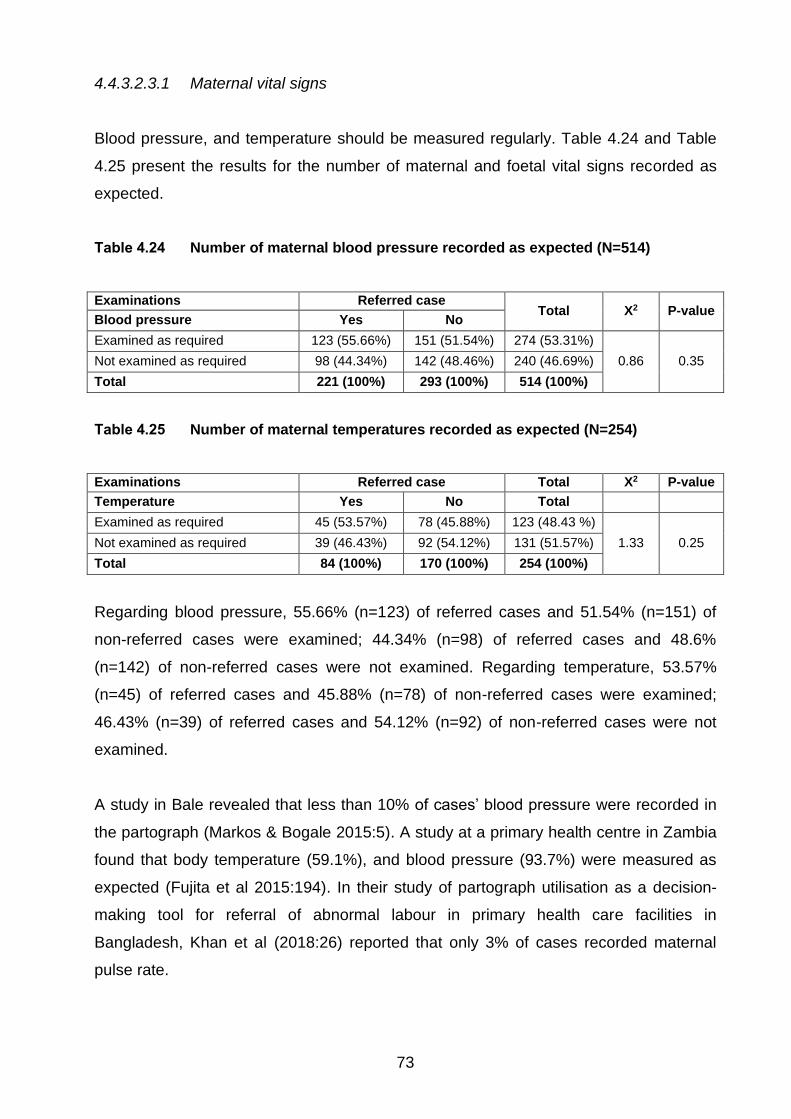
73
4.4.3.2.3.1 Maternal vital signs
Blood pressure, and temperature should be measured regularly. Table 4.24 and Table
4.25 present the results for the number of maternal and foetal vital signs recorded as
expected.
Table 4.24 Number of maternal blood pressure recorded as expected (N=514)
Examinations Referred case Total X2 P-value
Blood pressure Yes No
Examined as required 123 (55.66%) 151 (51.54%) 274 (53.31%)
0.86 0.35 Not examined as required 98 (44.34%) 142 (48.46%) 240 (46.69%)
Total 221 (100%) 293 (100%) 514 (100%)
Table 4.25 Number of maternal temperatures recorded as expected (N=254)
Examinations Referred case Total X2 P-value
Temperature Yes No Total
Examined as required 45 (53.57%) 78 (45.88%) 123 (48.43 %)
1.33 0.25 Not examined as required 39 (46.43%) 92 (54.12%) 131 (51.57%)
Total 84 (100%) 170 (100%) 254 (100%)
Regarding blood pressure, 55.66% (n=123) of referred cases and 51.54% (n=151) of
non-referred cases were examined; 44.34% (n=98) of referred cases and 48.6%
(n=142) of non-referred cases were not examined. Regarding temperature, 53.57%
(n=45) of referred cases and 45.88% (n=78) of non-referred cases were examined;
46.43% (n=39) of referred cases and 54.12% (n=92) of non-referred cases were not
examined.
A study in Bale revealed that less than 10% of cases’ blood pressure were recorded in
the partograph (Markos & Bogale 2015:5). A study at a primary health centre in Zambia
found that body temperature (59.1%), and blood pressure (93.7%) were measured as
expected (Fujita et al 2015:194). In their study of partograph utilisation as a decision-
making tool for referral of abnormal labour in primary health care facilities in
Bangladesh, Khan et al (2018:26) reported that only 3% of cases recorded maternal
pulse rate.

74
4.4.3.2.3.2 Labour investigations
Labour investigations done while the mother is in labour are important to identify
pregnancy-related problems, such as pregnancy-induced hypertension. These follow-
ups include checking for urine volume and for protein and acetone in the urine. Table
4.26 indicates the laboratory tests that were found in the study.
Table 4.26 Laboratory tests recorded on a partograph (N=544)
Tests Referred case X2 P-value
Urine volume Yes No Total
Done 0 1 (0.32%) 1 (0.78%)
Not done 233 (100%) 310 (99.68%) 543 (99.82%)
Total 233 (100%) 311 (100%) 544 (100%)
Urine protein Yes No Total
Done 7 (3.00%) 48 (15.43%) 55 (10.11%)
Not done 226 (97.00%) 263 (84.57%) 489 (89.89%) 22.65 0.000
Total 233 (100%) 311 (100%) 544 (100%)
Urine acetone Yes No Total
Done 7 (3.00%) 45 (14.47%) 52 (9.56%)
Not done 226 (97.00%) 266 (85.53%) 492 (90.44%) 20.25 0. 000
Total 233 (100%) 311 (100%) 544 (100%)
Regarding urine volume, 0% (n=0) of referred cases and 0.32% (n=1) of non-referred
cases were tested; 100% (N=233) of referred cases and 99.68% (n=310) of non-
referred of non-referred cases were not tested. Regarding urine protein, 3.00% (n=7) of
referred cases and 15.43% (n=48) of non-referred cases were tested; 97.00% (n=226)
of referred cases and 15.43% (n=48) of non-referred cases were not tested. Regarding
urine acetone, 3.00% (n=7) of referred cases and 14.47% (n=45) of non-referred cases
were tested; 97.00% (n=226) of referred cases and 85.53% (n=266) of non-referred
cases were not tested.
4.4.3.2.3.3 Pelvic examination
Digital vaginal examination at intervals of four hours is recommended for routine
assessment of active first stage of labour in low-risk women (WHO 2018a: 78). Every
examination should check for cervical dilatation, descent and moulding of foetal skull.
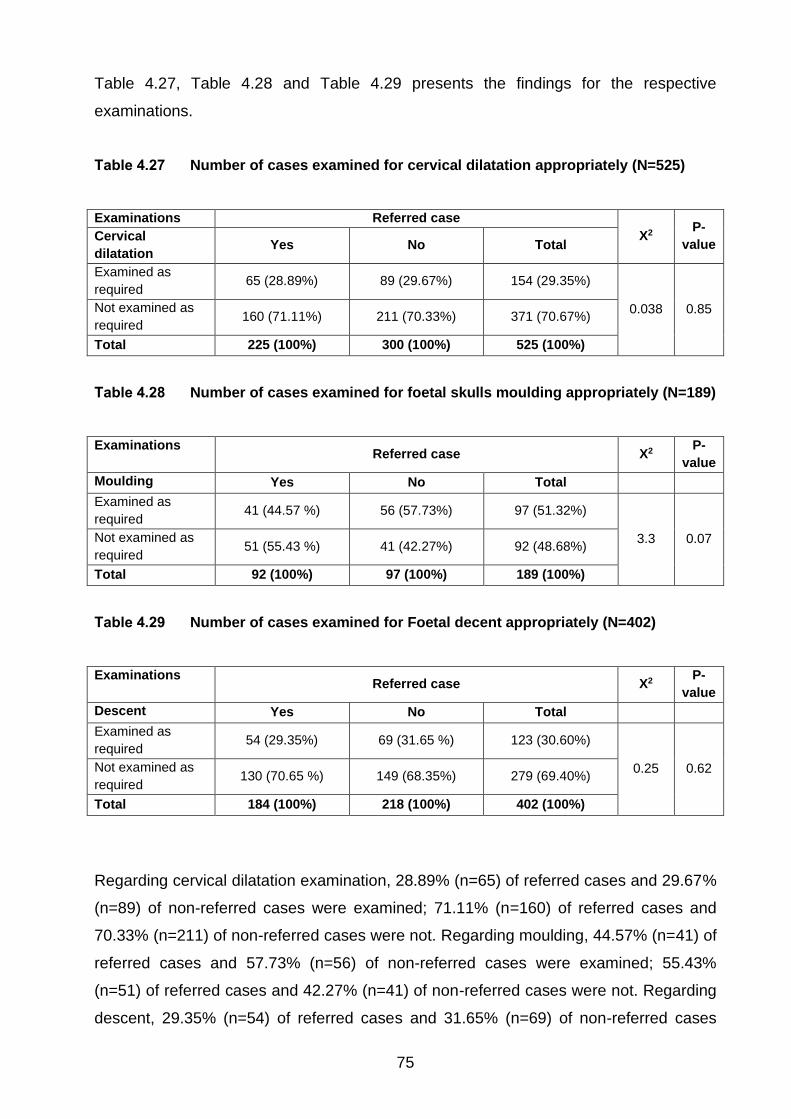
75
Table 4.27, Table 4.28 and Table 4.29 presents the findings for the respective
examinations.
Table 4.27 Number of cases examined for cervical dilatation appropriately (N=525)
Examinations Referred case
X2 P-
value Cervical
dilatation Yes No Total
Examined as
required 65 (28.89%) 89 (29.67%) 154 (29.35%)
0.038 0.85 Not examined as
required 160 (71.11%) 211 (70.33%) 371 (70.67%)
Total 225 (100%) 300 (100%) 525 (100%)
Table 4.28 Number of cases examined for foetal skulls moulding appropriately (N=189)
Examinations Referred case X2
P-
value
Moulding Yes No Total
Examined as
required 41 (44.57 %) 56 (57.73%) 97 (51.32%)
3.3 0.07 Not examined as
required 51 (55.43 %) 41 (42.27%) 92 (48.68%)
Total 92 (100%) 97 (100%) 189 (100%)
Table 4.29 Number of cases examined for Foetal decent appropriately (N=402)
Examinations Referred case X2
P-
value
Descent Yes No Total
Examined as
required 54 (29.35%) 69 (31.65 %) 123 (30.60%)
0.25 0.62 Not examined as
required 130 (70.65 %) 149 (68.35%) 279 (69.40%)
Total 184 (100%) 218 (100%) 402 (100%)
Regarding cervical dilatation examination, 28.89% (n=65) of referred cases and 29.67%
(n=89) of non-referred cases were examined; 71.11% (n=160) of referred cases and
70.33% (n=211) of non-referred cases were not. Regarding moulding, 44.57% (n=41) of
referred cases and 57.73% (n=56) of non-referred cases were examined; 55.43%
(n=51) of referred cases and 42.27% (n=41) of non-referred cases were not. Regarding
descent, 29.35% (n=54) of referred cases and 31.65% (n=69) of non-referred cases
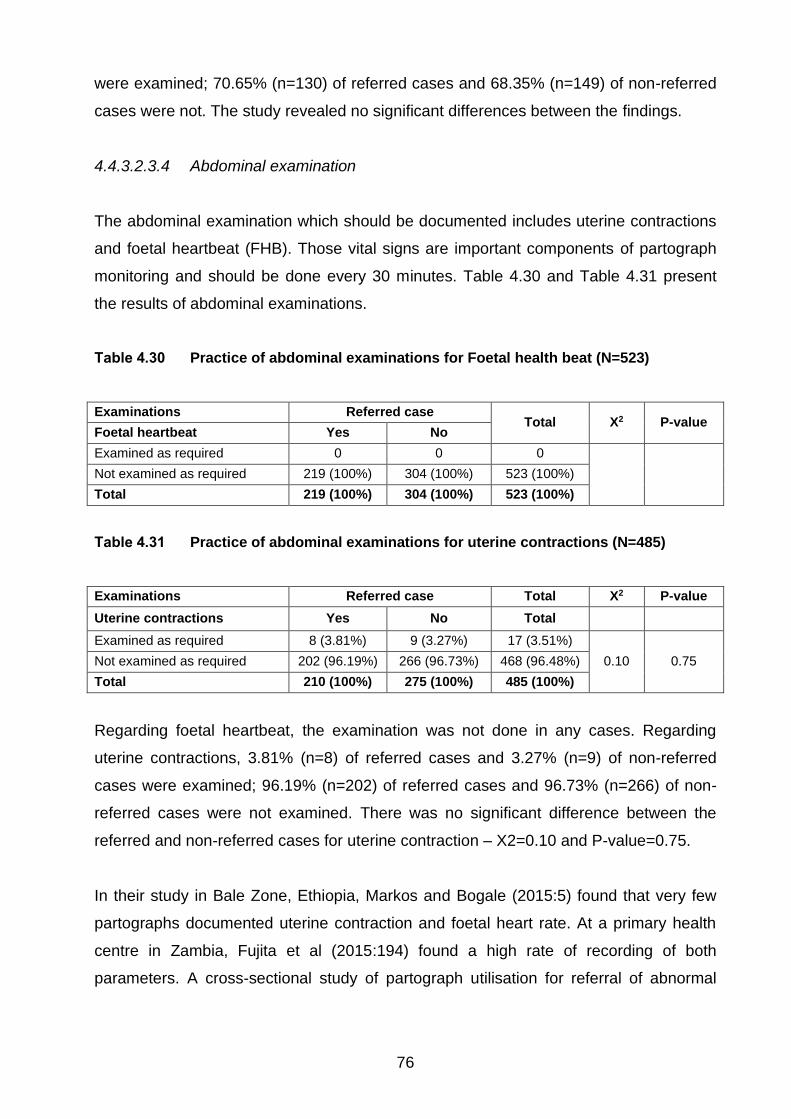
76
were examined; 70.65% (n=130) of referred cases and 68.35% (n=149) of non-referred
cases were not. The study revealed no significant differences between the findings.
4.4.3.2.3.4 Abdominal examination
The abdominal examination which should be documented includes uterine contractions
and foetal heartbeat (FHB). Those vital signs are important components of partograph
monitoring and should be done every 30 minutes. Table 4.30 and Table 4.31 present
the results of abdominal examinations.
Table 4.30 Practice of abdominal examinations for Foetal health beat (N=523)
Examinations Referred case Total X2 P-value
Foetal heartbeat Yes No
Examined as required 0 0 0
Not examined as required 219 (100%) 304 (100%) 523 (100%)
Total 219 (100%) 304 (100%) 523 (100%)
Table 4.31 Practice of abdominal examinations for uterine contractions (N=485)
Examinations Referred case Total X2 P-value
Uterine contractions Yes No Total
Examined as required 8 (3.81%) 9 (3.27%) 17 (3.51%)
0.10 0.75 Not examined as required 202 (96.19%) 266 (96.73%) 468 (96.48%)
Total 210 (100%) 275 (100%) 485 (100%)
Regarding foetal heartbeat, the examination was not done in any cases. Regarding
uterine contractions, 3.81% (n=8) of referred cases and 3.27% (n=9) of non-referred
cases were examined; 96.19% (n=202) of referred cases and 96.73% (n=266) of non-
referred cases were not examined. There was no significant difference between the
referred and non-referred cases for uterine contraction – X2=0.10 and P-value=0.75.
In their study in Bale Zone, Ethiopia, Markos and Bogale (2015:5) found that very few
partographs documented uterine contraction and foetal heart rate. At a primary health
centre in Zambia, Fujita et al (2015:194) found a high rate of recording of both
parameters. A cross-sectional study of partograph utilisation for referral of abnormal

77
labour in primary health care facilities of Bangladesh found foetal heart rate
documented in 61% of cases (Khan et al 2018:26).
4.4.3.3 Outcome of labour
The study revealed that the average length of stay from admission to delivery was close
to eight hours at the hospital. As a general guide, the mother is expected to stay at the
hospital for an additional 24 hours after spontaneous vaginal delivery (SVD) in the
hospital. The average total length of stay at hospital then would be 32 hours. Generally,
however, most deliveries are spontaneous and do not require extra management. Table
4.32 presents the findings in the study.
Table 4.32 Mode of delivery among reviewed cases (N=674)
Mode of delivery Referred case
Total Yes No
SVD 162 (64.80%) 330 (77.83%) 492 (73.00%)
C/s 22 (8.80%) 13 (3.07%) 35 (5.19%)
Forceps 4 (1.60%) 6 (1.42%) 10 (1.48%)
Vacuum 2 (0.80%) 4 (0.94%) 6 (0.89%)
SVD and episiotomy 55 (22.00%) 53 (12.50%) 108 (16.02%)
Total 250 (100%) 424 (100%) 674 (100%)
Regarding delivery, 64.80% (n=162) of referred cases and 77.83% (n=330) of non-
referred cases were SVD, while 22.0% (n=55) of referred cases and 12.50% (n=53) of
non-referred cases were SVD and episiotomy; 8.80% (n=22) of referred cases and
3.07% (n=13) of non-referred cases, were caesarean sections. Finally, 1.60% (n=4) of
referred cases and 1.42% (n=6) of non-referred cases, were forceps delivery, and
0.80% (n=2) of referred cases and 0.94% (n=4) non-referred cases, were vacuum
delivery. Between 2011 and 2015, the caesarean section rate in Ethiopia was 2% of live
births (CSA [Ethiopia] & ICF 2016:138).
The study revealed that most of the admitted labour cases resulted in live births and the
mothers were stable after delivery. Table 4.33 and Table 4.34 present the maternal and
newborn condition.
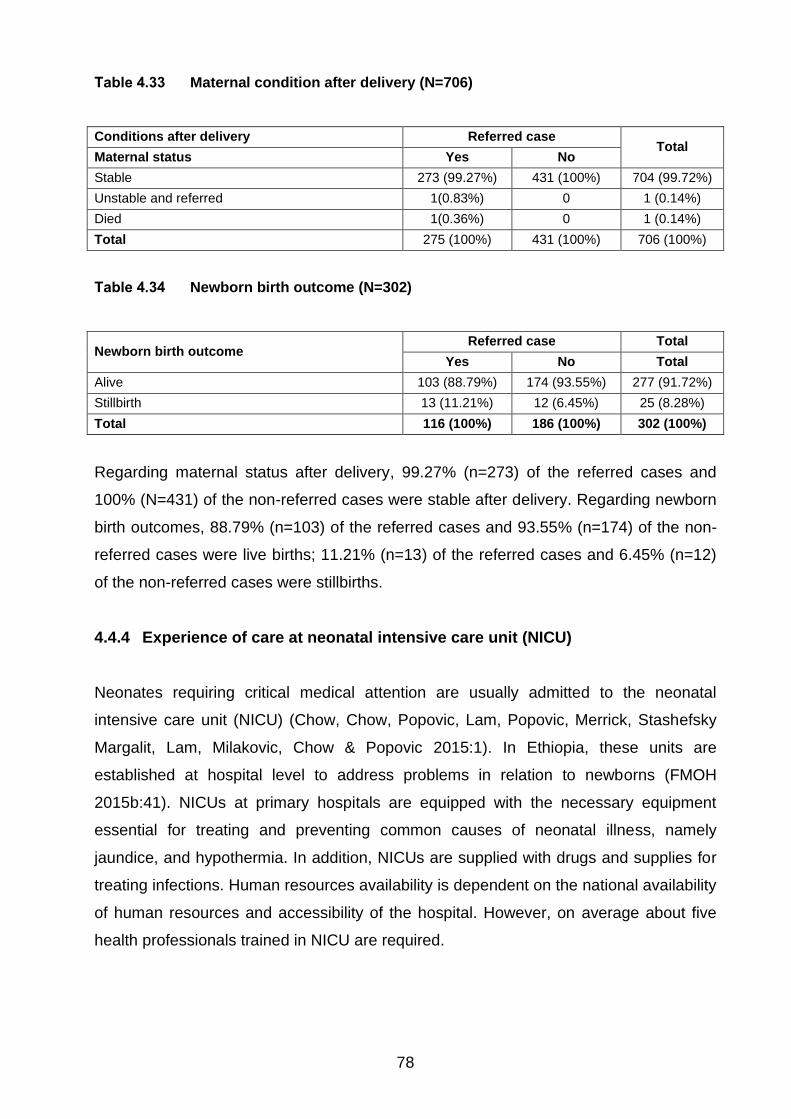
78
Table 4.33 Maternal condition after delivery (N=706)
Conditions after delivery Referred case Total
Maternal status Yes No
Stable 273 (99.27%) 431 (100%) 704 (99.72%)
Unstable and referred 1(0.83%) 0 1 (0.14%)
Died 1(0.36%) 0 1 (0.14%)
Total 275 (100%) 431 (100%) 706 (100%)
Table 4.34 Newborn birth outcome (N=302)
Newborn birth outcome Referred case Total
Yes No Total
Alive 103 (88.79%) 174 (93.55%) 277 (91.72%)
Stillbirth 13 (11.21%) 12 (6.45%) 25 (8.28%)
Total 116 (100%) 186 (100%) 302 (100%)
Regarding maternal status after delivery, 99.27% (n=273) of the referred cases and
100% (N=431) of the non-referred cases were stable after delivery. Regarding newborn
birth outcomes, 88.79% (n=103) of the referred cases and 93.55% (n=174) of the non-
referred cases were live births; 11.21% (n=13) of the referred cases and 6.45% (n=12)
of the non-referred cases were stillbirths.
4.4.4 Experience of care at neonatal intensive care unit (NICU)
Neonates requiring critical medical attention are usually admitted to the neonatal
intensive care unit (NICU) (Chow, Chow, Popovic, Lam, Popovic, Merrick, Stashefsky
Margalit, Lam, Milakovic, Chow & Popovic 2015:1). In Ethiopia, these units are
established at hospital level to address problems in relation to newborns (FMOH
2015b:41). NICUs at primary hospitals are equipped with the necessary equipment
essential for treating and preventing common causes of neonatal illness, namely
jaundice, and hypothermia. In addition, NICUs are supplied with drugs and supplies for
treating infections. Human resources availability is dependent on the national availability
of human resources and accessibility of the hospital. However, on average about five
health professionals trained in NICU are required.

79
4.4.4.1 Chief complaints for admission
The three main complaints for which newborns presented to the NICU were difficulty of
breathing, failure to suck breast, and fever (see Table 4.35).
Table 4.35 Chief complaints at admission (N=143)
Chief complaint Referred case
Total Yes No
Fast/difficulty of breathing 19 (35.19%) 25 (28.09%) 44 (30.77%)
Failure to suck 22 (40.74%) 22 (24.72%) 44 (30.77%)
Fever 3 (5.56%) 15 (16.85%) 18 (12.59%)
Low birth weight 4 (7.41%) 9 (10.11%) 13 (9.05%)
Cough 1 (1.85%) 7 (7.87%) 8 (5.59%)
Preterm 2 (3.75%) 1 (1.12%) 3 (2.10%)
Skin rash 0(0%) 5 (5.62%) 5 (3.50%)
Other 3 (5.56%) 5 (5.62%) 8 (5.59%)
Total 54 (100%) 89 (100%) 143 (100%)
Regarding difficulty in breathing, 35.19% (n=19) of referred cases and 28.09% (n=25) of
non-referred cases, were admitted to NICU. Regarding failure to suck, 40.74% (n=22) of
referred cases and 24.72% (n=22) of non-referred cases, were admitted to NICU.
Regarding fever, 5.56% (n=3) of referred cases and 16.85% (n=15) of non-referred
cases, were admitted to NICU.
4.4.4.2 Patients characteristics at admission
Measurement of foetal weight and vital signs are common practice at admission. This
study found that the majority of the neonates were under 2 days old when admitted and
had either a normal or a low birth weight (see Table 4.36 and Table 4.37).
Table 4.36 Admitted neonates’ age (N=143)
Newborn age (days) Referred case
Total X2 P-value Yes No
Less than 2 days 44 (81.48%) 37 (66.07%) 108 (75.52%)
2.17 0.34 Two to seven days 5 (9.26%) 9 (10.11%) 14 (9.79%)
Eight to twenty-eight days 5 (9.26%) 16 (17.98%) 21 (14.69%)
Total 54 (100%) 89 (100%) 143 (100%)
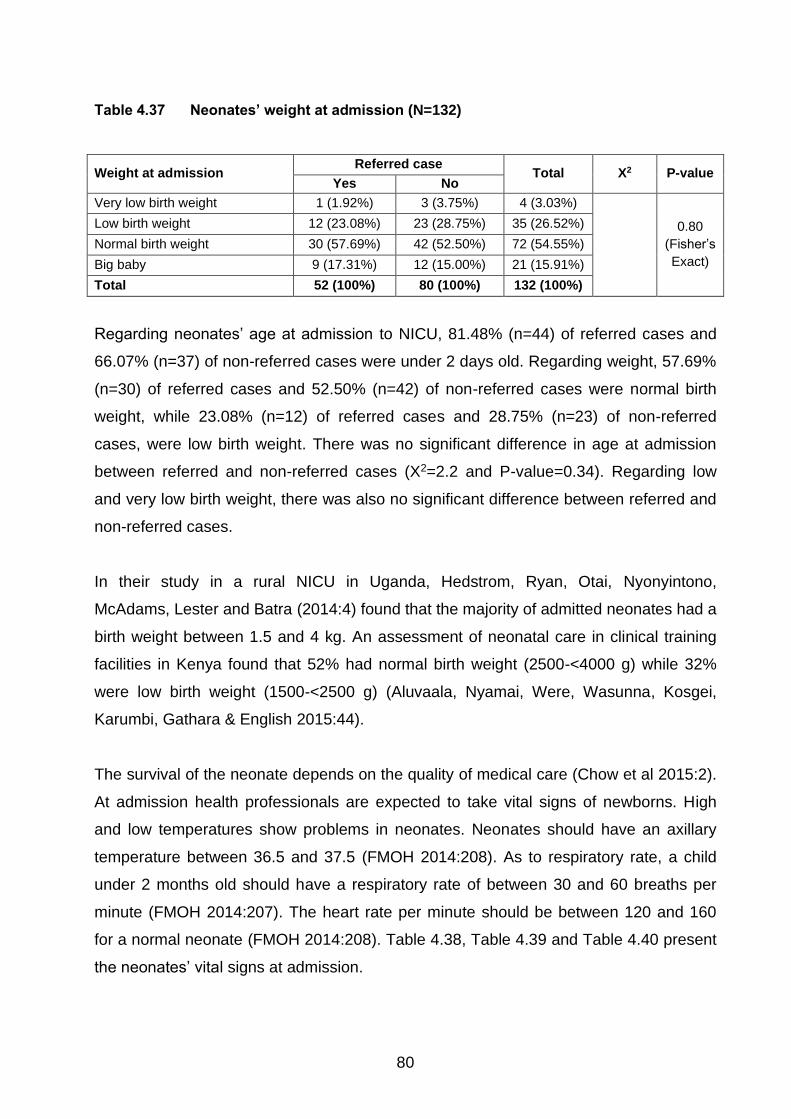
80
Table 4.37 Neonates’ weight at admission (N=132)
Weight at admission Referred case
Total X2 P-value Yes No
Very low birth weight 1 (1.92%) 3 (3.75%) 4 (3.03%)
0.80
(Fisher’s
Exact)
Low birth weight 12 (23.08%) 23 (28.75%) 35 (26.52%)
Normal birth weight 30 (57.69%) 42 (52.50%) 72 (54.55%)
Big baby 9 (17.31%) 12 (15.00%) 21 (15.91%)
Total 52 (100%) 80 (100%) 132 (100%)
Regarding neonates’ age at admission to NICU, 81.48% (n=44) of referred cases and
66.07% (n=37) of non-referred cases were under 2 days old. Regarding weight, 57.69%
(n=30) of referred cases and 52.50% (n=42) of non-referred cases were normal birth
weight, while 23.08% (n=12) of referred cases and 28.75% (n=23) of non-referred
cases, were low birth weight. There was no significant difference in age at admission
between referred and non-referred cases (X2=2.2 and P-value=0.34). Regarding low
and very low birth weight, there was also no significant difference between referred and
non-referred cases.
In their study in a rural NICU in Uganda, Hedstrom, Ryan, Otai, Nyonyintono,
McAdams, Lester and Batra (2014:4) found that the majority of admitted neonates had a
birth weight between 1.5 and 4 kg. An assessment of neonatal care in clinical training
facilities in Kenya found that 52% had normal birth weight (2500-<4000 g) while 32%
were low birth weight (1500-<2500 g) (Aluvaala, Nyamai, Were, Wasunna, Kosgei,
Karumbi, Gathara & English 2015:44).
The survival of the neonate depends on the quality of medical care (Chow et al 2015:2).
At admission health professionals are expected to take vital signs of newborns. High
and low temperatures show problems in neonates. Neonates should have an axillary
temperature between 36.5 and 37.5 (FMOH 2014:208). As to respiratory rate, a child
under 2 months old should have a respiratory rate of between 30 and 60 breaths per
minute (FMOH 2014:207). The heart rate per minute should be between 120 and 160
for a normal neonate (FMOH 2014:208). Table 4.38, Table 4.39 and Table 4.40 present
the neonates’ vital signs at admission.
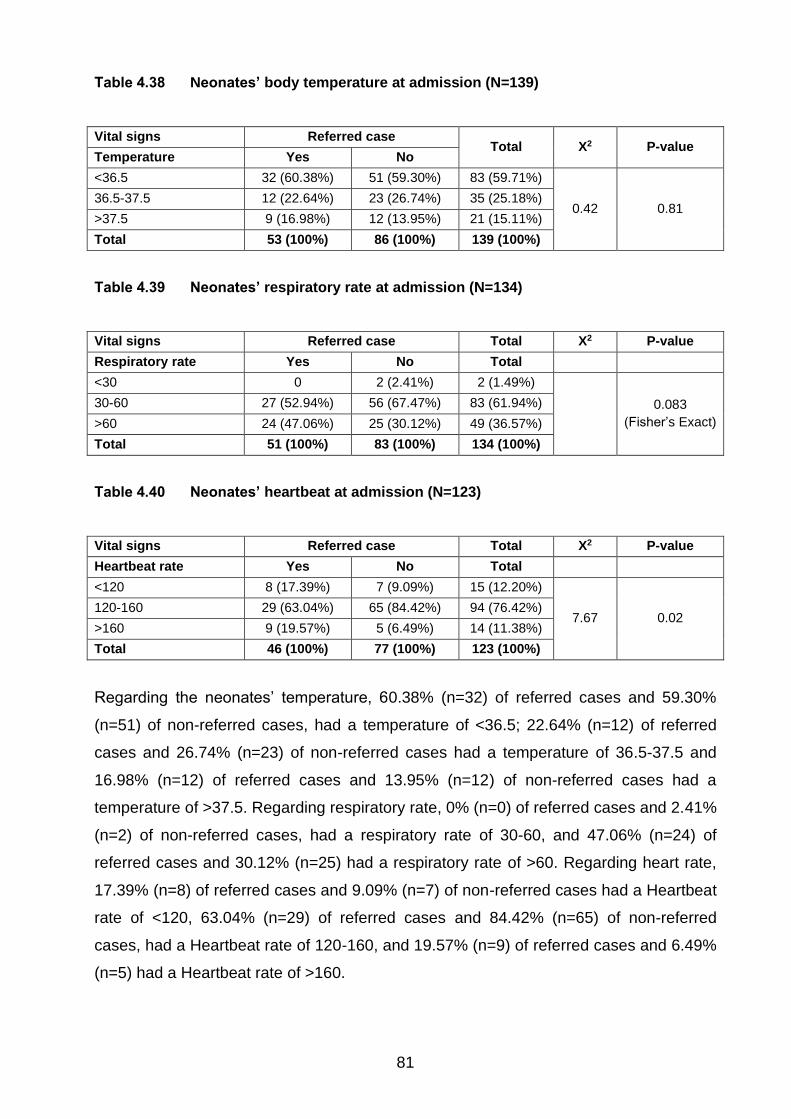
81
Table 4.38 Neonates’ body temperature at admission (N=139)
Vital signs Referred case Total X2 P-value
Temperature Yes No
<36.5 32 (60.38%) 51 (59.30%) 83 (59.71%)
0.42 0.81 36.5-37.5 12 (22.64%) 23 (26.74%) 35 (25.18%)
>37.5 9 (16.98%) 12 (13.95%) 21 (15.11%)
Total 53 (100%) 86 (100%) 139 (100%)
Table 4.39 Neonates’ respiratory rate at admission (N=134)
Vital signs Referred case Total X2 P-value
Respiratory rate Yes No Total
<30 0 2 (2.41%) 2 (1.49%)
0.083
(Fisher’s Exact)
30-60 27 (52.94%) 56 (67.47%) 83 (61.94%)
>60 24 (47.06%) 25 (30.12%) 49 (36.57%)
Total 51 (100%) 83 (100%) 134 (100%)
Table 4.40 Neonates’ heartbeat at admission (N=123)
Vital signs Referred case Total X2 P-value
Heartbeat rate Yes No Total
<120 8 (17.39%) 7 (9.09%) 15 (12.20%)
7.67 0.02 120-160 29 (63.04%) 65 (84.42%) 94 (76.42%)
>160 9 (19.57%) 5 (6.49%) 14 (11.38%)
Total 46 (100%) 77 (100%) 123 (100%)
Regarding the neonates’ temperature, 60.38% (n=32) of referred cases and 59.30%
(n=51) of non-referred cases, had a temperature of <36.5; 22.64% (n=12) of referred
cases and 26.74% (n=23) of non-referred cases had a temperature of 36.5-37.5 and
16.98% (n=12) of referred cases and 13.95% (n=12) of non-referred cases had a
temperature of >37.5. Regarding respiratory rate, 0% (n=0) of referred cases and 2.41%
(n=2) of non-referred cases, had a respiratory rate of 30-60, and 47.06% (n=24) of
referred cases and 30.12% (n=25) had a respiratory rate of >60. Regarding heart rate,
17.39% (n=8) of referred cases and 9.09% (n=7) of non-referred cases had a Heartbeat
rate of <120, 63.04% (n=29) of referred cases and 84.42% (n=65) of non-referred
cases, had a Heartbeat rate of 120-160, and 19.57% (n=9) of referred cases and 6.49%
(n=5) had a Heartbeat rate of >160.
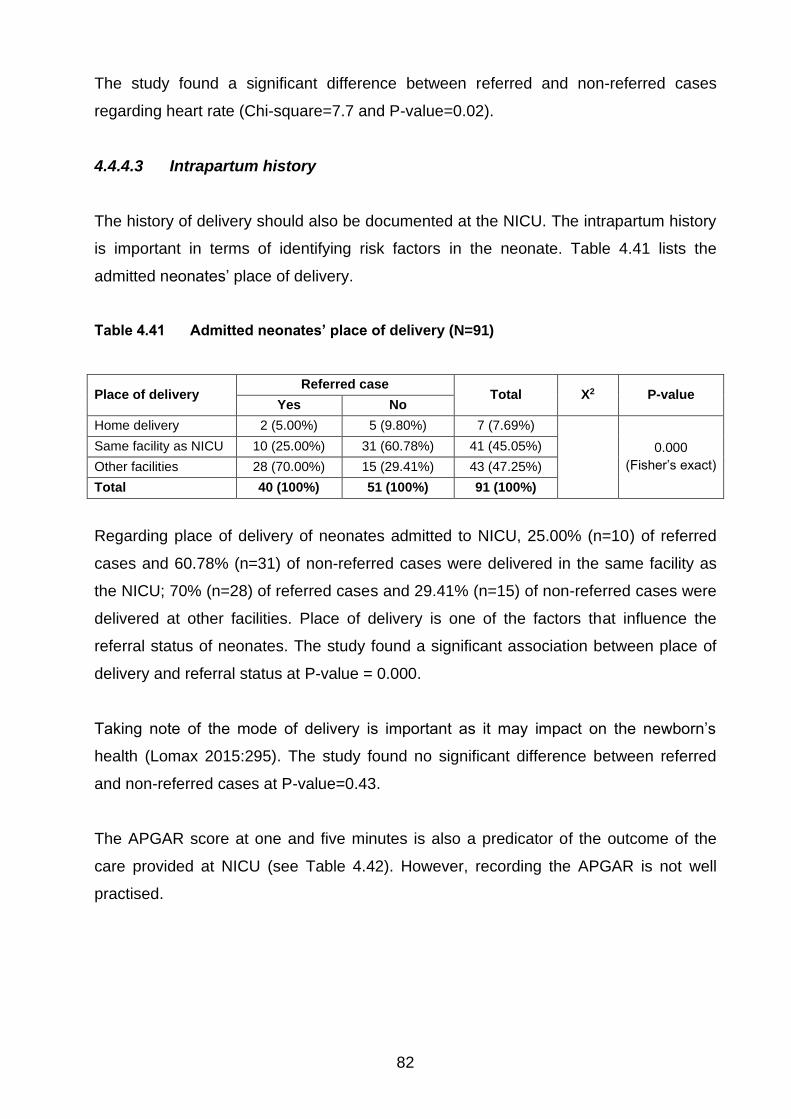
82
The study found a significant difference between referred and non-referred cases
regarding heart rate (Chi-square=7.7 and P-value=0.02).
4.4.4.3 Intrapartum history
The history of delivery should also be documented at the NICU. The intrapartum history
is important in terms of identifying risk factors in the neonate. Table 4.41 lists the
admitted neonates’ place of delivery.
Table 4.41 Admitted neonates’ place of delivery (N=91)
Place of delivery Referred case
Total X2 P-value Yes No
Home delivery 2 (5.00%) 5 (9.80%) 7 (7.69%)
0.000
(Fisher’s exact)
Same facility as NICU 10 (25.00%) 31 (60.78%) 41 (45.05%)
Other facilities 28 (70.00%) 15 (29.41%) 43 (47.25%)
Total 40 (100%) 51 (100%) 91 (100%)
Regarding place of delivery of neonates admitted to NICU, 25.00% (n=10) of referred
cases and 60.78% (n=31) of non-referred cases were delivered in the same facility as
the NICU; 70% (n=28) of referred cases and 29.41% (n=15) of non-referred cases were
delivered at other facilities. Place of delivery is one of the factors that influence the
referral status of neonates. The study found a significant association between place of
delivery and referral status at P-value = 0.000.
Taking note of the mode of delivery is important as it may impact on the newborn’s
health (Lomax 2015:295). The study found no significant difference between referred
and non-referred cases at P-value=0.43.
The APGAR score at one and five minutes is also a predicator of the outcome of the
care provided at NICU (see Table 4.42). However, recording the APGAR is not well
practised.

83
Table 4.42 Neonates’ APGAR score at one and five minutes after birth (N=58)
APGAR score Referred case Total X2 P-value
One minute Yes No
0-3 0 (0%) 1 (2.44%) 1 (1.72%)
0.71
(Fisher’s exact) 4-10 17 (100%) 40 (97.56%) 57 (98.28%)
Total 17 (100%) 41 (100%) 58 (100%)
Five minutes Yes No Total
0-6 1 (5.88%) 4 (9.76%) 5 (8.62%)
0.54
(Fisher’s exact) 7-10 16 (94.12%) 37 (90.24%) 53 (91.38%)
Total 17 (100%) 41 (100%) 58 (100%)
Regarding the APGAR score, 100% (n=17) of referred cases and 97.56% (n=40) of
non-referred cases, were recorded at 4-10 minutes; 94.12% (n=16) of referred cases
and 90.24% (n=37) of non-referred cases were recorded at 7-10 minutes.
The mother’s gestational age at delivery is an important indicator that should be
documented and reviewed for planning and management (see Table 4.43).
Table 4.43 Neonates’ gestational age (N=115)
Gestational age Referred case Total X2 P-value
Yes No
<37 weeks 8 (16.67%) 16 (23.88%) 24 (20.87%)
0.198
(Fisher’s Exact)
37-40 weeks 35 (72.92%) 49 (73.13%) 84 (73.04%)
>40 weeks 5 (10.42%) 2 (2.99%) 7 (6.09%)
Total 48 (100%) 67(100%) 115 (100%)
Regarding gestational age, 72.92% (n=35) of referred cases and 73.13% (n=49) of non-
referred cases were born at 37-40 weeks; 16.67% (n=8) of referred cases and 23.88%
(n=16) of non-referred cases were born at <37 weeks, and 10.42% (n=5) of referred
cases and 2.99% (n=2) of non-referred cases were born at >40 weeks. The study found
no significant difference between referred and non-referred cases at P-value= 0.198. In
their study in a rural NICU in Uganda, Hedstrom et al (2014:4) found that 36.5% of
admitted cases were preterm (gestational age <37 weeks).
The birth weight is another factor that can expose children to illnesses during the first
month of life and later. Table 4.44 presents the neonates’ birth weight.

84
Table 4.44 Neonates’ birth weight recorded (N=98)
Birth weight Referred case
Total X2 P-value Yes No
Very low birth weight 3 (9.09%) 1 (1.54%) 4 (4.08%)
0.279
(Fisher’s Exact)
Low birth weight 9 (27.27%) 20 (30.77%) 29 (29.59%)
Normal birth weight 19 (57.58%) 42 (64.62%) 61 (62.24%)
Big baby 2 (6.06%) 2 (3.08%) 4 (4.08%)
Total 21 (100%) 65 (100%) 98 (100%)
Regarding birth weight, 57.58% (n=19) of referred cases and 64.62% (n=42) of non-
referred cases had a normal birth weight; 27.27% (n=9) of referred cases and 30.77%
(n=20) of non-referred cases, had a low birth weight, and 9.09% (n=3) of referred cases
and 1.54% (n=1) of non-referred cases, had a very low birth weight. The study found no
significant difference between referred and non-referred cases at P-value=0.28.
In an assessment of neonatal care in clinical training facilities in Kenya, Aluvaala et al
(2015:44) found that 52% of cases had normal birth weight (2500-<4000 g), 49% of
cases were preterm babies (<37 weeks’ gestation) and most neonatal admissions
(66%) followed spontaneous vaginal delivery.
4.4.4.4 Main causes of newborn illness and admission to NICU
The common causes of newborn illness in Ethiopia include prematurity, infection and
asphyxia (FMOH 2015b:14). Table 4.36 presents the main causes of neonatal illness
and admission to NICU (see Table 4.45).
Table 4.45 Main causes of neonatal illness and reason for admission (N=272)
Main causes of illness and admission Referred case
Total Yes No
Sepsis 38 (40.00%) 62 (35.03%) 100 (36.76%)
Low birth weight 16 (16.84%) 30 (16.95%) 46 (16.91%)
Respiratory distress 9 (9.47%) 19 (10.73%) 28 (10.29%)
Perinatal asphyxia 9 (9.47%) 15 (8.47%) 24 (8.82%)
Congenital malformation 9 (9.47%) 18 (10.17%) 27 (9.93%)
Prematurity 7 (7.37%) 15 (8.47%) 22 (8.08%)
Other 7 (7.37%) 18 (10.17%) 25 (9.19%)
Total 95 (100%) 177 (100%) 272 (100%)

85
Regarding the main reasons for neonates’ admission to NICU, 40.00% (n=38) of the
referred cases and 35.03% (n=62) of non-referred cases, were admitted for sepsis;
16.84% (n=16) of referred cases and 16.95% (n=30) of non-referred cases, were
admitted for low birth weight, and 9.47% (n=9) of referred cases and 10.73% (n=19) of
non-referred cases, were admitted for respiratory distress.
In their study in Kenya, Aluvaala et al (2015:46) found that birth asphyxia,
prematurity/low birth weight and neonatal sepsis were the main reasons for admission
to NICU. Hedstrom et al (2014:4) found infection, prematurity, respiratory distress, and
asphyxia were the main reasons for admission in a rural Ugandan NICU.
4.4.4.5 Length of stay in NICU
The study examined the neonates’ length of stay in NICU. Most of the records indicated
the discharge date. Table 4.46 indicates the neonates’ length of stay in the NICU.
Table 4.46 Length of stay in NICU (N=114)
Length of stay in NICU Referred case
Total X2 P-value Yes No
Less than 2 days 4 (10.53%) 11 (14.47%) 15 (13.16%)
0.877
(Fisher’s Exact)
2-7 days 22 (57.89%) 41 (53.95%) 63 (55.26%)
Longer than 7 days 12 (31.58%) 24 (31.58%) 36 (31.58%)
Total 38 (100%) 76 (100%) 114 (100%)
Regarding length of stay in the NICU, 57.89% (n=22) of referred cases and 53.95%
(n=41) of non-referred cases remained in NICU for 2-7 days, and 31.58% (n=12) 0f non-
referred cases, remained longer than 7 days. The study found no significant difference
between length of stay and referral status at P-value = 0.877. The average length of
stay for all neonates was 6.7 days.
The study found that many records did not indicate discharge status. Presenting
findings based on a few records did not reflect the real situation and the variable was
dropped. Mortality rates in NICUs vary from country to country (Chow et al 2015:3;
Aluvaala et al 2015:45). In their study in a rural Ugandan NICU, Hedstrom et al (2014:6)
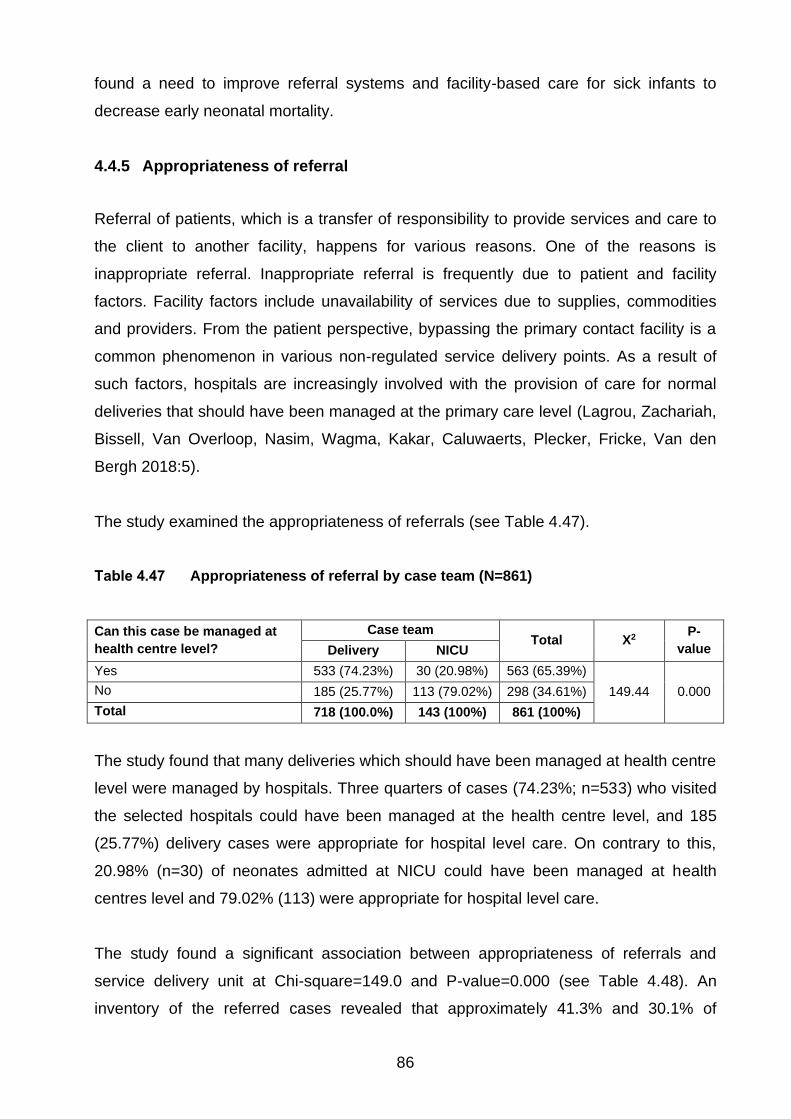
86
found a need to improve referral systems and facility-based care for sick infants to
decrease early neonatal mortality.
4.4.5 Appropriateness of referral
Referral of patients, which is a transfer of responsibility to provide services and care to
the client to another facility, happens for various reasons. One of the reasons is
inappropriate referral. Inappropriate referral is frequently due to patient and facility
factors. Facility factors include unavailability of services due to supplies, commodities
and providers. From the patient perspective, bypassing the primary contact facility is a
common phenomenon in various non-regulated service delivery points. As a result of
such factors, hospitals are increasingly involved with the provision of care for normal
deliveries that should have been managed at the primary care level (Lagrou, Zachariah,
Bissell, Van Overloop, Nasim, Wagma, Kakar, Caluwaerts, Plecker, Fricke, Van den
Bergh 2018:5).
The study examined the appropriateness of referrals (see Table 4.47).
Table 4.47 Appropriateness of referral by case team (N=861)
Can this case be managed at
health centre level?
Case team Total X2
P-
value Delivery NICU
Yes 533 (74.23%) 30 (20.98%) 563 (65.39%)
149.44 0.000 No 185 (25.77%) 113 (79.02%) 298 (34.61%)
Total 718 (100.0%) 143 (100%) 861 (100%)
The study found that many deliveries which should have been managed at health centre
level were managed by hospitals. Three quarters of cases (74.23%; n=533) who visited
the selected hospitals could have been managed at the health centre level, and 185
(25.77%) delivery cases were appropriate for hospital level care. On contrary to this,
20.98% (n=30) of neonates admitted at NICU could have been managed at health
centres level and 79.02% (113) were appropriate for hospital level care.
The study found a significant association between appropriateness of referrals and
service delivery unit at Chi-square=149.0 and P-value=0.000 (see Table 4.48). An
inventory of the referred cases revealed that approximately 41.3% and 30.1% of

87
referred and non-referred cases, respectively, were appropriate for hospital level care.
The difference between the two groups was found to be significant at X2=10.84 and p-
value=0.001.
Table 4.48 Appropriateness of referral by referral status (N=861)
Can case be managed at
health centre level?
Referred cases Total X2 P-value
Yes No
Yes 196 (58.68%) 367 (69.64%) 563 (65.39%)
10.84 0.001 No 138 (41.32%) 160 (30.36%) 298 (34.61%)
Total 334 (100%) 527 (100%) 861 (100%)
A study in Nigeria revealed that many patients bypassed primary health care facilities to
the next level and many cases from health centres were sent to hospitals
inappropriately (Koce, Randhawa & Ochieng 2019:2). Self-referral and underutilisation
of lower-level facilities, whether initiated by users or lower-level healthcare providers,
can result in congestion of hospitals, and poor quality of care and subsequent death of
mothers and neonates (Elmusharaf et al 2017:12-13).
4.4.6 Overview of main findings from the medical record review
A total of 869 medical records (83.5% mothers and 16.5% neonates) of patients who
visited the selected primary hospitals for care at delivery and neonatal intensive care
units were reviewed.
A total of 726 mothers visited the primary hospitals for delivery care. The mean age of
the mothers was 25.1 years old. The case review revealed that only 80% of patient
cards had a recorded GA. Of the reviewed cases, 37.61% were primigravida and
76.31% (n=438) were at 37-40 weeks.
Referral is the process of coordinated movement of health care seekers to reach a high-
level care within a short period of time (Biswas et al 2018:367). Unless referral is well
managed, it increases the workload and utilises substantial health care resources both
at the source of the referrals and the referral-level facilities (WHO 2018b: 58). Ensuring
emergency obstetric care services and quick referral during the perinatal period can
help reduce maternal deaths (Biswas et al 2018:367). The study found that of the
cases, 61.10% visited the hospital on their own without referrals and 38.9% were
referred.
88
Communication between the sending and receiving facility is an important component of
referral. Referral slips from the sending facility are part of the referral communication.
The study found that 63.5% of the reviewed records had referral slips. Of the referral
slips, 50.7% indicated the type of investigations done and 30.2% indicated the treatment
given at the sending facility.
The distance to reach health facilities is a critical factor for the outcome of any health
service. Consequently, transportation is an important determinant in the referral system.
In Ethiopia, the Ministry of Health provided several ambulances for primary health care
services. The study found that of the cases, 55.33% had travelled between 40 and 60
minutes to the hospital by ambulance; 20.41% travelled less than 20 minutes; 18.64%
travelled 20-40 minutes, and 5.62% travelled over 60 minutes to reach the hospital by
ambulance. The review indicated that 44.4% of referrals were accompanied by health
professionals.
The health professional’s decision is the starting point for referral. Health professionals
are responsible for identifying cases and the reasons that require referral. In this study,
31.63% of the mothers and 53.49% of the neonates referred had reasons for referral
recorded in the referral slip, and 68.37% of the mothers and 46.51% of the neonates did
not. The reasons for referral of the mothers were prolonged labour (48.21%);
haemorrhage (10.71%); PROM (8.93%); malpresentation (8.93%), and ‘other’
(unspecified) (23.22%). For the neonates, the reasons for referral were unable to
breathe/fast breathing (34.8%); failure to suck breast (26.09%); low birth weight
(21.74%), and ‘other’ (unspecified) (17.38%).
The attention given by the receiving facility to the referred cases can be demonstrated
by the completeness of care and follow-ups. The study examined whether the four
necessary vital signs were taken and/or recorded properly among the referred and non-
referred cases. The review indicated that in most referred and non-referred cases, the
mother’s temperature, pulse rate, blood pressure and gestational age were taken and
recorded. Regarding measuring the mothers for delivery care, there was no significant
difference between the referred and non-referred cases for gestational age and lie. For
presentation, however, there was a significant difference between the referred and non-
referred cases at X2=7.6 and P-value=0.006.
89
Labour monitoring using a partograph is one of the key processes for better labour
outcome. A partograph is a simple, low-cost monitoring tool for intrapartum care (WHO
2018a:50; Markos & Bogale 2015:2). Utilisation of a partograph is vital to guide health
workers to identify abnormal labour and to implement the appropriate management and
improve the quality of intrapartum care, maternal health and birth outcomes (Khan et al
2018:19). The WHO recommends consistent use of a partograph to reduce maternal
and neonatal mortality, especially in developing countries (Fujita et al 2015:191). The
study found that 84.73% of the referred cases and 71.33% of the non-referred cases
had the partograph attached to the record or patient’s card. There was a significant
difference between referred and non-referred cases at X2=16.84 and P-value=0.000.
The study analysed the practice of monitoring of vital signs and labour progress signs.
The time between the start of the partograph and delivery was calculated as length of
stay. The average length of stay for delivery care was 32 hours in the hospital. There
was no significant difference in mode of delivery between referred and non-referred
cases and the outcome. Regarding delivery, 64.80% of referred cases and 77.83% of
non-referred cases were SVD. Between 2011 and 2015, the caesarean section rate in
Ethiopia was 2% of live births (CSA [Ethiopia] & ICF 2016:138). Regarding maternal
status after delivery, 99.27% of the referred cases and 100% of the non-referred cases
were stable after delivery. Regarding newborn birth outcomes, 88.79% of the referred
cases and 93.55% of the non-referred cases were live births; 11.21% of the referred
cases and 6.45% of the non-referred cases were stillbirths.
Neonates requiring critical medical attention are usually admitted to the neonatal
intensive care unit (NICU) (Chow et al 2015:1). The three main complaints for which
newborns presented to the NICU were difficulty in breathing, failure to suck breast, and
fever. Regarding difficulty in breathing, 35.19% of referred cases and 28.09% of non-
referred cases, were admitted to NICU. Regarding failure to suck, 40.74% of referred
cases and 24.72% of non-referred cases were admitted to NICU. Regarding fever,
5.56% of referred cases and 16.85% of non-referred cases were admitted to NICU.
Regarding the neonates, 75.5% were less than two days old and 76.3% were born at
term. The median length of stay at NICU was 6.7 days and no significant difference was
observed between the referred and non-referred cases. The discharge status of the
neonate was poorly recorded, and therefore not included for analysis.
90
The APGAR score at one and five minutes is also a predicator of the outcome of the
care provided at NICU. However, recording the APGAR is not well practised. Regarding
the APGAR score, 100% of referred cases and 97.56% of non-referred cases, were
recorded at 4-10 minutes; 94.12% of referred cases and 90.24% of non-referred cases
were recorded at 7-10 minutes.
Regarding birth weight, 57.58% of referred cases and 64.62% of non-referred cases
had a normal birth weight; 27.27% of referred cases and 30.77% of non-referred cases,
had a low birth weight, and 9.09% of referred cases and 1.54% of non-referred cases,
had a very low birth weight. The study found no significant difference between referred
and non-referred cases at P-value=0.28.
The study found a significant association between appropriateness of referrals and
service delivery unit at Chi-square=149.0 and P-value=0.000. An inventory of the
referred cases revealed that approximately 41.3% and 30.1% of referred and non-
referred cases, respectively, were appropriate for hospital level care. The difference
between the two groups was found to be significant at X2=10.84 and p-value=0.001.
4.5 FINDINGS FROM HEALTH SERVICE COSTING
4.5.1 Description of facilities
The study examined the health service costing of the selected two primary hospitals and
six health centres that provide MNH care. The primary hospitals included in the medical
record review had 10 health centres under their catchment woredas. The facilities were
established to provide services to these catchment populations. On average, the
primary hospitals and health centres were expected to provide services to 100,000 and
25,000 people, respectively. The study found that the primary hospitals and health
centres provided services to 211,889 and 35,314 people, respectively.
4.5.1.1 Staffing
Primary hospitals and health centres should be staffed according to national and
regional standards. Based on these standards, Table 4.49 presents the average
availability of staff in the selected facilities.

91
Table 4.49 Staffing matrix by type of health facility
S. No Profession
Health Centre Primary Hospital
Standard
Average
filled
positions
% of
filled Standard
Average
filled
position
% of
filled
1 MD 1 0 0% 4 8.5 213%
2 HO 2 4 200% 2 9 450%
3 Nurse (BSc + Dip) 5 15 300% 25 46 184%
4 Midwives 3 3 100% 4 10 250%
5 Ophthalmic nurse 1 0 0% 1 0.5 50%
6 Psychiatric nurse 1 0 0% 1 0 0%
7 Laboratory
technician/technologist 2 2 100% 6 9 150%
8 Pharmacist/pharmacy
technician (druggist) 3 1 33% 6 7 117%
9 Environmental health 1 0.3 30% 1 1 100%
10 Health information 1 2 200% 1 2 200%
11 Cleaners 5 5 100% 15 20 133%
12 Reception/archive 6 8 133% 8 11 138%
13 Maintenance officer 1 0.5 50% 3 3 100%
14 Morgue attendant 1 0 0% 1 0 0%
15 Dental professional 2 0 0% 2 0 0%
16
Radiology
professional/
radiographer
1 0 0% 3 1.5 50%
17 Physiotherapist 1 0 0% 1 0 0%
18 Emergency surgical
officer NA NA NA 1 2 200%
19
BSc
Anaesthetist/nurse
anaesthetist
NA NA NA 2 1 50%
20
Medical equipment
maintenance
technician
NA NA NA 1 1 100%
21 Food and dietary NA NA NA 10 10 100%
22 Social workers NA NA NA 1 0 0%
23 Complaint handling
officer NA NA NA 1 0 0%
24 CEO NA NA NA 1 1 100%
Total 37 41 117% 101 144 143%
Table 4.49 presents the available staff type and number compared to the minimum
expected number of staff included in the regional health bureau’s standard. Beyond the
standard, however, if facilities need additional staff, the governing board of the facilities
can approve additional posts and number of staff. The table shows that in terms of the
standard there was a critical shortage of pharmacists, medical doctors, ophthalmic
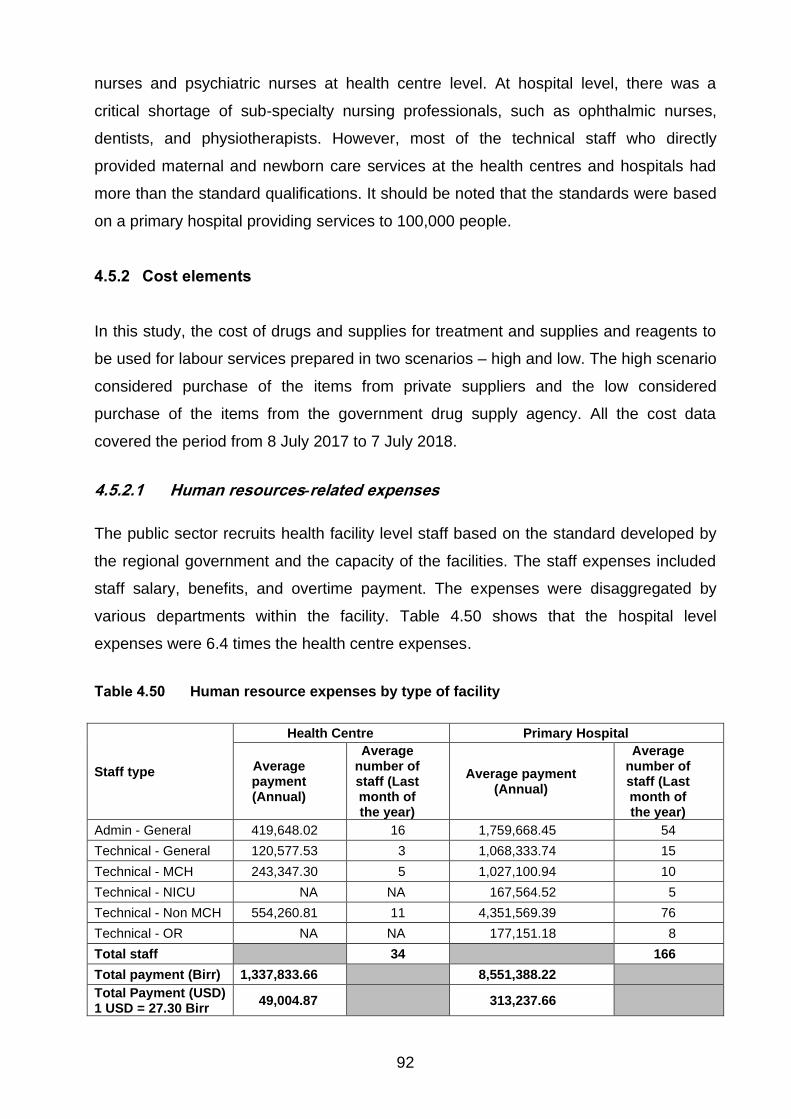
92
nurses and psychiatric nurses at health centre level. At hospital level, there was a
critical shortage of sub-specialty nursing professionals, such as ophthalmic nurses,
dentists, and physiotherapists. However, most of the technical staff who directly
provided maternal and newborn care services at the health centres and hospitals had
more than the standard qualifications. It should be noted that the standards were based
on a primary hospital providing services to 100,000 people.
4.5.2 Cost elements
In this study, the cost of drugs and supplies for treatment and supplies and reagents to
be used for labour services prepared in two scenarios – high and low. The high scenario
considered purchase of the items from private suppliers and the low considered
purchase of the items from the government drug supply agency. All the cost data
covered the period from 8 July 2017 to 7 July 2018.
4.5.2.1 Human resources-related expenses
The public sector recruits health facility level staff based on the standard developed by
the regional government and the capacity of the facilities. The staff expenses included
staff salary, benefits, and overtime payment. The expenses were disaggregated by
various departments within the facility. Table 4.50 shows that the hospital level
expenses were 6.4 times the health centre expenses.
Table 4.50 Human resource expenses by type of facility
Staff type
Health Centre Primary Hospital
Average payment (Annual)
Average number of staff (Last month of the year)
Average payment (Annual)
Average number of staff (Last month of the year)
Admin - General 419,648.02 16 1,759,668.45 54
Technical - General 120,577.53 3 1,068,333.74 15
Technical - MCH 243,347.30 5 1,027,100.94 10
Technical - NICU NA NA 167,564.52 5
Technical - Non MCH 554,260.81 11 4,351,569.39 76
Technical - OR NA NA 177,151.18 8
Total staff 34 166
Total payment (Birr) 1,337,833.66 8,551,388.22
Total Payment (USD) 1 USD = 27.30 Birr
49,004.87 313,237.66

93
4.5.2.2 Common administrative costs
The public finance management standard of the public system sets budget code for the
administration-related expenses. The expenditure reports of the selected facilities were
reviewed, and average expenditures analysed. Table 4.51 presents the administrative
costs for the selected facilities. The major expenses at facility level were vehicle running
and travel costs.
Table 4.51 Common administrative costs by type of facility
Type of expense Average annual expenditure at
Health Centre (Birr)
Average annual expenditure at
Primary Hospital (Birr)
Staff and office supplies
and furniture 9,050 (11.2%) 277,033 (52.5%)
Food and food items 5,417 (6.7%) 40,000 (7.6%)
Vehicle running costs 28,650 (11.2%) 103,900 (19.7%)
Travel 17,146 (35.6%) 27,000 (5.1%)
Contractual services 9,898 (12.3%) 45,142 (8.6%)
Utilities 10,428 (12.9%) 31,333 (5.9%)
Miscellaneous payments - 3,333 (0.6%)
Total (in Birr) 80,589 (100%) 527,742 (100%)
Total (in USD) 2,951.98 19,331.21
4.5.2.3 Direct clinical care costs
Direct clinical care costs include the average cost for medication, tests and supplies
used while providing the services to the cases visiting the various levels of health
facilities. The costs were estimated according to the proportion of cases utilising the
common drugs and supplies while receiving care and the costs were extracted from the
most recent goods receiving notes of the selected facilities.
4.5.2.3.1 Direct delivery and essential newborn care costs at health centre level
The direct service costs of providing BEmONC at health centres were estimated (see
Table 4.52). In addition, the total average expenditures at the health centre level were
estimated based on the unit cost and the average number of cases that visited the
health centres in the study period. The result showed that the costs ranged from 303–
376 birr per case which resulted in an annual average cost of 465,290–577,990 birrs.

94
Compared to the three cost drivers for this direct care costs, drugs contributed 67% of
the total cost.
Table 4.52 Delivery and essential newborn care at health centres
Inputs
Annual direct service costs
Drugs Supplies Labour tests Total
Low
estimate
High
estimate
Low
estimate
High
estimate
Low
estimate
High
estimate
Low
estimate
High
estimate
Average
unit cost
estimate
204 256 42 48 57 72 303 376
Average
number
of cases
(annual)
1,537 1,537 1,537 1,537 1,537 1,537 1,537 1,537
Total
annual
cost
estimate
(in Birr)
313,162 393,788 64,400 73,330 87,728 110,872 465,290 577,990
Total
annual
cost
estimate
(in USD)
11,471 14,424 2,359 2,686 3,213 4,061 17,044 21,172
4.5.2.3.2 Direct delivery and newborn care costs at primary hospital level
Primary hospitals provide services for mothers and newborns. As they are expected to
provide CEmONC services as well as routine delivery care, C-section and NICU
facilities should exist. Tables 4.53 to 4.55 present the costs for delivery care including
C-section and NICU services at primary hospital level. The total direct costs for delivery
care which include C-section and essential newborn care services, cost a hospital about
374 – 459 birr per visit. This, in turn, resulted in an average expenditure estimate of
1,097,185 –1,348,025 birr. The major cost driver for this type of care at hospital level
was drugs, which represented 53% of the expenditure.
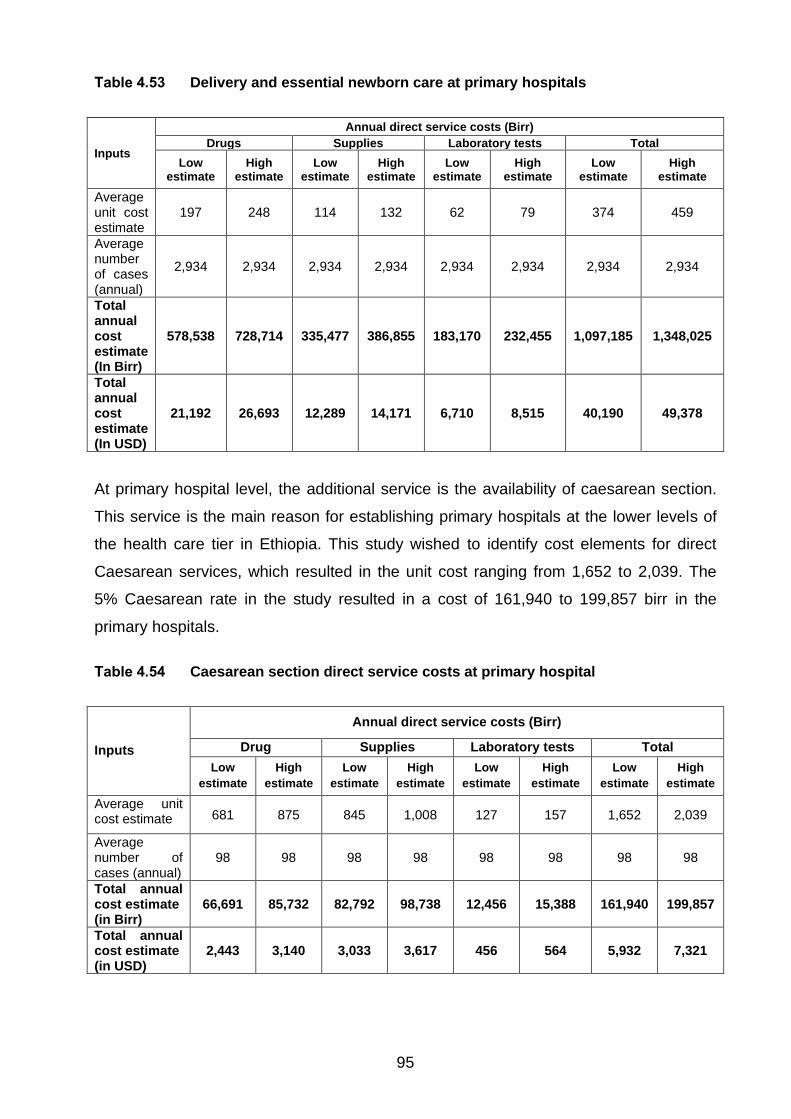
95
Table 4.53 Delivery and essential newborn care at primary hospitals
Inputs
Annual direct service costs (Birr)
Drugs Supplies Laboratory tests Total
Low estimate
High estimate
Low estimate
High estimate
Low estimate
High estimate
Low estimate
High estimate
Average unit cost estimate
197 248 114 132 62 79 374 459
Average number of cases (annual)
2,934 2,934 2,934 2,934 2,934 2,934 2,934 2,934
Total annual cost estimate (In Birr)
578,538 728,714 335,477 386,855 183,170 232,455 1,097,185 1,348,025
Total annual cost estimate (In USD)
21,192 26,693 12,289 14,171 6,710 8,515 40,190 49,378
At primary hospital level, the additional service is the availability of caesarean section.
This service is the main reason for establishing primary hospitals at the lower levels of
the health care tier in Ethiopia. This study wished to identify cost elements for direct
Caesarean services, which resulted in the unit cost ranging from 1,652 to 2,039. The
5% Caesarean rate in the study resulted in a cost of 161,940 to 199,857 birr in the
primary hospitals.
Table 4.54 Caesarean section direct service costs at primary hospital
Inputs
Annual direct service costs (Birr)
Drug Supplies Laboratory tests Total
Low
estimate
High
estimate
Low
estimate
High
estimate
Low
estimate
High
estimate
Low
estimate
High
estimate
Average unit cost estimate 681 875 845 1,008 127 157 1,652 2,039
Average number of cases (annual)
98 98 98 98 98 98 98 98
Total annual cost estimate (in Birr)
66,691 85,732 82,792 98,738 12,456 15,388 161,940 199,857
Total annual cost estimate (in USD)
2,443 3,140 3,033 3,617 456 564 5,932 7,321
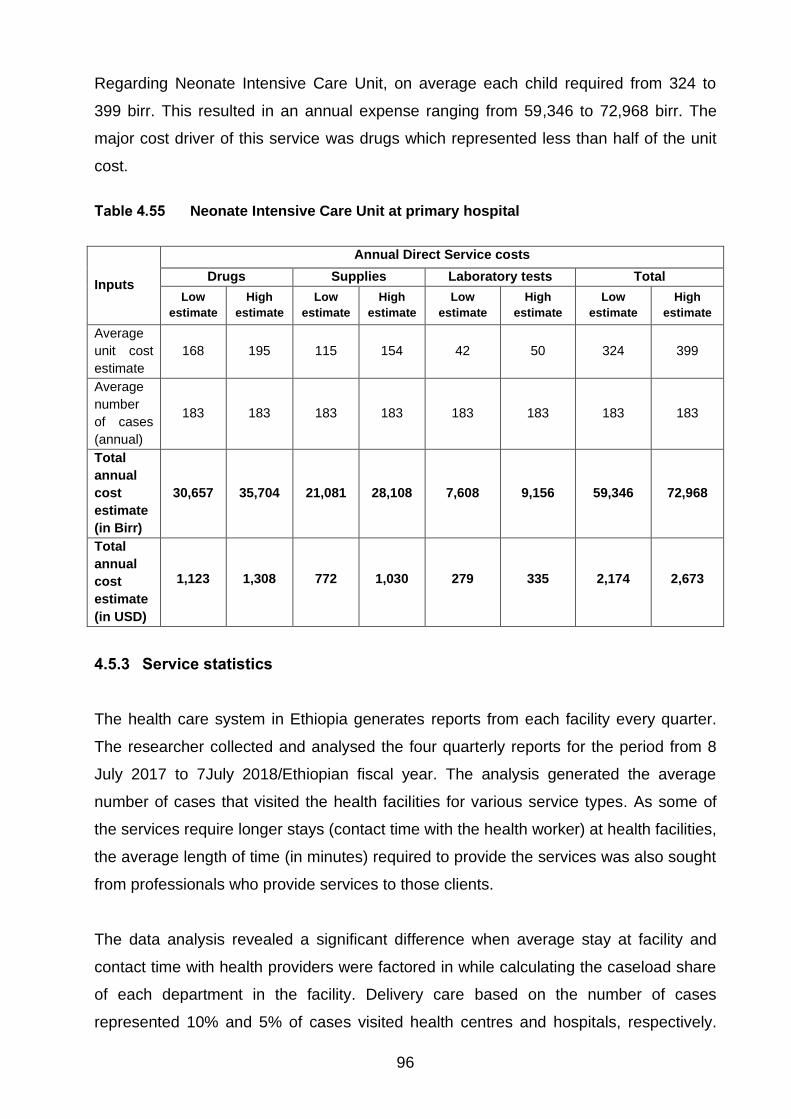
96
Regarding Neonate Intensive Care Unit, on average each child required from 324 to
399 birr. This resulted in an annual expense ranging from 59,346 to 72,968 birr. The
major cost driver of this service was drugs which represented less than half of the unit
cost.
Table 4.55 Neonate Intensive Care Unit at primary hospital
Inputs
Annual Direct Service costs
Drugs Supplies Laboratory tests Total
Low
estimate
High
estimate
Low
estimate
High
estimate
Low
estimate
High
estimate
Low
estimate
High
estimate
Average
unit cost
estimate
168 195 115 154 42 50 324 399
Average
number
of cases
(annual)
183 183 183 183 183 183 183 183
Total
annual
cost
estimate
(in Birr)
30,657 35,704 21,081 28,108 7,608 9,156 59,346 72,968
Total
annual
cost
estimate
(in USD)
1,123 1,308 772 1,030 279 335 2,174 2,673
4.5.3 Service statistics
The health care system in Ethiopia generates reports from each facility every quarter.
The researcher collected and analysed the four quarterly reports for the period from 8
July 2017 to 7July 2018/Ethiopian fiscal year. The analysis generated the average
number of cases that visited the health facilities for various service types. As some of
the services require longer stays (contact time with the health worker) at health facilities,
the average length of time (in minutes) required to provide the services was also sought
from professionals who provide services to those clients.
The data analysis revealed a significant difference when average stay at facility and
contact time with health providers were factored in while calculating the caseload share
of each department in the facility. Delivery care based on the number of cases
represented 10% and 5% of cases visited health centres and hospitals, respectively.
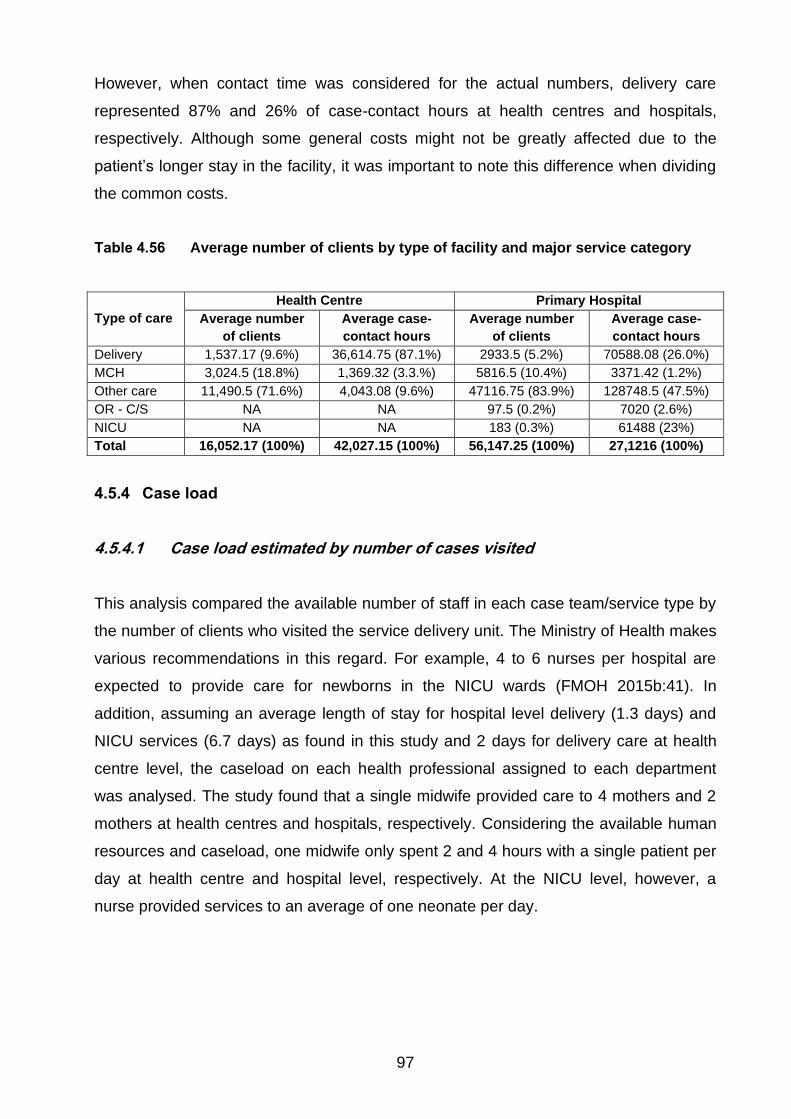
97
However, when contact time was considered for the actual numbers, delivery care
represented 87% and 26% of case-contact hours at health centres and hospitals,
respectively. Although some general costs might not be greatly affected due to the
patient’s longer stay in the facility, it was important to note this difference when dividing
the common costs.
Table 4.56 Average number of clients by type of facility and major service category
Type of care
Health Centre Primary Hospital
Average number
of clients
Average case-
contact hours
Average number
of clients
Average case-
contact hours
Delivery 1,537.17 (9.6%) 36,614.75 (87.1%) 2933.5 (5.2%) 70588.08 (26.0%)
MCH 3,024.5 (18.8%) 1,369.32 (3.3.%) 5816.5 (10.4%) 3371.42 (1.2%)
Other care 11,490.5 (71.6%) 4,043.08 (9.6%) 47116.75 (83.9%) 128748.5 (47.5%)
OR - C/S NA NA 97.5 (0.2%) 7020 (2.6%)
NICU NA NA 183 (0.3%) 61488 (23%)
Total 16,052.17 (100%) 42,027.15 (100%) 56,147.25 (100%) 27,1216 (100%)
4.5.4 Case load
4.5.4.1 Case load estimated by number of cases visited
This analysis compared the available number of staff in each case team/service type by
the number of clients who visited the service delivery unit. The Ministry of Health makes
various recommendations in this regard. For example, 4 to 6 nurses per hospital are
expected to provide care for newborns in the NICU wards (FMOH 2015b:41). In
addition, assuming an average length of stay for hospital level delivery (1.3 days) and
NICU services (6.7 days) as found in this study and 2 days for delivery care at health
centre level, the caseload on each health professional assigned to each department
was analysed. The study found that a single midwife provided care to 4 mothers and 2
mothers at health centres and hospitals, respectively. Considering the available human
resources and caseload, one midwife only spent 2 and 4 hours with a single patient per
day at health centre and hospital level, respectively. At the NICU level, however, a
nurse provided services to an average of one neonate per day.

98
Table 4.57 Patient caseload at various health care units of health centres and
hospitals
Type professional in the
service delivery unit
Health Centre Primary Hospital
Number of
professionals
Number of
cases per
professional
per day
Number of
professionals
Number of
cases per
professional
per day
Technical - MCH
GP 0 1 1:6.7
Midwife 2 1:4.2 8 1:.8
Nurse 3 1:2.8 2 1:1.6
Technical - NICU
Health officer NA NA 1 1:3
Nurse NA NA 5 1:0.6
4.5.4.2 Caseload estimated by expected care packages
Inputs for the caseload analysis were sought by identifying the major care steps,
prevalence of cases, and the average length time needed to provide for each care.
Based on these assumptions, the study identified the length of time needed for each
case. Then the researcher identified the expected number of professionals required to
provide the services.
Apart from providers’ skills and infrastructure, provision of quality care depends on the
length of time spent on a single patient. Based on the recommended time for each
delivery and essential newborn care step, the study found that at health centre level a
total of 4 health officers/general practitioners (GPs), 13 midwives/nurses and 2
laboratory technicians were required to deliver quality care. At the primary hospital level,
the study showed the need for 6 health officers/GPs, 24 midwives/nurses, 6 laboratory
technicians, 1 anaesthetist and 3 surgical officers. ICU-trained nurses are less readily
available in resource-limited regions (Tripathi, Kaur et al 2015:3), but four nurses are
required to provide the required services at the NICU of primary hospitals.
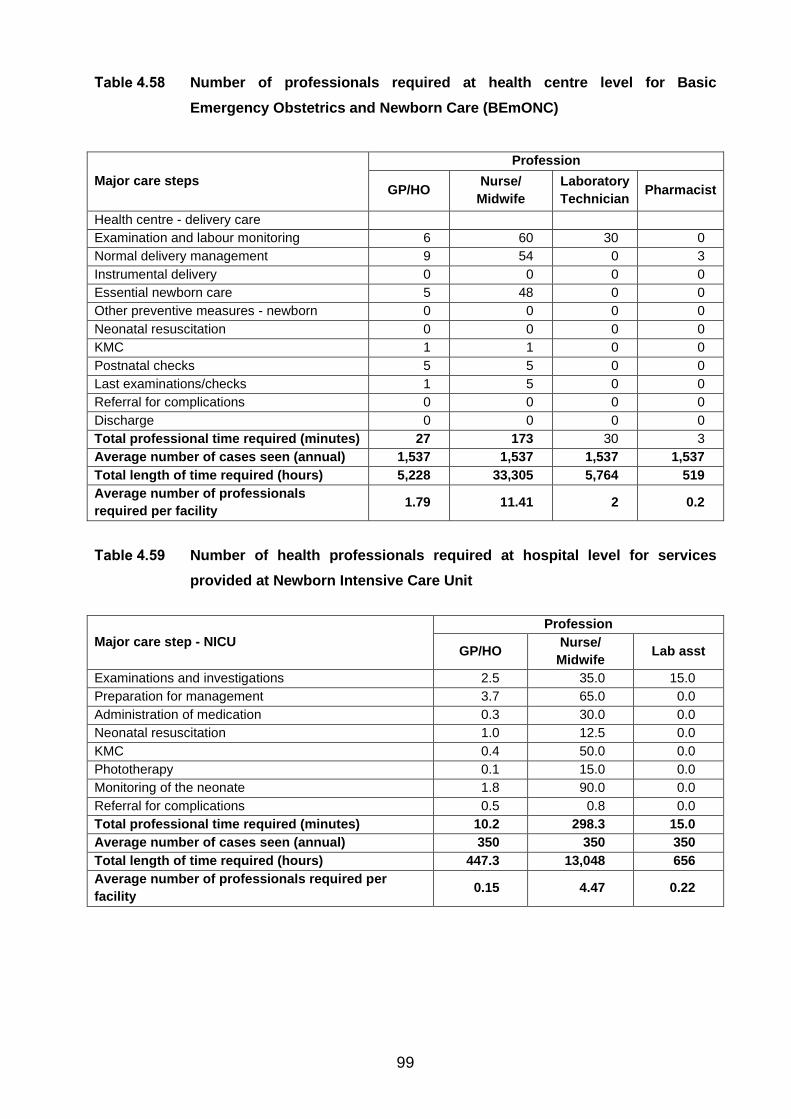
99
Table 4.58 Number of professionals required at health centre level for Basic
Emergency Obstetrics and Newborn Care (BEmONC)
Major care steps
Profession
GP/HO Nurse/
Midwife
Laboratory
Technician Pharmacist
Health centre - delivery care
Examination and labour monitoring 6 60 30 0
Normal delivery management 9 54 0 3
Instrumental delivery 0 0 0 0
Essential newborn care 5 48 0 0
Other preventive measures - newborn 0 0 0 0
Neonatal resuscitation 0 0 0 0
KMC 1 1 0 0
Postnatal checks 5 5 0 0
Last examinations/checks 1 5 0 0
Referral for complications 0 0 0 0
Discharge 0 0 0 0
Total professional time required (minutes) 27 173 30 3
Average number of cases seen (annual) 1,537 1,537 1,537 1,537
Total length of time required (hours) 5,228 33,305 5,764 519
Average number of professionals
required per facility 1.79 11.41 2 0.2
Table 4.59 Number of health professionals required at hospital level for services
provided at Newborn Intensive Care Unit
Major care step - NICU
Profession
GP/HO Nurse/
Midwife Lab asst
Examinations and investigations 2.5 35.0 15.0
Preparation for management 3.7 65.0 0.0
Administration of medication 0.3 30.0 0.0
Neonatal resuscitation 1.0 12.5 0.0
KMC 0.4 50.0 0.0
Phototherapy 0.1 15.0 0.0
Monitoring of the neonate 1.8 90.0 0.0
Referral for complications 0.5 0.8 0.0
Total professional time required (minutes) 10.2 298.3 15.0
Average number of cases seen (annual) 350 350 350
Total length of time required (hours) 447.3 13,048 656
Average number of professionals required per
facility 0.15 4.47 0.22
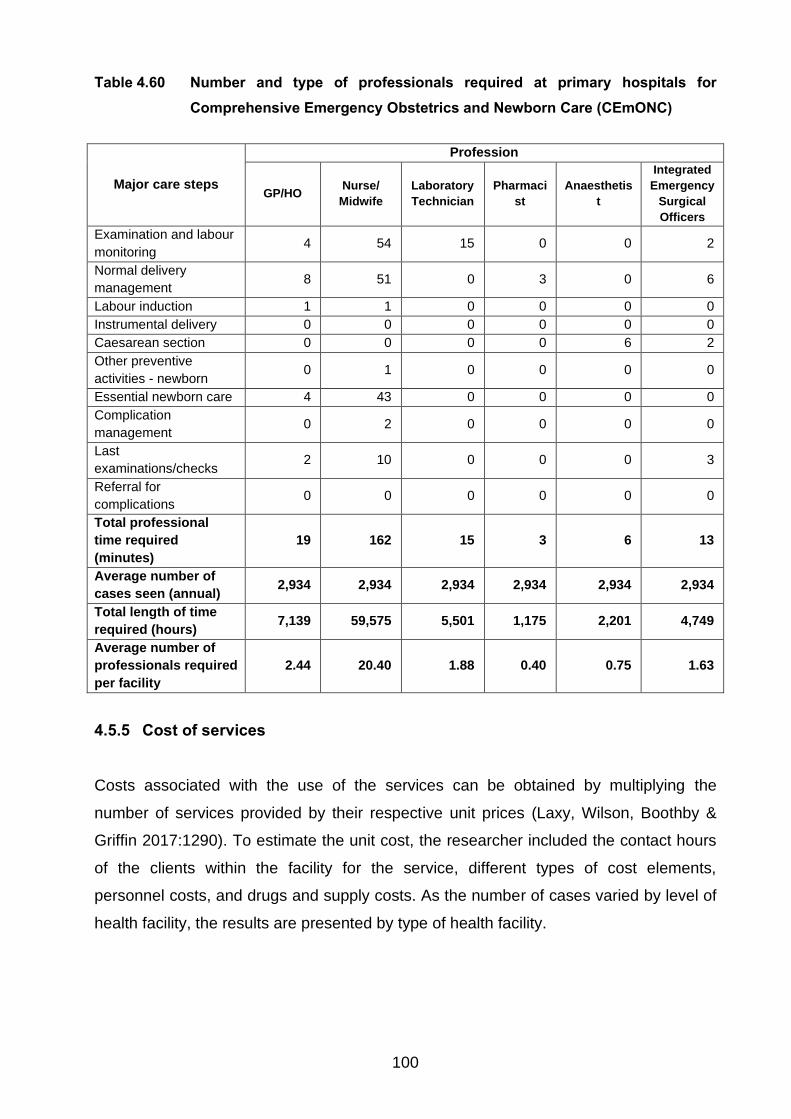
100
Table 4.60 Number and type of professionals required at primary hospitals for
Comprehensive Emergency Obstetrics and Newborn Care (CEmONC)
Major care steps
Profession
GP/HO Nurse/
Midwife
Laboratory
Technician
Pharmaci
st
Anaesthetis
t
Integrated
Emergency
Surgical
Officers
Examination and labour
monitoring 4 54 15 0 0 2
Normal delivery
management 8 51 0 3 0 6
Labour induction 1 1 0 0 0 0
Instrumental delivery 0 0 0 0 0 0
Caesarean section 0 0 0 0 6 2
Other preventive
activities - newborn 0 1 0 0 0 0
Essential newborn care 4 43 0 0 0 0
Complication
management 0 2 0 0 0 0
Last
examinations/checks 2 10 0 0 0 3
Referral for
complications 0 0 0 0 0 0
Total professional
time required
(minutes)
19 162 15 3 6 13
Average number of
cases seen (annual) 2,934 2,934 2,934 2,934 2,934 2,934
Total length of time
required (hours) 7,139 59,575 5,501 1,175 2,201 4,749
Average number of
professionals required
per facility
2.44 20.40 1.88 0.40 0.75 1.63
4.5.5 Cost of services
Costs associated with the use of the services can be obtained by multiplying the
number of services provided by their respective unit prices (Laxy, Wilson, Boothby &
Griffin 2017:1290). To estimate the unit cost, the researcher included the contact hours
of the clients within the facility for the service, different types of cost elements,
personnel costs, and drugs and supply costs. As the number of cases varied by level of
health facility, the results are presented by type of health facility.
101
4.5.5.1 Health centre level
The study extracted the total number of deliveries at health centre level and multiplied it
by the average unit cost to generate the expenditure of the health system to provide the
MNH care at the health centre level. Based on the analysis of the collected data,
delivery care and essential newborn care at health centre for one case cost from birr
752 ($27.5) to 825 ($30.2). A study in Rwanda reported $84.61 for services at
BEmONC facilities (Hatcher, Shaikh, Fazli, Zaidi & Riaz 2014:4).
Table 4.61 Delivery and essential newborn care costs at health centre level
Cost
drivers
Inputs - Health Centre Annual costs Cost per case
Numbe
r of
cases
Proportio
n
Case-
contacts
(in
hours)
Proportio
n Minimum Maximum Minimum Maximum
Direct
technica
l costs
1,537 100% 36,615 100% 708,637 821,338 461 534
General
admin
costs
1,537 9.6% 36,615 87.1% 500,237 500,237 283 283
General
technica
l costs
1,537 9.6% 36,615 87.1% 120,578 120,578 8 8
Total
(In Birr) 1,329,452 1,442,153 752 825
Total
(In
USD)
48,697.9 52,826.1 27.5 30.2
4.5.5.2 Primary hospital level
The total number of deliveries at primary hospital level was multiplied by the average
unit cost to provide MNH care. The result showed that delivery and essential newborn
care service at primary hospital costs from birr 946 ($34.7) to 1031 ($37.8). A single
Caesarean service at the primary hospital costs birr 4,089 ($149.8) to 4,476 ($164.0).
The WHO (2018a:58) reported that caesarean sections at hospitals in low-income
countries cost (US$ 162) which is four times higher than vaginal childbirth costs
(US$ 40). In this study, the estimated service costs were equivalent to the WHO
estimate.
102
Table 4.62 Cost of delivery and essential newborn care costs at primary hospital level
Cost drivers
Inputs - Primary Hospital Annual costs Cost per case
Number
of
cases
Propor-
tion
Case-
contacts
(in hours)
Proportion Minimum Maximum Mini-
mum
Maxi-
mum
Direct
technical costs
2,934 100% 70,588 100% 2,124,286 2,375,126 724 810
General admin
costs
2,934 5.2% 70,588 26.0% 2,287,410 2,287,410 203 203
General
technical costs
2,934 5.2% 70,588 26.0% 1,068,334 1,068,334 19 19
Total (in Birr) 5,480,030 5,730,870 946 1,031
Total (in USD) 200,733.7 209,922.0 34.7 37.8
Table 4.63 Cost of caesarean section at primary hospital level
Cost drivers
Inputs - Primary Hospital Annual costs Cost per case
Number
of
cases
Propor
-tion
Case-
contacts
(in
hours)
Proportion Minimum Maximum Mini-
mum
Maxi-
mum
Direct technical
costs
98 100% 7,020 100% 339,091 377,009 3,460 3,847
General admin
costs
98 0.2% 7,020 3% 2,287,410 2,287,410 607 607
General
technical costs
98 0.2% 7,020 3% 1,068,334 1,068,334 22 22
Total (in Birr) 3,694,835 3,732,753 4,089 4,476
Total (in USD) 135,341.9 136,730.9 149.8 164.0
Critical care is expensive in high- and low-income countries. Despite the cost, a short
duration of critical care to treat acute, life-threatening, and curable illnesses has a great
impact on mortality (Turner, Nielsen, Jamal, Von Saint André-von Arnim & Musa
2016:5). This study estimated the average unit cost from birr 4132 ($151.4) to 4207
($154.1).
103
Table 4.64 Cost of newborn intensive care unit costs at primary hospital level
Cost drivers
Inputs - Primary Hospital Annual cost Cost per case
Number
of cases
Propor-
tion
Case-
contacts
(in
hours)
Propor
-tion Minimum Maximum
Mini-
mum
Maxi-
mum
Direct technical
costs
183 100% 61,488 100% 226,911 240,532 1,240 1,314
General admin
costs
183 0.3% 61,488 23% 2,287,410 2,287,410 2,875 2,875
General technical
costs
183 0.3% 61,488 23% 1,068,334 1,068,334 18 18
Total (in Birr) 3,582,655 3,596,276 4,132 4,207
Total (in USD) 31,232.8 31,731.7 151.4 154.1
4.5.6 Overview of findings from health service costing
Two primary hospitals and six health centres were included in this health service costing
exercise. The study found that the selected facilities provided more than the expected
norm. On average, the health centres provided services to 35,314 people and the
primary hospitals provided care to 211,889 people. The findings show that the number
of health professionals assigned to the Delivery and NICU rooms were more than the
standard. Since the size of the catchment populations for the hospitals was more than
double the standard, the number of professionals should also have matched this. The
researcher is of the opinion that this mismatch may have contributed to a reduction of
quality of care. The critical shortage of pharmacists and technical staff may have
influenced forecasting needs and the timely request of drugs and supplies. This, in turn,
may have increased the referrals due shortages of drugs.
The human resources-related expenses in the health sector included staff salaries,
benefits and overtime/duty payments. A comparison of the expenses indicated that
hospital expenditure was 6.4 times higher than health centre expenditure. Similarly, the
hospitals’ administration costs were 6.5 times higher than those of the health centres.
Regarding the direct clinical care costs, three cost drivers: drugs, supplies and
laboratory tests were considered. The cost drivers varied according to health facility
type.
104
The service statistics/number of visits was an important factor in dividing general costs
among various departments. However, some types of care required longer stays at the
facility level and thus the effect of contact-hours/stay had to be considered in the
analysis. The proportion of delivery care, for instance, was influenced by this factor. At
health centre level, the number of cases that visited the facility accounted for 10% of
cases. However, the contact for each visit accounted for 87% of cases. As the use of
general administration costs depended on the length of stay or contact, use of the
contact-case load was an important consideration.
Health providers’ caseload was analysed in two ways: number of visits and length of
stay and expected care steps for quality care. The former analysis considered the
already available human resources in the facilities and number of cases and showed
that one midwife spent an average of 2 and 4 hours on a single patient per day at health
centre and primary hospital level, respectively. The second analysis based on the length
of time required to spend on a single patient revealed that one midwife should spend
3.2 and 3.3 hours at health centre and primary hospital level, respectively. This analysis
showed that a midwife had nearly half the time required to provide quality delivery care
to a single case at health centre level. Based on this analysis, the workload was greater
at health centres than hospitals.
This study found that delivery care at health centre level cost from $27.5 to $30.2
dollars and at hospital level from $34.7 to $37.8; Caesarean section service at primary
hospitals costs $149.8 to $164.0, and NICU care cost from $151.4 to $154.1.
4.6 CONCLUSION
This chapter presented the results from the first phase of the study. The results covered
findings from 869 medical record review and health service costing from 8 facilities (two
primary hospitals and six health centres). This chapter described the major findings in
relation to the characteristics and their experience of mothers and new-borns visited the
hospitals from July 08, 2017 to July 07, 2018. For the same period, costs incurred by
the health facilities, both at the health centres and primary hospital levels, to provide
maternal and new-born related cares were included.
Chapter 5 presents the qualitative data analysis from phase 2 of the study.
105
CHAPTER 5
QUALITATIVE DATA ANALYSIS AND INTERPRETATION, AND
FINDINGS
5.1 INTRODUCTION
Chapter 4 discussed the quantitative data analysis and findings from phase 1 of the
study. This chapter discusses the qualitative data analysis and findings from phase 2.
The purpose of the study was to formulate strategies to improve maternal and newborn
health care referrals in the health system in Ethiopia. The quantitative phase examined
the procedures and reasons for maternal and newborn care referrals and proportion of
inappropriate referrals and estimated the cost of maternal and newborn care-related
services at the various levels of the health system. The aim of the qualitative phase was
to analyse the effects of current referral practices and develop key strategies to improve
referrals in the health system.
The researcher visited the sites to explain the purpose, methods and period of the study
to the heads and managers of the facilities and the participants. This allowed the
researcher to meet the participants, explain the purpose of the study and allow them to
ask questions (Yin 2016:159). The researcher became familiar with the facilities and
was able to make allowance for potential unforeseen circumstances.
5.2 DATA COLLECTION
Data collection is the process of collecting information (data) related to research
questions in a systematic way to address a research problem (Polit & Beck 2017:725).
Qualitative research investigates phenomena, typically in an in-depth and holistic
fashion, by collecting rich narrative materials using a flexible research design (Polit &
Beck 2017:739). In qualitative studies, researchers explore and describe individuals’
and groups’ life experiences and situations and the meaning they ascribe to social
problems (Creswell & Creswell 2018:147; Merriam & Tisdell 2016:24). Qualitative
106
studies examine participants’ knowledge and practices and consider their perceptions
and practices in the field.
In phase 2, the researcher collected qualitative data from the participants by means of
key informant interviews (Leavy 2017:135; Yin 2016:169). The researcher used
purposive sampling to select health workers working in the MCH department who
provided MNH-related care at the selected hospitals and health centres. The researcher
obtained staff lists at the selected sites and purposively selected the participants from
the lists. Purposive sampling was used to select participants who could provide
information-rich data (Merriam & Tisdell 2016:96; Saks & Allsop 2013:173). The
participants were service providers at delivery rooms and NICU and people involved in
the referral processes.
The researcher developed a semi-structured interview guide (questionnaire) based on
the Donabedian and referral chain models and the literature review (Creswell &
Creswell 2018:191; Merriam & Tisdell 2016:106; Taylor 2017:551). The instrument
consisted of closed and open-ended questions and allowed the researcher to use
probing questions when necessary (Yin 2016:178; Merriam & Tisdell 2016:106). The
interview guide covered the respondents’ demographic information and work
experience; competency of the workforce; prevalence of severe and complicated cases;
adequacy of supplies and equipment; referrals; communication; emergency medical
transportation, and service. The researcher collected data until saturation was reached.
Data saturation was reached after 26 interviews, when no new data emerged. The
interviews were conducted in Amharic and were tape-recorded with the participants’
permission.
5.3 DATA ANALYSIS
Flick (cited in Merriam & Tisdell 2016:589) describes the process of data analysis as the
"classification and interpretation of linguistic (or visual) material to make statements
about implicit and explicit dimensions and structures of meaning-making in the material
and what is represented in it". Qualitative research is interpretative and involves
researchers in a close relationship with the participants (Creswell & Creswell 2018:183).
Qualitative data analysis commences with data collection and involves specific to
general steps (Merriam & Tisdell 2016:197; Creswell & Creswell 2018:193). The

107
researcher organised and prepared the data. First, the researcher transcribed the
interviews verbatim and compared the transcriptions with the recordings. The
researcher read all the transcriptions carefully to get an overall picture and jotted down
ideas as they came to mind in order to develop codes (Creswell & Creswell 2018:196).
Coding is a process of organising data by bracketing chunks and writing a word
representing a category in the margin. It requires breaking sentences into segments and
labelling them using participants’ actual language (Tracy 2013:189).
The researcher identified topics and themes that emerged from the data in the
transcriptions. Topics that related to each other were grouped together and themes
identified. The researcher wrote topics next to appropriate segments of text, checking to
see whether new themes emerged. The topics were turned into categories by finding
descriptive wording, final abbreviations for categories, and arranging them
alphabetically. Codes were formulated for each theme developed. The researcher used
the computer software program ATLAS ti to code the data (Tracy 2013:188).
The researcher used inductive and deductive data analysis techniques for the
qualitative data analysis. A bottom-up approach was used to build patterns, categories
and themes to organise abstract units of information (Creswell & Creswell 2018:181).
5.4 FINDINGS
The findings are discussed according to the themes that emerged from the data.
5.4.1 Respondents’ gender and qualification
Of the respondents, 61.54% (n=16) were male and 38.46% (n=10) were female. Of the
respondents, 46% (n=12) had a BSc degree; 38.46% (n=10) had a Diploma in Nursing;
7.69% (n=2) had an MSc degree, and 7.69% (n=2 had a certificate in short health
related trainings (see Table 5.1). The mean number of months in their current position
was 31.2 months.
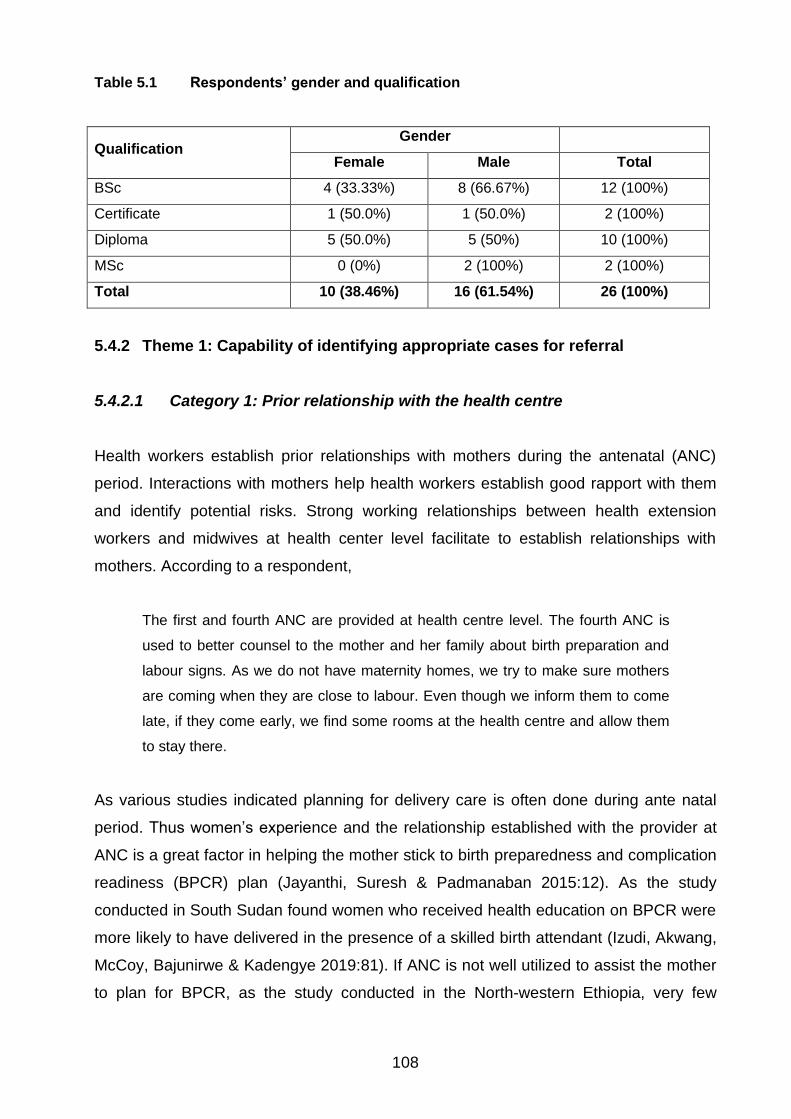
108
Table 5.1 Respondents’ gender and qualification
Qualification Gender
Female Male Total
BSc 4 (33.33%) 8 (66.67%) 12 (100%)
Certificate 1 (50.0%) 1 (50.0%) 2 (100%)
Diploma 5 (50.0%) 5 (50%) 10 (100%)
MSc 0 (0%) 2 (100%) 2 (100%)
Total 10 (38.46%) 16 (61.54%) 26 (100%)
5.4.2 Theme 1: Capability of identifying appropriate cases for referral
5.4.2.1 Category 1: Prior relationship with the health centre
Health workers establish prior relationships with mothers during the antenatal (ANC)
period. Interactions with mothers help health workers establish good rapport with them
and identify potential risks. Strong working relationships between health extension
workers and midwives at health center level facilitate to establish relationships with
mothers. According to a respondent,
The first and fourth ANC are provided at health centre level. The fourth ANC is
used to better counsel to the mother and her family about birth preparation and
labour signs. As we do not have maternity homes, we try to make sure mothers
are coming when they are close to labour. Even though we inform them to come
late, if they come early, we find some rooms at the health centre and allow them
to stay there.
As various studies indicated planning for delivery care is often done during ante natal
period. Thus women’s experience and the relationship established with the provider at
ANC is a great factor in helping the mother stick to birth preparedness and complication
readiness (BPCR) plan (Jayanthi, Suresh & Padmanaban 2015:12). As the study
conducted in South Sudan found women who received health education on BPCR were
more likely to have delivered in the presence of a skilled birth attendant (Izudi, Akwang,
McCoy, Bajunirwe & Kadengye 2019:81). If ANC is not well utilized to assist the mother
to plan for BPCR, as the study conducted in the North-western Ethiopia, very few
109
(24.1%) of ANC clients prepared for birth and ready for any complication (Bitew, Awoke
& Chekol 2016: 3).
5.4.2.2 Category 2: High caseload at health centre level
The health centres provide services to a designated catchment population of
approximately 25,000. Most of the visited facilities provided services to the wider
catchment population, and an increasing number of clients for institution-based care for
various reasons. The number of health workers providing the services did not match the
increasing visits to the health centres and some health workers were not available due
to meetings and training. According to a respondent,
The caseload is not as our plan. People are coming from neighbouring kebeles
and woredas. The plan is to provide services for 20 mothers per week, but we
may have more than 20 and sometimes up to 40. When there is no case, we at
least have some teens.
High caseloads compromise quality of time and care. A study in Tanzania found that a
single midwife attended to childbirth assistance (11%), recording (35%), explanation
(20%) and direct care (19%). The time allocation for monitoring labour accounted for
15%, including FHR monitoring at 2%, vaginal examination at 2%, abdominal palpation
at 3%, and measurement of mother's vital signs at 8% (Fujita et al 2015:194). Shortage
of staff and inadequate skill mix often result in delayed care if not denial of care
(Bhattacharyya et al 2015:431).
5.4.2.3 Category 3: Competent health workforce
The respondents stressed that health workers’ competence is related to their skills.
According to the respondents, short-term BEmONC in-service training, weekly peer
mentorship and team consultations were available but limited to one staff member
assigned to health centres and regular updates were not available. The respondents
emphasised the need for improvement after training. According to a respondent,

110
I think we are sending the appropriate cases now. For example, when we
compare it to the last year’s performance, there are lots of improvements. There
were lots of referrals, but now when the health workers get experience and some
of them are trained in BEmONC, they are now easily diagnose and refer
appropriate cases.
The lack of skills was also linked to wrong diagnosis for referral, complications such as
referred hypothermia in newborn cases, lack of clarity in referral slips, limited pre-
referral management and delays in referral. The respondents underlined that not having
required skills undermined providers’ confidence and increased inappropriate care
practices. One respondent stated,
The person who is referring may not be capable of diagnosing and writing referral
slips. In some of the health centres, where they have GPs, it is better. In other
facilities, you may find wrong information in the referral slip.
The availability of technically competent health providers was identified as one of the
factors for seeking institutional delivery (Mahato, Teijlingen, Simkhada & Angell
2017:40). There is a need to strengthen midwifery education, practice and skills in
Ethiopia by means of in-service training (Austin, Gulema, Belizan, Colaci, Kndall,
Tebeka, Hailemariam, Bekele, Tadesse, Berhane & Langer 2015:5; Yigzaw, Carr,
Stekelenburg, Van Roosmalen, Gibson, Gelagay & Admassu 2016:181). In low- and
middle-income countries, women’s perceptions of health providers’ competence at
BEmONC facilities also determined their choice of facility for care (Mahato et al
2017:59).
5.4.2.4 Category 4: Prevalence of severe and complicated cases
Severe and complicated cases requiring advanced care should be sent to hospitals
where operative care and intensive care units are available. According to the
respondents, the common problems for referral among mothers included prolonged
labour, malpresentation, pre-eclampsia/eclampsia, bleeding, prolonged PROM, and
non-reassuring foetal heartbeat. Regarding neonates, the most common clinical
reasons were hypothermia, unable to suck breast, asphyxia, and very low birth weight.
The respondents frequently doubted diagnoses related to prolonged labour, non-

111
reassuring foetal heartbeat and hypothermia. According to the respondents,
misdiagnosis or mismanagement at the initial stage of newborn’s life usually caused
these diagnoses.
Some of the cases sent were without any problem. That is the burden to the
family. Some of the cases may be sent as prolonged labour, but they may still be
at the latent phase. In addition, those family members give us trouble as they
were sent as if they have a problem.
A study in Northern India identified the most common clinical indications for referral as
preterm labour (30.6%), pregnancy-induced hypertension (17%), foetal distress
(10.6%), previous caesarean section (10%), malpresentation (8.5%), and non-progress
of labour (8%) and severe anaemia (5.08%) (Kant, Kaur, Malhotra, Haldar & Goel
2018:137). In Mozambique, Adolphson, Axemo and Högberg ( 2016:99) found that
midwives had limited resources to help women with serious problems and
complications, and needed a functional referral system. A system to establish functional
linkages between facilities is critical to address such limitations (Koblinsky, Moyer,
Calvert, Campbell, Campbell, Feigl, Graham, Hatt, Hodgins, Matthews, McDougall,
Moran, Nandakumar, Langar 2016:2308).
5.4.2.5 Category 5: Logistical limitations led to referrals
Due to logistical limitations, health centre staff referred cases to the next level of the
referral system, namely hospitals or nearby facility. The reasons included shortage of
power, lack of water, limited space and equipment, shortage of supplies and drugs, and
laboratory reagents. The respondents reported that there was limited practice of
introducing alternative power and water sources at health centre level. Lack of
laboratory services also forced health workers to rely solely on physical examination
and thus empirical treatment, which led to unnecessary referral and practices at the
health centre level. The respondents described the situation and health workers’
frustration at health centres. According to respondents,

112
We do not have any of the important supplies: glucose, vitamin A, calcium
gluconate, hydralazine, epileptic drugs, option B for HIV positives, Misoprostol.
The shortage is because of the budget limitation. It is annoying that because of
these simple items, we are referring cases to other places.
Water shortage is a serious problem in our facility. We [health workers]
sometimes forced to fetch waters from the water points in the community. As
there is shortage, we are using them economically. Often, we tend to refer cases
for shortage it, and sometimes the mothers deliver here, they may leave the
facility without washing their body.
Lack of availability of necessary equipment, drugs or important procedures at facilities
were factors that impacted negatively on quality of care. In addition, non-availability of
neonatal intensive care unit (ICU) (56%), non-availability of caesarean section (43.9%),
and non-availability of blood bank (5.6%) were the main reasons for referral in Haryana,
North India (Kant et al 2018:137).
5.4.2.6 Category 6: Motivated health workforce
The respondents pointed out that many factors affected health workers’ motivation,
such as availability of necessary materials and equipment, and relationships with the
community. The respondents indicated that low salaries, untimely payments of benefit
packages, exclusion of some health workers from benefit packages, a poor inter-
professional support structure, and relationships among staff members affected their
motivation. According to respondents,
There are lots of challenges. They pay me very small. I have a third-grade driving
licence, let alone as civil servant, but if I drive for a private company, I can easily
earn more than this. Imagine, I also work 24 hours. We also do not have any
benefit packages. They also say we are eligible for per diem when we go to
hospitals, and for your surprise, I also do not get those payments on time.

113
The health centre has a standard. We have 13 health workers now. There are
people on maternity leave, and one is breast-feeding. We only have 8 active
staff. Five of the staff are expected to support health posts. How does anyone
think the remaining health workers provide the required quality services? With all
these limitations, we provide services 24/7. Sometimes services are provided
with no protective device and receive no duty payments. On top of this, we only
have one midwife and other health workers are assigned to provide the services
in the delivery case team. However, as per the government guidance, the risk
payment is only paid to the midwife. My third point is in relation to the referral
services. The health centre does not have a phone and we are using our
personal phone, but we are not reimbursed for this.
In relation to the health system support, the respondents added that less equipped
facilities, lack of essential drugs and supplies, management’s inability to establish good
relationships among staff and impartiality of the facility management were factors
influencing staff motivation at the health centre level. According to respondents,
The management is not strong. It is biased. I expect the management to be fair to
all. Some of the decisions are based on your relationship with the management.
Many of the staff are wanting to leave the facility early.
I usually ask the health officers. They tell me that when we enter delivery case
team, the midwives are not happy. The midwives, on the other hand, say that the
health officers should have fixed schedules. In addition, all the drugs and
supplies at the delivery room are taken in the name of the midwives and the
health officers may not be as cautious as we are. I think if they work in a
committee and if we have a strong referral committee, they can easily work
together.
The respondents also referred to the relationship with the community. Most of the
respondents underlined that the mainstay of their commitment to serve was their
relationship with the community. The respondents indicated that blessing that followed
quality care and outcomes, the willingness of the community to contribute to improve
the service, and their acceptance of the health workers’ advice were key factors in their
motivation.

114
The respondents indicated that health workers’ motivation was key to further improve
the quality of service provided at the health centre level. Some factors that affected
motivation included long contact hours with clients; clean work environment; share of
costs borne by clients due to unavailability of drugs and supplies; strong follow up of the
referred cases, and minimal or no negligent practices. According to respondents,
When they send the patient, if possible, they ask the phone numbers of the
health workers at hospital level. If not, they take the phone number of the
attendant and check the status of the referral. The follow up includes where they
referred and follow if there are further referrals. We also have a copy of the
referral paper and we also have a referral registry to document the referred
cases.
When we have a mothers’ forum and referrals, we spend money from ours.
When we take mothers at night, we may be forced to spend the night at other
people’s house or hospital.
A study in a Kabul maternity home in Afghanistan underlined the relationship between
management and staff as a factor for staff employment and development opportunities.
The opportunity to attend training, acquire skills, and even employment were more
dependent on connections than need, motivation, or ability (Arnold, Van Teijlingen,
Ryan & Holloway 2015:264).
5.4.3 Theme 2: Proper initiation of the referral process determines the outcome
5.4.3.1 Category 1: Knowledge of referral pathways
Referral by health workers or self-referral was determined by knowledge of referral
pathways in the health system. The referral pathway, which was partly directed by the
availability of a referral directory, was affected by the community’s knowledge of the
available services at various levels of the health system. The respondents identified
various factors pushing mothers to go to hospitals directly: limited knowledge of
services provided at health centres, advice from family and community members and
private facilities, distance, and topography. According to a respondent,
115
There are some cases coming from home. People residing in the town, the
mothers directly bring the neonate here and review the case. Together with the
health extension workers, we are educating the community during pregnant
mothers’ forums about service availability.
Health workers’ knowledge of the services provided at neighbouring health centres and
referral hospitals was an important factor affecting the referral system. Regular update
of the referral directory, including contact persons and available services in each referral
facility, was identified an important factor in knowledge of the referral pathways. In
addition, the respondents stated that proactive communication from the hospitals to
health centres avoided unnecessary multiple referrals due to unavailability of services or
logistical problems at the referral hospitals. One respondent pointed out,
When the generator fails and depletes the reagents for certain investigations,
we call to the heads of the health centres so that they directly refer cases to the
general hospital. This helps to reduce the delay which may happen due to
multiple referrals.
A study on the referral system of primary health centres in Plateau State, North Central
Nigeria found that people with a good understanding of the referral system made 6.2
times more referrals than those with little knowledge or understanding of the concept of
referral (Afolaranmi et al 2018:7).
5.4.3.2 Category 2: Referral communication between facilities
As part of the referral system, a health centre is expected to assign a referral focal
person and a hospital needs to establish a referral liaison office. The referral focal
person is called whenever there is a referral. At health centre level, however, high
caseloads, minimal communication facilities, no dedicated room, limited functionality of
referral committee, and no accountability framework especially during night shifts are
obstacles to this function. The limited functionality of the referral focal person has
created problems in initiating the initial call before referral and making sure all the
necessary documentation and assignment of health workers with the referral case was
done. According to a respondent,
116
The health centres do not value the importance of the referral focal person. They
just assign the focal person for the sake of fulfilling the standard. This person
should communicate before any referral. If the person is not trained, he should
take the training properly. This function is so important, and I think this should
receive the needed attention from the woreda health office and the health centre
management. I know of people who travelled from facility to facility for the sake of
services and died in due course. If proper communication is placed before
referral, this may not be the case.
Communication plays an important role in interprofessional collaboration. It is a core
process in which people working at different levels of the health system share
information for improving outcomes of care (Karam, Brault, Van Durme & Macq
2018:73). Karam et al (20128:77) emphasise that patient-centred care is a core
principle in any communication between individuals or organisations. In Ethiopia,
communication between facilities is expected to happen and be facilitated through the
liaison officer or referral coordinator of both sending and receiving facilities (Austin et al
2015:4). At Saint Paul’s Hospital Millennium Medical College in Addis Ababa, Abdella et
al (2019:9) found that only 31.4% of referrals were sent to the hospital with prior
notification.
5.4.3.3 Category 3: Preparation for referral
Preparation for referral is a stepwise approach, which includes deciding on referral,
preparing a patient, preparing a referral slip and recording the case in the register. The
decision on referral should be a team effort and the referral committee that should be
established at the health centre level should make the decision. However, the time of
referral and availability of team members challenge the functionality of this team. In
addition, after the placement of the general practitioners at the health centre level, they
are the ones who decide on referrals. Patient preparation requires knowledge of the
case and confidence in the established diagnosis. Moreover, proper counselling is also
an important component to make sure the patient and her family accept referral.
Considering these factors, the respondents perceived that the patient preparation had
not been done properly. According to a respondent,

117
The pre-referral management is a problem. For example, for eclampsia cases
they are expected to send the patient after giving the loading dose, but they just
send the patient without any pre-referral management or writing it in the referral
paper. Once the protein and blood pressures are raised, they are expected to
start the loading dose and send. The other thing is when the mother has any
bleeding, they need to secure IV, but they just send the case like other cases.
The availability of formats and registers, the competence of the health workers, the
caseload and availability of the referral committee influenced documentation of cases
and referral paper preparation. The positive practice reported by the hospitals was that
all referred cases had referral slips or papers prepared by the health centre staff.
However, in some of the referral slips, especially when the health workers at health
centre level used plain paper, much of the required information was missing. According
to respondents,
The person who is managing the case completes the referral slip and then I
register the case in the referral register. The slip is filled by the person who takes
the history.
As they were not properly trained, we are making some efforts to improve the
completion of referral slips. For example, if the case is diagnosed as perinatal
asphyxia, they should at least record the APGAR score. We have learnt that
when we repeatedly question them to complete the referral slip, it is good to note
that there may be a capacity limitation and thus completely stop using the slip.
In a review of referrals between public sector health centres in India, Singh, Doyle,
Campbell, Mathew and Murthy (2016:13) found the common reasons for non-
compliance with referrals were cost (100%), lack of follow-up after reaching the
institution (92.4%), TBA advised against it (92.4%), non-availability of transport (79.4%),
previous bad experience (74.6%), and patients considering their symptoms as normal
(61.1%). Additional factors for ineffective referrals included inadequate referral
communication and record maintenance, and absence of standard guidelines for
referral, facilities and monitoring of referrals for obstetric care. Moreover, complicated
cases were not adequately stabilised nor were they given first-line treatment before
referral (Singh et al 2016:19). A study conducted in Addis Ababa found that the pre-
referral management was poor. For example, 72.3% of prolonged/obstructed labour

118
patients were transferred without intravenous access lines; 75.4% of patients with
premature rupture of foetal membranes were not given antibiotics before referral, 79.5%
of pre-eclampsia/eclampsia cases were not provided with magnesium sulphate as
seizure prophylaxis, and 60.8% of foetal distress patients were referred without securing
intravenous lines for resuscitation (Abdella et al 2019:10).
A study on the quality of obstetric referral services for institutional births in Madhya
Pradesh Province, India found that most referred mothers had slips, but inadequate
details of treatment provided and progress of the labour were provided (Chaturvedi et al
2014:7). In their review of referrals between public sector health institutions for women
with obstetric high risk, complications or emergencies in India, Singh et al (2016:17)
found compliance with referral was better with an accompanier from the referring
institution or where the nurse arranged for the transport and communicated about the
case to the higher-level institution.
5.4.4 Theme 3: Emergency medical transportation
5.4.4.1 Category 1: Ambulance availability
Each woreda has one or two ambulances to provide emergency medical transportation
services. However, ambulance availability depended on enough budget for
maintenance and running costs, accessibility of the sites, other assignments given by
the woreda health office to the ambulance, and order of calls by various users.
According to a respondent,
The woreda does not have enough vehicles and they use the ambulance for
other purposes as well. For example, we support the health office in material
distribution.
In a rural area of Burundi with high maternal mortality, the availability of an ambulance
referral network was found to be a cost-effective strategy to improve access to
emergency obstetric and neonatal services (Tayler-Smith, Zachariah, Manzi, Van den
Boogaard, Nyandwi, Reid, De Plecker, Lambert, Nicolai, Goetghebuer, Christiaens,
Ndelema, Kabangu, Manirampa, & Harries 2013:999). In Mozambique, Adolphson et al
(2016:99) found that midwives in remote areas reported that it was not always possible
119
to reach the people in charge of ambulances, ambulance services were not timely, and
the ambulances did not always arrive. This forced the midwives to devise flexible
solutions to the transportation problems. In Addis Ababa, Ethiopia, Abdella et al
(2019:9) found that many referred cases were transferred by public ambulances from
the health facilities, but 63% of the ambulances had no resuscitation facilities.
5.4.4.2 Category 2: Alternative for ambulance
When an ambulance is not available, the community and the health workers find other
alternatives to transport the mother or the newborn to the hospital. Sometimes the
health workers are forced to advise mothers and their family to transport the patient by
means of traditional ambulances, and Bajaj. The youth and family members use locally
prepared stretcher transport to take the mother to the main road and wait for public
transport, or the ambulance. Furthermore, the health workers may request any available
vehicle from different government offices or neighbouring woredas. According to a
respondent,
The ambulances are working well now. But when I was at the health centre, there
were cases that I sent them by traditional ambulance which is a locally made
stretcher and carried by some selected community members. Traditional
ambulances were also used when the phone was not working. Using the
traditional ambulance, they walked for 1 to 2 hours to the hospitals.
A study conducted in Ghana showed that provision of women friendly ambulance
services increase delivery care utilization at hospitals (Ganle, Fitzpatrick, Otupiri &
Parker 2016:9). However, transportation facilities in many, rural and urban alike, are
difficult. Noting these challenges free ambulatory services, or at least a system that
reimburse women with transport costs is introduced in Ghana (Ganle et al 2016:10).
India also introduced alternatives for ambulance transport; such as, carts, bicycle or
motorcycle (Bhattacharyya, Issac, Rajbangshi, Srivastava & Avan 2015:424).
5.4.4.3 Category 3: Equipped ambulance
The quality of ambulance services is determined by who is going with the patient as well
as to what extent the vehicle is equipped. The respondents stated that sometimes
120
referral cases were not accompanied by health workers from the health centres, but by
family members. The family members were given some main precautionary instructions
and things to follow while travelling with the patient. According to a respondent,
In many of the cases, only the driver brings the referred case. But, on rare
occasions, we have the health worker. If we have one or two referrals with the
health workers, that is good. For example, we had two referrals yesterday, and
the driver only brought them. They only just secured IV line and sent the mothers
with the driver.
Some of the participating health workers at the health centres said that due to the
caseload they did not always accompany the cases. They gave the high workload and
limited number of staff as reasons for not accompanying the case most of the time.
According to a respondent,
If I do not expect the mother to deliver on the way, I may not go. But if we have
cases like hypertension, bleeding, we accompany the case. The case burden at
this health centre also determines the decision to accompany the referred case. I
may also send another professional.
Some of the woredas also recruited an emergency technician – trained for 12 months -
who travels with the ambulance. The health centre staff acknowledged this
professional’s role. However, a participating emergency technician felt that the hospital
staff did not accept her. According to the respondent,
The other challenge is from the receiving facility. Usually, health workers at
hospitals prefer health centre staff to accompany and explain the case well. I
think they are right. As I do not attend the cases, I may not explain the reasons
for referral.
Lack of equipment was another challenge. The ambulance is not prepared for
transporting emergency cases. Some of the equipment is with the health workers going
with the ambulance. The ambulance, for example, does not have installed oxygen.
According to the respondent,
121
Another challenge I face is lack of equipment. For example, I do not have oxygen
in the ambulance. But I have some basic equipment such as gloves, forceps and
scissors, and an Ambubag as part of my kit.
Well-equipped ambulances with trained paramedics are the crux of an emergency
transportation system which aims at saving lives during the first critical period (Acharya,
Badhu, Shah & Shrestha 2017:182) Experience from Qatar showed that incorporating
an Ambulance Service Critical Care Paramedic (CCP) into the system provided a
seamless care continuum (Campbell 2017:53). On contrary to the standards of
emergency management, this study found critical shortage of equipment in the
ambulance. A study conducted in Nepal found that oxygen cylinder and adult oxygen
masks are available in most (90%) ambulances (Acharya et al 2017:185).
5.4.4.4 Category 4: Communication between users and ambulance drivers
The users and the ambulance drivers communicate by telephone. When the health
centre initiates the referral, the referral focal person or the head of the facility or the
health workers providing the care call the ambulance driver by telephone. The response
to the call depends on who calls for the driver and the driver’s behaviour and
commitment. According to respondents,
A call to ambulances can be done by health workers from health centres or family
members from the households. The source of a call may determine the response
of the driver. We have all the phone numbers of all the three drivers, and we call
to one of them and they inform us who is on duty.
Communicating with ambulance drivers is mentioned as one of the challenges in the
referral system. Partly it is due to limitations related to communication gadgets and the
rest is due to human factor. In Ghana, only sixty-four per cent of assessed facilities had
a working telephone or shortwave radio for communication (Kyei-Nimakoh, Carolan-
Olah & McCann 2017:4). Another study conducted in Mozambique reported challenges
in relation to ambulance drivers and emergency focal persons that people responsible in
managing ambulances are not responding to calls. In addition, in some instances, the
health workers are expected to convince ambulance drivers to treat the case as
emergency (Adolphson, Axemo & Högberg 2016:99).

122
5.4.4.5 Category 5: Tracking the ambulance
Tracking the whereabouts of the ambulance is very important to facilitate
communication between health workers, referral focal person and drivers. The drivers
should keep a register in the vehicle, but this was not well monitored. It is important to
check for completion of the registers and reporting to the next level.
I have a register. This register includes the data, odometer, keble, name of the
case, age, sex and residence and their reason for referral and where to go. I can
present it when I’m requested to do so by the woreda health office.
Various technology-based ambulance tracking system were introduced by various
countries. To mention some, an emergency system in Iran uses GPS and display map
in ambulances that reduced the response time of ambulance drivers (Delshad et al
2016:2). Bangladesh also introduced a cost-effective ambulance service using mobile
phones and geographical positioning system (GPS) tracking (North-West University
2016:16). In addition, North-West University in South Africa designed and implemented
a system integrated with a mobile application and a location-based service (LBS) to
bridge the communication gap between healthcare providers and patients residing in
the rural areas (North-West University 2016:14).
5.4.5 Theme 4: Services availability at receiving facility determines the
functionality of the referral system
5.4.5.1 Category 1: Service availability at hospital level
The respondents underlined that many factors affected service availability, including the
capacity of the hospitals to implement health services standards; acquiring the required
health workforce; availability of enough infrastructure to host the necessary units, such
as operating theatres, NICU and blood bank, and enough beds. The availability of these
capacities indicates the readiness of the hospitals for complication management, and
collaboration with other facilities, either public or private, to address the gaps. According
to a respondent,
123
Sometimes we do not have any admissions. When there is no power, we prefer
to refer cases. As we do not have oxygen cylinders, neonates requiring oxygen
are referred. In addition, thermal care was also not available when there was
power interruption. There was an incident when the standby generator was not
working for a month. In that time, we referred all of them. Many of the services
that we provide are related to electric power availability and we do not admit
when the generator is not functional. We do not want to take the risk.
Ideally, health service users should have the opportunity to utilize health care whenever
the need arises (Kyei-Nimakoh et al 2017:6). The initiation of referral process is a
medical decision and it depends on many things which among others include the
availability of a health institution with specialist facilities, and the quality of care at the
referral institution (Singh, Doyle, Campbell, Mathew & Murthy 2016:2). A study
conducted in Bangladesh also found that hospitals at district and subdistrict levels were
challenged by lack of healthcare personnel and logistic support, including equipment,
essential drugs, and laboratory needs (Islam et al 2015:8). Some of the logistics related
challenges; such as, irregular supply of water and electricity, were also ascertained by a
study conducted in India. Sometimes shortage of budget to cover administrative running
costs, like fuel for generator, also led to discontinuation of services (Bhattacharyya et al
2015:426).
5.4.5.2 Category 2: Increased service utilisation at hospital level
The community’s knowledge of the type of services available at various levels of the
health system, proximity, and inappropriate referrals increased unnecessary use of
services at hospital level. According to respondents,
The difference [plan versus performance] was because some of them were going
directly to hospitals and other health centres. We do not expect home delivery.
They are going to other health centres and hospitals because of the proximity.
If you stay here the whole day, you can witness that all the referred cases are
spontaneous vaginal delivery.
Unnecessary referrals overload referral hospitals beyond their capabilities with minor
cases which could have been seen at primary level care facilities (Koce et al 2019:2). In
124
India, Singh et al (2016:19) found that many unnecessary referrals to hospitals were
due to the inability of primary health centres to provide basic delivery care and BEmOC
services, a tendency for unjustified referrals to higher institutions, and bypassing the
CHCs as first referral choice. Regarding obstetrics referrals at Saint Paul’s Hospital
Millennium Medical College (SPHMMC) in Addis Ababa, Abdella et al (2019:11) found
that 80% of referrals were for delivery services; of those who gave birth, 77.3% were
delivered by SVD, and 71% of those were conducted at emergency obstetric units.
5.4.5.3 Category 3: Proper reception at the hospital level
Proper reception of referred cases is the hallmark of quality of care provision at hospital
level. Referred cases should be considered high risk and treated accordingly. However,
the previous experiences of hospital and health centre staff and the completeness and
appropriateness of the communication between the two levels determine the attention
provided to the case. In many cases, hospital staff do not trust cases sent by health
centres. According to a respondent,
The ambulance brings them here. They also have referral slip and health workers
from the health centre. When they enter the facility, they just come directly. As
this is an emergency, they are not required to pay for a card [visit to the health
worker] first. While we provide the necessary care, anyone from their family can
process the administrative requirements.
The admission should pass through the physical and pelvic examinations, medical
record reviews to see if the case had previous contact with the hospital, and laboratory
investigations to establish a diagnosis, if deemed necessary. The respondents indicated
that the quality of reception depended on the availability of the required laboratory
investigations, the availability of the senior health worker, the caseload, use of
ambulance, the presence of a health worker accompanying the case, and the reputation
of the referring health facility and health worker. In general, compared to walk-in
patients, referred cases have priority at reception where they are guided directly to the
delivery room or NICU. According to respondents,
125
I sometimes think this is just pushing the case to the hospital. It might be good if
we provide the care to mothers, but we are not equipped well. We do not have a
human resource shortage, but we have lots of limitations.
When we have referrals, we pay more attention to them. We check diagnosis and
review the case to confirm. If the case requires more attention, we follow them
regularly. We regularly follow the vital signs. If she is in active phase, we start the
use of partograph.
Mothers always seeks for responsiveness, promptness, and inter-personal behavior
when they visit health facilities (Bhattacharyya et al 2015:422). These are linked to
providers’ attitudes and behaviors and it sometimes providers behave differently as a
response to burnout (Mahato 2017:41; Filby, McConville & Portela 2016:9). The
dissatisfaction of mothers at the reception may be due to long waiting time to retrieve
folders and receive treatment, unfriendly attitudes of providers and other support staff
and late arrival to work by providers (The WHARC WHO FMOH MNCH Implementation
Research Study Team et al 2017:4). The other cause as ascertained by another study
in India is linked to spaces. Lack of waiting area available for users before admission
and for the accompanying persons and overcrowding of wards were ascertained
(Bhattacharyya et al 2015:426).
5.4.5.4 Category 4: Labour monitoring
For delivery cases, following the mothers using the labour monitoring chart is an
important component of the care steps. The provider’s skills; availability of the chart;
number of health workers assigned for the session (day or night duty); staff attitude
towards the chart; number of cases to be followed; the quality of teamwork and staff
relationships; the strength of supervisor follow-up; the focus of the supervision team; the
timing of checking for completeness; the practice of experienced/senior midwives/health
workers, and clarity on the components of the chart, determine the consistency and
completeness of the labour monitoring chart. According to respondents,

126
The components can be filled. To be honest, when the mother is at the second
stage, all the components of the chart are filled. All four components are filled. If
you are lucky and the foetal heartbeat is good, without properly following the
case, as the chart completeness is checked, you complete the chart after
delivery. Usually, when I review the charts, descent is forgotten especially when
the mother’s cervix is full. There are also some sections which only require
checking that the box not properly filled. And, especially when the labour
prolongs, the actions are not filled. For example, when ARM was done, it is not
written in the chart.
They (midwives) are great. Even compared to the referral hospital where we
were trained, they do it here properly. But we are not sure whether they fill in
while providing the service or not. As you know, there is a saying, ‘treating a
chart’. We only capture them when there are stillbirths, which signify poor
utilisation of the chart.
The quality of partograph use determines the outcome of labour. In Bangladesh, Khan
et al (2018:29) found that the stillbirth rate among mothers with abnormal partographs
was higher than among those with normal partographs (4.2% of 71 abnormal and 3.3%
of 577 normal partographs). In a study of healthcare providers’ perspectives on
challenges and opportunities in labour monitoring in Nigeria and Uganda, Yang, Bohren,
Kyaddondo, Titiloye, Olutayo, Oladapo, Souza, Gülmezoglu, Mugerwa & Fawole
(2017:21) found delays in responding to abnormal labour observations, suboptimal
clinical team cooperation, and insufficient provider-client communication were the
biggest problems. The WHO (2018a: 59) found that poor availability, lack of confidence,
difficulty of use, lack of clear policy on use, and workload contributed to low utilisation of
partographs and underscored that these factors led to retrospective completion and
inconsistent partograph recording.
5.4.5.5 Category 5: Work environment at hospital level
The respondents described the work environment as the interaction among staff,
hospital management and the patients themselves. The success of the completed
referral system is determined by how the hospital management conducts regular follow-
ups on practices, staff relationships and implementation of the health workers’
motivation packages as stipulated in national and regional policy and innovative staff

127
motivation schemes. In addition, the proximity of the seniors’ residence area to the
hospital is a factor to ensure timely support to the midwives working at the hospital
level. Interactions between staff and health workers in the delivery room also
contributed to a convenient work environment. According to respondents,
The attendants are the ones who sometimes insult you. This is because of a
loose environment; the security is not strong. If we have securities close to us,
we may not fight with the attendants. You need to pass through the attendants to
call for the security forces. In this process, there are also some people who want
to fight with you. This factor in one way or another forces you to not to like the
profession, even though you are happy with what you do.
There is a loose follow-up. Management follow-up is important. When the health
workers can exercise freely, they do not pay attention to every detail. If the
patient card is, for example, audited every day, we may be forced to complete the
partograph properly. Accountability is important.
The team spirit is the driving force for the achievements. Imagine had there not
been this, the challenges and the environment are not convenient. The MCH
department has very good teamwork and each one of us is good to others. Some
of us also have experience of birth and know the pain.
Poor working conditions further compromise quality of care (Filby et al 2016:10). Some
reports underlined that health workers globally work in difficult, unsafe, isolated and
poorly equipped settings (Homer et al 2018:7). On top of improving the working
condition, emergency management requires a well-functioning teamwork (Adolphson et
al 2016:97). Establishing multi-disciplinary teamwork is imperative to nurture a
collaborative attitude, problem solving skills and functional relationship among health
work force to ensure continuity of care (Homer et al 2018:9).
128
5.5.5 Theme 5: Functional cross-facility support platforms for better
collaboration and coordination between facilities
5.5.5.1 Category 1: Feedback on referral
Feedback to the referring facility is a means of establishing communication between
health centres and hospitals. When and how it is given has an impact on its application.
Most of the health workers at the hospitals reported that they provided written or on-the-
spot feedback to the referring health worker. However, the health centres complained
about lack of feedback in the system. Some of the respondents believed that most of
the cases came for similar inappropriate reasons. The respondents gave the following
reasons for the lack of referral feedback: overload too high to provide written feedback;
incomplete contact address of the referring health worker; limited follow up from the
health centre side; lack of health centres’ commitment to work on the feedback; most
referrals coming without health workers; use of inappropriate referral forms, and not
trusting the competencies of health workers at hospital level. According to a respondent,
We provide feedback. They may not accept the feedback and that is why they
commit similar mistakes time and time again. They may feel we are the same as
they are in terms of qualification. However, we have more experience and have
worked with many other professionals and with seniors. In due course, we have
better experience.
The health centre staff, however, believe it is because of the lack of commitment of the
hospital staff that the health centres do not receive feedback. Even when they provide
feedback, the tone of communication is not appropriate. According to a respondent,
They always communicate the negative. The feedback tone is always negative.
This may be because they think they work at hospital level. For example, we can
take a case of prolonged labour. We meticulously follow her and decide on the
case. Then, en route due to the nature of the road, the position may change, or
the labour may be hastened. When they reach hospital, they may deliver
normally. In this case, the feedback says ‘you are sending us the wrong cases’.
Sometimes, it is good to ask the patient herself and understand our efforts rather
than concluding we are tired of providing the care.
129
The referral focal person or health centre head collects the referral feedback and the
feedback is jointly reviewed by the delivery case team members. In some of the health
centres, the feedback is used as an opportunity for coaching and filling in the missing
materials which was the cause for the referral. Another opportunity presented by the
respondents was a meeting between health centres, hospital and woreda health office
officials where every stakeholder takes an assignment to improve the common
problems happening regarding referrals. According to respondents,
Our relationship with the health centres should be properly guided. We need to at
least have a quarter-based meeting with them. Recently we had that meeting
with the MCH lead, Referral focal person and midwives from the hospital and
woreda health offices. We took samples from their referral feedback and
discussed on them.
Eskandari, Abbaszadeh and Borhani (2013:4) underline the importance of referral
feedback as the lack of it may distort the process of referral and patient follow up. Lack
of proper referral documentation affects the completeness of referral feedback loop. In
India, for instance, 73% of referrals were provided referral slips but they did not provide
any information about clinical manifestations or treatment which limits the completeness
of referral feedbacks (Singh et al 2016:17). In addition, the fact that referred clients
being transported unaccompanied by healthcare staff is also another missed
opportunity to collect feedback from the referral sites (Kyei-Nimakoh et al 2017:7).
5.5.5.2 Category 2: Consultation and mentorship support
The relationship between health centres and hospitals can be strengthened further by
initiating functional technical support structures in the form of telephone consultation
and through either individual or group mentorship support to the health centres. The
respondents stated that telephone consultation is necessary to minimise unnecessary
referrals. According to a respondent,
When we have no one to consult with here at the health centre level, we call the
person working at the hospital. The call helps us manage the case and avoid
referrals. It also sends a message to prepare themselves to provide the services.
130
The respondents indicated that mentorship support improved health workers’
competence and reorganised service delivery platforms at health centre level. As
mentorship support requires advance preparation before the actual visit, it contributes to
ensuring that health centres’ problems are dealt with comprehensively and sends a
message that for any of the actions about referral, the health centre is accountable. This
further presents an opportunity for continued consultations between the health workers
at health centre and hospital level as well as the opportunity to present any
administrative-related problems to the woreda health office representatives. One of the
respondents described the process they followed to provide group mentorship:
One pharmacist, IESO, Lab, GP, and quality officer went to the health centre. I
[IESO] conducted mass U/S screening. All the staff from the hospital supported
the health centres. This was a great experience. The main thing was that they
are visited. It is also good to receive feedback. Another limitation in the health
system is their accountability. They have formal relations with the woreda, but not
the hospital. Such visits are helpful. There is a clear skill difference. If there is
woreda level training, there will be strong communication moving forward.
In rural Iran, the lack of feedback had a negative impact on the process of referral and
patient follow-up (Eskandari, Abbaszadeh & Borhani 2013: 232). In India, lack of
accountability and of back referral of minor cases that came directly to higher level were
among the factors affecting the referral feedback system (Bhattacharya 2017:3).
5.5.5.3 Category 3: Functional service management committees
Various management-related committees have been established at both health centre
and hospital level. The respondents identified the referral, MPDSR, and quality team
committees among those that have a stake in the referral system. However, the
functionality of those groups is either limited to one level or known by very few in the
system. According to a respondent,
There is an MPDSR committee led by the quality unit. Four midwives are also
part of the team. The committee analyses the case. The cause of the problem is
analysed, and every team member is evaluated. They do not go to the health
centre and home though. The result is used to educate the health workers at all
levels.

131
As the study in India demonstrated that accountability with regards to referral practices
should be ensured and best performances need to be rewarded (Jayanthi et al
2015:16). The availability of accountability mechanisms further promote active
collaboration among levels as well as enhance the implementation of harmonized
referral system (Singh et al 2016:19). These however are lacking as demonstrated by a
study conducted in India which showed an overall lack of monitoring of the referral
system and accountability to patients (Singh et al 2016:18).
5.6 OVERVIEW OF MAIN QUALITATITVE FINDINGS
The referral chain model has three important elements: Sender, Transport and
Receiver. This study identified the health centre as the sender; public transport and
ambulances as transport, and the primary hospital as receiver. The main limitations
identified in each element are summarised next.
In all the health centres in the study, delivery and essential newborn care services were
provided to a wider catchment population than expected. In addition, prior interactions
with the mother during ANC and pregnant mothers’ conference at community level
established a relationship between the health centre and mothers, which contributed to
improved utilisation of services at the health centre level. Two health workers were
assigned to the delivery case team in each health centre. Two factors led to high
caseloads. In one instance, for example, a single midwife provided delivery care to six
clients per night. Most of the health workers had limited experience and only a few had
attended in-service training to improve their skills. Besides these limitations, the health
workforce was challenged by a lack of properly implemented motivation packages, and
of supplies and reagents. Moreover, due to high caseloads, limited competence among
service providers, inappropriate practices during intrapartum care and logistical
problems, unnecessary maternal and newborn related referrals were sent to the primary
hospitals.
The study found that knowledge of referral pathways determined the referral practices
at the lower level of the system. There were self-referred cases and referrals by health
workers because of family and community members’ advice, private facility practices
and lack of regular update of referral directory. Communication between facilities is
another important factor. A strong referral focal person and referral committee
132
contribute to facility standards. Practice differed from facility to facility. Prior
communication before referral should happen, but the hospitals complained about a
lack thereof. This could be due to health centre management’s concentration on
establishing the focal person and committee and regularly following performance.
Patient pre-referral preparation was not done well. All the referred cases did have
referral slips, but information was incomplete and/or inaccurate. At some of the sites,
the referral decision was made solely by the medical doctors rather than a committee.
Transporting the referred cases was a challenge. All the woredas visited had at least
one ambulance for patient transportation. However, its availability was determined by
the number of calls, who had called the driver, and other assignments given by the
woreda health office. In several cases, public transport was an option if the client
agreed. However, having ambulances available to some patients and sending others by
public transport was a matter for discussion between the community members and the
health centre management. In some cases, health workers requested vehicles from the
government offices and neighbouring woredas. The available ambulances were not well
equipped for emergency management or well-staffed. In some woredas, emergency
management technicians were assigned to each ambulance to provide the service while
transporting the referred cases. However, health professionals at health centre level
accompanied cases based on the caseload and type of referred cases. In general, due
to the reporting line to the woreda rather than hospital and no strong tracking system,
ambulance management was poorly managed to provide the service.
The readiness of the hospital to receive the referred clients and provide quality care was
an important component of the referral system. Service availability was challenged by
the capacity of the hospital to have the necessary rooms and infrastructure, highly
trained workforce, and supplies and laboratory reagents available. The number of cases
visiting the hospitals also comprised quality of care. The referred cases at the reception
received preferential treatment based on previous knowledge of the sending facility and
health workers, and communication between the sending and receiving facility which
was not well established due to logistics, documentation factors, and patients coming
alone. Admitted cases were not properly monitored because of the high caseload,
limited supervision support, and the focus of follow up. In many cases, healthcare
professionals tended to “treat charts” rather than promote evidence-based practices
while providing care. The quality of practice was challenged by insecurity in the work
133
environment but strengthened by good teamwork and availability of consultation
support. Beyond providing services at hospital level, the primary hospitals failed to
improve the capacity of health centres through mentorship support, communicating
positive feedback on referrals and linking hospital level and health centre management
structures.
5.7 CONCLUSION
This chapter discussed the findings from the key informant interview during the phase 2
of the study. A total of twenty-six health workers included in the key informant
interviews. The findings from the interview focused on exploring the experiences of
health workers which managing maternal and new-born care related referral system.
The finding generated five major themes: Capability of identifying appropriate cases for
referral, proper initiation of the referral process determines the outcome, emergency
medical transportation, services availability at receiving facility determines the
functionality of the referral system and functional cross-facility support platforms for
better collaboration and coordination between facilities. Each theme in this chapter were
described by the direct quotes and relevant literatures.
Chapter 6 discusses the strategies developed to improve the referral system in relation
to maternal and newborn health.
134
CHAPTER 6
STRATEGIES TO IMPROVE MATERNAL AND NEWBORN REFERRAL
SYSTEM
6.1 INTRODUCTION
The purpose of the study was to formulate strategies to improve maternal and newborn
health care referrals in the health system in Ethiopia. Accordingly, the researcher
analysed the effects of current referral practices in the health system and identified and
developed strategies to improve referrals in the health system.
The quantitative and qualitative findings of the study indicated a significant proportion of
inappropriate referrals within the health care system. The inappropriate referrals were
mainly due to patients’ self-referrals and the capacity of the lower health system. Poor
referral practices impact negatively on the health care system and quality of care.
The researcher conducted a thorough literature review, examined the costs and
practices of patient referrals, and collected data from health workers in the field in order
to develop strategies to improve the referral system in maternal and newborn related
emergency care in Ethiopia.
The findings were categorised according to the three components of the referral chain
model, namely sending, transporting and receiving, as well as the overall governance
and accountability system in relation to referrals.
6.2 STRATEGY DEVELOPMENT
According to Clayton (2019), there are five stages of the strategic management
process, namely framing the objective; identifying issues; identifying possible strategies
to tackle the issues or problems; developing the strategies and implementing and
evaluating the strategies. The researcher collected quantitative data on the referral
practices, costs and problems about the referral system. In the qualitative phase, the
researcher explored health workers’ experiences and perceptions of the system and

135
problems as well as their suggestions and recommendations to tackle the problems and
improve the system. The researcher drew up a list of interventions/strategies aimed at
four areas: sending, transport and communication, receiving, and monitoring and
governance/accountability.
The researcher sent the strategies to selected programme managers and health
workers involved in MNH care provision and management for validation and revised the
strategies according to the feedback received for implementation of the strategy.
Implementation, evaluation and control require follow up after completion of this study.
6.3 SCOPE OF THE PROPOSED STRATEGIES
Improvement in the referral system requires considerations at strategic and operational
levels. The suggested strategies require the engagement of policy makers, programme
managers and service providers.
6.4 AIM OF THE STRATEGY
The overall aim of the strategy is to improve the availability of a functional maternal and
newborn care referral system. The strategy consists of strategies to
• Improve the capacity of health centres to provide the expected type of care and
improve quality of care.
• Improve the availability and utilisation of quality emergency transportation
services.
• Enhance the readiness of hospitals to provide emergency maternal and newborn
health care.
• Establish referral system governance and an accountability framework within the
health system.
6.5 STRATEGIES TO IMPROVE THE REFERRAL SYSTEM
The capacity of different tiers of public sector health facilities to provide essential
maternal and newborn care varies. Some facilities have the capacity to provide
Comprehensive emergency obstetric and newborn care (CEmONC), while others can

136
only provide Basic emergency obstetrics and newborn care (BEmONC) (Chaturvedi et
al 2014:2). Many cases can be managed by the lower level health facilities. For cases
requiring advanced care, establishing an effective referral system is crucial. Continued
study and reflections on the referral system are required to assist people working at
both levels of the system to enable them to decide when, where and how to refer cases.
Successful implementation of the referral system needs a progressive referral strategy
based on population needs and health system capacity; specific referral protocols well
understood by all actors; active communication and collaboration between referral
levels and other sectors; functional communication and transport arrangements; an
adequately equipped referral institution providing affordable services, supervision and
accountability for quality of care, and monitoring of effectiveness of the referral system
and policy support (Singh et al 2016:19). Based on the findings, Figure 6.1 depicts the
major elements in the strategy.
Figure 6.1 Elements of the strategy to improve the referral system
The study respondents’ suggestions to overcome the identified bottlenecks and
problems are discussed along with reference to the literature review.

137
6.5.1 Strategies for sending facilities
Delivery care at a nearby facility is a key element of the health system to ensure a
timely intervention for reducing the risk of maternal and perinatal death (Nyamtema,
Mwakatundu, N, Dominico, S, Mohamed, H, Pemba, S, Rumanyika, R, Kairuki, C,
Kassiga, I, Shayo, A, Issa, O, Nzabuhakwa, C, Lyimo, C, Van Roosmalen 2016:12). An
integrated and comprehensive approach can effectively address the distribution and
retention of health workforce in the system. This requires investment in training,
deployment, and retention of health workers; improvement in the quality of their
competencies; adopting a range of financial and non-financial incentives to improve
management systems and the work environment in which they operate (Koblinsky et al
2016:2311).
Delivering quality care also requires monitoring the effects of relatively less-experienced
health workers, staff rotation and the coverage of in-service BEmONC training (Austin et
al 2015:6). In addition to the availability and adequacy of the health workforce, a clear
national statement should be formulated of what should constitute primary care for
uncomplicated deliveries, and what mechanisms, including referral, need to be put in
place for complicated deliveries.
A study in Burundi identified robust protocols for the effective identification of obstetric
complications, together with health centre staff trained in the proficient use of these
protocols (Tayler-Smith et al 2013:998). The availability of the health workforce and
capacity of the lower level health system should thus be regularly measured against
those expectations (Koblinsky et al 2016:2312).
Meticulous follow up of adherence to high-quality clinical practice guidelines, and
utilisation of peer-to-peer or simulation-based training should be implemented to
improve providers' knowledge, clinical skills, attitudes, and women-centred approaches
(Koblinsky et al 2016:2308). Regular practice of skills acquired is an important
determinant to retain skills and to improve the quality of maternal care index score in
health care facilities with low volumes of deliveries (<500 births) (Kruk, Leslie, Verguet,
Mbaruku, Adanu & Langer 2016: e849).
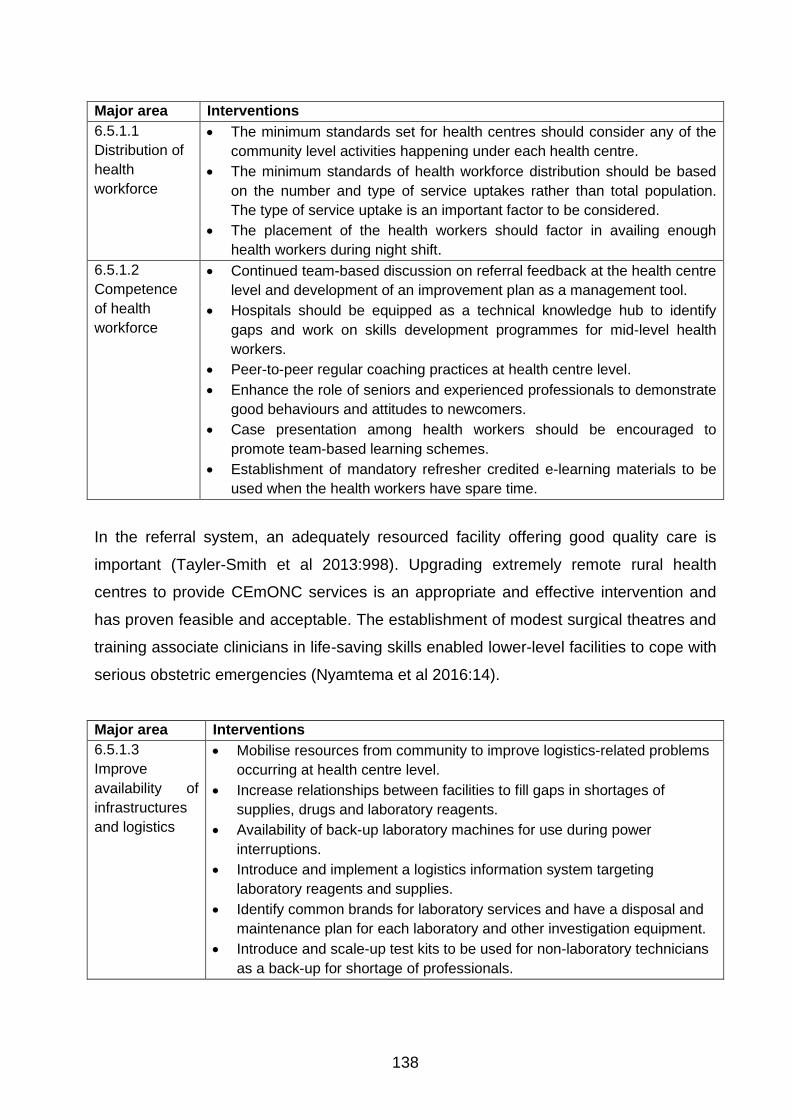
138
Major area Interventions
6.5.1.1
Distribution of
health
workforce
• The minimum standards set for health centres should consider any of the
community level activities happening under each health centre.
• The minimum standards of health workforce distribution should be based
on the number and type of service uptakes rather than total population.
The type of service uptake is an important factor to be considered.
• The placement of the health workers should factor in availing enough
health workers during night shift.
6.5.1.2
Competence
of health
workforce
• Continued team-based discussion on referral feedback at the health centre
level and development of an improvement plan as a management tool.
• Hospitals should be equipped as a technical knowledge hub to identify
gaps and work on skills development programmes for mid-level health
workers.
• Peer-to-peer regular coaching practices at health centre level.
• Enhance the role of seniors and experienced professionals to demonstrate
good behaviours and attitudes to newcomers.
• Case presentation among health workers should be encouraged to
promote team-based learning schemes.
• Establishment of mandatory refresher credited e-learning materials to be
used when the health workers have spare time.
In the referral system, an adequately resourced facility offering good quality care is
important (Tayler-Smith et al 2013:998). Upgrading extremely remote rural health
centres to provide CEmONC services is an appropriate and effective intervention and
has proven feasible and acceptable. The establishment of modest surgical theatres and
training associate clinicians in life-saving skills enabled lower-level facilities to cope with
serious obstetric emergencies (Nyamtema et al 2016:14).
Major area Interventions
6.5.1.3
Improve
availability of
infrastructures
and logistics
• Mobilise resources from community to improve logistics-related problems
occurring at health centre level.
• Increase relationships between facilities to fill gaps in shortages of
supplies, drugs and laboratory reagents.
• Availability of back-up laboratory machines for use during power
interruptions.
• Introduce and implement a logistics information system targeting
laboratory reagents and supplies.
• Identify common brands for laboratory services and have a disposal and
maintenance plan for each laboratory and other investigation equipment.
• Introduce and scale-up test kits to be used for non-laboratory technicians
as a back-up for shortage of professionals.
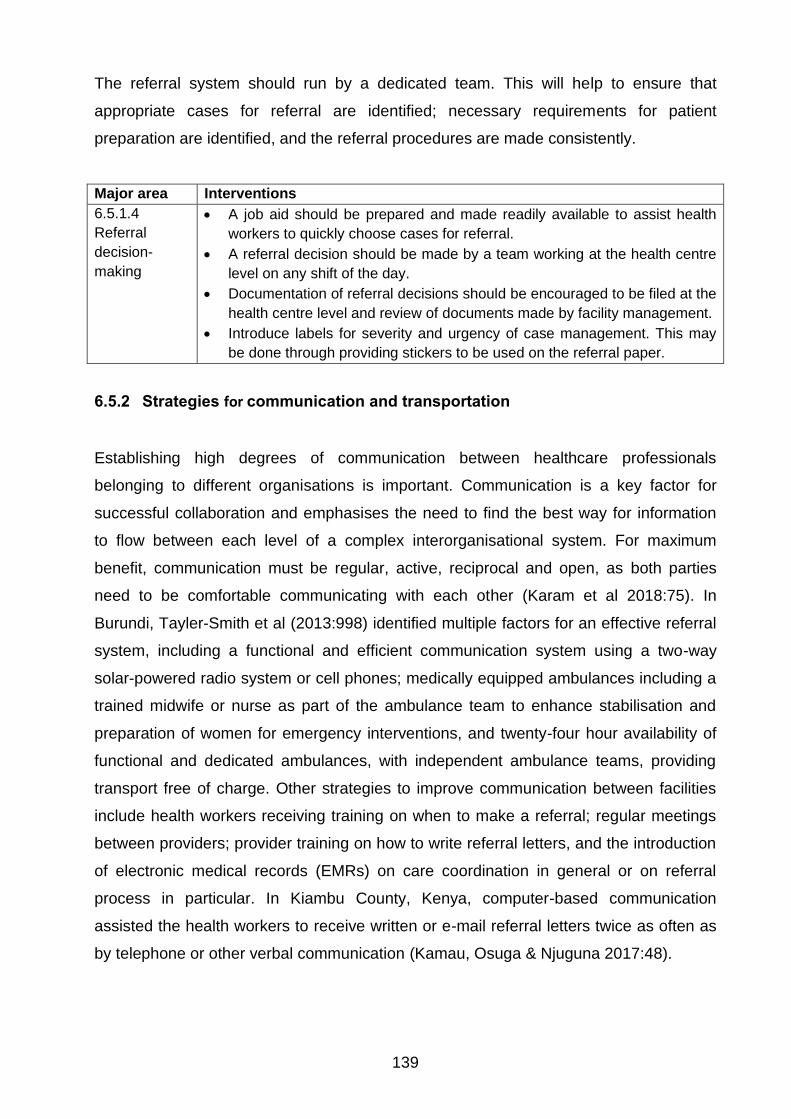
139
The referral system should run by a dedicated team. This will help to ensure that
appropriate cases for referral are identified; necessary requirements for patient
preparation are identified, and the referral procedures are made consistently.
Major area Interventions
6.5.1.4
Referral
decision-
making
• A job aid should be prepared and made readily available to assist health
workers to quickly choose cases for referral.
• A referral decision should be made by a team working at the health centre
level on any shift of the day.
• Documentation of referral decisions should be encouraged to be filed at the
health centre level and review of documents made by facility management.
• Introduce labels for severity and urgency of case management. This may
be done through providing stickers to be used on the referral paper.
6.5.2 Strategies for communication and transportation
Establishing high degrees of communication between healthcare professionals
belonging to different organisations is important. Communication is a key factor for
successful collaboration and emphasises the need to find the best way for information
to flow between each level of a complex interorganisational system. For maximum
benefit, communication must be regular, active, reciprocal and open, as both parties
need to be comfortable communicating with each other (Karam et al 2018:75). In
Burundi, Tayler-Smith et al (2013:998) identified multiple factors for an effective referral
system, including a functional and efficient communication system using a two-way
solar-powered radio system or cell phones; medically equipped ambulances including a
trained midwife or nurse as part of the ambulance team to enhance stabilisation and
preparation of women for emergency interventions, and twenty-four hour availability of
functional and dedicated ambulances, with independent ambulance teams, providing
transport free of charge. Other strategies to improve communication between facilities
include health workers receiving training on when to make a referral; regular meetings
between providers; provider training on how to write referral letters, and the introduction
of electronic medical records (EMRs) on care coordination in general or on referral
process in particular. In Kiambu County, Kenya, computer-based communication
assisted the health workers to receive written or e-mail referral letters twice as often as
by telephone or other verbal communication (Kamau, Osuga & Njuguna 2017:48).

140
Major area Interventions
6.5.2.1
Functionality
of the referral
liaison system
• Assign a focal person/coordinator with the right characteristics – skills of
coordination, approachable, responsible, active and organised to facilitate
the referral process.
• Facilities – workstation, registers, phone and filing system.
• Orientation of staff assigned to night shift about the procedures and the
documentation requirements and ensure any referred cases are presented
to the referral focal person as well as the head of the health centre.
• Assign three people, in eight-hourly shifts, in the liaison office with the
required tools/apparatus at the hospital level to ensure 24/7 availability.
• Introduce a performance standard and establish a feedback collection
system on the functionality of the liaison system – responsiveness to the
requests coming from health centres, follow up of referred cases until
discharge by health centre focal person, consistent use of communication
materials, completeness of documentation, feedback rate, survival rate of
referred cases, and appropriateness of referral.
• Introduce an electronic version referral and feedback communication
platform.
Transportation is another important dimension. A free ambulance service is highly cost
effective and a facilitator for the use of health facilities for delivery care (Tayler-Smith et
al 2013:999; Mahato et al 2017:51). Limited availability of transportation and lack of
communication and coordination between health centres and hospitals before and after
referrals hindered the efficiency of the referral system in Ethiopia (Austin et al 2015:3).
Major area Interventions
6.5.2.2
Availability of
transportation
facility and
team
• Advocate for the assignment of at least two ambulances for each district –
one solely dedicated for referrals between health centres and hospitals.
• Train emergency management technicians to be assigned with the
ambulances, including development of clear career pathway and scope of
practice.
• Use of ambulance or other public transportation options for health workers
who accompany the referred cases.
• Provide spaces at hospital level for accommodation of health workers who
accompany patients after midnight.
6.5.2.3
Proper
management
of the
ambulance
services
• Introduce a zonal or regional level pooled ambulance management system
especially for referrals between facilities.
• Ensure the placement of one of the ambulances at hospital level and all
related running expenses including drivers’ salary and benefits to be
covered by the hospital.
• Install a GPS system in the ambulance for proper tracking of its location
and monitoring can be done both at the pooled management station and
hospital level.
• Initiate a coordinated call station together with pooled management of
ambulance services.

141
6.5.3 Strategies for receiving facility
In Tamil Nadu, referral-in cases in hospitals reflected their capacity to treat emergency
obstetric cases in terms of manpower and materials, as perceived by lower level health
facilities (Rajasulochana & Dash 2018:368). Rajasulochana and Dash (2018:368) found
an urgent need to readdress the human resource policy for health care personnel;
devise mechanisms for periodic inspection and preventive maintenance of hospital
equipment and develop management capabilities and leadership skills. Primary
hospitals in Ethiopia are expected to serve as CEmONC facilities, which requires the
availability of blood transfusion and surgical (caesarean section) services in addition to
what is commonly available at the health centre level. Globally, CEmONC signal
functions are being expanded to include infection prevention and management for both
mothers and infants; monitoring and management of labour using the partograph; active
management of the third stage of labour, and infant thermal protection, feeding, and HIV
prevention (Otolorin et al 2015:S46). High-quality basic and emergency care services
include the importance of health facility strengthening, competency-based provider
education, and strong government ownership and coordination as essential precursors
to high impact evidence-based maternal and newborn interventions in low-resource
settings (Otolorin et al 2015:S46). It is imperative to make sure that these services are
always available irrespective of the day. To assist hospitals in providing the services,
countries have different support mechanisms. For example, India introduced the patient
welfare society (PWS) fund and annual maintenance grant (AMG) to enable smooth
hospital management (Rajasulochana & Dash 2018:373). Equipment procurement is
also linked to a mandatory annual maintenance contract by the suppliers and
mechanisms have been introduced for periodic inspection and preventive maintenance
of equipment (Rajasulochana & Dash 2018:375).
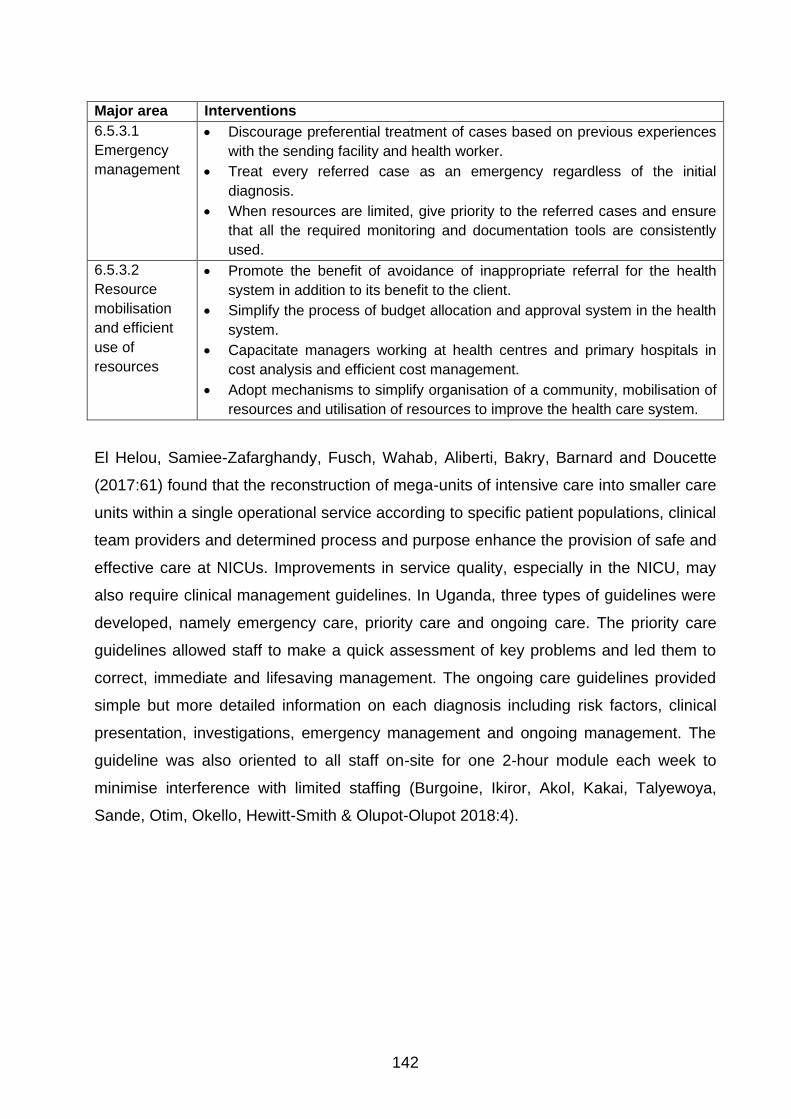
142
Major area Interventions
6.5.3.1
Emergency
management
• Discourage preferential treatment of cases based on previous experiences
with the sending facility and health worker.
• Treat every referred case as an emergency regardless of the initial
diagnosis.
• When resources are limited, give priority to the referred cases and ensure
that all the required monitoring and documentation tools are consistently
used.
6.5.3.2
Resource
mobilisation
and efficient
use of
resources
• Promote the benefit of avoidance of inappropriate referral for the health
system in addition to its benefit to the client.
• Simplify the process of budget allocation and approval system in the health
system.
• Capacitate managers working at health centres and primary hospitals in
cost analysis and efficient cost management.
• Adopt mechanisms to simplify organisation of a community, mobilisation of
resources and utilisation of resources to improve the health care system.
El Helou, Samiee-Zafarghandy, Fusch, Wahab, Aliberti, Bakry, Barnard and Doucette
(2017:61) found that the reconstruction of mega-units of intensive care into smaller care
units within a single operational service according to specific patient populations, clinical
team providers and determined process and purpose enhance the provision of safe and
effective care at NICUs. Improvements in service quality, especially in the NICU, may
also require clinical management guidelines. In Uganda, three types of guidelines were
developed, namely emergency care, priority care and ongoing care. The priority care
guidelines allowed staff to make a quick assessment of key problems and led them to
correct, immediate and lifesaving management. The ongoing care guidelines provided
simple but more detailed information on each diagnosis including risk factors, clinical
presentation, investigations, emergency management and ongoing management. The
guideline was also oriented to all staff on-site for one 2-hour module each week to
minimise interference with limited staffing (Burgoine, Ikiror, Akol, Kakai, Talyewoya,
Sande, Otim, Okello, Hewitt-Smith & Olupot-Olupot 2018:4).

143
Major area Interventions
6.5.3.3
Functionality of
the infrastructure
• The primary function of the hospital management should be ensuring
the availability and functionality of the standard infrastructure at the
hospital level.
• Strengthen the linkage with universities and use the opportunity to
mobilise resources to fill infrastructure related gaps.
• Maximise the use of multisectoral transformation plans to be
implemented in all districts.
• Ensure that savings from reduced inappropriate referrals are used to
further improve hospital infrastructure.
• Conduct operations research and present the results on the challenges
of the lack of infrastructure on quality of care and the loss in the system
and burden on the community to policy makers, programme managers
and facility managers.
6.5.3.4.
Functionality of
service units
(NICU and OR)
• Set a minimum list of equipment for each micro-unit at the NICU and
ensure the availability of functional equipment.
• Partition the NICU into micro units with glass partitions to ensure clear
view.
• Provide a separate room for medication preparation in the NICU.
• Establish strong internal supply and other logistics management
systems for the OR and NICU.
With regard to providing caesarean sections at primary hospitals, maximise the use of
emergency surgeons and carefully revise the benefit packages and motivational
schemes to increase the capacity to decentralise CEmONC services to the lower levels
of the health care administration (Nyamtema et al 2016:10).
Major area Interventions
6.5.3.5
Health workers’
motivation
• Establish new cadres when there is a need and after the development
of clear scope of practice.
• Do a quick analysis of the existing professions in the system and
establish clear career pathways.
• Ensure private practices at primary level care are either allowed or
prohibited to all. As lack of clarity leads to inconsistent application which
may demotivate health workers.
• Establish and regularly update health workforce account/database at
zonal and regional level.
• Establish a scope of practice that allows teamwork at every level of the
health system.
• Introduce benefit packages for practices rather than professions. For
example, any health workers working at delivery rooms should get risk
allowances.
• In addition to making health facilities client friendly, the Ministry of
Health should also make them provider friendly. The work environment

144
Major area Interventions
should not expose people to security problems.
• Assign health service managers who have worked in various levels of
the health system and attended leadership development programmes.
This would promote team building, problem solving, staff management,
conflict management and change management.
The consistent and correct use of labour monitoring in the health system requires
attention and improvement. Apart from maintaining key functionalities of a partograph,
an improved labour monitoring tool should be user-friendly, feasible to deploy in the
local context, reliable as a tool for detecting danger signs in a timely manner, and,
ideally, be more automated/dynamic and less complex for mid-level health workers to
use (Yang et al 2017:24).
Major area Interventions
6.5.3.3
Monitoring of
labour
management
• Provide a copy of partograph completion.
• Test and scale-up an electronic version of a simplified partograph.
• Introduce two types of checks – timely update and chart completion. The
first can be made by a first line supervisor and the second by a quality
team established at the hospital level.
• Focus on monitoring the proper use of the tool by senior and experienced
midwives as they can be considered as an example or model for others.
6.5.4 Strategies aiming at referral governance, monitoring and accountability
Referral systems frequently look good on paper, but are not well implemented
(Eskandari et al 2013: 231). Implementation of a system requires a clear
governance/accountability framework and monitoring system (Singh et al 2016:18). The
governance system may take two forms – representation and clinical governance. In
Indonesia, representatives of public and private health facilities collaborated with district
health officials and civil society representatives to map the most efficient referral
pathways between facilities and define their individual roles and responsibilities (Hyre,
Caiola, Amelia, Gandawidjaja, Markus & Baharuddin 2019:10). Clinical governance
encompassed shared accountability for sustaining and improving service quality and
using data for decision-making. A team within the facility promoted accountability,
communication, and ongoing learning within health facilities by introducing and
establishing purposefully selected principles of good care and practices to strengthen
clinical governance (Hyre et al 2019:10).

145
Major area Interventions
6.5.4.1
Strengthen the
existing quality
improvement team to
ensure clinical
governance
• Ensure the functionality of referral committees at health centre
levels.
• Strengthen the use of senior staff in quality audits at hospitals and
their catchment health centres.
• Ensure the functionality of the quality improvement teams at health
centres and proper use of improvement models for quality
improvement projects at local level.
In rural Southern Tanzania, the health system administration and district health care
facilities frequently lacked the capacity to sustain the initiative and improve interventions
(Jaribu, Penfold, Manzi, Schellenberg & Pfeiffer 2016:8). In Indonesia, interventions to
send cases and receive guidance from hospital staff on pre-referral stabilisation, SMS
messages and phone calls were routed among facilities according to the referral
pathways outlined in the referral network (Hyre et al 2019:10). In addition, regular
emergency drills were introduced to improve clinical performance, teamwork and
communication, and to identify and resolve sources of delays in responsiveness (Hyre
et al 2019:10). In India, referral audits were introduced for obstetric emergencies to
improve referral systems for obstetric care and prevent delays (Singh et al 2016:18). In
the Upper East Region of Ghana, adherence to standardised referral guidelines was
maintained after the introduction of referral audit (Kyei-Onanjiri, Carolan-Olah, Awoonor-
Williams & McCann 2018:6). In Addis Ababa, Austin et al (2015:5) found that back
referrals of simple cases strengthened accountability and alleviated hospital
overcrowding.
Major area Interventions
6.5.4.2
Awareness of
referral system
• Actively collaborate with health centres to educate the community on
health systems literacy to assist them know what kinds of services are
available at health centres and hospitals.
• Introduce a discouraging strategy on self-referred cases, such as priority
to referred cases, co-payments, no ambulance services for return.
6.5.4.3
Community
engagement to
improve referral
practices
• Strengthen and encourage recently delivered mothers’ participation in the
pregnant women’s conference to share experiences on delivery care and
provide feedback to the midwives from the health centres.
• Strengthen the performance management team at health centre level to
continuously and regularly conduct exit interviews and consistent use of
community score cards to monitor mothers and their families’ experience
of care and ambulance management.
• Establish a platform for open discussion between the client or her family
member and service provider.
• Allow family members to accompany mothers so that they monitor the
quality of care provided to the mother.

146
Major area Interventions
6.5.4.4
Consistent
provision of
feedback on
referred cases
• Give consistent feedback on every referred case in a way convenient to
the staff working at hospital level.
• Organise regular sessions among health centres, hospital and woreda
health offices to review referrals and share responsibility to improve the
situation.
Improvement regarding the referral system requires setting performance standards.
These standards should be based on the MOH referral guidelines, including elements of
a functional referral system, and be used regularly by district health office teams to
assess performance of the referral system, identify gaps, and drive action plans to
address gaps (Hyre et al 2019:10). This also requires framing indicators at various
levels: complicated maternal admissions as a percentage of total maternal admissions,
complicated neonatal admissions as a percentage of total neonatal admissions, and
referral-in and referral-out maternal and neonatal cases (Rajasulochana & Dash
2018:368; Acker, Sovanna & Strehlow 2017:20). The data can be collected from the
registers, audit reports or GIS modelling combined with population data (Chaturvedi et
al 2014:9). The results should be presented to staff in the form of laminated charts, and
the data reviewed during regular internal meetings, and governance meetings (Hyre et
al 2019:9).
Major area Interventions
6.5.4.5
Performance
measurement
and management
• Introduce a by-pass rate as a proxy indicator for community
engagement and client preference as part of quality of care
measurement at the health centre level.
• The hospital should regularly conduct referral audits and compile
findings and explore reasons for identified unnecessary referrals.
• Introduce surprise audits at NICU and delivery wards, including
operation rooms.
• Include appropriateness of referral and referral feedback rates in the key
performance indicators for health centres and hospitals, respectively.
147
6.6 CONCLUSION
This chapter described the strategies developed to improve the maternal and newborn
care referral system at primary level care. The strategies are based on the findings, the
literature review and experts’ feedback. The major strategies were categorized in four:
Strategies for sending facilities, communication and transportation, receiving facility and
overall referral governance. Each category of strategy included major focus areas and
possible interventions for consideration.
Chapter 7 briefly describes the conclusions of the study and makes recommendations
for practice and further research.
148
CHAPTER 7
FINDINGS, LIMITATIONS AND RECOMMENDATIONS
7.1 INTRODUCTION
Maternal and newborn health is one of the main indicators of a good health system.
Maternal death affects the family, especially the children, immeasurably, and the
community and economy.
Globally, half of all maternal deaths, one-third of stillbirths and one quarter of neonatal
deaths are due to delivery-related complications (Pasha et al 2015:8). Emergency
medical, surgical and obstetric management and service are less developed in low- and
middle-income, resource-limited countries. Ethiopia has high maternal and neonatal
mortality rates (CSA [Ethiopia] & ICF 2017:124, 252). The reduction of maternal
mortality is beneficial for both mother and newborn and depends on the availability of
high-quality delivery care and a functioning referral system (Dewana et al 2017:31). An
effective referral system is a critical component of the health system for the reduction of
maternal mortality and morbidity due to obstetric complications (Chaturvedi et al
2014:1). The actions of lower-level health facilities with limited capacity affect the time
required to complete the referral process for emergency case management. The health
sector in Ethiopia is a three-tier health care delivery system. The first tier or level is a
woreda or district health system comprising a primary hospital (with a population
coverage of 60,000-100,000 people), health centres (PHC facilities serving a population
of 15,000-25,000) and their satellite health posts (serving 3,000-5,000) that are
connected to each other by a referral system (FMoH 2010:4). This study focused on first
level health care delivery, especially maternal and newborn services.
A lack of coordination between facilities, however, has negatively affected communities’
trust and the efficiency of health service delivery. Regarding obstetrics emergency
management, in Ethiopia, all health centres are expected to implement Basic
Emergency Obstetrics and Neonatal Care (BEmONC) by fulfilling all the seven signal
functions and primary hospitals implement comprehensive emergency obstetrics and
neonatal care (CEmONC). Health centres should be able to identify cases requiring

149
advanced care and refer them to the hospitals promptly. The urgency of care required
for women in labour means that they should be treated as emergency cases.
An effective referral system is a critical component of the health system for the
reduction of maternal mortality and morbidity due to obstetric complications (Chaturvedi
et al 2014:1). The actions of lower-level health facilities with limited capacity affected the
time required to complete the referral process for emergency case management. The
major components of the referral system – sending, transporting and receiving - about
maternal and neonatal health were analysed by means of medical record review, health
service costing and in-depth interviews with health workers.
This chapter briefly summarises the findings, presents the limitations of the study and
makes recommendations for practice and further research.
7.2 FINDINGS
The study found that the selected hospitals and health centres had a referral system,
but several factors impeded the effective implementation of the system. An effective
referral system should have formal communication and transport systems, capable
receiving facilities, protocols for sending and receiving facilities, and take accountability
for providers’ performance (Tiruneh et al 2018:4).The findings are discussed according
to sending facility, transportation, receiving facility, and referral control and
accountability.
7.2.1 Sending facility
The study found that knowledge of referral pathways determined the referral practices
at the lower level of the system. There were self-referred cases and referrals by health
workers because of family and community members’ advice, private facility practices
and lack of regular updates of the referral directory. Communication between facilities is
another important factor. A strong referral focal person and referral committee
contribute to facility standards. Practice differed from facility to facility. Prior
communication before referral should happen, but the hospitals complained about a
lack thereof. This could be due to health centre management’s concentration on
establishing the focal person and committee and regularly following performance.
150
Patient pre-referral preparation was not done well. All the referred cases had referral
slips from the sending facilities, but information was incomplete and/or inaccurate. At
some of the sites, referral decisions were made solely by the medical doctors rather
than a committee. The number of inappropriate referrals to primary hospitals indicated a
need to mobilise and educate the community on the services available and protocols of
care.
The competence and motivation of the health workers at health centres were affected
by untimely payments including salary and other benefits, shortage of supplies and
drugs, limited management skills, and budget shortages. Unavailability of key health
workers, such as midwives and laboratory technicians, also affected the availability of
services and completeness of care. In addition, the introduction of benefit packages
based on profession rather than practice negatively affected motivation and teamwork
at health centre level.
Decisions on referral cases should be a team effort. Not all the facilities had a referral
team and referral focal person. Decision-making was also affected by the number of
health workers available, caseload, assignment of medical doctors, and follow up by
management. The functionality of the referral committee and focal person, and
knowledge of the referral pathways determine the timely initiation, communication,
documentation and follow up of referrals.
7.2.2 Transportation
Emergency medical transportation is a critical component of the referral system; delays
in transportation determine the outcome of care at hospital level. Transporting the
referred cases was a challenge. All the woredas visited had at least one ambulance for
patient transportation. However, its availability was determined by the number of calls,
who had called the driver, and other assignments given by the woreda health office.
Ambulance management was generally poor, lacked a tracking system, and was
negatively affected by confusion and lack of coordination between facilities. In addition,
there were frequent breakdowns due to limited budget for maintenance and running
costs. In several cases, public transport was an option if the client agreed. However,
having ambulances available to some patients and sending others by public transport
was a matter for discussion between the community members and the health centre
151
management. In some cases, health workers requested vehicles from the government
offices and neighbouring woredas. The available ambulances were not well equipped
for emergency management or well-staffed. In some woredas, emergency management
technicians were assigned to each ambulance to provide the service while transporting
the referred cases. However, health professionals at health centre level accompanied
cases based on the caseload and type of referred cases. In general, due to the
reporting line to the woreda rather than the hospital and no strong tracking system,
ambulance management was poorly done to provide the service.
7.2.3 Receiving facility
The readiness of the hospital to receive the referred clients and provide quality care was
an important component of the referral system. Service availability was challenged by
the capacity of the hospital to have the necessary rooms and infrastructure, highly
trained workforce, and supplies and laboratory reagents available. The number of cases
visiting the hospitals also comprised quality of care. The reception of referred cases
receiving preferential treatment based on previous knowledge of the sending facility and
health workers, and communication between the sending and receiving facility was not
well established due to logistics, documentation factors and patients coming alone. The
study found that logistical problems such as power interruptions, non-functionality of
equipment and tests and unavailability of blood banks or refrigerators affected the
availability of services in the selected facilities.
Quality of maternal care depends on the quality of the labour monitoring and thus
evidence-based care. However, partograph utilisation was not consistently practised.
Admitted cases were not properly monitored because of the high caseload, limited
supervision support, and the focus of follow up. In many cases, healthcare professionals
tended to “treat charts” rather than promote evidence-based practices while providing
care. The quality of practice was challenged by insecurity in the work environment but
strengthened by good teamwork and available consultation support. Beyond providing
services at hospital level, the primary hospitals failed to improve the capacity of health
centres through mentorship support, communicating positive feedback on referrals and
linking hospital level and health centre management structures.
152
7.2.4 Referral control and accountability
The respondents indicated that there was a referral system, but its implementation
depended on the people involved, the use of performance indicators, follow up by
management, and an accountability framework. Some of the selected facilities had
started forming a multidisciplinary team to develop and improve the referral system,
including ambulance and drug availability, patient-centred and friendly care, and regular
assessment using the community scorecard programme. Health facility governing
boards need to ensure required capacity, in terms of competence, service availability,
budget and motivation of health workers at health centre level to minimise unnecessary
referrals.
7.3 LIMITATIONS OF THE STUDY
The study was restricted to two primary hospitals and six health facilities in one region
of Ethiopia therefore the findings cannot be generalised to other regions or the whole
country. The researcher reviewed medical records to evaluate the completeness and
outcome of care at the hospital level. The results may not be conclusive as some care
may have been done, but not recorded. In addition, some cost items were programme
related expenses and the costs may not be accurate.
7.4 RECOMMENDATIONS
Based on the findings, the researcher makes the following recommendations for
practice and further research.
7.4.1 Practice
The recommendations for practice are presented under sending facility, transportation,
receiving facility, and control and accountability.

153
7.4.1.1 Sending facility
Health centres are the first point of contact in Ethiopia’s health system and should be
capable of providing acceptable quality care. Quality care is affected by structure and
process.
• Structure
The human resource distribution and availability require attention. The placement of
health workers from woredas should be based on caseload and community level
activities. Each health centre should have a minimum of three midwives. When health
workers need to attend meetings/training and community level activities, temporary
replacement workers should be available. This requires additional staff and meetings on
site for management of emergencies.
Facility managers should motivate health workers and ensure payment of staff benefit
packages. All managers must receive mandatory management training before
assignment and attend regular mentorship programme sessions. Health workers’
benefit packages, such as risk allowance, should be based on practice.
Each facility must appoint a referral focal person and referral committee to facilitate
communication and promote teamwork among the multidisciplinary teams. The referral
focal person must have the necessary equipment to facilitate communication, document
experiences and organise a joint review of feedback on referrals. Each facility must
have a copy of written guidelines on the role of the referral focal person in order to
promote consistency in the absence of the focal person. Facility management must
appoint a referral committee to improve the quality of referral decisions, promote
teamwork and team accountability, and peer support.
Health facilities must ensure the availability of drugs, supplies and laboratory reagents
and the implementation of the integrated pharmaceutical logistics system. Health centre
governing boards must allocate resources for purchases from private companies,
especially in emergencies.
154
• Process
A referral directory is an essential tool to ensure health workers know about the referral
pathways. Each facility should have a referral directory placed in an area accessible to
all health workers. The referral directory must be updated regularly. In the long term,
developing a mobile application may be required.
Referral guidelines should be developed and maintained at health centres to facilitate
decisions on referrals. All health workers should be trained in the use of these
guidelines.
Simple job aids/algorithm to facilitate easy decision on referral cases should be
developed and maintained at health centre levels. The knowledge and skills of the
health workers on the appropriate use of them should be enhanced.
Pre-referral management is an important step in the care process. This step requires
the availability of the necessary drugs and supplies to provide this service. Management
should oversee complete pre-referral management.
Referral communication should be complete and based on agreed referral formats. It is
also important to attach partographs for the cases which are in active labour phase. It is
imperative to sensitise the health workers that decisions are based on the items
captured in the partograph format.
7.4.1.2 Transportation
Emergency medical transportation is a critical component of the referral system.
Accordingly, the researcher recommends the following:
• To improve availability, the study recommends at least two ambulances for each
woreda: one to be directly managed by the hospital and the other by the woreda
health office. The hospital ambulance should primarily transport cases between
health centre and hospital and beyond. The woreda ambulance should primarily
transport people from home to health centres.
155
• The recruitment of drivers should consider applicants’ character as well as
qualifications. Ambulance drivers need to be friendly, qualified, and able to
provide patient-centred emergency transportation.
• Emergency teams or health workers should be available to accompany patients
with the ambulance. This needs to be mandatory with a framework stating scope
of work and and accountability.
• Ambulances should be equipped with fully functioning essential lifesaving
equipment.
• In the long-term, establishing a central call centre, perhaps at zone level, and
installing GPS instruments in vehicles might enhance a pooled use of vehicles.
7.4.1.3 Receiving facility
In order to improve maternal and newborn care at the receiving facility, the study
recommends the following:
• Structure
Hospital and health centre management should be responsible for and ensure the
proper use of allocated budgets. Management should ensure efficient use of resources
at hospital level. In addition, one-time logistics related problems should be addressed
through community level resource mobilisation strategy.
Inappropriate referrals should be followed up and minimised in order to limit wastage
and improve the capacity of health centres to provide the required basic services to the
target population.
NICU services should be reorganised to ensure the rooms are separated with glass
partitions and fitted with the required equipment that is functional all the time. Health
workers and support staff should be trained in assembling and preventive maintenance.
The primary hospitals provide services to selected villages/kebeles, which may
compromise or overload the referral system in some instances. Thus, the hospital
should dedicate separate rooms (e.g., EmONC) for basic services to people coming
from the direct catchment population.
156
Each hospital should have a liaison office staffed with three people working in three
shifts. The liaison office staff should always be available, document referral-ins and
referral-outs, and ensure feedback is provided to the health centres.
• Process
Emergency cases should receive priority when they reach hospitals. Preferential
treatment should be avoided as that could affect the completeness of care. Different
types of referral papers could be used to indicate the urgency of care since some cases
may have been referred because of logistics related problems.
A referral audit is one of the tools to ensure appropriate clinical cases are attended by
hospitals and communication between health centres and hospitals is guided
objectively. A tool for audit can be adapted from the Robinson case classification for
delivery management and NICU case classification.
Labour monitoring is a continuous process and should be considered an element of
care that extends from health centres. Therefore, partographs should accompany
referrals and health workers should be trained in the use and completion thereof as a
priority. In addition, quality checks while using the tool may improve its appropriate use
for evidence-based decisions in labour management. Focusing on senior midwives in
the team should improve the culture of use when new staff join the team.
• Outcome
Documentation of the outcome of care is frequently omitted, especially in NICUs. To
improve documentation, including for adverse outcomes, “blaming and shaming” should
be avoided. Process-based performance indicators should be introduced and used.
7.4.1.4 Control and accountability framework
Health facility management should review referral appropriateness, planning and
availability of quality care at the appropriate level.

157
The community scorecard programme should include issues related to referrals and the
results of the score used to improve the health system. Facility level management
should monitor performance standards about referral management and monitoring.
All health workers should know the referral communication protocols and formats, and
appropriate timing and place for referrals.
The Ministry of Health should develop and issue key performance indicators. All health
facilities should have these guidelines available and use them.
7.4.2 Further research
The researcher recommends that further research be conducted on the following topics:
• An examination of household and family costs due to inappropriate referrals and
the economic benefits of managing inappropriate referrals
• The relationship between the overall performance of the health system and the
appropriateness of referral
• The role of quality improvement networks in facilitating referral practices at lower
levels of the Ethiopian health system.
7.5 CONCLUSION
This chapter outlined the findings and limitations of the study and made
recommendations for practice and further research. The purpose of the study was to
formulate strategies to improve maternal and newborn health care referrals in the health
system in Ethiopia. The researcher developed strategies to improve maternal and
newborn referrals based on the findings. The researcher will disseminate the findings in
recognised scientific journals and presentations at regional and national forums.
158
LIST OF REFERENCES
Abdella, MN, Meskelu, J, Teklu, AM & Bekele, D. 2019. Obstetrics referrals at Saint
Paul’s Hospital Millennium Medical College (SPHMMC): pre-referral care and
appropriateness. Ethiopian Journal of Reproductive Health (EJRH), 11(2):7-11.
Accorsi, S, Somigliana, E, Solomon, H, Ademe, T, Woldegebriel, J, Almaz, B, Zemedu,
M, Manenti, F, Tibebe, A, Farese, P, Seifu, A, Menozzi, S & Putoto, G. 2017. Cost-
effectiveness of an ambulance-based referral system for emergency obstetrical and
neonatal care in rural Ethiopia. BMC Pregnancy & Childbirth, 17(1):220.
Acharya, R, Badhu, A, Shah, T & Shrestha, S. 2017. Availability of life support
equipment and its utilization by ambulance drivers. Journal of Nepal Health Research
Council, 15(2):182-186.
Acker, PC, Sovanna, T & Strehlow, M. 2017. Emergently accessing a higher level of
care: referral system strengthening efforts to improve maternal and child health in
Cambodia. Annals of Global Health, 83(1):18-58.
Adeoye, IA, Ijarotimi, OO & Fatusi, AO. 2015. What are the factors that interplay from
normal pregnancy to near-miss maternal morbidity in a Nigerian tertiary health care
facility? Health Care for Women International, 36(1):70-87.
Adler, L, Yi, D, Li, M, McBroom, B, Hauck, L, Sammer, C, Jones, C, Shaw, T &
Claassen, D. 2018. Impact of inpatient harm on hospital finances and patient clinical
outcomes. Journal of Patient Safety, 14(2):68.
Adolphson, K, Axemo, P & Högberg, U. 2016. Midwives’ experiences of working
conditions, perceptions of professional role and attitudes towards mothers in
Mozambique. Midwifery, 40:95-101.
Afolaranmi, TO, Hassan, ZI, Filibus, DI, Al-Mansur, UA, Lagi, LA, Kumbak, FD, Daboer,
JC & Chirdan, OO. 2018. Referral system: an assessment of primary health care
centres in Plateau State, North Central Nigeria. World Journal of Research and Review,
6(1):5-7.

159
Ajwant, WNO. 2013. The influence of referral service on household access to health
care services in Eldoret municipality, Keyna, 1st Annual International Interdisciplinary
Conference Proceeding. AIIC 24-26 April. Azores, Portugal:713-715.
Allanson, E, Tunçalp, Ö, Gardosi, J, Pattinson, RC, Erwich, JJH, Flenady, VJ, Frøen,
JF, Neilson, Chou, D, Mathai, M, Saya, L, & Gülmezoglua, M. 2016. Classifying the
causes of perinatal death. Bulletin of the World Health Organization, 94(2):79-79.
Aluvaala, J, Nyamai, R, Were, F, Wasunna, A, Kosgei, R, Karumbi, J, Gathara, D &
English, M. 2015. Assessment of neonatal care in clinical training facilities in Kenya.
Archives of Disease in Childhood, 100(1):42-47.
Arnold, R, Van Teijlingen, E, Ryan, K & Holloway, I. 2015. Understanding Afghan
healthcare providers: a qualitative study of the culture of care in a Kabul maternity
hospital. BJOG: An International Journal of Obstetrics & Gynaecology, 122(2):260-267.
Austin, A, Langer, A, Salam, RA, Lassi, ZS, Das, JK & Bhutta, ZA. 2014. Approaches to
improve the quality of maternal and newborn health care: an overview of the evidence.
Reproductive Health, 11 Suppl 2: S1-S7.
Austin, A, Gulema, H, Belizan, M, Colaci, DS, Kendall, T, Tebeka, M, Hailemariam, M,
Bekele, D, Tadesse, L, Berhane, Y & Langer, A. 2015. Barriers to providing quality
emergency obstetric care in Addis Ababa, Ethiopia: healthcare providers’ perspectives
on training, referrals and supervision, a mixed methods study. BMC Pregnancy and
Childbirth 15(1):3-6.
Baker, U, Peterson, S, Marchant, T, Mbaruku, G, Temu, S, Manzi, F & Hanson, C.
2015. Identifying implementation bottlenecks for maternal and newborn health
interventions in rural districts of the United Republic of Tanzania. Bulletin of the World
Health Organization 93(6):380-389.
Bartlett, L, Weissman, E, Gubin, R, Patton-Molitors, R & Friberg, IK. 2014. The impact
and cost of scaling up midwifery and obstetrics in 58 low- and middle-income countries.
PLoS One, 9(6):e98550.

160
Berhan, Y & Berhan, A. 2014. Causes of maternal mortality in Ethiopia: a significant
decline in abortion-related death. Ethiopian Journal of Health Sciences, 24:15-23.
Bhattacharya, S. 2017. Health system strengthening focusing on referrals: an analysis
from India. JOJ Nursing and Health Care, 2(4):3.
Bhattacharyya, S, Issac, A, Rajbangshi, P, Srivastava, A & Avan, BI. 2015. “Neither we
are satisfied nor they” – users’ and providers’ perspective: a qualitative study of
maternity care in secondary level public health facilities, Uttar Pradesh, India. BMC
Health Services Research, 15:421 - 431.
Biswas, A, Anderson, R, Doraiswamy, S, Abdullah, ASMd, Purno, N, Rahman, F &
Halim, A. 2018. Timely referral saves the lives of mothers and newborns: midwifery-led
continuum of care in marginalized teagarden communities: a qualitative case study in
Bangladesh. F1000Research, 7:365-373.
Bitew, Y, Awoke, W & Chekol, S. 2016. Birth Preparedness and Complication
Readiness Practice and Associated Factors among Pregnant Women, Northwest
Ethiopia. International Scholarly Research Notices. 2016:1-8.
Blundell, N, Clarke, A & Mays N. 2010. Interpretations of referral appropriateness by
senior health managers in five PCT areas in England: a qualitative investigation. Quality
and Safety in Health Care, 19:182-186.
Bohren, MA, Oladapo, OT, Tunçalp, Ö, Wendland, M, Vogel, JP, Tikkanen, M, Fawole,
B, Mugerwa, K, Souza JP, Bahl, R, Gulmezoglu, M, WHO BOLD Research Group.
2015. Formative research and development of innovative tools for “Better Outcomes in
Labour Difficulty” (BOLD): study protocol. Reproductive Health, 12(1):2.
Bordens, KS & Abbott, BB. 2018. Research design and methods: a process approach.
10th edition. Dubuque, IA: McGraw-Hill Education.

161
Bosch, X, Escoda, O, Nicolás, D, Coloma, E, Fernández, S, Coca, A & López-Soto, A.
2014. Primary care referrals of patients with potentially serious diseases to the
emergency department or a quick diagnosis unit: a cross-sectional retrospective study.
BMC Family Practice, 15(1):75-76.
Bowling, A. 2014. Research methods in health: investigating health and health services.
4th edition. Maidenhead, NY: Open University Press.
Bradley, S, Kamwendo, F, Chipeta, E, Chimwaza, W, De Pinho, H & McAuliffe, E. 2015.
Too few staff, too many patients: a qualitative study of the impact on obstetric care
providers and on quality of care in Malawi. BMC Pregnancy and Childbirth, 15:65-71.
Brenner, S, De Allegri, M, Gabrysch, S, Chinkhumba, J, Sarker, M & Muula, AS. 2015.
The quality of clinical maternal and neonatal healthcare: a strategy for identifying
“routine care signal functions”. PloS One 10(4):2-3.
Brink, HI, Van der Walt, C & Van Rensburg, G. 2012. Fundamentals of research
methodology for health care professionals. 3rd edition. Pretoria: Juta.
Bruce, N, Pope, D & Stanistreet, D. 2018. Quantitative methods for health research: a
practical interactive guide to epidemiology and statistics. 2nd edition. Hoboken, NJ:
Wiley.
Burgoine, K, Ikiror, J, Akol, S, Kakai, M, Talyewoya, S, Sande, A, Otim, T, Okello, F
Hewitt-Smith, A & Olupot-Olupot, P. 2018. Staged implementation of a two-tiered
hospital-based neonatal care package in a resource-limited setting in Eastern Uganda.
BMJ Global Health 3(1):4.
Campbell, CB. 2017. ECMO transport: The role of critical care paramedics. Qatar
Medical Journal, 2017(1):53.
Campbell, J, Sochas, L, Cometto, G & Matthews, Z. 2016. Evidence for action on
improving the maternal and newborn health workforce: the basis for quality care.
International Journal of Gynaecology and Obstetrics, 132(1):126-129.
162
Central Statistical Agency (CSA) [Ethiopia] and ICF. 2016. Ethiopia demographic and
health survey, 2016. Addis Ababa, Ethiopia, and Rockville, MD: CSA and ICF.
Chaturvedi, S, Randive, B, Diwan, V & De Costa, A. 2014. Quality of obstetric referral
services in India’s JSY cash transfer programme for institutional births: a study from
Madhya Pradesh Province. PLoS One 9(5):1-9.
Chavane, LA, Bailey, P, Loquiha, O, Dgedge, M, Aerts, M & Temmerman, M. 2018.
Maternal death and delays in accessing emergency obstetric care in Mozambique. BMC
Pregnancy and Childbirth, 18(1):1-6.
Chow, S, Chow, R, Popovic, M, Lam, M, Popovic, M, Merrick, J, Stashefsky Margalit,
RN, Lam, H, Milakovic M, Chow E and Popovic J. 2015. A selected review of the
mortality rates of neonatal intensive care units. Frontiers in Public Health, 3:1-3.
Clayton, J. 2019. The five stages of the strategic management process. From:
https://smallbusiness.chron.com/five-stages-strategic-management-process-18785.html
(accessed 08 May 2019).
Creswell, JW & Creswell, JD. 2018. Research designs: qualitative, quantitative, and
mixed methods approach. 5th edition. Los Angeles: Sage.
Curtis, EA & Drennan, J. 2013. Quantitative health research issues and methods. New
York: Open University Press.
Delshad, V, Shemshad, H, Moradian, Mj, Ahmadi, S, Malkyan, L & Sabzalizadeh, S.
2016. The effect of applying global positioning system in ambulances on response time
of Tehran emergency medical service. Health in Emergencies and Disasters Quarterly.
1(3):125-128.
Dewana, Z, Gebremariam, A, Abdulahi, M, Fikadu, T & Facha, W. 2017. Quality of
delivery service at public health facilities in Arba Minch District, Gamo Gofa Zone,
Southern Ethiopia. Journal of Gynecology and Obstetrics, 5(2):31-35.

163
Donabedian, A. 1988. The quality of care: how can it be assessed? JAMA,
260(12):1743-1748.
Ebener, S, Guerra-Arias, M, Campbell, J, Tatem, AJ, Moran, AC, Johnson, F, Fogstad,
H, Stenberg, K, Neal, S, Bailey, P, Porter, R, Matthews, Z. 2015. The geography of
maternal and newborn health: the state of the art. International Journal of Health
Geographics, 14:19.
El Helou, S, Samiee-Zafarghandy, S, Fusch, G, Wahab, MGA, Aliberti, L, Bakry, A,
Barnard, D & Doucette, J. 2017. Introduction of microsystems in a level 3 neonatal
intensive care unit: an interprofessional approach. BMC Health Services Research,
17(1):61.
Elmusharaf, K, Byrne, E, AbuAgla, A, AbdelRahim, A, Manandhar, M, Sondorp, E &
O’Donovan, D. 2017. Patterns and determinants of pathways to reach comprehensive
emergency obstetric and neonatal care (CEmONC) in South Sudan: qualitative
diagrammatic pathway analysis. BMC Pregnancy and Childbirth, 17(1): 1 - 14.
Eskandari, M, Abbaszadeh, A & Borhani, F. 2013. Barriers of referral system to health
care provision in rural societies in Iran. Journal of Caring Sciences, 2(3):229-236.
Federal Ministry of Health. 2007. Standards for access and quality of health service.
Addis Ababa: FMoH.
Federal Ministry of Health. 2010. Guideline for implementation of a patient referral
system. Addis Ababa: FMoH.
Federal Ministry of Health. 2014. Neonatal Intensive Care Unit (NICU) Training. Addis
Ababa, Ethiopia.
Federal Ministry of Health. 2015a. Health sector transformation plan (HSTP),
2015/2016-2019/2020. Addis Ababa, Ethiopia.
Federal Ministry of Health. 2015b. National strategy for newborn and child survival in
Ethiopia, 2015-2020. Addis Ababa. Ethiopia.
164
Filby, A, McConville, F & Portela, A. 2016. What prevents quality midwifery care? A
systematic mapping of barriers in low and middle income countries from the provider
perspective. PLOS ONE, 11(5):e0153391.
Floyd, J & Fowler, JF. 2014. Survey research methods. 5th edition. Los Angeles: Sage.
Franklin, M, Lomas, J, Walker, S & Young, T. 2019. An educational review about using
cost data for the purpose of cost‑effectiveness analysis. Pharmacoeconomics, 37:631-
643.
Fujita, W, Mukumbuta, L, Chavuma, R & Ohashi, K. 2015. Quality of partogram
monitoring at a primary health centre in Zambia. Midwifery, 31(1):191-196.
Ganle, JK, Fitzpatrick, R, Otupiri, E & Parker, M. 2016. Addressing health system
barriers to access to and use of skilled delivery services: perspectives from Ghana:
Health system barriers to delivery services. The International Journal of Health Planning
and Management. 31(4):e235-e253.
Goldenberg, RL, Saleem, S, Pasha, O, Harrison, MS & McClure, EM. 2016. Reducing
stillbirths in low-income countries. Acta Obstetricia et Gynecologica Scandinavica,
95(2):135-143.
Goodman, MS & Thompson, VS (eds). 2017. Public health research methods for
partnerships and practice. 1st edition. New York: Taylor & Francis Group.
Groppi, L, Somigliana, E, Pisani, V, Ika, M, Mabor, JL, Akec, HN, Nhial, JA & Mading,
MS. 2015. A hospital-centred approach to improve emergency obstetric care in South
Sudan. International Journal of Gynaecology and Obstetrics, 128(1):58-61.
Grove, SK, Gray, J & Burns, N. 2015. Understanding nursing research. 6th edition.
Philadelphia: Saunders.
Grove, SK, Burns, N, & Gray, J. 2013. The practice of nursing research: appraisal,
synthesis and generation of evidence. 7th edition. St Louis: Saunders Elsevier.
165
Gyedu, A, Baah, EG, Boakye, G, Ohene-Yeboah, M, Otupiri, E & Stewart, BT. 2015.
Quality of referrals for elective surgery at a tertiary care hospital in a developing country:
an opportunity for improving timely access to and cost-effectiveness of surgical care.
International Journal of Surgery, 15:74-78.
Hailu, D & Berhe, H. 2014. Knowledge about obstetric danger signs and associated
factors among mothers in Tsegedie district, Tigray region, Ethiopia, 2013: community-
based cross-sectional study. PloS One, 9(2):1.
Hatcher, P, Shaikh, S, Fazli, H, Zaidi, S & Riaz, A. 2014. Provider cost analysis
supports results-based contracting out of maternal and newborn health services: an
evidence-based policy perspective. BMC Health Services Research, 14(1):4.
Hedstrom, A, Ryman, T, Otai, C, Nyonyintono, J, McAdams, RM, Lester, D & Batra, M.
2014. Demographics, clinical characteristics and neonatal outcomes in a rural Ugandan
NICU. Pregnancy and Childbirth, 14: 4 - 6.
Hendriks, ME, Kundu, P, Boers, AC, Bolarinwa, OA, Te Pas, MJ, Akande, TM, Agbede,
K, Gomez, GB, Redekop, WK, Schultsz, C & Tan, SS. 2014. Step-by-step guideline for
disease-specific costing studies in low- and middle-income countries: a mixed
methodology. Global Health Action, 7(1):4.
Hirose, A, Borchert, M, Cox, J, Alkozai, AS & Filippi, V. 2015. Determinants of delays in
travelling to an emergency obstetric care facility in Herat, Afghanistan: an analysis of
cross-sectional survey data and spatial modelling. BMC Pregnancy and Childbirth, 15:7-
14.
Hodgins, S. 2013. Achieving better maternal and newborn outcomes: coherent strategy
and pragmatic, tailored implementation. Global Health: Science and Practice, 1(2):149.

166
Homer, CSE, Castro Lopes, S, Nove, A, Michel-Schuldt, M, McConville, F, Moyo, NT,
Bokosi, M & ten Hoope-Bender, P. 2018. Barriers to and strategies for addressing the
availability, accessibility, acceptability and quality of the sexual, reproductive, maternal,
newborn and adolescent health workforce: addressing the post-2015 agenda. BMC
Pregnancy and Childbirth, 18(1):55.
Huchon, C, Arsenault, C, Tourigny, C, Coulibaly, A, Traore, M, Dumont, A & Fournier,
P. 2014. Obstetric competence among referral healthcare providers in Mali.
International Journal of Gynaecology & Obstetrics, 126(1):50-59.
Hyre, A, Caiola, N, Amelia, D, Gandawidjaja, T, Markus, S & Baharuddin, M. 2019.
Expanding maternal and neonatal survival in Indonesia: a program overview.
International Journal of Gynaecology & Obstetrics, 144:7-12.
Islam, F, Rahman, A, Halim, A, Eriksson, C, Rahman, F & Dalal, K. 2015. Perceptions
of health care providers and patients on quality of care in maternal and neonatal health
in fourteen Bangladesh government healthcare facilities: a mixed-method study. BMC
Health Services Research, 15(1):237.
Islam, MA & Al-Shiha, A. 2018. Foundations of biostatistics. Singapore: Springer.
Izudi, J, Akwang, DG, McCoy, SI, Bajunirwe, F & Kadengye, DT. 2019. Effect of health
education on birth preparedness and complication readiness on the use of maternal
health services: A propensity score-matched analysis. Midwifery, 78:78-84.
Jacobs, LD, Judd, TM & Bhutta, ZA. 2016. Addressing the child and maternal mortality
crisis in Haiti through a central referral hospital providing countrywide care. The
Permanente Journal, 20(2):59-70.
Jahn, A & De Brouwere, V. 2001. Referral in pregnancy and childbirth. In Safe
motherhood strategies: a review of the evidence edited by V de Brouwere and W van
Lerberghe. Antwerp: ITG Press:229-246.
167
Jaribu, J, Penfold, S, Manzi, F, Schellenberg, J & Pfeiffer, C. 2016. Improving
institutional childbirth services in rural Southern Tanzania: a qualitative study of
healthcare workers’ perspective. BMJ Open, 6(9):8.
Jayanthi, TP, Suresh, S & Padmanaban, P. 2015. Primary health centres: Preferred
option for birthing care in Tamilnadu, India. Users’ Perspectives, 33(1):177-186.
Kamau, KJ, Osuga, BO & Njuguna, S. 2017. Challenges facing implementation of
referral system for quality health care services in Kiambu County, Kenya. Health
Systems and Policy Research, 4(1):48.
Kant, S, Kaur, R, Malhotra, S, Haldar, P & Goel, A. 2018. Audit of emergency obstetric
referrals from a secondary level hospital in Haryana, North India. Journal of Family
Medicine and Primary Care, 7(1):137.
Karam, M, Brault, I, Van Durme, T & Macq, J. 2018. Comparing interprofessional and
interorganizational collaboration in healthcare: a systematic review of the qualitative
research. International Journal of Nursing Studies, 79:70-83.
Khan, ANS, Billah, SM, Mannan, I, Mannan, II, Begum, T, Khan, MA, Islam, M, Ahasan,
SMM, Rahman, JN, George, J, El Arifeen, S, Meena, USJ, Iftekhar, R, & Graft-Johnson,
JD. 2018. A cross-sectional study of partograph utilization as a decision-making tool for
referral of abnormal labour in primary health care facilities of Bangladesh. 13(9):19-29.
Koblinsky, M, Moyer, CA, Calvert, C, Campbell, J, Campbell, OMR, Feigl, AB, Graham,
WJ, Hatt, L, Hodgins, S, Matthews, Z, McDougall, L, Moran, AC, Nandakumar, AK &
Langar, A. 2016. Quality maternity care for every woman, everywhere: a call to action.
The Lancet, 388(10057):2307-2320.
Koce, F, Randhawa, G & Ochieng, B. 2019. Understanding healthcare self-referral in
Nigeria from the service users’ perspective: a qualitative study of Niger state. BMC
Health Services Research, 19(1):2.

168
Kruk, ME, Leslie, HH, Verguet, S, Mbaruku, GM, Adanu, RMK & Langer, A. 2016.
Quality of basic maternal care functions in health facilities of five African countries: an
analysis of national health system surveys. The Lancet Global Health, 4(11):e845-e855.
Kyei-Onanjiri, M, Carolan-Olah, M, Awoonor-Williams, JK & McCann, TV. 2018. Review
of emergency obstetric care interventions in health facilities in the Upper East Region of
Ghana: a questionnaire survey. BMC Health Services Research, 18(1):8.
Kyei-Nimakoh, M, Carolan-Olah, M & McCann, TV. 2017. Access barriers to obstetric
care at health facilities in sub-Saharan Africa — a systematic review. Systematic
Reviews, 6(1):110.
Lagrou, D, Zachariah, R, Bissell, K, Van Overloop, C, Nasim, M, Wagma, HN, Kakar, S,
Caluwaerts, S, Plecker, ED, Fricke, R, Van den Bergh, R. 2018. Provision of emergency
obstetric care at secondary level in a conflict setting in a rural area of Afghanistan: is the
hospital fulfilling its role? Conflict and Health, 12(1):2-5.
Lassi, ZS & Bhutta, ZA. 2015. Community-based intervention packages for reducing
maternal and neonatal morbidity and mortality and improving neonatal outcomes. The
Cochrane Database of Systematic Reviews, 3:6.
Laxy, M, Wilson, ECF, Boothby, CE & Griffin, SJ. 2017 Incremental costs and cost-
effectiveness of intensive treatment in individuals with type-2 diabetes detected by
screening in the ADDITION-UK trial: an update with empirical trial-based cost data.
Value in Health, 20:1288-1298.
Leavy, P. 2017. Research design: quantitative, qualitative, mixed methods, arts-based,
and community-based participatory research approaches. London: Guildford Press.
Litorp, H, Rööst, M, Kidanto, HL, Nyström, L & Essén, B. 2016. The effects of previous
caesarean deliveries on severe maternal and adverse perinatal outcomes at a university
hospital in Tanzania. International Journal of Gynaecology and Obstetrics, 133(2):183-
187.

169
Lomax, A (ed). 2015. Examination of the newborn: an evidence-based guide. 2nd
edition. West Sussex: Wiley.
Mahato, PK, Van Teijlingen, E, Simkhada, P & Angell, C. 2017. Determinants of quality
of care and access to basic emergency obstetric and neonatal care facilities and
midwife-led facilities in low- and middle-income countries: a systematic review. Journal
of Asian Midwives, 4:25-61.
Markos, D & Bogale, D. 2015. Documentation status of the modified World Health
Organization partograph in public health institutions of Bale zone, Ethiopia.
Reproductive Health, 12(1):1-81.
McClure, EM, Saleem, S, Goudar, SS, Moore, JL, Garces, A, Esamai, F, Patel, A,
Chomba, E, Althabe, F, Pasha, O, Kodkany, BS, Bose, CL, Berreuta, M, Liechty, EA,
Hambidge, KM, Krebs, NF, Derman, RJ, Hibberd, PL, Buekens, P, Manasyan, A, Carlo,
WA, Wallace, DD, Koso-Thoma, M & Goldenberg, RL. 2015. Stillbirth rates in low-
middle income countries, 2010-2013: a population-based, multi-country study from the
Global Network. Reproductive Health, 12(Suppl 2):2-7.
Merali, HS, Lipsitz, S, Hevelone, N, Gawande, AA, Lashoher, A, Agrawal, P & Spector,
J. 2014. Audit-identified avoidable factors in maternal and perinatal deaths in low
resource settings: a systematic review. BMC Pregnancy and Childbirth, 14:280.
Merriam, SB & Tisdell, EJ. 2016. Qualitative research: a guide to design and
implementation. San Franciso: A Wiley Brand.
Miyazaki, C, Moreno Garcia, R, Ota, E, Swa, T, Oladapo, OT & Mori, R. 2016. Tocolysis
for inhibiting preterm birth in extremely preterm birth, multiple gestations and in growth-
restricted fetuses: a systematic review and meta-analysis. Reproductive Health, 13(1):1-
4.
Moran, AC, Jolivet, RR, Chou, D, Dalglish, SL, Hill, K, Ramsey, K, Rawlins, B & Say, L.
2016. A common monitoring framework for ending preventable maternal mortality,
2015-2030: phase I of a multi-step process. BMC Pregnancy and Childbirth, 16(1):2.
170
Mwaniki, MK, Vaid, S, Chome, IM, Amolo, D, Tawfik, Y & Kwale Improvement Coaches.
2014. Improving service uptake and quality of care of integrated maternal health
services: the Kenya Kwale District improvement collaborative. BMC Health Services
Research, 14:18.
North-West University, Computer Science Department, Mafikeng, South Africa, Isong,
B, Dladlu, N & Magogodi, T. 2016. Mobile-based medical emergency ambulance
scheduling system. International Journal of Computer Network and Information Security,
8(11):14-22.
Nyamtema, AS, Mwakatundu, N, Dominico, S, Mohamed, H, Pemba, S, Rumanyika, R,
Kairuki, C, Kassiga, I, Shayo, A, Issa, O, Nzabuhakwa, C, Lyimo, C, Van Roosmalen, J.
2016. Enhancing Maternal and Perinatal Health in Under-Served Remote Areas in Sub-
Saharan Africa: a Tanzanian model. PLOS ONE, 11(3):10-14.
Oladapo, OT, Souza, JP, Bohren, MA, Tunçalp, Ö, Vogel, JP, Fawole, B, Mugerwa, K &
Gülmezoglu, AM. 2015. WHO Better Outcomes in Labour Difficulty (BOLD) project:
innovating to improve quality of care around the time of childbirth. Reproductive Health,
12(1):2.
Ollerhead, E & Osrin, D. 2014. Barriers to and incentives for achieving partograph use
in obstetric practice in low- and middle-income countries: a systematic review. BMC
Pregnancy and Childbirth, 14:285.
Opiyo, N & English, M. 2015. In-service training for health professionals to improve care
of seriously ill newborns and children in low-income countries. The Cochrane Database
of Systematic Reviews, 5:8.
Otolorin, E, Gomez, P, Currie, S, Thapa, K & Dao, B. 2015. Essential basic and
emergency obstetric and newborn care: from education and training to service delivery
and quality of care. International Journal of Gynaecology and Obstetrics, 130 Suppl 2:
S46-S53.

171
Owens, L, Semrau, K, Mbewe, R, Musokotwane, K, Grogan, C, Maine, D & Hamer, DH.
2015. The state of routine and emergency obstetric and neonatal care in Southern
Province, Zambia. International Journal of Gynaecology and Obstetrics, 128(1):53-57.
Parahoo, K. 2014. Nursing research: principles, process and issues. London: Palgrave
MacMillan.
Pasha, O, Saleem, S, Ali, S, Goudar, SS, Garces, A, Esamai, F, Patel, A, Chomba, E,
Althabe, F, Moore, JL, Harrison, M, Berrueta, MB, Hambidge, KM, Krebs, NF, Hibbberd,
PL, Carlo, WA, Kodkany, B, Derman, RJ, Liechty, EA, Koso-Thomas, M, McClure, EM &
Goldenberg, RL. 2015. Maternal and newborn outcomes in Pakistan compared to other
low- and middle-income countries in the Global Network’s Maternal Newborn Health
Registry: an active, community-based, pregnancy surveillance mechanism.
Reproductive Health, 12 Suppl 2: 2 - 8.
Patabendige, M & Senanayake, H. 2015. Implementation of the WHO safe childbirth
checklist programme at a tertiary care setting in Sri Lanka: a developing country
experience. BMC Pregnancy and Childbirth, 15:12.
Polit, DF & Beck, CT. 2014. Essentials of nursing research: appraising evidence for
nursing practice. 8th edition. Philadelphia: Lippincott Williams & Wilkins.
Polit, DF & Beck, CT. 2017. Nursing research: generating and assessing evidence for
nursing practice. 10th edition. Philadelphia: Wolters Kluwer Health.
Rajasulochana, S & Dash, U. 2018. Performance of CEmONC Centres in public
hospitals of Tamil Nadu: a case study. Journal of Health Management, 20(3):363-377.
Rosen, HE, Lynam, PF, Carr, C, Reis, V, Ricca, J, Bazant, ES, Bartlett, LA et al 2015.
Direct observation of respectful maternity care in five countries: a cross-sectional study
of health facilities in East and Southern Africa. BMC Pregnancy and Childbirth 15:306-
307.
Sacks, E & Kinney, MV. 2015. Respectful maternal and newborn care: building a
common agenda. Reproductive Health, 12(1):46.

172
Sheferaw, ED, Mengesha, TZ & Wase, SB. 2016. Development of a tool to measure
women’s perception of respectful maternity care in public health facilities. BMC
Pregnancy and Childbirth, 16(1):67-68.
Singh, S, Doyle, P, Campbell, OM, Mathew, M & Murthy, GVS. 2016. Referrals between
public sector health institutions for women with obstetric high risk, complications or
emergencies in India: a systematic review. PLOS One, 11(8):13-19.
Stewart, A. 2016. Basic statistics and epidemiology: a practical guide. Boca Raton, FL:
Taylor & Francis Group.
Tayler-Smith, K, Zachariah, R, Manzi, M, Van den Boogaard, W, Nyandwi, G, Reid, T,
De Plecker, E, Lambert, V, Nicolai, M, Goetghebuer, S, Christiaens, B, Ndelema, B,
Kabangu, A, Manirampa, J & Harries, AD. 2013. An ambulance referral network
improves access to emergency obstetric and neonatal care in a district of rural Burundi
with high maternal mortality. Tropical Medicine and International Health, 18(8):993-
1001.
Taylor, SJ, Bogdan, R & DeVault, ML. 2017. Introduction to qualitative research
methods: a guidebook and resource. 4th edition. Hoboken, NJ: Wiley.
Tessema, GA, Laurence, CO, Melaku, YA, Misganaw, A, Woldie, SA, Hiruye, A, Amare,
AT, Lakew, Y, Zeleke, BM & Deribew, A. 2017. Trends and causes of maternal mortality
in Ethiopia during 1990-2013: findings from the Global Burden of Diseases study, 2013.
BMC Public Health, 17(1): 2 - 7.
The WHARC WHO FMOH MNCH Implementation Research Study Team, Okonofua, F,
Ogu, R, Agholor, K, Okike, O, Abdus-salam, R, Gana, M, Randawa, A, et al. 2017.
Qualitative assessment of women’s satisfaction with maternal health care in referral
hospitals in Nigeria. Reproductive Health, 14(1):44.
173
Tiruneh, GT, Karim, AM, Avan, BI, Zemichael, NF, Wereta, TG, Wickremasinghe, D,
Keweti, ZN, Kebede, Z & Betemarian, WA. 2018. The effect of implementation strength
of basic emergency obstetric and newborn care (BEmONC) on facility deliveries and the
met need for BEmONC at the primary health care level in Ethiopia. BMC Pregnancy and
Childbirth, 18(1):3 -4.
Tolley, EE, Ulin, PR, Mack, N, Robinson, ET & Succop, SM. 2016. Qualitative methods
in public health: a field guide for applied research. 2nd edition. San Francisco, CA:
Jossey-Bass & Pfeiffer.
Tracy, SJ. 2013. Qualitative research methods. Hoboken, NJ: Wiley-Blackwell:370.
Tripathi, V, Stanton, C, Strobino, D & Bartlett, L. 2015. Development and validation of
an index to measure the quality of facility-based labour and delivery care processes in
Sub-Saharan Africa. PloS One, 10(6):3.
Turner, EL, Nielsen, KR, Jamal, SM, von Saint André-von Arnim, A & Musa, NL. 2016.
A review of pediatric critical care in resource-limited settings: a look at past, present,
and future directions. Frontiers in Pediatrics, 4:5.
United Nations Development Programme. 2012. Sustainable development goals, 2015-
2030. New York: UNDP.
Vargas, I, Mogollón-Pérez, AS, De Paepe, P, da Silva, MRF, Unger, JP & Vázquez, ML.
2015. Do existing mechanisms contribute to improvements in care coordination across
levels of care in health services networks? Opinions of the health personnel in Colombia
and Brazil. BMC Health Services Research, 15: 5.
Vogel, J, Bohren, M, Tunçalp, Ö, Oladapo, O & Gülmezoglu, A. 2016a. Promoting
respect and preventing mistreatment during childbirth. BJOG: An International Journal
of Obstetrics & Gynaecology, 123(5):671-674.
174
Vogel, JP, Betrán, AP, Vindevoghel, N, Souza, JP, Torloni, MR, Zhang, J, Tunçalp, Ö,
Mori, R, Marisaki, N, Ortiz-Panozo, E, Hernandez, B, Perez-Cuevas, R, Qureshi, Z,
Gulmezaglu, AM, Temmerman, M. 2015. Use of the Robson classification to assess
caesarean section trends in 21 countries: a secondary analysis of two WHO multi-
country surveys. The Lancet. Global Health, 3(5):e260-e270.
Vogel, JP, Moore, JE, Timmins, C, Khan, S, Khan, DN, Defar, A, Hadush, A, Minwyelet
Terefe, MM, Teshome, L, Ba-Thike, K, Than, K, Makuwani, A, Mbaruku, G, Mrisho, M,
Mugerwa, KY, Ritchie, LMP, Rashid, S, Straus, SE, GuÈlmezoglu, AM. 2016b. Barriers,
facilitators and priorities for implementation of WHO maternal and perinatal health
guidelines in four lower-income countries: a GREAT network research activity. PLOS
One, 11(11):e0160020.
Weissenberger-Eibl, M, Almeida, A & Seuss, F. 2019. A systems thinking approach to
corporate strategy development. Systems, 7(1):16.
Whaley, BB (ed). 2014. Research methods in health communication: principles and
application. New York: Taylor & Francis Group.
White Ribbon Alliance (WRA). 2011. Respectful maternity care charter. Washington,
DC: WRA.
Windsma, M, Vermeiden, T, Braat, F, Tsegaye, AM, Gaym, A, van den Akker, T &
Stekelenburg, J. 2017. Emergency obstetric care provision in Southern Ethiopia: a
facility-based study. BMJ Open, 7(11):1.
World Health Organization (WHO). 2017. Managing complications in pregnancy and
childbirth. Geneva: WHO.
World Health Organization (WHO). 2008a. Referral Systems - a summary of key
processes to guide health services managers.
From: https://www.who.int/management/Referralnotes.doc (accessed on 27 September
2015).
World Health Organization (WHO). 2008b. World health statistics. Geneva: WHO.
175
World Health Organization (WHO). 2014. Prevention and elimination of disrespect and
abuse during facility-based childbirth. Geneva: WHO.
World Health Organization (WHO). 2016a. Recommendations on antenatal care for a
positive pregnancy experience. Geneva: WHO.
World Health Organization (WHO). 2016b. Pregnancy, childbirth, postpartum and
newborn care: a guide for essential practice. Geneva: WHO.
World Health Organization (WHO). 2018a. WHO recommendations on intrapartum care
for a positive childbirth experience. Geneva: WHO.
World Health Organization (WHO). 2018b. WHO recommendations: non-clinical
interventions to reduce unnecessary caesarean sections. Geneva: WHO.
Yang, F, Bohren, MA, Kyaddondo, D, Titiloye, MA, Olutayo, AO, Oladapo, OT, Souza,
JP, Gülmezoglu, AM, Mugerwa, K & Fawole, B. 2017. Healthcare providers’
perspectives on labour monitoring in Nigeria and Uganda: a qualitative study on
challenges and opportunities. International Journal of Gynecology and Obstetrics,
139:17-26.
Yigzaw, T, Carr, C, Stekelenburg, J, Van Roosmalen, J, Gibson, H, Gelagay, M &
Admassu, A. 2016. Using task analysis to generate evidence for strengthening
midwifery education, practice, and regulation in Ethiopia. International Journal of
Women’s Health (May):181.
Yin, RK. 2016. Qualitative research from start to finish. 2nd edition. New York: The
Guildford Press.
Zafar, S, Jean-Baptiste, R, Rahman, A, Neilson, JP & Van den Broek, NR. 2015. Non-
life-threatening maternal morbidity: cross-sectional surveys from Malawi and Pakistan.
PloS One 10(9):2.

176
ANNEXURES

177
ANNEXURE 1: ETHICAL CLEARANCE CERTIFICATE FROM UNISA

178

179
ANNEXURE 2: SUPPORT LETTER FOR THE STUDY

180
ANNEXURE 3: CASE REGISTRATION SHEET
S. No Date of service
Source of information/Unit (Delivery, NICU)
Medical Record Number
Woreda Kebele Age Sex
Name of Catchment Health Center

181
ANNEXURE 4: MEDICAL RECORD EXTRACTING SHEET
Questionnaire Number: _______________
Name of Facility: _______________
Background information Q 1.1 Zone Q.1.2 Woreda Q 1.3 Kebele
Q 1.4 Village/Gote Q.1.5 House number
Q 1.6 Phone number
Q 1.7 Age (Years for adult and days for newborn)
___ Years
Q.1.8 Patient code Q.1.9 Service providing case team
1) Delivery room
2) NICU
____ days
Summary of referral information Q 2.1. Was
the case referred from another facility?
1) Yes 2) NO
Q.2.2 If the case is referred, what is the name of referring institution?
Q.2.3 Was the referring facility the first contact for the case?
1) Yes 2) No
Q.2.4 The approximate distance from the referring facility (hours of driving by public transport)
Data collectors estimate
(--------)
Q.2.5 Is there a referral slip attached to the file/recorded in the card?
1) Yes 2) No
Q.2.6 Does the referral slip include what was done before referral?
1) Yes 2) No
Q.2.7. If it is written in the referral slip, list the type of investigation made before referral
Q 2.8 If it is written in the referral slip, list the type of treatments given/started before referral
Q.2.9 Did the referral use the ambulance from the sending facility?
1) Yes 2) No
Q.2.10 Was the referral accompanied by health professional?
1) Yes 2) No
Q. 2.11 What was the reason for referral (as it is written on the referral slip or patient record/card)
Chief complaint of the case as documented by the hospital Q. 3.1 Chief complaint
Q. 3.2. Date of visit

182
Description of the maternal case as presented to delivery ward Q 4.1 Gravida Q.4.2 Parity Q.4.3 Number of
ANC follow ups
Q.4.4 Where was she following ANC?
1) In this hospital 2) In the referring facility 3) In the referring catchment health
post 4) Other institution
Q.4.5 How long the client has taken iron in this current pregnancy? How long has the client taken iron ... pregnancy?
Q.4.6 Does the client
have or has she had or had the following obstetrics problems?
Last Pregnancy
()
Current pregnancy
()
Q.4.7. Does the client have or has she had the following medical condition?
Last Pregnancy
()
Current Pregnancy
()
Q.4.6.a Abortion Q.4.7.a Diabetic Q.4.6.b Stillbirth Q.4.7.b Renal disease Q.4.6.c Pre term Q.4.7.c Cardiac disease Q.4.6.d Low birth weight Q.4.7.d Chronic HPN Q.4.6.e Big baby Q.4.7.e Substance abuse Q.4.6.f Preeclampsia/ecl
ampsia Q.4.7.f Other medical
conditions
Q.4.6.g Surgery on reproductive organ
Q.4.7.g Other, Specify _________________
Q.4.6.h Vaginal bleeding Q.4.6.i Multiple
pregnancy
Q.4.6.j Other, Specify ______________
Q.4.8 Current investigation done and its result ( put tick mark for the right answer)
Inside facility
Outside of this facility
4.9 Is there any problem identified from the test (put tick mark for the right answer)
Yes No
Q.4.8.a HIV Test Q.4.9.a HIV test Q.4.8.b Hepatitis Q.4.9.b Hepatitis Q.4.8.c VDRL Q.4.9.c VDRL Q.4.8.d RH Factor Q.4.9.d RH factor Q.4.8.e Ultrasound Q.4.9.e Ultrasound Q.4.8.f Urine analysis Q.4.9.f Urine analysis Q.4.8.g HgB Q.4.9.g HgB Q.4.8.h Other, Specify
_______________
Q.4.9.h Others, Specify ____________
Q 4.10 Vital signs at admission
T RR PR BP
Q.4.11 Measurements taken at admission
Gestational age
MUAC Ht Wt
Q.4.12 Physical examination results
Pallor 1) Yes 2) No 3) Not recorded
Jaundice 1) Yes 2) No 3) Not recorded
Q.4.13 Abdominal examination at admission
Presentation Lie

183
Q.4.14 Pelvic exam at admission
Cervical dilatation
Station Moulding
Vaginal discharge Ruptured membrane
Labour monitoring - Partograph records/labour monitoring and management 5.1 Is the partograph attached
to the record/patient card? 1) Yes 2) No 3) NA
5.2 Date of admission
5.3 Time of admission
5.4 Hours of ruptured membrane
5.5 Foetal heart beats (All records separated by comma)
5.6. “Moulding” (Put number of “X” records)
5.7 Liquor ( all records)
5.8 Descent (all records) 5.9 Cervical dilatation (All records separated by comma)
5.10 Number of contractions per 10 minutes (All records separated by comma)
5.11 Duration of contractions (All records separated by comma)
5.12 Urine tests done (all records)
Acetone
Protein Urine volume
5.13 Maternal vital signs (All records separated by comma)
BP T PR RR
5.14. Any problem identified during labour
5.15 Any medicines for induction (dose and frequency)
5.16 Any medicine given to treat the mother while in labour (dose and frequency)
5.17 In your opinion, does ?was the Partograph filled properly?
1) Yes 2) No
Outcome of labour 6.1 Date of
delivery 6.2 Time of
delivery 6.3 Mode of
delivery a) SVD b) C/S c) Forceps d) Vaccum e) Episitomy f) Other procedure
6.4 Maternal status
1) Stable 2) Unstable/deteriorated and referred to the next
facility 3) Died
6.5 Obstetrics complications
1) Pre-eclampsia 2) Eclampsia 3) APH 4) PPH 5) Other 6) Referred
6.6 Newborn birth outcome
1) Alive 2) Stillbirth 3) Live birth,
died before arrival
4) Live birth, died after arrival
6.7 APGAR score (1’/5’ min)
6.8 Sex of the newborn
1) Male 2) Female
6.9 Height 6.10 Weight 6.11 Problem identified in the newborn
1) Prematurity 2) Sepsis 3) Respiratory
distrust/asphyxia 4) Low birth weight 5) Congenital
malformation 6) Other specify

184
6.12 Treatment given
1) Oxygen resuscitated
2) Resuscitated and survived
3) Died
6.13 Cause of death, if died
1) Prematurity 2) Infection 3) Asphyxia 4) Other
Newborn Intensive Care Unit service 7.1 Date of
birth and time
7.2 Date of admission
7.3 Mode of Delivery
a) SVD b) C/S c) Forceps d) Vaccum e) Episitomy f) Other procedure
7.4 Sex 7.5 Vital Signs at admission
Wt T RR AHR
7.6 Place of delivery
1) Home delivery 2) Same facility 3) Referred from
other facility
7.7 APGAR score (1’/5’)
7.8 Birth weight
7.9 Gestational age (wks)
7.10 Maternal health condition
1) HIV positive 2) Syphilis +ve 3) Hepatitis B+ve 4) Hepatitis C+ve 5) Dead 6) Other, Specify ________________________
7.11 Major problems
1) Prematurity 2) Low birth weight 3) Sepsis 4) Respiratory distress/asphyxia 5) Perinatal asphyxia 6) Congenital malformation 7) Other specify _____________
7.12 Management 1) CPAP 2) Antibiotics 3) Anticonvelants 4) Phototherapy 5) Glucose 6) Oxygen 7) Blood transfusion 8) Incubator/thermal care 9) Other, Specify
_____________________
7.13 Discharge date and time
7.14 Discharge weight
7.15 Discharge status
1) Recovered 2) Dead 3) Transferred 4) Other, Specify
_______________
7.16 Survived after resuscita-tion
1) Yes 2) No
7.17 If died,( age in days)
7.18 Cause of death
1) Prematurity 2) Sepsis 3) Prenatal asphyxia 4) Congenital
malformation 5) Other, specify
________________
Back referral 8.1 Any back
referrals made
1) Yes 2) No
8.2 If yes, name of receiving facility
8.3 Type of receiving facility
a) HP b) HC c) Hospital d) Private facility e) Other, Specify
_________________
Conclusion/remark 9.1 In your opinion, can this case be treated at health centre level? 1) Yes
2) No
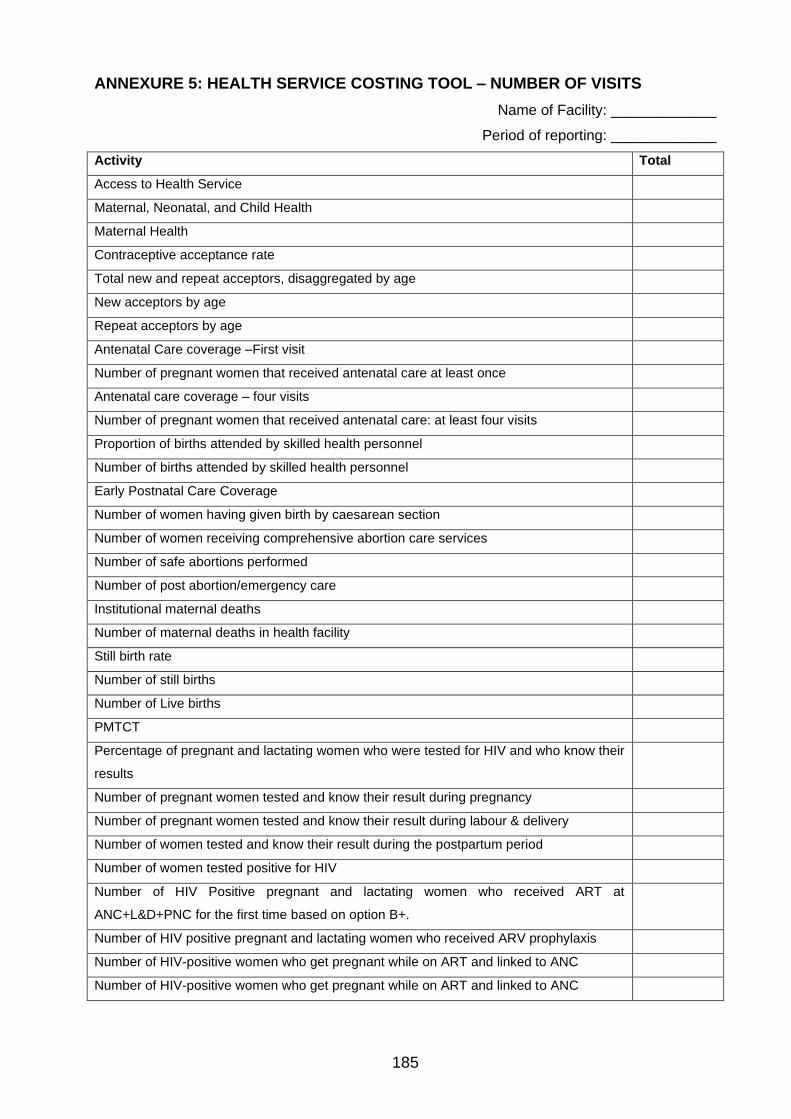
185
ANNEXURE 5: HEALTH SERVICE COSTING TOOL – NUMBER OF VISITS
Name of Facility: _____________
Period of reporting: _____________
Activity Total
Access to Health Service
Maternal, Neonatal, and Child Health
Maternal Health
Contraceptive acceptance rate
Total new and repeat acceptors, disaggregated by age
New acceptors by age
Repeat acceptors by age
Antenatal Care coverage –First visit
Number of pregnant women that received antenatal care at least once
Antenatal care coverage – four visits
Number of pregnant women that received antenatal care: at least four visits
Proportion of births attended by skilled health personnel
Number of births attended by skilled health personnel
Early Postnatal Care Coverage
Number of women having given birth by caesarean section
Number of women receiving comprehensive abortion care services
Number of safe abortions performed
Number of post abortion/emergency care
Institutional maternal deaths
Number of maternal deaths in health facility
Still birth rate
Number of still births
Number of Live births
PMTCT
Percentage of pregnant and lactating women who were tested for HIV and who know their
results
Number of pregnant women tested and know their result during pregnancy
Number of pregnant women tested and know their result during labour & delivery
Number of women tested and know their result during the postpartum period
Number of women tested positive for HIV
Number of HIV Positive pregnant and lactating women who received ART at
ANC+L&D+PNC for the first time based on option B+.
Number of HIV positive pregnant and lactating women who received ARV prophylaxis
Number of HIV-positive women who get pregnant while on ART and linked to ANC
Number of HIV-positive women who get pregnant while on ART and linked to ANC
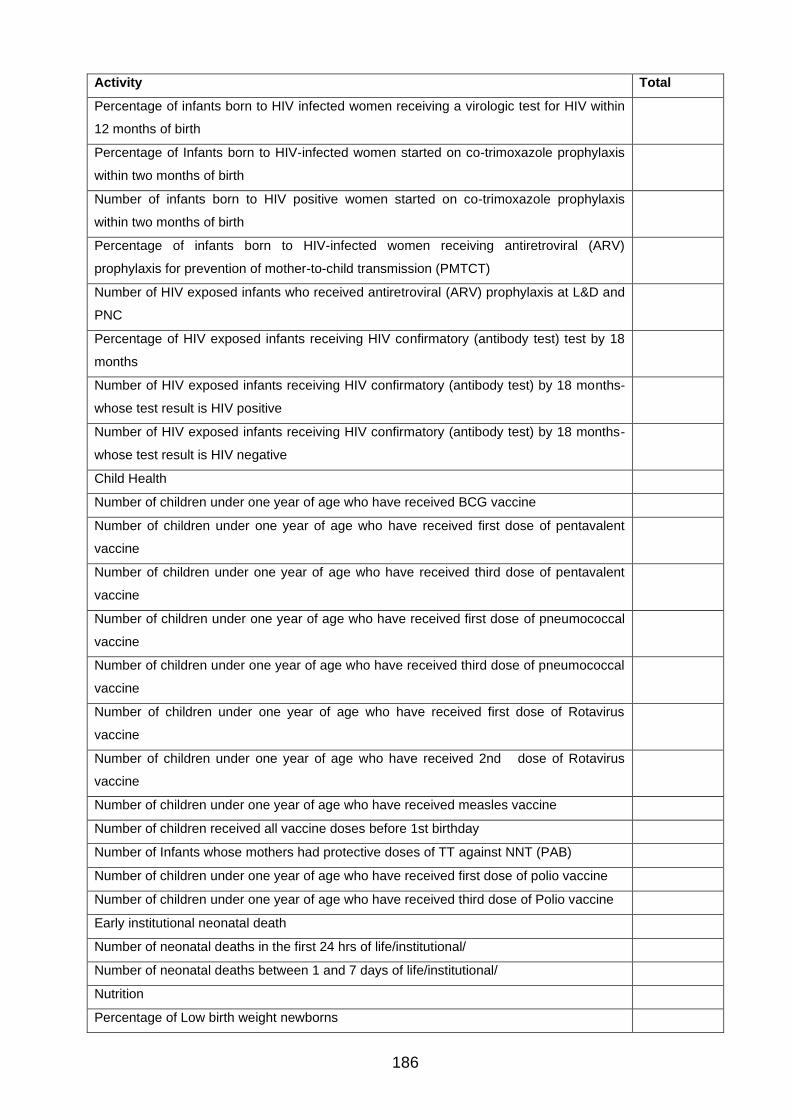
186
Activity Total
Percentage of infants born to HIV infected women receiving a virologic test for HIV within
12 months of birth
Percentage of Infants born to HIV-infected women started on co-trimoxazole prophylaxis
within two months of birth
Number of infants born to HIV positive women started on co-trimoxazole prophylaxis
within two months of birth
Percentage of infants born to HIV-infected women receiving antiretroviral (ARV)
prophylaxis for prevention of mother-to-child transmission (PMTCT)
Number of HIV exposed infants who received antiretroviral (ARV) prophylaxis at L&D and
PNC
Percentage of HIV exposed infants receiving HIV confirmatory (antibody test) test by 18
months
Number of HIV exposed infants receiving HIV confirmatory (antibody test) by 18 months-
whose test result is HIV positive
Number of HIV exposed infants receiving HIV confirmatory (antibody test) by 18 months-
whose test result is HIV negative
Child Health
Number of children under one year of age who have received BCG vaccine
Number of children under one year of age who have received first dose of pentavalent
vaccine
Number of children under one year of age who have received third dose of pentavalent
vaccine
Number of children under one year of age who have received first dose of pneumococcal
vaccine
Number of children under one year of age who have received third dose of pneumococcal
vaccine
Number of children under one year of age who have received first dose of Rotavirus
vaccine
Number of children under one year of age who have received 2nd dose of Rotavirus
vaccine
Number of children under one year of age who have received measles vaccine
Number of children received all vaccine doses before 1st birthday
Number of Infants whose mothers had protective doses of TT against NNT (PAB)
Number of children under one year of age who have received first dose of polio vaccine
Number of children under one year of age who have received third dose of Polio vaccine
Early institutional neonatal death
Number of neonatal deaths in the first 24 hrs of life/institutional/
Number of neonatal deaths between 1 and 7 days of life/institutional/
Nutrition
Percentage of Low birth weight newborns

187
Activity Total
Number of live-born babies with birth weight less than 2,500 g
Total number of live births weighed
Percentage of underweight Children aged <5 years (Growth Monitoring)
Number of weights measured for children under 5yrs, by age
Proportion of children 6 - 59 months with severe acute malnutrition
Total Number of children screened for malnutrition
Number of children screened and have sever acute malnutrition
Treatment outcome for management of severe acute malnutrition in children 6-59 months
Number of children recovered
Number of children defaulted
Number of children transferred
Number of children died
Total number of children who exit from severe acute malnutrition treatment
Number of children aged 6-59 months supplemented with vitamin-A
Prevention and Control of Diseases
Communicable diseases
HIV/AIDS
Clients receiving HIV test results (at VCT)
Clients testing positive for HIV (at VCT)
Clients receiving HIV test results (at PICT)
Clients testing positive for HIV (at PICT)
Newly enrolled in pre-ART care
Number of adults and children with HIV infection newly enrolled in Pre ART care
HIV positive persons receiving co-trimoxazole prophylaxis
Number of HIV positive persons receiving CTX prophylaxis
Number of PLHIV ever started on ART
Number of adults and children with advanced HIV infection ever started on ART
Number of adults and children who are currently on ART
Adults >= 15years: First Line Regimen
Adults >= 15years: Adult Second Line Regimen
< 1 year: First Line Regimen
< 1 year: Second Line Regimen
Children aged 1-4 years: First Line Regimen
Children aged 1-4 years: Second Line Regimen
Children aged 1-4 years: Third Line Regimen
Children aged 5-14 years: First Line Regimen
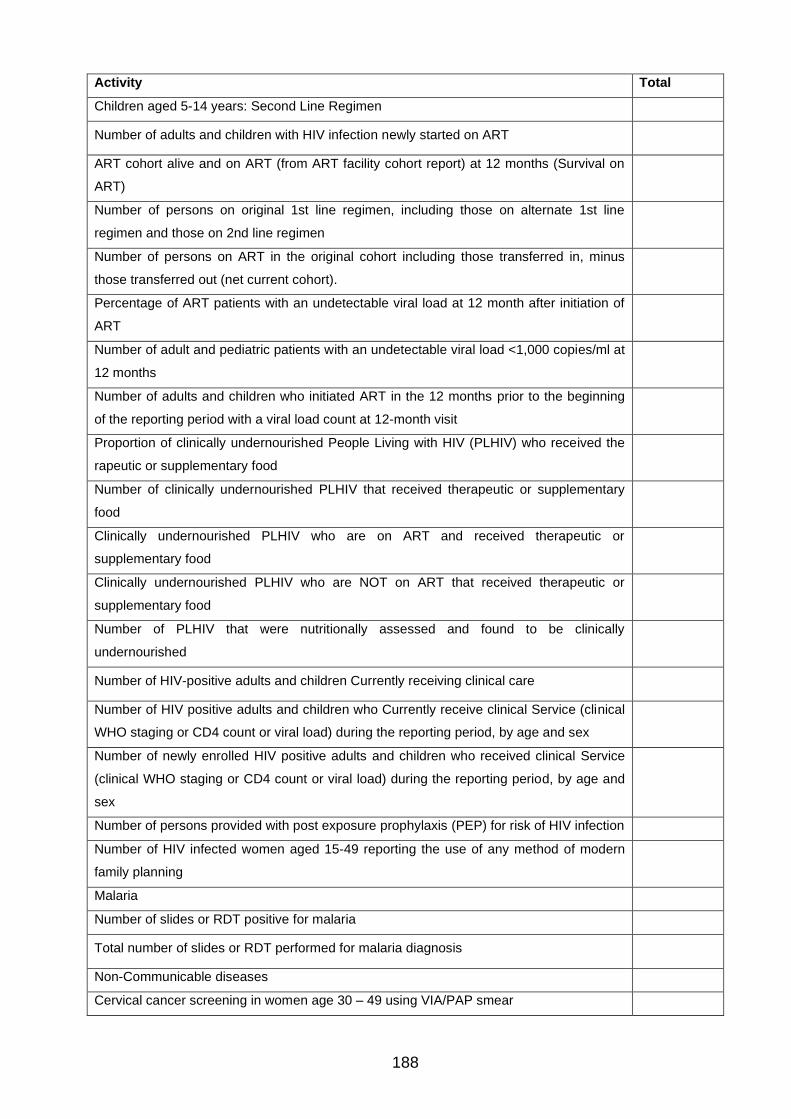
188
Activity Total
Children aged 5-14 years: Second Line Regimen
Number of adults and children with HIV infection newly started on ART
ART cohort alive and on ART (from ART facility cohort report) at 12 months (Survival on
ART)
Number of persons on original 1st line regimen, including those on alternate 1st line
regimen and those on 2nd line regimen
Number of persons on ART in the original cohort including those transferred in, minus
those transferred out (net current cohort).
Percentage of ART patients with an undetectable viral load at 12 month after initiation of
ART
Number of adult and pediatric patients with an undetectable viral load <1,000 copies/ml at
12 months
Number of adults and children who initiated ART in the 12 months prior to the beginning
of the reporting period with a viral load count at 12-month visit
Proportion of clinically undernourished People Living with HIV (PLHIV) who received the
rapeutic or supplementary food
Number of clinically undernourished PLHIV that received therapeutic or supplementary
food
Clinically undernourished PLHIV who are on ART and received therapeutic or
supplementary food
Clinically undernourished PLHIV who are NOT on ART that received therapeutic or
supplementary food
Number of PLHIV that were nutritionally assessed and found to be clinically
undernourished
Number of HIV-positive adults and children Currently receiving clinical care
Number of HIV positive adults and children who Currently receive clinical Service (clinical
WHO staging or CD4 count or viral load) during the reporting period, by age and sex
Number of newly enrolled HIV positive adults and children who received clinical Service
(clinical WHO staging or CD4 count or viral load) during the reporting period, by age and
sex
Number of persons provided with post exposure prophylaxis (PEP) for risk of HIV infection
Number of HIV infected women aged 15-49 reporting the use of any method of modern
family planning
Malaria
Number of slides or RDT positive for malaria
Total number of slides or RDT performed for malaria diagnosis
Non-Communicable diseases
Cervical cancer screening in women age 30 – 49 using VIA/PAP smear

189
Activity Total
Number of women age 30 – 49 screened once with VIA/PAP for cervical cancer
Quality of health Services
Number of outpatient visits
Number of inpatient admissions
Total Number of NICU
Total number of Major OR
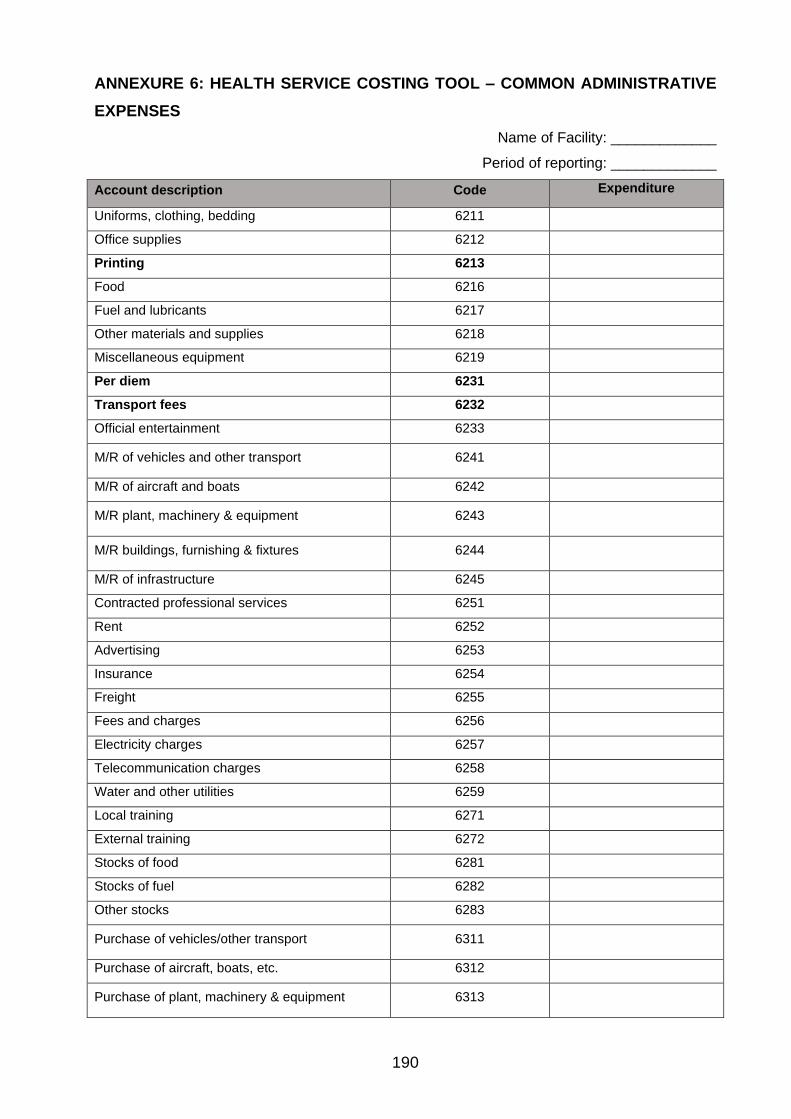
190
ANNEXURE 6: HEALTH SERVICE COSTING TOOL – COMMON ADMINISTRATIVE
EXPENSES
Name of Facility: _____________
Period of reporting: _____________
Account description Code Expenditure
Uniforms, clothing, bedding 6211
Office supplies 6212
Printing 6213
Food 6216
Fuel and lubricants 6217
Other materials and supplies 6218
Miscellaneous equipment 6219
Per diem 6231
Transport fees 6232
Official entertainment 6233
M/R of vehicles and other transport 6241
M/R of aircraft and boats 6242
M/R plant, machinery & equipment 6243
M/R buildings, furnishing & fixtures 6244
M/R of infrastructure 6245
Contracted professional services 6251
Rent 6252
Advertising 6253
Insurance 6254
Freight 6255
Fees and charges 6256
Electricity charges 6257
Telecommunication charges 6258
Water and other utilities 6259
Local training 6271
External training 6272
Stocks of food 6281
Stocks of fuel 6282
Other stocks 6283
Purchase of vehicles/other transport 6311
Purchase of aircraft, boats, etc. 6312
Purchase of plant, machinery & equipment 6313

191
Account description Code Expenditure
Purchase of buildings, furnishing & fixtures 6314
Purchase of livestock and transport animals 6315
Subsidies, investments and grant payments 6410
Grants, contributions & subsidies to institutions 6412
Contributions to international organizations 6414
Compensation to individuals and institutions 6416
Grants and gratitude to individuals 6417
Miscellaneous payments 6419
TOTAL

192
ANNEXURE 7: HEALTH SERVICE COSTING TOOL – MONTHLY PAYMENTS TO
STAFF
Name of Facility: _____________
Period of reporting: _____________
Department/
case team Facility
Staff
code/ID Profession Monthly
salary Allowances
Total
Payable
Other
payment
(if any)
Total
Payments
(annual)

193
ANNEXURE 8: HEALTH SERVICE COSTING TOOL – SERVICE DELIVERY STAFF
TIME
Name of Facility: _____________
Period of reporting: _____________
Name of unit: ____________
Activity/Care step GP
/MD
HO
Nu
rse
Mid
wiv
e
La
b
Ph
a
An
es
the
tis
t
IES
O
Oth
er
To
tal
% o
f c
as
es
req
uir
ing
th
is
ca
re
How many percent of cases
require this health worker?
Total: Time of service delivery staff

194
ANNEXURE 9: HEALTH SERVICE COSTING TOOL – DRUGS, SUPPLIES AND
LABORATORY TESTS
Name of Facility: _____________
Period of reporting: _____________
Name of unit: ____________
Section 1: Drugs
Drug,
Protocol,
Dosage,
Unit
% of
cases
requiring
Strength
(unit per
dose)
Frequency
per day
Number
of days
Total
units -
Low
estimate
Total
units -
High
Estimate
Weighted
Average
cost per
treatment
- Low
Cost
Weighted
Average
cost per
treatment -
High Cost
Section 2 Medical supply
Supplies
% of
cases
requiring
Strength
(unit per
dose)
Frequency
per day
Number
of days
Total
units -
Low
estimate
Total
units -
High
Estimate
Weighted
Average
cost per
treatment
- Low
Cost
Weighted
Average
cost per
treatment
- High
Cost
Section 3: Laboratory tests
Laboratory Test
% of
cases
requiring
Frequency
per day
Number
of days
Total
units -
Low
estimate
Total
units -
High
Estimate
Weighted
Average
cost per
treatment -
Low Cost
Weighted
Average
cost per
treatment -
High Cost

195
ANNEXURE 10: QUALITATIVE – KEY INFORMANT INTERVIEW GUIDE
Introduction and Consent
My name is Binyam Fekadu and I am here to conduct an interview with you to understand the
Ethiopian health system more. Your responses will be used by the Regional Health Bureau and
FMOH and other relevant stakeholders to improve the referral system between health centres
and primary hospitals.
As part this study we are collecting information through interviews from you and other
participants, and you were selected to participate. We would very much appreciate your
participation in this research. The interview usually takes about one (1) hour to complete.
Whatever information you provide will be kept strictly confidential and will not be shown to other
persons. Participation in this interview is also entirely on a voluntary basis and you can choose
not to answer any individual questions or all the questions. We hope that you will participate
fully in this assessment since your views are very important.
Do you have any questions? May I begin the interview now?
Verbal consent given by the interviewee, check box
Background information
(This section needs to be filled in by the interviewer before starting the questions.)
1. Name of facility:
2. Type of health facility Health Centre Primary Hospital
3. Qualification
4. Position
5. How long has s/he worked in this position?
6. How long has s/he been in the facility?
Guiding questions
Elements of
the model Key questions Probes
General 1. What are the major responsibilities your facility is playing to ensure the community is getting the MNH related health services?
• Type of services provided
• What are the common health problems/cases you are seeing?
• Comment on trends of cases; which cases are increasing in your catchment area?
• What are the major steps you follow while providing the care?
• Do you think you are providing the intended services you are expected to provide? If not, what are the major reasons
Structure 2. Do you think your facility is well
• Comments on physical structure

196
Elements of
the model Key questions Probes
equipped to provide the service
• Catchment population
• Human resources – number, mix and motivation
• Budget and equipment
• Availability of supplies and commodities
Structure 3. How is your facility linked to other health facilities - at similar or other levels of care?
• Your relationship with the lower, same and higher-level public facilities
• Your relationship with the private facilities
• What are your responsibilities in these relationships?
• What are the common areas of support you require from other facilities? Why?
Structure 4. What kinds of role the facility management, district administration and community play to improve the referral system?
• What is expected from the management?
• What has the management done so far?
• Your relationship with Woreda/District Health Office
• How are you collaborating with community and community structures?
Process 5. What are the issues related to referrals in the health system?
• How do the referral pathways look? a. Is this pathway maintained? Why?
• What are the common reasons for referral?
• Who decides about the referral?
• What are the common requirements you fulfil before referrals?
• Communication with the referred case and receiving facility
• How is the documentation done? Who is responsible?
• How is feedback/back referral done? a. Who is providing feedback? Who follows it up? b. What common feedback have you received? c. What have you done to improve on the feedbacks?
• Do you think the referred cases are appropriate?
Process 6. What are the major problems referred cases are facing?
• Completeness of care at sending facility - What would you have preferred to do? Why?
a. History taking b. Routine follow up c. Investigation
• Completeness of care at receiving facility - What would you have preferred to do?
a. History taking b. Routine follow up c. Investigation
• Health worker related issues
• Socio-economic factors - at household and community levels
• Transportation facility
• Travel time
Outcome 7. Do you think the referred cases are satisfied with the care you are providing?
• What would you do differently for referred cases?
• What satisfies them?
• What have you done to improve the services and increase your patients’ satisfaction?
• How do you monitor their satisfaction?
• Do you have any satisfaction assessment done for the mothers coming for themselves or their newborn care? Can you share the report with us?
• Are you satisfied with the outcome of services? Why?

197
Elements of
the model Key questions Probes
General 8. Do you have anything that you wish to add?
Thank you very much for your time

198
ANNEXURE 11: LETTER FROM THE LANGUAGE EDITOR
Related Documents